Filed Pursuant to Rule 424(b)(3)
Registration Statement No. 333-229322
| Minimum | Midpoint | Maximum | |||||||||
| Number of shares offered | 3,570,000 | 4,200,000 | 4,830,000 | ||||||||
| Gross offering proceeds | $ | 35,700,000 | $ | 42,000,000 | $ | 48,300,000 | |||||
| Estimated offering expenses | $ | 1,000,000 | $ | 1,000,000 | $ | 1,000,000 | |||||
| Estimated selling agent fees and expenses (1)(2) | $ | 1,995,250 | $ | 2,357,500 | $ | 2,719,750 | |||||
| Estimated net proceeds | $ | 32,704,750 | $ | 38,642,500 | $ | 44,580,250 | |||||
| Estimated net proceeds per share | $ | 9.16 | $ | 9.20 | $ | 9.23 | |||||
| (1) | Represents the total of (i) the fees to be paid to Griffin Financial, which is equal to 3.5% of the gross proceeds from shares sold in the subscription offering and the community offering, and 5.75% of the gross proceeds from shares purchased by ICG and Enstar, and (ii) an estimate of the reimbursable expenses expected to be incurred by Griffin Financial in connection with the offering. See “The Conversions and The Offering - Marketing and Underwriting Arrangements.” |
| (2) | Assumes that 300,000 shares are sold to purchasers other than ICG and Enstar and that 3,270,000, 3,900,000 and 4,530,000 shares are sold to ICG and Enstar at the minimum, midpoint, and maximum of the offering range, respectively. See “The Conversions and The Offering - Marketing and Underwriting Arrangements.” |
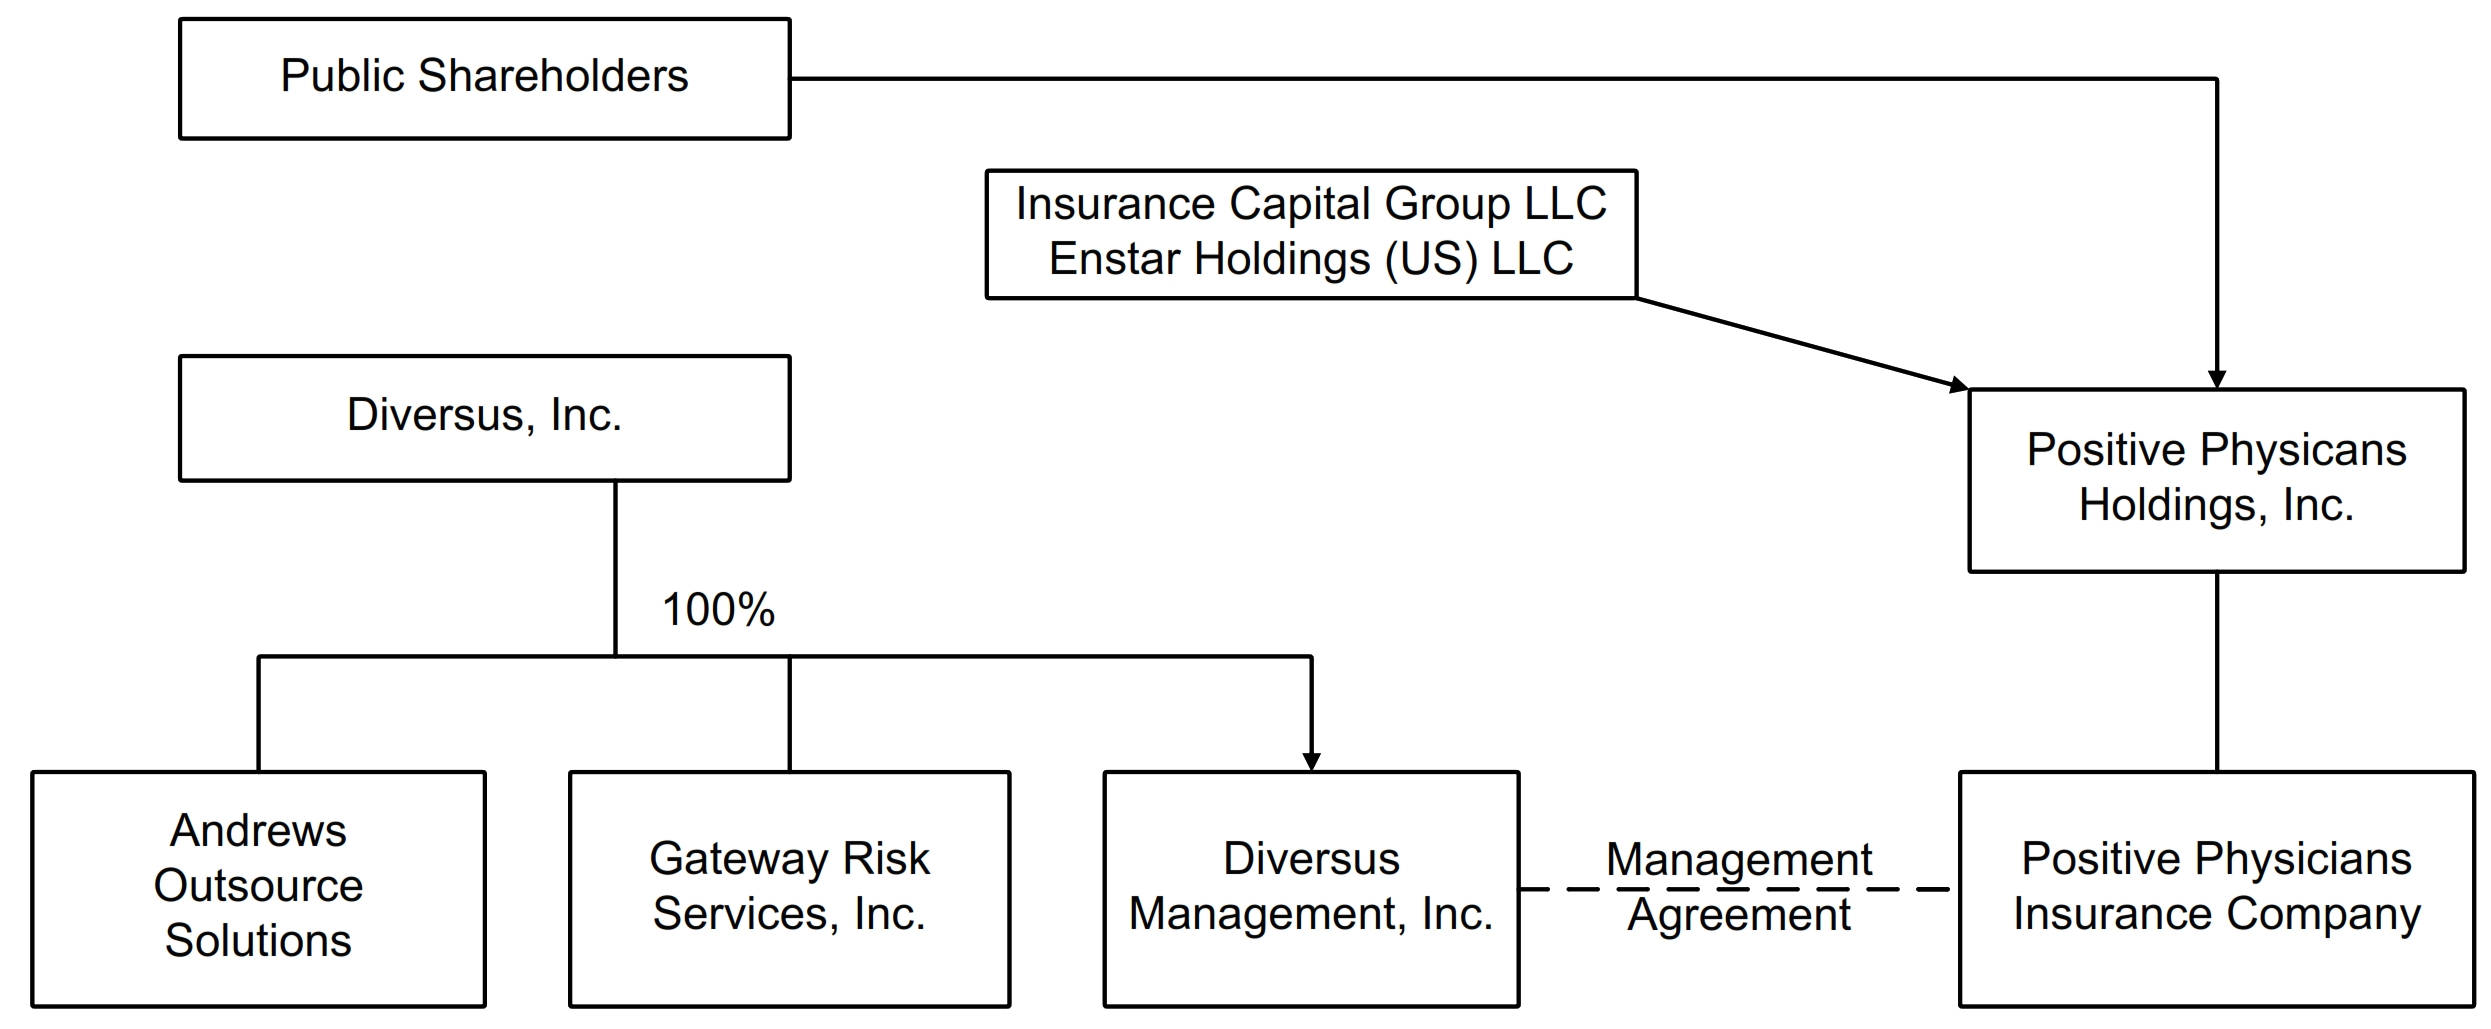
| • | “the Company,” “we,” “us” and “our” refer to the registrant, Positive Physicians Holdings, Inc. prior to completion of the conversions, and after completion of the conversions refer to Positive Physicians Holdings, Inc. and all of its subsidiaries; |
| • | the “conversions” refers to the transactions by which PPIX, PCA and PIPE will each convert from a reciprocal insurance exchange to a stock insurance company by merging with and into PPIX Conversion Corp., PCA Conversion Corp., and PIPE Conversion Corp., respectively, which will become wholly owned subsidiaries of the Company; |
| • | “eligible policyholder” or “eligible subscriber” refers to a policyholder of PPIX, PCA, or PIPE as of June 1, 2018; |
| • | “Enstar” means Enstar Holdings (US) LLC; |
| • | “exchange” means PPIX, PCA, or PIPE, and “exchanges” means PPIX, PCA, and PIPE collectively; |
| • | “Diversus Management” refers to Diversus Management, Inc., a wholly owned subsidiary of Diversus, Inc. which will be the surviving entity upon the merger of the attorneys-in-fact of PPIX, PIPE, and PCA with and into Diversus Management; |
| • | the “offering” and the “conversion offering” refer to the offering of up to 4,830,000 shares of our common stock to eligible policyholders of PPIX, PCA and PIPE in a subscription offering under their respective plans of conversion and to certain stockholders of Diversus and to ICG and Enstar in a community offering. We expect to conduct the subscription offering and the community offering simultaneously; |
| • | “PCA” refers to Professional Casualty Association, which as part of the conversions will merge with and into PCA Conversion Corp.; |
| • | “PIPE” refers to Physicians’ Insurance Program Exchange, which as part of the conversions will merge with and into PIPE Conversion Corp.; |
| • | “PPIX” refers to Positive Physicians Insurance Exchange, which as part of the conversions will merge with and into PPIX Conversion Corp.; |
| • | “Positive Insurance” refers to Positive Physicians Insurance Company, the stock insurance company that will be the surviving entity after the merger of PCA Conversion Corp. and PIPE Conversion Corp. with and into PPIX Conversion Corp., which will then change its name to Positive Physicians Insurance Company; |
| • | “standby purchaser” or “ICG” refers to Insurance Capital Group, LLC; and |
| • | “subscribers” refers to the policyholders of PPIX, PCA or PIPE, who are the named insureds under insurance policies issued by PPIX, PCA or PIPE, respectively. |
| • | Share repurchases; |
| • | A follow on offering of our common stock or the issuance of our stock in connection with acquisitions; or |
| • | A sale of the Company to a larger participant in the MPLI market or the insurance industry generally. |
Offering | Eligible Purchasers | Shares Available for Purchase | ||
| Subscription Offering | Eligible policyholders of PPIX, PCA, and PIPE; | 4,830,000 shares | ||
| Community Offering | Eligible stockholders of Diversus | 4,830,000 shares, less shares subscribed for in the Subscription Offering. These persons and their affiliates may not purchase more than 5% of shares available after the Subscription Offering | ||
ICG and Enstar | 4,830,000 shares, less shares subscribed for in the Subscription Offering (subject to the right of Diversus eligible stockholders to purchase up to 5% of any shares available after the Subscription Offering) | |||
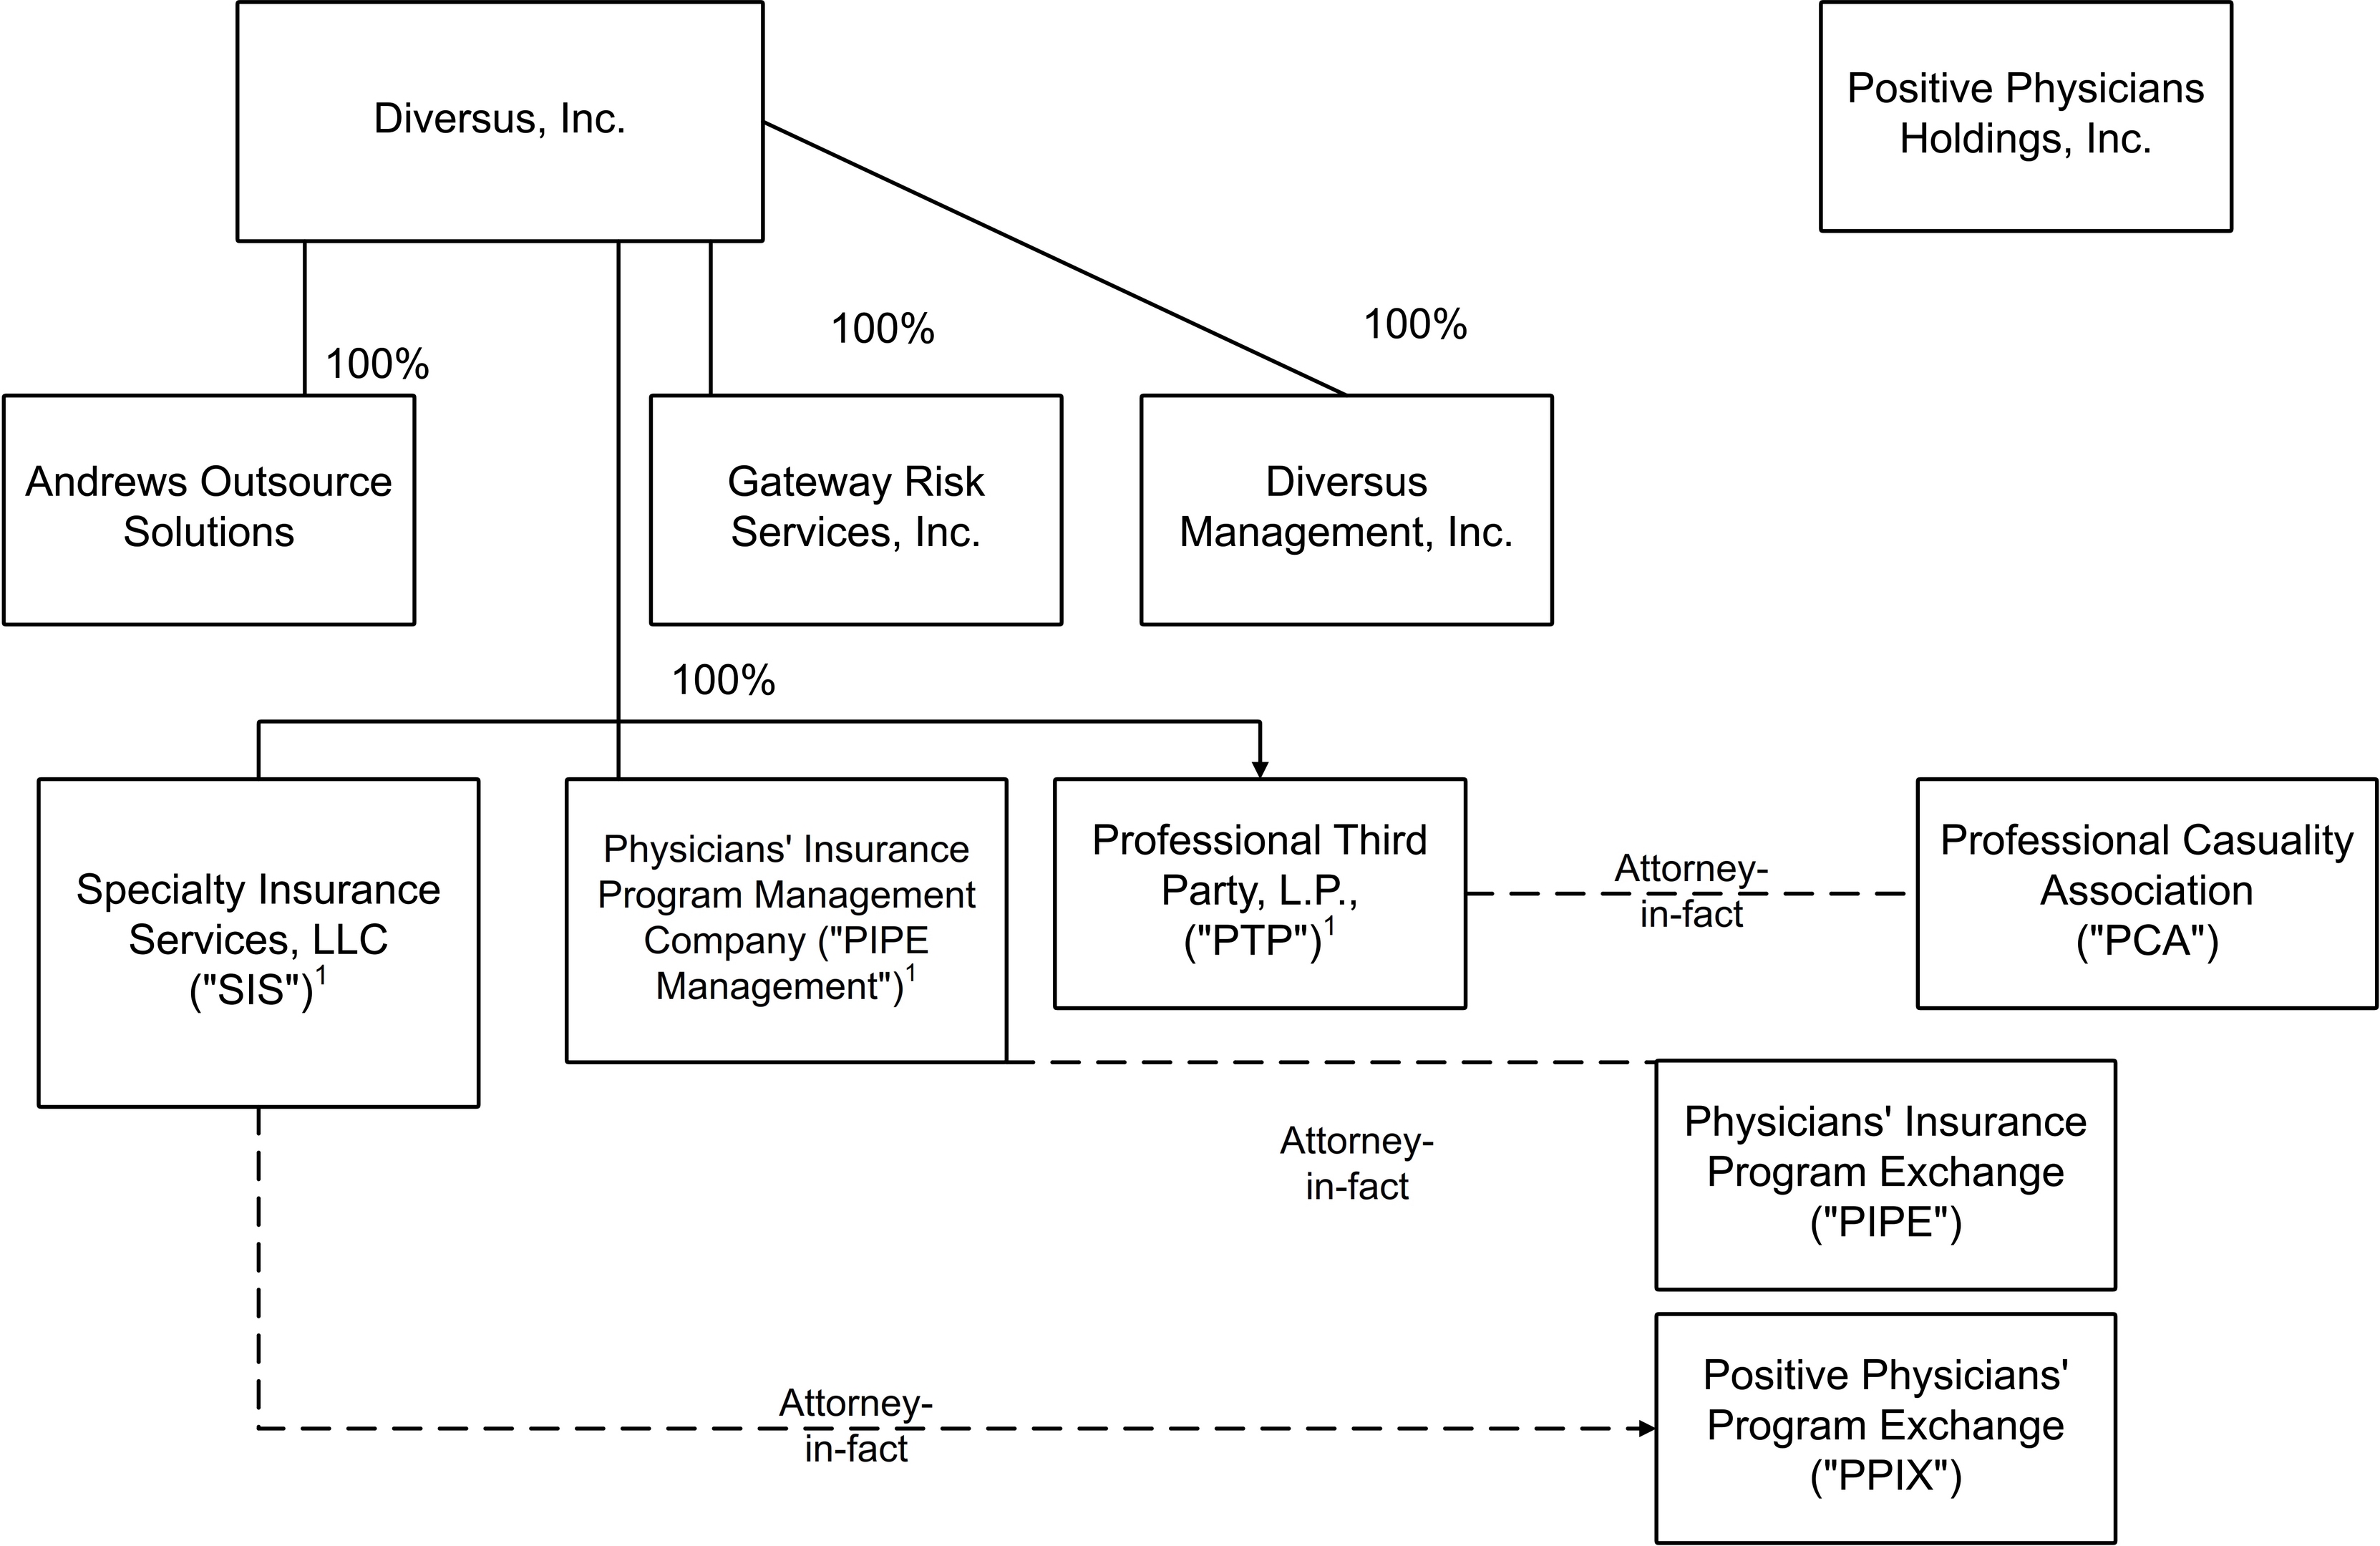
| (1) | Manages the reciprocal insurance exchange pursuant to an attorney-in-fact agreement. |
| (1) | ICG has agreed to purchase in the community offering such number of shares as will cause at least 3,570,000 shares to be sold in the offering. ICG has agreed to permit Enstar to purchase 30% of the shares that ICG would otherwise purchase in the offering. However, if the eligible |
| Net Proceeds | |||||||
| Gross proceeds | $ | 35,700,000 | $ | 48,300,000 | |||
| Conversion and offering expenses | 1,000,000 | 1,000,000 | |||||
| Estimated selling agent fees and expenses | 1,995,250 | 2,719,750 | |||||
| Net proceeds | $ | 32,704,750 | $ | 44,580,250 | |||
| Use of Net Proceeds | |||||||
| Payment to Diversus | $ | 10,000,000 | $ | 10,000,000 | |||
| General corporate purposes | 15,504,750 | 27,380,250 | |||||
| Capital contribution to Positive Insurance | 1,200,000 | 1,200,000 | |||||
| Line of credit to Diversus | 6,000,000 | 6,000,000 | |||||
| Total | $ | 32,704,750 | $ | 44,580,250 | |||
| • | such person’s spouse; |
| • | relatives of such person or such person’s spouse living in the same house; |
| • | companies, trusts or other entities in which such person or entity holds 10% or more of the equity securities (excluding the Company); |
| • | a trust or estate in which such person or entity holds a substantial beneficial interest or serves in a fiduciary capacity; or |
| • | any person acting in concert with any of the persons or entities listed above. |
| • | a requirement to include in this prospectus only two years of audited financial statements, two years of selected financial information, and two years of related Management Discussion & Analysis; |
| • | exemption from the auditor attestation requirement on the effectiveness of our internal control over financial reporting; |
| • | reduced disclosure about our executive compensation arrangements; and |
| • | no stockholder non-binding advisory votes on executive compensation or golden parachute arrangements. |
| • | The Company may not be able to grow its premiums either organically or through acquisitions of other business. The Company may be unable to identify and complete acquisitions on terms favorable to the Company, and integration of such businesses will entail various risks and may distract the Company’s management from the day to day operations of its businesses; |
| • | Changes in the healthcare industry and overcapacity in the MPLI market may impair the Company’s insurance company subsidiaries’ ability to increase premium revenues; |
| • | A significant percentage of the Company’s written premiums are concentrated geographically in Pennsylvania and New Jersey. Changes in the legal or regulatory environment in Pennsylvania or New Jersey would have a material adverse effect on the results of our MPLI insurance subsidiaries; |
| • | Because ICG and Enstar will likely own a majority of the Company’s outstanding shares after the offering, there will be little liquidity in the Company’s stock and they will control the Company; |
| • | It is likely that ICG will cause the Company to delist from the NASDAQ Stock Market, which will have a material and adverse effect on the liquidity of the Company’s stock, and to deregister its shares of common stock under the Securities Exchange Act of 1934, thereby terminating its public reporting obligations; and |
| • | The option agreement provides Diversus with the option of requiring the Company to acquire Diversus. |
Recent Developments
As of the date of this prospectus, none of PPIX, PCA or PIPE has completed the preparation of its statutory or GAAP financial statements for the year ended December 31, 2018. However, based upon a preliminary review of the year end results, management estimates that PCA and PIPE incurred a loss for the year and these losses accelerated in the fourth quarter, resulting in a decline in aggregate GAAP equity of the three exchanges of 9.5% in the fourth quarter when compared to that of the third quarter.
The foregoing analysis is preliminary. No assurance can be given that actual results may not be materially different from these estimates. Such material differences could be favorable or unfavorable. Specifically, the foregoing analysis is based, in part, upon the receipt of preliminary data from PCA’s actuary, which indicates the need for up to $3.8 million of reserve strengthening for the 2015 through 2018 policy years. Management believes this indication stems, in part, from PCA’s own review and strengthening of its case reserves relating to those policy years in 2018 as well as the loss on one significant claim from the 2015 policy year. Management is in the process of reviewing with the actuary whether PCA’s own review of, and increase in, case reserves and this one claim produced higher loss development factors and whether the aggregation of these events in 2018 had any distorting effect on the indicated need for additional reserves. Further contributing to the losses are reinsurance adjustments made in the fourth quarter as well as approximately $182,000 of conversion related expenses and approximately $330,000 of state examination expenses. Approximately $1.0 million of the decline in GAAP equity is as a result of a decline in the market value of investments in the fourth quarter. Although an additional reduction to GAAP equity of approximately $1.2 million resulting from a reclassification relating to retroactive reinsurance may be required, management currently believes the runoff provisions within the treaty will result in no adjustment to equity.
ICG and Enstar, the standby investors in the proposed offering, are fully apprised of the foregoing. Neither has requested that the appraisals of the reciprocals be revised to reflect this deterioration in earnings and GAAP equity, and each has stated that it intends to complete the transaction on the terms set forth in the standby stock purchase agreement.
| • | Problems integrating the acquired operations with our existing business; |
| • | Operating and underwriting results of the acquired operations not meeting our expectations; |
| • | Diversion of management’s time and attention from our existing business; |
| • | Need for financial resources above our planned investment levels; |
| • | Difficulties in retaining business relationships with agents and policyholders of the acquired company; |
| • | Risks associated with entering markets in which we lack extensive prior experience; |
| • | Tax issues associated with acquisitions; |
| • | Acquisition-related disputes, including disputes over contingent consideration and escrows; |
| • | Potential loss of key employees of the acquired company; and |
| • | Potential impairment of related goodwill and intangible assets. |
| • | Competition from other providers of medical professional liability insurance; |
| • | Price regulation by insurance regulatory authorities; |
| • | Selection and implementation of appropriate rating formula or other pricing methodologies; |
| • | Availability of sufficient reliable data; |
| • | Uncertainties inherent in estimates and assumptions generally; |
| • | Adverse changes in claim results; |
| • | Incorrect or incomplete analysis of available data; |
| • | Our ability to predict policyholder retention, investment yields and the duration of liability for losses and loss adjustment expenses (“LAE”) accurately; |
| • | Unanticipated effects of court decisions, legislation, or regulation, including those related to tort and healthcare reform; and |
| • | Increasing severity of claims outcomes. |
| • | approval of policy forms and premium rates; |
| • | standards of solvency, including establishing requirements for minimum capital and surplus, and for risk-based capital; |
| • | classifying assets as admissible for purposes of determining solvency and compliance with minimum capital and surplus requirements; |
| • | licensing of insurers and their producers; |
| • | advertising and marketing practices; |
| • | restrictions on the nature, quality and concentration of investments; |
| • | assessments by guaranty associations and mandatory pooling arrangements; |
| • | restrictions on the ability to pay dividends; |
| • | restrictions on transactions between affiliated companies; |
| • | restrictions on the size of risks insurable under a single policy; |
| • | requiring deposits for the benefit of policyholders; |
| • | requiring certain methods of accounting; |
| • | periodic examinations of our operations and finances; |
| • | claims practices; |
| • | prescribing the form and content of reports of financial condition required to be filed; and |
| • | requiring reserves for unearned premiums, losses and other purposes. |
| • | the requirement that a majority of our board of directors consist of independent directors; |
| • | the requirement that we have a nominating and corporate governance committee that is composed entirely of independent directors, or otherwise have director nominees selected by vote of a majority of the independent directors; |
| • | the requirement that we have a compensation committee that is composed entirely of independent directors; and |
| • | the requirement for an annual performance evaluation of the nominating and corporate governance and compensation committees. |
| • | quarterly variations in our results of operations; |
| • | announcements by third parties of claims against us; |
| • | changes in law and regulation; |
| • | results of operations that vary from those expected by investors; |
| • | future sales of shares of our common stock by investors; |
| • | actual or anticipated variations in our quarterly results, including per share results, of operations; |
| • | changes in market valuations of companies in the property casualty and MPLI business; |
| • | fluctuations in stock market prices and trading volumes; |
| • | our relatively small market capitalization and the anticipated relatively low trading volume of our shares; and |
| • | announcements by us or our competitors of acquisitions or strategic alliances. |
| • | The prohibition of cumulative voting in the election of directors; |
| • | The requirement that nominations for the election of directors made by shareholders and any shareholder proposals for inclusion on the agenda at any shareholders’ meeting must be made by notice (in writing) delivered or mailed to us not less than 90 days prior to the meeting; and |
| • | The requirement that the provision of our articles of incorporation prohibiting cumulative voting can only be amended by an affirmative vote of shareholders entitled to cast at least 80% of all votes that shareholders are entitled to cast, unless approved by an affirmative vote of at least 80% of the members of the board of directors. |
Our ability to pay dividends is constrained by the order issued by the Department approving the conversions, which may have an adverse effect on the trading price for our shares after completion of the offering.
The Department’s order approving the conversions prohibits the declaration or payment of any dividend, return of capital, or other distribution to ICG or Enstar, without the prior approval of the Department, for a period of three years following the effective date of the conversions. See “Dividends”. We can provide no assurance that the Department would approve any request that we might make regarding the payment of dividends to our shareholders during that three year period. If we are not able to obtain approval from the Department with respect to the payment of a dividend during that three year period, it may have an adverse effect on the trading price for our shares after completion of the offering.
| • | statements of goals, intentions and expectations; |
| • | statements regarding prospects and business strategy; and |
| • | estimates of future costs, benefits and results. |
| • | the potential impact of fraud, operational errors, systems malfunctions, or cybersecurity incidents; |
| • | future economic conditions in the markets in which we compete that are less favorable than expected; |
| • | the effect of legislative, judicial, economic, demographic and regulatory events in the jurisdictions where we do business; |
| • | our ability to enter new markets successfully and capitalize on growth opportunities either through acquisitions or the expansion of our producer network; |
| • | financial market conditions, including, but not limited to, changes in interest rates and the stock markets causing a reduction of investment income or investment gains and a reduction in the value of our investment portfolio; |
| • | heightened competition, including specifically the intensification of price competition, the entry of new competitors and the development of new products by new or existing competitors, resulting in a reduction in the demand for our products; |
| • | changes in general economic conditions, including inflation, unemployment, interest rates and other factors; |
| • | estimates and adequacy of loss reserves and trends in loss and loss adjustment expenses; |
| • | changes in the coverage terms required by state laws, including higher limits; |
| • | our inability to obtain regulatory approval of, or to implement, premium rate increases; |
| • | our ability to obtain reinsurance coverage at reasonable prices or on terms that adequately protect us and to collect amounts that we believe we are entitled to under such reinsurance; |
| • | the potential impact on our reported net income that could result from the adoption of future accounting standards issued by the Public Company Accounting Oversight Board or the Financial Accounting Standards Board or other standard-setting bodies; |
| • | unanticipated changes in industry trends and ratings assigned by nationally recognized rating organizations; |
| • | adverse litigation or arbitration results; and |
| • | adverse changes in applicable laws, regulations or rules governing insurance holding companies and insurance companies, and tax or accounting matters including limitations on premium levels, increases in minimum capital and reserves, and other financial viability requirements, and changes that affect the cost of, or demand for our products. |
For the Nine Months Ended September 30, (Unaudited) | For the Years Ended December 31, | ||||||||||||||
| 2018 | 2017 | 2017 | 2016 | ||||||||||||
| (Dollars in thousands) | (Dollars in thousands) | ||||||||||||||
| Statement of Operations Data: | |||||||||||||||
| Revenue | |||||||||||||||
| Direct premiums written | $ | 10,349 | $ | 10,307 | $ | 15,327 | $ | 13,799 | |||||||
| Net premiums written | 8,291 | 9,065 | 13,051 | 9,472 | |||||||||||
| Net premiums earned | 9,644 | 9,694 | 12,275 | 8,591 | |||||||||||
| Net investment income | 903 | 805 | 972 | 1,183 | |||||||||||
| Total revenue | 10,547 | 10,499 | 13,247 | 9,774 | |||||||||||
| Expenses: | |||||||||||||||
| Losses and loss adjustment expenses | 5,435 | 6,540 | 7,733 | 3,920 | |||||||||||
| Other underwriting expenses | 4,906 | 4,047 | 5,787 | 4,391 | |||||||||||
| Interest expense | 5 | 7 | 9 | 53 | |||||||||||
| Total expenses | 10,346 | 10,594 | 13,529 | 8,363 | |||||||||||
| Income (loss) before income taxes | 201 | (95 | ) | (282 | ) | 1,410 | |||||||||
| Income tax expense (benefit) | 7 | (170 | ) | (260 | ) | 586 | |||||||||
| Net income (loss) | 194 | 75 | (22 | ) | 824 | ||||||||||
| Other comprehensive (loss) income | (666 | ) | 658 | 672 | (63 | ) | |||||||||
| Comprehensive (loss) income | $ | (472 | ) | $ | 733 | $ | 650 | $ | 761 | ||||||
| Performance Ratios: | |||||||||||||||
| Losses and loss adjustment expenses ratio (1) | 56.4 | % | 67.5 | % | 63.0 | % | 45.6 | % | |||||||
| Expense ratio (2) | 50.9 | % | 41.7 | % | 47.1 | % | 51.1 | % | |||||||
| Combined ratio (3) | 107.3 | % | 109.2 | % | 110.1 | % | 96.7 | % | |||||||
| Return on average equity | 1.1 | % | 0.4 | % | (0.1 | )% | 5.0 | % | |||||||
| Statutory Data: | |||||||||||||||
| Statutory net income (loss) | $ | 311 | $ | (254 | ) | $ | (440 | ) | $ | 911 | |||||
| Statutory surplus | $ | 17,276 | $ | 16,936 | $ | 16,882 | $ | 17,487 | |||||||
| Ratio of net premiums written to statutory surplus | 48.0 | % | 53.5 | % | 77.3 | % | 54.2 | % | |||||||
| (1) | Calculated by dividing losses and loss adjustment expenses by net premiums earned. |
| (2) | Calculated by dividing amortization of deferred policy acquisition costs and net underwriting and administrative expenses by net premiums earned. |
| (3) | The sum of the losses and loss adjustment expenses ratio and the underwriting expense ratio. A combined ratio of less than 100% means a company is making an underwriting profit. |
| September 30, 2018 (unaudited) | September 30, 2017 (unaudited) | December 31, 2017 | December 31, 2016 | ||||||||||||
| (Dollars in thousands) | (Dollars in thousands) | ||||||||||||||
| Balance Sheet Data (at period end): | |||||||||||||||
| Total investments, cash, and cash equivalents | $ | 50,138 | $ | 50,591 | $ | 52,819 | $ | 48,827 | |||||||
| Premiums and other receivables | 4,736 | 4,511 | 5,712 | 4,142 | |||||||||||
| Reinsurance receivable | 6,588 | 6,044 | 6,117 | 8,670 | |||||||||||
| Deferred acquisition costs | 2,191 | 2,095 | 2,504 | 1,714 | |||||||||||
| Deferred income taxes | 148 | 78 | (42 | ) | 560 | ||||||||||
| Other assets | — | 115 | 50 | 150 | |||||||||||
| Total Assets | $ | 63,801 | $ | 63,434 | $ | 67,161 | $ | 64,063 | |||||||
| Losses and loss adjustment expenses | $ | 37,417 | $ | 36,985 | $ | 38,029 | $ | 34,814 | |||||||
| Unearned and advance premiums | 7,491 | 7,146 | 8,689 | 7,961 | |||||||||||
| Note payable | 143 | 202 | 187 | 782 | |||||||||||
| Other liabilities | 1,690 | 1,489 | 2,724 | 3,626 | |||||||||||
| Total Liabilities | 46,741 | 45,822 | 49,629 | 47,183 | |||||||||||
| Surplus | 17,060 | 17,612 | 17,532 | 16,880 | |||||||||||
| Total Equity | 17,060 | 17,612 | 17,532 | 16,880 | |||||||||||
| Total Liabilities and Equity | $ | 63,801 | $ | 63,434 | $ | 67,161 | $ | 64,063 | |||||||
For the Nine Months Ended September 30, (Unaudited) | For the Years Ended December 31, | ||||||||||||||
| 2018 | 2017 | 2017 | 2016 | ||||||||||||
| (Dollars in Thousands) | (Dollars in Thousands) | ||||||||||||||
| Statement of Operations Data: | |||||||||||||||
| Direct premiums written | $ | 4,227 | $ | 5,057 | $ | 7,684 | $ | 11,941 | |||||||
| Net premiums written | 3,913 | 4,141 | 6,323 | 9,842 | |||||||||||
| Net premiums earned | 4,475 | 5,753 | 7,480 | 13,310 | |||||||||||
| Net investment income | 561 | 410 | 584 | 623 | |||||||||||
| Total revenue | 5,036 | 6,163 | 8,064 | 13,933 | |||||||||||
| Expenses: | |||||||||||||||
| Losses and loss adjustment expenses | 5,052 | 2,646 | 4,012 | 6,550 | |||||||||||
| Other underwriting expenses | 2,579 | 2,725 | 3,500 | 6,091 | |||||||||||
| Interest expense | — | 31 | 31 | — | |||||||||||
| Total expenses | 7,631 | 5,402 | 7,544 | 12,641 | |||||||||||
| (Loss) income before income taxes | (2,595 | ) | 761 | 520 | 1,292 | ||||||||||
| Income tax (benefit) expense | (515 | ) | 225 | 209 | 671 | ||||||||||
| Net (loss) income | (2,080 | ) | 536 | 311 | 621 | ||||||||||
| Other comprehensive (loss) income | (373 | ) | 265 | 259 | 162 | ||||||||||
| Comprehensive (loss) income | $ | (2,453 | ) | $ | 801 | $ | 570 | $ | 783 | ||||||
| Performance Ratios: | |||||||||||||||
| Losses and loss adjustment expenses ratio (1) | 112.9 | % | 46.0 | % | 53.6 | % | 49.2 | % | |||||||
| Expense ratio (2) | 57.6 | % | 47.4 | % | 46.8 | % | 45.8 | % | |||||||
| Combined ratio (3) | 170.5 | % | 93.4 | % | 100.4 | % | 95.0 | % | |||||||
| Return on average equity | (16.5 | )% | 3.9 | % | 2.3 | % | 4.8 | % | |||||||
| Statutory Data: | |||||||||||||||
| Statutory net (loss) income | $ | (1,863 | ) | $ | 814 | $ | 566 | $ | 1,673 | ||||||
| Statutory surplus | $ | 11,635 | $ | 13,938 | $ | 13,591 | $ | 13,619 | |||||||
| Ratio of net premiums written to statutory surplus | 33.6 | % | 29.7 | % | 46.5 | % | 72.3 | % | |||||||
| (1) | Calculated by dividing losses and loss adjustment expenses by net premiums earned. |
| (2) | Calculated by dividing amortization of deferred policy acquisition costs and net underwriting and administrative expenses by net premiums earned. |
| (3) | The sum of the losses and loss adjustment expenses ratio and the underwriting expense ratio. A combined ratio of less than 100% means a company is making an underwriting profit. |
| September 30, 2018 (unaudited) | September 30, 2017 (unaudited) | December 31, 2017 | December 31, 2016 | ||||||||||||
| (dollars in thousands) | (dollars in thousands) | ||||||||||||||
| Balance Sheet Data (at period end): | |||||||||||||||
| Total investments, cash, and cash equivalents | $ | 31,465 | $ | 36,097 | $ | 33,205 | $ | 39,036 | |||||||
| Premiums and other receivables | 1,224 | 1,159 | 1,941 | 1,300 | |||||||||||
| Reinsurance receivable | 2,003 | 2,258 | 2,312 | 2,465 | |||||||||||
| Deferred acquisition costs | 882 | 778 | 1,189 | 1,219 | |||||||||||
| Deferred tax assets | 216 | 305 | 102 | 417 | |||||||||||
| Other assets | 407 | 799 | 810 | 841 | |||||||||||
| Total Assets | $ | 36,197 | $ | 41,396 | $ | 39,559 | $ | 45,278 | |||||||
| Losses and loss adjustment expenses | $ | 19,915 | $ | 20,845 | $ | 18,585 | $ | 23,002 | |||||||
| Unearned and advance premiums | 4,582 | 5,612 | 6,217 | 7,371 | |||||||||||
| Notes payable | — | — | — | 500 | |||||||||||
| Other liabilities | 298 | 854 | 903 | 1,122 | |||||||||||
| Total Liabilities | 24,795 | 27,311 | 25,705 | 31,994 | |||||||||||
| Surplus | 11,402 | 14,085 | 13,854 | 13,284 | |||||||||||
| Equity | 11,402 | 14,085 | 13,854 | 13,284 | |||||||||||
| Total Liabilities and Equity | $ | 36,197 | $ | 41,396 | $ | 39,559 | $ | 45,278 | |||||||
For the Nine Months Ended September 30, (Unaudited) | For the Years Ended December 31, | ||||||||||||||
| 2018 | 2017 | 2017 | 2016 | ||||||||||||
| (Dollars in thousands) | (Dollars in thousands) | ||||||||||||||
| Statement of Operations Data: | |||||||||||||||
| Revenue | |||||||||||||||
| Direct premiums written | $ | 3,028 | $ | 3,224 | $ | 3,647 | $ | 4,172 | |||||||
| Net premiums written | 2,853 | 2,676 | 3,028 | 3,463 | |||||||||||
| Net premiums earned | 2,366 | 2,418 | 3,148 | 3,793 | |||||||||||
| Net investment income | 548 | 427 | 571 | 462 | |||||||||||
| Total revenue | 2,914 | 2,845 | 3,719 | 4,255 | |||||||||||
| Expenses: | |||||||||||||||
| Losses and loss adjustment expenses | 1,265 | 1,495 | 1,823 | 210 | |||||||||||
| Other underwriting expenses | 1,485 | 1,457 | 1,855 | 2,252 | |||||||||||
| Interest expense | — | — | — | 898 | |||||||||||
| Total expenses | 2,750 | 2,952 | 3,678 | 3,360 | |||||||||||
| Income (loss) before income taxes | 164 | (107 | ) | 41 | 895 | ||||||||||
| Income tax expense (benefit) | 80 | (41 | ) | 101 | 305 | ||||||||||
| Net income (loss) | 84 | (66 | ) | (60 | ) | 590 | |||||||||
| Other comprehensive (loss) income | (418 | ) | 105 | 92 | 319 | ||||||||||
| Comprehensive (loss) income | $ | (334 | ) | $ | 39 | $ | 32 | $ | 909 | ||||||
| Performance Ratios: | |||||||||||||||
| Losses and loss adjustment expenses ratio (1) | 53.5 | % | 61.8 | % | 57.9 | % | 5.5 | % | |||||||
| Expense ratio (2) | 62.8 | % | 60.3 | % | 58.9 | % | 59.4 | % | |||||||
| Combined ratio (3) | 116.3 | % | 122.1 | % | 116.8 | % | 64.9 | % | |||||||
| Return on average equity | 0.7 | % | (0.5 | )% | (0.5 | )% | 5.0 | % | |||||||
| Statutory Data: | |||||||||||||||
| Statutory net income | $ | 240 | $ | 138 | $ | 171 | $ | 531 | |||||||
| Statutory surplus | $ | 12,098 | $ | 12,029 | $ | 12,037 | $ | 12,029 | |||||||
| Ratio of net premiums written to statutory surplus | 23.6 | % | 22.2 | % | 25.2 | % | 28.8 | % | |||||||
| (1) | Calculated by dividing losses and loss adjustment expenses by net premiums earned. |
| (2) | Calculated by dividing amortization of deferred policy acquisition costs and net underwriting and administrative expenses by net premiums earned. |
| (3) | The sum of the losses and loss adjustment expenses ratio and the underwriting expense ratio. A combined ratio of less than 100% means a company is making an underwriting profit. |
| September 30, 2018 (unaudited) | September 30, 2017 (unaudited) | December 31, 2017 | December 31, 2016 | ||||||||||||
| (Dollars in thousands) | (Dollars in thousands) | ||||||||||||||
| Balance Sheet Data (at period end): | |||||||||||||||
| Total investments, cash, and cash equivalents | $ | 22,963 | $ | 24,997 | $ | 25,017 | $ | 26,092 | |||||||
| Premiums and other receivables | 218 | 538 | 680 | 645 | |||||||||||
| Reinsurance receivable | 285 | 282 | 156 | 91 | |||||||||||
| Deferred acquisition costs | 551 | 511 | 385 | 422 | |||||||||||
| Deferred income taxes | 189 | 172 | 152 | 331 | |||||||||||
| Other assets | 311 | 373 | 255 | 217 | |||||||||||
| Total Assets | $ | 24,517 | $ | 26,873 | $ | 26,645 | $ | 27,798 | |||||||
| Losses and loss adjustment expenses | $ | 10,306 | $ | 12,022 | $ | 11,761 | $ | 12,343 | |||||||
| Unearned and advance premiums | 2,032 | 2,087 | 2,211 | 2,643 | |||||||||||
| Other liabilities | 249 | 493 | 409 | 581 | |||||||||||
| Total Liabilities | 12,587 | 14,602 | 14,381 | 15,567 | |||||||||||
| Surplus | 11,930 | 12,271 | 12,264 | 12,231 | |||||||||||
| Total Equity | 11,930 | 12,271 | 12,264 | 12,231 | |||||||||||
| Total Liabilities and Equity | $ | 24,517 | $ | 26,873 | $ | 26,645 | $ | 27,798 | |||||||
| Minimum | Maximum | ||||||
| Net Proceeds | |||||||
| Gross proceeds | $ | 35,700,000 | $ | 48,300,000 | |||
| Conversion and offering expenses | 1,000,000 | 1,000,000 | |||||
| Estimated selling agent fees and expenses | 1,995,250 | 2,719,750 | |||||
| Net proceeds | $ | 32,704,750 | $ | 44,580,250 | |||
| Use of Net Proceeds | |||||||
| Payment to Diversus | $ | 10,000,000 | $ | 10,000,000 | |||
| General corporate purposes | 15,504,750 | 27,380,250 | |||||
| Capital contribution to Positive Insurance | 1,200,000 | 1,200,000 | |||||
| Line of credit to Diversus | 6,000,000 | 6,000,000 | |||||
| Total | $ | 32,704,750 | $ | 44,580,250 | |||
The Department’s order approving the conversions prohibits the declaration or payment of any dividend, return of capital, or other distribution by us to ICG or Enstar, without the prior approval of the Department, for a period of three years following the effective date of the conversions.
The Department’s order approving the conversions prohibits the declaration or payment of any dividend or other distribution or returns of capital by Positive Insurance to the Company, without the prior approval of the Department for a period of three years following the effective date of the conversions.
| PPIX, PCA, PIPE and PPHI Historical Capitalization (1) | Pro Forma Combined Capitalization (2) | ||||||||||||||
| Minimum | Midpoint | Maximum | |||||||||||||
| Shareholders’ Equity | |||||||||||||||
| Common stock, $0.01 par value per share | $ | — | $ | 36 | $ | 42 | $ | 48 | |||||||
| Additional paid-in capital | 15,883 | 48,552 | 54,483 | 60,525 | |||||||||||
| Retained earnings | 24,518 | 24,518 | 24,518 | 24,518 | |||||||||||
| Accumulated other comprehensive loss | (9 | ) | (9 | ) | (9 | ) | (9 | ) | |||||||
| Total equity | $ | 40,392 | $ | 73,097 | $ | 79,034 | $ | 85,082 | |||||||
| (1) | Combined historical capitalization of the Company, PPIX, PCA, and PIPE. |
| (2) | To give effect to the sale of common stock at the minimum, midpoint and maximum of the estimated range of the pro forma market value of Positive Insurance as a subsidiary of the Company, as determined by the independent valuations of Feldman Financial. The following table presents the estimated net proceeds at the minimum, midpoint, and maximum of the estimated valuation range (shares and dollars in thousands). |
Minimum | Midpoint | Maximum | |||||||||
| Gross proceeds from the conversion | $ | 35,700,000 | $ | 42,000,000 | $ | 48,300,000 | |||||
| Less: offering expenses and commissions | 2,995,250 | 3,357,500 | 3,719,750 | ||||||||
| Net proceeds from conversion | $ | 32,704,750 | $ | 38,642,500 | $ | 44,580,250 | |||||
| Total shares issued by the Company as a result of conversion | 3,570,000 | 4,200,000 | 4,830,000 | ||||||||
| PPIX surplus | $ | 17,060 | |
| PCA surplus | 11,402 | ||
| PIPE surplus | 11,930 | ||
| Net assets transferred to Positive Physicians Holdings, Inc. | $ | 40,392 | |
| (i) | the issuance and sale of 3,570,000 shares of common stock in this offering at an assumed public offering price of $10 per share, which is the minimum of the range listed on the cover page of this prospectus, after deducting commissions and estimated offering expenses payable by us, as if all such transactions had occurred on January 1, 2018 and 2017; and |
| (ii) | completion of the conversions on a pro forma basis to convert PPIX, PCA and PIPE each from a reciprocal insurance exchange to stock form of ownership and their merger to form Positive Insurance, a subsidiary of Positive Physicians Holdings, Inc., as if the conversion had occurred on January 1, 2018 and 2017. |
| • | the unaudited financial statements of PPIX, PCA, and PIPE as of and for the nine months ended September 30, 2018 and 2017, and the notes related thereto, included elsewhere in this prospectus; |
| • | the audited financial statements of PPIX, PCA, and PIPE as of and for the years ended December 31, 2017 and 2016, and the notes related thereto, included elsewhere in this prospectus; |
| • | the sections entitled “Selected Historical Consolidated Financial Data,” “Management’s Discussion and Analysis of Financial Condition and Results of Operations of PPIX, PCA, and PIPE,” and “Accounting Treatment” included elsewhere in this prospectus. |
| PPIX Historical | PCA Historical | PIPE Historical | PPHI Historical | Pro Forma Adjustments | Positive Physicians Holdings, Inc. Pro Forma Consolidated | |||||||||||||||||||
| Assets | ||||||||||||||||||||||||
| Total investments, cash, and cash equivalents | $ | 50,138 | $ | 31,465 | $ | 22,963 | $ | — | $ | 32,705 | (1) (2) | $ | 137,271 | |||||||||||
| Premiums and other receivables | 4,736 | 1,224 | 218 | — | — | 6,178 | ||||||||||||||||||
| Reinsurance receivable | 6,588 | 2,003 | 285 | — | — | 8,876 | ||||||||||||||||||
| Deferred acquisition costs | 2,191 | 882 | 551 | — | — | 3,624 | ||||||||||||||||||
| Deferred tax asset | 148 | 216 | 189 | — | — | 553 | ||||||||||||||||||
| Other assets | — | 407 | 311 | — | — | 718 | ||||||||||||||||||
| Total assets | $ | 63,801 | $ | 36,197 | $ | 24,517 | $ | — | $ | 32,705 | $ | 157,220 | ||||||||||||
| Liabilities | ||||||||||||||||||||||||
| Losses and loss adjustment expenses | 37,417 | 19,915 | 10,306 | — | — | 67,638 | ||||||||||||||||||
| Unearned and advance premiums | 7,491 | 4,582 | 2,032 | — | — | 14,105 | ||||||||||||||||||
| Note payable | 143 | — | — | — | — | 143 | ||||||||||||||||||
| Other liabilities | 1,690 | 298 | 249 | — | — | 2,237 | ||||||||||||||||||
| Total liabilities | 46,741 | 24,795 | 12,587 | — | — | 84,123 | ||||||||||||||||||
| Stockholders’ equity | ||||||||||||||||||||||||
| Common stock | — | — | — | — | 36 | (1) | 36 | |||||||||||||||||
| Additional paid-in capital | — | — | — | — | 48,552 | (2) | 48,552 | |||||||||||||||||
| Contributed surplus | 5,483 | 2,349 | 8,051 | — | (15,883 | ) | (2) | — | ||||||||||||||||
| Retained earnings | 11,354 | 9,109 | 4,055 | — | — | 24,518 | ||||||||||||||||||
| Accumulated other comprehensive income (loss) | 223 | (56 | ) | (176 | ) | — | — | (9 | ) | |||||||||||||||
| Total equity | 17,060 | 11,402 | 11,930 | — | 32,705 | 73,097 | ||||||||||||||||||
| Total liabilities and equity | $ | 63,801 | $ | 36,197 | $ | 24,517 | $ | — | $ | 32,705 | $ | 157,220 | ||||||||||||
| Pro forma shareholders’ equity per share | $ | 20.48 | ||||||||||||||||||||||
| (1) | The unaudited pro forma condensed consolidated balance sheet, as prepared, gives effect to the sale of common stock at the minimum of the estimated range of the pro forma market value of Positive Insurance as a subsidiary of the Company, as determined by the independent valuations of Feldman Financial. The following table presents the estimated net proceeds at the minimum, midpoint, and maximum of the estimated valuation range (shares and dollars in thousands). |
| Minimum | Midpoint | Maximum | |||||||||
| Gross proceeds from the conversion | $ | 35,700 | $ | 42,000 | $ | 48,300 | |||||
| Less: offering expenses and commissions | 2,995 | 3,358 | 3,720 | ||||||||
| Net proceeds from conversion | $ | 32,705 | $ | 38,642 | $ | 44,580 | |||||
| Total shares issued by the Company as a result of conversion | 3,570 | 4,200 | 4,830 | ||||||||
| (2) | Represents the conversions of PPIX, PCA, and PIPE from reciprocal insurance exchanges to stock insurance companies and their merger to form Positive Insurance as if the conversions had occurred on January 1, 2018. For accounting purposes, the exchange of ownership interests is considered an exchange between entities under common control and thus the merger is accounted for at historical cost without revaluation of the net assets as follows (in thousands): |
| PPIX surplus | $ | 17,060 | |
| PCA surplus | 11,402 | ||
| PIPE surplus | 11,930 | ||
| Net assets transferred to Positive Physicians Holdings, Inc. | $ | 40,392 | |
| PPIX Historical | PCA Historical | PIPE Historical | PPHI Historical | Pro Forma and Other Adjustments | Positive Physicians Holdings, Inc. Pro Forma Consolidated (2) | |||||||||||||||||||
| Statement of Operations Data (amounts in thousands): | ||||||||||||||||||||||||
| Revenue: | ||||||||||||||||||||||||
| Net premiums earned | $ | 9,644 | $ | 4,475 | $ | 2,366 | $ | — | $ | — | $ | 16,485 | ||||||||||||
| Net investment income | 903 | 561 | 548 | — | — | (1) | 2,012 | |||||||||||||||||
| Total Revenue | 10,547 | 5,036 | 2,914 | — | — | 18,497 | ||||||||||||||||||
| Expenses: | ||||||||||||||||||||||||
| Losses and loss adjustment expenses | 5,435 | 5,052 | 1,265 | — | — | 11,752 | ||||||||||||||||||
| Other underwriting expenses | 4,906 | 2,579 | 1,485 | — | — | 8,970 | ||||||||||||||||||
| Interest expense and fees | 5 | — | — | — | — | 5 | ||||||||||||||||||
| Total Expenses | 10,346 | 7,631 | 2,750 | — | — | 20,727 | ||||||||||||||||||
| Income (loss) before income taxes | 201 | (2,595 | ) | 164 | — | — | (2,230 | ) | ||||||||||||||||
| Income tax expense (benefit) | 7 | (515 | ) | 80 | — | — | (428 | ) | ||||||||||||||||
| Net income (loss) | $ | 194 | $ | (2,080 | ) | $ | 84 | $ | — | $ | — | $ | (1,802 | ) | ||||||||||
| Loss per share data: | ||||||||||||||||||||||||
| Net loss per share of common stock | $ | (0.50 | ) | |||||||||||||||||||||
| Shares considered outstanding in calculating pro forma net loss per share (2) | 3,570,000 | |||||||||||||||||||||||
| (1) | Does not reflect any income from the investment of net proceeds available for investment and assumed to be received as of the beginning of each period in accordance with Article 11 of Regulation S-X. This income is not “factually supportable” as that term is used in the Securities and Exchange Commission’s rules and regulations. On a short-term basis, these proceeds will be invested primarily in U.S. government securities and other federal agency securities. |
| (2) | The unaudited pro forma condensed consolidated statements of operations, as prepared, give effect to the sale of common stock at the minimum of the estimated range of the pro forma market value of Positive Insurance as a subsidiary of the Company, as determined by the independent valuation of Feldman Financial. The following table provides a comparison between the sale of common stock at the minimum, midpoint, and maximum of the estimated valuation range (in thousands, except share and per share data). |
| September 30, 2018 | |||||||||||
3,570,000 Shares | 4,200,000 Shares | 4,830,000 Shares | |||||||||
| Net loss | $ | (1,802 | ) | $ | (1,802 | ) | $ | (1,802 | ) | ||
| Net loss per share of common stock | $ | (0.50 | ) | $ | (0.43 | ) | $ | (0.37 | ) | ||
| Shares considered outstanding in calculating pro forma net loss per share | 3,570,000 | 4,200,000 | 4,830,000 | ||||||||
| PPIX Historical | PCA Historical | PIPE Historical | PPHI Historical | Pro Forma and Other Adjustments | Positive Physicians Holdings, Inc. Pro Forma Consolidated (2) | |||||||||||||||||||
| Statement of Operations Data (amounts in thousands): | ||||||||||||||||||||||||
| Revenue: | ||||||||||||||||||||||||
| Net premiums earned | $ | 12,275 | $ | 7,480 | $ | 3,148 | $ | — | $ | — | $ | 22,903 | ||||||||||||
| Net investment income | 972 | 584 | 571 | — | — | (1) | 2,127 | |||||||||||||||||
| Total Revenue | 13,247 | 8,064 | 3,719 | — | — | 25,030 | ||||||||||||||||||
| Expenses: | ||||||||||||||||||||||||
| Losses and loss adjustment expenses | 7,733 | 4,012 | 1,823 | — | — | 13,568 | ||||||||||||||||||
| Other underwriting expenses | 5,787 | 3,500 | 1,855 | — | — | 11,142 | ||||||||||||||||||
| Interest expense and fees | 9 | 31 | — | — | — | 40 | ||||||||||||||||||
| Total Expenses | 13,529 | 7,544 | 3,678 | — | — | 24,750 | ||||||||||||||||||
| (Loss) income before income taxes | (282 | ) | 520 | 41 | — | — | 280 | |||||||||||||||||
| Income tax (benefit) expense | (260 | ) | 209 | 101 | — | — | 50 | |||||||||||||||||
| Net (loss) income | $ | (22 | ) | $ | 311 | $ | (60 | ) | $ | — | $ | — | $ | 230 | ||||||||||
| Income per share data: | ||||||||||||||||||||||||
| Net income per share of common stock | $ | 0.06 | ||||||||||||||||||||||
| Shares considered outstanding in calculating pro forma net income per share (2) | 3,570,000 | |||||||||||||||||||||||
| (1) | Does not reflect any income from the investment of net proceeds available for investment and assumed to be received as of the beginning of each period in accordance with Article 11 of Regulation S-X. This income is not “factually supportable” as that term is used in the Securities and Exchange Commission’s rules and regulations. On a short-term basis, these proceeds will be invested primarily in U.S. government securities and other federal agency securities. |
| (2) | The unaudited pro forma condensed consolidated statements of operations, as prepared, give effect to the sale of common stock at the minimum of the estimated range of the pro forma market value of Positive Insurance as a subsidiary of the Company, as determined by the independent valuation of Feldman Financial. The following table provides a comparison between the sale of common stock at the minimum, midpoint, and maximum of the estimated valuation range (in thousands, except share and per share data). |
| December 31, 2017 | |||||||||||
3,570,000 Shares | 4,200,000 Shares | 4,830,000 Shares | |||||||||
| Net income | $ | 230 | $ | 230 | $ | 230 | |||||
| Net income per share of common stock | $ | 0.06 | $ | 0.05 | $ | 0.05 | |||||
| Shares considered outstanding in calculating pro forma net income per share | 3,570,000 | 4,200,000 | 4,830,000 | ||||||||
| • | Expenses of the conversion and offering will be approximately $1.0 million; and |
| • | Underwriting commissions will equal 3.5% of the gross proceeds of the offering from shares not purchased by ICG or Enstar and 5.75% of the gross proceeds from shares purchased by ICG or Enstar and that 3,265,000 shares are sold to ICG and Enstar. |
| • | Average weighted shares outstanding has been calculated as if our common stock had been sold in the offering on January 1, 2018; |
| • | Pro forma per share amounts have been calculated by dividing historical and pro forma amounts by the indicated number of shares of stock; and |
| • | Pro forma shareholders’ equity amounts, pro forma net income, and pro forma income per share have been calculated as if our common stock had been sold in the offering on September 30, 2018 and, accordingly, no effect has been given to the assumed earnings effect of the net proceeds from the offering. |
| Nine Months Ended September 30, 2018 | |||||||||||
| (amounts in thousands, except share data) | |||||||||||
| 3,570,000 Shares sold at $10.00 per share (Minimum of range) | 4,200,000 Shares sold at $10.00 per share (Midpoint of range) | 4,830,000 Shares sold at $10.00 per share (Maximum of range) | |||||||||
| Pro forma conversion offering proceeds | |||||||||||
| Gross proceeds of public offering | $ | 35,700 | $ | 42,000 | $ | 48,300 | |||||
| Less estimated offering expenses and underwriting commissions | 2,995 | 3,358 | 3,720 | ||||||||
| Estimated net conversion proceeds | $ | 32,705 | $ | 38,642 | $ | 44,580 | |||||
| Pro forma shareholders’ equity | |||||||||||
| Historical equity of PPIX, PCA, and PIPE | $ | 40,392 | $ | 40,392 | $ | 40,392 | |||||
| Pro forma conversion proceeds | 32,705 | 38,642 | 44,580 | ||||||||
| Pro forma shareholders’ equity | $ | 73,097 | $ | 79,034 | $ | 84,972 | |||||
| Pro forma outstanding shares | |||||||||||
| Total shares offered in conversion | 3,570,000 | 4,200,000 | 4,830,000 | ||||||||
| Pro forma outstanding shares | 3,570,000 | 4,200,000 | 4,830,000 | ||||||||
| Pro forma book value per share | $ | 20.48 | $ | 18.82 | $ | 17.59 | |||||
| Pro forma price to book value | 48.8 | % | 53.1 | % | 56.9 | % | |||||
| Pro forma net income | |||||||||||
| Historical combined net loss | $ | (1,802 | ) | $ | (1,802 | ) | $ | (1,802 | ) | ||
| Other pro forma adjustments | — | — | — | ||||||||
| Pro forma net loss | $ | (1,802 | ) | $ | (1,802 | ) | $ | (1,802 | ) | ||
| Weighted average shares outstanding | 3,570,000 | 4,200,000 | 4,830,000 | ||||||||
| Pro forma loss per share (1) | $ | (0.50 | ) | $ | (0.43 | ) | $ | (0.37 | ) | ||
| Pro forma price to net loss per share (1) | 200x | 250x | 250x | ||||||||
| (1) | Based on pro forma net loss for the nine months ended September 30, 2018. |
AND RESULTS OF OPERATIONS OF PPIX, PCA, AND PIPE
| • | Actual versus Expected Model - The Actual versus Expected Model utilizes the actuarial point ultimate loss and defense containment cost (“DCC”) estimates as of the prior reserve review which were adjusted based on the difference between actual and expected loss development during that prior reserve review and the current evaluation to arrive at an updated actuarial point ultimate loss and DCC estimate. The method is dependent on the loss development factors used to determine the expected losses. |
| • | Bornhuetter-Ferguson Method (Paid and Incurred) - The Bornhuetter-Ferguson Method is a blended method that explicitly takes into account both actual loss development to date and expected future loss emergence. This method is applied on both a paid loss development method and an incurred loss development method. This method uses the selected loss development patterns from the two loss development methods to calculate the expected percentage of loss unpaid (or unreported). The expected future loss component of the method is calculated by multiplying earned premium for the given exposure period by a selected a priori (i.e. deductive) loss ratio. The resulting dollars are then multiplied by the expected percentage of unpaid (or unreported) loss described above. This provides an estimate of future paid (or reported) losses that is then added to actual paid (or incurred) loss data to produce estimated ultimate loss. |
| • | Expected Loss Ratio Method - The Expected Loss Ratio Method utilizes some measure of anticipated losses and does not consider actual losses. An expected loss ratio, a ratio of anticipated losses relative to some measure of exposure, is applied to that measure of exposure to determine estimated ultimate losses for each year. This method provides stability over time because the ultimate loss estimates do not change unless the exposure measure changes. This is offset by a lack of responsiveness to actual loss experience. |
| • | Frequency/Severity Method - The Frequency/Severity Method estimates ultimate losses by estimating a frequency and a severity component. For each year, the actuary estimates ultimate claims costs and an ultimate average severity. The actuary then multiplies these two estimates together. The method is useful when the claim count development pattern is more stable than the loss development pattern. |
| • | Incurred Loss Development Method - The Incurred Loss Development Method utilizes historical incurred loss (the sum of cumulative historical loss payments plus outstanding case reserves) patterns to estimate future losses. This method is often preferred over the paid method as it includes the additional information provided by the aggregation of individual case reserves. The resulting loss development factors (LDFs) tend to be lower and more stable than those of the paid development method. However, the incurred development method may be affected by changes in case reserving practices and any unusually large individual claims. The actuaries produce and review several indications of ultimate loss using this method based on various LDF selections. |
| • | Historical industry development experience in MPLI; |
| • | Historical company development experience; |
| • | Changes in the exchange’s internal claims processing policies and procedures; and |
| • | Trends and risks in claim costs, such as risk that medical cost inflation could increase. |
| • | The rate of increase in medical costs that underlie insured risks; and |
| • | Impact of changes in laws or regulations. |
| (dollars in thousands) | Case Reserves | IBNR Reserves | Total Reserves | ||||||||
| Medical professional liability | $ | 12,229 | $ | 19,217 | $ | 31,446 | |||||
| Other | — | — | — | ||||||||
| Total net reserves | 12,229 | 19,217 | 31,446 | ||||||||
| Reinsurance recoverables | 762 | 5,209 | 5,971 | ||||||||
| Gross reserves | $ | 12,991 | $ | 24,426 | $ | 37,417 | |||||
| Case Reserves | IBNR Reserves | Total Reserves | Actuarially Determined Range of Estimates | ||||||||||||||||
| (dollars in thousands) | Low | High | |||||||||||||||||
| Medical professional liability | $ | 11,698 | $ | 20,566 | $ | 32,264 | $ | 29,567 | $ | 36,849 | |||||||||
| Other | — | — | — | — | — | ||||||||||||||
| Total net reserves | 11,698 | 20,566 | 32,264 | $ | 29,567 | $ | 36,849 | ||||||||||||
| Reinsurance recoverables | 1,314 | 4,451 | 5,765 | ||||||||||||||||
| Gross reserves | $ | 13,012 | $ | 25,017 | $ | 38,029 | |||||||||||||
| Case Reserves | IBNR Reserves | Total Reserves | Actuarially Determined Range of Estimates | ||||||||||||||||
| (dollars in thousands) | Low | High | |||||||||||||||||
| Medical professional liability | $ | 9,541 | $ | 20,218 | $ | 29,759 | $ | 26,296 | $ | 34,501 | |||||||||
| Other | — | — | — | — | — | ||||||||||||||
| Total net reserves | 9,541 | 20,218 | 29,759 | $ | 26,296 | $ | 34,501 | ||||||||||||
| Reinsurance recoverables | 603 | 4,452 | 5,055 | ||||||||||||||||
| Gross reserves | $ | 10,144 | $ | 24,670 | $ | 34,814 | |||||||||||||
| Dollars in thousands (unaudited) | 2013 | 2014 | 2015 | 2016 | 2017 | ||||||||||||||
| As originally estimated | $ | 26,957 | $ | 28,046 | $ | 29,951 | $ | 29,759 | $ | 32,264 | |||||||||
| As estimated at December 31, 2017 | 20,837 | 21,091 | 24,159 | 27,138 | 32,264 | ||||||||||||||
| Net cumulative redundancy (deficiency) | $ | 6,120 | $ | 6,955 | $ | 5,792 | $ | 2,621 | $ | — | |||||||||
| % redundancy (deficiency) | 22.7 | % | 24.8 | % | 19.3 | % | 8.8 | % | — | % | |||||||||
| Reserve Range for Unpaid Loss and LAE | Aggregate Loss and LAE Reserve | Percentage Change in Equity (1) | |||||
| Low End | $ | 29,567 | 10 | % | |||
| Recorded | $ | 32,264 | — | ||||
| High End | $ | 36,849 | (17 | )% | |||
| (1) | Net of tax |
| Case Reserves | IBNR Reserves | Total Reserves | |||||||||
| (dollars in thousands) | |||||||||||
| Medical professional liability | $ | 12,391 | $ | 5,521 | $ | 17,912 | |||||
| Other | — | — | — | ||||||||
| Total net reserves | 12,391 | 5,521 | 17,912 | ||||||||
| Reinsurance recoverables | 924 | 1,079 | 2,003 | ||||||||
| Gross reserves | $ | 13,315 | $ | 6,600 | $ | 19,915 | |||||
| Case Reserves | IBNR Reserves | Total Reserves | Actuarially Determined Range of Estimates | ||||||||||||||||
| (dollars in thousands) | Low | High | |||||||||||||||||
| Medical professional liability | $ | 8,937 | $ | 8,180 | $ | 17,117 | $ | 15,756 | $ | 19,551 | |||||||||
| Other | — | — | — | — | — | ||||||||||||||
| Total net reserves | 8,937 | 8,180 | 17,117 | $ | 15,756 | $ | 19,551 | ||||||||||||
| Reinsurance recoverables | 460 | 1,008 | 1,468 | ||||||||||||||||
| Gross reserves | $ | 9,397 | $ | 9,188 | $ | 18,585 | |||||||||||||
| Case Reserves | IBNR Reserves | Total Reserves | Actuarially Determined Range of Estimates | ||||||||||||||||
| (dollars in thousands) | Low | High | |||||||||||||||||
| Medical professional liability | $ | 9,026 | $ | 12,251 | $ | 21,277 | $ | 18,893 | $ | 23,831 | |||||||||
| Other | — | — | — | — | — | ||||||||||||||
| Total net reserves | 9,026 | 12,251 | 21,277 | $ | 18,893 | $ | 23,831 | ||||||||||||
| Reinsurance recoverables | 189 | 1,536 | 1,725 | ||||||||||||||||
| Gross reserves | $ | 9,215 | $ | 13,787 | $ | 23,002 | |||||||||||||
| Dollars in thousands (unaudited) | 2013 | 2014 | 2015 | 2016 | 2017 | ||||||||||||||
| As originally estimated | $ | 29,401 | $ | 26,526 | $ | 25,675 | $ | 21,277 | $ | 17,177 | |||||||||
| As estimated at December 31, 2017 | 31,895 | 26,467 | 24,706 | 21,463 | 17,117 | ||||||||||||||
| Net cumulative redundancy (deficiency) | $ | (2,494 | ) | $ | 59 | $ | 969 | $ | (186 | ) | $ | — | |||||||
| % redundancy (deficiency) | (8.5 | )% | 0.2 | % | 3.8 | % | (0.9 | )% | — | % | |||||||||
| Reserve Range for Unpaid Loss and LAE | Aggregate Loss and LAE Reserve | Percentage Change in Equity (1) | |||||
| Low End | $ | 15,756 | 6 | % | |||
| Recorded | $ | 17,117 | — | ||||
| High End | $ | 19,551 | (12 | )% | |||
| (1) | Net of tax |
| Case Reserves | IBNR Reserves | Total Reserves | |||||||||
| (dollars in thousands) | |||||||||||
| Medical professional liability | $ | 5,435 | $ | 4,586 | $ | 10,021 | |||||
| Other | — | — | — | ||||||||
| Total net reserves | 5,435 | 4,586 | 10,021 | ||||||||
| Reinsurance recoverables | 54 | 231 | 285 | ||||||||
| Gross reserves | $ | 5,489 | $ | 4,817 | $ | 10,306 | |||||
| Case Reserves | IBNR Reserves | Total Reserves | Actuarially Determined Range of Estimates | ||||||||||||||||
| (dollars in thousands) | Low | High | |||||||||||||||||
| Medical professional liability | $ | 6,369 | $ | 5,236 | $ | 11,605 | $ | 10,727 | $ | 13,308 | |||||||||
| Other | — | — | — | — | — | ||||||||||||||
| Total net reserves | 6,369 | 5,236 | 11,605 | $ | 10,727 | $ | 13,308 | ||||||||||||
| Reinsurance recoverables | — | 156 | 156 | ||||||||||||||||
| Gross reserves | $ | 6,369 | $ | 5,392 | $ | 11,761 | |||||||||||||
| Case Reserves | IBNR Reserves | Total Reserves | Actuarially Determined Range of Estimates | ||||||||||||||||
| (dollars in thousands) | Low | High | |||||||||||||||||
| Medical professional liability | $ | 4,776 | $ | 7,476 | $ | 12,252 | $ | 9,930 | $ | 12,944 | |||||||||
| Other | — | — | — | — | — | ||||||||||||||
| Total net reserves | 4,776 | 7,476 | 12,252 | $ | 9,930 | $ | 12,944 | ||||||||||||
| Reinsurance recoverables | — | 91 | 91 | ||||||||||||||||
| Gross reserves | $ | 4,776 | $ | 7,567 | $ | 12,343 | |||||||||||||
| Dollars in thousands (unaudited) | 2013 | 2014 | 2015 | 2016 | 2017 | ||||||||||||||
| As originally estimated | $ | 13,661 | $ | 15,797 | $ | 14,888 | $ | 12,252 | $ | 11,605 | |||||||||
| As estimated at December 31, 2017 | 13,553 | 12,633 | 11,337 | 11,740 | 11,605 | ||||||||||||||
| Net cumulative redundancy (deficiency) | $ | 108 | $ | 3,164 | $ | 3,551 | $ | 512 | $ | — | |||||||||
| % redundancy (deficiency) | 0.8 | % | 20.0 | % | 23.9 | % | 4.2 | % | — | % | |||||||||
| Reserve Range for Unpaid Loss and LAE | Aggregate Loss and LAE Reserve | Percentage Change in Equity (1) | |||||
| Low End | $ | 10,727 | 5 | % | |||
| Recorded | $ | 11,605 | — | ||||
| High End | $ | 13,308 | (9 | )% | |||
| (1) | Net of tax |
| Level 1: | Quoted (unadjusted) prices for identical assets in active markets |
| Level 2: | Quoted prices for similar assets in active markets, quoted prices for identical or similar assets in nonactive markets (few transactions, limited information, noncurrent prices, high variability over time, etc., inputs other than quoted prices that are observable for the asset (interest rates, yield curves, volatilities, default rates, etc., and inputs that are derived principally from or corroborated by other observable market data. |
| Level 3: | Unobservable inputs that cannot be corroborated by observable market data. |
| Less than 12 months (dollars in thousands) | 12 months or longer (dollars in thousands) | Total (dollars in thousands) | |||||||||||||||||||||
| Description of securities | Fair Value | Unrealized losses | Fair Value | Unrealized losses | Fair Value | Unrealized losses | |||||||||||||||||
| September 30, 2018 (unaudited): | |||||||||||||||||||||||
| U.S. Government and government agencies and authorities | $ | 6,680 | $ | 67 | $ | 4,913 | $ | 158 | $ | 11,593 | $ | 225 | |||||||||||
| Industrial and miscellaneous | 15,932 | 323 | 7,529 | 381 | 23,461 | 704 | |||||||||||||||||
| Total fixed maturities | 22,612 | 390 | 12,442 | 539 | 35,054 | 929 | |||||||||||||||||
| Common stocks, unaffiliated | 448 | 188 | 517 | 157 | 965 | 345 | |||||||||||||||||
| Total temporarily impaired securities | $ | 23,060 | $ | 578 | $ | 12,959 | $ | 696 | $ | 36,019 | $ | 1,274 | |||||||||||
| Less than 12 months (dollars in thousands) | 12 months or longer (dollars in thousands) | Total (dollars in thousands) | |||||||||||||||||||||
| Description of securities | Fair Value | Unrealized losses | Fair Value | Unrealized losses | Fair Value | Unrealized losses | |||||||||||||||||
| December 31, 2017 (audited): | |||||||||||||||||||||||
| U.S. Government and government agencies and authorities | $ | 4,328 | $ | 85 | $ | 4,668 | $ | 29 | $ | 8,996 | $ | 114 | |||||||||||
| Industrial and miscellaneous | 9,474 | 128 | 1,699 | 7 | 11,173 | 135 | |||||||||||||||||
| Total fixed maturities | 13,802 | 213 | 6,367 | 36 | 20,169 | 249 | |||||||||||||||||
| Common stocks, unaffiliated | 795 | 48 | 231 | 231 | 1,026 | 279 | |||||||||||||||||
| Total temporarily impaired securities | $ | 14,597 | $ | 261 | $ | 6,598 | $ | 267 | $ | 21,195 | $ | 528 | |||||||||||
| Less than 12 months (dollars in thousands) | 12 months or longer (dollars in thousands) | Total (dollars in thousands) | |||||||||||||||||||||
| Description of securities | Fair Value | Unrealized losses | Fair Value | Unrealized losses | Fair Value | Unrealized losses | |||||||||||||||||
| December 31, 2016 (audited): | |||||||||||||||||||||||
| U.S. Government and government agencies and authorities | $ | 8,146 | $ | 146 | $ | 4,183 | $ | 29 | $ | 12,329 | $ | 175 | |||||||||||
| Industrial and miscellaneous | 6,613 | 193 | 3,768 | 18 | 10,381 | 211 | |||||||||||||||||
| Total fixed maturities | 14,759 | 339 | 7,951 | 47 | 22,710 | 386 | |||||||||||||||||
| Common stocks, unaffiliated | 400 | 10 | 445 | 193 | 845 | 203 | |||||||||||||||||
| Total temporarily impaired securities | $ | 15,159 | $ | 349 | $ | 8,396 | $ | 240 | $ | 23,555 | $ | 589 | |||||||||||
| Total | Level 1 | Level 2 | Level 3 | ||||||||||||
| Bonds | $ | 41,775 | $ | — | $ | 41,775 | $ | — | |||||||
| Common stocks | $ | 2,860 | $ | 2,860 | $ | — | $ | — | |||||||
| Total | Level 1 | Level 2 | Level 3 | ||||||||||||
| Bonds | $ | 43,786 | $ | — | $ | 43,786 | $ | — | |||||||
| Common stocks | $ | 2,807 | $ | 2,807 | $ | — | $ | — | |||||||
| Total | Level 1 | Level 2 | Level 3 | ||||||||||||
| Bonds | $ | 39,155 | $ | — | $ | 39,155 | $ | — | |||||||
| Common stocks | $ | 2,491 | $ | 2,491 | $ | — | $ | — | |||||||
| Less than 12 months (dollars in thousands) | 12 months or longer (dollars in thousands) | Total (dollars in thousands) | |||||||||||||||||||||
| Description of securities | Fair Value | Unrealized losses | Fair Value | Unrealized losses | Fair Value | Unrealized losses | |||||||||||||||||
| September 30, 2018 (unaudited): | |||||||||||||||||||||||
| U.S. Government and government agencies and authorities | $ | 5,244 | $ | 95 | $ | — | $ | — | $ | 5,244 | $ | 95 | |||||||||||
| Industrial and miscellaneous | 19,207 | 518 | — | — | 19,207 | 518 | |||||||||||||||||
| Total fixed maturities | 24,451 | 613 | — | — | 24,451 | 613 | |||||||||||||||||
| Common stocks, unaffiliated | 282 | 17 | 254 | 21 | 536 | 38 | |||||||||||||||||
| Total temporarily impaired securities | $ | 24,733 | $ | 630 | $ | 254 | $ | 21 | $ | 24,987 | $ | 651 | |||||||||||
| Less than 12 months (dollars in thousands) | 12 months or longer (dollars in thousands) | Total (dollars in thousands) | |||||||||||||||||||||
| Description of securities | Fair Value | Unrealized Losses | Fair Value | Unrealized Losses | Fair Value | Unrealized Losses | |||||||||||||||||
| December 31, 2017 (audited): | |||||||||||||||||||||||
| U.S. Government and government agencies and authorities | $ | 2,508 | $ | 5 | $ | 4,806 | $ | 65 | $ | 7,314 | $ | 70 | |||||||||||
| Industrial and miscellaneous | 7,514 | 58 | 3,212 | 32 | 10,726 | 90 | |||||||||||||||||
| Total fixed maturities | 10,022 | 63 | 8,018 | 97 | 18,040 | 160 | |||||||||||||||||
| Common stocks, unaffiliated | 187 | 5 | 214 | 4 | 401 | 9 | |||||||||||||||||
| Total temporarily impaired securities | $ | 10,209 | $ | 68 | $ | 8,233 | $ | 101 | $ | 18,441 | $ | 169 | |||||||||||
| Less than 12 months (dollars in thousands) | 12 months or longer (dollars in thousands) | Total (dollars in thousands) | |||||||||||||||||||||
| Description of securities | Fair Value | Unrealized Losses | Fair Value | Unrealized Losses | Fair Value | Unrealized Losses | |||||||||||||||||
| December 31, 2016 (audited): | |||||||||||||||||||||||
| U.S. Government and government agencies and authorities | $ | 6,345 | $ | 61 | $ | 3,010 | $ | 9 | $ | 9,355 | $ | 70 | |||||||||||
| Industrial and miscellaneous | 4,034 | 52 | 2,011 | 21 | 6,045 | 73 | |||||||||||||||||
| Total fixed maturities | 10,379 | 113 | 5,021 | 30 | 15,400 | 143 | |||||||||||||||||
| Common stocks, unaffiliated | 462 | 26 | 376 | 39 | 838 | 65 | |||||||||||||||||
| Total temporarily impaired securities | $ | 10,841 | $ | 139 | $ | 5,397 | $ | 69 | $ | 16,238 | $ | 208 | |||||||||||
| Total | Level 1 | Level 2 | Level 3 | ||||||||||||
| Bonds | $ | 25,587 | $ | — | $ | 25,587 | $ | — | |||||||
| Common stocks | $ | 3,324 | $ | 3,324 | $ | — | $ | — | |||||||
| Total | Level 1 | Level 2 | Level 3 | ||||||||||||
| Bonds | $ | 25,714 | $ | — | $ | 25,714 | $ | — | |||||||
| Common stocks | $ | 3,241 | $ | 3,241 | $ | — | $ | — | |||||||
| Total | Level 1 | Level 2 | Level 3 | ||||||||||||
| Bonds | $ | 30,843 | $ | — | $ | 30,843 | $ | — | |||||||
| Common stocks | $ | 2,394 | $ | 2,394 | $ | — | $ | — | |||||||
| Less than 12 months (dollars in thousands) | 12 months or longer (dollars in thousands) | Total (dollars in thousands) | |||||||||||||||||||||
| Description of securities | Fair Value | Unrealized losses | Fair Value | Unrealized losses | Fair Value | Unrealized losses | |||||||||||||||||
| September 30, 2018 (unaudited): | |||||||||||||||||||||||
| U.S. Government and government agencies and authorities | $ | 1,928 | $ | 24 | $ | 1,869 | $ | 87 | $ | 3,797 | $ | 111 | |||||||||||
| Industrial and miscellaneous | 7,571 | 215 | 4,071 | 190 | 11,642 | 405 | |||||||||||||||||
| Total fixed maturities | 9,499 | 239 | 5,940 | 277 | 15,439 | 516 | |||||||||||||||||
| Common stocks, unaffiliated | 251 | 15 | 223 | 23 | 474 | 38 | |||||||||||||||||
| Total temporarily impaired securities | $ | 9,750 | $ | 254 | $ | 6,163 | $ | 300 | $ | 15,913 | $ | 554 | |||||||||||
| Less than 12 months (dollars in thousands) | 12 months or longer (dollars in thousands) | Total (dollars in thousands) | |||||||||||||||||||||
| Description of securities | Fair Value | Unrealized losses | Fair Value | Unrealized losses | Fair Value | Unrealized losses | |||||||||||||||||
| December 31, 2017 (audited): | |||||||||||||||||||||||
| U.S. Government and government agencies and authorities | $ | 387 | $ | 2 | $ | 2,978 | $ | 120 | $ | 3,365 | $ | 122 | |||||||||||
| Industrial and miscellaneous | 6,920 | 54 | 1,707 | 12 | 8,627 | 66 | |||||||||||||||||
| Total fixed maturities | 7,306 | 56 | 4,685 | 132 | 11,992 | 188 | |||||||||||||||||
| Common stocks, unaffiliated | 187 | 6 | 98 | 2 | 285 | 8 | |||||||||||||||||
| Total temporarily impaired securities | $ | 7,494 | $ | 62 | $ | 4,783 | $ | 135 | $ | 12,277 | $ | 196 | |||||||||||
| Less than 12 months (dollars in thousands) | 12 months or longer (dollars in thousands) | Total (dollars in thousands) | |||||||||||||||||||||
| Description of securities | Fair Value | Unrealized losses | Fair Value | Unrealized losses | Fair Value | Unrealized losses | |||||||||||||||||
| December 31, 2016 (audited): | |||||||||||||||||||||||
| U.S. Government and government agencies and authorities | $ | 4,705 | $ | 105 | $ | 520 | $ | 43 | $ | 5,225 | $ | 148 | |||||||||||
| Industrial and miscellaneous | 1,458 | 15 | 1,937 | 26 | 3,395 | 41 | |||||||||||||||||
| Total fixed maturities | 6,163 | 120 | 2,457 | 69 | 8,620 | 189 | |||||||||||||||||
| Common stocks, unaffiliated | 602 | 20 | — | — | 602 | 20 | |||||||||||||||||
| Total temporarily impaired securities | $ | 6,765 | $ | 140 | $ | 2,457 | $ | 69 | $ | 9,222 | $ | 209 | |||||||||||
| Total | Level 1 | Level 2 | Level 3 | ||||||||||||
| Bonds | $ | 19,449 | $ | — | $ | 19,449 | $ | — | |||||||
| Common stocks | $ | 1,920 | $ | 1,920 | $ | — | $ | — | |||||||
| Total | Level 1 | Level 2 | Level 3 | ||||||||||||
| Bonds | $ | 21,229 | $ | — | $ | 21,229 | $ | — | |||||||
| Common stocks | $ | 1,820 | $ | 1,820 | $ | — | $ | — | |||||||
| Total | Level 1 | Level 2 | Level 3 | ||||||||||||
| Bonds | $ | 16,619 | $ | — | $ | 16,619 | $ | — | |||||||
| Common stocks | $ | 1,231 | $ | 1,231 | $ | — | $ | — | |||||||
| September 30, 2018 | December 31, 2017 | December 31, 2016 | |||||||||
| (unaudited) | (audited) | (audited) | |||||||||
| Deferred acquisition costs | $ | 2,191 | $ | 2,504 | $ | 1,714 | |||||
| Unearned premium reserves | $ | 7,373 | $ | 8,211 | $ | 7,435 | |||||
| September 30, 2018 | December 31, 2017 | December 31, 2016 | |||||||||
| (unaudited) | (audited) | (audited) | |||||||||
| Deferred acquisition costs | $ | 882 | $ | 1,189 | $ | 1,219 | |||||
| Unearned premium reserves | $ | 4,575 | $ | 5,494 | $ | 6,706 | |||||
| September 30, 2018 | December 31, 2017 | December 31, 2016 | |||||||||
| (unaudited) | (audited) | (audited) | |||||||||
| Deferred acquisition costs | $ | 551 | $ | 385 | $ | 422 | |||||
| Unearned premium reserves | $ | 2,014 | $ | 1,609 | $ | 1,753 | |||||
| Nine Months Ended September 30, | Year Ended December 31, | ||||||||||||||
| 2018 | 2017 | 2017 | 2016 | ||||||||||||
| (unaudited) | (unaudited) | (audited) | (audited) | ||||||||||||
| Revenues: | |||||||||||||||
| Net premiums earned | $ | 9,644 | $ | 9,694 | $ | 12,275 | $ | 8,591 | |||||||
| Total revenues | 9,644 | 9,694 | 12,275 | 8,591 | |||||||||||
| Expenses: | |||||||||||||||
| Losses and loss adjustment expenses | 5,435 | 6,540 | 7,733 | 3,920 | |||||||||||
| Underwriting expenses | 4,906 | 4,047 | 5,787 | 4,391 | |||||||||||
| Underwriting (loss) income | (697) | (893) | (1,245 | ) | 280 | ||||||||||
| Investment income, net of investment expense | 873 | 769 | 1,038 | 1,145 | |||||||||||
| Realized investment gains (losses), net | 30 | 35 | (66 | ) | 38 | ||||||||||
| Interest expense | (5 | ) | (7 | ) | (9 | ) | (53 | ) | |||||||
| Income (loss) before income taxes | 201 | (95 | ) | (282 | ) | 1,411 | |||||||||
| Income tax expense (benefit) | 7 | (170) | (260 | ) | 586 | ||||||||||
| Net income (loss) | $ | 194 | $ | 75 | $ | (22 | ) | $ | 825 | ||||||
| Nine Months Ended September 30 | Year Ended December 31, | ||||||||||||||
| 2018 | 2017 | 2017 | 2016 | ||||||||||||
| Average cash and invested assets | $ | 51,479 | $ | 49,709 | $ | 50,823 | $ | 48,351 | |||||||
| Net investment income | 873 | 769 | 1,038 | 1,145 | |||||||||||
| Return on average cash and invested assets (1) | 2.26 | % | 2.06 | % | 2.04 | % | 2.37 | % | |||||||
| (1) | Return on average cash and invested assets is calculated on an annualized basis. |
| Payments due by period | |||||||||||||||||||
| (Dollars in thousands) | |||||||||||||||||||
| Contractual Obligations | Total | Less than 1 year | 1-3 years | 3-5 years | More than 5 years | ||||||||||||||
| Estimated gross losses & loss adjustment expense payments | $ | 28,213 | $ | 636 | $ | 6,735 | $ | 15,191 | $ | 5,650 | |||||||||
| Total Contractual Obligations | $ | 28,213 | $ | 636 | $ | 6,735 | $ | 15,191 | $ | 5,650 | |||||||||
| Nine Months Ended September 30, | Years Ended December 31, | ||||||||||||||
| 2018 | 2017 | 2017 | 2016 | ||||||||||||
| (unaudited) | (unaudited) | (audited) | (audited) | ||||||||||||
| Cash flows (used in) provided by operating activities | $ | (1,687 | ) | $ | 1,444 | $ | 3,741 | $ | 1,221 | ||||||
| Cash flows provided by (used in) investing activities | 829 | (4,086 | ) | (6,082 | ) | (1,544 | ) | ||||||||
| Cash flows used in financing activities | (45 | ) | (580 | ) | (595 | ) | (55 | ) | |||||||
| Net decrease in cash and cash equivalents | $ | (903 | ) | $ | (3,222 | ) | $ | (2,936 | ) | $ | (378 | ) | |||
| Estimated Change in Fair Value | Fair Value | |||||||
Hypothetical Change in Interest Rates | (Dollars in thousands) | |||||||
| 200 basis point increase | $ | (2,985 | ) | $ | 38,790 | |||
| 100 basis point increase | (1,491 | ) | 40,284 | |||||
| No change | 41,775 | |||||||
| 100 basis point decrease | 1,482 | 43,257 | ||||||
| 200 basis point decrease | 2,966 | 44,741 | ||||||
| Estimated Change in Fair Value | Fair Value | |||||||
Hypothetical Change in Interest Rates | (Dollars in thousands) | |||||||
| 200 basis point increase | $ | (1,828 | ) | $ | 23,759 | |||
| 100 basis point increase | (913 | ) | 24,674 | |||||
| No change | 25,587 | |||||||
| 100 basis point decrease | 908 | 26,495 | ||||||
| 200 basis point decrease | 1,817 | 27,404 | ||||||
| Estimated Change in Fair Value | Fair Value | |||||||
Hypothetical Change in Interest Rates | (Dollars in thousands) | |||||||
| 200 basis point increase | $ | (1,390 | ) | $ | 18,059 | |||
| 100 basis point increase | (694 | ) | 18,755 | |||||
| No change | 19,449 | |||||||
| 100 basis point decrease | 690 | 20,139 | ||||||
| 200 basis point decrease | 1,381 | 20,830 | ||||||
| Nine Months Ended September 30, | Year Ended December 31, | ||||||||||||||
| 2018 | 2017 | 2017 | 2016 | ||||||||||||
| (unaudited) | (unaudited) | (audited) | (audited) | ||||||||||||
| Revenues: | |||||||||||||||
| Net premiums earned | $ | 4,475 | $ | 5,753 | $ | 7,480 | $ | 13,310 | |||||||
| Total revenues | 4,475 | 5,753 | 7,480 | 13,310 | |||||||||||
| Expenses: | |||||||||||||||
| Losses and loss adjustment expenses | 5,052 | 2,646 | 4,012 | 6,550 | |||||||||||
| Underwriting expenses | 2,579 | 2,725 | 3,500 | 6,091 | |||||||||||
| Underwriting (loss) income | (3,156 | ) | 382 | (33 | ) | 669 | |||||||||
| Investment income, net of investment expenses | 550 | 395 | 571 | 633 | |||||||||||
| Realized investment gains (losses), net | 11 | 15 | 13 | (10 | ) | ||||||||||
| Interest expense | — | (31 | ) | (31 | ) | — | |||||||||
| (Loss) income before income taxes | (2,595 | ) | 761 | 520 | 1,292 | ||||||||||
| Income tax (benefit) expense | (515 | ) | 225 | 209 | 671 | ||||||||||
| Net (loss) income | $ | (2,080 | ) | $ | 536 | $ | 311 | $ | 621 | ||||||
| Nine Months Ended September 30, | Year Ended December 31, | ||||||||||||||
| 2018 | 2017 | 2017 | 2016 | ||||||||||||
| Average cash and invested assets | $ | 32,335 | $ | 37,566 | $ | 36,120 | $ | 42,845 | |||||||
| Net investment income | 550 | 395 | 571 | 633 | |||||||||||
| Return on average cash and invested assets (1) | 2.27 | % | 1.40 | % | 1.58 | % | 1.48 | % | |||||||
| (1) | Return on average cash and invested assets is calculated on an annualized basis. |
| Payments due by period | |||||||||||||||||||
| (Dollars in thousands) | |||||||||||||||||||
| Contractual Obligations | Total | Less than 1 year | 1-3 years | 3 - 5 years | More than 5 years | ||||||||||||||
| Estimated gross losses and loss adjustment expense payments | $ | 19,915 | $ | 1,056 | $ | 7,687 | $ | 7,767 | $ | 3,405 | |||||||||
| Total Contractual Obligations | $ | 19,915 | $ | 1,056 | $ | 7,687 | $ | 7,767 | $ | 3,405 | |||||||||
| Nine Months Ended September 30, | Year Ended December 31, | ||||||||||||||
| 2018 | 2017 | 2017 | 2016 | ||||||||||||
| (unaudited) | (unaudited) | (audited) | (audited) | ||||||||||||
| Cash flows used in operating activities | $ | (1,244 | ) | $ | (2,727 | ) | $ | (5,566 | ) | $ | (7,731 | ) | |||
| Cash flows (used in) provided by investing activities | (752 | ) | (327 | ) | 4,518 | 10,561 | |||||||||
| Cash flows used in financing activities | — | (500 | ) | (500 | ) | — | |||||||||
| Net (decrease) increase in cash and cash equivalents | $ | (1,996 | ) | (3,554 | ) | $ | (1,548 | ) | $ | 2,830 | |||||
| Nine Months Ended September 30, | Year Ended December 31, | ||||||||||||||
| 2018 | 2017 | 2017 | 2016 | ||||||||||||
| (unaudited) | (unaudited) | (audited) | (audited) | ||||||||||||
| Revenues: | |||||||||||||||
| Net premiums earned | $ | 2,366 | $ | 2,418 | $ | 3,148 | $ | 3,793 | |||||||
| Total revenues | 2,366 | 2,418 | 3,148 | 3,793 | |||||||||||
| Expenses: | |||||||||||||||
| Losses and loss adjustment expenses | 1,265 | 1,495 | 1,823 | 210 | |||||||||||
| Underwriting expenses | 1,485 | 1,457 | 1,855 | 2,252 | |||||||||||
| Underwriting (loss) income | (384 | ) | (534 | ) | (530 | ) | 1,331 | ||||||||
| Investment income, net of investment expenses | 492 | 367 | 521 | 645 | |||||||||||
| Realized investment gains (losses), net | 56 | 60 | 51 | (184 | ) | ||||||||||
| Interest expense | — | — | — | (898 | ) | ||||||||||
| Income (loss) before income taxes | 164 | (107 | ) | 42 | 894 | ||||||||||
| Income tax expense (benefit) | 80 | (41 | ) | 101 | 305 | ||||||||||
| Net income (loss) | $ | 84 | $ | (66 | ) | $ | (59 | ) | $ | 589 | |||||
| Nine Months Ended September 30, | Year Ended December 31, | ||||||||||||||
| 2018 | 2017 | 2017 | 2016 | ||||||||||||
| Average cash and invested assets | $ | 23,990 | $ | 25,545 | $ | 25,555 | $ | 26,279 | |||||||
| Net investment income | 492 | 367 | 521 | 645 | |||||||||||
| Return on average cash and invested assets (1) | 2.73 | % | 1.92 | % | 2.04 | % | 2.46 | % | |||||||
| (1) | Return on average cash and invested assets is calculated on an annualized basis. |
| Payments due by period | |||||||||||||||||||
| (Dollars in thousands) | |||||||||||||||||||
| Contractual Obligations | Total | Less than 1 year | 1-3 years | 3-5 years | More than 5 years | ||||||||||||||
| Estimated gross losses & loss adjustment expense payments | $ | 10,306 | $ | 536 | $ | 1,762 | $ | 3,689 | $ | 4,319 | |||||||||
| Total Contractual Obligations | $ | 10,306 | $ | 536 | $ | 1,762 | $ | 3,689 | $ | 4,319 | |||||||||
| Nine Months Ended September 30, | Years Ended December 31, | ||||||||||||||
| 2018 | 2017 | 2017 | 2016 | ||||||||||||
| (unaudited) | (unaudited) | (audited) | (audited) | ||||||||||||
| Cash flows used in operating activities | $ | (1,541 | ) | $ | (1,226 | ) | $ | (1,149 | ) | $ | (542 | ) | |||
| Cash flows provided by (used in) investing activities | 913 | (1,692 | ) | (5,142 | ) | 4,951 | |||||||||
| Cash flows provided by financing activities | — | — | — | — | |||||||||||
| Net (decrease) increase in cash and cash equivalents | $ | (628 | ) | $ | (2,918 | ) | $ | (6,291 | ) | $ | 4,409 | ||||
| • | Term: The Management Agreement will have a rolling seven-year term, as compared with the perpetual duration of the attorney-in-fact agreements. |
| • | Percentage Fee: The Management Agreement will have a base management fee based upon a percentage of Positive Insurance’s gross written premiums, less return premiums. The percentage will initially be 25% of gross written premiums, less return premiums, in 2018, and which will decline to 12% in 2019, 11% in 2020, and 10% in 2021. At January 1, 2022, the percentage will thereafter be set at 9% of gross written premiums, less return premiums. If by December 31, 2019, the Company has not acquired one or more additional insurance entities with additional annual gross written premiums of at least $10,000,000 |
| • | Incentive Fee: The Management Agreement will include a quarterly incentive fee payable to Diversus Management equal to the product of (x) 100 minus the combined ratio of Positive Insurance, (y) 0.0825, and (z) net premiums earned calculated on a rolling 12-month basis. The attorney-in-fact agreements have no incentive fee component. |
| • | Underwriting: All underwriting decisions will be made by the officers of Positive Insurance. |
| • | Enhanced Insurer Oversight: The board of directors of Positive Insurance will have enhanced oversight and approval rights over the services provided and some decisions to be made by Diversus Management. Currently PCA, PIPE, and PPIX do not have subscribers committees that oversee the services provided by the attorneys-in-fact. |
| • | Share repurchases; |
| • | A follow on offering of our common stock or the issuance of our stock in connection with acquisitions; or |
| • | A sale of the Company to a larger participant in the MPLI market or the insurance industry generally. |
| • | reduce net liability on individual risks; |
| • | mitigate the effect of individual loss occurrences; |
| • | stabilize underwriting results; and |
| • | increase our underwriting capacity. |
| Claims with MCARE Coverage | Claims Without MCARE Coverage | ||||||||||
| Losses Incurred | Retained by PPIX/ PCA/PIPE | Ceded Under Reinsurance Treaty or MCARE | Retained by PPIX/ PCA/PIPE | Ceded Under Reinsurance Treaty | |||||||
| Up to $300,000 | 100 | % | 0 | % | 100 | % | 0 | % | |||
| $700,000 in excess of $300,000 | 0 | % | 100 | % | 0 | % | 100 | % | |||
| In excess of $1.0 million (limited to $2.0 million) | 0 | % | 100 | % | 0 | % | 100 | % | |||
| Claims | |||||
| Losses Incurred | Retained by PPIX/PIPE | Ceded Under Reinsurance Treaty | |||
| Up to $300,000 | 100 | % | 0 | % | |
| In excess of $300,000 | 0 | % | 100 | % | |
| Claims | |||||
| Losses Incurred | Retained by PCA | Ceded Under Reinsurance Treaty | |||
| Up to $300,000 | 100 | % | 0 | % | |
| In excess of $300,000 | 0 | % | 100 | % | |
| Reinsurance Company | Losses & Loss Expense Recoverable On Unpaid Claims | Percentage of Total Recoverable | A.M. Best Rating | |||||
| Catlin Underwriting Agencies Ltd. Lloyd’s Syndicate 2003 | $ | 4,159 | 69.7 | % | A (Excellent) | |||
| Catlin Insurance Company | 154 | 2.6 | % | A (Excellent) | ||||
| Hannover Rueck SE | 1,296 | 21.7 | % | A+ (Superior) | ||||
| American Safety Re | 80 | 1.3 | % | Not rated | ||||
| Faraday Underwriting Ltd. Lloyd’s Syndicate 435 | 80 | 1.3 | % | A (Excellent) | ||||
| Aspen Insurance UK Ltd. | 89 | 1.5 | % | A (Excellent) | ||||
| Barbican Syndicate 1955 | 64 | 1.1 | % | A (Excellent) | ||||
| BRIT Syndicate Ltd. 2987 | 24 | 0.4 | % | A (Excellent) | ||||
| Wellington Underwriting Agencies Lloyd’s Syndicate 2020 | 25 | 0.4 | % | A (Excellent) | ||||
| Total | $ | 5,971 | 100.0 | % | ||||
| Reinsurance Company | Losses & Loss Expense Recoverable On Unpaid Claims | Percentage of Total Recoverable | A.M. Best Rating | |||||
| Catlin Underwriting Agencies Ltd. Lloyd’s Syndicate 2003 | $ | 5,260 | 91.2 | % | A (Excellent) | |||
| Catlin Insurance Company | 136 | 2.4 | % | A (Excellent) | ||||
| American Safety Re | 80 | 1.4 | % | Not rated | ||||
| Faraday Underwriting Ltd. Lloyd’s Syndicate 435 | 71 | 1.2 | % | A (Excellent) | ||||
| Aspen Insurance UK Ltd. | 62 | 1.1 | % | A (Excellent) | ||||
| Barbican Syndicate 1955 | 63 | 1.1 | % | A (Excellent) | ||||
| Lexington Insurance Company | 57 | 1.0 | % | A (Excellent) | ||||
| BRIT Syndicate Ltd. 2987 | 24 | 0.4 | % | A (Excellent) | ||||
| Wellington Underwriting Agencies Lloyd’s Syndicate 2020 | 12 | 0.2 | % | A (Excellent) | ||||
| Total | $ | 5,765 | 100.0 | % | ||||
| Reinsurance Company | Losses & Loss Expense Recoverable On Unpaid Claims | Percentage of Total Recoverable | A.M. Best Rating | |||||
| Hannover Rueck SE | $ | 1,063 | 53.1 | % | A+ (Superior) | |||
| Scor Reinsurance | 752 | 37.5 | % | A (Excellent) | ||||
| Tokio Millennium | 188 | 9.4 | % | A++ (Superior) | ||||
| Total | $ | 2,003 | 100.0 | % | ||||
| Reinsurance Company | Losses & Loss Expense Recoverable On Unpaid Claims | Percentage of Total Recoverable | A.M. Best Rating | |||||
| Hannover Rueck SE | $ | 995 | 67.8 | % | A+ (Superior) | |||
| Scor Reinsurance | 329 | 22.4 | % | A (Excellent) | ||||
| XL Reinsurance American Incorporated | 53 | 3.6 | % | A (Excellent) | ||||
| Ace Property & Casualty | 27 | 1.8 | % | A++ (Superior) | ||||
| Tokio Millennium | 64 | 4.4 | % | A++ (Superior) | ||||
| Total | $ | 1,468 | 100.0 | % | ||||
| Reinsurance Company | Losses & Loss Expense Recoverable On Unpaid Claims | Percentage of Total Recoverable | A.M. Best Rating | |||||
| Hannover Rueck SE | $ | 285 | 100.0 | % | A+ (Superior) | |||
| Total | $ | 285 | 100.0 | % | ||||
| Reinsurance Company | Losses & Loss Expense Recoverable On Unpaid Claims | Percentage of Total Recoverable | A.M. Best Rating | |||||
| Hannover Rueck SE | $ | 156 | 100.0 | % | A+ (Superior) | |||
| Total | $ | 156 | 100.0 | % | ||||
| PPIX | PCA | PIPE | |||||||||||||||||||||
| Nine Months Ended September 30, | Nine Months Ended September 30, | Nine Months Ended September 30, | |||||||||||||||||||||
| 2018 | 2017 | 2018 | 2017 | 2018 | 2017 | ||||||||||||||||||
| Balance at January 1 (in thousands) | $ | 38,029 | $ | 34,814 | $ | 18,585 | $ | 23,002 | $ | 11,761 | $ | 12,343 | |||||||||||
| Reinsurance recoverable on liability for losses and loss adjustment expenses | 6,117 | 8,670 | 2,312 | 2,465 | 156 | 91 | |||||||||||||||||
| Reinsurance recoverable on claims paid | 352 | 3,615 | 844 | 740 | — | — | |||||||||||||||||
| Net liability at January 1 | 32,264 | 29,759 | 17,117 | 21,277 | 11,605 | 12,252 | |||||||||||||||||
| Losses and loss adjustment expenses incurred, net: | |||||||||||||||||||||||
| Current periods | 5,435 | 6,540 | 2,793 | 1,933 | 1,548 | 1,716 | |||||||||||||||||
| Prior periods | — | — | 2,259 | 713 | (283 | ) | (221 | ) | |||||||||||||||
| Total incurred losses and loss adjustment expenses | 5,435 | 6,540 | 5,052 | 2,646 | 1,265 | 1,495 | |||||||||||||||||
| Less losses and loss adjustment expenses paid, net: | |||||||||||||||||||||||
| Current periods | 256 | 351 | 107 | 207 | 73 | 49 | |||||||||||||||||
| Prior periods | 5,997 | 3,751 | 4,150 | 4,712 | 2,776 | 1,958 | |||||||||||||||||
| Total losses and loss adjustment expenses paid | 6,253 | 4,102 | 4,257 | 4,919 | 2,849 | 2,007 | |||||||||||||||||
| Net liability for liability for losses and loss adjustment expenses, at end of year | 31,446 | 32,197 | 17,912 | 19,004 | 10,021 | 11,740 | |||||||||||||||||
| Reinsurance recoverable on liability for losses and loss adjustment expenses | 6,073 | 5,795 | 2,003 | 2,258 | 285 | 282 | |||||||||||||||||
| Reinsurance recoverable on claims paid | 102 | 1,007 | — | 417 | — | — | |||||||||||||||||
| Liability for losses and loss adjustment expenses, December 31 | $ | 37,417 | $ | 36,985 | $ | 19,915 | $ | 20,845 | $ | 10,306 | $ | 12,022 | |||||||||||
| PPIX | PCA | PIPE | |||||||||||||||||||||
| Years Ended December 31, | Years Ended December 31, | Years Ended December 31, | |||||||||||||||||||||
| 2017 | 2016 | 2017 | 2016 | 2017 | 2016 | ||||||||||||||||||
| Balance at January 1 (in thousands) | $ | 34,814 | $ | 36,069 | $ | 23,002 | $ | 27,552 | $ | 12,343 | $ | 14,888 | |||||||||||
| Reinsurance recoverable on liability for losses and loss adjustment expenses | 8,670 | 6,118 | 2,465 | 2,184 | 91 | — | |||||||||||||||||
| Reinsurance recoverable on claims paid | 3,615 | — | 740 | 306 | — | — | |||||||||||||||||
| Net liability at January 1 | 29,759 | 29,951 | 21,277 | 25,674 | 12,252 | 14,888 | |||||||||||||||||
| Losses and loss adjustment expenses incurred, net: | |||||||||||||||||||||||
| Current year | 10,378 | 8,346 | 4,435 | 7,769 | 2,163 | 2,542 | |||||||||||||||||
| Prior years | (2,645 | ) | (4,426 | ) | (423 | ) | (1,219 | ) | (340 | ) | (2,332 | ) | |||||||||||
| Total incurred losses and loss adjustment expenses | 7,733 | 3,920 | 4,012 | 6,550 | 1,823 | 210 | |||||||||||||||||
| Less losses and loss adjustment expenses paid, net: | |||||||||||||||||||||||
| Current year | 564 | 378 | 311 | 604 | 30 | 258 | |||||||||||||||||
| Prior years | 4,664 | 3,734 | 7,861 | 10,343 | 2,440 | 2,588 | |||||||||||||||||
| Total losses and loss adjustment expenses paid | 5,228 | 4,112 | 8,172 | 10,947 | 2,470 | 2,846 | |||||||||||||||||
| Net liability for liability for losses and loss adjustment expenses, at end of year | 32,264 | 29,759 | 17,117 | 21,277 | 11,605 | 12,252 | |||||||||||||||||
| Reinsurance recoverable on liability for losses and loss adjustment expenses | 6,117 | 8,670 | 2,312 | 2,465 | 156 | 91 | |||||||||||||||||
| Reinsurance recoverable on claims paid | 352 | 3,615 | 844 | 740 | — | — | |||||||||||||||||
| Liability for losses and loss adjustment expenses, December 31 | $ | 38,029 | $ | 34,814 | $ | 18,585 | $ | 23,002 | $ | 11,761 | $ | 12,343 | |||||||||||
| Incurred Losses and Loss Adjustment Expenses, Net of Reinsurance (in thousands) | ||||||||||||||||||||||||||||||
| Accident Year | 2008 | 2009 | 2010 | 2011 | 2012 | 2013 | 2014 | 2015 | 2016 | 2017 | ||||||||||||||||||||
| 2008 | $ | 4,216 | $ | 4,758 | $ | 4,708 | $ | 5,085 | $ | 4,666 | $ | 4,011 | $ | 3,774 | $ | 3,473 | $ | 2,798 | $ | 2,276 | ||||||||||
| 2009 | 3,899 | 3,792 | 3,939 | 3,607 | 3,426 | 2,856 | 2,718 | 2,548 | 2,503 | |||||||||||||||||||||
| 2010 | 4,875 | 4,191 | 4,961 | 4,521 | 4,158 | 3,671 | 3,265 | 2,937 | ||||||||||||||||||||||
| 2011 | 5,329 | 5,473 | 5,456 | 5,221 | 4,948 | 4,276 | 4,447 | |||||||||||||||||||||||
| 2012 | 6,258 | 5,956 | 5,946 | 5,643 | 5,405 | 6,410 | ||||||||||||||||||||||||
| 2013 | 6,547 | 6,722 | 6,199 | 5,625 | 5,224 | |||||||||||||||||||||||||
| 2014 | 6,353 | 6,034 | 5,562 | 4,278 | ||||||||||||||||||||||||||
| 2015 | 8,173 | 7,575 | 6,992 | |||||||||||||||||||||||||||
| 2016 | 8,136 | 7,502 | ||||||||||||||||||||||||||||
| 2017 | 10,184 | |||||||||||||||||||||||||||||
| $ | 52,753 | |||||||||||||||||||||||||||||
| Cumulative Paid Losses and Loss Adjustment Expenses, Net of Reinsurance (in thousands) | ||||||||||||||||||||||||||||||
| Accident Year | 2008 | 2009 | 2010 | 2011 | 2012 | 2013 | 2014 | 2015 | 2016 | 2017 | ||||||||||||||||||||
| 2008 | $ | 32 | $ | 363 | $ | 685 | $ | 999 | $ | 1,659 | $ | 1,866 | $ | 1,940 | $ | 1,959 | $ | 1,969 | $ | 1,985 | ||||||||||
| 2009 | 58 | 312 | 530 | 829 | 1,291 | 1,577 | 1,656 | 1,573 | 1,602 | |||||||||||||||||||||
| 2010 | 30 | 255 | 466 | 871 | 1,410 | 1,531 | 1,736 | 1,911 | ||||||||||||||||||||||
| 2011 | 69 | 366 | 903 | 1,959 | 3,400 | 2,988 | 3,273 | |||||||||||||||||||||||
| 2012 | 83 | 464 | 901 | 1,870 | 3,775 | 5,193 | ||||||||||||||||||||||||
| 2013 | 50 | 236 | 950 | 2,306 | 2,617 | |||||||||||||||||||||||||
| 2014 | 42 | 292 | 766 | 1,792 | ||||||||||||||||||||||||||
| 2015 | 79 | 381 | 1,162 | |||||||||||||||||||||||||||
| 2016 | 193 | 807 | ||||||||||||||||||||||||||||
| 2017 | 400 | |||||||||||||||||||||||||||||
| $ | 20,742 | |||||||||||||||||||||||||||||
| All outstanding liabilities before 2008, net of reinsurance | 253 | |||||||||||||||||||||||||||||
| Liabilities for losses and loss adjustment expenses, net of reinsurance | $ | 32,264 | ||||||||||||||||||||||||||||
| Net outstanding liabilities for losses and loss adjustment expenses: | |||
| Medical professional | $ | 32,264 | |
| Liabilities for losses and loss adjustment expenses, net of reinsurance | 32,264 | ||
| Reinsurance recoverable on unpaid claims: | |||
| Medical professional | 5,765 | ||
| Total reinsurance recoverable on unpaid claims | 5,765 | ||
| Total gross liability for losses and loss adjustment expenses | $ | 38,029 | |
| Incurred Losses and Loss Adjustment Expenses, Net of Reinsurance (in thousands) | ||||||||||||||||||||||||||||||
| Accident Year | 2008 | 2009 | 2010 | 2011 | 2012 | 2013 | 2014 | 2015 | 2016 | 2017 | ||||||||||||||||||||
| 2008 | $ | 14,470 | $ | 10,342 | $ | 10,126 | $ | 8,943 | $ | 9,012 | $ | 8,654 | $ | 8,746 | $ | 8,912 | $ | 9,192 | $ | 9,121 | ||||||||||
| 2009 | 13,591 | 11,440 | 10,624 | 9,767 | 9,791 | 9,712 | 10,438 | 11,064 | 11,196 | |||||||||||||||||||||
| 2010 | 8,455 | 6,567 | 6,443 | 5,740 | 4,990 | 4,563 | 4,461 | 5,127 | ||||||||||||||||||||||
| 2011 | 9,459 | 9,537 | 9,471 | 11,602 | 11,928 | 11,982 | 12,428 | |||||||||||||||||||||||
| 2012 | 9,877 | 9,364 | 9,553 | 10,064 | 10,146 | 10,420 | ||||||||||||||||||||||||
| 2013 | 7,818 | 7,057 | 6,270 | 5,536 | 5,040 | |||||||||||||||||||||||||
| 2014 | 7,403 | 5,924 | 5,989 | 5,672 | ||||||||||||||||||||||||||
| 2015 | 8,374 | 7,292 | 6,500 | |||||||||||||||||||||||||||
| 2016 | 7,529 | 7,873 | ||||||||||||||||||||||||||||
| 2017 | 4,378 | |||||||||||||||||||||||||||||
| $ | 77,755 | |||||||||||||||||||||||||||||
| Cumulative Losses and Loss Adjustment Expenses, Net of Reinsurance (in thousands) | ||||||||||||||||||||||||||||||
| Accident Year | 2008 | 2009 | 2010 | 2011 | 2012 | 2013 | 2014 | 2015 | 2016 | 2017 | ||||||||||||||||||||
| 2008 | $ | 411 | $ | 2,077 | $ | 4,999 | $ | 6,512 | $ | 7,424 | $ | 7,675 | $ | 7,925 | $ | 8,098 | $ | 9,128 | $ | 8,941 | ||||||||||
| 2009 | 408 | 1,605 | 4,028 | 7,214 | 7,956 | 8,282 | 9,507 | 10,240 | 11,057 | |||||||||||||||||||||
| 2010 | 267 | 963 | 2,065 | 3,078 | 3,671 | 3,851 | 3,981 | 4,986 | ||||||||||||||||||||||
| 2011 | 398 | 1,132 | 2,802 | 8,926 | 10,356 | 11,098 | 11,795 | |||||||||||||||||||||||
| 2012 | 423 | 1,500 | 3,240 | 5,736 | 8,617 | 9,811 | ||||||||||||||||||||||||
| 2013 | 406 | 1,336 | 2,715 | 4,191 | 4,435 | |||||||||||||||||||||||||
| 2014 | 285 | 1,017 | 2,884 | 4,094 | ||||||||||||||||||||||||||
| 2015 | 381 | 1,802 | 3,197 | |||||||||||||||||||||||||||
| 2016 | 512 | 2,475 | ||||||||||||||||||||||||||||
| 2017 | 302 | |||||||||||||||||||||||||||||
| $ | 61,093 | |||||||||||||||||||||||||||||
| All outstanding liabilities before 2008, net of reinsurance | 50 | |||||||||||||||||||||||||||||
| Liabilities for losses and loss adjustment expenses, net of reinsurance | $ | 16,712 | ||||||||||||||||||||||||||||
| Net outstanding liabilities for losses and loss adjustment expenses: | |||
| Medical professional | $ | 16,712 | |
| Liabilities for losses and loss adjustment expenses, net of reinsurance | 16,712 | ||
| Reinsurance recoverable on unpaid claims: | |||
| Medical professional | 1,468 | ||
| Total reinsurance recoverable on unpaid claims | 1,468 | ||
| Unallocated loss adjustment expenses | 405 | ||
| Total gross liability for losses and loss adjustment expenses | $ | 18,585 | |
| Incurred Losses and Loss Adjustment Expenses, Net of Reinsurance (in thousands) | ||||||||||||||||||||||||||||||
| Accident Year | 2008 | 2009 | 2010 | 2011 | 2012 | 2013 | 2014 | 2015 | 2016 | 2017 | ||||||||||||||||||||
| 2008 | $ | 3,610 | $ | 2,783 | $ | 2,293 | $ | 1,389 | $ | 1,117 | $ | 1,035 | $ | 1,037 | $ | 886 | $ | 770 | $ | 875 | ||||||||||
| 2009 | 4,299 | 3,801 | 4,603 | 4,624 | 4,687 | 5,501 | 6,253 | 6,663 | 7,421 | |||||||||||||||||||||
| 2010 | 5,262 | 4,314 | 4,306 | 4,229 | 3,517 | 3,667 | 3,048 | 3,224 | ||||||||||||||||||||||
| 2011 | 4,736 | 3,773 | 3,664 | 4,352 | 4,203 | 4,772 | 4,454 | |||||||||||||||||||||||
| 2012 | 4,170 | 3,176 | 3,314 | 3,400 | 2,927 | 2,914 | ||||||||||||||||||||||||
| 2013 | 3,388 | 3,100 | 2,750 | 2,063 | 1,183 | |||||||||||||||||||||||||
| 2014 | 3,551 | 3,150 | 2,247 | 1,137 | ||||||||||||||||||||||||||
| 2015 | 3,452 | 2,918 | 3,002 | |||||||||||||||||||||||||||
| 2016 | 2,800 | 3,486 | ||||||||||||||||||||||||||||
| 2017 | 2,026 | |||||||||||||||||||||||||||||
| $ | 29,722 | |||||||||||||||||||||||||||||
| Cumulative Losses and Loss Adjustment Expenses, Net of Reinsurance (in thousands) | ||||||||||||||||||||||||||||||
| Accident Year | 2008 | 2009 | 2010 | 2011 | 2012 | 2013 | 2014 | 2015 | 2016 | 2017 | ||||||||||||||||||||
| 2008 | $ | 21 | $ | (1,085 | ) | $ | (817 | ) | $ | (50 | ) | $ | 341 | $ | 481 | $ | 519 | $ | 617 | $ | 722 | $ | 739 | |||||||
| 2009 | 52 | 315 | 1,112 | 2,122 | 3,246 | 4,449 | 4,620 | 6,075 | 6,695 | |||||||||||||||||||||
| 2010 | 167 | 503 | 1,631 | 2,363 | 1,802 | 2,392 | 2,611 | 2,724 | ||||||||||||||||||||||
| 2011 | 111 | 390 | 1,342 | 1,232 | 3,155 | 3,688 | 3,802 | |||||||||||||||||||||||
| 2012 | 496 | 657 | 1,496 | 2,166 | 1,984 | 2,361 | ||||||||||||||||||||||||
| 2013 | 70 | 324 | 584 | 445 | 573 | |||||||||||||||||||||||||
| 2014 | 90 | 367 | 419 | 562 | ||||||||||||||||||||||||||
| 2015 | 63 | 293 | 827 | |||||||||||||||||||||||||||
| 2016 | 239 | 536 | ||||||||||||||||||||||||||||
| 2017 | 26 | |||||||||||||||||||||||||||||
| $ | 18,845 | |||||||||||||||||||||||||||||
| All outstanding liabilities before 2008, net of reinsurance | 506 | |||||||||||||||||||||||||||||
| Liabilities for losses and loss adjustment expenses, net of reinsurance | $ | 11,383 | ||||||||||||||||||||||||||||
| Net outstanding liabilities for losses and loss adjustment expenses: | |||
| Medical professional | $ | 11,383 | |
| Liabilities for losses and loss adjustment expenses, net of reinsurance | 11,383 | ||
| Reinsurance recoverable on unpaid claims: | |||
| Medical professional | 156 | ||
| Total reinsurance recoverable on unpaid claims | 156 | ||
| Unallocated loss adjustment expenses | 222 | ||
| Total gross liability for losses and loss adjustment expenses | $ | 11,761 | |
| • | Commodities and futures contracts; |
| • | Options (except covered call options); |
| • | Interest-only, principal-only, and residual tranche collateralized mortgage obligations; |
| • | Foreign currency trading; |
| • | Venture-capital investments; |
| • | Securities lending; |
| • | Portfolio leveraging, i.e., margin transactions; and |
| • | Short selling. |
| September 30, 2018 | December 31, | ||||||||||||||||||||||
| 2017 | 2016 | ||||||||||||||||||||||
| Cost or Amortized Cost (unaudited) | Estimated Fair Value or Equity Method Value (unaudited) | Cost or Amortized Cost (audited) | Estimated Fair Value or Equity Method Value (audited) | Cost or Amortized Cost (audited) | Estimated Fair Value or Equity Method Value (audited) | ||||||||||||||||||
| Agencies not backed by the full faith and credit of the U.S. government | $ | 4,808 | $ | 4,685 | $ | 7,416 | $ | 7,323 | $ | 8,191 | $ | 8,092 | |||||||||||
| U.S. Treasury securities | 250 | 234 | 350 | 341 | 595 | 581 | |||||||||||||||||
| States, territories and possessions | 915 | 910 | 1,202 | 1,213 | 1,224 | 1,222 | |||||||||||||||||
| Special revenue | 9,910 | 9,853 | 9,738 | 9,881 | 9,998 | 10,016 | |||||||||||||||||
| Industrial and miscellaneous | 26,774 | 26,093 | 24,991 | 25,028 | 19,360 | 19,244 | |||||||||||||||||
| Total debt securities | 42,657 | 41,775 | 43,697 | 43,786 | 39,368 | 39,155 | |||||||||||||||||
| Equity securities | 2,841 | 2,860 | 2,737 | 2,807 | 2,505 | 2,491 | |||||||||||||||||
| Total securities at fair value | 45,498 | 44,635 | 46,434 | 46,593 | 41,873 | 41,646 | |||||||||||||||||
| Limited partnerships | 3,150 | 4,296 | 3,150 | 4,116 | 1,850 | 2,135 | |||||||||||||||||
| Total | $ | 48,648 | $ | 48,931 | $ | 49,584 | $ | 50,709 | $ | 43,723 | $ | 43,781 | |||||||||||
| September 30, 2018 | ||||||
| Rating | Estimated Fair Value | Percent of Total (1) | ||||
| Agencies not backed by the full faith and credit of the U.S. government | $ | 4,685 | 11.2 | % | ||
| U.S. Treasury securities | 234 | 0.6 | % | |||
| AAA | 2,278 | 5.5 | % | |||
| AA | 9,252 | 22.1 | % | |||
| A | 14,675 | 35.1 | % | |||
| BBB | 10,651 | 25.5 | % | |||
| Total | $ | 41,775 | 100.0 | % | ||
| (1) | Represents percent of fair value for classification as a percent of the total portfolio. |
| September 30, 2018 | |||||||
| Amortized Cost | Estimated Fair Value (1) | ||||||
| Less than one year | $ | 1,901 | $ | 1,900 | |||
| One through five years | 27,358 | 26,957 | |||||
| Five through ten years | 13,398 | 12,919 | |||||
| Greater than ten years | — | — | |||||
| Total debt securities | $ | 42,657 | $ | 41,775 | |||
| (1) | Debt securities are carried at fair value in PPIX’s financial statements beginning on page F-28. |
| Nine Months Ended September 30, | Year Ended December 31, | ||||||||||||||
| 2018 | 2017 | 2017 | 2016 | ||||||||||||
| Average cash and invested assets | $ | 51,479 | $ | 49,709 | $ | 50,823 | $ | 48,351 | |||||||
| Net investment income | 873 | 769 | 1,038 | 1,145 | |||||||||||
| Return on average cash and invested assets (1) | 2.26 | % | 2.06 | % | 2.04 | % | 2.37 | % | |||||||
| (1) | Return on average cash and invested assets is calculated on an annualized basis. |
| December 31, | |||||||||||||||||||||||
| September 30, 2018 | 2017 | 2016 | |||||||||||||||||||||
| Cost or Amortized Cost (unaudited) | Estimated Fair Value or Equity Method Value (unaudited) | Cost or Amortized Cost (audited) | Estimated Fair Value (audited) | Cost or Amortized Cost (audited) | Estimated Fair Value (audited) | ||||||||||||||||||
| Agencies not backed by the full faith and credit of the U.S. government | $ | 1,249 | $ | 1,239 | $ | 1,225 | $ | 1,212 | $ | 3,827 | $ | 3,816 | |||||||||||
| U.S. treasury securities | 2,848 | 2,766 | 5,468 | 5,415 | 9,522 | 9,477 | |||||||||||||||||
| Special revenue | 844 | 841 | 915 | 913 | 1,520 | 1,517 | |||||||||||||||||
| Industrial and miscellaneous | 21,252 | 20,741 | 18,186 | 18,175 | 16,055 | 16,033 | |||||||||||||||||
| Total debt securities | 26,193 | 25,587 | 25,795 | 25,715 | 30,924 | 30,843 | |||||||||||||||||
| Equity securities | 2,789 | 3,324 | 2,759 | 3,241 | 2,305 | 2,394 | |||||||||||||||||
| Total securities at fair value | 28,982 | 28,911 | 28,554 | 28,956 | 33,229 | 33,237 | |||||||||||||||||
| Limited partnerships | 150 | 150 | — | — | — | — | |||||||||||||||||
| Total | $ | 29,132 | $ | 29,061 | $ | 28,554 | $ | 28,956 | $ | 33,229 | $ | 33,237 | |||||||||||
| September 30, 2018 | ||||||
| Rating (1) | Estimated Fair Value | Percent Of Total (2) | ||||
| Agencies not backed by the full faith and credit of the U.S. government | $ | 1,239 | 4.8 | % | ||
| U.S. treasury securities | 2,766 | 10.8 | % | |||
| AAA | 194 | 0.8 | % | |||
| AA | 3,594 | 14.0 | % | |||
| A | 11,263 | 44.0 | % | |||
| BBB | 6,129 | 24.0 | % | |||
| Not rated | 403 | 1.6 | % | |||
| Total | $ | 25,587 | 100.0 | % | ||
| (1) | The ratings set forth in this table are based on the ratings assigned by S&P. If S&P’s ratings were unavailable, the equivalent ratings supplied by Moody’s Investor Service, Fitch Investors Service, Inc. or the National Association of Insurance Commissioners (NAIC) were used where available. |
| (2) | Represents percent of fair value for classification as a percent of the total portfolio. |
| September 30, 2018 | |||||||
Amortize Cost | Estimated Fair Value (1) | ||||||
| Less than one year | $ | 1,584 | $ | 1,571 | |||
| One through five years | 15,937 | 15,635 | |||||
| Five through ten years | 8,672 | �� | 8,381 | ||||
| Greater than ten years | — | — | |||||
| Total debt securities | $ | 26,193 | $ | 25,587 | |||
| (1) | Debt securities are carried at fair value in PCA’s financial statements beginning on page G-26. |
| Nine Months Ended September 30, | Year Ended December 31, | ||||||||||||||
| 2018 | 2017 | 2017 | 2016 | ||||||||||||
| Average cash and invested assets | $ | 32,335 | $ | 37,566 | $ | 36,120 | $ | 42,845 | |||||||
| Net investment income | 550 | 395 | 571 | 633 | |||||||||||
Return on average cash and invested assets (1) | 2.27 | % | 1.40 | % | 1.58 | % | 1.48 | % | |||||||
| (1) | Return on average cash and invested assets for interim periods is calculated on an annualized basis. |
| September 30, 2018 | December 31, | ||||||||||||||||||||||
| 2017 | 2016 | ||||||||||||||||||||||
| Cost or Amortized Cost (unaudited) | Estimated Fair Value or Equity Method Value (unaudited) | Cost or Amortized Cost (audited) | Estimated Fair Value or Equity Method Value (audited) | Cost or Amortized Cost (audited) | Estimated Fair Value (audited) | ||||||||||||||||||
| Agencies not backed by the full faith and credit of the U.S. government | $ | 1,878 | $ | 1,917 | $ | 3,436 | $ | 3,568 | $ | 2,667 | $ | 2,758 | |||||||||||
| U.S. Treasury securities | 1,537 | 1,490 | 1,505 | 1,476 | 3,385 | 3,428 | |||||||||||||||||
| States, territories and possessions | 200 | 204 | 200 | 216 | 302 | 297 | |||||||||||||||||
| Special revenue | 2,519 | 2,489 | 3,206 | 3,183 | 3,688 | 3,634 | |||||||||||||||||
| Industrial and miscellaneous | 13,745 | 13,349 | 12,815 | 12,786 | 6,444 | 6,503 | |||||||||||||||||
| Total debt securities | 19,879 | 19,449 | 21,162 | 21,229 | 16,486 | 16,619 | |||||||||||||||||
| Equity securities | 1,702 | 1,920 | 1,580 | 1,820 | 1,197 | 1,231 | |||||||||||||||||
| Total securities at fair value | 21,581 | 21,369 | 22,742 | 23,049 | 17,683 | 17,850 | |||||||||||||||||
| Limited partnerships | 245 | 235 | 129 | 132 | — | — | |||||||||||||||||
| Total | $ | 21,826 | $ | 21,604 | $ | 22,871 | $ | 23,181 | $ | 17,683 | $ | 17,850 | |||||||||||
| September 30, 2018 | ||||||
| Rating | Estimated Fair Value | Percent of Total (1) | ||||
| Agencies not backed by the full faith and credit of the U.S. government | $ | 1,917 | 9.9 | % | ||
| U.S. Treasury securities | 1,490 | 7.7 | % | |||
| AAA | 803 | 4.1 | % | |||
| AA | 2,261 | 11.6 | % | |||
| A | 7,579 | 39.0 | % | |||
| BBB | 5,141 | 26.4 | % | |||
| CCC | 137 | 0.7 | % | |||
| Not rated | 121 | 0.6 | % | |||
| Total | $ | 19,449 | 100 | % | ||
| (1) | Represents percent of fair value for classification as a percent of the total portfolio. |
| September 30, 2018 | |||||||
| Amortized Cost | Estimated Fair Value (1) | ||||||
| Less than one year | $ | 1,520 | $ | 1,509 | |||
| One through five years | 10,031 | 9,884 | |||||
| Five through ten years | 6,863 | 6,603 | |||||
| Greater than ten years | 1,465 | 1,453 | |||||
| Total debt securities | $ | 19,879 | $ | 19,449 | |||
| (1) | Debt securities are carried at fair value in PIPE’s financial statements beginning on page H-28. |
| Nine Months Ended September 30, | Year Ended December 31, | ||||||||||||||
| 2018 | 2017 | 2017 | 2016 | ||||||||||||
| Average cash and invested assets | $ | 23,990 | $ | 25,545 | $ | 25,555 | $ | 26,279 | |||||||
| Net investment income | 492 | 367 | 521 | 645 | |||||||||||
Return on average cash and invested assets (1) | 2.73 | % | 1.92 | % | 2.04 | % | 2.46 | % | |||||||
| (1) | Return on average cash and invested assets is calculated on an annualized basis. |
| • | the representations and warranties of the Company and the exchanges are true and correct as of the date of the standby stock purchase agreement and as of the date of the closing of the conversion as if made on that date, except where the failure to be true and correct (without regard to any materiality or material adverse effect qualifications contained in such representations) would not reasonably be expected to have, individually or in the aggregate, a material adverse effect (as defined in the standby stock purchase agreement), and provided that certain representations and warranties have to be true and correct in all respects; |
| • | the Company and the exchanges shall have performed in all material respects all of their respective obligations under the standby stock purchase agreement that are required to be performed prior to the closing; |
| • | as of the closing date none of the following shall be in effect: (a) trading in the Company’s common stock shall have been suspended by the SEC or trading in securities generally on the New York Stock Exchange or the NASDAQ Stock Market shall have been suspended or limited or minimum prices shall have been established on either such exchange, (b) a banking moratorium shall have been declared either by United States or New York state authorities, or (c) there shall have occurred any material outbreak or material escalation of hostilities, declaration by the United States of a national emergency or war, or other calamity or crisis which has a material adverse effect on the United States financial markets; |
| • | the gross proceeds from the offering, including the purchases by the standby purchaser, are equal to or greater than $35,700,000; |
| • | since the date of the standby stock purchase agreement, a material adverse effect shall not have occurred with respect to the exchanges and the Company and no change or event shall have occurred that would reasonably be expected to have, individually or in the aggregate, a material adverse effect with respect to the exchanges or the Company; |
| • | the standby purchaser has been granted the right to appoint a member of the board of directors of Diversus, Inc.; and |
| • | if requested by the standby purchaser, the exchanges have obtained adverse development coverage from a reinsurance company acceptable to the standby purchaser in the amount of $15,000,000 and at a cost not in excess of $6,000,000 and attaching at current reserve levels. |
| • | the representations and warranties of the standby purchaser are true and correct in all material respects as of the date of the standby stock purchase agreement and as of the date of the closing of the conversion as if made on that date (except for representations and warranties made as of a specified date, which shall be true and correct as of that specified date); |
| • | the standby purchaser shall have performed in all material respects all of its obligations under the standby stock purchase agreement that are required to be performed prior to the closing; |
| • | as of the closing date none of the following shall be in effect: (a) trading in the Company’s common stock shall have been suspended by the SEC or trading in securities generally on the New York Stock Exchange or the NASDAQ Stock Market shall have been suspended or limited or minimum prices shall have been established on either such exchange, (b) a banking moratorium shall have been declared either by United States or New York state authorities, or (c) there shall have occurred any material outbreak or material escalation of hostilities, declaration by the United States of a national emergency or war, or other calamity or crisis which has a material adverse effect on the United States financial markets; and |
| • | the gross proceeds from the offering, including the purchases by the standby purchaser, are equal to or greater than $35,700,000. |
| • | no judgment, injunction, decree, or other legal restraint shall be outstanding, nor shall any action, suit, claim, investigation, or other legal proceeding be pending that would reasonably be expected to prohibit, or have the effect of rendering unachievable, the consummation of the offerings or the transactions contemplated by the standby stock purchase agreement; |
| • | the registration statement of which this prospectus is a part shall have been declared effective by the SEC and no stop order suspending the effectiveness of such registration statement or any part thereof shall have been issued and no proceeding for that purpose shall have been initiated or threatened by the SEC, and any request of the SEC with respect to such registration statement shall have been complied with; |
| • | at least two-thirds of the votes cast by the subscribers of each exchange voting at the special meeting of the subscribers of such exchange called for such purpose shall have voted to adopt and approve the plan of conversion of the exchange and the transactions contemplated thereunder; |
| • | all consents and approvals of the Department and any other regulatory body or agency necessary to consummate the transactions contemplated by the standby stock purchase agreement shall have been obtained and all notice and waiting periods required by law to pass after receipt of such approvals or consents shall have passed; |
| • | our shares of common stock shall have been authorized for listing on the NASDAQ Capital Market; |
| • | Diversus Management and Positive Insurance shall have both executed and delivered the new management agreement described herein under “Description of Business - Management of Positive Insurance After the Conversions” and the Company shall have made the $10,000,000 payment to Diversus in consideration of Diversus Management entering into the new management agreement; |
| • | the Company and Diversus shall have entered into credit agreements related to the $6,000,000 credit facility described herein under “The Conversions and the Offering - Transactions Related to the Conversions;” |
| • | Diversus, the Company, and Diversus’ lender shall have entered into an intercreditor agreement on terms and conditions that are reasonably acceptable to Diversus, the Company, and Diversus’ Lender; and |
| • | Diversus and the Company shall have both executed and delivered the option agreement described under “The Conversions and the Offering - Transactions Related to the Conversions.” |
| • | a material breach of the agreement by us that has not been cured within fifteen days after written notice by the standby purchaser; |
| • | if, by action by the attorneys-in-fact of the exchanges, the exchanges shall have decided to abandon the plans of conversion; |
| • | if the plans of conversion shall have failed to receive the requisite approval of the Department or the requisite vote for approval and adoption by the subscribers of the exchanges who are eligible to vote on the plans of conversion; |
| • | if any governmental entity, including the Department, shall have issued an order, decree, or ruling or taken any other action permanently restraining, enjoining, or otherwise prohibiting the transactions contemplated by the standby stock purchase agreement and such order, decree, ruling, or other action shall have become final and nonappealable or if the removal or reversal of such order, decree, ruling or other action would result in a “burdensome condition” as defined in the standby stock purchase agreement; or |
| • | the conversion is not completed by March 31, 2019, unless the person seeking to terminate the agreement has failed to perform its obligations under the standby stock purchase agreement and such failure is the primary cause of the failure of the conversion to be completed by March 31, 2019, and provided that either the Company or the standby purchaser may extend such date for up to six months if any approvals necessary to proceed with or complete the conversion or the offerings have not been received by December 1, 2018. |
| • | the present and projected operating results and financial condition of PPIX, PCA, and PIPE and current economic conditions; |
| • | certain historical, financial and other information relating to PPIX, PCA, and PIPE; |
| • | a comparative evaluation of the operating and financial statistics of PPIX, PCA, and PIPE with those of other comparable publicly traded insurance companies located in the United States; |
| • | the size of offerings of common stock by PPIX, PCA and PIPE as determined by Feldman Financial; |
| • | the impact of the conversion offering on the net worth and earnings potential of PPIX, PCA, and PIPE as determined by Feldman Financial; |
| • | the trading market for securities of comparable companies and general conditions in the market for such securities; and |
| • | the values which Feldman Financial estimates to be necessary to attract a full subscription of offerings of common stock by PPIX, PCA, and PIPE. |
| Company | Total Assets ($mil.) | Total Policy Reserves ($mil.) | Total Equity ($mil.) | LTM Total Revenue ($mil.) | Policy Reserves/Equity (%) | Cash & Invest./ Assets (%) | Total Equity/Assets (%) | Tangible Equity/Assets (%) | ||||||||||||||||
| Positive Physicians Insurance Exchange | 67.2 | 38.0 | 17.5 | 13.2 | 2.17 | % | 78.60 | % | 26.09 | % | 26.09 | % | ||||||||||||
| Professional Casualty Association | 39.6 | 18.6 | 13.9 | 8.1 | 1.34 | % | 75.74 | % | 35.02 | % | 35.02 | % | ||||||||||||
| Physicians’ Insurance Program Exchange | 26.6 | 11.8 | 12.3 | 3.7 | 0.96 | % | 93.89 | % | 46.03 | % | 46.03 | % | ||||||||||||
| Comparative Group Median | 254.5 | 145.6 | 90.6 | 96.8 | 1.61 | % | 70.92 | % | 32.52 | % | 32.42 | % | ||||||||||||
| Comparative Group Mean | 486.9 | 282.9 | 133.4 | 175.4 | 1.96 | % | 68.74 | % | 31.71 | % | 31.16 | % | ||||||||||||
| All Public P&C/Multiline Median | 3,840.1 | 1,867.4 | 973.4 | 1,052.7 | 2.12 | % | 71.19 | % | 25.26 | % | 23.57 | % | ||||||||||||
| All Public P&C/Multiline Mean | 42,539.1 | 17,550.5 | 11,144.3 | 9,664.3 | 2.42 | % | 67.35 | % | 28.43 | % | 26.72 | % | ||||||||||||
| Comparative Group | ||||||||||||||||||||||||
| 1347 Property Insurance Holdings | 114.4 | 53.0 | 46.8 | 38.1 | 1.13 | % | 68.83 | % | 40.90 | % | 40.90 | % | ||||||||||||
| Atlantic American Corporation | 343.2 | 173.6 | 113.0 | 181.1 | 1.54 | % | 79.26 | % | 32.92 | % | 32.42 | % | ||||||||||||
| Atlas Financial Holdings,Inc. | 482.5 | 339.7 | 90.6 | 222.0 | 3.75 | % | 50.46 | % | 18.79 | % | 17.61 | % | ||||||||||||
| Baldwin & Lyons, Inc. | 1,357.0 | 733.4 | 418.8 | 371.2 | 1.75 | % | 64.22 | % | 30.86 | % | 30.70 | % | ||||||||||||
| Conifer Holdings, Inc. | 239.0 | 145.6 | 52.8 | 96.8 | 2.76 | % | 70.92 | % | 22.10 | % | 21.78 | % | ||||||||||||
| Federated National Holding Company | 904.9 | 524.9 | 227.5 | 391.7 | 2.31 | % | 58.60 | % | 25.14 | % | 25.14 | % | ||||||||||||
| Hallmark Financial Services, Inc. | 1,231.1 | 803.7 | 251.1 | 385.5 | 3.20 | % | 59.21 | % | 20.40 | % | 16.69 | % | ||||||||||||
| ICC Holdings, Inc. | 152.3 | 77.6 | 64.1 | 48.2 | 1.21 | % | 73.53 | % | 42.08 | % | 42.08 | % | ||||||||||||
| Kingstone Companies, Inc. | 254.5 | 115.9 | 94.6 | 92.8 | 1.23 | % | 73.67 | % | 37.16 | % | 36.90 | % | ||||||||||||
| National Security Group, Inc. | 146.4 | 76.7 | 47.6 | 65.6 | 1.61 | % | 82.88 | % | 32.52 | % | 32.52 | % | ||||||||||||
| Unico American Corporation | 130.3 | 67.8 | 59.9 | 36.8 | 1.13 | % | 74.57 | % | 46.01 | % | 46.01 | % | ||||||||||||
| Company | Total Assets ($mil.) | Total Market Value ($mil.) | Price/ Book Value (%) | Price/ Tang. Book (%) | Price/ LTM EPS (x) | Price/ Oper. EPS (x) | Price/ Total Revenue (x) | Price/ Total Assets (%) | Total Equity/ Assets (%) | Current Div. Yield (%) | ||||||||||
| Positive Physicians Insurance Exchange | ||||||||||||||||||||
| Pro Forma Minimum | 81.2 | 15.3 | 48.6 | 48.6 | 77.7 | 58.00 | 1.13 | 18.85 | 38.80 | 0.00 | ||||||||||
| Pro Forma Midpoint | 83.8 | 18.0 | 52.8 | 52.8 | 75.6 | 59.00 | 1.33 | 21.49 | 40.70 | 0.00 | ||||||||||
| Pro Forma Maximum | 86.4 | 20.7 | 56.4 | 56.4 | 74.2 | 59.80 | 1.52 | 23.96 | 42.50 | 0.00 | ||||||||||
| Professional Casualty Association | ||||||||||||||||||||
| Pro Forma Minimum | 49.4 | 11.1 | 46.6 | 46.6 | 18.7 | 19.2 | 1.34 | 22.36 | 47.99 | 0.00 | ||||||||||
| Pro Forma Midpoint | 51.3 | 13.0 | 50.8 | 50.8 | 21.0 | 21.4 | 1.57 | 25.34 | 49.90 | 0.00 | ||||||||||
| Pro Forma Maximum | 53.2 | 15.0 | 54.4 | 54.4 | 23.0 | 23.5 | 1.79 | 28.11 | 51.67 | 0.00 | ||||||||||
| Physicians’ Insurance Program Exchange | ||||||||||||||||||||
| Pro Forma Minimum | 34.9 | 9.4 | 45.6 | 45.6 | 55.7 | 79.9 | 2.41 | 26.82 | 50.33 | 0.00 | ||||||||||
| Pro Forma Midpoint | 36.5 | 11.0 | 49.8 | 49.8 | 57.0 | 77.5 | 2.81 | 30.17 | 52.36 | 0.00 | ||||||||||
| Pro Forma Maximum | 38.1 | 12.7 | 53.4 | 53.4 | 58.3 | 76.2 | 3.21 | 33.24 | 54.23 | 0.00 | ||||||||||
| Comparative Group Median | 254.5 | 66.3 | 84.5 | 87.0 | 18.7 | 40.5 | 0.61 | 26.47 | 31.16 | 0.00 | ||||||||||
| Comparative Group Mean | 486.9 | 123.5 | 97.8 | 101.3 | 20.5 | 40.5 | 0.84 | 30.21 | 37.01 | 0.99 | ||||||||||
| Public P&C/Multiline Median | 3,840.1 | 1,660.9 | 144.3 | 156.0 | 19.0 | 21.2 | 1.22 | 33.51 | 28.14 | 1.69 | ||||||||||
| Public P&C/Multiline Mean | 42,539.1 | 13,407.2 | 151.4 | 174.0 | 22.0 | 23.9 | 1.51 | 54.35 | 28.43 | 1.71 | ||||||||||
| Comparative Group | ||||||||||||||||||||
| 1347 Property Insurance Holdings | 114.4 | 40.7 | 87.0 | 87.0 | NM | NM | 1.07 | 35.56 | 40.90 | 0.00 | ||||||||||
| Atlantic American Corporation | 343.2 | 66.3 | 61.8 | 63.3 | 16.3 | NM | 0.37 | 19.32 | 32.92 | 0.62 | ||||||||||
| Atlas Financial Holdings,Inc. | 482.5 | 127.7 | 144.1 | 156.0 | NM | NM | 0.58 | 26.47 | 18.79 | 0.00 | ||||||||||
| Baldwin & Lyons, Inc. | 1,357.0 | 348.3 | 83.4 | 84.0 | 19.2 | 62.7 | 0.94 | 25.66 | 30.86 | 4.83 | ||||||||||
| Conifer Holdings, Inc. | 239.0 | 48.1 | 91.1 | 92.9 | NM | NM | 0.50 | 20.14 | 22.10 | 0.00 | ||||||||||
| Federated National Holding Company | 904.9 | 222.4 | 104.0 | 104.0 | 28.2 | NM | 0.57 | 24.57 | 25.14 | 1.89 | ||||||||||
| ICC Holdings, Inc. | 1231.1 | 187.6 | 75.0 | 95.8 | NM | NM | 0.49 | 15.23 | 20.40 | 0.00 | ||||||||||
| Hallmark Financial Services, Inc. | 152.3 | 52.6 | 84.5 | 84.5 | NM | NM | 1.09 | 34.56 | 42.08 | 0.00 | ||||||||||
| Kingstone Companies, Inc. | 254.5 | 183.8 | 193.4 | 195.4 | 18.3 | 18.3 | 1.98 | 72.19 | 37.16 | 2.33 | ||||||||||
| National Security Group, Inc. | 146.4 | 39.9 | 83.7 | 83.7 | NM | NM | 0.61 | 27.21 | 32.52 | 1.27 | ||||||||||
| Unico American Corporation | 130.3 | 40.9 | 68.2 | 68.2 | NM | NM | 1.11 | 31.36 | 46.01 | 0.00 | ||||||||||
| • | not timely received; |
| • | improperly completed or executed; |
| • | not accompanied by payment in full for the shares of common stock subscribed for in the form; or |
| • | submitted by a person who we believe is making false representations or who we believe may be violating, evading or circumventing the terms and conditions of the plan of conversion. |
| Minimum (3,570,000 shares) | Maximum (4,830,000 shares) | ||||||
| Commissions | $ | 1,995,250 | $ | 2,719,750 | |||
| • | No person or entity may purchase fewer than 50 shares of common stock in the offering; |
| • | Holders of Diversus common stock will be permitted to purchase that number of shares that have a purchase price equal to 33% of the purchase price such stockholder paid for such stockholder’s shares of Diversus common stock. Holders of Diversus preferred stock will be permitted to purchase that number of shares that have a purchase price equal to 10% of the purchase price such stockholder paid for such stockholder’s shares of Diversus preferred stock, provided that if such stockholder voluntarily converts all of such stockholder’s shares of preferred stock to Diversus common stock prior to closing of the offerings, such stockholder will be permitted to purchase shares with a purchase price equal to 33% of the purchase price such stockholder paid for such stockholder’s shares of Diversus preferred stock. Enstar is an existing stockholder of Diversus, but because Enstar is purchasing 30% of the shares that ICG has the right to purchase, neither Enstar Holdings (US) LLC nor any of its affiliates will be permitted to purchase shares in the offering in its capacity as a stockholder of Diversus; |
| • | The stockholders of Diversus, Inc. as a group may not purchase more than 5% of the total number of shares remaining to be sold in the offering after giving effect to the shares purchase in the subscription offering and no Diversus stockholder may purchase, together with his or her affiliates, more than 25,000 shares; and |
| • | Except for ICG, Enstar, and the stockholders of Diversus, Inc., no purchaser, together with such purchaser’s affiliates and associates or any group acting in concert, may purchase more than 5,000 shares of common stock in the offering. |
| • | any corporation or organization (other than the Company or Diversus) of which you are an officer or partner or the beneficial owner of 10% or more of any class of equity securities; |
| • | any trust or other estate in which you have a substantial beneficial interest or as to which you serve as trustee or in a similar fiduciary capacity; |
| • | any of your relatives or your spouse, or any relative of your spouse, who lives at home with you; |
| • | any person or entity who you control, who controls you, or who together with you is controlled by the same third party; |
| • | any person or entity who is knowingly participating with you in a joint activity or interdependent conscious parallel action toward a common goal; or |
| • | any person or entity with whom you are combining or pooling voting or other interests in the securities of an issuer for a common purpose pursuant to any agreement or relationship. |
| • | PPIX, PCA, and PIPE upon the conversion of PPIX, PCA, and PIPE from reciprocal insurance exchanges to a stock company pursuant to a merger with and into PPIX Conversion Corp., PCA Conversion Corp. and PIPE Conversion Corp., respectively; |
| • | eligible subscribers that are U.S. Persons that hold their membership interests in PPIX, PCA, and PIPE as of June 1, 2018, respectively, as a capital asset within the meaning of Section 1221 of the Internal Revenue Code of 1986, as amended (which we refer to as the Code), of the receipt, exercise and lapse of subscription rights to purchase shares of the common stock of Positive Physicians Holdings, Inc. (which we refer to as our common stock) in the subscription offering; |
| • | eligible subscribers that are U.S. Persons that purchase shares of our common stock in the subscription offering upon the exercise of subscription rights and hold their shares of our common stock as a capital asset within the meaning of Section 1221 of the Code, of the acquisition, ownership and disposition of shares of our common stock purchased in the subscription offering; and |
| • | other investors that are U.S. Persons that purchase shares of our common stock in the community offering and hold their shares of our common stock as a capital asset within the meaning of Section 1221 of the Code, of the acquisition, ownership and disposition of shares of our common stock purchased in the community offering. |
| • | the conversions of PPIX, PCA, and PIPE from reciprocal insurance exchanges to stock insurance companies pursuant to a merger with and into PPIX Conversion Corp., PCA Conversion Corp., and PIPE Conversion Corp., respectively, will be a reorganization within the meaning of Section 368(a)(1) of the Code; |
| • | PPIX, PCA, and PIPE, in their post-conversion stock form will constitute the same taxable entity as PPIX, PIPE and PCA in their pre-conversion reciprocal insurance exchange form; |
| • | none of PPIX, PCA, nor PIPE in their pre-conversion reciprocal insurance exchange form nor PPIX, PCA, nor PIPE in their post-conversion stock form will recognize gain or loss as a result of the conversion; and |
| • | the tax attributes of PPIX, PCA and PIPE in their pre-conversion reciprocal insurance exchange form will remain unchanged as tax attributes of PPIX Conversion Corp., PCA Conversion Corp., and PIPE Conversion Corp., respectively, in their post-conversion stock form. Thus, PPIX’s, PCA’s, and PIPE’s basis in their assets, holding period for their assets, net operating loss carryovers, if any, capital loss carryovers, if any, earnings and profits and accounting methods will not be changed by reason of the conversion. |
| • | eligible subscribers will be treated as transferring their membership interests in PPIX, PCA, and PIPE to Positive Physicians Holdings, Inc. in exchange for subscription rights to purchase Positive Physicians Holdings, Inc. common stock; |
| • | any gain realized by an eligible member as a result of the receipt of a subscription right with a fair market value must be recognized, whether or not such right is exercised; |
| • | the amount of gain that must be recognized by an eligible subscriber as a result of the receipt of a subscription right will equal the fair market value of such subscription right; |
| • | any gain recognized by an eligible subscriber as a result of the receipt of a subscription right with a fair market value should constitute a capital gain, which will be long term capital gain if the eligible member has held its membership interest for more than one year; and |
| • | if an eligible subscriber is required to recognize gain on the receipt of a subscription right and does not exercise such subscription right, (i) the eligible subscriber should recognize a corresponding loss upon the expiration or lapse of such subscriber’s unexercised subscription right, (ii) the amount of that loss should equal the gain previously recognized upon receipt of the unexercised subscription right, and (iii) if the common stock that an eligible subscriber would have received upon exercise of the lapsed subscription right would have constituted a capital asset in the hands of that eligible subscriber, the resulting loss upon expiration of the subscription right should constitute a capital loss. |
| Age at December 1, 2018 | Director Since (1) | Position with Positive Physicians Holdings, Inc. | |||
| Dr. Lewis S. Sharps, M.D. | 69 | 2018 | President, CEO, and Director | ||
| Scott C. Penwell | 65 | 2018 | Director | ||
| William Hitselberger | 60 | 2018 | Director | ||
| Stephen J. Johnson | 63 | 2018 | Director | ||
| James L. Zech | 61 | 2018 | Director | ||
| (1) | Indicates year first elected as a director of Positive Physicians Holdings, Inc. |
| • | a director who is, or at any time during the past three years was, employed by us; |
| • | a director who accepted, or who has a spouse, parent, child or sibling, whether by blood, marriage or adoption, or any other person who resides in his home, hereinafter referred to as a “Family Member”, who accepted any compensation from us in excess of $120,000 during any period of twelve consecutive months within the three years preceding the determination of independence (other than compensation for board or board committee service; compensation paid to a Family Member who is an employee (other than an executive officer) of the Company or one of its subsidiaries; or benefits under a tax-qualified retirement plan, or non-discretionary compensation); |
| • | a director who is a Family Member of an individual who is, or at any time during the past three years was, employed by us as an executive officer; |
| • | a director who is, or has a Family Member who is, a partner in, or a controlling shareholder or an executive officer of, any organization to which we made, or from which we received, payments for property or services in the current or any of the past three fiscal years that exceed 5% of the recipient’s consolidated gross revenues for that year, or $200,000, whichever is more (excluding payments arising solely from investments in our securities or payments under non-discretionary charitable contribution matching programs). |
| • | a director of the Company who is, or has a Family Member who is, employed as an executive officer of another entity where at any time during the past three (3) years any of our executive officers served on the compensation committee of such other entity; or |
| • | a director who is, or has a Family Member who is, a current partner of our outside auditor, or was a partner or employee of the company’s outside auditor who worked on our audit at any time during any of the past three (3) years. |
| • | the creation, incurrence, or guarantee of indebtedness in excess of $1,000,000, other than (i) borrowings under credit facilities previously approved by ICG and Enstar, and (ii) indebtedness contemplated by the standby stock purchase agreement among the Company, the exchanges, and ICG; |
| • | authorization or issuance of shares of capital stock of the Company or any of its subsidiaries or securities convertible into, or exercisable or exchangeable for, such shares of capital stock; |
| • | the distribution of cash or other property to shareholders of the Company on other than a pro rata basis; |
| • | the repurchase by the Company of any shares of its capital stock if either ICG or Enstar is not provided with the opportunity to participate in such repurchase on a pro rata basis; |
| • | any acquisition of any business in which the aggregate consideration paid would exceed $1,000,000; |
| • | any disposal, whether in a single or a series of related transactions, by merger, consolidation, sale or otherwise, of (i) any asset of the Company or any of its subsidiaries with a fair market value greater than $1,000,000, or (ii) all or substantially all of the capital stock of any subsidiary of the Company, excluding sales of investments in connection with the management of the investment portfolios of the Company or any of its subsidiaries; |
| • | an election to dissolve or liquidate the Company or any of its subsidiaries, or to file bankruptcy or similar proceedings; |
| • | making or changing any material election in respect of taxes, adopting or changing in any material respect any accounting method in respect of taxes, settling or compromising any material claim or assessment in respect of taxes, or filing any amended tax return that is reasonably likely to result in a material increase in liability in respect of taxes; |
| • | initiating, conducting, or settling any legal or regulatory proceeding or threatened legal or regulatory proceeding, excluding claims under insurance policies in the ordinary course of business, for an amount in excess of $1,000,000; |
| • | creating any new subsidiary of the Company that is not wholly-owned by the Company; |
| • | amending, altering, waiving or repealing any provision of the articles of incorporation, bylaws, or other organizational documents of the Company or any of its subsidiaries in a manner that would negatively impact the economic, voting or other rights of either ICG or Enstar in a material manner; and |
| • | entering into or becoming a party to any transaction with an employee, officer, or director of the Company or any subsidiary or any other party related to any such person except for transactions arising in the ordinary course of business or such transactions that are conducted on an arms-length basis. |
| • | review, evaluate and approve the compensation and benefit plans and policies of Company employees, including its officers; |
| • | review, evaluate and approve the compensation and benefit plans and policies for our officers and directors; |
| • | grant stock options and restricted stock and restricted stock unit awards to employees, management and directors under our proposed stock-based incentive plan; |
| • | be responsible for producing an annual report on executive compensation for inclusion in our proxy statement and for ensuring compliance of compensation and benefit programs with all other legal, tax and regulatory requirements; and |
| • | make recommendations to our board of directors regarding these matters. |
| • | be responsible for the selection, retention, oversight and termination of our independent registered public accounting firm; |
| • | approve the non-audit services provided by the independent registered public accounting firm; |
| • | review the results and scope of the audit and other services provided by our independent registered public accounting firm; |
| • | approve the estimated cost of the annual audit; |
| • | establish procedures to facilitate the receipt, retention and treatment of complaints received from third parties regarding accounting, internal accounting controls, or auditing matters; |
| • | establish procedures to facilitate the receipt, retention, and treatment of confidential, anonymous submissions of concerns regarding questionable accounting or auditing matters by Company employees; |
| • | review and approve all related party transactions and transactions raising potential conflicts of interest; |
| • | review the annual financial statements and the results of the audit with management and the independent registered public accounting firm; |
| • | review with management and the independent registered public accounting firm the adequacy of our system of internal control over financial reporting, including their effectiveness at achieving compliance with any applicable laws or regulations; |
| • | review with management and the independent registered public accounting firm the significant recommendations made by the independent registered public accounting firm with respect to changes in accounting procedures and internal control over financial reporting; and |
| • | report to the board of directors on the results of its review and make such recommendations as it may deem appropriate. |
| • | make independent recommendations to the board of directors as to best practices for board governance and evaluation of board performance; |
| • | produce a Code of Ethics and submit it for board approval, and periodically review the Code of Ethics for necessary revisions; |
| • | identify suitable candidates for board membership, and in such capacity will consider any nominees recommended by shareholders; |
| • | propose to the board a slate of directors for election by the shareholders at each annual meeting; and |
| • | propose candidates to fill vacancies on the board based on qualifications it determines to be appropriate. |
| • | whether the transaction is fair and reasonable to us; |
| • | the business reasons for the transaction; |
| • | whether the transaction would impair the independence of a director; |
| • | whether the transaction presents a conflict of interest, taking into account the size of the transaction, the financial position of the director, officer or employee, the nature of their interest in the transaction and the ongoing nature of the transaction; and |
| • | whether the transaction is material, taking into account the significance of the transaction in light of all the circumstances. |


| 2017 | 2016 | ||||||
| ASSETS | |||||||
| Investments in available-for-sale securities: | |||||||
| Bonds (Amortized cost of $43,696,584 and $39,368,291) | $ | 43,786,294 | $ | 39,155,303 | |||
| Common stocks (Cost of $2,737,328 and $2,505,194) | 2,806,613 | 2,491,165 | |||||
| Other invested assets | 4,115,892 | 2,134,822 | |||||
| Total investments | 50,708,799 | 43,781,290 | |||||
| Cash and cash equivalents | 2,110,000 | 5,045,589 | |||||
| Accrued investment income | 302,788 | 277,588 | |||||
| Premiums receivable | 4,835,002 | 3,731,615 | |||||
| Reinsurance recoverable | 6,117,389 | 8,670,162 | |||||
| Income taxes recoverable | 574,326 | 133,099 | |||||
| Deferred acquisition costs | 2,504,001 | 1,713,784 | |||||
| Deferred income taxes | — | 559,874 | |||||
| EDP equipment and software | 50,000 | 150,000 | |||||
| Due from affiliate | 350 | — | |||||
| TOTAL ASSETS | $ | 67,202,655 | $ | 64,063,001 | |||
| LIABILITIES AND SUBSCRIBERS’ SURPLUS | |||||||
| LIABILITIES: | |||||||
| Losses and loss adjustment expenses | $ | 38,028,709 | $ | 34,814,118 | |||
| Unearned premiums | 8,211,480 | 7,435,311 | |||||
| Reinsurance payable | 1,408,418 | 3,256,107 | |||||
| Accounts payable, accrued expenses, and other liabilities | 1,341,324 | 885,090 | |||||
| Deferred income taxes | 41,531 | — | |||||
| Note payable | 187,222 | 244,767 | |||||
| Surplus note payable to affiliate | — | 537,000 | |||||
| Due to affiliate | 452,035 | 10,463 | |||||
| TOTAL LIABILITIES | 49,670,719 | 47,182,856 | |||||
| SUBSCRIBERS’ SURPLUS: | |||||||
| Paid-in and contributed surplus | 5,482,997 | 5,482,997 | |||||
| Unassigned surplus | 11,160,278 | 11,358,997 | |||||
| Accumulated other comprehensive income | 888,661 | 38,151 | |||||
| TOTAL SUBSCRIBERS’ SURPLUS | 17,531,936 | 16,880,145 | |||||
| TOTAL LIABILITIES AND SUBSCRIBERS’ SURPLUS | $ | 67,202,655 | $ | 64,063,001 | |||
| 2017 | 2016 | ||||||
| REVENUES: | |||||||
| Net premium earned | $ | 12,274,965 | $ | 8,590,608 | |||
| TOTAL REVENUES | 12,274,965 | 8,590,608 | |||||
| EXPENSES: | |||||||
| Losses and loss adjustment expenses | 7,732,526 | 3,919,503 | |||||
| Other underwriting expenses | 5,786,751 | 4,391,058 | |||||
| TOTAL EXPENSES | 13,519,277 | 8,310,561 | |||||
| NET INVESTMENT INCOME | 971,833 | 1,183,210 | |||||
| (LOSS) INCOME FROM OPERATIONS | (272,479 | ) | 1,463,257 | ||||
| INTEREST EXPENSE | 8,653 | 52,543 | |||||
| (LOSS) INCOME BEFORE PROVISION FOR INCOME TAXES | (281,132 | ) | 1,410,714 | ||||
| PROVISION FOR INCOME TAXES | (260,491 | ) | 585,557 | ||||
| NET (LOSS) INCOME | (20,641 | ) | 825,157 | ||||
| OTHER COMPREHENSIVE INCOME (LOSS): | |||||||
| Unrealized holding gains (losses) on available-for-sale securities, net of income tax (expense) benefit of $(362,876) and $32,387 | 606,144 | (5,161 | ) | ||||
| Reclassification adjustments for net realized loss (gain) included in net (loss) income | 66,288 | (57,709 | ) | ||||
| TOTAL OTHER COMPREHENSIVE INCOME (LOSS) | 672,432 | (62,870 | ) | ||||
| COMPREHENSIVE INCOME | $ | 651,791 | $ | 762,287 | |||
| Paid-in and Contributed Surplus | Unassigned Surplus | Accumulated Other Comprehensive Income | Total Subscribers’ Surplus | ||||||||||||
| Balance, January 1, 2016 | $ | 5,482,997 | $ | 10,533,840 | $ | 101,021 | $ | 16,117,858 | |||||||
| Net income | — | 825,157 | — | 825,157 | |||||||||||
| Other comprehensive loss | — | — | (62,870 | ) | (62,870 | ) | |||||||||
| Balance, December 31, 2016 | 5,482,997 | 11,358,997 | 38,151 | 16,880,145 | |||||||||||
| Net loss | — | (20,641 | ) | — | (20,641 | ) | |||||||||
| Other comprehensive income | — | — | 672,432 | 672,432 | |||||||||||
| Reclassification of tax effects from accumulated other comprehensive income related to passage of Tax Cuts and Jobs Act | — | (178,078 | ) | 178,078 | — | ||||||||||
| Balance, December 31, 2017 | $ | 5,482,997 | $ | 11,160,278 | $ | 888,661 | $ | 17,531,936 | |||||||
| 2017 | 2016 | ||||||
| CASH FLOWS FROM OPERATING ACTIVITIES: | |||||||
| Net (loss) income | $ | (20,641 | ) | $ | 825,157 | ||
| Adjustments to reconcile net (loss) income to net cash provided by operating activities: | |||||||
| Deferred income taxes | 206,755 | 108,516 | |||||
| Net realized losses (gains) on sales of investments | 66,288 | (57,709 | ) | ||||
| Amortization of bond premiums | 154,948 | 176,613 | |||||
| Depreciation expense | 100,000 | 100,000 | |||||
| Changes in operating assets and liabilities: | |||||||
| Accrued investment income | (25,200 | ) | (16,765 | ) | |||
| Premiums receivable | (1,103,387 | ) | (278,544 | ) | |||
| Reinsurance recoverable | 2,552,773 | (2,551,720 | ) | ||||
| Reinsurance premiums receivable | — | 207,713 | |||||
| Income taxes recoverable | (441,227 | ) | (133,099 | ) | |||
| Deferred acquisition costs | (790,217 | ) | (153,299 | ) | |||
| Other assets | — | 11,129 | |||||
| Due from affiliate | (350 | ) | — | ||||
| Liability for losses and loss adjustment expenses | 3,214,591 | (1,255,186 | ) | ||||
| Unearned premiums | 776,169 | 880,813 | |||||
| Reinsurance payable | (1,847,689 | ) | 3,256,107 | ||||
| Income taxes payable | — | (162,333 | ) | ||||
| Accounts payable, accrued expenses, and other liabilities | 456,234 | 470,081 | |||||
| Due to affiliate | 441,572 | (206,457 | ) | ||||
| NET CASH PROVIDED BY OPERATING ACTIVITIES | 3,740,619 | 1,221,017 | |||||
| CASH FLOWS FROM INVESTING ACTIVITIES: | |||||||
| Investments: | |||||||
| Proceeds from sales and maturities | 2,742,245 | 15,542,979 | |||||
| Purchases | (8,823,908 | ) | (17,086,824 | ) | |||
| NET CASH USED IN INVESTING ACTIVITIES | (6,081,663 | ) | (1,543,845 | ) | |||
| CASH FLOWS FROM FINANCING ACTIVITIES: | |||||||
| Repayment of note payable | (57,545 | ) | (55,233 | ) | |||
| Repayment of surplus note payable to affiliate | (537,000 | ) | — | ||||
| NET CASH USED IN FINANCING ACTIVITIES | (594,545 | ) | (55,233 | ) | |||
| NET CHANGE IN CASH AND CASH EQUIVALENTS | $ | (2,935,589 | ) | $ | (378,061 | ) | |
| CASH AND CASH EQUIVALENTS, beginning of year | 5,045,589 | 5,423,650 | |||||
| CASH AND CASH EQUIVALENTS, end of year | $ | 2,110,000 | $ | 5,045,589 | |||
| SUPPLEMENTAL DISCLOSURE OF CASH FLOW INFORMATION: | |||||||
| Interest paid for the year | $ | 19,115 | $ | 52,543 | |||
| Income taxes paid for the year | $ | — | $ | 792,000 | |||
| 1. | Organization and Operations: |
| 2. | Summary of Significant Accounting Policies and Principles: |
| 3. | Concentrations of Credit Risk: |
| 4. | Variable Interest Entity: |
| 5. | Investments: |
| • | Quoted prices for similar assets in active markets; |
| • | Quoted prices for identical or similar assets in nonactive markets (few transactions, limited information, noncurrent prices, high variability over time, etc.); |
| • | Inputs other than quoted prices that are observable for the asset (interest rates, yield curves, volatilities, default rates, etc.); and |
| • | Inputs that are derived principally from or corroborated by other observable market data. |
| Amortized Cost/Cost | Gross Unrealized Gains | Gross Unrealized Losses | Fair Value | ||||||||||||
| December 31, 2017 | |||||||||||||||
| U.S. government | $ | 7,765,977 | $ | 138 | $ | 101,417 | $ | 7,664,698 | |||||||
| States, territories, and possessions | 1,202,008 | 10,979 | — | 1,212,987 | |||||||||||
| Subdivisions of states, territories, and possessions | 9,737,894 | 156,666 | 13,486 | 9,881,074 | |||||||||||
| Industrial and miscellaneous | 24,990,705 | 171,809 | 134,979 | 25,027,535 | |||||||||||
| Total bonds | 43,696,584 | 339,592 | 249,882 | 43,786,294 | |||||||||||
| Common stocks | 2,737,328 | 348,136 | 278,851 | 2,806,613 | |||||||||||
| $ | 46,433,912 | $ | 687,728 | $ | 528,733 | $ | 46,592,907 | ||||||||
| Amortized Cost/Cost | Gross Unrealized Gains | Gross Unrealized Losses | Fair Value | ||||||||||||
| December 31, 2016 | |||||||||||||||
| U.S. government | $ | 8,785,743 | $ | 998 | $ | 113,466 | $ | 8,673,275 | |||||||
| States, territories, and possessions | 1,224,034 | 4,254 | 5,934 | 1,222,354 | |||||||||||
| Subdivisions of states, territories, and possessions | 9,998,373 | 73,743 | 56,240 | 10,015,876 | |||||||||||
| Industrial and miscellaneous | 19,360,141 | 94,481 | 210,824 | 19,243,798 | |||||||||||
| Total bonds | 39,368,291 | 173,476 | 386,464 | 39,155,303 | |||||||||||
| Common stocks | 2,505,194 | 188,619 | 202,648 | 2,491,165 | |||||||||||
| $ | 41,873,485 | $ | 362,095 | $ | 589,112 | $ | 41,646,468 | ||||||||
| Amortized Cost/Cost | Fair Value | ||||||
| Due in less than one year | $ | 4,878,222 | $ | 4,868,400 | |||
| Due after one year to five years | 20,829,218 | 20,794,915 | |||||
| Due after five years to ten years | 17,989,144 | 18,122,979 | |||||
| $ | 43,696,584 | $ | 43,786,294 | ||||
| 2017 | 2016 | ||||||
| Proceeds | $ | 2,742,245 | $ | 15,542,979 | |||
| Gross gains | 54,887 | 135,826 | |||||
| Gross losses | 121,175 | 78,117 | |||||
| 2017 | 2016 | ||||||
| Bonds | $ | 951,246 | $ | 875,994 | |||
| Cash and short-term investments | 3,907 | 3,136 | |||||
| Common stocks | 142,033 | 131,660 | |||||
| Limited partnerships | — | 200,000 | |||||
| Net (loss) gain on sales of investments, net of tax of $0 and $19,621 | (66,288 | ) | 38,088 | ||||
| 1,030,898 | 1,248,878 | ||||||
| Less investment expenses | 59,065 | 65,668 | |||||
| Net investment income | $ | 971,833 | $ | 1,183,210 | |||
| Less than 12 Months | |||||||
| Fair Value | Unrealized Losses | ||||||
| U.S. government | $ | 3,875,717 | $ | 82,023 | |||
| Subdivisions of states, territories, and possessions | 452,316 | 3,780 | |||||
| Industrial and miscellaneous | 9,474,229 | 128,102 | |||||
| Common stocks | 795,147 | 47,812 | |||||
| $ | 14,597,409 | $ | 261,717 | ||||
| Greater than 12 Months | |||||||
| Fair Value | Unrealized Losses | ||||||
| U.S. government | $ | 3,779,791 | $ | 19,394 | |||
| Subdivisions of states, territories, and possessions | 888,309 | 9,706 | |||||
| Industrial and miscellaneous | 1,698,530 | 6,877 | |||||
| Common stocks | 230,876 | 231,039 | |||||
| $ | 6,597,506 | $ | 267,016 | ||||
| Totals | |||||||
| Fair Value | Unrealized Losses | ||||||
| U.S. government | $ | 7,655,508 | $ | 101,417 | |||
| Subdivisions of states, territories, and possessions | 1,340,625 | 13,486 | |||||
| Industrial and miscellaneous | 11,172,759 | 134,979 | |||||
| Common stocks | 1,026,023 | 278,851 | |||||
| $ | 21,194,915 | $ | 528,733 | ||||
| Less than 12 Months | |||||||
| Fair Value | Unrealized Losses | ||||||
| U.S. government | $ | 4,005,510 | $ | 96,442 | |||
| States, territories, and possessions | 650,944 | 5,934 | |||||
| Subdivisions of states, territories, and possessions | 3,489,633 | 44,080 | |||||
| Industrial and miscellaneous | 6,612,642 | 192,912 | |||||
| Common stocks | 399,877 | 9,498 | |||||
| $ | 15,158,606 | $ | 348,866 | ||||
| Greater than 12 Months | |||||||
| Fair Value | Unrealized Losses | ||||||
| U.S. government | $ | 3,781,371 | $ | 17,024 | |||
| States, territories, and possessions | — | — | |||||
| Subdivision of states, territories, and possessions | 401,394 | 12,160 | |||||
| Industrial and miscellaneous | 3,768,084 | 17,912 | |||||
| Common stocks | 445,488 | 193,150 | |||||
| $ | 8,396,337 | $ | 240,246 | ||||
| Totals | |||||||
| Fair Value | Unrealized Losses | ||||||
| U.S. government | $ | 7,786,881 | $ | 113,466 | |||
| States, territories, and possessions | 650,944 | 5,934 | |||||
| Subdivision of states, territories, and possessions | 3,891,027 | 56,240 | |||||
| Industrial and miscellaneous | 10,380,726 | 210,824 | |||||
| Common stocks | 845,365 | 202,648 | |||||
| $ | 23,554,943 | $ | 589,112 | ||||
| Total | Level 1 | Level 2 | Level 3 | ||||||||||||
| U.S. government | $ | 7,664,698 | $ | — | $ | 7,664,698 | $ | — | |||||||
| States, territories, and possessions | 1,212,987 | — | 1,212,987 | — | |||||||||||
| Subdivisions of states, territories and possessions | 9,881,074 | — | 9,881,074 | — | |||||||||||
| Industrial and miscellaneous | 25,027,535 | — | 25,027,535 | — | |||||||||||
| Total bonds | 43,786,294 | — | 43,786,294 | — | |||||||||||
| Common stocks | 2,806,613 | 2,806,613 | — | — | |||||||||||
| $ | 46,592,907 | $ | 2,806,613 | $ | 43,786,294 | $ | — | ||||||||
| Total | Level 1 | Level 2 | Level 3 | ||||||||||||
| U.S. government | $ | 8,673,275 | $ | — | $ | 8,673,275 | $ | — | |||||||
| States, territories, and possessions | 1,222,354 | — | 1,222,354 | — | |||||||||||
| Subdivisions of states, territories and possessions | 10,015,876 | — | 10,015,876 | — | |||||||||||
| Industrial and miscellaneous | 19,243,798 | — | 19,243,798 | — | |||||||||||
| Total bonds | 39,155,303 | — | 39,155,303 | — | |||||||||||
| Common stocks | 2,491,165 | 2,491,165 | — | — | |||||||||||
| $ | 41,646,468 | $ | 2,491,165 | $ | 39,155,303 | $ | — | ||||||||
| 6. | Deferred Acquisition Costs: |
| 2017 | 2016 | ||||||
| Balance, beginning of year | $ | 1,713,784 | $ | 1,560,485 | |||
| Amount capitalized during the year | 5,058,137 | 3,533,008 | |||||
| Amount amortized during the year | 4,267,920 | 3,379,709 | |||||
| Balance, end of year | $ | 2,504,001 | $ | 1,713,784 | |||
| 7. | Reinsurance: |
| 2017 | 2016 | ||||||
| Premiums written: | |||||||
| Direct | $ | 15,327,496 | $ | 13,798,821 | |||
| Ceded | 2,276,362 | 4,327,200 | |||||
| Premiums written, net of reinsurance | $ | 13,051,134 | $ | 9,471,621 | |||
| Premiums earned: | |||||||
| Direct | $ | 14,551,327 | $ | 12,917,808 | |||
| Ceded | 2,276,362 | 4,327,200 | |||||
| Premiums earned, net of reinsurance | $ | 12,274,965 | $ | 8,590,608 | |||
| Losses and loss adjustment expenses incurred: | |||||||
| Direct | $ | 9,567,678 | $ | 6,471,541 | |||
| Ceded | 1,835,152 | 2,552,038 | |||||
| Losses and loss adjustment expenses incurred, net of reinsurance | $ | 7,732,526 | $ | 3,919,503 | |||
| 8. | Equipment: |
| 2017 | 2016 | ||||||
| EDP equipment and software | $ | 300,000 | $ | 300,000 | |||
| Less accumulated depreciation and amortization | 250,000 | 150,000 | |||||
| $ | 50,000 | $ | 150,000 | ||||
| 9. | Losses and Loss Adjustment Expenses: |
| 2017 | 2016 | ||||||
| Losses and loss adjustment expenses, beginning of year | $ | 34,814,118 | $ | 36,069,304 | |||
| Less: Reinsurance recoverable, beginning of year | 8,670,162 | 6,118,442 | |||||
| Add: Reinsurance recoverable, claims paid, beginning of year | (3,614,905 | ) | (319 | ) | |||
| Losses and loss adjustment expenses, beginning of year | 29,758,861 | 29,951,181 | |||||
| Incurred related to: | |||||||
| Current year | 10,377,591 | 8,346,007 | |||||
| Prior years | (2,645,065 | ) | (4,426,504 | ) | |||
| Total incurred | 7,732,526 | 3,919,503 | |||||
| Paid related to: | |||||||
| Current year | 564,039 | 377,891 | |||||
| Prior years | 4,663,743 | 3,733,932 | |||||
| Total paid | 5,227,782 | 4,111,823 | |||||
| Losses and loss adjustment expenses, end of year - net | 32,263,605 | 29,758,861 | |||||
| Add: Reinsurance recoverable, end of year | 6,117,389 | 8,670,162 | |||||
| Less: Recoverable on claims paid | (352,285 | ) | (3,614,905 | ) | |||
| Losses and loss adjustment expenses, end of year - gross | $ | 38,028,709 | $ | 34,814,118 | |||
| Incurred Losses and Loss Adjustment Expenses, Net of Reinsurance (in thousands) | As of December 31, 2017 | ||||||||||||||||||||||||||||||||||
| Accident Year | 2008 | 2009 | 2010 | 2011 | 2012 | 2013 | 2014 | 2015 | 2016 | 2017 | Total of Incurred-But-Not-Reported Liabilities Plus Expected Development on Reported Claims | Cumulative Number of Reported Claims | |||||||||||||||||||||||
| 2008 | $ | 4,216 | $ | 4,758 | $ | 4,708 | $ | 5,085 | $ | 4,666 | $ | 4,011 | $ | 3,774 | $ | 3,473 | $ | 2,798 | $ | 2,276 | $ | 60 | 49 | ||||||||||||
| 2009 | 3,899 | 3,792 | 3,939 | 3,607 | 3,426 | 2,856 | 2,718 | 2,548 | 2,503 | 518 | 57 | ||||||||||||||||||||||||
| 2010 | 4,875 | 4,191 | 4,961 | 4,521 | 4,158 | 3,671 | 3,265 | 2,937 | 830 | 48 | |||||||||||||||||||||||||
| 2011 | 5,329 | 5,473 | 5,456 | 5,221 | 4,948 | 4,276 | 4,447 | 380 | 55 | ||||||||||||||||||||||||||
| 2012 | 6,258 | 5,956 | 5,946 | 5,643 | 5,405 | 6,410 | 242 | 71 | |||||||||||||||||||||||||||
| 2013 | 6,547 | 6,722 | 6,199 | 5,625 | 5,224 | 912 | 57 | ||||||||||||||||||||||||||||
| 2014 | 6,353 | 6,034 | 5,562 | 4,278 | 1,385 | 42 | |||||||||||||||||||||||||||||
| 2015 | 8,173 | 7,575 | 6,992 | 4,219 | 32 | ||||||||||||||||||||||||||||||
| 2016 | 8,136 | 7,502 | 4,175 | 68 | |||||||||||||||||||||||||||||||
| 2017 | 10,184 | 7,744 | 53 | ||||||||||||||||||||||||||||||||
| $ | 52,753 | ||||||||||||||||||||||||||||||||||
| Cumulative Paid Losses and Loss Adjustment Expenses, Net of Reinsurance (in thousands) | |||||||||||||||||||||||||||||||||||
| Accident Year | 2008 | 2009 | 2010 | 2011 | 2012 | 2013 | 2014 | 2015 | 2016 | 2017 | |||||||||||||||||||||||||
| 2008 | $ | 32 | $ | 363 | $ | 685 | $ | 999 | $ | 1,659 | $ | 1,866 | $ | 1,940 | $ | 1,959 | $ | 1,969 | $ | 1,985 | |||||||||||||||
| 2009 | 58 | 312 | 530 | 829 | 1,291 | 1,577 | 1,656 | 1,573 | 1,602 | ||||||||||||||||||||||||||
| 2010 | 30 | 255 | 466 | 871 | 1,410 | 1,531 | 1,736 | 1,911 | |||||||||||||||||||||||||||
| 2011 | 69 | 366 | 903 | 1,959 | 3,400 | 2,988 | 3,273 | ||||||||||||||||||||||||||||
| 2012 | 83 | 464 | 901 | 1,870 | 3,775 | 5,193 | |||||||||||||||||||||||||||||
| 2013 | 50 | 236 | 950 | 2,306 | 2,617 | ||||||||||||||||||||||||||||||
| 2014 | 42 | 292 | 766 | 1,792 | |||||||||||||||||||||||||||||||
| 2015 | 79 | 381 | 1,162 | ||||||||||||||||||||||||||||||||
| 2016 | 193 | 807 | |||||||||||||||||||||||||||||||||
| 2017 | 400 | ||||||||||||||||||||||||||||||||||
| $ | 20,742 | ||||||||||||||||||||||||||||||||||
| All outstanding liabilities before 2008, net of reinsurance | 253 | ||||||||||||||||||||||||||||||||||
| Liabilities for losses and loss adjustment expenses, net of reinsurance | $ | 32,264 | |||||||||||||||||||||||||||||||||
| 2017 | |||
| Net outstanding liabilities for losses and loss adjustment expenses: | |||
| Medical professional | $ | 32,263,605 | |
| Liabilities for losses and loss adjustment expenses, net of reinsurance | 32,263,605 | ||
| Reinsurance recoverable on unpaid claims: | |||
| Medical professional | 5,765,104 | ||
| Total reinsurance recoverable on unpaid claims | 5,765,104 | ||
| Total gross liability for losses and loss adjustment expenses | $ | 38,028,709 | |
| Average Annual Percentage Payout of Incurred Losses by Age, Net of Reinsurance | ||||||||||||||||||||||||||||||
| (unaudited) | ||||||||||||||||||||||||||||||
| Accident Year | Year 1 | Year 2 | Year 3 | Year 4 | Year 5 | Year 6 | Year 7 | Year 8 | Year 9 | Year 10 | ||||||||||||||||||||
| Medical professional | 1.7 | % | 7.4 | % | 10.6 | % | 18.3 | % | 22.3 | % | 7.5 | % | 4.9 | % | 1.2 | % | 0.8 | % | 0.7 | % | ||||||||||
| 10. | Note Payable: |
| Year ending December 31, | |||
| 2018 | $ | 59,909 | |
| 2019 | 62,385 | ||
| 2020 | 64,928 | ||
| $ | 187,222 | ||
| 11. | Income Taxes: |
| 2017 | 2016 | ||||||
| Current provision | $ | (467,246 | ) | $ | 477,041 | ||
| Deferred tax provision | 206,755 | 108,516 | |||||
| $ | (260,491 | ) | $ | 585,557 | |||
| 2017 | 2016 | ||||||
| Expected tax provision at federal statutory rate | $ | (95,585 | ) | $ | 479,643 | ||
| Tax exempt income, net of proration | (72,521 | ) | (73,087 | ) | |||
| Dividends received deduction | (7,204 | ) | (8,406 | ) | |||
| Correction of prior year’s amounts | (59,472 | ) | 187,407 | ||||
| Change in enacted tax rates | (25,709 | ) | — | ||||
| Net income tax provision | $ | (260,491 | ) | $ | 585,557 | ||
| 2017 | 2016 | ||||||
| Deferred tax assets: | |||||||
| Discount of unearned premiums | $ | 344,882 | $ | 505,601 | |||
| Discount of advance premiums | 20,054 | 35,738 | |||||
| Discount of losses and loss adjustment expenses | 512,300 | 666,449 | |||||
| Total deferred tax assets | 877,236 | 1,207,788 | |||||
| Deferred tax liabilities: | |||||||
| Deferred acquisition costs | 525,840 | 582,687 | |||||
| Tax Act transitional adjustment | 105,261 | — | |||||
| Unrealized gain on investments | 287,666 | 65,227 | |||||
| Total deferred tax liabilities | 918,767 | 647,914 | |||||
| Net deferred tax (liability) asset | $ | (41,531 | ) | $ | 559,874 | ||
| 12. | Related Party Transactions: |
| 13. | Management Agreement: |
| 14. | Assessments: |
| 15. | Statutory Information: |
| 2017 | 2016 | ||||||
| Statutory net (loss) income | $ | (439,756 | ) | $ | 911,171 | ||
| Statutory surplus and other funds | 16,882,485 | 17,487,422 | |||||
| 2017 | 2016 | ||||||
| Statutory surplus and other funds prescribed by the Department | $ | 16,882,485 | $ | 17,487,422 | |||
| State prescribed practices: | |||||||
| Unearned management fees | (1,399,576 | ) | (1,060,802 | ) | |||
| Statutory surplus and other funds per NAIC statutory accounting practices | $ | 15,482,909 | $ | 16,426,620 | |||
| 16. | Subsequent Events |
| Unaudited | Unaudited | ||||||
| 2018 | 2017 | ||||||
| ASSETS | |||||||
| Investments in available-for-sale securities: | |||||||
| Bonds (Amortized cost of $42,657,383 and $42,062,293) | $ | 41,775,450 | $ | 42,436,720 | |||
| Common stocks (Cost of $2,841,327 and $2,901,117) | 2,859,693 | 2,780,346 | |||||
| Other invested assets | 4,295,798 | 3,550,642 | |||||
| Total investments | 48,930,941 | 48,767,708 | |||||
| Cash and cash equivalents | 1,207,492 | 1,823,424 | |||||
| Accrued investment income | 341,674 | 310,788 | |||||
| Premiums receivable | 3,840,306 | 3,779,490 | |||||
| Reinsurance recoverable | 6,073,316 | 5,795,336 | |||||
| Reinsurance premiums receivable | 514,531 | 248,447 | |||||
| Income taxes recoverable | 553,949 | 420,479 | |||||
| Deferred acquisition costs | 2,190,831 | 2,095,102 | |||||
| Deferred income taxes | 148,342 | 77,674 | |||||
| Other assets | — | 115,000 | |||||
| TOTAL ASSETS | $ | 63,801,382 | $ | 63,433,448 | |||
| LIABILITIES AND MEMBERS' EQUITY | |||||||
| LIABILITIES: | |||||||
| Losses and loss adjustment expenses | $ | 37,417,339 | $ | 36,984,858 | |||
| Unearned premiums | 7,373,044 | 7,055,474 | |||||
| Reinsurance payable | 1,088,624 | 842,389 | |||||
| Accounts payable, accrued expenses, and other liabilities | 625,709 | 541,777 | |||||
| Note payable | 142,502 | 201,837 | |||||
| Due to affiliates | 94,297 | 194,940 | |||||
| TOTAL LIABILITIES | 46,741,515 | 45,821,275 | |||||
| MEMBERS' EQUITY | $ | 17,059,867 | $ | 17,612,173 | |||
| TOTAL LIABILITIES AND MEMBERS' EQUITY | $ | 63,801,382 | $ | 63,433,448 | |||
| Unaudited | Unaudited | ||||||
| 2018 | 2017 | ||||||
| REVENUES: | |||||||
| Net premium earned | $ | 9,644,090 | $ | 9,693,624 | |||
| TOTAL REVENUES | 9,644,090 | 9,693,624 | |||||
| EXPENSES: | |||||||
| Losses and loss adjustment expenses, net | 5,435,270 | 6,540,054 | |||||
| Other underwriting expenses | 4,905,722 | 4,047,230 | |||||
| TOTAL EXPENSES | 10,340,992 | 10,587,284 | |||||
| NET INVESTMENT INCOME | 902,904 | 804,692 | |||||
| INCOME (LOSS) FROM OPERATIONS | 206,002 | (88,968 | ) | ||||
| INTEREST EXPENSE | 4,911 | 6,696 | |||||
| INCOME (LOSS) BEFORE PROVISION FOR INCOME TAXES | 201,091 | (95,664 | ) | ||||
| PROVISION FOR INCOME TAXES | 7,461 | (170,006 | ) | ||||
| NET INCOME | 193,630 | 74,342 | |||||
| OTHER COMPREHENSIVE (LOSS) INCOME: | |||||||
| Unrealized holding (losses) gains on available-for-sale securities, net of income tax benefit (expense) of $176,957 and $(338,807) | (635,784 | ) | 693,122 | ||||
| Reclassification adjustments for net realized gain included in net income | (29,915 | ) | (35,436 | ) | |||
| TOTAL OTHER COMPREHENSIVE (LOSS) INCOME | (665,699 | ) | 657,686 | ||||
| COMPREHENSIVE (LOSS) INCOME | $ | (472,069 | ) | $ | 732,028 | ||
| Contributed Capital | Retained Earnings | Accumulated Other Comprehensive Income | Total Members' Equity | ||||||||||||
| Balance, January 1, 2017 | $ | 5,482,997 | $ | 11,358,997 | $ | 38,151 | $ | 16,880,145 | |||||||
| Net income | — | 74,342 | — | 74,342 | |||||||||||
| Other comprehensive income | — | — | 657,686 | 657,686 | |||||||||||
| Balance, September 30, 2017 (unaudited) | $ | 5,482,997 | $ | 11,433,339 | $ | 695,837 | $ | 17,612,173 | |||||||
| Balance, January 1, 2018 | $ | 5,482,997 | $ | 11,160,278 | $ | 888,661 | $ | 17,531,936 | |||||||
| Net income | — | 193,630 | — | 193,630 | |||||||||||
| Other comprehensive loss | — | — | (665,699 | ) | (665,699 | ) | |||||||||
| Balance, September 30, 2018 (unaudited) | $ | 5,482,997 | $ | 11,353,908 | $ | 222,962 | $ | 17,059,867 | |||||||
| Unaudited | Unaudited | ||||||
| 2018 | 2017 | ||||||
| CASH FLOWS FROM OPERATING ACTIVITIES: | |||||||
| Net income | $ | 193,630 | $ | 74,342 | |||
| Adjustments to reconcile net income to net cash (used in) provided by operating activities: | |||||||
| Deferred income taxes | (12,916 | ) | 143,393 | ||||
| Net realized gains on sales of investments | (29,915 | ) | (35,436 | ) | |||
| Amortization of bond premiums | 135,854 | 131,331 | |||||
| Depreciation expense | 50,000 | 75,000 | |||||
| Changes in operating assets and liabilities: | |||||||
| Accrued investment income | (38,886 | ) | (33,200 | ) | |||
| Premiums receivable | 994,696 | (47,875 | ) | ||||
| Reinsurance recoverable | 44,073 | (740,079 | ) | ||||
| Reinsurance premiums receivable | (514,531 | ) | 3,366,458 | ||||
| Income taxes recoverable | 20,377 | (287,380 | ) | ||||
| Deferred acquisition costs | 313,170 | (381,318 | ) | ||||
| Other assets | — | (40,000 | ) | ||||
| Liability for losses and loss adjustment expenses | (611,370 | ) | 2,170,740 | ||||
| Unearned premiums | (838,436 | ) | (379,837 | ) | |||
| Reinsurance payable | (319,794 | ) | (2,413,718 | ) | |||
| Accounts payable, accrued expenses, and other liabilities | (715,615 | ) | (343,313 | ) | |||
| Due to affiliates | (357,388 | ) | 184,477 | ||||
| NET CASH (USED IN) PROVIDED BY OPERATING ACTIVITIES | (1,687,051 | ) | 1,443,585 | ||||
| CASH FLOWS FROM INVESTING ACTIVITIES: | |||||||
| Investments: | |||||||
| Proceeds from sales and maturities | 5,240,080 | 2,301,383 | |||||
| Purchases | (4,410,817 | ) | (6,387,203 | ) | |||
| NET CASH PROVIDED BY (USED IN) INVESTING ACTIVITIES | 829,263 | (4,085,820 | ) | ||||
| CASH FLOWS FROM FINANCING ACTIVITIES: | |||||||
| Repayment of note payable | (44,720 | ) | (42,930 | ) | |||
| Repayment of surplus note payable to affiliate | — | (537,000 | ) | ||||
| NET CASH USED IN FINANCING ACTIVITIES | (44,720 | ) | (579,930 | ) | |||
| NET CHANGE IN CASH AND CASH EQUIVALENTS | $ | (902,508 | ) | $ | (3,222,165 | ) | |
| CASH AND CASH EQUIVALENTS, beginning of period | 2,110,000 | 5,045,589 | |||||
| CASH AND CASH EQUIVALENTS, end of period | $ | 1,207,492 | $ | 1,823,424 | |||
| SUPPLEMENTAL DISCLOSURE OF CASH FLOW INFORMATION: | |||||||
| Interest paid for the period | $ | 4,911 | $ | 17,159 | |||
| 1. | Organization and Operations: |
| 2. | Summary of Significant Accounting Policies and Principles: |
| 3. | Concentrations of Credit Risk: |
| 4. | Variable Interest Entity: |
| 5. | Investments: |
| • | Quoted prices for similar assets in active markets; |
| • | Quoted prices for identical or similar assets in nonactive markets (few transactions, limited information, noncurrent prices, high variability over time, etc.); |
| • | Inputs other than quoted prices that are observable for the asset (interest rates, yield curves, volatilities, default rates, etc.); and |
| • | Inputs that are derived principally from or corroborated by other observable market data. |
| Amortized Cost/Cost | Gross Unrealized Gains | Gross Unrealized Losses | Fair Value | ||||||||||||
| September 30, 2018 | |||||||||||||||
| U.S. government | $ | 5,058,162 | $ | 2 | $ | 138,960 | $ | 4,919,204 | |||||||
| States, territories, and possessions | 915,228 | 788 | 6,224 | 909,792 | |||||||||||
| Subdivisions of states, territories, and possessions | 9,909,760 | 23,796 | 80,480 | 9,853,076 | |||||||||||
| Industrial and miscellaneous | 26,774,233 | 23,359 | 704,214 | 26,093,378 | |||||||||||
| Total bonds | 42,657,383 | 47,945 | 929,878 | 41,775,450 | |||||||||||
| Common stocks | 2,841,327 | 363,131 | 344,765 | 2,859,693 | |||||||||||
| $ | 45,498,710 | $ | 411,076 | $ | 1,274,643 | $ | 44,635,143 | ||||||||
| Amortized Cost/Cost | Gross Unrealized Gains | Gross Unrealized Losses | Fair Value | ||||||||||||
| September 30, 2017 | |||||||||||||||
| U.S. government | $ | 7,770,638 | $ | 315 | $ | 74,923 | $ | 7,696,030 | |||||||
| States, territories, and possessions | 1,207,632 | 27,597 | — | 1,235,229 | |||||||||||
| Subdivisions of states, territories, and possessions | 9,770,533 | 281,980 | 5,963 | 10,046,550 | |||||||||||
| Industrial and miscellaneous | 23,313,490 | 225,556 | 80,135 | 23,458,911 | |||||||||||
| Total bonds | 42,062,293 | 535,448 | 161,021 | 42,436,720 | |||||||||||
| Common stocks | 2,901,117 | 252,086 | 372,857 | 2,780,346 | |||||||||||
| $ | 44,963,410 | $ | 787,534 | $ | 533,878 | $ | 45,217,066 | ||||||||
| Amortized Cost/Cost | Fair Value | ||||||
| Due in less than one year | $ | 1,901,322 | $ | 1,899,920 | |||
| Due after one year to five years | 27,357,824 | 26,956,549 | |||||
| Due after five years to ten years | 13,398,237 | 12,918,981 | |||||
| $ | 42,657,383 | $ | 41,775,450 | ||||
| 2018 | 2017 | ||||||
| Proceeds | $ | 5,240,080 | $ | 2,301,383 | |||
| Gross gains | 45,720 | 49,950 | |||||
| Gross losses | 15,805 | 14,514 | |||||
| 2018 | 2017 | ||||||
| Bonds | $ | 799,616 | $ | 705,444 | |||
| Cash and short-term investments | 5,529 | 3,031 | |||||
| Common stocks | 110,112 | 106,776 | |||||
| Net gain on sales of investments | 29,915 | 35,436 | |||||
| 945,172 | 850,687 | ||||||
| Less investment expenses | 42,268 | 45,995 | |||||
| Net investment income | $ | 902,904 | $ | 804,692 | |||
| Less than 12 Months | |||||||
| Fair Value | Unrealized Losses | ||||||
| U.S. government | $ | 448,529 | $ | 1,413 | |||
| States, territories, and possessions | 635,640 | 6,224 | |||||
| Subdivisions of states, territories, and possessions | 5,595,401 | 59,565 | |||||
| Industrial and miscellaneous | 15,932,254 | 323,219 | |||||
| Common stocks | 448,255 | 187,989 | |||||
| $ | 23,060,079 | $ | 578,410 | ||||
| Greater than 12 Months | |||||||
| Fair Value | Unrealized Losses | ||||||
| U.S. government | $ | 4,470,484 | $ | 137,547 | |||
| States, territories, and possessions | — | — | |||||
| Subdivisions of states, territories, and possessions | 442,722 | 20,915 | |||||
| Industrial and miscellaneous | 7,528,668 | 380,995 | |||||
| Common stocks | 516,916 | 156,776 | |||||
| $ | 12,958,790 | $ | 696,233 | ||||
| Totals | |||||||
| Fair Value | Unrealized Losses | ||||||
| U.S. government | $ | 4,919,013 | $ | 138,960 | |||
| States, territories, and possessions | 635,640 | 6,224 | |||||
| Subdivisions of states, territories, and possessions | 6,038,123 | 80,480 | |||||
| Industrial and miscellaneous | 23,460,922 | 704,214 | |||||
| Common stocks | 965,171 | 344,765 | |||||
| $ | 36,018,869 | $ | 1,274,643 | ||||
| Less than 12 Months | |||||||
| Fair Value | Unrealized Losses | ||||||
| U.S. government | $ | 2,632,591 | $ | 16,526 | |||
| Subdivisions of states, territories, and possessions | 460,016 | 5,963 | |||||
| Industrial and miscellaneous | 7,374,295 | 42,212 | |||||
| Common stocks | 272,531 | 27,148 | |||||
| $ | 10,739,433 | $ | 91,849 | ||||
| Greater than 12 Months | |||||||
| Fair Value | Unrealized Losses | ||||||
| U.S. government | $ | 5,048,982 | $ | 58,397 | |||
| Subdivisions of states, territories, and possessions | — | — | |||||
| Industrial and miscellaneous | 1,332,161 | 37,923 | |||||
| Common stocks | 863,555 | 345,709 | |||||
| $ | 7,244,698 | $ | 442,029 | ||||
| Totals | |||||||
| Fair Value | Unrealized Losses | ||||||
| U.S. government | $ | 7,681,573 | $ | 74,923 | |||
| Subdivisions of states, territories, and possessions | 460,016 | 5,963 | |||||
| Industrial and miscellaneous | 8,706,456 | 80,135 | |||||
| Common stocks | 1,136,086 | 372,857 | |||||
| $ | 17,984,131 | $ | 533,878 | ||||
| Total | Level 1 | Level 2 | Level 3 | ||||||||||||
| U.S. government | $ | 4,919,204 | $ | — | $ | 4,919,204 | $ | — | |||||||
| States, territories, and possessions | 909,792 | — | 909,792 | — | |||||||||||
| Subdivisions of states, territories and possessions | 9,853,076 | — | 9,853,076 | — | |||||||||||
| Industrial and miscellaneous | 26,093,378 | — | 26,093,378 | — | |||||||||||
| Total bonds | 41,775,450 | — | 41,775,450 | — | |||||||||||
| Common stocks | 2,859,693 | 2,859,693 | — | — | |||||||||||
| $ | 44,635,143 | $ | 2,859,693 | $ | 41,775,450 | $ | — | ||||||||
| Total | Level 1 | Level 2 | Level 3 | ||||||||||||
| U.S. government | $ | 7,696,030 | $ | — | $ | 7,696,030 | $ | — | |||||||
| States, territories, and possessions | 1,235,229 | — | 1,235,229 | — | |||||||||||
| Subdivisions of states, territories and possessions | 10,046,550 | — | 10,046,550 | — | |||||||||||
| Industrial and miscellaneous | 23,458,911 | — | 23,458,911 | — | |||||||||||
| Total bonds | 42,436,720 | — | 42,436,720 | — | |||||||||||
| Common stocks | 2,780,346 | 2,780,346 | — | — | |||||||||||
| $ | 45,217,066 | $ | 2,780,346 | $ | 42,436,720 | $ | — | ||||||||
| 6. | Deferred Acquisition Costs: |
| 2018 | 2017 | ||||||
| Balance, beginning of period | $ | 2,504,001 | $ | 1,713,784 | |||
| Amount capitalized during the period | 3,568,445 | 3,561,399 | |||||
| Amount amortized during the period | 3,881,615 | 3,180,081 | |||||
| Balance, end of period | $ | 2,190,831 | $ | 2,095,102 | |||
| 7. | Reinsurance: |
| 2018 | 2017 | ||||||
| Premiums written: | |||||||
| Direct | $ | 10,349,246 | $ | 10,307,387 | |||
| Ceded | 2,058,123 | 1,242,048 | |||||
| Premiums written, net of reinsurance | $ | 8,291,123 | $ | 9,065,339 | |||
| Premiums earned: | |||||||
| Direct | $ | 11,187,682 | $ | 10,687,225 | |||
| Ceded | 1,543,592 | 993,601 | |||||
| Premiums earned, net of reinsurance | $ | 9,644,090 | $ | 9,693,624 | |||
| Losses and loss adjustment expenses incurred: | |||||||
| Direct | $ | 5,731,721 | $ | 5,321,199 | |||
| Ceded | 296,451 | (1,218,855 | ) | ||||
| Losses and loss adjustment expenses incurred, net of reinsurance | $ | 5,435,270 | $ | 6,540,054 | |||
| 8. | Equipment: |
| 2018 | 2017 | ||||||
| EDP equipment and software | $ | 300,000 | $ | 300,000 | |||
| Less accumulated depreciation and amortization | 300,000 | 225,000 | |||||
| $ | — | $ | 75,000 | ||||
| 9. | Losses and Loss Adjustment Expenses: |
| 2018 | 2017 | ||||||
| Losses and loss adjustment expenses, beginning of period | $ | 38,028,709 | $ | 34,814,118 | |||
| Less: Reinsurance recoverable, beginning of period | 6,117,389 | 8,670,162 | |||||
| Add: Reinsurance recoverable, claims paid, beginning of period | 352,285 | 3,614,905 | |||||
| Losses and loss adjustment expenses, beginning of period | 32,263,605 | 29,758,861 | |||||
| Incurred related to: | |||||||
| Current period | 5,435,271 | 6,540,054 | |||||
| Prior periods | — | — | |||||
| Total incurred | 5,435,271 | 6,540,054 | |||||
| Paid related to: | |||||||
| Current period | 255,667 | 351,389 | |||||
| Prior periods | 5,997,141 | 3,751,222 | |||||
| Total paid | 6,252,808 | 4,102,611 | |||||
| Losses and loss adjustment expenses, end of period - net | 31,446,068 | 32,196,304 | |||||
| Add: Reinsurance recoverable, end of period | 6,073,316 | 5,795,336 | |||||
| Less: Recoverable on claims paid | 102,045 | 1,006,782 | |||||
| Losses and loss adjustment expenses, end of period - gross | $ | 37,417,339 | $ | 36,984,858 | |||
| 10. | Note Payable: |
| Year ending September 30, | |||
| 2019 | $ | 61,758 | |
| 2020 | 64,304 | ||
| 2021 | 16,440 | ||
| $ | 142,502 | ||
| 11. | Income Taxes: |
| 2018 | 2017 | ||||||
| Current provision | $ | 20,377 | $ | (313,399 | ) | ||
| Deferred tax provision | (12,916 | ) | 143,393 | ||||
| $ | 7,461 | $ | (170,006 | ) | |||
| 2018 | 2017 | ||||||
| Expected tax provision at federal statutory rate | $ | 42,229 | $ | (32,526 | ) | ||
| Permanent and other differences | (40,016 | ) | (85,723 | ) | |||
| Deferred adjustments | 5,248 | (51,757 | ) | ||||
| Net income tax provision | $ | 7,461 | $ | (170,006 | ) | ||
| 2018 | 2017 | ||||||
| Deferred tax assets: | |||||||
| Discount of unearned premiums | $ | 288,058 | $ | 462,878 | |||
| Discount of advance premiums | 4,967 | 6,138 | |||||
| Discount of losses and loss adjustment expenses | 502,012 | 733,037 | |||||
| Total deferred tax assets | 795,037 | 1,202,053 | |||||
| Deferred tax liabilities: | |||||||
| Deferred acquisition costs | 460,075 | 712,335 | |||||
| Tax Act transitional adjustment | 85,525 | — | |||||
| Unrealized gain on investments | 101,095 | 412,044 | |||||
| Total deferred tax liabilities | 646,695 | 1,124,379 | |||||
| Net deferred tax asset | $ | 148,342 | $ | 77,674 | |||
| 12. | Related Party Transactions: |
| 13. | Management Agreement: |
| 14. | Assessments: |
| 15. | Statutory Information: |
| 2018 | 2017 | ||||||
| Statutory net income (loss) | $ | 310,557 | $ | (254,076 | ) | ||
| Statutory surplus and other funds | 17,276,244 | 16,935,891 | |||||
| 2018 | 2017 | ||||||
| Statutory surplus and other funds prescribed by the Department | $ | 17,276,244 | $ | 16,935,891 | |||
| State prescribed practices: | |||||||
| Unearned management fees | (1,562,011 | ) | (1,543,239 | ) | |||
| Statutory surplus and other funds per NAIC statutory accounting practices | $ | 15,714,233 | $ | 15,392,652 | |||
| 16. | Subsequent Events: |

| 2017 | 2016 | ||||||
| ASSETS | |||||||
| Investments in available-for-sale securities, at fair value: | |||||||
| Bonds (Amortized cost of $25,795,186 and $30,924,351) | $ | 25,714,469 | $ | 30,843,401 | |||
| Common stocks (Cost of $2,758,755 and $2,304,849) | 3,240,787 | 2,394,169 | |||||
| Total investments | 28,955,256 | 33,237,570 | |||||
| Cash and cash equivalents | 4,250,022 | 5,797,935 | |||||
| Accrued investment income | 139,058 | 136,384 | |||||
| Premiums receivable | 1,447,712 | 780,933 | |||||
| Reinsurance recoverable | 2,312,019 | 2,465,280 | |||||
| Unearned ceded premiums | 549,304 | 603,847 | |||||
| Deferred acquisition costs | 1,189,364 | 1,218,724 | |||||
| Income taxes recoverable | 353,968 | 382,313 | |||||
| Deferred income taxes | 102,362 | 416,896 | |||||
| Due from affiliates, net | — | 147,754 | |||||
| Other assets | 260,684 | 89,092 | |||||
| TOTAL ASSETS | $ | 39,559,749 | $ | 45,276,728 | |||
| LIABILITIES AND MEMBERS’ EQUITY | |||||||
| LIABILITIES: | |||||||
| Losses and loss adjustment expenses | $ | 18,584,712 | $ | 23,001,791 | |||
| Unearned premiums | 5,494,355 | 6,706,108 | |||||
| Accounts payable, accrued expenses, and other liabilities | 1,347,964 | 1,785,047 | |||||
| Subordinated notes payable to related parties | — | 500,000 | |||||
| Due to affiliates, net | 278,370 | — | |||||
| TOTAL LIABILITIES | 25,705,401 | 31,992,946 | |||||
| MEMBERS’ EQUITY | 13,854,348 | 13,283,782 | |||||
| TOTAL LIABILITIES AND MEMBERS’ EQUITY | $ | 39,559,749 | $ | 45,276,728 | |||
| 2017 | 2016 | ||||||
| REVENUES: | |||||||
| Net premium earned | $ | 7,480,452 | $ | 13,309,693 | |||
| TOTAL REVENUES | 7,480,452 | 13,309,693 | |||||
| EXPENSES: | |||||||
| Losses and loss adjustment expenses, net | 4,012,280 | 6,549,536 | |||||
| Other underwriting expenses | 3,500,447 | 6,090,810 | |||||
| TOTAL EXPENSES | 7,512,727 | 12,640,346 | |||||
| NET INVESTMENT INCOME | 584,026 | 623,028 | |||||
| INCOME FROM OPERATIONS | 551,751 | 1,292,375 | |||||
| INTEREST EXPENSE | 31,250 | — | |||||
| INCOME BEFORE PROVISION FOR INCOME TAXES | 520,501 | 1,292,375 | |||||
| PROVISION FOR INCOME TAXES | 209,278 | 670,579 | |||||
| NET INCOME | 311,223 | 621,796 | |||||
| OTHER COMPREHENSIVE INCOME: | |||||||
| Unrealized holding gains on available-for-sale securities, net of income tax expense of $133,601 and $83,673 | 272,576 | 152,261 | |||||
| Reclassification adjustments for net realized (gain) loss included in net income | (13,233 | ) | 10,163 | ||||
| TOTAL OTHER COMPREHENSIVE INCOME | 259,343 | 162,424 | |||||
| COMPREHENSIVE INCOME | $ | 570,566 | $ | 784,220 | |||
| Members’ Equity | Accumulated Other Comprehensive Income (Loss) | Total Members’ Equity | |||||||||
| Balance, January 1, 2016 | $ | 12,656,462 | $ | (156,900 | ) | $ | 12,499,562 | ||||
| Net income | 621,796 | — | 621,796 | ||||||||
| Other comprehensive income | — | 162,424 | 162,424 | ||||||||
| Balance, December 31, 2016 | 13,278,258 | 5,524 | 13,283,782 | ||||||||
| Net income | 311,223 | — | 311,223 | ||||||||
| Other comprehensive income | — | 259,343 | 259,343 | ||||||||
| Reclassification of tax effects from accumulated other comprehensive income related to passage of TCJA | (52,171 | ) | 52,171 | — | |||||||
| Balance, December 31, 2017 | $ | 13,537,310 | $ | 317,038 | $ | 13,854,348 | |||||
| 2017 | 2016 | ||||||
| CASH FLOWS FROM OPERATING ACTIVITIES: | |||||||
| Net income | $ | 311,223 | $ | 621,796 | |||
| Adjustments to reconcile net income to net cash used in operating activities: | |||||||
| Deferred income taxes | 180,933 | 136,567 | |||||
| Net realized (gain) loss on sales of investments | (13,233 | ) | 10,163 | ||||
| Amortization of bond premiums | 87,129 | 123,177 | |||||
| Changes in operating assets and liabilities: | |||||||
| Accrued investment income | (2,674 | ) | 73,627 | ||||
| Premiums receivable | (666,779 | ) | (32,515 | ) | |||
| Reinsurance recoverable | 153,261 | (281,676 | ) | ||||
| Mcare assessment receivable | — | 97,020 | |||||
| Income taxes recoverable | 28,345 | (382,313 | ) | ||||
| Unearned ceded premiums | 54,543 | 281,413 | |||||
| Deferred acquisition costs | 29,360 | 829,190 | |||||
| Due from affiliates, net | 147,754 | (565,224 | ) | ||||
| Other assets | (87,982 | ) | (89,092 | ) | |||
| Liability for losses and loss adjustment expenses | (4,417,079 | ) | (4,550,648 | ) | |||
| Unearned premiums | (1,211,753 | ) | (3,767,756 | ) | |||
| Reinsurance payable | — | (533,584 | ) | ||||
| Income taxes payable | — | (98,879 | ) | ||||
| Accounts payable, accrued expenses, and other liabilities | (437,083 | ) | 397,875 | ||||
| Due to affiliates, net | 278,370 | — | |||||
| NET CASH USED IN OPERATING ACTIVITIES | (5,565,665 | ) | (7,730,859 | ) | |||
| CASH FLOWS FROM INVESTING ACTIVITIES: | |||||||
| Investments: | |||||||
| Proceeds from sales and maturities | 16,725,323 | 17,352,897 | |||||
| Purchases | (12,123,961 | ) | (6,791,752 | ) | |||
| Other assets | (83,610 | ) | — | ||||
| NET CASH PROVIDED BY INVESTING ACTIVITIES | 4,517,752 | 10,561,145 | |||||
| CASH FLOWS FROM FINANCING ACTIVITIES: | |||||||
| Repayment of subordinated notes payable | (500,000 | ) | — | ||||
| NET CASH USED IN FINANCING ACTIVITIES | (500,000 | ) | — | ||||
| NET CHANGE IN CASH AND CASH EQUIVALENTS | $ | (1,547,913 | ) | $ | 2,830,286 | ||
| CASH AND CASH EQUIVALENTS, beginning of year | 5,797,935 | 2,967,649 | |||||
| CASH AND CASH EQUIVALENTS, end of year | $ | 4,250,022 | $ | 5,797,935 | |||
| SUPPLEMENTAL DISCLOSURE OF CASH FLOW INFORMATION: | |||||||
| Interest paid for the year | $ | 31,250 | $ | — | |||
| Income taxes paid for the year | $ | — | $ | 1,051,324 | |||
| 1. | Organization and Operations: |
| 2. | Summary of Significant Accounting Policies and Principles: |
| 3. | Concentrations of Credit Risk: |
| 4. | Variable Interest Entity: |
| 5. | Investments: |
| • | Quoted prices for similar assets in active markets; |
| • | Quoted prices for identical or similar assets in nonactive markets (few transactions, limited information, noncurrent prices, high variability over time, etc.); |
| • | Inputs other than quoted prices that are observable for the asset (interest rates, yield curves, volatilities, default rates, etc.); |
| • | Inputs that are derived principally from or corroborated by other observable market data. |
| Amortized Cost/Cost | Gross Unrealized Gains | Gross Unrealized Losses | Fair Value | ||||||||||||
| December 31, 2017 | |||||||||||||||
| U.S. government | $ | 6,693,770 | $ | 560 | $ | 67,765 | $ | 6,626,565 | |||||||
| Subdivisions of states, territories, and possessions | 915,000 | — | 1,912 | 913,088 | |||||||||||
| Industrial and miscellaneous | 18,186,417 | 78,498 | 90,099 | 18,174,816 | |||||||||||
| Total bonds | 25,795,187 | 79,058 | 159,776 | 25,714,469 | |||||||||||
| Common stocks | 2,758,755 | 491,752 | 9,720 | 3,240,787 | |||||||||||
| $ | 28,553,942 | $ | 570,810 | $ | 169,496 | $ | 28,955,256 | ||||||||
| Amortized Cost/Cost | Gross Unrealized Gains | Gross Unrealized Losses | Fair Value | ||||||||||||
| December 31, 2016 | |||||||||||||||
| U.S. government | $ | 13,349,110 | $ | 10,307 | $ | 66,770 | $ | 13,292,647 | |||||||
| States, territories, and possessions | 1,520,000 | 128 | 2,756 | 1,517,372 | |||||||||||
| Industrial and miscellaneous | 16,055,241 | 50,711 | 72,570 | 16,033,382 | |||||||||||
| Total bonds | 30,924,351 | 61,146 | 142,096 | 30,843,401 | |||||||||||
| Common stocks | 2,304,849 | 154,361 | 65,041 | 2,394,169 | |||||||||||
| $ | 33,229,200 | $ | 215,507 | $ | 207,137 | $ | 33,237,570 | ||||||||
| Amortized Cost/Cost | Fair Value | ||||||
| Due in less than one year | $ | 5,250,471 | $ | 5,244,865 | |||
| Due after one year to five years | 10,643,617 | 10,552,132 | |||||
| Due after five years to ten years | 9,901,099 | 9,917,472 | |||||
| $ | 25,795,187 | $ | 25,714,469 | ||||
| 2017 | 2016 | ||||||
| Proceeds | $ | 16,725,323 | $ | 17,352,897 | |||
| Gross gains | 46,147 | 30,935 | |||||
| Gross losses | 32,914 | 41,098 | |||||
| 2017 | 2016 | ||||||
| Bonds | $ | 578,219 | $ | 644,914 | |||
| Cash and short-term investments | 19,529 | 9,892 | |||||
| Common stocks | 81,298 | 59,171 | |||||
| Net gain (loss) on sales of investments | 13,233 | (10,163 | ) | ||||
| 692,279 | 703,814 | ||||||
| Less investment expenses | 108,253 | 80,776 | |||||
| Net investment income | $ | 584,026 | $ | 623,038 | |||
| Less than 12 Months | |||||||
| Fair Value | Unrealized Losses | ||||||
| U.S. government | $ | 2,508,225 | $ | 4,733 | |||
| Subdivisions of states, territories, and possessions | — | — | |||||
| Industrial and miscellaneous | 7,514,041 | 58,048 | |||||
| Common stocks | 186,528 | 5,446 | |||||
| $ | 10,208,794 | $ | 68,227 | ||||
| Greater than 12 Months | |||||||
| Fair Value | Unrealized Losses | ||||||
| U.S. government | $ | 3,893,144 | $ | 63,032 | |||
| Subdivisions of states, territories, and possessions | 913,088 | 1,912 | |||||
| Industrial and miscellaneous | 3,212,135 | 32,051 | |||||
| Common stocks | 214,313 | 4,274 | |||||
| $ | 8,232,680 | $ | 101,269 | ||||
| Totals | |||||||
| Fair Value | Unrealized Losses | ||||||
| U.S. government | $ | 6,401,369 | $ | 67,765 | |||
| Subdivisions of states, territories, and possessions | 913,088 | 1,912 | |||||
| Industrial and miscellaneous | 10,726,176 | 90,099 | |||||
| Common stocks | 400,841 | 9,720 | |||||
| $ | 18,441,474 | $ | 169,496 | ||||
| Less than 12 Months | |||||||
| Fair Value | Unrealized Losses | ||||||
| U.S. government | $ | 4,917,355 | $ | 57,830 | |||
| Subdivisions of states, territories, and possessions | 1,427,243 | 2,756 | |||||
| Industrial and miscellaneous | 4,034,492 | 51,832 | |||||
| Common stocks | 461,879 | 26,057 | |||||
| $ | 10,840,969 | $ | 138,475 | ||||
| Greater than 12 Months | |||||||
| Fair Value | Unrealized Losses | ||||||
| U.S. government | $ | 3,010,130 | $ | 8,940 | |||
| Industrial and miscellaneous | 2,011,194 | 20,738 | |||||
| Common stocks | 376,054 | 38,984 | |||||
| $ | 5,397,378 | $ | 68,662 | ||||
| Totals | |||||||
| Fair Value | Unrealized Losses | ||||||
| U.S. government | $ | 7,927,485 | $ | 66,770 | |||
| Subdivision of states, territories, & possessions | 1,427,243 | 2,756 | |||||
| Industrial and miscellaneous | 6,045,686 | 72,570 | |||||
| Common stocks | 837,933 | 65,041 | |||||
| $ | 16,238,347 | $ | 207,137 | ||||
| Total | Level 1 | Level 2 | Level 3 | ||||||||||||
| U.S. government | $ | 6,626,565 | $ | — | $ | 6,626,565 | $ | — | |||||||
| Subdivisions of states, territories, and possessions | 913,088 | — | 913,088 | — | |||||||||||
| Industrial and miscellaneous | 18,174,816 | — | 18,174,816 | — | |||||||||||
| Total bonds | 25,714,469 | — | 25,714,469 | — | |||||||||||
| Common stocks | 3,240,787 | 3,240,787 | — | — | |||||||||||
| $ | 28,955,256 | $ | 3,240,787 | $ | 25,714,469 | $ | — | ||||||||
| Total | Level 1 | Level 2 | Level 3 | ||||||||||||
| U.S. government | $ | 13,292,647 | $ | — | $ | 13,292,647 | $ | — | |||||||
| Subdivisions of states, territories, and possessions | 1,517,372 | — | 1,517,372 | — | |||||||||||
| Industrial and miscellaneous | 16,033,382 | — | 16,033,382 | — | |||||||||||
| Total bonds | 30,843,401 | — | 30,843,401 | — | |||||||||||
| Common stocks | 2,394,169 | 2,394,169 | — | — | |||||||||||
| $ | 33,237,570 | $ | 2,394,169 | $ | 30,843,401 | $ | — | ||||||||
| 6. | Deferred Acquisition Costs: |
| 2017 | 2016 | ||||||
| Balance, beginning of year | $ | 1,218,724 | $ | 2,047,914 | |||
| Amount capitalized during the year | 2,583,099 | 4,096,924 | |||||
| Amount amortized during the year | 2,612,459 | 4,926,114 | |||||
| Balance, end of year | $ | 1,189,364 | $ | 1,218,724 | |||
| 7. | Reinsurance: |
| 2017 | 2016 | ||||||
| Premiums written: | |||||||
| Direct | $ | 7,683,787 | $ | 11,940,718 | |||
| Ceded | 1,360,550 | 2,098,628 | |||||
| Premiums written, net of reinsurance | $ | 6,323,237 | $ | 9,842,090 | |||
| Premiums earned: | |||||||
| Direct | $ | 8,895,545 | $ | 15,689,734 | |||
| Ceded | 1,415,093 | 2,380,041 | |||||
| Premiums earned, net of reinsurance | $ | 7,480,452 | $ | 13,309,693 | |||
| Loss and loss adjustment expenses incurred: | |||||||
| Direct | $ | 4,702,804 | $ | 8,253,714 | |||
| Ceded | 690,524 | 1,704,178 | |||||
| Loss and loss adjustment expenses incurred, net of reinsurance | $ | 4,012,280 | $ | 6,549,536 | |||
| 8. | Loss and Loss Adjustment Expenses: |
| 2017 | 2016 | ||||||
| Loss and loss adjustment expenses, beginning of year – gross | $ | 23,001,791 | $ | 27,552,439 | |||
| Less: Reinsurance recoverable, beginning of year | 2,465,280 | 2,183,604 | |||||
| Add: Recoverable on claims paid | 740,158 | 306,000 | |||||
| Loss and loss adjustment expenses, beginning of year – net | 21,276,669 | 25,674,835 | |||||
| Incurred related to: | |||||||
| Current year | 4,435,280 | 7,768,536 | |||||
| Prior years | (423,000 | ) | (1,219,000 | ) | |||
| Total incurred | 4,012,280 | 6,549,536 | |||||
| Paid related to: | |||||||
| Current year | 310,857 | 605,040 | |||||
| Prior years | 7,861,111 | 10,342,662 | |||||
| Total paid | 8,171,968 | 10,947,702 | |||||
| Loss and loss adjustment expenses, end of year – net | 17,116,981 | 21,276,669 | |||||
| Add: Reinsurance recoverable, end of year | 2,312,019 | 2,465,280 | |||||
| Less: Recoverable on claims paid – end of year | 844,288 | 740,158 | |||||
| Loss and loss adjustment expenses, end of year – gross | $ | 18,584,712 | $ | 23,001,791 | |||
| Incurred Losses and Loss Adjustment Expenses, Net of Reinsurance (in thousands) | As of December 31, 2017 | |||||||||||||||||||||||||||||||||
| Accident Year | 2008 | 2009 | 2010 | 2011 | 2012 | 2013 | 2014 | 2015 | 2016 | 2017 | Total of Incurred-But-Not-Reported Liabilities Plus Expected Development on Reported Claims | Cumulative Number of Reported Claims | ||||||||||||||||||||||
| 2008 | $ | 14,470 | $ | 10,342 | $ | 10,126 | $ | 8,943 | $ | 9,012 | $ | 8,654 | $ | 8,746 | $ | 8,912 | $ | 9,192 | $ | 9,121 | 62 | 108 | ||||||||||||
| 2009 | 13,591 | 11,440 | 10,624 | 9,767 | 9,791 | 9,712 | 10,438 | 11,064 | 11,196 | 18 | 100 | |||||||||||||||||||||||
| 2010 | 8,455 | 6,567 | 6,443 | 5,740 | 4,990 | 4,563 | 4,461 | 5,127 | 13 | 70 | ||||||||||||||||||||||||
| 2011 | 9,459 | 9,537 | 9,471 | 11,602 | 11,928 | 11,982 | 12,428 | 292 | 84 | |||||||||||||||||||||||||
| 2012 | 9,877 | 9,364 | 9,553 | 10,064 | 10,146 | 10,420 | 287 | 98 | ||||||||||||||||||||||||||
| 2013 | 7,818 | 7,057 | 6,270 | 5,536 | 5,040 | 272 | 86 | |||||||||||||||||||||||||||
| 2014 | 7,403 | 5,924 | 5,989 | 5,672 | 487 | 68 | ||||||||||||||||||||||||||||
| 2015 | 8,374 | 7,292 | 6,500 | 1,084 | 66 | |||||||||||||||||||||||||||||
| 2016 | 7,529 | 7,873 | 2,797 | 71 | ||||||||||||||||||||||||||||||
| 2017 | 4,378 | 2,459 | 46 | |||||||||||||||||||||||||||||||
| $ | 77,755 | |||||||||||||||||||||||||||||||||
| Cumulative Losses and Loss Adjustment Expenses Paid, Net of Reinsurance (in thousands) | ||||||||||||||||||||||||||||||||||
| Accident Year | 2008 | 2009 | 2010 | 2011 | 2012 | 2013 | 2014 | 2015 | 2016 | 2017 | ||||||||||||||||||||||||
| 2008 | $ | 411 | $ | 2,077 | $ | 4,999 | $ | 6,512 | $ | 7,424 | $ | 7,675 | $ | 7,925 | $ | 8,098 | $ | 9,128 | $ | 8,941 | ||||||||||||||
| 2009 | 408 | 1,605 | 4,028 | 7,214 | 7,956 | 8,282 | 9,507 | 10,240 | 11,057 | |||||||||||||||||||||||||
| 2010 | 267 | 963 | 2,065 | 3,078 | 3,671 | 3,851 | 3,981 | 4,986 | ||||||||||||||||||||||||||
| 2011 | 398 | 1,132 | 2,802 | 8,926 | 10,356 | 11,098 | 11,795 | |||||||||||||||||||||||||||
| 2012 | 423 | 1,500 | 3,240 | 5,736 | 8,617 | 9,811 | ||||||||||||||||||||||||||||
| 2013 | 406 | 1,336 | 2,715 | 4,191 | 4,435 | |||||||||||||||||||||||||||||
| 2014 | 285 | 1,017 | 2,884 | 4,094 | ||||||||||||||||||||||||||||||
| 2015 | 381 | 1,802 | 3,197 | |||||||||||||||||||||||||||||||
| 2016 | 512 | 2,475 | ||||||||||||||||||||||||||||||||
| 2017 | 302 | |||||||||||||||||||||||||||||||||
| $ | 61,093 | |||||||||||||||||||||||||||||||||
| All outstanding liabilities before 2008, net of reinsurance | 49 | |||||||||||||||||||||||||||||||||
| Liabilities for losses and loss adjustment expenses, net of reinsurance | $ | 16,711 | ||||||||||||||||||||||||||||||||
| 2017 | |||
| Net outstanding liabilities for losses and loss adjustment expenses: | |||
| Medical professional | $ | 16,711,792 | |
| Liabilities for losses and loss adjustment expenses, net of reinsurance | 16,711,792 | ||
| Reinsurance recoverable on unpaid claims: | |||
| Medical professional | 1,467,731 | ||
| Total reinsurance recoverable on unpaid claims | 1,467,731 | ||
| Unallocated loss adjustment expenses | 405,189 | ||
| Total gross liability for losses and loss adjustment expenses | $ | 18,584,712 | |
| Average Annual Percentage Payout of Incurred Losses by Age, Net of Reinsurance | ||||||||||||||||||||||||||||||
| Accident Year | Year 1 | Year 2 | Year 3 | Year 4 | Year 5 | Year 6 | Year 7 | Year 8 | Year 9 | Year 10 | ||||||||||||||||||||
| Medical professional | 5.3 | % | 15.2 | % | 23.4 | % | �� | 27.0 | % | 12.0 | % | 5.3 | % | 6.7 | % | 9.3 | % | 9.3 | % | (2.1 | )% | |||||||||
| 9. | Income Taxes: |
| 2017 | 2016 | ||||||
| Current provision | $ | 28,345 | $ | 534,012 | |||
| Deferred tax provision | 180,933 | 136,567 | |||||
| $ | 209,278 | $ | 670,579 | ||||
| 2017 | 2016 | ||||||
| Expected tax provision at federal statutory rate | $ | 176,970 | $ | 439,408 | |||
| Permanent and other differences | 27,124 | 231,171 | |||||
| Deferred adjustments | (58,182 | ) | — | ||||
| Change in deferred income taxes due to change in enacted tax rates | 63,366 | — | |||||
| Net income tax provision | $ | 209,278 | $ | 670,579 | |||
| 2017 | 2016 | ||||||
| Deferred tax assets: | |||||||
| Discount of unearned premiums | $ | 207,692 | $ | 414,954 | |||
| Discount of advance premiums | 30,365 | 45,180 | |||||
| Discount of losses and loss adjustment expenses | 266,541 | 370,519 | |||||
| Guaranty fund assessment | 16,757 | — | |||||
| Capital loss carryforward | — | 3,455 | |||||
| Total deferred tax assets | 521,355 | 834,108 | |||||
| Deferred tax liabilities: | |||||||
| Deferred acquisition costs | 249,766 | 414,366 | |||||
| TCJA transitional adjustment | 83,753 | — | |||||
| Other items | 1,198 | — | |||||
| Unrealized gains on investments | 84,276 | 2,846 | |||||
| Total deferred tax liabilities | 418,993 | 417,212 | |||||
| Net deferred tax assets | $ | 102,362 | $ | 416,896 | |||
| 10. | Related Party Transactions: |
| 11. | Assessments: |
| 12. | Statutory Information: |
| 2017 | 2016 | ||||||
| Statutory net income | $ | 566,493 | $ | 1,673,176 | |||
| Statutory surplus and other funds | 13,590,555 | 13,618,932 | |||||
| 2018 | 2017 | ||||||
| Statutory surplus and other funds prescribed by the Department | $ | 13,590,555 | $ | 13,618,932 | |||
| State prescribed practices: | |||||||
| Unearned management fees | (807,794 | ) | (888,005 | ) | |||
| Statutory surplus and other funds per NAIC statutory accounting practices | $ | 12,782,761 | $ | 12,730,927 | |||
| 13. | Subsequent Events: |
| Unaudited | Unaudited | ||||||
| 2018 | 2017 | ||||||
| ASSETS | |||||||
| Investments in available-for-sale securities, at fair value: | |||||||
| Bonds (Amortized cost of $26,192,695 and $30,848,213) | $ | 25,586,773 | $ | 30,920,179 | |||
| Common stocks (Cost of $2,788,885 and $2,594,701) | 3,324,114 | 2,932,322 | |||||
| Short-term investments | 149,856 | — | |||||
| Other invested assets | 150,129 | — | |||||
| Total investments | 29,210,872 | 33,852,501 | |||||
| Cash and cash equivalents | 2,253,760 | 2,244,309 | |||||
| Accrued investment income | 160,556 | 169,634 | |||||
| Premiums receivable | 367,247 | 856,628 | |||||
| Reinsurance recoverable | 2,003,134 | 2,257,615 | |||||
| Income taxes recoverable | 695,885 | 132,392 | |||||
| Unearned ceded premiums | 191,531 | 427,213 | |||||
| Deferred acquisition costs | 881,827 | 778,381 | |||||
| Deferred income taxes | 216,028 | 305,445 | |||||
| Other assets | 215,870 | 371,869 | |||||
| TOTAL ASSETS | $ | 36,196,710 | $ | 41,395,987 | |||
| LIABILITIES AND MEMBERS’ EQUITY | |||||||
| LIABILITIES: | |||||||
| Losses and loss adjustment expenses | $ | 19,915,481 | $ | 20,845,494 | |||
| Unearned premiums | 4,574,517 | 4,917,089 | |||||
| Reinsurance payable | 28,564 | — | |||||
| Accounts payable, accrued expenses, and other liabilities | 195,832 | 1,451,257 | |||||
| Due to affiliates, net | 80,042 | 97,154 | |||||
| TOTAL LIABILITIES | 24,794,436 | 27,310,994 | |||||
| MEMBERS’ EQUITY | 11,402,274 | 14,084,993 | |||||
| TOTAL LIABILITIES AND MEMBERS’ EQUITY | $ | 36,196,710 | $ | 41,395,987 | |||
| Unaudited | Unaudited | ||||||
| 2018 | 2017 | ||||||
| REVENUES: | |||||||
| Net premium earned | $ | 4,474,850 | $ | 5,753,150 | |||
| TOTAL REVENUES | 4,474,850 | 5,753,150 | |||||
| EXPENSES: | |||||||
| Losses and loss adjustment expenses, net | 5,051,713 | 2,645,892 | |||||
| Other underwriting expenses | 2,578,932 | 2,724,767 | |||||
| TOTAL EXPENSES | 7,630,645 | 5,370,659 | |||||
| NET INVESTMENT INCOME | 561,328 | 410,125 | |||||
| (LOSS) INCOME FROM OPERATIONS | (2,594,467 | ) | 792,616 | ||||
| INTEREST EXPENSE | — | 31,250 | |||||
| (LOSS) INCOME BEFORE PROVISION FOR INCOME TAXES | (2,594,467 | ) | 761,366 | ||||
| PROVISION FOR INCOME TAXES | (515,278 | ) | 224,958 | ||||
| NET (LOSS) INCOME | (2,079,189 | ) | 536,408 | ||||
| OTHER COMPREHENSIVE (LOSS) INCOME: | |||||||
| Unrealized holding (loss) gains on available-for-sale securities, net of income tax benefit (expense) of $99,122 and $(136,414) | (361,074 | ) | 280,148 | ||||
| Reclassification adjustments for net realized gain included in net (loss) income | (11,811 | ) | (15,345 | ) | |||
| TOTAL OTHER COMPREHENSIVE (LOSS) INCOME | (372,885 | ) | 264,803 | ||||
| COMPREHENSIVE (LOSS) INCOME | $ | (2,452,074 | ) | $ | 801,211 | ||
| Contributed Capital | Retained Earnings | Accumulated Other Comprehensive Income (Loss) | Total Members' Equity | ||||||||||||
| Balance, January 1, 2017 | $ | 2,348,988 | $ | 10,929,270 | $ | 5,524 | $ | 13,283,782 | |||||||
| Net income | 536,408 | — | 536,408 | ||||||||||||
| Other comprehensive income | — | — | 264,803 | 264,803 | |||||||||||
| Balance, September 30, 2017 (unaudited) | $ | 2,348,988 | $ | 11,465,678 | $ | 270,327 | $ | 14,084,993 | |||||||
| Balance, January 1, 2018 | $ | 2,348,988 | $ | 11,188,322 | $ | 317,038 | $ | 13,854,348 | |||||||
| Net loss | — | (2,079,189 | ) | — | (2,079,189 | ) | |||||||||
| Other comprehensive loss | — | — | (372,885 | ) | (372,885 | ) | |||||||||
| Balance, September 30, 2018 (unaudited) | $ | 2,348,988 | $ | 9,109,133 | $ | (55,847 | ) | $ | 11,402,274 | ||||||
| Unaudited | Unaudited | ||||||
| 2018 | 2017 | ||||||
| CASH FLOWS FROM OPERATING ACTIVITIES: | |||||||
| Net (loss) income | $ | (2,079,189 | ) | $ | 536,408 | ||
| Adjustments to reconcile net (loss) income to net cash used in operating activities: | |||||||
| Deferred income taxes | (14,544 | ) | (24,963 | ) | |||
| Net realized gain on sales of investments | (11,811 | ) | (15,345 | ) | |||
| Amortization of bond premiums | 20,068 | 71,595 | |||||
| Amortization of other assets | 19,429 | — | |||||
| Changes in operating assets and liabilities: | |||||||
| Accrued investment income | (21,498 | ) | (33,250 | ) | |||
| Premiums receivable | 1,080,465 | (75,695 | ) | ||||
| Reinsurance recoverable | 308,885 | 207,665 | |||||
| Income taxes recoverable | (341,917 | ) | 249,921 | ||||
| Unearned ceded premiums | 357,773 | 176,634 | |||||
| Deferred acquisition costs | 307,537 | 440,343 | |||||
| Due from affiliate | — | 258,143 | |||||
| Other assets | 41,696 | (226,212 | ) | ||||
| Liability for losses and loss adjustment expenses | 1,330,769 | (2,156,297 | ) | ||||
| Unearned premiums | (919,838 | ) | (1,789,019 | ) | |||
| Reinsurance payable | 28,564 | — | |||||
| Accounts payable, accrued expenses, and other liabilities | (1,152,132 | ) | (333,790 | ) | |||
| Due to affiliates, net | (198,328 | ) | (13,235 | ) | |||
| NET CASH USED IN OPERATING ACTIVITIES | (1,244,071 | ) | (2,727,097 | ) | |||
| CASH FLOWS FROM INVESTING ACTIVITIES: | |||||||
| Investments: | |||||||
| Proceeds from sales and maturities | 7,273,891 | 7,487,918 | |||||
| Purchases | (8,009,771 | ) | (7,757,882 | ) | |||
| Other assets | (16,311 | ) | (56,565 | ) | |||
| NET CASH USED IN INVESTING ACTIVITIES | (752,191 | ) | (326,529 | ) | |||
| CASH FLOWS FROM FINANCING ACTIVITIES: | |||||||
| Repayment of subordinated notes payable | — | (500,000 | ) | ||||
| NET CASH USED IN FINANCING ACTIVITIES | — | (500,000 | ) | ||||
| NET CHANGE IN CASH AND CASH EQUIVALENTS | $ | (1,996,262 | ) | $ | (3,553,626 | ) | |
| CASH AND CASH EQUIVALENTS, beginning of period | 4,250,022 | 5,797,935 | |||||
| CASH AND CASH EQUIVALENTS, end of period | $ | 2,253,760 | $ | 2,244,309 | |||
| SUPPLEMENTAL DISCLOSURE OF CASH FLOW INFORMATION: | |||||||
| Interest paid for the period | $ | — | $ | 31,250 | |||
| 1. | Organization and Operations: |
| 2. | Summary of Significant Accounting Policies and Principles: |
| 3. | Concentrations of Credit Risk: |
| 4. | Variable Interest Entity: |
| 5. | Investments: |
| • | Quoted prices for similar assets in active markets; |
| • | Quoted prices for identical or similar assets in nonactive markets (few transactions, limited information, noncurrent prices, high variability over time, etc.); |
| • | Inputs other than quoted prices that are observable for the asset (interest rates, yield curves, volatilities, default rates, etc.); |
| • | Inputs that are derived principally from or corroborated by other observable market data. |
| Amortized Cost/Cost | Gross Unrealized Gains | Gross Unrealized Losses | Fair Value | ||||||||||||
| September 30, 2018 | |||||||||||||||
| U.S. government | $ | 4,096,667 | $ | — | $ | 91,842 | $ | 4,004,825 | |||||||
| Subdivisions of states, territories, and possessions | 844,406 | — | 3,647 | 840,759 | |||||||||||
| Industrial and miscellaneous | 21,251,622 | 7,245 | 517,678 | 20,741,189 | |||||||||||
| Total bonds | 26,192,695 | 7,245 | 613,167 | 25,586,773 | |||||||||||
| Common stocks | 2,788,885 | 572,729 | 37,500 | 3,324,114 | |||||||||||
| $ | 28,981,580 | $ | 579,974 | $ | 650,667 | $ | 28,910,887 | ||||||||
| Amortized Cost/Cost | Gross Unrealized Gains | Gross Unrealized Losses | Fair Value | ||||||||||||
| September 30, 2017 | |||||||||||||||
| U.S. government | $ | 9,292,570 | $ | 4,695 | $ | 47,399 | $ | 9,249,866 | |||||||
| Subdivisions of states, territories, and possessions | 1,430,000 | 51 | 128 | 1,429,923 | |||||||||||
| Industrial and miscellaneous | 20,125,643 | 148,679 | 33,932 | 20,240,390 | |||||||||||
| Total bonds | 30,848,213 | 153,425 | 81,459 | 30,920,179 | |||||||||||
| Common stocks | 2,594,701 | 364,193 | 26,572 | 2,932,322 | |||||||||||
| $ | 33,442,914 | $ | 517,618 | $ | 108,031 | $ | 33,852,501 | ||||||||
| Amortized Cost/Cost | Fair Value | ||||||
| Due in less than one year | $ | 1,582,995 | $ | 1,570,843 | |||
| Due after one year to five years | 15,936,645 | 15,635,395 | |||||
| Due after five years to ten years | 8,673,055 | 8,380,535 | |||||
| $ | 26,192,695 | $ | 25,586,773 | ||||
| 2018 | 2017 | ||||
| Proceeds | 7,273,891 | 7,487,918 | |||
| Gross gains | 36,113 | 27,878 | |||
| Gross losses | 24,302 | 12,533 | |||
| 2018 | 2017 | ||||||
| Bonds | $ | 466,548 | $ | 429,126 | |||
| Cash and short-term investments | 36,033 | 6,639 | |||||
| Common stocks | 73,885 | 58,310 | |||||
| Limited partnership | 129 | — | |||||
| Net gain on sales of investments | 11,811 | 15,345 | |||||
| 588,406 | 509,420 | ||||||
| Less investment expenses | 27,078 | 99,295 | |||||
| Net investment income | $ | 561,328 | $ | 410,125 | |||
| Less than 12 Months | |||||||
| Fair Value | Unrealized Losses | ||||||
| U.S. government | $ | 4,004,824 | $ | 91,842 | |||
| Subdivisions of states, territories, and possessions | 1,238,885 | 3,647 | |||||
| Industrial and miscellaneous | 19,207,213 | 517,678 | |||||
| Common stocks | 282,415 | 16,673 | |||||
| $ | 24,733,337 | $ | 629,840 | ||||
| Greater than 12 Months | |||||||
| Fair Value | Unrealized Losses | ||||||
| U.S. government | $ | — | $ | — | |||
| Subdivisions of states, territories, and possessions | — | — | |||||
| Industrial and miscellaneous | — | — | |||||
| Common stocks | 254,405 | 20,827 | |||||
| $ | 254,405 | $ | 20,827 | ||||
| Totals | |||||||
| Fair Value | Unrealized Losses | ||||||
| U.S. government | $ | 4,004,824 | $ | 91,842 | |||
| Subdivisions of states, territories, and possessions | 1,238,885 | 3,647 | |||||
| Industrial and miscellaneous | 19,207,213 | 517,678 | |||||
| Common stocks | 536,820 | 37,500 | |||||
| $ | 24,987,742 | $ | 650,667 | ||||
| Less than 12 Months | |||||||
| Fair Value | Unrealized Losses | ||||||
| U.S. government | $ | 6,929,129 | $ | 44,821 | |||
| Subdivisions of states, territories, and possessions | 914,872 | 128 | |||||
| Industrial and miscellaneous | 5,282,734 | 29,463 | |||||
| Common stocks | 312,249 | 18,424 | |||||
| $ | 13,438,984 | $ | 92,836 | ||||
| Greater than 12 Months | |||||||
| Fair Value | Unrealized Losses | ||||||
| U.S. government | $ | 997,700 | $ | 2,578 | |||
| Subdivision of states, territories, & possessions | — | — | |||||
| Industrial and miscellaneous | 1,302,750 | 4,469 | |||||
| Common stocks | 60,548 | 8,148 | |||||
| $ | 2,360,998 | $ | 15,195 | ||||
| Totals | |||||||
| Fair Value | Unrealized Losses | ||||||
| U.S. government | $ | 7,926,829 | $ | 47,399 | |||
| Subdivision of states, territories, & possessions | 914,872 | 128 | |||||
| Industrial and miscellaneous | 6,585,484 | 33,932 | |||||
| Common stocks | 372,797 | 26,572 | |||||
| $ | 15,799,982 | $ | 108,031 | ||||
| Total | Level 1 | Level 2 | Level 3 | ||||||||||||
| U.S. government | $ | 4,004,825 | $ | — | $ | 4,004,825 | $ | — | |||||||
| Subdivisions of states, territories, and possessions | 840,759 | — | 840,759 | — | |||||||||||
| Industrial and miscellaneous | 20,741,189 | — | 20,741,189 | — | |||||||||||
| Total bonds | 25,586,773 | — | 25,586,773 | — | |||||||||||
| Common stocks | 3,324,114 | 3,324,114 | — | — | |||||||||||
| $ | 28,910,887 | $ | 3,324,114 | $ | 25,586,773 | $ | — | ||||||||
| Total | Level 1 | Level 2 | Level 3 | ||||||||||||
| U.S. government | $ | 9,249,866 | $ | — | $ | 9,249,866 | $ | — | |||||||
| Subdivisions of states, territories, and possessions | 1,429,923 | — | 1,429,923 | — | |||||||||||
| Industrial and miscellaneous | 20,240,390 | — | 20,240,390 | — | |||||||||||
| Total bonds | 30,920,179 | — | 30,920,179 | — | |||||||||||
| Common stocks | 2,932,322 | 2,932,322 | — | — | |||||||||||
| $ | 33,852,501 | $ | 2,932,322 | $ | 30,920,179 | $ | — | ||||||||
| 6. | Deferred Acquisition Costs: |
| 2018 | 2017 | ||||||
| Balance, beginning of period | $ | 1,189,364 | $ | 1,218,724 | |||
| Amount capitalized during the period | 1,532,759 | 2,115,566 | |||||
| Amount amortized during the period | 1,840,296 | 2,555,909 | |||||
| Balance, end of period | $ | 881,827 | $ | 778,381 | |||
| 7. | Reinsurance: |
| 2018 | 2017 | ||||||
| Premiums written: | |||||||
| Direct | $ | 4,226,514 | $ | 5,057,049 | |||
| Ceded | 313,729 | 916,289 | |||||
| Premiums written, net of reinsurance | $ | 3,912,785 | $ | 4,140,760 | |||
| Premiums earned: | |||||||
| Direct | $ | 5,146,353 | $ | 6,846,074 | |||
| Ceded | 671,503 | 1,092,924 | |||||
| Premiums earned, net of reinsurance | $ | 4,474,850 | $ | 5,753,150 | |||
| Losses and loss adjustment expenses incurred: | |||||||
| Direct | $ | 6,244,953 | $ | 3,056,295 | |||
| Ceded | 1,193,240 | 410,403 | |||||
| Losses and loss adjustment expenses incurred, net of reinsurance | $ | 5,051,713 | $ | 2,645,892 | |||
| 8. | Losses and Loss Adjustment Expenses: |
| 2018 | 2017 | ||||||
| Loss and loss adjustment expenses, beginning of period - gross | $ | 18,584,712 | $ | 23,001,791 | |||
| Less: Reinsurance recoverable, beginning of period | 2,312,019 | 2,465,280 | |||||
| Add: Recoverable on claims paid | 844,288 | 740,158 | |||||
| Losses and loss adjustment expenses, beginning of period- net | 17,116,981 | 21,276,669 | |||||
| Incurred related to: | |||||||
| Current period | 2,792,864 | 1,932,886 | |||||
| Prior periods | 2,258,849 | 713,006 | |||||
| Total incurred | 5,051,713 | 2,645,892 | |||||
| Paid related to: | |||||||
| Current period | 107,281 | 206,998 | |||||
| Prior periods | 4,149,066 | 4,710,480 | |||||
| Total paid | 4,256,347 | 4,917,478 | |||||
| Losses and loss adjustment expenses, end of period - net | 17,912,347 | 19,005,083 | |||||
| Add: Reinsurance recoverable, end of period | 2,003,134 | 2,257,615 | |||||
| Less: Recoverable on claims paid | — | 417,204 | |||||
| Losses and loss adjustment expenses, end of period - gross | $ | 19,915,481 | $ | 20,845,494 | |||
| 9. | Income Taxes: |
| 2018 | 2017 | ||||||
| Current provision | $ | (500,734 | ) | $ | 249,921 | ||
| Deferred tax provision | (14,544 | ) | (24,963 | ) | |||
| $ | (515,278 | ) | $ | 224,958 | |||
| 2018 | 2017 | ||||||
| Expected tax provision at federal statutory rate | $ | (544,838 | ) | $ | 255,864 | ||
| Permanent and other differences | 22,920 | 32,664 | |||||
| Deferred adjustments | 6,640 | (63,570 | ) | ||||
| Net income tax provision | $ | (515,278 | ) | $ | 224,958 | ||
| 2018 | 2017 | ||||||
| Deferred tax assets: | |||||||
| Discount of unearned premiums | $ | 184,085 | $ | 305,312 | |||
| Discount of advance premiums | 301 | 47,238 | |||||
| Discount of losses and loss adjustment expenses | 267,182 | 330,961 | |||||
| Guaranty fund assessment | 13,304 | 25,844 | |||||
| Unrealized loss on investments | 14,846 | — | |||||
| Total deferred tax assets | 479,718 | 709,355 | |||||
| Deferred tax liabilities: | |||||||
| Deferred acquisition costs | 185,184 | 264,650 | |||||
| TCJA transitional adjustment | 75,901 | — | |||||
| Other items | 2,605 | — | |||||
| Unrealized gain on investments | — | 139,260 | |||||
| Total deferred tax liabilities | 263,690 | 403,910 | |||||
| Net deferred tax assets | $ | 216,028 | $ | 305,445 | |||
| 10. | Related Party Transactions: |
| 11. | Assessments: |
| 12. | Statutory Information: |
| 2018 | 2017 | ||||||
| Statutory net (loss) income | $ | (1,862,944 | ) | $ | 813,897 | ||
| Statutory surplus and other funds | 11,635,274 | 13,938,411 | |||||
| 2018 | 2017 | ||||||
| Statutory surplus and other funds prescribed by the Department | $ | 11,635,274 | $ | 13,938,411 | |||
| State prescribed practices: | |||||||
| Unearned management fees | (577,840 | ) | (628,254 | ) | |||
| Statutory surplus and other funds per NAIC statutory accounting practices | $ | 11,057,434 | $ | 13,310,157 | |||
| 13. | Subsequent Events: |
| 2017 | 2016 | ||||||
| ASSETS | |||||||
| Investments in available-for-sale securities, at fair value: | |||||||
| Bonds (Amortized cost of $21,161,640 and $16,486,465) | $ | 21,229,056 | $ | 16,619,228 | |||
| Common stocks (Cost of $1,580,248 and $1,196,668) | 1,819,637 | 1,230,653 | |||||
| Short-term investments | — | 115,283 | |||||
| Other invested assets | 131,798 | — | |||||
| Total investments | 23,180,491 | 17,965,164 | |||||
| Cash and cash equivalents | 1,836,204 | 8,127,243 | |||||
| Accrued investment income | 136,854 | 122,873 | |||||
| Premiums receivable | 353,793 | 458,795 | |||||
| Reinsurance recoverable | 156,443 | 90,868 | |||||
| Income taxes recoverable | 189,233 | 63,247 | |||||
| Unearned ceded premiums | 171,573 | 194,834 | |||||
| Deferred acquisition costs | 384,957 | 422,310 | |||||
| Deferred income taxes | 151,578 | 330,612 | |||||
| Other assets | 83,036 | 22,635 | |||||
| TOTAL ASSETS | $ | 26,644,162 | $ | 27,798,581 | |||
| LIABILITIES AND MEMBERS’ EQUITY | |||||||
| LIABILITIES: | |||||||
| Losses and loss adjustment expenses | $ | 11,761,133 | $ | 12,343,048 | |||
| Unearned premiums | 1,609,252 | 1,752,671 | |||||
| Reinsurance payable | 10,661 | 71,743 | |||||
| Accounts payable, accrued expenses, and other liabilities | 922,001 | 1,070,290 | |||||
| Due to affiliates | 77,470 | 329,574 | |||||
| TOTAL LIABILITIES | 14,380,517 | 15,567,326 | |||||
| MEMBERS’ EQUITY | 12,263,645 | 12,231,255 | |||||
| TOTAL LIABILITIES AND MEMBERS’ EQUITY | $ | 26,644,162 | $ | 27,798,581 | |||
| 2017 | 2016 | ||||||
| REVENUES: | |||||||
| Net premium earned | $ | 3,147,916 | $ | 3,792,603 | |||
| TOTAL REVENUES | 3,147,916 | 3,792,603 | |||||
| EXPENSES: | |||||||
| Losses and loss adjustment expenses, net | 1,823,071 | 209,626 | |||||
| Other underwriting expenses | 1,855,102 | 2,252,055 | |||||
| TOTAL EXPENSES | 3,678,173 | 2,461,681 | |||||
| NET INVESTMENT INCOME | 571,463 | 461,772 | |||||
| INCOME FROM OPERATIONS | 41,206 | 1,792,694 | |||||
| INTEREST EXPENSE | — | 897,986 | |||||
| INCOME BEFORE PROVISION FOR INCOME TAXES | 41,206 | 894,708 | |||||
| PROVISION FOR INCOME TAXES | 101,394 | 305,491 | |||||
| NET (LOSS) INCOME | (60,188 | ) | 589,217 | ||||
| OTHER COMPREHENSIVE INCOME: | |||||||
| Unrealized holding gains on available-for-sale securities, net of income tax expense of $104,314 and $164,152 | 143,108 | 134,927 | |||||
| Reclassification adjustments for net realized (gain) loss included in net (loss) income | (50,671 | ) | 183,723 | ||||
| Total other comprehensive income | 92,437 | 318,650 | |||||
| COMPREHENSIVE INCOME | $ | 32,249 | $ | 907,867 | |||
| Members’ Equity | Accumulated Other Comprehensive Income (Loss) | Total Members’ Equity | |||||||||
| Balance, January 1, 2016 | $ | 11,531,843 | $ | (208,596 | ) | $ | 11,323,247 | ||||
| Subscription fees | 141 | — | 141 | ||||||||
| Net income | 589,217 | — | 589,217 | ||||||||
| Other comprehensive income | — | 318,650 | 318,650 | ||||||||
| Balance, December 31, 2016 | 12,121,201 | 110,054 | 12,231,255 | ||||||||
| Subscription fees | 141 | — | 141 | ||||||||
| Net loss | (60,188 | ) | — | (60,188 | ) | ||||||
| Other comprehensive income | — | 92,437 | 92,437 | ||||||||
| Reclassification of tax effects from accumulated other comprehensive income related to passage of TCJA | (39,885 | ) | 39,885 | — | |||||||
| Balance, December 31 2017 | $ | 12,021,269 | $ | 242,376 | $ | 12,263,645 | |||||
| 2017 | 2016 | ||||||
| CASH FLOWS FROM OPERATING ACTIVITIES: | |||||||
| Net (loss) income | $ | (60,188 | ) | $ | 589,217 | ||
| Adjustments to reconcile net (loss) income to net cash used in operating activities: | |||||||
| Deferred income taxes | 131,414 | (625,702 | ) | ||||
| Net realized (gain) loss on sales of investments | (50,671 | ) | 183,723 | ||||
| Amortization of bond premiums | 66,290 | 130,962 | |||||
| Changes in operating assets and liabilities: | |||||||
| Accrued investment income | (13,981 | ) | 67,158 | ||||
| Premiums receivable | 105,002 | 115,391 | |||||
| Reinsurance deposit | — | 2,200,689 | |||||
| Reinsurance recoverable | (65,575 | ) | (90,868 | ) | |||
| Income taxes recoverable | (125,986 | ) | 106,193 | ||||
| Unearned ceded premiums | 23,261 | (194,834 | ) | ||||
| Deferred acquisition costs | 37,353 | 49,604 | |||||
| Other assets | (9,391 | ) | (22,635 | ) | |||
| Liability for losses and loss adjustment expenses | (581,915 | ) | (2,545,259 | ) | |||
| Unearned premiums | (143,419 | ) | (134,987 | ) | |||
| Reinsurance payable | (61,082 | ) | (66,721 | ) | |||
| Accounts payable, accrued expenses, and other liabilities | (148,289 | ) | (395,252 | ) | |||
| Due to affiliates | (252,104 | ) | 90,996 | ||||
| NET CASH USED IN OPERATING ACTIVITIES | (1,149,281 | ) | (542,325 | ) | |||
| CASH FLOWS FROM INVESTING ACTIVITIES: | |||||||
| Investments: | |||||||
| Proceeds from sales and maturities | 5,489,626 | 11,732,597 | |||||
| Purchases | (10,580,515 | ) | (6,781,453 | ) | |||
| Other assets | (51,010 | ) | — | ||||
| NET CASH (USED IN) PROVIDED BY INVESTING ACTIVITIES | (5,141,899 | ) | 4,951,144 | ||||
| CASH FLOWS FROM FINANCING ACTIVITIES: | |||||||
| Subscription fees received | 141 | 141 | |||||
| NET CASH PROVIDED BY FINANCING ACTIVITIES | 141 | 141 | |||||
| NET CHANGE IN CASH AND CASH EQUIVALENTS | $ | (6,291,039 | ) | $ | 4,408,960 | ||
| CASH AND CASH EQUIVALENTS, beginning of year | 8,127,243 | 3,718,283 | |||||
| CASH AND CASH EQUIVALENTS, end of year | $ | 1,836,204 | $ | 8,127,243 | |||
| SUPPLEMENTAL DISCLOSURE OF CASH FLOW INFORMATION: | |||||||
| Interest paid for the year | $ | — | $ | 897,986 | |||
| Income taxes paid for the year | $ | 215,406 | $ | 825,000 | |||
| 1. | Organization and Operations: |
| 2. | Summary of Significant Accounting Policies and Principles: |
| 3. | Concentrations of Credit Risk: |
| 4. | Variable Interest Entity: |
| 5. | Investments: |
| • | Quoted prices for similar assets in active markets; |
| • | Quoted prices for identical or similar assets in nonactive markets (few transactions, limited information, noncurrent prices, high variability over time, etc.); |
| • | Inputs other than quoted prices that are observable for the asset (interest rates, yield curves, volatilities, default rates, etc.); |
| • | Inputs that are derived principally from or corroborated by other observable market data. |
| Amortized Cost/Cost | Gross Unrealized Gains | Gross Unrealized Losses | Fair Value | ||||||||||||
| December 31, 2017 | |||||||||||||||
| U.S. government | $ | 4,940,661 | $ | 147,753 | $ | 44,877 | $ | 5,043,537 | |||||||
| States, territories, and possessions | 200,490 | 15,866 | — | 216,356 | |||||||||||
| Subdivisions of states, territories, and possessions | 3,205,666 | 54,515 | 77,223 | 3,182,958 | |||||||||||
| Industrial and miscellaneous | 12,814,823 | 37,455 | 66,073 | 12,786,205 | |||||||||||
| Total bonds | 21,161,640 | 255,589 | 188,173 | 21,229,056 | |||||||||||
| Common stocks | 1,580,248 | 247,978 | 8,589 | 1,819,637 | |||||||||||
| $ | 22,741,888 | $ | 503,567 | $ | 196,762 | $ | 23,048,693 | ||||||||
| Amortized Cost/Cost | Gross Unrealized Gains | Gross Unrealized Losses | Fair Value | ||||||||||||
| December 31, 2016 | |||||||||||||||
| U.S. government | $ | 6,052,203 | $ | 196,185 | $ | 62,420 | $ | 6,185,968 | |||||||
| States, territories, and possessions | 302,045 | — | 5,353 | 296,692 | |||||||||||
| Subdivisions of states, territories, and possessions | 3,688,403 | 26,111 | 80,719 | 3,633,795 | |||||||||||
| Industrial and miscellaneous | 6,443,814 | 99,761 | 40,802 | 6,502,773 | |||||||||||
| Total bonds | 16,486,465 | 322,057 | 189,294 | 16,619,228 | |||||||||||
| Common stocks | 1,196,668 | 53,869 | 19,884 | 1,230,653 | |||||||||||
| $ | 17,683,133 | $ | 375,926 | $ | 209,178 | $ | 17,849,881 | ||||||||
| Amortized Cost/Carrying Value | Fair Value | ||||||
| Due in less than one year | $ | 2,126,658 | $ | 2,127,137 | |||
| Due after one year to five years | 10,716,159 | 10,758,992 | |||||
| Due after five years to ten years | 7,496,987 | 7,487,401 | |||||
| Due after ten years | 821,836 | 855,526 | |||||
| $ | 21,161,640 | $ | 21,229,056 | ||||
| 2017 | 2016 | ||||||
| Proceeds | $ | 5,489,626 | $ | 11,732,597 | |||
| Gross gains | 98,767 | 52,596 | |||||
| Gross losses | 48,096 | 236,319 | |||||
| 2017 | 2016 | ||||||
| Bonds | $ | 510,632 | $ | 656,342 | |||
| Cash and short-term investments | 26,662 | 24,180 | |||||
| Common stocks | 58,073 | 19,898 | |||||
| Limited partnership | 2,684 | — | |||||
| Net gain (loss) on sales of investments | 50,671 | (183,723 | ) | ||||
| 648,722 | 516,697 | ||||||
| Less investment expenses | 77,259 | 54,925 | |||||
| Net investment income | $ | 571,463 | $ | 461,772 | |||
| Less than 12 Months | |||||||
| Fair Value | Unrealized Losses | ||||||
| U.S. government | $ | 259,329 | $ | 1,404 | |||
| Subdivisions of states, territories, and possessions | 127,479 | 646 | |||||
| Industrial and miscellaneous | 6,919,636 | 53,723 | |||||
| Common stocks | 187,070 | 6,100 | |||||
| $ | 7,493,514 | $ | 61,873 | ||||
| Greater than 12 Months | |||||||
| Fair Value | Unrealized Losses | ||||||
| U.S. government | $ | 2,087,424 | $ | 43,473 | |||
| Subdivisions of states, territories, and possessions | 890,308 | 76,577 | |||||
| Industrial and miscellaneous | 1,707,035 | 12,350 | |||||
| Common stocks | 98,136 | 2,489 | |||||
| $ | 4,782,903 | $ | 134,889 | ||||
| Totals | |||||||
| Fair Value | Unrealized Losses | ||||||
| U.S. government | $ | 2,346,753 | $ | 44,877 | |||
| Subdivisions of states, territories, and possessions | 1,017,787 | 77,223 | |||||
| Industrial and miscellaneous | 8,626,671 | 66,073 | |||||
| Common stocks | 285,206 | 8,589 | |||||
| $ | 12,276,417 | $ | 196,762 | ||||
| Less than 12 Months | |||||||
| Fair Value | Unrealized Losses | ||||||
| U.S. government | $ | 2,338,279 | $ | 53,564 | |||
| States, territories, and possessions | 296,692 | 5,353 | |||||
| Subdivisions of states, territories, and possessions | 2,069,714 | 46,572 | |||||
| Industrial and miscellaneous | 1,458,496 | 14,600 | |||||
| Common stocks | 602,086 | 19,884 | |||||
| $ | 6,765,267 | $ | 139,973 | ||||
| Greater than 12 Months | |||||||
| Fair Value | Unrealized Losses | ||||||
| U.S. government | $ | 403,669 | $ | 8,856 | |||
| Subdivision of states, territories, and possessions | 116,822 | 34,147 | |||||
| Industrial and miscellaneous | 1,937,346 | 26,202 | |||||
| $ | 2,457,837 | $ | 69,205 | ||||
| Totals | |||||||
| Fair Value | Unrealized Losses | ||||||
| U.S. government | $ | 2,741,948 | $ | 62,420 | |||
| States, territories, and possessions | 296,692 | 5,353 | |||||
| Subdivision of states, territories, and possessions | 2,186,536 | 80,719 | |||||
| Industrial and miscellaneous | 3,395,842 | 40,802 | |||||
| Common stocks | 602,086 | 19,884 | |||||
| $ | 9,223,104 | $ | 209,178 | ||||
| Total | Level 1 | Level 2 | Level 3 | ||||||||||||
| U.S. government | $ | 5,043,537 | $ | — | $ | 5,043,537 | $ | — | |||||||
| States, territories, and possessions | 216,356 | — | 216,356 | — | |||||||||||
| Subdivisions of states, territories and possessions | 3,182,958 | — | 3,182,958 | — | |||||||||||
| Industrial and miscellaneous | 12,786,205 | — | 12,786,205 | — | |||||||||||
| Total bonds | 21,229,056 | — | 21,229,056 | — | |||||||||||
| Common stocks | 1,819,637 | 1,819,637 | — | — | |||||||||||
| $ | 23,048,693 | $ | 1,819,637 | $ | 21,229,056 | $ | — | ||||||||
| Total | Level 1 | Level 2 | Level 3 | ||||||||||||
| U.S. government | $ | 6,185,968 | $ | — | $ | 6,185,968 | $ | — | |||||||
| States, territories, and possessions | 296,692 | — | 296,692 | — | |||||||||||
| Subdivisions of states, territories and possessions | 3,633,795 | — | 3,633,795 | — | |||||||||||
| Industrial and miscellaneous | 6,502,773 | — | 6,502,773 | — | |||||||||||
| Total bonds | 16,619,228 | — | 16,619,228 | — | |||||||||||
| Common stocks | 1,230,653 | 1,230,653 | — | — | |||||||||||
| $ | 17,849,881 | $ | 1,230,653 | $ | 16,619,228 | $ | — | ||||||||
| 6. | Deferred Acquisition Costs: |
| 2017 | 2016 | ||||||
| Balance, beginning of year | $ | 422,310 | $ | 471,914 | |||
| Amount capitalized during the year | 1,370,230 | 1,473,025 | |||||
| Amount amortized during the year | 1,407,583 | 1,522,629 | |||||
| Balance, end of year | $ | 384,957 | $ | 422,310 | |||
| 7. | Reinsurance: |
| 2017 | 2016 | ||||||
| Premiums written: | |||||||
| Direct | $ | 3,647,265 | $ | 4,172,025 | |||
| Ceded | 619,507 | 709,243 | |||||
| Premiums written, net of reinsurance | $ | 3,027,758 | $ | 3,462,782 | |||
| Premiums earned: | |||||||
| Direct | $ | 3,790,684 | $ | 4,307,012 | |||
| Ceded | 642,768 | 514,409 | |||||
| Premiums earned, net of reinsurance | $ | 3,147,916 | $ | 3,792,603 | |||
| Losses and loss adjustment expenses incurred: | |||||||
| Direct | $ | 1,888,646 | $ | 300,494 | |||
| Ceded | 65,575 | 90,868 | |||||
| Losses and loss adjustment expenses incurred, net of reinsurance | $ | 1,823,071 | $ | 209,626 | |||
| 8. | Losses and Loss Adjustment Expenses: |
| 2017 | 2016 | ||||||
| Losses and loss adjustment expenses, beginning of year - gross | $ | 12,343,048 | $ | 14,888,307 | |||
| Less: Reinsurance recoverable, beginning of year | 90,868 | — | |||||
| Losses and loss expense reserves, beginning of year - net | 12,252,180 | 14,888,307 | |||||
| Incurred related to: | |||||||
| Current year | 2,163,071 | 2,541,626 | |||||
| Prior years | (340,000 | ) | (2,332,000 | ) | |||
| Total incurred | 1,823,071 | 209,626 | |||||
| Paid related to: | |||||||
| Current year | 29,623 | 257,951 | |||||
| Prior years | 2,440,938 | 2,587,802 | |||||
| Total paid | 2,470,561 | 2,845,753 | |||||
| Losses and loss adjustment expenses, end of year - net | 11,604,690 | 12,252,180 | |||||
| Add: Reinsurance recoverable, end of year | 156,443 | 90,868 | |||||
| Losses and loss adjustment expenses, end of year - gross | $ | 11,761,133 | $ | 12,343,048 | |||
| Incurred Losses and Loss Adjustment Expenses, Net of Reinsurance (in thousands) | As of December 31, 2017 | ||||||||||||||||||||||||||||||||||
| Accident Year | 2008 | 2009 | 2010 | 2011 | 2012 | 2013 | 2014 | 2015 | 2016 | 2017 | Total of Incurred-But-Not-Reported Liabilities Plus Expected Development on Reported Claims | Cumulative Number of Reported Claims | |||||||||||||||||||||||
| 2008 | $ | 3,610 | $ | 2,783 | $ | 2,293 | $ | 1,389 | $ | 1,117 | $ | 1,035 | $ | 1,037 | $ | 886 | $ | 770 | $ | 875 | $ | 29 | 23 | ||||||||||||
| 2009 | 4,299 | 3,801 | 4,603 | 4,624 | 4,687 | 5,501 | 6,253 | 6,663 | 7,421 | 90 | 37 | ||||||||||||||||||||||||
| 2010 | 5,262 | 4,314 | 4,306 | 4,229 | 3,517 | 3,667 | 3,048 | 3,224 | 54 | 34 | |||||||||||||||||||||||||
| 2011 | 4,736 | 3,773 | 3,664 | 4,352 | 4,203 | 4,772 | 4,454 | 271 | 34 | ||||||||||||||||||||||||||
| 2012 | 4,170 | 3,176 | 3,314 | 3,400 | 2,927 | 2,914 | 328 | 22 | |||||||||||||||||||||||||||
| 2013 | 3,388 | 3,100 | 2,750 | 2,063 | 1,183 | 235 | 18 | ||||||||||||||||||||||||||||
| 2014 | 3,551 | 3,150 | 2,247 | 1,137 | 222 | 20 | |||||||||||||||||||||||||||||
| 2015 | 3,452 | 2,918 | 3,002 | 908 | 27 | ||||||||||||||||||||||||||||||
| 2016 | 2,800 | 3,486 | 1,229 | 26 | |||||||||||||||||||||||||||||||
| 2017 | 2,026 | 1,604 | 10 | ||||||||||||||||||||||||||||||||
| $ | 29,722 | ||||||||||||||||||||||||||||||||||
| Cumulative Losses and Loss Adjustment Expenses Paid, Net of Reinsurance (in thousands) | |||||||||||||||||||||||||||||||||||
| Accident Year | 2008 | 2009 | 2010 | 2011 | 2012 | 2013 | 2014 | 2015 | 2016 | 2017 | |||||||||||||||||||||||||
| 2008 | $ | 21 | $ | (1,085 | ) | $ | (817 | ) | $ | (50 | ) | $ | 341 | $ | 481 | $ | 519 | $ | 617 | $ | 722 | $ | 739 | ||||||||||||
| 2009 | 52 | 315 | 1,112 | 2,122 | 3,246 | 4,449 | 4,620 | 6,075 | 6,695 | ||||||||||||||||||||||||||
| 2010 | 167 | 503 | 1,631 | 2,363 | 1,802 | 2,392 | 2,611 | 2,724 | |||||||||||||||||||||||||||
| 2011 | 111 | 390 | 1,342 | 1,232 | 3,155 | 3,688 | 3,802 | ||||||||||||||||||||||||||||
| 2012 | 496 | 657 | 1,496 | 2,166 | 1,984 | 2,361 | |||||||||||||||||||||||||||||
| 2013 | 70 | 324 | 584 | 445 | 573 | ||||||||||||||||||||||||||||||
| 2014 | 90 | 367 | 419 | 562 | |||||||||||||||||||||||||||||||
| 2015 | 63 | 293 | 827 | ||||||||||||||||||||||||||||||||
| 2016 | 239 | 536 | |||||||||||||||||||||||||||||||||
| 2017 | 26 | ||||||||||||||||||||||||||||||||||
| $ | 18,845 | ||||||||||||||||||||||||||||||||||
| All outstanding liabilities before 2008, net of reinsurance | 506 | ||||||||||||||||||||||||||||||||||
| Liabilities for losses and loss adjustment expenses, net of reinsurance | $ | 11,383 | |||||||||||||||||||||||||||||||||
| 2017 | |||
| Net outstanding liabilities for losses and loss adjustment expenses: | |||
| Medical professional | $ | 11,382,954 | |
| Liabilities for losses and loss adjustment expenses, net of reinsurance | 11,382,954 | ||
| Reinsurance recoverable on unpaid claims: | |||
| Medical professional | 156,443 | ||
| Total reinsurance recoverable on unpaid claims | 156,443 | ||
| Unallocated loss adjustment expenses | 221,736 | ||
| Total gross liability for losses and loss adjustment expenses | $ | 11,761,133 | |
| Average Annual Percentage Payout of Incurred Losses by Age, Net of Reinsurance | ||||||||||||||||||||||||||||||
| Accident Year | Year 1 | Year 2 | Year 3 | Year 4 | Year 5 | Year 6 | Year 7 | Year 8 | Year 9 | Year 10 | ||||||||||||||||||||
| Medical professional | 5.2 | % | (4.3 | )% | 21.4 | % | 20.8 | % | 15.0 | % | 15.1 | % | 4.0 | % | 11.4 | % | 10.2 | % | 1.9 | % | ||||||||||
| 9. | Income Taxes: |
| 2017 | 2016 | ||||||
| Current provision | $ | (30,020 | ) | $ | 931,193 | ||
| Deferred tax provision | 131,414 | (625,702 | ) | ||||
| $ | 101,394 | $ | 305,491 | ||||
| 2017 | 2016 | ||||||
| Expected tax provision at federal statutory rate | $ | 14,010 | $ | 304,201 | |||
| Permanent and other items | 5,242 | 159,258 | |||||
| Deferred adjustments | (15,955 | ) | (157,968 | ) | |||
| Alternative minimum tax | 4,262 | — | |||||
| Change in deferred income taxes due to change in enacted tax rates | 93,835 | — | |||||
| Net income tax provision | $ | 101,394 | $ | 305,491 | |||
| 2017 | 2016 | ||||||
| Deferred tax assets: | |||||||
| Discount of unearned premiums | $ | 60,382 | $ | 105,933 | |||
| Discount of advance premiums | 25,263 | 60,555 | |||||
| Discount of losses and loss adjustment expenses | 177,136 | 278,219 | |||||
| Capital loss carryforward | 41,774 | 86,184 | |||||
| Guaranty fund assessment | 5,692 | — | |||||
| Total deferred tax assets | 310,247 | 530,891 | |||||
| Deferred tax liabilities: | |||||||
| Deferred acquisition costs | 80,841 | 143,585 | |||||
| TCJA transitional adjustment | 12,425 | — | |||||
| Other items | 410 | — | |||||
| Unrealized gain on investments | 64,993 | 56,694 | |||||
| Total deferred tax liabilities | 158,669 | 200,279 | |||||
| Net deferred tax asset | $ | 151,578 | $ | 330,612 | |||
| 10. | Related Party Transactions: |
| 11. | Assessments: |
| 12. | Statutory Information: |
| 2017 | 2016 | ||||||
| Statutory net income | $ | 170,559 | $ | 530,760 | |||
| Statutory surplus and other funds | 12,037,248 | 12,028,695 | |||||
| 2018 | 2017 | ||||||
| Statutory surplus and other funds prescribed by the Department | $ | 12,037,248 | $ | 12,028,695 | |||
| State prescribed practices: | |||||||
| Unearned management fees | (252,313 | ) | (286,523 | ) | |||
| Statutory surplus and other funds per NAIC statutory accounting practices | $ | 11,784,935 | $ | 11,742,172 | |||
| 13. | Subsequent Events: |
| 2018 | 2017 | ||||||
| (Unaudited) | |||||||
| ASSETS | |||||||
| Investments in available-for-sale securities, at fair value: | |||||||
| Bonds (Amortized cost of $19,879,355 and $17,886,058) | $ | 19,448,807 | $ | 18,049,122 | |||
| Common stocks (Cost of $1,702,254 and $1,451,066) | 1,919,824 | 1,614,086 | |||||
| Short-term investments | 149,856 | — | |||||
| Other invested assets | 235,407 | 125,000 | |||||
| Total investments | 21,753,894 | 19,788,208 | |||||
| Cash and cash equivalents | 1,208,971 | 5,209,253 | |||||
| Accrued investment income | 134,186 | 111,000 | |||||
| Premiums receivable | 64,491 | 36,958 | |||||
| Reinsurance recoverable | 284,563 | 282,127 | |||||
| Income taxes recoverable | 19,744 | 390,085 | |||||
| Unearned ceded premiums | 89,068 | 258,022 | |||||
| Deferred acquisition costs | 551,383 | 511,079 | |||||
| Deferred income taxes | 189,438 | 172,007 | |||||
| Other assets | 222,388 | 113,898 | |||||
| TOTAL ASSETS | $ | 24,518,126 | $ | 26,872,637 | |||
| LIABILITIES AND MEMBERS’ EQUITY | |||||||
| LIABILITIES: | |||||||
| Losses and loss adjustment expenses | $ | 10,305,592 | $ | 12,021,941 | |||
| Unearned premiums | 2,013,618 | 2,074,343 | |||||
| Reinsurance payable | 69,826 | 171,027 | |||||
| Accounts payable, accrued expenses, and other liabilities | 161,302 | 248,454 | |||||
| Due to affiliates | 37,200 | 86,232 | |||||
| TOTAL LIABILITIES | 12,587,538 | 14,601,997 | |||||
| MEMBERS’ EQUITY | 11,930,588 | 12,270,640 | |||||
| TOTAL LIABILITIES AND MEMBERS’ EQUITY | $ | 24,518,126 | $ | 26,872,637 | |||
| 2018 | 2017 | ||||||
| (Unaudited) | |||||||
| REVENUES: | |||||||
| Net premium earned | $ | 2,366,373 | $ | 2,417,910 | |||
| TOTAL REVENUES | 2,366,373 | 2,417,910 | |||||
| EXPENSES: | |||||||
| Losses and loss adjustment expenses, net | 1,265,303 | 1,495,332 | |||||
| Other underwriting expenses | 1,484,759 | 1,457,426 | |||||
| TOTAL EXPENSES | 2,750,062 | 2,952,758 | |||||
| NET INVESTMENT INCOME | 548,086 | 427,489 | |||||
| INCOME (LOSS) BEFORE PROVISION FOR INCOME TAXES | 164,397 | (107,359 | ) | ||||
| PROVISION FOR INCOME TAXES | 79,545 | (41,442 | ) | ||||
| NET INCOME | 84,852 | (65,917 | ) | ||||
| OTHER COMPREHENSIVE (LOSS) INCOME: | |||||||
| Unrealized holding (losses) gains on available-for-sale securities, net of income tax benefit (expense) of $111,089 and $(54,175) | (361,808 | ) | 165,422 | ||||
| Reclassification adjustments for net realized gain included in net income | (56,101 | ) | (60,261 | ) | |||
| Total other comprehensive (loss) income | (417,909 | ) | 105,161 | ||||
| COMPREHENSIVE (LOSS) INCOME | $ | (333,057 | ) | $ | 39,244 | ||
| Contributed Capital | Retained Earnings | Accumulated Other Comprehensive Income (Loss) | Total Members' Equity | ||||||||||||
| Balance, January 1, 2017 | $ | 8,050,709 | $ | 4,070,492 | $ | 110,054 | $ | 12,231,255 | |||||||
| Subscription fees | 141 | — | — | 141 | |||||||||||
| Net loss | — | (65,917 | ) | — | (65,917 | ) | |||||||||
| Other comprehensive income | — | — | 105,161 | 105,161 | |||||||||||
| Balance, September 30, 2017 (unaudited) | $ | 8,050,850 | $ | 4,004,575 | $ | 215,215 | $ | 12,270,640 | |||||||
| Balance, January 1, 2018 | $ | 8,050,850 | $ | 3,970,359 | $ | 242,376 | $ | 12,263,645 | |||||||
| Net income | — | 84,852 | — | 84,852 | |||||||||||
| Other comprehensive loss | — | — | (417,909 | ) | (417,909 | ) | |||||||||
| Balance, September 30, 2018 (unaudited) | $ | 8,050,850 | $ | 4,055,211 | $ | (175,533 | ) | $ | 11,930,588 | ||||||
| 2018 | 2017 | ||||||
| (Unaudited) | |||||||
| CASH FLOWS FROM OPERATING ACTIVITIES: | |||||||
| Net income (loss) | $ | 84,852 | $ | (65,917 | ) | ||
| Adjustments to reconcile net income (loss) to net cash used in operating activities: | |||||||
| Deferred income taxes | 73,793 | 104,430 | |||||
| Net realized gain on sales of investments | (56,101 | ) | (60,261 | ) | |||
| Amortization of bond premiums | 32,522 | 52,350 | |||||
| Amortization of other assets | 11,449 | — | |||||
| Changes in operating assets and liabilities: | |||||||
| Accrued investment income | 2,668 | 11,873 | |||||
| Premiums receivable | 289,302 | 421,837 | |||||
| Reinsurance recoverable | (128,120 | ) | (191,259 | ) | |||
| Income taxes recoverable | 169,489 | (326,838 | ) | ||||
| Unearned ceded premiums | 82,505 | (63,188 | ) | ||||
| Deferred acquisition costs | (166,426 | ) | (88,769 | ) | |||
| Other assets | (142,928 | ) | (55,158 | ) | |||
| Liability for losses and loss adjustment expenses | (1,455,541 | ) | (321,107 | ) | |||
| Unearned premiums | 404,366 | 321,672 | |||||
| Reinsurance payable | 59,165 | 99,284 | |||||
| Accounts payable, accrued expenses, and other liabilities | (761,263 | ) | (821,836 | ) | |||
| Due to affiliates | (40,270 | ) | (243,342 | ) | |||
| NET CASH USED IN OPERATING ACTIVITIES | (1,540,538 | ) | (1,226,229 | ) | |||
| CASH FLOWS FROM INVESTING ACTIVITIES: | |||||||
| Investments: | |||||||
| Proceeds from sales and maturities | 4,717,398 | 5,148,036 | |||||
| Purchases | (3,796,220 | ) | (6,803,833 | ) | |||
| Other assets | (7,873 | ) | (36,105 | ) | |||
| NET CASH PROVIDED BY (USED IN) INVESTING ACTIVITIES | 913,305 | (1,691,902 | ) | ||||
| CASH FLOWS FROM FINANCING ACTIVITIES: | |||||||
| Subscription fees received | — | 141 | |||||
| NET CASH PROVIDED BY FINANCING ACTIVITIES | — | 141 | |||||
| NET CHANGE IN CASH AND CASH EQUIVALENTS | $ | (627,233 | ) | $ | (2,917,990 | ) | |
| CASH AND CASH EQUIVALENTS, beginning of period | 1,836,204 | 8,127,243 | |||||
| CASH AND CASH EQUIVALENTS, end of period | $ | 1,208,971 | $ | 5,209,253 | |||
| SUPPLEMENTAL DISCLOSURE OF CASH FLOW INFORMATION: | |||||||
| Income taxes paid for the period | $ | — | $ | 300,406 | |||
| 1. | Organization and Operations: |
| 2. | Summary of Significant Accounting Policies and Principles: |
| 3. | Concentrations of Credit Risk: |
| 4. | Variable Interest Entity: |
| 5. | Investments: |
| • | Quoted prices for similar assets in active markets; |
| • | Quoted prices for identical or similar assets in nonactive markets (few transactions, limited information, noncurrent prices, high variability over time, etc.); |
| • | Inputs other than quoted prices that are observable for the asset (interest rates, yield curves, volatilities, default rates, etc.); |
| • | Inputs that are derived principally from or corroborated by other observable market data. |
| Amortized Cost/Cost | Gross Unrealized Gains | Gross Unrealized Losses | Fair Value | ||||||||||||
| September 30, 2018 | |||||||||||||||
| U.S. government | $ | 3,414,679 | $ | 55,894 | $ | 63,396 | $ | 3,407,177 | |||||||
| States, territories, and possessions | 200,474 | 3,132 | — | 203,606 | |||||||||||
| Subdivisions of states, territories, and possessions | 2,518,718 | 18,073 | 48,232 | 2,488,559 | |||||||||||
| Industrial and miscellaneous | 13,745,484 | 8,624 | 404,643 | 13,349,465 | |||||||||||
| Total bonds | 19,879,355 | 85,723 | 516,271 | 19,448,807 | |||||||||||
| Common stocks | 1,702,254 | 255,519 | 37,949 | 1,919,824 | |||||||||||
| $ | 21,581,609 | $ | 341,242 | $ | 554,220 | $ | 21,368,631 | ||||||||
| Amortized Cost/Cost | Gross Unrealized Gains | Gross Unrealized Losses | Fair Value | ||||||||||||
| September 30, 2017 | |||||||||||||||
| U.S. government | $ | 5,112,397 | $ | 174,097 | $ | 34,604 | $ | 5,251,890 | |||||||
| States, territories, and possessions | 200,495 | 16,117 | — | 216,612 | |||||||||||
| Subdivisions of states, territories, and possessions | 3,213,045 | 62,273 | 72,065 | 3,203,253 | |||||||||||
| Industrial and miscellaneous | 9,360,121 | 52,076 | 34,830 | 9,377,367 | |||||||||||
| Total bonds | 17,886,058 | 304,563 | 141,499 | 18,049,122 | |||||||||||
| Common stocks | 1,451,066 | 187,399 | 24,379 | 1,614,086 | |||||||||||
| $ | 19,337,124 | $ | 491,962 | $ | 165,878 | $ | 19,663,208 | ||||||||
| Amortized Cost/Carrying Value | Fair Value | ||||||
| Due in less than one year | $ | 1,520,123 | $ | 1,508,590 | |||
| Due after one year to five years | 10,030,869 | 9,884,177 | |||||
| Due after five years to ten years | 6,863,007 | 6,602,896 | |||||
| Due after ten years | 1,465,356 | 1,453,144 | |||||
| $ | 19,879,355 | $ | 19,448,807 | ||||
| 2018 | 2017 | ||||||
| Proceeds | $ | 4,717,398 | $ | 5,148,036 | |||
| Gross gains | 83,090 | 94,854 | |||||
| Gross losses | 26,989 | 34,593 | |||||
| 2018 | 2017 | ||||||
| Bonds | $ | 460,501 | $ | 373,694 | |||
| Cash and short-term investments | 7,316 | 22,755 | |||||
| Common stocks | 47,881 | 34,960 | |||||
| Limited partnerships | 1,081 | — | |||||
| Net gain on sales of investments | 56,101 | 60,261 | |||||
| 572,880 | 491,670 | ||||||
| Less investment expenses | 24,794 | 64,181 | |||||
| Net investment income | $ | 548,086 | $ | 427,489 | |||
| Less than 12 Months | |||||||
| Fair Value | Unrealized Losses | ||||||
| U.S. government | $ | 582,176 | $ | 3,104 | |||
| Subdivisions of states, territories, and possessions | 1,345,403 | 21,073 | |||||
| Industrial and miscellaneous | 7,570,750 | 215,015 | |||||
| Common stocks | 251,181 | 15,146 | |||||
| $ | 9,749,510 | $ | 254,338 | ||||
| Greater than 12 Months | |||||||
| Fair Value | Unrealized Losses | ||||||
| U.S. government | $ | 1,497,604 | $ | 60,292 | |||
| Subdivisions of states, territories, and possessions | 371,858 | 27,159 | |||||
| Industrial and miscellaneous | 4,071,274 | 189,628 | |||||
| Common stocks | 222,651 | 22,803 | |||||
| $ | 6,163,387 | $ | 299,882 | ||||
| Totals | |||||||
| Fair Value | Unrealized Losses | ||||||
| U.S. government | $ | 2,079,780 | $ | 63,396 | |||
| Subdivisions of states, territories, and possessions | 1,717,261 | 48,232 | |||||
| Industrial and miscellaneous | 11,642,024 | 404,643 | |||||
| Common stocks | 473,832 | 37,949 | |||||
| $ | 15,912,897 | $ | 554,220 | ||||
| Less than 12 Months | |||||||
| Fair Value | Unrealized Losses | ||||||
| U.S. government | $ | 1,874,639 | $ | 28,583 | |||
| Subdivisions of states, territories, and possessions | 449,594 | 1,232 | |||||
| Industrial and miscellaneous | 4,088,446 | 22,978 | |||||
| Common stocks | 273,648 | 20,983 | |||||
| $ | 6,686,327 | $ | 73,776 | ||||
| Greater than 12 Months | |||||||
| Fair Value | Unrealized Losses | ||||||
| U.S. government | $ | 462,256 | $ | 6,021 | |||
| Subdivision of states, territories, and possessions | 80,080 | 70,833 | |||||
| Industrial and miscellaneous | 790,724 | 11,852 | |||||
| Common stocks | 25,212 | 3,396 | |||||
| $ | 1,358,272 | $ | 92,102 | ||||
| Totals | |||||||
| Fair Value | Unrealized Losses | ||||||
| U.S. government | $ | 2,336,895 | $ | 34,604 | |||
| Subdivision of states, territories, and possessions | 529,674 | 72,065 | |||||
| Industrial and miscellaneous | 4,879,170 | 34,830 | |||||
| Common stocks | 298,860 | 24,379 | |||||
| $ | 8,044,599 | $ | 165,878 | ||||
| Total | Level 1 | Level 2 | Level 3 | ||||||||||||
| U.S. government | $ | 3,407,177 | $ | — | $ | 3,407,177 | $ | — | |||||||
| States, territories, and possessions | 203,606 | — | 203,606 | — | |||||||||||
| Subdivisions of states, territories and possessions | 2,488,559 | — | 2,488,559 | — | |||||||||||
| Industrial and miscellaneous | 13,349,465 | — | 13,349,465 | — | |||||||||||
| Total bonds | 19,448,807 | — | 19,448,807 | — | |||||||||||
| Common stocks | 1,919,824 | 1,919,824 | — | — | |||||||||||
| $ | 21,368,631 | $ | 1,919,824 | $ | 19,448,807 | $ | — | ||||||||
| Total | Level 1 | Level 2 | Level 3 | ||||||||||||
| U.S. government | $ | 5,251,890 | $ | — | $ | 5,251,890 | $ | — | |||||||
| States, territories, and possessions | 216,612 | — | 216,612 | — | |||||||||||
| Subdivisions of states, territories and possessions | 3,203,253 | — | 3,203,253 | — | |||||||||||
| Industrial and miscellaneous | 9,377,367 | — | 9,377,367 | — | |||||||||||
| Total bonds | 18,049,122 | — | 18,049,122 | — | |||||||||||
| Common stocks | 1,614,086 | 1,614,086 | — | — | |||||||||||
| $ | 19,663,208 | $ | 1,614,086 | $ | 18,049,122 | $ | — | ||||||||
| 6. | Deferred Acquisition Costs: |
| 2018 | 2017 | ||||||
| Balance, beginning of period | $ | 384,957 | $ | 422,310 | |||
| Amount capitalized during the period | 1,138,511 | 1,204,055 | |||||
| Amount amortized during the period | 972,085 | 1,115,286 | |||||
| Balance, end of period | $ | 551,383 | $ | 511,079 | |||
| 7. | Reinsurance: |
| 2018 | 2017 | ||||||
| Premiums written: | |||||||
| Direct | $ | 3,028,368 | $ | 3,223,934 | |||
| Ceded | 175,124 | 547,540 | |||||
| Premiums written, net of reinsurance | $ | 2,853,244 | $ | 2,676,394 | |||
| Premiums earned: | |||||||
| Direct | $ | 2,624,002 | $ | 2,902,262 | |||
| Ceded | 257,629 | 484,352 | |||||
| Premiums earned, net of reinsurance | $ | 2,366,373 | $ | 2,417,910 | |||
| Losses and loss adjustment expenses incurred: | |||||||
| Direct | $ | 1,393,423 | $ | 1,686,591 | |||
| Ceded | 128,120 | 191,259 | |||||
| Losses and loss adjustment expenses incurred, net of reinsurance | $ | 1,265,303 | $ | 1,495,332 | |||
| 8. | Losses and Loss Adjustment Expenses: |
| 2018 | 2017 | ||||||
| Losses and loss adjustment expenses, beginning of period - gross | $ | 11,761,133 | $ | 12,343,048 | |||
| Less: Reinsurance recoverable, beginning of period | 156,443 | 90,868 | |||||
| Losses and loss adjustment expenses, beginning of period - net | 11,604,690 | 12,252,180 | |||||
| Incurred related to: | |||||||
| Current period | 1,548,352 | 1,716,242 | |||||
| Prior periods | (283,049 | ) | (220,910 | ) | |||
| Total incurred | 1,265,303 | 1,495,332 | |||||
| Paid related to: | |||||||
| Current period | 73,330 | 49,142 | |||||
| Prior periods | 2,775,634 | 1,958,556 | |||||
| Total paid | 2,848,964 | 2,007,698 | |||||
| Losses and loss adjustment expenses, end of period - net | 10,021,029 | 11,739,814 | |||||
| Add: Reinsurance recoverable, end of period | 284,563 | 282,127 | |||||
| Losses and loss adjustment expenses, end of period - gross | $ | 10,305,592 | $ | 12,021,941 | |||
| 9. | Income Taxes: |
| 2018 | 2017 | ||||||
| Current provision | $ | 5,752 | $ | (145,872 | ) | ||
| Deferred tax provision | 73,793 | 104,430 | |||||
| $ | 79,545 | $ | (41,442 | ) | |||
| 2018 | 2017 | ||||||
| Expected tax provision at federal statutory rate | $ | 34,523 | $ | (36,502 | ) | ||
| Permanent and other items | 21,583 | 11,550 | |||||
| Deferred adjustments | 23,439 | (16,490 | ) | ||||
| Net income tax provision | $ | 79,545 | $ | (41,442 | ) | ||
| 2018 | 2017 | ||||||
| Deferred tax assets: | |||||||
| Discount of unearned premiums | $ | 80,831 | $ | 123,510 | |||
| Discount of advance premiums | 791 | 854 | |||||
| Discount of losses and loss adjustment expenses | 153,493 | 266,584 | |||||
| Capital loss carryforward | 31,050 | 65,695 | |||||
| Unrealized loss on investments | 46,660 | — | |||||
| Guaranty fund assessment | 4,540 | — | |||||
| Total deferred tax assets | 317,365 | 456,643 | |||||
| Deferred tax liabilities: | |||||||
| Deferred acquisition costs | 115,790 | 173,767 | |||||
| TCJA transitional adjustment | 11,260 | — | |||||
| Other items | 877 | — | |||||
| Unrealized gain on investments | — | 110,869 | |||||
| Total deferred tax liabilities | 127,927 | 284,636 | |||||
| Net deferred tax asset | $ | 189,438 | $ | 172,007 | |||
| 10. | Related Party Transactions: |
| 11. | Assessments: |
| 12. | Statutory Information: |
| 2018 | 2017 | ||||||
| Statutory net income | $ | 239,542 | $ | 138,219 | |||
| Statutory surplus and other funds | 12,097,689 | 12,029,390 | |||||
| 2018 | 2017 | ||||||
| Statutory surplus and other funds prescribed by the Department | $ | 12,097,689 | $ | 12,029,390 | |||
| State prescribed practices: | |||||||
| Unearned management fees | (353,405 | ) | (379,444 | ) | |||
| Statutory surplus and other funds per NAIC statutory accounting practices | $ | 11,744,284 | $ | 11,649,946 | |||
| 13. | Subsequent Events: |