Exhibit c(2)
Project Padlock
Board Discussion Materials Goldman Sachs & Co. LLC
May 23, 2022
INVESTMENT BANKING DIVISION
Disclaimer
INVESTMENT BANKING DIVISION
These materials have been prepared and are provided by Goldman Sachs on a confidential basis solely for the information and assistance of the Board of Directors (the “Board”), the Transaction Committee of the Board, and senior management of Corgi (the “Company”) in connection with their consideration of the matters referred to herein. These materials and Goldman Sachs’ presentation relating to these materials (the “Confidential Information”) may not be disclosed to any third party or circulated or referred to publicly or used for or relied upon for any other purpose without the prior written consent of Goldman Sachs. The Confidential Information was not prepared with a view to public disclosure or to conform to any disclosure standards under any state, federal or international securities laws or other laws, rules or regulations, and Goldman Sachs does not take any responsibility for the use of the Confidential Information by persons other than those set forth above. Notwithstanding anything in this Confidential Information to the contrary, the Company may disclose to any person the US federal income and state income tax treatment and tax structure of any transaction described herein and all materials of any kind (including tax opinions and other tax analyses) that are provided to the Company relating to such tax treatment and tax structure, without Goldman Sachs imposing any limitation of any kind. The Confidential Information has been prepared by the Investment Banking Division of Goldman Sachs and is not a product of its research department.
Goldman Sachs and its affiliates are engaged in advisory, underwriting and financing, principal investing, sales and trading, research, investment management and other financial and non-financial activities and services for various persons and entities. Goldman Sachs and its affiliates and employees, and funds or other entities they manage or in which they invest or have other economic interests or with which they co-invest, may at any time purchase, sell, hold or vote long or short positions and investments in securities, derivatives, loans, commodities, currencies, credit default swaps and other financial instruments of the Company, any other party to any transaction and any of their respective affiliates or any currency or commodity that may be involved in any transaction. Goldman Sachs’ investment banking division maintains regular, ordinary course client service dialogues with clients and potential clients to review events, opportunities, and conditions in particular sectors and industries and, in that connection, Goldman Sachs may make reference to the Company, but Goldman Sachs will not disclose any confidential information received from the Company.
The Confidential Information has been prepared based on historical financial information, forecasts and other information obtained by Goldman Sachs from publicly available sources, the management of the Company or other sources (approved for our use by the Company in the case of information from management and non-public information). In preparing the Confidential Information, Goldman Sachs has relied upon and assumed, without assuming any responsibility for independent verification, the accuracy and completeness of all of the financial, legal, regulatory, tax, accounting and other information provided to, discussed with or reviewed by us, and Goldman Sachs does not assume any liability for any such information. Goldman Sachs does not provide accounting, tax, legal or regulatory advice.
Goldman Sachs has not made an independent evaluation or appraisal of the assets and liabilities (including any contingent, derivative or other off-balance sheet assets and liabilities) of the Company or any other party to any transaction or any of their respective affiliates and has no obligation to evaluate the solvency of the Company or any other party to any transaction under any state or federal laws relating to bankruptcy, insolvency or similar matters. The analyses contained in the Confidential Information do not purport to be appraisals nor do they necessarily reflect the prices at which businesses or securities actually may be sold or purchased. Goldman Sachs’ role in any due diligence review is limited solely to performing such a review as it shall deem necessary to support its own advice and analysis and shall not be on behalf of the Company. Analyses based upon forecasts of future results are not necessarily indicative of actual future results, which may be significantly more or less favorable than suggested by these analyses, and Goldman Sachs does not assume responsibility if future results are materially different from those forecast.
The Confidential Information does not address the underlying business decision of the Company to engage in any transaction, or the relative merits of any transaction or strategic alternative referred to herein as compared to any other transaction or alternative that may be available to the Company. The Confidential Information is necessarily based on economic, monetary, market and other conditions as in effect on, and the information made available to Goldman Sachs as of, the date of such Confidential Information and Goldman Sachs assumes no responsibility for updating or revising the Confidential Information based on circumstances, developments or events occurring after such date. The Confidential Information does not constitute any opinion, nor does the Confidential Information constitute a recommendation to the Board, any security holder of the Company or any other person as to how to vote or act with respect to any transaction or any other matter. The Confidential Information, including this disclaimer, is subject to, and governed by, any written agreement between the Company, the Board and/or any committee thereof, on the one hand, and Goldman Sachs, on the other hand. The Confidential Information does not address, nor does Goldman Sachs express any view as to, the potential effects of volatility in the credit, financial and stock markets on the Company, any other party to any transaction or any transaction.
1
Topics for Discussion
INVESTMENT BANKING DIVISION
1 Transaction Overview
2 Public Market Perspectives on Corgi 3 Overview of Corgi Management Projections 4 Illustrative Valuation Analysis A Appendix A: Supplemental Materials
Topics for Discussion
INVESTMENT BANKING DIVISION
1 Transaction Overview
2 Public Market Perspectives on Corgi 3 Overview of Corgi Management Projections 4 Illustrative Valuation Analysis A Appendix A: Supplemental Materials
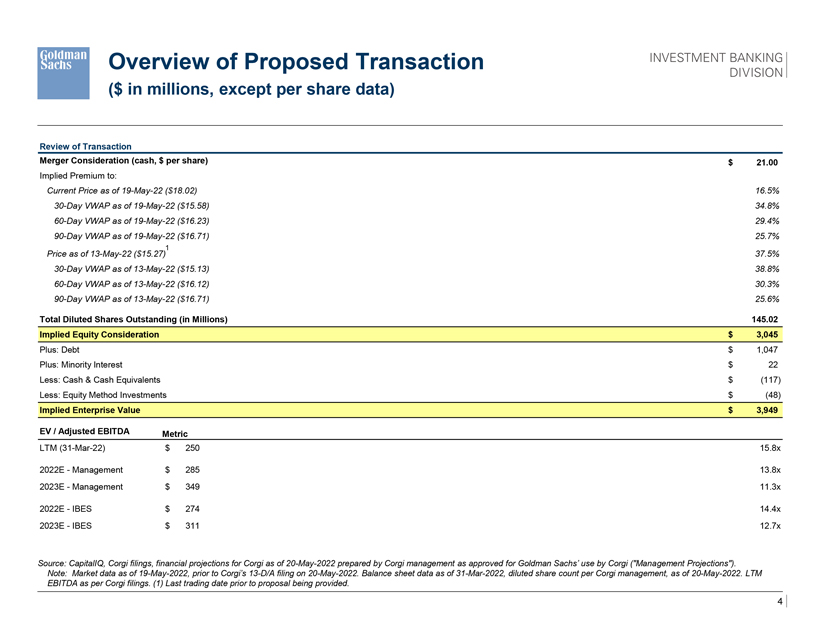
Overview of Proposed Transaction
($ in millions, except per share data)
INVESTMENT BANKING DIVISION
Review of Transaction
Merger Consideration (cash, $ per share) $ 21.00
Implied Premium to:
Current Price as of 19-May-22 ($18.02) 16.5% 30-Day VWAP as of 19-May-22 ($15.58) 34.8% 60-Day VWAP as of 19-May-22 ($16.23) 29.4% 90-Day VWAP as of 19-May-22 ($16.71) 25.7%
1
Price as of 13-May-22 ($15.27) 37.5% 30-Day VWAP as of 13-May-22 ($15.13) 38.8% 60-Day VWAP as of 13-May-22 ($16.12) 30.3% 90-Day VWAP as of 13-May-22 ($16.71) 25.6%
Total Diluted Shares Outstanding (in Millions) 145.02 Implied Equity Consideration $ 3,045
Plus: Debt $ 1,047 Plus: Minority Interest $ 22 Less: Cash & Cash Equivalents $ (117) Less: Equity Method Investments $ (48)
Implied Enterprise Value $ 3,949
EV / Adjusted EBITDA Metric
LTM (31-Mar-22) $ 250 15.8x
2022E—Management $ 285 13.8x 2023E—Management $ 349 11.3x
2022E—IBES $ 274 14.4x 2023E—IBES $ 311 12.7x
Source: CapitalIQ, Corgi filings, financial projections for Corgi as of 20-May-2022 prepared by Corgi management as approved for Goldman Sachs’ use by Corgi (“Management Projections”). Note: Market data as of 19-May-2022, prior to Corgi’s 13-D/A filing on 20-May-2022. Balance sheet data as of 31-Mar-2022, diluted share count per Corgi management, as of 20-May-2022. LTM
EBITDA as per Corgi filings. (1) Last trading date prior to proposal being provided.
4
Topics for Discussion
INVESTMENT BANKING DIVISION
1 Transaction Overview
2 Public Market Perspectives on Corgi 3 Overview of Corgi Management Projections 4 Illustrative Valuation Analysis A Appendix A: Supplemental Materials
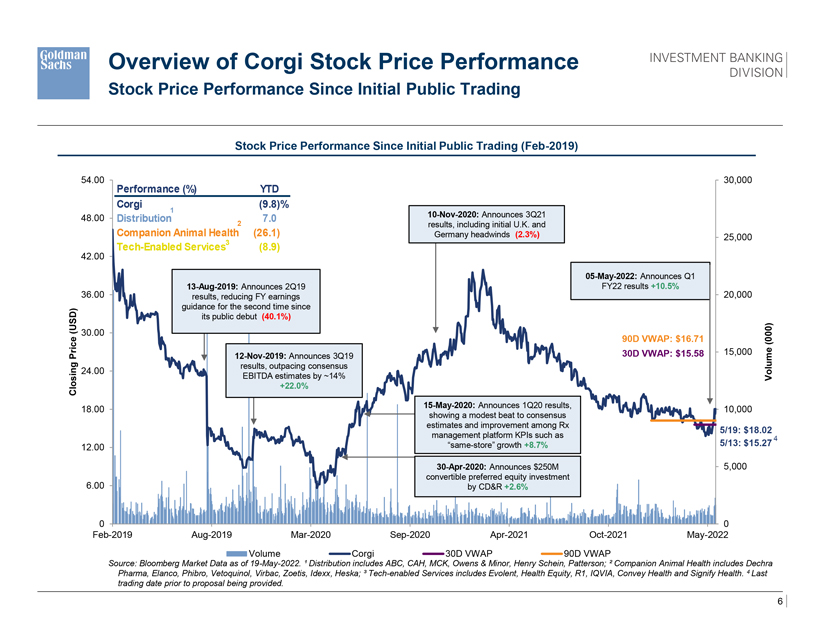
Overview of Corgi Stock Price Performance
Stock Price Performance Since Initial Public Trading
INVESTMENT BANKING DIVISION
Stock Price Performance Since Initial Public Trading (Feb-2019)
54.00 Performance (%) YTD 30,000 Corgi (9.8)%
1
48.00 Distribution 7.0 10-Nov-2020: Announces 3Q21
2 results, including initial U.K. and
Companion Animal Health (26.1) Germany headwinds (2.3%) 25,000 Tech-Enabled Services3 (8.9)
42.00
05-May-2022: Announces Q1
36.00 13-Aug-2019: Announces 2Q19 FY22 results +10.5% 20,000 results, reducing FY earnings guidance for the second time since (USD) its public debut (40.1%)
30.00
90D VWAP: $16.71 (000)
15,000
Price 12-Nov-2019: Announces 3Q19 30D VWAP: $15.58 g results, outpacing consensus in 24.00
EBITDA estimates by ~14% Volume Clos +22.0%
18.00 15-May-2020: Announces 1Q20 results, 10,000 showing a modest beat to consensus estimates and improvement among Rx
5/19: $18.02 management platform KPIs such as 5/13: $15.27 4
12.00 “same-store” growth +8.7%
30-Apr-2020: Announces $250M 5,000 convertible preferred equity investment 6.00 by CD&R +2.6%
0 0 Feb-2019 Aug-2019 Mar-2020 Sep-2020 Apr-2021 Oct-2021 May-2022
Volume Corgi 30D VWAP 90D VWAP
Source: Bloomberg Market Data as of 19-May-2022. ¹ Distribution includes ABC, CAH, MCK, Owens & Minor, Henry Schein, Patterson; ² Companion Animal Health includes Dechra Pharma, Elanco, Phibro, Vetoquinol, Virbac, Zoetis, Idexx, Heska; ³ Tech-enabled Services includes Evolent, Health Equity, R1, IQVIA, Convey Health and Signify Health. 4 Last trading date prior to proposal being provided.
6
INVESTMENT BANKING DIVISION
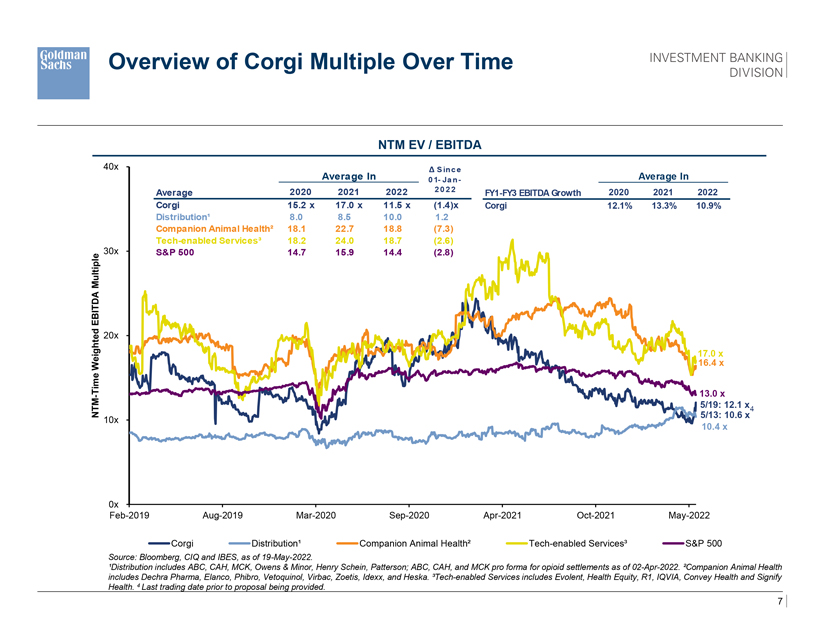
Overview of Corgi Multiple Over Time
NTM EV / EBITDA
40x Δ S inc e
Average In 0 1- Ja n- Average In
Average 2020 2021 2022 2 0 2 2 FY1-FY3 EBITDA Growth 2020 2021 2022
Corgi 15.2 x 17.0 x 11.5 x (1.4)x Corgi 12.1% 13.3% 10.9% Distribution¹ 8.0 8.5 10.0 1.2 Companion Animal Health² 18.1 22.7 18.8 (7.3) Tech-enabled Services³ 18.2 24.0 18.7 (2.6) 30x S&P 500 14.7 15.9 14.4 (2.8)
Multip le EBITDA d ighte 20x
17.0 x We 16.4 x me - Ti 13.0 x 5/19: 12.1 x
4
NTM 5/13: 10.6 x
10x
10.4 x
0x
Feb-2019 Aug-2019 Mar-2020 Sep-2020 Apr-2021 Oct-2021 May-2022
Corgi Distribution¹ Companion Animal Health² Tech-enabled Services³ S&P 500
Source: Bloomberg, CIQ and IBES, as of 19-May-2022.
¹Distribution includes ABC, CAH, MCK, Owens & Minor, Henry Schein, Patterson; ABC, CAH, and MCK pro forma for opioid settlements as of 02-Apr-2022. ²Companion Animal Health includes Dechra Pharma, Elanco, Phibro, Vetoquinol, Virbac, Zoetis, Idexx, and Heska. ³Tech-enabled Services includes Evolent, Health Equity, R1, IQVIA, Convey Health and Signify Health. 4 Last trading date prior to proposal being provided.
7
INVESTMENT BANKING DIVISION
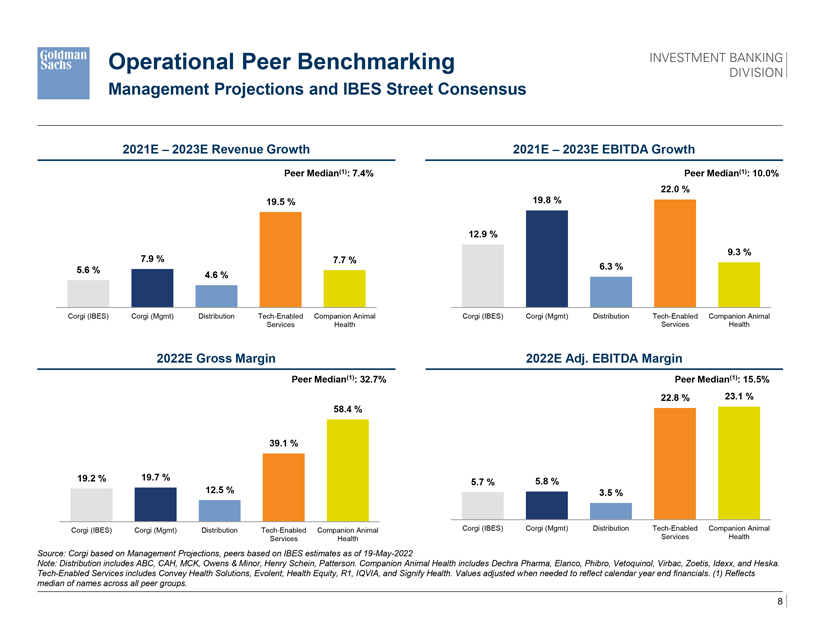
Operational Peer Benchmarking
Management Projections and IBES Street Consensus
2021E – 2023E Revenue Growth 2021E – 2023E EBITDA Growth
Peer Median(1): 7.4% Peer Median(1): 10.0% 22.0 % 19.5 % 19.8 %
12.9 %
9.3 % 7.9 % 7.7 % 6.3 % 5.6 % 4.6 %
Corgi (IBES) Corgi (Mgmt) Distribution Tech-Enabled Companion Animal Corgi (IBES) Corgi (Mgmt) Distribution Tech-Enabled Companion Animal Services Health Services Health
2022E Gross Margin 2022E Adj. EBITDA Margin
Peer Median(1): 32.7% Peer Median(1): 15.5% 22.8 % 23.1 % 58.4 %
39.1 %
19.2 % 19.7 % 5.8 % 12.5 % 5.7 %
3.5 %
Corgi (IBES) Corgi (Mgmt) Distribution Tech-Enabled Companion Animal Corgi (IBES) Corgi (Mgmt) Distribution Tech-Enabled Companion Animal Services Health Services Health
Source: Corgi based on Management Projections, peers based on IBES estimates as of 19-May-2022
Note: Distribution includes ABC, CAH, MCK, Owens & Minor, Henry Schein, Patterson. Companion Animal Health includes Dechra Pharma, Elanco, Phibro, Vetoquinol, Virbac, Zoetis, Idexx, and Heska. Tech-Enabled Services includes Convey Health Solutions, Evolent, Health Equity, R1, IQVIA, and Signify Health. Values adjusted when needed to reflect calendar year end financials. (1) Reflects median of names across all peer groups.
8
INVESTMENT BANKING DIVISION
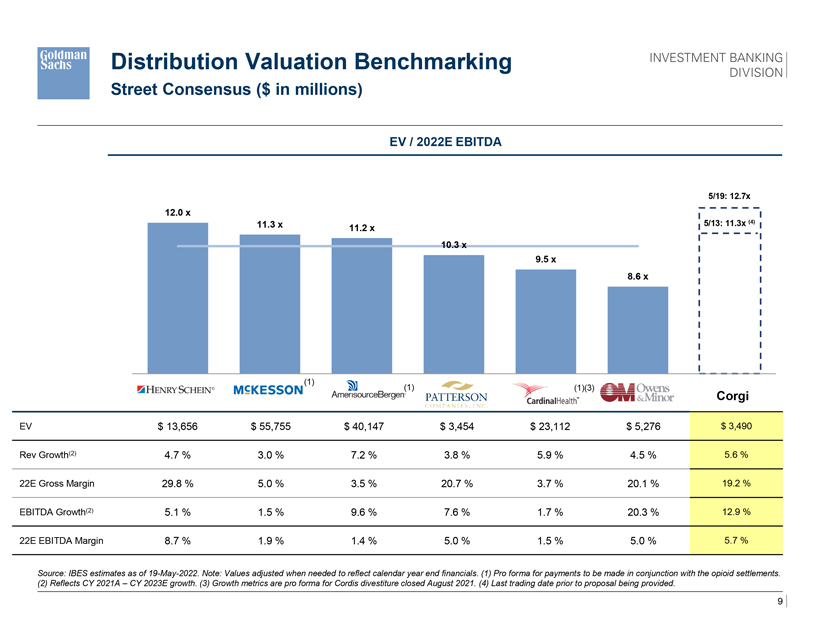
Distribution Valuation Benchmarking
Street Consensus ($ in millions)
EV / 2022E EBITDA
5/19: 12.7x
12.0 x
11.3 x 5/13: 11.3x (4)
11.2 x
10.3 x
9.5 x
8.6 x
(1)
(1) (1)(3)
Corgi
EV $ 13,656 $ 55,755 $ 40,147 $ 3,454 $ 23,112 $ 5,276 $ 3,490 Rev Growth(2) 4.7 % 3.0 % 7.2 % 3.8 % 5.9 % 4.5 % 5.6 % 22E Gross Margin 29.8 % 5.0 % 3.5 % 20.7 % 3.7 % 20.1 % 19.2 % EBITDA Growth(2) 5.1 % 1.5 % 9.6 % 7.6 % 1.7 % 20.3 % 12.9 % 22E EBITDA Margin 8.7 % 1.9 % 1.4 % 5.0 % 1.5 % 5.0 % 5.7 %
Source: IBES estimates as of 19-May-2022. Note: Values adjusted when needed to reflect calendar year end financials. (1) Pro forma for payments to be made in conjunction with the opioid settlements. (2) Reflects CY 2021A – CY 2023E growth. (3) Growth metrics are pro forma for Cordis divestiture closed August 2021. (4) Last trading date prior to proposal being provided.
9
INVESTMENT BANKING DIVISION
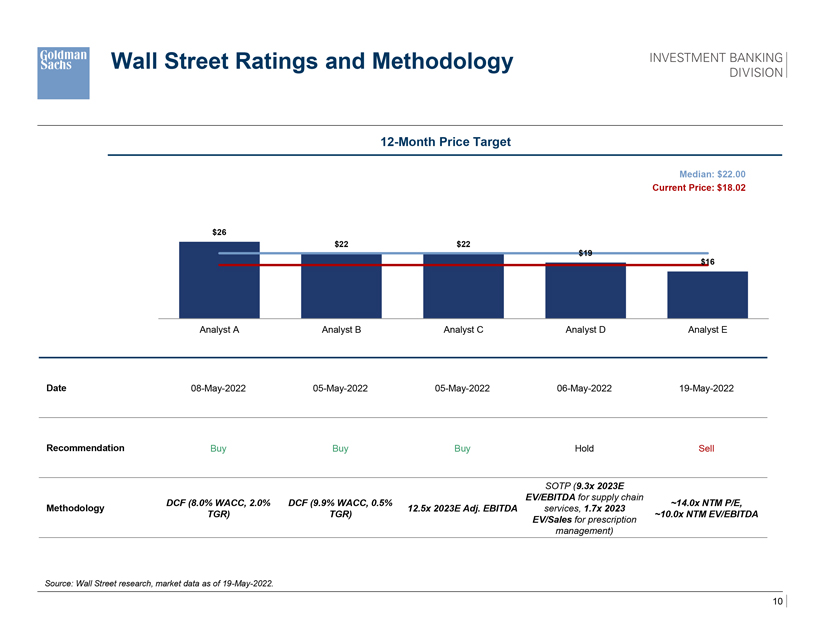
Wall Street Ratings and Methodology
12-Month Price Target
Median: $22.00 Current Price: $18.02
$26
$22 $22 $19 $16
Analyst A Analyst B Analyst C Analyst D Analyst E
Date 08-May-2022 05-May-2022 05-May-2022 06-May-2022 19-May-2022
Recommendation Buy Buy Buy Hold Sell
SOTP (9.3x 2023E EV/EBITDA for supply chain
DCF (8.0% WACC, 2.0% DCF (9.9% WACC, 0.5% ~14.0x NTM P/E, Methodology 12.5x 2023E Adj. EBITDA services, 1.7x 2023 TGR) TGR) ~10.0x NTM EV/EBITDA
EV/Sales for prescription management)
Source: Wall Street research, market data as of 19-May-2022.
10
INVESTMENT BANKING DIVISION
Topics for Discussion
1 Transaction Overview
2 Public Market Perspectives on Corgi 3 Overview of Corgi Management Projections 4 Illustrative Valuation Analysis A Appendix A: Supplemental Materials
INVESTMENT BANKING DIVISION
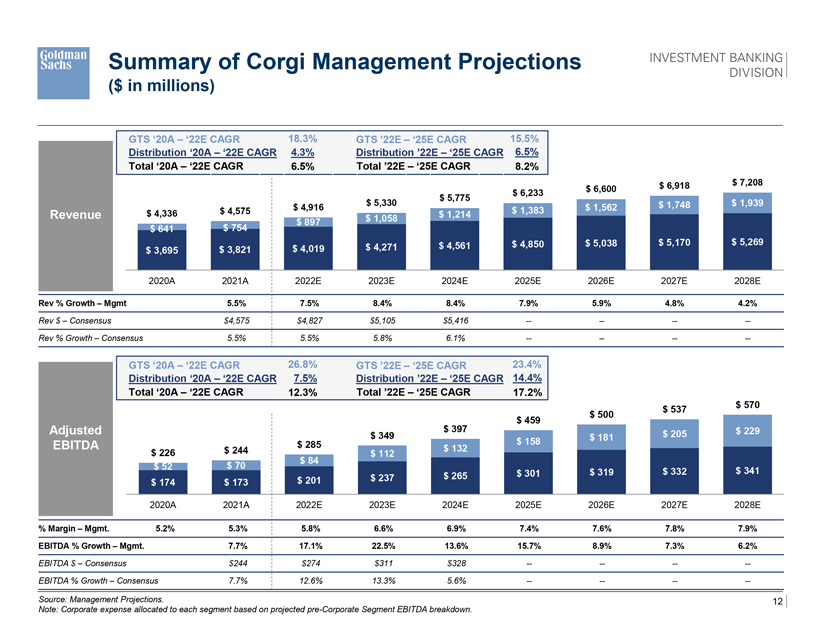
Summary of Corgi Management Projections
($ in millions)
GTS ‘20A – ‘22E CAGR 18.3% GTS ’22E – ‘25E CAGR 15.5% Distribution ‘20A – ‘22E CAGR 4.3% Distribution ’22E – ‘25E CAGR 6.5% Total ‘20A – ‘22E CAGR 6.5% Total ’22E – ‘25E CAGR 8.2% $ 6,918 $ 7,208 $ 6,233 $ 6,600 $ 5,775 $ 5,330 $ 1,748 $ 1,939 $ 4,575 $ 4,916 $ 1,383 $ 1,562
Revenue $ 4,336 $ 1,214
$ 897 $ 1,058 $ 641 $ 754 $ 4,561 $ 4,850 $ 5,038 $ 5,170 $ 5,269 $ 3,695 $ 3,821 $ 4,019 $ 4,271
2020A 2021A 2022E 2023E 2024E 2025E 2026E 2027E 2028E
Rev % Growth – Mgmt 5.5% 7.5% 8.4% 8.4% 7.9% 5.9% 4.8% 4.2%
Rev $ – Consensus $4,575 $4,827 $5,105 $5,416 -———-
Rev % Growth – Consensus 5.5% 5.5% 5.8% 6.1% -———-
GTS ‘20A – ‘22E CAGR 26.8% GTS ’22E – ‘25E CAGR 23.4% Distribution ‘20A – ‘22E CAGR 7.5% Distribution ’22E – ‘25E CAGR 14.4% Total ‘20A – ‘22E CAGR 12.3% Total ’22E – ‘25E CAGR 17.2% $ 570 $ 537 $ 500 $ 397 $ 459
Adjusted $ 205 $ 229
$ 349 $ 181
EBITDA $ 285 $ 158
$ 244 $ 132 $ 226 $ 112 $ 84
$ 52 $ 70 $ 301 $ 319 $ 332 $ 341 $ 237 $ 265 $ 174 $ 173 $ 201
2020A 2021A 2022E 2023E 2024E 2025E 2026E 2027E 2028E
% Margin – Mgmt. 5.2% 5.3% 5.8% 6.6% 6.9% 7.4% 7.6% 7.8% 7.9% EBITDA % Growth – Mgmt. 7.7% 17.1% 22.5% 13.6% 15.7% 8.9% 7.3% 6.2%
EBITDA $ – Consensus $244 $274 $311 $328 -———-
EBITDA % Growth – Consensus 7.7% 12.6% 13.3% 5.6% -———-
Source: Management Projections. 12 Note: Corporate expense allocated to each segment based on projected pre-Corporate Segment EBITDA breakdown.
INVESTMENT BANKING DIVISION
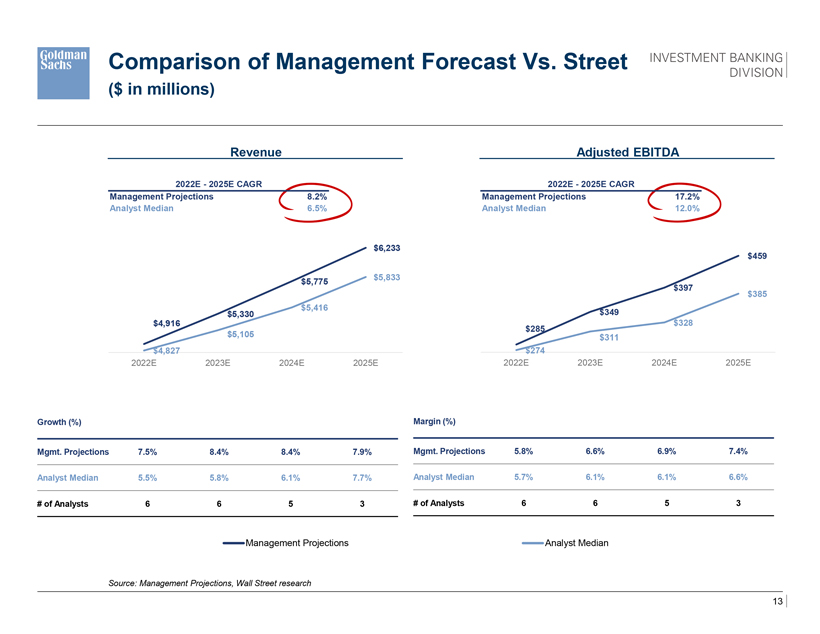
Comparison of Management Forecast Vs. Street
($ in millions)
Revenue Adjusted EBITDA
2022E—2025E CAGR 2022E—2025E CAGR
Management Projections 8.2% Management Projections 17.2% Analyst Median 6.5% Analyst Median 12.0%
$6,233 $459 $5,833 $5,775 $397 $385 $5,416 $5,330 $349 $4,916 $328 $285 $5,105 $311 $4,827 $274
2022E 2023E 2024E 2025E 2022E 2023E 2024E 2025E
Growth (%) Margin (%)
Mgmt. Projections 7.5% 8.4% 8.4% 7.9% Mgmt. Projections 5.8% 6.6% 6.9% 7.4% Analyst Median 5.5% 5.8% 6.1% 7.7% Analyst Median 5.7% 6.1% 6.1% 6.6% # of Analysts 6 6 5 3 # of Analysts 6 6 5 3
Management Projections Analyst Median
Source: Management Projections, Wall Street research
13
INVESTMENT BANKING DIVISION
Topics for Discussion
1 Transaction Overview
2 Public Market Perspectives on Corgi 3 Overview of Corgi Management Projections 4 Illustrative Valuation Analysis A Appendix A: Supplemental Materials
INVESTMENT BANKING DIVISION
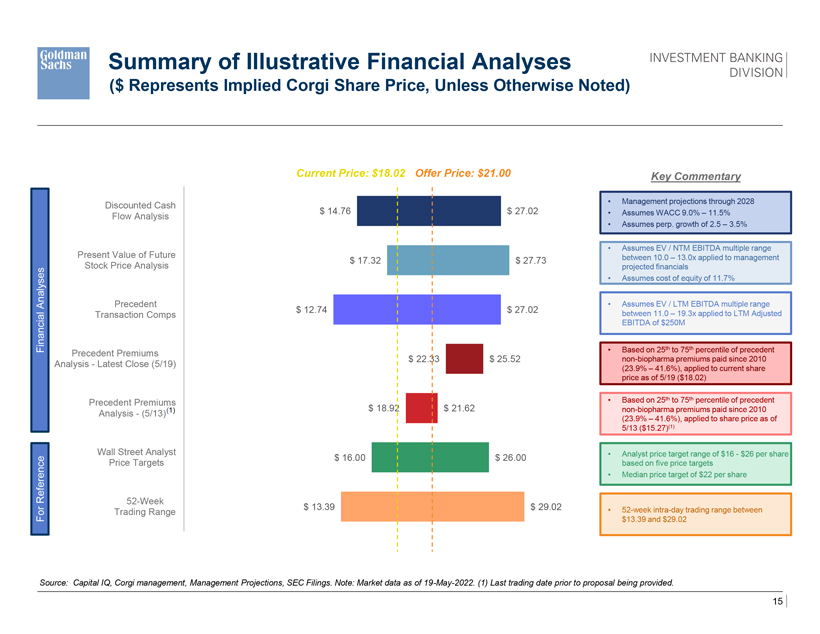
Summary of Illustrative Financial Analyses
($ Represents Implied Corgi Share Price, Unless Otherwise Noted)
Current Price: $18.02 Offer Price: $21.00 Key Commentary
Discounted Cash • Management projections through 2028
$ 14.76 $ 27.02 • Assumes WACC 9.0% – 11.5%
Flow Analysis
• Assumes perp. growth of 2.5 – 3.5%
• Assumes EV / NTM EBITDA multiple range Present Value of Future between 10.0 – 13.0x applied to management
$ 17.32 $ 27.73
Stock Price Analysis projected financials
• Assumes cost of equity of 11.7%
Analyses Precedent • Assumes EV / LTM EBITDA multiple range Transaction Comps $ 12.74 $ 27.02 between 11.0 – 19.3x applied to LTM Adjusted EBITDA of $250M
Financial • Based on 25th to 75th percentile of precedent
Precedent Premiums
$ 22.33 $ 25.52 non-biopharma premiums paid since 2010
Analysis—Latest Close (5/19)
(23.9% – 41.6%), applied to current share price as of 5/19 ($18.02)
Precedent Premiums • Based on 25th to 75th percentile of precedent (1) $ 18.92 $ 21.62 non-biopharma premiums paid since 2010
Analysis—(5/13)
(23.9% – 41.6%), applied to share price as of 5/13 ($15.27)(1)
Wall Street Analyst • Analyst price target range of $16—$26 per share
$ 16.00 $ 26.00
Price Targets based on five price targets
Reference • Median price target of $22 per share
52-Week
$ 13.39 $ 29.02
Trading Range • 52-week intra-day trading range between For $13.39 and $29.02
Source: Capital IQ, Corgi management, Management Projections, SEC Filings. Note: Market data as of 19-May-2022. (1) Last trading date prior to proposal being provided.
15
INVESTMENT BANKING DIVISION
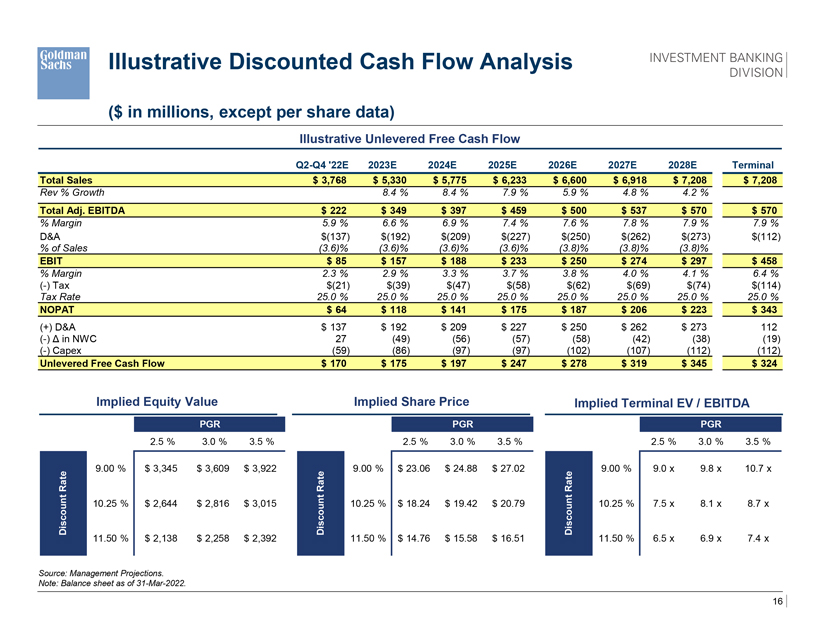
Illustrative Discounted Cash Flow Analysis
($ in millions, except per share data)
Illustrative Unlevered Free Cash Flow
Q2-Q4 ‘22E 2023E 2024E 2025E 2026E 2027E 2028E Terminal Total Sales $ 3,768 $ 5,330 $ 5,775 $ 6,233 $ 6,600 $ 6,918 $ 7,208 $ 7,208
Rev % Growth 8.4 % 8.4 % 7.9 % 5.9 % 4.8 % 4.2 %
Total Adj. EBITDA $ 222 $ 349 $ 397 $ 459 $ 500 $ 537 $ 570 $ 570
% Margin 5.9 % 6.6 % 6.9 % 7.4 % 7.6 % 7.8 % 7.9 % 7.9 %
D&A $(137) $(192) $(209) $(227) $(250) $(262) $(273) $(112)
% of Sales (3.6)% (3.6)% (3.6)% (3.6)% (3.8)% (3.8)% (3.8)%
EBIT $ 85 $ 157 $ 188 $ 233 $ 250 $ 274 $ 297 $ 458
% Margin 2.3 % 2.9 % 3.3 % 3.7 % 3.8 % 4.0 % 4.1 % 6.4 %
(-) Tax $(21) $(39) $(47) $(58) $(62) $(69) $(74) $(114)
Tax Rate 25.0 % 25.0 % 25.0 % 25.0 % 25.0 % 25.0 % 25.0 % 25.0 %
NOPAT $ 64 $ 118 $ 141 $ 175 $ 187 $ 206 $ 223 $ 343
(+) D&A $ 137 $ 192 $ 209 $ 227 $ 250 $ 262 $ 273 112 (-) Δ in NWC 27 (49) (56) (57) (58) (42) (38) (19) (-) Capex (59) (86) (97) (97) (102) (107) (112) (112)
Unlevered Free Cash Flow $ 170 $ 175 $ 197 $ 247 $ 278 $ 319 $ 345 $ 324
Implied Equity Value Implied Share Price Implied Terminal EV / EBITDA
PGR PGR PGR
# ###### 2.5 % 3.0 % 3.5 % $ 19.97 2.5 % 3.0 % 3.5 % $ 8.03 2.5 % 3.0 % 3.5 %
9.00 % $ 3,345 $ 3,609 $ 3,922 9.00 % $ 23.06 $ 24.88 $ 27.02 9.00 % 9.0 x 9.8 x 10.7 x
RateRateRate ount 10.25 % $ 2,644 $ 2,816 $ 3,015 ount 10.25 % $ 18.24 $ 19.42 $ 20.79 ount 10.25 % 7.5 x 8.1 x 8.7 x
Disc Disc Disc
11.50 % $ 2,138 $ 2,258 $ 2,392 11.50 % $ 14.76 $ 15.58 $ 16.51 11.50 % 6.5 x 6.9 x 7.4 x
Source: Management Projections. Note: Balance sheet as of 31-Mar-2022.
16
INVESTMENT BANKING DIVISION
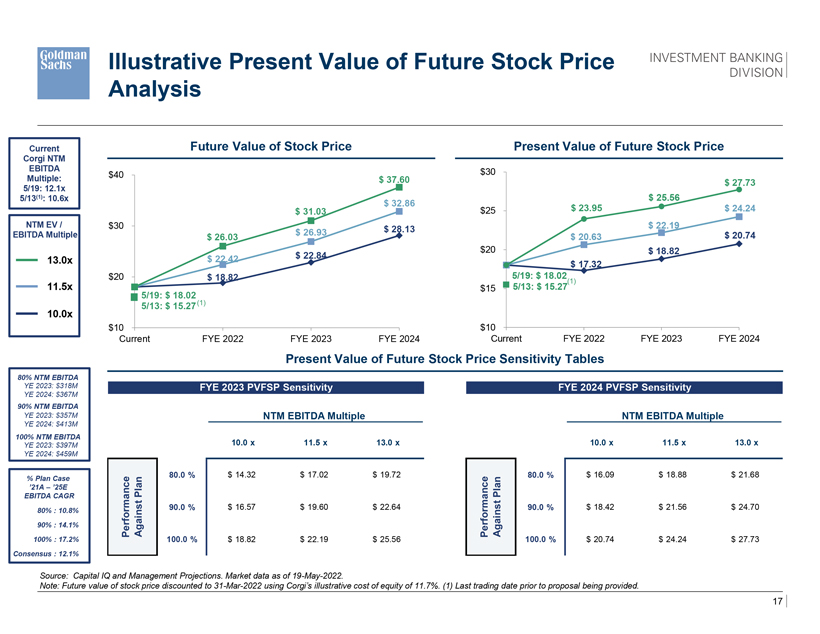
Illustrative Present Value of Future Stock Price Analysis
Current Future Value of Stock Price Present Value of Future Stock Price
Corgi NTM
EBITDA $30 Multiple: $40 $ 37.60 $ 27.73
5/19: 12.1x
5/13(1): 10.6x $ 32.86 $ 25.56 $ 31.03 $25 $ 23.95 $ 24.24 NTM EV / $30 $ 22.19 $ 26.93 $ 28.13
EBITDA Multiple $ 26.03 $ 20.63 $ 20.74
$20 $ 18.82 $ 22.42 $ 22.84 13.0x $ 17.32
$20 $ 18.82 5/19: $ 18.02
(1)
11.5x $15 5/13: $ 15.27 5/19: $ 18.02 (1) 5/13: $ 15.27
10.0x
$10 $10
Current FYE 2022 FYE 2023 FYE 2024 Current FYE 2022 FYE 2023 FYE 2024
Present Value of Future Stock Price Sensitivity Tables
80% NTM EBITDA
YE 2023: $318M FYE 2023 PVFSP Sensitivity FYE 2024 PVFSP Sensitivity
YE 2024: $367M
90% NTM EBITDA
YE 2023: $357M NTM EBITDA Multiple NTM EBITDA Multiple
YE 2024: $413M
100% NTM EBITDA
YE 2023: $397M 11.7 % 10.0 x 11.5 x 13.0 x 10.0 x 11.5 x 13.0 x
YE 2024: $459M
% Plan Case n 80.0 % $ 14.32 $ 17.02 $ 19.72 n 80.0 % $ 16.09 $ 18.88 $ 21.68
’21A – ’25E nce Pla nce Pla
EBITDA CAGR
90.0 % $ 16.57 $ 19.60 $ 22.64 90.0 % $ 18.42 $ 21.56 $ 24.70
80% : 10.8% rforma rforma 90% : 14.1% Against Against Pe Pe
100% : 17.2% 100.0 % $ 18.82 $ 22.19 $ 25.56 100.0 % $ 20.74 $ 24.24 $ 27.73
Consensus : 12.1%
Source: Capital IQ and Management Projections. Market data as of 19-May-2022.
Note: Future value of stock price discounted to 31-Mar-2022 using Corgi’s illustrative cost of equity of 11.7%. (1) Last trading date prior to proposal being provided.
17
INVESTMENT BANKING DIVISION
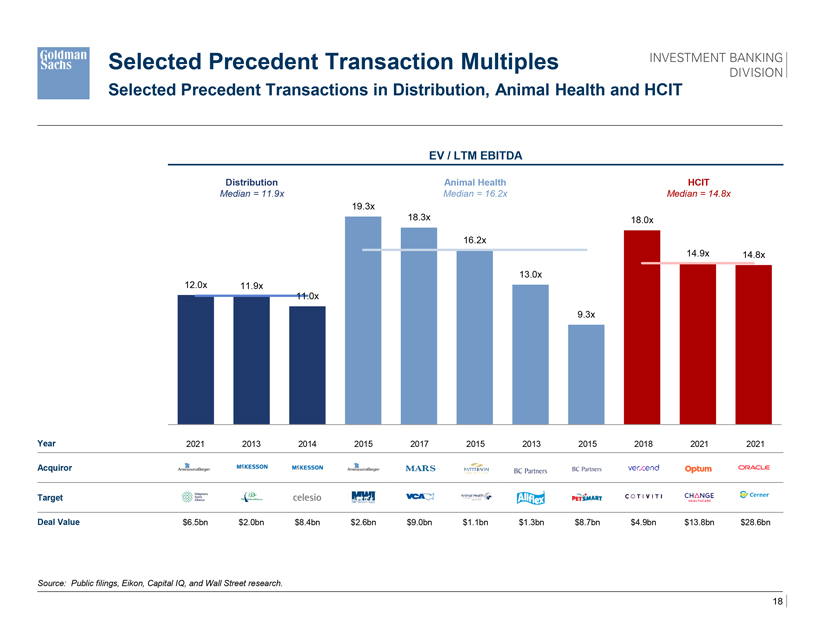
Selected Precedent Transaction Multiples
Selected Precedent Transactions in Distribution, Animal Health and HCIT
EV / LTM EBITDA
Distribution Animal Health HCIT
Median = 11.9x Median = 16.2x Median = 14.8x
19.3x
18.3x 18.0x 16.2x
14.9x 14.8x 13.0x 12.0x 11.9x 11.0x
9.3x
Year 2021 2013 2014 2015 2017 2015 2013 2015 2018 2021 2021
Acquiror
Target
Deal Value $6.5bn $2.0bn $8.4bn $2.6bn $9.0bn $1.1bn $1.3bn $8.7bn $4.9bn $13.8bn $28.6bn
Source: Public filings, Eikon, Capital IQ, and Wall Street research.
18
INVESTMENT BANKING DIVISION
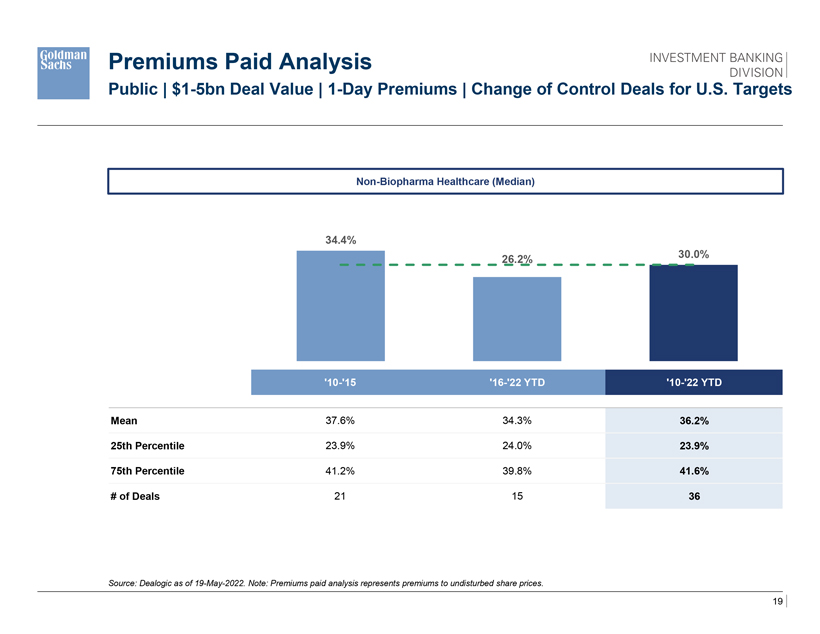
Premiums Paid Analysis
Public | $1-5bn Deal Value | 1-Day Premiums | Change of Control Deals for U.S. Targets
Non-Biopharma Healthcare (Median)
34.4%
30.0% 26.2%
‘10-‘15 ‘16-‘22 YTD ‘10-‘22 YTD
Mean 37.6% 34.3% 36.2% 25th Percentile 23.9% 24.0% 23.9% 75th Percentile 41.2% 39.8% 41.6% # of Deals 21 15 36
Source: Dealogic as of 19-May-2022. Note: Premiums paid analysis represents premiums to undisturbed share prices.
19
INVESTMENT BANKING DIVISION
Topics for Discussion
1 Transaction Overview
2 Public Market Perspectives on Corgi 3 Overview of Corgi Management Projections 4 Illustrative Valuation Analysis A Appendix A: Supplemental Materials
INVESTMENT BANKING DIVISION
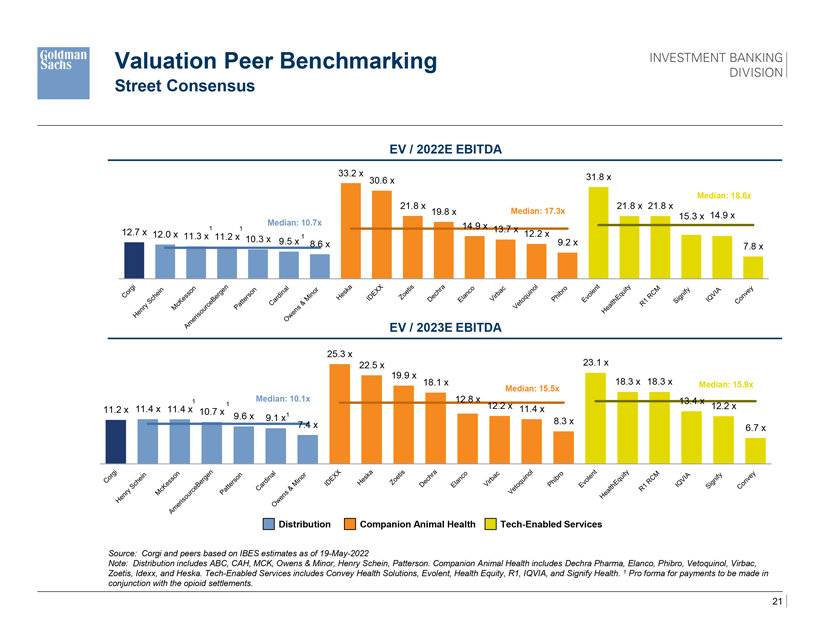
Valuation Peer Benchmarking
Street Consensus
EV / 2022E EBITDA
33.2 x 31.8 x 30.6 x
Median: 18.6x
21.8 x 21.8 x 21.8 x 19.8 x Median: 17.3x
Median: 10.7x 15.3 x 14.9 x
1 1 14.9 x 13.7 x
12.7 x 12.0 x 12.2 x 11.3 x 11.2 x 10.3 x 1
9.5 x 8.6 x 9.2 x
7.8 x
EV / 2023E EBITDA
25.3 x
22.5 x 23.1 x 19.9 x
18.1 x 18.3 x 18.3 x Median: 15.9x Median: 15.5x
1 Median: 10.1x 12.8 x 13.4 x
1 12.2 x 12.2 x 11.2 x 11.4 x 11.4 x 10.7 x 11.4 x
9.6 x 9.1 x1
7.4 x 8.3 x
6.7 x
Distribution Companion Animal Health Tech-Enabled Services
Source: Corgi and peers based on IBES estimates as of 19-May-2022
Note: Distribution includes ABC, CAH, MCK, Owens & Minor, Henry Schein, Patterson. Companion Animal Health includes Dechra Pharma, Elanco, Phibro, Vetoquinol, Virbac, Zoetis, Idexx, and Heska. Tech-Enabled Services includes Convey Health Solutions, Evolent, Health Equity, R1, IQVIA, and Signify Health. 1 Pro forma for payments to be made in conjunction with the opioid settlements.
21
INVESTMENT BANKING DIVISION
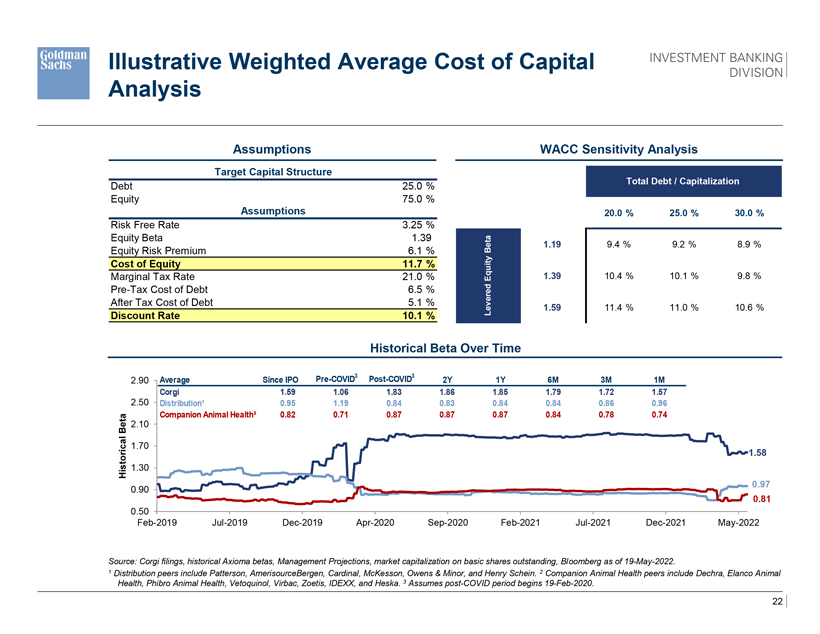
Illustrative Weighted Average Cost of Capital Analysis
Assumptions WACC Sensitivity Analysis
Target Capital Structure
Total Debt / Capitalization
Debt 25.0 % Equity 75.0 %
Assumptions $ 0.10 20.0 % 25.0 % 30.0 %
Risk Free Rate 3.25 % Equity Beta 1.39
Beta 1.19 9.4 % 9.2 % 8.9 %
Equity Risk Premium 6.1 % ty
Cost of Equity 11.7 % ui
Marginal Tax Rate 21.0 % Eq 1.39 10.4 % 10.1 % 9.8 % Pre-Tax Cost of Debt 6.5 % After Tax Cost of Debt 5.1 %
Levered 1.59 11.4 % 11.0 % 10.6 %
Discount Rate 10.1 %
Historical Beta Over Time
Pre-COVID3 Post-COVID3
2.90 Average Since IPO 2Y 1Y 6M 3M 1M Corgi 1.59 1.06 1.83 1.86 1.85 1.79 1.72 1.57 2.50 Distribution¹ 0.95 1.19 0.84 0.83 0.84 0.84 0.86 0.96 Companion Animal Health² 0.82 0.71 0.87 0.87 0.87 0.84 0.78 0.74
Beta 2.10 l a 1.70
1.58 Historic 1.30 0.97
0.90
0.81
0.50
Feb-2019 Jul-2019 Dec-2019 Apr-2020 Sep-2020 Feb-2021 Jul-2021 Dec-2021 May-2022
Source: Corgi filings, historical Axioma betas, Management Projections, market capitalization on basic shares outstanding, Bloomberg as of 19-May-2022.
1 Distribution peers include Patterson, AmerisourceBergen, Cardinal, McKesson, Owens & Minor, and Henry Schein. 2 Companion Animal Health peers include Dechra, Elanco Animal Health, Phibro Animal Health, Vetoquinol, Virbac, Zoetis, IDEXX, and Heska. 3 Assumes post-COVID period begins 19-Feb-2020.
22
INVESTMENT BANKING DIVISION
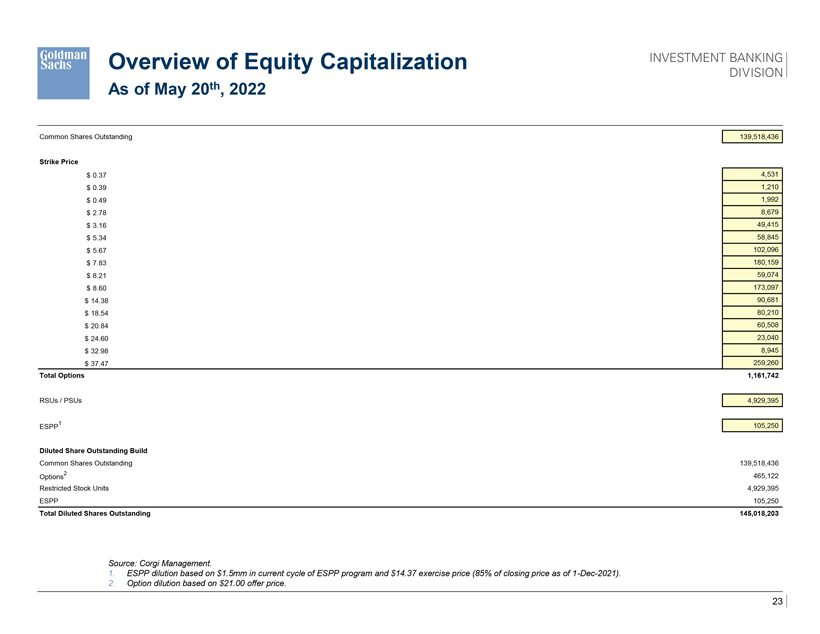
Overview of Equity Capitalization
As of May 20th, 2022
Common Shares Outstanding 139,518,436
Strike Price
$ 0.37 4,531
$ 0.39 1,210
$ 0.49 1,992
$ 2.78 8,679
$ 3.16 49,415
$ 5.34 58,845
$ 5.67 102,096
$ 7.83 180,159
$ 8.21 59,074
$ 8.60 173,097 $ 14.38 90,681 $ 18.54 80,210 $ 20.84 60,508 $ 24.60 23,040 $ 32.98 8,945 $ 37.47 259,260
Total Options 1,161,742
RSUs / PSUs 4,929,395
1 105,250 ESPP
Diluted Share Outstanding Build
Common Shares Outstanding 139,518,436
2 465,122 Options Restricted Stock Units 4,929,395 ESPP 105,250
Total Diluted Shares Outstanding 145,018,203
Source: Corgi Management.
1. ESPP dilution based on $1.5mm in current cycle of ESPP program and $14.37 exercise price (85% of closing price as of 1-Dec-2021).
2. Option dilution based on $21.00 offer price.
23
INVESTMENT BANKING DIVISION
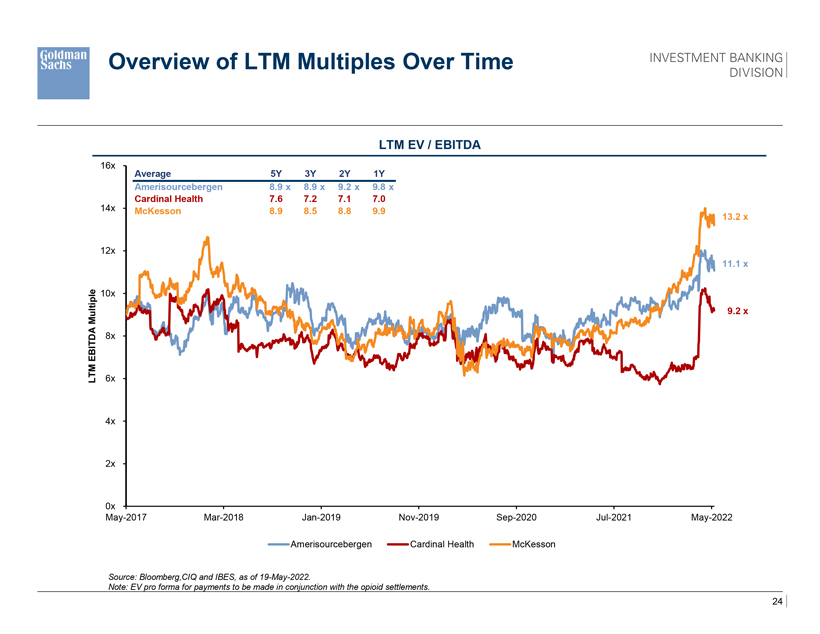
Overview of LTM Multiples Over Time
LTM EV / EBITDA
16x Average 5Y 3Y 2Y 1Y Amerisourcebergen 8.9 x 8.9 x 9.2 x 9.8 x Cardinal Health 7.6 7.2 7.1 7.0 14x McKesson 8.9 8.5 8.8 9.9
13.2 x
12x
11.1 x
10x
Multiple 9.2 x EBITDA 8x LTM 6x
4x
2x
0x
May-2017 Mar-2018 Jan-2019 Nov-2019 Sep-2020 Jul-2021 May-2022
Amerisourcebergen Cardinal Health McKesson
Source: Bloomberg,CIQ and IBES, as of 19-May-2022.
Note: EV pro forma for payments to be made in conjunction with the opioid settlements.
24
INVESTMENT BANKING DIVISION
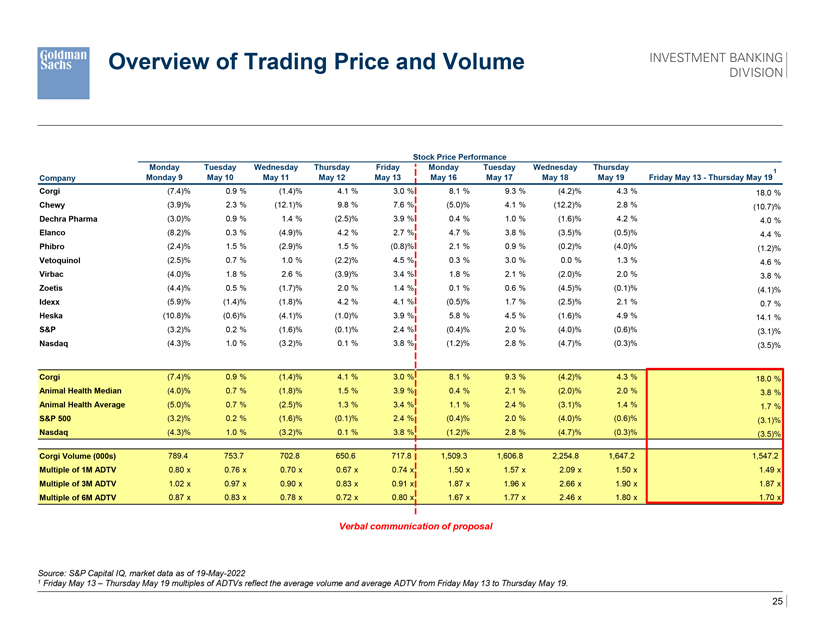
Overview of Trading Price and Volume
Stock Price Performance
Monday Tuesday Wednesday Thursday Friday Monday Tuesday Wednesday Thursday
Monday 9 May 10 May 11 May 12 May 13 May 16 May 17 May 18 May 19 Friday May 13—Thursday May 191 Company Corgi (7.4)% 0.9 % (1.4)% 4.1 % 3.0 % 8.1 % 9.3 % (4.2)% 4.3 % 18.0 % Chewy (3.9)% 2.3 % (12.1)% 9.8 % 7.6 % (5.0)% 4.1 % (12.2)% 2.8 % (10.7)% Dechra Pharma (3.0)% 0.9 % 1.4 % (2.5)% 3.9 % 0.4 % 1.0 % (1.6)% 4.2 % 4.0 % Elanco (8.2)% 0.3 % (4.9)% 4.2 % 2.7 % 4.7 % 3.8 % (3.5)% (0.5)% 4.4 % Phibro (2.4)% 1.5 % (2.9)% 1.5 % (0.8)% 2.1 % 0.9 % (0.2)% (4.0)% (1.2)% Vetoquinol (2.5)% 0.7 % 1.0 % (2.2)% 4.5 % 0.3 % 3.0 % 0.0 % 1.3 % 4.6 % Virbac (4.0)% 1.8 % 2.6 % (3.9)% 3.4 % 1.8 % 2.1 % (2.0)% 2.0 % 3.8 % Zoetis (4.4)% 0.5 % (1.7)% 2.0 % 1.4 % 0.1 % 0.6 % (4.5)% (0.1)% (4.1)% Idexx (5.9)% (1.4)% (1.8)% 4.2 % 4.1 % (0.5)% 1.7 % (2.5)% 2.1 % 0.7 % Heska (10.8)% (0.6)% (4.1)% (1.0)% 3.9 % 5.8 % 4.5 % (1.6)% 4.9 % 14.1 % S&P (3.2)% 0.2 % (1.6)% (0.1)% 2.4 % (0.4)% 2.0 % (4.0)% (0.6)% (3.1)% Nasdaq (4.3)% 1.0 % (3.2)% 0.1 % 3.8 % (1.2)% 2.8 % (4.7)% (0.3)% (3.5)%
Corgi (7.4)% 0.9 % (1.4)% 4.1 % 3.0 % 8.1 % 9.3 % (4.2)% 4.3 % 18.0 % Animal Health Median (4.0)% 0.7 % (1.8)% 1.5 % 3.9 % 0.4 % 2.1 % (2.0)% 2.0 % 3.8 % Animal Health Average (5.0)% 0.7 % (2.5)% 1.3 % 3.4 % 1.1 % 2.4 % (3.1)% 1.4 % 1.7 % S&P 500 (3.2)% 0.2 % (1.6)% (0.1)% 2.4 % (0.4)% 2.0 % (4.0)% (0.6)% (3.1)% Nasdaq (4.3)% 1.0 % (3.2)% 0.1 % 3.8 % (1.2)% 2.8 % (4.7)% (0.3)% (3.5)%
Corgi Volume (000s) 789.4 753.7 702.8 650.6 717.8 1,509.3 1,606.8 2,254.8 1,647.2 1,547.2 Multiple of 1M ADTV 0.80 x 0.76 x 0.70 x 0.67 x 0.74 x 1.50 x 1.57 x 2.09 x 1.50 x 1.49 x Multiple of 3M ADTV 1.02 x 0.97 x 0.90 x 0.83 x 0.91 x 1.87 x 1.96 x 2.66 x 1.90 x 1.87 x Multiple of 6M ADTV 0.87 x 0.83 x 0.78 x 0.72 x 0.80 x 1.67 x 1.77 x 2.46 x 1.80 x 1.70 x
Verbal communication of proposal
Source: S&P Capital IQ, market data as of 19-May-2022
1 Friday May 13 – Thursday May 19 multiples of ADTVs reflect the average volume and average ADTV from Friday May 13 to Thursday May 19.
25