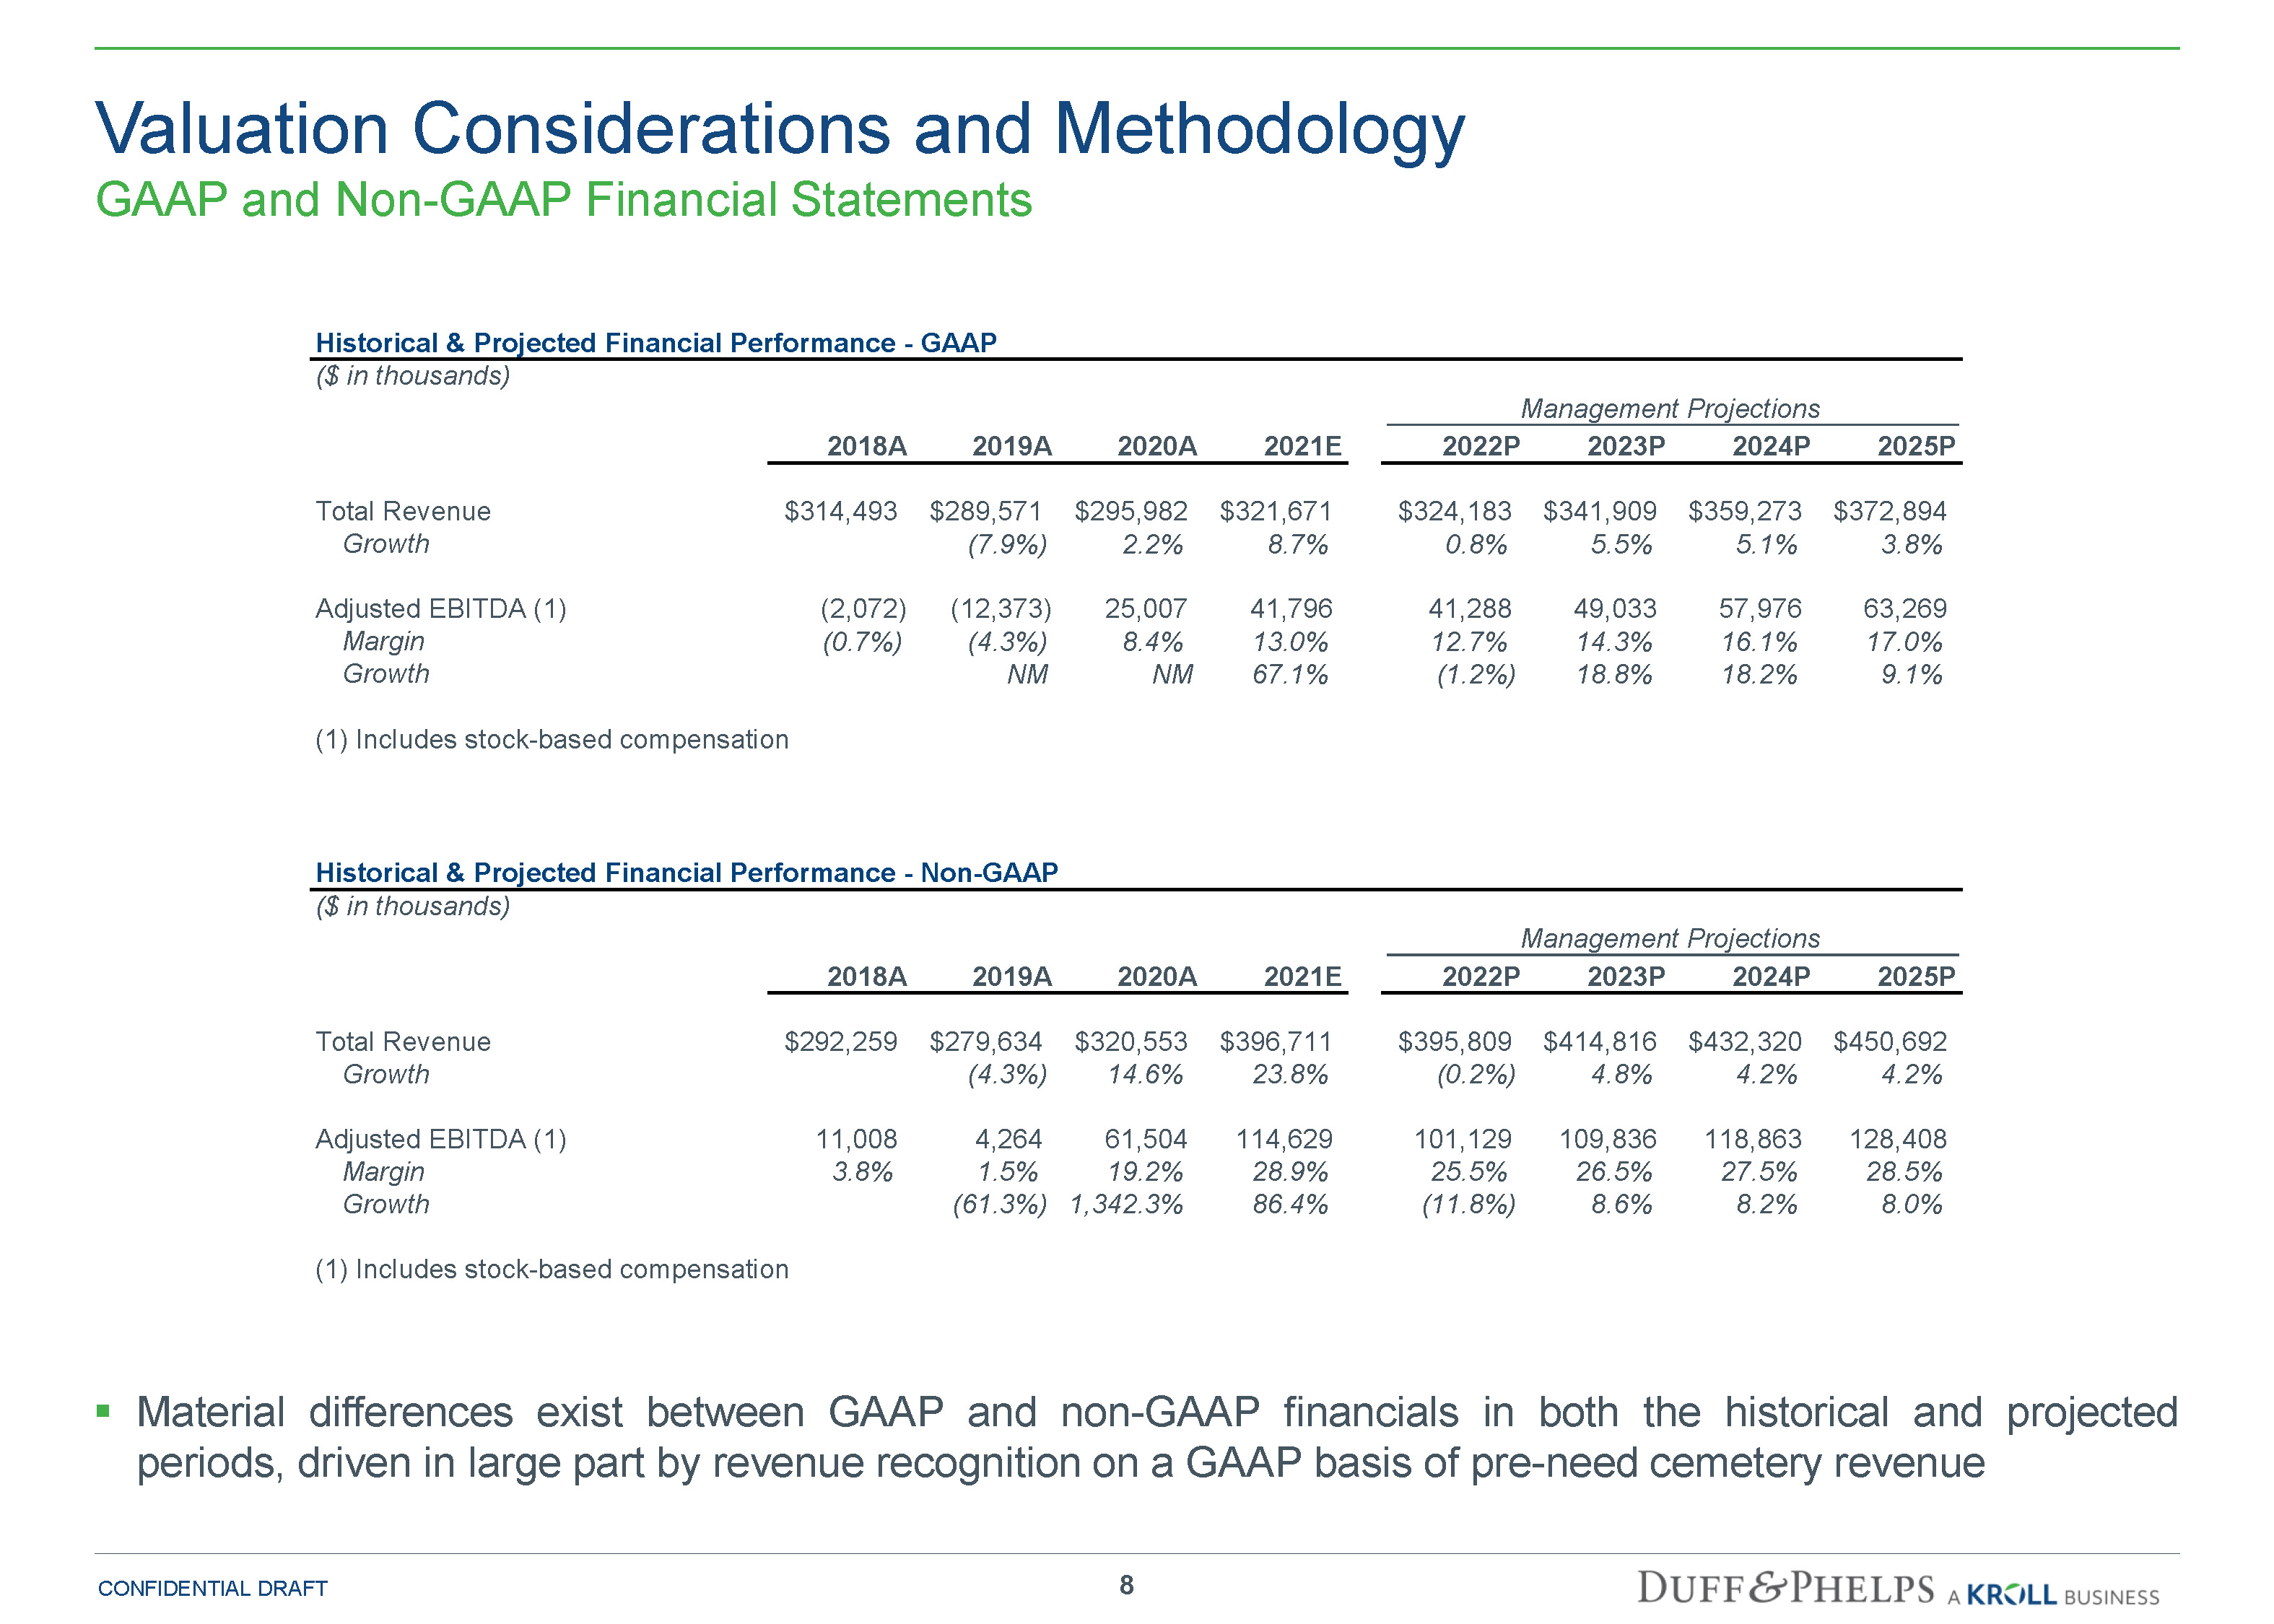
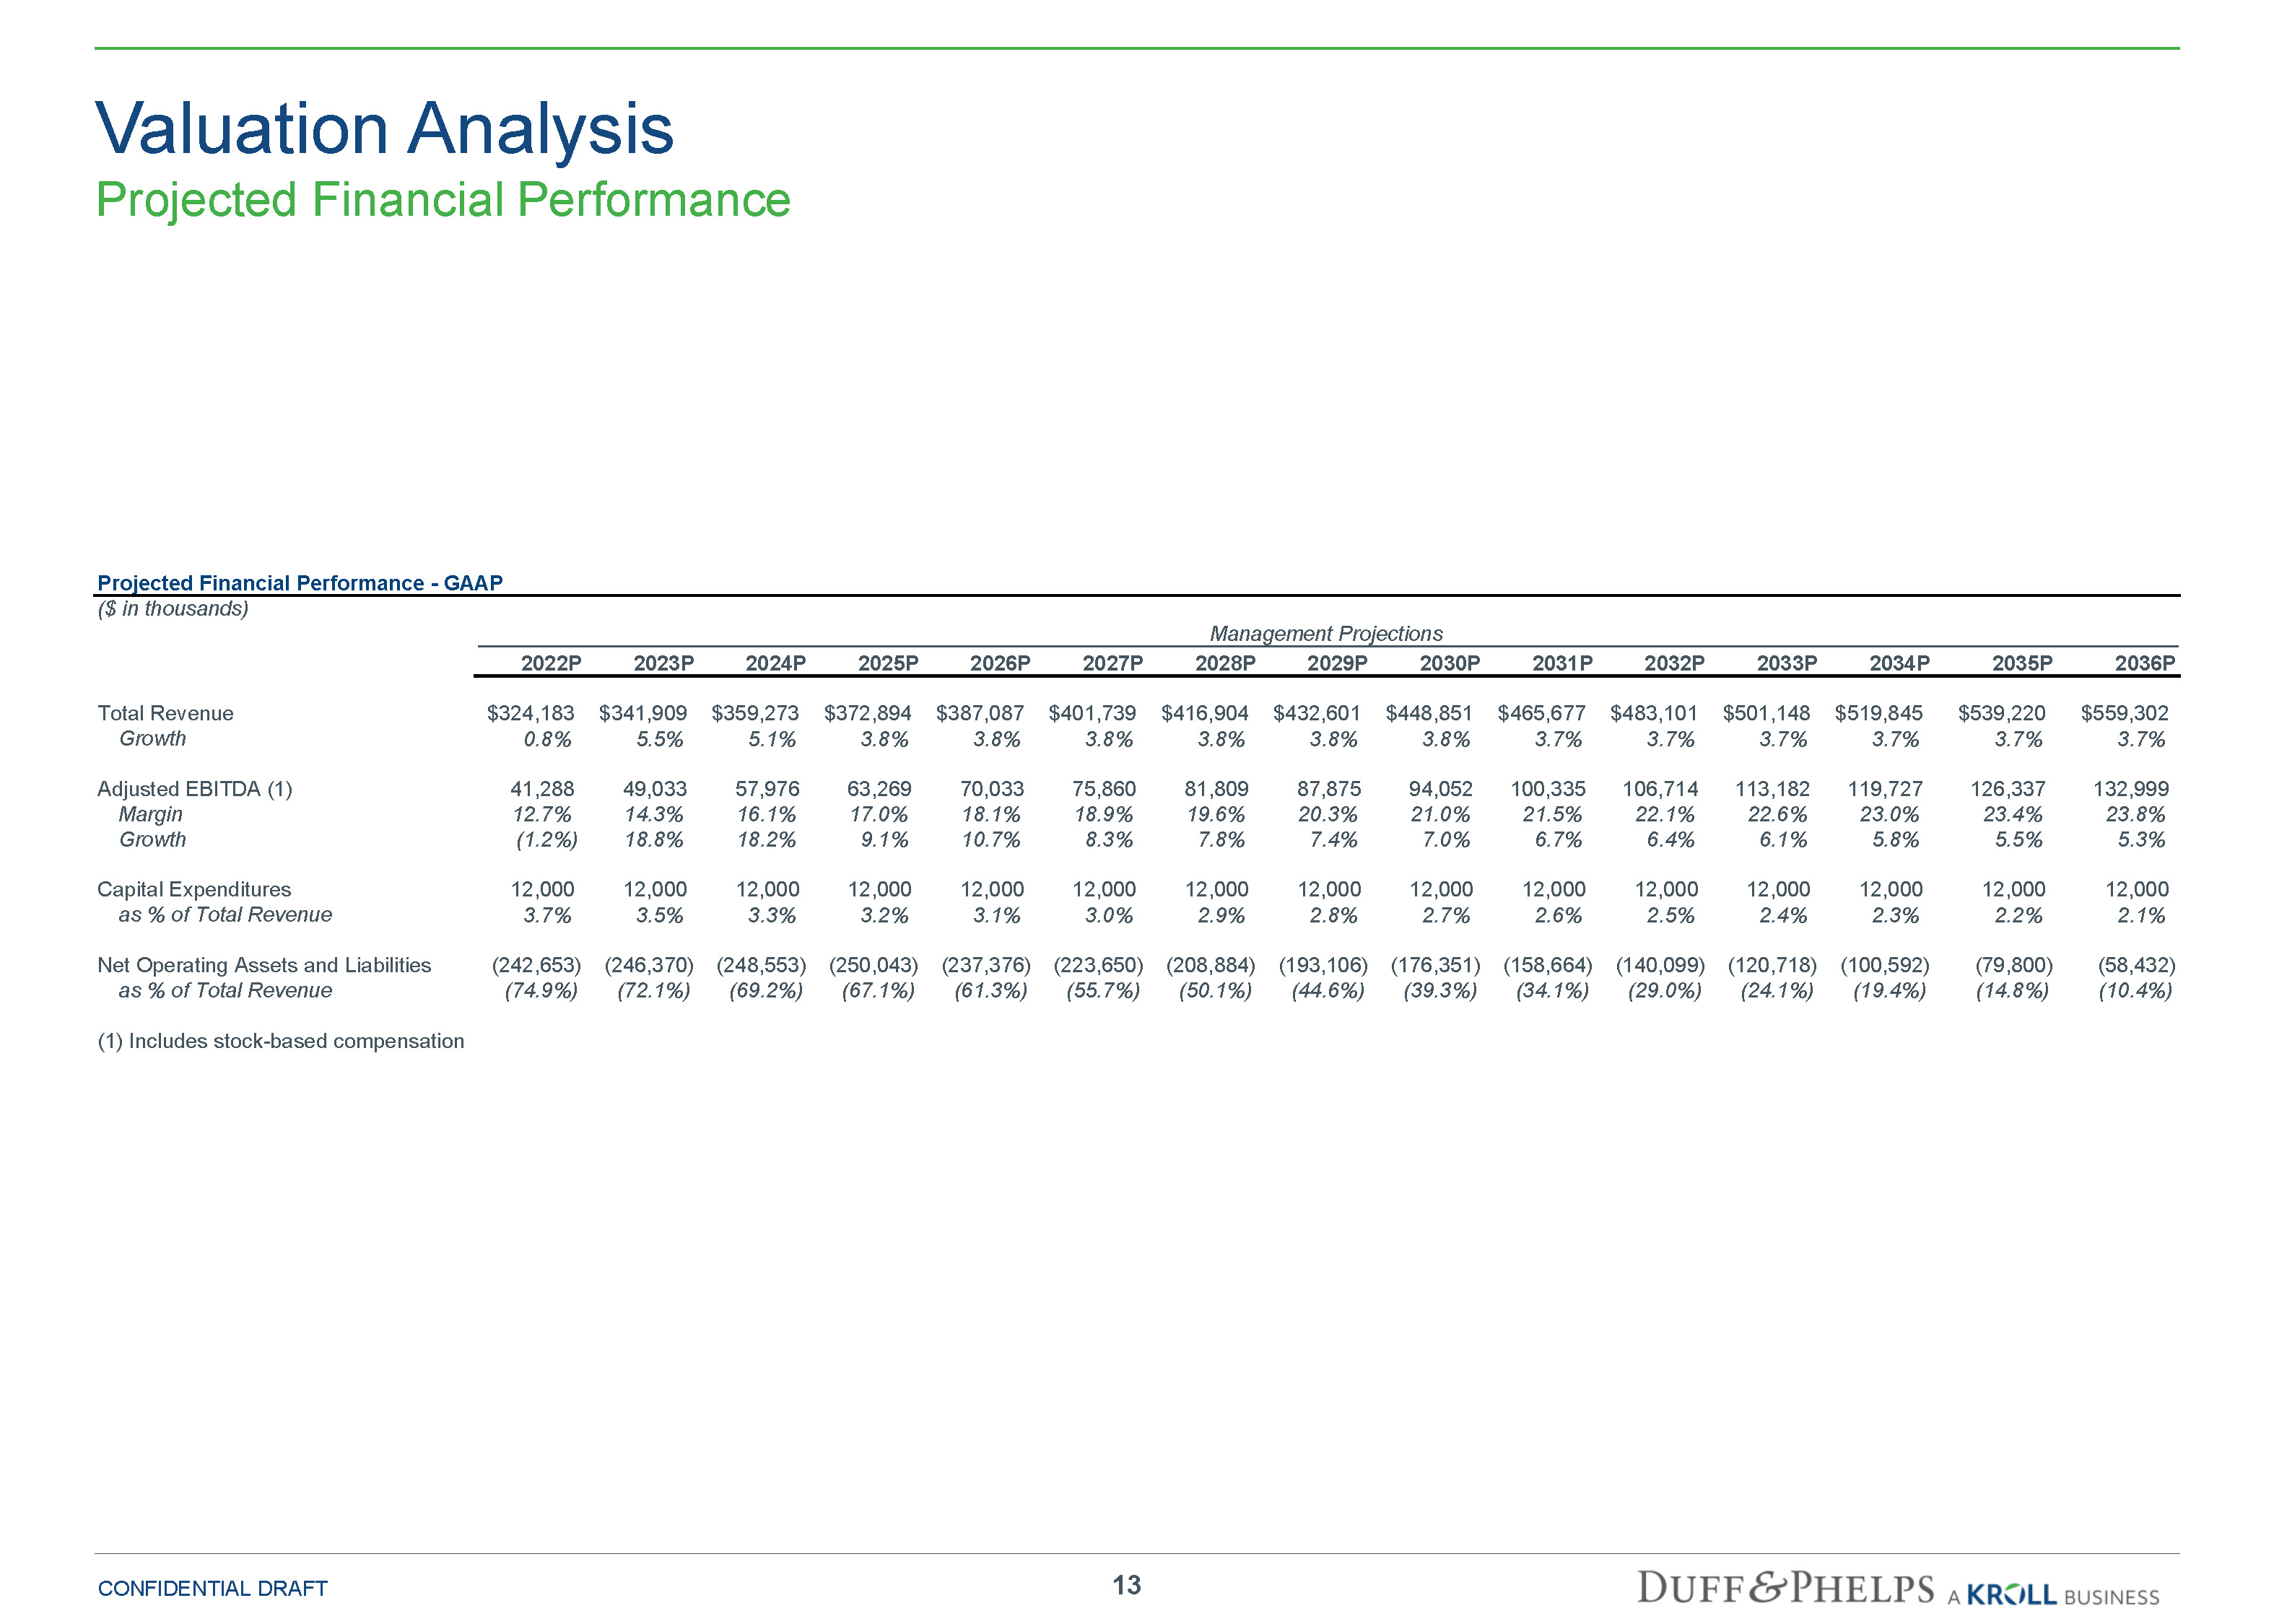
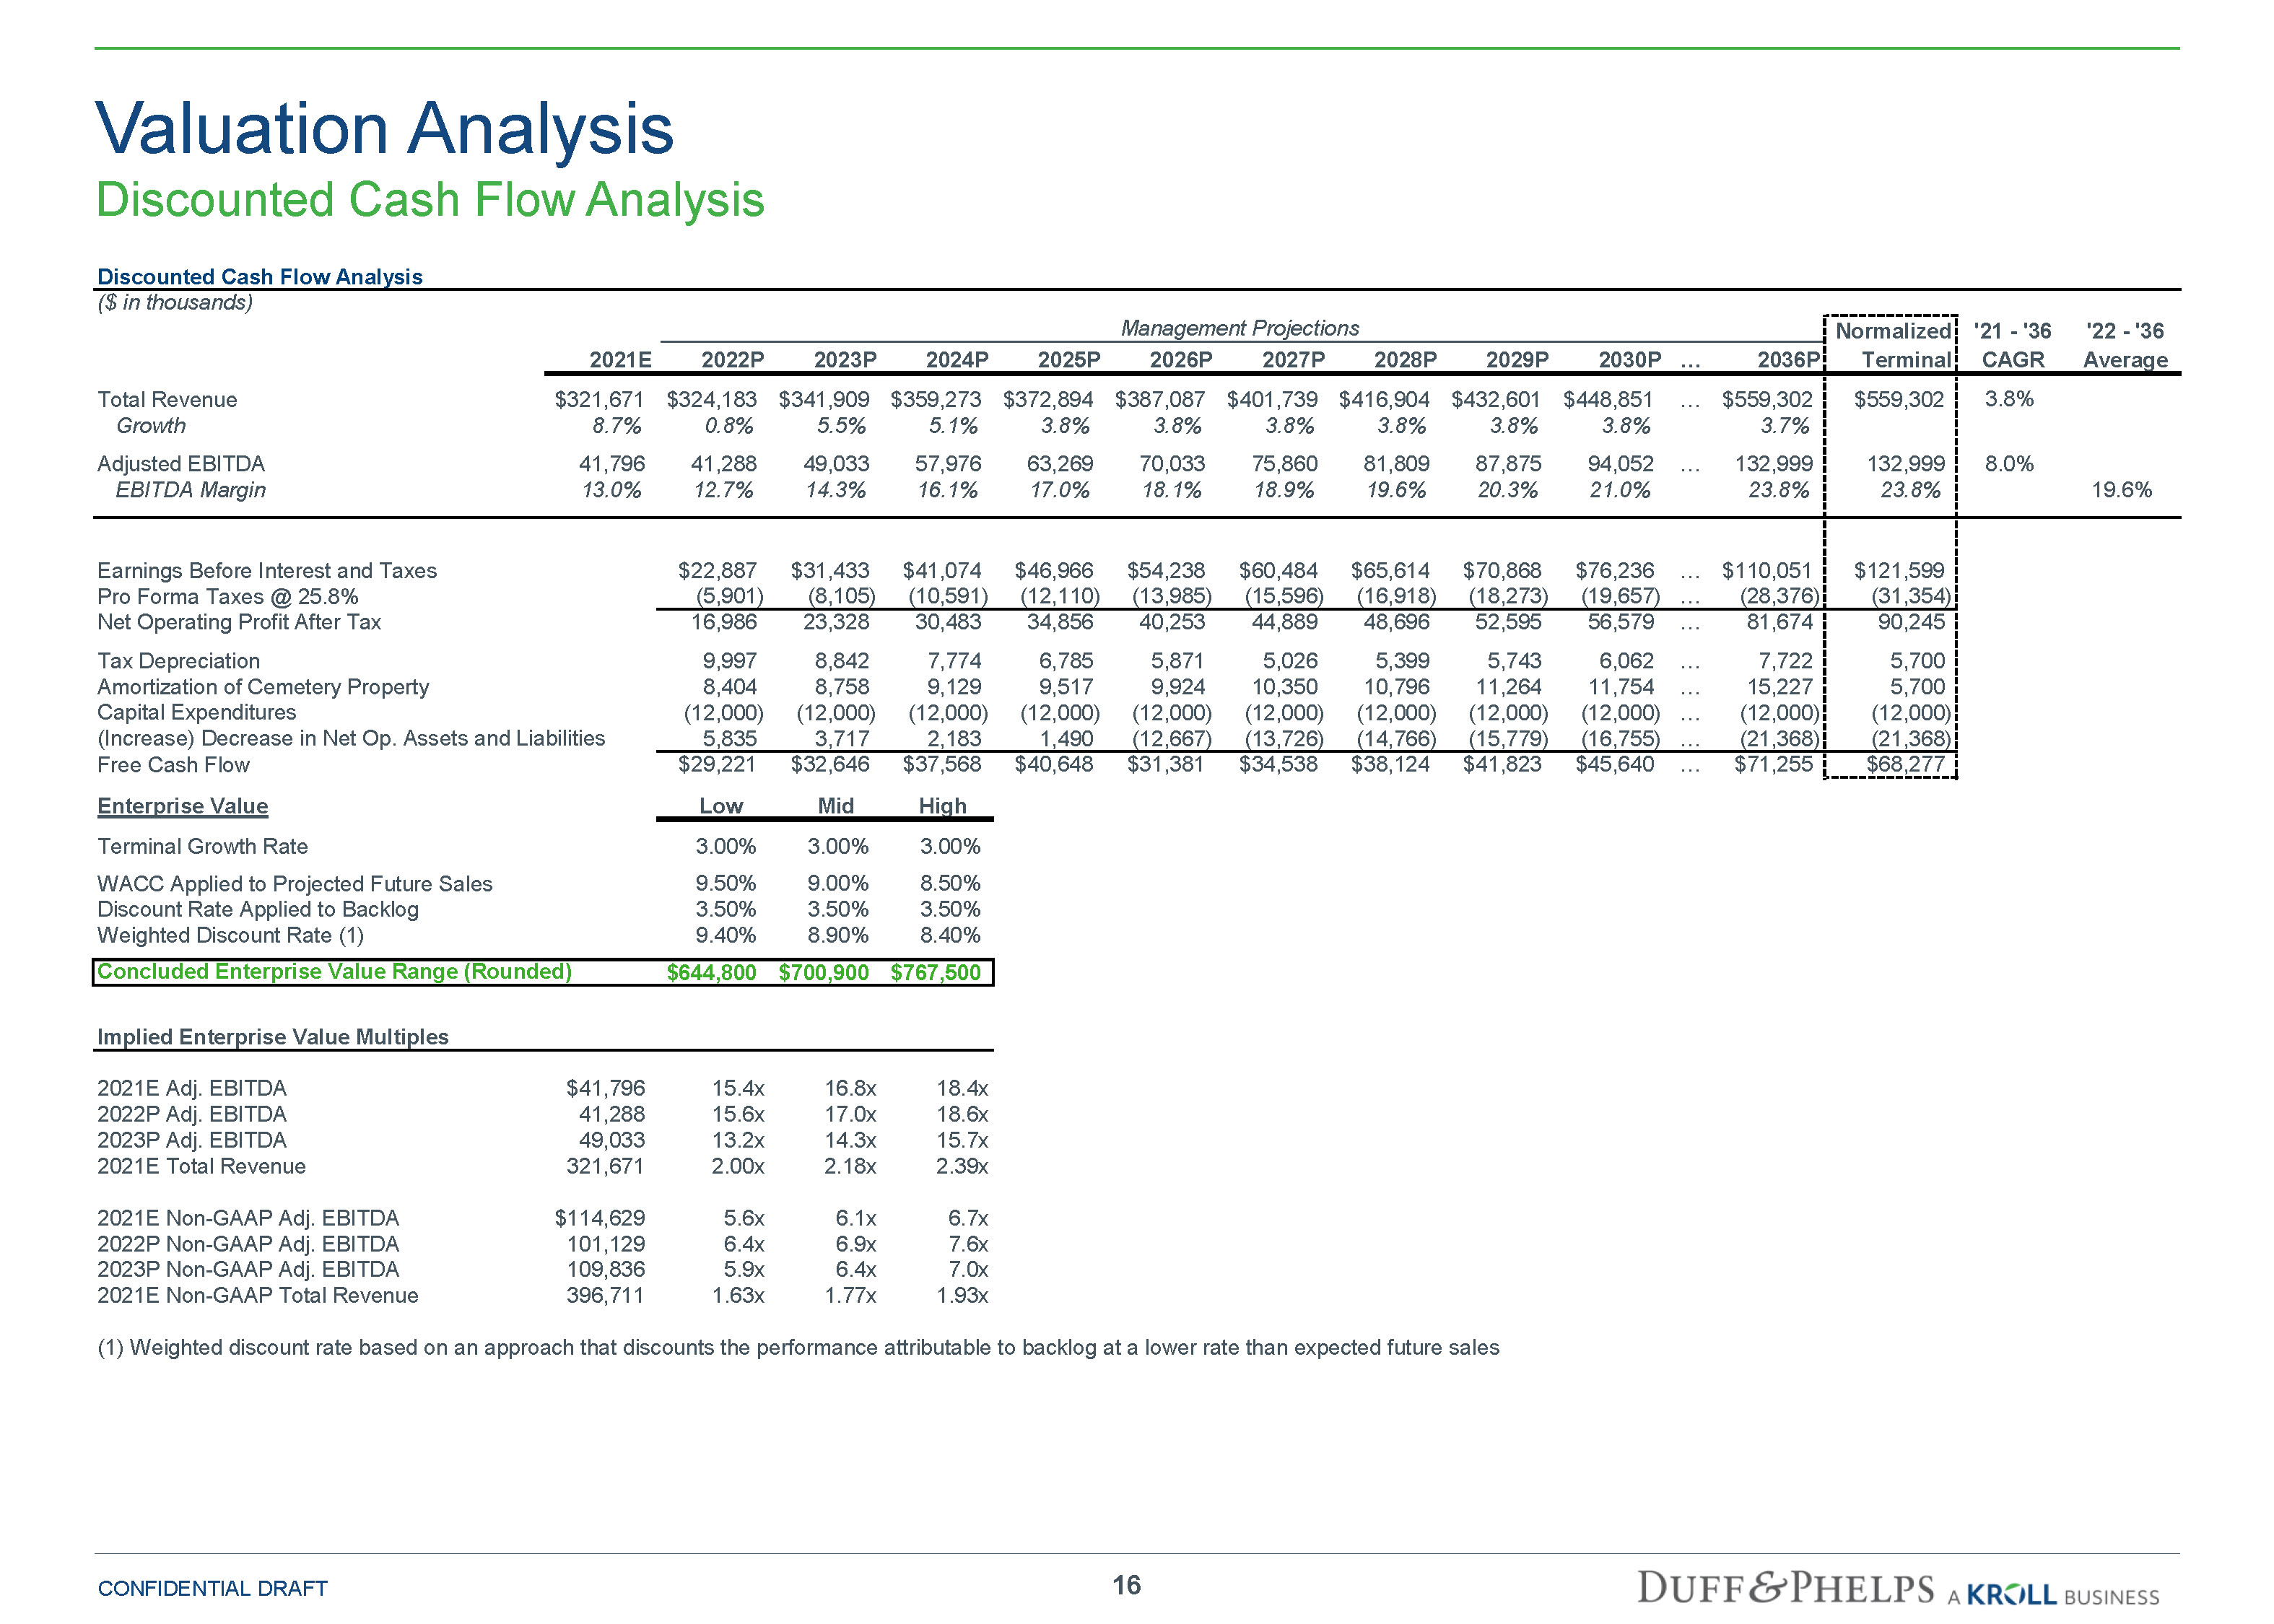
Valuation Analysis Discounted Cash Flow Analysis Discounted Cash Flow Analysis ($ in thousands) Management Projections Normalized '21 - '36 '22 - '36 Terminal Growth Rate 3.00% 3.00% 3.00% WACC Applied to Projected Future Sales 9.50% 9.00% 8.50% Discount Rate Applied to Backlog 3.50% 3.50% 3.50% Weighted Discount Rate (1) 9.40% 8.90% 8.40% Concluded Enterprise Value Range (Rounded) $644,800 $700,900 $767,500 Implied Enterprise Value Multiples 2021E Adj. EBITDA $41,796 15.4x 16.8x 18.4x 2022P Adj. EBITDA 41,288 15.6x 17.0x 18.6x 2023P Adj. EBITDA 49,033 13.2x 14.3x 15.7x 2021E Total Revenue 321,671 2.00x 2.18x 2.39x 2021E Non-GAAP Adj. EBITDA $114,629 5.6x 6.1x 6.7x 2022P Non-GAAP Adj. EBITDA 101,129 6.4x 6.9x 7.6x 2023P Non-GAAP Adj. EBITDA 109,836 5.9x 6.4x 7.0x 2021E Non-GAAP Total Revenue 396,711 1.63x 1.77x 1.93x (1) Weighted discount rate based on an approach that discounts the performance attributable to backlog at a lower rate than expected future sales 2021E 2022P 2023P 2024P 2025P 2026P 2027P 2028P 2029P 2030P … 2036P Terminal CAGR Average Total Revenue $321,671 $324,183 $341,909 $359,273 $372,894 $387,087 $401,739 $416,904 $432,601 $448,851 … $559,302 $559,302 3.8% Growth 8.7% 0.8% 5.5% 5.1% 3.8% 3.8% 3.8% 3.8% 3.8% 3.8% 3.7% Adjusted EBITDA 41,796 41,288 49,033 57,976 63,269 70,033 75,860 81,809 87,875 94,052 … 132,999 132,999 8.0% EBITDA Margin 13.0% 12.7% 14.3% 16.1% 17.0% 18.1% 18.9% 19.6% 20.3% 21.0% 23.8% 23.8% 19.6% Earnings Before Interest and Taxes $22,887 $31,433 $41,074 $46,966 $54,238 $60,484 $65,614 $70,868 $76,236 … $110,051 $121,599 Pro Forma Taxes @ 25.8% (5,901) (8,105) (10,591) (12,110) (13,985) (15,596) (16,918) (18,273) (19,657) … (28,376) (31,354) Net Operating Profit After Tax 16,986 23,328 30,483 34,856 40,253 44,889 48,696 52,595 56,579 … 81,674 90,245 Tax Depreciation 9,997 8,842 7,774 6,785 5,871 5,026 5,399 5,743 6,062 … 7,722 5,700 Amortization of Cemetery Property 8,404 8,758 9,129 9,517 9,924 10,350 10,796 11,264 11,754 … 15,227 5,700 Capital Expenditures (12,000) (12,000) (12,000) (12,000) (12,000) (12,000) (12,000) (12,000) (12,000) … (12,000) (12,000) (Increase) Decrease in Net Op. Assets and Liabilities 5,835 3,717 2,183 1,490 (12,667) (13,726) (14,766) (15,779) (16,755) … (21,368) (21,368) Free Cash Flow $29,221 $32,646 $37,568 $40,648 $31,381 $34,538 $38,124 $41,823 $45,640 … $71,255 $68,277 Enterprise Value Low Mid High 13 CONFIDENTIAL DRAFT
