
Fourth Quarter and Full Year 2023 Investor Presentation February 2024 CSE: TRUL OTCQX: TCNNF
www.trulieve.com 2 Forward Looking Statements and Industry Data Unless the context otherwise requires, the terms “Trulieve,” “we,” “us” and “our” in this presentation refer to Trulieve Cannabis Corp. and its subsidiaries. Certain statements in this presentation constitute forward-looking statements within the meaning of the U.S. Private Securities Litigation Reform Act of 1995 and applicable Canadian securities legislation (collectively herein referred to as “forward-looking statements”), which can often be identified by words such as “will”, “may”, “estimate”, “expect”, “plan”, “project”, “intend”, “anticipate” and other words indicating that the statements are forward-looking. These forward-looking statements relate to Trulieve’s expectations or forecasts of business, operations, financial performance, prospects, and other plans, intentions, expectations, estimates, and beliefs and include statements regarding Trulieve’s 2023 objectives for cash generation and preservation and investment, Trulieve’s financial targets, and its plans for potential acquisitions and expansion of the Company’s operations. Such forward-looking statements are expectations only and are subject to known and unknown risks, uncertainties and other important factors, including, but not limited to, risk factors included in this presentation, that could cause the Company’s actual results, performance or achievements or industry results to differ materially from any future results, performance or achievements implied by such forward-looking statements. Such risks and uncertainties include, among others, dependence on obtaining and maintaining regulatory approvals, including acquiring and renewing state, local or other licenses; engaging in activities which currently are illegal under United States federal law and the uncertainty of existing protection from United States federal or other prosecution; regulatory or political change such as changes in applicable laws and regulations, including United States state-law legalization, particularly in Florida, due to inconsistent public opinion, perception of the medical-use and adult-use cannabis industry, bureaucratic delays or inefficiencies or any other reasons; any other factors or developments which may hinder market growth; reliance on management; and the effect of capital market conditions and other factors on capital availability; competition, including from more established or better financed competitors; and the need to secure and maintain corporate alliances and partnerships, including with customers and suppliers. These factors should be considered carefully, and readers are cautioned not to place undue reliance on such forward-looking statements. You are cautioned not to place undue reliance upon any forward-looking statements, which speak only as of the date made. Although it may voluntarily do so from time to time, the Company undertakes no commitment to update or revise the forward-looking statements, whether as a result of new information, future events or otherwise, except as required by applicable securities laws. Unless otherwise noted, the forecasted industry and market data contained herein are based upon management estimates and industry and market publications and surveys. The information from industry and market publications has been obtained from sources believed to be reliable, but there can be no assurance as to the accuracy or completeness of the included information. The Company has not independently verified any of the data from third-party sources, nor has the Company ascertained the underlying economic assumptions relied upon therein. While such information is believed to be reliable for the purposes used herein, the Company makes no representation or warranty with respect to the accuracy of such information. PLEASE NOTE: MARIJUANA IS ILLEGAL UNDER U.S. FEDERAL LAW, INCLUDING ITS CONSUMPTION, POSSESSION, CULTIVATION, DISTRIBUTION, MANUFACTURING, DISPENSING, AND POSSESSION WITH INTENT TO DISTRIBUTE. Forward-looking statements made in this document are made only as of the date of their initial publication, and the Company undertakes no obligation to publicly update any of these forward-looking statements as actual events unfold.
www.trulieve.com 3 Management’s Use of Non-GAAP Financial Measures In addition to our results determined in accordance with GAAP, we supplement our results with non-GAAP financial measures, including adjusted net income, adjusted earnings per share, adjusted EBITDA, and free cash flow. Our management uses these non-GAAP financial measures in conjunction with GAAP financial measures to evaluate our operating results and financial performance. We believe these measures are useful to investors as they are widely used measures of performance and can facilitate comparison to other companies. These non-GAAP financial measures are not and should not be considered as measures of liquidity. These non-GAAP financial measures have limitations as analytical tools in that they do not reflect all of the amounts associated with our results of operations as determined in accordance with GAAP. Because of these limitations, these non-GAAP financial measures should be considered along with GAAP financial performance measures. The presentation of these non-GAAP financial measures is not intended to be considered in isolation or as a substitute for, or superior to, financial information prepared and presented in accordance with GAAP. Investors are encouraged to review the reconciliation of these non-GAAP financial measures to their most directly comparable GAAP financial measures. A reconciliation of the non-GAAP financial measures to such GAAP measures can be found below. These non-GAAP financial measures should be considered supplemental to, and not a substitute for, our reported financial results prepared in accordance with GAAP.
www.trulieve.com 4 Agenda • Full Year and Fourth Quarter 2023 Financial Highlights • Full Year and Fourth Quarter 2023 Operational Highlights • Retail Highlights • Recent Developments • Tax Position • 2024 Objectives • Financial Targets • Financial Highlights

www.trulieve.com 5 Full Year 2023 Financial Highlights* • Revenue $1.13 billion, with 96% revenue from retail sales • GAAP gross profit of $589 million and 52% gross margin • SG&A expenses of $386 million, a decrease of $61 million in 2023 • Net loss of $527 million • Adjusted net loss of $70 million excludes non-recurring charges, asset and goodwill impairments, disposals and discontinued operations • Cash flow from operations of $202 million and free cash flow of $161 million • Adjusted EBITDA of $322 million or 29% of revenue • Purchased $57 million face value senior secured 2026 notes for USD $47.6 million in September, which represents a 16.5% discount to par, plus accrued interest • Cash as of December 31, 2023 of approximately $208 million * Adjusted net loss, adjusted EBITDA and free cash flow are Non-GAAP financial measures. See slides 17-19 for reconciliation to GAAP for all Non-GAAP financial measures. Numbers may not sum perfectly due to rounding.
www.trulieve.com 6 Fourth Quarter 2023 Financial Highlights* • Revenue $287 million, up 4% sequentially with 95% revenue from retail sales • GAAP gross profit of $154 million and 54% gross margin, improved by 2% sequentially • SG&A expenses of $96 million or 34% of revenue • Net loss of $33 million • Adjusted net loss of $23 million excludes non-recurring charges, asset impairments, disposals and discontinued operations • Cash flow from operations of $131 million and free cash flow of $122 million • EBITDA of $73 million or 25% of revenue and adjusted EBITDA of $88 million or 31% of revenue • Redeemed $130 million of senior secured notes due June 18, 2024 on December 1, 2023 • Closed $25 million five-year mortgage financing at 8.31% interest • Filed amended federal tax returns for 2019, 2020, and 2021 claiming $143 million of refunds, also filed corresponding amended state returns claiming $31 million of refunds • Received $62 million in refunds in the fourth quarter and a total of $113 million in refunds to date alongside one rejection notice in the amount of $1.2 million * Adjusted net loss, adjusted EBITDA, and free cash flow are Non-GAAP financial measures. See slides 17-19 for reconciliation to GAAP for all Non-GAAP financial measures. Numbers may not sum perfectly due to rounding.
www.trulieve.com 7 Full Year and Fourth Quarter 2023 Operational Highlights • Launched adult-use sales in Connecticut and Maryland and opened new markets with medical dispensaries in Georgia and Ohio • Exited California retail assets and operations in Massachusetts as part of cash preservation and generation plan to bolster business resilience • Opened 17 dispensaries in 2023, increasing retail footprint to 192 retail locations nationwide at year end, with 32% of retail locations outside of the state of Florida
www.trulieve.com 8 Retail Highlights • 2023 Retail revenue $1.1 billion • Sold 45 million branded products in 2023 • Fourth quarter retail revenue increased 4% sequentially to $274 million • Customer retention 66% companywide • Customer retention 74% medical only • December traffic exceeded third quarter average by 100,000 • December basket was 5% higher than q3:23 average • Units sold increased by 4% sequentially in q4:23 • Exited year with 32% of retail locations outside of the state of Florida
www.trulieve.com 9 Recent Developments • Smart and Safe Florida campaign for adult use presented oral arguments to the Florida Supreme Court in November; the deadline for a ruling is April 1, 2024 • Added two executives to the leadership team in January, Wes Getman, Chief Financial Officer, and Marie Zhang, Chief Operating Officer • Opened one retail location in Pinellas Park, Florida • Currently operate 193 retail dispensaries and over 4 million square feet of cultivation and processing capacity in the United States
www.trulieve.com 10 Tax Position • In Q4, Trulieve filed amended federal tax returns for 2019, 2020, and 2021 claiming $143 million of refunds and corresponding amended state returns claiming $31 million of refunds • Amended returns were supported by legal interpretations that challenge the tax liability under Section 280E of the Internal Revenue Code • Refund checks of approximately $113 million received to date of $174 million claimed • $62 million in Q4:23 and $50 million in Q1:24 • Received one rejection notice for return seeking $1.2 million refund • Trulieve continues to make tax payments as a customary U.S. taxpayer without tax payments associated with 280E of the tax code until final resolution is reached • While challenge is ongoing, taxes are swept into an uncertain tax position • Balance sheet includes refund checks received, overpayments made in 2022 and 2023, and estimated payments made in 2023 • Balance sheet uncertain tax position was $180 million at December 31, 2023, with $152 million related to this tax challenge • Cash flow reflects net of cash taxes paid and refunds received • Fourth quarter reported operating cash flow would have been an estimated $32 million without the $62 million refund checks and with $37 million tax inclusive of 280E tax liability Numbers may not sum perfectly due to rounding.
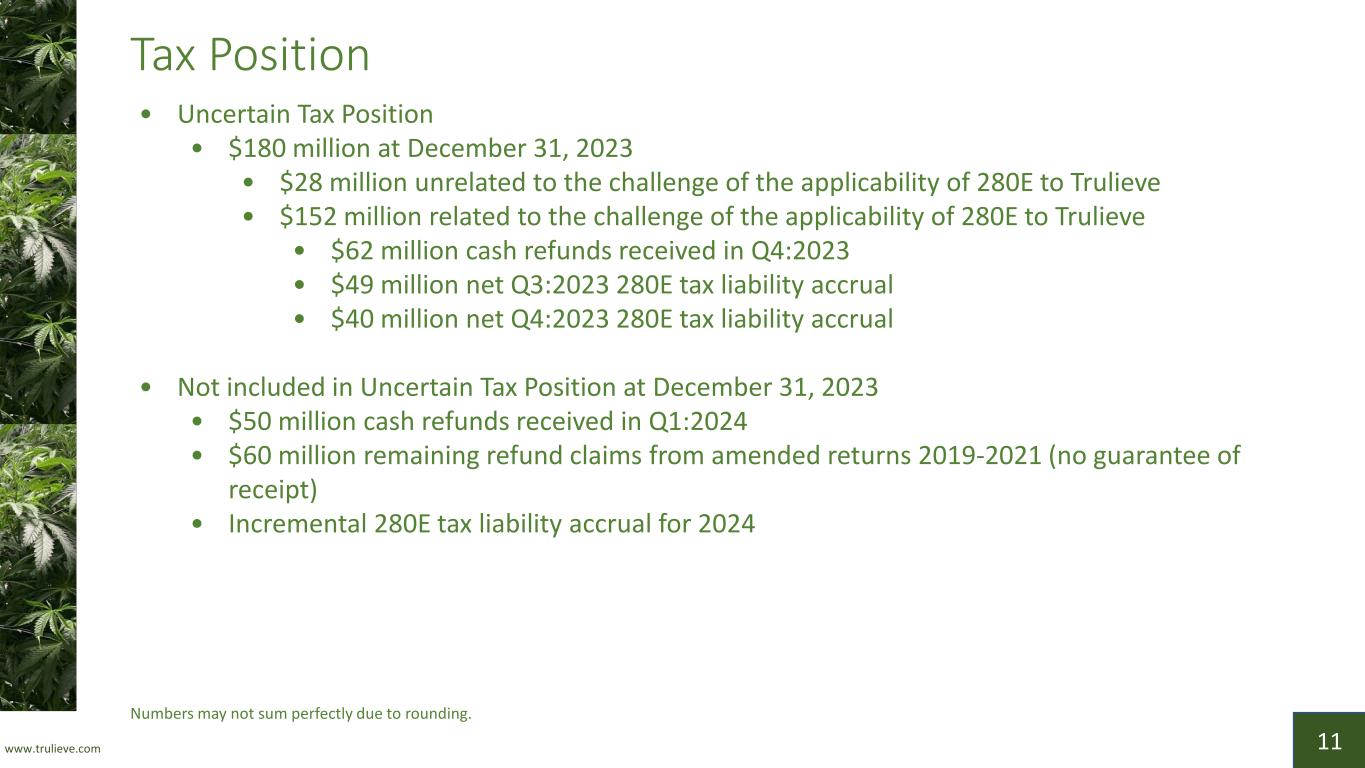
www.trulieve.com 11 Tax Position • Uncertain Tax Position • $180 million at December 31, 2023 • $28 million unrelated to the challenge of the applicability of 280E to Trulieve • $152 million related to the challenge of the applicability of 280E to Trulieve • $62 million cash refunds received in Q4:2023 • $49 million net Q3:2023 280E tax liability accrual • $40 million net Q4:2023 280E tax liability accrual • Not included in Uncertain Tax Position at December 31, 2023 • $50 million cash refunds received in Q1:2024 • $60 million remaining refund claims from amended returns 2019-2021 (no guarantee of receipt) • Incremental 280E tax liability accrual for 2024 Numbers may not sum perfectly due to rounding.
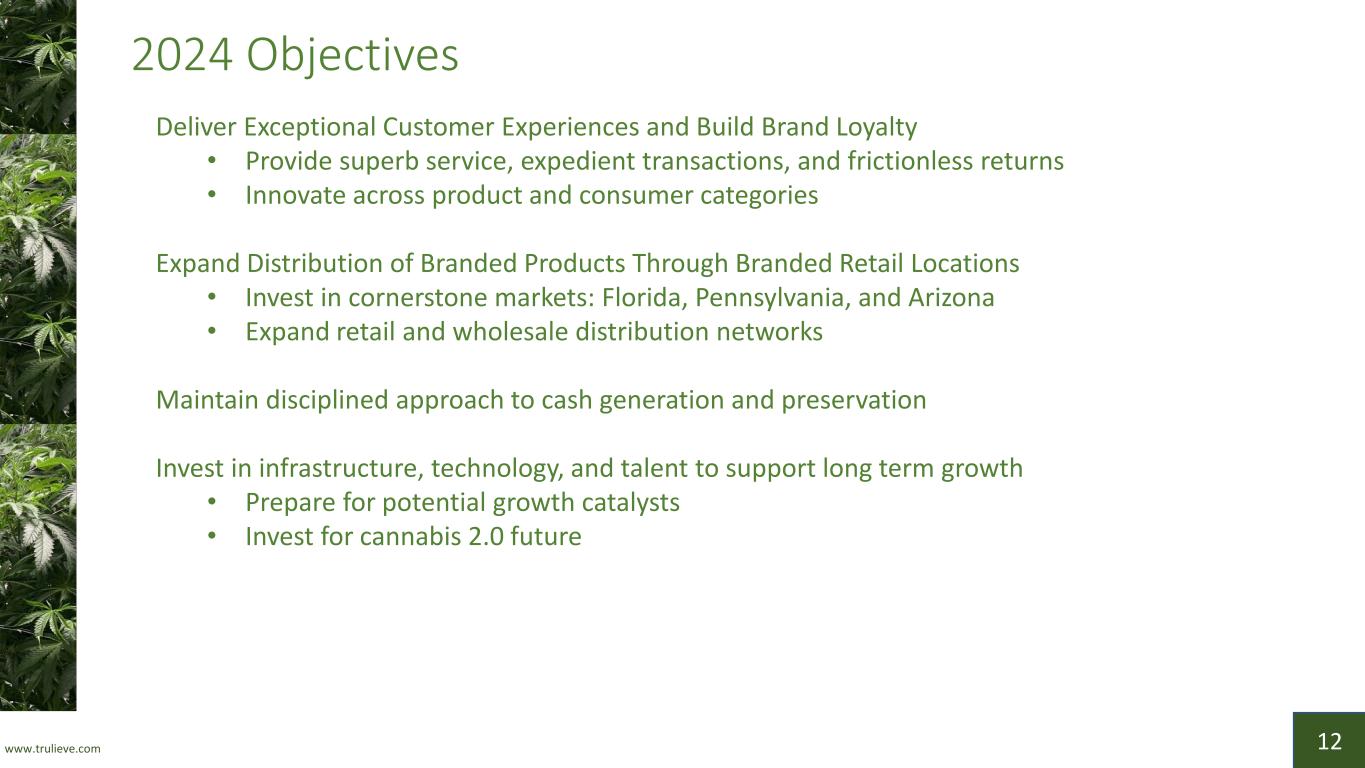
www.trulieve.com 12 2024 Objectives Deliver Exceptional Customer Experiences and Build Brand Loyalty • Provide superb service, expedient transactions, and frictionless returns • Innovate across product and consumer categories Expand Distribution of Branded Products Through Branded Retail Locations • Invest in cornerstone markets: Florida, Pennsylvania, and Arizona • Expand retail and wholesale distribution networks Maintain disciplined approach to cash generation and preservation Invest in infrastructure, technology, and talent to support long term growth • Prepare for potential growth catalysts • Invest for cannabis 2.0 future
Financials
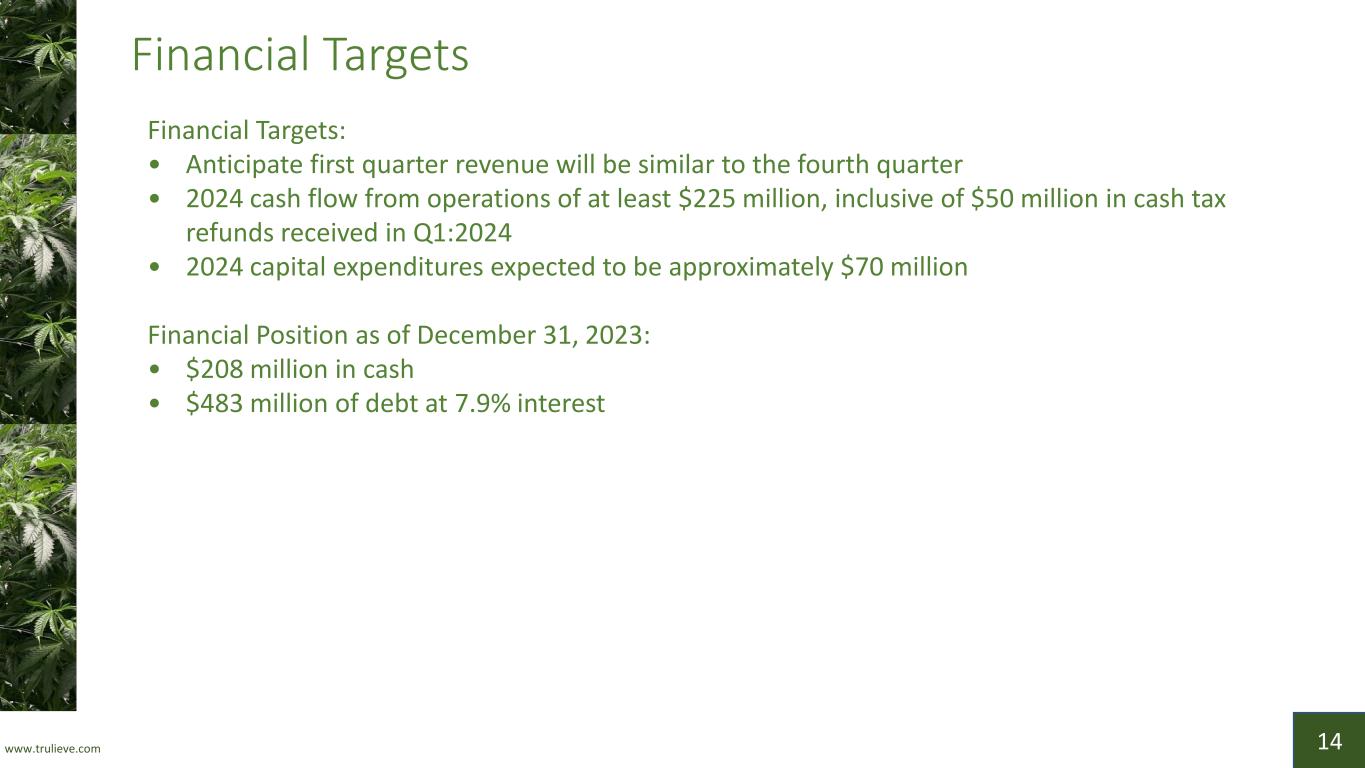
www.trulieve.com 14 Financial Targets Financial Targets: • Anticipate first quarter revenue will be similar to the fourth quarter • 2024 cash flow from operations of at least $225 million, inclusive of $50 million in cash tax refunds received in Q1:2024 • 2024 capital expenditures expected to be approximately $70 million Financial Position as of December 31, 2023: • $208 million in cash • $483 million of debt at 7.9% interest

www.trulieve.com 15 Financial Highlights* *Adjusted net income, adjusted EPS, adjusted EBITDA and adjusted EBITDA Margin are Non-GAAP financial measures. See slides 17-19 for reconciliation to GAAP for all Non-GAAP financial measures. **Includes discontinued operations. INCOME STATEMENT HIGHLIGHTS (USD millions, except per share data) Q4:23 Q3:23 Q2:23 Q1:23 Q4:22 Q3:22 Q2:22 Q1:22 2023 2022 Revenue 287.0 275.2 281.8 285.2 298.5 295.4 313.8 310.6 1,129.2 1,218.2 Gross Profit 153.9 142.9 141.6 150.2 157.1 168.7 183.4 179.9 588.6 689.1 Gross Margin 53.6 % 51.9 % 50.3 % 52.6 % 52.6 % 57.1 % 58.4 % 57.9 % 52.1 % 56.6 % Adjusted Gross Profit 153.9 143.1 143.4 150.2 161.1 172.5 183.2 184.6 590.6 701.4 Adjusted Gross Margin 53.6 % 52.0 % 50.9 % 52.7 % 54.0 % 58.4 % 58.4 % 59.5 % 52.3 % 57.6 % SG&A 96.3 93.9 96.0 100.0 122.8 111.9 107.5 104.9 386.2 447.0 SG&A as % Revenue 33.6 % 34.1 % 34.1 % 35.1 % 41.1 % 37.9 % 34.2 % 33.8 % 34.2 % 36.7 % Adjusted SG&A 83.7 84.6 81.1 86.7 96.0 90.4 90.5 93.5 336.1 370.4 Adjusted SG&A as % Revenue 29.2 % 30.7 % 28.8 % 30.4 % 32.2 % 30.6 % 28.8 % 30.1 % 29.8 % 30.4 % Depreciation and Amortization 27.2 27.0 26.1 29.6 29.8 29.5 29.4 27.8 109.8 116.4 Net (Loss) Income** (33.4) (25.4) (403.8) (64.1) (77.0) (114.6) (22.5) (32.0) (526.8) (246.1) Net (Loss) Income Continuing Operations (36.6) (22.9) (342.1) (34.3) (64.2) (72.6) (18.7) (27.0) (435.9) (182.6) Adjusted Net (Loss) Income (22.8) (14.7) (14.6) (17.7) (34.0) 7.9 2.8 4.7 (69.8) (18.7) EPS** (0.18) (0.13) (2.14) (0.34) (0.41) (0.61) (0.12) (0.17) (2.79) (1.31) EPS Continuing Operations (0.19) (0.12) (1.80) (0.18) (0.33) (0.38) (0.09) (0.14) (2.28) (0.95) Adjusted EPS (0.12) (0.08) (0.08) (0.09) (0.18) 0.04 0.01 0.03 (0.37) (0.10) Adjusted EBITDA 87.8 77.7 78.7 78.1 82.8 99.6 110.9 105.0 322.3 398.1 Adjusted EBITDA Margin 30.6 % 28.2 % 27.9 % 27.4 % 27.7 % 33.7 % 35.3 % 33.8 % 28.5 % 32.7 %
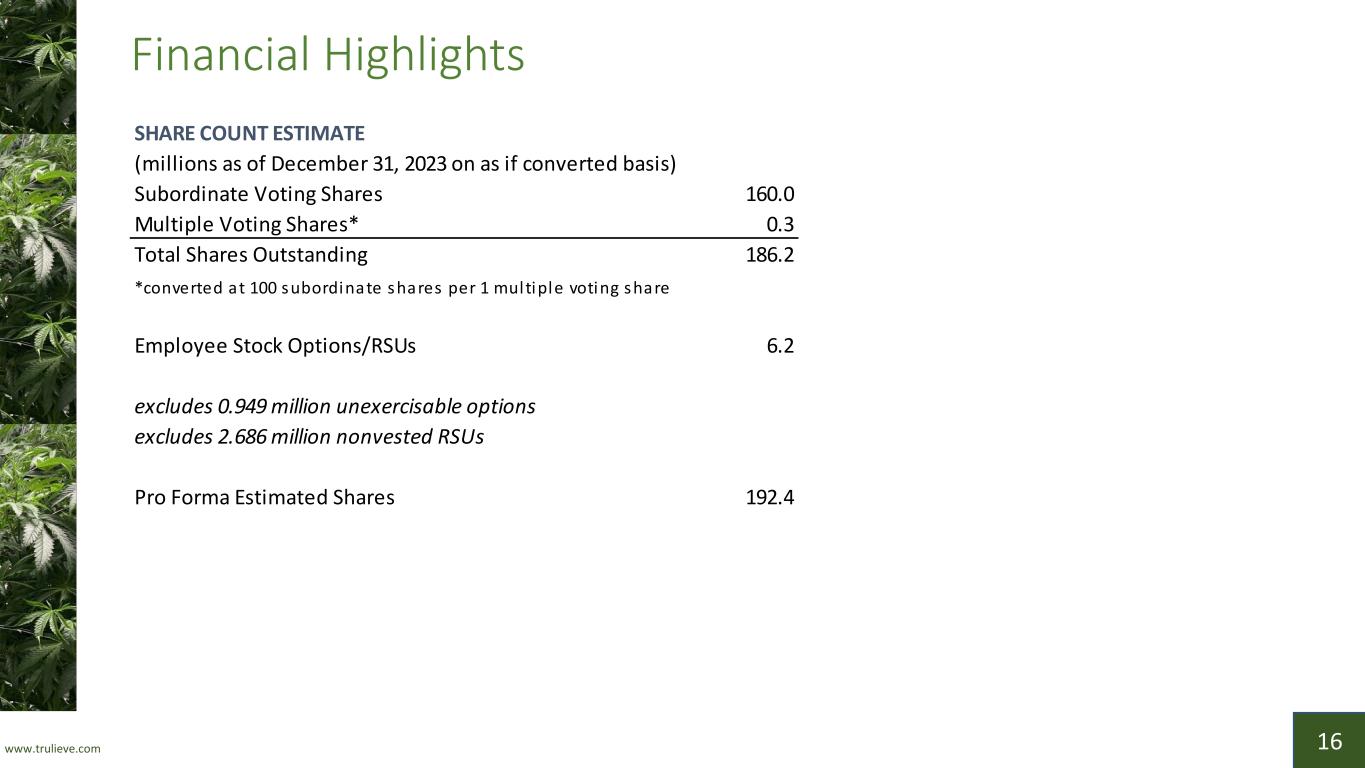
www.trulieve.com 16 Financial Highlights SHARE COUNT ESTIMATE Subordinate Voting Shares 160.0 Multiple Voting Shares* 0.3 Total Shares Outstanding 186.2 Employee Stock Options/RSUs 6.2 Pro Forma Estimated Shares 192.4 (millions as of December 31, 2023 on as if converted basis) *converted at 100 subordinate shares per 1 multiple voting share excludes 0.949 million unexercisable options excludes 2.686 million nonvested RSUs
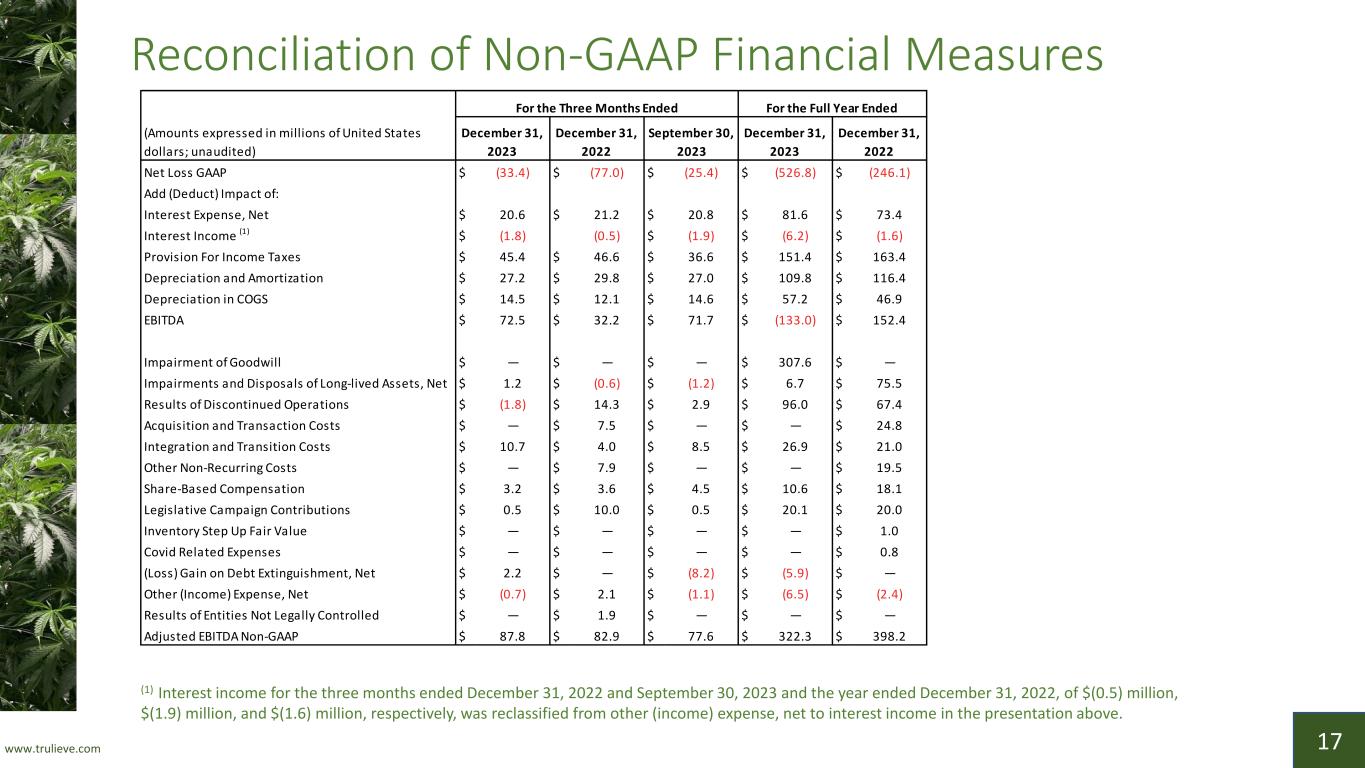
www.trulieve.com 17 Reconciliation of Non-GAAP Financial Measures (1) Interest income for the three months ended December 31, 2022 and September 30, 2023 and the year ended December 31, 2022, of $(0.5) million, $(1.9) million, and $(1.6) million, respectively, was reclassified from other (income) expense, net to interest income in the presentation above. Net Loss GAAP $ (33.4) $ (77.0) $ (25.4) $ (526.8) $ (246.1) Add (Deduct) Impact of: Interest Expense, Net $ 20.6 $ 21.2 $ 20.8 $ 81.6 $ 73.4 Interest Income (1) $ (1.8) (0.5) $ (1.9) $ (6.2) $ (1.6) Provision For Income Taxes $ 45.4 $ 46.6 $ 36.6 $ 151.4 $ 163.4 Depreciation and Amortization $ 27.2 $ 29.8 $ 27.0 $ 109.8 $ 116.4 Depreciation in COGS $ 14.5 $ 12.1 $ 14.6 $ 57.2 $ 46.9 EBITDA $ 72.5 $ 32.2 $ 71.7 $ (133.0) $ 152.4 Impairment of Goodwill $ — $ — $ — $ 307.6 $ — Impairments and Disposals of Long-lived Assets, Net $ 1.2 $ (0.6) $ (1.2) $ 6.7 $ 75.5 Results of Discontinued Operations $ (1.8) $ 14.3 $ 2.9 $ 96.0 $ 67.4 Acquisition and Transaction Costs $ — $ 7.5 $ — $ — $ 24.8 Integration and Transition Costs $ 10.7 $ 4.0 $ 8.5 $ 26.9 $ 21.0 Other Non-Recurring Costs $ — $ 7.9 $ — $ — $ 19.5 Share-Based Compensation $ 3.2 $ 3.6 $ 4.5 $ 10.6 $ 18.1 Legislative Campaign Contributions $ 0.5 $ 10.0 $ 0.5 $ 20.1 $ 20.0 Inventory Step Up Fair Value $ — $ — $ — $ — $ 1.0 Covid Related Expenses $ — $ — $ — $ — $ 0.8 (Loss) Gain on Debt Extinguishment, Net $ 2.2 $ — $ (8.2) $ (5.9) $ — Other (Income) Expense, Net $ (0.7) $ 2.1 $ (1.1) $ (6.5) $ (2.4) Results of Entities Not Legally Controlled $ — $ 1.9 $ — $ — $ — Adjusted EBITDA Non-GAAP $ 87.8 $ 82.9 $ 77.6 $ 322.3 $ 398.2 For the Full Year Ended December 31, 2022 December 31, 2023 (Amounts expressed in millions of United States dollars; unaudited) December 31, 2023 December 31, 2022 September 30, 2023 For the Three Months Ended
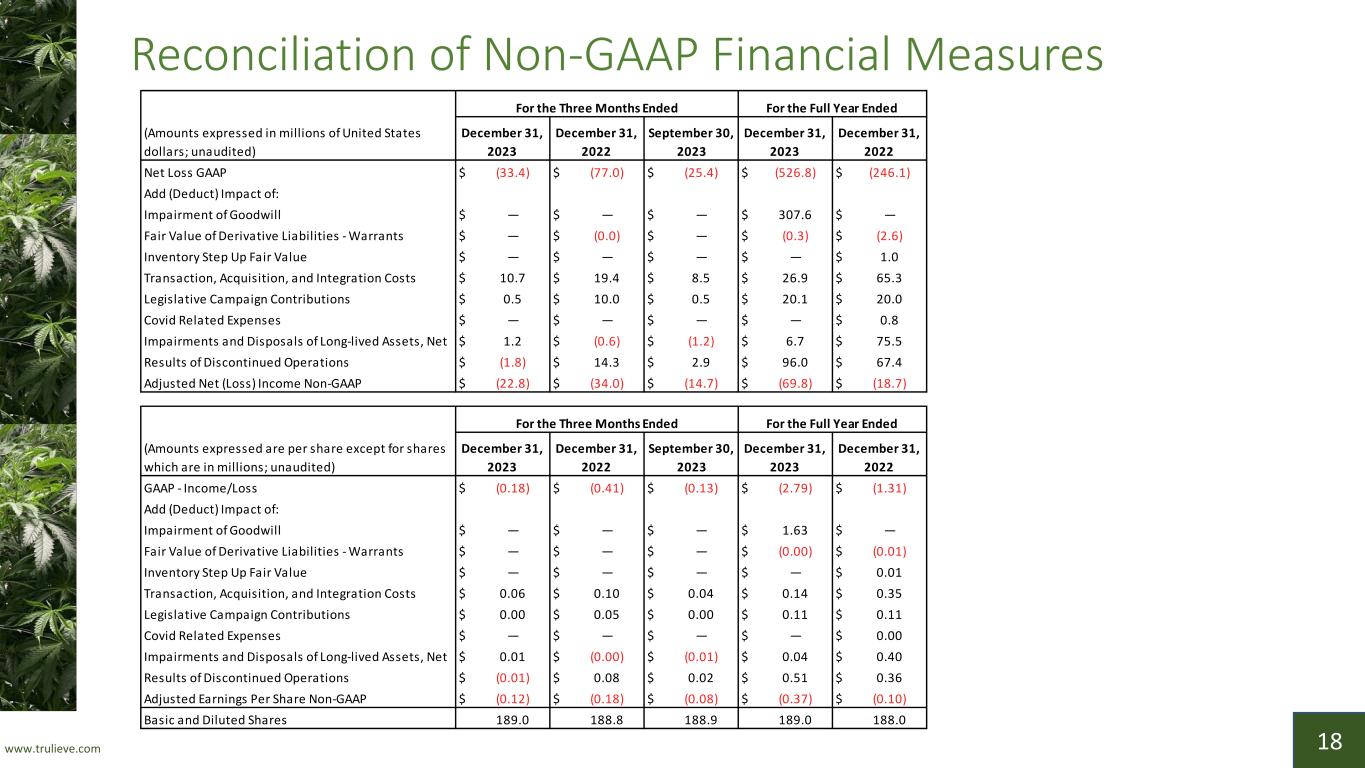
www.trulieve.com 18 Reconciliation of Non-GAAP Financial Measures Net Loss GAAP $ (33.4) $ (77.0) $ (25.4) $ (526.8) $ (246.1) Add (Deduct) Impact of: Impairment of Goodwill $ — $ — $ — $ 307.6 $ — Fair Value of Derivative Liabilities - Warrants $ — $ (0.0) $ — $ (0.3) $ (2.6) Inventory Step Up Fair Value $ — $ — $ — $ — $ 1.0 Transaction, Acquisition, and Integration Costs $ 10.7 $ 19.4 $ 8.5 $ 26.9 $ 65.3 Legislative Campaign Contributions $ 0.5 $ 10.0 $ 0.5 $ 20.1 $ 20.0 Covid Related Expenses $ — $ — $ — $ — $ 0.8 Impairments and Disposals of Long-lived Assets, Net $ 1.2 $ (0.6) $ (1.2) $ 6.7 $ 75.5 Results of Discontinued Operations $ (1.8) $ 14.3 $ 2.9 $ 96.0 $ 67.4 Adjusted Net (Loss) Income Non-GAAP $ (22.8) $ (34.0) $ (14.7) $ (69.8) $ (18.7) (Amounts expressed in millions of United States dollars; unaudited) December 31, 2023 For the Three Months Ended December 31, 2022 September 30, 2023 December 31, 2023 For the Full Year Ended December 31, 2022 GAAP - Income/Loss $ (0.18) $ (0.41) $ (0.13) $ (2.79) $ (1.31) Add (Deduct) Impact of: Impairment of Goodwill $ — $ — $ — $ 1.63 $ — Fair Value of Derivative Liabilities - Warrants $ — $ — $ — $ (0.00) $ (0.01) Inventory Step Up Fair Value $ — $ — $ — $ — $ 0.01 Transaction, Acquisition, and Integration Costs $ 0.06 $ 0.10 $ 0.04 $ 0.14 $ 0.35 Legislative Campaign Contributions $ 0.00 $ 0.05 $ 0.00 $ 0.11 $ 0.11 Covid Related Expenses $ — $ — $ — $ — $ 0.00 Impairments and Disposals of Long-lived Assets, Net $ 0.01 $ (0.00) $ (0.01) $ 0.04 $ 0.40 Results of Discontinued Operations $ (0.01) $ 0.08 $ 0.02 $ 0.51 $ 0.36 Adjusted Earnings Per Share Non-GAAP $ (0.12) $ (0.18) $ (0.08) $ (0.37) $ (0.10) Basic and Diluted Shares 189.0 188.8 188.9 189.0 188.0 For the Full Year EndedFor the Three Months Ended (Amounts expressed are per share except for shares which are in millions; unaudited) December 31, 2023 December 31, 2022 September 30, 2023 December 31, 2023 December 31, 2022
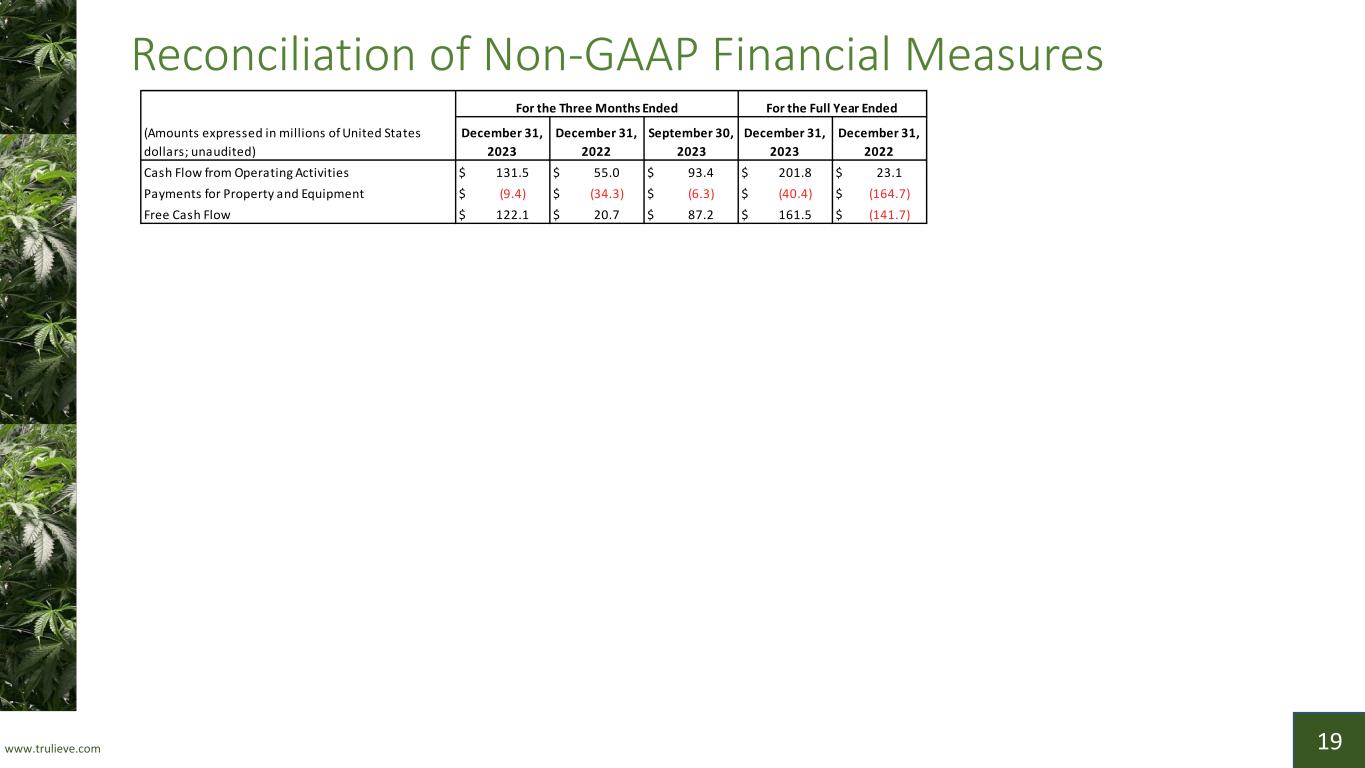
www.trulieve.com 19 Reconciliation of Non-GAAP Financial Measures Cash Flow from Operating Activities $ 131.5 $ 55.0 $ 93.4 $ 201.8 $ 23.1 Payments for Property and Equipment $ (9.4) $ (34.3) $ (6.3) $ (40.4) $ (164.7) Free Cash Flow $ 122.1 $ 20.7 $ 87.2 $ 161.5 $ (141.7) For the Full Year EndedFor the Three Months Ended (Amounts expressed in millions of United States dollars; unaudited) December 31, 2023 December 31, 2022 September 30, 2023 December 31, 2023 December 31, 2022
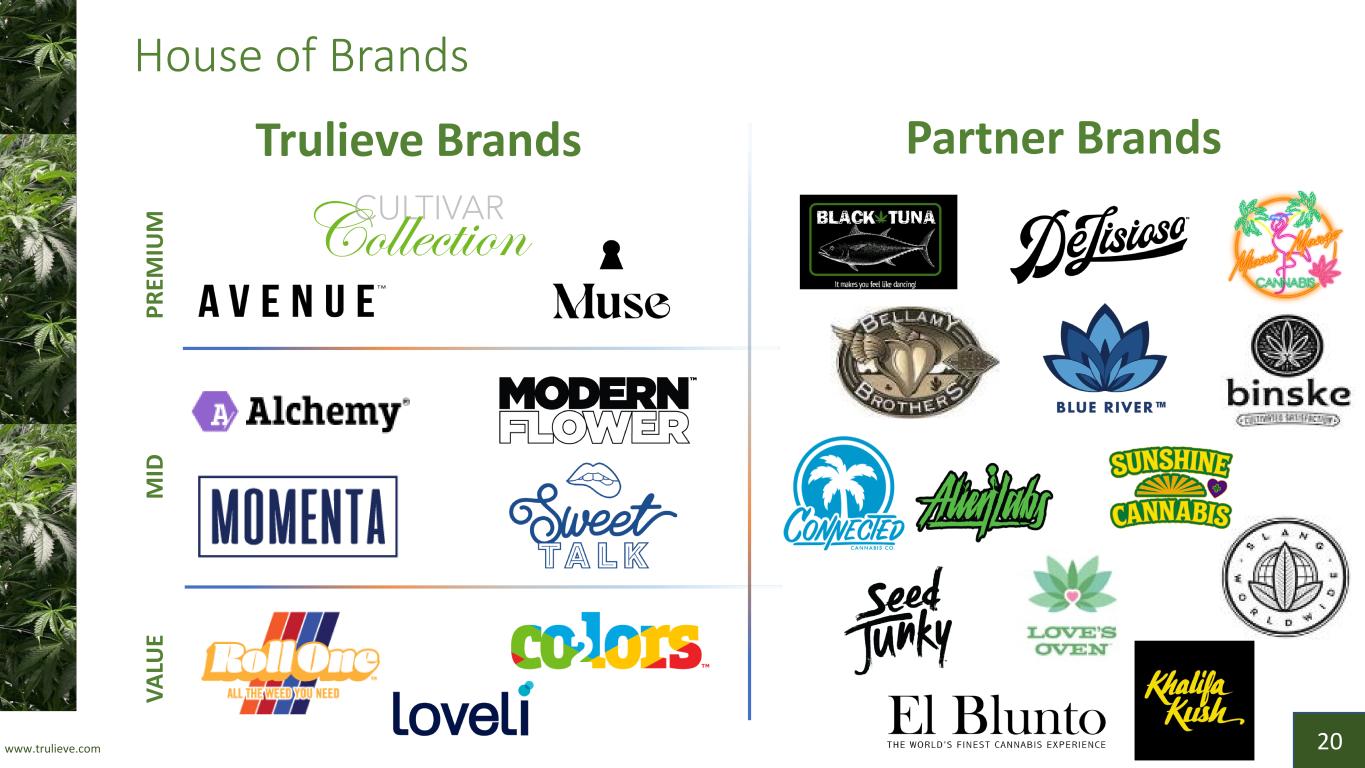
www.trulieve.com 20 House of Brands Trulieve Brands VA LU E M ID P RE M IU M Partner Brands

THANK YOU CSE: TRUL OTCQX: TCNNF @Trulieve/@Trulieve_IR ir@trulieve.com


