Exhibit 99.1

INVESTOR Presentation November 2024

Safe Harbor Statement and Disclaimer Forward - Looking Statements This presentation contains, and future oral and written statements by us and our management may contain, forward - looking stateme nts within the meaning of Section 27A of the Securities Act of 1933 and Section 21E of the Securities Exchange Act of 1934. These forward - looking statements represent plans, estimates, objectives, goals, guidelines, expectations, intentions, projections, and statements of our beliefs concerning future events, business plans, objectives, expected operati ng results, and the assumptions upon which those statements are based. Forward - looking statements include without limitation, any statement that may predict, forecast, indicate or imply fu ture results, performance or achievements, and are typically identified with words such as “may,” “could,” “should,” “will,” “would,” “believe,” “anticipate,” “estimate,” “expe ct, ” “aim,” “intend,” “plan,” or words or phases of similar meaning. We caution that the forward - looking statements are based largely on our expectations and are subject to a number of kno wn and unknown risks and uncertainties that are subject to change based on factors which are, in many instances, beyond our control. Such forward - looking statements are based o n various assumptions (some of which may be beyond our control) and are subject to risks and uncertainties, which change overtime, and other factors which could cause ac tua l results to differ materially from those currently anticipated. New risks and uncertainties may emerge from time to time, and it is not possible for us to predict their occurre nce or how they will affect us. If one or more of the factors affecting our forward - looking information and statements proves incorrect, then our actual results, performance or achievements could differ materially from those expressed in, or implied by, forward - looking information and statements contained in this presentation. Therefore, we caution you not to place un due reliance on our forward - looking information and statements. We disclaim any duty to revise or update the forward - looking statements, whether written or oral, to reflect actual results or changes in the factors affecting the forward - looking statements, except as specifically required by law. Industry Information This presentation includes statistical and other industry and market data that we obtained from government reports and other thi rd - party sources. Our internal data, estimates, and forecasts are based on information obtained from government reports, trade and business organizations and other contacts in t he markets in which we operate and our management’s understanding of industry conditions. Although we believe that this information (including the industry publications and thir d p arty research, surveys, and studies) is accurate and reliable, we have not independently verified such information. In addition, estimates, forecasts and assumptions are necessarily subjec t t o a high degree of uncertainty and risk due to a variety of factors. Finally, forward - looking information obtained from these sources is subject to the same qualifications and the addit ional uncertainties regarding the other forward - looking statements in this presentation. 2

Franchise Overview 3 1) There are 3 branches located in Middletown. Background ▪ Successfully completed IPO and NASDAQ listing in August 2021 ▪ Bank was established in 1892 and has operated successfully for 132 years ▪ Headquartered in Middletown, NY ▪ Premier business bank in the Hudson Valley region, operating in diverse and stable markets ▪ Highly attractive core deposit franchise ▪ Full service commercial bank with focus on small to medium sized businesses ▪ Diverse, high - margin private banking and trust/wealth management service offerings Strong Banking Institution with Established Presence in Stable Markets Geographic Presence $2.5B TOTAL ASSETS $1.8B TOTAL NET LOANS $2.1B TOTAL DEPOSITS $1.8B AUM Company Background Q3 2024 Snapshot - + + + + + + + - 2015: Opened White Plains branch (Westchester) 2016: Opened Mamaroneck & Hawthorne branches (Westchester) 2017: Opened New City branch (Rockland) 2017: Opened Mount Vernon branch (Westchester) 2017: Closure of Vails Gate branch (Orange) 2018: Sale of Fishkill branch (Dutchess) 2018: Opened Cortlandt Manor branch (Westchester) 2019: Opened LPO in Bronx, NY market 2021: Opened Bronx branch and Nanuet branch (Rockland) 2024: Opened Yonkers branch (Westchester) 2024: Received approval for a second Bronx location Branches & LPOs (16) (1) Market Footprint Expansion of Franchise Footprint HVIA + +

Structure & Scope Balanced, Client - Driven Business Model 4 Business Banking Private Banking Orange Wealth Management • 16 branches • Focus on small to medium size businesses in the communities served • Seasoned lenders with significant regional and industry expertise • Comprehensive product offering • Full treasury management suite Key Metrics $1.8 billion net loans $2.1 billion deposits • Launched in mid 2017 • Division of Orange Bank & Trust • Client - driven service linking our four primary product areas 1) Cash Management / Treasury 2) Loans (Commercial and/or Residential) 3) Trust, Estate and Custody Services 4) Investment Advisory Services (through HVIA) Approximately 746 Clients • Subsidiary of Orange County Bancorp, Inc. • Acquired in late 2012 from Sterling Bancorp • SEC registered Investment Advisor $1.8 billion AUM • Founding division of the Bank • Traditional trust & administration services to local clients • Niche focus on Special Needs Trust and Guardianship services Note: Key financial metrics are as of September 30, 2024 (unaudited). Client - Driven Service Unifies Three Unique Product Areas

Franchise Scarcity Value in Highly Attractive Markets 5 Attractive Demographics in a Large, Growing Addressable Market Median Household Income ($000s) 2UDQJH 1< :HVWFKHVWHU 1< 5RFNODQG 1< 6WDWH RI 1< 8 6 2YHUDOO OBT Growth Markets Orange County Westchester & Rockland Counties Bronx County • Attractive and stable market • 60 miles from New York City • 132 - year - operating history in the region • Strong foundation for growth and low - cost deposit funding • Continued remote workplace migration • Primary OBT growth markets • Large, economically diverse and affluent markets • Unbalanced Market: large regional/national banks, few small community banks • Reputation as leading local bank for small business • Significant long - term growth opportunity relative to current market share • Densely populated area with approximately 1.5 million residents • Diversified economy typical of urban population centers • Persistent need for housing in the region generates growth through demand for construction lending and refinancing activity

Business Strategy 6 Note: Financial data as of September 30, 2024 (unaudited) unless otherwise noted. Leverage Relationships to Drive Organic Growth Derive Loan Growth Through Relationship - Based Model Continue to Grow Core Deposit Franchise Continue to Build Fee - Based Business Strategic Expansion / Opportunistic M&A • The Bank’s historical success has been closely tied to that of its clients and the communities it serves • Seek trusted advisor role with clients as they build their businesses with the Bank’s resources and support • Majority of loan growth comes from existing clients and referrals • Direct access to senior management offers customers quicker response time on loan applications and other transactions • Differentiated level of service provides a pricing advantage, often resulting in higher loan rates • Core deposits (which includes all deposits except certificates of deposit) comprise 93.4% of total funding, attributed to the bank’s long - standing relationships with clients • Cash management has helped the Bank expand depth and efficiency of deposit product offerings • By continuing to broaden its suite of business services, deposits and loans grew 5.0% and 2.8% respectively between year end 2023 and Q3 2024 • Strategic Expansion: Ongoing investments in Rockland, Westchester and Bronx Counties continue to be significant drivers of growth & profitability • Capitalize on Market Disruption: Consolidation from the sales/mergers of Signature Bank, The Westchester Bank, Sterling National Bank, Hudson Valley Bank, Hometown Bank, Greater Hudson Bank and PCSB Bank presents opportunities to hire seasoned bankers and capture market share • Opportunistic M&A: Could include fee - based business, whole bank or branch acquisitions that would improve market position in geographies with attractive demographics • Having recently reached $1.8 billion in combined AUM at Q3 2024, the Company’s trust and advisory services businesses provide a strong foundation of fee - based revenue • Company intends to expand HVIA’s services into Westchester and Rockland counties • Private Banking service enables approximately 746 clients to leverage the resources of the platform

)< )< )< 4 )< )< )< 4 )< )< )< 4 )< )< )< 4 Consistent History of Growth 7 Note: Financial data as of September 30, 2024 is unaudited. Source: Company filings. Current Success is Attributed to Disciplined Organic Growth Gross Loans ($M) Total Assets ($M) Consolidated Equity Ex. AOCI ($M) Total Deposits ($M) Impact of AOCI Losses

)< )< )< <7' 1HW ,QWHUHVW ,QFRPH 1RQLQWHUHVW ,QFRPH )< )< )< <7' ò 52$$ 52$( )< )< )< <7' Strong and Consistent Historical Profitability 8 Net Interest Margin (%) Net Income ($M) Pre - Provision Revenue ($M) ROAA and ROAE (%) Success Maintaining Strong Profitabilit y Metrics $72 .6 $9 0.1 $ 101.8 $80.4 1) Local peers include NASDAQ, NYSE and NYSEAM traded U.S. banks and thrifts in the NYC MSA with total assets under $50 billion as of Q3 2024, excluding merger targets and mutuals; peer data sourced from S&P Capital IQ Pro. 2) Reflects annualized metric. Note: Financial data as of September 30, 2024 is unaudited. Source: Company filings. )< )< )< <7' ò 2%7 /RFDO 3HHUV ñ

Loan Composition 9 1) CRE and C&D loans as a % of Total Risk - Based Capital; Bank level Call Report data. Note: Financial data as of September 30, 2024 (unaudited) unless otherwise noted. Total Loans: $1.7 Billion Commercial - Focused Portfolio with Conservative Concentrations ▪ Advantageous, relationship - based lending model through existing clients and referrals ▪ Syndicated loans represent less than 1.7% of total loans ▪ Majority of lending occurs within market; ~87% of loans are in market as of September 30, 2024 ▪ $320.8 million (17.9% of loans) are repricing or maturing within one year or less Geographic Composition of RE Secured Loans Loan Portfolio Commentary 6.02% Yield on Loans 417% CRE Concentration¹ (% of Risked - Based Capital) 34% C&D Concentration¹ (% of Risked - Based Capital) CRE 70% C&I 12% CRE Construction 6% Residential RE 8% Consumer 2% Other 2%

Overview of Commercial Real Estate Portfolio 10 Note: Financial data as of September 30, 2024 (unaudited) unless otherwise noted. CRE Portfolio Geographic Composition CRE Portfolio by Property Type Limited exposure to core NYC metro area with only 4% of the CRE portfolio in Manhattan Non - owner - occupied represents approximately 66% of the CRE loan portfolio Total CRE: $1.2 Billion Westchester 28% Orange 15% Bronx 17% Rockland 8% Manhattan 4% Other NY Counties 13% New Jersey 7% Other States 9% Retail 13% Office 14% Multifamily 25% Indust/Warehou se 8% Commercial Mixed Use 11% Other 21% Construction / Development 8%

Overview of Multifamily Portfolio 11 Note: Financial data as of September 30, 2024 (unaudited) unless otherwise noted. Multifamily Portfolio Detail Multifamily Portfolio Geographic Composition Weighted Average LTV 56.7% Average Loan Size $2.27 Million % of Total Multifamily Portfolio Portfolio Characteristic 25.1% % of Portfolio Rent Stabilized 2.8% % of Portfolio Rent Controlled 0.6% % Maturing in 2024 4.9% % Maturing in 2025 6.0% % Maturing in 2026 88.5% % Maturing in 2027+ Total Multi: $291.6 million
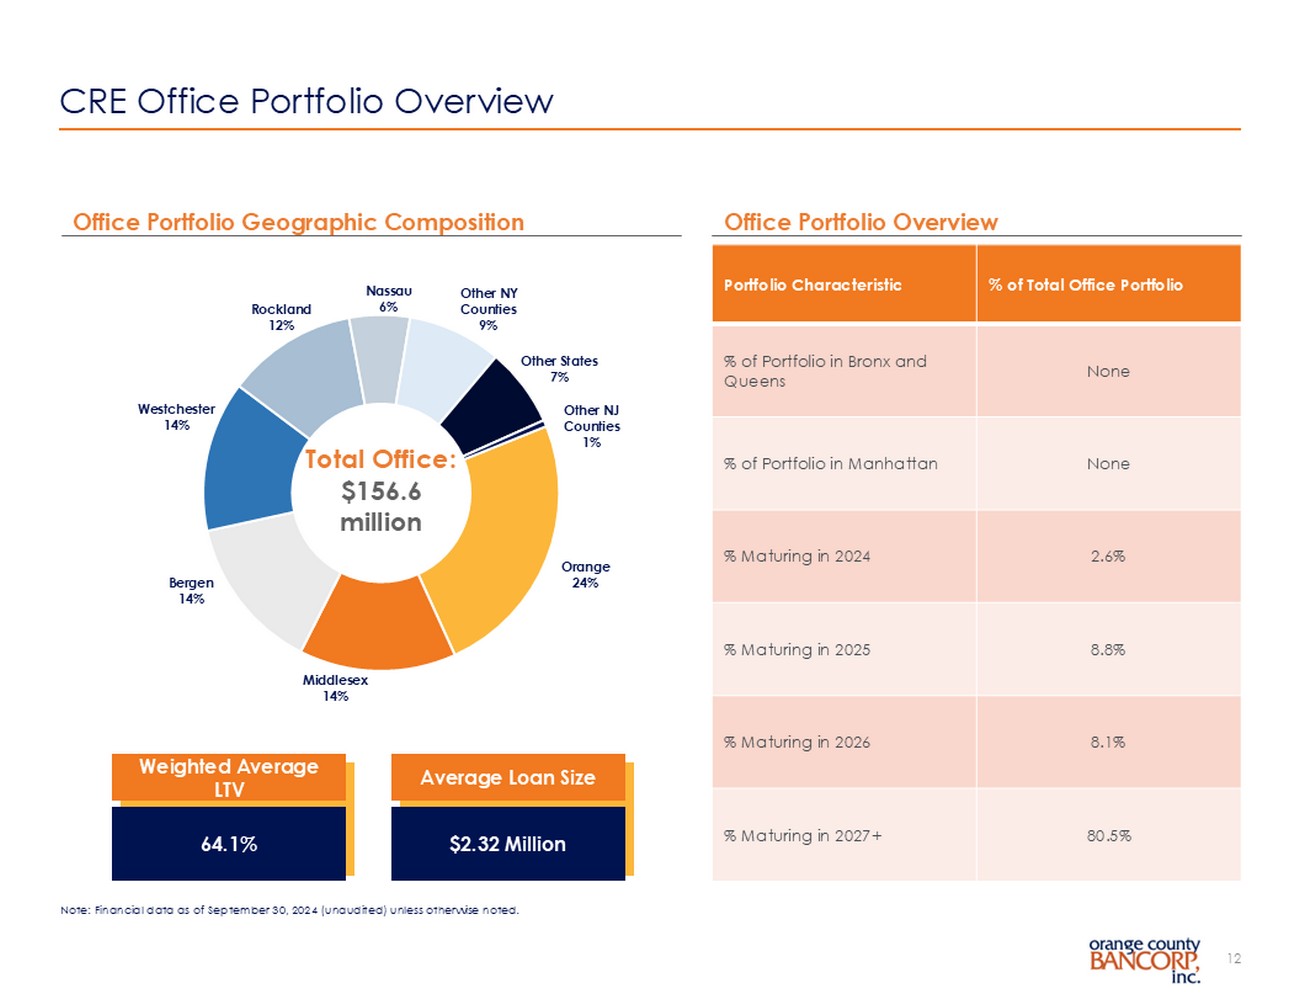
CRE Office Portfolio Overview 12 Note: Financial data as of September 30, 2024 (unaudited) unless otherwise noted. Office Portfolio Overview Office Portfolio Geographic Composition % of Total Office Portfolio Portfolio Characteristic None % of Portfolio in Bronx and Queens None % of Portfolio in Manhattan 2.6% % Maturing in 2024 8.8% % Maturing in 2025 8.1% % Maturing in 2026 80.5% % Maturing in 2027+ Weighted Average LTV 64.1% Average Loan Size $2.32 Million Orange 24% Middlesex 14% Bergen 14% Westchester 14% Rockland 12% Nassau 6% Other NY Counties 9% Other States 7% Other NJ Counties 1% Total Office: $156.6 million
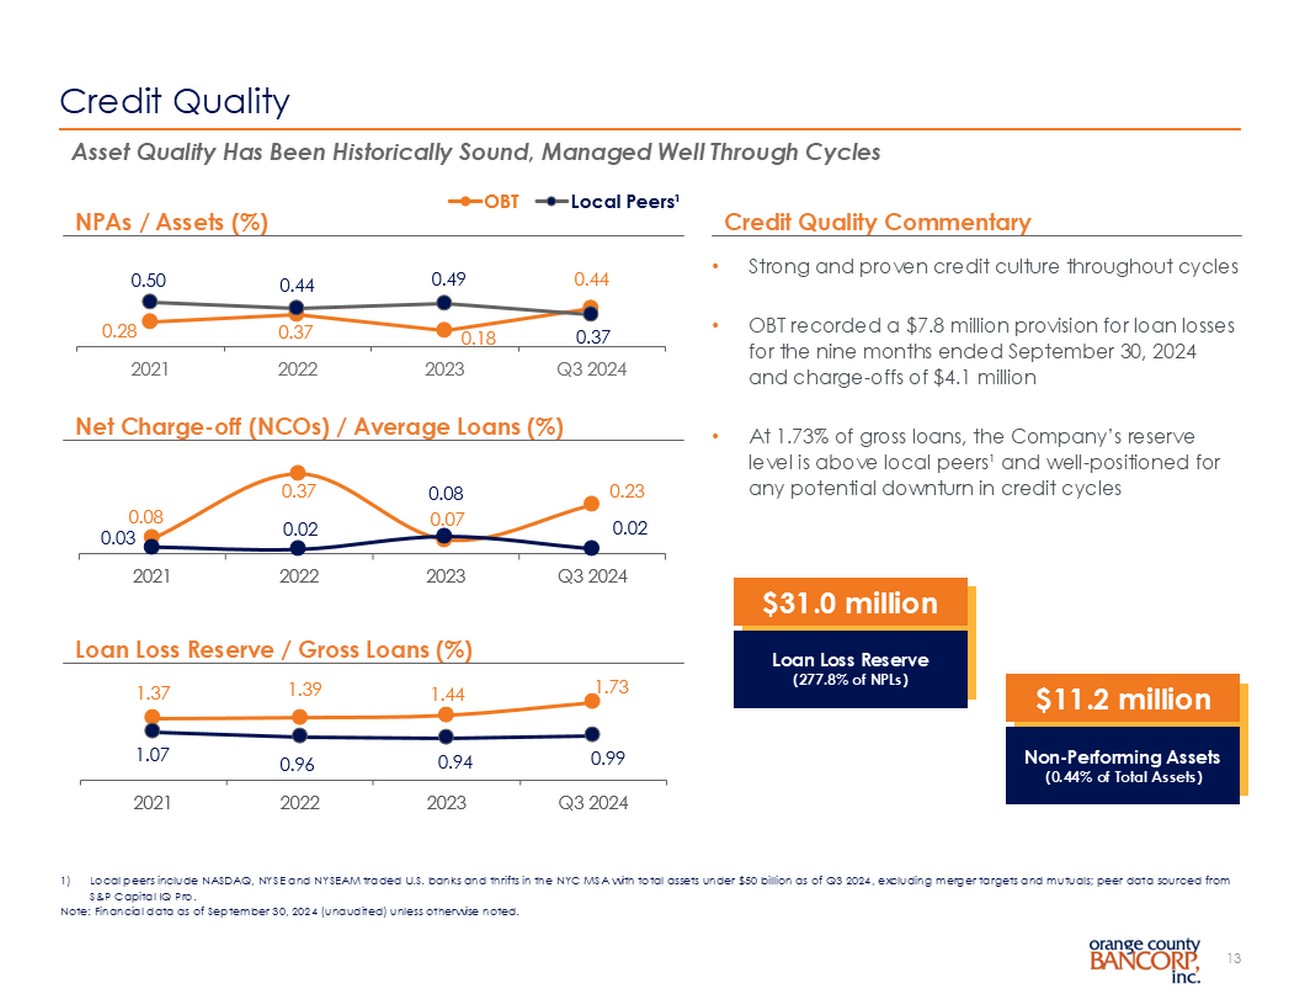
Credit Quality 13 1) Local peers include NASDAQ, NYSE and NYSEAM traded U.S. banks and thrifts in the NYC MSA with total assets under $50 billion as of Q3 2024, excluding merger targets and mutuals; peer data sourced from S&P Capital IQ Pro. Note: Financial data as of September 30, 2024 (unaudited) unless otherwise noted. Asset Quality Has Been Historically Sound, Managed Well Through Cycles • Strong and proven credit culture throughout cycles • OBT recorded a $ 7.8 million provision for loan losses for the nine months ended September 30, 2024 and charge - offs of $4.1 million • At 1.73% of gross loans, the Company’s reserve level is above local peers¹ and well - positioned for any potential downturn in credit cycles Credit Quality Commentary 4 4 NPAs / Assets (%) Net Charge - off (NCOs) / Average Loans (%) 4 Loan Loss Reserve / Gross Loans (%) 4 2%7 /RFDO 3HHUV ñ $11.2 million Non - Performing Assets (0.44% of Total Assets) $31.0 million Loan Loss Reserve (277.8% of NPLs)

Liquidity Overview 14 Note: Financial data as of September 30, 2024 (unaudited) unless otherwise noted. Strong Recent Deposit Growth and Significant Borrowing Capacity • Borrowings consist of both short - term and long - term borrowings and provide the Company with one of its sources of funding • Maintaining available borrowing capacity provides the Company with a contingent source of liquidity • FHLBNY short - term borrowings were paid down and $82 million was outstanding as of September 30, 2024 as compared to $224.5 million at December 31, 2023 • The decrease in borrowings reflects a strategic decision to manage liquidity sources and take advantage of opportunities to reduce funding costs • The Company has the capacity to borrow $491.6 million from the FHLBNY as of September 30, 2024 • At September 30, 2024, the Bank was utilizing $50 million of funding through the Bank Term Funding Program from the Federal Reserve under a one - year facility • Uninsured deposits, net of fully collateralized municipal relationships, remain stable and represent approximately 39% of total deposits at September 30, 2024 as compared to 37% of total deposits at December 31, 2023

Leading Core Deposit Franchise Areas of Focus Keys to Success x Dedicated deposit relationship managers x Investment into customer experience/cash management product suite x Obtain deposit relationships at loan origination Escrow x Attractive DDA capture Municipal Deposits x Comprise 16.0% of total deposits x Competitive products and niche focus x Focused on local opportunities and long - term relationships 15 Stable and Low - Cost Core Funding Base Total Deposits: $2.1 Billion Composition by Geography 32.3% Noninterest - Bearing 93.4% Core Deposits¹ 131 bps Cost of Deposits 1) Core deposits defined as total deposits minus certificates of deposit. 2) Cost of total deposits calculated using total annualized deposit interest expense and average total deposits in the given period. Note: Financial data as of September 30, 2024 (unaudited) unless otherwise noted. Certificates of Deposit 7% Savings 12% Money Market 33% Non - interest Bearing Demand 32% Interest - Bearing Demand 16% Orange 41% Westchester 36% Rockland 8% Bronx 4% Other 10%

8 6 *RYHUQPHQW $JHQFLHV 0RUWJDJH EDFNHG 6HFXULWLHV &RUSRUDWH 6HFXULWLHV 0XQLFLSDO 6HFXULWLHV Conservatively Managed Securities Portfolio 16 Note: Financial data as of September 30, 2024 (unaudited) unless otherwise noted. ▪ $469.5 million in securities, primarily concentrated in mortgage - backed securities, municipal securities and agency ▪ Approximately 65% pledged as collateral to secure public deposits ▪ Historically served as use for excess liquidity – this is no longer the case ▪ 6.2 year weighted average life Securities Portfolio Commentary Securities Portfolio Composition $469.5 Million Total Portfolio Fair Value of Investment Securities ▪ Recent decline in fair value was primarily attributable to changes in interest rates, and not credit quality ▪ No intent to sell securities before their anticipated recovery Ptx. Unrealized Gain / (Loss) Estimated Fair Value Amortized Cost Available for Sale Securities $(6,957) $80,768 $87,725 U.S. Government Agencies (37,945) 276,955 314,900 Mortgage - backed Securities (4,144) 19,370 23,514 Corporate Securities (10,583) 92,439 103,022 Municipal Securities $(59,629) $469,532 $529,161 Total 100% Securities Classified as Available for Sale

Ability to Take Advantage of M&A Driven Market Disintermediation Successful and Ongoing Expansion of Market Footprint Highly Attractive Market Geography and Scarcity Value of Franchise Stable, Low - Cost Deposit Base: 48% Transaction Accounts, 131 bps Total Cost 1 Demonstrated Loan Growth Driven by Relationship - Based Model Complementary Offerings in Private Banking and Trust & Wealth Businesses Consistent and Very Strong Financial Metrics Strong and Experienced Management Team Investment Highlights 17 1) Annualized for the quarter ended September 30, 2024 (unaudited)