
2Q 2019 Earnings Conference Call August 1, 2019 Insert Risk Classification
Safe Harbor Regarding Forward-Looking Statements Forward-Looking Statements This presentation contains forward-looking statements within the meaning of Section 21E of the Securities Exchange Act of 1934, as amended, and Section 27A of the Securities Act of 1933, as amended, which are intended to be covered by the safe harbor provisions for forward-looking statements contained in the Private Securities Litigation Reform Act of 1995, and may be identified by their use of words like “plans,” “expects,” “will,” “anticipates,” “believes,” “intends,” “projects,” “estimates” or other words of similar meaning. All statements that address expectations or projections about the future, including statements about Corteva’s strategy for growth, product development, regulatory approval, market position, anticipated benefits of recent acquisitions, timing of anticipated benefits from restructuring actions, outcome of contingencies, such as litigation and environmental matters, expenditures, and financial results, as well as expected benefits from, the separation of Corteva from DuPont, are forward-looking statements. Forward-looking statements are based on certain assumptions and expectations of future events which may not be accurate or realized. Forward-looking statements also involve risks and uncertainties, many of which are beyond Corteva’s control. While the list of factors presented below is considered representative, no such list should be considered to be a complete statement of all potential risks and uncertainties. Unlisted factors may present significant additional obstacles to the realization of forward-looking statements. Consequences of material differences in results as compared with those anticipated in the forward-looking statements could include, among other things, business disruption, operational problems, financial loss, legal liability to third parties and similar risks, any of which could have a material adverse effect on Corteva’s business, results of operations and financial condition. Some of the important factors that could cause Corteva’s actual results to differ materially from those projected in any such forward-looking statements include: (i) effect of competition and consolidation in Corteva’s industry; (ii) failure to successfully develop and commercialize Corteva’s pipeline; (iii) failure to obtain or maintain the necessary regulatory approvals for some Corteva’s products; (iv) failure to enforce Corteva’s intellectual property rights or defend against intellectual property claims asserted by others; (v) effect of competition from manufacturers of generic products; (vi) impact of Corteva’s dependence on third parties with respect to certain of its raw materials or licenses and commercialization; (vii) costs of complying with evolving regulatory requirements and the effect of actual or alleged violations of environmental laws or permit requirements; (viii) effect of the degree of public understanding and acceptance or perceived public acceptance of Corteva’s biotechnology and other agricultural products; (ix) effect of changes in agricultural and related policies of governments and international organizations; (x) effect of disruptions to Corteva’s supply chain, information technology or network systems; (xi) competitor’s establishment of an intermediary platform for distribution of Corteva’s products; (xii) effect of volatility in Corteva’s input costs; (xiii) failure to raise capital through the capital markets or short-term borrowings on terms acceptable to Corteva; (xiv) failure of Corteva’s customers to pay their debts to Corteva, including customer financing programs; (xv) failure to realize the anticipated benefits of the internal reorganizations taken by DowDuPont in connection with the spin-off of Corteva; (xvi) failure to benefit from significant cost synergies and risks related to the indemnification obligations of legacy DuPont liabilities in connection with the separation of Corteva; (xvii) increases in pension and other post-employment benefit plan funding obligations; (xviii) effect of compliance with environmental laws and requirements and adverse judgments on litigation; (xix) risks related to Corteva’s global operations; (xx) effect of climate change and unpredictable seasonal and weather factors; (xxi) effect of counterfeit products; (xxii) failure to effectively manage acquisitions, divestitures, alliances and other portfolio actions; and (xxiii) risks related to the discontinuation of LIBOR. Additionally, there may be other risks and uncertainties that Corteva is unable to currently identify or that Corteva does not currently expect to have a material impact on its business. Where, in any forward-looking statement, an expectation or belief as to future results or events is expressed, such expectation or belief is based on the current plans and expectations of Corteva’s management and expressed in good faith and believed to have a reasonable basis, but there can be no assurance that the expectation or belief will result or be achieved or accomplished. Corteva disclaims and does not undertake any obligation to update or revise any forward-looking statement, except as required by applicable law. A detailed discussion of some of the significant risks and uncertainties which may cause results and events to differ materially from such forward-looking statements is included in the “Risk Factors” section of Exhibit 99.1 of Amendment No. 4 to Corteva’s Registration Statement on Form 10 and Corteva’s Quarterly Report on Form 10-Q for the period ended March 31, 2019, as modified by subsequent reports on Form 10-Q and Current Reports on Form 8-K. 2
A Reminder About Non-GAAP Financial Measures and Pro Forma Financial Information Corteva Unaudited Pro Forma Financial Information In order to provide the most meaningful comparison of results of operations, supplemental unaudited pro forma financial information for the first quarter of 2019 and prior has been included in this presentation. This presentation presents the pro forma results of Corteva, after giving effect to events that are (1) directly attributable to the merger of DuPont and Dow, the divestiture of Historical DuPont’s specialty products and materials science businesses, the receipt of Dow AgroSciences, debt retirement transactions related to paying off or retiring portions of Historical DuPont’s existing debt liabilities, and the separation and distribution to DowDuPont stockholders of all the outstanding shares of Corteva common stock; (2) factually supportable and (3) with respect to the pro forma statements of income, expected to have a continuing impact on the consolidated results. Refer to Corteva’s Form 10 registration statement filed on May 6, 2019, which can be found on the investors section of the Corteva website, for further details on the above transactions. The pro forma financial statements were prepared in accordance with Article 11 of Regulation S-X, and are presented for informational purposes only, and do not purport to represent what the results of operations would have been had the above actually occurred on the dates indicated, nor do they purport to project the results of operations for any future period or as of any future date. Regulation G This presentation includes information that does not conform to U.S. GAAP and are considered non-GAAP financial measures. These measures include organic sales, operating EBITDA, pro forma operating EBITDA, operating EBITDA margin, pro forma operating EBITDA margin, segment operating EBITDA, pro forma segment operating EBITDA, operating earnings per share, pro forma operating earnings per share, and operating tax rate. Management believes that these non-GAAP measures best reflect the ongoing performance of the Company during the periods presented and provide more relevant and meaningful information to investors as they provide insight with respect to ongoing operating results of the Company and a more useful comparison of year over year results. These non-GAAP measures supplement the Company's U.S. GAAP disclosures and should not be viewed as an alternative to U.S. GAAP measures of performance. Furthermore, such non-GAAP measures may not be consistent with similar measures provided or used by other companies. Reconciliations for these non-GAAP measures to their most directly attributable U.S. GAAP measure are provided on slides 15 - 21 of this presentation. These non-GAAP measures are being reconciled to a pro forma GAAP financial measure prepared and presented in accordance with Article 11 of Regulation S-X. Organic sales is defined as price and volume and excludes currency and portfolio impacts. Rest of world organic sales is defined as organic sales for Europe, Middle East and Africa (EMEA), Latin America and Asia Pacific and excludes the North America region (U.S. and Canada). Operating EBITDA is defined as earnings (i.e., income from continuing operations before income taxes) before interest, depreciation, amortization, non-operating costs, net and foreign exchange gains (losses), excluding the impact of adjusted significant items. Non-operating costs, net consists of non-operating pension and other post-employment benefit (OPEB) costs, environmental remediation and legal costs associated with legacy businesses and sites of E. I. du Pont de Nemours and Company (“Historical DuPont”). Operating EBITDA margin is defined as Operating EBITDA as a percentage of net sales. Segment Operating EBITDA is defined as Operating EBITDA excluding corporate expenses. Operating earnings and operating earnings per share are defined as "Earnings per common share from continuing operations - diluted" excluding the after-tax impact of significant items, the after-tax impact of non-operating costs, net, and the after-tax impact of amortization expense associated with intangible assets as of the separation from DowDuPont. Although amortization of the Company's intangible assets is excluded from these non-GAAP measures, management believes it is important for investors to understand that such intangible assets contribute to revenue generation. Amortization of intangible assets that relate to past acquisitions will recur in future periods until such intangible assets have been fully amortized. Operating tax rate is defined as the effective tax rate excluding the impacts of foreign exchange gains (losses), non-operating costs, amortization of intangibles as of Separation, and significant items. Corteva does not provide forward-looking U.S. GAAP financial measures or a reconciliation of forward- looking non-GAAP financial measures to the most comparable U.S. GAAP financial measures on a forward-looking basis because the company is unable to predict with reasonable certainty the ultimate outcome of pending litigation, unusual gains and losses, foreign currency exchange gains or losses and potential future asset impairments, as well as discrete taxable events, without unreasonable effort. These items are uncertain, depend on various factors, and could have a material impact on U.S. GAAP results for the guidance period. All periods for the first quarter of 2019 and prior are on a pro forma basis as discussed above in the paragraph ‘Corteva Unaudited Pro Forma Financial Information’. 3
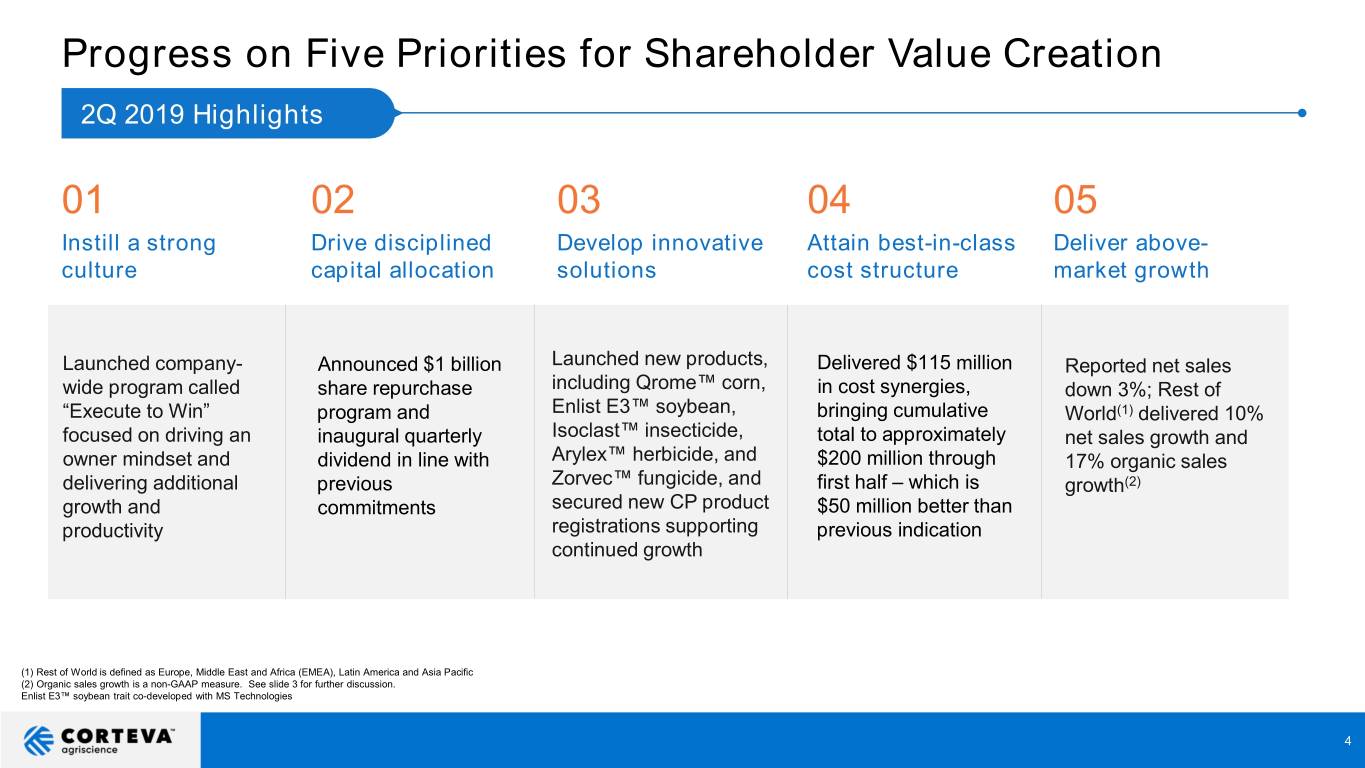
Progress on Five Priorities for Shareholder Value Creation 2Q 2019 Highlights 01 02 03 04 05 Instill a strong Drive disciplined Develop innovative Attain best-in-class Deliver above- culture capital allocation solutions cost structure market growth Launched company- Announced $1 billion Launched new products, Delivered $115 million Reported net sales wide program called share repurchase including Qrome™ corn, in cost synergies, down 3%; Rest of “Execute to Win” program and Enlist E3™ soybean, bringing cumulative World(1) delivered 10% focused on driving an inaugural quarterly Isoclast™ insecticide, total to approximately net sales growth and owner mindset and dividend in line with Arylex™ herbicide, and $200 million through 17% organic sales delivering additional previous Zorvec™ fungicide, and first half – which is growth(2) growth and commitments secured new CP product $50 million better than productivity registrations supporting previous indication continued growth (1) Rest of World is defined as Europe, Middle East and Africa (EMEA), Latin America and Asia Pacific (2) Organic sales growth is a non-GAAP measure. See slide 3 for further discussion. Enlist E3™ soybean trait co-developed with MS Technologies 4
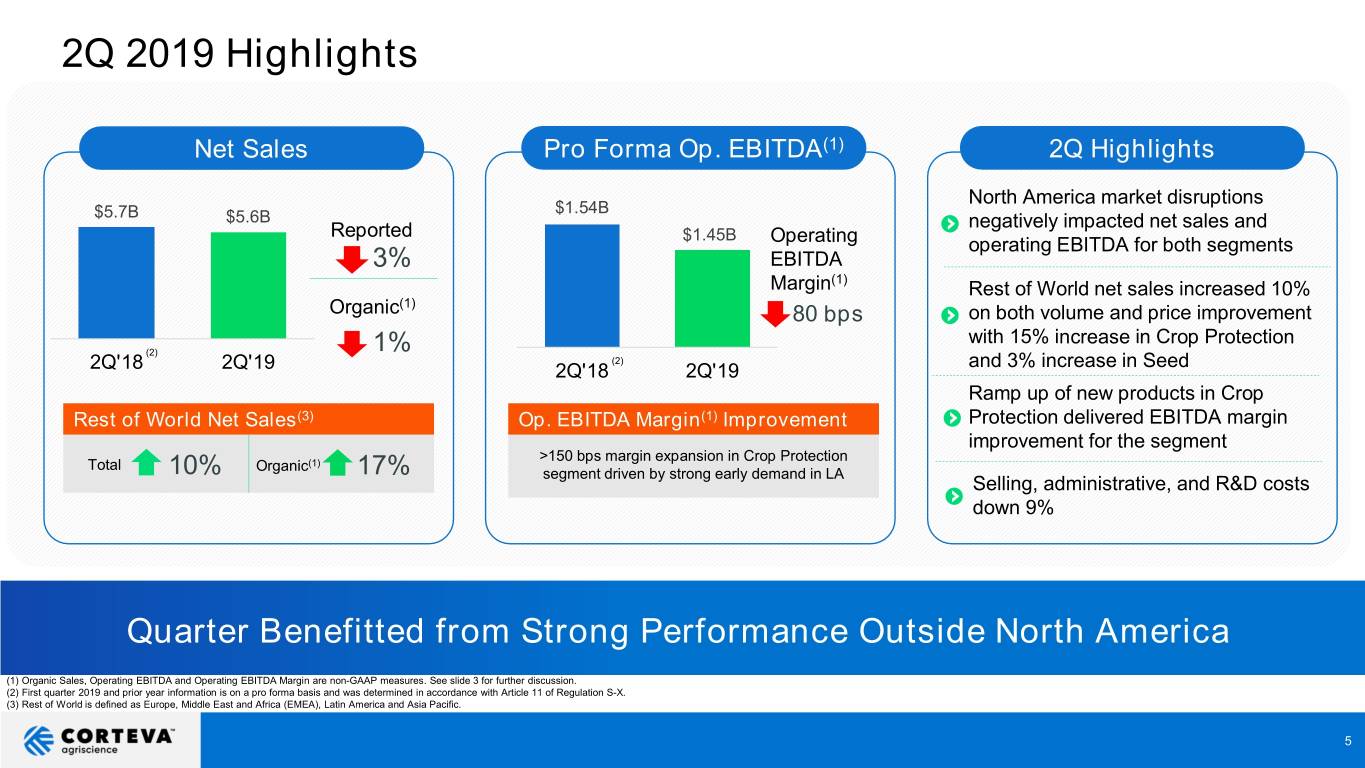
2Q 2019 Highlights Net Sales Pro Forma Op. EBITDA(1) 2Q Highlights North America market disruptions $1.54B $5.7B $5.6B negatively impacted net sales and Reported $1.45B Operating operating EBITDA for both segments 3% EBITDA (1) Margin Rest of World net sales increased 10% (1) Organic 80 bps on both volume and price improvement with 15% increase in Crop Protection (2) 1% (2) and 3% increase in Seed 2Q'18 2Q'19 2Q'18 2Q'19 Ramp up of new products in Crop Rest of World Net Sales(3) Op. EBITDA Margin(1) Improvement Protection delivered EBITDA margin improvement for the segment >150 bps margin expansion in Crop Protection Total Organic(1) 10% 17% segment driven by strong early demand in LA Selling, administrative, and R&D costs down 9% Quarter Benefitted from Strong Performance Outside North America (1) Organic Sales, Operating EBITDA and Operating EBITDA Margin are non-GAAP measures. See slide 3 for further discussion. (2) First quarter 2019 and prior year information is on a pro forma basis and was determined in accordance with Article 11 of Regulation S-X. (3) Rest of World is defined as Europe, Middle East and Africa (EMEA), Latin America and Asia Pacific. 5
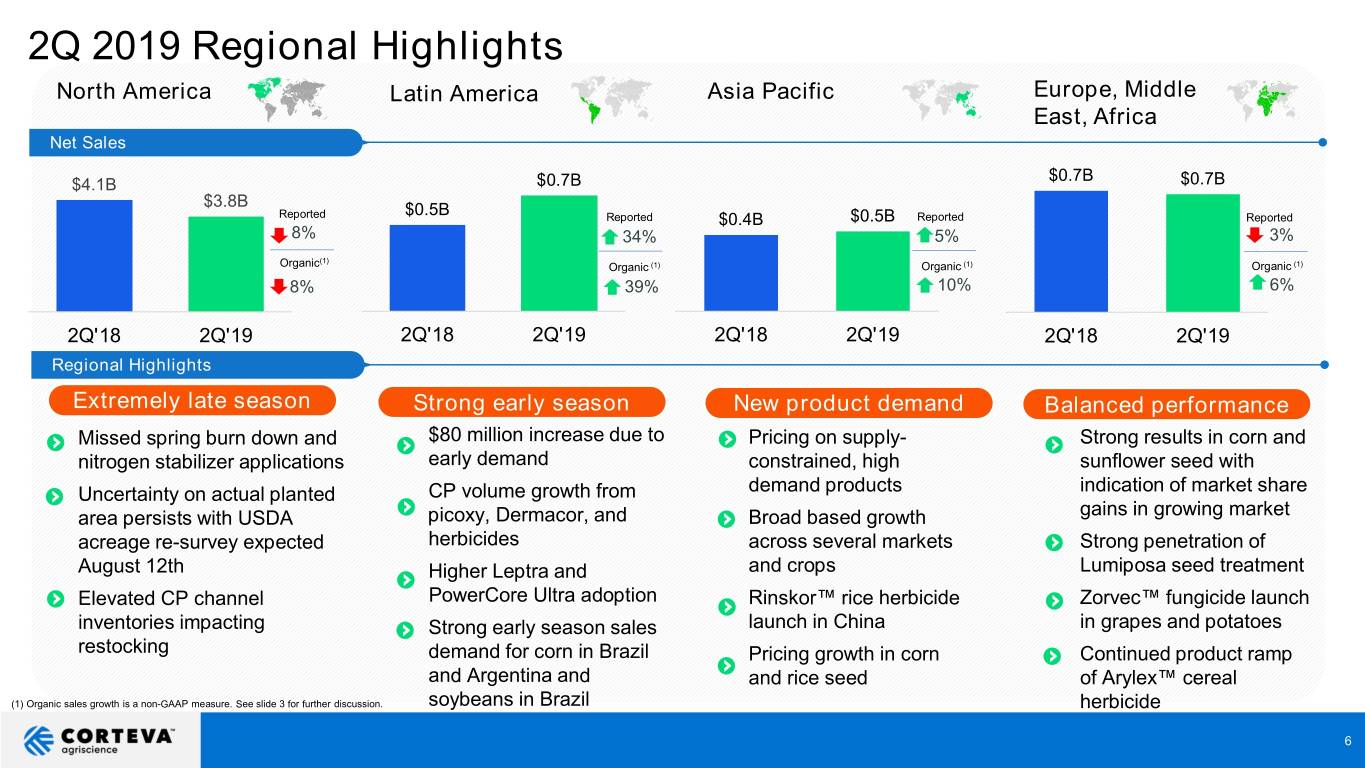
2Q 2019 Regional Highlights North America Latin America Asia Pacific Europe, Middle East, Africa Net Sales $0.7B $4.1B $0.7B $0.7B $3.8B $0.5B Reported Reported $0.4B $0.5B Reported Reported 8% 34% 5% 3% (1) Organic Organic (1) Organic (1) Organic (1) 8% 39% 10% 6% 2Q'18 2Q'19 2Q'18 2Q'19 2Q'18 2Q'19 2Q'18 2Q'19 Regional Highlights Extremely late season Strong early season New product demand Balanced performance Missed spring burn down and $80 million increase due to Pricing on supply- Strong results in corn and nitrogen stabilizer applications early demand constrained, high sunflower seed with Uncertainty on actual planted CP volume growth from demand products indication of market share area persists with USDA picoxy, Dermacor, and Broad based growth gains in growing market acreage re-survey expected herbicides across several markets Strong penetration of August 12th Higher Leptra and and crops Lumiposa seed treatment Elevated CP channel PowerCore Ultra adoption Rinskor™ rice herbicide Zorvec™ fungicide launch inventories impacting Strong early season sales launch in China in grapes and potatoes restocking demand for corn in Brazil Pricing growth in corn Continued product ramp and Argentina and and rice seed of Arylex™ cereal (1) Organic sales growth is a non-GAAP measure. See slide 3 for further discussion. soybeans in Brazil herbicide 6
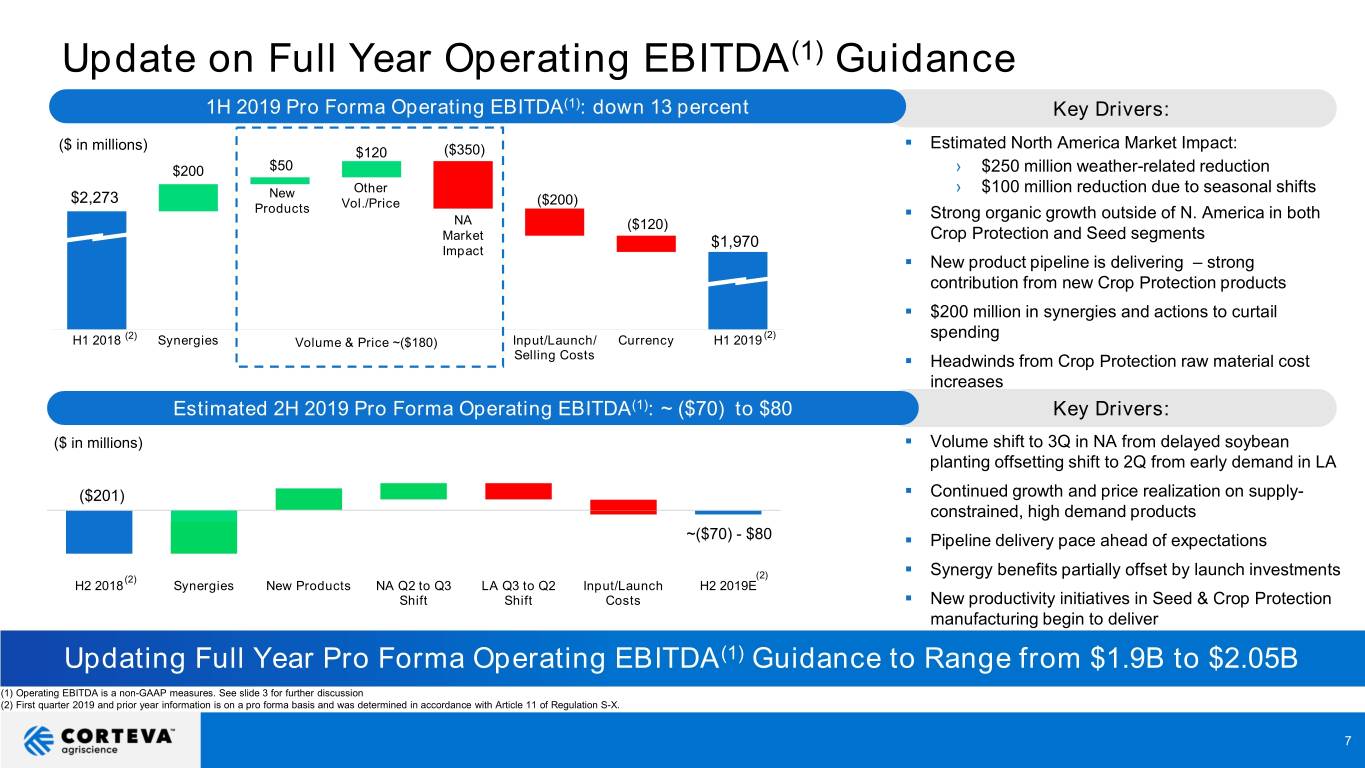
Update on Full Year Operating EBITDA(1) Guidance 1H 2019 Pro Forma Operating EBITDA(1): down 13 percent Key Drivers: ($ in millions) . Estimated North America Market Impact: $120 ($350) $200 $50 › $250 million weather-related reduction New Other › $100 million reduction due to seasonal shifts $2,273 Vol./Price ($200) Products . Strong organic growth outside of N. America in both NA ($120) Market $1,970 Crop Protection and Seed segments Impact . New product pipeline is delivering – strong contribution from new Crop Protection products . $200 million in synergies and actions to curtail (2) (2) spending H1 2018 Synergies Volume & Price ~($180) Input/Launch/ Currency H1 2019 Selling Costs . Headwinds from Crop Protection raw material cost increases Estimated 2H 2019 Pro Forma Operating EBITDA(1): ~ ($70) to $80 Key Drivers: ($ in millions) . Volume shift to 3Q in NA from delayed soybean planting offsetting shift to 2Q from early demand in LA ($201) . Continued growth and price realization on supply- constrained, high demand products ~($70) - $80 . Pipeline delivery pace ahead of expectations . Synergy benefits partially offset by launch investments (2) (2) H2 2018 Synergies New Products NA Q2 to Q3 LA Q3 to Q2 Input/Launch H2 2019E Shift Shift Costs . New productivity initiatives in Seed & Crop Protection manufacturing begin to deliver Updating Full Year Pro Forma Operating EBITDA(1) Guidance to Range from $1.9B to $2.05B (1) Operating EBITDA is a non-GAAP measures. See slide 3 for further discussion (2) First quarter 2019 and prior year information is on a pro forma basis and was determined in accordance with Article 11 of Regulation S-X. 7
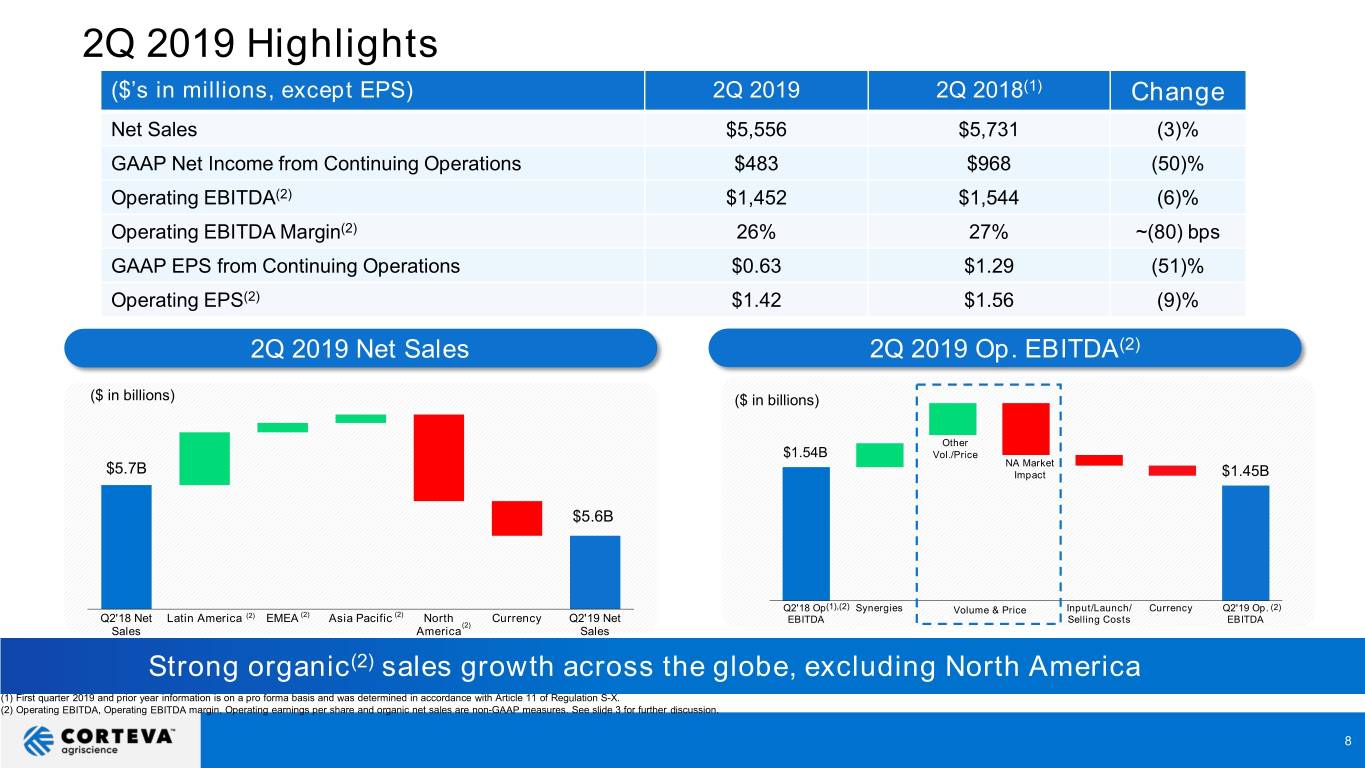
2Q 2019 Highlights ($’s in millions, except EPS) 2Q 2019 2Q 2018(1) Change Net Sales $5,556 $5,731 (3)% GAAP Net Income from Continuing Operations $483 $968 (50)% Operating EBITDA(2) $1,452 $1,544 (6)% Operating EBITDA Margin(2) 26% 27% ~(80) bps GAAP EPS from Continuing Operations $0.63 $1.29 (51)% Operating EPS(2) $1.42 $1.56 (9)% 2Q 2019 Net Sales 2Q 2019 Op. EBITDA(2) ($ in billions) ($ in billions) Other $1.54B Vol./Price NA Market $5.7B Impact $1.45B $5.6B Q2'18 Op.(1),(2) Synergies Input/Launch/ Currency Q2'19 Op. (2) (2) (2) (2) Volume & Price Q2'18 Net Latin America EMEA Asia Pacific North (2) Currency Q2'19 Net EBITDA Selling Costs EBITDA Sales America Sales Strong organic(2) sales growth across the globe, excluding North America (1) First quarter 2019 and prior year information is on a pro forma basis and was determined in accordance with Article 11 of Regulation S-X. (2) Operating EBITDA, Operating EBITDA margin, Operating earnings per share and organic net sales are non-GAAP measures. See slide 3 for further discussion. 8
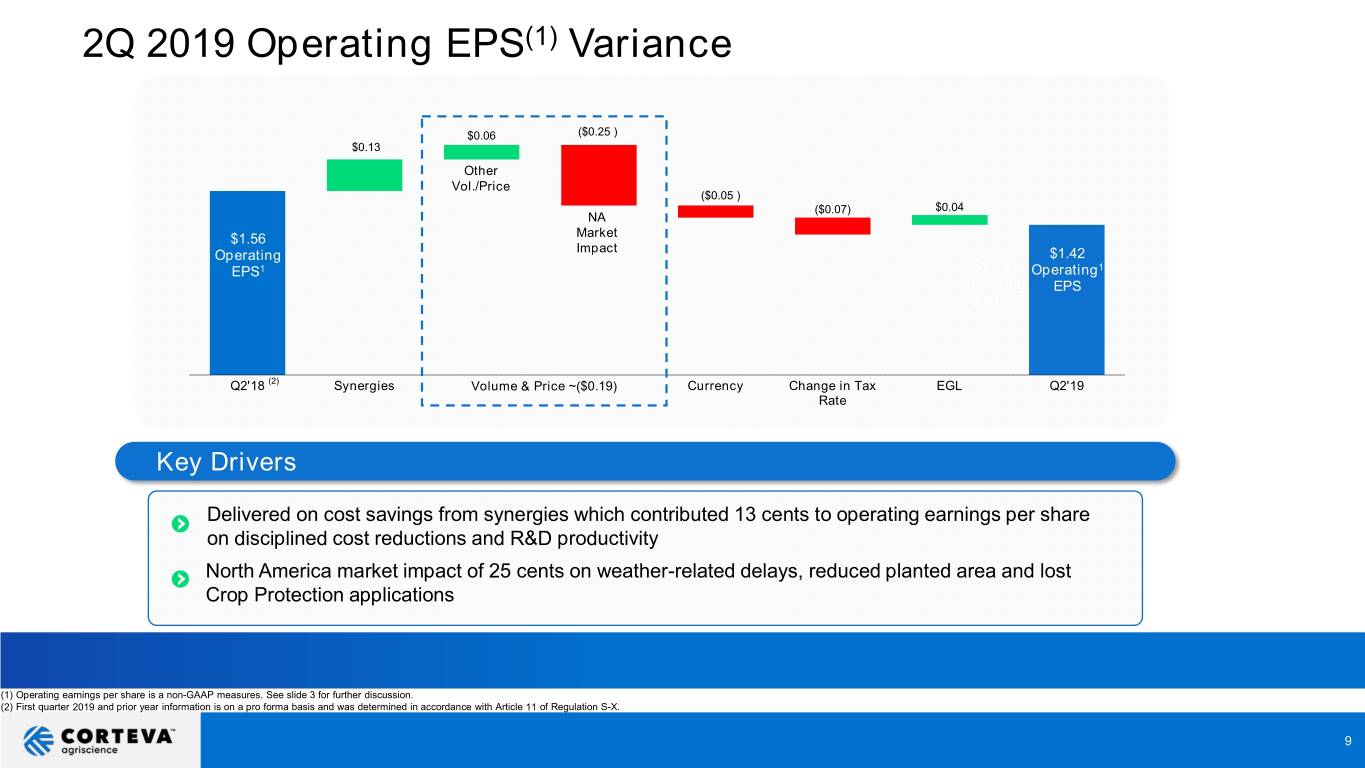
2Q 2019 Operating EPS(1) Variance $0.06 ($0.25 ) $0.13 Other Vol./Price ($0.05 ) ($0.07) $0.04 NA $1.56 Market Impact Operating $1.42 EPS1 $1.42 Operating1 Operating EPS EPS1 (2) Q2'18 Synergies Volume & Price ~($0.19) Currency Change in Tax EGL Q2'19 Rate Key Drivers Delivered on cost savings from synergies which contributed 13 cents to operating earnings per share on disciplined cost reductions and R&D productivity North America market impact of 25 cents on weather-related delays, reduced planted area and lost Crop Protection applications (1) Operating earnings per share is a non-GAAP measures. See slide 3 for further discussion. (2) First quarter 2019 and prior year information is on a pro forma basis and was determined in accordance with Article 11 of Regulation S-X. 9
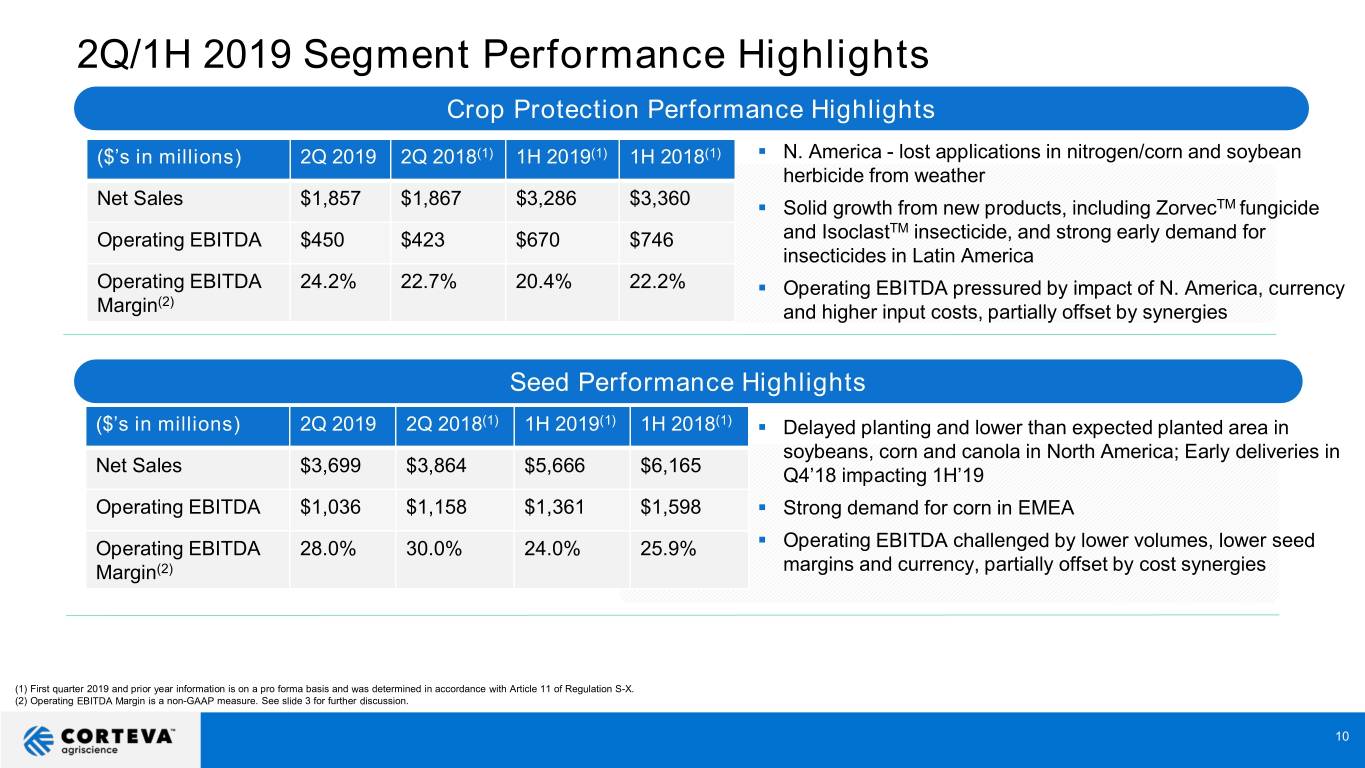
2Q/1H 2019 Segment Performance Highlights Crop Protection Performance Highlights ($’s in millions) 2Q 2019 2Q 2018(1) 1H 2019(1) 1H 2018(1) . N. America - lost applications in nitrogen/corn and soybean herbicide from weather Net Sales $1,857 $1,867 $3,286 $3,360 . Solid growth from new products, including ZorvecTM fungicide TM Operating EBITDA $450 $423 $670 $746 and Isoclast insecticide, and strong early demand for insecticides in Latin America Operating EBITDA 24.2% 22.7% 20.4% 22.2% . Operating EBITDA pressured by impact of N. America, currency (2) Margin and higher input costs, partially offset by synergies Seed Performance Highlights ($’s in millions) 2Q 2019 2Q 2018(1) 1H 2019(1) 1H 2018(1) . Delayed planting and lower than expected planted area in soybeans, corn and canola in North America; Early deliveries in Net Sales $3,699 $3,864 $5,666 $6,165 Q4’18 impacting 1H’19 Operating EBITDA $1,036 $1,158 $1,361 $1,598 . Strong demand for corn in EMEA . Operating EBITDA 28.0% 30.0% 24.0% 25.9% Operating EBITDA challenged by lower volumes, lower seed Margin(2) margins and currency, partially offset by cost synergies (1) First quarter 2019 and prior year information is on a pro forma basis and was determined in accordance with Article 11 of Regulation S-X. (2) Operating EBITDA Margin is a non-GAAP measure. See slide 3 for further discussion. 10
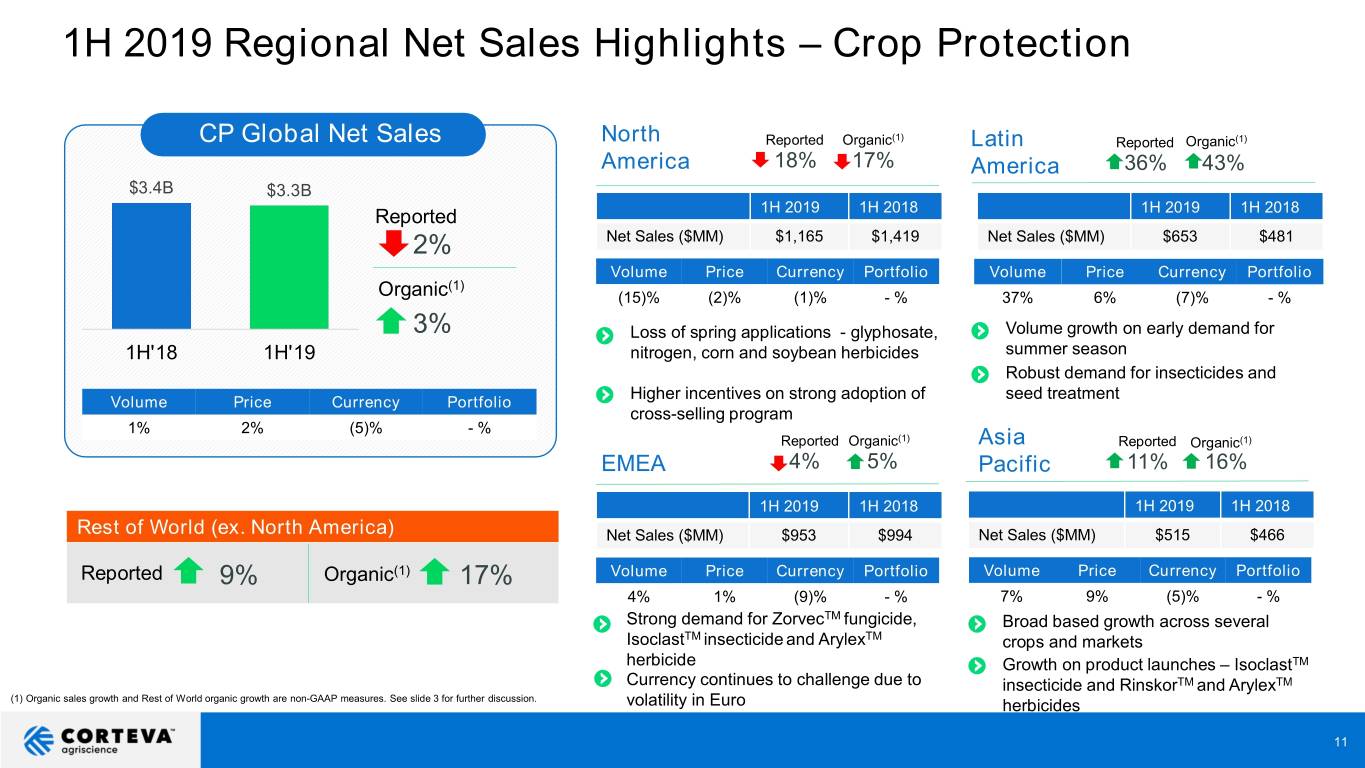
1H 2019 Regional Net Sales Highlights – Crop Protection CP Global Net Sales North Reported Organic(1) Latin Reported Organic(1) America 18% 17% America 36% 43% $3.4B $3.3B Reported 1H 2019 1H 2018 1H 2019 1H 2018 2% Net Sales ($MM) $1,165 $1,419 Net Sales ($MM) $653 $481 Volume Price Currency Portfolio Volume Price Currency Portfolio (1) Organic (15)% (2)% (1)% - % 37% 6% (7)% - % 3% Loss of spring applications - glyphosate, Volume growth on early demand for 1H'18 1H'19 nitrogen, corn and soybean herbicides summer season Robust demand for insecticides and Higher incentives on strong adoption of seed treatment Volume Price Currency Portfolio cross-selling program 1% 2% (5)% - % Reported Organic(1) Asia Reported Organic(1) EMEA 4% 5% Pacific 11% 16% 1H 2019 1H 2018 1H 2019 1H 2018 Rest of World (ex. North America) Net Sales ($MM) $953 $994 Net Sales ($MM) $515 $466 Reported 9% Organic(1) 17% Volume Price Currency Portfolio Volume Price Currency Portfolio 4% 1% (9)% - % 7% 9% (5)% - % Strong demand for ZorvecTM fungicide, Broad based growth across several IsoclastTM insecticide and ArylexTM crops and markets herbicide Growth on product launches – IsoclastTM Currency continues to challenge due to insecticide and RinskorTM and ArylexTM (1) Organic sales growth and Rest of World organic growth are non-GAAP measures. See slide 3 for further discussion. volatility in Euro herbicides 11
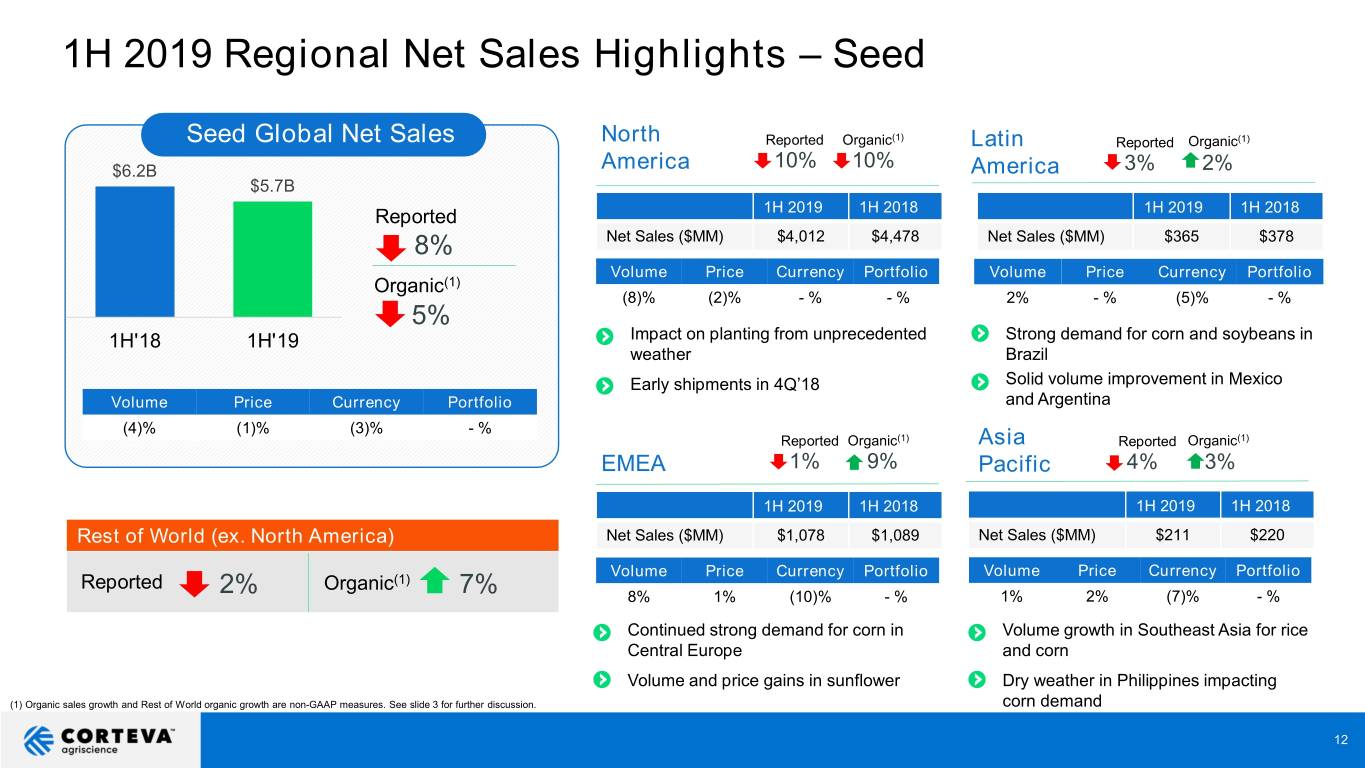
1H 2019 Regional Net Sales Highlights – Seed Seed Global Net Sales North Reported Organic(1) Latin Reported Organic(1) $6.2B America 10% 10% America 3% 2% $5.7B Reported 1H 2019 1H 2018 1H 2019 1H 2018 8% Net Sales ($MM) $4,012 $4,478 Net Sales ($MM) $365 $378 Volume Price Currency Portfolio Volume Price Currency Portfolio Organic(1) (8)% (2)% - % - % 2% - % (5)% - % 5% 1H'18 1H'19 Impact on planting from unprecedented Strong demand for corn and soybeans in weather Brazil Early shipments in 4Q’18 Solid volume improvement in Mexico Volume Price Currency Portfolio and Argentina (4)% (1)% (3)% - % Reported Organic(1) Asia Reported Organic(1) EMEA 1% 9% Pacific 4% 3% 1H 2019 1H 2018 1H 2019 1H 2018 Rest of World (ex. North America) Net Sales ($MM) $1,078 $1,089 Net Sales ($MM) $211 $220 Volume Price Currency Portfolio Volume Price Currency Portfolio Reported Organic(1) 2% 7% 8% 1% (10)% - % 1% 2% (7)% - % Continued strong demand for corn in Volume growth in Southeast Asia for rice Central Europe and corn Volume and price gains in sunflower Dry weather in Philippines impacting (1) Organic sales growth and Rest of World organic growth are non-GAAP measures. See slide 3 for further discussion. corn demand 12
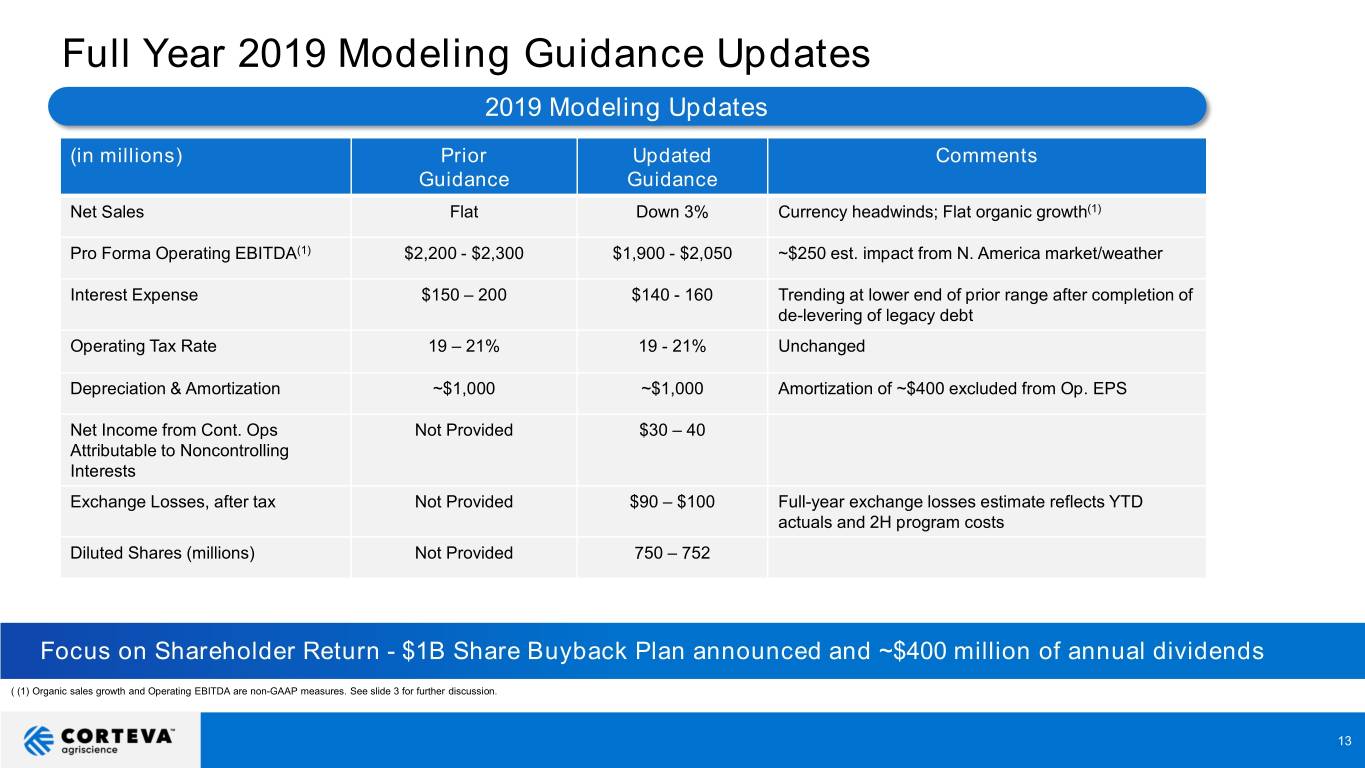
Full Year 2019 Modeling Guidance Updates 2019 Modeling Updates (in millions) Prior Updated Comments Guidance Guidance Net Sales Flat Down 3% Currency headwinds; Flat organic growth(1) Pro Forma Operating EBITDA(1) $2,200 - $2,300 $1,900 - $2,050 ~$250 est. impact from N. America market/weather Interest Expense $150 – 200 $140 - 160 Trending at lower end of prior range after completion of de-levering of legacy debt Operating Tax Rate 19 – 21% 19 - 21% Unchanged Depreciation & Amortization ~$1,000 ~$1,000 Amortization of ~$400 excluded from Op. EPS Net Income from Cont. Ops Not Provided $30 – 40 Attributable to Noncontrolling Interests Exchange Losses, after tax Not Provided $90 – $100 Full-year exchange losses estimate reflects YTD actuals and 2H program costs Diluted Shares (millions) Not Provided 750 – 752 Focus on Shareholder Return - $1B Share Buyback Plan announced and ~$400 million of annual dividends ( (1) Organic sales growth and Operating EBITDA are non-GAAP measures. See slide 3 for further discussion. 13
Appendix - Upcoming Investor Presentation . Investor Presentation with Greg Friedman, EVP and CFO . Date: August 15, 2019 – 8:00 a.m. . Updates on stand-alone company financials and modeling assumptions Footnotes 14
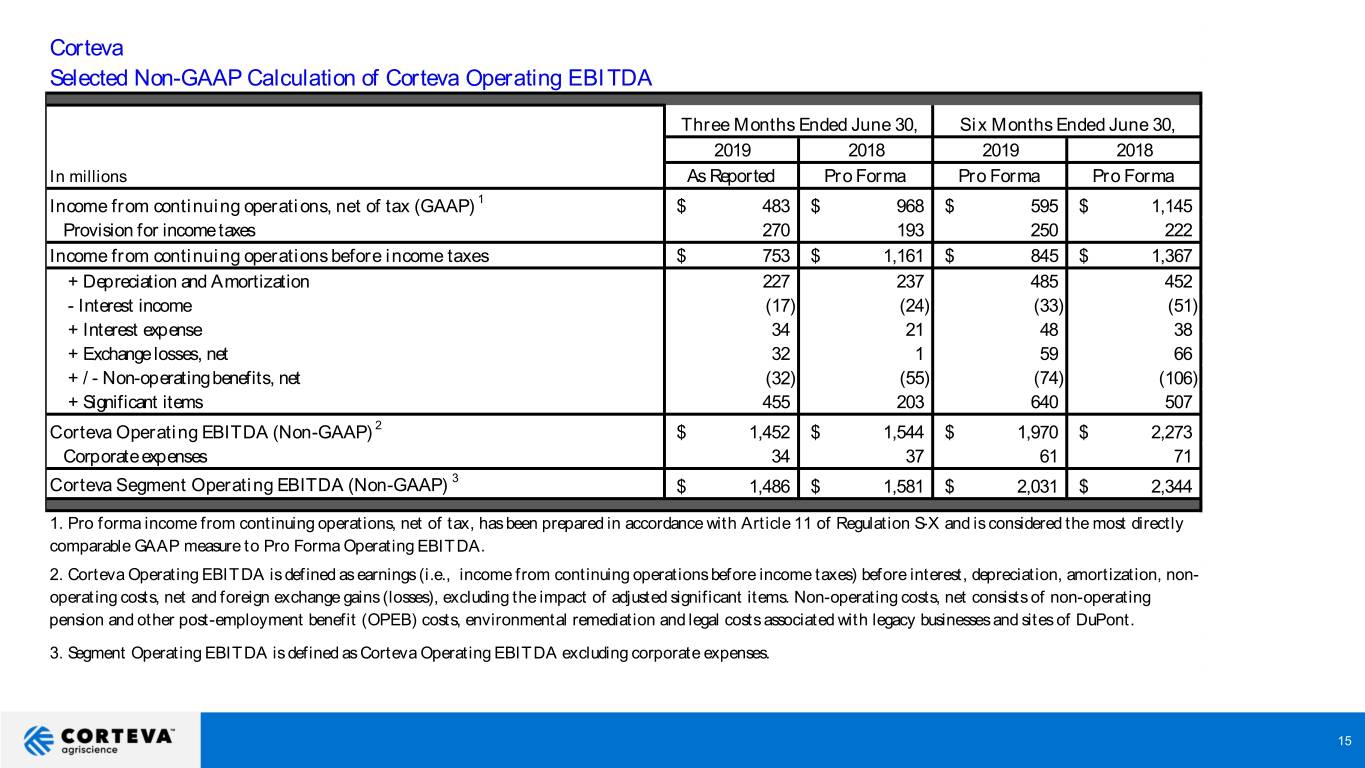
Corteva Selected Non-GAAP Calculation of Corteva Operating EBITDA Three Months Ended June 30, Six Months Ended June 30, 2019 2018 2019 2018 In millions As Reported Pro Forma Pro Forma Pro Forma Income from continuing operations, net of tax (GAAP) 1 $ 483 $ 968 $ 595 $ 1,145 Provision for income taxes 270 193 250 222 Income from continuing operations before income taxes $ 753 $ 1,161 $ 845 $ 1,367 + Depreciation and Amortization 227 237 485 452 - Interest income (17) (24) (33) (51) + Interest expense 34 21 48 38 + Exchange losses, net 32 1 59 66 + / - Non-operating benefits, net (32) (55) (74) (106) + Significant items 455 203 640 507 Corteva Operating EBITDA (Non-GAAP) 2 $ 1,452 $ 1,544 $ 1,970 $ 2,273 Corporate expenses 34 37 61 71 3 Corteva Segment Operating EBITDA (Non-GAAP) $ 1,486 $ 1,581 $ 2,031 $ 2,344 1. Pro forma income from continuing operations, net of tax, has been prepared in accordance with Article 11 of Regulation S-X and is considered the most directly comparable GAAP measure to Pro Forma Operating EBITDA. 2. Corteva Operating EBITDA is defined as earnings (i.e., income from continuing operations before income taxes) before interest, depreciation, amortization, non- operating costs, net and foreign exchange gains (losses), excluding the impact of adjusted significant items. Non-operating costs, net consists of non-operating pension and other post-employment benefit (OPEB) costs, environmental remediation and legal costs associated with legacy businesses and sites of DuPont. 3. Segment Operating EBITDA is defined as Corteva Operating EBITDA excluding corporate expenses. 15
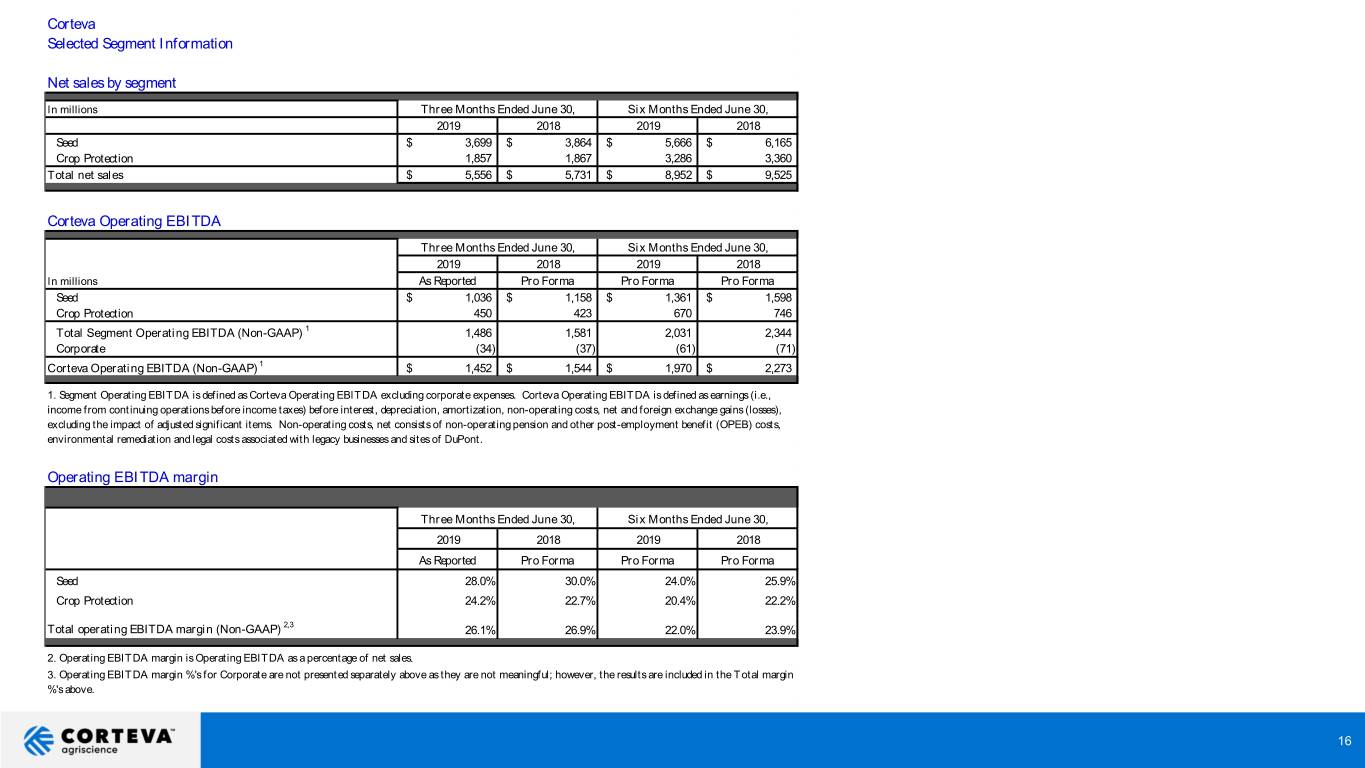
Corteva Selected Segment Information Net sales by segment In millions Three Months Ended June 30, Six Months Ended June 30, 2019 2018 2019 2018 Seed $ 3,699 $ 3,864 $ 5,666 $ 6,165 Crop Protection 1,857 1,867 3,286 3,360 Total net sales $ 5,556 $ 5,731 $ 8,952 $ 9,525 Corteva Operating EBITDA Three Months Ended June 30, Six Months Ended June 30, 2019 2018 2019 2018 In millions As Reported Pro Forma Pro Forma Pro Forma Seed $ 1,036 $ 1,158 $ 1,361 $ 1,598 Crop Protection 450 423 670 746 Total Segment Operating EBITDA (Non-GAAP) 1 1,486 1,581 2,031 2,344 Corporate (34) (37) (61) (71) Corteva Operating EBITDA (Non-GAAP) 1 $ 1,452 $ 1,544 $ 1,970 $ 2,273 1. Segment Operating EBITDA is defined as Corteva Operating EBITDA excluding corporate expenses. Corteva Operating EBITDA is defined as earnings (i.e., income from continuing operations before income taxes) before interest, depreciation, amortization, non-operating costs, net and foreign exchange gains (losses), excluding the impact of adjusted significant items. Non-operating costs, net consists of non-operating pension and other post-employment benefit (OPEB) costs, environmental remediation and legal costs associated with legacy businesses and sites of DuPont. Operating EBITDA margin Three Months Ended June 30, Six Months Ended June 30, 2019 2018 2019 2018 As Reported Pro Forma Pro Forma Pro Forma Seed 28.0% 30.0% 24.0% 25.9% Crop Protection 24.2% 22.7% 20.4% 22.2% 2,3 Total operating EBITDA margin (Non-GAAP) 26.1% 26.9% 22.0% 23.9% 2. Operating EBITDA margin is Operating EBITDA as a percentage of net sales. 3. Operating EBITDA margin %'s for Corporate are not presented separately above as they are not meaningful; however, the results are included in the Total margin %'s above. 16
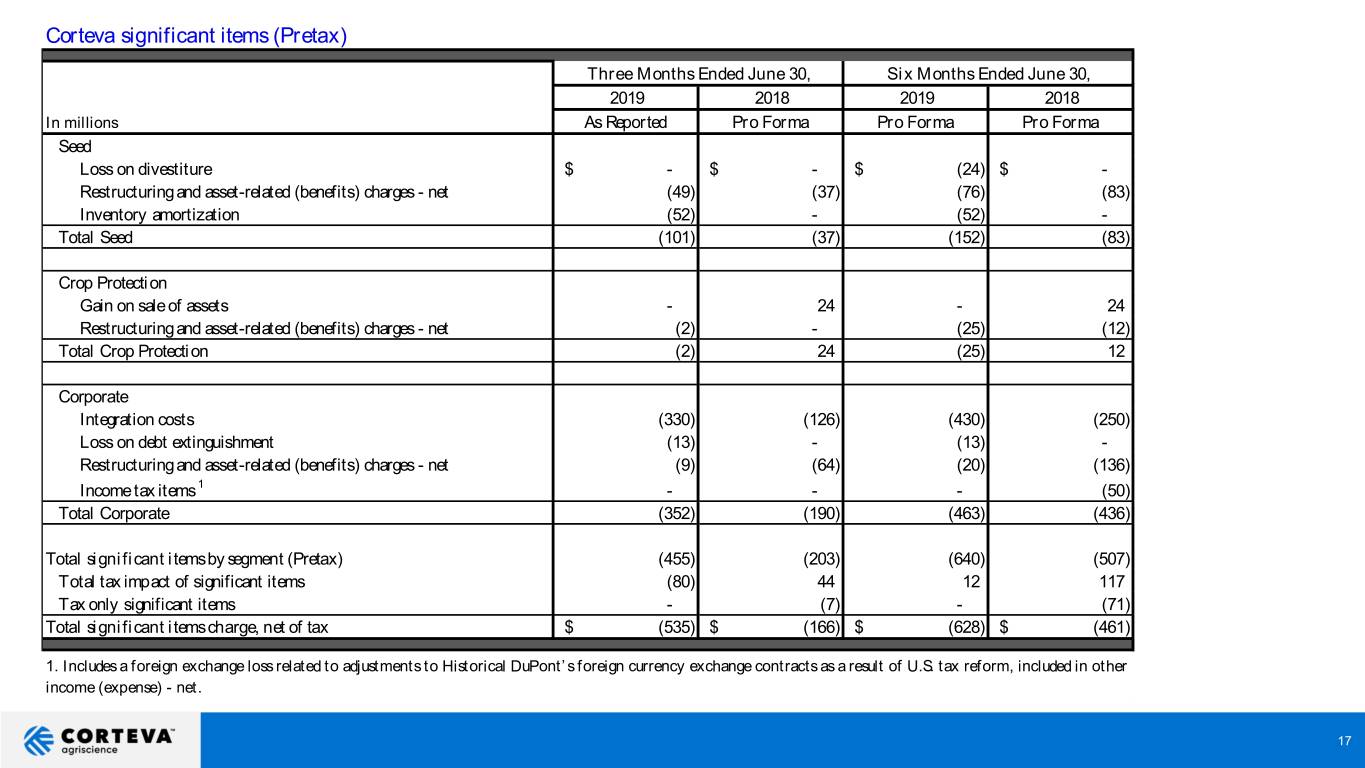
Corteva significant items (Pretax) Three Months Ended June 30, Six Months Ended June 30, 2019 2018 2019 2018 In millions As Reported Pro Forma Pro Forma Pro Forma Seed Loss on divestiture $ - $ - $ (24) $ - Restructuring and asset-related (benefits) charges - net (49) (37) (76) (83) Inventory amortization (52) - (52) - Total Seed (101) (37) (152) (83) Crop Protection Gain on sale of assets - 24 - 24 Restructuring and asset-related (benefits) charges - net (2) - (25) (12) Total Crop Protection (2) 24 (25) 12 Corporate Integration costs (330) (126) (430) (250) Loss on debt extinguishment (13) - (13) - Restructuring and asset-related (benefits) charges - net (9) (64) (20) (136) Income tax items 1 - - - (50) Total Corporate (352) (190) (463) (436) Total significant items by segment (Pretax) (455) (203) (640) (507) Total tax impact of significant items (80) 44 12 117 Tax only significant items - (7) - (71) Total significant items charge, net of tax $ (535) $ (166) $ (628) $ (461) 1. Includes a foreign exchange loss related to adjustments to Historical DuPont’s foreign currency exchange contracts as a result of U.S. tax reform, included in other income (expense) - net. 17
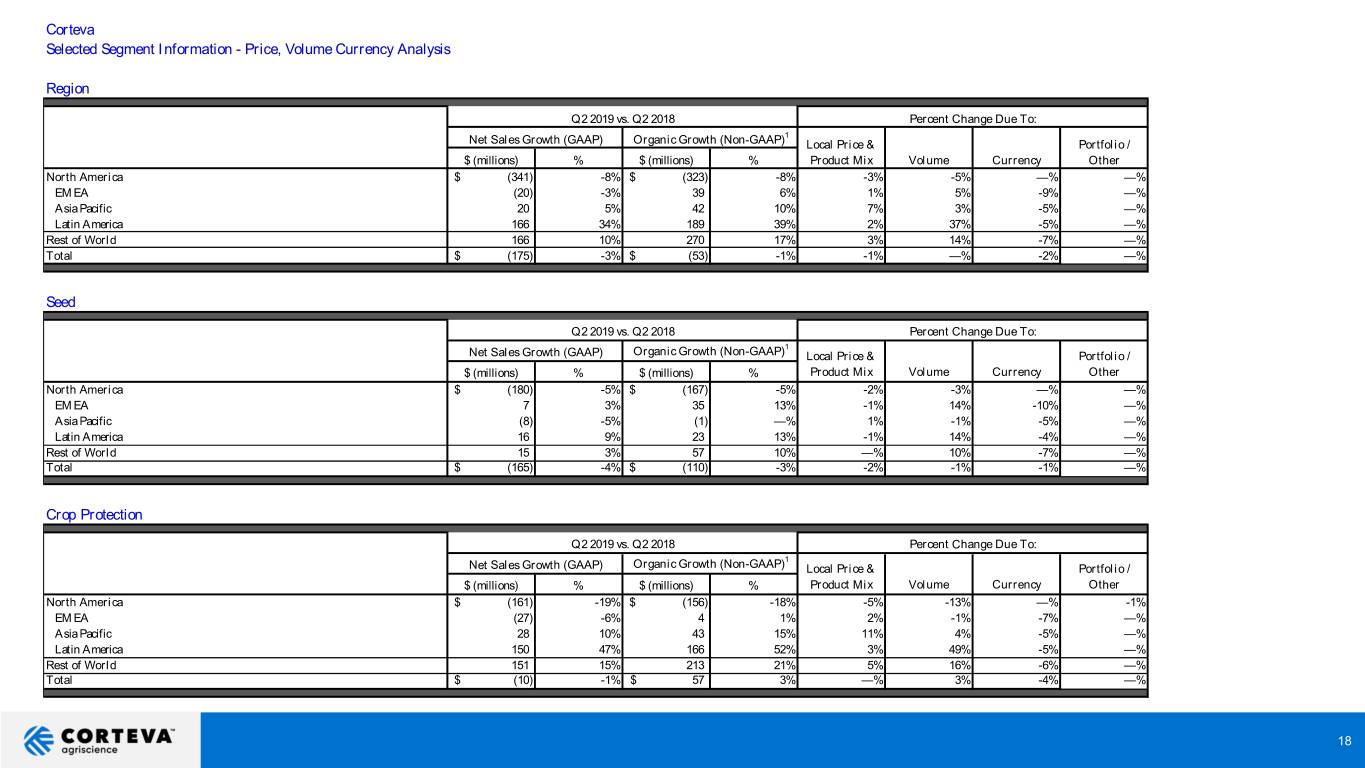
Corteva Selected Segment Information - Price, Volume Currency Analysis Region Q2 2019 vs. Q2 2018 Percent Change Due To: 1 Net Sales Growth (GAAP) Organic Growth (Non-GAAP) Local Price & Portfolio / $ (millions) % $ (millions) % Product Mix Volume Currency Other North America $ (341) -8% $ (323) -8% -3% -5% —% —% EM EA (20) -3% 39 6% 1% 5% -9% —% Asia Pacific 20 5% 42 10% 7% 3% -5% —% Latin America 166 34% 189 39% 2% 37% -5% —% Rest of World 166 10% 270 17% 3% 14% -7% —% Total $ (175) -3% $ (53) -1% -1% —% -2% —% Seed Q2 2019 vs. Q2 2018 Percent Change Due To: 1 Net Sales Growth (GAAP) Organic Growth (Non-GAAP) Local Price & Portfolio / $ (millions) % $ (millions) % Product Mix Volume Currency Other North America $ (180) -5% $ (167) -5% -2% -3% —% —% EM EA 7 3% 35 13% -1% 14% -10% —% Asia Pacific (8) -5% (1) —% 1% -1% -5% —% Latin America 16 9% 23 13% -1% 14% -4% —% Rest of World 15 3% 57 10% —% 10% -7% —% Total $ (165) -4% $ (110) -3% -2% -1% -1% —% Crop Protection Q2 2019 vs. Q2 2018 Percent Change Due To: 1 Net Sales Growth (GAAP) Organic Growth (Non-GAAP) Local Price & Portfolio / $ (millions) % $ (millions) % Product Mix Volume Currency Other North America $ (161) -19% $ (156) -18% -5% -13% —% -1% EM EA (27) -6% 4 1% 2% -1% -7% —% Asia Pacific 28 10% 43 15% 11% 4% -5% —% Latin America 150 47% 166 52% 3% 49% -5% —% Rest of World 151 15% 213 21% 5% 16% -6% —% Total $ (10) -1% $ 57 3% —% 3% -4% —% 18
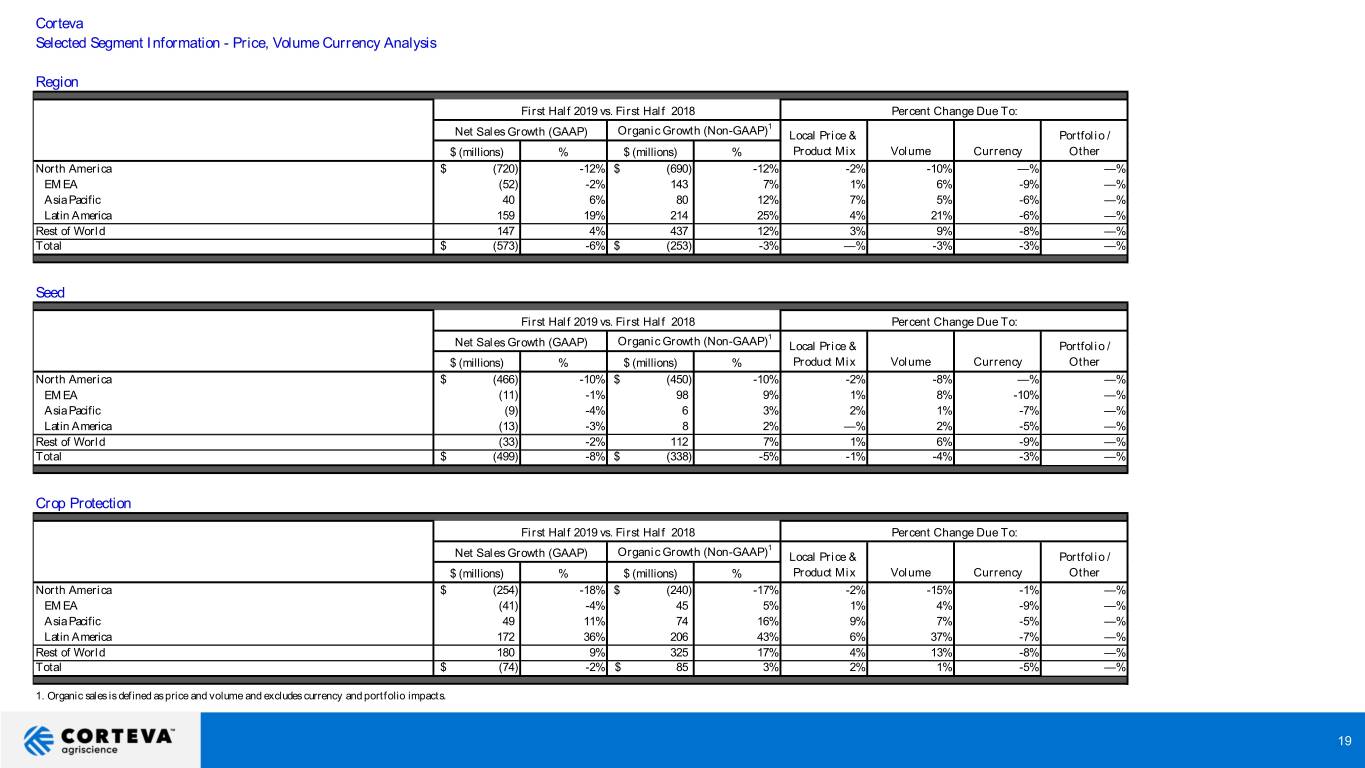
Corteva Selected Segment Information - Price, Volume Currency Analysis Region First Half 2019 vs. First Half 2018 Percent Change Due To: 1 Net Sales Growth (GAAP) Organic Growth (Non-GAAP) Local Price & Portfolio / $ (millions) % $ (millions) % Product Mix Volume Currency Other North America $ (720) -12% $ (690) -12% -2% -10% —% —% EM EA (52) -2% 143 7% 1% 6% -9% —% Asia Pacific 40 6% 80 12% 7% 5% -6% —% Latin America 159 19% 214 25% 4% 21% -6% —% Rest of World 147 4% 437 12% 3% 9% -8% —% Total $ (573) -6% $ (253) -3% —% -3% -3% —% Seed First Half 2019 vs. First Half 2018 Percent Change Due To: 1 Net Sales Growth (GAAP) Organic Growth (Non-GAAP) Local Price & Portfolio / $ (millions) % $ (millions) % Product Mix Volume Currency Other North America $ (466) -10% $ (450) -10% -2% -8% —% —% EM EA (11) -1% 98 9% 1% 8% -10% —% Asia Pacific (9) -4% 6 3% 2% 1% -7% —% Latin America (13) -3% 8 2% —% 2% -5% —% Rest of World (33) -2% 112 7% 1% 6% -9% —% Total $ (499) -8% $ (338) -5% -1% -4% -3% —% Crop Protection First Half 2019 vs. First Half 2018 Percent Change Due To: 1 Net Sales Growth (GAAP) Organic Growth (Non-GAAP) Local Price & Portfolio / $ (millions) % $ (millions) % Product Mix Volume Currency Other North America $ (254) -18% $ (240) -17% -2% -15% -1% —% EM EA (41) -4% 45 5% 1% 4% -9% —% Asia Pacific 49 11% 74 16% 9% 7% -5% —% Latin America 172 36% 206 43% 6% 37% -7% —% Rest of World 180 9% 325 17% 4% 13% -8% —% Total $ (74) -2% $ 85 3% 2% 1% -5% —% 1. Organic sales is defined as price and volume and excludes currency and portfolio impacts. 19
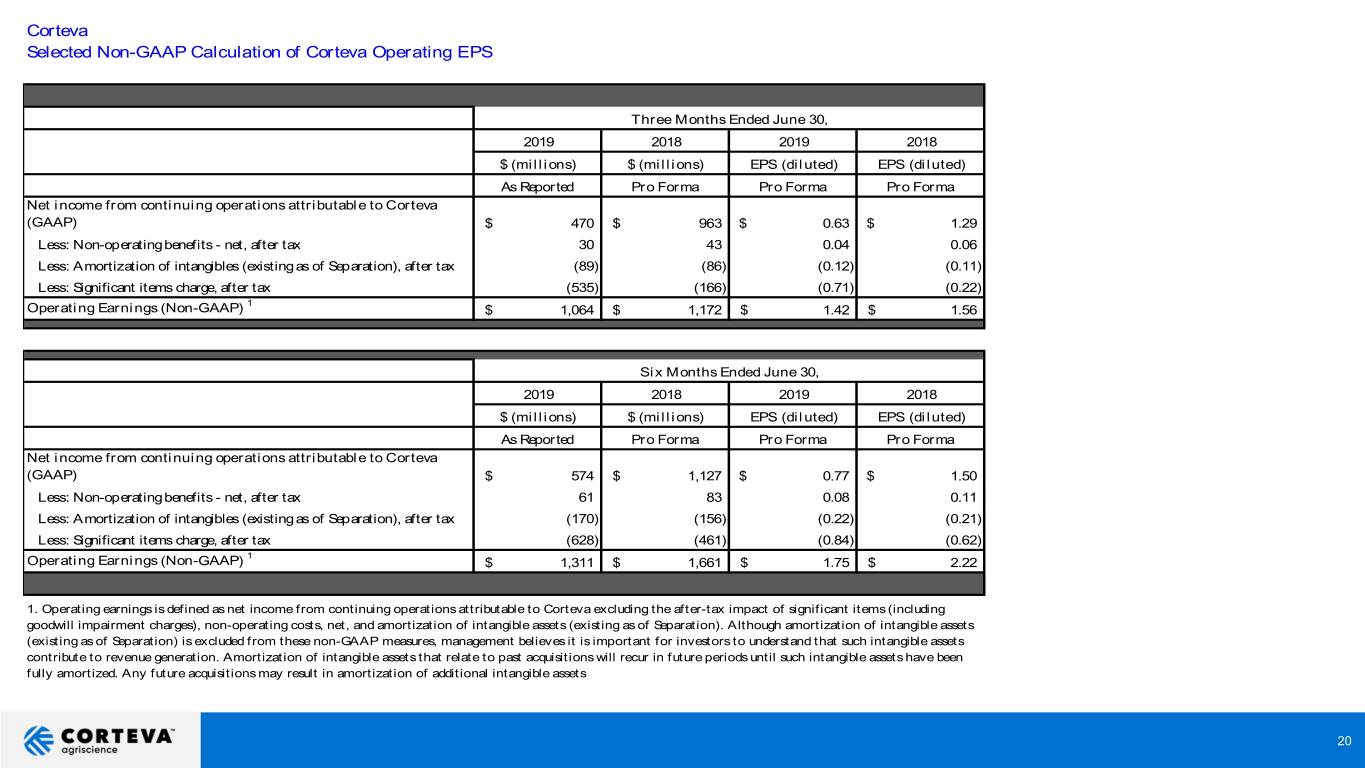
Corteva Selected Non-GAAP Calculation of Corteva Operating EPS Three Months Ended June 30, 2019 2018 2019 2018 $ (millions) $ (millions) EPS (diluted) EPS (diluted) As Reported Pro Forma Pro Forma Pro Forma Net income from continuing operations attributable to Corteva (GAAP) $ 470 $ 963 $ 0.63 $ 1.29 Less: Non-operating benefits - net, after tax 30 43 0.04 0.06 Less: Amortization of intangibles (existing as of Separation), after tax (89) (86) (0.12) (0.11) Less: Significant items charge, after tax (535) (166) (0.71) (0.22) 1 Operating Earnings (Non-GAAP) $ 1,064 $ 1,172 $ 1.42 $ 1.56 Six Months Ended June 30, 2019 2018 2019 2018 $ (millions) $ (millions) EPS (diluted) EPS (diluted) As Reported Pro Forma Pro Forma Pro Forma Net income from continuing operations attributable to Corteva (GAAP) $ 574 $ 1,127 $ 0.77 $ 1.50 Less: Non-operating benefits - net, after tax 61 83 0.08 0.11 Less: Amortization of intangibles (existing as of Separation), after tax (170) (156) (0.22) (0.21) Less: Significant items charge, after tax (628) (461) (0.84) (0.62) 1 Operating Earnings (Non-GAAP) $ 1,311 $ 1,661 $ 1.75 $ 2.22 1. Operating earnings is defined as net income from continuing operations attributable to Corteva excluding the after-tax impact of significant items (including goodwill impairment charges), non-operating costs, net, and amortization of intangible assets (existing as of Separation). Although amortization of intangible assets (existing as of Separation) is excluded from these non-GAAP measures, management believes it is important for investors to understand that such intangible assets contribute to revenue generation. Amortization of intangible assets that relate to past acquisitions will recur in future periods until such intangible assets have been fully amortized. Any future acquisitions may result in amortization of additional intangible assets 20
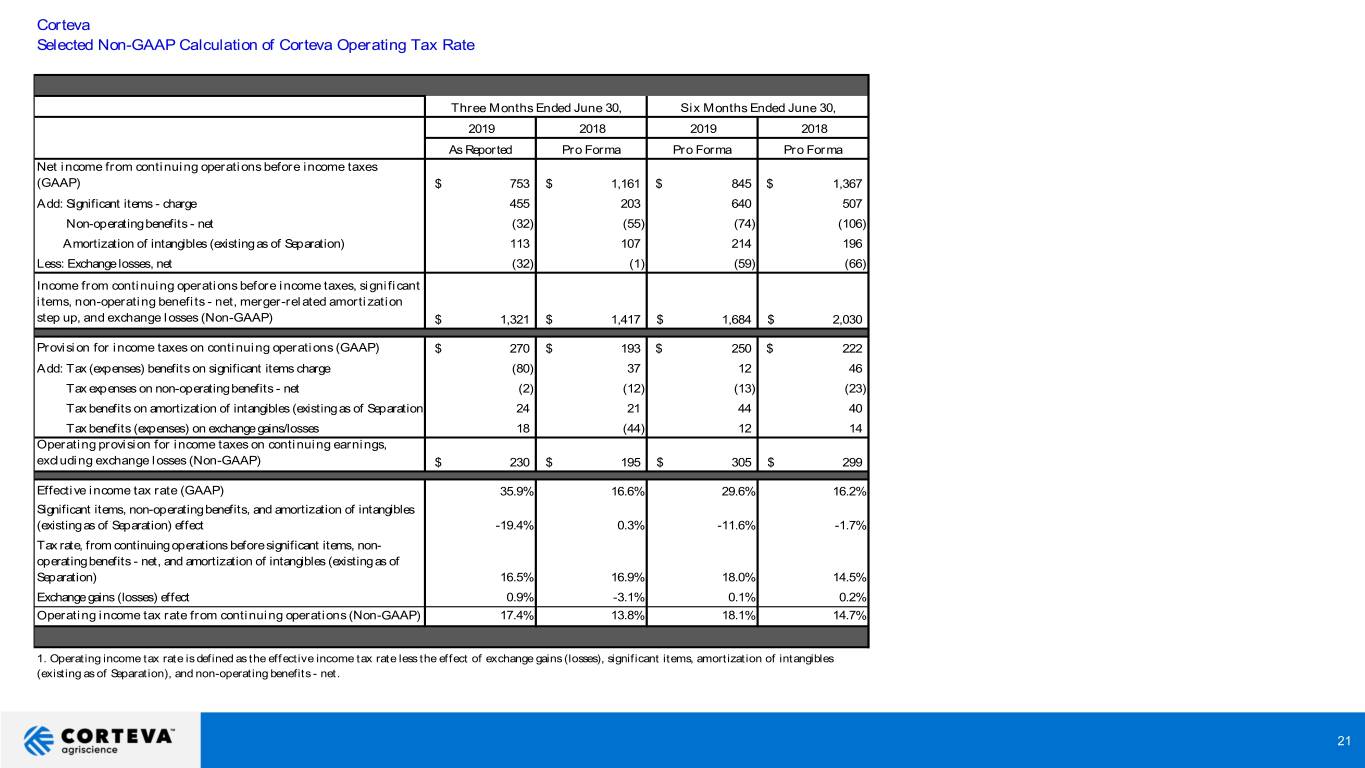
Corteva Selected Non-GAAP Calculation of Corteva Operating Tax Rate Three Months Ended June 30, Six Months Ended June 30, 2019 2018 2019 2018 As Reported Pro Forma Pro Forma Pro Forma Net income from continuing operations before income taxes (GAAP) $ 753 $ 1,161 $ 845 $ 1,367 Add: Significant items - charge 455 203 640 507 Non-operating benefits - net (32) (55) (74) (106) Amortization of intangibles (existing as of Separation) 113 107 214 196 Less: Exchange losses, net (32) (1) (59) (66) Income from continuing operations before income taxes, significant items, non-operating benefits - net, merger-related amortization step up, and exchange losses (Non-GAAP) $ 1,321 $ 1,417 $ 1,684 $ 2,030 Provision for income taxes on continuing operations (GAAP) $ 270 $ 193 $ 250 $ 222 Add: Tax (expenses) benefits on significant items charge (80) 37 12 46 Tax expenses on non-operating benefits - net (2) (12) (13) (23) Tax benefits on amortization of intangibles (existing as of Separation) 24 21 44 40 Tax benefits (expenses) on exchange gains/losses 18 (44) 12 14 Operating provision for income taxes on continuing earnings, excluding exchange losses (Non-GAAP) $ 230 $ 195 $ 305 $ 299 Effective income tax rate (GAAP) 35.9% 16.6% 29.6% 16.2% Significant items, non-operating benefits, and amortization of intangibles (existing as of Separation) effect -19.4% 0.3% -11.6% -1.7% Tax rate, from continuing operations before significant items, non- operating benefits - net, and amortization of intangibles (existing as of Separation) 16.5% 16.9% 18.0% 14.5% Exchange gains (losses) effect 0.9% -3.1% 0.1% 0.2% Operating income tax rate from continuing operations (Non-GAAP) 17.4% 13.8% 18.1% 14.7% 1. Operating income tax rate is defined as the effective income tax rate less the effect of exchange gains (losses), significant items, amortization of intangibles (existing as of Separation), and non-operating benefits - net. 21

22


