As filed with the Securities and Exchange Commission on June 28, 2021
File No. 000-56274
UNITED STATES
SECURITIES AND EXCHANGE COMMISSION
Washington, DC 20549
Amendment No. 2
to
FORM 10
GENERAL FORM FOR REGISTRATION OF SECURITIES
PURSUANT TO SECTION 12(b) OR 12(g) OF
THE SECURITIES EXCHANGE ACT OF 1934
VINEBROOK HOMES TRUST, INC.
(Exact name of registrant as specified in its charter)
| Maryland | 83-1268857 | |
| (State or other jurisdiction of incorporation or organization) | (IRS Employer Identification Number) | |
| 2515 McKinney Avenue, Suite 1100, Dallas, Texas | 75201 | |
| (Address of principal executive offices) | (Zip Code) | |
Registrant’s telephone number, including area code: (833) 463-6697
Copies to:
Brian Mitts Chief Financial Officer, Assistant Secretary and Treasurer VineBrook Homes Trust, Inc. 2515 McKinney Avenue, Suite 1100 Dallas, Texas 75201 (833) 463-6697 | Charlie Haag Justin Reinus Winston & Strawn LLP 2121 North Pearl Street, Suite 900 Dallas, Texas 75201 (214) 453-6500 |
Securities to be registered pursuant to Section 12(b) of the Act:
Title of each class to be so registered | Name of each exchange on which each class is to be registered | |
| None | None |
Securities to be registered pursuant to Section 12(g) of the Act:
Class A Common Stock, par value $0.01 per share
(Title of class)
Indicate by check mark whether the registrant is a large accelerated filer, an accelerated filer, a non-accelerated filer, a smaller reporting company, or an emerging growth company. See the definitions of “large accelerated filer,” “accelerated filer,” “smaller reporting company,” and “emerging growth company” in Rule 12b-2 of the Exchange Act.
| Large accelerated filer | ☐ | Accelerated filer | ☐ | |||
| Non-accelerated filer | ☑ | Smaller reporting company | ☑ | |||
| Emerging growth company | ☑ | |||||
If an emerging growth company, indicate by check mark if the registrant has elected not to use the extended transition period for complying with any new or revised financial accounting standards provided pursuant to Section 13(a) of the Exchange Act. ☐
TABLE OF CONTENTS
i
CAUTIONARY NOTE REGARDING FORWARD-LOOKING STATEMENTS
Certain statements contained in this General Form for Registration of Securities on Form 10 (this “Form 10”) of VineBrook Homes Trust, Inc. (“we”, “us”, “our”, or the “Company”) other than historical facts may be considered forward-looking statements. In particular, statements relating to our business and investment strategies, plans or intentions, our liquidity and capital resources, our performance and results of operations contain forward-looking statements. Furthermore, all statements regarding future financial performance (including market conditions) are forward-looking statements. We caution investors that any forward-looking statements presented in this Form 10 are based on management’s beliefs and assumptions made by, and information currently available to, management. When used, the words “anticipate,” “believe,” “expect,” “intend,” “may,” “might,” “plan,” “estimate,” “project,” “should,” “will,” “would,” “result,” the negative version of these words and similar expressions that do not relate solely to historical matters are intended to identify forward-looking statements.
Forward-looking statements are subject to risks, uncertainties and assumptions and may be affected by known and unknown risks, trends, uncertainties and factors that are beyond our control. Should one or more of these risks or uncertainties materialize, or should underlying assumptions prove incorrect, actual results may vary materially from those anticipated, estimated or projected. We caution you against relying on any of these forward-looking statements.
Some of the risks and uncertainties that may cause our actual results, performance, liquidity or achievements to differ materially from those expressed or implied by forward-looking statements include, among others, the following:
| • | risks associated with the COVID-19 pandemic and future outbreak of other highly infectious or contagious diseases; |
| • | risks associated with our limited operating history and the possibility that we may not replicate the historical results achieved by other entities managed or sponsored by affiliates of NexPoint Real Estate Advisors V, L.P. (our “Adviser”), members of VineBrook Homes, LLC’s (our “Manager”) management team or their affiliates; |
| • | our dependence on our Manager, its affiliates and personnel to conduct our day-to-day operations; |
| • | risks associated with the Manager’s ability to terminate the Management Agreements (as defined below) and risks associated with any potential internalization of our management functions; |
| • | loss of key personnel of our Adviser and our Manager; |
| • | risks associated with the fluctuation in the net asset value (“NAV”) per share amounts; |
| • | unfavorable changes in economic conditions and their effects on the real estate industry generally and our operations and financial condition, including our ability to access funding and generate returns for stockholders; |
ii
| • | the risk we make significant changes to our strategies in a market downturn, or fail to do so; |
| • | risks associated with ownership of real estate, including properties in transition, subjectivity of valuation, environmental matters and lack of liquidity in our assets; |
| • | risks related to increasing property taxes, homeowner’s associations (“HOAs”) fees and insurance costs may negatively affect our financial results; |
| • | risks associated with acquisitions, including the risk of expanding our scale of operations and acquisitions even if there is a recovery in the rental and housing markets, which could adversely impact anticipated yields; |
| • | risks associated with leasing real estate, including the risks that rents do not increase sufficiently to keep pace with rising costs of operations and competitive pressures from other types of properties or market conditions that incentivize tenants to purchase their residences; |
| • | risks related to tenant relief laws, including laws regulating evictions, rent control laws, executive orders, administrative orders and other regulations that may impact our rental income and profitability; |
| • | risks related to governmental laws, regulations and rules applicable to our properties or that may be passed in the future; |
| • | risks relating to the timing and costs of the renovation of properties which has the potential to adversely affect our operating results and ability to make distributions; |
| • | risks related to our ability to change our major policies, operations and targeted investments without stockholder consent; |
| • | risks related to failure to maintain our status as a real estate investment trust (“REIT”); |
| • | risks related to failure of our operating partnership to be taxable as a partnership for federal income tax purposes, possibly causing us to fail to qualify for or to maintain REIT status; |
| • | risks related to compliance with REIT requirements, which may limit our ability to hedge our liabilities effectively and cause us to forgo otherwise attractive opportunities, liquidate certain of our investments or incur tax liabilities; |
| • | the risk that the Internal Revenue Service (“IRS”) may consider certain sales of properties to be prohibited transactions, resulting in a 100% penalty tax on any taxable gain; |
iii
| • | the ineligibility of dividends payable by REITs for the reduced tax rates available for some dividends; |
| • | risks associated with the stock ownership restrictions of the Internal Revenue Code of 1986, as amended (the “Code”) for REITs and the stock ownership limit imposed by our charter; |
| • | recent and potential legislative or regulatory tax changes or other actions affecting REITs; |
| • | failure to generate sufficient cash flows to service our outstanding indebtedness or pay distributions at expected levels; |
| • | risks associated with purchasing single-family properties through the foreclosure auction process; |
| • | damage associated with single-family properties sold through short sales or foreclosure sales may require extensive renovation; and |
| • | any of the other risks included in this Form 10, including those set forth under the heading “Risk Factors.” |
iv
We are filing this Amendment No. 1 to Form 10 to register shares of our Class A common stock, par value $0.01 per share (our “common stock”), pursuant to Section 12(g) of the Securities Exchange Act of 1934, as amended (the “Exchange Act”). We are subject to the registration requirements of Section 12(g) of the Exchange Act because as of December 31, 2020, the aggregate value of our assets exceeded the applicable threshold and our common stock was held of record by 2,000 or more persons. As a result of the registration of our common stock pursuant to the Exchange Act, following the effectiveness of this Form 10 (as amended), we will be subject to the requirements of the Exchange Act and the rules promulgated thereunder. In particular, we will be required to file Quarterly Reports on Form 10-Q, Annual Reports on Form 10-K, and Current Reports on Form 8-K and otherwise comply with the disclosure obligations of the Exchange Act applicable to issuers filing registration statements to register a class of securities pursuant to Section 12(g) of the Exchange Act.
General
VineBrook Homes Trust, Inc. (“VineBrook,” the “Company,” “we,” “us,” or “our”) was formed on July 16, 2018 as a Maryland corporation, and elected to be taxed as a real estate investment trust (“REIT”) beginning with its taxable year ended December 31, 2018. We are focused on acquiring, developing, renovating, leasing and operating single-family rental (“SFR”) properties primarily located in the midwestern, heartland and southern U.S. markets. Substantially all of our assets are owned by, and our operations are conducted through, our operating partnership, VineBrook Homes Operating Partnership, L.P. (our “Operating Partnership”). This structure is referred to as an Umbrella Partnership REIT or “UPREIT” structure. We own the majority of the issued and outstanding limited partnership interests of our Operating Partnership. As of March 31, 2021, we, through our Operating Partnership, owned and operated a portfolio of over 13,500 SFR assets located in 16 states (our “Portfolio”).
We are externally managed by our adviser, NexPoint Real Estate Advisors V, L.P. (our “Adviser”), through an amended and restated advisory agreement, dated May 4, 2020, between our Adviser and us (as amended from time to time, the “Advisory Agreement”), subject to the authority of our board of directors (our “Board”) over the management of the Company. Our Adviser’s responsibilities include, among other duties, recommending distributions to our Board, preparing our quarterly and annual consolidated financial statements in accordance with generally accepted accounting principles (“GAAP”), managing our annual audit, developing and maintaining appropriate internal accounting controls, maintaining our REIT status, recommending to the pricing committee of our board of directors our net asset value (“NAV”), processing purchases and redemptions of shares of our common stock, preparing public filings, preparing our tax filings, raising capital for us and procuring debt financing. See Item 5. “Directors and Executive Officers—Our Adviser—Advisory Agreement” for additional information regarding the terms of the Advisory Agreement. Additionally, certain employees of our Adviser serve as some of our directors and executive officers. For additional information regarding our Adviser’s key employees, see Item 5. “Directors and Executive Officers—Our Adviser—Key Employees of Our Adviser.”
Our Portfolio is managed by VineBrook Homes, LLC (our “Manager”), pursuant to the terms of a management agreement, dated November 1, 2018 (as amended from time to time, the “Original Management Agreement”), among our Manager and various wholly owned subsidiaries of our Operating Partnership that own the SFR properties and the amended and restated side letter, dated July 31, 2020, among our Manager, our Operating Partnership and other parties thereto (as amended from time to time, the “Side Letter”). Our Manager entered into two additional management agreements (as amended from time to time, the
1
“TrueLane Management Agreements”) with other wholly owned subsidiaries of our Operating Partnership in connection with our acquisition of a bulk portfolio of SFR properties on September 30, 2019 (See “—Subsequent Material Acquisitions—TrueLane Acquisition” below for additional information). The TrueLane Management Agreements are on the same terms as the Original Management Agreement and are also subject to the terms of the Side Letter. Our Manager entered into an additional management agreement (as amended from time to time, the “Conrex Management Agreement”) with other wholly owned subsidiaries of our Operating Partnership in connection with our acquisitions of a bulk portfolio of SFR properties on January 22, 2021 and March 1, 2021 (See “—Subsequent Material Acquisitions—Conrex Acquisitions” below for additional information). The Conrex Management Agreement is on the same terms as the Original Management Agreement and is also subject to the terms of the Side Letter. From time to time, our Manager may enter into one or more additional management agreements with other wholly owned subsidiaries of our Operating Partnership in connection with future acquisitions of SFR properties on the same terms as the Original Management Agreement. The Original Management Agreement, the TrueLane Management Agreements, the Conrex Management Agreement and any future management agreements are collectively referred to herein as the “Management Agreements.” See Item 7. “Certain Relationships and Related Transactions, and Director Independence—Transactions with Related Persons—Management Agreements and Side Letter” for additional information regarding the terms of the Management Agreements.
Our Manager is responsible for the day-to-day management of the properties, renovating the homes, leasing the properties, managing tenant situations, collecting rents, paying operating expenses, managing maintenance issues, accounting for each property using GAAP, and other responsibilities customary for the management of SFR properties. In addition, subject to the limitations set forth in our Operating Partnership’s Amended and Restated Agreement of Limited Partnership (as amended from time to time, the “OP LPA”) and oversight from our Operating Partnership’s investment committee (the “Investment Committee”), our Manager is primarily responsible for the identification of potential SFR properties and the acquisition and disposition of SFR properties.
Our principal executive offices are located at 2515 McKinney Avenue, Suite 1100, Dallas, Texas 75201. Our telephone number is (833) 463-6697.
The Formation Transaction
On July 18, 2018, our Operating Partnership and its subsidiaries executed definitive agreements (the “Purchase Agreements”) to acquire the Initial Portfolio (defined below) through a series of restructurings and acquisitions of SFR properties from numerous partnerships and limited liability companies (such partnerships and limited liability companies are collectively referred to herein as the “VineBrook Companies,” and such acquisitions and related transactions are referred to herein as the “Formation Transaction”). The Formation Transaction closed on November 1, 2018, at which time we, through our Operating Partnership, acquired the equity interest in six special purpose entities (“SPEs”), which collectively owned approximately 4,129 SFR assets located in Ohio, Kentucky and Indiana (the “Initial Portfolio”) for a total purchase price of $330.2 million, including closing and financing costs of approximately $6.0 million. In connection with the Formation Transaction, NexPoint Real Estate Opportunities, LLC (“NREO”), an affiliate of NexPoint Advisors, L.P. (“NexPoint”), contributed an SPE which owned a portfolio of SFR properties located in Cincinnati included in the Initial Portfolio and cash in exchange for approximately $70.7 million in Class A units of our Operating Partnership (“OP Units”).
2
Because we acquired substantially all of the VineBrook Companies’ assets and liabilities by purchasing (via a combination of cash and the issuance OP Units) all general partnership interests, limited partnership interests and equity interests of the VineBrook Companies in connection with the Formation Transaction, we consider the VineBrook Companies on a consolidated basis to be our predecessor.
Subsequent Material Acquisitions
TrueLane Acquisition
On September 30, 2019, we, through our Operating Partnership, acquired a portfolio of 954 SFR properties from an unaffiliated third-party for $73 million (the “TrueLane Acquisition”). The TrueLane Acquisition expanded our footprint to four additional active markets, including Pittsburgh, Pennsylvania, Jackson, Mississippi, Omaha, Nebraska and Little Rock, Arkansas. In connection with the TrueLane Acquisition, our Manager entered into the TrueLane Management Agreements with other wholly owned subsidiaries of our Operating Partnership. The TrueLane Management Agreements are on the same terms as the Original Management Agreement and are also subject to the terms of the Side Letter (See “—General” above and Item 7. “Certain Relationships and Related Transactions, and Director Independence—Transactions with Related Persons—Management Agreements and Side Letter” for additional information regarding the terms of the Management Agreements).
Conrex Acquisitions
On January 22, 2021, we, through our Operating Partnership, acquired a portfolio of 1,725 SFR properties from an unaffiliated third-party for $228.0 million (the “Conrex I Acquisition”). In addition to the $228.0 million purchase price, in connection with the Conrex I Acquisition, we paid an approximately $2.5 million acquisition fee to the Manager which was capitalized as a transaction cost. The Conrex I Acquisition expanded our footprint to seven additional markets in Alabama, Georgia, North Carolina and South Carolina. In connection with the Conrex I Acquisition, our Manager entered into the Conrex Management Agreement with wholly owned subsidiaries of our Operating Partnership. The Conrex Management Agreement is on the same terms as the Original Management Agreement and is also subject to the terms of the Side Letter (See “—General” above and Item 7. “Certain Relationships and Related Transactions, and Director Independence—Transactions with Related Persons—Management Agreements and Side Letter” for additional information regarding the terms of the Management Agreements).
On March 1, 2021, we, through our Operating Partnership, acquired a portfolio of 2,170 SFR properties from an unaffiliated third-party for $282.9 million (the “Conrex II Acquisition”). In addition to the $282.9 million purchase price, in connection with the Conrex II Acquisition, we paid an approximately $3.0 million acquisition fee to the Manager which was capitalized as a transaction cost. The Conrex II Acquisition further expanded our presence in the midwest, heartland and southeast U.S. markets. In connection with the Conrex II Acquisition, our Manager entered into an amendment to the Conrex Management Agreement with wholly owned subsidiaries of our Operating Partnership. The Conrex Management Agreement is on the same terms as the Original Management Agreement and is also subject to the terms of the Side Letter (See “—General” above and Item 7. “Certain Relationships and Related Transactions, and Director Independence—Transactions with Related Persons—Management Agreements and Side Letter” for additional information regarding the terms of the Management Agreements).
We entered into a 120-day agreement with an affiliate of Brookfield Asset Management for the management of a subset of homes purchased in the Conrex I Acquisition and Conrex II Acquisition on a transitional basis, which was mutually terminated early on April 27, 2021.
3
The portfolio acquired in the Conrex I Acquisition had an occupancy rate of 96.5% and weighted average monthly effective rent per occupied home of $1,167 as of January 22, 2021. The portfolio acquired in the Conrex II Acquisition had an occupancy rate of 89.2% and weighted average monthly effective rent per occupied home of $1,158 as of March 1, 2021. At the time of the acquisition, 93% of the homes we acquired in the Conrex I Acquisition and the Conrex II Acquisition had in place leases and 99.6% of homes were generally in good condition with 99.6% being recently renovated and had minimal deferred maintenance. We intend to renovate less than 0.4% of the homes acquired and to sell less than 0.1% of the homes acquired.
The following table provides a summary of the number of homes, occupancy rate and average rent on a market basis of the 1,725 homes we acquired in the Conrex I Acquisition as of January 22, 2021:
| # of Homes | Occupancy | Avg Rent | ||||||||||
Birmingham | 309 | 91.6 | % | 1,104 | ||||||||
Columbia | 379 | 97.6 | % | 1,211 | ||||||||
Indianapolis | 276 | 98.2 | % | 1,196 | ||||||||
Augusta | 182 | 96.2 | % | 994 | ||||||||
Cincinnati | 117 | 98.3 | % | 1,270 | ||||||||
Dayton | 64 | 98.4 | % | 1,221 | ||||||||
Greenville | 138 | 99.3 | % | 1,228 | ||||||||
Kansas City | 130 | 94.6 | % | 1,164 | ||||||||
Triad | 52 | 98.1 | % | 1,159 | ||||||||
Columbus | 65 | 96.9 | % | 1,214 | ||||||||
Huntsville | 13 | 100.0 | % | 1,024 | ||||||||
|
|
|
|
|
| |||||||
Total | 1,725 | 96.5 | % | 1,167 | ||||||||
The following table provides a summary of the number of homes, occupancy rate and average rent on a market basis of the 2,170 homes we acquired in the Conrex II Acquisition as of March 1, 2021:
| # of Homes | Occupancy | Avg Rent | ||||||||||
Birmingham | 438 | 86.3 | % | 1,104 | ||||||||
Columbia | 305 | 88.5 | % | 1,191 | ||||||||
Indianapolis | 217 | 90.3 | % | 1,151 | ||||||||
Augusta | 186 | 91.4 | % | 990 | ||||||||
Cincinnati | 252 | 96.4 | % | 1,271 | ||||||||
Dayton | 125 | 95.2 | % | 1,244 | ||||||||
Greenville | 46 | 87.0 | % | 1,228 | ||||||||
Kansas City | 164 | 82.9 | % | 1,201 | ||||||||
Triad | 35 | 80.0 | % | 1,191 | ||||||||
Columbus | 81 | 91.4 | % | 1,196 | ||||||||
Huntsville | 121 | 95.0 | % | 1,074 | ||||||||
St. Louis | 31 | 80.6 | % | 1,188 | ||||||||
Montgomery | 61 | 85.2 | % | 1,061 | ||||||||
Jackson | 108 | 82.4 | % | 1,220 | ||||||||
|
|
|
|
|
| |||||||
Total | 2,170 | 89.2 | % | 1,158 | ||||||||
We included contractual provisions in both the acquisition agreements under which the sellers are obligated to provide us the books and records of the entities purchased, which would have allowed us to comply with Rule 3-14 by completing and auditing the required financial statements. We have, to date, exhausted all practical avenues by which to obtain the information necessary to provide Rule 3-14 financial statements. Consequently, we believe the essential information for the delivery of Rule 3-14 financial statements cannot be reasonably obtained. There is no affiliation between us and the sellers.
Our Adviser
Our Adviser is an affiliate of NexPoint Real Estate Advisors, L.P. (“NREA”), which is wholly owned by NexPoint. NREA was formed to manage real estate investments for NexPoint managed companies, funds and accounts. The NREA real estate team is led by Matt McGraner and Brian Mitts. Pursuant to the Advisory Agreement, our Adviser manages our business operations, subject to the authority of our Board. Additionally, certain employees of our Adviser serve on our Board, as our officers and on the Investment Committee. The Investment Committee was established pursuant to the terms of the OP LPA and is responsible for making decisions and approvals with respect to asset acquisitions and asset dispositions that exceed a pre-determined amount. The Investment Committee is comprised of three individuals, one appointed by our Adviser and two appointed by our Manager (so long as any Management Agreement remains in place). Currently, Matt McGraner, Dana Sprong and Ryan McGarry are members of the Investment Committee. In accordance with the OP LPA, the Investment Committee has delegated authority to the Manager to acquire or dispose of a limited number of homes. Acquisitions must satisfy the approved guidelines set forth in the Management Agreements, which may be updated from time to time.
For additional information regarding the Adviser’s key employees, see Item 5. “Directors and Executive Officers—Our Adviser—Key Employees of Our Adviser.”
4
Our Manager
As part of the acquisition of the Initial Portfolio, the entity that managed the SFR properties owned by our predecessor since its inception in 2007 (the “Historical VineBrook Manager”) was not acquired. Instead, the beneficial owners of the Historical VineBrook Manager, which include Dana Sprong, Ryan McGarry, Dan Bathon and Tom Silvia (collectively, the “VineBrook Executives”) formed our Manager for the purpose of managing our Portfolio as an external manager.
Our Manager is led by Dana Sprong, Ryan McGarry, and Graham Strong and has a team of more than 350 professionals with experience in real estate investment, property management operations, construction management and comprehensive financial and metric-focused reporting. The VineBrook Executives have operated in the workforce SFR market since the inception of the VineBrook Companies in 2007, participating in several large acquisitions and financing transactions, demonstrating the ability to identify consolidation and growth opportunities and to subsequently integrate new properties into an existing portfolio. Pursuant to the Management Agreements, our Manager is generally the sole and exclusive manager for our properties (subject to the terms of the Management Agreements), responsible for managing, coordinating and supervising the ordinary and usual business and affairs pertaining to the renovation, operation, maintenance, leasing, and management of properties in an efficient manner satisfactory to us and in compliance with the Management Agreements. In addition, our Manager is primarily responsible for the identification of potential SFR properties and the acquisition and disposition of SFR properties, subject to oversight from the Investment Committee and the terms of the OP LPA. Additionally, certain employees of the Manager serve on our Board, as our officers and on the Investment Committee. From time to time, we may use an unaffiliated third party manager for limited periods to, for example, provide management while our Manager sets up an operations team in a market or to manage homes we acquired as part of a larger portfolio acquisition but plan to sell.
For additional information regarding our Manager’s key employees, see Item 5. “Directors and Executive Officers—Our Manager—Key Employees of Our Manager.”
Under the terms of the Side Letter, at any time, we and our Operating Partnership have the right and option (but not the obligation) to purchase all of the equity interests of our Manager, at a price calculated by a formula specified in the Side Letter (the “Call Right”). The purpose of the Call Right is to provide us, our Operating Partnership, and our and its respective permitted successors and assigns with the ability to perform the responsibilities and obligations of our Manager under the Management Agreements. It is not expected that the Call Right would be exercised, except in the event of our initial public offering or sale at our discretion. In addition, the equity interests of our Manager may not be transferred (directly or indirectly), or additional equity interests issued, without the consent of us and our Operating Partnership, which may be withheld in our discretion.
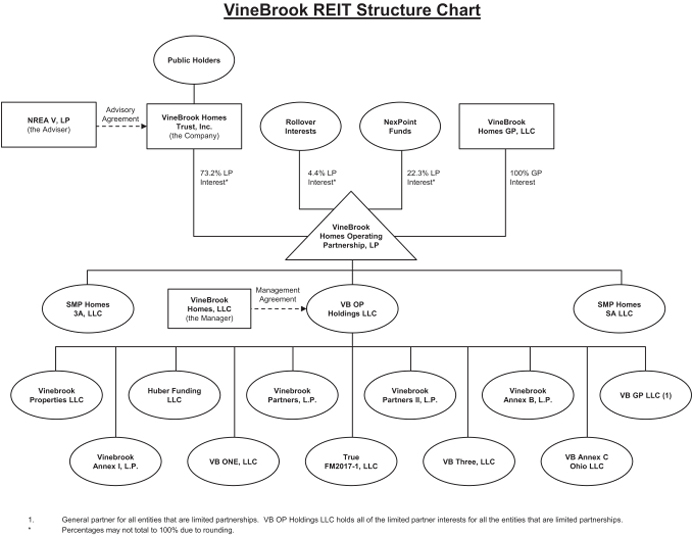
Our Ownership and Operation Structure
The following chart shows our current ownership structure and our relationship with our Adviser and our Manager.
5
6
Our Portfolio
As of March 31, 2021, our homes average approximately 1,318 square feet with three bedrooms and one and a half bathrooms. Our homes benefit from high occupancy and low turnover rates due to our extensive renovation process and institutional management, generating stable, durable cash flows. Similarly, as of March 31, 2021, 93% of our Portfolio is comprised of standalone units, with only 7% of properties stemming from duplexes, triplexes, quad-plexes, villas, townhouses, courtyards and condominiums. As of March 31, 2021, 1,779 homes in our Portfolio (13% of our Portfolio) were unoccupied, including 1,331 recently purchased homes (10% of our Portfolio) in rehabilitation and 442 homes (3% of our Portfolio) in turnover between tenants (make-ready turnover). As of March 31, 2021, the average length of leases in our Portfolio was 12 months and the average remaining length of leases in our Portfolio was seven months. We believe our turnover rate is low because of our institutional level of management, affordable pricing and available amenities not found in other SFR rental properties, including a large number of employees and 24/7 support. As of March 31, 2021, the average age of the homes in our Portfolio is 59 years.
The table below provides summary information regarding our Portfolio as of March 31, 2021:
Market | # of Homes | Portfolio Occupancy | Average Effective Rent | # of Stabilized Homes | Stabilized Occupany | Stabilized Average Monthly Rent | ||||||||||||||||||
Cincinnati | 2,738 | 92.9 | % | $ | 1,076 | 1,828 | 97.6 | % | $ | 1,066 | ||||||||||||||
Dayton | 2,432 | 93.3 | % | 961 | 2,097 | 98.2 | % | 940 | ||||||||||||||||
Columbus | 1,368 | 92.5 | % | 1,070 | 1,048 | 98.2 | % | 1,071 | ||||||||||||||||
St. Louis | 1,226 | 76.0 | % | 946 | 372 | 94.1 | % | 928 | ||||||||||||||||
Indianapolis | 1,059 | 89.6 | % | 1,070 | 403 | 96.8 | % | 976 | ||||||||||||||||
Birmingham | 759 | 87.1 | % | 1,126 | — | n/a | n/a | |||||||||||||||||
Columbia | 685 | 93.4 | % | 1,213 | — | n/a | n/a | |||||||||||||||||
Kansas City | 673 | 76.4 | % | 1,066 | 123 | 94.3 | % | 925 | ||||||||||||||||
Jackson | 494 | 58.9 | % | 1,040 | 46 | 93.5 | % | 1,079 | ||||||||||||||||
Memphis | 474 | 91.1 | % | 852 | 278 | 95.0 | % | 870 | ||||||||||||||||
Augusta | 374 | 86.6 | % | 998 | — | n/a | n/a | |||||||||||||||||
Milwaukee | 370 | 82.7 | % | 1,033 | 108 | 98.1 | % | 1,147 | ||||||||||||||||
Pittsburgh | 306 | 66.3 | % | 894 | 46 | 97.8 | % | 979 | ||||||||||||||||
Greenville | 190 | 90.5 | % | 1,242 | — | n/a | n/a | |||||||||||||||||
Little Rock | 137 | 54.7 | % | 822 | 33 | 100.0 | % | 885 | ||||||||||||||||
Huntsville | 134 | 95.5 | % | 1,144 | — | n/a | n/a | |||||||||||||||||
Omaha | 112 | 64.3 | % | 1,100 | 12 | 100.0 | % | 1,089 | ||||||||||||||||
Triad | 95 | 87.4 | % | 1,162 | — | n/a | n/a | |||||||||||||||||
Montgomery | 61 | 86.9 | % | 1,061 | — | n/a | n/a | |||||||||||||||||
|
|
|
|
|
|
|
|
|
|
|
| |||||||||||||
Sub-Total/Average | 13,687 | 87.0 | % | $ | 1,039 | 6,394 | 97.5 | % | $ | 1,001 | ||||||||||||||
|
|
|
|
|
|
|
|
|
|
|
| |||||||||||||
Held for Sale | 6 | n/a | n/a | n/a | n/a | n/a | ||||||||||||||||||
|
|
|
|
|
|
|
|
|
|
|
| |||||||||||||
Total/Average | 13,693 | 87.0 | % | $ | 1,039 | 6,394 | 97.5 | % | $ | 1,001 | ||||||||||||||
|
|
|
|
|
|
|
|
|
|
|
| |||||||||||||
Occupancy is calculated as the number of homes occupied as of the respective period end, divided by the total number of homes, expressed as a percentage. We use the definition of stabilized homes as established by the National Rental Home Council (the “NRHC”), a non-profit SFR home trade association. A stabilized home means a home that has had a rehabilitation completed and is either leased or 30 days have expired since the rehabilitation has been completed. In accordance with the NRHC definition of stabilized which allows management certain discretion in the inclusion of acquired homes, we currently do not include homes purchased with a tenant in place as stabilized until (1) we have owned them for an adequate period of time to allow for complete on-boarding to our operating platform and (2) the property has experienced tenant turnover at least once under our ownership, providing the opportunity for rehabilitation to meet our property standards. Since stabilized homes are expected to be held for at least one year, stabilized homes also excludes any assets held for sale. As of March 31, 2021, a total of 53.3% of our Portfolio was excluded from being a stabilized home, with 9.7% of our Portfolio being excluded because the homes were in rehabilitation and 43.6% of our Portfolio being excluded because the homes were purchased with tenants in place. As of March 31, 2021, on average, homes are in rehabilitation for 163 days and the average length of time from acquisition to stabilization for acquired homes is 222 days.
Investment Objectives and Strategy
Our primary investment objectives are to maximize the cash flow and value of properties owned, acquire properties with cash flow growth potential, provide quarterly cash distributions and achieve long-term capital appreciation for our stockholders through targeted management and a renovation program on
7
the homes purchased. We predominately target markets that exhibit lower institutional competition, household formation growth, and superior revenue growth relative to national averages that still allow us to efficiently operate through market-level density. Our target markets include the following metropolitan statistical areas or MSAs: Cincinnati, Dayton (OH), Columbus (OH), St. Louis, Indianapolis, Birmingham (AL), Kansas City, Memphis, Montgomery (AL), Pittsburgh, Greenville (SC), Columbia (SC), Huntsville (AL), Milwaukee, Omaha, Little Rock, Jackson (MS), Augusta (GA) and the Triad (NC). We believe we can achieve this objective through active portfolio management to take advantage of market opportunities to achieve superior risk adjusted returns. Our Adviser and Manager regularly monitor and stress-test each market and the Portfolio as a whole under various scenarios, enabling us to make informed and proactive investment decisions.
Our Financing Strategy
We intend to use leverage to provide additional funds to support our investment activities, with the expectation that this will enhance returns. Leverage allows us to make more investments than would otherwise be possible, resulting in a broader and more diverse portfolio with potentially higher returns but also with more risk.
We leverage our Portfolio by assuming or incurring secured or unsecured property-level or entity-level debt. An example of property-level debt is a mortgage loan secured by an individual property or portfolio of properties incurred or assumed in connection with the acquisition of such property or portfolio of properties. An example of entity-level debt is a line of credit obtained by us or our Operating Partnership or subsidiaries.
Our actual leverage level will be affected by a number of factors, some of which are outside our control. Significant inflows of proceeds from our ongoing private offering generally will cause our leverage as a percentage of net assets, or our leverage ratio, to decrease, at least temporarily. Our leverage ratio will also increase or decrease with decreases or increases, respectively, in the value of our Portfolio.
Our target leverage is 60-65% loan-to-value (“LTV”), with value being calculated as the value of our assets used to determine our NAV (see Item 2. “Financial Information—Management’s Discussion and Analysis of Financial Condition and Results of Operations—Overview”) and capital priced at one-month London InterBank Offered Rate (“LIBOR”) plus 150-325 bps, depending on whether the loan is secured or unsecured, the duration of the loan and specific provisions and covenants contained in the loan. We may additionally enter into interest rate swap contracts whereby we synthetically fix floating interest rates on loans.
The following table presents a summary of our current outstanding indebtedness as of March 31, 2021:
8
| Type | Outstanding Principal as of March 31, 2021 | |||||||
Initial Mortgage | Floating | $ | 241,400 | |||||
Warehouse Facility | Floating | 100,000 | ||||||
JPM Facility | Floating | 320,000 | ||||||
MetLife Note | Fixed | 125,000 | ||||||
TrueLane Mortgage | Fixed | 10,526 | ||||||
Colony Note | Fixed | 9,318 | ||||||
CoreVest Note | Fixed | 2,364 | ||||||
|
| |||||||
| $ | 808,608 | |||||||
Debt premium, net | 563 | |||||||
Deferred financing costs, net of accumulated amortization of $1,794 | (9,942 | ) | ||||||
|
| |||||||
| $ | 799,229 | |||||||
|
| |||||||
Competition
We face competition from different sources in each of our two primary activities: developing/acquiring properties and renting our properties. We believe our primary competitors in acquiring our target properties through individual acquisitions are individual investors, small private investment partnerships looking for one-off acquisitions of investment properties that can either be rented or restored and sold, and larger investors, including private equity funds and other REITs, that are seeking to capitalize on the same market opportunity that we have identified as well as individuals looking to become homeowners. Our primary competitors in acquiring portfolios of properties or land assets include large and small private equity investors, public and private REITs, other sizeable private institutional investors and other homebuilders. These same competitors may also compete with us for tenants. Competition may increase the prices for properties and land that we would like to purchase, reduce the amount of rent we may charge at our properties, reduce the occupancy of our Portfolio and adversely impact our ability to achieve attractive yields. However, we believe that our acquisition platform, our extensive in-house property management infrastructure and market knowledge in markets that meet our selection criteria provide us with competitive advantages.
Private Offering
On August 28, 2018, we commenced a non-registered continuous private placement of up to 40,000,000 shares of our common stock (the “Private Offering”) pursuant to the safe harbor of Rule 506(b) of Regulation D under Section 4(a)(2) of the Securities Act of 1933, as amended (the “Securities Act”). The Private Offering will continue until the earlier of (i) the date when the maximum offering amount is sold, (ii) November 1, 2023, subject to two one-year extensions at the sole discretion of the Board or (iii) a decision by the Company to terminate the Private Offering. As of March 31, 2021, we have issued 11,533,512 shares of common stock through the Private Offering and under our DRIP resulting in gross offering proceeds of approximately $370.2 million, including 411,577 shares issued under our dividend reinvestment plan (“DRIP”). After fees, commissions and other offering expenses, we received net offering proceeds of approximately $352.4 million. We contributed a majority of the net proceeds from the Private Offering to our Operating Partnership in exchange for OP Units. Our Operating Partnership has used the net proceeds from the Private Offering primarily to acquire and renovate additional SFR properties in new and existing markets and maintain existing SFR properties in our Portfolio.
9
Human Capital
We have one accounting employee. We are externally managed by our Adviser pursuant to the Advisory Agreement. In addition, our Manager is responsible for the day-to-day management of our Portfolio pursuant to the Management Agreements and Side Letter. We will not have any employees other than accounting and tax employees while the Advisory Agreement is in effect.
Regulation
General
Our properties are subject to various rules, laws and ordinances, and certain of our properties are also subject to the rules of the various HOAs where such properties are located. We believe that we are in material compliance with such covenants, laws, ordinances and rules, and we also require that our tenants agree to comply with such covenants, laws, ordinances and rules in their leases with us.
Fair Housing Act
The Fair Housing Act (“FHA”) and its state law counterparts, and the regulations promulgated by the U.S. Department of Housing and Urban Development and various state agencies, prohibit discrimination in housing on the basis of race or color, national origin, religion, sex, familial status (including children under the age of 18 living with parents or legal custodians, pregnant women and people securing custody of children under the age of 18), handicap or, in some states, financial capability. We believe that our properties are in substantial compliance with the FHA and other regulations.
Environmental Matters
As a current or prior owner of real estate, we are subject to various federal, state and local environmental laws, regulations and ordinances, and we could be liable to third parties as a result of environmental contamination or noncompliance at our properties, even if we no longer own such properties. See Item 1A. “Risk Factors—Risks Related to Our Business—Contingent or unknown liabilities could adversely affect our financial condition.” and Item 1A. “Risk Factors—Risks Related to the Real Estate Industry—Environmental hazards outside of our control and the cost of complying with governmental laws and regulations regarding these hazards may adversely affect our operations and performance.”
REIT Qualification
We have elected to be treated as a REIT under the Code, commencing with our taxable year ended on December 31, 2018. We believe that we have been organized and operate in such a manner as to continue to qualify for taxation as a REIT.
Qualification and taxation as a REIT depend on our ability to meet on a continuing basis, through actual operating results, distribution levels, and diversity of stock and asset ownership, various
10
qualification requirements imposed upon REITs by the Code. Our ability to qualify as a REIT also requires that we satisfy certain asset tests, some of which depend upon the fair market values of assets that we own directly or indirectly. Such values may not be susceptible to a precise determination. Accordingly, no assurance can be given that the actual results of our operations for any taxable year will satisfy such requirements for qualification and taxation as a REIT.
If we fail to qualify as a REIT in any taxable year and do not qualify for certain statutory relief provisions, we will be subject to U.S. federal income tax at regular corporate rates and may be precluded from qualifying as a REIT for the subsequent four taxable years following the year during which we failed to qualify as a REIT. Even if we qualify for taxation as a REIT, we may be subject to some U.S. federal, state and local taxes on our income or property or REIT “prohibited transactions” taxes with respect to certain of our activities. Any distributions paid by us generally will not be eligible for taxation at the preferred U.S. federal income tax rates that apply to certain distributions received by individuals from taxable corporations. For additional information see Item 1A. “Risk Factors—Risks Related to Tax.”
Investment Company Act of 1940
We intend to conduct our operations so that neither we nor any of our subsidiaries are required to register as an investment company under the Investment Company Act of 1940.
Implications of Being an Emerging Growth Company and Smaller Reporting Company
We are an “emerging growth company,” as defined in the Jumpstart Our Business Startups Act (the “JOBS Act”) and we are eligible to take advantage of certain exemptions from various reporting requirements that are applicable to other public companies that are not “emerging growth companies” including, but not limited to, not being required to comply with the auditor attestation requirements of Section 404 of the Sarbanes-Oxley Act, reduced disclosure obligations regarding executive compensation in our periodic reports and proxy statements, and exemptions from the requirements of holding a non-binding advisory vote on executive compensation and stockholder approval of any golden parachute payments not previously approved.
The JOBS Act permits an emerging growth company such as us to take advantage of an extended transition period to comply with new or revised accounting standards applicable to public companies. We have elected to take advantage of this extended transition period. As a result of this election, our financial statements may not be comparable to companies that comply with public company effective dates for such new or revised standards. We may elect to comply with public company effective dates at any time, and such election would be irrevocable pursuant to Section 107(b) of the JOBS Act.
We could remain an “emerging growth company” until the earliest of (1) the end of the fiscal year following the fifth anniversary of the date of the first sale of our common stock pursuant to an effective registration statement, (2) the last day of the fiscal year in which our annual gross revenues exceed $1.07 billion, (3) the date that we become a “large accelerated filer” as defined in Rule 12b-2 under the Exchange Act, which would occur if the market value of our common stock that is held by non-affiliates exceeds $700 million as of the last business day of our most recently completed second fiscal quarter, or (4) the date on which we have issued more than $1 billion in non-convertible debt during the preceding three year period.
11
We are also a “smaller reporting company” as defined in the Exchange Act, and may elect to take advantage of certain of the scaled disclosures available to smaller reporting companies. We may be a smaller reporting company even after we are no longer an “emerging growth company.”
12
The following are some of the risks and uncertainties that could cause our actual results to differ materially from those presented in our forward-looking statements. You should consider carefully the risks described below and the other information in this Form 10, including our consolidated financial statements and the related notes included in this Form 10 when evaluating our business. The risks and uncertainties described below are not the only ones we face but do represent those risks and uncertainties that we believe are material to us. Additional risks and uncertainties not presently known to us or that we currently deem immaterial may also harm our business.
Summary Risk Factors
The following is a summary of some of the risks and uncertainties that could materially adversely affect our business, financial condition and results of operations:
| • | risks associated with the COVID-19 pandemic and future outbreak of other highly infectious or contagious diseases; |
| • | risks associated with our limited operating history and the possibility that we may not replicate the historical results achieved by other entities managed or sponsored by affiliates of our Adviser, members of our Manager’s management team or their affiliates; |
| • | our dependence on our Manager, its affiliates and personnel to conduct our day-to-day operations; |
| • | risks associated with the Manager’s ability to terminate the Management Agreements; |
| • | loss of key personnel of our Adviser and our Manager; |
| • | risks associated with the fluctuation in the NAV per share amounts; |
| • | unfavorable changes in economic conditions and their effects on the real estate industry generally and our operations and financial condition, including our ability to access funding and generate returns for stockholders; |
| • | the risk we make significant changes to our strategies in a market downturn, or fail to do so; |
| • | risks associated with ownership of real estate, including properties in transition, subjectivity of valuation, environmental matters and lack of liquidity in our assets; |
| • | risk related to increasing property taxes, HOA fees and insurance costs may negatively affect our financial results; |
| • | risks associated with acquisitions, including the risk of expanding our scale of operations and acquisitions even if there is a recovery in the rental and housing markets, which could adversely impact anticipated yields; |
| • | risks associated with leasing real estate, including the risks that rents do not increase sufficiently to keep pace with rising costs of operations and competitive pressures from other types of properties or market conditions that incentivize tenants to purchase their residences; |
13
| • | risks related to tenant relief laws, including laws regulating evictions, rent control laws, executive orders, administrative orders and other regulations that may impact our rental income and profitability; |
| • | risks related to governmental laws, regulations and rules applicable to our properties or that may be passed in the future; |
| • | risks relating to the timing and costs of the renovation of properties which has the potential to adversely affect our operating results and ability to make distributions; |
| • | risks related to our ability to change our major policies, operations and targeted investments without stockholder consent; |
| • | risks related to failure to maintain our status as a REIT; |
| • | risks related to failure of our operating partnership to be taxable as a partnership for federal income tax purposes, possibly causing us to fail to qualify for or to maintain REIT status; |
| • | risks related to compliance with REIT requirements, which may limit our ability to hedge our liabilities effectively and cause us to forgo otherwise attractive opportunities, liquidate certain of our investments or incur tax liabilities; |
| • | the risk that the IRS may consider certain sales of properties to be prohibited transactions, resulting in a 100% penalty tax on any taxable gain; |
| • | the ineligibility of dividends payable by REITs for the reduced tax rates available for some dividends; |
| • | risks associated with the stock ownership restrictions of the Code for REITs and the stock ownership limit imposed by our charter; |
| • | recent and potential legislative or regulatory tax changes or other actions affecting REITs; |
| • | failure to generate sufficient cash flows to service our outstanding indebtedness or pay distributions at expected levels; |
| • | risks associated with purchasing single-family properties through the foreclosure auction process; and |
| • | damage associated with single-family properties sold through short sales or foreclosure sales may require extensive renovation. |
You should read this summary together with the more detailed description of each risk factor contained below:
14
Risks Related to Our Common Stock and Our Organizational Structure
As a recently organized company, limited operating history and information exists.
As a recently established entity, we have limited operating history from which potential investors may evaluate likely performance. Neither the past performance of previous investments of our Adviser and its affiliates, nor the past financial performance of us or the VineBrook Companies can be relied upon as an indicator of our future performance or success due to a variety of factors, including changes in personnel, different national and local economic circumstances, different supply and demand characteristics, and varying circumstances relating to the real estate markets. Since our performance depends on future events, it is inherently uncertain.
We are employing a business model with a limited consolidated institutional track record, which may make our business difficult to evaluate.
Until recently, the SFR business consisted primarily of private and individual investors in local markets and was managed individually or by small, non-institutional owners and property managers. Our business strategy involves purchasing, renovating, maintaining and managing a large number of residential properties and leasing them to qualified residents. Entry into this market by large, well-capitalized investors is a relatively recent trend, so few peer companies exist and none have yet established long-term track records that might assist us in predicting whether our business model and investment strategy can be implemented and sustained over an extended period of time. It may be difficult to evaluate our potential future performance without the benefit of established long-term track records from companies implementing a similar business model. We may encounter unanticipated problems as we continue to refine our business model, which may adversely affect our results of operations and ability to make distributions to our stockholders and cause our NAV and stock price to decline significantly.
We are dependent upon the retention of key personnel and the ability to attract qualified personnel.
Our Adviser has the sole authority to direct our operations, subject to oversight by our Board. Our Manager has discretionary authority (subject to consent rights of us set forth in the OP LPA and the Investment Committee) through the Management Agreements, to identify, structure, allocate, acquire and dispose of investments and, in doing so, has no responsibility to consult with any investor. Accordingly, investors will have no authority to direct our investments or operations and must depend entirely on the investment skills and abilities of our Adviser, our Manager and their respective employees. The ability of our Adviser and Manager to manage our affairs currently depends on key personnel. Our Adviser and Manager will be relying extensively on the diligence, skill, judgment, reputation and business contacts of such key personnel.
In addition, our future success will depend upon our Adviser and Manager’s ability to retain the services of key personnel and recruit additional qualified personnel. Our Adviser and Manager’s respective personnel have no obligation to remain employed by either entity or their respective affiliates. The departure for any reason of any of their most senior professionals, or a significant number of other investment professionals, could have a material adverse effect on our ability to achieve our investment objectives. In
15
addition, our Adviser and Manager anticipate that it will be necessary to add professionals to both grow their teams and replace those who depart. However, the market for qualified real estate professionals and individuals with experience operating a REIT is extremely competitive, and they may not succeed in recruiting additional personnel or may fail to effectively replace current personnel who depart with qualified or effective successors.
Stockholders will have limited participation and communication in regard to our management or control.
Stockholders will have no right or power to participate directly in the management or control of our business and thus must depend solely on our Adviser and Manager’s ability to make and dispose of investments and operate our business. In addition, aside from our Portfolio, investors will not have an opportunity to evaluate the future investments, or the terms of any such investment, made by us.
There are restrictions on the transferability and withdrawal of our common stock, and therefore, our stockholders’ ability to dispose of common stock will likely be limited to repurchases by us.
Our common stock has not been registered under the Securities Act or any state securities laws and may not be transferred unless (a) an exemption from registration under applicable federal and state securities laws is available and (b) either the transfer is a “Permitted Transfer” as defined in our charter or our Board has consented to such transfer (which consent may be withheld if, in the reasonable judgment of our Board, such transfer would result in violations under applicable federal or state securities laws), except as otherwise set forth in our charter. There is no public market for our common stock and one is not guaranteed to develop. As a result, stockholders may be required to hold their common stock indefinitely. Consequently, the purchase of our common stock should be considered only as a long-term and illiquid investment and shares should only be acquired by investors who are able to commit their funds for an indefinite period of time. Each investor will be required to represent that it is an accredited investor under applicable securities laws and that it is acquiring its common stock for investment purposes and not with a view to resale or distribution and that it will only sell and transfer its common stock to an accredited investor under applicable securities laws or in a manner permitted by our charter and consistent with such laws. In addition, the investors may not sell, assign, transfer or pledge any interest in us without the prior written consent of our Board (which consent may be withheld if, in the reasonable judgment of our Board, such transfer would result in violations under applicable federal or state securities laws), except if such transfer is considered a Permitted Transfer or as otherwise set forth in our charter. See Item 11. “Description of Registrant’s Securities to be Registered—Restrictions on Ownership and Transfer.”.
Due to these transfer restrictions, the repurchase of common stock by us will likely be the only way for stockholders to dispose of their common stock. We will repurchase our common stock at a price equal to the offering price of our common stock in the Private Offering on the date of repurchase (which will generally be equal to the most recent NAV per share in effect), and not based on the price at which stockholders initially purchased their common stock.
The ability of stockholders to have common stock repurchased through the Share Repurchase Plan is limited. We may choose to repurchase fewer shares of common stock than have been requested to be repurchased, in our Board’s sole discretion, and the amount of common stock we may repurchase is subject to caps. Further, our Board may modify, suspend or terminate the Share Repurchase Plan if it deems such action to be in our best interest and the best interest of our stockholders.
16
We may choose to repurchase fewer shares of common stock than have been requested in any particular quarter to be repurchased under the Share Repurchase Plan, or none at all, in our Board’s sole discretion. We may repurchase fewer shares of common stock than have been requested to be repurchased due to lack of readily available funds because of adverse market conditions beyond our control, the need to maintain liquidity for our operations or because we determined that investing in real property or other illiquid investments is a better use of our capital than repurchasing shares of common stock. In addition, the total amount of common stock that we will repurchase will be limited, in any calendar quarter, to common stock whose aggregate value (based on the repurchase price per share on the date of the repurchase) is no more than 5% of our aggregate NAV as of the last day of the previous calendar quarter. Further, our Board may modify, suspend or terminate the Share Repurchase Plan if it deems such action to be in our best interest and the best interest of our stockholders, including but not limited to decreasing or modifying the price at which shares of common stock are repurchased through the Share Repurchase Plan or changing the frequency at which repurchases occur. If the full amount of all shares of common stock requested to be repurchased in any given quarter are not repurchased, funds will be allocated pro rata based on the total number of shares of common stock being repurchased. All unsatisfied repurchase requests must be resubmitted after the start of the next quarter, or upon the recommencement of the Share Repurchase Plan, as applicable.
The vast majority of our assets will consist of properties that cannot generally be readily liquidated without impacting our ability to realize full value upon their disposition. Therefore, we may not always have a sufficient amount of cash to immediately satisfy repurchase requests. Should repurchase requests, in our judgment, place an undue burden on our liquidity, adversely affect our operations or risk having an adverse impact on us as a whole, or should we otherwise determine that investing our liquid assets in our Operating Partnership rather than repurchasing common stock is in our best interest as a whole, then we may choose to repurchase fewer shares of common stock than have been requested to be repurchased, or none at all. Because we are not required to authorize the recommencement of the Share Repurchase Plan within any specified period of time, we may effectively terminate the plan by suspending it indefinitely. As a result, stockholders’ ability to have common stock repurchased by us may be limited, and at times, stockholders may not be able to liquidate their investment. See Item 11. “Description of Registrant’s Securities to be Registered—Distribution Reinvestment Plans.” and Item 11. “Description of Registrant’s Securities to be Registered—Share Repurchase Plan.”
The Board may amend or suspend the DRIP at any time in its discretion, including by decreasing the discount at which shares of common stock may be purchased through the DRIP.
Our Board has adopted the DRIP whereby investors who purchase shares of our common stock in the Private Offering may elect at the time of subscription or upon subsequent enrollment to have their dividends reinvested through purchase of additional shares (each electing investor, a “participant”). Any cash dividends attributable to shares of our common stock owned by a participant in the DRIP will be used to purchase additional shares of our common stock on the payment date for the dividend. The purchase price per share for shares of our common stock purchased pursuant to the DRIP will be equal to 97.0% of most recent NAV in effect on the purchase date, equivalent to a 3.0% discount. Purchases made through the DRIP have no minimum investment amount and no fees, commissions or offering and organization expenses will be paid in respect of or attributable to such purchases. The Board in its discretion may amend or suspend the DRIP at any time, including but not limited to decreasing the discount at which shares of common stock are purchased through the DRIP.
Purchases, repurchases, reinvestments of distributions and repurchases of shares of our common stock will not be made based on the current NAV per share.
Generally, the price at which we repurchase the shares of our common stock will equal the most recent NAV per share in effect based on a previous calculation period. The NAV per share as of the date on which stockholders make their repurchase request may be significantly different than the price such stockholder originally paid or the repurchase price to be received. In addition, we may offer and repurchase shares of our common stock at a price that we believe reflects the NAV per share more appropriately than the most recent NAV per share in effect, including by updating a previously disclosed NAV, in cases where we believe there has been a material change (positive or negative) to the most recent NAV per share in effect. In such cases, the repurchase price will not equal our NAV per share as of any time.
The sale price of the shares of our common stock sold in the Private Offering and the purchase price at which the shares of our common stock may be repurchased under the Share Repurchase Plan are based on NAV as calculated in accordance with the Valuation Methodology, which is subject to certain risks and uncertainties and may be changed at any time in the sole discretion of our Board.
The sale price of the shares of our common stock sold in the Private Offering is equal to the most recent NAV in effect plus applicable fees and commissions, and the purchase price at which shares of our common stock may be repurchased in accordance with the terms of the Share Repurchase Plan is generally based on the most recent NAV in effect at the time of repurchase. NAV is calculated in accordance with the valuation methodology (the “Valuation Methodology”) approved by our Board. The Valuation Methodology involves significant judgment and estimation of the fair value of our properties and is subject to certain risks and uncertainties, including that valuations of our properties may not incorporate all material information concerning their value. In addition, the Valuation Methodology may be amended at any time at the sole discretion of our Board.
For additional information, see “—Valuations of our properties are estimates of fair value and may not necessarily correspond to realizable value. In addition, the Valuation Methodology may be changed at any time at the sole discretion of our Board,” “—Our NAV per share amounts may change materially if the values of our properties materially change from prior values or the actual operating results differ from what we originally budgeted for that quarter,” and “—It may be difficult to reflect, fully and accurately, material events that may impact our NAV” below.
17
Valuations of our properties are estimates of fair value and may not necessarily correspond to realizable value. In addition, our Valuation Methodology and related policies may be changed at any time at the sole discretion of our Board.
Valuations of properties will be determined by our Adviser based in part on valuations of each of our properties by independent, third-party firms (the “Valuation Providers”) conducted on a quarterly or monthly basis, at the sole discretion of the Board. Our NAV is calculated by our Adviser in accordance with the Valuation Methodology and recommended to the pricing committee of our Board. Based on this recommendation, the pricing committee of our Board then determines NAV.
Within the parameters of our Valuation Methodology, the techniques used to value the properties will involve subjective judgments and projections and may not be accurate. The Valuation Methodology will also involve assumptions and opinions about future events, which may or may not turn out to be correct. Valuations and appraisals of our properties are only estimates of fair value. Ultimate realization of the value of an asset depends to a great extent on economic, market and other conditions beyond our control or the control of our Adviser and the Valuation Providers. Further, valuations do not necessarily represent the price at which an asset would sell, since market prices of assets can only be determined by negotiation between a willing buyer and seller. As such, the carrying value of an asset may not reflect the price at which the asset could be sold in the market, and the difference between carrying value and the ultimate sales price could be material. In addition, accurate valuations are more difficult to obtain in times of low transaction volume because there are fewer market transactions that can be considered in the context of the valuation. There will be no retroactive adjustment in the valuation of such assets, the price we paid to repurchase shares of our common stock or NAV-based fees paid to our Adviser to the extent such valuations prove to not accurately reflect the realizable value of our assets. Because the price at which such shares of common stock may be repurchased by us pursuant to the Share Repurchase Plan are generally based on the most recent NAV per share in effect which may be based on a previous calculation period, stockholders may pay more than realizable value or receive less than realizable value for their investment.
Our Valuation Methodology and related policies may be changed at any time at the sole discretion of our Board.
On May 24, 2021, our Board approved a form of an amendment and restatement of the Valuation Methodology and authorized the officers of the Company to implement the new methodology (the “Green Street Valuation Methodology”). Once implemented, the Company expects Green Street Advisors, LLC (“Green Street”) to calculate the NAV by valuing the Portfolio in accordance with the Green Street Valuation Methodology. Green Street will then recommend the NAV to the pricing committee of our Board. Based on this recommendation, the pricing committee of our Board will then determine NAV. The Green Street Valuation Methodology includes an initial valuation (“Initial Valuation”) conducted by Green Street which the Company expects to be completed by Green Street on or about July 31, 2021, the expected effective date of the Green Street Valuation Methodology, followed by monthly or quarterly ongoing valuations (“Ongoing Valuations”) as determined by the Board, which are also conducted by Green Street. Assessments are expected to vary based on whether a property is stabilized (as such term is defined in the Green Street Valuation Methodology) but to also take into consideration whether the property is occupied, was recently acquired, recently had a renovation completed, has remaining renovation costs exceeding a certain threshold, or recently transitioned to being stabilized. The Initial Valuation for stabilized properties is expected to rely on cap rates as determined by Green Street using proprietary and third-party data, third-party estimates and other relevant information as inputs for a discounted cash flow estimate of valuation, subject to certain adjustments and validation as determined by Green Street. With regard to Ongoing Valuations, stabilized properties are expected to rely on Green Street’s proprietary appreciation index (the “Index”), newly stabilized properties are expected to rely on a capitalized income methodology and then rely on the Index for future valuations, newly acquired properties are expected to be assessed for stabilization and valued accordingly in an Initial Valuation, and other properties are expected to continue to be valued according to discounted cash flow estimates, in each of the foregoing cases subject to certain adjustments and validation. The NAV calculation is expected to include the values of our other assets and of our liabilities. The NAV per share is expected to be calculated on a fully diluted basis, assuming all restricted stock unit grants and profit interest grants are fully vested and all units of the operating partnership are converted to common stock. The risks set forth in this Form 10 will also apply to the Green Street Valuation Methodology once implemented.
Our NAV per share amounts may change materially if the appraised values of our properties materially change from prior appraisals or the actual operating results for a particular period differ from what we originally budgeted for that period.
We anticipate that the monthly appraisals of our properties will be conducted on a rolling basis, such that properties may be appraised at different times but each property would be appraised at least once per quarter. When these appraisals are reflected in our NAV calculations, there may be a material change in the NAV per share amounts from those previously reported. In addition, actual operating results for a given period may differ from what we originally budgeted for that period, which may cause a material increase or decrease in the NAV per share amounts. We will not retroactively adjust the NAV per share reported for the previous period. Therefore, because a new monthly appraisal may differ materially from the prior appraisal or the actual results from operations may be better or worse than what we previously budgeted for a particular period, the adjustment to reflect the new appraisal or actual operating results may cause the NAV per share to increase or decrease, and such increase or decrease will occur on the day the adjustment is made.
It may be difficult to reflect, fully and accurately, material events that may impact our monthly NAV.
Our Adviser’s recommendation to the pricing committee of our Board of the monthly NAV per share will be based on appraisals of each of our properties provided on a monthly basis by the Valuation Providers. The Adviser will take an average of each valuation per property to determine the valuation for each specific property. However, in cases
18
where the Adviser receives data from three or more Valuation Providers that (1) reflects a change in value that is 20% higher (or more) than the last value received for the most recent NAV, the Adviser will use a value that is 15% greater than the last value used to calculate the most recent NAV, or (2) reflects a change in value that is 5% lower (or more) than the last value used to calculate the most recent NAV, the Adviser will use a value that is 95% of the previous value. The Board has determined that such adjustments are reasonable and necessary to remove valuation outliers from the data used by the Adviser to calculate NAV. As a result, the most recent NAV per share in effect may not fully reflect any or all changes in value that may have occurred since the most recent appraisal. Our Adviser will review appraisal reports and monitor the properties, and is responsible for notifying the Valuation Providers of the occurrence of any property-specific or market-driven event it believes may cause a material valuation change in the real estate valuation, but it may be difficult to reflect fully and accurately rapidly changing market conditions or material events that may impact the value of the properties or liabilities between valuations, or to obtain quickly complete information regarding any such events. For example, an unexpected termination or renewal of a material lease, a material increase or decrease in vacancies or an unanticipated structural or environmental event at a property may cause the value of a property to change materially, yet obtaining sufficient relevant information after the occurrence has come to light and/or analyzing fully the financial impact of such an event may be difficult to do and may require some time. In addition, the adjustments and validation to valuation information may slow the reflection of any such events. As a result, the most recent NAV per share in effect may not reflect a material event until such time as sufficient information is available and analyzed, and the financial impact is fully evaluated, such that our NAV may be appropriately adjusted in accordance with the Valuation Methodology.
The form, timing and/or amount of dividend distributions on our common stock in future periods may vary and be impacted by economic and other considerations.
The form, timing and/or amount of dividend distributions on our common stock, will be declared at the discretion of our Board and will depend on actual cash from operations, our financial condition, capital requirements, the annual distribution requirements under the REIT provisions of the Code and other factors as our Board may consider relevant. Our Board may modify our dividend policy from time to time.
We may change the frequency at which our NAV per share is calculated and may infrequently calculate our NAV per share. In addition, because our NAV per share is calculated periodically, our NAV per share may suddenly change on the day the newly calculated NAV per share is effective.
As of May 2021, we calculate NAV per share on an approximately monthly basis. However, our Board has approved the Green Street Methodology which, when implemented, will provide for calculations of NAV per share on an approximately monthly or quarterly basis as determined by the Board. In addition, the Board in its discretion may in the future approve a Valuation Methodology with less or more frequent calculations of NAV per share. To the extent we infrequently calculate our NAV per share, our stockholders may not be able to determine the NAV per share on an ongoing basis except when our estimated NAV per share is calculated. In addition, our Portfolio and other applicable assets and liabilities are valued periodically in accordance with the Valuation Methodology in effect. As such, when these new valuations are reflected in our NAV per share calculation, our NAV per share may suddenly and materially change on the day the newly calculated NAV per share becomes effective.
NAV calculations are not governed by governmental or independent securities, financial or accounting rules or standards.
The Valuation Methodology and components thereof are not prescribed by rules of the SEC or any other regulatory agency. Furthermore, there are no accounting rules or standards that prescribe which components should be used in calculating NAV, and our NAV is not audited by our independent registered public accounting firm. We calculate NAV solely for purposes of establishing the price at which we sell and repurchase shares of our common stock, and our stockholders should not view our NAV as a measure of our historical or future financial condition or performance. The components and methodology used in calculating our NAV may differ from those used by other companies now or in the future. In addition, calculations of our NAV, to the extent that they incorporate valuations of our assets and liabilities, are not necessarily prepared in accordance with GAAP. These valuations may differ from actual values that could be realized in the event that we were forced to sell assets. Additionally, errors may occur in calculating our NAV, which could impact the price at which we sell and repurchase shares of our common stock and fees we pay to our Adviser.
We may be unable to make distributions on our common stock at expected levels, which could result in a decrease in the value of our common stock.
If sufficient cash is not available for distribution from our operations, we may have to fund distributions on our common stock, from working capital, borrow to provide funds for such distributions, reduce the amount of such distributions, or issue stock dividends. To the extent we have to borrow to fund distributions, our future interest costs would increase, thereby reducing our earnings and cash available for distribution from what they otherwise would have been. If we make stock dividends in lieu of cash distributions, it may have a dilutive effect on the holdings of our stockholders.
All distributions on our common stock will be made at the discretion of our Board and will be based upon, among other factors, our historical and projected results of operations, financial condition, cash flows and liquidity, maintenance of our REIT qualification and other tax considerations, other expense obligations, debt covenants, contractual prohibitions or other limitations, and applicable law and such other matters as our Board may deem relevant from time to time. We may not be able to make distributions in the future, and our inability to make distributions, or to make distributions at expected levels, could result in a decrease in the value of our common stock.
We may pay distributions from sources other than our cash flow from operations, including, without limitation, the sale of assets, borrowings or offering proceeds, and we have no limits on the amounts we may pay from such sources.
We may not generate sufficient cash flow from operations to fully fund distributions to stockholders. Therefore, we may fund distributions to our stockholders from sources other than cash flow from operations, including, without limitation, the sale of assets, borrowings, return of capital or offering proceeds, including from sales from our common stock, our 6.50% Series A Cumulative Redeemable Preferred Stock (our “Series A Preferred Stock”) or OP Units. The extent to which we pay distributions from sources other than cash flow from operations will depend on various factors, including the level at which holders of shares of our common stock participate in our DRIP, how quickly we invest the proceeds from our Private Offering and any future offerings and the performance of our investments. Funding distributions from the sales of assets, borrowings, return of capital or offering proceeds will result in us having less funds available to acquire SFR properties or other real estate-related investments. As a result, the return you realize on your investment may be reduced. Doing so may also negatively impact our ability to generate cash flows. Likewise, funding distributions from the sale of additional securities will dilute your interest in us on a percentage basis and may impact the value of your investment, especially if we sell these securities at prices less than the price you paid for your capital stock. We may be required to continue to fund our regular distributions from a combination of some of these sources if our investments fail to perform, if expenses are greater than our revenues or due to numerous other factors. We have not established a limit on the amount of our distributions that may be paid from any of these sources.
To the extent we borrow funds to pay distributions, we would incur borrowing costs and these borrowings would require a future repayment. The use of these sources for distributions and the ultimate repayment of any liabilities incurred could adversely impact our ability to pay distributions in future periods, decrease our NAV, decrease the amount of cash we have available for operations and new investments and adversely impact the value of your investment.
19
Disruptions in the financial markets and deteriorating economic conditions may adversely affect our operations and may limit our ability to execute our business strategy.
The capital and credit markets are prone to volatility and disruption from time to time. Such turmoil in the capital markets can constrain equity and debt capital available for investment in the real estate market, resulting in fewer buyers seeking to acquire properties, increases in cap rates and lower property values. Furthermore, deteriorating economic conditions can negatively impact real estate fundamentals, which can increase risks of defaults on loans and foreclosures on mortgages. We cannot foresee such fluctuations and disruptions.
Should such disruptions in the financial markets occur, deteriorating economic conditions could also impact the market for our investments and the volatility of our investments. The returns available to us with respect to our targeted investments are determined, in part, by: (1) the supply and demand for such investments and (2) the existence of a market for such investments, which includes the ability to sell or finance such investments. During periods of volatility, the number of investors participating in the market may change at an accelerated pace. As liquidity or “demand” increases, our returns will increase. Conversely, a lack of liquidity will cause our returns to decrease.
Our Adviser is using and may continue to use leverage with respect to our Portfolio. Should the credit markets become uncertain, we may not be able to obtain debt financing on attractive terms. In addition, because we use leverage to acquire or refinance investments, and if as a result the value of our Portfolio declines, we could be forced to dispose of investments at inopportune times to repay debt or use operating income to repay debt.
Economic events affecting the U.S. economy, such as the general negative performance of the real estate sector or other events, including the COVID-19 pandemic, could also cause stockholders to seek to sell their shares to us pursuant to the Share Repurchase Plan at a time when such events are adversely affecting the performance of our assets. Even if we decide to satisfy all resulting repurchase requests, our cash flow could be materially adversely affected. In addition, if we determine to sell assets to satisfy repurchase requests, we may not be able to realize the return on such assets that we may have been able to achieve had such assets been sold at a more favorable time, and our results of operations and financial condition, including, without limitation, breadth of our Portfolio by property type and location, could be materially adversely affected.
Furthermore, all of the factors described above, including disruptions in the financial markets and deteriorating economic conditions related to the COVID-19 pandemic (see “—Risks Related to the Real Estate Industry—Local market conditions may adversely affect our performance” and “—The current COVID-19 pandemic, and the future outbreak of other highly infectious or contagious diseases, could materially and adversely impact or disrupt our financial condition, results of operations, cash flows and performance”), could adversely impact our ability to implement our business strategy and make distributions to investors and could decrease the value of an investment in us.
Stockholders have no assurance of investment returns.
20
No assurance can be given that we will be able to meet our objectives or that we will be able to generate returns for our stockholders, or that the returns, if any, will be commensurate with the risks of investing in the type of investments made by us. Our investments are subject to a wide range of significant risks that could cause such investments to lose value. Our investments are speculative in nature and the possibility of partial or total loss of capital will exist. Accordingly, an investment in us should only be considered by persons able to withstand a total loss of their investment. Furthermore, our investment return objectives are targets only and there can be no assurance that we will achieve these objectives.
We may be required to pay for state tax obligations.
We own single family homes in 16 states. We may be subject to state and/or local tax obligations in some of those states as a result of the income generated from the SFR properties in those states. We may be required to withhold amounts from distributions otherwise payable to stockholders to satisfy these tax obligations.
Provisions providing for indemnification and limitation of liability in our charter and bylaws may limit investors’ rights of action.
Certain provisions providing for indemnification and limitation of liability contained in our charter and bylaws limit the rights of action otherwise available to the investors and other parties against our Board and/or certain of its officers and employees. See Item 12. “Indemnification of Directors and Officers.”
Our exemption from holding plan assets may have negative consequences.
We will be structured and operated in a manner intended to avoid holding the “plan assets” of “Benefit Plan Investors” (as defined under Section 3(42) of the Employee Retirement Income Security Act of 1974, as amended (“ERISA”)) with us being required to use reasonable commercial efforts to comply with one or more exceptions provided under Section 3(42) of ERISA and the Plan Asset Regulations. We will attempt to qualify for an exception provided for entities in which Benefit Plan Investors will hold less than 25% of the total value of each class of our equity interests. To qualify for this exception, we may limit the investment in us by Benefit Plan Investors, which in certain circumstances could have the result that (1) transfers of shares would be limited or (2) the shares of some stockholders would be subject to mandatory redemption. Alternatively, we will have the right to take whatever action we deem necessary (after consulting with counsel) to avoid our assets being treated as plan assets under any other exception under the Plan Asset Regulations, such as the venture capital operating company exception or the real estate operating company exception. To qualify for those exceptions, we may be required to decline to make certain investments that we would otherwise prefer to make, or we may be required to sell certain investments before we would otherwise prefer to do so. There can be no assurance that we will avoid holding plan assets under the foregoing exceptions. If our underlying assets were to be considered plan assets of a Benefit Plan Investor, we would be an ERISA fiduciary and would be subject to certain fiduciary requirements of ERISA with which it would be difficult for us to comply.
21
Our Board may change significant corporate policies without stockholder approval.
Our investment, financing, borrowing and distribution policies and our policies with respect to all other activities, including growth, debt, capitalization, operations and property valuation, are determined by our Board. These policies may be amended or revised at any time and from time to time at the discretion of our Board without a vote of our stockholders. In addition, our Board may change our policies with respect to conflicts of interest provided that such changes are consistent with applicable legal requirements. A change in these policies could have an adverse effect on our financial condition, our results of operations, our cash flow, the price of our common stock and our ability to satisfy our debt service obligations and to pay distributions to our stockholders.
Future issuances of debt securities and equity securities may negatively affect the value of our common stock and, in the case of equity securities, may be dilutive to owners of our common stock and could reduce the overall value of an investment in our common stock.
In the future, we may issue debt or equity securities or incur other financial obligations, including stock dividends and shares that may be issued in exchange for our common stock. Upon liquidation, holders of our debt securities and other loans and preferred stock will receive a distribution of our available assets before holders of our common stock. We are not required to offer any such additional debt or equity securities to stockholders on a preemptive basis. Therefore, additional common stock issuances, directly or through convertible or exchangeable securities (including common stock and convertible preferred stock), warrants or options, will dilute the holdings of our existing common stockholders and such issuances or the perception of such issuances may reduce the value of shares of our common stock. Any convertible preferred stock would have, and our Series A Preferred Stock has and any series or class of our preferred stock would likely have, a preference on distribution payments, periodically or upon liquidation, which could eliminate or otherwise limit our ability to make distributions to holders of our common stock.
Holders of shares of our common stock do not have preemptive rights to any shares we issue in the future. Our charter authorizes the issuance of 500,000,000 shares of capital stock, consisting of 300,000,000 of Class A Common Stock, 100,000,000 shares of Class I Common Stock, and 100,000,000 shares of preferred stock, par value $0.01 per share, 16,000,000 shares of which have been classified as the Series A Preferred Stock. Our Board may increase the number of authorized shares of capital stock without stockholder approval. In the future, our Board may elect to (1) sell additional shares in future public offerings; (2) issue equity interests in private offerings, including the Private Offering; (3) issue shares of our common stock under a long-term incentive plan to our non-employee directors or to employees of our Manager, Adviser or either of their affiliates; (4) issue shares to our Manager, Adviser, or either of their successors or assigns, in payment of an outstanding fee obligation (if permitted pursuant to the Advisory Agreement, the applicable Management Agreement or as otherwise may be agreed) or as consideration in a related-party transaction; or (5) issue shares of our common stock in connection with a redemption of OP Units. To the extent we issue additional equity interests in the future, the percentage ownership interest held by holders of shares of our common stock will be diluted. Further, depending upon the terms of such transactions, most notably the offering price per share, holders of shares of our common stock may also experience a dilution in the book value of their investment in us.
Common stock eligible for future sale may have adverse effects on our share price.
There is no public market for our common stock and one is not guaranteed to develop. However, should one develop or should we determine to publicly list our common stock, we cannot predict the effect, if any, of future sales of our common stock, or the availability of shares for future sales, on the market price, if any, of our common stock. Sales of substantial amounts of common stock or the perception that such sales could occur may adversely affect the prevailing market price, if any, for our common stock.
We may issue additional shares in future public offerings or private placements to make new investments or for other purposes. We are not required to offer any such shares to stockholders on a preemptive basis. Therefore, it may not be possible for stockholders to participate in such future share issuances, which may dilute such stockholders’ interests in us.
Risks Related to our Series A Preferred Stock
Our charter permits our Board to issue stock with terms that may subordinate the rights of our common stockholders or discourage a third party from acquiring us in a manner that could otherwise result in a premium price to our stockholders.
Our Board may classify or reclassify any unissued shares of common stock or preferred stock and establish the preferences, conversion or other rights, voting powers, restrictions, limitations as to distributions, qualifications and terms or conditions of redemption of any such stock. Thus, our Board could authorize the issuance of preferred stock with terms and conditions that could have priority as to distributions and amounts payable upon liquidation over the rights of the holders of our common stock. Such preferred stock could also have the effect of delaying, deferring or preventing a change in control of us, including an extraordinary transaction (such as a merger, tender offer or sale of all or substantially all of our assets) that might provide a premium price to holders of our common stock.
On October 7, 2020, the Company issued 2,440,000 shares of our Series A Preferred Stock. On December 30, 2020 the Company issued 1,100,000 shares of Series A Preferred Stock and on January 8, 2020 the Company issued 1,460,000 shares of Series A Preferred Stock. As of March 31, 2021, we have issued 5,000,000 shares of Series A Preferred Stock. The Series A Preferred Stock rank, with respect to rights to the payment of dividends and the distribution of assets upon our liquidation, dissolution or winding up, (1) senior to our common stock; (2) on parity with all equity securities issued by us with terms specifically providing that those equity securities rank on parity with the Series A Preferred Stock with respect to rights to the payment of dividends and the distribution of assets upon our liquidation, dissolution or winding up; and (3) junior to all our existing and future indebtedness and to the indebtedness and other liabilities of our existing subsidiaries and any future subsidiaries. Additionally, unless the mandatory redemption date is extended, if we fail to effect a mandatory redemption of the Series A Preferred Stock by October 7, 2027, and such non-compliance remains uncured by us on the nine-month anniversary following such date, the number of directors shall be automatically increased to such number as is necessary so that a majority of the outstanding shares of Series A Preferred Stock shall have the right at any time after such date to elect a majority of the members of our Board. See Item 11. “Description of Registrant’s Securities to be Registered—Description of Series A Preferred Stock” for additional information regarding our Series A Preferred Stock.
22
Risks Related to Our Business and the Single-Family Rental Housing Market
A significant portion of our costs and expenses are fixed and we may not be able to adapt our cost structure to offset declines in our revenue.
Many of the expenses associated with our business, such as real estate taxes, HOA fees, personal and property taxes, insurance, utilities, acquisition, renovation and maintenance costs, and other general corporate expenses are relatively inflexible and will not necessarily decrease with a reduction in revenue from our business. Some components of our fixed assets depreciate more rapidly and require ongoing capital expenditures. Our expenses and ongoing capital expenditures are also affected by inflationary increases and certain of our cost increases may exceed the rate of inflation in any given period or market. By contrast, our rental income is affected by many factors beyond our control, such as the availability of alternative rental housing and economic conditions in our markets. In addition, state and local regulations may require us to maintain properties that we own, even if the cost of maintenance is greater than the value of the property or any potential benefit from renting the property, or pass regulations that limit our ability to increase rental rates. As a result, we may not be able to fully offset rising costs and capital spending by increasing rental rates, which could have a material adverse effect on our results of operations and cash available for distribution.
Increasing property taxes, HOA fees and insurance costs may negatively affect our financial results.
As a result of our substantial real estate holdings, the cost of property taxes and insuring our properties is a significant component of our expenses. Our properties are subject to real and personal property taxes that may increase as tax rates change and as the real properties are assessed or reassessed by taxing authorities. As the owner of our properties, we are ultimately responsible for payment of the taxes to the applicable government authorities. If real property taxes increase, our expenses will increase. If we fail to pay any such taxes, the applicable taxing authority may place a lien on the real property and the real property may be subject to a tax sale. In addition, a significant portion of our properties are located within HOAs and we are subject to HOA rules and regulations. HOAs have the power to increase monthly charges and make assessments for capital improvements and common area repairs and maintenance. Property taxes, HOA fees, and insurance premiums are subject to significant increases, which can be outside of our control. If the costs associated with property taxes, HOA fees and assessments or insurance rise significantly and we are unable to increase rental rates due to rent control laws or other regulations to offset such increases, our results of operations would be negatively affected.
Our Portfolio will be concentrated in the single-family asset class; our Portfolio will also be geographically concentrated, which could adversely affect operations if either the targeted markets or asset class suffers from a negative event.
Our investments in real estate assets and debt secured by real estate assets are and will continue to be concentrated in our markets and in the single-family properties sector of the real estate industry. A downturn or slowdown in the rental demand for single-family housing caused by adverse economic, regulatory or environmental conditions, or other events, in our markets may have a greater impact on the value of our properties or our operating results than if we had more fully diversified our investments. We believe that there are seasonal fluctuations in rental demand with demand higher in the spring and summer than in the late fall and winter. Such seasonal fluctuations may impact our operating results. In addition to
23
general, regional, national and international economic conditions, our operating performance will be impacted by the economic conditions in our markets. We base a substantial part of our business plan on our belief that property values and operating fundamentals for single-family properties in our markets will continue to improve over the near to intermediate term. We can provide no assurance as to the extent property values and operating fundamentals in these markets will improve, if at all. If the recent economic downturn in these markets returns or if we fail to accurately predict the timing of economic improvement in these markets, the value of our properties could decline and our ability to execute our business plan may be adversely affected to a greater extent than if we owned a real estate portfolio that was more geographically diversified, which could adversely affect our financial condition, operating results and ability to make distributions to our stockholders and cause the value of our capital stock to decline.
If rents in our markets do not increase sufficiently to keep pace with rising costs of operations, the cash available for distribution will be adversely impacted.
The success of our business model will substantially depend on conditions in the SFR market in our geographic markets. Our asset acquisitions are premised on assumptions about, among other things, occupancy and rent levels, and if those assumptions prove to be inaccurate, our cash flows will be lower than expected.
Eventually, the rebound of the U.S. economy and job growth, coupled with government programs designed to keep homeowners in their homes and/or other factors, may contribute to trends that favor homeownership rather than renting. A softening of the rental market in our markets would reduce our rental revenue, which could adversely impact the cash available for distribution.
Competitive pressures from rental homes, multifamily units, and current high levels of home affordability in our target markets may have a material impact on our performance.
All of our houses are located in developed areas that include other single-family houses. The number of competitive houses in a particular area could have a material effect on our ability to lease our houses and on the rents charged. The pool of potential renters is reduced by those who choose to purchase, rather than rent, houses. In addition, multi-family properties, particularly apartment buildings, provide housing alternatives to potential renters of single-family houses. The continuing development of apartment buildings in many markets increases the supply of housing and may exacerbate the competition for renters.
We intend to continue expanding our scale of operations and make acquisitions even if there is a recovery in the rental and housing markets, which could adversely impact anticipated yields.
Our long-term growth depends on the availability of acquisition opportunities in our target markets at attractive pricing levels. We believe various factors and market conditions have made homes available for purchase at prices that are below replacement costs. We expect that, in the future, housing prices will stabilize and return to more normalized levels, and therefore future acquisitions may be more expensive. There are many factors that may cause a recovery in the housing market in our target markets that would result in future acquisitions becoming more expensive and possibly less attractive than recent past and present opportunities, including:
| • | improvements in the overall economy and job market in our target markets; |
| • | increased of consumer lending activity and greater availability of consumer credit; |
24
| • | improvements in the pricing and terms of mortgage-backed securities; |
| • | the emergence of increased competition for single-family assets from private investors and entities with similar investment objectives as us; and |
| • | tax or other government incentives that encourage homeownership. |
We have not adopted and do not expect to adopt a policy of making future acquisitions only if they are accretive to existing yields and distributable cash. We plan to continue acquiring properties as long as we believe such properties offer an attractive total return opportunity. Accordingly, future acquisitions may have lower yield characteristics than recent past and present opportunities and if such future acquisitions are funded through equity issuances, the yield and distributable cash will be reduced, and the value of our common stock may decline.
Acquiring properties during periods when the single-family home sector is experiencing substantial inflows of capital and intense competition may result in inflated purchase prices and increase the likelihood that our properties will not appreciate in value and may, instead, decrease in value.
The allocation of substantial amounts of capital for investment in the single-family home sector and significant competition for income producing real estate may inflate the purchase prices for such assets. To the extent we purchased, or in the future purchase, real estate in such an environment, it is possible that the value of such properties may not appreciate and may, instead, decrease in value, perhaps significantly, below the amount paid for such properties. In addition to macroeconomic and local economic factors, technical factors, such as a decrease in the amount of capital allocated to the single-family home sector and the number of investors participating in the sector, could cause the value of our properties to decline.
Purchasing single-family properties through the foreclosure auction process subjects us to significant risks that could adversely affect our operating results, cash flows and ability to make distributions.
Our business plan involves acquiring single-family properties through the foreclosure auction process simultaneously in a number of markets, which involves monthly foreclosure auctions on the same day of the month in certain markets. In these instances, we are only able to visually inspect properties from the street and must purchase these properties without a contingency period and in “as is” condition with the risk that unknown defects in the property may exist. We also may encounter unexpected legal challenges and expenses in the foreclosure process. Upon acquiring a new property, we may have to evict residents who are in unlawful possession before we can secure possession and control of the property. The holdover occupants may be the former owners or tenants of a property, or they may be squatters or others who are illegally in possession. Securing control and possession from these occupants can be both costly and time-consuming.
Further, when acquiring properties on an “as is” basis, title commitments are often not available prior to purchase, and title reports or title information may not reflect all senior liens, which may increase
25
the possibility of acquiring houses outside predetermined acquisition and price parameters, purchasing residences with title defects and deed restrictions, HOA restrictions on leasing or underwriting or purchasing the wrong residence. The policies, procedures and practices we implement to assess the state of title and leasing restrictions prior to purchase may not be effective, which could lead to a material if not complete loss on our investment in such properties. For properties we acquire through the foreclosure auction process, we do not obtain title commitments prior to purchase, and we are not able to perform the type of title review that is customary in acquisitions of real property. As a result, our knowledge of potential title issues will be limited, and no title insurance protection will be in place. This lack of title knowledge and insurance protection may result in third parties having claims against our title to such properties that may materially and adversely affect the values of the properties or call into question the validity of our title to such properties. Without title insurance, we are fully exposed to, and would have to defend ourselves against, such claims. Further, if any such claims are superior to our title to the property acquired, we risk loss of the property purchased. Any of these risks could adversely affect our operating results, cash flows and ability to make distributions to investors.
The failure to manage acquisitions or to integrate them with our existing business could negatively affect our financial condition and results of operations.
We have completed a number of strategic acquisitions in the past and intend to continue actively acquiring single family properties for rental operations as market conditions, including access to the debt and equity markets, dictate. Our ability to successfully grow through these types of strategic transactions depends upon our ability to identify, negotiate, complete and integrate suitable acquisitions and to obtain any necessary financing, and is subject to numerous risks, including problems integrating the acquired properties, unanticipated costs associated with the acquisitions and increased legal and accounting compliance costs.
We may engage in expedited transactions that increase the risk of loss.
Our underwriting guidelines require a thorough analysis of many factors, including, among others, the underlying property’s financial performance and condition, geographic market assessment and future prospects of the property within the market. Investment analyses and decisions by us may frequently be required to be undertaken on an expedited basis to take advantage of investment opportunities. In such cases, the information available to us at the time of making an investment decision may be limited, and we may not have access to detailed information regarding the investment property, such as physical characteristics, environmental matters, zoning regulations or other local conditions affecting an investment property. If we make the decision to purchase a property prior to the full completion of one or more of these analyses, we may fail to identify certain risks that we would otherwise have identified and we may suffer significant losses as a result. Therefore, no assurance can be given that we will have knowledge of all circumstances that may adversely affect an investment.
Properties acquired as part of portfolios or in bulk may subject us to a variety of risks.
Most of our properties have been, and we expect that a substantial portion of any future property acquisitions will be, purchased as portfolios in bulk from owners of portfolios of single-family homes. To the extent the management and leasing of such properties have not been consistent with our property management and leasing standards, we may be subject to a variety of risks, including risks relating to the
26
condition of the properties, the credit quality and employment stability of the tenants and compliance with applicable laws, among others. In addition, financial and other information provided to us regarding such portfolios during due diligence may not be accurate, and we may not discover such inaccuracies until it is too late to seek remedies against such sellers. To the extent we timely pursue such remedies, we may not be able to successfully prevail against the seller in an action seeking damages for such inaccuracies.
We may not be able to effectively control the timing and costs relating to the renovation of properties, which may adversely affect our operating results and our ability to make distributions.
Nearly all of our properties require some level of renovation immediately upon their acquisition or in the future following expiration of a lease or otherwise. We may acquire properties that we plan to renovate extensively. We also may acquire properties that we expect to be in good condition only to discover unforeseen defects and problems that require extensive renovation and capital expenditures. To the extent properties are leased to existing tenants, renovations may be postponed until the tenant vacates the premises, and we will pay the costs of renovating. In addition, from time to time, in order to reposition properties in the rental market, we will be required to make ongoing capital improvements and replacements and perform significant renovations and repairs that tenant deposits and insurance may not cover.
Our properties have infrastructure and appliances of varying ages and conditions. Consequently, we routinely retain independent contractors and trade professionals to perform physical repair work and are exposed to all of the risks inherent in property renovation and maintenance, including potential cost overruns, increases in labor and materials costs, delays by contractors in completing work, delays in the timing of receiving necessary work permits, certificates of occupancy and poor workmanship. If our assumptions regarding the costs or timing of renovation and maintenance across properties prove to be materially inaccurate, our operating results and ability to make distributions to investors may be adversely affected.
Single-family properties that are being sold through short sales or foreclosure sales are subject to risks of theft, mold, infestation, vandalism, illegal activity on the premises, deterioration or other damage that could require extensive renovation prior to renting and adversely impact our operating results.
When a single-family property is put into foreclosure due to a default by the homeowner on its mortgage obligations or the value of the property is substantially below the outstanding principal balance on the mortgage and the homeowner decides to seek a short sale, the homeowner may abandon the property or cease to maintain the property as rigorously as the homeowner normally would. Neglected and vacant properties are subject to increased risks of theft, mold, infestation, vandalism, illegal activity on the premises, general deterioration and other maintenance problems that may persist without appropriate attention and remediation. If we begin to purchase a large volume of properties in bulk portfolio acquisitions and are not able to inspect them immediately before closing on the purchase, we may purchase properties that may be subject to these problems, which may result in maintenance and renovation costs and time frames that far exceed our estimates. These circumstances could substantially impair our ability to quickly renovate and lease such properties in a cost-efficient manner or at all, which would adversely impact our operating results.
27
As a result of current housing market conditions, potential renters may choose to purchase their residences, which could adversely impact the number and quality of our tenants.
Government sponsored programs, low interest rates, the large supply of foreclosed homes on the market, and depressed home values all pose threats to the SFR market. As a result of these low home prices and increased home affordability, potential renters may be encouraged to purchase homes rather than lease them. This may have a negative impact on the number and quality of our tenants.
Our real estate investments are illiquid, which limits our operational flexibility and may negatively affect our performance.
Real estate investments generally cannot be sold quickly. This inability to sell properties could adversely affect our ability to maximize sales proceeds.
Our business objectives could be impeded by not being able to obtain additional capital.
Our ability to acquire, develop, or redevelop properties depends upon our ability to obtain capital. The real estate industry has historically experienced periods of volatile debt and equity capital markets and/or periods of extreme illiquidity. A prolonged period in which we cannot effectively access the debt or equity markets may result in heavier reliance on alternative financing sources to undertake new investments. An inability to obtain debt or equity capital on acceptable terms could delay or prevent us from acquiring, financing, and completing desirable investments and could otherwise adversely affect our business. Also, the issuance of additional shares of capital stock or interests in subsidiaries to fund future operations could dilute the ownership of our then-existing stockholders. Even as liquidity returns to the market, debt and equity capital may be more expensive than in prior years.
In addition, we may not be able to sell our properties quickly to raise capital. Investments in real estate are relatively illiquid compared to other investments. Accordingly, we may not be able to sell our properties when we desire or at prices acceptable to us in response to changes in economic or other conditions. In addition, the Code may limit our ability to sell properties held for less than two years. These limitations on our ability to sell our properties may adversely affect our cash flows, our ability to repay debt, and our ability to make distributions to our stockholders.
A number of our properties are part of HOAs, and we and our tenants are subject to the rules and regulations of such HOAs, which may be arbitrary or restrictive. Violations of such rules may subject us to additional fees, penalties and litigation with such HOAs which would be costly.
As of March 31, 2021, approximately 7.4% of our properties are located within HOAs, which are private entities that regulate the activities of owners and occupants of, and levy assessments on, properties in a residential subdivision. We pay all HOA fees and assessments directly. The majority of the HOA fees due on our properties are billed annually. The fees are paid when due by our Manager and are included in our property and operating expenses. HOAs in which we own properties may have or may enact onerous or arbitrary rules that restrict our ability to restore, market or lease our properties or require us to restore or maintain such properties at standards or costs that are in excess of our planned budgets. Such rules may include requirements for landscaping, limitations on signage promoting a property for lease or sale or the requirement that specific construction materials be used in restorations. Some HOAs also impose limits on the number of property owners who may rent their homes, which, if met or exceeded, would cause us to incur additional costs to sell the property and opportunity costs of lost rental revenue. Furthermore, many HOAs impose restrictions on the conduct of occupants of homes and the use of common areas, and we may
28
have tenants who violate HOA rules and for which we may be liable as the property owner. Additionally, the boards of directors of the HOAs in which we own property may not make important disclosures about the properties or may block our access to HOA records, initiate litigation, restrict our ability to sell our properties, impose assessments or arbitrarily change the HOA rules. We may be unaware of or unable to review or comply with HOA rules before purchasing a property, and any such excessively restrictive or arbitrary regulations may cause us to sell such property at a loss, prevent us from renting such property or otherwise reduce our cash flow from such property, which would have an adverse effect on our returns on these properties.
The inability to effectively integrate operating platforms and personnel may result in inefficiencies that could adversely affect our cash available for distribution.
To grow successfully, we must be able to apply our experience in managing real estate to a larger number of properties in our current markets and as we expand into new markets. In addition, we must be able to integrate new management and operations personnel as our organization grows in size and complexity. Failures in either area will result in inefficiencies that could adversely affect our cash available for distribution to investors.
We rely on information supplied by prospective residents in managing our business.
We make leasing decisions based on our review of rental applications completed by the prospective resident. While we may seek to confirm or build on information provided in such rental applications through our own due diligence, including by conducting background checks, we rely on the information supplied to us by prospective residents to make leasing decisions, and we cannot be certain that this information is accurate. These applications are submitted to us at the time we evaluate a prospective resident and we do not require residents to provide us with updated information during the terms of their leases, notwithstanding the fact that this information can, and frequently does, change over time. For example, increases in unemployment levels or adverse economic conditions in certain of our markets may adversely affect the creditworthiness of our residents in such markets. Even though this information is not updated, we will use it to evaluate the characteristics of our Portfolio over time. If resident-supplied information is inaccurate or our residents’ creditworthiness declines over time, we may make poor or imperfect leasing decisions and our Portfolio may contain more risk than we believe.
Our leases are relatively short-term, exposing us to the risk that we may have to re-lease our properties frequently, which we may be unable to do on attractive terms, on a timely basis or at all.
Substantially all of our new leases have a duration of one year. As such leases permit the residents to leave at the end of the lease term, we anticipate our rental revenues may be affected by declines in market rental rates more quickly than if our leases were for longer terms. Short-term leases may result in high turnover, which involves costs such as restoring the properties, marketing costs and lower occupancy levels. Our resident turnover rate and related cost estimates may be less accurate than if we had more operating data upon which to base such estimates. If the rental rates for our properties decrease or our residents do not renew their leases, our operating results and ability to make distributions to our stockholders could be adversely affected. In addition, most of our potential residents are represented by leasing agents and we may need to pay all or a portion of any related agent commissions, which will reduce the revenue from a particular rental home. Alternatively, to the extent that a lease term exceeds one year, we may miss out on the ability to raise rents in an appreciating market and be locked into a lower rent until such lease expires.
29
Many factors impact the SFR market, and if rents in our markets do not increase sufficiently to keep pace with rising costs of operations, our income and distributable cash could decline.
The success of our business model depends, in part, on conditions in the SFR market in our markets. Our investment strategy is premised on assumptions about occupancy levels, rental rates, interest rates and other factors, and if those assumptions prove to be inaccurate, our cash flows and profitability will be reduced. Government programs designed to keep homeowners in their homes and/or other factors may contribute to an increase in homeownership rather than renting. In addition, we expect that as investors like us increasingly seek to capitalize on opportunities to purchase housing assets at below replacement costs and convert them to productive uses, the supply of SFR properties will decrease, which may increase competition for residents, limit our strategic opportunities and increase the cost to acquire those properties. A softening of the rental market in our core areas would reduce our rental revenue and profitability.
We are highly dependent on information systems and systems failures could significantly disrupt our business.
Our operations are dependent upon our information systems that support our business processes, including marketing, leasing, vendor communications, finance, intracompany communications, resident portal and property management platforms, which include certain automated processes that require access to telecommunications or the Internet, each of which is subject to system security risks. Certain critical components of our platform are dependent upon third party service providers, and a significant portion of our business operations are conducted over the Internet. As a result, we could be severely impacted by a catastrophic occurrence, such as a natural disaster or a terrorist attack, or a circumstance that disrupted access to telecommunications, the Internet or operations at our third-party service providers, including viruses or experienced computer programmers that could penetrate network security defenses and cause system failures and disruptions of operations. Even though we believe we utilize appropriate duplication and back-up procedures, a significant outage in telecommunications, the Internet or at our third-party service providers could negatively impact our operations.
The SFR portfolios tend to be larger than portfolios in other property sectors and is a relatively new sector lacking publicly traded institutional owners, which could limit the quality and availability of data and financial information available on large SFR portfolios we acquire.
Unlike other property sectors, SFR portfolios tend to be extremely large. For example, as of March 31, 2021, we own over 13,500 individual assets across 16 states, whereas a large portfolio in a publicly traded multifamily REIT has on average 178 properties. Because each unit in an SFR portfolio is generally also an individual property, and financial records must be maintained on each individual property, the volume of data and information to be kept is larger in the SFR sector as compared to other sectors.
Also, there are a limited number of publicly traded companies that currently have exposure to SFR properties. Because the vast majority of the SFR portfolios with over 1,000 homes (or “institutional” portfolios) are held by private companies, many of the portfolios we seek to acquire do not have audited financial statements at the portfolio or company level, which creates a varied range in the quality of financial
30
documentation and financial information available. Further, many SFR operators outsource property management to third party managers who produce and maintain the property level accounting. When we purchase a large portfolio of SRF assets or an entity that owns a large portfolio of SFR assets, we are largely dependent on the information provided by the property manager, which in many cases is an unrelated third party that is not contractually bound by the sales agreements. Since the SFR sector is relatively new, the third-party property managers may lack the quality, sophistication and institutionalization of third-party managers in other sectors. The inability to access quality data and financial information associated with large SFR portfolios that we acquire could significantly disrupt our business.
Risks Related to the Real Estate Industry
Our business has inherent general real estate risks.
Our Portfolio will be subject to the risks incident to the ownership and operation of real estate, including risks associated with the general economic climate, local real estate conditions (including the availability of excess supply of properties relative to demand), changes in the availability of debt financing, credit risk arising from the financial condition of tenants, buyers, and sellers of properties, geographic or market concentration, competition from other space, our ability to manage our Portfolio, government regulations (such as changes in regulations governing land usage, improvements, zoning, and environmental issues), liability arising out of the presence of certain construction materials, uninsurable losses, and fluctuations in interest rates. We will incur the burdens of ownership of real property, which include paying expenses and taxes, maintaining the investments, and ultimately disposing of our Portfolio. The possibility of partial or total loss of capital will exist, and prospective investors should not purchase our common stock unless they can readily bear the consequences of such loss.
Real estate historically has experienced fluctuations and cycles in value, and local market conditions may result in reductions in the value of real property. The marketability and value of real property will depend on many factors beyond our control, including changes in general or local economic conditions in various markets, changes in supply of, or demand for, competing properties in an area, changes in interest rates, the promulgation and enforcement of governmental regulations relating to land-use and zoning restrictions, issues relating to environmental protection and occupational safety, condemnation or other taking of property by the government, unavailability of mortgage funds, which may render the sale of an investment difficult, the financial condition of tenants, buyers, and sellers of investments, changes in real estate tax rates and operating expenses, the imposition of rent controls, energy and supply shortages, the availability and cost of property insurance, including insurance covering earthquake and acts of terrorism, and various uninsured or uninsurable risks and acts of God, natural disasters and other uninsurable losses. In addition, general economic conditions, as well as conditions of domestic and international financial markets, may adversely affect our operations. Furthermore, should the value of our investments decline, we may need to consider disposing of investments at inopportune times or using operating income to repay indebtedness in order to maintain compliance with debt covenants. There can be no assurance that there will be a ready market for the resale of investments, because investments generally will not be liquid. Illiquidity may result from the absence of an established market for the investments, as well as legal or contractual restrictions on their resale by us. Additionally, partial or complete sales, transfers, or other dispositions of investments which may result in a return of capital or the realization of gains, if any, are generally not expected to occur for a number of years after an investment is made. Accordingly, an investment in us requires a long-term commitment, with no certainty of return.
31
Local market conditions may adversely affect our performance.
We intend to focus our investment activity in target markets based on our belief in our investment strategy, which relies, in part, upon providing need-based housing to individuals with working-class jobs. Our strategy further relies, in part, upon market recoveries in our target markets. However, no assurance can be given that the real estate assets can be acquired at favorable prices or that the market for such assets will recover or continue to improve, as the case may be, since this will depend, in part, upon events and factors outside of our control, including, without limitation, local market and economic conditions in our target markets and the surrounding regions which may significantly affect rents and vacancy rates in our target markets. For example, a downturn in the local economy could lead to a decrease in rents and an increase in vacancy rates, which would significantly adversely affect our profitability and ability to satisfy our financial obligations. Accordingly, our performance and our ability to make distributions to investors could be materially and adversely affected by market and economic conditions in these geographic areas. The risks that may further affect conditions in these geographic areas include the following:
| • | The local economic climate (which may be adversely affected by industry slowdowns, decreases in government spending, and other factors); |
| • | A downturn in the economy; |
| • | The local real estate conditions (such as an oversupply of properties); |
| • | A decline in business growth that adversely affects occupancy or rental rates; |
| • | The inability or unwillingness of tenants to pay rent increases; |
| • | An adverse change in local governmental procedures; and |
| • | The local rental market may limit the extent to which rents may be increased to meet increased expenses without decreasing occupancy rates. |
Any of these risks could adversely affect our ability to achieve our desired yields on our investments and to make expected distributions to investors.
The COVID-19 pandemic has led to an economic slowdown in the U.S. and other countries. During periods of economic slowdown or recession, rising interest rates or declining demand for real estate could result in a general decline in rents or an increased incidence of defaults under existing leases. Such adverse impacts from COVID-19 to the economy generally or to our real estate in particular could negatively impact, among other things, our rental income, the value of our real estate, and our ability to raise capital. If we cannot operate our Portfolio to meet our financial expectations or if we cannot raise adequate capital, because of these or other risks, we may be prevented from being profitable or growing the values of our real estate properties, and our business, financial condition, results of operations or cash flow may be significantly negatively impacted.
32
We may experience heightened risks of vacancies.
A property may incur vacancy either by the continued default of the tenant under the lease, the expiration of a lease or the termination by the tenant of a lease. If vacancies continue for a long period of time, we may suffer reduced revenues resulting in less cash available to distribute to investors. Some of the leases for the properties in our Portfolio are scheduled to expire at the same time and as a result the cash flow from our Portfolio may be significantly diminished for a period of time. In addition, because properties’ market values depend principally upon the value of the properties’ leases, the resale value of properties with high or prolonged vacancies or with tenants suffering economically (for example, because of the current U.S. and global economic slowdown as a result of the COVID-19 pandemic) could suffer, which could further reduce or eliminate any return on an investor’s investment.
The current COVID-19 pandemic, and the future outbreak of other highly infectious or contagious diseases, could materially and adversely impact or disrupt our financial condition, results of operations, cash flows and performance.
The COVID-19 pandemic has had, and other pandemics in the future could have, repercussions across regional and global economies and financial markets. The outbreak of COVID-19 in many countries has significantly adversely impacted global economic activity and has contributed to significant volatility and negative pressure in financial markets. The global impact of the outbreak has evolved rapidly and, as cases of COVID-19 were identified in additional countries, many countries, including the U.S., reacted by instituting quarantines, mandating business and school closures and restricting travel.
The COVID-19 pandemic has negatively impacted, and will likely continue to negatively impact, almost every industry directly or indirectly, which may adversely impact the ability of our tenants, many of whom may be restricted in their ability to work or to pay their rent as and when due. In addition, our property manager may be limited in its ability to properly maintain our properties.
The COVID-19 pandemic, and other future pandemics, could also materially and adversely impact or disrupt our financial condition, results of operations, cash flows and performance due to, among other factors:
| • | reduced economic activity may cause certain of our tenants to be unable to meet their rent obligations to us in full, or at all, or to otherwise seek modifications of such obligations; |
| • | difficulty accessing debt and equity capital on attractive terms, or at all, impacts to our credit ratings, and a severe disruption and instability in the global financial markets or deteriorations in credit and financing conditions may affect our access to capital necessary to fund business operations or address maturing liabilities on a timely basis, or at all; |
| • | weaker economic conditions due to the COVID-19 pandemic could require us to recognize future impairment losses; |
33
| • | the financial impact of the COVID-19 pandemic could negatively impact our future compliance with financial covenants in our debt obligations and result in a default and potentially an acceleration of indebtedness; |
| • | a general decline in business activity and demand for real estate transactions could adversely affect our ability to sell or purchase properties; |
| • | a change in housing trends, including tenants seeking properties with yards or larger outdoor spaces; |
| • | the potential negative impact on the health of the employees of our Adviser and our Manager, particularly if a significant number of them are impacted, could result in a deterioration in our ability to ensure business continuity during this disruption; and |
| • | the timing of the development and distribution of an effective vaccine or treatments for COVID-19. |
The extent to which COVID-19 continues to impact our business will depend on future developments, which are highly uncertain and cannot be predicted, including additional actions taken to contain COVID-19 or treat its impact, among others. The rapid development and fluidity of this situation precludes any prediction as to the full adverse impact of the COVID-19 pandemic. The COVID-19 pandemic could materially and adversely impact or disrupt our financial condition, results of operations, cash flows and performance. Moreover, many risk factors set forth in this Form 10 should be interpreted as heightened risks as a result of the impact of the COVID-19 pandemic.
Inability to renew leases as leases expire may impact our financial performance.
When renters decide to leave our houses, whether they decide not to renew their leases or they leave before their lease expiration date, we may not be able to relet their houses. In addition, we may suffer unexpected losses from renters who leave prior to the expiration of the lease term without notice or payment of penalty to us as our ability to collect rent due under the lease will be limited in these circumstances. Even if the renters do renew or we can relet the houses, the terms of renewal or reletting may be less favorable than current lease terms. If we are unable to promptly renew the leases or relet the houses, or if the rental rates upon renewal or reletting are significantly lower than expected rates, our results of operations and financial condition will be adversely affected. Furthermore, there are seasonal fluctuations in rental activity with activity higher in the spring and summer than in the fall and winter. If renters do not experience increases in their income, we may be unable to increase rent and/or delinquencies may increase. Occupancy levels and market rents may be adversely affected by national and local economic and market conditions, including new construction of single-family houses and apartment buildings and excess inventory of single and multi-family housing, rental housing subsidized by the government, government programs that favor owner occupied housing over rental housing, slow or negative employment growth and household formation, the availability of low interest mortgages for single-family home buyers, changes in social preferences and the potential for geopolitical instability, all of which are beyond our control. In addition, various state and local municipalities are considering and may continue to consider rent control legislation
34
which could limit our ability to raise rents. Finally, the large quantity of foreclosed houses, along with the low residential mortgage interest rates currently available and government sponsored programs to promote home ownership, have resulted in a record high level on the National Association of Realtor’s Housing Affordability Index, an index used to measure whether or not a typical family could qualify for a mortgage loan on a typical house. The foregoing factors may encourage potential renters to purchase residences rather than lease them, thereby causing a decline in the number and quality of potential tenants available to us and our ability to renew leases and/or raise rents. Consequently, our cash flow and ability to make distributions to investors could be reduced. In addition, we may be unable to quickly dispossess tenants in default under the applicable laws in certain jurisdictions resulting in delays in re-leasing properties.
We may experience deferred maintenance costs.
Before renting a home, we will typically perform a detailed assessment with an on-site review of each property to identify the scope of work to be completed. Beyond customary repairs, our Manager will usually focus on improvements that optimize overall property appeal and complete such improvements when appropriate and cost-effective as a means of maximizing the value of the property. To the extent properties are leased to existing tenants, renovations may be postponed until the tenant vacates the premises and we will pay the cost of renovating.
We may not be able to obtain adequate insurance on all of our investments, resulting in the potential risk of excessively expensive premiums for insurance and/or uninsured losses.
We will attempt to obtain adequate insurance on all of our investments to cover casualty losses. However, there are types of losses, generally catastrophic in nature, such as losses due to wars, acts of terrorism, earthquakes, floods, hurricanes, tornadoes, pollution or environmental matters that are uninsurable or not economically insurable, or may be insured subject to limitations, such as large deductibles or co-payments. Insurance risks associated with potential terrorist acts could sharply increase the premiums we pay for coverage against property and casualty claims. Additionally, mortgage lenders in some cases have begun to insist that property owners purchase coverage against terrorism as a condition of providing mortgage loans. Such insurance policies may not be available at a reasonable cost, if at all, which could inhibit our ability to finance or refinance our investments. In such instances we could be required to provide other financial support, either through financial assurances or self-insurance, to cover potential losses. We may not have adequate coverage for such losses. If any of our investments incur a casualty loss that is not fully insured, the value of our investments will be reduced by such uninsured loss. In addition, other than any working capital reserve or other reserves we may have, we have no source of funding to repair or reconstruct any uninsured damaged property. Also, to the extent we must pay unexpectedly large amounts for insurance, we could suffer reduced earnings that would result in lower distributions to investors.
Due diligence may not reveal all conditions.
We perform due diligence on each investment prior to its acquisition. Regardless of the thoroughness of the due diligence process, not all circumstances affecting the value of an investment can be ascertained through the due diligence process. If the materials provided to us are inaccurate, if we do not sufficiently investigate or follow up on matters brought to our attention as part of the due diligence process, or if the due diligence process fails to detect material facts that impact the value determination, we may acquire an investment that results in significant losses to us or may overpay for an investment, which would cause our performance to suffer.
35
Each of our real estate investments is subject to the effect of property taxes and assessments.
Each of our investments will be subject to real and personal property taxes and assessments. The real and personal property taxes on each investment may increase or decrease as property tax rates change and as such investments are assessed or reassessed by taxing authorities. If property taxes on the investments increase, our cash available for distribution to investors may be materially and adversely affected.
Compliance with governmental laws, regulations and covenants that are applicable to our properties or that may be passed in the future, including permit, license and zoning requirements, may adversely affect our ability to make future acquisitions or renovations, result in significant costs or delays, and adversely affect our growth strategy.
Rental homes are subject to various covenants and local laws, executive orders, administrative orders and regulatory requirements, including permitting, licensing and zoning requirements. Local regulations, including municipal or local ordinances, restrictions and restrictive covenants imposed by community developers may restrict our use of our properties and may require us to obtain approval from local officials or community standards organizations at any time with respect to our properties, including prior to acquiring any of our properties or when undertaking renovations of any of our existing properties. Among other things, these restrictions may relate to fire and safety, seismic, asbestos cleanup or hazardous material abatement requirements. Additionally, such local regulations may cause us to incur additional costs to renovate or maintain our properties in accordance with the particular rules and regulations. We cannot assure you that existing regulatory policies will not adversely affect us or the timing or cost of any future acquisitions or renovations, or that additional regulations will not be adopted that would increase such delays or result in additional costs. Our business and growth strategies may be materially and adversely affected by our ability to obtain permits, licenses and approvals. Our failure to obtain such permits, licenses and approvals could have a material adverse effect on us and cause the value of our capital stock to decline.
Tenant relief laws, including laws regulating evictions, rent control laws and other regulations that limit our ability to increase rental rates may negatively impact our rental income and profitability.
As the landlord of numerous properties, we are involved from time to time in evicting residents who are not paying their rent or who are otherwise in material violation of the terms of their lease. Eviction activities impose legal and managerial expenses that raise our costs and expose us to potential negative publicity. The eviction process is typically subject to legal barriers, mandatory “cure” policies, our internal policies and procedures and other sources of expense and delay, each of which may delay our ability to gain possession and stabilize the property. Additionally, state and local landlord-tenant laws may impose legal duties to assist residents in relocating to new housing or restrict the landlord’s ability to remove the resident on a timely basis or to recover certain costs or charge residents for damage residents cause to the landlord’s premises. Because such laws vary by state and locality, we must be familiar with and take all appropriate steps to comply with all applicable landlord-tenant laws and need to incur supervisory and legal expenses to ensure such compliance. To the extent that we do not comply with state or local laws, we may be subjected to civil litigation filed by individuals, in class actions or actions by state or local law
36
enforcement and our reputation and financial results may suffer. We may be required to pay our adversaries’ litigation fees and expenses if judgment is entered against us in such litigation or if we settle such litigation. Furthermore, state and local governmental agencies may introduce rent control laws or other regulations that limit our ability to increase rental rates, which may affect our rental income. Especially in times of recession and economic slowdown, rent control initiatives can acquire significant political support. If rent controls unexpectedly became applicable to certain of our properties, our revenue from and the value of such properties could be adversely affected.
We may become a target of legal demands, litigation (including class actions) and negative publicity by tenant and consumer rights organizations, which could directly limit and constrain our operations and may result in significant litigation expenses and reputational harm.
Numerous tenant rights and consumer rights organizations exist throughout the country and operate in our markets, and we may attract attention from some of these organizations and become a target of legal demands, litigation and negative publicity. Many such consumer organizations have become more active and better funded in connection with mortgage foreclosure-related issues, and with the increased market for homes arising from displaced homeownership, some of these organizations may shift their litigation, lobbying, fundraising and grass roots organizing activities to focus on landlord-resident issues. While we intend to conduct our business lawfully and in compliance with applicable landlord-tenant and consumer laws, such organizations might work in conjunction with trial and pro bono lawyers in one or multiple states to attempt to bring claims against us on a class action basis for damages or injunctive relief and to seek to publicize our activities in a negative light. We cannot anticipate what form such legal actions might take, or what remedies they may seek. Additionally, such organizations may lobby local county and municipal attorneys or state attorneys’ general to pursue enforcement or litigation against us, may lobby state and local legislatures to pass new laws and regulations to constrain or limit our business operations, adversely impact our business or may generate negative publicity for our business and harm our reputation. If they are successful in any such endeavors, they could directly limit and constrain our operations and may impose on us significant litigation expenses, including settlements to avoid continued litigation or judgments for damages or injunctions.
Environmental hazards outside of our control and the cost of complying with governmental laws and regulations regarding these hazards may adversely affect our operations and performance.
Real property and the operations conducted on real property are subject to federal, state and local laws and regulations relating to, among other things, environmental protection and human health and safety and access by persons with disabilities. We could be subject to liability in the form of fines or damages for noncompliance with these laws and regulations (or our borrowers could suffer such liability), even if we did not cause the event(s) resulting in liability.
Environmental Laws Generally. Environmental laws and regulations generally govern wastewater discharges, air emissions, the operation and removal of underground and above-ground storage tanks, the use, storage, treatment, transportation and disposal of solid hazardous materials, the remediation of contaminated property associated with the disposal of solid and hazardous materials and other health and safety-related concerns. Some of these laws and regulations may impose joint and several liability on tenants, owners or operators of real property for the costs to investigate or remediate contaminated properties, regardless of fault, whether the acts causing the contamination were legal, whether the
37
contamination was present prior to a purchaser’s acquisition of a property, and whether an owner knew of such contamination. The conditions of investments at the time we acquire them, operations in the vicinity of our investments, such as the presence of underground tanks, or activities of unrelated third parties may affect the value or performance of our Portfolio.
Hazardous Substances. The presence of hazardous substances (on owned real estate), or the failure to properly remediate these substances, may hinder our ability to sell, rent or pledge investments as collateral for future borrowings. Any material expenditures, fines, or damages that we must pay will reduce our ability to make distributions to investors and may reduce the value of an investment in us. Additionally, compliance with new laws, ordinances or regulations may impose material environmental liability.
Asbestos Containing Materials. Certain U.S. federal, state, and local laws, regulations and ordinances govern the removal, encapsulation or disturbance of asbestos containing materials (“ACMs”) when such materials are in poor condition or in the event of construction, remodeling, renovation, or demolition of a building. Such laws may impose liability for release of ACMs and may provide for third parties to seek recovery from owners or operators of real property for personal injury associated with ACMs. In connection with our ownership and operation of real estate, we may incur costs associated with the removal of ACMs or liability to third parties.
Other Regulations. We will be required to operate our properties in compliance with fire and safety regulations, building codes and other land use regulations, as they may be adopted by governmental agencies and bodies and become applicable to our properties. We may be required to make substantial capital expenditures to comply with those requirements, and these expenditures could adversely affect our performance and our ability to make distributions to investors.
Eminent domain could lead to material losses on our investments in our properties.
Governmental authorities may exercise eminent domain to acquire the land on which our properties are built in order to build roads and other infrastructure. Any such exercise of eminent domain would allow us to recover only the fair value of the affected properties. In addition, “fair value” could be substantially less than the real market value of the property for a number of years, and we could effectively have no profit potential from properties acquired by the government through eminent domain.
Contingent or unknown liabilities could adversely affect our financial condition.
Our acquisition activities are subject to many risks. We may acquire properties that are subject to unknown or contingent liabilities, including liabilities for or with respect to liens attached to properties, unpaid real estate taxes, utilities or HOA charges for which a prior owner remains liable, clean-up or remediation of environmental conditions or code violations, claims of vendors or other persons dealing with the acquired properties and tax liabilities, among other things. In each case, our acquisitions may be without any, or with only limited, recourse with respect to unknown or contingent liabilities or conditions. As a result, if any such liability were to arise relating to our properties, or if any adverse condition exists with respect to our properties that is in excess of its insurance coverage, we might have to pay substantial sums to settle or cure it, which could adversely affect our business. The properties we acquire may also be subject to covenants, conditions or restrictions that restrict the use or ownership of such properties, including prohibitions on leasing or requirements to obtain the approval of HOAs prior to leasing. We may not discover such restrictions during the acquisition process and such restrictions may adversely affect our ability to operate such properties as we intend.
38
In addition, purchases of single-family homes acquired as part of a portfolio or in bulk purchases typically involve few or no representations or warranties with respect to the properties and may allow us limited or no recourse against the sellers of such properties. Such properties also often have unpaid tax, utility and HOA liabilities for which we may be obligated but fail to anticipate.
Our dependence upon third parties for key services may have an adverse effect on our operating results or reputation if the third parties fail to perform.
We use local and national third-party vendors and service providers to provide certain services for our properties. For example, we typically engage third-party home improvement professionals with respect to certain maintenance and specialty services, such as heating, ventilation and air conditioning systems, roofing, painting and floor installations. Selecting, managing and supervising these third-party service providers requires significant resources and expertise, and because our Portfolio consists of geographically dispersed properties, our ability to adequately select, manage and supervise such third parties may be more limited or subject to greater inefficiencies than if our properties were more geographically concentrated. We have entered into a three-year contract with a third-party vendor to provide certain services for our properties. Because of the large volume of services under this contract, only a limited number of companies are capable of servicing our needs on this scale. Accordingly, the inability or unwillingness of this vendor, to continue to provide these services on acceptable terms or at all could have a material adverse effect on our business.
We may obtain only limited warranties when we purchase a property and would have only limited recourse in the event due diligence did not identify any issues that lower the value of the property.
The seller of a property often sells such property in its “as is” condition on a “where is” basis and “with all faults” without any warranties of merchantability or fitness for a particular use or purpose. In addition, purchase and sale agreements may contain only limited warranties, representations and indemnifications that will only survive for a limited period after the closing. The purchase of properties with limited warranties increases the risk that we may lose some or all of our invested capital in the property, as well as the loss of rental revenue from that property.
The costs of complying with new and existing laws and regulations may adversely affect the values of our properties or affect our ability to attract and retain tenants.
Federal, state, and local governments and governmental agencies may adopt, create or amend laws, regulations, or ordinances related to property acquisitions, tenants, or landlords that could negatively affect our operations and our ability to effectively manage our properties.
Our properties may be or become subject to condemnation or eminent domain proceedings.
A governmental authority could bring an eminent domain or inverse condemnation action against one or more of our properties. Such an action could have a material adverse effect on the financial viability and marketability of that property, and, as a result, our results of operations and our ability to make distributions to investors.
39
Risks Associated with Debt Financing
General debt financing risks related to the use of leverage in connection with executing our business strategy may result in increased risk for investors.
We employ leverage and may continue to utilize leverage or enter into hedging agreements related to our debt in connection with our respective investments. Use of leverage subjects the investments to risks normally associated with debt financing, including the risk that cash flows will be insufficient to meet required payments of principal and interest, the risk that the value of collateral may decrease, forcing us to dispose of investments at inopportune times to reduce leverage and maintain compliance, the risk that indebtedness on the investments will not be able to be refinanced, or that the terms of such refinancing will not be as favorable as the terms of the existing indebtedness.
Significant borrowings increase the risks of an investment in us. If there is a shortfall between the cash flow from investments and the cash flow needed to service our indebtedness, then the amount available for distributions to stockholders may be reduced. In addition, incurring mortgage debt increases the risk of loss because defaults on indebtedness secured by a property may result in lenders initiating foreclosure actions. In that case, we could lose the investment securing the loan that is in default, thus reducing the value of an investment in us.
Currently, financing for investments in single-family homes is generally available, but there can be no guarantee that sufficient financing will be available to us in the future.
Under current lending conditions, financing for investment single-family houses is generally available. However, there can be no assurance that we will be able to obtain financing on favorable terms, if at all.
Interest rate risk on our debt may adversely affect our performance and our ability to make distributions to stockholders.
As of March 31, 2021, $661.4 million of our total debt outstanding bears interest at floating interest rates, and we may also borrow additional funds at floating interest rates in the future, including $180.0 million and $150.0 million available for borrowing under the JPM Facility and Warehouse Facility, respectively, as of March 31, 2021. As of March 31, 2021, five interest rate swap agreements, with a combined notional amount of $320 million and terms expiring in 2024 and 2025, effectively fix the interest rate on $320 million, or 48%, of our $661.4 million of floating rate debt outstanding. As of March 31, 2021, the interest rate cap agreement we have entered into effectively caps LIBOR on $241.4 million of our floating rate mortgage debt outstanding at 6.60% for the term of the agreement, which expires on November 1, 2021. Except to the extent we have arrangements in place that hedge against the risk of rising interests rates, an increase in interest rates could increase required debt service payments on floating rate debt and could reduce funds available for operations, future business opportunities, and distributions to stockholders. If we need to repay debt during times of rising interest rates, we could be forced to dispose of properties on unfavorable terms, which may not permit realization of the maximum return on such investments.
Interest-only indebtedness may increase our risk of default.
As of March 31, 2021, $661.4 million of our debt outstanding was interest-only. Additionally, we may also finance any future property acquisitions using interest-only mortgage indebtedness or make other borrowings that are interest-only. For all of this indebtedness other than the Initial Mortgage, interest is payable monthly during the loan term, and a “balloon” payment of the entire principal amount is payable at maturity. For our Initial Mortgage, interest is payable monthly during the loan term and principal payments based on a 30 year amortization schedule are required during the last 36 months of the loan and the remainder of the principal, or a balloon payment, is payable at maturity. These required balloon payments may increase our risk of default under the related loan because we may not have the required funds to repay the principal as required under the agreements. These required principal or balloon payments may increase our risk of default under the related loan if we do not have funds available or are unable to refinance the obligation. Additionally, if we default on the payment of principal under one of our agreements, it may cause cross defaults under our other credit agreements. In order to make the required principal or balloon payments, we may be forced to sell one or more of our properties or investments in real estate at times that may not permit us to realize the return on the investments we would have otherwise realized. In addition, payments of principal and interest made to service our debts may leave us with insufficient cash to pay the distributions that we are required to pay to maintain our qualification as a REIT.
We have a substantial amount of indebtedness, which may limit our financial and operating activities and may adversely affect our ability to incur additional debt to fund future needs.
As of March 31, 2021, there was $808.6 million of debt outstanding related to our Portfolio.
Payments of principal and interest on borrowings may leave us with insufficient cash resources to operate our properties, fully implement our capital expenditure, acquisition and development activities, or pay the dividends necessary to maintain our REIT qualification. Our level of debt and the limitations imposed on us by our debt agreements could have significant adverse consequences, including the following:
| • | require us to dedicate a substantial portion of cash flow from operations to the payment of principal, and interest on, indebtedness, thereby reducing the funds available for other purposes; |
| • | make it more difficult for us to borrow additional funds as needed or on favorable terms, which could, among other things, adversely affect our ability to meet operational needs; |
| • | force us to dispose of one or more of our properties, possibly on unfavorable terms or in violation of certain covenants which we may be subject to; |
| • | subject us to increased sensitivity to interest rate increases; |
| • | make us more vulnerable to economic downturns, adverse industry conditions or catastrophic external events; |
| • | limit our ability to withstand competitive pressures; |
| • | limit our ability to refinance our indebtedness at maturity or the refinancing terms may be less favorable than the terms of our original indebtedness; |
| • | reduce our flexibility in planning for or responding to changing business, industry and economic conditions; and/or |
| • | place us at a competitive disadvantage to competitors that have relatively less debt than we have. |
If any one of these consequences were to materialize, our financial condition, results of operations, cash flow and price of our common stock could be adversely affected. Furthermore, foreclosures could create taxable income without accompanying cash proceeds, which could hinder our ability to meet the REIT distribution requirements imposed by the Code.
Changes to, or the elimination of, LIBOR may adversely affect interest expense related to our loans and investments.
In a speech on July 27, 2017, Andrew Bailey, the Chief Executive of the Financial Conduct Authority of the U.K., or the FCA, announced the FCA’s intention to cease sustaining LIBOR after 2021. The FCA has statutory powers to require panel banks to contribute to LIBOR when necessary. The FCA has decided not to ask, or to require, that panel banks continue to submit contributions to LIBOR beyond the end of 2021. The FCA has indicated that it expects that the current panel banks will voluntarily sustain LIBOR until the end of 2021. The FCA’s intention is that after 2021, it will no longer be necessary for the FCA to ask, or to require, banks to submit contributions to LIBOR. The FCA does not intend to sustain LIBOR through its influence or legal powers beyond that date. It is possible that the ICE Benchmark Administration Limited (formerly NYSE Euronext Rate Administration Limited) and the panel banks could continue to produce LIBOR on the current basis after 2021, if they are willing and able to do so, but we cannot make assurances that LIBOR will survive in its current form, or at all. The ICE Benchmark Administration Limited also recently announced that it will consult on its intention to extend the publication of LIBOR to June 30, 2023. The U.S. Federal Reserve, in conjunction with the Alternative Reference Rates Committee, a steering committee comprised of large U.S. financial institutions, is considering replacing U.S.-dollar LIBOR with the Secured Overnight Financing Rate, or SOFR, a new index calculated by short-term repurchase agreements, backed by Treasury securities. Although there have been a few issuances utilizing SOFR or the Sterling Over Night Index Average, an alternative reference rate that is based on transactions, it is unknown whether these alternative reference rates will attain market acceptance as replacements for LIBOR.
Approximately 82% of our debt outstanding as of March 31, 2021 pays interest at a variable rate that is tied to LIBOR. If LIBOR is no longer available, our loan documents generally allow the lender, in some cases in coordination with us, to choose a new index based upon comparable information. If LIBOR is no longer available, we may need to renegotiate some of our agreements to determine a replacement index or rate of interest. There is currently no definitive information regarding the future utilization of LIBOR or of any particular replacement rate, although SOFR has emerged as a leading candidate and is expressly used in some of our facilities. As such, the potential effect of any such event on our cost of capital and net investment income cannot yet be determined and any changes to benchmark interest rates could increase our financing costs, which could impact our results of operations, cash flows and the market value of our investments. In addition, the elimination of LIBOR and/or changes to another index could result in mismatches with the interest rate of investments that we are financing.
Secured indebtedness exposes us to the possibility of foreclosure on our ownership interests in our rental homes.
Incurring mortgage and other secured indebtedness increases our risk of loss of our ownership interests in our rental homes because defaults thereunder, and/or the inability to refinance such indebtedness, may result in foreclosure action initiated by lenders. For tax purposes, a foreclosure of any of our rental homes would be treated as a sale of the home for a purchase price equal to the outstanding balance of the indebtedness secured by such rental home. If the outstanding balance of the indebtedness secured by such rental home exceeds our tax basis in the rental home, we would recognize taxable income on foreclosure without receiving any cash proceeds.
40
Covenants in our debt agreements may restrict our operating activities and adversely affect our financial condition.
Our existing debt agreements contain, and future debt agreements may contain, financial and/or operating covenants including, among other things, certain coverage ratios, as well as limitations on the ability to incur additional secured and unsecured debt and otherwise affect our distribution and operating policies. These covenants may limit our operational flexibility and acquisition and disposition activities. Moreover, if any of the covenants in these debt agreements are breached and not cured within the applicable cure period, we could be required to repay the debt immediately, even in the absence of a payment default. A default under one of our debt agreements could result in a cross-default under other debt agreements, and our lenders could elect to declare outstanding amounts due and payable, terminate their commitments, require and enforce their respective interests against existing collateral. As a result, a default under applicable debt covenants could have an adverse effect on our financial condition or results of operations. Additionally, borrowing base requirements associated with our financing arrangements may prevent us from drawing upon our total maximum capacity under these financing arrangements if sufficient collateral, in accordance with our facility agreements, is not available.
For example, some of our debt agreements require, among other things, that a cash management account controlled by the lender collect all rents and cash generated by the properties securing our Portfolio. Upon the occurrence of an event of default or failure to satisfy the required financial covenants, the lender may apply any excess cash as the lender elects, including prepayment of principal and amounts due under the loans. These covenants may restrict our ability to engage in transactions that we believe would otherwise be in the best interests of our stockholders. Further, such restrictions could make it difficult for us to satisfy the requirements necessary to maintain our qualification as a REIT for U.S. federal income tax purposes.
Other Risks
We may be subject to requirements under the USA PATRIOT Act of 2001 and the regulations of the Treasury Department’s Office of Foreign Assets Control.
We may be subject to the Uniting and Strengthening America by Providing Appropriate Tools Required to Intercept and Obstruct Terrorism Act of 2001 (the “USA PATRIOT Act”), which amends the Bank Secrecy Act and was designed to detect and deter money laundering and terrorist financing activity. The USA PATRIOT Act requires subject businesses to establish anti-money laundering compliance programs that must include policies and procedures to verify investor identity at account opening and to detect and report suspicious transactions to the government. Institutions subject to the USA PATRIOT Act must also implement specialized employee training programs, designate an anti-money laundering compliance officer and submit to independent audits of the effectiveness of the compliance program. Compliance with the USA PATRIOT Act may result in additional financial expenses for us and may subject us to additional liability. Our failure to comply with regulations of the Treasury Department’s Office of Foreign Assets Control applicable to it could have similar or additional negative consequences to those under the USA PATRIOT Act.
41
Risks Related to Tax
Failure to qualify as a REIT for U.S. federal income tax purposes would have a material adverse effect on us.
We elected to be taxed as a REIT under the Code. Our qualification as a REIT will require us to satisfy numerous requirements, some on an annual and quarterly basis, established under highly technical and complex Code provisions for which there are only limited judicial or administrative interpretations, and which involve the determination of various factual matters and circumstances not entirely within our control. We expect that our current organization and proposed method of operation will enable us to continue to qualify as a REIT, but we may not so qualify or we may not be able to remain so qualified in the future. In addition, U.S. federal income tax laws governing REITs and other corporations and the administrative interpretations of those laws may be amended at any time, potentially with retroactive effect. If we fail to qualify as a REIT in any taxable year, we would be subject to U.S. federal income tax on our REIT taxable income at the corporate tax rate and would not be allowed to deduct dividends paid to our stockholders in computing our taxable income. Also, unless the IRS granted us relief under certain statutory provisions, we could not re-elect REIT status until the fifth calendar year after the year in which we first failed to qualify as a REIT. The additional tax liability from the failure to qualify as a REIT would reduce or eliminate the amount of cash available for investment or distribution to our stockholders. This would materially and adversely affect us. In addition, we would no longer be required to make distributions to our stockholders.
As a REIT, we may be subject to tax liabilities that reduce our cash flow.
Even if we continue to qualify as a REIT, for U.S. federal income tax purposes, we may be subject to certain U.S. federal, state and local taxes on our income or property, including the following:
| • | To continue to qualify as a REIT, we must distribute annually at least 90% of our REIT taxable income (determined without regard to the dividends paid deduction and excluding net capital gains) to our stockholders. If we satisfy the distribution requirement but distribute less than 100% of our REIT taxable income (determined without regard to the dividends paid deduction and including net capital gains), we will be subject to tax on the undistributed income at the corporate income tax rate. |
| • | We will be subject to a 4% nondeductible excise tax on the amount, if any, by which the distributions that we pay in any calendar year are less than the sum of 85% of our ordinary income, 95% of our capital gain net income, and 100% of our undistributed income from prior years. |
| • | If we have net income from the sale of foreclosure property that we hold primarily for sale to customers in the ordinary course of business or other non-qualifying income from foreclosure property, we must pay a tax on that income at the corporate income tax rate. |
| • | If we sell a property, other than foreclosure property, that we hold primarily for sale to customers in the ordinary course of business, our net gain will be subject to the 100% “prohibited transaction” tax. |
| • | We may be subject to state and local taxes on our income or property, either directly or indirectly because of the taxation of entities through which we indirectly own our assets. |
42
| • | Our subsidiaries that are “taxable REIT subsidiaries” (“TRSs”) would generally be required to pay U.S. federal (and applicable state and local) corporate income tax on their earnings. We currently do not have a TRS. |
To qualify as a REIT, we must meet annual distribution requirements, which could result in material harm to the Company if they are not met.
To obtain the favorable tax treatment accorded to REITs, among other requirements, we normally will be required each year to distribute to our stockholders at least 90% of our REIT taxable income, determined without regard to the deduction for dividends paid and by excluding net capital gains. We will be subject to U.S. federal income tax on our undistributed REIT taxable income and net capital gains. In addition, if we fail to distribute to our stockholders during each calendar year at least the sum of (a) 85% of our ordinary income for such year; (b) 95% of our capital gain net income for such year; and (c) any undistributed REIT taxable income from prior periods, we will be subject to a 4% excise tax on the excess of the required distribution over the sum of (1) the amounts actually distributed by us and (2) retained amounts on which we pay U.S. federal income tax at the corporate level. We intend to make distributions to our stockholders to comply with the requirements of the Code for REITs and to minimize or eliminate our U.S. federal income tax obligation. However, differences between the recognition of REIT taxable income and the actual receipt of cash could require us to sell assets or raise capital on a short-term or long-term basis to meet the distribution requirements of the Code. Certain types of assets generate substantial mismatches between REIT taxable income and available cash. Such assets include rental real estate that has been financed through financing structures which require some or all of available cash flows to be used to service borrowings. As a result, the requirement to distribute a substantial portion of our REIT taxable income could cause us to: (1) sell assets in adverse market conditions; (2) raise capital on unfavorable terms; or (3) distribute amounts that would otherwise be invested in future acquisitions, expansions or developments, capital expenditures or repayment of debt, in order to comply with REIT requirements. Further, amounts distributed will not be available to fund our operations. Under certain circumstances, covenants and provisions in our existing and future debt instruments may prevent us from making distributions that we deem necessary to comply with REIT requirements. Our inability to make required distributions as a result of such covenants could threaten our status as a REIT and could result in material adverse tax consequences for us and our stockholders.
Complying with REIT requirements may cause us to forgo otherwise attractive opportunities or liquidate certain of our investments.
To qualify as a REIT for U.S. federal income tax purposes, we must continually satisfy tests concerning, among other things, the sources of our income, the nature and diversification of our assets, the amounts we distribute to our stockholders and the ownership of our shares. We may be required to make distributions to our stockholders at disadvantageous times or when we do not have funds readily available for distribution. Thus, compliance with the REIT requirements may, for instance, hinder our ability to make certain otherwise attractive investments or undertake other activities that might otherwise be beneficial to us and our stockholders, or may require us to raise capital or liquidate investments in unfavorable market conditions and, therefore, may hinder our performance.
43
As a REIT, at the end of each quarter, at least 75% of the value of our assets must consist of cash, cash items, government securities and qualified real estate assets. The remainder of our investments in securities (other than cash, cash items, government securities, securities issued by a TRS and qualified real estate assets) generally cannot include more than 10% of the outstanding voting securities of any one issuer or more than 10% of the total value of the outstanding securities of any one issuer. In addition, in general, no more than 5% of the value of our total assets (other than cash, cash items, government securities, securities issued by a TRS and qualified real estate assets) can consist of the securities of any one issuer, and no more than 20% of the value of our total assets can be represented by securities of one or more TRSs. If we fail to comply with these requirements at the end of any quarter, we must correct the failure within 30 days after the end of the quarter or qualify for certain statutory relief provisions to avoid losing our REIT qualification and suffering material adverse tax consequences. The need to comply with the 75% asset test and 20% TRS securities test on an ongoing basis potentially could require us in the future to limit the future acquisition of, or to dispose of, nonqualifying assets, limit the future expansion of any TRS’s assets and operations or dispose of or curtail TRS assets and operations, which could adversely affect our business and could have the effect of reducing our income and amounts available for distribution to our stockholders.
If our Operating Partnership failed to qualify as a partnership for U.S. federal income tax purposes, we would cease to qualify as a REIT.
We believe that our Operating Partnership will be treated as a partnership for U.S. federal income tax purposes. As a partnership, our Operating Partnership generally will not be subject to U.S. federal income tax on its income. Instead, each of its partners, including us, will be allocated, and may be required to pay tax with respect to, its share of our Operating Partnership’s income. We cannot assure you, however, that the IRS will not challenge the status of our Operating Partnership or any other subsidiary partnership in which we own an interest as a partnership for U.S. federal income tax purposes, or that a court would not sustain such a challenge. If the IRS were successful in treating our Operating Partnership or any other such subsidiary partnership as an entity taxable as a corporation for U.S. federal income tax purposes (including by reason of being classified as a publicly traded partnership or “taxable mortgage pool” for U.S. federal income tax purposes), we would fail to meet the gross income tests and certain of the asset tests applicable to REITs and, accordingly, we would likely cease to qualify as a REIT. Also, the failure of our Operating Partnership or any subsidiary partnerships to qualify as a partnership could cause it to become subject to U.S. federal and state corporate income tax, which would significantly reduce the amount of cash available for debt service and for distribution to its partners, including us.
The prohibited transactions tax may limit our ability to engage in sale transactions.
A REIT’s income from “prohibited transactions” is subject to a 100% tax. In general, “prohibited transactions” are sales or other dispositions of property other than foreclosure property, held primarily for sale to customers in the ordinary course of business. We may be subject to the prohibited transactions tax equal to 100% of net gain upon a disposition of real property or debt instruments that we hold. Although a safe harbor is available, for which certain sales of property by a REIT are not subject to the 100% prohibited transaction tax, we cannot assure you that we can comply with the safe harbor or that we will avoid owning property that may be characterized as held primarily for sale to customers in the ordinary course of business. Consequently, we may choose not to engage in certain sales of our properties or we may conduct such sales
44
through our TRSs, which would be subject to U.S. federal and state income taxation at corporate rates. In addition, we may have to sell numerous properties to a single or a few purchasers, which could cause us to be less profitable than would be the case if we sold properties on a property-by-property basis. For example, if we decide to acquire properties opportunistically to renovate in anticipation of immediate resale, we will need to conduct that activity through our TRSs to avoid the 100% prohibited transactions tax.
The 100% tax described above may limit our ability to enter into transactions that would otherwise be beneficial to us. For example, if circumstances make it not profitable or otherwise uneconomical for us to remain in certain states or geographical markets, the 100% tax could delay our ability to exit those states or markets by selling our assets in those states or markets other than through a TRS, which could harm our operating profits.
You may be restricted from acquiring or transferring certain amounts of our stock.
The restrictions on ownership and transfer in our charter may inhibit market activity in our capital stock and restrict our business combination opportunities.
In order to qualify as a REIT for each taxable year, five or fewer individuals, as defined in the Code, may not own, beneficially or constructively, more than 50% in value of our issued and outstanding stock at any time during the last half of a taxable year. Attribution rules in the Code determine if any individual or entity beneficially or constructively owns our capital stock under this requirement. Additionally, at least 100 persons must beneficially own our capital stock during at least 335 days of a taxable year for each taxable year. To help ensure that we meet these tests, our charter restricts the acquisition and ownership of shares of our capital stock.
Our charter, with certain exceptions, authorizes our directors to take such actions as are necessary to preserve our qualification as a REIT. Unless exempted by our Board, our charter prohibits any person from beneficially or constructively owning more than 9.8% in value or in number of shares, whichever is more restrictive, of outstanding shares of our common stock or more than 9.8% in value of the aggregate of the outstanding shares of any class or series of our capital stock. Our Board may not grant an exemption from these restrictions to any proposed transferee whose ownership in excess of such ownership limits would, among other things, result in our failing to qualify as a REIT. This as well as other restrictions on transferability and ownership will not apply, however, if our Board determines that it is no longer in our best interest to continue to qualify as a REIT. See Item 11. “Description of Registrant’s Securities to be Registered—Restrictions on Ownership and Transfer.”
We may be subject to adverse legislative or regulatory tax changes.
The U.S. federal income tax treatment of REITs may be modified, possibly with retroactive effect, by legislative, judicial or administrative action at any time, which could affect the U.S. federal income tax treatment of an investment in us. The U.S. federal income tax rules dealing with REITs are constantly under review by persons involved in the legislative process, the IRS and the U.S. Treasury Department, which could result in statutory changes as well as frequent revisions to regulations and interpretations. We cannot predict the long-term effect of any future law changes on REITs and their stockholders. Prospective investors are urged to consult with their tax advisors regarding the effect of potential changes to the U.S. federal tax laws on an investment in our stock.
45
We and our subsidiaries and stockholders may be subject to state, local or foreign taxation in various jurisdictions including those in which we or they transact business, own property or reside.
We may own real property assets located in numerous jurisdictions, and may be required to file tax returns in some or all of those jurisdictions. Our state, local or foreign tax treatment and that of our stockholders may not conform to the U.S. federal income tax treatment discussed above. Prospective investors should consult their tax advisors regarding the application and effect of state and local income and other tax laws on an investment in our stock.
Dividends payable by REITs generally are taxed at the higher ordinary income rate, which could reduce the net cash received by stockholders and may be detrimental to our ability to raise additional funds through any future sale of our stock.
Income from “qualified dividends” payable to U.S. stockholders that are individuals, trusts and estates is generally subject to tax at reduced rates. However, dividends payable by REITs to their stockholders generally are not eligible for the reduced rates for qualified dividends and are taxed at ordinary income rates (but U.S. stockholders that are individuals, trusts and estates generally may deduct up to 20% of ordinary dividends from a REIT for taxable years beginning after December 31, 2017 and before January 1, 2026). To qualify for this deduction, the U.S. stockholder receiving such dividends must hold the dividend-paying REIT stock for at least 46 days (taking into account certain special holding period rules) of the 91-day period beginning 45 days before the stock becomes ex-dividend and cannot be under an obligation to make related payments with respect to a position in substantially similar or related property. Although these rules do not adversely affect the taxation of REITs or dividends payable by REITs, to the extent that the reduced rates continue to apply to regular corporate qualified dividends, investors that are individuals, trusts and estates may perceive investments in REITs to be relatively less attractive than investments in the stocks of non-REIT corporations that pay dividends, which could materially and adversely affect the value of the shares of REITs, including the per share trading price of our stock, and could be detrimental to our ability to raise additional funds through the future sale of our stock.
Risks Related to Conflicts of Interest
Certain of our officers will have conflicts of interest.
Certain of our officers will have conflicts of interest in allocating their time between us and their other business activities, including that of our Adviser or our Manager, and none of our officers will devote all of such officer’s business time and attention to our activities.
Conflicts may arise in connection with allocation of services and costs.
Affiliates of our Adviser own, and may continue to own in the future, other properties outside our Portfolio, which may result in a conflict of allocation of services and costs.
46
ITEM 2. FINANCIAL INFORMATION.
Summary Historical and Pro Forma Financial Data
Summary Historical Financial Data
The following tables set forth, for the periods and dates indicated, our summary historical consolidated financial data. We have derived the statement of operations data for the years ended December 31, 2020 and 2019 and the balance sheet data as of December 31, 2020 and 2019 from our audited consolidated financial statements appearing elsewhere in this Form 10. We have derived the statement of operations data for the three months ended March 31, 2021 and 2020 and the balance sheet data as of March 31, 2021 from our unaudited consolidated financial statements appearing elsewhere in this Form 10. You should read this information in conjunction with “Management’s Discussion and Analysis of Financial Condition and Results of Operations” and our audited consolidated financial statements and unaudited interim consolidated financial statements and the related notes to those financial statements included elsewhere in this Form 10.
| (in thousands, except per share data) | For the Three Months Ended (unaudited) | For the Years Ended (audited) | ||||||||||||||
Statement of Operations Data: | 2021 | 2020 | 2020 | 2019 | ||||||||||||
Total revenues | $ | 30,628 | $ | 17,103 | $ | 76,454 | $ | 52,324 | ||||||||
Total expenses | 30,685 | 17,632 | 77,470 | 53,944 | ||||||||||||
Loss on sales of real estate | (75 | ) | (26 | ) | (930 | ) | (44 | ) | ||||||||
|
|
|
|
|
|
|
| |||||||||
Operating loss | (132 | ) | (555 | ) | (1,946 | ) | (1,664 | ) | ||||||||
Casualty gain (loss), net of insurance proceeds | (9 | ) | — | 281 | 22 | |||||||||||
|
|
|
|
|
|
|
| |||||||||
Net loss | (141 | ) | (555 | ) | (1,665 | ) | (1,642 | ) | ||||||||
Dividends on and accretion to redemption value of Redeemable Series A preferred stock | 2,206 | — | 1,052 | — | ||||||||||||
Net loss attributable to redeemable noncontrolling interests in the OP | (35 | ) | (190 | ) | (570 | ) | (967 | ) | ||||||||
|
|
|
|
|
|
|
| |||||||||
Net loss attributable to common stockholders | $ | (2,312 | ) | $ | (365 | ) | $ | (2,147 | ) | $ | (675 | ) | ||||
|
|
|
|
|
|
|
| |||||||||
Weighted average common shares outstanding - basic | 10,417 | 5,907 | 7,175 | 3,221 | ||||||||||||
|
|
|
|
|
|
|
| |||||||||
Weighted average common shares outstanding - diluted | 10,417 | 5,907 | 7,175 | 3,221 | ||||||||||||
|
|
|
|
|
|
|
| |||||||||
Loss per share – basic | $ | (0.22 | ) | $ | (0.06 | ) | $ | (0.30 | ) | $ | (0.21 | ) | ||||
|
|
|
|
|
|
|
| |||||||||
Loss per share – diluted | $ | (0.22 | ) | $ | (0.06 | ) | $ | (0.30 | ) | $ | (0.21 | ) | ||||
|
|
|
|
|
|
|
| |||||||||
| (in thousands) | As of March 31, (unaudited) | As of December 31, (audited) | ||||||||||
Balance Sheet Data: | 2021 | 2020 | 2019 | |||||||||
Cash and restricted cash | 51,776 | $ | 37,096 | $ | 17,830 | |||||||
Total assets | 1,347,881 | $ | 779,968 | $ | 536,636 | |||||||
Total debt | 799,229 | $ | 347,709 | $ | 315,889 | |||||||
Total temporary equity (1) | 248,436 | $ | 212,157 | $ | 93,933 | |||||||
Total stockholders’ equity | 252,000 | $ | 174,322 | $ | 107,471 | |||||||
| As of March 31, (unaudited) | ||||
| 2021 | ||||
| Other Data (unaudited): | ||||
Number of Homes | 13,693 | |||
Occupancy (2) | 97.5 | % | ||
Avg Effective Monthly Rent | $ | 1,039 | ||
Avg Sq Ft | 1,318 | |||
% of homes that have been renovated | 66.7 | % | ||
% of homes to be renovated | 33.3 | % | ||
% of homes to be sold | 0.0 | % | ||
% of homes in good condition | 90.3 | % | ||
| (1) | Includes the Company’s Series A Preferred Stock and redeemable noncontrolling interests in the Operating Partnership. |
| (2) | Occupancy is calculated as the number of units occupied as of a specific date, divided by the total number of stabilized units as of that date, expressed as a percentage. |
47
Summary Pro Forma Financial Data
The following tables set forth, for the period and date indicated, our summary unaudited pro forma financial data. The summary unaudited pro forma financial data has been prepared to give effect to the acquisition of (1) a portfolio of 1,725 SFR properties from an unaffiliated third-party for approximately $228.0 million on January 22, 2021 (the “Conrex I Acquisition”) and (2) a portfolio of 2,170 SFR properties from an unaffiliated third-party for approximately $282.9 million on March 1, 2021 (the “Conrex II Acquisition”). In addition to the $228.0 million purchase price, in connection with the Conrex I Acquisition, we paid an approximately $2.5 million acquisition fee to the Manager which was capitalized as a transaction cost. In addition to the $282.9 million purchase price, in connection with the Conrex II Acquisition, we paid an approximately $3.0 million acquisition fee to the Manager which was capitalized as a transaction cost. We refer to the portfolios purchased in the Conrex I Acquisition and the Conrex II Acquisition as the “Acquired Portfolios.” The unaudited pro forma statement of operations data for the year ended December 31, 2020 and for the three months ended March 31, 2021 have been prepared to give effect to the acquisitions of the Acquired Portfolios as if the acquisitions occurred on January 1, 2020. The unaudited pro forma other data as of December 31, 2020 has been prepared to give effect to the acquisitions of the Acquired Portfolios as if the acquisitions occurred on December 31, 2020.
In connection with the Conrex I Acquisition and Conrex II Acquisitions, we did not receive historical audited or unaudited financial statements for the periods or dates presented relating to the Acquired Portfolios. Further, the sellers have not provided us with the information needed to prepare Rule 3-14 financial statements. We prepared the following summary unaudited pro forma statement of operations data for the three months ended March 31, 2021 based on actual operating data of the acquired portfolios from the date of acquisition through March 31, 2021 adjusted to reflect a full quarter of activity as if the homes were operating the whole quarter. We prepared the following summary unaudited pro forma statement of operations data for the year ended December 31, 2020 based on other information and data, including historical financial data used to calculate NOI, received in connection with management’s underwriting and analysis of the portfolios acquired in the Conrex I Acquisition and Conrex II Acquisition. The Company used the NOI data provided by the sellers to create annualized historical financial data for the acquired portfolios in order to prepare the following pro forma statement of operations data.
Based on the limited information available to management, we made estimates and assumptions about the acquired portfolios based on our Portfolio’s prior performance and knowledge of the markets that we believe are reasonable. Results could differ materially from the estimates and assumptions used in the pro forma adjustments. Despite the limited information available to management, management believes providing the summary unaudited pro forma financial and other data provides useful and relevant information about the Acquired Portfolios. This summary unaudited pro forma financial and other data has been prepared for informational purposes only and is not necessarily indicative of future results or of actual results that would have been achieved had the acquisitions of the Acquired Portfolios been consummated on January 1, 2020.
Management also used the data provided by the sellers to identify trends in the acquired portfolios. For example, management identified lower occupancy rates in the acquired portfolios in certain MSAs as compared to the Company’s historical portfolio performance. As a result, in its internal modeling of future performance, the Company assumed lower initial occupancy of the acquired portfolio in those MSAs as compared to its historical portfolio. Other than to create annualized historical financial data for use in the pro forma statement of operations data and to identify trends used in its internal modeling, the Company has not generally relied on the information and data provided by the sellers.
You should read this information in conjunction with “Management’s Discussion and Analysis of Financial Condition and Results of Operations” and our consolidated financial statements and the related notes to those statements included elsewhere in this Form 10.
All amounts presented in the following tables are displayed in thousands (except for per share data and data presented in the other data table).
48
Statement of Operations Data (unaudited): | Historical For the Three Months Ended March 31, 2021 | Conrex I Acquisition (1) | Conrex II Acquisition (1) | Pro Forma For the Quarter Ended March 31, 2021 | ||||||||||||||||||||
Total revenues | $ | 30,628 |
| $ | 1,009 | (2) | $ | 4,280 | (3) | $ | 35,917 | |||||||||||||
Total expenses | 30,685 | 1,927 | (4) | 7,809 | (5) | 40,421 | ||||||||||||||||||
Loss on sales of real estate | (75 | ) | — | — | (75 | ) | ||||||||||||||||||
|
|
|
|
|
|
|
| |||||||||||||||||
Operating loss | (132 | ) | (918 | ) | (3,529 | ) | (4,579 | ) | ||||||||||||||||
Casualty loss, net of insurance proceeds | (9 | ) | — | — | (9 | ) | ||||||||||||||||||
|
|
|
|
|
|
|
| |||||||||||||||||
Net loss | (141 | ) | (918 | ) | (3,529 | ) | (4,588 | ) | ||||||||||||||||
Dividends on and accretion to redemption value of Redeemable Series A preferred stock | 2,206 | — | — | 2,206 | ||||||||||||||||||||
Net loss attributable to redeemable noncontrolling interests in the OP | (35 | ) | (228 | ) | (876 | ) | (1,139 | ) | ||||||||||||||||
|
|
|
|
|
|
|
| |||||||||||||||||
Net loss attributable to common stockholders | $ | (2,312 | ) | $ | (690 | ) | $ | (2,653 | ) | $ | (5,655 | ) | ||||||||||||
|
|
|
|
|
|
|
| |||||||||||||||||
Weighted average common shares outstanding - basic | 10,417 | 10,417 | ||||||||||||||||||||||
|
|
|
| |||||||||||||||||||||
Weighted average common shares outstanding - diluted | 10,417 | 10,417 | ||||||||||||||||||||||
|
|
|
| |||||||||||||||||||||
Loss per share - basic | $ | (0.22 | ) | $ | (0.54 | ) | ||||||||||||||||||
|
|
|
| |||||||||||||||||||||
Loss per share - diluted | $ | (0.22 | ) | $ | (0.54 | ) | ||||||||||||||||||
|
|
|
| |||||||||||||||||||||
Statement of Operations Data: | Historical For the Year Ended December 31, 2020 | Conrex I Acquisition(6) | Conrex II Acquisition(7) | Pro Forma For the Year Ended December 31, 2020 | ||||||||||||||||||||
| (audited) | (unaudited) | (unaudited) | (unaudited) | |||||||||||||||||||||
Total revenues | $ | 76,454 | $ | 23,328 | (2) | $ | 20,723 | (3) | $ | 120,505 | ||||||||||||||
Total expenses | 77,470 | 24,642 | (8) | 35,335 | (9) | 137,447 | ||||||||||||||||||
Loss on sales of real estate | (930 | ) | — | — | (930 | ) | ||||||||||||||||||
|
|
|
|
|
|
|
| |||||||||||||||||
Operating loss | (1,946 | ) | (1,314 | ) | (14,612 | ) | (17,872 | ) | ||||||||||||||||
Casualty gain, net of insurance proceeds | 281 | — | — | 281 | ||||||||||||||||||||
|
|
|
|
|
|
|
| |||||||||||||||||
Net loss | (1,665 | ) | (1,314 | ) | (14,612 | ) | (17,591 | ) | ||||||||||||||||
Dividends on and accretion to redemption value of Redeemable Series A preferred stock | 1,052 | 2,373 | (10) | — | 3,425 | |||||||||||||||||||
Net loss attributable to redeemable noncontrolling interests in the OP | (570 | ) | (450 | ) | (5,002 | ) | (6,022 | ) | ||||||||||||||||
|
|
|
|
|
|
|
| |||||||||||||||||
Net loss attributable to common stockholders | $ | (2,147 | ) | $ | (3,237 | ) | $ | (9,610 | ) | $ | (14,994 | ) | ||||||||||||
|
|
|
|
|
|
|
| |||||||||||||||||
Weighted average common shares outstanding - basic | 7,175 | 7,175 | ||||||||||||||||||||||
|
|
|
| |||||||||||||||||||||
Weighted average common shares outstanding - diluted | 7,175 | 7,175 | ||||||||||||||||||||||
|
|
|
| |||||||||||||||||||||
Loss per share - basic | $ | (0.30 | ) | $ | (2.09 | ) | ||||||||||||||||||
|
|
|
| |||||||||||||||||||||
Loss per share - diluted | $ | (0.30 | ) | $ | (2.09 | ) | ||||||||||||||||||
|
|
|
| |||||||||||||||||||||
Other Data (unaudited): | Historical as of 12/31/2020 | Conrex I Acquisition | Conrex II Acquisition | Pro Forma as of December 31, 2020 | ||||||||||||
Number of homes | 9,282 | 1,725 | 2,170 | 13,177 | ||||||||||||
Occupancy (11) | 96.4 | % | 96.5 | % | 89.2 | % | 95.2 | % | ||||||||
Avg Effective Monthly Rent | $ | 970 | $ | 1,167 | $ | 1,158 | $ | 1,027 | ||||||||
Avg Sq Ft | 1,226 | 1,544 | 1,550 | 1,321 | ||||||||||||
% of homes that have been renovated | 63.5 | % | 99.6 | % | 99.6 | % | 74.1 | % | ||||||||
% of homes to be renovated | 36.5 | % | 0.4 | % | 0.4 | % | 25.9 | % | ||||||||
% of homes to be sold | 0.1 | % | 0.1 | % | 0.1 | % | 0.1 | % | ||||||||
% of homes in good condition | 87.2 | % | 99.6 | % | 99.6 | % | 90.9 | % | ||||||||
49
| (1) | Historical revenue data from the date of acquisition to March 31, 2021 adjusted to reflect a full quarter was used to derive pro forma revenue. |
| (2) | Includes rental and other income (not reflected in the historical consolidated statements of operations of the Company) as if the Conrex I Acquisition occurred on January 1, 2020 and the properties began operations on that date. |
| (3) | Includes rental and other income (not reflected in the historical consolidated statements of operations of the Company) as if the Conrex II Acquisition occurred on January 1, 2020 and the properties began operations on that date. |
| (4) | Includes the following adjustments to total expenses (not reflected in the historical consolidated statements of operations of the Company) as if the Conrex I Acquisition occurred on January 1, 2020 and the properties began operations on that date: (a) Total property operating expenses; (b) Advisory fees; (c) Depreciation and amortization expense (real estate-related depreciation and amortization are computed on a straight-line basis over the respective estimated useful lives of the assets). |
| (5) | Includes the following adjustments to total expenses (not reflected in the historical consolidated statements of operations of the Company) as if the Conrex II Acquisition occurred on January 1, 2020 and the properties began operations on that date: (a) Total property operating expenses; (b) Advisory fees; (c) Depreciation and amortization expense (real estate-related depreciation and amortization are computed on a straight-line basis over the respective estimated useful lives of the assets); (d) Interest expense as if the borrowings attributable to the Conrex II Acquisition were borrowed on January 1, 2020 and includes the amortization of deferred financing costs incurred in connection with the borrowings. In connection with the Conrex II Acquisition, the Company entered into a credit facility with JP Morgan, which has an interest rate of LIBOR plus 2.75% and a two-year term and drew $320.0 million. For additional information regarding our debt arrangements, see “Management’s Discussion and Analysis of Financial Condition and Results of Operations—Debt, Derivatives and Hedging Activity—Debt.” |
| (6) | Annualized historical revenue data provided by the sellers for six months of 2020 was used to derive pro forma revenue. |
| (7) | Historical revenue data provided by the sellers for the full year ended December 31, 2020 was used to derive pro forma revenue. |
| (8) | Includes the following adjustments to total expenses (not reflected in the historical consolidated statements of operations of the Company) as if the Conrex I Acquisition occurred on January 1, 2020 and the properties began operations on that date: (a) Total property operating expenses; (b) Advisory fees; (c) Depreciation and amortization expense (real estate-related depreciation and amortization are computed on a straight-line basis over the respective estimated useful lives of the assets); (d) Interest expense as if the borrowings attributable to the Conrex I Acquisition were borrowed on January 1, 2020 and includes the amortization of deferred financing costs incurred in connection with the borrowings. In connection with the Conrex II Acquisition, the Company entered into a $125.0 million note with MetLife, which has an interest rate of 3.25% and a five-year term. For additional information regarding our debt arrangements, see “Management’s Discussion and Analysis of Financial Condition and Results of Operations—Debt, Derivatives and Hedging Activity—Debt.” |
| (9) | Includes the following adjustments to total expenses (not reflected in the historical consolidated statements of operations of the Company) as if the Conrex II Acquisition occurred on January 1, 2020 and the properties began operations on that date: (a) Total property operating expenses; (b) Advisory fees; (c) Depreciation and amortization expense (real estate-related depreciation and amortization are computed on a straight-line basis over the respective estimated useful lives of the assets); (d) Interest expense as if the borrowings attributable to the Conrex II Acquisition were borrowed on January 1, 2020 and includes the amortization of deferred financing costs incurred in connection with the borrowings. In connection with the Conrex II Acquisition, the Company entered into a credit facility with JP Morgan, which has an interest rate of LIBOR plus 2.75% and a two-year term and drew $320.0 million. For additional information regarding our debt arrangements, see “Management’s Discussion and Analysis of Financial Condition and Results of Operations—Debt, Derivatives and Hedging Activity—Debt.” |
| (10) | Includes dividends to our preferred stockholders (not reflected in the historical consolidated statements of operations of the Company) as if $36.5 million of our Series A Preferred Stock was issued on January 1, 2020. |
| (11) | Occupancy is calculated as the number of units occupied as of a specific date, divided by the total number of stabilized units as of that date, expressed as a percentage. |
50
Management’s Discussion and Analysis of Financial Condition and Results of Operations
The following is a discussion and analysis of our financial condition and our historical results of operations. The following should be read in conjunction with our financial statements and accompanying notes. This discussion contains forward-looking statements that involve risks and uncertainties. Our actual results could differ materially from those projected, forecasted, or expected in these forward-looking statements as a result of various factors, including, but not limited to, those discussed below and elsewhere in this annual report. See “Cautionary Statement Regarding Forward-Looking Statements” and “Risk Factors” in this Form 10. Our management believes the assumptions underlying the Company’s financial statements and accompanying notes are reasonable. However, the Company’s financial statements and accompanying notes may not be an indication of our financial condition and results of operations in the future.
Overview
The Company is an owner and operator of single-family homes for lease. As of March 31, 2021, our Portfolio consisted of 13,687 SFR homes primarily located in the midwestern, heartland and southeastern United States. As of March 31, 2021, the Portfolio had occupancy of approximately 87.0% with a weighted average monthly effective rent of $1,039 per occupied home. As of March 31, 2021, the Portfolio had a stabilized occupancy of approximately 97.5% with a weighted average monthly stabilized effective rent of $1,001 per occupied home and 53.3% of homes in our Portfolio were excluded from being stabilized under the NRHC definition either because the homes were in rehabilitation or were purchased with tenants in place. Substantially all of the Company’s business is conducted through the Operating Partnership, as the Company owns its homes indirectly through the Operating Partnership. VineBrook Homes OP GP, LLC, is the general partner of the Operating Partnership. As of March 31, 2021, there were 12,988,961 OP Units outstanding, of which 9,513,087, or 73.2%, were owned by the Company. Please see the notes to the financial statements included within this Form 10 for the breakdown of the non-controlling ownership of our Operating Partnership.
As of December 31, 2020, our Portfolio consisted of 9,282 SFR homes primarily located in the midwestern, heartland and southeastern United States. As of December 31, 2020, the Portfolio had occupancy of approximately 83.7% with a weighted average monthly effective rent of $969 per occupied home. As of December 31, 2020, the Portfolio had a stabilized occupancy of approximately 96.5% with a weighted average monthly effective rent of $989 per occupied stabilized home and 36.6% of homes in our Portfolio were excluded from being stabilized under the NRHC definition either because the homes were in rehabilitation or were purchased with tenants in place. As of December 31, 2020, there were 11,479,785 OP Units outstanding, of which 8,045,094, or 70.1%, were owned by the Company. Please see the notes to the financial statements included within this Form 10 for the breakdown of the non-controlling ownership of our Operating Partnership.
We are primarily focused on acquiring, renovating, leasing, maintaining and otherwise managing SFR home investments primarily located in large to medium size cities and suburbs located in the midwestern, heartland and southeastern United States. We intend to employ targeted management and a value-add program at a majority of our homes in an attempt to improve rental rates and the net operating income (“NOI”) at our homes, maximize cash flow, provide quarterly cash distributions and achieve long-term capital appreciation for our stockholders. We are externally managed by the Adviser through the Advisory Agreement, for an initial term ending November 1, 2021 which will automatically renew for one-year terms thereafter.
We began operations on November 1, 2018 as a result of the acquisition of various partnerships and limited liability companies owned and operated by the VineBrook Executives and other third parties, which owned the Initial Portfolio of approximately 4,129 SFR assets located in Ohio, Kentucky and Indiana for a total purchase price of approximately $330.2 million, including closing and financing costs of approximately $6.0 million. On November 1, 2018, the Company accepted subscriptions for 1,097,367 shares of our common stock for gross proceeds of approximately $27.4 million in connection with the Formation Transaction. The proceeds from the issuance of such shares of our common stock were used to acquire OP Units. The Operating Partnership used the capital contribution from the Company to fund a portion of the purchase price for the Initial Portfolio. The remaining purchase price and closing costs were funded by a capital contribution totaling $70.7 million from NREO, $8.6 million of equity rolled over from VineBrook Executives, and $241.4 million from a Federal Home Loan Mortgage Corporation (“Freddie Mac”) mortgage provided by KeyBank N.A (“KeyBank”).
On August 28, 2018, the Company authorized the offering of 40,000,000 shares of our common stock through a continuous private placement, under regulation D of the Securities Act of 1933 (and various state securities law provisions) for a maximum of $1.0 billion of its shares of our common stock. The Private Offering expires on November 1, 2023 but may be extended for up to two times for one year each. The
51
initial offering price for shares of our common stock sold through the Private Offering was $25.00 per share. The Company conducts periodic closings and sells shares of our common stock at a purchase price generally equal to NAV as determined using the valuation methodology and as recommended by the Adviser and approved by the pricing committee of the Board (the “Valuation Methodology”), plus applicable fees and commissions. For sales through Raymond James & Associates, Inc. (“Raymond James”), the purchaser subscribes for a gross amount based on NAV and separately pays the applicable fees upfront from the purchaser’s account with Raymond James. For sales through a broker-dealer other than Raymond James, the purchaser subscribers from a gross amount based on a public offering price (“POP”) which includes the applicable upfront fees and commissions. Additionally, an independent third-party valuation firm assesses and evaluates the appropriateness of our NAV calculations on a quarterly basis. NAV may differ from the values of our real estate assets as calculated in accordance with GAAP.
NexPoint Securities, Inc., an entity under common ownership with the Adviser, serves as the dealer manager (the “Dealer Manager”) for the Private Offering and Raymond James & Associates, Inc. and other unaffiliated broker-dealers serve as placement agents through selling agreements between each placement agent and the Company.
COVID-19
The COVID-19 pandemic could have material and adverse effects on our financial condition, results of operations, and cash flows in the near term. In response to the COVID-19 pandemic, in March 2021, Congress finalized the American Rescue Plan, a $1.9 trillion relief bill, which includes an additional $1,400 stimulus payment, $25 billion in rental assistance for low and moderate-income households who have lost jobs during the COVID-19 pandemic, and $5 billion to help struggling renters pay their utility bills. The plan will also continue to protect tenants from eviction through September 30, 2021. Since the outbreak, we have provided limited payment plans if certain criteria are met by residents. The duration of a payment plan is determined on a case by case basis, and ultimately the tenant is expected to make rent payments in full over time. The Company has not granted any direct rent reductions to residents as of March 31, 2021. The Company continues to closely monitor the impact of the COVID-19 pandemic on all aspects of our business.
Our Portfolio
Since our formation, we have significantly grown our portfolio of homes. When the Company began operations on November 1, 2018, the Initial Portfolio consisted of 4,129 homes located in Ohio, Kentucky and Indiana. As of March 31, 2021 and 2020, the Company, through the Operating Partnership’s SPEs, indirectly owned an interest in 13,693 and 7,431 homes, respectively in 16 and 14 states, respectively. As of March 31, 2021 and 2020, the Portfolio had occupancy of 87.0% and 77.4%, respectively, and the weighted average monthly effective rent of $1,039 and $940, respectively per occupied home. As of March 31, 2021 and 2020, the occupancy of stabilized homes in our Portfolio was 97.5% and 94.7%, respectively, and the weighted average effective rent of occupied homes was $1,001 and $958, respectively. As of March 31, 2021 and 2020, 53.3% and 38.0%, respectively, of homes in our Portfolio were excluded from being stabilized under the NRHC definition either because the homes were in rehabilitation or were purchased with tenants in place.
As of December 31, 2020, the Company, through the Operating Partnership’s SPEs, indirectly owned an interest in 9,282 homes in 10 states. As of December 31, 2019, the Company, through the Operating Partnership’s SPEs, indirectly owned an interest in 6,910 homes. As of December 31, 2020 and 2019, the Portfolio had occupancy of 83.7% and 81.3% (excluding third-party managed units), respectively, and the weighted average monthly effective rent of $969 and $936 (excluding third-party managed units), respectively. As of December 31, 2020 and 2019, the occupancy of stabilized homes in our Portfolio was 96.5% and 94.0%, respectively, and the weighted average effective rent of stabilized occupied homes was $989 and $952, respectively. As of December 31, 2020 and 2019, 36.6% and 37.2%, respectively, of homes in our Portfolio were excluded from being “stabilized homes” either because the homes were in rehabilitation or were purchased with tenants in place.
Components of Revenues and Expenses
The following is a description of the components of our revenues and expenses.
Revenues
Rental Income. Our revenues are derived primarily from rental revenue, net of any concessions and uncollectible amounts, collected from residents of our single-family homes under lease agreements which typically have a term of one year. Also included are utility reimbursements, late fees, pet fees, and other rental fees charged to tenants.
Other income. Other income includes ancillary income earned from tenants such as non-refundable fees, application fees, move-out fees, and other miscellaneous fees charged to tenants.
Expenses
Property operating expenses. Property operating expenses include property maintenance costs, turn costs, salary and employee benefit costs, utilities and other property operating costs.
Real estate taxes and insurance. Real estate taxes include the property taxes assessed by local and state authorities depending on the location of each home. Insurance includes the cost of property, general liability, and other needed insurance for each property.
52
Property management fees. Property management fees include fees paid to the Manager for managing each property (see Note 11 to our consolidated financial statements).
Advisory fees. Advisory fees include the fees paid to our Adviser pursuant to the Advisory Agreement (see Note 11 to our consolidated financial statements).
Corporate general and administrative expenses. Corporate general and administrative expenses include, but are not limited to, audit fees, legal fees, tax preparation fees, board of director fees, equity-based compensation expense, investor relations costs and corporate payroll.
Property general and administrative expenses. Property general and administrative expenses include the costs of marketing, professional fees, legal fees, general office supplies, and other administrative related costs.
Depreciation and amortization. Depreciation and amortization costs primarily include depreciation of our homes and amortization of acquired in-place leases, recognized over their respective useful lives.
Interest expense. Interest expense primarily includes the cost of interest expense on debt, payments and receipts related to our interest rate swap agreements and the amortization of deferred financing costs.
Loss on sales of real estate. Loss on sales of real estate includes the loss recognized upon sales of homes. Loss on sales of real estate is calculated by deducting the carrying value of the real estate and costs incurred to sell the properties from the sales prices of the homes.
Casualty gain/(loss). Casualty gain/(loss) includes the gain or loss incurred on homes, net of insurance proceeds received, that experience an unexpected and unusual event such as a natural disaster or fire.
Results of Operations for the Three Months Ended March 31, 2021 and 2020
The three months ended March 31, 2021 compared to the three months ended March 31, 2020
The following table sets forth a summary of our operating results for the three months ended March 31, 2021 and 2020 (in thousands):
| For the Three Months Ended March 31, | ||||||||||||
| 2021 | 2020 | $ Change | ||||||||||
Total revenues | $ | 30,628 | $ | 17,103 | $ | 13,525 | ||||||
Total expenses | (30,685 | ) | (17,632 | ) | (13,053 | ) | ||||||
|
|
|
|
|
| |||||||
Loss on sales of real estate | (75 | ) | (26 | ) | (49 | ) | ||||||
Operating loss | (57 | ) | (529 | ) | 472 | |||||||
Casualty loss, net of insurance proceeds | (9 | ) | — | (9 | ) | |||||||
|
|
|
|
|
| |||||||
Net loss | (141 | ) | (555 | ) | 414 | |||||||
Dividends on and accretion to redemption value of Redeemable Series A preferred stock | 2,206 | — | 2,206 | |||||||||
Net loss attributable to redeemable noncontrolling interests in the OP | (35 | ) | (190 | ) | 155 | |||||||
|
|
|
|
|
| |||||||
Net loss attributable to common stockholders | $ | (2,312 | ) | $ | (365 | ) | $ | (1,947 | ) | |||
|
|
|
|
|
| |||||||
The change in our net loss between the periods primarily relates to increases in total property operating expenses of $6.0 million, depreciation and amortization expense of $3.1 million, advisory fees of $0.6 million, corporate general and administrative expenses of $1.0 million, and interest expense of $2.4 million, partially offset by an increase in rental income of $13.4 million.
Revenues
Rental income. Rental income was $30.1 million for the three months ended March 31, 2021 compared to $16.7 million for the three months ended March 31, 2020, which was an increase of $13.4 million. The increase between the periods was primarily due to our acquisition activity and increases in rental rates in 2021.
Other income. Other income was $0.5 million for the three months ended March 31, 2021 compared to $0.4 million for the three months ended March 31, 2020. The increase between the periods was primarily due to our acquisition activity in 2021.
Expenses
Property operating expenses. Property operating expenses were $5.2 million for the three months ended March 31, 2021 compared to $3.4 million for the three months ended March 31, 2020, which was an increase of $1.8 million. The increase between the periods was primarily due to our acquisition activity in 2021.
Real estate taxes and insurance. Real estate taxes and insurance were $6.3 million for the three months ended March 31, 2021 compared to $3.1 million for the three months ended March 31, 2020, which was an increase of $3.2 million. The increase between the periods was primarily due to our acquisition activity in 2021 as well as increases in our real estate taxes as a result of increases in property valuations.
Property management fees. Property management fees were $2.0 million for the three months ended March 31, 2021 compared to $1.4 million for the three months ended March 31, 2020, which was an increase of $0.6 million. The increase between the periods was primarily due to our acquisition activity and increases in rental rates in 2021.
Advisory fees. Advisory fees were $1.3 million for the three months ended March 31, 2021 compared to $0.7 million for the three months ended March 31, 2020, which was an increase of $0.6 million. The increase between the periods was primarily due to our equity raising activity in 2021 and increases in total debt principal outstanding.
Corporate general and administrative expenses. Corporate general and administrative expenses were $1.5 million for the three months ended March 31, 2021 compared to $0.5 million for the three months ended March 31, 2020, which was an increase of $1.0 million. The increase between the periods was primarily due to increases in equity-based compensation expense and other corporate expenses as our operations continued to gain scale.
Property general and administrative expenses. Property general and administrative expenses were $1.3 million for the three months ended March 31, 2021 compared to $0.8 million for the three months ended March 31, 2020, which was an increase of $0.5 million. The increase between the periods was primarily due to our acquisition activity in 2021.
Depreciation and amortization. Depreciation and amortization costs were $8.0 million for the three months ended March 31, 2021 compared to $4.9 million for the three months ended March 31, 2020, which was an increase of $3.1 million. The increase between the periods was primarily due to our acquisition activity in 2021.
Interest expense. Interest expense was $5.1 million for the three months ended March 31, 2021 compared to $2.7 million for the three months ended March 31, 2020, which was an increase of $2.4 million. The increase between the periods was primarily due to an increase on interest on debt, as we increased our total debt principal outstanding during 2021. The following table details the various costs included in interest expense for the three months ended March 31, 2021 and 2020 (in thousands):
| For the Three Months Ended March 31, | ||||||||||||
| 2021 | 2020 | $ Change | ||||||||||
Interest on debt | $ | 4,595 | $ | 2,547 | $ | 2,048 | ||||||
Amortization of deferred financing costs | 531 | 167 | 364 | |||||||||
|
|
|
|
|
| |||||||
Total | $ | 5,126 | $ | 2,714 | $ | 2,412 | ||||||
|
|
|
|
|
| |||||||
Loss on sales of real estate. Loss on sales of real estate was $0.1 million for the three months ended March 31, 2021 compared to less than $0.1 million for the three months ended March 31, 2020, which was an increase of approximately less than $0.1 million. During the three months ended March 31, 2021, we sold 4 homes; during the three months ended March 31, 2020, we sold 9 homes. The homes sold were generally not part of the Company’s expansion strategy but were acquired as part of larger portfolio transactions. The homes sold were immediately categorized as held for sale upon acquisition and were subsequently sold.
Casualty loss, net of insurance proceeds. Casualty loss, net of insurance proceeds, was less than $0.1 million for the three months ended March 31, 2021. No casualty gain or loss was recognized during the three months ended March 31, 2020.
Results of Operations for the Years Ended December 31, 2020 and 2019
The year ended December 31, 2020 compared to the year ended December 31, 2019
The following table sets forth a summary of our operating results for the years ended December 31, 2020 and 2019 (in thousands):
| For the Year Ended December 31, | ||||||||||||
| 2020 | 2019 | $ Change | ||||||||||
Total revenues | $ | 76,454 | $ | 52,324 | $ | 24,130 | ||||||
Total expenses | (77,470 | ) | (53,944 | ) | (23,526 | ) | ||||||
Loss on sales of real estate | (930 | ) | (44 | ) | (886 | ) | ||||||
|
|
|
|
|
| |||||||
Operating loss | (1,946 | ) | (1,664 | ) | (282 | ) | ||||||
Casualty gain, net of insurance proceeds | 281 | 22 | 259 | |||||||||
|
|
|
|
|
| |||||||
Net loss | (1,665 | ) | (1,642 | ) | (23 | ) | ||||||
Dividends on and accretion to redemption value of Redeemable Series A preferred stock | 1,052 | — | 1,052 | |||||||||
Net loss attributable to redeemable noncontrolling interests in the Operating Partnership | (570 | ) | (967 | ) | 397 | |||||||
|
|
|
|
|
| |||||||
Net loss attributable to common stockholders | $ | (2,147 | ) | $ | (675 | ) | $ | (1,472 | ) | |||
|
|
|
|
|
| |||||||
53
The change in our net loss between the periods primarily relates to increases in total property operating expenses of $13.6 million, depreciation and amortization expense of $4.4 million, corporate general and administrative expenses of $2.9 million, advisory fees of $1.6 million, interest expense of $1.1 million, partially offset by increases in rental income of $23.9 million.
Revenues
Rental income. Rental income was $74.9 million for the year ended December 31, 2020 compared to $51.0 million for the year ended December 31, 2019, which was an increase of $23.9 million. The increase between the periods was primarily due to our acquisition activity and increases in rental rates and occupancy levels in 2020.
Other income. Other income was $1.6 million for the year ended December 31, 2020 compared to $1.4 million for the year ended December 31, 2019, which was an increase of $0.2 million. The increase between the periods was primarily due to our acquisition activity in 2020, which was partially offset by decreases in certain other income items as a result of the impact of COVID-19 such as move-out charges.
Expenses
Property operating expenses. Property operating expenses were $15.7 million for the year ended December 31, 2020 compared to $10.7 million for the year ended December 31, 2019, which was an increase of $5.0 million. The increase between the periods was primarily due to our acquisition activity in 2020.
Real estate taxes and insurance. Real estate taxes and insurance were $15.4 million for the year ended December 31, 2020 compared to $9.4 million for the year ended December 31, 2019, which was an increase of $6.0 million. The increase between the periods was primarily due to our acquisition activity in 2020 as well as increases in our real estate taxes as a result of increases in property valuations.
Property management fees. Property management fees were $4.6 million for the year ended December 31, 2020 compared to $3.2 million for the year ended December 31, 2019, which was an increase of $1.4 million. The increase between the periods was primarily due to our acquisition activity and increases in rental rates and occupancy levels in 2020.
Advisory fees. Advisory fees were $3.3 million for the year ended December 31, 2020 compared to $1.7 million for the year ended December 31, 2019, which was an increase of $1.6 million. The increase between the periods was primarily due to our equity raising activity in 2020 and increases in total debt principal outstanding.
Corporate general and administrative expenses. Corporate general and administrative expenses were $4.3 million for the year ended December 31, 2020 compared to $1.4 million for the year ended December 31, 2019, which was an increase of $2.9 million. The increase between the periods was primarily due to increases in equity-based compensation expense and other corporate expenses as our operations gained scale.
Property general and administrative expenses. Property general and administrative expenses were $2.8 million for the year ended December 31, 2020 compared to $1.6 million for the year ended December 31, 2019, which was an increase of $1.2 million. The increase between the periods was primarily due to our acquisition activity in 2020.
54
Depreciation and amortization. Depreciation and amortization costs were $20.4 million for the year ended December 31, 2020 compared to $16.1 million for the year ended December 31, 2019, which was an increase of $4.3 million. The increase between the periods was primarily due to our acquisition activity in 2020.
Interest expense. Interest expense was $10.9 million for the year ended December 31, 2020 compared to $9.8 million for the year ended December 31, 2019, which was an increase of $1.1 million. The increase between the periods was primarily due to an increase on interest on debt, as we increased our total debt principal outstanding during 2020, which was partially offset by a decrease in LIBOR. The following table details the various costs included in interest expense for the years ended December 31, 2020 and 2019 (in thousands):
| For the Year Ended December 31, | ||||||||||||
| 2020 | 2019 | $ Change | ||||||||||
Interest on debt | $ | 7,470 | $ | 9,866 | $ | (2,396 | ) | |||||
Interest rate swap expense | 2,714 | (450 | ) | 3,164 | ||||||||
Amortization of deferred financing costs | 717 | 397 | 320 | |||||||||
|
|
|
|
|
| |||||||
Total | $ | 10,901 | $ | 9,813 | $ | 1,088 | ||||||
|
|
|
|
|
| |||||||
Loss on sales of real estate. Loss on sales of real estate was $0.9 million for the year ended December 31, 2020 compared to less than $0.1 million for the year ended December 31, 2019, which was an increase of approximately $0.9 million. During the year ended December 31, 2020, we sold 69 homes and during the year ended December 31, 2019, we sold 13 homes. The homes sold were generally not part of the Company’s expansion strategy but were acquired as part of larger portfolio transactions. They were immediately categorized as held for sale and were subsequently sold.
Casualty gain, net of insurance proceeds. Casualty gain, net of insurance proceeds, was $0.3 million for the year ended December 31, 2020 compared to less than $0.1 million for the year ended December 31, 2019, which was an increase of $0.3 million. The increase between the periods was primarily due to an increase in homes affected by fires which resulted in increased insurance proceeds.
Non-GAAP Measurements
Net Operating Income
NOI is a non-GAAP financial measure of performance. NOI is used by our management to evaluate and compare the performance of our properties to other comparable properties, to determine trends in earnings and to compute the fair value of our properties as NOI is not affected by (1) the cost of funds, (2) acquisition costs, (3) advisory fees, (4) the impact of depreciation and amortization expenses, (5) gains or losses from the sale of operating real estate assets that are included in net income computed in accordance with GAAP, (6) corporate general and administrative expenses, (8) casualty gains or losses and (9) other gains and losses that are specific to us.
The cost of funds is eliminated from net income (loss) because it is specific to our particular financing capabilities and constraints. The cost of funds is also eliminated because it is dependent on historical interest rates and other costs of capital as well as past decisions made by us regarding the appropriate mix of capital, or in the case of assumed debt, decisions made by others, which may have changed or may change in the future. Acquisition costs and advisory fees are eliminated because they do not reflect continuing operating costs of the property owner. Depreciation and amortization expenses as well as gains or losses from the sale of operating real estate assets are eliminated because they may not accurately represent the actual change in value in our homes that result from use of the properties or changes in market conditions. While certain aspects of real property do decline in value over time in a
55
manner that is reasonably captured by depreciation and amortization, the value of the properties as a whole have historically increased or decreased as a result of changes in overall economic conditions instead of from actual use of the property or the passage of time. Gains and losses from the sale of real property vary from property to property and are affected by market conditions at the time of sale, which will usually change from period to period. Corporate general and administrative are eliminated because they do not reflect the ongoing operating activity performed at the properties. Casualty gains or losses are excluded because of the infrequent and unusual nature of the sustained damages, they do not reflect continuing operating costs of the property owner and typically the economic impact, aside from deductible or risk retention, is covered by insurance. These gains and losses can create distortions when comparing one period to another or when comparing our operating results to the operating results of other real estate companies that have not made similarly timed purchases or sales. We believe that eliminating these items from net income is useful because the resulting measure captures the actual ongoing revenue generated and actual expenses incurred in operating our properties as well as trends in occupancy rates, rental rates and operating costs.
However, the usefulness of NOI is limited because it excludes corporate general and administrative expenses, interest expense, acquisition costs, casualty gains or losses, advisory fees, depreciation and amortization expense, gains or losses from the sale of properties, and other gains and losses as determined under GAAP, and the level of capital expenditures and leasing costs necessary to maintain the operating performance of our properties, all of which are significant economic costs. NOI may fail to capture significant trends in these components of net income, which further limits its usefulness.
NOI is a measure of the operating performance of our properties but does not measure our performance as a whole. NOI is therefore not a substitute for net income (loss) as computed in accordance with GAAP. This measure should be analyzed in conjunction with net income (loss) computed in accordance with GAAP and discussions elsewhere regarding the components of net income (loss) that are eliminated in the calculation of NOI. Other companies may use different methods for calculating NOI or similarly entitled measures and, accordingly, our NOI may not be comparable to similarly entitled measures reported by other companies that do not define the measure exactly as we do.
The following table, which has not been adjusted for the effects of noncontrolling interests, reconciles our NOI for the three months ended March 31, 2021 and 2020 and for the years ended December 31, 2020 and 2019 to net loss, the most directly comparable GAAP financial measure (in thousands):
| For the Three Months Ended March 31, | For the Year Ended December 31, | |||||||||||||||
| 2021 | 2020 | 2020 | 2019 | |||||||||||||
Net loss | $ | (141 | ) | $ | (555 | ) | $ | (1,665 | ) | $ | (1,642 | ) | ||||
Adjustments to reconcile net loss to NOI: | ||||||||||||||||
Advisory fees | 1,291 | 713 | 3,271 | 1,710 | ||||||||||||
Corporate general and administrative expenses | 1,481 | 498 | 4,313 | 1,414 | ||||||||||||
Depreciation and amortization | 8,044 | 4,922 | 20,447 | 16,081 | ||||||||||||
Interest expense | 5,126 | 2,714 | 10,901 | 9,813 | ||||||||||||
Loss on sales of real estate | 75 | 26 | 930 | 44 | ||||||||||||
Casualty loss (gain), net of insurance proceeds | 9 | — | (281 | ) | (22 | ) | ||||||||||
|
|
|
|
|
|
|
| |||||||||
NOI | $ | 15,885 | $ | 8,318 | $ | 37,916 | $ | 27,398 | ||||||||
|
|
|
|
|
|
|
| |||||||||
56
Net Operating Income for Our Same Home and Non-Same Home Properties for the Three Months Ended March 31, 2021 and 2020
There are 4,163 homes in our same home pool for the three months ended March 31, 2021 and 2020 (our “Q1 Same Home” properties). To be included as a “Same Home,” homes must have been stabilized for at least 90 days in advance of the first day of the previous period and be held constant for the entirety of the comparable reporting period. For example, Same Home properties for the period ended March 31, 2021 and March 31, 2020 were stabilized by October 1, 2019 and held through March 31, 2021. Same Home properties do not include homes held for sale or in rehabilitation. Homes that are stabilized are included as Same Home properties, whether occupied or vacant. See Item 1 “Business—Our Portfolio” for a discussion of homes included in “stabilized”. We view Same Home NOI as an important measure of the operating performance of our homes because it allows us to compare operating results of homes owned for the entirety of the current and comparable periods and therefore eliminated variations caused by acquisitions or dispositions during the periods.
The following table reflects the revenues, property operating expenses and NOI for the three months ended March 31, 2021 and 2020 for our Q1 Same Home and Non-Same Home properties (dollars in thousands):
| For the Three Months Ended March 31, | ||||||||||||||||
| 2021 | 2020 | $ Change | % Change | |||||||||||||
Revenues | ||||||||||||||||
Same Home | ||||||||||||||||
Rental income | $ | 12,522 | $ | 11,648 | $ | 874 | 7.5 | % | ||||||||
Other income | 212 | 296 | (84 | ) | -28.4 | % | ||||||||||
|
|
|
|
|
|
|
| |||||||||
Same Home revenues | 12,734 | 11,944 | 790 | 6.6 | % | |||||||||||
Non-Same Home | ||||||||||||||||
Rental income | 17,614 | 5,054 | 12,560 | 248.5 | % | |||||||||||
Other income | 280 | 105 | 175 | 166.7 | % | |||||||||||
|
|
|
|
|
|
|
| |||||||||
Non-Same Home revenues | 17,894 | 5,159 | 12,735 | 246.9 | % | |||||||||||
|
|
|
|
|
|
|
| |||||||||
Total revenues | 30,628 | 17,103 | 13,525 | 79.1 | % | |||||||||||
|
|
|
|
|
|
|
| |||||||||
Operating expenses | ||||||||||||||||
Same Home | ||||||||||||||||
Property operating expenses | 1,669 | 1,929 | (260 | ) | -13.5 | % | ||||||||||
Real estate taxes and insurance | 2,491 | 1,913 | 578 | 30.2 | % | |||||||||||
Property management fees (1) | 853 | 756 | 97 | 12.8 | % | |||||||||||
Property general and administrative expenses | 13 | 15 | (2 | ) | -13.3 | % | ||||||||||
|
|
|
|
|
|
|
| |||||||||
Same Home operating expenses | 5,026 | 4,613 | 413 | 9.0 | % | |||||||||||
Non-Same Home | ||||||||||||||||
Property operating expenses | 3,484 | 1,518 | 1,966 | 129.5 | % | |||||||||||
Real estate taxes and insurance | 3,803 | 1,218 | 2,585 | 212.2 | % | |||||||||||
Property management fees (1) | 1,120 | 606 | 514 | 84.8 | % | |||||||||||
Property general and administrative expenses | 1,310 | 830 | 480 | 57.8 | % | |||||||||||
|
|
|
|
|
|
|
| |||||||||
Non-Same Home operating expenses | 9,717 | 4,172 | 5,545 | 132.9 | % | |||||||||||
|
|
|
|
|
|
|
| |||||||||
Total operating expenses | 14,743 | 8,785 | 5,958 | 67.8 | % | |||||||||||
|
|
|
|
|
|
|
| |||||||||
NOI | ||||||||||||||||
Same Home | 7,708 | 7,331 | 377 | 5.1 | % | |||||||||||
Non-Same Home | 8,177 | 987 | 7,190 | 728.5 | % | |||||||||||
|
|
|
|
|
|
|
| |||||||||
Total NOI | $ | 15,885 | $ | 8,318 | $ | 7,567 | 91.0 | % | ||||||||
|
|
|
|
|
|
|
| |||||||||
| (1) | Fees incurred to the Manager. |
See reconciliation of net income (loss) to NOI above under “—Net Operating Income.”
Same Home Results of Operations for the Three Months Ended March 31, 2021 and 2020
As of March 31, 2021, our Q1 Same Home properties were approximately 98.0% occupied with a weighted average monthly effective rent per occupied home of $1,004. As of March 31, 2020, our Q1 Same Home properties were approximately 95.4% occupied with a weighted average monthly effective rent per occupied home of $961. For our Q1 Same Home properties, we recorded the following operating results for the three months ended March 31, 2021 as compared to the three months ended March 31, 2020:
Revenues
Rental income. Rental income was $12.5 million for the three months ended March 31, 2021 compared to $11.6 million for the three months ended March 31, 2020, which was an increase of approximately $0.9 million, or 7.5%. The increase is related to a 4.5% increase in the weighted average monthly effective rent per occupied apartment unit and a 2.6% increase in occupancy.
Other income. Other income was $0.2 million for the three months ended March 31, 2021 compared to $0.3 million for the three months ended March 31, 2020, which was a decrease of approximately $0.1 million, or 28.4%. The majority of the decrease is related to a $0.1 million, or 29.3%, decrease in move-out charges.
Expenses
Property operating expenses. Property operating expenses were $1.7 million for the three months ended March 31, 2021 compared to $1.9 million for the three months ended March 31, 2020, which was a decrease of approximately $0.2 million, or 13.5%. The majority of the decrease is related to a $0.2 million, or 25.3%, decrease in payroll costs.
Real estate taxes and insurance. Real estate taxes and insurance costs were $2.5 million for the three months ended March 31, 2021 compared to $1.9 million for the three months ended March 31, 2020, which was an increase of approximately $0.6 million, or 30.2%. The majority of the increase is related to a $0.4 million, or 24.6%, increase in property taxes.
Property management fees. Property management fees were $0.9 million for the three months ended March 31, 2021 compared to $0.8 million for the three months ended March 31, 2020, which was an increase of approximately $0.1 million, or 12.8%.
Property general and administrative expenses. Property general and administrative expenses remained flat at less than $0.1 million for the three months ended March 31, 2021 compared to less than $0.1 million for the three months ended March 31, 2020.
Net Operating Income for Our Same Home Properties and Non-Same Home Properties for the Years Ended December 31, 2020 and 2019
There are 3,759 homes in our same home pool for the years ended December 31, 2020 and 2019 (our “Same Home” properties). See “—Net Operating Income for Our Same Home and Non-Same and Non-Same Home Properties for the Three Months Ended March 31, 2021 and 2020” for a discussion of homes included in “same home”. The following table reflects the revenues, property operating expenses and NOI for the years ended December 31, 2020 and 2019 for our Same Home and Non-Same Home properties (dollars in thousands):
| For the Year Ended December 31, | ||||||||||||||||
| 2020 | 2019 | $ Change | % Change | |||||||||||||
Revenues | ||||||||||||||||
Same Home | ||||||||||||||||
Rental income | $ | 43,009 | $ | 40,792 | $ | 2,217 | 5.4 | % | ||||||||
Other income | 1,124 | 1,269 | (145 | ) | -11.4 | % | ||||||||||
|
|
|
|
|
|
|
| |||||||||
Same Home revenues | 44,133 | 42,061 | 2,072 | 4.9 | % | |||||||||||
Non-Same Home | ||||||||||||||||
Rental income | 31,856 | 10,179 | 21,677 | 213.0 | % | |||||||||||
Other income | 465 | 84 | 381 | 453.6 | % | |||||||||||
|
|
|
|
|
|
|
| |||||||||
Non-Same Home revenues | 32,321 | 10,263 | 22,058 | 214.9 | % | |||||||||||
|
|
|
|
|
|
|
| |||||||||
Total revenues | 76,454 | 52,324 | 24,130 | 46.1 | % | |||||||||||
|
|
|
|
|
|
|
| |||||||||
Operating expenses | ||||||||||||||||
Same Home | ||||||||||||||||
Property operating expenses | 7,288 | 7,794 | (506 | ) | -6.5 | % | ||||||||||
Real estate taxes and insurance | 8,094 | 7,110 | 984 | 13.8 | % | |||||||||||
Property management fees (1) | 2,827 | 2,764 | 63 | 2.3 | % | |||||||||||
Property general and administrative expenses | 50 | 53 | (3 | ) | -5.7 | % | ||||||||||
|
|
|
|
|
|
|
| |||||||||
Same Home operating expenses | 18,259 | 17,721 | 538 | 3.0 | % | |||||||||||
Non-Same Home | ||||||||||||||||
Property operating expenses | 8,715 | 2,940 | 5,494 | 186.9 | % | |||||||||||
Real estate taxes and insurance | 7,313 | 2,259 | 5,054 | 223.7 | % | |||||||||||
Property management fees (1) | 1,784 | 426 | 1,358 | 318.8 | % | |||||||||||
Property general and administrative expenses | 2,467 | 1,580 | 1,168 | 73.9 | % | |||||||||||
|
|
|
|
|
|
|
| |||||||||
Non-Same Home operating expenses | 20,279 | 7,205 | 13,074 | 181.5 | % | |||||||||||
|
|
|
|
|
|
|
| |||||||||
Total operating expenses | 38,538 | 24,926 | 13,612 | 54.6 | % | |||||||||||
|
|
|
|
|
|
|
| |||||||||
NOI | ||||||||||||||||
Same Home | 25,874 | 24,340 | 1,534 | 6.3 | % | |||||||||||
Non-Same Home | 12,042 | 3,058 | 8,984 | 293.8 | % | |||||||||||
|
|
|
|
|
|
|
| |||||||||
Total NOI | $ | 37,916 | $ | 27,398 | $ | 10,518 | 38.4 | % | ||||||||
|
|
|
|
|
|
|
| |||||||||
| (1) | Fees incurred to Manager. |
See reconciliation of net income (loss) to NOI above under “—Net Operating Income.”
57
Same Home Results of Operations for the Years Ended December 31, 2020 and 2019
As of December 31, 2020, our Same Home properties were approximately 98.2% leased with a weighted average monthly effective rent per occupied home of $1,007. As of December 31, 2019, our Same Home properties were approximately 95.2% leased with a weighted average monthly effective rent per occupied home of $967. For our Same Home properties, we recorded the following operating results for the year ended December 31, 2020 as compared to the year ended December 31, 2019:
Revenues
Rental income. Rental income was $43.0 million for the year ended December 31, 2020 compared to $40.8 million for the year ended December 31, 2019, which was an increase of approximately $2.2 million, or 5.4%. The increase is related to a 4.1% increase in the weighted average monthly effective rent per occupied home and a 3.0% increase in occupancy.
Other income. Other income was $1.1 million for the year ended December 31, 2020 compared to $1.3 million for the year ended December 31, 2019, which was a decrease of approximately $0.2 million, or 11.4%. The majority of the decrease is related to a $0.2 million, or 16.1%, decrease in move-out charges.
Expenses
Property operating expenses. Property operating expenses were $7.3 million for the year ended December 31, 2020 compared to $7.8 million for the year ended December 31, 2019, which was a decrease of approximately $0.5 million, or 6.5%. The majority of the decrease is related to a $0.6 million, or 13.1%, decrease in repairs and maintenance costs.
Real estate taxes and insurance. Real estate taxes and insurance costs were $8.1 million for the year ended December 31, 2020 compared to $7.1 million for the year ended December 31, 2019, which was an increase of approximately $1.0 million, or 13.8%. The majority of the increase is related to a $0.6 million, or 9.0%, increase in property taxes as a result of appreciation in property values of our homes and a $0.4 million, or 59.5% increase in insurance costs.
Property management fees. Property management fees remained flat at $2.8 million for the year ended December 31, 2020 compared to $2.8 million for the year ended December 31, 2019.
Property general and administrative expenses. Property general and administrative expenses remained flat at $0.1 million for the year ended December 31, 2020 compared to $0.1 million for the year ended December 31, 2019.
58
FFO, Core FFO and AFFO
We believe that net income (loss), as defined by GAAP, is the most appropriate earnings measure. We also believe that funds from operations (“FFO”) as defined by the National Association of Real Estate Investments Trusts (“NAREIT”), core funds from operations (“Core FFO”) and adjusted funds from operations (“AFFO”) are important non-GAAP supplemental measures of operating performance for a REIT.
Since the historical cost accounting convention used for real estate assets requires depreciation except on land, such accounting presentation implies that the value of real estate assets diminishes predictably over time. However, since real estate values have historically risen or fallen with market and other conditions, presentations of operating results for a REIT that use historical cost accounting for depreciation could be less informative. Thus, NAREIT created FFO as a supplemental measure of operating performance for REITs that excludes historical cost deprecation and amortization, among other items, from net income (loss), as defined by GAAP. FFO is defined by NAREIT as net income (loss) computed in accordance with GAAP, excluding gains or losses from real estate dispositions, plus real estate depreciation and amortization. We compute FFO in accordance with NAREIT’s definition. Our presentation differs slightly in that we begin with net income (loss) attributable to common stockholders and net income (loss) attributable to NCI of the OP and then make the adjustments to arrive at FFO.
Core FFO makes certain adjustments to FFO, which are either not likely to occur on a regular basis or are otherwise not representative of the ongoing operating performance of our portfolio. Core FFO adjusts FFO to remove items such as casualty gains or losses, the amortization of deferred financing costs and equity-based compensation expense. We believe Core FFO is useful as a supplemental gauge of our operating performance and is useful in comparing our operating performance with other REITs that are not as involved in the aforementioned activities.
AFFO makes certain adjustments to Core FFO in order to arrive at a more refined measure of the operating performance of our Portfolio. There is no industry standard definition of AFFO and the method of calculating AFFO is divergent across the industry. AFFO adjusts Core FFO to remove recurring capital expenditures. We believe AFFO is useful as a supplemental gauge of our operating performance and is useful in comparing our operating performance with other REITs that are not as involved in the aforementioned activities.
Basic and diluted weighted average shares in our FFO table includes both our common stock and OP units.
We believe that the use of FFO, Core FFO and AFFO, combined with the required GAAP presentations, improves the understanding of operating results of REITs and makes comparisons of operating results among such companies more meaningful. While FFO, Core FFO and AFFO are relevant and widely used measures of operating performance of REITs, they do not represent cash flows from operations or net income (loss) as defined by GAAP and should not be considered as an alternative or substitute to those measures in evaluating our liquidity or operating performance. FFO, Core FFO and AFFO do not purport to be indicative of cash available to fund our future cash requirements. Further, our computation of FFO, Core FFO and AFFO may not be comparable to FFO, Core FFO and AFFO reported by other REITs.
59
The three months ended March 31, 2021 as compared to the three months ended March 31, 2020
The following table reconciles our calculations of FFO, Core FFO and AFFO to net income (loss), the most directly comparable GAAP financial measure, for the three month periods ended March 31, 2021 and 2020 (in thousands, except per share amounts):
| For the Three Months Ended March 31, | ||||||||
| 2021 | 2020 | |||||||
Net loss attributable to common stockholders | $ | (2,312 | ) | $ | (365 | ) | ||
Net loss attributable to NCI of the OP | (35 | ) | (190 | ) | ||||
Depreciation and amortization | 8,044 | 4,922 | ||||||
Loss on sales of real estate | 75 | 26 | ||||||
|
|
|
| |||||
FFO | 5,772 | 4,393 | ||||||
|
|
|
| |||||
FFO per share - basic | $ | 0.42 | $ | 0.49 | ||||
|
|
|
| |||||
FFO per share - diluted | $ | 0.40 | $ | 0.48 | ||||
|
|
|
| |||||
Casualty (gain)/loss, net of insurance proceeds | 9 | — | ||||||
Amortization of deferred financing costs | 531 | 167 | ||||||
Equity-based compensation expense | 930 | 383 | ||||||
|
|
|
| |||||
Core FFO | 7,242 | 4,943 | ||||||
|
|
|
| |||||
Core FFO per share - basic | $ | 0.52 | $ | 0.55 | ||||
|
|
|
| |||||
Core FFO per share - diluted | $ | 0.51 | $ | 0.54 | ||||
|
|
|
| |||||
Recurring capital expenditures | (797 | ) | (1,037 | ) | ||||
|
|
|
| |||||
AFFO | 6,445 | 3,906 | ||||||
|
|
|
| |||||
AFFO per share - basic | $ | 0.46 | $ | 0.44 | ||||
|
|
|
| |||||
AFFO per share - diluted | $ | 0.45 | $ | 0.43 | ||||
|
|
|
| |||||
Weighted average shares outstanding - basic | 13,904 | 8,971 | ||||||
|
|
|
| |||||
Weighted average shares outstanding - diluted | 14,305 | 9,165 | ||||||
|
|
|
| |||||
Dividends declared per share | $ | 0.5301 | $ | 0.5301 | ||||
FFO Coverage - diluted(1) | 0.76x | 0.90x | ||||||
Core FFO Coverage - diluted(1) | 0.96x | 1.02x | ||||||
AFFO Coverage - diluted(1) | 0.85x | 0.80x | ||||||
| (1) | Indicates coverage ratio of FFO/Core FFO/AFFO per common share (diluted) over dividends declared per common share during the period. |
FFO was $5.8 million for the three months ended March 31, 2021 compared to $4.4 million for the three months ended March 31, 2020, which was an increase of approximately $1.4 million. The change in our FFO between the periods primarily relates to an increase in rental income of $13.4 million, partially offset by total property operating expenses of $6.0 million, depreciation and amortization expense of $3.1 million, advisory fees of $0.6 million, corporate general and administrative expenses of $1.0 million and interest expense of $2.4 million.
Core FFO was $7.2 million for the three months ended March 31, 2021 compared to $4.9 million for the three months ended March 31, 2020, which was an increase of approximately $2.3 million. The change in our Core FFO between the periods primarily relates to an increase in FFO and increases in amortization of deferred financing costs of $0.3 million and equity-based compensation expense of $0.5 million.
AFFO was $6.4 million for the three months ended March 31, 2021 compared to $3.9 million for the three months ended March 31, 2020, which was an increase of approximately $2.5 million. The change in our AFFO between the periods primarily relates to increases in Core FFO and a decrease in recurring capital expenditures of $0.2 million.
The year ended December 31, 2020 as compared to the year ended December 31, 2019
The following table reconciles our calculations of FFO, Core FFO and AFFO to net income (loss), the most directly comparable GAAP financial measure, for the years ended December 31, 2020 and 2019 (in thousands, except per share amounts):
| For the Year Ended December 31, | ||||||||
| 2020 | 2019 | |||||||
Net loss attributable to common stockholders | $ | (2,147 | ) | $ | (675 | ) | ||
Net loss attributable to NCI of the OP | (570 | ) | (967 | ) | ||||
Depreciation and amortization | 20,447 | 16,081 | ||||||
Loss on sales of real estate | 930 | 44 | ||||||
|
|
|
| |||||
FFO | 18,660 | 14,483 | ||||||
|
|
|
| |||||
FFO per share - basic | $ | 1.79 | $ | 2.34 | ||||
|
|
|
| |||||
FFO per share - diluted | $ | 1.74 | $ | 2.32 | ||||
|
|
|
| |||||
Casualty gain, net of insurance proceeds | (281 | ) | (22 | ) | ||||
Amortization of deferred financing costs | 717 | 397 | ||||||
Equity-based compensation expense | 2,638 | 315 | ||||||
|
|
|
| |||||
Core FFO | 21,734 | 15,173 | ||||||
|
|
|
| |||||
Core FFO per share - basic | $ | 2.08 | $ | 2.45 | ||||
|
|
|
| |||||
Core FFO per share – diluted | $ | 2.02 | $ | 2.43 | ||||
|
|
|
| |||||
Recurring capital expenditures | (2,844 | ) | (2,312 | |||||
|
|
|
| |||||
AFFO | 18,890 | 12,861 | ||||||
|
|
|
| |||||
AFFO per share - basic | $ | 1.81 | $ | 2.08 | ||||
|
|
|
| |||||
AFFO per share – diluted | $ | 1.76 | $ | 2.06 | ||||
|
|
|
| |||||
Weighted average shares outstanding - basic | 10,424 | 6,182 | ||||||
|
|
|
| |||||
Weighted average shares outstanding – diluted | 10,744 | 6,243 | ||||||
|
|
|
| |||||
Dividends declared per share | $ | 2.1204 | $ | 2.1204 | ||||
FFO Coverage – diluted(1) | 0.82x | 1.09x | ||||||
Core FFO Coverage – diluted(1) | 0.95x | 1.15x | ||||||
AFFO Coverage – diluted(1) | 0.83x | 0.97x | ||||||
(1) Indicates coverage ratio of FFO/Core FFO/AFFO per common share (diluted) over dividends declared per common share during the period.
FFO was $18.7 million for the year ended December 31, 2020 compared to $14.5 million for the year ended December 31, 2019, which was an increase of approximately $4.2 million. The change in our FFO between the periods primarily relates to an increase in total revenues of $23.9 million, partially offset by an increase in total property operating expenses of $13.6 million, advisory fees of $1.6 million, corporate general and administrative expenses of $2.9 million and interest expense of $1.0 million.
60
Core FFO was $21.7 million for the year ended December 31, 2020 compared to $15.2 million for the year ended December 31, 2019, which was an increase of approximately $6.5 million. The change in our Core FFO between the periods primarily relates to an increase in FFO and an increase in equity-based compensation expense of $2.3 million.
AFFO was $18.9 million for the year ended December 31, 2020 compared to $12.9 million for the year ended December 31, 2019, which was an increase of approximately $6.0 million. The change in our AFFO between the periods primarily relates to increases in Core FFO and recurring capital expenditures of $0.5 million.
Liquidity and Capital Resources
Our short-term liquidity requirements consist primarily of funds necessary to pay for debt maturities, operating expenses and other expenditures directly associated with our homes, including:
| • | recurring maintenance necessary to maintain our homes; |
| • | interest expense and scheduled principal payments on outstanding indebtedness; |
| • | distributions necessary to qualify for taxation as a REIT; |
| • | advisory fees payable to our Adviser; |
| • | general and administrative expenses; |
| • | offering expenses related to raising equity from our Private Offering; |
| • | property management fees payable to the Manager. |
We expect to meet our short-term liquidity requirements generally through net cash provided by operations and existing cash balances. Additionally, as of March 31, 2021, we had significant access to credit through our credit facilities. The Warehouse Facility (as defined below) has an additional $150 million of capacity (based on total borrowings of $100 million as of March 31, 2021 and our ability to increase the total commitment to $250 million) and the JPM facility (as defined below) has an additional $180 million of capacity.
Our long-term liquidity requirements consist primarily of funds necessary to pay for the costs of acquiring additional homes, renovations and other capital expenditures to improve our homes and scheduled debt payments and distributions. We expect to meet our long-term liquidity requirements through various sources of capital, which will include equity issuances through the Private Offering, issuance of preferred equity, draws on our revolving credit facilities, existing working capital, net cash provided by operations, long-term mortgage indebtedness and may include other secured and unsecured borrowings. However, there are a number of factors that may have a material adverse effect on our ability to access these capital sources, including the state of overall equity and credit markets, our degree of leverage, our unencumbered asset base and borrowing restrictions imposed by lenders (including as a result of any failure to comply with financial covenants in our existing and future indebtedness), general market conditions for REITs, our operating performance and liquidity, market perceptions about us and restrictions on sales of properties under the Code. The success of our business strategy will depend, in part, on our ability to access these various capital sources.
61
Our homes will require periodic capital expenditures and renovation to remain competitive. Also, acquisitions of new homes will require significant capital outlays. Long-term, we may not be able to fund such capital improvements solely from net cash provided by operations because we must distribute annually at least 90% of our REIT taxable income, determined without regard to the deductions for dividends paid and excluding net capital gains, to qualify and maintain our qualification as a REIT, and we are subject to tax on any retained income and gains. As a result, our ability to fund capital expenditures and acquisitions through retained earnings long-term is limited. Consequently, we expect to rely heavily upon the availability of debt or equity capital for these purposes. If we are unable to obtain the necessary capital on favorable terms, or at all, our financial condition, liquidity, results of operations, and prospects could be materially and adversely affected.
We believe that our available cash, expected operating cash flows, and potential debt or equity financings will provide sufficient funds for our operations, acquisitions, anticipated scheduled debt service payments and dividend requirements for the twelve-month period following March 31, 2021.
Cash Flows
The three months ended March 31, 2021 as compared to the three months ended March 31, 2020
The following table presents selected data from our consolidated statements of cash flows for the three months ended March 31, 2021 and 2020 (in thousands):
| For the Three Months Ended March 31, | ||||||||
| 2021 | 2020 | |||||||
Net cash provided by operating activities | $ | 12,250 | $ | 5,793 | ||||
Net cash used in investing activities | (556,805 | ) | (41,521 | ) | ||||
Net cash provided by financing activities | 559,235 | 64,866 | ||||||
|
|
|
| |||||
Change in cash and restricted cash | 14,680 | 29,138 | ||||||
Cash and restricted cash, beginning of period | 37,096 | 17,830 | ||||||
|
|
|
| |||||
Cash and restricted cash, end of period | $ | 51,776 | $ | 46,968 | ||||
|
|
|
| |||||
Cash flows from operating activities. During the three months ended March 31, 2021, net cash provided by operating activities was $12.3 million compared to net cash provided by operating activities of $5.8 million for the three months ended March 31, 2020. The change in cash flows from operating activities was mainly due to an increase in total revenues, partially offset by an increase in total property operating expenses.
Cash flows from investing activities. During the three months ended March 31, 2021, net cash used in investing activities was $556.8 million compared to net cash used in investing activities of $41.5 million for the three months ended March 31, 2020. The change in cash flows from investing activities was mainly due to a significant increase in acquisitions and capital expenditures.
Cash flows from financing activities. During the three months ended March 31, 2021, net cash provided by financing activities was $559.2 million compared to net cash provided by financing activities of $64.9 million for the three months ended March 31, 2020. The change in cash flows from financing activities was mainly due to an increase in proceeds from notes payable and credit facilities, and partially due to an increase in proceeds from the issuance of our Shares and our Preferred Shares.
The year ended December 31, 2020 as compared to the year ended December 31, 2019
The following table presents selected data from our consolidated statements of cash flows for the years ended December 31, 2020 and 2019 (in thousands):
| For the Year Ended December 31, | ||||||||
| 2020 | 2019 | |||||||
Net cash provided by operating activities | 30,365 | 16,806 | ||||||
Net cash used in investing activities | (245,470 | ) | (185,542 | ) | ||||
Net cash provided by financing activities | 234,371 | 139,869 | ||||||
|
|
|
| |||||
Change in cash and restricted cash | 19,266 | (28,867 | ) | |||||
Cash and restricted cash, beginning of period | 17,830 | 46,697 | ||||||
|
|
|
| |||||
Cash and restricted cash, end of period | $ | 37,096 | $ | 17,830 | ||||
|
|
|
| |||||
Cash flows from operating activities. During the year ended December 31, 2020, net cash provided by operating activities was $30.4 million compared to net cash provided by operating activities of $16.8 million for the year ended December 31, 2019. The change in cash flows from operating activities was mainly due to an increase in total revenues, partially offset by an increase in total property operating expenses.
Cash flows from investing activities. During the year ended December 31, 2020, net cash used in investing activities was $245.5 million compared to net cash used in investing activities of $185.5 million for the year ended December 31, 2019. The change in cash flows from investing activities was mainly due to an increase in acquisitions and capital expenditures.
Cash flows from financing activities. During the year ended December 31, 2020, net cash provided by financing activities was $234.4 million compared to net cash provided by financing activities of $139.9 million for the year ended December 31, 2019. The change in cash flows from financing activities was mainly due to an increase in proceeds from the issuance of our Series A Preferred Stock, and partially due to an increase in proceeds from the issuance of our shares of common stock.
62
Debt, Derivatives and Hedging Activity
Debt
As of March 31, 2021, we and our subsidiaries had aggregate debt outstanding to third parties of approximately $808.6 million at a weighted average interest rate of 2.5800% and an adjusted weighted average interest rate of 3.1022%. For purposes of calculating the adjusted weighted average interest rate of our debt outstanding, we have included the weighted average fixed rate of 1.4309% for LIBOR based on our combined $320.0 million notional amount of interest rate swap agreements, which effectively fix the interest rate on $320.0 million of our floating rate debt. See Notes 5 and 6 to our consolidated financial statements for additional information.
The following table sets forth a summary of our mortgage loan indebtedness as of March 31, 2021:
| Type | Outstanding Principal as of March 31, 2021 | Interest Rate (1) | ||||||||||
Initial Mortgage | Floating | $ | 241,400 | 1.66 | % | |||||||
Warehouse Facility | Floating | 100,000 | 2.36 | % | ||||||||
JPM Facility | Floating | 320,000 | 2.86 | % | ||||||||
MetLife Note | Fixed | 125,000 | 3.25 | % | ||||||||
TrueLane Mortgage | Fixed | 10,526 | 5.35 | % | ||||||||
Colony Note | Fixed | 9,318 | 6.06 | % | ||||||||
CoreVest Note | Fixed | 2,364 | 6.12 | % | ||||||||
|
| |||||||||||
| $ | 808,608 | |||||||||||
Debt premium, net (2) | 563 | |||||||||||
Deferred financing costs, net of accumulated amortization of $1,794 | (9,942 | ) | ||||||||||
|
| |||||||||||
| $ | 799,229 | |||||||||||
|
| |||||||||||
| (1) | Represents the interest rate as of March 31, 2021. Except for fixed rate debt, the interest rate is one-month LIBOR plus an applicable margin. One-month LIBOR as of March 31, 2021 was 0.1111%. |
| (2) | The Company reflected valuation adjustments on its assumed fixed rate debt to adjust it to fair market value on the dates of acquisition for the difference between the fair value and the assumed principal amount of debt. The difference is amortized into interest expense over the remaining terms of the debt. |
On November 1, 2018, the Operating Partnership, as guarantor, and certain entities that acquired properties from our predecessor, as borrowers, entered into a $241.4 million Freddie Mac mortgage loan (the “Initial Mortgage”) with KeyBank. The Initial Mortgage is secured by certain properties that we acquired from our predecessor and equity pledges of the entities that own those properties and bears interest at a variable rate equal to LIBOR plus 1.55%. The Initial Mortgage is interest-only for the first 48 months of the term and principal amortizes at a rate of 30 years over the last 36 months of the term. The Initial Mortgage matures and is due in full on December 1, 2025.
On September 20, 2019, the Operating Partnership, as guarantor, and VB One, LLC, as borrower, entered into a credit facility (as amended from time to time, the “Warehouse Facility”) with KeyBank. The Warehouse Facility is secured by an equity pledge in certain assets of VB One, LLC and an equity pledge in the equity of VB One, LLC and bears interest at a variable rate equal to LIBOR plus 2.25%. The Warehouse Facility is a full-term, interest-only facility with an initial 36-month term, has one 12- month extension option, and the Company has the right to request an increase in the facility amount of up to $250.0 million. As of March 31, 2021, the commitment amount of the Warehouse Facility was $135.0 million.
63
On August 22, 2019, the Company, through the Operating Partnership, entered into an approximately $1.3 million subordinated convertible note (the “NREO Note”) with NREO, who is an affiliate of the Adviser. The NREO Note bears interest at a variable rate equal to LIBOR plus 2.25% and is full interest-only. The NREO Note is convertible at any time to equity at the election of the Company or upon its maturity on September 19, 2022. On January 26, 2021, the Company, through the Operating Partnership, paid down the principal of approximately $1.3 million and accrued interest of approximately $0.1 million on the NREO Note. This extinguished the NREO Note.
On September 30, 2019, in relation with the TrueLane Portfolio acquisition, the Operating Partnership, as guarantor, assumed an approximately $10.8 million Freddie Mac mortgage loan (as amended from time to time, the “TrueLane Mortgage”) with Berkadia Commercial Mortgage LLC as a result of the Operating Partnership’s acquisition of True FM 2017-1, LLC. The TrueLane Mortgage is secured by certain of our properties and equity pledges in the entity that owns those properties and bears interest at a fixed rate equal to 5.35%. The TrueLane Mortgage matures and is due in full on February 1, 2028 and requires monthly principal and interest payments.
On October 7, 2020, the Company issued 2,440,000 shares of our Series A Preferred Stock at a price of $25.00 per share, for gross proceeds of $61.0 million before deducting offering costs of approximately $2.3 million. These proceeds were in turn used to purchase 2,440,000 6.50% Series A Cumulative Redeemable Preferred Units of the Operating Partnership (“OP Preferred Units”). The Operating Partnership used $50.0 million of those net proceeds to partially pay down the Warehouse Facility. On January 13, 2021, the Operating Partnership drew $50.0 million under the Warehouse Facility. The proceeds were used to fund a portion of the purchase price of the Conrex I Acquisition. On March 8, 2021, the Operating Partnership paid down $35.0 million under the Warehouse Facility. As of March 31, 2021, the outstanding balance of the Warehouse Facility was $100.0 million.
On December 28, 2020, in relation to the acquisition of a 161-home portfolio, the Operating Partnership provided a non-recourse carveout guaranty related to an approximately $9.2 million mortgage loan assumed by a subsidiary of the Operating Partnership (the “Colony Note”) with Colony American Finance Lender, LLC as a result of the Operating Partnership’s acquisition of SMP Homes 3B, LLC. The Colony Note is secured by the properties in SMP Homes 3B, LLC and an equity pledge in SMP Homes 3B, LLC and bears interest at a fixed rate equal to 6.06%. The Colony Note matures and is due in full on December 9, 2021 and requires monthly principal and interest payments.
On December 28, 2020, in relation the acquisition of a 45-home portfolio, the Operating Partnership provided a non-recourse carveout guaranty related to an approximately $2.4 million mortgage loan assumed by a subsidiary of the Operating Partnership (the “CoreVest Note”) with CoreVest American Finance Lender LLC as a result of the Operating Partnership’s acquisition of SMP Homes 5B, LLC. The CoreVest Note is secured by the properties in SMP Homes 5B, LLC and an equity pledge in SMP Homes 5B, LLC and bears interest at a fixed rate equal to 6.12%. The CoreVest Note matures and is due in full on January 9, 2023 and requires monthly principal and interest payments.
On January 6, 2021, the Company (as guarantor) and VB Two, LLC (as borrower) entered into a $125.0 million note with Metropolitan Life Insurance (the “MetLife Note”). The MetLife Note is secured by equity pledges in VB Two, LLC and its wholly owned subsidiaries and bears interest at a fixed rate of 3.25%. The MetLife Note is interest-only and matures and is due in full on January 31, 2026. The net proceeds received were used to fund a portion of the purchase price of the Conrex I Acquisition.
64
On March 1, 2021, the Company entered into a non-recourse carveout guaranty and certain wholly owned subsidiaries of VB Three, LLC (as borrowers) entered into a $500.0 million credit agreement with JP Morgan (the “JPM Facility”). The JPM Facility is secured by equity pledges in VB Three, LLC and its wholly owned subsidiaries and bears interest at a variable rate equal to LIBOR plus 2.75%. The JPM Facility is interest-only and matures and is due in full on March 1, 2023. On March 1, 2021, in conjunction with the Conrex II Acquisition, the Company drew $320.0 million on the JPM Facility. As of March 31, 2021, the outstanding balance of the JPM Facility was $320.0 million.
As of March 31, 2021, the Company was in compliance with the debt covenants in each of its debt agreements.
We intend to invest in additional homes as suitable opportunities arise and adequate sources of equity and debt financing are available. We expect that future investments in properties, including any improvements or renovations of current or newly acquired properties, will depend on and will be financed by, in whole or in part, our existing cash, future borrowings and the proceeds from additional issuances of common stock, preferred stock or other securities or property dispositions.
Although we expect to be subject to restrictions on our ability to incur indebtedness, we expect that we will be able to refinance existing indebtedness or incur additional indebtedness for acquisitions or other purposes, if needed. However, there can be no assurance that we will be able to refinance our indebtedness, incur additional indebtedness or access additional sources of capital, such as by issuing common stock, preferred stock or other debt or equity securities, on terms that are acceptable to us or at all.
Furthermore, following the completion of our renovations and depending on the interest rate environment at the applicable time, we may seek to refinance our floating rate debt into longer-term fixed rate debt at lower leverage levels.
Interest Rate Swap Agreements
We have entered into and expect to continue to enter into interest rate swap and cap agreements with various third parties to fix or cap the floating interest rates on a majority of our floating rate mortgage debt outstanding. The interest rate swap agreements generally have a term of five years and effectively establish a fixed interest rate on debt on the underlying notional amounts. In order to fix a portion of, and mitigate the risk associated with, our floating rate indebtedness (without incurring substantial prepayment penalties or defeasance costs typically associated with fixed rate indebtedness when repaid early or refinanced), we, through the OP, have entered into 5 interest rate swap transactions with KeyBank with a combined notional amount of $320.0 million. As of March 31, 2021, the interest rate swaps we have entered into effectively replace the floating interest rate (LIBOR) with respect to $320.0 million of our floating rate mortgage debt outstanding with a weighted average fixed rate of 1.43%. As of March 31, 2021, interest rate swap agreements effectively covered $320.0 million, or 48%, of our $661.4 million of floating rate debt outstanding. During the term of these interest rate swap agreements, we are required to make monthly fixed rate payments of 1.43%, on a weighted average basis, on the notional amounts, while KeyBank is obligated to make monthly floating rate payments based on LIBOR to us referencing the same notional amounts. For purposes of hedge accounting under Financial Accounting Standards Board (“FASB”) Accounting Standards Codification (“ASC”) 815, Derivatives and Hedging, we have designated these interest rate swaps as cash flow hedges of interest rate risk. See Notes 6 and 7 to our consolidated financial statements for additional information.
The interest rate cap agreement has a term of three years, covering the outstanding principal amount of the Initial Mortgage which was required by the lender. Under the interest rate cap agreements, we pay a fixed fee in exchange for the counterparty to pay any interest above a maximum rate. As of March 31, 2021, interest rate cap agreements covered $241.4 million of our $661.4 million of floating rate debt outstanding. The interest rate cap agreement effectively caps LIBOR on $241.4 million of our floating rate mortgage debt at 6.60%.
65
Reference Rate Reform
On March 5, 2021, the FCA announced that LIBOR will no longer be published after June 30, 2023. This announcement has several implications, including setting the spread that may be used to automatically convert contracts from LIBOR to SOFR. Additionally, banking regulators are encouraging banks to discontinue new LIBOR debt issuances by December 31, 2021.
The Company anticipates that LIBOR will continue to be available at least until June 30, 2023. Any changes adopted by the FCA or other governing bodies in the method used for determining LIBOR may result in a sudden or prolonged increase or decrease in reported LIBOR. If that were to occur, our interest payments could change. In addition, uncertainty about the extent and manner of future changes may result in interest rates and/or payments that are higher or lower than if LIBOR were to remain available in its current form.
The Company has contracts that are indexed to LIBOR and we are monitoring and evaluating the related risks, which include interest on loans and amounts received/paid on derivative instruments. These risks arise in connection with transitioning contracts to an alternative rate, including any resulting value transfer that may occur, and are likely to vary by contract. The value of loans, securities, or derivative instruments tied to LIBOR, as well as interest rates on our current or future indebtedness, may also be impacted if LIBOR is limited or discontinued. For some instruments the method of transitioning to an alternative reference rate may be challenging, especially if we cannot agree with the respective counterparty about how to make the transition.
While we expect LIBOR to be available in substantially its current form until at least the end of June 30, 2023, it is possible that LIBOR will become unavailable prior to that point. This could result, for example, if a sufficient amount of banks decline to make submissions to the LIBOR administrator. In that case, the risks associated with the transition to an alternative reference rate will be accelerated and magnified.
Alternative rates and other market changes related to the replacement of LIBOR, including the introduction of financial products and changes in market practices, may lead to risk modeling and valuation challenges, such as adjusting interest rate accrual calculations and building a term structure for an alternative rate.
The introduction of an alternative rate also may create additional basis risk and increased volatility as alternative rates are phased in and utilized in parallel with LIBOR.
Adjustments to systems and mathematical models to properly process and account for alternative rates will be required, which may strain the model risk management and information technology functions and result in substantial incremental costs for the company.
REIT Tax Election and Income Taxes
We have elected to be taxed as a REIT under Sections 856 through 860 of the Code and expect to continue to qualify as a REIT. To qualify as a REIT, we must meet a number of organizational and operational requirements, including a requirement that we distribute at least 90% of our “REIT taxable income,” as defined by the Code, to our stockholders. Taxable income from certain non-REIT activities would be managed through a TRS and would be subject to applicable U.S. federal, state, and local income and margin taxes.
66
We did not have a TRS as of March 31, 2021, March 31, 2020, December 31, 2020 and December 31, 2019. We believe we qualify for taxation as a REIT under the Code, and we intend to continue to operate in such a manner, but no assurance can be given that we will operate in a manner so as to qualify as a REIT.
We anticipate that we will continue to qualify to be taxed as a REIT for U.S. federal income tax purposes, and we intend to continue to be organized and to operate in a manner that will permit us to qualify as a REIT. To qualify as a REIT, we must meet certain organizational and operational requirements, including a requirement to distribute at least 90% of our annual REIT taxable income to stockholders. As a REIT, we will be subject to federal income tax on our undistributed REIT taxable income and net capital gain and to a 4% nondeductible excise tax on any amount by which distributions we pay with respect to any calendar year are less than the sum of (1) 85% of our ordinary income, (2) 95% of our capital gain net income and (3) 100% of our undistributed income from prior years.
If we fail to qualify as a REIT in any taxable year, we will be subject to U.S. federal income tax on our taxable income at regular corporate income tax rates, and dividends paid to our stockholders would not be deductible by us in computing taxable income. Any resulting corporate liability could be substantial and could materially and adversely affect our net income and net cash available for distribution to stockholders. Unless we were entitled to relief under certain Code provisions, we also would be disqualified from re-electing to be taxed as a REIT for the four taxable years following the year in which we failed to qualify to be taxed as a REIT.
We evaluate the accounting and disclosure of tax positions taken or expected to be taken in the course of preparing our tax returns to determine whether the tax positions are “more-likely-than-not” (greater than 50 percent probability) of being sustained by the applicable tax authority. Tax positions not deemed to meet the more-likely-than-not threshold would be recorded as a tax benefit or expense in the current year. Our management is required to analyze all open tax years, as defined by the statute of limitations, for all major jurisdictions, which include federal and certain states. We have no examinations in progress and none are expected at this time.
We recognize our tax positions and evaluate them using a two-step process. First, we determine whether a tax position is more likely than not to be sustained upon examination, including resolution of any related appeals or litigation processes, based on the technical merits of the position. Second, we will determine the amount of benefit to recognize and record the amount that is more likely than not to be realized upon ultimate settlement.
We had no material unrecognized tax benefit or expense, accrued interest or penalties as of March 31, 2021. We and our subsidiaries are subject to U.S. federal income tax as well as income tax of various state and local jurisdictions. The 2020, 2019 and 2018 tax years remain open to examination by tax jurisdictions to which our subsidiaries and we are subject. When applicable, we recognize interest and/or penalties related to uncertain tax positions on our consolidated statements of operations and comprehensive income.
Dividends
We intend to make regular quarterly dividend payments to holders of our common stock. U.S. federal income tax law generally requires that a REIT distribute annually at least 90% of its REIT taxable income, without regard to the deduction for dividends paid and excluding net capital gains. As a REIT, we will be subject to U.S. federal income tax on our undistributed REIT taxable income and net capital gain and to a 4% nondeductible excise tax on any amount by which distributions we pay with respect to any calendar year are less than the sum of (1) 85% of our ordinary income, (2) 95% of our capital gain net income and
67
(3) 100% of our undistributed income from prior years. We intend to make regular quarterly dividend payments of all or substantially all of our taxable income to holders of our common stock out of assets legally available for this purpose, if and to the extent authorized by our Board. Before we make any dividend payments, whether for U.S. federal income tax purposes or otherwise, we must first meet both our operating requirements and debt service on our debt payable. If our cash available for distribution is less than our taxable income, we could be required to sell assets, borrow funds or raise additional capital to make cash dividends or we may make a portion of the required dividend in the form of a taxable distribution of stock or debt securities.
We will make dividend payments based on our estimate of taxable earnings per share of common stock, but not earnings calculated pursuant to GAAP. Our dividends and taxable income and GAAP earnings will typically differ due to items such as depreciation and amortization, fair value adjustments, differences in premium amortization and discount accretion, and non-deductible general and administrative expenses. Our dividends per share may be substantially different than our taxable earnings and GAAP earnings per share.
Inflation
The real estate market has not been affected significantly by inflation in the past several years due to a relatively low inflation rate. The majority of our lease terms are for a period of one year or less and reset to market if renewed. The majority of our leases also contain protection provisions applicable to reimbursement billings for utilities. Should inflation return, due to the short-term nature of our leases, we do not believe our results will be materially affected.
Inflation may also affect the overall cost of debt, as the implied cost of capital increases. Currently, interest rates are less than historical averages. However, the Federal Reserve, in response to or in anticipation of continued inflation concerns, could continue to raise interest rates. We intend to mitigate these risks through long-term fixed interest rate loans and interest rate hedges, which to date have included interest rate caps and interest rate swap agreements.
Seasonality
We believe that our business and related operating results will be impacted by seasonal factors throughout the year. We experience higher levels of tenant move-outs and move-ins during the late spring and summer months, which impacts both our rental revenues and related turnover costs. Furthermore, our property operating costs are seasonally impacted in certain markets for expenses such as HVAC repairs, turn costs and landscaping expenses during the summer season. Additionally, our single-family properties are at greater risk in certain markets for adverse weather conditions such as extreme cold weather in winter months and hurricanes in late summer months.
Off-Balance Sheet Arrangements
As of March 31, 2021 and 2020 and December 31, 2020 and 2019, we had no off-balance sheet arrangements that have or are reasonably likely to have a current or future effect on our financial condition, changes in financial condition, revenues or expenses, results of operations, liquidity, capital expenditures or capital resources.
Critical Accounting Policies and Estimates
Management’s discussion and analysis of financial condition and results of operations is based upon our consolidated financial statements, which have been prepared in accordance with GAAP. The preparation of these financial statements requires our management to make judgments, assumptions and estimates that affect the reported amounts of assets, liabilities, revenues and expenses, and related disclosure
68
of contingent assets and liabilities. We evaluate these judgments, assumptions and estimates for changes that would affect the reported amounts. These estimates are based on management’s historical industry experience and on various other judgments and assumptions that are believed to be reasonable under the circumstances. Actual results may differ from these judgments, assumptions and estimates. Below is a discussion of the accounting policies that we consider critical to understanding our financial condition or results of operations where there is uncertainty or where significant judgment is required. A discussion of recent accounting pronouncements and our significant accounting policies, including further discussion of the accounting policies described below, can be found in Note 2 “Summary of Significant Accounting Policies” to our consolidated financial statements included in this Form 10.
Real Estate Investments
Upon acquisition, we evaluate our acquired single-family residential properties for purposes of determining whether a transaction should be accounted for as an asset acquisition or business combination. Since substantially all of the fair value of our acquired properties is concentrated in a single identifiable asset or group of similar identifiable assets and the acquisitions do not include a substantive process, our purchases of homes or portfolios of homes qualify as asset acquisitions. Accordingly, upon acquisition of a property, the purchase price and related acquisition costs (the “total consideration”) are allocated to land, buildings, improvements, fixtures, and intangible lease assets based upon their relative fair values.
The allocation of total consideration, which is determined using inputs that are classified within Level 3 of the fair value hierarchy established by FASB ASC 820, Fair Value Measurement (“ASC 820”) (see Note 6), is based on an independent third-party valuation firm’s estimate of the fair value of the tangible and intangible assets and liabilities acquired. The Valuation Methodology utilizes market comparable information, depreciated replacement cost and other estimates in allocating value to the tangible assets. The allocation of the total consideration to intangible lease assets represents the value associated with the in-place leases, as one month’s worth of effective gross income (rental revenue, less credit loss allowance, plus other income) as the average downtime of the assets in the portfolio is approximately one month and the assets in the portfolio are leased on a gross rental structure. If any debt is assumed in an acquisition, the difference between the fair value, which is estimated using inputs that are classified within Level 2 of the fair value hierarchy, and the face value of debt is recorded as a premium or discount and amortized or accreted as interest expense over the life of the debt assumed.
Real estate assets, including land, buildings, improvements, fixtures, and intangible lease assets are stated at historical cost less accumulated depreciation and amortization. Costs incurred in making repairs and maintaining real estate assets are expensed as incurred. Expenditures for improvements, renovations, and replacements are capitalized at cost. The Company also incurs costs to prepare acquired properties for rental. These costs are capitalized to the cost of the property during the period the property is undergoing activities to prepare it for its intended use. We capitalize interest costs as a cost of the property only during the period for which activities necessary to prepare an asset for its intended use are ongoing, provided that expenditures for the asset have been made and interest costs have been incurred. Upon completion of the renovation of our properties, all costs of operations, including repairs and maintenance, are expensed as incurred, unless the renovation meets the Company’s capitalization criteria.
Impairment
Real estate assets are reviewed for impairment quarterly or whenever events or changes in circumstances indicate that the carrying amount of an asset may not be recoverable. Significant indicators of impairment may include, but are not limited to, declines in home values, rental rates or occupancy percentages, as well as significant changes in the economy. In such cases, the Company will evaluate the recoverability of the assets by comparing the estimated future cash flows expected to result from the use and eventual disposition of each asset to its carrying amount and provide for impairment if such undiscounted cash flows are insufficient to recover the carrying amount. If impaired, the real estate asset will be written down to its estimated fair value. The process whereby we assess our single-family homes for impairment requires significant judgment and assessment of factors that are, at times, subject to significant uncertainty. No significant impairments on operating properties were recorded during the years ended December 31, 2020 and 2019 or the three months ended March 31, 2021 and 2020.
69
Recent Accounting Pronouncements
See Note 2 — Summary of Significant Accounting Policies to the consolidated financial statements for the years ended December 31, 2020 and 2019 included elsewhere in this Form 10 for a discussion of recently issued accounting pronouncements.
Implications of being an Emerging Growth Company and Smaller Reporting Company
We are an “emerging growth company,” as defined in the JOBS Act and we are eligible to take advantage of certain exemptions from various reporting requirements that are applicable to other public companies that are not “emerging growth companies” including, but not limited to, not being required to comply with the auditor attestation requirements of Section 404 of the Sarbanes-Oxley Act, reduced disclosure obligations regarding executive compensation in our periodic reports and proxy statements, and exemptions from the requirements of holding a non-binding advisory vote on executive compensation and stockholder approval of any golden parachute payments not previously approved.
The JOBS Act permits an emerging growth company such as us to take advantage of an extended transition period to comply with new or revised accounting standards applicable to public companies. We have elected to take advantage of this extended transition period. As a result of this election, our financial statements may not be comparable to companies that comply with public company effective dates for such new or revised standards. We may elect to comply with public company effective dates at any time, and such election would be irrevocable pursuant to Section 107(b) of the JOBS Act.
We could remain an “emerging growth company” until the earliest of (1) the end of the fiscal year following the fifth anniversary of the date of the first sale of our common stock pursuant to an effective registration statement, (2) the last day of the fiscal year in which our annual gross revenues exceed $1.07 billion, (3) the date that we become a “large accelerated filer” as defined in Rule 12b-2 under the Exchange Act, which would occur if the market value of our common stock that is held by non-affiliates exceeds $700 million as of the last business day of our most recently completed second fiscal quarter, or (4) the date on which we have issued more than $1 billion in non-convertible debt during the preceding three year period.
We are also a “smaller reporting company” as defined in the Exchange Act, and may elect to take advantage of certain of the scaled disclosures available to smaller reporting companies. We may be a smaller reporting company even after we are no longer an “emerging growth company.”
70
| ITEM 4. | SECURITY OWNERSHIP OF CERTAIN BENEFICIAL OWNERS AND MANAGEMENT. |
The following tables shows as of March 31, 2021, the amount of our common stock owned by any person who is known by us to be the beneficial owner of more than 5% of the outstanding shares of common stock and the amount of common stock, our common units of the Operating Partnership and our Series A Preferred Stock beneficially owned (unless otherwise indicated) by (1) our directors, (2) our executive officers, and (3) all of our directors and executive officers as a group. As of March 31, 2021, none of the foregoing beneficially own any of our Series A cumulative redeemable preferred units of the Operating Partnership. The address for each beneficial owner is c/o VineBrook Homes Trust, Inc., 2515 McKinney Avenue, Suite 1100, Dallas, Texas 75201 unless otherwise provided.
Beneficial ownership and percentage of beneficial ownership is based on 11,499,045 shares of our common stock, 12,957,484 OP Units and 5,000,000 shares of our Series A Preferred Stock outstanding at March 31, 2021. Shares of common stock or OP Units that a person has the right to acquire within 60 days of March 31, 2021 upon the vesting of restricted stock units or profits interest units are deemed to be outstanding and beneficially owned by the person for the purpose of computing the percentage of beneficial ownership of that person and any group of which that person is a member, but are not deemed outstanding for the purpose of computing the percentage of beneficial ownership for any other person.
NAME OF BENEFICIAL OWNERS | COMMON STOCK BENEFICIALLY OWNED | |||||||
| NUMBER | PERCENT OF CLASS | |||||||
5% Stockholders | ||||||||
APC-VB Homes, LLC | 769,561.57 | 6.69 | % | |||||
NAME OF BENEFICIAL OWNERS | COMMON STOCK BENEFICIALLY OWNED | OP UNITS BENEFICIALLY OWNED | SERIES A PREFERRED STOCK BENEFICIALLY OWNED | |||||||||||||||||||||
| NUMBER | PERCENT OF CLASS | NUMBER | PERCENT OF CLASS | NUMBER | PERCENT OF CLASS | |||||||||||||||||||
Directors and Executive Officers |
| |||||||||||||||||||||||
James Dondero (1) | 12,999.51 | * | 2,899,816.74 | 22.38 | % | — | — | |||||||||||||||||
Matthew McGraner | 8,790.65 | * | — | — | — | — | ||||||||||||||||||
Brian Mitts | 4,220.51 | * | — | — | — | — | ||||||||||||||||||
Dana Sprong | — | — | 48,932.71 | * | — | — | ||||||||||||||||||
Edward Constantino | 13,492.78 | * | — | — | — | — | ||||||||||||||||||
Scott Kavanaugh | 21,381.72 | * | — | — | — | — | ||||||||||||||||||
Arthur Laffer | 9,913.16 | * | — | — | — | — | ||||||||||||||||||
Catherine Wood | — | — | — | — | — | — | ||||||||||||||||||
All Directors and Executive Officers as a group (nine persons) | 70,798.33 | * | 3,068,480.5 | 25.17 | % | — | — | |||||||||||||||||
| * | Reports less than 1% |
72
| (1) | James D. Dondero, NexPoint and Highland Capital Management Fund Advisors, L.P., or HCMFA have sole voting power, shared voting power, sole dispositive power and shared dispositive power as follows: |
Name of Reporting Person | Sole Voting Power | Shared Voting Power | Sole Dispositive Power | Shared Dispositive Power | ||||||||||||
James D. Dondero | 5,760.26 | 2,906,607 | 5,760.26 | 2,906,607 | ||||||||||||
NexPoint Advisors, L.P. | — | 2,774,832 | — | 2,774,832 | ||||||||||||
Highland Capital Management Fund Advisors, L.P. | — | 131,775 | — | 131,775 | ||||||||||||
73
| ITEM 5. | DIRECTORS AND EXECUTIVE OFFICERS. |
Our Directors and Executive Officers
Our directors and executive officers and their positions and ages are as follows:
Name | Age | Position | ||
| Scott Kavanaugh | 60 | Independent Director | ||
| Arthur Laffer | 80 | Independent Director | ||
| Edward Constantino | 74 | Independent Director | ||
| Catherine Wood | 65 | Independent Director | ||
| James Dondero | 58 | Director, Chief Executive Officer and President | ||
| Brian Mitts | 50 | Director, Chief Financial Officer, Assistant Secretary and Treasurer | ||
| Dana Sprong | 42 | Director, Senior Vice President of Acquisitions & Dispositions and member of Investment Committee | ||
| Matt McGraner | 37 | Executive Vice President, Chief Investment Officer, Secretary and member of Investment Committee | ||
| Ryan McGarry | 35 | Senior Vice President of Asset Management and member of Investment Committee |
Below is a biography for each director who is not an employee of our Adviser or our Manager. For biographical information on our directors who also serve as our executive officers and our executive officers, see “—Key Employees of our Adviser” and “—Key Employees of our Manager.”
Scott Kavanaugh
Mr. Kavanaugh has served as a member of our Board since December 2018. Mr. Kavanaugh has also served as a member of the board of directors of NexPoint Residential Trust, Inc., a publicly traded multifamily REIT (“NXRT”), since March 2015, and as a member of the board of directors of NexPoint Real Estate Finance, Inc. (“NREF”) since February 2020. Mr. Kavanaugh is, and since December 2009 has been, the CEO of First Foundation Inc. (“FFI”), a financial services company. From June 2007 until December 2009, he served as President and Chief Operating Officer of FFI. Mr. Kavanaugh has been the Vice-Chairman of FFI since June 2007. He also is, and since September 2007 has been, the Chairman and CEO of FFI’s wholly owned banking subsidiary, First Foundation Bank. Mr. Kavanaugh was a founding stockholder and served as an Executive Vice President and Chief Administrative Officer and a member of the board of directors of Commercial Capital Bancorp, Inc., the parent holding company of Commercial Capital Bank, from 1999 until 2003. From 1998 until 2003, Mr. Kavanaugh served as the Executive Vice President and Chief Operating Officer and a director of Commercial Capital Mortgage. From 1993 to 1998, Mr. Kavanaugh was a partner and head of trading for fixed income and equity securities at Great Pacific Securities, Inc., a west coast-based regional securities firm. Mr. Kavanaugh is, and since 2009 has been, a member of the board of directors of Colorado Federal Savings Bank and its parent holding company, Silver Queen Financial Services, Inc. Mr. Kavanaugh also served as a member of the board of directors of NexBank, SSB (“NexBank”) and its parent holding company, NexBank Capital, Inc., from 2014 until 2015. Mr. Kavanaugh was selected to serve on our Board because of his expertise in investment management and his experience as both an executive officer and a director of multiple companies.
74
Arthur Laffer
Dr. Laffer has served as a member of our Board since December 2018. Dr. Laffer has also served as a member of the board of directors of NXRT since May 2015 and as a member of the board of directors of NREF since February 2020. Dr. Laffer is the founder and chairman of Laffer Associates, an economic research and consulting firm and served as the chairman and director of Laffer Investments, a registered investment advisor, from 1999 to 2019. Dr. Laffer served as a director of GEE Group, Inc., a provider of specialized staffing solutions, from 2014 to 2020. A former member of President Reagan’s Economic Policy Advisory Board during the 1980s, Dr. Laffer’s economic acumen and influence have earned him the distinction in many publications as The Father of Supply-Side Economics. He has served on several boards of directors of public and private companies, including staffing company MPS Group, Inc., which was sold to Adecco Group for $1.3 billion in 2009. Dr. Laffer has served as a director of VerifyMe, Inc. since 2019. Dr. Laffer was previously a consultant to Secretary of the Treasury William Simon, Secretary of Defense Donald Rumsfeld, and Secretary of the Treasury George Shultz. In the early 1970s, Dr. Laffer was the first to hold the title of Chief Economist at the Office of Management and Budget under Mr. Shultz. Additionally, Dr. Laffer was formerly the Distinguished University Professor at Pepperdine University and a member of the Pepperdine University board of directors. He also served as Charles B. Thornton Professor of Business Economics at the University of Southern California and as Associate Professor of Business Economics at the University of Chicago. Dr. Laffer was selected to serve on our Board because of his expertise in economics and his experience as a director of multiple companies.
Edward Constantino
Mr. Constantino has served as a member of our Board since February 2019. Mr. Constantino has also served as a member of the board of directors of NXRT since March 2015, as a member of the board of directors of NREF since February 2020 and as a member of the board of directors of NexPoint Strategic Opportunities Fund (“NHF”), a closed-end mutual fund, since March 2020. Mr. Constantino has over 40 years of audit, advisory and tax experience working for two major accounting firms, Arthur Andersen LLP and KPMG. Mr. Constantino retired from KPMG in late 2009, where he was an audit partner in charge of the firm’s real estate and asset management businesses. Mr. Constantino is, and since 2010 has been, a member of the board of directors of Patriot Bank N.A. Mr. Constantino has also served as a consultant for the law firm Skadden, Arps, Slate, Meagher & Flom LLP. He is a licensed CPA, a member of the American Institute of Certified Public Accountants and a member of the New York State Society of Public Accountants. He is currently a member of the board of trustees and the audit committee chairman of St. Francis College in Brooklyn Heights, New York. Mr. Constantino was selected to serve on our Board because of his extensive accounting experience, particularly in the real estate field.
Catherine Wood
Ms. Wood has served as a member of our Board since July 2020. In addition, she has served as a member of the board of directors of NXRT and the board of directors of NREF since July 2020. Ms. Wood is currently Chief Executive Officer and Chief Investment Officer of ARK Investment Management LLC (“ARK”), an SEC registered investment advisor, which she founded in January 2014. Prior to ARK, Ms.
75
Wood spent 12 years at AllianceBernstein as Chief Investment Officer of Global Thematic Strategies. Ms. Wood joined AllianceBernstein from Tupelo Capital Management, a hedge fund she co-founded. Prior to her tenure at Tupelo Capital Management, Ms. Wood worked for 18 years at Jennison Associates LLC as Chief Economic Officer and several other positions. Ms. Wood started her career in Los Angeles at The Capital Group as an Assistant Economist. Ms. Wood received her Bachelor of Science, summa cum laude, in Finance and Economics from the University of Southern California. Ms. Wood was selected to serve on our Board because of her experience as it relates to disruptive technologies, business models and processes, which provides a unique and important perspective to the Board.
Board of Directors
We are managed by our Board, which is comprised of seven persons. Each director serves a one-year term expiring at each annual meeting of stockholders and lasting until his or her respective successor is duly elected and qualified. Pursuant to the terms of the Advisory Agreement, our Adviser has the right to designate individuals (the “Adviser Designees”) to be nominated for election (or re-election) to our Board, such that, if elected, there shall be two Adviser Designees serving on our Board, and we will take all reasonably necessary action to nominate and include the Adviser Designees in the slate of nominees recommended by our Board for election as directors at each applicable annual meeting of stockholders or special meeting of stockholders at which directors are to be elected. To the extent the Adviser Designees are not elected, our Adviser may terminate the Advisory Agreement and receive the Adviser Termination Fee (as defined below).
Our Board has determined that each of Edward Constantino, Scott Kavanaugh, Dr. Arthur Laffer and Catherine Wood is independent in accordance with the New York Stock Exchange (“NYSE”) listing standards. Of the remaining directors, (a) one of the directors is independent of our Adviser (Dana Sprong) and (b) two of the directors are independent of our Manager (James Dondero and Brian Mitts). Generally, all actions by our Board require the affirmative approval or consent of a majority of the directors present at a meeting at which a quorum is present. Based on the composition of our Board, all actions taken by our Board require the approval or consent of at least one of the directors who is independent of both our Adviser and our Manager. In regard to actions impacting our Adviser, our Adviser’s Board representatives (James Dondero and Brian Mitts) abstain from voting on those matters and in regard to actions impacting our Manager, our Manager’s Board representative (Dana Sprong) abstains from voting on those matters.
The Company has a policy that all directors are expected to attend the annual meeting.
Committees of the Board of Directors
Our Board may establish committees it deems appropriate to address specific areas in more depth than may be possible at a full meeting of our Board. Our Board established effective immediately prior to the effectiveness of this Form 10 an audit committee, a compensation committee and a nominating and corporate governance committee, the composition and responsibilities of which are described below. Members will serve on the committees until their resignation or until otherwise determined by our Board.
Audit Committee
Upon effectiveness of this Form 10, our audit committee will consist of Edward Constantino, Scott Kavanaugh, Dr. Arthur Laffer and Catherine Wood, with Edward Constantino serving as chair of the committee. Our Board has determined that Edward Constantino qualifies as an
76
“audit committee financial expert” as that term is defined by the applicable SEC regulations. Our Board has also determined that each of Edward Constantino, Scott Kavanaugh, Dr. Arthur Laffer and Catherine Wood is independent as defined by NYSE listing standards and SEC requirements relating to the independence of audit committee members. Our Board adopted an audit committee charter effective immediately prior to the effectiveness of this Form 10, which details the principal functions of the audit committee, including oversight related to:
| • | our accounting and financial reporting processes; |
| • | the integrity of our consolidated financial statements; |
| • | our systems of disclosure controls and procedures and internal control over financial reporting; |
| • | our compliance with financial, legal and regulatory requirements; |
| • | the performance of our internal audit function; and |
| • | our overall risk assessment and management. |
Our audit committee will also be responsible for engaging an independent registered public accounting firm, reviewing with the independent registered public accounting firm the plans and results of the audit engagement, approving professional services provided by the independent registered public accounting firm, including all audit and non-audit services, reviewing the independence of the independent registered public accounting firm, considering the range of audit and non-audit fees and reviewing the adequacy of our internal accounting controls. The audit committee will also prepare the audit committee report required by SEC regulations to be included in our annual proxy statement beginning with our annual meeting of stockholders to be held in 2022. Our audit committee charter will be available upon effectiveness of this Form 10 on our website at www.investors.vinebrookhomes.com.
Compensation Committee
Upon effectiveness of this Form 10, our compensation committee will consist of Edward Constantino, Scott Kavanaugh, Dr. Arthur Laffer and Catherine Wood, with Dr. Arthur Laffer serving as chair of the committee. Our Board has determined that each of Edward Constantino, Scott Kavanaugh, Dr. Arthur Laffer and Catherine Wood is independent as defined by NYSE listing standards and SEC requirements relating to the independence of compensation committee members. Our Board adopted a compensation committee charter effective immediately prior to the effectiveness of this Form 10, which details the principal functions of the compensation committee, including:
| • | reviewing our compensation policies and plans; |
| • | implementing and administering the VineBrook Homes Trust, Inc., 2018 Long-Term Incentive Plan (the “LTIP”); |
| • | assisting management in complying with our proxy statement and annual report disclosure requirements; |
| • | producing a report on compensation to be included in our annual proxy statement; and |
77
| • | reviewing, evaluating and recommending changes, if appropriate, to the remuneration for directors. |
Our compensation committee will have the sole authority to retain and terminate compensation consultants to assist in the evaluation of our compensation and the sole authority to approve the fees and other retention terms of such compensation consultants. The committee will also be able to retain independent counsel and other independent advisors to assist it in carrying out its responsibilities. Our compensation committee charter will be available upon effectiveness of this Form 10 on our website at www.investors.vinebrookhomes.com.
Nominating and Corporate Governance Committee
Upon effectiveness of this Form 10, our nominating and corporate governance committee will consist of Edward Constantino, Scott Kavanaugh, Dr. Arthur Laffer and Catherine Wood, with Scott Kavanaugh serving as chair of the committee. The Board has determined that each of Edward Constantino, Scott Kavanaugh, Dr. Arthur Laffer and Catherine Wood is independent as defined by NYSE listing standards. Our Board adopted a nominating and corporate governance committee charter effective immediately prior to the effectiveness of this Form 10, which details the principal functions of the nominating and corporate governance committee, including:
| • | identifying and recommending to the full Board qualified candidates for election as directors and recommending nominees for election as directors at the annual meeting of stockholders; |
| • | developing and recommending to the Board corporate governance guidelines and implementing and monitoring such guidelines; |
| • | reviewing and making recommendations on matters involving the general operation of the Board, including board size and composition, and committee composition and structure; |
| • | recommending to the Board nominees for each committee of the Board; |
| • | annually facilitating the assessment of the Board’s performance; and |
| • | annually reviewing and making recommendations to the Board regarding revisions to the corporate governance guidelines and the code of business conduct and ethics. |
Our nominating and corporate governance committee will have the sole authority to retain and terminate any search firm to assist in the identification of director candidates and the sole authority to set the fees and other retention terms of such search firms. The committee will also be able to retain independent counsel and other independent advisors to assist it in carrying out its responsibilities. Our nominating and corporate committee charter will be available upon effectiveness of this Form 10 on our website at www.investors.vinebrookhomes.com.
Our Adviser
Our Adviser is an affiliate of NREA. NREA is wholly owned by NexPoint and is a leading real estate manager. Pursuant to the Advisory Agreement, our operations are managed by our Adviser. Our Adviser’s responsibilities include, among other duties, recommending distributions to our Board, preparing our quarterly consolidated unaudited financial statements and annual consolidated financial statements in accordance with GAAP, managing our annual audit, developing and maintaining appropriate
78
internal accounting controls, maintaining our REIT status, calculating our NAV, processing purchases and redemptions of shares of our common stock, reporting to investors, preparing our tax filings, raising capital for us and procuring debt financing. Additionally, certain employees of our Adviser serve as some of our directors and executive officers.
Key Employees of Our Adviser
James Dondero
Mr. Dondero has served as a member of our Board and as our Chief Executive Officer and President since February 2019. Mr. Dondero has also served as the President and chairman of the board of directors of NXRT since May 2015 and as President and chairman of the board of directors of NREF since February 2020. Mr. Dondero is also: founder and president of NexPoint, an investment advisor registered with the Securities and Exchange Commission (the “SEC”) and chairman of NexBank. Mr. Dondero co-founded Highland Capital Management, L.P. (“Highland”), a former affiliate of NexPoint, in 1993 with Mark Okada and served as President from 2004 to 2020. Mr. Dondero has over 30 years of experience investing in credit and equity markets and has helped pioneer credit asset classes. Mr. Dondero has also served as the Chief Executive Officer of NexPoint Hospitality Trust, Inc. (“NHT”), a publicly traded hospitality REIT listed on the TSX Venture Exchange (the “TSXV”) since December 2018. Mr. Dondero served as a director of Jernigan Capital, Inc., a self-storage lending REIT, from August 2016 to November 2020. Mr. Dondero currently serves on the boards of directors of Metro-Goldwyn-Mayer, Cornerstone Healthcare Group, SeaOne Holdings, LLC and Texmark Timber Treasury, L.P. He also serves as president of NexPoint Capital, Inc. (“NexPoint Capital”), NexPoint Real Estate Strategies Fund (“NRESF”), and NexPoint Healthcare Opportunities Fund, all of which are affiliates of our Adviser. On October 16, 2019, Highland filed for Chapter 11 bankruptcy protection with the U.S. Bankruptcy Court for the District of Delaware. Mr. Dondero was selected to serve on our Board because of his prior service as a director and his experience as an executive officer.
Matt McGraner
Mr. McGraner has served as our Executive VP, Chief Investment Officer and Secretary and as a member of the Investment Committee since 2018. Mr. McGraner co-founded NREA as well as NXRT, NREF and other real estate businesses with Mr. Mitts and Mr. Dondero. Mr. McGraner has also served as the Executive VP and Chief Investment Officer of NXRT since March 2015 and has served as the Executive VP and Chief Investment Officer of NREF since February 2020 and as a member of the board of directors and President of NexPoint Storage Partners, Inc. (“NSP”) since November 2020. From September 2014 to March 2015, Mr. McGraner served as NXRT’s Secretary. Mr. McGraner has also served as Chief Investment Officer of NHT since December 2018 and as a Managing Director at NexPoint since 2016. With over ten years of real estate, private equity and legal experience, his primary responsibilities are to lead the operations of the real estate platform at NexPoint, as well as source and execute investments, manage risk and develop potential business opportunities, including fundraising, private investments and joint ventures. Mr. McGraner is also a licensed attorney and was formerly an associate at Jones Day from 2011 to 2013, with a practice primarily focused on private equity, real estate and mergers and acquisitions. While at Jones Day, Mr. McGraner led the acquisition and financing of over $200 million of real estate investments and advised on $16.3 billion of M&A and private equity transactions. Since 2013, Mr. McGraner has led the acquisition and financing of approximately $11.8 billion of real estate investments.
79
Brian Mitts
Mr. Mitts has served as a member of our Board since July 2018, and as our Chief Financial Officer, Treasurer and Assistant Secretary since November 2018. Mr. Mitts co-founded NREA as well as NXRT, NREF and other real estate businesses with Mr. McGraner and Mr. Dondero. Currently, Mr. Mitts leads our financial reporting and accounting teams and is integral in financing and capital allocation decisions. Prior to co-founding NREA, NXRT and NREF, Mr. Mitts was Chief Operations Officer of HCMFA, the external advisor of open-end and closed-end funds where he managed the operations of these funds and helped develop new products. Mr. Mitts was also a co-founder of NexPoint, the parent of NREA. He has worked for NREA or its affiliates since 2007. Mr. Mitts has also served as a director of NXRT since September 2014 and as the Chief Financial Officer, Executive Vice President-Finance and Treasurer of NXRT since March 2015. In February 2019, Mr. Mitts was also appointed Secretary of NXRT. From September 2014 to March 2015, Mr. Mitts served as President and Treasurer of NXRT. Mr. Mitts has also served as the Chief Financial Officer, Executive VP-Finance, Treasurer and Corporate Secretary of NHT since December 2018, as the Chief Financial Officer, Executive Vice President-Finance, Secretary and Treasurer of NREF since February 2020, and as a member of the board of directors of NREF since June 2019. Mr. Mitts also served as our President and Treasurer from July 2018 until October 2018. Since November 2020, Mr. Mitts has also served as Chief Financial Officer, Secretary and Treasurer of NSP. Mr. Mitts was selected to serve on our Board because of his prior service as a director and his experience as an executive officer.
Paul Richards
Mr. Richards (32) has served as our Vice President of Asset Management and Financing since 2018. Mr. Richards has also served as Vice President of Asset Management of NHT since March 2019, as a Director at NREA since 2019 and as VP of Originations and Investments of NREF since February 2020. His primary responsibilities are to research and conduct due diligence on new investment ideas, perform valuation and benchmark analysis, monitor and manage investments in the existing real estate portfolio, and provide industry support for NexPoint’s real estate team. Mr. Richards serves as a Director for NREA and joined in 2017. From 2016 to 2017, Mr. Richards served as a Product Strategy Associate at HCMFA, where he was responsible for evaluating and optimizing the registered product lineup. Previously, Mr. Richards was also employed with Deloitte & Touche LLP’s state and local tax practice where he served as a tax consultant specializing in state strategic tax reviews, voluntary disclosure agreements, state tax exposure research, and overall state tax compliance.
Jackie Graham
Ms. Graham (31) has served as the Director, Investor Relations and Capital Markets at NexPoint since 2016. Ms. Graham is responsible for leading investor relations and capital markets efforts for NexPoint’s public and private real estate companies. Prior to joining NexPoint in November 2016, she worked as a marketing consultant at The Nautilus Group, a service of New York Life Insurance Company. At the Nautilus Group, Ms. Graham consulted with agents who work in the high net worth market. She was responsible for event planning, creating custom marketing collateral, and developing continuing education programs for attorneys, accountants, and other financial planning professionals. Ms. Graham received a BS in Political Science with a pre-law emphasis and a minor in Communications from Santa Clara University. She also holds FINRA Series 7 and 63 licenses.
80
David Willmore
Mr. Willmore, CPA, (36) has served as the Chief Accounting Officer for NexPoint since 2021. Mr. Willmore has also served as the VP of Finance for NREF and NexPoint Residential Trust, Inc. since February 2020. Mr. Willmore has also served as Senior Manager at NXRT since March 2019 and was previously a Senior Manager at a former NexPoint affiliate from February 2017 to March 2019. With over ten years of accounting, auditing, and financial reporting experience, his primary responsibilities are to implement the financial and operational strategies of NexPoint’s public and private REITs and registered investment funds as well as ensure timely and accurate accounting and reporting. As a Senior Manager, Mr. Willmore was responsible for the accounting, reporting and operations for hedge funds, separately managed accounts and private equity business lines. Before joining in October 2011, Mr. Willmore began his career at Deloitte & Touche LLP as an auditor in the Audit and Enterprise Risk Services Group.
Tom Chapline
Mr. Chapline, CPA, (30) has served as a Senior Fund Analyst at NexPoint since 2017. With seven years of financial reporting experience, Mr. Chapline’s responsibilities include managing VineBrook’s consolidated financial reporting, accounting and operations. Mr. Chapline also manages the financial reporting, accounting and operations of private REITs on the NexPoint platform. Prior to joining NexPoint in 2017, Mr. Chapline was a Senior Associate at KPMG. Over his three years at KPMG, Mr. Chapline was responsible for leading teams on hedge fund and private equity audit engagements. Mr. Chapline received his MS and BBA in Accounting from Southern Methodist University and is a licensed Certified Public Accountant in the state of Texas.
Our Manager
The VineBrook Executives have operated in the workforce SFR market since the inception of the VineBrook Companies in 2007, participating in several large acquisition and financing transactions, demonstrating the ability to identify consolidation and growth opportunities and to subsequently integrate new properties into an existing portfolio. Pursuant to the Management Agreements, our Manager is generally the sole and exclusive manager for our properties (subject to the terms of the Management Agreements), responsible for managing, coordinating and supervising the ordinary and usual business and affairs pertaining to the operation, maintenance, leasing, and management of properties in an efficient manner satisfactory to us and in compliance with the Management Agreements. In addition, our Manager is primarily responsible for the identification of potential SFR properties and the acquisition and disposition of SFR properties, subject to oversight from the Investment Committee and the terms of the OP LPA. Additionally, certain employees of our Manager serve on our Board, as our executive officers and on the Investment Committee.
81
Key Employees of Our Manager
Dana Sprong
Dana Sprong has served as a member of the Board since November 2018 and has served as our Senior Vice President of Acquisitions and Dispositions since 2018. He is also the Chief Executive Officer of our Manager and was a prior owner of our predecessor. Mr. Sprong founded our predecessor, purchased our first rental home in December of 2007, and led the due diligence, acquisition, and management of over 13,000 SFR homes. Since its inception, he has grown VineBrook from zero employees to over 350 professionals. Prior to founding our predecessor, Mr. Sprong was a senior manager at JW Construction (“JWC”), an eastern Massachusetts residential construction and development firm. Prior to JWC, he was a senior manager at DJ Dowling Inc., a builder on the San Francisco Peninsula. Mr. Sprong is a licensed General Contractor and Real Estate Broker. He is also an Auxiliary On-Call Firefighter. He graduated with honors from Harvard University. Mr. Sprong also serves as a member of the Investment Committee. Mr. Sprong was selected to serve on our Board because of his prior service as a director and his experience as an executive officer.
Ryan McGarry
Ryan McGarry has served as our Senior Vice President of Asset Management since 2018. He has also served as the COO of our Manager since 2018 and is responsible for managing our property operations, including leasing homes, maintaining homes, making homes ready for leasing and other operational aspects. Mr. McGarry joined our predecessor in 2010, and has focused on enhancing analytical capabilities to drive efficiency and scale, and helping build out technology to make operations run efficiently. With a focus on NOI margin enhancement, his focus is on driving efficiency and transparency via task-based management solutions and a robust, metric-based reporting infrastructure. Prior to joining our predecessor, Mr. McGarry worked at a national investment consulting firm, focused on investment policy direction and manager evaluation and selection. Mr. McGarry is a CFA Charterholder and a CAIA Charterholder. Mr. McGarry also serves as a member of the Investment Committee.
82
Graham Strong
Graham Strong (49) has served as our Manager’s Chief Financial Officer since 2018 and is responsible for administrative, financial and risk management functions including, but not limited to, the development of financial and operational strategies, metrics tied to strategy, and the ongoing development and monitoring of control systems designed to facilitate growth, preserve company assets and report accurate and timely financial results. Mr. Strong joined our predecessor in April 2013 after serving several years on the management team of one of the largest independent, middle market equipment and technology lessors in North America. Within that organization, Mr. Strong was charged with the management of the corporate treasury, accounting and tax functions. Prior to Mr. Strong’s stint within the equipment and technology leasing industry, he served as Vice President of Finance for a large, regional originator of residential mortgages. Mr. Strong received his Master of Business Administration with a Concentration in Finance from the Williams College of Business at Xavier University. Additionally, he received his Bachelor of Business Administration, Major in Accounting, from the Carl H. Lindner College of Business at the University of Cincinnati. He is a Certified Public Accountant (CPA) and a Chartered Global Management Accountant (CGMA).
83
| ITEM 6. | EXECUTIVE COMPENSATION. |
Compensation of Our Directors in 2020
Directors who also serve as our officers do not receive compensation for their service as directors.
Our Board has adopted a director compensation policy that provides the following compensation for non-management directors:
| • | each non-management director receives an annual director’s fee payable in cash equal to $20,000 and an annual grant of restricted stock units; |
| • | the chair of the Audit Committee will receive an additional annual fee payable in cash equal to $15,000; |
| • | the chair of the Compensation Committee will receive an additional annual fee payable in cash equal to $7,500; |
| • | the chair of the Nominating and Corporate Governance Committee will receive an additional annual fee payable in cash equal to $7,500; and |
| • | the Lead Independent Director will receive an additional annual fee payable in cash equal to $10,000. |
We also reimburse directors for all expenses incurred in attending board and committee meetings.
Director Compensation Table
The following table provides information regarding the compensation of our directors for the year ended December 31, 2020:
NAME | FEES EARNED OR PAID IN CASH | STOCK AWARDS (2) | TOTAL | |||||||||
James Dondero | — | — | — | |||||||||
Brian Mitts | — | — | — | |||||||||
Dana Sprong | — | — | — | |||||||||
Edward Constantino | $ | 35,000 | $ | 94,248 | $ | 129,248 | ||||||
Scott Kavanaugh | $ | 37,500 | $ | 94,248 | $ | 131,748 | ||||||
Arthur Laffer | $ | 27,500 | $ | 94,248 | $ | 121,748 | ||||||
Catherine Wood | $ | 8,600 | (1) | — | $ | 8,600 | ||||||
| (1) | Ms. Wood joined our board on July 27, 2020. This reflects her pro-rated fee based on annual compensation of $20,000. |
| (2) | These restricted stock units were granted on May 11, 2020 and will vest on May 11, 2021, the first anniversary of the grant date. The grant date fair value of each award was equal to the NAV value of our common stock on the date of grant as calculated in accordance with FASB ASC Topic 718. Pursuant to the rules of the SEC, the amounts shown in this column exclude the impact of estimated forfeitures related to service-based vesting conditions. See Note 7 to our consolidated financial statements included in this Form 10 for information regarding the assumptions made in determining these values. As of December 31, 2020, our non-management directors (except for Ms. Wood) each held 3,058 restricted stock units. |
84
Compensation of Our Executive Officers in 2020
We are externally managed by our Adviser pursuant to the Advisory Agreement. In addition, our properties are managed by our Manager pursuant to the Management Agreements and Side Letter. Because our officers are employed by either our Adviser or our Manager, our officers have not received, nor do we expect they will in the future receive, any cash compensation from us for their services as our officers. The Company does not reimburse and does not plan to reimburse our Adviser for salary or benefits paid to the Company’s named executive officers. Instead, we pay our Adviser the fees described under Item 7. “Certain Relationships and Related Transactions—Transactions with Related Persons; Policies—Advisory Agreement” and our Manager the fees described under Item 7. “Certain Relationships and Related Transactions—Transactions with Related Persons; Policies—Management Agreements.” For the year ended December 31, 2020, we paid approximately $3.3 million and $4.6 million in fees to our Adviser and our Manager, respectively.
The LTIP authorizes our Board to provide equity-based compensation in the form of stock options, appreciation rights, restricted stock, restricted stock units, performance shares, performance units, profits interest units and certain other awards denominated or payable in, or otherwise based on, our common stock or factors that may influence the value of our common stock, plus cash incentive awards, for the purpose of providing our officers, our non-management directors, and potentially certain non-employees who perform employee-type functions, incentives and rewards for performance.
The restricted stock units granted under the LTIP vest according to the respective award agreement and typically contain time-based vesting provisions subject to continued employment and partial vesting at the successful completion of an initial public offering of our common stock. See “—Outstanding Equity Awards at Fiscal Year End” below for additional detail regarding vesting provisions. In the event of any officer’s employment with us or our Manager or Adviser, as applicable, is terminated involuntarily by our Manager or Adviser, as applicable, for reasons other than for cause, by the officer for good reason, or otherwise due to such officer’s death, disability or retirement, all outstanding restricted stock units that have not previously vested or been forfeited, will vest. In addition, in the event of a change of control under the LTIP, all outstanding restricted stock units that have not previously vested or been forfeited will vest following the passing of a specified waiting period. See “—Potential Payments upon Termination of Employment or Change of Control” below for additional information about changes of control under the LTIP.
Outstanding Equity Awards at Fiscal Year End
The following table contains information regarding outstanding equity awards held by our officers as of December 31, 2020:
NAME | STOCK AWARDS | |||||||
| NUMBER OF SHARES THAT HAVE NOT VESTED (#) | MARKET VALUE OF SHARES THAT HAVE NOT VESTED ($) (1) | |||||||
James Dondero | 74,911 | (2) | $ | 2,738,746 | ||||
Matt McGraner | 74,911 | (3) | $ | 2,738,746 | ||||
Brian Mitts | 29,537 | (4) | $ | 1,079,873 | ||||
| (1) | Market value is based on the NAV of our common stock as of December 31, 2020 ($36.56). |
| (2) | Consists of restricted stock units granted on December 10, 2019 and May 11, 2020. With respect to the restricted stock units granted on December 10, 2019, as of December 31, 2020, |
85
| there were 16,997 restricted stock units not vested, which will vest one-third on December 10, 2021, one-third on December 10, 2022 and one-third on December 10, 2023. With respect to the restricted stock units granted on May 11, 2020, as of December 31, 2020, there were 57,914 restricted stock units not vested, which will vest one-eighth on May 11, 2021, one-eighth on May 11, 2022, one-eighth on May 11, 2023, one-eighth on May 11, 2024 and one-half on the date of the successful completion of an initial public offering of our common stock. |
| (3) | Consists of restricted stock units granted on December 10, 2019 and May 11, 2020. With respect to the restricted stock units granted on December 10, 2019, as of December 31, 2020, there were 16,997 restricted stock units not vested, which will vest one-third on December 10, 2021, one-third on December 10, 2022 and one-third on December 10, 2023. With respect to the restricted stock units granted on May 11, 2020, as of December 31, 2020, there were 57,914 restricted stock units not vested, which will vest one-eighth on May 11, 2021, one-eighth on May 11, 2022, one-eighth on May 11, 2023, one-eighth on May 11, 2024 and one-half on the date of the successful completion of an initial public offering of our common stock. |
| (4) | Consists of restricted stock units granted on December 10, 2019 and May 11, 2020. With respect to the restricted stock units granted on December 10, 2019, as of December 31, 2020, there were 10,502 restricted stock units not vested, which will vest one-third on December 10, 2021, one-third on December 10, 2022 and one-third on December 10, 2023. With respect to the restricted stock units granted on May 11, 2020, as of December 31, 2020, there were 19,034 restricted stock units not vested, which will vest one-eighth on May 11, 2021, one-eighth on May 11, 2022, one-eighth on May 11, 2023, one-eighth on May 11, 2024 and one-half on the date of the successful completion of an initial public offering of our common stock. |
Pension Benefits
We do not provide any of our officers with pension benefits.
Nonqualified Deferred Compensation
We do not provide any of our officers with any nonqualified deferred compensation plans.
Potential Payments Upon Termination of Employment or Change in Control
In the event any officer’s employment with our Adviser is terminated involuntarily by the Adviser for reasons other than for cause or otherwise due to such officer’s death, disability (as defined in the Restricted Stock Units Agreement) or retirement (as defined in the Restricted Stock Units Agreement), all outstanding restricted stock units that have not previously vested or been forfeited, will vest, in each case conditioned upon timely execution of certain releases of claims and related requirements as further described in the LTIP and following the passing of a specified waiting period. In addition, in the event our Adviser is terminated or internalized, that termination or internalization will be deemed a change in control under the LTIP. If a change in control occurs, all outstanding restricted stock awards held by our officers that have not previously vested or been forfeited, will vest following the passing of a specified waiting period. See “—Outstanding Equity Awards at Fiscal Year-End” above for the market value of outstanding restricted stock units as of December 31, 2020 that would have vested if any of the events described above occurred on December 31, 2020.
In general, except as may be otherwise prescribed in the applicable award agreement, the LTIP provides that a change of control will be deemed to have occurred if: (a) a person or group becomes the beneficial owner of 50.1% or more of the then-outstanding shares of our common stock or the combined voting power of our then-outstanding securities entitled to vote generally in the election of directors, subject to certain exceptions (an “Ownership Change”), (b) we close a reorganization, merger, consolidation, significant sale or purchase of assets or other similar transaction resulting in a substantial change in our ownership or leadership, in each case which causes either (i) the persons or groups who are the beneficial owners of 50.1% or more of the then-outstanding shares of our common stock or the combined voting power of our then-outstanding securities entitled to vote generally in the election of directors to cease to be such beneficial owners of the entity resulting from such transaction, in substantially the same proportions of ownership as immediately prior to such transaction, or (ii) a person or group to become the beneficial owner of 50.1% or more of the outstanding shares of common stock or the combined voting power of the outstanding securities entitled to vote generally in the election of directors of the entity resulting from such transaction, subject to certain exceptions, in each case as further described in the LTIP, or (c) our stockholders approve our complete liquidation or dissolution. Each of the applicable award agreements for restricted stock units provide that an Ownership Change will only be deemed to have occurred if a person or group becomes the beneficial owner of 75% or more of the then-outstanding shares of our common stock or the combined voting power of our then-outstanding securities entitled to vote generally in the election of directors, subject to certain exceptions.
86
Compensation Committee Interlocks and Insider Participation
Other than Mr. Dondero and Mr. Mitts, none of our executive officers has served as a member of the board of directors or compensation committee of any related entity that has one or more executive officers serving on our Board. Other than Mr. Dondero, Mr. Mitts and Mr. Sprong, no director who served as a member of our Board during the prior fiscal year (1) was during such year, or had previously been, an officer or employee of the Company or any of our subsidiaries or (2) had any material interest in a transaction of the Company or a business relationship with, or any indebtedness to, the Company.
87
| ITEM 7. | CERTAIN RELATIONSHIPS AND RELATED TRANSACTIONS, AND DIRECTOR INDEPENDENCE. |
Transactions with Related Persons
Advisory Agreement
Our Adviser acts as our adviser under the Advisory Agreement. Pursuant to the Advisory Agreement, we pay our Adviser, on a monthly basis in arrears, an advisory fee at an annualized rate of 0.75% of our gross asset value. Gross asset value means the value of our total assets as determined in accordance with GAAP on an unconsolidated basis plus our pro rata share of leverage at our Operating Partnership. Our Adviser manages our operations and its responsibilities include, among other duties, recommending distributions and related amounts to our Board, preparing our quarterly consolidated unaudited financial statements and annual consolidated financial statements prepared under GAAP, managing our annual audit, developing and maintaining appropriate internal accounting controls, maintaining our REIT status, calculating our NAV, processing purchases and redemptions of shares of our common stock, reporting to investors, preparing our tax filings, raising capital for us, procuring debt financing and other responsibilities customary for an external advisor to an SFR REIT.
Additionally, we are required to pay directly or reimburse our Adviser for all of the documented “operating expenses” (all out-of-pocket expenses of our Adviser in performing services for us, including but not limited to the expenses incurred by our Adviser in connection with any provision by our Adviser of legal, accounting, financial and due diligence services performed by our Adviser that outside professionals or outside consultants would otherwise perform, compensation expenses under our LTIP and our pro rata share of rent, telephone, utilities, office furniture, equipment, machinery and other office, internal and overhead expenses of our Adviser required for our operations) and “offering expenses” (any and all expenses (other than underwriters’ discounts) paid or to be paid by us in connection with an offering of our securities, including, without limitation, our legal, accounting, printing, mailing and filing fees and other documented offering expenses) paid or incurred by our Adviser or its affiliates in connection with the services it provides to us pursuant to the Management Agreements.
Reimbursement of operating expenses plus the advisory fees paid to our Adviser, may not exceed 1.5% of our average total gross asset value for any calendar year or portion thereof, provided, however, that this limitation will not apply to legal, accounting, financial, due diligence and other service fees incurred in connection with extraordinary litigation, an initial public offering of our equity securities, an internalization, mergers and acquisitions and other events outside our ordinary course of business or any out-of-pocket acquisition or due diligence expenses incurred in connection with the acquisition or disposition of real estate assets. Average total gross asset value means the average of the total assets of the Company and our Operating Partnership, as determined in accordance with GAAP on a consolidated basis, at the end of each month (or partial month) (1) for which any fee under the Advisory Agreement is calculated or (2) during the year for which any expense reimbursement under the Advisory Agreement is calculated.
For the years ended December 31, 2020 and 2019, we incurred advisory and administrative fees of approximately $3.3 million and $1.7 million, respectively.
88
The Advisory Agreement may be terminated with 180 days’ notice prior to the expiration of the then-current term, without cause, by either us or our Adviser. In addition, we may terminate the Advisory Agreement 30 days after the delivery of written notice to our Adviser stating that a Cause Event (as defined in the Advisory Agreement) has occurred. Our Adviser may terminate the Advisory Agreement (1) 30 days after written notice has been delivered to us if we default in the performance or observance of any material term, condition or covenant contained in the Advisory Agreement and such default has continued for a period of 30 days after receipt of written notice by us of such default or (2) by giving written notice to us in the event that any of our Adviser’s designees are not elected or appointed to our Board pursuant to the terms of the Advisory Agreement. The Advisory Agreement automatically terminates upon an internalization. If the Advisory Agreement is terminated other than as a result of a Cause Event or an internalization, our Adviser will be entitled to a termination fee (the “Adviser Termination Fee”) in the amount of three times the annual advisory fee earned by our Adviser for the trailing 12-month period prior to the termination. In instances where the Advisory Agreement is terminated as a result of a Cause Event or internalization, no Adviser Termination Fee is owed.
If we and our Adviser agree to internalize our Adviser, we will purchase all of the outstanding partnership interests of our Adviser and pay our Adviser the internalization fee in stock of the Company. The internalization fee equals three times the sum of the annual advisory fee for the trailing 12-month period as of the month end immediately preceding the date we and our Adviser agree to the internalization; provided, however, the fee shall be capped at 2.5% of the combined equity value of the Company and the Operating Partnership on a consolidated basis at the time of the internalization.
Under the Advisory Agreement, we are also required to indemnify our Adviser and pay or reimburse reasonable expenses in advance of final disposition of a proceeding with respect to certain of our Adviser’s acts or omissions.
Management Agreements and Side Letter
Pursuant to the Management Agreements, our Manager is generally the sole and exclusive manager for our properties (subject to the terms of the Management Agreements). Our Manager is responsible for the day-to-day management of the properties, leasing the properties, managing tenant situations, collecting rents, paying operating expenses, managing maintenance issues, accounting for each property using GAAP, and other responsibilities customary for the management of SFR properties. In addition, subject to the limitations set forth in the OP LPA and oversight from the Investment Committee, our Manager is primarily responsible for the identification of potential SFR properties and the acquisition and disposition of SFR properties.
Monthly in arrears, our Manager is entitled to (1) an acquisition fee equal to 1.0% of the gross purchase price paid for any new property acquired during the month, (2) a construction fee monthly in arrears that shall not exceed the greater of 10% of construction costs or $1,000, whichever is higher, in connection with the repair, renovation, improvement or development of any property acquired during the month, and (3) a property management fee equal to a percentage of collected rental revenues for all properties managed during the month as follows:
| • | 8.0% of collected rental revenue up to and including $45 million on an annualized basis; |
| • | 7.0% of the incremental collected rental revenue above $45 million but below and including $65 million on an annualized basis; |
89
| • | 6.0% of the incremental collected rental revenue above $65 million but below and including $85 million on an annualized basis; and |
| • | 5.0% of the incremental collected rental revenue above $85 million on an annualized basis. |
As agreed by our Manager in the Side Letter, the Manager’s EBITDA (as defined in the Management Agreements) derived from management fees in any fiscal year is capped at the greater of (1) $1.0 million (the “Dollar Cap”) and (2) 0.5% of the combined equity value of the Company and our Operating Partnership on a consolidated basis per fiscal year (“Equity Cap”). The Dollar Cap or Equity Cap, as applicable, will be paid (1) in cash in an amount equal to the tax obligations of our Manager’s equityholders resulting from the aggregate management fees earned in such fiscal year (up to a maximum rate of 25%) and (2) with respect to the remaining portion of the Dollar Cap or Equity Cap, as applicable, in the form of OP Units issued to our Manager at a price per OP Unit equal to the Cash Amount (as defined in the OP LPA) as of the applicable date. The Equity Cap will reset each year as of the first business day of the fiscal year.
For the years ended December 31, 2020 and 2019, we incurred property management fees of approximately $4.6 million and $3.2 million, respectively.
Any Management Agreement may be terminated with 90 days’ notice without cause. In addition, all Management Agreements will automatically terminate upon (1) the sale or transfer of all or substantially all of the properties in our Portfolio or (2) the occurrence of a bankruptcy event with respect to our Manager. If a Management Agreement is terminated without cause or as a result of all or substantially all of the property being sold, our Manager will be entitled to a termination fee (the “Manager Termination Fee”) in the amount of three times the annual property management fee for the trailing 12-month period prior to the termination, with such Manager Termination Fee paid in cash. In instances where a Management Agreement is terminated for cause as the result of an uncured breach, no Manager Termination Fee is owed.
The entities that own the properties are required to indemnify, defend and hold harmless the Manager and its agents and employees from and against all claims, liabilities, losses, damages, and/or expenses arising out of (1) the Manager’s performance under the Management Agreements, or (2) facts, occurrences, or matters first arising before the date of the Management Agreements. The entities that own the properties are not required to indemnify the Manager against damages or expenses suffered as a result of the gross negligence, willful misconduct, or fraud on the part of the Manager, its agents, or employees.
The Manager is required to indemnify, defend, and hold harmless the entities that own the properties and their agents and employees from and against all claims, liabilities, losses, damages, and/or expenses arising out of the gross negligence, willful misconduct, or fraud on the part of the Manager, its agents, or employees, and shall at its own cost and expense defend any action or proceeding against us arising therefrom.
We have the right to acquire our Manager pursuant to the terms of the Side Letter. We will pay our Manager a fee equal to three times the annualized property management fee for the trailing 12-months’ property management fee reduced by $6,500,000 (the “Legacy Value”), then further reduced by 50% and then increased by the Legacy Value (the “Manager Internalization Fee”). The Manager Internalization Fee is capped at 2.5% of the combined equity value of the Company and the Operating Partnership combined at the time we exercise our right to acquire our Manager.
90
Pursuant to the Side Letter, the Manager may request from the Operating Partnership from time-to-time an advance on acquisition and construction fees (the “Fee Advances”) to fund the performance of its obligations under the Management Agreements. Each Fee Advance is repaid from future acquisition and construction fees earned by and owed to the Manager. Fee Advances are included in the line item Due from Manager on the consolidated balance sheets. As of December 31, 2020, the Company recorded no receivable for Fee Advances. As of December 31, 2019, the Company recorded a receivable on the consolidated balance sheet due from the Manager for Fee Advances of approximately $0.2 million.
Pursuant to the Side Letter, in the event the Manager does not have sufficient cash flow from operations to meet its budgeted obligations under the Management Agreements, the Manager may from time-to-time request from the Company a temporary loan (the “Backstop Loan”) to satisfy the shortfall. Backstop Loans are interest free, may be prepaid at any time and may not exceed a principal amount that is in the aggregate equal to the lesser of the Manager Internalization Fee or the Manager Termination Fee under the applicable Management Agreement. Unless otherwise repaid, each Backstop Loan is payable upon termination of the applicable Management Agreement. Backstop Loans are included in the line item Due from Manager on the consolidated balance sheets. As of December 31, 2020 and 2019, the Company recorded a receivable for Backstop Loans made to the manager of approximately $0.7 million and approximately $0.7 million, respectively.
Dealer Manager Fees
Investors in our Private Offering may be charged a dealer manager fee of between 0.50% and 3.00% of gross investor equity by the Dealer Manager for sales of shares in the Private Offering, subject to certain breakpoints and various terms of the agreements with the Dealer Manager. The Dealer Manager may re-allow the dealer manager fee, in whole or in part in its sole discretion, to one or more broker-dealers. At the sole discretion of the Dealer Manager, the dealer manager fee may be partially or fully waived. The Dealer Manager is an affiliate of the Adviser.
NexBank
The Company and the Operating Partnership maintain bank accounts with an affiliate of the Adviser, NexBank. NexBank charges no recurring maintenance fees on the accounts.
NREO Note
On August 22, 2019, the Company, through the Operating Partnership, entered into the approximately $1.3 million NREO Note with NREO, who is an affiliate of the Adviser. The NREO Note bears interest at a variable rate equal to LIBOR plus 2.25% and is full interest-only. The NREO Note is convertible at any time to equity at the election of the Company or upon its maturity on September 19, 2022. On January 26, 2021, the Company, through the Operating Partnership, paid down the principal of approximately $1.3 million and accrued interest of approximately $0.1 million on the NREO Note. This extinguished the NREO Note.
91
Conflicts of Interest
The following briefly summarizes the material potential and actual conflicts of interest which may arise from the overall investment activity of our Adviser and its respective clients and affiliates and our Manager, but is not intended to be an exhaustive list of all such conflicts. The scope of the activities of the affiliates of our Adviser and the funds and clients advised by affiliates of our Adviser may give rise to conflicts of interest or other restrictions and/or limitations imposed on us in the future that cannot be foreseen or mitigated at this time.
Manager Conflicts of Interest
Under our Management Agreement, our Manager is entitled to fees that are structured in a manner intended to provide incentives to our Manager to perform in our best interest and in the best interest of our stockholders. However, because performance is only one aspect of our Manager’s compensation, our Manager’s interests are not wholly aligned with those of our stockholders. In that regard, our Manager could be motivated to recommend riskier or more speculative investments that would entitle our Manager to a higher fee. For example, because management fees payable to our Manager are based in part on the purchase price paid for any new property acquisitions, our Manager may have an incentive to acquire a large number of new properties at a higher price in order to increase its fees. Externally managed REITs may also have conflicts of interest with their advisors that are not common with self-managed REITs.
Advisor Conflicts of Interest
Under our Advisory Agreement, our Adviser is entitled to an annual advisory fee at an annualized rate of 0.75% of our gross asset value, as well as reimbursement for all out-of-pocket expenses of our Adviser in performing services for us, subject to an expense cap. The advisory fee is structured in a manner intended to provide incentives to our Adviser to perform in our best interest and in the best interest of our stockholders. In that regard, our Adviser could be motivated to recommend riskier or more speculative investments that would entitle our Adviser to a higher fee. For example, because advisory fees payable to our Adviser are based on gross asset value of the Company, our Adviser may have incentive to acquire a large number of new properties in order to increase its fees. However, because affiliates of the Adviser own, and may continue to own in the future, other properties outside the Portfolio, it is possible that conflicts of allocation of services and costs may arise. Externally managed REITs may also have conflicts of interest with their advisors that are not common with self-managed REITs.
Other Accounts and Relationships
As part of their regular business, our Adviser, its affiliates and their respective officers, directors, trustees, stockholders, members, partners and employees and their respective funds and investment accounts (collectively, the “Related Parties”) hold, purchase, sell, trade or take other related actions both for their respective accounts and for the accounts of their respective clients, on a principal or agency basis, subject to applicable law with respect to loans, securities and other investments and financial instruments of all types. The Related Parties also provide investment advisory services, among other
92
services, and engage in private equity, real estate and capital markets-oriented investment activities. The Related Parties are not restricted in their performance of any such services or in the types of debt, equity, real estate or other investments which they may make. The Related Parties may have economic interests in or other relationships with respect to investments made by us. In particular, the Related Parties may make and/or hold an investment, including investments in securities, that may compete with, be pari passu, senior or junior in ranking to an, investment, including investments in securities, made and/or held by us or in which partners, security holders, members, officers, directors, agents or employees of such Related Parties serve on boards of directors or otherwise have ongoing relationships. Each of such ownership and other relationships may result in restrictions on transactions by us and otherwise create conflicts of interest for us. In such instances, the Related Parties may in their discretion make investment recommendations and decisions that may be the same as or different from those made with respect to our investments. In connection with any such activities described above, the Related Parties may hold, purchase, sell, trade or take other related actions in securities or investments of a type that may be suitable for us. The Related Parties are not required to offer such securities or investments to us or provide notice of such activities to us. In addition, in managing our business, our Adviser may take into account its relationship or the relationships of its affiliates with obligors and their respective affiliates, which may create conflicts of interest. Furthermore, in connection with actions taken in the ordinary course of business of our Adviser in accordance with its fiduciary duties to its other clients, our Adviser may take, or be required to take, actions which adversely affect our interests.
The Related Parties have invested and may continue to invest in investments that would also be appropriate for us. Such investments may be different from those made on our behalf. Neither our Adviser nor any Related Party has any duty, in making or maintaining such investments, to act in a way that is favorable to us or to offer any such opportunity to us, subject to our Adviser’s allocation policy set forth below. The investment policies, fee arrangements and other circumstances applicable to such other parties may vary from those applicable to us. Our Adviser and/or any Related Party may also have ongoing relationships with, render services to or engage in transactions with other clients, including: NREF, a publicly traded commercial mortgage REIT listed on the NYSE; NHT, a publicly traded hospitality REIT listed on the TSXV; NXRT, a publicly traded REIT listed on the NYSE; REITs that are wholly owned subsidiaries of registered investment companies advised by our Adviser and its affiliates; and other REITs, who make investments of a similar nature as we do, and with companies whose securities or properties are acquired by us and may own equity or debt securities issued by our joint ventures. In connection with the foregoing activities our Adviser and/or any Related Party may from time to time come into possession of material nonpublic information that limits the ability of our Adviser to effect a transaction for us, and our investments may be constrained as a consequence of our Adviser’s inability to use such information for advisory purposes or otherwise to effect transactions that otherwise may have been initiated on behalf of its clients, including us. In addition, officers or affiliates of our Adviser and/or Related Parties may possess information relating to our joint ventures that is not known to the individuals at our Adviser responsible for monitoring our joint ventures and performing the other obligations under the Advisory Agreement. Further, the Related Parties currently provide services to and may in the future provide services to other REITs or funds that compete with us for similar investments.
Although the professional staff of our Adviser will devote as much time to our business and investments as our Adviser deems appropriate to perform its duties in accordance with the Advisory Agreement and in accordance with reasonable commercial standards, the staff may have conflicts in allocating its time and services among us and any Related Parties’ other accounts.
93
The directors, officers, employees and agents of the Related Parties, and our Adviser may, subject to applicable law, serve as directors (whether supervisory or managing), officers, employees, partners, agents, nominees or signatories, and receive arm’s length fees in connection with such service, for us or any Related Party, or for any of our investments or any affiliate thereof, and neither we nor our stockholders have the right to any such fees.
The Related Parties serve or may serve as officers, directors or principals of entities that operate in the same or a related line of business as us, or of other investment funds managed by our Adviser or its affiliates. In serving in these multiple capacities, they may have obligations to other clients or investors in those entities, the fulfillment of which may not be in our best interest. We may compete with other entities managed by our Adviser and its affiliates for capital and investment opportunities.
There is no limitation or restriction on our Adviser or any of its Related Parties with regard to acting as investment manager (or in a similar role) to other parties or persons. This and other future activities of our Adviser and/or its Related Parties may give rise to additional conflicts of interest. Such conflicts may be related to obligations that our Adviser or its affiliates have to other clients.
Subject to prior approval of our Board, certain Related Parties, including NexBank and NexPoint Securities, Inc. among others, may provide banking, dealer manager, agency, insurance and other services to us and our operating affiliates for customary fees, and neither we, nor our subsidiaries will have a right to any such fees.
Allocation Policy
If a potential investment is appropriate for either us or another entity managed by our Adviser or its affiliates, such as Highland Income Fund, which as of December 31, 2020 has approximately $1.31 billion of assets under management, NHF, which as of December 31, 2020 has approximately $854.1 million of assets under management, NRESF, which as of December 31, 2020 has approximately $17.0 million of assets under management, NexPoint Capital, which as of December 31, 2020 has approximately $64.2 million of assets under management, Highland Global Allocation Fund, which as of December 31, 2020 has approximately $241.6 million of assets under management, NREF, which as of December 31, 2020 has a combined unpaid principal balance of approximately $2.9 billion under management, NXRT, which as of December 31, 2020 has an enterprise value of approximately $2.3 billion, and NHT, which as of December 31, 2020 has an enterprise value of approximately $332.9 million, our Adviser and its affiliates, including their respective personnel, have an allocation policy that provides that opportunities will be allocated among those accounts for which participation in their respective opportunity is considered most appropriate, taking into account the following objective factors.
First, the allocation policy looks to the investment objectives of the REITs managed by our Adviser and its affiliates. For example, our targeted investments differ from the targeted investments of NXRT, which generally are direct ownership of well-located middle-income multifamily properties with value-add potential. We believe that most investment opportunities will be more appropriate for us, NXRT or other entities based on the differences in our primary investment objectives. We expect we will remain the primary vehicle in which investments are made in SFR assets. Our Adviser is not required to offer to us any opportunities that do not meet our investment objectives and criteria. Personnel of our Adviser and its affiliates may invest in any such investment opportunities not required to be presented to us.
94
To the extent the opportunity is consistent with the investment objectives of more than one REIT managed by our Adviser and its affiliates, the allocation policy then looks to other factors, such as:
| • | which REIT has available cash (including availability under lines of credit) to acquire the investment; |
| • | whether there are any positive or negative income tax effects on any of the REITs relating to the purchase; |
| • | whether the investment opportunity creates geographic, asset class or tenant concentration / diversification concerns for any of the REITs; |
| • | how the investment size, potential leverage, transaction structure and anticipated cash flows affect each REIT, including earnings and distribution coverage; and |
| • | whether one or more of the REITs has an existing relationship with the tenant(s), operator, facility or system associated with the investment, or a significant geographic presence that would make the investment strategically more important. |
Our Adviser will allocate investment opportunities across the entities for which such opportunities are appropriate, consistent with its internal conflict of interest and allocation policies. Our Adviser will seek to allocate investment opportunities among such entities in a manner that is fair and equitable over time and consistent with its allocation policy. However, there is no assurance that such investment opportunities will be allocated to us fairly or equitably in the short-term or over time, and there can be no assurance that we will be able to participate in all such investment opportunities that are suitable for us.
Cross Transactions and Principal Transactions
As further described below, our Adviser may effect client cross-transactions where our Adviser causes a transaction to be effected between us and another client advised by our Adviser or any of its affiliates. Our Adviser may engage in a client cross-transaction involving us any time that our Adviser believes such transaction to be fair to us and the other client of our Adviser or its affiliates in accordance with our Adviser’s internal written cross-transaction policies and procedures.
As further described below, our Adviser may effect principal transactions where we may make and/or hold an investment, including an investment in securities, in which our Adviser and/or its affiliates have a debt, equity or participation interest, in each case in accordance with applicable law and with our Adviser’s internal written policies and procedures for principal transactions, which may include our Adviser obtaining our consent and approval prior to engaging in any such principal transaction between us and our Adviser or its affiliates.
95
Our Adviser may direct us to acquire or dispose of investments in cross trades between us and other clients of our Adviser or its affiliates in accordance with applicable legal and regulatory requirements. In addition, we may make and/or hold an investment, including an investment in securities, in which our Adviser and/or its affiliates have a debt, equity or participation interest, and the holding and sale of such investments by us may enhance the profitability of our Adviser’s own investments in such companies. Moreover, we, along with our operating affiliates, may invest in assets originated by, or enter into loans, borrowings and/or financings with our Adviser or its affiliates, including but not limited to NexBank and NexPoint Securities, Inc., including in primary and secondary transactions with respect to which our Adviser or a Related Party may receive customary fees from the applicable issuer, and neither we nor our subsidiaries have the right to any such fees. In each such case, our Adviser and such affiliates may have a potentially conflicting division of loyalties and responsibilities regarding us and the other parties to such investment. Under certain circumstances, our Adviser and its affiliates may determine that it is appropriate to avoid such conflicts by selling an investment at a fair value that has been calculated pursuant to our Adviser’s valuation procedures to another fund managed or advised by our Adviser or such affiliates. In addition, our Adviser may enter into agency cross-transactions where it or any of its affiliates acts as broker for us and for the other party to the transaction, to the extent permitted under applicable law. Our Adviser may obtain our written consent as provided herein if any such transaction requires the consent of our Board.
Participation in Creditor Committees, Underwriting and Other Activities
Our Adviser and/or its Related Parties may participate in creditors or other committees with respect to the bankruptcy, restructuring or workout or foreclosure of our investments. In such circumstances, our Adviser may take positions on behalf of itself or Related Parties that are adverse to our interests.
Our Adviser and/or its Related Parties may act as an underwriter, arranger or placement agent, or otherwise participate in the origination, structuring, negotiation, syndication or offering of investments purchased by us. Such transactions are on an arm’s-length basis and may be subject to arm’s-length fees. There is no expectation for preferential access to transactions involving investments that are underwritten, originated, arranged or placed by our Adviser and/or its Related Parties and neither we nor our stockholders have the right to any such fees.
Material Non-Public Information
There are generally no ethical screens or information barriers among our Adviser and certain of its affiliates of the type that many firms implement to separate persons who make investment decisions from others who might possess material, non-public information that could influence such decisions. If our Adviser, any of its personnel or its affiliates were to receive material non-public information about an investment or issuer, or have an interest in causing us to acquire a particular investment, our Adviser may be prevented from causing us to purchase or sell such asset due to internal restrictions imposed on our Adviser. Notwithstanding the maintenance of certain internal controls relating to the management of material non-public information, it is possible that such controls could fail and result in our Adviser, or one of its investment professionals, buying or selling an asset while, at least constructively, in possession of material non-public information. Inadvertent trading on material non-public information could have adverse effects on our Adviser’s reputation, result in the imposition of regulatory or financial sanctions,
96
and as a consequence, negatively impact our Adviser’s ability to perform its investment management services to us. In addition, while our Adviser and certain of its affiliates currently operate without information barriers on an integrated basis, such entities could be required by certain regulations, or decide that it is advisable, to establish information barriers. In such event, our Adviser’s ability to operate as an integrated platform could also be impaired, which would limit our Adviser’s access to personnel of its affiliates and potentially impair its ability to manage our investments.
Other Benefits to Our Adviser and Manager
Our LTIP provides us with the ability to grant awards to directors and officers of, and certain consultants to, us, our Adviser, our Manager and their respective affiliates and other entities that provide services to us. The management team of our Adviser or our Manager may receive awards under the LTIP and will benefit from the compensation provided by these awards.
In addition to the compensation provided to our Adviser by the Advisory Agreement and any long-term incentive plan, our Adviser may also receive reputational benefits from our future growth through capital-raising transactions and acquisitions. The reputational benefit to our Adviser from our future growth could assist our Adviser and its affiliates in pursuing other real estate investments. These investments could be made through other entities managed by our Adviser or its affiliates, and there can be no assurance that we will be able to participate in all such investment opportunities.
In addition to the compensation provided to our Manager by the Management Agreement and any long-term incentive plan, our Manager may also receive reputational benefits from our future growth. Our Manager will also have an incentive to raise capital and cause us to acquire additional assets, which would then contribute to the management fee. The reputational benefit to our Manager from our future growth could assist our Manager and its affiliates in pursuing other real estate investments.
Director Independence
For information relating to our independent directors, see Item 5. “Directors and Executive Officers—Board of Directors” of this Form 10.
97
| ITEM 8. | LEGAL PROCEEDINGS. |
We are not currently a party to any legal proceedings which, individually or in the aggregate, would be expected to have a material effect on our business, financial condition, results of operations, or financial statements, taken as a whole, if determined adversely to us.
98
| ITEM 9. | MARKET PRICE OF AND DIVIDENDS ON THE REGISTRANT’S COMMON EQUITY AND RELATED STOCKHOLDER MATTERS. |
Market Information
There is no established trading market for our shares of common stock and we do not expect a public market to develop. We have not agreed to register for sale under the Securities Act any shares of our common stock. No shares of our common stock have been or are currently expected to be publicly offered by us. As of March 31, 2021, 6,620,662 shares of our common stock, subject to obtaining the prior written consent of the Company, and no shares of our Series A Preferred Stock issued in the Preferred Offering may be sold pursuant to Rule 144 of the Exchange Act. See Item 10. “Recent Sales of Unregistered Securities—Common Stock and Common Stock DRIP” and Item 10. “Recent Sales of Unregistered Securities—6.50% Series A Cumulative Redeemable Preferred Stock.”
Stockholders
As of March 31, 2021, there were 2,683 holders of shares of our common stock.
Long Term Incentive Plan
Our Board and stockholders adopted the LTIP whereby our Board may grant awards based on our common stock or OP Units (including profits interest units) to certain directors, officers and other key employees and advisors of us and our affiliates to provide them incentives to increase stockholder value and reward performance. The LTIP reserves 10% of the number of OP Units, with a minimum of 426,307 shares (the “Share Reserve”). The Share Reserve will automatically increase on January 1st of each year, for a period of not more than five years, commencing on January 1, 2019 to an amount equal to 10% of the total number of OP Units outstanding on December 31st of the precedent calendar year; provided, our Board may act prior to January 1st of a given year to provide that there will be no January 1st increase in the Share Reserve for such year or that the increase in the Share Reserve for such year will be a lesser number of shares. Grants may be made annually by our Board or more or less frequently in our Board’s sole discretion. Vesting of grants made under the LTIP will occur ratably over a period of time as determined by our Board and may include the achievement of performance metrics also as determined by our Board. The awards granted will be valued based on the then-current NAV at the date of grant.
As of March 31, 2021, 345,290 profits interest units in our Operating Partnership have been granted to certain employees of our Manager, 18,942 restricted stock units and 6,699 profits interests units have been granted to our non-management directors and 426,122 restricted stock units have been granted to certain employees of our Adviser.
99
The following table provides certain information as of the end of our most recently completed fiscal year with respect to compensation plans (including any individual compensation arrangements, of which there are none) under which our equity securities are authorized for issuance, aggregated as follows:
Plan category | Number of securities to be | Weighted-average | Number of securities remaining | |||
| Equity compensation plans approved by securityholders | ||||||
| LTIP | 587,122 shares of the Company’s common stock (1) | N/A | 162,537 shares of the Company’s common stock | |||
| Equity compensation plans not approved by security holders | ||||||
None | — | N/A | — | |||
Total | 587,122 shares of the Company’s common stock | N/A | 162,537 shares of the Company’s common stock |
| (1) | Represents 235,133 restricted stock units granted under our LTIP and 351,989 profits interests units granted under our LTIP. |
Distributions
We intend to declare dividends on our shares of common stock on a monthly basis, payable on the last business day of each fiscal quarter end (although our Board may elect to modify the frequency or suspend the declaration and payment of dividends). U.S. federal income tax law generally requires that a REIT distribute annually at least 90% of its REIT taxable income, without regard to the deduction for dividends paid and excluding net capital gains. As a REIT, we are subject to federal income tax on our undistributed REIT taxable income and net capital gain and to a 4% nondeductible excise tax on any amount by which distributions we pay with respect to any calendar year are less than the sum of (1) 85% of our ordinary income, (2) 95% of our capital gain net income and (3) 100% of our undistributed income from prior years. We intend to make regular quarterly dividend payments of all or substantially all of our taxable income to holders of our common stock out of assets legally available for this purpose, if and to the extent authorized by our Board.
Before we make any dividend payments, whether for U.S. federal income tax purposes or otherwise, we must first meet both our operating requirements and debt service on our debt payable. If our cash available for distribution is less than our taxable income, we could be required to sell assets, borrow funds or raise additional capital to make cash dividends or we may make a portion of the required dividend in the form of a taxable distribution of stock or debt securities.
100
ITEM 10. RECENT SALES OF UNREGISTERED SECURITIES.
Common Stock and Common Stock DRIP
On August 28, 2018, we commenced a continuous private placement of up to 40,000,000 shares of our common stock pursuant to the safe harbor of Rule 506(b) of Regulation D under Section 4(a)(2) of the Securities Act (the “Private Offering”). The securities are being offered and sold only to purchasers who are “accredited investors,” as defined in Rule 501 of Regulation D of the Securities Act.
Each investor in the Private Offering is required to make certain representations to us, including that such investor is an “accredited investor”, as defined in Rule 501(a) under the Securities Act, and that such investor is acquiring our common stock for such investor’s own account, for investment purposes only and not with a view to its distribution.
As of March 31, 2021, we have issued 11,533,512 shares of common stock through the Private Offering and under our DRIP, including 411,577 shares issued under our DRIP, resulting in gross offering proceeds of approximately $370.2 million. As of March 31, 2021, we have paid (or Raymond James has collected upfront) an aggregate of approximately $15.7 million in selling commissions and we have incurred approximately $2.0 million in additional offering expenses, resulting in net proceeds to us of approximately $352.4 million. No underwriting discount or commission is applicable to sales through the common stock DRIP. We contributed the majority of the net proceeds from the Private Offering to our Operating Partnership in exchange for OP Units. Our Operating Partnership has used the net proceeds from the Private Offering primarily to acquire additional SFR properties in new and existing markets and maintain existing SFR properties in our Portfolio.
The following table provides information regarding the sale of shares of our common stock in the Private Offering and through the common stock DRIP during the previous three years ended December 31, 2020, and for the three months ended March 31, 2021 (dollar amounts in thousands, except per share sale price):
Month | Year | Common Stock Private Offering | Common Stock DRIP | Total Gross Proceeds | ||||||||||||||||||||||||||||
| Shares Sold | Sale Price (1) | Gross Proceeds | Shares Reinvested | Sale Price (2) | Gross Proceeds (3) | |||||||||||||||||||||||||||
October | 2018 | 1,097,367 | $ | 26.10 | $ | 28,638 | — | $ | — | $ | — | $ | 28,638 | |||||||||||||||||||
November | 2018 | — | — | — | — | — | — | — | ||||||||||||||||||||||||
December | 2018 | 803,291 | 25.76 | 20,690 | 6,112 | 24.25 | 148 | 20,838 | ||||||||||||||||||||||||
January | 2019 | — | — | — | — | — | — | — | ||||||||||||||||||||||||
February | 2019 | 7,075 | 28.27 | 200 | — | — | — | 200 | ||||||||||||||||||||||||
March | 2019 | 562,226 | 29.79 | 16,749 | 14,002 | 27.42 | 384 | 17,133 | ||||||||||||||||||||||||
April | 2019 | 2,196 | 31.42 | 69 | — | — | — | 69 | ||||||||||||||||||||||||
May | 2019 | 11,230 | 28.94 | 325 | — | — | — | 325 | ||||||||||||||||||||||||
June | 2019 | 809,292 | 30.16 | 24,409 | 17,442 | 27.89 | 486 | 24,895 | ||||||||||||||||||||||||
July | 2019 | 141,511 | 29.19 | 4,130 | — | — | — | 4,130 | ||||||||||||||||||||||||
August | 2019 | 49,176 | 31.56 | 1,552 | — | — | — | 1,552 | ||||||||||||||||||||||||
September | 2019 | 870,560 | 30.42 | 26,480 | 27,205 | 28.01 | 762 | 27,242 | ||||||||||||||||||||||||
October | 2019 | 79,871 | 30.73 | 2,455 | — | — | — | 2,455 | ||||||||||||||||||||||||
November | 2019 | 45,973 | 31.54 | 1,450 | — | — | — | 1,450 | ||||||||||||||||||||||||
December | 2019 | 581,062 | 31.43 | 18,263 | 36,941 | 29.01 | 1,071 | 19,335 | ||||||||||||||||||||||||
January | 2020 | 315,766 | 32.14 | 10,148 | — | — | — | 10,148 | ||||||||||||||||||||||||
February | 2020 | 466,439 | 32.12 | 14,980 | — | — | — | 14,980 | ||||||||||||||||||||||||
March | 2020 | 637,111 | 32.10 | 20,452 | 46,813 | 29.65 | 1,388 | 21,840 | ||||||||||||||||||||||||
April | 2020 | 34,609 | 32.49 | 1,125 | — | — | — | 1,125 | ||||||||||||||||||||||||
May | 2020 | 25,928 | 32.98 | 855 | — | — | — | 855 | ||||||||||||||||||||||||
June | 2020 | 50,009 | 32.35 | 1,618 | 54,294 | 30.15 | 1,637 | 3,255 | ||||||||||||||||||||||||
July | 2020 | 407,618 | 32.28 | 13,158 | — | — | — | 13,158 | ||||||||||||||||||||||||
August | 2020 | 271,444 | 33.02 | 8,963 | — | — | — | 8,963 | ||||||||||||||||||||||||
September | 2020 | 333,897 | 33.36 | 11,137 | 58,911 | 31.91 | 1,880 | 13,017 | ||||||||||||||||||||||||
October | 2020 | 438,856 | 34.99 | 15,356 | — | — | — | 15,356 | ||||||||||||||||||||||||
November | 2020 | 429,126 | 35.87 | 15,394 | — | — | — | 15,394 | ||||||||||||||||||||||||
December | 2020 | 489,128 | 36.11 | 17,686 | 69,364 | 33.35 | 2,314 | 20,000 | ||||||||||||||||||||||||
January | 2021 | 593,303 | 36.07 | 21,398 | — | — | — | 21,398 | ||||||||||||||||||||||||
February | 2021 | 582,140 | 38.19 | 22,231 | — | — | — | 22,231 | ||||||||||||||||||||||||
March | 2021 | 985,731 | 37.84 | 37,297 | 80,493 | $ | 35.75 | 2,878 | 40,175 | |||||||||||||||||||||||
TOTAL | 11,121,935 | $ | 357,208 | 411,577 | $ | 12,949 | $ | 370,157 | ||||||||||||||||||||||||
101
(1) Sale price is the per share weighted average for the corresponding month which includes upfront selling costs.
(2) Common stock DRIP shares are generally purchased at a discounted rate of 97% of the NAV in effect.
(3) For shares of common stock issued under the common stock DRIP, we do not receive any cash proceeds from the transaction as the shareholder receives shares in lieu of the cash dividend. Refer to Note 7 to the consolidated financial statements included in this Form 10 for further discussion.
NexPoint Securities, Inc., an entity under common ownership with the Adviser, serves as the Dealer Manager for the Private Offering and Raymond James and other unaffiliated broker-dealers serve as non-exclusive placement agents through selling agreements between each placement agent and the Company.
None of the shares of our common stock set forth in the table above were registered under the Securities Act, in reliance upon the exemptions from registration under the Securities Act provided by Rule 506(b) under Regulation D promulgated under the Securities Act and Section 4(a)(2) of the Securities Act. All of the shares of our common stock set forth in the table above were sold to persons who represented to us in writing that they qualified as an “accredited investor,” as such term is defined by Regulation D promulgated under the Securities Act.
102
6.50% Series A Cumulative Redeemable Preferred Stock
On September 30, 2020, we commenced a private placement in an initial amount of up to $75 million of shares of our Series A Preferred Stock pursuant to the safe harbor of Rule 506(b) of Regulation D under Section 4(a)(2) of the Securities Act (the “Preferred Offering”), which was subsequently increased to $125 million. The securities are being offered and sold only to purchasers who are “accredited investors,” as defined in Rule 501 of Regulation D of the Securities Act.
Each investor in the Preferred Offering is required to make certain representations to us, including that such investor is an “accredited investor”, as defined in Rule 501(a) under the Securities Act, and that such investor is acquiring our Series A Preferred Stock for such investor’s own account, for investment purposes only and not with a view to its distribution.
The initial closing of the Preferred Offering occurred on October 7, 2020, and subsequent closings occurred on December 30, 2020 and January 8, 2021. Raymond James & Associates, Inc. served as the exclusive placement agent for the Preferred Offering. As of March 31, 2021, we have issued 5,000,000 shares of Series A Preferred Stock, resulting in gross offering proceeds of approximately $125.0 million. As of March 31, 2021, we have paid an aggregate of approximately $3.9 million in selling commissions and incurred approximately $1.0 million in additional offering expenses, resulting in net proceeds to us of approximately $120.1 million.
We contributed the net proceeds from the Preferred Offering to our Operating Partnership in exchange for Series A cumulative redeemable preferred units of our Operating Partnership, which units have the same or substantially similar designations, preferences and rights as our Series A Preferred Stock. Our Operating Partnership has used the net proceeds from the Preferred Offering primarily to acquire new SFR properties, repay a portion of the indebtedness outstanding under the Warehouse Facility and for general corporate purposes.
The following table provides information regarding the sale of shares of our Series A Preferred Stock by us during the previous three years ended December 31, 2020, and for the three months ended March 31, 2021 (gross proceeds in thousands).
Sale Date | Series A Preferred Stock Private Offering | |||||||||||
| Number Sold | Sale Price (1) | Gross Proceeds | ||||||||||
October 7, 2020 | 2,440,000 | $ | 25.00 | $ | 61,000,000 | |||||||
December 30, 2020 | 1,100,000 | 24.995 | 27,494,500 | |||||||||
January 8, 2021 | 1,460,000 | 25.032 | 36,546,720 | |||||||||
|
|
|
| |||||||||
TOTAL | 5,000,000 | 125,041,220 | ||||||||||
|
|
|
| |||||||||
(1) The Sales Prices for the December 30, 2020 and January 8, 2021 sales equaled $25 per share adjusted for dividends based on the sale date relative to the dividend record date.
Except as set forth above, we have not sold any securities which were not registered under the Securities Act during the previous three years.
103
ITEM 11. DESCRIPTION OF REGISTRANT’S SECURITIES TO BE REGISTERED.
The following is a summary of the rights and preferences of our capital stock. We encourage you to read carefully this entire Form 10, our charter, and bylaws, and the relevant provisions of the Maryland General Corporation Law (“MGCL”) for a more complete understanding of our capital stock. Our Board and stockholders have approved an amended and restated charter. References in this Form 10 to our “charter” refer to the form of amended and restated charter we expect to file with the Maryland State Department of Assessments and Taxation on the date hereof. Copies of our form of amended and restated charter and bylaws are filed as exhibits to this Form 10, and the following summary, to the extent it relates to those documents, is qualified in its entirety by references thereto.
General
Our charter authorizes the issuance of 500,000,000 shares of capital stock, consisting of 300,000,000 shares of Class A common stock, par value $0.01 per share (“Class A Common Stock”), 100,000,000 shares of Class I common stock, par value $0.01 per share (“Class I Common Stock” and, in this Item 11, together with the Class A Common Stock, our “common stock”) and 100,000,000 shares of preferred stock, par value $0.01 per share, 16,000,000 shares of which have been classified as Series A Preferred Stock. Our Board may amend our charter from time to time to increase or decrease the aggregate number of shares of stock of any class or series that we have the authority to issue, without any action by the stockholders. Our Board may classify any unissued shares of capital stock into one or more classes or series of stock, may designate the preferences, conversion or other rights, voting powers, restrictions, limitations as to dividends, qualifications, and terms and conditions of redemption, and other terms, of any class or series of capital stock, and may reclassify any previously classified but unissued shares of capital stock into one or more classes or series of stock. Under Maryland law, our stockholders generally are not liable for our debts or obligations solely as a result of their status as stockholders.
Description of Common Stock
As of March 31, 2021, 11,499,045 shares of our Class A Common Stock were issued and outstanding and no shares of our Class I Common Stock were issued and outstanding.
Subject to the preferential rights, if any, of holders of any other class or series of our stock and to the provisions of our charter relating to the restrictions on ownership and transfer of our stock, holders of our common stock are entitled to receive dividends and other distributions on such shares of stock when, as and if authorized by our Board and declared by us out of assets legally available for distribution to our stockholders and will be entitled to share ratably in our net assets legally available for distribution to our stockholders in the event of our liquidation, dissolution or winding up after payment of or adequate provision for all of our known debts and liabilities.
Subject to the provisions of our charter regarding the restrictions on ownership and transfer of our stock and except as may be otherwise specified in the terms of any class or series of common stock, each outstanding share of common stock entitles the holder to one vote on all matters submitted to a vote of stockholders, including the election of directors, and, except as may be provided with respect to any other class or series of our stock, the holders of shares of our common stock will possess the exclusive voting power. Each of our directors elected by our stockholders is elected to serve until the next annual meeting of our stockholders and until his or her successor is duly elected and qualified. There is no cumulative voting in the election of directors. Consequently, the holders of a majority of the outstanding shares of our common stock can elect all of the directors then standing for election, and the holders of the remaining shares will not be able to elect any directors. Directors will be elected by a plurality of all of the votes cast in the election of directors.
104
Holders of shares of our common stock have no preference, conversion, exchange, sinking fund, redemption or appraisal rights and have no preemptive rights to subscribe for any securities of our Company. Subject to the provisions of our charter regarding the restrictions on ownership and transfer of our stock, shares of our common stock will have equal distribution, liquidation and other rights. Under the MGCL, a Maryland corporation generally cannot dissolve, amend its charter, merge or consolidate with, or convert into, another entity, sell all or substantially all of its assets or engage in a statutory share exchange unless the action is advised by our Board and approved by the affirmative vote of stockholders entitled to cast at least two-thirds of the votes entitled to be cast on the matter, unless a lesser percentage (but not less than a majority of all of the votes entitled to be cast on the matter) is specified in the corporation’s charter. Our charter provides that these actions must be approved by a majority of all of the votes entitled to be cast on the matter.
Maryland law also permits a corporation to transfer all or substantially all of its assets without the approval of its stockholders to an entity owned, directly or indirectly, by the corporation.
Description of Series A Preferred Stock
As of March 31, 2021, 5,000,000 shares of our Series A Preferred Stock were issued and outstanding. Each class or series of our preferred stock will have the designations, voting powers, preferences, conversion or other rights, qualifications, limitations, restrictions, terms and conditions of redemption, and other terms as Maryland law may permit and our Board may determine by adoption of applicable articles supplementary to our charter. Our Board may, without notice to or the consent of holders of Series A Preferred Stock, authorize the issuance and sale of additional shares of Series A Preferred Stock and authorize and issue additional shares of stock ranking junior to the Series A Preferred Stock (“Junior Stock”) or shares of preferred equity ranking on parity with the Series A Preferred Stock (“Parity Stock”) from time to time. The following is a summary of the material terms of our Series A Preferred Stock and certain provisions of our charter.
Overview
The Series A Preferred Stock accrues a 6.50% per annum dividend (the “Annual Preferred Dividend”), have a priority on distribution of cash from operations, and capital items proceeds as set forth below. The Series A Preferred Stock is subject to a redemption right of the Company beginning on October 7, 2023.
Dividends
Dividends on the Series A Preferred Stock will accrue on the liquidation preference per share of Series A Preferred Stock from the respective original issuance date on a cumulative basis, quarterly in arrears, on the last day of March, June, September and December of each year. The dividend rate will consist of the Annual Preferred Dividend on the Series A Preferred Stock, through October 7, 2027 (the
105
“Mandatory Redemption Date”), unless extended as further described under the heading “—Mandatory Redemption.” Dividends on the Series A Preferred Stock, when, as and if declared by our Board (or a duly authorized committee of our Board) are intended to be paid quarterly (at the rate of one-quarter of the Annual Preferred Dividend) on April 10, July 10, October 10 and January 10 of each year (or the next successive business day if such date falls on a non-business day), to holders of record of the Series A Preferred Stock as they appear on our records at the close of business on the 25th day of the month preceding the applicable payment date, i.e., March 25, June 25, September 25 and December 25, respectively. The first payment was made on January 11, 2021. Dividends will be paid from funds legally available for the payment of dividends, as determined by our Board (or a duly authorized committee of our Board) and shall be prorated for partial quarters. Dividends will continue to accrue even if not authorized, declared or paid. The rate of the Annual Preferred Dividend is subject to adjustment as further described below.
Unless full cumulative and compound dividends on the Series A Preferred Stock have been or contemporaneously are declared and paid in cash or declared and a sum sufficient for the payment thereof is set apart for payment for all past dividend periods that have ended, no dividends (other than a dividend in shares of Junior Stock) or in options, warrants or rights to subscribe for or purchase any such shares of Junior Stock) will be declared and paid or declared and set apart for payment nor will any other distribution be declared and made upon the Junior Stock or the Parity Stock, nor will any shares of Junior Stock or Parity Stock be redeemed, purchased or otherwise acquired for any consideration (or any moneys be paid to or made available for a sinking fund for the redemption of any shares of Junior Stock or Parity Stock) by us (except (1) by conversion into or exchange for Junior Stock, (2) the purchase of Series A Preferred Stock, Junior Stock or Parity Stock pursuant to our charter to the extent necessary to preserve our qualification as a REIT or (3) the purchase of shares of Parity Stock pursuant to a purchase or exchange offer made on the same terms to holders of all outstanding Series A Preferred Stock). Holders of Series A Preferred Stock are not entitled to any dividend, whether payable in cash, property or stock, in excess of full cumulative and compounding dividends on the Series A Preferred Stock as provided above. Any dividend payment made on the Series A Preferred Stock will first be credited against the earliest accrued but unpaid dividend due with respect to such shares which remains payable.
In the event that distributable cash flow is not sufficient to pay any scheduled Annual Preferred Dividend, we will accrue the Annual Preferred Dividend. We believe that we have and will continue to have sufficient distributable cash flow to service its Annual Preferred Dividend obligations.
Upon liquidation of us, after satisfaction of liabilities and funding or any reserves necessary for wind up, holders of Series A Preferred Stock will be entitled to be paid out of the assets of the Company legally available for distribution to stockholders, a liquidation preference of $25.00 per share of Series A Preferred Stock plus an amount equal to any accrued and unpaid dividends thereon, including the Annual Preferred Dividend. If the assets of the Company legally available for distribution to stockholders are insufficient to pay in full the liquidation preference on the Series A Preferred Stock and the liquidation preference on the shares of any Parity Stock, all assets distributed to the holders of Series A Preferred Stock and the holders of any class or series of Parity Stock will be distributed pro rata so that the amount of assets distributed per share of Series A Preferred Stock and per share of such class or series of Parity Stock will in all cases bear to each other the same ratio that the liquidation preference per share of Series A Preferred Stock and per share of such class or series of Parity Stock bear to each other.
106
The Series A Preferred Stock will rank, with respect to rights to the payment of dividends and the distribution of assets upon our liquidation, dissolution or winding up, (1) senior to our common stock; (2) on parity with all equity securities issued by us with terms specifically providing that those equity securities rank on parity with the Series A Preferred Stock with respect to rights to the payment of dividends and the distribution of assets upon our liquidation, dissolution or winding up; and (3) junior to all of our existing and future indebtedness and to the indebtedness and other liabilities of our existing subsidiaries and any future subsidiaries.
Voting Rights
Except as set forth in our charter, the Series A Preferred Stock have no voting rights.
So long as any shares of Series A Preferred Stock remain outstanding, the holders of shares of Series A Preferred Stock will have the exclusive right to vote on any amendment, alteration or repeal of our charter, including the terms of the Series A Preferred Stock, that would alter only the contract rights, as expressly set forth in our charter, of the Series A Preferred Stock, and the holders of any other classes or series of our capital stock will not be entitled to vote on any such amendment, alteration or repeal. Any such amendment, alteration or repeal will require the affirmative vote or consent of the holders of two-thirds of the shares of Series A Preferred Stock issued and outstanding at the time. With respect to any amendment, alteration or repeal of our charter, including the terms of the Series A Preferred Stock, that equally affects the terms of the Series A Preferred Stock and any Parity Stock upon which like voting rights have been conferred, the holders of shares of Series A Preferred Stock and such Parity Stock (voting together as a single class) also will have the exclusive right to vote on any amendment, alteration or repeal of our charter, including the terms of the Series A Preferred Stock, that would alter only the contract rights, as expressly set forth in our charter, of the Series A Preferred Stock and such Parity Stock, and the holders of any other classes or series of our capital stock will not be entitled to vote on any such amendment, alteration or repeal. Any such amendment, alteration or repeal shall require the affirmative vote or consent of the holders entitled to cast two-thirds of the votes entitled to be cast by the holders of shares of Series A Preferred Stock and such Parity Stock issued and outstanding at the time, voting together as a single class, with each share of Series A Preferred Stock and share of such Parity Stock entitled to one vote for each $25.00 of liquidation preference.
Fixed Charge Coverage Ratio
We must maintain a fixed charge coverage ratio (“FCCR”) of 1.10x or higher as of the last day of each fiscal quarter. “FCCR” means Cash Flow Before Debt Service (as defined below) for the four consecutive fiscal quarter period ending on the calculation date divided by the total of our consolidated debt service plus preferred payments for the four consecutive fiscal quarter period ending on the calculation date. For the avoidance of doubt, preferred payments will not include payments on preferred units of our Operating Partnership, including the Series A Preferred Units, that track the Series A Preferred Stock. “Cash Flow Before Debt Service” means for any fiscal quarter, our total revenue on a consolidated basis less (i) our total operating expenses on a consolidated basis, (ii) recurring capital expenditures of $87.50 per home owned (directly or indirectly) by us as of the last day of the fiscal quarter and (iii) our total general and administrative expenses on a consolidated basis.
If at any time the FCCR falls below 1.10x as of the last day of a fiscal quarter (an “FCCR Default”),
107
then as of the date of the occurrence of the FCCR Default to, but not including, the date on which such FCCR Default is no longer continuing (as evidenced by notice to the holders of the Series A Preferred Stock, which may be by press release, of an FCCR necessary to cure such FCCR Default), the rate of the Annual Preferred Dividend will increase by 50 basis points. The rate of the Annual Preferred Dividend will return to 6.50% upon us achieving an FCCR of 1.10x (or higher).
Restrictions on New Issuances
Unless the (1) holders of a majority of the shares of the Series A Preferred Stock then outstanding consent, or (2) indebtedness is being incurred or an additional class or series of preferred equity of us is being issued in connection with a full redemption of the Series A Preferred Stock pursuant to an Optional Redemption (defined below) or Mandatory Redemption (defined below), we may not: (a) issue a new class, or issue any additional amounts of any existing class, of preferred equity with payment priority senior to that of the Series A Preferred Stock, (b)(i) incur any additional indebtedness or (ii) issue additional preferred equity that is pari passu to the Series A Preferred Stock, solely with respect to subclauses (i) and (ii), if, after such incurrence or issuance, the aggregate principal amount of long-term indebtedness and dividends on each existing class or series of our preferred equity pari passu with the Series A Preferred Stock would be greater than 75% of the gross value of the assets of us and our subsidiaries (such ratio, the “Senior Capital Leverage Ratio”). Subject to compliance with the immediately preceding sentence, we may, without consent of the holders of the Series A Preferred Stock then outstanding, issue additional Series A Preferred Stock with identical terms to those offered hereby. We will determine the values of all of our and our subsidiaries’ assets (including all real estate assets) in our good faith reasonable judgment, which may include (but is not required to include) input from third party valuation experts.
If we exceed a Senior Capital Leverage Ratio of 75%, the rate of the Annual Preferred Dividend will increase by 50 basis points. The rate of the Annual Preferred Dividend will return to 6.50% upon the Company achieving a Senior Capital Leverage Ratio of 75% (or less).
Optional Redemption
The Series A Preferred Stock are not redeemable prior to October 7, 2023, except (1) in order to preserve our qualification as a REIT and as described under “—Special Redemption Option upon a Change of Control” below and (2) at any time that the aggregate distributions to the Series A Preferred Stock result in a multiple on invested capital with respect to each share of Series A Preferred Stock equal to the sum of (x) $25.00 plus (y) the product of the Annual Preferred Dividend and three, such sum of (x) and (y) divided by $25.00 (e.g., a multiple of invested capital of 1.195x assuming a 6.50% Annual Preferred Dividend).
We may, at our option, redeem the Series A Preferred Stock, in whole or in part, from time to time, at any time on or after October 7, 2023 (each such redemption being an “Optional Redemption”) at a redemption price equal to $25.00 per share of Series A Preferred Stock, plus any accrued and unpaid dividends (whether or not declared), including the Annual Preferred Dividend, to, but excluding, the date fixed for redemption.
Special Redemption Option upon a Change of Control
Upon the occurrence of a Change of Control (as defined in our charter), we may
108
redeem for cash, in whole or in part, the Series A Preferred Stock within 120 days after the date on which such Change of Control occurred, by paying $25.00 per share, plus any accrued and unpaid dividends (whether or not declared), including the Annual Preferred Dividend, to, but excluding, the date fixed for redemption (the “Change of Control Offer”), regardless of whether the multiple on invested capital described in the first paragraph under the heading “—Optional Redemption” above has been achieved.
Mandatory Redemption
On the Mandatory Redemption Date, we will at our option (i) redeem all the outstanding shares of the Series A Preferred Stock in cash by paying $25.00 per share, plus any accrued and unpaid dividends (whether or not declared) to, but excluding, the Mandatory Redemption Date or (ii) effect a Listing Event, as defined below (such redemption or effecting of a Listing Event, the “Mandatory Redemption”). The Mandatory Redemption Date may be extended by consent of 60% of the outstanding Series A Preferred Stock, subject to approval by our Board in its sole discretion. We are not required to set aside funds to redeem the Series A Preferred Stock. Accordingly, the Series A Preferred Stock may remain outstanding until redeemed on the Mandatory Redemption Date, unless redeemed earlier.
Unless the Mandatory Redemption Date is extended, if we fail to effect a Mandatory Redemption of the Series A Preferred Stock by the Mandatory Redemption Date, and such non-compliance remains uncured by us on the nine-month anniversary following the Mandatory Redemption Date (a “Failed Redemption”), (i) the number of directors shall be automatically increased to such number as is necessary so that a majority of the outstanding shares of Series A Preferred Stock shall have the right at any time after such date to elect a majority of the members of our Board (such newly elected directors, the “Preferred Share Majority Directors”) and (ii) we will schedule a meeting of the then outstanding shares of Series A Preferred Stock to elect the Preferred Share Majority Directors. If at any time following a Failed Redemption, we complete the Mandatory Redemption, the terms of any and all Preferred Share Majority Directors shall automatically expire immediately following such Mandatory Redemption and the number of directors shall be automatically decreased by a corresponding number.
At our option, and in lieu of redemption, the shares of Series A Preferred Stock may be listed on a public exchange at any time before or concurrent with the Mandatory Redemption Date, assuming there is at least $200 million of the Series A Preferred Stock outstanding and we have a BBB- rating or higher at the time of listing (a “Listing Event”).
Additionally, if the Mandatory Redemption has not occurred by the Mandatory Redemption Date (as may be extended), the rate of the Annual Preferred Dividend will increase by 50 basis points (notwithstanding the provisions contained under the heading “—Rating” below, if we have a rating lower than BBB- after the Mandatory Redemption Date, the maximum the Annual Preferred Dividend will increase is 50 basis points). If, after the Mandatory Redemption Date, the Series A Preferred Stock has not been redeemed and is subsequently subject to a Listing Event, the rate of the Annual Preferred Dividend will return to 6.50% upon listing.
Restrictions on Ownership and Transfer
For information regarding restrictions on ownership and transfer of the Series A Preferred Stock, see “—Restrictions on Ownership and Transfer” herein.
109
The articles supplementary for the Series A Preferred Stock provides that the ownership limitations described in “—Restrictions on Ownership and Transfer” herein apply to ownership of shares of Series A Preferred Stock pursuant to Article VII of our charter, under which shares of Series A Preferred Stock owned by a stockholder in excess of an ownership limit will be transferred to a charitable trust and may be purchased by us under certain circumstances. Our Board may, in its sole discretion, except a person from an ownership limit, as described in “—Restrictions on Ownership and Transfer” herein.
Ownership limits also apply to shares of our common stock. See “—Restrictions on Ownership and Transfer” herein. Notwithstanding any other provision of the Series A Preferred Stock, no holder of shares of the Series A Preferred Stock are entitled to convert any shares of Series A Preferred Stock into shares of our common stock to the extent that receipt of our common stock would cause such holder or any other person to exceed the ownership limits contained in our charter or in the articles supplementary for the Series A Preferred Stock.
Preemptive Rights
No holders of Series A Preferred Stock shall, as the holders, have any preemptive rights to purchase or subscribe for our common stock or any other security of our company.
Rating
Egan Jones Rating Company (the “Rating Company”) assigned the Series A Preferred Stock a “BBB-” indicative rating. We will be required to maintain this “BBB-” rating or higher. The rating is subject to review on an annual basis based upon the outlook and historical performance of our Portfolio. We will continue the review and ratings process regarding the Series A Preferred Stock on an annual basis unless either (1) we are unable to engage a ratings company that will accord a rating to the Series A Preferred Stock or (2) holders of a majority of the Series A Preferred Stock approve cessation of obtaining such a rating for the Series A Preferred Stock. Subject to the immediately preceding sentence, if at any time the Rating Company can no longer provide a rating with respect to the Series A Preferred Stock, we will use reasonable best efforts to obtain a rating from another rating agency. Provision of a rating is not an assurance as to current or future performance of our Portfolio.
If the rating falls below BBB-, the rate of the Annual Preferred Dividend will increase by 25 basis points. The rate of the Annual Preferred Dividend will return to 6.50% upon our receipt of a BBB- rating (or higher).
Power to Increase or Decrease Authorized Shares of Stock, Reclassify Unissued Shares of Stock and Issue Additional Shares of Common and Preferred Stock
Our charter authorizes our Board, with the approval of a majority of our Board and without stockholder approval, to amend our charter to increase or decrease the aggregate number of shares of stock or the number of shares of any class or series of stock that we are authorized to issue. In addition, our charter authorizes our Board to authorize the issuance from time to time of shares of our common and preferred stock.
110
Our charter also authorizes our Board to classify and reclassify any unissued shares of our common or preferred stock into other classes or series of stock, including one or more classes or series of stock that have priority over our common stock with respect to voting rights, distributions or upon liquidation, and authorize us to issue the newly classified shares. Prior to the issuance of shares of each new class or series, our Board is required by Maryland law and by our charter to set, subject to the provisions of our charter regarding the restrictions on ownership and transfer of our stock, the preferences, conversion and other rights, voting powers, restrictions, limitations as to distributions, qualifications and terms and conditions of redemption for each class or series. Therefore, although our Board does not currently intend to do so, it could authorize the issuance of shares of common or preferred stock with terms and conditions that could have the effect of delaying, deferring or preventing a change in control or other transaction that might involve a premium price for shares of our common stock or otherwise be in the best interest of our stockholders.
We believe that the power of our Board to approve amendments to our charter to increase or decrease the number of authorized shares of stock, to authorize us to issue additional authorized but unissued shares of common or preferred stock and to classify or reclassify unissued shares of common or preferred stock and thereafter to authorize us to issue such classified or reclassified shares of stock will provide us with increased flexibility in structuring possible future financings and acquisitions and in meeting other needs that might arise.
Restrictions on Ownership and Transfer
In order for us to qualify as a REIT under the Code, shares of our stock must be owned by 100 or more persons during at least 335 days of a taxable year of 12 months (other than the first year for which an election to qualify as a REIT has been made) or during a proportionate part of a shorter taxable year. Also, not more than 50% of the value of the outstanding shares of our stock may be owned, directly or indirectly, by five or fewer individuals (as defined in the Code to include certain entities such as private foundations) during the last half of a taxable year (other than the first year for which an election to be a REIT has been made). To qualify as a REIT, we must satisfy other requirements as well.
Except for Permitted Transfers (defined below) or transfers otherwise permitted by our charter or bylaws, holders of our common stock or preferred stock are prohibited from transferring any such shares of common stock or preferred stock without our prior written consent. Our charter provides that the section of our charter containing this prohibition will not apply to any common stock or preferred stock listed on a national securities exchange. Our consent may only be withheld if, in our reasonable judgment, such transfer would violate applicable federal or state securities laws. “Permitted Transfers” include transfers (a) by the holder to us, (b) in connection with a transfer to an unaffiliated third party pursuant to a merger, consolidation, stock-for-stock exchange, tender offer or similar transaction, (c) to a family member or a controlled entity for bona fide estate planning purposes and (d) by a trust to the trust’s beneficiaries. Transfers under clauses (b), (c) and (d) are subject to the transferee agreeing to be bound by the restrictions on transfer set forth under Article VII of our charter.
Our charter also contains restrictions on the ownership and transfer of our stock that became effective on the date upon which the outstanding shares of our stock is beneficially owned by at least 100 persons (the “Initial Date”). The relevant sections of our charter provide that, subject to the exceptions described
111
below, from and after the Initial Date, no person or entity may own, or be deemed to own, beneficially or by virtue of the applicable constructive ownership provisions of the Code, more than 9.8%, in value or in number of shares, whichever is more restrictive, of the outstanding shares of our common stock (the “common stock ownership limit”), or 9.8% in value of the outstanding shares of all classes or series of our stock, including the Series A Preferred Stock (the “aggregate stock ownership limit”). We refer to the common stock ownership limit and the aggregate stock ownership limit collectively as the “ownership limits.” We refer to the person or entity that, but for operation of the ownership limits or another restriction on ownership and transfer of our stock as described below, would beneficially own or constructively own shares of our stock in violation of such limits or restrictions and, if appropriate in the context, a person or entity that would have been the record owner of such shares of our stock as a “prohibited owner.”
The constructive ownership rules under the Code are complex and may cause shares of stock owned beneficially or constructively by a group of related individuals and/or entities to be owned beneficially or constructively by one individual or entity. As a result, the acquisition of less than 9.8%, in value or in number of shares, whichever is more restrictive, of the outstanding shares of our common stock, or less than 9.8% in value of the outstanding shares of all classes and series of our stock, including the Series A Preferred Stock (or the acquisition by an individual or entity of an interest in an entity that owns, beneficially or constructively, shares of our stock), could, nevertheless, cause that individual or entity, or another individual or entity, to own beneficially or constructively shares of our stock in excess of the ownership limits.
Our Board, in its sole discretion, may exempt, prospectively or retroactively, a particular stockholder from the ownership limits or establish a different limit on ownership (the “excepted holder limit”) if our Board determines that:
| • | no individual’s beneficial or constructive ownership of our stock will result in our being “closely held” under Section 856(h) of the Code (without regard to whether the ownership interest is held during the last half of a taxable year), or otherwise result in our failing to qualify as a REIT or result in our failing to qualify as a “domestically controlled qualified investment entity” within the meaning of Section 897(h) of the Code; and |
| • | such stockholder does not and will not own, actually or constructively, an interest in a tenant of ours (or a tenant of any entity owned or controlled by us) that would cause us to own, actually or constructively, more than a 9.9% interest (as set forth in Section 856(d)(2)(B) of the Code) in such tenant (or our Board determines that revenue derived from such tenant will not affect our ability to qualify as a REIT). |
Our charter provides that any violation or attempted violation of any such representations or undertakings will result in such stockholder’s shares of stock being automatically transferred to a charitable trust. As a condition of granting the waiver or establishing the excepted holder limit, our Board may require an opinion of counsel or a ruling from the IRS, in either case in form and substance satisfactory to our Board, in its sole discretion, in order to determine or ensure our status as a REIT and such representations and undertakings from the person requesting the exception as our Board may require
112
in its sole discretion to make the determinations above. Our Board may impose such conditions or restrictions as it deems appropriate in connection with granting such a waiver or establishing an excepted holder limit. These waivers will be subject to certain initial and ongoing conditions designed to preserve our status as a REIT.
In connection with granting a waiver of the ownership limits or creating an excepted holder limit or at any other time, our Board may from time to time increase or decrease the common stock ownership limit, the aggregate stock ownership limit or both, for all other persons, unless, after giving effect to such increase, five or fewer individuals could beneficially own, in the aggregate, more than 49.9% in value of our outstanding stock or we would otherwise fail to qualify as a REIT. A reduced ownership limit will not apply to any person or entity whose percentage ownership of our common stock or our stock of all classes and series, as applicable, is, at the effective time of such reduction, in excess of such decreased ownership limit until such time as such person’s or entity’s percentage ownership of our common stock or our stock of all classes and series, as applicable, equals or falls below the decreased ownership limit, but any further acquisition of shares of our common stock or stock of all other classes or series, as applicable, will violate the decreased ownership limit.
Our charter further prohibits:
| • | any person from beneficially or constructively owning, applying certain attribution rules of the Code, shares of our stock that would result in our being “closely held” under Section 856(h) of the Code (without regard to whether the ownership interest is held during the last half of a taxable year) or otherwise cause us to fail to qualify as a REIT; |
| • | any person from transferring shares of our stock if the transfer would result in shares of our stock being beneficially owned by fewer than 100 persons (determined under the principles of Section 856(a)(5) of the Code); and |
| • | any person from beneficially or constructively owning shares of our stock to the extent such ownership would result in our failing to qualify as a “domestically controlled qualified investment entity” within the meaning of Section 897(h) of the Code. |
Our charter provides that any person who acquires or attempts or intends to acquire beneficial or constructive ownership of shares of our stock that will or may violate the ownership limits or any of the other restrictions on ownership and transfer of our stock described above, or who would have owned shares of our stock transferred to the trust as described below, must immediately give notice to us of such event or, in the case of an attempted or proposed transaction, give us at least 15 days’ prior written notice and provide us with such other information as we may request in order to determine the effect of such transfer on our status as a REIT. The foregoing restrictions on ownership and transfer of our stock will not apply if our Board determines that it is no longer in our best interest to attempt to qualify, or to continue to qualify, as a REIT or that compliance with the restrictions and limits on ownership and transfer of our stock described above is no longer required in order for us to qualify as a REIT.
113
Our charter further provides that, if any transfer of shares of our stock would result in shares of our stock being beneficially owned by fewer than 100 persons, the transfer will be null and void and the intended transferee will acquire no rights in the shares. In addition, our charter provides that, if any purported transfer of shares of our stock or any other event would otherwise result in any person violating the ownership limits or an excepted holder limit established by our Board, or in our being “closely held” under Section 856(h) of the Code (without regard to whether the ownership interest is held during the last half of a taxable year) or otherwise failing to qualify as a REIT or as a “domestically controlled qualified investment entity” within the meaning of Section 897(h)(4)(B) of the Code, then that number of shares (rounded up to the nearest whole share) that would cause the violation will be automatically transferred to, and held by, a trust for the exclusive benefit of one or more charitable organizations selected by us, and the intended transferee or other prohibited owner will acquire no rights in the shares. The automatic transfer will be effective as of the close of business on the business day prior to the date of the violative transfer or other event that results in a transfer to the trust. If the transfer to the trust as described above would not be automatically effective for any reason to prevent violation of the applicable ownership limits or our being “closely held” under Section 856(h) of the Code (without regard to whether the ownership interest is held during the last half of a taxable year) or our otherwise failing to qualify as a REIT or as a “domestically controlled qualified investment entity,” then our charter provides that the transfer of the shares will be null and void and the intended transferee will acquire no rights in such shares.
Shares of our stock held in the trust will be issued and outstanding shares. Our charter provides that the prohibited owner will not benefit economically from ownership of any shares of our stock held in the trust and will have no rights to distributions and no rights to vote or other rights attributable to the shares of our stock held in the trust. The trustee of the trust will exercise all voting rights and receive all distributions with respect to shares held in the trust for the exclusive benefit of the charitable beneficiary of the trust. Any distribution made before we discover that the shares have been transferred to a trust as described above must be repaid by the recipient to the trustee upon demand. Subject to Maryland law, effective as of the date that the shares have been transferred to the trust, the trustee will have the authority to rescind as void any vote cast by a prohibited owner before our discovery that the shares have been transferred to the trust and to recast the vote in accordance with the desires of the trustee acting for the benefit of the charitable beneficiary of the trust. However, if we have already taken irreversible corporate action, then the trustee may not rescind and recast the vote.
Shares of our stock transferred to the trustee are deemed offered for sale to us, or our designee, at a price per share equal to the lesser of (a) the price paid by the prohibited owner for the shares (or, in the case of a devise or gift, the market price at the time of such devise or gift) and (b) the market price on the date we accept, or our designee, accepts such offer. We may reduce the amount so payable to the trustee by the amount of any distribution that we made to the prohibited owner before we discovered that the shares had been automatically transferred to the trust and that are then owed by the prohibited owner to the trustee as described above, and we may pay the amount of any such reduction to the trustee for distribution to the charitable beneficiary. We have the right to accept such offer until the trustee has sold the shares of our stock held in the trust as discussed below. Upon a sale to us, the interest of the charitable beneficiary in the shares sold terminates, and the trustee must distribute the net proceeds of the sale to the prohibited owner and must distribute any distributions held by the trustee with respect to such shares to the charitable beneficiary.
114
If we do not buy the shares, the trustee must, within 20 days of receiving notice from us of the transfer of shares to the trust, sell the shares to a person or entity designated by the trustee who could own the shares without violating the ownership limits or the other restrictions on ownership and transfer of our stock. After the sale of the shares, the interest of the charitable beneficiary in the shares transferred to the trust will terminate and the trustee must distribute to the prohibited owner an amount equal to the lesser of (a) the price paid by the prohibited owner for the shares (or, if the prohibited owner did not give value for the shares in connection with the event causing the shares to be held in the trust (for example, in the case of a gift, devise or other such transaction), the market price of the shares on the day of the event causing the shares to be held in the trust) and (b) the sales proceeds (net of any commissions and other expenses of sale) received by the trust for the shares. The trustee may reduce the amount payable to the prohibited owner by the amount of any distribution that we paid to the prohibited owner before we discovered that the shares had been automatically transferred to the trust and that are then owed by the prohibited owner to the trustee as described above. Any net sales proceeds in excess of the amount payable to the prohibited owner must be paid immediately to the charitable beneficiary, together with any distributions thereon. In addition, if, prior to the discovery by us that shares of stock have been transferred to a trust, such shares of stock are sold by a prohibited owner, then such shares will be deemed to have been sold on behalf of the trust and, to the extent that the prohibited owner received an amount for, or in respect of, such shares that exceeds the amount that such prohibited owner was entitled to receive, such excess amount will be paid to the trustee upon demand. Our charter provides that the prohibited owner has no rights in the shares held by the trustee.
In addition, if our Board determines that a transfer or other event has occurred that would violate the restrictions on ownership and transfer of our stock described above, our Board may take such action as it deems advisable to refuse to give effect to or to prevent such transfer, including, but not limited to, causing us to redeem shares of our stock, refusing to give effect to the transfer on our books or instituting proceedings to enjoin the transfer.
Our charter provides that every owner of 5% or more (or such lower percentage as required by the Code or the regulations promulgated thereunder) of our stock, within 30 days after the end of each taxable year, must give us written notice stating the stockholder’s name and address, the number of shares of each class and series of our stock that the stockholder beneficially owns and a description of the manner in which the shares are held. Each such owner must provide to us in writing such additional information as we may request in order to determine the effect, if any, of the stockholder’s beneficial ownership on our status as a REIT and to ensure compliance with the ownership limits. In addition, our charter provides that any person or entity that is a beneficial owner or constructive owner of shares of our stock and any person or entity (including the stockholder of record) who is holding shares of our stock for a beneficial owner or constructive owner must, on request, provide to us such information as we may request in good faith in order to determine our status as a REIT and to comply with the requirements of any taxing authority or governmental authority or to determine such compliance and to ensure compliance with the ownership limits.
115
Any certificates representing shares of our stock, or the notice in lieu of a certificate, will bear a legend referring to the restrictions on ownership and transfer of our stock described above.
These restrictions on ownership and transfer of our stock will take effect on the Initial Date and will not apply if our Board determines that it is no longer in our best interest to attempt to qualify, or to continue to qualify, as a REIT or that compliance is no longer required in order for us to qualify as a REIT.
The restrictions on ownership and transfer of our stock described above could delay, defer or prevent a transaction or a change in control that might involve a premium price for our common stock or otherwise be in the best interest of our stockholders.
Lock-Up Agreements
Our charter provides that in connection with the initial public offering of our equity securities pursuant to a registration statement under the Securities Act, each holder of our common stock or preferred stock is required to execute and deliver a lock-up agreement in the form executed by our officers and directors, if determined or requested by our Board. Our charter further provides that upon the listing of any of our common stock or preferred stock on a national securities exchange, such requirement will no longer apply to such common stock or preferred stock, provided that the validity of any lock-up agreements entered into by such holders will not be affected.
Distribution Reinvestment Plans
Our Board has adopted the DRIP whereby investors who purchase shares of our common stock in the Private Offering may elect at the time of subscription or upon subsequent enrollment to have their dividends reinvested through purchase of additional shares of our common stock (each electing investor, a “participant”). Any cash distributions attributable to shares of our common stock owned by participants in the DRIP will be immediately reinvested in shares of our common stock on behalf of the participants on the business day such distribution would have been paid to such participant. The per share purchase price for shares of our common stock purchased pursuant to the DRIP will be equal to the transaction price at the time the distribution is payable, which will generally be equal to the most recent NAV in effect less a 3.0% discount to the applicable NAV.
In addition, owners of OP Units (other than the Company), have the right to elect to participate in a distribution reinvestment plan, consented to by the Board and approved by VineBrook Homes OP GP, LLC, the general partner of our Operating Partnership, that mirrors the terms and conditions of the DRIP.
Share Repurchase Plan
Investors may request on a quarterly basis that we repurchase all or any portion of their shares of our common stock pursuant to our Share Repurchase Plan. We are not obligated to repurchase any shares of our common stock and may choose to repurchase only some, or even none, of the shares of our common stock that we have been asked to repurchase in any particular quarter, in the sole discretion of the Board. The total amount of aggregate repurchases of shares of our common stock will be limited to no more than 5% of our aggregate NAV per calendar quarter. We began the Share Repurchase Plan on November 1, 2019.
Under our Share Repurchase Plan, investors may request that we repurchase all or a portion of their shares of our common stock by submitting a repurchase request and required documentation to our transfer agent by 4:00 p.m. (Eastern time) on the business day before the last calendar day of any particular quarter (a “repurchase date”). Settlements of share repurchases will be made in cash within three business days of the repurchase date. An investor may withdraw his or her repurchase request by notifying the transfer agent, directly or through his or her financial intermediary, on the Company’s toll-free automated telephone customer service number by 4:00 p.m. (Eastern time) on the applicable repurchase date (or, if such repurchase date is not a business day, the prior business day). If a repurchase order is received after 4:00 p.m. (Eastern time) on the business day before the repurchase date, the purchase order will be executed, if at all, on the next quarter’s redemption date at the transaction price applicable to that quarter, unless such request is withdrawn prior to the repurchase.
116
In the event that any investor fails to maintain the minimum balance of $10,000 of shares of our common stock, the Company may repurchase all of the shares held by that investor at the repurchase price in effect on the date the Company determines that such investor failed to meet the minimum balance. Minimum account repurchases will apply even in the event that the failure to meet the minimum balance is caused solely by a decline in our NAV.
Certain Provisions of Maryland Law and Our Charter and Bylaws
Business Combinations
Under the MGCL, certain “business combinations” (including a merger, consolidation, statutory share exchange or, in certain circumstances, an asset transfer or issuance or reclassification of equity securities) between a Maryland corporation and an interested stockholder (defined generally as any person who beneficially owns, directly or indirectly, 10% or more of the voting power of the corporation’s outstanding voting stock or an affiliate or associate of the corporation who, at any time during the two-year period immediately prior to the date in question, was the beneficial owner, directly or indirectly, of 10% or more of the voting power of the then-outstanding stock of the corporation) or an affiliate of such an interested stockholder are prohibited for five years after the most recent date on which the interested stockholder becomes an interested stockholder.
Thereafter, any such business combination must generally be recommended by the board of directors of the corporation and approved by the affirmative vote of at least (a) 80% of the votes entitled to be cast by holders of outstanding shares of voting stock of the corporation and (b) two-thirds of the votes entitled to be cast by holders of voting stock of the corporation, other than shares held by the interested stockholder with whom (or with whose affiliate) the business combination is to be effected or held by an affiliate or associate of the interested stockholder, unless, among other conditions, the corporation’s common stockholders receive a minimum price (as determined in accordance with the applicable provisions of the MGCL) for their shares and the consideration is received in cash or in the same form as previously paid by the interested stockholder for its shares. A person is not an interested stockholder under the statute if the board of directors approved in advance the transaction by which the person otherwise would have become an interested stockholder. A corporation’s board of directors may provide that its approval is subject to compliance, at or after the time of approval, with any terms and conditions determined by the board.
Pursuant to the statute, the Board has by resolution exempted business combinations (a) between us, our Adviser and our Manager and its respective affiliates and (b) between us and any other person, provided that in the latter case the business combination is first approved by the Board (including a majority of our directors who are not affiliates or associates of such person). Consequently, the five-year prohibition and the supermajority vote requirements will not apply to a business combination between us, our Adviser or our Manager and/or their affiliates or to a business combination between us and any other person if the Board has first approved the combination. As a result, any person described in the preceding sentence may be able to enter into business combinations with us that may not be in the best interest of our stockholders, without compliance with the supermajority vote requirements and other provisions of the statute. We cannot assure you that the Board will not amend or repeal this resolution in the future.
Control Share Acquisitions
The MGCL provides that holders of “control shares” of a Maryland corporation acquired in a “control share acquisition” have no voting rights with respect to such shares except to the extent approved by the affirmative vote of at least two-thirds of the votes entitled to be cast on the matter. Shares owned by the acquirer, an officer of the corporation or an employee of the corporation who is also a director of the corporation are excluded from shares entitled to vote on the matter.
“Control shares” are voting shares of stock that, if aggregated with all other such shares of stock owned by the acquirer, or in respect of which the acquirer is able to exercise or direct the exercise of voting power (except solely by virtue of a revocable proxy), would entitle the acquirer to exercise voting power in electing directors within one of the following ranges of voting power:
| • | one-tenth or more but less than one-third; |
| • | one-third or more but less than a majority; or |
| • | a majority or more of all voting power. |
Control shares do not include shares that the acquiring person is then entitled to vote as a result of having previously obtained stockholder approval or shares acquired directly from the corporation. A “control share acquisition” means the acquisition, directly or indirectly of issued and outstanding control shares, subject to certain exceptions.
A person who has made or proposes to make a control share acquisition, upon satisfaction of certain conditions (including an undertaking to pay expenses and making an “acquiring person statement” as described in the MGCL), may compel the board of the corporation to call a special meeting of stockholders to be held within 50 days of demand to consider the voting rights of the shares. If no request for a meeting is made, the corporation may itself present the question at any stockholders meeting.
If voting rights are not approved at the meeting or if the acquiring person does not deliver an “acquiring person statement” as required by the statute, then, subject to certain conditions and limitations, the corporation may redeem any or all of the control shares (except those for which voting rights have previously been approved) for fair value determined, without regard to the absence of voting rights for the control shares, as of the date of the last control share acquisition by the acquirer or, if a meeting of stockholders was held at which the voting rights of such shares are considered and not approved, as of the date of such meeting. If voting rights for control shares are approved at a stockholders’ meeting and the acquirer becomes entitled to vote a majority of the shares entitled to vote, all other stockholders may exercise appraisal rights. The fair value of the shares as determined for purposes of such appraisal rights may not be less than the highest price per share paid by the acquirer in the control share acquisition.
The control share acquisition statute does not apply to shares acquired in a merger, consolidation or statutory share exchange if the corporation is a party to the transaction or acquisitions approved or exempted by the charter or bylaws of the corporation.
Our bylaws contain a provision exempting from the control share acquisition statute any and all acquisitions by any person of shares of our stock. This provision may be amended or eliminated at any time in the future by the Board.
Subtitle 8
Subtitle 8 of Title 3 of the MGCL permits a Maryland corporation with a class of equity securities registered under the Exchange Act and at least three independent directors to elect to be subject, by provision in its charter or bylaws or a resolution of its board of directors and notwithstanding any contrary provision in the charter or bylaws, to any or all of five provisions of the MGCL that provide, respectively, for:
| • | a classified board of directors; |
| • | a two-thirds vote requirement for removing a director; |
| • | a requirement that the number of directors be fixed only by vote of the board of directors; |
| • | a requirement that a vacancy on the board of directors be filled only by the remaining directors in office and (if the board of directors is classified) for the remainder of the full term of the class of directors in which the vacancy occurred; and |
| • | a majority requirement for the calling of a stockholder-requested special meeting of stockholders. |
Through provisions in our charter and bylaws unrelated to Subtitle 8, we already, subject to the terms of any class or series of preferred stock, (a) require a two-thirds vote for removing a director in the event that none of our common stock is listed on a national securities exchange, (b) vest in the Board the exclusive power to fix the number of directorships, and (c) require, unless called by our chairman of the Board, our chief executive officer, our president or the Board, the written request of stockholders entitled to cast a majority of all of the votes entitled to be cast at such a meeting to call a special meeting. If we made an election to be subject to the provisions of Subtitle 8 relating to a classified Board, our Board would automatically be classified into three classes with staggered terms of office of three years each. In such instance, the classification and staggered terms of office of the directors would make it more difficult for a third party to gain control of the Board since at least two annual meetings of stockholders, instead of one, generally would be required to effect a change in the majority of the directors.
The Board
Our charter provides that the number of directors on the Board is to be fixed exclusively by the Board pursuant to our bylaws, but may not be fewer than the minimum required by Maryland law, which is one. Our bylaws provide that the Board is to consist of not less than one and not more than 15 directors. The Board currently consists of seven directors.
Subject to the terms of any class or series of preferred stock, the Advisory Agreement and other contractual rights, our charter and bylaws provide that vacancies on the Board may be filled only by a majority of the remaining directors, even if the remaining directors do not constitute a quorum, and any director elected to fill a vacancy will hold office for the remainder of the full term of the directorship in which the vacancy occurred and until his or her successor is duly elected and qualified.
Each of our directors elected by our stockholders is elected to serve until the next annual meeting of our stockholders and until his or her successor is duly elected and qualified. Holders of common stock will have no right to cumulative voting in the election of directors. Consequently, the holders of a majority of the outstanding shares of our common stock can elect all of the directors then standing for election, and the holders of the remaining shares will not be able to elect any directors, subject to the terms of the Series A Preferred Stock. Directors are elected by a plurality of all of the votes cast in the election of directors.
117
Removal of Directors
Subject to the terms of any class or series of preferred stock, our charter provides that a director may be removed from office at any time, but only for cause and (a) in the event that none of the Company’s common stock is listed on a national securities exchange, then only by the affirmative vote of holders of shares entitled to cast at least two-thirds of all the votes entitled to be cast generally in the election of directors, or (b) in the event that any of the Company’s common stock is listed on a national securities exchange, then only by the affirmative vote of holders of shares entitled to cast at least a majority of all of the votes entitled to be cast generally in the election of directors. This provision, when coupled with the power of the Board to fill vacancies on the Board, may preclude stockholders from removing incumbent directors (except for cause and upon a substantial or majority affirmative vote) and filling the vacancies created by such removal with their own nominees.
Meetings of Stockholders
Pursuant to our bylaws, a meeting of our stockholders for the election of directors and the transaction of any business will be held annually on a date and at the time and place set by the Board. The chairman of the Board, our chief executive officer, our president or the Board may call a special meeting of our stockholders. Subject to the provisions of our bylaws, a special meeting of our stockholders to act on any matter that may properly be brought before a meeting of our stockholders must also be called by our secretary upon the written request of the stockholders entitled to cast a majority of all the votes entitled to be cast on such matter at the meeting and containing the information required by our bylaws. Our secretary will inform the requesting stockholders of the reasonably estimated cost of preparing and delivering the notice of meeting (including our proxy materials), and the requesting stockholder must pay such estimated cost before our secretary is required to prepare and deliver the notice of the special meeting.
Amendments to Our Charter and Bylaws
Except for those amendments permitted to be made without stockholder approval under Maryland law or our charter, our charter generally may be amended only if the amendment is first declared advisable by the Board and thereafter approved by the affirmative vote of stockholders entitled to cast a majority of all of the votes entitled to be cast on the matter. However, amendments to certain provisions in our charter, including, among others, the provisions relating to the number of directors and certain prohibitions on transfer of our stock, must first be declared advisable by our Board and thereafter be approved by the affirmative vote of stockholders entitled to cast at least two-thirds of all of the votes entitled to be cast on the matter, provided that, upon the listing of our common stock on a national securities exchange, certain such amendments will be valid if declared advisable by our Board and approved by the affirmative vote of stockholders entitled to cast a majority of all the votes entitled to be cast on the matter.
The Board has the exclusive power to adopt, alter or repeal any provision of our bylaws and to make new bylaws.
Transactions Outside the Ordinary Course of Business
Under the MGCL, a Maryland corporation generally may not dissolve, merge or consolidate with, or convert into, another entity, sell all or substantially all of its assets or engage in a statutory share exchange unless the action is declared advisable by the Board and approved by the affirmative vote of stockholders entitled to cast at least two-thirds of the votes entitled to be cast on the matter, unless a lesser percentage (but not less than a majority of all of the votes entitled to be cast on the matter) is specified in the corporation’s charter. Our charter provides that these actions must be approved by a majority of all of the votes entitled to be cast on the matter.
Dissolution
The dissolution of the Company must be declared advisable by a majority of the entire Board and approved by the affirmative vote of the holders of a majority of all of the votes entitled to be cast on the matter.
Advance Notice of Director Nominations and New Business
Our bylaws provide that, with respect to an annual meeting of our stockholders, nominations of individuals for election to the Board and the proposal of other business to be considered by our stockholders may be made only (a) pursuant to our notice of the meeting, (b) by or at the direction of the Board or (c) by any stockholder who was a stockholder of record both at the time of giving the notice required by our bylaws and at the time of the meeting, who is entitled to vote at the meeting on such business or in the election of such nominee and has provided notice to us within the time period, and containing the information and other materials, specified in the advance notice provisions of our bylaws.
118
With respect to special meetings of stockholders, only the business specified in our notice of meeting may be brought before the meeting. Nominations of individuals for election to the Board may be made only (a) by or at the direction of the Board or (b) if the meeting has been called for the purpose of electing directors, by any stockholder who was a stockholder of record both at the time of giving the notice required by our bylaws and at the time of the meeting, who is entitled to vote at the meeting in the election of each such nominee and who has provided notice to us within the time period, and containing the information and other materials, specified in the advance notice provisions of our bylaws.
The advance notice procedures of our bylaws provide that, to be timely, a stockholder’s notice with respect to director nominations or other proposals for an annual meeting must be delivered to our corporate secretary at our principal executive office not earlier than the 150th day nor later than 5:00 p.m., Eastern Time, on the 120th day prior to the first anniversary of the date of the proxy statement for our preceding year’s annual meeting. In the event that the date of the annual meeting is advanced or delayed by more than 30 days from the first anniversary of the date of the preceding year’s annual meeting, to be timely, a stockholder’s notice must be delivered not earlier than the 150th day prior to the date of such annual meeting and not later than 5:00 p.m., Eastern Time, on the later of the 120th day prior to the date of such annual meeting or the tenth day following the day on which public announcement of the date of such meeting is first made.
REIT Qualification
Our charter provides that the Board may authorize us to revoke or otherwise terminate our REIT election, without approval of our stockholders, if it determines that it is no longer in our best interest to continue to qualify as a REIT.
Our charter provides for certain restrictions on ownership and transfer. See Item 11. “Description of Registrant’s Securities to be Registered—Restrictions on Ownership and Transfer.”
Forum Selection Clause
Our bylaws provide that, unless we consent in writing to the selection of an alternative forum, the sole and exclusive forum for (a) any derivative action or proceeding brought on our behalf, other than actions arising under federal securities laws, (b) any action asserting a claim of breach of any duty owed by any of our directors or officers or other employees to us or to our stockholders, (c) any action asserting a claim against us or any of our directors or officers or other employees arising pursuant to any provision of the MGCL or our charter or bylaws or (d) any action asserting a claim against us or any of our directors or officers or other employees that is governed by the internal affairs doctrine shall be, in each case, the Circuit Court for Baltimore City, Maryland, or, if that Court does not have jurisdiction, the U.S. District Court for the District of Maryland, Baltimore Division.
Effects of Certain Provisions of Maryland Law and of Our Charter and Bylaws
Our charter and bylaws and Maryland law contain provisions that may delay, defer or prevent a change in control or other transaction that might involve a premium price for shares of our capital stock or otherwise be in the best interest of our stockholders, including business combination provisions, supermajority vote requirements and advance notice requirements for director nominations and other stockholder proposals. Likewise, if the provision in our bylaws opting out of the control share acquisition provisions of the MGCL or the resolution of the Board exempting certain business combinations from the business combination provisions of the MGCL were amended or rescinded or if we elect to be subject to any of the provisions of Subtitle 8, these provisions of the MGCL could have similar anti-takeover effects.
119
Stockholders’ Consent in Lieu of Meeting
Our bylaws provide that any action required or permitted to be taken at any meeting of stockholders may be taken without a meeting (a) if a unanimous consent setting forth the action is given in writing or by electronic transmission by each stockholder entitled to vote on the matter and filed with the minutes of proceedings of the stockholders or (b) if the action is advised, and submitted to the stockholders for approval, by the Board and a consent in writing or by electronic transmission of stockholders entitled to cast not less than the minimum number of votes that would be necessary to authorize or take the action at a meeting of stockholders is delivered to the Company in accordance with the MGCL.
Our charter provides that the holders of the Series A Preferred Stock may take action or consent to any action by providing a consent in writing or by electronic transmission of the holders of the Series A Preferred Stock entitled to cast not less than the minimum number of votes that would be necessary to authorize or take the action at a meeting of holders of the Series A Preferred Stock at which all stockholders entitled to vote on the action were present and voted if the Company gives notice of the action to each holder of the Series A Preferred Stock not later than 10 days after the effective time of the action.
120
ITEM 12. INDEMNIFICATION OF DIRECTORS AND OFFICERS.
Maryland law permits a Maryland corporation to include in its charter a provision limiting the liability of its directors and officers to the corporation and its stockholders for money damages, except for liability resulting from (a) actual receipt of an improper benefit or profit in money, property or services or (b) active and deliberate dishonesty that is established by a final judgment and that is material to the cause of action. Our charter contains a provision that eliminates the liability of our directors and officers to the maximum extent permitted by Maryland law.
The MGCL requires us (unless our charter provides otherwise, which our charter does not) to indemnify a director or officer who has been successful, on the merits or otherwise, in the defense of any proceeding to which he or she is made or threatened to be made a party by reason of his or her service in that capacity. The MGCL permits us to indemnify our present and former directors and officers, among others, against judgments, penalties, fines, settlements and reasonable expenses actually incurred by them in connection with any proceeding to which they may be made or threatened to be made a party by reason of their service in those or other capacities unless it is established that:
| • | the act or omission of the director or officer was material to the matter giving rise to the proceeding and (a) was committed in bad faith or (b) was the result of active and deliberate dishonesty; |
| • | the director or officer actually received an improper personal benefit in money, property or services; or |
| • | in the case of any criminal proceeding, the director or officer had reasonable cause to believe that the act or omission was unlawful. |
Under the MGCL, we may not indemnify a director or officer in a suit by us or in our right in which the director or officer was adjudged liable to us or in a suit in which the director or officer was adjudged liable on the basis that personal benefit was improperly received. A court may order indemnification if it determines that the director or officer is fairly and reasonably entitled to indemnification, even though the director or officer did not meet the prescribed standard of conduct or was adjudged liable on the basis that personal benefit was improperly received. However, indemnification for an adverse judgment in a suit by us or in our right, or for a judgment of liability on the basis that personal benefit was improperly received, is limited to expenses.
In addition, the MGCL permits us to advance reasonable expenses to a director or officer upon our receipt of:
| • | a written affirmation by the director or officer of his or her good faith belief that he or she has met the standard of conduct necessary for indemnification by us; and |
| • | a written undertaking by or on behalf of the director or officer to repay the amount paid or reimbursed by us if it is ultimately determined that the director or officer did not meet the standard of conduct. |
121
Our charter provides that we have the power to obligate the Company, and our bylaws obligate us, to the maximum extent permitted by Maryland law in effect from time to time, to indemnify and, without requiring a preliminary determination of the ultimate entitlement to indemnification, pay or reimburse reasonable expenses in advance of final disposition of a proceeding to:
| • | any present or former director or officer who is made or threatened to be made a party to, or witness in, a proceeding by reason of his or her service in that capacity; or |
| • | any individual who, while a director or officer of our Company and at our request, serves or has served as a director, officer, partner, trustee, member or manager of another corporation, REIT, limited liability company, partnership, joint venture, trust, employee benefit plan or any other enterprise and who is made or threatened to be made a party to, or witness in, the proceeding by reason of his or her service in that capacity. |
Our charter and bylaws also permit us, upon the approval of our Board, to indemnify and advance expenses to any person who served a predecessor of ours in any of the capacities described above and to any employee or agent of our Company or a predecessor of our Company.
We have entered into indemnification agreements with each of our directors and executive officers that provide for indemnification to the maximum extent permitted by Maryland law.
122
ITEM 15. FINANCIAL STATEMENTS AND EXHIBITS.
(a) Financial Statements. See “Index to Financial Statements” on page F-1 of this Form 10.
(b) Exhibits.
125
126
| * | Previously filed. |
| † | Management contract, compensatory plan or arrangement. |
127
SIGNATURES
Pursuant to the requirements of Section 12 of the Securities Exchange Act of 1934, the registrant has duly caused this registration statement to be signed on its behalf by the undersigned, thereunto duly authorized.
VineBrook Homes Trust, Inc. | ||||||
Date: June 28, 2021 | By: | /s/ Brian Mitts | ||||
Name: | Brian Mitts | |||||
Title: | Chief Financial Officer, Assistant Secretary and Treasurer | |||||
VINEBROOK HOMES TRUST, INC.
| Page | ||||
| F-2 | ||||
Audited Consolidated Financial Statements as of and for the years ended December 31, 2020 and 2019: | ||||
| F-3 | ||||
Consolidated Statements of Operations and Comprehensive Loss | F-4 | |||
| F-5 | ||||
| F-7 | ||||
| F-9 | ||||
Unaudited Consolidated Financial Statements as of and for the three months ended March 31, 2021 and 2020 | ||||
| F-35 | ||||
Consolidated Unaudited Statements of Operations and Comprehensive Income (Loss) | F-36 | |||
| F-37 | ||||
| F-38 | ||||
| F-40 | ||||
F-1
Report of Independent Registered Public Accounting Firm
To the Shareholders and the Board of Directors of VineBrook Homes Trust, Inc. and Subsidiaries
Opinion on the Financial Statements
We have audited the accompanying consolidated balance sheets of VineBrook Homes Trust, Inc. and Subsidiaries (the Company) as of December 31, 2020 and 2019, the related consolidated statements of operations and comprehensive loss, equity and cash flows for the years then ended, and the related notes and the financial statement schedule (collectively referred to as the “consolidated financial statements”). In our opinion, the consolidated financial statements present fairly, in all material respects, the financial position of the Company at December 31, 2020 and 2019, and the results of its operations and its cash flows for the years then ended in conformity with U.S. generally accepted accounting principles.
Basis for Opinion
These financial statements are the responsibility of the Company’s management. Our responsibility is to express an opinion on the Company’s financial statements based on our audits. We are a public accounting firm registered with the Public Company Accounting Oversight Board (United States) (PCAOB) and are required to be independent with respect to the Company in accordance with the U.S. federal securities laws and the applicable rules and regulations of the Securities and Exchange Commission and the PCAOB.
We conducted our audits in accordance with the standards of the PCAOB and in accordance with auditing standards generally accepted in the United States of America. Those standards require that we plan and perform the audit to obtain reasonable assurance about whether the financial statements are free of material misstatement, whether due to error or fraud. Our audits included performing procedures to assess the risks of material misstatement of the financial statements, whether due to error or fraud, and performing procedures that respond to those risks. Such procedures included examining, on a test basis, evidence regarding the amounts and disclosures in the financial statements. Our audits also included evaluating the accounting principles used and significant estimates made by management, as well as evaluating the overall presentation of the financial statements. We believe that our audits provide a reasonable basis for our opinion.
/s/ Ernst & Young LLP
We have served as the Company’s auditor since 2018.
Phoenix, Arizona
April 2, 2021
F-2
VINEBROOK HOMES TRUST, INC. AND SUBSIDIARIES
(dollars in thousands)
| December 31, 2020 | December 31, 2019 | |||||||
| ASSETS | ||||||||
Operating real estate investments | ||||||||
Land | $ | 171,062 | $ | 128,718 | ||||
Buildings and improvements | 582,610 | 391,240 | ||||||
Intangible lease assets | 795 | 1,126 | ||||||
|
|
|
| |||||
Total gross operating real estate investments | 754,467 | 521,084 | ||||||
Accumulated depreciation and amortization | (34,396 | ) | (15,391 | ) | ||||
|
|
|
| |||||
Total net operating real estate investments | 720,071 | 505,693 | ||||||
Real estate held for sale, net | 675 | 7,163 | ||||||
|
|
|
| |||||
Total net real estate investments | 720,746 | 512,856 | ||||||
Cash | 31,225 | 11,896 | ||||||
Restricted cash | 5,871 | 5,934 | ||||||
Accounts receivable | 3,983 | 1,679 | ||||||
Due from Manager (see Note 11) | 663 | 1,686 | ||||||
Prepaid and other assets | 17,480 | 958 | ||||||
Fair market value of interest rate swaps | — | 1,627 | ||||||
|
|
|
| |||||
TOTAL ASSETS | $ | 779,968 | $ | 536,636 | ||||
|
|
|
| |||||
| LIABILITIES AND STOCKHOLDERS’ EQUITY | ||||||||
Liabilities: | ||||||||
Notes payable, net | $ | 262,522 | $ | 250,771 | ||||
Warehouse facility, net | 83,937 | 63,868 | ||||||
NREO Note Payable, net (see Note 11) | 1,250 | 1,250 | ||||||
Accounts payable and other accrued liabilities | 8,573 | 3,130 | ||||||
Accrued real estate taxes payable | 12,591 | 9,668 | ||||||
Accrued interest payable | 616 | 970 | ||||||
Security deposit liability | 7,292 | 4,958 | ||||||
Prepaid rents | 1,255 | 617 | ||||||
Fair market value of interest rate swaps | 15,453 | — | ||||||
|
|
|
| |||||
Total Liabilities | 393,489 | 335,232 | ||||||
Redeemable Series A preferred stock, $0.01 par value: 16,000,000 shares authorized; 3,540,000 and 0 shares issued and outstanding, respectively | 85,067 | — | ||||||
Redeemable noncontrolling interests in the OP | 127,090 | 93,933 | ||||||
Stockholders’ Equity: | ||||||||
Common stock, $0.01 par value: 300,000,000 shares authorized; 9,260,805 and 5,162,532 shares issued and outstanding, respectively | 93 | 52 | ||||||
Additional paid-in capital | 210,381 | 114,589 | ||||||
Distributions in excess of retained earnings | (26,002 | ) | (8,235 | ) | ||||
Accumulated other comprehensive income (loss) | (10,150 | ) | 1,065 | |||||
|
|
|
| |||||
Total Stockholders’ Equity | 174,322 | 107,471 | ||||||
|
|
|
| |||||
TOTAL LIABILITIES AND STOCKHOLDERS’ EQUITY | $ | 779,968 | $ | 536,636 | ||||
|
|
|
| |||||
See Accompanying Notes to Consolidated Financial Statements
F-3
VINEBROOK HOMES TRUST, INC. AND SUBSIDIARIES
CONSOLIDATED STATEMENTS OF OPERATIONS AND COMPREHENSIVE LOSS
(in thousands, except for per share amounts)
| For the Year Ended December 31, | ||||||||
| 2020 | 2019 | |||||||
Revenues | ||||||||
Rental income | $ | 74,865 | $ | 50,971 | ||||
Other income | 1,589 | 1,353 | ||||||
|
|
|
| |||||
Total revenues | 76,454 | 52,324 | ||||||
|
|
|
| |||||
Expenses | ||||||||
Property operating expenses | 15,722 | 10,734 | ||||||
Real estate taxes and insurance | 15,407 | 9,369 | ||||||
Property management fees | 4,611 | 3,190 | ||||||
Advisory fees | 3,271 | 1,710 | ||||||
Corporate general and administrative expenses | 4,313 | 1,414 | ||||||
Property general and administrative expenses | 2,798 | 1,633 | ||||||
Depreciation and amortization | 20,447 | 16,081 | ||||||
Interest expense | 10,901 | 9,813 | ||||||
|
|
|
| |||||
Total expenses | 77,470 | 53,944 | ||||||
Loss on sales of real estate | (930 | ) | (44 | ) | ||||
|
|
|
| |||||
Operating loss | (1,946 | ) | (1,664 | ) | ||||
Casualty gain, net of insurance proceeds | 281 | 22 | ||||||
|
|
|
| |||||
Net loss | (1,665 | ) | (1,642 | ) | ||||
Dividends on and accretion to redemption value of Redeemable Series A preferred stock | 1,052 | — | ||||||
Net loss attributable to redeemable noncontrolling interests in the OP | (570 | ) | (967 | ) | ||||
|
|
|
| |||||
Net loss attributable to common stockholders | $ | (2,147 | ) | $ | (675 | ) | ||
|
|
|
| |||||
Other comprehensive income/(loss) | ||||||||
Unrealized gain/(loss) on interest rate swaps | (17,080 | ) | 1,627 | |||||
|
|
|
| |||||
Total comprehensive loss | (18,745 | ) | (15 | ) | ||||
Dividends on and accretion to redemption value of Redeemable Series A preferred stock | 1,052 | — | ||||||
Comprehensive loss attributable to redeemable noncontrolling interests in the OP | (6,435 | ) | (405 | ) | ||||
|
|
|
| |||||
Comprehensive income/(loss) attributable to common stockholders | $ | (13,362 | ) | $ | 390 | |||
|
|
|
| |||||
Weighted average common shares outstanding - basic | 7,175 | 3,221 | ||||||
|
|
|
| |||||
Weighted average common shares outstanding - diluted | 7,175 | 3,221 | ||||||
|
|
|
| |||||
Loss per share - basic | (0.30 | ) | (0.21 | ) | ||||
|
|
|
| |||||
Loss per share - diluted | (0.30 | ) | (0.21 | ) | ||||
|
|
|
| |||||
See Accompanying Notes to Consolidated Financial Statements
F-4
VINEBROOK HOMES TRUST, INC. AND SUBSIDIARIES
CONSOLIDATED STATEMENTS OF EQUITY
(dollars in thousands)
| Class A Common Stock | ||||||||||||||||||||||||
| Number of Shares | Par Value | Additional Paid-in Capital | Distributions in Excess of Retained Earnings | Accumulated Other Comprehensive Income (Loss) | Total | |||||||||||||||||||
Balances, December 31, 2019 | 5,162,532 | $ | 52 | $ | 114,589 | $ | (8,235 | ) | $ | 1,065 | $ | 107,471 | ||||||||||||
Net loss attributable to common stockholders | — | (2,147 | ) | — | (2,147 | ) | ||||||||||||||||||
Issuance of Class A common stock | 4,129,621 | 41 | 131,503 | — | — | 131,544 | ||||||||||||||||||
Redemptions of Class A common stock | (44,441 | ) | — | (1,413 | ) | — | — | (1,413 | ) | |||||||||||||||
Offering costs | (983 | ) | — | — | (983 | ) | ||||||||||||||||||
Equity-based compensation | 13,083 | — | 1,147 | — | — | 1,147 | ||||||||||||||||||
Common stock dividends declared ($2.1204 per share) | — | (15,620 | ) | — | (15,620 | ) | ||||||||||||||||||
Other comprehensive income attributable to common stockholders | — | — | (11,215 | ) | (11,215 | ) | ||||||||||||||||||
Adjustment to reflect redemption value of redeemable noncontrolling interests in the OP | (34,462 | ) | — | — | (34,462 | ) | ||||||||||||||||||
|
|
|
|
|
|
|
|
|
|
|
| |||||||||||||
Balances, December 31, 2020 | 9,260,795 | $ | 93 | $ | 210,381 | $ | (26,002 | ) | $ | (10,150 | ) | $ | 174,322 | |||||||||||
|
|
|
|
|
|
|
|
|
|
|
| |||||||||||||
See Accompanying Notes to Consolidated Financial Statements
F-5
VINEBROOK HOMES TRUST, INC. AND SUBSIDIARIES
CONSOLIDATED STATEMENTS OF EQUITY
(dollars in thousands)
| Class A Common Stock | ||||||||||||||||||||||||
| Number of Shares | Par Value | Additional Paid-in Capital | Distributions in Excess of Retained Earnings | Accumulated Other Comprehensive Income | Total | |||||||||||||||||||
Balances, December 31, 2018 | 1,906,770 | $ | 19 | $ | 47,440 | $ | (836 | ) | $ | — | $ | 46,623 | ||||||||||||
Net loss attributable to common stockholders | — | (675 | ) | — | (675 | ) | ||||||||||||||||||
Issuance of Class A common stock | 3,255,762 | 33 | 94,162 | — | — | 94,195 | ||||||||||||||||||
Offering costs | (483 | ) | — | — | (483 | ) | ||||||||||||||||||
Equity-based compensation | 33 | — | — | �� | 33 | |||||||||||||||||||
Common stock dividends declared | — | (6,724 | ) | — | (6,724 | ) | ||||||||||||||||||
Other comprehensive income | — | — | 1,065 | 1,065 | ||||||||||||||||||||
Adjustment to reflect redemption value of redeemable noncontrolling interests in the OP | (26,563 | ) | — | — | (26,563 | ) | ||||||||||||||||||
|
|
|
|
|
|
|
|
|
|
|
| |||||||||||||
Balances, December 31, 2019 | 5,162,532 | $ | 52 | $ | 114,589 | $ | (8,235 | ) | $ | 1,065 | $ | 107,471 | ||||||||||||
|
|
|
|
|
|
|
|
|
|
|
| |||||||||||||
See Accompanying Notes to Consolidated Financial Statements
F-6
VINEBROOK HOMES TRUST, INC. AND SUBSIDIARIES
CONSOLIDATED STATEMENTS OF CASH FLOWS
(dollars in thousands)
| For the Year Ended December 31, | ||||||||
| 2020 | 2019 | |||||||
Cash flows from operating activities | ||||||||
Net loss | $ | (1,665 | ) | $ | (1,642 | ) | ||
Adjustments to reconcile net loss to net cash provided by operating activities: | ||||||||
Loss on sales of real estate | 930 | 44 | ||||||
Depreciation and amortization | 20,447 | 16,081 | ||||||
Amortization of deferred financing costs | 733 | 403 | ||||||
Change in fair value on derivative instruments included in interest expense | 1,957 | (419 | ) | |||||
Net cash received/(paid) on derivative settlements | (2,315 | ) | 409 | |||||
Amortization of assumed debt premium | (64 | ) | (16 | ) | ||||
Equity-based compensation | 2,638 | 320 | ||||||
Casualty gain | (281 | ) | (22 | ) | ||||
Changes in operating assets and liabilities, net of effects of acquisitions: | ||||||||
Operating assets | (1,319 | ) | (2,565 | ) | ||||
Operating liabilities | 9,304 | 4,213 | ||||||
|
|
|
| |||||
Net cash provided by operating activities | 30,365 | 16,806 | ||||||
|
|
|
| |||||
Cash flows from investing activities | ||||||||
Net proceeds from sales of real estate | 7,160 | 791 | ||||||
Prepaid acquisition deposits | (16,484 | ) | (182 | ) | ||||
Insurance proceeds received | 846 | 1,188 | ||||||
Additions to real estate investments | (236,992 | ) | (187,339 | ) | ||||
|
|
|
| |||||
Net cash used in investing activities | (245,470 | ) | (185,542 | ) | ||||
|
|
|
| |||||
Cash flows from financing activities | ||||||||
Mortgage proceeds received | 11,793 | — | ||||||
Mortgage payments | (157 | ) | (40 | ) | ||||
Warehouse facility proceeds received | 20,000 | 65,000 | ||||||
NREO Note proceeds received | — | 1,250 | ||||||
Deferred financing costs paid | (485 | ) | (1,267 | ) | ||||
Proceeds from issuance of Class A common stock | 124,325 | 91,493 | ||||||
Redemptions of Class A common stock paid | (1,413 | ) | — | |||||
Offering costs paid | (878 | ) | (450 | ) | ||||
Dividends paid to common stockholders | (8,040 | ) | (4,124 | ) | ||||
Proceeds from issuance of redeemable Series A preferred stock, net of offering costs | 84,940 | — | ||||||
Contributions from redeemable noncontrolling interests in the OP | 10,000 | 3,012 | ||||||
Distributions to redeemable noncontrolling interests in the OP | (3,014 | ) | (3,005 | ) | ||||
Redemptions by redeemable noncontrolling interests in the OP | (2,700 | ) | (12,000 | ) | ||||
|
|
|
| |||||
Net cash provided by financing activities | 234,371 | 139,869 | ||||||
|
|
|
| |||||
Change in cash and restricted cash | 19,266 | (28,867 | ) | |||||
Cash and restricted cash, beginning of year | 17,830 | 46,697 | ||||||
|
|
|
| |||||
Cash and restricted cash, end of year | $ | 37,096 | $ | 17,830 | ||||
|
|
|
| |||||
See Accompanying Notes to Consolidated Financial Statements
F-7
Supplemental Disclosure of Cash Flow Information | ||||||||
Interest paid, net of amount capitalized | $ | 8,581 | $ | 8,982 | ||||
Cash paid for income and franchise taxes | 281 | 126 | ||||||
Supplemental Disclosure of Noncash Activities | ||||||||
Accrued dividends payable to common stockholders | 361 | 116 | ||||||
Accrued distributions payable to redeemable noncontrolling interests in the OP | 647 | — | ||||||
Accrued dividends payable to preferred stockholders | 925 | — | ||||||
Accretion to redemption value of Redeemable Series A preferred stock | 127 | — | ||||||
Fair market value adjustment on assumed debt | 138 | 531 | ||||||
Assumed debt on acquisitions | 11,654 | 10,583 | ||||||
Offering costs accrued | 105 | 33 | ||||||
Issuance of Shares to common stockholders related to DRIP dividends | 7,219 | 2,702 | ||||||
DRIP dividends to common stockholders | (7,219 | ) | (2,702 | ) | ||||
Contributions from redeemable noncontrolling interests in the OP related to DRIP distributions | 3,872 | 3,359 | ||||||
DRIP distributions to redeemable noncontrolling interests in the OP | (3,872 | ) | (3,359 | ) | ||||
See Accompanying Notes to Consolidated Financial Statements
F-8
VINEBROOK HOMES TRUST, INC. AND SUBSIDIARIES
NOTES TO CONSOLIDATED FINANCIAL STATEMENTS
1. Organization and Description of Business
VineBrook Homes Trust, Inc. (the “Company”, “we”, “our”) was incorporated in Maryland on July 18, 2018 and has elected to be taxed as a real estate investment trust (“REIT”). The Company is focused on acquiring, renovating, leasing, maintaining and otherwise managing single-family rental home investments primarily located in large to medium size cities and suburbs located in the midwestern and southeastern United States. Substantially all of the Company’s business is conducted through VineBrook Homes Operating Partnership, L.P. (the “OP”), the Company’s operating partnership, as the Company owns its properties indirectly through the OP. VineBrook Homes OP GP, LLC (the “OP GP”), is the general partner of the OP. As of December 31, 2020, there were 11,521,310 Class A units of the OP (“OP Units”) or vested PI Units (defined below) issued under the 2018 LTIP (defined below) that are convertible into OP Units outstanding, of which 8,045,094, or 69.8%, were owned by the Company, 1,953,967, or 17.0%, were owned by NexPoint Real Estate Opportunities, LLC (“NREO”), 75,586, or 0.7%, were owned by NexPoint Real Estate Strategies Fund (“NRESF”), 737,362, or 6.4%, were owned by NexPoint Real Estate Capital, LLC (“NREC”), 129,840, or 1.1% were owned by GAF REIT, LLC (“GAF REIT”) and 579,461, or 5.0%, were owned by limited partners that were sellers in the Formation Transaction (defined below) (and in certain instances affiliated with the equity holders of the Manager (defined below)) (the “VineBrook Contributors”) or other Company insiders. NREO, NRESF, NREC and GAF REIT are noncontrolling limited partners unaffiliated with the Company but are affiliates of the Adviser (defined below).
The Company began operations on November 1, 2018 (the “Commencement of Operations”) as a result of the acquisition of various partnerships and limited liability companies owned and operated by the VineBrook Contributors and other third parties, which owned 4,129 single-family rental assets located in Ohio, Kentucky and Indiana (the “Initial Portfolio”) for a total purchase price of approximately $330.2 million, including closing and financing costs of $6.0 million (the “Formation Transaction”). On November 1, 2018, the Company accepted subscriptions for 1,097,367 shares of its Class A common stock, par value $0.01 (“Shares”), for gross proceeds of approximately $27.4 million in connection with the Formation Transaction. The proceeds from the issuance of Shares were used to acquire OP Units. The OP used the capital contribution from the Company to fund a portion of the purchase price for the Initial Portfolio. The remaining purchase price and closing costs were funded by a capital contribution totaling $70.7 million from NREO, $8.6 million of equity rolled over from VineBrook Contributors, and $241.4 million from a Federal Home Loan Mortgage Corporation (“Freddie Mac”) mortgage provided by KeyBank N.A (“KeyBank”). On May 1, 2019 (the “Release Date”), approximately $1.4 million worth of OP Units were released to various VineBrook Contributors from an indemnity reserve escrow that was established at the time the Initial Portfolio was acquired. From the time the escrow reserve was established until the Release Date, no indemnity claims were made against said escrow.
Between November 1, 2018 and December 31, 2020, the Company, through the SPEs (as defined in Note 3) owned by the OP, purchased 5,234 additional homes and sold 81 homes. Together with the Initial Portfolio, the Company, through the OP’s SPEs, indirectly owned an interest in 9,282 homes (the “Portfolio”) in 10 states as of December 31, 2020. The acquisition of the additional homes was funded by loans (see Note 5), proceeds from the sale of Shares and excess cash generated from operations.
The Company is externally managed by NexPoint Real Estate Advisors V, L.P. (the “Adviser”), through an agreement dated November 1, 2018 and subsequently amended and restated on May 4, 2020, for an initial term ending November 1, 2021 (the “Advisory Agreement”) and will automatically renew for one-year terms thereafter, unless otherwise terminated. The Adviser provides asset management services to the Company. The OP caused the SPEs to retain VineBrook Homes, LLC (the “Manager”), an affiliate of certain VineBrook Contributors, to renovate, lease, maintain, and operate the Portfolio under management agreements (as amended, the “Management Agreements”) that generally have an initial three-year term with one-year renewals, unless otherwise terminated. The Management Agreements are supplemented by a side letter (as amended and restated, the “Side Letter”) by and among the Company, the OP, the OP GP, the Manager and certain of its affiliates. Certain SPEs from time to time may have property management agreements with independent third parties that are not the Manager. These are typically the result of maintaining legacy property managers after an acquisition to help transition the properties to the Manager or, in the case of a future sale, to manage the properties until they are sold. All of the Company’s investment decisions are made by employees of the Adviser and the Manager, subject to general oversight by the OP’s investment committee and the Company’s board of directors (the “Board”). Because the principals of the Manager own OP Units, the Manager is considered an affiliate for financial reporting disclosure purposes.
The Company’s investment objectives are to maximize the cash flow and value of properties owned, acquire properties with cash flow growth potential, provide quarterly cash distributions and achieve long-term capital appreciation for its stockholders through targeted management and a renovation program on the homes purchased.
F-9
VINEBROOK HOMES TRUST, INC. AND SUBSIDIARIES
NOTES TO CONSOLIDATED FINANCIAL STATEMENTS
On August 28, 2018, the Company authorized the offering of 40,000,000 Shares through a continuous private placement (the “Continuous Offering”), under regulation D of the Securities Act of 1933 (and various state securities law provisions) for a maximum of $1.0 billion of its Shares. The Continuous Offering expires on November 1, 2023 but may be extended for up to two times for one year each. The initial offering price for Shares sold through the Continuous Offering was $25.00 per Share. The Company conducts periodic closings and sells Shares at the prior net asset value (the “NAV”) as determined using the valuation methodology recommended by the Adviser and approved by the pricing committee of the Board (the “Valuation Methodology”). Additionally, an independent third-party valuation firm assesses and evaluates the appropriateness of each NAV; all NAVs have been assessed as reasonable by the third-party. NAV may differ from the values of our real estate assets as calculated in accordance with GAAP.
NexPoint Securities, Inc. (the “Dealer Manager”), an entity under common ownership with the Adviser, serves as the dealer manager for the Continuous Offering and Raymond James and other unaffiliated broker-dealers serve as placement agents through selling agreements between each placement agent and the Company.
The Company has adopted a Long-Term Incentive Plan (the “2018 LTIP”) whereby the Board, or a committee thereof, may grant awards of restricted share units of the Company (“RSUs”) or profits interest units in the OP (“PI Units”) to certain employees of the Adviser and the Manager, or others at the discretion of the Board (including the directors and officers of the Company or other service providers of the Company or the OP). Under the terms of the 2018 LTIP, 426,307 Shares were initially reserved, subject to automatic increase on January 1st of each year beginning with January 1, 2019 by a number equal to 10% of the total number outstanding on December 31st of the preceding year of OP Units and vested PI Units, provided that the Board may act prior to each such January 1st to determine that there will be no increase for such year or that the increase will be less than the number of shares by which the Share Reserve would otherwise increase (the “Share Reserve”). In addition, the Shares available under the LTIP Plan may not exceed in the aggregate 10% of the number of OP Units and vested PI Units outstanding at the time of measurement (the “Share Maximum”). Grants may be made annually by the Board, or more or less frequently in the Board’s sole discretion. Vesting of grants made under the 2018 LTIP will occur over a period of time as determined by the Board and may include the achievement of performance metrics, also as determined by the Board in its sole discretion.
2. Summary of Significant Accounting Policies
Basis of Accounting and Use of Estimates
The accompanying consolidated financial statements are presented in accordance with accounting principles generally accepted in the United States (“GAAP”) and the rules and regulations of the U.S. Securities and Exchange Commission (the “SEC”). GAAP requires management to make estimates and assumptions that affect the reported amounts of assets and liabilities and the disclosure of contingent liabilities at the dates of the consolidated financial statements and the amounts of revenues and expenses during the reporting periods. Actual amounts realized or paid could differ from those estimates.
Principles of Consolidation
The Company accounts for subsidiary partnerships, joint ventures and other similar entities in which it holds an ownership interest in accordance with Financial Accounting Standards Board (“FASB”) Accounting Standards Codification (“ASC”) 810, Consolidation. The Company first evaluates whether each entity is a variable interest entity (“VIE”). Under the VIE model, the Company consolidates an entity when it has control to direct the activities of the VIE and the obligation to absorb losses or the right to receive benefits that could potentially be significant to the VIE. If the Company determines the entity is not a VIE, it evaluates whether the entity should be consolidated under the voting model. The Company consolidates an entity when it controls the entity through ownership of a majority voting interest. As of December 31, 2020, the Company has determined it must consolidate the OP and its subsidiaries under the VIE model as it was determined the Company both controls the direct activities of the OP and the right to receive benefits that could potentially be significant to the OP. The consolidated financial statements include the accounts of the Company and its subsidiaries, including the OP and its subsidiaries. All significant intercompany accounts and transactions have been eliminated in consolidation. OP Units that are not owned by the Company are presented as noncontrolling interests in the consolidated financial statements, and income or loss generated at the OP is allocated between the Company and the noncontrolling interests based upon their relative ownership percentages.
Real Estate Investments
Upon acquisition, we evaluate our acquired single-family residential properties for purposes of determining whether a transaction should be accounted for as an asset acquisition or business combination. Since substantially all of the fair value of our acquired properties is concentrated in a single identifiable asset or group of similar identifiable assets and the acquisitions do not include a substantive process, our purchases of homes or portfolios of homes qualify as asset acquisitions. Accordingly, upon acquisition of a property, the purchase price and related acquisition costs (“Total Consideration”) are allocated to land, buildings, improvements, fixtures, and intangible lease assets based upon their relative fair values.
F-10
VINEBROOK HOMES TRUST, INC. AND SUBSIDIARIES
NOTES TO CONSOLIDATED FINANCIAL STATEMENTS
The allocation of Total Consideration, which is determined using inputs that are classified within Level 3 of the fair value hierarchy established by FASB ASC 820, Fair Value Measurement (“ASC 820”) (see Note 6), is based on an independent third-party valuation firm’s estimate of the fair value of the tangible and intangible assets and liabilities acquired. The valuation methodology utilizes market comparable information, depreciated replacement cost and other estimates in allocating value to the tangible assets. The allocation of the Total Consideration to intangible lease assets represents the value associated with the in-place leases, as one month’s worth of effective gross income (rental revenue, less credit loss allowance, plus other income) as the average downtime of the assets in the portfolio is approximately one month and the assets in the portfolio are leased on a gross rental structure. If any debt is assumed in an acquisition, the difference between the fair value, which is estimated using inputs that are classified within Level 2 of the fair value hierarchy, and the face value of debt is recorded as a premium or discount and amortized or accreted as interest expense over the life of the debt assumed.
Real estate assets, including land, buildings, improvements, fixtures, and intangible lease assets are stated at historical cost less accumulated depreciation and amortization. Costs incurred in making repairs and maintaining real estate assets are expensed as incurred. Expenditures for improvements, renovations, and replacements are capitalized at cost. The Company also incurs costs to prepare acquired properties for rental. These costs are capitalized to the cost of the property during the period the property is undergoing activities to prepare it for its intended use. We capitalize interest costs as a cost of the property only during the period for which activities necessary to prepare an asset for its intended use are ongoing, provided that expenditures for the asset have been made and interest costs have been incurred. Upon completion of the renovation of our properties, all costs of operations, including repairs and maintenance, are expensed as incurred, unless the renovation meets the Company’s capitalization criteria. Real estate-related depreciation and amortization are computed on a straight-line basis over the estimated useful lives as described in the following table:
Land | Not depreciated | |
Buildings | 27.5 years | |
Improvements (1) | 15 years | |
Fixtures (1) (2) | 5 - 7 years | |
Intangible lease assets | 6 months | |
Capitalized building maintenance | 3 - 15 years |
| (1) | Disclosed in the table is the typical depreciable life used by the Company. |
| (2) | Fixtures are included in buildings and improvements on the consolidated balance sheet. |
As of December 31, 2020, the gross balance and accumulated amortization related to the intangible lease assets was $0.8 million and $0.3 million, respectively. As of December 31, 2019, the gross balance and accumulated amortization related to the intangible lease assets was $1.1 million and $0.6 million, respectively. For the years ended December 31, 2020 and 2019, the Company recognized approximately $1.1 million and $3.1 million, respectively, of amortization expense related to the intangible lease assets.
Real estate assets are reviewed for impairment quarterly or whenever events or changes in circumstances indicate that the carrying amount of an asset may not be recoverable. Significant indicators of impairment may include, but are not limited to, declines in home values, rental rates or occupancy percentages, as well as significant changes in the economy. In such cases, the Company will evaluate the recoverability of the assets by comparing the estimated future cash flows expected to result from the use and eventual disposition of each asset to its carrying amount and provide for impairment if such undiscounted cash flows are insufficient to recover the carrying amount. If impaired, the real estate asset will be written down to its estimated fair value. No significant impairments on operating properties were recorded during the years ended December 31, 2020 and 2019.
Cash and restricted cash
The Company maintains cash at multiple financial institutions and, at times, these balances exceed federally insurable limits. As a result, there is a concentration of credit risk related to amounts on deposit. We believe any risks are mitigated through the size of the financial institutions at which our cash balances are held.
Restricted cash represents cash deposited in accounts related to security deposits, property taxes, insurance premiums and deductibles and other lender-required escrows. Amounts deposited in the reserve accounts associated with the loans can only be used as provided for in the respective loan agreements, and security deposits held pursuant to lease agreements are required to be segregated.
F-11
VINEBROOK HOMES TRUST, INC. AND SUBSIDIARIES
NOTES TO CONSOLIDATED FINANCIAL STATEMENTS
The following table provides a reconciliation of cash and restricted cash reported on the consolidated balance sheets that sum to the total of such amount shown in the consolidated statements of cash flows (in thousands):
| December 31, 2020 | December 31, 2019 | |||||||
Unrestricted cash | $ | 31,225 | $ | 11,896 | ||||
Tax escrow | 4,209 | 3,653 | ||||||
Insurance escrow | 311 | 1,307 | ||||||
Reserve replacement escrow | 1,109 | 823 | ||||||
Security deposits | 242 | 151 | ||||||
|
|
|
| |||||
Total cash and restricted cash | $ | 37,096 | $ | 17,830 | ||||
|
|
|
| |||||
Revenue Recognition
The Company’s primary operations consist of rental income earned from its residents under lease agreements typically with terms of one year or less. As a result of the adoption of ASC 842 on January 1, 2019, the Company classifies the single-family property leases as operating leases and elects to not separate the lease component, comprised of rents from single-family properties, from the associated non-lease component, comprised of fees from single-family properties and tenant charge-backs. The combined component is accounted for under the new lease accounting standard while certain resident reimbursements are accounted for as variable payments under the revenue accounting guidance. Rental income is recognized when earned. This policy effectively results in income recognition on a straight-line basis over the related terms of the leases. Resident reimbursements and other income consist of charges billed to residents for utilities, resident-caused damages, pets, administrative, application and other fees and are recognized when earned. The Company uses a direct write-off method for uncollectable rents; these uncollectible rents are netted against rental income.
The table below outlines the components of rental income and its other components for the years ended December 31, 2020 and 2019 (in thousands):
| For the Year Ended December 31, | ||||||||
Lease Income Type | 2020 | 2019 | ||||||
Rental income | $ | 72,226 | $ | 48,962 | ||||
Utility reimbursements | 585 | 315 | ||||||
Late fees | 729 | 663 | ||||||
Pet fees | 735 | 578 | ||||||
Other fees | 590 | 453 | ||||||
|
|
|
| |||||
Total rental income | 74,865 | 50,971 | ||||||
|
|
|
| |||||
Gains or losses on sales of properties are recognized pursuant to the provisions included in ASC 610-20, Other Income. We recognize a full gain or loss on sale, which is presented in loss on sales of real estate on the consolidated statements of operations and comprehensive loss, when the derecognition criteria under ASC 610-20 have been met.
In April 2020, the Financial Accounting Standards Board issued a Staff Q&A on accounting for leases during the COVID-19 pandemic, focused on the application of lease guidance in ASC 842, Leases. The Q&A states that some lease contracts may contain explicit or implicit enforceable rights and obligations that require lease concessions if certain circumstances arise that are beyond the control of the parties to the contract. Therefore, entities would need to perform a lease-by-lease analysis to determine whether contractual provisions in an existing lease agreement provide enforceable rights and obligations related to lease concessions. The FASB determined it would be acceptable for entities to not perform a lease-by-lease analysis regarding rent concessions resulting from COVID-19, and to instead make a policy election regarding rent concessions, which would give entities the option to account or not to account for these rent concessions as lease modifications if the total payments required by the modified contract are substantially the same or less than the total payments required by the original contract. Entities making the election to account for these rent concessions as lease modifications would recognize the effects of rent abatements and rent deferrals on a prospective straight-line basis over the remainder of the modified contract. We have made the election to not perform a lease-by-lease analysis to determine whether contractual provisions in an existing lease agreement provide enforceable rights and obligations related to payment plans. By electing the FASB relief, we have also made an accounting policy election to not account for rent deferrals provided to lessees due to the COVID-19 pandemic as lease modifications. Lessees are required to pay the full outstanding balance of the rent deferred over the period of the payment plan.
F-12
VINEBROOK HOMES TRUST, INC. AND SUBSIDIARIES
NOTES TO CONSOLIDATED FINANCIAL STATEMENTS
Redeemable Securities
Included in the Company’s consolidated balance sheets are redeemable noncontrolling interests in the OP and 6.50% Series A Cumulative Redeemable Preferred Stock (the “Preferred Shares”). These interests are presented in the “mezzanine” section of the consolidated balance sheets because they do not meet the functional definition of a liability or equity under current accounting literature. The Company accounts for these under the provisions of Accounting Standards Codification (ASC) Topic 480-10-S99-3A, paragraph 15(b).
In accordance with ASC Topic 480-10-S99, since the redeemable noncontrolling interests in the OP have a redemption feature, they are measured at their redemption value if such value exceeds the carrying value of interests. The redemption value is based on the NAV per unit at the measurement date. The offset to the adjustment to the carrying amount of the redeemable noncontrolling interests in the OP is reflected in the Company’s additional paid-in capital on the balance sheet. In accordance with ASC Topic 480-10-S99, the Preferred Shares are measured at their carrying value plus the accretion to their future redemption value on the balance sheet. The accretion is reflected in the Company’s dividends and accretion of issuance costs on Series A redeemable preferred stock on the statement of operations and comprehensive loss.
Earnings (Loss) Per Share
Basic earnings (loss) per share is computed by dividing net income (loss) attributable to common stockholders by the weighted average number of shares of the Company’s common stock outstanding, which excludes any unvested restricted stock units issued pursuant to the 2018 LTIP. Diluted earnings (loss) per share is computed by adjusting basic earnings (loss) per share for the dilutive effect of the assumed vesting of restricted stock units. During periods of net loss, the assumed vesting of restricted stock units is anti-dilutive and is not included in the calculation of earnings (loss) per share. The following table sets forth the computation of basic and diluted earnings (loss) per share for the periods presented (in thousands, except per share amounts):
| For the Year Ended December 31, | ||||||||
| 2020 | 2019 | |||||||
Numerator for loss per share: | ||||||||
Net loss | $ | (1,665 | ) | $ | (1,642 | ) | ||
Less: | ||||||||
Dividends on and accretion to redemption value of Redeemable Series A preferred stock | 1,052 | — | ||||||
Net loss attributable to redeemable noncontrolling interests in the OP | (570 | ) | (967 | ) | ||||
|
|
|
| |||||
Net income (loss) attributable to common stockholders | $ | (2,147 | ) | $ | (675 | ) | ||
|
|
|
| |||||
Denominator for earnings (loss) per share: | ||||||||
Weighted average common shares outstanding - basic | 7,175 | 3,221 | ||||||
Weighted average unvested restricted stock units | — | — | ||||||
|
|
|
| |||||
Weighted average common shares outstanding - diluted | 7,175 | 3,221 | ||||||
Earnings (loss) per weighted average common share: | ||||||||
Basic | $ | (0.30 | ) | $ | (0.21 | ) | ||
Diluted | $ | (0.30 | ) | $ | (0.21 | ) | ||
Segment Reporting
Under the provision of ASC 280, Segment Reporting, the Company has determined that it has one reportable segment with activities related to acquiring, renovating, developing, leasing and operating single-family homes as rental properties. The Company’s management allocates resources and evaluates operating performance on a total portfolio basis. The aggregation of individual homes constitutes the total portfolio.
F-13
VINEBROOK HOMES TRUST, INC. AND SUBSIDIARIES
NOTES TO CONSOLIDATED FINANCIAL STATEMENTS
Recent Accounting Pronouncements
In June 2016, the FASB issued ASU 2016-13, Financial Instruments - Credit Losses (Topic 326) -Measurement of Credit Losses on Financial Instruments (“ASU 2016-13”), which changes how entities measure credit losses for most financial assets. This guidance requires an entity to estimate its lifetime “expected credit loss” and record an allowance that, when deducted from the amortized cost basis of the financial asset, presents the net amount expected to be collected on the financial asset. In November 2018, the FASB issued ASU 2018–19, Codification Improvements to Topic 326, Financial Instruments - Credit Losses, which clarified that receivables arising from operating leases are within the scope of the leasing standard (ASC 842) discussed above. Subsequent to issuing ASU 2016-13, the FASB issued ASU 2019-04, Codification Improvements to Topic 326, Financial Instruments - Credit Losses, Topic 815, Derivatives and Hedging, and Topic 825, Financial Instruments (“ASU 2019-04”) in April 2019 and ASU 2019-05, Financial Instruments-Credit Losses (Topic 326): Targeted Transition Relief (“ASU 2019-05”) in May 2019. ASU 2019-04 clarifies that equity instruments without readily determinable fair values for which an entity has elected the measurement alternative should be remeasured to fair value as of the date that an observable transaction occurred. ASU 2019-05 provides an option to irrevocably elect to measure certain individual financial assets at fair value instead of amortized cost. The amendments should be applied on either a prospective transition or modified-retrospective approach depending on the subtopic. The guidance is effective for the Company for annual reporting periods beginning after December 15, 2019. The Company adopted this guidance effective January 1, 2020 with no material impact to the consolidated financial statements.
In March 2020, the FASB issued ASU 2020-04, Reference Rate Reform (Topic 848) (“ASU 2020-04”). ASU 2020-04 contains practical expedients for reference rate reform related activities that impact debt, leases, derivatives and other contracts. The guidance in ASU 2020-04 is optional and may be elected over time as reference rate reform activities occur. The Company is currently evaluating the impact the adoption of this ASU will have on the Company’s consolidated financial statements.
COVID-19
The COVID-19 pandemic could have material and adverse effects on our financial condition, results of operations, and cash flows in the near term. Since the outbreak, we have provided limited payment plans if certain criteria are met by residents. The duration of a payment plan is determined on a case by case basis, and ultimately the tenant is expected to make rent payments in full over time. The Company had not granted any direct rent reductions to residents in response to the crisis as of December 31, 2020. The Company continues to closely monitor the impact of the COVID-19 pandemic on all aspects of our business.
3. Investments in Subsidiaries
In connection with its indirect investments in real estate assets acquired, the Company, through its ownership of the OP, indirectly holds a proportional ownership interest in the Portfolio, through the OP’s beneficial ownership of all of the issued and outstanding membership interests in the special purpose limited liability companies (“SPEs”) that directly own the Portfolio. All of the properties in the Portfolio are consolidated in the Company’s consolidated financial statements. The assets of each entity can only be used to settle obligations of that particular entity, and the creditors of each entity have no recourse to the assets of other entities or the Company, except as discussed below. Under the terms of the notes payable, except as discussed below, the lender has a mortgage interest in each real estate asset in the SPE to which the loan is made.
F-14
VINEBROOK HOMES TRUST, INC. AND SUBSIDIARIES
NOTES TO CONSOLIDATED FINANCIAL STATEMENTS
As of December 31, 2020, the Company owned the Portfolio, which consisted of 9,282 properties, through nine SPEs. The following table presents the ownership structure of each SPE group that directly owns the title to each real estate asset as of December 31, 2020, the number of assets held, the cost of those assets, the resulting debt allocated to each SPE and whether the debt is a mortgage. The mortgage loan may be settled from the assets of the below entities to which the loan is made. Loans from the Warehouse Facility (as defined in Note 5) can only be settled from the assets owned by VB One, LLC (dollars in thousands):
VIE Name | Homes | Cost Basis | OP Beneficial Ownership % | Encumbered by Mortgage (1) | Debt Allocated | |||||||||||||||
NREA VB I, LLC | 66 | $ | 5,999 | 100 | % | Yes | $ | 5,048 | ||||||||||||
NREA VB II, LLC | 172 | 16,549 | 100 | % | Yes | 10,799 | ||||||||||||||
NREA VB III, LLC | 1,323 | 119,231 | 100 | % | Yes | 71,189 | ||||||||||||||
NREA VB IV, LLC | 386 | 37,016 | 100 | % | Yes | 24,330 | ||||||||||||||
NREA VB V, LLC | 1,829 | 125,041 | 100 | % | Yes | 108,384 | ||||||||||||||
NREA VB VI, LLC | 299 | 26,804 | 100 | % | Yes | 18,661 | ||||||||||||||
NREA VB VII, LLC | 36 | 3,028 | 100 | % | Yes | 2,989 | ||||||||||||||
True FM2017-1, LLC | 150 | 12,246 | 100 | % | Yes | 10,570 | ||||||||||||||
SMP Homes 3B, LLC | 161 | 16,605 | 100 | % | Yes | 9,296 | ||||||||||||||
SMP Homes 5B, LLC | 45 | 4,400 | 100 | % | Yes | 2,358 | ||||||||||||||
VB One, LLC | 4,781 | 384,938 | 100 | % | No | 85,000 | ||||||||||||||
VB Two, LLC | 34 | 3,285 | 100 | % | No | — | ||||||||||||||
|
|
|
|
|
| |||||||||||||||
| 9,282 | $ | 755,142 | $ | 348,624 | ||||||||||||||||
|
|
|
|
|
| |||||||||||||||
The following table shows the detail of the SPEs as of December 31, 2019 (dollars in thousands): |
| |||||||||||||||||||
VIE Name | Homes | Cost Basis | OP Beneficial Ownership % | Encumbered by Mortgage (1) | Debt Allocated | |||||||||||||||
NREA VB I, LLC | 66 | $ | 5,742 | 100 | % | Yes | $ | 5,048 | ||||||||||||
NREA VB II, LLC | 172 | 15,814 | 100 | % | Yes | 10,799 | ||||||||||||||
NREA VB III, LLC | 1,323 | 113,045 | 100 | % | Yes | 71,189 | ||||||||||||||
NREA VB IV, LLC | 386 | 35,417 | 100 | % | Yes | 24,330 | ||||||||||||||
NREA VB V, LLC | 1,829 | 118,768 | 100 | % | Yes | 108,384 | ||||||||||||||
NREA VB VI, LLC | 299 | 25,003 | 100 | % | Yes | 18,661 | ||||||||||||||
NREA VB VII, LLC | 36 | 2,855 | 100 | % | Yes | 2,989 | ||||||||||||||
True FM2017-1, LLC | 196 | 16,594 | 100 | % | Yes | 10,727 | ||||||||||||||
VB One, LLC | 2,603 | 179,618 | 100 | % | No | 65,000 | ||||||||||||||
|
|
|
|
|
| |||||||||||||||
| 6,910 | $ | 512,856 | $ | 317,127 | ||||||||||||||||
|
|
|
|
|
| |||||||||||||||
| (1) | Some of the assets in VB One, LLC were acquired utilizing debt provided through the Warehouse Facility (as defined in Note 5) but these assets are not encumbered by a mortgage. Instead, the lender has an equity pledge in certain assets of VB One, LLC and an equity pledge in the equity of VB One, LLC. |
F-15
VINEBROOK HOMES TRUST, INC. AND SUBSIDIARIES
NOTES TO CONSOLIDATED FINANCIAL STATEMENTS
4. Real Estate Assets
As of December 31, 2020, the Company, through the OP and its SPE subsidiaries, owned 9,282 single-family rental homes. As of December 31, 2019, the Company, through the OP and its SPE subsidiaries, owned 6,910 single-family rental homes. The components of the Company’s real estate investments in single family rental properties were as follows (in thousands):
| Land | Buildings and improvements (1) | Intangible lease assets | Real estate held for sale, net | Total | ||||||||||||||||
Gross Real Estate, December 31, 2019 | $ | 128,718 | $ | 391,240 | $ | 1,126 | $ | 7,163 | $ | 528,247 | ||||||||||
Additions | 42,344 | 191,370 | 1,111 | — | 234,825 | |||||||||||||||
Write-offs | — | — | (1,442 | ) | — | (1,442 | ) | |||||||||||||
Dispositions | — | — | — | (6,488 | ) | (6,488 | ) | |||||||||||||
|
|
|
|
|
|
|
|
|
| |||||||||||
Gross Real Estate, December 31, 2020 | 171,062 | 582,610 | 795 | 675 | 755,142 | |||||||||||||||
Accumulated depreciation and amortization | — | (34,114 | ) | (282 | ) | — | (34,396 | ) | ||||||||||||
|
|
|
|
|
|
|
|
|
| |||||||||||
Net Real Estate, December 31, 2020 | $ | 171,062 | $ | 548,496 | $ | 513 | $ | 675 | $ | 720,746 | ||||||||||
|
|
|
|
|
|
|
|
|
| |||||||||||
| Land | Buildings and improvements (1) | Intangible lease assets | Real estate held for sale, net | Total | ||||||||||||||||
Gross Real Estate, December 31, 2018 | $ | 89,037 | $ | 242,746 | $ | 3,523 | $ | — | $ | 335,306 | ||||||||||
Additions | 39,681 | 148,494 | 1,320 | 7,998 | 197,493 | |||||||||||||||
Write-offs | — | — | (3,717 | ) | — | (3,717 | ) | |||||||||||||
Dispositions | — | — | — | (835 | ) | (835 | ) | |||||||||||||
|
|
|
|
|
|
|
|
|
| |||||||||||
Gross Real Estate, December 31, 2019 | 128,718 | 391,240 | 1,126 | 7,163 | 528,247 | |||||||||||||||
Accumulated depreciation and amortization | — | (14,825 | ) | (566 | ) | — | (15,391 | ) | ||||||||||||
|
|
|
|
|
|
|
|
|
| |||||||||||
Net Real Estate, December 31, 2019 | $ | 128,718 | $ | 376,415 | $ | 560 | $ | 7,163 | $ | 512,856 | ||||||||||
|
|
|
|
|
|
|
|
|
| |||||||||||
| (1) | Includes capitalized interest, real estate taxes, insurance and other costs incurred during renovation of the properties. |
During the years ended December 31, 2020 and 2019, the Company recognized depreciation expense of approximately $19.3 million and $13.0 million, respectively.
Acquisitions and dispositions
During the year ended December 31, 2020, the Company, through the OP, acquired 2,440 homes and disposed of 68 homes. During the year ended December 31, 2019, the Company, through the OP, acquired 2,718 homes and sold 13 homes.
Held for sale properties
The Company periodically classifies real estate assets as held for sale when certain criteria are met, in accordance with GAAP. Once the Company begins marketing an asset or determines that it will pursue marketing an asset, the asset becomes classified as held for sale. At that time, the Company presents the net real estate assets separately in its consolidated balance sheet, and the Company ceases recording depreciation and amortization expense related to that property. Real estate held for sale is reported at the lower of its carrying amount or its estimated fair value less estimated costs to sell. As of December 31, 2020, there are 8 properties that are classified as held for sale. These held for sale properties are unencumbered and have a carrying amount of approximately $0.7 million.
F-16
VINEBROOK HOMES TRUST, INC. AND SUBSIDIARIES
NOTES TO CONSOLIDATED FINANCIAL STATEMENTS
5. Debt
On November 1, 2018, the OP (as guarantor) and some of the SPEs (as borrowers) entered into a $241.4 million Freddie Mac mortgage loan (the “Initial Mortgage”) with KeyBank. The Initial Mortgage is secured by certain properties in the Initial Portfolio and equity pledges of the SPEs and bears interest at a variable rate equal to the 30-day London InterBank Offered Rate (“one-month LIBOR”) plus 1.55%. The Initial Mortgage is interest-only for the first 48 months of the term and principal amortizes at a rate of 30 years over the last 36 months of the term. The Initial Mortgage matures and is due in full on December 1, 2025. The balance of the Initial Mortgage, net of unamortized deferred financing costs, is included in notes payable on the consolidated balance sheets.
On September 20, 2019, the OP (as guarantor) and VB One, LLC (as borrower) entered into a credit facility (the “Warehouse Facility”) with KeyBank. The Warehouse Facility is secured by an equity pledge in certain assets of VB One, LLC and an equity pledge in the equity of VB One, LLC and bears interest at a variable rate equal to one-month LIBOR plus 2.25%. The Warehouse Facility is a full-term, interest-only facility with an initial 36-month term, has one 12-month extension option, and the Company has the right to request an increase in the facility amount of up to $250.0 million. As of December 31, 2020, the commitment amount of the Warehouse Facility is $135.0 million. The balance of the Warehouse Facility, net of unamortized deferred financing costs, is included in Warehouse Facility on the consolidated balance sheets.
On September 30, 2019, in relation to the acquisition of a 954-home portfolio, the OP (as guarantor) assumed an approximately $10.8 million Freddie Mac mortgage loan (the “TrueLane Mortgage”) with Berkadia Commercial Mortgage LLC as a result of the OP’s acquisition of True FM 2017-1, LLC. The TrueLane Mortgage is secured by the properties in True FM 2017-1, LLC and an equity pledge in True FM 2017-1, LLC and bears interest at a fixed rate equal to 5.35%. The TrueLane Mortgage matures and is due in full on February 1, 2028 and requires monthly principal and interest payments. The balance of the TrueLane Mortgage, net of unamortized deferred financing costs, is included in notes payable on the consolidated balance sheets.
On December 28, 2020, in relation to the acquisition of a 161-home portfolio, the OP provided a non-recourse carveout guaranty related to an approximately $9.2 million mortgage loan assumed by a subsidiary of the OP (the “Colony Note”) with Colony American Finance Lender, LLC as a result of the OP’s acquisition of SMP Homes 3B, LLC. The Colony Note is secured by the properties in SMP Homes 3B, LLC and an equity pledge in SMP Homes 3B, LLC and bears interest at a fixed rate equal to 6.06%. The Colony Note matures and is due in full on December 9, 2021 and requires monthly principal and interest payments. The balance of the Colony Note, net of unamortized deferred financing costs, is included in notes payable on the consolidated balance sheets.
On December 28, 2020, in relation the acquisition of a 45-home portfolio, the OP provided a non-recourse carveout guaranty related to an approximately $2.4 million mortgage loan assumed by a subsidiary of the OP (the “CoreVest Note”) with CoreVest American Finance Lender LLC as a result of the OP’s acquisition of SMP Homes 5B, LLC. The CoreVest Note is secured by the properties in SMP Homes 5B, LLC and an equity pledge in SMP Homes 5B, LLC and bears interest at a fixed rate equal to 6.12%. The CoreVest Note matures and is due in full on January 9, 2023 and requires monthly principal and interest payments. The balance of the CoreVest Note, net of unamortized deferred financing costs, is included in notes payable on the consolidated balance sheets.
As of December 31, 2020, the Company is in compliance with all debt covenants in all of its debt agreements.
The weighted average interest rate of the Company’s debt was 2.1227% as of December 31, 2020 and 3.5268% as of December 31, 2019. As of December 31, 2020 and December 31, 2019, the adjusted weighted average interest rate of the Company’s debt, including the effect of derivative financial instruments, was 3.2998% and 3.3227%, respectively. For purposes of calculating the adjusted weighted average interest rate of the Company’s debt, including the effect of derivative financial instruments, the Company has included the weighted average fixed rate of 1.4309% for one-month LIBOR on its combined $320.0 million notional amount of interest rate swap agreements, which effectively fix the interest rate on $320.0 million of the Company’s floating rate indebtedness (see Note 6).
F-17
VINEBROOK HOMES TRUST, INC. AND SUBSIDIARIES
NOTES TO CONSOLIDATED FINANCIAL STATEMENTS
The following table contains summary information concerning the Company’s debt as of December 31, 2020 and 2019 (dollars in thousands):
| Outstanding Principal as of December 31, | ||||||||||||||
| Type | 2020 | 2019 | Interest Rate (1) | |||||||||||
Initial Mortgage | Floating | $ | 241,400 | $ | 241,400 | 1.69 | % | |||||||
Warehouse Facility | Floating | 85,000 | 65,000 | 2.39 | % | |||||||||
TrueLane Mortgage | Fixed | 10,570 | 10,727 | 5.35 | % | |||||||||
Colony Note | Fixed | 9,296 | — | 6.06 | % | |||||||||
CoreVest Note | Fixed | 2,358 | — | 6.12 | % | |||||||||
NexPoint Real Estate Opportunities, LLC Note(2) | Floating | 1,250 | 1,250 | 2.39 | % | |||||||||
|
|
|
| |||||||||||
| $ | 349,874 | $ | 318,377 | |||||||||||
Debt premium, net(3) | 591 | 515 | ||||||||||||
Deferred financing costs, net of accumulated amortization of $1,235 and $455, respectively | (2,756 | ) | (3,003 | ) | ||||||||||
|
|
|
| |||||||||||
| $ | 347,709 | $ | 315,889 | |||||||||||
|
|
|
| |||||||||||
| (1) | Except for fixed rate debt, the interest rate is one-month LIBOR plus an applicable margin. One-month LIBOR as of December 31, 2020 was 0.1439%. One-month LIBOR as of December 31, 2019 was 1.7625%. |
| (2) | This is a related party note which is convertible to equity at the election of the Company or upon its maturity on September 19, 2022 (see Note 11). |
| (3) | The Company reflected valuation adjustments on its assumed fixed rate debt to adjust it to fair market value on the dates of acquisition for the difference between the fair value and the assumed principal amount of debt. The difference is amortized into interest expense over the remaining terms of the debt. |
Schedule of Debt Maturities
The aggregate scheduled maturities, including amortizing principal payments, of total debt for the next five calendar years subsequent to December 31, 2020 are as follows (in thousands):
| Total | ||||
2021 | $ | 9,496 | ||
2022 | 955 | |||
2023 | 97,305 | (1) | ||
2024 | 8,375 | |||
2025 | 224,110 | |||
Thereafter | 9,633 | |||
|
| |||
Total | $ | 349,874 | ||
|
| |||
| (1) | Assumes the Company exercises the 12-month extension option on the Warehouse Facility. |
Deferred Financing Costs
The Company defers costs incurred in obtaining financing and amortizes the costs over the term of the related debt using the straight-line method, which approximates the effective interest method. Deferred financing costs, net of amortization, are recorded as a reduction from the related debt on the Company’s consolidated balance sheets. Upon repayment of, or in conjunction with, a material change in the terms of the underlying debt agreement, any unamortized costs are charged to loss on extinguishment of debt and modification costs and any prepayment penalty resulting from the early repayment of the debt is recorded as interest expense in the period incurred. For the years ended December 31, 2020 and 2019, amortization of deferred financing costs of approximately $0.7 million and $0.4 million, respectively, is included in interest expense on the consolidated statements of operations and comprehensive loss.
F-18
VINEBROOK HOMES TRUST, INC. AND SUBSIDIARIES
NOTES TO CONSOLIDATED FINANCIAL STATEMENTS
6. Fair Value of Derivatives and Financial Instruments
Fair value measurements are determined based on the assumptions that market participants would use in pricing an asset or liability. As a basis for considering market participant assumptions in fair value measurements, ASC 820 establishes a fair value hierarchy that distinguishes between market participant assumptions based on market data obtained from sources independent of the reporting entity (observable inputs that are classified within Levels 1 and 2 of the hierarchy) and the reporting entity’s own assumptions about market participant assumptions (unobservable inputs classified within Level 3 of the hierarchy):
| • | Level 1 inputs utilize quoted prices (unadjusted) in active markets for identical assets or liabilities that the Company has the ability to access. |
| • | Level 2 inputs are inputs other than quoted prices included in Level 1 that are observable for the asset or liability, either directly or indirectly. Level 2 inputs may include quoted prices for similar assets and liabilities in active markets, as well as inputs that are observable for the asset or liability (other than quoted prices), such as interest rates and yield curves that are observable at commonly quoted intervals. |
| • | Level 3 inputs are the unobservable inputs for the asset or liability, which are typically based on an entity’s own assumption, as there is little, if any, related market activity. In instances where the determination of the fair value measurement is based on input from different levels of the fair value hierarchy, the level in the fair value hierarchy within which the entire fair value measurement falls is based on the lowest level input that is significant to the fair value measurement in its entirety. |
The Company’s assessment of the significance of a particular input to the fair value measurement in its entirety requires judgment and considers factors specific to the asset or liability. The Company utilizes independent third parties to perform the allocation of value analysis for each property acquisition and to perform the market valuations on its derivative financial instruments and has established policies, as described above, processes and procedures intended to ensure that the valuation methodologies for investments and derivative financial instruments are fair and consistent as of the measurement date.
Derivative Financial Instruments and Hedging Activities
The Company manages interest rate risk primarily by managing the amount, sources, and duration of its debt funding and the use of derivative financial instruments. Specifically, the Company has entered into an interest rate cap and interest rate swaps to manage exposures that arise from changes in interest rates. The Company’s derivative financial instruments are used to manage the Company’s risk of increased cash outflows from the floating rate loans that may result from rising interest rates, in particular the reference rate for the loans, or one-month LIBOR. In order to minimize counterparty credit risk, the Company has entered into and expects to enter in the future into hedging arrangements and intends to only transact with major financial institutions that have high credit ratings.
The Company utilizes an independent third party to perform the market valuations on its derivative financial instruments. The valuation of these instruments is determined using widely accepted valuation techniques, including discounted cash flow analysis on the expected cash flows of each derivative. This analysis reflects the contractual terms of the derivatives, including the period to maturity, and uses observable market-based inputs, including interest rate curves and implied volatilities. The fair values of interest rate swaps are determined using the market standard methodology of netting the discounted future fixed cash receipts (or payments) and the discounted expected variable cash payments (or receipts). The variable cash payments (or receipts) are based on an expectation of future interest rates (forward curves) derived from observable market interest rate curves. The fair value of the interest rate cap is determined using the market standard methodology of discounting the future expected cash receipts that would occur if variable interest rates rise above the strike rate of the cap. The variable interest rates used in the calculation of projected receipts on the cap are based on an expectation of future interest rates derived from observable market interest rate curves and volatilities. To comply with the provisions of ASC 820, the Company incorporates credit valuation adjustments to appropriately reflect both the Company’s own nonperformance risk and the respective counterparty’s nonperformance risk in the fair value measurements. In adjusting the fair value of the Company’s derivative contracts for the effect of nonperformance risk, the Company has considered the impact of netting and any applicable credit enhancements, such as collateral postings, thresholds, mutual puts and guarantees. Although the Company has determined that the majority of the inputs used to value its derivatives fall within Level 2 of the fair value hierarchy, the credit valuation adjustments associated with the Company’s derivatives utilize Level 3 inputs, such as estimates of current credit spreads, to evaluate the likelihood of default by the Company and its counterparties. The Company has determined that the significance of the impact of the credit valuation adjustments made to its derivative contracts, which determination was based on the fair value of each individual contract, was not significant to the overall valuation. As a result, all of the Company’s derivatives held as of December 31, 2020 and December 31, 2019 were classified as Level 2 of the fair value hierarchy.
F-19
VINEBROOK HOMES TRUST, INC. AND SUBSIDIARIES
NOTES TO CONSOLIDATED FINANCIAL STATEMENTS
The changes in the fair value of derivative financial instruments that are designated as cash flow hedges are recorded in other comprehensive income (loss) and are subsequently reclassified into net income (loss) in the period that the hedged forecasted transaction affects earnings. Amounts reported in other comprehensive income (loss) related to derivatives will be reclassified to interest expense as interest payments are made on the Company’s floating rate debt. Derivatives not designated as hedges are not speculative and are used to manage the Company’s exposure to interest rate movements but either do not meet the strict requirements to apply hedge accounting in accordance with FASB ASC 815, Derivatives and Hedging, or the Company has elected not to designate such derivatives as hedges. Changes in the fair value of derivatives not designated in hedging relationships are recorded directly in net income (loss) as interest expense.
In order to fix a portion of, and mitigate the risk associated with, the Company’s floating rate indebtedness, the Company, through the OP, has entered into five interest rate swap transactions with KeyBank with a combined notional amount of $320.0 million. The interest rate swaps the Company has entered into effectively replace the floating interest rate (one-month LIBOR) with respect to that amount with a weighted average fixed rate of 1.4309%. The Company has designated these interest rate swaps as cash flow hedges of interest rate risk.
As of December 31, 2020, the Company had the following outstanding interest rate swaps that were designated as cash flow hedges of interest rate risk (dollars in thousands):
| Effective Date | Expiration Date | Index (1) | Notional | Fixed Rate | ||||||||||
| 7/1/2019 | 7/1/2024 | One-Month LIBOR | $ | 100,000 | 1.6290 | % | ||||||||
| 9/1/2019 | 12/21/2025 | One-Month LIBOR | 100,000 | 1.4180 | % | |||||||||
| 9/1/2019 | 12/21/2025 | One-Month LIBOR | 50,000 | 1.4190 | % | |||||||||
| 2/3/2020 | 2/1/2025 | One-Month LIBOR | 50,000 | 1.2790 | % | |||||||||
| 3/2/2020 | 3/3/2025 | One-Month LIBOR | 20,000 | 0.9140 | % | |||||||||
|
|
|
| |||||||||||
| $ | 320,000 | 1.4309 | %(2) | |||||||||||
|
|
|
| |||||||||||
| (1) | As of December 31, 2020, one-month LIBOR was 0.1439%. |
| (2) | Represents the weighted average fixed rate of the interest rate swaps. |
For the years ended December 31, 2020 and 2019, on the consolidated statements of operations and comprehensive loss, the Company recognized approximately $17.1 million of unrealized loss and $1.6 million of unrealized gain, respectively, related to the change in fair value of the interest rate swaps.
Interest rate caps involve the receipt of variable-rate amounts from a counterparty if interest rates rise above the strike rate on the contract in exchange for an up-front premium. The Company, through the OP, has entered into an interest rate cap transaction with SMBC Capital Markets, Inc. (the “Counterparty”) with a notional amount of $241.4 million. The interest rate cap effectively caps the total rate paid by the Company on $241.4 million of mortgage debt at 6.60%. The interest rate cap expires on November 1, 2021.
As of December 31, 2020 and 2019, the Company had the following outstanding derivatives that were not designated as hedges in qualifying hedging relationships (dollars in thousands):
| Index as of December 31, | ||||||||||||||||||||
Derivative | Notional | Hedged Floating Rate Debt | Index | 2020 | 2019 | Strike Rate | ||||||||||||||
Interest Rate Cap | $ | 241,400 | Mortgage payable | One-Month LIBOR | 0.1439 | % | 1.7625 | % | 6.60 | % | ||||||||||
For the years ended December 31, 2020 and 2019, on the consolidated statements of operations and comprehensive loss, the Company recognized less than $0.1 million, of interest expense related to the interest rate cap.
F-20
VINEBROOK HOMES TRUST, INC. AND SUBSIDIARIES
NOTES TO CONSOLIDATED FINANCIAL STATEMENTS
The table below presents the fair value of the Company’s derivative financial instruments as well as their classification on the consolidated balance sheets as of December 31, 2020 and December 31, 2019 (in thousands):
| Asset Derivatives | Liability Derivatives | |||||||||||||||||
Balance Sheet Location | December 31, 2020 | December 31, 2019 | December 31, 2020 | December 31, 2019 | ||||||||||||||
Derivatives designated as hedging instruments: | ||||||||||||||||||
Interest rate swaps (1) | Fair market value of interest rate swaps | $ | — | $ | 1,832 | $ | 15,453 | $ | 205 | |||||||||
|
|
|
|
|
|
|
| |||||||||||
Total | $ | — | $ | 1,832 | $ | 15,453 | $ | 205 | ||||||||||
|
|
|
|
|
|
|
| |||||||||||
| (1) | The fair market value of interest rate swaps is presented net on the consolidated balance sheets. |
Financial assets and liabilities for which the carrying values approximate their fair values include cash, restricted cash, accounts receivable, accounts payable, and security deposits. Generally, these assets and liabilities are short-term in duration and are recorded at fair value on the consolidated balance sheets. The Company believes the carrying value of each outstanding loan approximates fair value based on the nature, term and interest rate of each loan.
7. Stockholders’ Equity
The following table details all Share issuances under the Continuous Offering and the Company’s dividend reinvestment program (the “DRIP”) from the Commencement of Operations through December 31, 2020 summarized by period end (dollars in thousands):
Period/Year End | Shares issued | Cash Proceeds | DRIP reinvestment | |||||||||
December 31, 2018 | 1,906,770 | $ | 47,513 | $ | 153 | |||||||
December 31, 2019 | 3,255,762 | 91,497 | 2,702 | |||||||||
December 31, 2020 | 4,142,704 | 124,958 | 7,219 | |||||||||
|
|
|
|
|
| |||||||
| 9,305,236 | $ | 263,968 | $ | 10,074 | ||||||||
|
|
|
|
|
| |||||||
The following table provides detail on cash dividends declared on Shares as well as reinvested dividends as part of the Company’s DRIP for the year ended December 31, 2020 (dollars in thousands):
Quarter Ended | DRIP Shares Issued | DRIP Dividend | Cash Dividend | Cash Dividend Accrued on RSUs(1) | Total Dividend | |||||||||||||||
March 31, 2020 | 46,813 | $ | 1,388 | $ | 1,758 | $ | 39 | $ | 3,185 | |||||||||||
June 30, 2020 | 54,294 | 1,637 | 1,890 | 102 | 3,629 | |||||||||||||||
September 30, 2020 | 58,911 | 1,880 | 2,065 | 134 | 4,079 | |||||||||||||||
December 31, 2020 | 69,364 | 2,314 | 2,288 | 125 | 4,727 | |||||||||||||||
|
|
|
|
|
|
|
|
|
| |||||||||||
Total | 229,382 | $ | 7,219 | $ | 8,001 | $ | 400 | $ | 15,620 | |||||||||||
|
|
|
|
|
|
|
|
|
| |||||||||||
| (1) | Included in accounts payable and other accrued liabilities on the consolidated balance sheets. |
During the year ended December 31, 2019, the Company declared dividends of approximately $6.8 million which was comprised of approximately $4.1 million paid in cash and approximately $2.7 million which was reinvested in 95,589 Shares under the DRIP.
Long-Term Incentive Plan
The Company adopted the 2018 LTIP whereby the Board, or a committee thereof, may grant awards based on RSUs or PI Units to certain employees of the Adviser and the Manager, or others at the discretion of the Board (including the directors and officers of the Company or other service providers of the Company or the OP). The 2018 LTIP provides for the Share Reserve and the Share Maximum for issuance of RSUs or PI Units. Grants may be made annually by the Board or more or less frequently in the Board’s sole discretion. Vesting of grants made under the 2018 LTIP will occur ratably over a period of time as determined by the Board and may include the achievement of performance metrics also as determined by the Board in its sole discretion.
F-21
VINEBROOK HOMES TRUST, INC. AND SUBSIDIARIES
NOTES TO CONSOLIDATED FINANCIAL STATEMENTS
RSU Grants Under the 2018 LTIP
On December 10, 2019, a total of 73,700 RSUs were granted to certain employees of the Adviser and officers of the Company. On May 11, 2020, a total of 179,858 RSUs were granted to certain employees of the Adviser, officers of the Company and independent board members. RSUs granted to certain employees of the Adviser and officers of the Company generally vest over a four-year period with the May 11, 2020 grants vesting 50% ratably over four years and 50% at the successful completion of an initial public offering. The RSUs granted to independent board members fully vest on the first anniversary of the grant date. Any unvested RSU is forfeited, except in limited circumstances, as determined by the compensation committee of the Board, when the recipient is no longer employed by the Adviser. RSUs are valued at fair value (which is the NAV per share) on the date of grant, with compensation expense recorded in accordance with the applicable vesting schedule that approximates a straight-line basis. Beginning on the date of grant, RSUs accrue dividends that are payable in cash on the vesting date. Once vested, the RSUs convert on a one-for-one basis into Shares.
As of December 31, 2020 and 2019, the number of RSUs granted that are outstanding was as follows (dollars in thousands):
Dates | Number of RSUs | Value(1) | ||||||
Outstanding December 31, 2018 | — | $ | — | |||||
Granted | 73,700 | 2,200 | ||||||
Vested | — | — | ||||||
Forfeited | — | — | ||||||
|
|
|
| |||||
Outstanding December 31, 2019 | 73,700 | $ | 2,200 | |||||
Granted | 179,858 | 5,543 | ||||||
Vested | (18,425 | ) | (550 | ) | ||||
Forfeited | — | — | ||||||
|
|
|
| |||||
Outstanding December 31, 2020 | 235,133 | $ | 7,193 | |||||
|
|
|
| |||||
| (1) | Value is based on the number of RSUs granted multiplied by the most recent NAV per share on the date of grant, which was $29.85 for the December 10, 2019 grant and $30.82 for the May 11, 2020 grant. |
The vesting schedule for the RSUs is as follows:
Vest Date | RSUs Vesting | |||
May 11, 2021 | 30,510 | |||
December 10, 2021 | 18,425 | |||
May 11, 2022 | 21,336 | |||
December 10, 2022 | 18,425 | |||
May 11, 2023 | 21,335 | |||
December 10, 2023 | 18,425 | |||
May 11, 2024 | 21,335 | |||
Upon successful completion of IPO | 85,342 | |||
|
| |||
| 235,133 | ||||
|
| |||
For the years ended December 31, 2020 and 2019, the Company recognized approximately $1.1 million and less than $0.1 million, respectively, of non-cash compensation expense related to the RSUs, which is included in corporate general and administrative expenses on the consolidated statements of operations and comprehensive loss.
F-22
VINEBROOK HOMES TRUST, INC. AND SUBSIDIARIES
NOTES TO CONSOLIDATED FINANCIAL STATEMENTS
Determination of Net Asset Value
Periodically, the pricing committee of the Board, with the assistance of the Adviser, determines the NAV using the Valuation Methodology. On and before March 31, 2020, NAV was determined at the end of each quarter. Beginning April 30, 2020, the NAV has been determined at the end of each month to account for changes related to the COVID-19 pandemic. Shares and OP Units sold on or after each date below pursuant to the Continuous Offering were generally sold at that NAV until the next NAV calculation. Shares and OP Units issued under the DRIP reflect a 3% discount to the then current NAV set by the pricing committee of the Board. The table below illustrates the changes in NAV since inception:
Date | NAV per share | DRIP price per share | ||||||
November 1, 2018 | $ | 25.00 | $ | 24.25 | ||||
December 31, 2018 | 28.27 | 27.42 | ||||||
March 31, 2019 | 28.75 | 27.89 | ||||||
June 30, 2019 | 28.88 | 28.01 | ||||||
September 30, 2019 | 29.85 | 28.95 | ||||||
December 31, 2019 | 30.58 | 29.66 | ||||||
March 31, 2020 | 30.59 | 29.67 | ||||||
April 30, 2020 | 30.82 | 29.90 | ||||||
May 31, 2020 | 31.08 | 30.15 | ||||||
June 30, 2020 | 31.24 | 30.30 | ||||||
July 31, 2020 | 31.47 | 30.53 | ||||||
August 31, 2020 | 32.91 | 31.92 | ||||||
September 30, 2020 | 34.00 | 32.98 | ||||||
October 31, 2020 | 34.18 | 33.15 | ||||||
November 30, 2020 | 34.38 | 33.35 | ||||||
December 31, 2020 | 36.56 | 35.46 | ||||||
Fees paid to placement agents
Subject to certain exceptions, investors that purchase Shares through the Continuous Offering will pay entities which have an agreement with the Company (the “Placement Agents”) to sell its shares in the Continuous Offering (“Selling Agreements”) a placement fee in addition to the NAV sales price and equal to 1% to 5.5% of gross investor equity, subject to certain breakpoints and various terms of each specific Selling Agreement. With the consent of the Placement Agents, some or all of the placement fee may be waived. Under the Selling Agreement with Raymond James, an advisory fee equal to 2% of gross proceeds invested, which is also in addition to the NAV sales price, is paid to Raymond James for all Shares sold by the Company in the Continuous Offering. Other Selling Agreements may have specific fees that differ from the Raymond James fees related to selling Shares to their clients. Placement Agent compensation is subject to a reasonable carve-out for sales of Shares directly by the Company or for sales to employees of our Adviser, Manager and affiliates thereof.
8. Redeemable Noncontrolling Interests in the OP
Other than PI Units and OP Preferred Units (defined below), partnership interests in the OP are represented by OP Units. Net income (loss) is allocated pro rata to holders of OP Units and PI Units based upon net income (loss) attributable to the OP and the respective members’ OP Units and PI Units held during the period. Capital contributions, distributions, and profits and losses are allocated to PI Units and OP Units not held by the Company (the “noncontrolling interests”).
F-23
VINEBROOK HOMES TRUST, INC. AND SUBSIDIARIES
NOTES TO CONSOLIDATED FINANCIAL STATEMENTS
The following table presents the redeemable noncontrolling interests in the OP (in thousands):
| Balances | ||||
Redeemable noncontrolling interests in the OP, December 31, 2018 | $ | 79,481 | ||
Net loss attributable to redeemable noncontrolling interests in the OP | (967 | ) | ||
Contributions by redeemable noncontrolling interests in the OP | 6,371 | |||
Distributions to redeemable noncontrolling interests in the OP | (6,364 | ) | ||
Redemptions by redeemable noncontrolling interests in the OP | (12,000 | ) | ||
Equity-based compensation | 287 | |||
Other comprehensive income | 562 | |||
Adjustment to reflect redemption value of redeemable noncontrolling interests in the OP | 26,563 | |||
|
| |||
Redeemable noncontrolling interests in the OP, December 31, 2019 | $ | 93,933 | ||
Net loss attributable to redeemable noncontrolling interests in the OP | (570 | ) | ||
Contributions by redeemable noncontrolling interests in the OP | 13,872 | |||
Distributions to redeemable noncontrolling interests in the OP | (7,533 | ) | ||
Redemptions by redeemable noncontrolling interests in the OP | (2,700 | ) | ||
Equity-based compensation | 1,491 | |||
Other comprehensive income attributable to redeemable noncontrolling interests in the OP | (5,865 | ) | ||
Adjustment to reflect redemption value of redeemable noncontrolling interests in the OP | 34,462 | |||
|
| |||
Redeemable noncontrolling interests in the OP, December 31, 2020 | $ | 127,090 | ||
|
| |||
The following table provides detail on distributions to noncontrolling interests in the OP for the year ended December 31, 2020 (dollars in thousands):
Quarter Ended | DRIP OP Units Issued | OP DRIP Distribution | OP Cash Distribution | OP Cash Distribution Accrued on PI Units(1) | Total OP Distribution | |||||||||||||||
March 31, 2020 | 7,966 | $ | 236 | $ | 1,392 | $ | 64 | $ | 1,692 | |||||||||||
June 30, 2020 | 52,557 | 1,585 | 48 | 142 | 1,775 | |||||||||||||||
September 30, 2020 | 53,624 | 1,712 | 48 | 180 | 1,940 | |||||||||||||||
December 31, 2020 | 10,192 | 339 | 1,526 | 261 | 2,126 | |||||||||||||||
|
|
|
|
|
|
|
|
|
| |||||||||||
Total | 124,339 | $ | 3,872 | $ | 3,014 | $ | 647 | $ | 7,533 | |||||||||||
|
|
|
|
|
|
|
|
|
| |||||||||||
| (1) | Included in accounts payable and other accrued liabilities on the consolidated balance sheets. |
The following table provides detail on distributions to noncontrolling interests in the OP for the year ended December 31, 2019 (dollars in thousands):
Quarter Ended | DRIP OP Units Issued | DRIP Distribution | OP Cash Distribution | OP Cash Distribution Accrued on PI Units(1) | Total OP Distribution | |||||||||||||||
March 31, 2019 | 52,779 | $ | 1,463 | $ | 32 | $ | 15 | $ | 1,510 | |||||||||||
June 30, 2019 | 53,905 | 1,524 | 47 | 21 | 1,592 | |||||||||||||||
September 30, 2019 | 6,927 | 194 | 1,391 | 21 | 1,606 | |||||||||||||||
December 31, 2019 | 7,443 | 215 | 1,391 | 50 | 1,656 | |||||||||||||||
|
|
|
|
|
|
|
|
|
| |||||||||||
Total | 121,054 | $ | 3,396 | $ | 2,861 | $ | 107 | $ | 6,364 | |||||||||||
|
|
|
|
|
|
|
|
|
| |||||||||||
As of December 31, 2020, the Company held 8,045,094 OP Units, NREO held 1,953,967 OP Units, NRESF held 75,586 OP Units, NREC held 737,362 OP Units, GAF REIT held 129,840 OP Units and the VineBrook Contributors and other Company insiders held 579,461 OP Units or vested PI Units. As of December 31, 2019, the Company held 5,162,532 OP Units, NREO held 2,535,533 OP Units, NRESF held 70,661 OP Units, and the VineBrook Contributors and other Company insiders held 465,510 OP Units.
F-24
VINEBROOK HOMES TRUST, INC. AND SUBSIDIARIES
NOTES TO CONSOLIDATED FINANCIAL STATEMENTS
PI Unit Grants Under the 2018 LTIP
In connection with the 2018 LTIP, PI Units have been issued to key personnel, senior management and executives of the Manager. On April 19, 2019, a total of 40,000 PI Units were granted, on November 21, 2019, a total of 80,399 PI Units were granted and on May 11, 2020, a total of 219,826 PI Units were granted. The PI Units are a special class of partnership interests in the OP with certain restrictions, which are convertible into OP Units, subject to satisfying vesting and other conditions. PI Unit holders are entitled to receive the same distributions as holders of our OP Units (only if we pay such distributions). The PI Units granted in 2019 generally fully vest over a period of two to four years. The PI Units granted on May 11, 2020 vest 50% ratably over four years and 50% at the successful completion of an initial public offering and the PI Units granted on November 30, 2020 vest 100% ratably over four years or alternatively 100% on the successful completion of an initial public offering. Once vested and converted into OP Units in accordance with the limited partnership agreement of the OP, the PI Units will then be fully recognized as OP Units, which are subject to a one year lock up period before they can be converted to Shares. Any unvested PI Unit is forfeited, except in limited circumstances, as determined by the compensation committee of the Board, when the recipient is no longer employed by the Manager. PI Units are valued at fair value on the date of grant, with compensation expense recorded in accordance with the applicable vesting schedule over the periods in which the restrictions lapse, that approximates a straight-line basis. We valued the PI Units at a per-unit value equivalent to the per-share offering price of our OP Units less a discount for lack of marketability and other discounts estimated by a third-party consultant. Beginning on the date of grant, PI Units accrue dividends that are payable in cash quarterly.
As of December 31, 2020, the number of PI Units granted that are outstanding was as follows (dollars in thousands):
| Number of PI Units | Value(1) | |||||||
Outstanding December 31, 2018 | — | $ | — | |||||
Granted | 120,399 | 3,456 | ||||||
Vested | — | — | ||||||
Forfeited | — | — | ||||||
|
|
|
| |||||
Outstanding December 31, 2019 | 120,399 | $ | 3,456 | |||||
Granted | 231,590 | 7,023 | ||||||
Vested | (41,524 | ) | (1,189 | ) | ||||
Forfeited | — | — | ||||||
|
|
|
| |||||
Outstanding December 31, 2020 | 310,465 | $ | 9,290 | |||||
|
|
|
| |||||
| (1) | Value is based on the number of PI Units granted multiplied by the estimated per unit fair value on the date of grant, which was $27.88 for the April 19, 2019 grant, $29.12 for the November 21, 2019 grant and $30.16 for the May 11, 2020 grant. |
The vesting schedule for the PI Units is as follows:
Vest Date | PI Units Vesting | |||
May 11, 2021 | 27,478 | |||
November 1, 2021 | 9,200 | |||
November 21, 2021 | 18,425 | |||
November 30, 2021 | 2,941 | |||
May 11, 2022 | 27,479 | |||
November 1, 2022 | 7,200 | |||
November 21, 2022 | 18,425 | |||
November 30, 2022 | 2,941 | |||
May 11, 2023 | 27,478 | |||
November 1, 2023 | 7,200 | |||
November 21, 2023 | 18,425 | |||
November 30, 2023 | 2,941 | |||
May 11, 2024 | 27,478 | |||
November 30, 2024 | 2,941 | |||
Upon successful completion of IPO* | 109,913 | |||
|
| |||
| 310,465 | ||||
|
| |||
*Upon successful completion of an IPO, an additional 11,764 PI Units will vest immediately instead of vesting ratably according to the schedule above on each of November 30, 2021, November 30, 2022, November 30, 2023 and November 30, 2024.
F-25
VINEBROOK HOMES TRUST, INC. AND SUBSIDIARIES
NOTES TO CONSOLIDATED FINANCIAL STATEMENTS
For the years ended December 31, 2020 and 2019, the OP recognized approximately $1.5 million and $0.3 million, respectively, of non-cash compensation expense related to the PI Units, which is included in corporate general and administrative expenses on the Company’s consolidated statements of operations and comprehensive loss.
9. Redeemable Series A Preferred Stock
On October 7, 2020, the Company issued 2,440,000 shares of its 6.50% Series A Cumulative Redeemable Preferred Stock (the “Preferred Shares”) at a price of $25.00 per share, for gross proceeds of $61.0 million before deducting issuance costs of approximately $2.3 million. These proceeds were in turn used to purchase 2,440,000 6.50% Series A Cumulative Redeemable Preferred Units of the OP (“OP Preferred Units”). The OP used $50.0 million of those net proceeds to partially pay down the Warehouse Facility. On December 30, 2020, the Company issued 1,100,000 Preferred Shares at a price of $24.995 per share, for gross proceeds of approximately $27.5 million before deducting issuance costs of approximately $1.2 million. On October 26, 2020, the Company declared a dividend of $0.3792 per share to the holders of record of Preferred Shares as of December 25, 2020. The preferred dividend was paid on January 11, 2021. The following table presents the redeemable Series A preferred stock (dollars in thousands):
| Preferred Shares | Balances | |||||||
Redeemable Series A preferred stock, December 31, 2019 | — | $ | — | |||||
Issuance of Redeemable Series A preferred stock | 3,540,000 | 88,495 | ||||||
Issuance costs related to Redeemable Series A preferred stock | — | (3,555 | ) | |||||
Net income attributable to Redeemable Series A preferred stockholders | — | 925 | ||||||
Dividends declared to Redeemable Series A preferred stockholders | — | (925 | ) | |||||
Accretion to redemption value | — | 127 | ||||||
|
|
|
| |||||
Redeemable Series A preferred stock, December 31, 2020 | 3,540,000 | $ | 85,067 | |||||
|
|
|
| |||||
10. Income Taxes
The Company has made the election and intends to be taxed as a REIT under Sections 856 through 860 of the Internal Revenue Code of 1986, as amended (the “Code”), and expects to continue to qualify as a REIT. To qualify as a REIT, the Company must meet a number of organizational and operational requirements, including a requirement to distribute annually at least 90% of its “REIT taxable income,” as defined by the Code, to its stockholders. As a REIT, the Company will be subject to federal income tax on its undistributed REIT taxable income and net capital gain and to a 4% nondeductible excise tax on any amount by which distributions it pays with respect to any calendar year are less than the sum of (1) 85% of its ordinary income, (2) 95% of its capital gain net income and (3) 100% of its undistributed income from prior years. The Company intends to operate in such a manner so as to qualify as a REIT, but no assurance can be given that the Company will operate in a manner so as to qualify as a REIT.
If the Company fails to meet these requirements, it could be subject to federal income tax on all of the Company’s taxable income at regular corporate rates for that year. The Company would not be able to deduct distributions paid to stockholders in any year in which it fails to qualify as a REIT. Additionally, the Company will also be disqualified from electing to be taxed as a REIT for the four taxable years following the year during which qualification was lost unless the Company is entitled to relief under specific statutory provisions. As of December 31, 2020, the Company believes it is in compliance with all applicable REIT requirements. The Company is still subject to state and local income taxes and to federal income and excise tax on its undistributed income, however those taxes are not material to the financial statements.
The Company evaluates the accounting and disclosure of tax positions taken or expected to be taken in the course of preparing the Company’s tax returns to determine whether the tax positions are “more-likely-than-not” (greater than 50 percent probability) of being sustained by the applicable tax authority. Tax positions not deemed to meet the more-likely-than-not threshold would be recorded as a tax benefit or expense in the current year. The Company’s management is required to analyze all open tax years, as defined by the statute of limitations, for all major jurisdictions, which include federal and certain states. The Company has no examinations in progress and none are expected at this time. The tax years subject to examination are 2019 and 2018.
The Company had no material unrecognized federal or state tax benefit or expense, accrued interest or penalties as of December 31, 2020. When applicable, the Company recognizes interest and/or penalties related to uncertain tax positions on its consolidated statements of operations and comprehensive loss.
F-26
VINEBROOK HOMES TRUST, INC. AND SUBSIDIARIES
NOTES TO CONSOLIDATED FINANCIAL STATEMENTS
11. Related Party Transactions
Advisory Fee
Pursuant to the Advisory Agreement, the Company will pay the Adviser, on a monthly basis in arrears, an advisory fee at an annualized rate of 0.75% of the gross asset value of the Company on a consolidated basis (excluding the value of the OP’s assets but inclusive of the Company’s pro rata share of the debt held at the OP and its SPEs). The Adviser will manage the Company’s business including, among other duties, advising the Board to issue distributions, preparing our quarterly and annual consolidated financial statements prepared under GAAP, development and maintenance of internal accounting controls, management and conduct of maintaining our REIT status, calculation of our NAV and recommending the appropriate NAV to be set by the Board, processing of sales of Shares through the Continuous Offering, reporting to holders of Shares, our tax filings, and other responsibilities customary for an external advisor to a business similar to ours. With certain specified exceptions, the advisory fee together with reimbursement of operating and offering expenses may not exceed 1.5% of average total assets of the Company and the OP, as determined in accordance with GAAP on a consolidated basis, at the end of each month (or partial month) (i) for which any advisory fee is calculated or (ii) during the year for which any expense reimbursement is calculated (the “Expense Cap”).
For the years ended December 31, 2020 and 2019, the Company incurred advisory fees of approximately $3.3 million and $1.7 million, respectively, which is included in advisory fees on the consolidated statements of operations and comprehensive loss.
Management Fee
The equity holders of the Manager are holders of noncontrolling interests in the OP and comprise a portion of the VineBrook Contributors. Through this noncontrolling ownership, the Manager is deemed to be a related party. Pursuant to the Management Agreements, the OP will pay the Manager (i) an acquisition fee equal to 1.0% of the purchase price paid for any new property acquired during the month, (ii) a construction fee monthly in arrears that shall not exceed the greater of 10% of construction costs or $1,000, whichever is higher, in connection with the repair, renovation, improvement or development of any newly acquired property, and (iii) a property management fee monthly in arrears equal to a percentage of collected rental revenues for all properties during the month as follows:
| • | 8.0% of collected rental revenue up to and including $45 million on an annualized basis; |
| • | 7.0% of the incremental collected rental revenue above $45 million but below and including $65 million on an annualized basis; |
| • | 6.0% of the incremental collected rental revenue above $65 million but below and including $85 million on an annualized basis; and |
| • | 5.0% of the incremental collected rental revenue above $85 million on an annualized basis. |
Under the Management Agreements and the Side Letter, the aggregate fees that the Manager can earn in any fiscal year are capped such that the Manager’s EBITDA (as defined in the Management Agreements) derived from these fees may not exceed the greater of $1.0 million or 0.5% of the combined equity value of the Company and the OP on a consolidated basis, calculated on the first day of each fiscal year based on the aggregate NAV of the outstanding Shares and OP Units held by other than the Company on the last business day of the prior fiscal year (the “Manager Cap”). The aggregate fees up to the Manager Cap are payable (1) in cash in an amount equal to the tax obligations of the Manager’s equity holders resulting from the aggregate management fees earned in such fiscal year up to a maximum rate of 25% (the “Manager Cash Cap”) and (2) with respect to the remaining portion of the aggregate fees, in OP Units, at a price per OP Unit equal to the Cash Amount (as defined in the OP’s limited partnership agreement). The aggregate fees paid in cash that exceed the Manager Cash Cap are rebated back to the OP. As of December 31, 2020, the OP recorded a receivable of approximately $1.1 million on the consolidated balance sheet related to the Manager Cash Cap rebate. As of December 31, 2019, the OP recorded a receivable of approximately $0.8 million due from the Manager related to the Manager Cash Cap rebate.
The Manager will be responsible for the day-to-day management of the properties, acquisition of new properties, disposition of existing properties (with acquisition and disposition decisions made under the approval of the investment committee and the Board), leasing the properties, managing tenant issues and requests, collecting rents, paying operating expenses, managing maintenance issues, accounting for each property using GAAP, and other responsibilities customary for the management of single family rental properties.
Property management fees are included in property management fees on the consolidated statements of operations and comprehensive loss and acquisition and construction fees are capitalized into each home and is included in buildings and improvements on the consolidated balance sheet and are depreciated over the useful life of each property.
F-27
VINEBROOK HOMES TRUST, INC. AND SUBSIDIARIES
NOTES TO CONSOLIDATED FINANCIAL STATEMENTS
The following table is a summary of fees that the OP incurred to the Manager and its affiliates, as well as reimbursements paid to the Manager and its affiliates for various operating expenses the Manager paid on the OP’s behalf, under the terms of Management Agreements and Side Letter, for the years ended December 31, 2020 and 2019 (dollars in thousands):
| For the Year Ended December 31, | ||||||||||
Location on Financial Statements | 2020 | 2019 | ||||||||
Fees Incurred | ||||||||||
Property management fees | Statement of Operations | $ | 4,478 | $ | 3,190 | |||||
Acquisition fees | Balance Sheet | 1,771 | 1,718 | |||||||
Construction supervision fees | Balance Sheet | 4,194 | 2,081 | |||||||
Reimbursements | ||||||||||
Payroll and benefits | Balance Sheet and Statement of Operations | 8,501 | 4,179 | |||||||
Other reimbursements | Balance Sheet and Statement of Operations | 414 | 322 | |||||||
|
|
|
| |||||||
Totals | $ | 19,358 | $ | 11,490 | ||||||
|
|
|
| |||||||
Internalization of the Adviser or the Manager
The Company may acquire all of the outstanding equity interests of the Adviser, the Manager or both (an “Internalization”) under certain provisions (a “Purchase Provision”) of the Advisory Agreement or the Side Letter to effect an Internalization upon the payment of a certain fee (an “Internalization Fee”). If the Company determines to acquire the equity interests of the Adviser, the applicable Purchase Provision of the Advisory Agreement provides that the Adviser must first agree to such acquisition and that the Company will pay the Adviser an Internalization Fee equal to three times the total of the prior 12 months’ advisory fee, payable only in capital stock of the Company. If the Company determines to acquire the equity interests of Manager, the applicable Purchase Provision of the Side Letter provides the Company has a right to do so and that the Company will pay the Manager an Internalization Fee equal to $6.5 million plus 50% of the subtraction of $6.5 million from three times the total of the prior 12 months’ property management fee, payable in cash, Shares or OP Units. The OP may also acquire the equity interests of the Manager on the same terms under the applicable Purchase Provision. Certain additional conditions and limitations apply to the Internalizations, including but not limited to caps on the Internalization Fees. The Company expects any equity issued in satisfaction of an Internalization Fee to be valued at the NAV in effect on the date the Internalization is consummated.
Termination Fees Payable to the Adviser or Manager
If the Advisory Agreement or any one of the Management Agreements is terminated without cause by the Company or the SPE, as applicable, or is otherwise terminated under certain conditions, the Adviser or the Manager, as applicable, will be entitled to a termination fee (a “Termination Fee”) in the amount of three times the prior 12 months’ advisory fee, in the case of a termination of the Advisory Agreement, or three times the prior 12 months’ property management fee, in the case of the applicable Management Agreement. In addition to termination by the Company without cause, the Adviser will be entitled to the Termination Fee if the Adviser terminates the Advisory Agreement without cause or terminates the agreement due to the occurrence of certain specified breaches of the Advisory Agreement by the Company. The Advisory Agreement may be terminated without cause by the Company or the Adviser with 180 days’ notice prior to the expiration of the then-current term. In addition to termination by the SPE without cause, the Manager will be entitled to the Termination Fee if the SPE sells or otherwise disposes of all or substantially all of the properties subject to the applicable Management Agreement. The Management Agreements may be terminated by the SPE with 90 days’ notice without cause. Termination Fees are payable in cash.
Advance Acquisition and Construction Fee Advances Paid to the Manager
Pursuant to the Side Letter, the Manager may request from the OP from time-to-time an advance on acquisition and construction fees (the “Fee Advances”) to fund the performance of its obligations under the Management Agreements. Each Fee Advance is repaid from future acquisition and construction fees earned by and owed to the Manager. Fee Advances are included in the line item Due from Manager on the consolidated balance sheets. As of December 31, 2020, the Company recorded no receivable for Fee Advances. As of December 31, 2019, the Company recorded a receivable on the consolidated balance sheet due from the Manager for Fee Advances of approximately $0.2 million.
F-28
VINEBROOK HOMES TRUST, INC. AND SUBSIDIARIES
NOTES TO CONSOLIDATED FINANCIAL STATEMENTS
Backstop Loans to the Manager
Pursuant to the Side Letter, in the event the Manager does not have sufficient cash flow from operations to meet its budgeted obligations under the Management Agreements, the Manager may from time to time request from the Company a temporary loan (the “Backstop Loan”) to satisfy the shortfall. Backstop Loans are interest free, may be prepaid at any time and may not exceed a principal amount that is in the aggregate equal to the lesser of the Internalization Fee or Termination Fee under the applicable Management Agreement. Unless otherwise repaid, each Backstop Loan is payable upon termination of the applicable Management Agreement. Backstop Loans are included in the line item Due from Manager on the consolidated balance sheets. As of December 31, 2020 and 2019, the Company recorded a receivable for Backstop Loans made to the manager of approximately $0.7 million and approximately $0.7 million, respectively.
Dealer Manager Fees
Investors may be charged a dealer manager fee of between 0.50% and 3.00% of gross investor equity by the Dealer Manager for sell of Shares pursuant to the Continuous Offering, subject to certain breakpoints and various terms of the Dealer Manager Agreements. At the sole discretion of the Dealer Manager, the dealer manager fee may be partially or fully waived. The dealer manager fee is paid to an affiliate of the Adviser.
Organization and Continuous Offering Expenses
Offering and organizational expenses (“O&O Expenses”) may be incurred in connection with sales in the Continuous Offering at the discretion of the Company and are borne in full or in part by investors through a fee of between 0.50% and 1.00% of gross investor equity, depending on the provisions of each Dealer Manager Agreement. O&O Expenses are intended to reimburse the Company for the costs of maintaining the Continuous Offering and selling costs incurred in raising equity under the Continuous Offering. Payments for bona fide expenses are submitted by the Adviser, at which time the O&O Expenses are recorded as a reduction to equity as an offering cost.
See below for detail related to the O&O Expenses as of December 31, 2020 (dollars in thousands):
| Amount | ||||
Gross investor equity raised subject to O&O | $ | 276,070 | ||
O&O collected and available for reimbursements | $ | 1,685 | ||
|
| |||
O&O Expenses reimbursed for the period: | ||||
Inception through December 31, 2019 | $ | 686 | ||
January 1, 2020 through March 31, 2020 | 188 | |||
April 1, 2020 through June 30, 2020 | 235 | |||
July 1, 2020 through September 30, 2020 | 175 | |||
October 1, 2020 through December 31, 2020 | 385 | |||
|
| |||
| $ | 1,669 | |||
|
| |||
O&O available for future reimbursements | $ | 16 | ||
|
| |||
NexBank
The Company and the OP maintain bank accounts with an affiliate of the Adviser, NexBank N.A. (“NexBank”). NexBank charges no recurring maintenance fees on the accounts.
NREO Note
On August 22, 2019, the Company, through the OP, entered into an approximately $1.3 million subordinated convertible note (the “NREO Note”) with NREO, who is an affiliate of the Adviser. The NREO Note bears interest at a variable rate equal to one-month LIBOR plus 2.25% and is full interest-only. The NREO Note is convertible at any time to equity at the election of the Company or upon its maturity on September 19, 2022. For the year ended December 31, 2020, the Company recognized less than $0.1 million of interest expense related to the NREO Note. The balance of the NREO Note is included on the consolidated balance sheets in NREO Note Payable. The NREO Note was repaid in full and extinguished during 2021 (see Note 13).
F-29
VINEBROOK HOMES TRUST, INC. AND SUBSIDIARIES
NOTES TO CONSOLIDATED FINANCIAL STATEMENTS
12. Commitments and Contingencies
Commitments
In the normal course of business, the Company enters into various construction related purchase commitments with parties that provide these goods and services. In the event the Company were to terminate construction services prior to the completion of projects, the Company could potentially be committed to satisfy outstanding or uncompleted purchase orders with such parties. As of December 31, 2020, management does not anticipate any material deviations from schedule or budget related to rehabilitation projects currently in process.
Contingencies
In the normal course of business, the Company is subject to claims, lawsuits, and legal proceedings. While it is not possible to ascertain the ultimate outcome of all such matters, management believes that the aggregate amount of such liabilities, if any, in excess of amounts provided or covered by insurance, will not have a material adverse effect on the consolidated balance sheets or consolidated statements of operations and comprehensive loss of the Company. The Company is not involved in any material litigation nor, to management’s knowledge, is any material litigation currently threatened against the Company or its properties or subsidiaries.
The Company is not aware of any environmental liability with respect to the properties it owns that could have a material adverse effect on the Company’s business, assets, or results of operations. However, there can be no assurance that such a material environmental liability does not exist. The existence of any such material environmental liability could have an adverse effect on the Company’s results of operations and cash flows.
An entity purchased by the OP as a part of the Formation Transaction, the Huber Transaction Sub, LLC (“Huber”), had potential liability exposure to a legacy environmental issue related to a 1988 petroleum release from an underground storage tank located on a property subsequently not purchased by Huber. The owner of the property prior to Huber has assumed the defense of alleged environmental violations and is proceeding with the required regulatory investigation and remediation of the underground storage tank release clean up. Huber received an indemnification, and the Company and the OP in turn received an indemnification, which is evidenced by approximately $2.6 million of proceeds in an escrow account (the “Indemnification Escrow”) that is for the benefit of the Company and the OP in the event the prior owner fails to perform their obligations in regard to any required remediation of the issue. As a result of the Indemnification Escrow, the Company does not expect that it, the OP or any of the SPEs will have any financial liability related to the alleged violation.
13. Subsequent Events
The Company evaluated subsequent events through April 2, 2021, to determine if any significant events occurred subsequent to the balance sheet date that would have a material impact on these consolidated financial statements and determined the following events were material:
Redeemable Series A Preferred Stock Offering
On January 8, 2021, the Company issued 1,460,000 Preferred Shares at a price of $25.032 per share, for gross proceeds of approximately $36.5 million before deducting offering costs of approximately $1.1 million. On January 8, 2021, the net proceeds from the Preferred Shares issued on December 30, 2020 and January 8, 2021 were used to purchase 2,560,000 OP Preferred Units. The OP used these proceeds for acquisitions and other capital expenditures.
Acquisitions
On January 22, 2021, the Company, through the OP, purchased 1,725 homes, net of a simultaneous bulk disposition, located throughout the midwestern and southeastern United States (the “January Portfolio”). The gross purchase price including closing costs and other expenses and net of the simultaneous bulk disposition was approximately $224.4 million.
On March 1, 2021, the Company, through the OP, purchased 2,170 homes, net of a simultaneous bulk disposition, located throughout the midwestern and southeastern United States (the “March Portfolio”). The gross purchase price including closing costs and other expenses and net of the simultaneous bulk disposition was approximately $282.5 million.
Subsequent to December 31, 2020, including the portfolio acquisitions mentioned above, the Company acquired 4,409 homes.
F-30
VINEBROOK HOMES TRUST, INC. AND SUBSIDIARIES
NOTES TO CONSOLIDATED FINANCIAL STATEMENTS
MetLife Note
On January 6, 2021, the Company (as guarantor) and VB Two, LLC (as borrower) entered into a $125.0 million note with Metropolitan Life Insurance (the “MetLife Note”). The MetLife Note is secured by equity pledges in VB Two, LLC and its wholly owned subsidiaries and bears interest at a fixed rate of 3.25%. The MetLife Note is interest-only and matures and is due in full on January 31, 2026. The net proceeds received were used to fund a portion of the purchase price of the January Portfolio.
JP Morgan Facility
On March 1, 2021, the Company entered into a non-recourse carveout guaranty and certain wholly owned subsidiaries of VB Three, LLC (as borrowers) entered into a $500.0 million credit agreement with JP Morgan (the “JPM Facility”). The JPM Facility is secured by equity pledges in VB Three, LLC (a new SPE formed by the Company in 2021) and its wholly owned subsidiaries and bears interest at a variable rate equal to one-month LIBOR plus 2.75%. VB Three, LLC is a new special purpose entity formed by the Company. The JPM Facility is interest-only and matures and is due in full on March 1, 2023. To fund the acquisition of the March Portfolio, $320.0 was drawn on the JPM facility on March 1, 2021.
Warehouse Facility
On January 13, 2021, the OP drew $50.0 million under the Warehouse Facility. The proceeds were used to fund a portion of the purchase price of the January Portfolio. On March 8, 2021, the OP paid down $35.0 million under the Warehouse Facility. As of April 2, 2021, the outstanding balance of the Warehouse Facility was $100.0 million.
NREO Note Repayment
On January 26, 2021, the Company, through the OP, paid down the principal of approximately $1.3 million and accrued interest of approximately $0.1 million on the NREO Note. This extinguished the NREO Note.
Indemnification Escrow Release
On January 27, 2021, the Indemnification Escrow was released.
First Quarter 2021 Dividends
On January 15, 2021, the Company declared a dividend of $0.1767 per Share for shareholders of record as of January 15, 2021. On February 15, 2021, the Company declared a dividend of $0.1767 per Share for shareholders of record as of February 16, 2021. On March 15, 2021, the Company declared a dividend of $0.1767 per Share for shareholders of record as of March 15, 2021. The aforementioned dividends were paid on March 31, 2021.
Equity Issuance Pursuant to the Continuous Offering
The table below illustrates equity issuances subsequent to the balance sheet date (dollars in thousands):
Date of Close | Shares issued | Gross proceeds | ||||||
January 4, 2021 | 482,310 | $ | 16,582 | |||||
January 15, 2021 | 32,863 | 1,202 | ||||||
January 22, 2021 | 29,690 | 1,086 | ||||||
January 29, 2021 | 48,440 | 1,770 | ||||||
February 1, 2021 | 380,104 | 13,897 | ||||||
February 12, 2021 | 65,468 | 2,394 | ||||||
February 19, 2021 | 27,257 | 997 | ||||||
February 26, 2021 | 121,088 | 4,427 | ||||||
March 1, 2021 | 482,985 | 17,658 | ||||||
March 12, 2021 | 441,787 | 16,152 | ||||||
March 19, 2021 | 28,040 | 1,025 | ||||||
March 26, 2021 | 32,918 | 1,207 | ||||||
|
|
|
| |||||
| 2,172,950 | $ | 78,397 | ||||||
|
|
|
| |||||
F-31
VINEBROOK HOMES TRUST, INC. AND SUBSIDIARIES
NOTES TO CONSOLIDATED FINANCIAL STATEMENTS
NAV Determination
Pursuant to the terms of the Continuous Offering and calculated in accordance with the Valuation Methodology, on January 15, 2021, the pricing committee of the Board increased the NAV per Share to $36.56 as of December 31, 2020. In accordance with provisions in the OP’s partnership agreement, the value of the OP Units per OP Unit was also increased to $36.56. Shares issued under the respective DRIP plans will be issued a 3% discount to the NAV in effect.
F-32
Schedule III – Real Estate and Accumulated Depreciation as of December 31, 2020
(dollars in thousands)
| Initial Cost to Company | Gross Cost Basis as of December 31, 2020 (1) | Accumulated | ||||||||||||||||||||||||||||||||||||||||||
Market | Number of Homes | Gross Cost Basis Encumbered | Land | Buildings and Improvements | Costs Capitalized Subsequent to Acquisition | Land | Buildings and Improvements | Total | Depreciation and Amortization | Net Cost Basis | Dates of Acquisition | |||||||||||||||||||||||||||||||||
| Operating homes | ||||||||||||||||||||||||||||||||||||||||||||
Dayton | 2,193 | $ | 140,119 | $ | 34,409 | $ | 98,708 | $ | 16,806 | $ | 34,409 | $ | 115,515 | $ | 149,924 | $ | (9,712 | ) | $ | 140,212 | | 2018- 2020 | ||||||||||||||||||||||
Columbus | 1,203 | 96,354 | 28,099 | 65,821 | 16,822 | 28,099 | 82,644 | 110,743 | (6,421 | ) | 104,322 | | 2018- 2020 | |||||||||||||||||||||||||||||||
Cincinnati | 2,312 | 192,516 | 55,525 | 132,217 | 23,575 | 55,525 | 155,793 | 211,318 | (11,953 | ) | 199,365 | | 2018- 2020 | |||||||||||||||||||||||||||||||
Indianapolis | 536 | 29,396 | 8,254 | 31,588 | 6,779 | 8,254 | 38,368 | 46,622 | (1,852 | ) | 44,770 | | 2018- 2020 | |||||||||||||||||||||||||||||||
St. Louis | 1,145 | 71,191 | 16,628 | 60,572 | 12,253 | 16,628 | 72,826 | 89,454 | (1,518 | ) | 87,936 | | 2019- 2020 | |||||||||||||||||||||||||||||||
Memphis | 459 | 8,649 | 5,002 | 20,252 | 9,129 | 5,002 | 29,382 | 34,384 | (1,041 | ) | 33,343 | | 2019- 2020 | |||||||||||||||||||||||||||||||
Kansas City | 353 | 11,440 | 5,168 | 17,744 | 4,034 | 5,168 | 21,779 | 26,947 | (446 | ) | 26,501 | | 2019- 2020 | |||||||||||||||||||||||||||||||
Milwaukee | 273 | 16,625 | 3,535 | 17,973 | 4,310 | 3,535 | 22,283 | 25,818 | (323 | ) | 25,495 | | 2019- 2020 | |||||||||||||||||||||||||||||||
Pittsburgh | 285 | 10,033 | 5,178 | 14,845 | 1,506 | 5,178 | 16,353 | 21,531 | (471 | ) | 21,060 | | 2019- 2020 | |||||||||||||||||||||||||||||||
Little Rock | 111 | 6,302 | 1,499 | 5,410 | 624 | 1,499 | 6,035 | 7,534 | (98 | ) | 7,436 | | 2019- 2020 | |||||||||||||||||||||||||||||||
Jackson | 324 | 16,198 | 7,036 | 14,148 | 1,805 | 7,036 | 15,953 | 22,989 | (349 | ) | 22,640 | | 2019- 2020 | |||||||||||||||||||||||||||||||
Omaha | 80 | 3,091 | 729 | 6,185 | 289 | 729 | 6,474 | 7,203 | (212 | ) | 6,991 | | 2019- 2020 | |||||||||||||||||||||||||||||||
|
|
|
|
|
|
|
|
|
|
|
|
|
|
|
|
|
|
|
| |||||||||||||||||||||||||
Total operating homes | 9,274 | 601,914 | 171,062 | 485,463 | 97,932 | 171,062 | 583,405 | 754,467 | (34,396 | ) | 720,071 | |||||||||||||||||||||||||||||||||
Homes held for sale | 8 | — | 203 | 473 | — | 203 | 473 | 675 | — | 675 | | 2018- 2019 | ||||||||||||||||||||||||||||||||
|
|
|
|
|
|
|
|
|
|
|
|
|
|
|
|
|
|
|
| |||||||||||||||||||||||||
Total homes | 9,282 | $ | 601,914 | $ | 171,265 | $ | 485,936 | $ | 97,932 | $ | 171,265 | $ | 583,878 | $ | 755,142 | $ | (34,396 | ) | $ | 720,746 | ||||||||||||||||||||||||
|
|
|
|
|
|
|
|
|
|
|
|
|
|
|
|
|
|
|
| |||||||||||||||||||||||||
| (1) | The unaudited aggregate cost of consolidated real estate in the table above for federal income tax purposes was approximately $755.1 million as of December 31, 2020. |
F-31
Schedule III – Real Estate and Accumulated Depreciation as of December 31, 2020
(dollars in thousands)
| For the Year Ended December 31, | ||||||||
| 2020 | 2019 | |||||||
Gross operating real estate: | ||||||||
Balance, beginning of year | $ | 521,084 | $ | 335,306 | ||||
Acquisitions and building improvements | 234,825 | 189,495 | ||||||
Write-offs | (1,442 | ) | (3,717 | ) | ||||
|
|
|
| |||||
Balance, end of year | $ | 754,467 | $ | 521,084 | ||||
|
|
|
| |||||
Accumulated depreciation and amortization: | ||||||||
Balance, beginning of year | $ | 15,391 | $ | 3,027 | ||||
Depreciation expense (1) | 19,304 | 12,999 | ||||||
Amortization expense | 1,143 | 3,082 | ||||||
Write-offs | (1,442 | ) | (3,717 | ) | ||||
|
|
|
| |||||
Balance, end of year | $ | 34,396 | $ | 15,391 | ||||
|
|
|
| |||||
| (1) | Depreciation of buildings and improvements is computed on a straight-line basis over estimated useful lives ranging from three to 27.5 years. |
F-34
VINEBROOK HOMES TRUST, INC. AND SUBSIDIARIES
(dollars in thousands)
| March 31, 2021 | December 31, 2020 | |||||||
| (unaudited) | ||||||||
ASSETS | ||||||||
Operating real estate investments | ||||||||
Land | $ | 328,982 | $ | 171,062 | ||||
Buildings and improvements | 996,060 | 582,610 | ||||||
Intangible lease assets | 4,941 | 795 | ||||||
|
|
|
| |||||
Total gross operating real estate investments | 1,329,983 | 754,467 | ||||||
Accumulated depreciation and amortization | (42,134 | ) | (34,396 | ) | ||||
|
|
|
| |||||
Total net operating real estate investments | 1,287,849 | 720,071 | ||||||
Real estate held for sale, net | 712 | 675 | ||||||
|
|
|
| |||||
Total net real estate investments | 1,288,561 | 720,746 | ||||||
Cash | 40,093 | 31,225 | ||||||
Restricted cash | 11,683 | 5,871 | ||||||
Accounts receivable | 2,991 | 3,983 | ||||||
Due from Manager (see Note 11) | 663 | 663 | ||||||
Prepaid and other assets | 3,890 | 17,480 | ||||||
|
|
|
| |||||
TOTAL ASSETS | $ | 1,347,881 | $ | 779,968 | ||||
|
|
|
| |||||
| LIABILITIES AND STOCKHOLDERS’ EQUITY | ||||||||
Liabilities: | ||||||||
Notes payable, net | $ | 386,469 | $ | 262,522 | ||||
Credit facilities, net | 412,760 | 83,937 | ||||||
NREO Note Payable, net (see Note 11) | — | 1,250 | ||||||
Accounts payable and other accrued liabilities | 8,326 | 8,573 | ||||||
Accrued real estate taxes payable | 14,515 | 12,591 | ||||||
Accrued interest payable | 1,803 | 616 | ||||||
Security deposit liability | 12,428 | 7,292 | ||||||
Prepaid rents | 2,062 | 1,255 | ||||||
Fair market value of interest rate swaps | 9,082 | 15,453 | ||||||
|
|
|
| |||||
Total Liabilities | 847,445 | 393,489 | ||||||
Redeemable Series A preferred stock, $0.01 par value: 16,000,000 shares authorized; 5,000,000 and 3,540,000 shares issued and outstanding, respectively | 120,454 | 85,067 | ||||||
Redeemable noncontrolling interests in the OP | 127,982 | 127,090 | ||||||
Stockholders’ Equity: | ||||||||
Common stock, $0.01 par value: 300,000,000 shares authorized; 11,499,045 and 9,260,795 shares issued and outstanding, respectively | 115 | 93 | ||||||
Additional paid-in capital | 291,305 | 210,381 | ||||||
Distributions in excess of retained earnings | (34,060 | ) | (26,002 | ) | ||||
Accumulated other comprehensive income (loss) | (5,360 | ) | (10,150 | ) | ||||
|
|
|
| |||||
Total Stockholders’ Equity | 252,000 | 174,322 | ||||||
|
|
|
| |||||
TOTAL LIABILITIES AND STOCKHOLDERS’ EQUITY | $ | 1,347,881 | $ | 779,968 | ||||
|
|
|
| |||||
See Accompanying Notes to Consolidated Financial Statements
F-35
VINEBROOK HOMES TRUST, INC. AND SUBSIDIARIES
CONSOLIDATED STATEMENTS OF OPERATIONS AND COMPREHENSIVE INCOME (LOSS)
(in thousands, except for per share amounts)
(Unaudited)
| For the Three Months Ended March 31, | ||||||||
| 2021 | 2020 | |||||||
Revenues | ||||||||
Rental income | $ | 30,136 | $ | 16,702 | ||||
Other income | 492 | 401 | ||||||
|
|
|
| |||||
Total revenues | 30,628 | 17,103 | ||||||
|
|
|
| |||||
Expenses | ||||||||
Property operating expenses | 5,153 | 3,447 | ||||||
Real estate taxes and insurance | 6,294 | 3,131 | ||||||
Property management fees | 1,973 | 1,362 | ||||||
Advisory fees | 1,291 | 713 | ||||||
Corporate general and administrative expenses | 1,481 | 498 | ||||||
Property general and administrative expenses | 1,323 | 845 | ||||||
Depreciation and amortization | 8,044 | 4,922 | ||||||
Interest expense | 5,126 | 2,714 | ||||||
|
|
|
| |||||
Total expenses | 30,685 | 17,632 | ||||||
Loss on sales of real estate | (75 | ) | (26 | ) | ||||
|
|
|
| |||||
Operating loss | (132 | ) | (555 | ) | ||||
Casualty loss, net of insurance proceeds | (9 | ) | — | |||||
|
|
|
| |||||
Net loss | (141 | ) | (555 | ) | ||||
Dividends on and accretion to redemption value of Redeemable Series A preferred stock | 2,206 | — | ||||||
Net loss attributable to redeemable noncontrolling interests in the OP | (35 | ) | (190 | ) | ||||
|
|
|
| |||||
Net loss attributable to common stockholders | $ | (2,312 | ) | $ | (365 | ) | ||
|
|
|
| |||||
Other comprehensive income/(loss) | ||||||||
Unrealized gain/(loss) on interest rate swaps | 6,371 | (17,654 | ) | |||||
|
|
|
| |||||
Total comprehensive income/(loss) | 6,230 | (18,209 | ) | |||||
Dividends on and accretion to redemption value of Redeemable Series A preferred stock | 2,206 | — | ||||||
Comprehensive income/(loss) attributable to redeemable noncontrolling interests in the OP | 1,546 | (6,173 | ) | |||||
|
|
|
| |||||
Comprehensive income/(loss) attributable to common stockholders | $ | 2,478 | $ | (12,036 | ) | |||
|
|
|
| |||||
Weighted average common shares outstanding - basic | 10,417 | 5,907 | ||||||
|
|
|
| |||||
Weighted average common shares outstanding - diluted | 10,417 | 5,907 | ||||||
|
|
|
| |||||
Loss per share - basic | $ | (0.22 | ) | $ | (0.06 | ) | ||
|
|
|
| |||||
Loss per share - diluted | $ | (0.22 | ) | $ | (0.06 | ) | ||
|
|
|
| |||||
See Accompanying Notes to Consolidated Financial Statements
F-36
VINEBROOK HOMES TRUST, INC. AND SUBSIDIARIES
CONSOLIDATED STATEMENTS OF EQUITY
(dollars in thousands)
(Unaudited)
| Class A Common Stock | ||||||||||||||||||||||||
| Number of Shares | Par Value | Additional Paid-in Capital | Distributions in Excess of Retained Earnings | Accumulated Other Comprehensive Income (Loss) | Total | |||||||||||||||||||
Balances, December 31, 2020 | 9,260,795 | $ | 93 | $ | 210,381 | $ | (26,002 | ) | $ | (10,150 | ) | $ | 174,322 | |||||||||||
Net loss attributable to common stockholders | — | (2,312 | ) | — | (2,312 | ) | ||||||||||||||||||
Issuance of Class A common stock | 2,241,677 | 22 | 80,829 | — | — | 80,851 | ||||||||||||||||||
Redemptions of Class A common stock | (3,427 | ) | — | (126 | ) | — | — | (126 | ) | |||||||||||||||
Offering costs | (296 | ) | — | — | (296 | ) | ||||||||||||||||||
Equity-based compensation | — | — | 514 | — | — | 514 | ||||||||||||||||||
Common stock dividends declared ($0.5301 per share) | — | (5,746 | ) | — | (5,746 | ) | ||||||||||||||||||
Other comprehensive income attributable to common stockholders | — | — | 4,790 | 4,790 | ||||||||||||||||||||
Adjustment to reflect redemption value of redeemable noncontrolling interests in the OP | 3 | — | — | 3 | ||||||||||||||||||||
|
|
|
|
|
|
|
|
|
|
|
| |||||||||||||
Balances, March 31, 2021 | 11,499,045 | $ | 115 | $ | 291,305 | $ | (34,060 | ) | $ | (5,360 | ) | $ | 252,000 | |||||||||||
|
|
|
|
|
|
|
|
|
|
|
| |||||||||||||
| Class A Common Stock | ||||||||||||||||||||||||
| Number of Shares | Par Value | Additional Paid-in Capital | Distributions in Excess of Retained Earnings | Accumulated Other Comprehensive Income | Total | |||||||||||||||||||
Balances, December 31, 2019 | 5,162,532 | $ | 52 | $ | 114,589 | $ | (8,235 | ) | $ | 1,065 | $ | 107,471 | ||||||||||||
Net loss attributable to common stockholders | — | (365 | ) | — | (365 | ) | ||||||||||||||||||
Issuance of Class A common stock | 1,457,940 | 14 | 44,560 | — | — | 44,574 | ||||||||||||||||||
Offering costs | (188 | ) | — | — | (188 | ) | ||||||||||||||||||
Equity-based compensation | 135 | — | — | 135 | ||||||||||||||||||||
Common stock dividends declared | — | (3,185 | ) | — | (3,185 | ) | ||||||||||||||||||
Other comprehensive income attributable to common stockholders | — | — | (11,671 | ) | (11,671 | ) | ||||||||||||||||||
Adjustment to reflect redemption value of redeemable noncontrolling interests in the OP | (7,656 | ) | — | — | (7,656 | ) | ||||||||||||||||||
|
|
|
|
|
|
|
|
|
|
|
| |||||||||||||
Balances, March 31, 2020 | 6,620,472 | $ | 66 | $ | 151,440 | $ | (11,785 | ) | $ | (10,606 | ) | $ | 129,115 | |||||||||||
|
|
|
|
|
|
|
|
|
|
|
| |||||||||||||
See Accompanying Notes to Consolidated Financial Statements
F-37
VINEBROOK HOMES TRUST, INC. AND SUBSIDIARIES
CONSOLIDATED STATEMENTS OF CASH FLOWS
(dollars in thousands)
(Unaudited)
| For the Three Months Ended March 31, | ||||||||
| 2021 | 2020 | |||||||
Cash flows from operating activities | ||||||||
Net loss | $ | (141 | ) | $ | (555 | ) | ||
Adjustments to reconcile net loss to net cash provided by operating activities: | ||||||||
Loss on sales of real estate | 75 | 26 | ||||||
Depreciation and amortization | 8,044 | 4,922 | ||||||
Amortization of deferred financing costs | 560 | 183 | ||||||
Change in fair value on derivative instruments included in interest expense | 670 | (119 | ) | |||||
Net cash received/(paid) on derivative settlements | (1,032 | ) | 145 | |||||
Amortization of assumed debt premium | (29 | ) | (16 | ) | ||||
Equity-based compensation | 930 | 382 | ||||||
Casualty loss, net of insurance proceeds | 9 | — | ||||||
Changes in operating assets and liabilities, net of effects of acquisitions: | ||||||||
Operating assets | (2 | ) | (1,556 | ) | ||||
Operating liabilities | 3,166 | 2,381 | ||||||
|
|
|
| |||||
Net cash provided by operating activities | 12,250 | 5,793 | ||||||
|
|
|
| |||||
Cash flows from investing activities | ||||||||
Net proceeds from sales of real estate | 151 | 809 | ||||||
Prepaid acquisition deposits | (1,890 | ) | (173 | ) | ||||
Insurance proceeds received | 59 | — | ||||||
Acquisitions of real estate investments | (538,725 | ) | (30,527 | ) | ||||
Additions to real estate investments | (16,400 | ) | (11,630 | ) | ||||
|
|
|
| |||||
Net cash used in investing activities | (556,805 | ) | (41,521 | ) | ||||
|
|
|
| |||||
Cash flows from financing activities | ||||||||
Notes payable proceeds received | 125,000 | — | ||||||
Notes payable payments | (15 | ) | (38 | ) | ||||
Credit facilities proceeds received | 335,000 | 25,000 | ||||||
NREO Note repayment | (1,250 | ) | — | |||||
Financing costs paid | (7,746 | ) | (23 | ) | ||||
Proceeds from issuance of Class A common stock | 77,973 | 43,191 | ||||||
Redemptions of Class A common stock paid | (126 | ) | — | |||||
Offering costs paid | (310 | ) | (108 | ) | ||||
Dividends paid to common stockholders | (2,676 | ) | (1,764 | ) | ||||
Proceeds from issuance of redeemable Series A preferred stock, net of offering costs | 35,212 | — | ||||||
Preferred stock dividends paid | (925 | ) | — | |||||
Contributions from redeemable noncontrolling interests in the OP | 595 | — | ||||||
Distributions to redeemable noncontrolling interests in the OP | (1,497 | ) | (1,392 | ) | ||||
|
|
|
| |||||
Net cash provided by financing activities | 559,235 | 64,866 | ||||||
|
|
|
| |||||
Change in cash and restricted cash | 14,680 | 29,138 | ||||||
Cash and restricted cash, beginning of period | 37,096 | 17,830 | ||||||
|
|
|
| |||||
Cash and restricted cash, end of period | $ | 51,776 | $ | 46,968 | ||||
|
|
|
| |||||
See Accompanying Notes to Consolidated Financial Statements
F-38
Supplemental Disclosure of Cash Flow Information | ||||||||
Interest paid, net of amount capitalized | $ | 2,738 | $ | 2,681 | ||||
Supplemental Disclosure of Noncash Activities | ||||||||
Assumed liabilities in asset acquisitions | 4,554 | — | ||||||
Accrued dividends payable to common stockholders | 192 | 39 | ||||||
Accrued distributions payable to redeemable noncontrolling interests in the OP | 165 | 64 | ||||||
Accrued dividends payable to preferred stockholders | 2,031 | — | ||||||
Accretion to redemption value of Redeemable Series A preferred stock | 175 | — | ||||||
Offering costs accrued | 91 | 80 | ||||||
Issuance of Shares to common stockholders related to DRIP dividends | 2,878 | 1,383 | ||||||
DRIP dividends to common stockholders | (2,878 | ) | (1,383 | ) | ||||
Contributions from redeemable noncontrolling interests in the OP related to DRIP distributions | 360 | 236 | ||||||
DRIP distributions to redeemable noncontrolling interests in the OP | (360 | ) | (236 | ) |
See Accompanying Notes to Consolidated Financial Statements
F-39
VINEBROOK HOMES TRUST, INC.
NOTES TO CONSOLIDATED UNAUDITED FINANCIAL STATEMENTS
1. Organization and Description of Business
VineBrook Homes Trust, Inc. (the “Company”, “we”, “our”) was incorporated in Maryland on July 18, 2018 and has elected to be taxed as a real estate investment trust (“REIT”). The Company is focused on acquiring, renovating, leasing, maintaining and otherwise managing single-family rental home investments primarily located in large to medium size cities and suburbs located in the midwestern and southeastern United States. Substantially all of the Company’s business is conducted through VineBrook Homes Operating Partnership, L.P. (the “OP”), the Company’s operating partnership, as the Company owns its properties indirectly through the OP. VineBrook Homes OP GP, LLC (the “OP GP”), is the general partner of the OP. As of March 31, 2021, there were 12,988,961 Class A units of the OP (“OP Units”), of which 9,513,087, or 73.2%, were owned by the Company, 1,953,967, or 15.0%, were owned by NexPoint Real Estate Opportunities, LLC (“NREO”), 76,712, or 0.6%, were owned by NexPoint Real Estate Strategies Fund (“NRESF”), 737,362, or 5.7%, were owned by NexPoint Real Estate Capital, LLC (“NREC”), 131,775, or 1.0% were owned by GAF REIT, LLC (“GAF REIT”) and 576,058, or 4.4%, were owned by limited partners that were sellers in the Formation Transaction (defined below) (and in certain instances affiliated with the equity holders of the Manager (defined below)) (the “VineBrook Contributors”) or other Company insiders. NREO, NRESF, NREC and GAF REIT are noncontrolling limited partners unaffiliated with the Company but are affiliates of the Adviser (defined below).
The Company began operations on November 1, 2018 (the “Commencement of Operations”) as a result of the acquisition of various partnerships and limited liability companies owned and operated by the VineBrook Contributors and other third parties, which owned 4,129 single-family rental assets located in Ohio, Kentucky and Indiana (the “Initial Portfolio”) for a total purchase price of approximately $330.2 million, including closing and financing costs of $6.0 million (the “Formation Transaction”). On November 1, 2018, the Company accepted subscriptions for 1,097,367 shares of its Class A common stock, par value $0.01 (“Shares”), for gross proceeds of approximately $27.4 million in connection with the Formation Transaction. The proceeds from the issuance of Shares were used to acquire OP Units. The OP used the capital contribution from the Company to fund a portion of the purchase price for the Initial Portfolio. The remaining purchase price and closing costs were funded by a capital contribution totaling $70.7 million from NREO, $8.6 million of equity rolled over from VineBrook Contributors, and $241.4 million from a Federal Home Loan Mortgage Corporation (“Freddie Mac”) mortgage provided by KeyBank N.A (“KeyBank”). On May 1, 2019 (the “Release Date”), approximately $1.4 million worth of OP Units were released to various VineBrook Contributors from an indemnity reserve escrow that was established at the time the Initial Portfolio was acquired. From the time the escrow reserve was established until the Release Date, no indemnity claims were made against said escrow.
Between November 1, 2018 and March 31, 2021, the Company, through the SPEs (as defined in Note 3) owned by the OP, purchased 9,648 additional homes and sold 84 homes. Together with the Initial Portfolio, the Company, through the OP’s SPEs, indirectly owned an interest in 13,693 homes (the “Portfolio”) in 16 states as of March 31, 2021. The acquisition of the additional homes was funded by loans (see Note 5), proceeds from the sale of Shares and Preferred Shares (defined below) and excess cash generated from operations.
The Company is externally managed by NexPoint Real Estate Advisors V, L.P. (the “Adviser”), through an agreement dated November 1, 2018 and subsequently amended and restated on May 4, 2020, for an initial term ending November 1, 2021 (the “Advisory Agreement”) and will automatically renew for one-year terms thereafter, unless otherwise terminated. The Adviser provides asset management services to the Company. The OP caused the SPEs to retain VineBrook Homes, LLC (the “Manager”), an affiliate of certain VineBrook Contributors, to renovate, lease, maintain, and operate the Portfolio under management agreements (as amended, the “Management Agreements”) that generally have an initial three-year term with one-year renewals, unless otherwise terminated. The Management Agreements are supplemented by a side letter (as amended and restated, the “Side Letter”) by and among the Company, the OP, the OP GP, the Manager and certain of its affiliates. Certain SPEs from time to time may have property management agreements with independent third parties that are not the Manager. These are typically the result of maintaining legacy property managers after an acquisition to help transition the properties to the Manager or, in the case of a future sale, to manage the properties until they are sold. All of the Company’s investment decisions are made by employees of the Adviser and the Manager, subject to general oversight by the OP’s investment committee and the Company’s board of directors (the “Board”). Because the principals of the Manager own OP Units, the Manager is considered an affiliate for financial reporting disclosure purposes.
The Company’s investment objectives are to maximize the cash flow and value of properties owned, acquire properties with cash flow growth potential, provide quarterly cash distributions and achieve long-term capital appreciation for its stockholders through targeted management and a renovation program on the homes purchased.
On August 28, 2018, the Company authorized the offering of 40,000,000 Shares through a continuous private placement (the “Continuous Offering”), under regulation D of the Securities Act of 1933 (and various state securities law provisions) for a maximum of $1.0 billion of its Shares. The Continuous Offering expires on November 1, 2023 but may be extended for up to two times for one year each extension. The initial offering price for Shares sold through the Continuous Offering was $25.00 per Share. The Company conducts periodic closings and sells Shares at the prior net asset value (the “NAV”) per share as determined using the valuation methodology recommended by the Adviser and as approved by the pricing committee of the Board (the “Valuation Methodology”). The NAV per share is calculated on a fully diluted basis. Additionally, an independent third-party valuation firm assesses and evaluates the appropriateness of each NAV; all NAVs have been assessed as reasonable by the third-party. NAV may differ from the values of our real estate assets as calculated in accordance with GAAP.
F-40
VINEBROOK HOMES TRUST, INC.
NOTES TO CONSOLIDATED UNAUDITED FINANCIAL STATEMENTS
NexPoint Securities, Inc. (the “Dealer Manager”), an entity under common ownership with the Adviser, serves as the dealer manager for the Continuous Offering and Raymond James and other unaffiliated broker-dealers serve as placement agents (“Placement Agents”) through selling agreements (“Selling Agreements”) between each Placement Agent and the Company.
The Company has adopted a Long-Term Incentive Plan (the “2018 LTIP”) whereby the Board, or a committee thereof, may grant awards of restricted stock units of the Company (“RSUs”) or profits interest units in the OP (“PI Units”) to certain employees of the Adviser and the Manager, or others at the discretion of the Board (including the directors and officers of the Company or other service providers of the Company or the OP). Under the terms of the 2018 LTIP, 426,307 Shares were initially reserved, subject to automatic increase on January 1st of each year beginning with January 1, 2019 by a number equal to 10% of the total number outstanding on December 31st of the preceding year of OP Units and vested PI Units, provided that the Board may act prior to each such January 1st to determine that there will be no increase for such year or that the increase will be less than the number of shares by which the Share Reserve would otherwise increase (the “Share Reserve”). In addition, the Shares available under the LTIP Plan may not exceed in the aggregate 10% of the number of OP Units and vested PI Units outstanding at the time of measurement (the “Share Maximum”). Grants may be made annually by the Board, or more or less frequently in the Board’s sole discretion. Vesting of grants made under the 2018 LTIP will occur over a period of time as determined by the Board and may include the achievement of performance metrics, also as determined by the Board in its sole discretion.
2. Summary of Significant Accounting Policies
Basis of Accounting and Use of Estimates
The accompanying unaudited consolidated financial statements are presented in accordance with accounting principles generally accepted in the United States (“GAAP”) and the rules and regulations of the U.S. Securities and Exchange Commission (the “SEC”). GAAP requires management to make estimates and assumptions that affect the reported amounts of assets and liabilities and the disclosure of contingent liabilities at the dates of the consolidated financial statements and the amounts of revenues and expenses during the reporting periods. Actual amounts realized or paid could differ from those estimates. There have been no significant changes to the Company’s significant accounting policies during the three months ended March 31, 2021.
The accompanying unaudited consolidated financial statements have been prepared according to the rules and regulations of the SEC. Certain information and note disclosures normally included in financial statements prepared in accordance with GAAP have been condensed or omitted according to such rules and regulations, although management believes that the disclosures are adequate to make the information presented not misleading. References to number of properties is unaudited.
In the opinion of management, all adjustments and eliminations necessary for the fair presentation of the Company’s financial position as of March 31, 2021 and December 31, 2020 and results of operations for the three months ended March 31, 2021 and 2020 have been included. The unaudited information included in these interim financial statements should be read in conjunction with the audited consolidated financial statements and notes thereto for the years ended December 31, 2020 and 2019 included in the Company’s Form 10 initially filed with the SEC on April 30, 2021. The results of operations for the interim period presented are not necessarily indicative of the results that may be expected for the year ending December 31, 2021, or any other future period.
Principles of Consolidation
The Company accounts for subsidiary partnerships, joint ventures and other similar entities in which it holds an ownership interest in accordance with Financial Accounting Standards Board (“FASB”) Accounting Standards Codification (“ASC”) 810, Consolidation. The Company first evaluates whether each entity is a variable interest entity (“VIE”). Under the VIE model, the Company consolidates an entity when it has control to direct the activities of the VIE and the obligation to absorb losses or the right to receive benefits that could potentially be significant to the VIE. If the Company determines the entity is not a VIE, it evaluates whether the entity should be consolidated under the voting model. The Company consolidates an entity when it controls the entity through ownership of a majority voting interest. As of March 31, 2021, the Company has determined it must consolidate the OP and its subsidiaries under the VIE model as it was determined the Company both controls the direct activities of the OP and the right to receive benefits that could potentially be significant to the OP. The consolidated financial statements include the accounts of the Company and its subsidiaries, including the OP and its subsidiaries. All significant intercompany accounts and transactions have been eliminated in consolidation. OP Units that are not owned by the Company are presented as noncontrolling interests in the consolidated financial statements, and income or loss generated at the OP is allocated between the Company and the noncontrolling interests based upon their relative ownership percentages.
F-41
VINEBROOK HOMES TRUST, INC.
NOTES TO CONSOLIDATED UNAUDITED FINANCIAL STATEMENTS
Real Estate Investments
Upon acquisition, we evaluate our acquired single-family residential properties for purposes of determining whether a transaction should be accounted for as an asset acquisition or business combination. Since substantially all of the fair value of our acquired properties is concentrated in a single identifiable asset or group of similar identifiable assets and the acquisitions do not include a substantive process, our purchases of homes or portfolios of homes qualify as asset acquisitions. Accordingly, upon acquisition of a property, the purchase price and related acquisition costs (“Total Consideration”) are allocated to land, buildings, improvements, fixtures, and intangible lease assets based upon their relative fair values.
The allocation of Total Consideration, which is determined using inputs that are classified within Level 3 of the fair value hierarchy established by FASB ASC 820, Fair Value Measurement (“ASC 820”) (see Note 6), is based on an independent third-party valuation firm’s estimate of the fair value of the tangible and intangible assets and liabilities acquired. The valuation methodology utilizes market comparable information, depreciated replacement cost and other estimates in allocating value to the tangible assets. The allocation of the Total Consideration to intangible lease assets represents the value associated with the in-place leases, as one month’s worth of effective gross income (rental revenue, less credit loss allowance, plus other income) as the average downtime of the assets in the portfolio is approximately one month and the assets in the portfolio are leased on a gross rental structure. If any debt is assumed in an acquisition, the difference between the fair value, which is estimated using inputs that are classified within Level 2 of the fair value hierarchy, and the face value of debt is recorded as a premium or discount and amortized or accreted as interest expense over the life of the debt assumed.
Real estate assets, including land, buildings, improvements, fixtures, and intangible lease assets are stated at historical cost less accumulated depreciation and amortization. Costs incurred in making repairs and maintaining real estate assets are expensed as incurred. Expenditures for improvements, renovations, and replacements are capitalized at cost. The Company also incurs costs to prepare acquired properties for rental. These costs are capitalized to the cost of the property during the period the property is undergoing activities to prepare it for its intended use. We capitalize interest costs as a cost of the property only during the period for which activities necessary to prepare an asset for its intended use are ongoing, provided that expenditures for the asset have been made and interest costs have been incurred. Upon completion of the renovation of our properties, all costs of operations, including repairs and maintenance, are expensed as incurred, unless the renovation meets the Company’s capitalization criteria. Real estate-related depreciation and amortization are computed on a straight-line basis over the estimated useful lives as described in the following table:
Land | Not depreciated | |
Buildings | 27.5 years | |
Improvements (1) | 15 years | |
Fixtures (1) (2) | 5 - 7 years | |
Intangible lease assets | 6 months | |
Capitalized building maintenance | 3 - 15 years |
| (1) | Disclosed in the table is the typical depreciable life used by the Company. |
| (2) | Fixtures are included in buildings and improvements on the consolidated balance sheet. |
As of March 31, 2021, the gross balance and accumulated amortization related to the intangible lease assets was $4.9 million and $1.0 million, respectively. As of December 31, 2020, the gross balance and accumulated amortization related to the intangible lease assets was $0.8 million and $0.3 million, respectively. For the three months ended March 31, 2021 and 2020, the Company recognized approximately $1.0 million and $0.6 million, respectively, of amortization expense related to the intangible lease assets.
Real estate assets are reviewed for impairment quarterly or whenever events or changes in circumstances indicate that the carrying amount of an asset may not be recoverable. Significant indicators of impairment may include, but are not limited to, declines in home values, rental rates or occupancy percentages, as well as significant changes in the economy. In such cases, the Company will evaluate the recoverability of the assets by comparing the estimated future cash flows expected to result from the use and eventual disposition of each asset to its carrying amount and provide for impairment if such undiscounted cash flows are insufficient to recover the carrying amount. If impaired, the real estate asset will be written down to its estimated fair value. No significant impairments on operating properties were recorded during the three months ended March 31, 2021 and 2020.
Cash and restricted cash
The Company maintains cash at multiple financial institutions and, at times, these balances exceed federally insurable limits. As a result, there is a concentration of credit risk related to amounts on deposit. We believe any risks are mitigated through the size of the financial institutions at which our cash balances are held.
F-42
VINEBROOK HOMES TRUST, INC.
NOTES TO CONSOLIDATED UNAUDITED FINANCIAL STATEMENTS
Restricted cash represents cash deposited in accounts related to security deposits, property taxes, insurance premiums and deductibles and other lender-required escrows. Amounts deposited in the reserve accounts associated with the loans can only be used as provided for in the respective loan agreements, and security deposits held pursuant to lease agreements are required to be segregated.
The following table provides a reconciliation of cash and restricted cash reported on the consolidated balance sheets that sum to the total of such amount shown in the consolidated statements of cash flows (in thousands):
| March 31, | ||||||||||||
| 2021 | 2020 | December 31, 2020 | ||||||||||
Cash | $ | 40,093 | $ | 43,356 | $ | 31,225 | ||||||
Restricted cash | 11,683 | 3,612 | 5,871 | |||||||||
|
|
|
|
|
| |||||||
Total cash and restricted cash | $ | 51,776 | $ | 46,968 | $ | 37,096 | ||||||
|
|
|
|
|
| |||||||
Revenue Recognition
The Company’s primary operations consist of rental income earned from its residents under lease agreements typically with terms of one year or less. As a result of the adoption of ASC 842 on January 1, 2019, the Company classifies the single-family property leases as operating leases and elects to not separate the lease component, comprised of rents from single-family properties, from the associated non-lease component, comprised of fees from single-family properties and tenant charge-backs. The combined component is accounted for under the new lease accounting standard while certain resident reimbursements are accounted for as variable payments under the revenue accounting guidance. Rental income is recognized when earned. This policy effectively results in income recognition on a straight-line basis over the related terms of the leases. Resident reimbursements and other income consist of charges billed to residents for utilities, resident-caused damages, pets, administrative, application and other fees and are recognized when earned. The Company uses a direct write-off method for uncollectable rents; these uncollectible rents are netted against rental income.
Gains or losses on sales of properties are recognized pursuant to the provisions included in ASC 610-20, Other Income. We recognize a full gain or loss on sale, which is presented in loss on sales of real estate on the consolidated statements of operations and comprehensive income (loss), when the derecognition criteria under ASC 610-20 have been met.
In April 2020, the Financial Accounting Standards Board issued a Staff Q&A on accounting for leases during the COVID-19 pandemic, focused on the application of lease guidance in ASC 842, Leases. The Q&A states that some lease contracts may contain explicit or implicit enforceable rights and obligations that require lease concessions if certain circumstances arise that are beyond the control of the parties to the contract. Therefore, entities would need to perform a lease-by-lease analysis to determine whether contractual provisions in an existing lease agreement provide enforceable rights and obligations related to lease concessions. The FASB determined it would be acceptable for entities to not perform a lease-by-lease analysis regarding rent concessions resulting from COVID-19, and to instead make a policy election regarding rent concessions, which would give entities the option to account or not to account for these rent concessions as lease modifications if the total payments required by the modified contract are substantially the same or less than the total payments required by the original contract. Entities making the election to account for these rent concessions as lease modifications would recognize the effects of rent abatements and rent deferrals on a prospective straight-line basis over the remainder of the modified contract. We have made the election to not perform a lease-by-lease analysis to determine whether contractual provisions in an existing lease agreement provide enforceable rights and obligations related to payment plans. By electing the FASB relief, we have also made an accounting policy election to not account for rent deferrals provided to lessees due to the COVID-19 pandemic as lease modifications. Lessees are required to pay the full outstanding balance of the rent deferred over the period of the payment plan.
Redeemable Securities
Included in the Company’s consolidated balance sheets are redeemable noncontrolling interests in the OP and 6.50% Series A Cumulative Redeemable Preferred Stock (the “Preferred Shares”). These interests are presented in the “mezzanine” section of the consolidated balance sheets because they do not meet the functional definition of a liability or equity under current accounting literature. The Company accounts for these under the provisions of Accounting Standards Codification (ASC) Topic 480-10-S99-3A, paragraph 15(b).
In accordance with ASC Topic 480-10-S99, since the redeemable noncontrolling interests in the OP have a redemption feature, they are measured at their redemption value if such value exceeds the carrying value of interests. The redemption value is based on the NAV per unit at the measurement date. The offset to the adjustment to the carrying amount of the redeemable noncontrolling interests in the OP is reflected in the Company’s additional paid-in capital on the balance sheet. In accordance with ASC Topic 480-10-S99, the Preferred Shares are measured at their carrying value plus the accretion to their future redemption value on the balance sheet. The accretion is reflected in the Company’s dividends on and accretion to redemption value of Series A redeemable preferred stock on the statement of operations and comprehensive income (loss).
F-43
VINEBROOK HOMES TRUST, INC.
NOTES TO CONSOLIDATED UNAUDITED FINANCIAL STATEMENTS
Earnings (Loss) Per Share
Basic earnings (loss) per share is computed by dividing net income (loss) attributable to common stockholders by the weighted average number of shares of the Company’s common stock outstanding, which excludes any unvested restricted stock units issued pursuant to the 2018 LTIP. Diluted earnings (loss) per share is computed by adjusting basic earnings (loss) per share for the dilutive effect of the assumed vesting of restricted stock units. During periods of net loss, the assumed vesting of restricted stock units is anti-dilutive and is not included in the calculation of earnings (loss) per share. The following table sets forth the computation of basic and diluted earnings (loss) per share for the periods presented (in thousands, except per share amounts):
| For the Three Months Ended March 31, | ||||||||
| 2021 | 2020 | |||||||
Numerator for loss per share: | ||||||||
Net loss | $ | (141 | ) | $ | (555 | ) | ||
Less: | ||||||||
Dividends on and accretion to redemption value of Redeemable Series A preferred stock | 2,206 | — | ||||||
Net loss attributable to redeemable noncontrolling interests in the OP | (35 | ) | (190 | ) | ||||
|
|
|
| |||||
Net loss attributable to common stockholders | $ | (2,312 | ) | $ | (365 | ) | ||
|
|
|
| |||||
Denominator for earnings (loss) per share: | ||||||||
Weighted average common shares outstanding—basic | 10,417 | 5,907 | ||||||
Weighted average unvested restricted stock units | — | — | ||||||
Weighted average common shares outstanding—diluted | 10,417 | 5,907 | ||||||
Earnings (loss) per weighted average common share: | ||||||||
Basic | $ | (0.22 | ) | $ | (0.06 | ) | ||
Diluted | $ | (0.22 | ) | $ | (0.06 | ) | ||
Segment Reporting
Under the provision of ASC 280, Segment Reporting, the Company has determined that it has one reportable segment with activities related to acquiring, renovating, developing, leasing and operating single-family homes as rental properties. The Company’s management allocates resources and evaluates operating performance on a total portfolio basis. The aggregation of individual homes constitutes the total portfolio.
Recent Accounting Pronouncements
In March 2020, the FASB issued ASU 2020-04, Reference Rate Reform (Topic 848) (“ASU 2020-04”). ASU 2020-04 contains practical expedients for reference rate reform related activities that impact debt, leases, derivatives and other contracts. The guidance in ASU 2020-04 is optional and may be elected over time as reference rate reform activities occur. The Company is currently evaluating the impact the adoption of this ASU will have on the Company’s consolidated financial statements.
COVID-19
The COVID-19 pandemic could have material and adverse effects on our financial condition, results of operations, and cash flows in the near term. Since the outbreak, we have provided limited payment plans if certain criteria are met by residents. The duration of a payment plan is determined on a case by case basis, and ultimately the tenant is expected to make rent payments in full over time. The Company had not granted any direct rent reductions to residents in response to the crisis as of March 31, 2021. The Company continues to closely monitor the impact of the COVID-19 pandemic on all aspects of our business.
3. Investments in Subsidiaries
In connection with its indirect investments in real estate assets acquired, the Company, through its ownership of the OP, indirectly holds a proportional ownership interest in the Portfolio, through the OP’s beneficial ownership of all of the issued and outstanding membership interests in the special purpose limited liability companies (“SPEs”) that directly own the Portfolio. All of the properties in the Portfolio are consolidated in the Company’s consolidated financial statements. The assets of each entity can only be used to settle obligations of that particular entity, and the creditors of each entity have no recourse to the assets of other entities or the Company, except as discussed below. Under the terms of the notes payable, except as discussed below, the lender has a mortgage interest in each real estate asset in the SPE to which the loan is made.
F-44
VINEBROOK HOMES TRUST, INC.
NOTES TO CONSOLIDATED UNAUDITED FINANCIAL STATEMENTS
As of March 31, 2021, the Company owned the Portfolio, which consisted of 13,693 properties, through thirteen SPEs. The following table presents the ownership structure of each SPE group that directly owns the title to each real estate asset as of March 31, 2021, the number of assets held, the cost of those assets, the resulting debt allocated to each SPE and whether the debt is a mortgage loan. The mortgage loan may be settled from the assets of the below entity or entities to which the loan is made. Loans from the Warehouse Facility (as defined in Note 5) can only be settled from the assets owned by VB One, LLC (dollars in thousands):
VIE Name | Homes | Cost Basis | OP Beneficial Ownership % | Encumbered by Mortgage (1) | Debt Allocated | |||||||||||||||
NREA VB I, LLC | 66 | $ | 6,002 | 100 | % | Yes | $ | 5,048 | ||||||||||||
NREA VB II, LLC | 172 | 16,575 | 100 | % | Yes | 10,799 | ||||||||||||||
NREA VB III, LLC | 1,323 | 119,631 | 100 | % | Yes | 71,189 | ||||||||||||||
NREA VB IV, LLC | 386 | 37,082 | 100 | % | Yes | 24,330 | ||||||||||||||
NREA VB V, LLC | 1,829 | 125,227 | 100 | % | Yes | 108,384 | ||||||||||||||
NREA VB VI, LLC | 303 | 27,457 | 100 | % | Yes | 18,661 | ||||||||||||||
NREA VB VII, LLC | 36 | 3,031 | 100 | % | Yes | 2,989 | ||||||||||||||
True FM2017-1, LLC | 213 | 17,184 | 100 | % | Yes | 10,526 | ||||||||||||||
SMP Homes 3B, LLC | 160 | 16,494 | 100 | % | Yes | 9,318 | ||||||||||||||
SMP Homes 5B, LLC | 46 | 4,538 | 100 | % | Yes | 2,364 | ||||||||||||||
VB One, LLC | 3,405 | 286,351 | 100 | % | No | 100,000 | ||||||||||||||
VB Two, LLC | 1,859 | 154,438 | 100 | % | No | 125,000 | ||||||||||||||
VB Three, LLC | 3,895 | 516,685 | 100 | % | No | 320,000 | ||||||||||||||
|
|
|
|
|
| |||||||||||||||
| 13,693 | $ | 1,330,695 | $ | 808,608 | ||||||||||||||||
|
|
|
|
|
| |||||||||||||||
| (1) | Assets in VB One, LLC, VB Two, LLC and VB Three, LLC are not encumbered by a mortgage. Instead, the lender has an equity pledge in certain assets of the respective SPEs and an equity pledge in the equity of the respective SPEs. |
4. Real Estate Assets
As of March 31, 2021, the Company, through the OP and its SPE subsidiaries, owned 13,693 single-family rental homes. As of December 31, 2020, the Company, through the OP and its SPE subsidiaries, owned 9,282 single-family rental homes. The components of the Company’s real estate investments in single family rental properties were as follows (in thousands):
| Land | Buildings and improvements (1) | Intangible lease assets | Real estate held for sale, net | Total | ||||||||||||||||
Gross Real Estate, December 31, 2020 | $ | 171,062 | $ | 582,610 | $ | 795 | $ | 675 | $ | 755,142 | ||||||||||
Additions | 157,920 | 413,450 | 4,452 | 263 | 576,085 | |||||||||||||||
Write-offs | — | — | (306 | ) | — | (306 | ) | |||||||||||||
Dispositions | — | — | — | (226 | ) | (226 | ) | |||||||||||||
|
|
|
|
|
|
|
|
|
| |||||||||||
Gross Real Estate, March 31, 2021 | 328,982 | 996,060 | 4,941 | 712 | 1,330,695 | |||||||||||||||
Accumulated depreciation and amortization | — | (41,129 | ) | (1,005 | ) | — | (42,134 | ) | ||||||||||||
|
|
|
|
|
|
|
|
|
| |||||||||||
Net Real Estate, March 31, 2021 | $ | 328,982 | $ | 954,931 | $ | 3,936 | $ | 712 | $ | 1,288,561 | ||||||||||
|
|
|
|
|
|
|
|
|
| |||||||||||
| (1) | Includes capitalized interest, real estate taxes, insurance and other costs incurred during renovation of the properties. |
During the three months ended March 31, 2021 and 2020, the Company recognized depreciation expense of approximately $7.0 million and $4.4 million, respectively.
Acquisitions and dispositions
During the three months ended March 31, 2021, the Company, through the OP, acquired 4,415 homes and disposed of 4 homes.
On January 22, 2021, the Company, through the OP, purchased 1,725 homes, net of a simultaneous bulk disposition, located throughout the midwestern and southeastern United States (the “Conrex I Portfolio”). The gross purchase price including closing costs and other expenses and net of the simultaneous bulk disposition was approximately $228.0 million.
F-45
VINEBROOK HOMES TRUST, INC.
NOTES TO CONSOLIDATED UNAUDITED FINANCIAL STATEMENTS
On March 1, 2021, the Company, through the OP, purchased 2,170 homes, net of a simultaneous bulk disposition, located throughout the midwestern and southeastern United States (the “Conrex II Portfolio”). The gross purchase price including closing costs and other expenses and net of the simultaneous bulk disposition was approximately $282.9 million.
Held for sale properties
The Company periodically classifies real estate assets as held for sale when certain criteria are met, in accordance with GAAP. Once the Company begins marketing an asset or determines that it will pursue marketing an asset, the asset becomes classified as held for sale. At that time, the Company presents the net real estate assets separately in its consolidated balance sheet, and the Company ceases recording depreciation and amortization expense related to that property. Real estate held for sale is reported at the lower of its carrying amount or its estimated fair value less estimated costs to sell. As of March 31, 2021, there are 6 properties that are classified as held for sale. These held for sale properties are unencumbered and have a carrying amount of approximately $0.7 million.
5. Debt
On November 1, 2018, the OP (as guarantor) and some of the SPEs (as borrowers) entered into a $241.4 million Freddie Mac mortgage loan (the “Initial Mortgage”) with KeyBank. The Initial Mortgage is secured by certain properties in the Initial Portfolio and equity pledges of the SPEs and bears interest at a variable rate equal to the 30-day London InterBank Offered Rate (“one-month LIBOR”) plus 1.55%. The Initial Mortgage is interest-only for the first 48 months of the term and principal amortizes at a rate of 30 years over the last 36 months of the term. The Initial Mortgage matures and is due in full on December 1, 2025. The balance of the Initial Mortgage, net of unamortized deferred financing costs, is included in notes payable on the consolidated balance sheets.
On September 20, 2019, the OP (as guarantor) and VB One, LLC (as borrower) entered into a credit facility (the “Warehouse Facility”) with KeyBank. The Warehouse Facility is secured by an equity pledge in certain assets of VB One, LLC and an equity pledge in the equity of VB One, LLC and bears interest at a variable rate equal to one-month LIBOR plus 2.25%. The Warehouse Facility is a full-term, interest-only facility with an initial 36-month term, has one 12-month extension option, and the Company has the right to request an increase in the facility amount of up to $250.0 million. As of March 31, 2021, the commitment amount of the Warehouse Facility is $135.0 million. The balance of the Warehouse Facility, net of unamortized deferred financing costs, is included in Warehouse Facility on the consolidated balance sheets.
On September 30, 2019, in relation to the acquisition of a 954-home portfolio, the OP (as guarantor) assumed an approximately $10.8 million Freddie Mac mortgage loan (the “TrueLane Mortgage”) with Berkadia Commercial Mortgage LLC as a result of the OP’s acquisition of True FM 2017-1, LLC. The TrueLane Mortgage is secured by the properties in True FM 2017-1, LLC and an equity pledge in True FM 2017-1, LLC and bears interest at a fixed rate equal to 5.35%. The TrueLane Mortgage matures and is due in full on February 1, 2028 and requires monthly principal and interest payments. The balance of the TrueLane Mortgage, net of unamortized deferred financing costs, is included in notes payable on the consolidated balance sheets.
On December 28, 2020, in relation to the acquisition of a 161-home portfolio, the OP provided a non-recourse carveout guaranty related to an approximately $9.2 million mortgage loan assumed by a subsidiary of the OP (the “Colony Note”) with Colony American Finance Lender, LLC as a result of the OP’s acquisition of SMP Homes 3B, LLC. The Colony Note is secured by the properties in SMP Homes 3B, LLC and an equity pledge in SMP Homes 3B, LLC and bears interest at a fixed rate equal to 6.06%. The Colony Note matures and is due in full on December 9, 2021 and requires monthly principal and interest payments. The balance of the Colony Note, net of unamortized deferred financing costs, is included in notes payable on the consolidated balance sheets.
On December 28, 2020, in relation the acquisition of a 45-home portfolio, the OP provided a non-recourse carveout guaranty related to an approximately $2.4 million mortgage loan assumed by a subsidiary of the OP (the “CoreVest Note”) with CoreVest American Finance Lender LLC as a result of the OP’s acquisition of SMP Homes 5B, LLC. The CoreVest Note is secured by the properties in SMP Homes 5B, LLC and an equity pledge in SMP Homes 5B, LLC and bears interest at a fixed rate equal to 6.12%. The CoreVest Note matures and is due in full on January 9, 2023 and requires monthly principal and interest payments. The balance of the CoreVest Note, net of unamortized deferred financing costs, is included in notes payable on the consolidated balance sheets.
On January 6, 2021, the Company (as guarantor) and VB Two, LLC (as borrower) entered into a $125.0 million note with Metropolitan Life Insurance (the “MetLife Note”). The MetLife Note is secured by equity pledges in VB Two, LLC and its wholly owned subsidiaries and bears interest at a fixed rate of 3.25%. The MetLife Note is interest-only and matures and is due in full on January 31, 2026.
On March 1, 2021, the Company entered into a non-recourse carveout guaranty and certain wholly owned subsidiaries of VB Three, LLC (as borrowers) entered into a $500.0 million credit agreement with JP Morgan (the “JPM Facility”). The JPM Facility is secured by equity pledges in VB Three, LLC and its wholly owned subsidiaries and bears interest at a variable rate equal to one-month LIBOR plus 2.75%. The JPM Facility is interest-only and matures and is due in full on March 1, 2023.
F-46
VINEBROOK HOMES TRUST, INC.
NOTES TO CONSOLIDATED UNAUDITED FINANCIAL STATEMENTS
As of March 31, 2021, the Company is in compliance with all debt covenants in all of its debt agreements.
The weighted average interest rate of the Company’s debt was 2.5800% as of March 31, 2021 and 2.1227% as of December 31, 2020. As of March 31, 2021 and December 31, 2020, the adjusted weighted average interest rate of the Company’s debt, including the effect of derivative financial instruments, was 3.1022% and 3.2998%, respectively. For purposes of calculating the adjusted weighted average interest rate of the Company’s debt, including the effect of derivative financial instruments, the Company has included the weighted average fixed rate of 1.4309% for one-month LIBOR on its combined $320.0 million notional amount of interest rate swap agreements, which effectively fix the interest rate on $320.0 million of the Company’s floating rate indebtedness (see Note 6).
The following table contains summary information concerning the Company’s debt as of March 31, 2021 (dollars in thousands):
| Outstanding Principal as of | ||||||||||||||||||||
| Type | March 31, 2021 | December 31, 2020 | Interest Rate (1) | |||||||||||||||||
Initial Mortgage | Floating | $ | 241,400 | $ | 241,400 | 1.66 | % | |||||||||||||
Warehouse Facility | Floating | 100,000 | 85,000 | 2.36 | % | |||||||||||||||
JPM Facility | Floating | 320,000 | — | 2.86 | % | |||||||||||||||
MetLife Note | Fixed | 125,000 | — | 3.25 | % | |||||||||||||||
TrueLane Mortgage | Fixed | 10,526 | 10,570 | 5.35 | % | |||||||||||||||
Colony Note | Fixed | 9,318 | 9,296 | 6.06 | % | |||||||||||||||
CoreVest Note | Fixed | 2,364 | 2,358 | 6.12 | % | |||||||||||||||
NexPoint Real Estate Opportunities, LLC Note | (2 | ) | Floating | — | 1,250 | 2.36 | % | |||||||||||||
|
|
|
| |||||||||||||||||
| $ | 808,608 | $ | 349,874 | |||||||||||||||||
Debt premium, net | (3 | ) | 563 | 591 | ||||||||||||||||
Deferred financing costs, net of accumulated amortization of $1,794 and $591, respectively | (9,942 | ) | (2,756 | ) | ||||||||||||||||
|
|
|
| |||||||||||||||||
| $ | 799,229 | $ | 347,709 | |||||||||||||||||
|
|
|
| |||||||||||||||||
| (1) | Represents the interest rate as of March 31, 2021. Except for fixed rate debt, the interest rate is one-month LIBOR plus an applicable margin. One-month LIBOR as of March 31, 2021 was 0.1111%. One-month LIBOR as of December 31, 2020 was 0.1439%. |
| (2) | This was a related party note which was extinguished during the three months ended March 31, 2021 (see Note 11). |
| (3) | The Company reflected valuation adjustments on its assumed fixed rate debt to adjust it to fair market value on the dates of acquisition for the difference between the fair value and the assumed principal amount of debt. The difference is amortized into interest expense over the remaining terms of the debt. |
Schedule of Debt Maturities
The aggregate scheduled maturities, including amortizing principal payments, of total debt for the next five calendar years subsequent to March 31, 2021 are as follows (in thousands):
| Total | ||||
2021 | $ | 9,518 | ||
2022 | 955 | |||
2023 | 431,061 | (1) | ||
2024 | 8,375 | |||
2025 | 224,110 | |||
Thereafter | 134,589 | |||
Total | $ | 808,608 | ||
|
| |||
| (1) | Assumes the Company exercises the 12-month extension option on the Warehouse Facility. |
F-47
VINEBROOK HOMES TRUST, INC.
NOTES TO CONSOLIDATED UNAUDITED FINANCIAL STATEMENTS
Deferred Financing Costs
The Company defers costs incurred in obtaining financing and amortizes the costs over the term of the related debt using the straight-line method, which approximates the effective interest method. Deferred financing costs, net of amortization, are recorded as a reduction from the related debt on the Company’s consolidated balance sheets. Upon repayment of, or in conjunction with, a material change in the terms of the underlying debt agreement, any unamortized costs are charged to loss on extinguishment of debt and modification costs and any prepayment penalty resulting from the early repayment of the debt is recorded as interest expense in the period incurred. For the three months ended March 31, 2021 and 2020, amortization of deferred financing costs of approximately $0.5 million and $0.2 million, respectively, is included in interest expense on the consolidated statements of operations and comprehensive income (loss).
6. Fair Value of Derivatives and Financial Instruments
Fair value measurements are determined based on the assumptions that market participants would use in pricing an asset or liability. As a basis for considering market participant assumptions in fair value measurements, ASC 820 establishes a fair value hierarchy that distinguishes between market participant assumptions based on market data obtained from sources independent of the reporting entity (observable inputs that are classified within Levels 1 and 2 of the hierarchy) and the reporting entity’s own assumptions about market participant assumptions (unobservable inputs classified within Level 3 of the hierarchy):
| • | Level 1 inputs utilize quoted prices (unadjusted) in active markets for identical assets or liabilities that the Company has the ability to access. |
| • | Level 2 inputs are inputs other than quoted prices included in Level 1 that are observable for the asset or liability, either directly or indirectly. Level 2 inputs may include quoted prices for similar assets and liabilities in active markets, as well as inputs that are observable for the asset or liability (other than quoted prices), such as interest rates and yield curves that are observable at commonly quoted intervals. |
| • | Level 3 inputs are the unobservable inputs for the asset or liability, which are typically based on an entity’s own assumption, as there is little, if any, related market activity. In instances where the determination of the fair value measurement is based on input from different levels of the fair value hierarchy, the level in the fair value hierarchy within which the entire fair value measurement falls is based on the lowest level input that is significant to the fair value measurement in its entirety. |
The Company’s assessment of the significance of a particular input to the fair value measurement in its entirety requires judgment and considers factors specific to the asset or liability. The Company utilizes independent third parties to perform the allocation of value analysis for each property acquisition and to perform the market valuations on its derivative financial instruments and has established policies, as described above, processes and procedures intended to ensure that the valuation methodologies for investments and derivative financial instruments are fair and consistent as of the measurement date.
Derivative Financial Instruments and Hedging Activities
The Company manages interest rate risk primarily by managing the amount, sources, and duration of its debt funding and the use of derivative financial instruments. Specifically, the Company has entered into an interest rate cap and interest rate swaps to manage exposures that arise from changes in interest rates. The Company’s derivative financial instruments are used to manage the Company’s risk of increased cash outflows from the floating rate loans that may result from rising interest rates, in particular the reference rate for the loans, or one-month LIBOR. In order to minimize counterparty credit risk, the Company has entered into and expects to enter in the future into hedging arrangements and intends to only transact with major financial institutions that have high credit ratings.
The Company utilizes an independent third party to perform the market valuations on its derivative financial instruments. The valuation of these instruments is determined using widely accepted valuation techniques, including discounted cash flow analysis on the expected cash flows of each derivative. This analysis reflects the contractual terms of the derivatives, including the period to maturity, and uses observable market-based inputs, including interest rate curves and implied volatilities. The fair values of interest rate swaps are determined using the market standard methodology of netting the discounted future fixed cash receipts (or payments) and the discounted expected variable cash payments (or receipts). The variable cash payments (or receipts) are based on an expectation of future interest rates (forward curves) derived from observable market interest rate curves. The fair value of the interest rate cap is determined using the market standard methodology of discounting the future expected cash receipts that would occur if variable interest rates rise above the strike rate of the cap. The variable interest rates used in the calculation of projected receipts on the cap are based on an expectation of future interest rates derived from observable market interest rate curves and volatilities. To comply with the provisions of ASC 820, the Company incorporates credit valuation adjustments to appropriately reflect both the Company’s own nonperformance risk and the respective counterparty’s nonperformance risk in the fair value measurements. In adjusting the fair value of the Company’s derivative contracts for the effect of nonperformance risk, the Company has considered the impact of netting and any applicable credit enhancements, such as collateral postings, thresholds, mutual puts and guarantees. Although the Company has determined that the majority of the inputs used to value its derivatives fall within Level 2 of the fair value hierarchy, the credit valuation adjustments
F-48
VINEBROOK HOMES TRUST, INC.
NOTES TO CONSOLIDATED UNAUDITED FINANCIAL STATEMENTS
associated with the Company’s derivatives utilize Level 3 inputs, such as estimates of current credit spreads, to evaluate the likelihood of default by the Company and its counterparties. The Company has determined that the significance of the impact of the credit valuation adjustments made to its derivative contracts, which determination was based on the fair value of each individual contract, was not significant to the overall valuation. As a result, all of the Company’s derivatives held as of March 31, 2021 and December 31, 2020 were classified as Level 2 of the fair value hierarchy.
The changes in the fair value of derivative financial instruments that are designated as cash flow hedges are recorded in other comprehensive income (loss) and are subsequently reclassified into net income (loss) in the period that the hedged forecasted transaction affects earnings. Amounts reported in other comprehensive income (loss) related to derivatives will be reclassified to interest expense as interest payments are made on the Company’s floating rate debt. Derivatives not designated as hedges are not speculative and are used to manage the Company’s exposure to interest rate movements but either do not meet the strict requirements to apply hedge accounting in accordance with FASB ASC 815, Derivatives and Hedging, or the Company has elected not to designate such derivatives as hedges. Changes in the fair value of derivatives not designated in hedging relationships are recorded directly in net income (loss) as interest expense.
In order to fix a portion of, and mitigate the risk associated with, the Company’s floating rate indebtedness, the Company, through the OP, has entered into five interest rate swap transactions with KeyBank with a combined notional amount of $320.0 million. The interest rate swaps the Company has entered into effectively replace the floating interest rate (one-month LIBOR) with respect to that amount with a weighted average fixed rate of 1.4309%. The Company has designated these interest rate swaps as cash flow hedges of interest rate risk.
As of March 31, 2021, the Company had the following outstanding interest rate swaps that were designated as cash flow hedges of interest rate risk (dollars in thousands):
Effective Date | Expiration Date | Index (1) | Notional | Fixed Rate |
| |||||||||||||
7/1/2019 | 7/1/2024 | One-Month LIBOR | $ | 100,000 | 1.6290 | % | ||||||||||||
9/1/2019 | 12/21/2025 | One-Month LIBOR | 100,000 | 1.4180 | % | |||||||||||||
9/1/2019 | 12/21/2025 | One-Month LIBOR | 50,000 | 1.4190 | % | |||||||||||||
2/3/2020 | 2/1/2025 | One-Month LIBOR | 50,000 | 1.2790 | % | |||||||||||||
3/2/2020 | 3/3/2025 | One-Month LIBOR | 20,000 | 0.9140 | % | |||||||||||||
|
|
|
| |||||||||||||||
| $ | 320,000 | 1.4309 | % | (2 | ) | |||||||||||||
|
|
|
| |||||||||||||||
| (1) | As of March 31, 2021, one-month LIBOR was 0.1111%. |
| (2) | Represents the weighted average fixed rate of the interest rate swaps. |
For the three months ended March 31, 2021 and 2020, on the consolidated statements of operations and comprehensive income (loss), the Company recognized approximately $6.4 million of unrealized gain and $17.7 million of unrealized loss, respectively, related to the change in fair value of the interest rate swaps.
Interest rate caps involve the receipt of variable-rate amounts from a counterparty if interest rates rise above the strike rate on the contract in exchange for an up-front premium. The Company, through the OP, has entered into an interest rate cap transaction with SMBC Capital Markets, Inc. (the “Counterparty”) with a notional amount of $241.4 million. The interest rate cap effectively caps the total rate paid by the Company on $241.4 million of mortgage debt at 6.60%. The interest rate cap expires on November 1, 2021.
As of March 31, 2021 and 2020, the Company had the following outstanding derivatives that were not designated as hedges in qualifying hedging relationships (dollars in thousands):
Derivative | Notional | Hedged Floating Rate Debt | Index | Index as of March 31, 2021 | Strike Rate | |||||||||||||||
Interest Rate Cap | $ | 241,400 | Mortgage payable | | One-Month LIBOR | | 0.1111 | % | 6.60 | % | ||||||||||
For the three months ended March 31, 2021 and 2020, on the consolidated statements of operations and comprehensive income (loss), the Company recognized less than $0.1 million, of interest expense related to the interest rate cap.
F-49
VINEBROOK HOMES TRUST, INC.
NOTES TO CONSOLIDATED UNAUDITED FINANCIAL STATEMENTS
The table below presents the fair value of the Company’s derivative financial instruments as well as their classification on the consolidated balance sheets as of March 31, 2021 and December 31, 2020 (in thousands):
| Asset Derivatives | Liability Derivatives | |||||||||||||||||
Balance Sheet Location | March 31, 2021 | December 31, 2020 | March 31, 2021 | December 31, 2020 | ||||||||||||||
Derivatives designated as hedging instruments: | ||||||||||||||||||
Interest rate swaps | Fair market value of interest rate swaps | $ | — | $ | — | $ | 9,082 | $ | 15,453 | |||||||||
|
|
|
|
|
|
|
| |||||||||||
Total | $ | — | $ | — | $ | 9,082 | $ | 15,453 | ||||||||||
|
|
|
|
|
|
|
| |||||||||||
Financial assets and liabilities for which the carrying values approximate their fair values include cash, restricted cash, accounts receivable, accounts payable, and security deposits. Generally, these assets and liabilities are short-term in duration and are recorded at fair value on the consolidated balance sheets. The Company believes the carrying value of each outstanding loan approximates fair value based on the nature, term and interest rate of each loan.
7. Stockholders’ Equity
The following table details all Share issuances under the Continuous Offering and the Company’s distribution reinvestment plan (the “DRIP”) for the three months ended March 31, 2021 summarized by period end (dollars in thousands):
Period End | Shares issued | Cash proceeds | DRIP reinvestment | |||||||||
March 31, 2021 | 2,241,677 | $ | 77,966 | $ | 2,878 | |||||||
The following table provides detail on cash dividends declared on Shares as well as reinvested dividends as part of the Company’s DRIP for the three months ended March 31, 2021 (dollars in thousands):
Quarter Ended | DRIP Shares Issued | DRIP Dividend | Cash Dividend | Cash Dividend Accrued on RSUs (1) | Total Dividend | |||||||||||||||
March 31, 2021 | 80,493 | $ | 2,878 | $ | 2,676 | $ | 192 | $ | 5,746 | |||||||||||
| (1) | Included in accounts payable and other accrued liabilities on the consolidated balance sheets. |
During the three months ended March 31, 2020, the Company declared dividends of approximately $3.2 million which was comprised of approximately $1.8 million paid in cash and approximately $1.4 million which was reinvested in 46,813 Shares under the DRIP.
Long-Term Incentive Plan
The Company adopted the 2018 LTIP whereby the Board, or a committee thereof, may grant awards based on RSUs or PI Units to certain employees of the Adviser and the Manager, or others at the discretion of the Board (including the directors and officers of the Company or other service providers of the Company or the OP). The 2018 LTIP provides for the Share Reserve and the Share Maximum for issuance of RSUs or PI Units. Grants may be made annually by the Board or more or less frequently in the Board’s sole discretion. Vesting of grants made under the 2018 LTIP will occur ratably over a period of time as determined by the Board and may include the achievement of performance metrics also as determined by the Board in its sole discretion.
RSU Grants Under the 2018 LTIP
On December 10, 2019, a total of 73,700 RSUs were granted to certain employees of the Adviser and officers of the Company. On May 11, 2020, a total of 179,858 RSUs were granted to certain employees of the Adviser, officers of the Company and independent board members. On February 15, 2021, a total of 191,503 RSUs were granted to certain employees of the Adviser, officers of the Company and independent board members. RSUs granted to certain employees of the Adviser and officers of the Company generally vest over a four-year period with the February 15, 2021 and May 11, 2020 grants vesting 50% ratably over four years and 50% at the successful completion of an initial public offering. The RSUs granted to independent board members fully vest on the first anniversary of the grant date. Any unvested RSU is forfeited, except in limited circumstances, as determined by the compensation committee of the Board, when the recipient is no longer employed by the Adviser. RSUs are valued at fair value (which is the NAV per share) on the date of grant, with compensation expense recorded in accordance with the applicable vesting schedule that approximates a straight-line basis. Beginning on the date of grant, RSUs accrue dividends that are payable in cash on the vesting date. Once vested, the RSUs convert on a one-for-one basis into Shares.
F-50
VINEBROOK HOMES TRUST, INC.
NOTES TO CONSOLIDATED UNAUDITED FINANCIAL STATEMENTS
As of March 31, 2021, the number of RSUs granted that are outstanding was as follows (dollars in thousands):
Dates | Number of RSUs | Value (1) | ||||||
Outstanding December 31, 2020 | 235,133 | $ | 7,193 | |||||
Granted | 191,506 | 6,720 | ||||||
Vested | — | — | ||||||
Forfeited | — | — | ||||||
|
|
|
| |||||
Outstanding March 31, 2021 | 426,639 | $ | 13,913 | |||||
|
|
|
| |||||
| (1) | Value is based on the number of RSUs granted multiplied by the most recent NAV per share on the date of grant, which was $36.56 for the February 15, 2021 grant, $30.82 for the May 11, 2020 grant, and $29.85 for the December 10, 2019 grant. |
The vesting schedule for the RSUs is as follows:
Vest Date | RSUs Vesting | |||
May 11, 2021 | 30,510 | |||
December 10, 2021 | 18,425 | |||
February 15, 2022 | 32,483 | |||
May 11, 2022 | 21,336 | |||
December 10, 2022 | 18,425 | |||
February 15, 2023 | 22,717 | |||
May 11, 2023 | 21,335 | |||
December 10, 2023 | 18,426 | |||
February 15, 2024 | 22,717 | |||
May 11, 2024 | 21,335 | |||
February 14, 2025 | 22,717 | |||
Upon successful completion of IPO | 176,211 | |||
|
| |||
| 426,639 | ||||
|
| |||
For the three months ended March 31, 2021 and 2020, the Company recognized approximately $0.5 million and $0.1 million, respectively, of non-cash compensation expense related to the RSUs, which is included in corporate general and administrative expenses on the consolidated statements of operations and comprehensive income (loss).
F-51
VINEBROOK HOMES TRUST, INC.
NOTES TO CONSOLIDATED UNAUDITED FINANCIAL STATEMENTS
Determination of Net Asset Value
Periodically, the pricing committee of the Board, with the assistance of the Adviser, determines the NAV using the Valuation Methodology. On and before March 31, 2020, NAV was determined at the end of each quarter. Beginning April 30, 2020, the NAV has been determined at the end of each month to account for changes related to the COVID-19 pandemic. Shares and OP Units sold on or after each date below pursuant to the Continuous Offering were generally sold at that NAV until the next NAV calculation. Shares and OP Units issued under the DRIP reflect a 3% discount to the then current NAV set by the pricing committee of the Board. The table below illustrates the changes in NAV since inception:
Date | NAV per share | DRIP price per share | ||||||
November 1, 2018 | $ | 25.00 | $ | 24.25 | ||||
December 31, 2018 | 28.27 | 27.42 | ||||||
March 31, 2019 | 28.75 | 27.89 | ||||||
June 30, 2019 | 28.88 | 28.01 | ||||||
September 30, 2019 | 29.85 | 28.95 | ||||||
December 31, 2019 | 30.58 | 29.66 | ||||||
March 31, 2020 | 30.59 | 29.67 | ||||||
April 30, 2020 | 30.82 | 29.90 | ||||||
May 31, 2020 | 31.08 | 30.15 | ||||||
June 30, 2020 | 31.24 | 30.30 | ||||||
July 31, 2020 | 31.47 | 30.53 | ||||||
August 31, 2020 | 32.91 | 31.92 | ||||||
September 30, 2020 | 34.00 | 32.98 | ||||||
October 31, 2020 | 34.18 | 33.15 | ||||||
November 30, 2020 | 34.38 | 33.35 | ||||||
December 31, 2020 | 36.56 | 35.46 | ||||||
January 31, 2021 | 36.56 | 35.46 | ||||||
February 28, 2021 | 36.68 | 35.58 | ||||||
March 31, 2021 | 36.82 | 35.72 | ||||||
Fees and Commissions paid to Placement Agents and Dealer Manager
Subject to certain exceptions, investors that purchase Shares through the Continuous Offering will generally pay the Placement Agents in the Continuous Offering placement fees or commissions, in addition to the NAV sales price, equal to 1% to 5.5% of gross investor equity, subject to certain breakpoints and various terms of each specific Selling Agreement. An advisory fee equal to 2% of gross proceeds invested, which is also in addition to the NAV sales price, is paid to Raymond James for all Shares sold by Raymond James on behalf of the Company in the Continuous Offering. With the consent of the applicable Placement Agent, some or all of the applicable fees and commissions may be waived. Other Selling Agreements may have specific fees that differ from the Raymond James fees related to selling Shares to their clients. In addition, the Dealer Manager will generally receive a fee of 0.5% on sales in the Continuous Offering through Raymond James and 3% on sales through other Placement Agents. Placement Agent compensation is subject to a reasonable carve-out for sales of Shares directly by the Company or for sales to employees of our Adviser, Manager and affiliates thereof.
8. Redeemable Noncontrolling Interests in the OP
Other than PI Units and OP Preferred Units (defined below), partnership interests in the OP are represented by OP Units. Net income (loss) is allocated pro rata to holders of OP Units and PI Units based upon net income (loss) attributable to the OP and the respective members’ OP Units and PI Units held during the period. Capital contributions, distributions, and profits and losses are allocated to PI Units and OP Units not held by the Company (the “noncontrolling interests”).
F-52
VINEBROOK HOMES TRUST, INC.
NOTES TO CONSOLIDATED UNAUDITED FINANCIAL STATEMENTS
The following table presents the redeemable noncontrolling interests in the OP (in thousands):
| Balances | ||||
Redeemable noncontrolling interests in the OP, December 31, 2020 | $ | 127,090 | ||
Net loss attributable to redeemable noncontrolling interests in the OP | (35 | ) | ||
Contributions by redeemable noncontrolling interests in the OP | 955 | |||
Distributions to redeemable noncontrolling interests in the OP | (2,022 | ) | ||
Redemptions by redeemable noncontrolling interests in the OP | — | |||
Equity-based compensation | 416 | |||
Other comprehensive income attributable to redeemable noncontrolling interests in the OP | 1,581 | |||
Adjustment to reflect redemption value of redeemable noncontrolling interests in the OP | (3 | ) | ||
|
| |||
Redeemable noncontrolling interests in the OP, March 31, 2021 | $ | 127,982 | ||
|
| |||
The following table provides detail on distributions to noncontrolling interests in the OP for the three months ended March 31, 2021 (dollars in thousands):
Quarter Ended | DRIP OP Units Issued | OP DRIP Distribution | OP Cash Distribution | OP Cash Distribution Accrued on PI Units (1) | Total OP Distribution | |||||||||||||||
March 31, 2021 | 10,108 | $ | 360 | $ | 1,497 | $ | 165 | $ | 2,022 | |||||||||||
| (1) | Included in accounts payable and other accrued liabilities on the consolidated balance sheets. |
As of March 31, 2021, the Company held 9,513,087 OP Units, NREO held 1,953,967 OP Units, NRESF held 76,712 OP Units, NREC held 737,362 OP Units, GAF REIT held 131,775 OP Units and the VineBrook Contributors and other Company insiders held 576,058 OP Units.
The following table provides detail on distributions to noncontrolling interests in the OP for the three months ended March 31, 2020 (dollars in thousands):
Quarter Ended | DRIP OP Units Issued | OP DRIP Distribution | OP Cash Distribution | OP Cash Distribution Accrued on PI Units (1) | Total OP Distribution | |||||||||||||||
March 31, 2020 | 7,966 | $ | 236 | $ | 1,392 | $ | 64 | $ | 1,692 | |||||||||||
| (1) | Included in accounts payable and other accrued liabilities on the consolidated balance sheets. |
PI Unit Grants Under the 2018 LTIP
In connection with the 2018 LTIP, PI Units have been issued to key personnel, senior management and executives of the Manager. On April 19, 2019, a total of 40,000 PI Units were granted, on November 21, 2019, a total of 80,399 PI Units were granted, on May 11, 2020, a total of 219,826 PI Units were granted and on November 30, 2020, a total of 11,764 PI Units were granted. The PI Units are a special class of partnership interests in the OP with certain restrictions, which are convertible into OP Units, subject to satisfying vesting and other conditions. PI Unit holders are entitled to receive the same distributions as holders of our OP Units (only if we pay such distributions). The PI Units granted in 2019 generally fully vest over a period of two to four years. The PI Units granted on May 11, 2020 vest 50% ratably over four years and 50% at the successful completion of an initial public offering and the PI Units granted on November 30, 2020 vest 100% ratably over four years or alternatively 100% on the successful completion of an initial public offering. Once vested and converted into OP Units in accordance with the limited partnership agreement of the OP, the PI Units will then be fully recognized as OP Units, which are subject to a one year lock up period before they can be converted to Shares. Any unvested PI Unit is forfeited, except in limited circumstances, as determined by the compensation committee of the Board, when the recipient is no longer employed by the Manager. PI Units are valued at fair value on the date of grant, with compensation expense recorded in accordance with the applicable vesting schedule over the periods in which the restrictions lapse, that approximates a straight-line basis. We valued the PI Units at a per-unit value equivalent to the per-share offering price of our OP Units less a discount for lack of marketability and other discounts estimated by a third-party consultant. Beginning on the date of grant, PI Units accrue dividends that are payable in cash quarterly.
F-53
VINEBROOK HOMES TRUST, INC.
NOTES TO CONSOLIDATED UNAUDITED FINANCIAL STATEMENTS
As of March 31, 2021, the number of PI Units granted that are outstanding was as follows (dollars in thousands):
| Number of PI Units | Value (1) | |||||||
Outstanding December 31, 2020 | 310,465 | $ | 9,290 | |||||
Granted | — | — | ||||||
Vested | — | — | ||||||
Forfeited | — | — | ||||||
|
|
|
| |||||
Outstanding March 31, 2021 | 310,465 | $ | 9,290 | |||||
|
|
|
| |||||
| (1) | Value is based on the number of PI Units granted multiplied by the estimated per unit fair value on the date of grant, which was $27.88 for the April 19, 2019 grant, $29.12 for the November 21, 2019 grant, $30.16 for the May 11, 2020 grant and $33.45 for the November 30, 2020 grant. |
The vesting schedule for the PI Units is as follows:
Vest Date | PI Units Vesting | |||
May 11, 2021 | 27,478 | |||
November 1, 2021 | 9,200 | |||
November 21, 2021 | 18,425 | |||
November 30, 2021 | 2,941 | |||
May 11, 2022 | 27,479 | |||
November 1, 2022 | 7,200 | |||
November 21, 2022 | 18,425 | |||
November 30, 2022 | 2,941 | |||
May 11, 2023 | 27,478 | |||
November 1, 2023 | 7,200 | |||
November 21, 2023 | 18,425 | |||
November 30, 2023 | 2,941 | |||
May 11, 2024 | 27,478 | |||
November 30, 2024 | 2,941 | |||
Upon successful completion of IPO* | 109,913 | |||
|
| |||
| 310,465 | ||||
|
| |||
*Upon successful completion of an IPO, an additional 11,764 PI Units will vest immediately instead of vesting ratably according to the schedule above on each of November 30, 2021, November 30, 2022, November 30, 2023 and November 30, 2024.
For the three months ended March 31, 2021 and 2020, the OP recognized approximately $0.4 million and $0.2 million, respectively, of non-cash compensation expense related to the PI Units, which is included in corporate general and administrative expenses on the Company’s consolidated statements of operations and comprehensive income (loss).
The table below presents the consolidated Shares and OP Units outstanding held by the noncontrolling interests (“NCI”), as the OP Units held by the Company are eliminated in consolidation:
Period End | Shares Outstanding | OP Units Held by NCI | Consolidated Shares and OP Units Outstanding | |||||||||
March 31, 2021 | 11,499,045 | 3,475,874 | 14,974,919 | |||||||||
9. Redeemable Series A Preferred Stock
On January 8, 2021, the Company issued 1,460,000 Preferred Shares at a price of $25.032 per share, for gross proceeds of approximately $36.5 million. The net proceeds were in turn used to purchase 1,460,000 6.50% Series A Cumulative Redeemable Preferred Units of the OP (“OP Preferred Units”). The OP used the proceeds for acquisitions and other corporate purposes. The Preferred Shares have a redemption value of $25.00 per share and are mandatorily redeemable on October 7, 2027, subject to certain extensions. On March 15, 2021, the Company declared a dividend of $0.40625 per share to the holders of record of Preferred Shares as of March 25, 2021. The preferred dividend was paid on April 12, 2021. The following table presents the redeemable Series A preferred stock (dollars in thousands):
F-54
VINEBROOK HOMES TRUST, INC.
NOTES TO CONSOLIDATED UNAUDITED FINANCIAL STATEMENTS
| Preferred Shares | Balances | |||||||
Redeemable Series A preferred stock, December 31, 2020 | 3,540,000 | $ | 85,067 | |||||
Issuance of Redeemable Series A preferred stock | 1,460,000 | 36,547 | ||||||
Issuance costs related to Redeemable Series A preferred stock | — | (1,335 | ) | |||||
Net income attributable to Redeemable Series A preferred stockholders | — | 2,031 | ||||||
Dividends declared to Redeemable Series A preferred stockholders | — | (2,031 | ) | |||||
Accretion to redemption value | — | 175 | ||||||
|
|
|
| |||||
Redeemable Series A preferred stock, March 31, 2021 | 5,000,000 | $ | 120,454 | |||||
|
|
|
| |||||
10. Income Taxes
The Company has made the election and intends to be taxed as a REIT under Sections 856 through 860 of the Internal Revenue Code of 1986, as amended (the “Code”), and expects to continue to qualify as a REIT. To qualify as a REIT, the Company must meet a number of organizational and operational requirements, including a requirement to distribute annually at least 90% of its “REIT taxable income,” as defined by the Code, to its stockholders. As a REIT, the Company will be subject to federal income tax on its undistributed REIT taxable income and net capital gain and to a 4% nondeductible excise tax on any amount by which distributions it pays with respect to any calendar year are less than the sum of (1) 85% of its ordinary income, (2) 95% of its capital gain net income and (3) 100% of its undistributed income from prior years. The Company intends to operate in such a manner so as to qualify as a REIT, but no assurance can be given that the Company will operate in a manner so as to qualify as a REIT.
If the Company fails to meet these requirements, it could be subject to federal income tax on all of the Company’s taxable income at regular corporate rates for that year. The Company would not be able to deduct distributions paid to stockholders in any year in which it fails to qualify as a REIT. Additionally, the Company will also be disqualified from electing to be taxed as a REIT for the four taxable years following the year during which qualification was lost unless the Company is entitled to relief under specific statutory provisions. As of March 31, 2021, the Company believes it is in compliance with all applicable REIT requirements. The Company is still subject to state and local income taxes and to federal income and excise tax on its undistributed income, however those taxes are not material to the financial statements.
The Company evaluates the accounting and disclosure of tax positions taken or expected to be taken in the course of preparing the Company’s tax returns to determine whether the tax positions are “more-likely-than-not” (greater than 50 percent probability) of being sustained by the applicable tax authority. Tax positions not deemed to meet the more-likely-than-not threshold would be recorded as a tax benefit or expense in the current year. The Company’s management is required to analyze all open tax years, as defined by the statute of limitations, for all major jurisdictions, which include federal and certain states. The Company has no examinations in progress and none are expected at this time. The tax years subject to examination are 2019 and 2018.
The Company had no material unrecognized federal or state tax benefit or expense, accrued interest or penalties as of March 31, 2021. When applicable, the Company recognizes interest and/or penalties related to uncertain tax positions on its consolidated statements of operations and comprehensive income (loss).
11. Related Party Transactions
Advisory Fee
Pursuant to the Advisory Agreement, the Company will pay the Adviser, on a monthly basis in arrears, an advisory fee at an annualized rate of 0.75% of the gross asset value of the Company on a consolidated basis (excluding the value of the OP’s assets but inclusive of the Company’s pro rata share of the debt held at the OP and its SPEs). The Adviser will manage the Company’s business including, among other duties, advising the Board to issue distributions, preparing our quarterly and annual consolidated financial statements prepared under GAAP, development and maintenance of internal accounting controls, management and conduct of maintaining our REIT status, calculation of our NAV and recommending the appropriate NAV to be set by the Board, processing of sales of Shares through the Continuous Offering, reporting to holders of Shares, our tax filings, and other responsibilities customary for an external advisor to a business similar to ours. With certain specified exceptions, the advisory fee together with reimbursement of operating and offering expenses may not exceed 1.5% of average total assets of the Company and the OP, as determined in accordance with GAAP on a consolidated basis, at the end of each month (or partial month) (i) for which any advisory fee is calculated or (ii) during the year for which any expense reimbursement is calculated (the “Expense Cap”).
For the three months ended March 31, 2021 and 2020, the Company incurred advisory fees of approximately $1.3 million and $0.7 million, respectively, which is included in advisory fees on the consolidated statements of operations and comprehensive income (loss).
F-55
VINEBROOK HOMES TRUST, INC.
NOTES TO CONSOLIDATED UNAUDITED FINANCIAL STATEMENTS
Management Fee
The equity holders of the Manager are holders of noncontrolling interests in the OP and comprise a portion of the VineBrook Contributors. Through this noncontrolling ownership, the Manager is deemed to be a related party. Pursuant to the Management Agreements, the OP will pay the Manager (i) an acquisition fee equal to 1.0% of the purchase price paid for any new property acquired during the month, (ii) a construction fee monthly in arrears that shall not exceed the greater of 10% of construction costs or $1,000, whichever is higher, in connection with the repair, renovation, improvement or development of any newly acquired property, and (iii) a property management fee monthly in arrears equal to a percentage of collected rental revenues for all properties during the month as follows:
| • | 8.0% of collected rental revenue up to and including $45 million on an annualized basis; |
| • | 7.0% of the incremental collected rental revenue above $45 million but below and including $65 million on an annualized basis; |
| • | 6.0% of the incremental collected rental revenue above $65 million but below and including $85 million on an annualized basis; and |
| • | 5.0% of the incremental collected rental revenue above $85 million on an annualized basis. |
Under the Management Agreements and the Side Letter, the aggregate fees that the Manager can earn in any fiscal year are capped such that the Manager’s EBITDA (as defined in the Management Agreements) derived from these fees may not exceed the greater of $1.0 million or 0.5% of the combined equity value of the Company and the OP on a consolidated basis, calculated on the first day of each fiscal year based on the aggregate NAV of the outstanding Shares and OP Units held by other than the Company on the last business day of the prior fiscal year (the “Manager Cap”). The aggregate fees up to the Manager Cap are payable (1) in cash in an amount equal to the tax obligations of the Manager’s equity holders resulting from the aggregate management fees earned in such fiscal year up to a maximum rate of 25% (the “Manager Cash Cap”) and (2) with respect to the remaining portion of the aggregate fees, in OP Units, at a price per OP Unit equal to the Cash Amount (as defined in the OP’s limited partnership agreement). The aggregate fees paid in cash that exceed the Manager Cash Cap are rebated back to the OP. As of March 31, 2021, the OP recorded no receivable on the consolidated balance sheet related to the Manager Cash Cap rebate. As of December 31, 2020, the OP recorded a receivable of approximately $1.1 million due from the Manager related to the Manager Cash Cap rebate.
The Manager will be responsible for the day-to-day management of the properties, acquisition of new properties, disposition of existing properties (with acquisition and disposition decisions made under the approval of the investment committee and the Board), leasing the properties, managing tenant issues and requests, collecting rents, paying operating expenses, managing maintenance issues, accounting for each property using GAAP, and other responsibilities customary for the management of single family rental properties.
Property management fees are included in property management fees on the consolidated statements of operations and comprehensive income (loss) and acquisition and construction fees are capitalized into each home and is included in buildings and improvements on the consolidated balance sheet and are depreciated over the useful life of each property.
The following table is a summary of fees that the OP incurred to the Manager and its affiliates, as well as reimbursements paid to the Manager and its affiliates for various operating expenses the Manager paid on the OP’s behalf, under the terms of Management Agreements and Side Letter, for the three months ended March 31, 2021 and 2020 (dollars in thousands):
| For the Three Months Ended March 31, | ||||||||||
Location on Financial Statements | 2021 | 2020 | ||||||||
Fees Incurred | ||||||||||
Property management fees | Statement of Operations | $ | 1,805 | $ | 1,277 | |||||
Acquisition fees | Balance Sheet | 5,974 | 314 | |||||||
Construction supervision fees | Balance Sheet | 1,322 | 863 | |||||||
Reimbursements | ||||||||||
Payroll and benefits | Balance Sheet and Statement of Operations | 3,079 | 1,827 | |||||||
Other reimbursements | Balance Sheet and Statement of Operations | 155 | 93 | |||||||
|
|
|
| |||||||
Totals | $ | 12,335 | $ | 4,374 | ||||||
|
|
|
| |||||||
F-56
VINEBROOK HOMES TRUST, INC.
NOTES TO CONSOLIDATED UNAUDITED FINANCIAL STATEMENTS
Internalization of the Adviser or the Manager
The Company may acquire all of the outstanding equity interests of the Adviser, the Manager or both (an “Internalization”) under certain provisions (a “Purchase Provision”) of the Advisory Agreement or the Side Letter to effect an Internalization upon the payment of a certain fee (an “Internalization Fee”). If the Company determines to acquire the equity interests of the Adviser, the applicable Purchase Provision of the Advisory Agreement provides that the Adviser must first agree to such acquisition and that the Company will pay the Adviser an Internalization Fee equal to three times the total of the prior 12 months’ advisory fee, payable only in capital stock of the Company. If the Company determines to acquire the equity interests of Manager, the applicable Purchase Provision of the Side Letter provides the Company has a right to do so and that the Company will pay the Manager an Internalization Fee equal to $6.5 million plus 50% of the subtraction of $6.5 million from three times the total of the prior 12 months’ property management fee, payable in cash, Shares or OP Units. The OP may also acquire the equity interests of the Manager on the same terms under the applicable Purchase Provision. Certain additional conditions and limitations apply to the Internalizations, including but not limited to caps on the Internalization Fees. The Company expects any equity issued in satisfaction of an Internalization Fee to be valued at the NAV in effect on the date the Internalization is consummated.
Termination Fees Payable to the Adviser or Manager
If the Advisory Agreement or any one of the Management Agreements is terminated without cause by the Company or the SPE, as applicable, or is otherwise terminated under certain conditions, the Adviser or the Manager, as applicable, will be entitled to a termination fee (a “Termination Fee”) in the amount of three times the prior 12 months’ advisory fee, in the case of a termination of the Advisory Agreement, or three times the prior 12 months’ property management fee, in the case of the applicable Management Agreement. In addition to termination by the Company without cause, the Adviser will be entitled to the Termination Fee if the Adviser terminates the Advisory Agreement without cause or terminates the agreement due to the occurrence of certain specified breaches of the Advisory Agreement by the Company. The Advisory Agreement may be terminated without cause by the Company or the Adviser with 180 days’ notice prior to the expiration of the then-current term. In addition to termination by the SPE without cause, the Manager will be entitled to the Termination Fee if the SPE sells or otherwise disposes of all or substantially all of the properties subject to the applicable Management Agreement. The Management Agreements may be terminated by the SPE with 90 days’ notice without cause. Termination Fees are payable in cash.
Advance Acquisition and Construction Fee Advances Paid to the Manager
Pursuant to the Side Letter, the Manager may request from the OP from time-to-time an advance on acquisition and construction fees (the “Fee Advances”) to fund the performance of its obligations under the Management Agreements. Each Fee Advance is repaid from future acquisition and construction fees earned by and owed to the Manager. Fee Advances are included in the line item Due from Manager on the consolidated balance sheets. As of March 31, 2021 and December 31, 2020, the Company recorded no receivable for Fee Advances.
Backstop Loans to the Manager
Pursuant to the Side Letter, in the event the Manager does not have sufficient cash flow from operations to meet its budgeted obligations under the Management Agreements, the Manager may from time to time request from the Company a temporary loan (the “Backstop Loan”) to satisfy the shortfall. Backstop Loans are interest free, may be prepaid at any time and may not exceed a principal amount that is in the aggregate equal to the lesser of the Internalization Fee or Termination Fee under the applicable Management Agreement. Unless otherwise repaid, each Backstop Loan is payable upon termination of the applicable Management Agreement. Backstop Loans are included in the line item Due from Manager on the consolidated balance sheets. As of March 31, 2021 and December 31, 2020, the Company recorded a receivable for Backstop Loans made to the manager of approximately $0.7 million and approximately $0.7 million, respectively.
Dealer Manager Fees
Investors may be charged a dealer manager fee of between 0.50% and 3.00% of gross investor equity by the Dealer Manager for sell of Shares pursuant to the Continuous Offering, subject to certain breakpoints and various terms of the Dealer Manager Agreements. At the sole discretion of the Dealer Manager, the dealer manager fee may be partially or fully waived. The dealer manager fee is paid to an affiliate of the Adviser.
Organization and Continuous Offering Expenses
Offering and organizational expenses (“O&O Expenses”) may be incurred in connection with sales in the Continuous Offering at the discretion of the Company and are borne by investors through a fee of up to 0.50% of gross investor equity for sales through Raymond James and up to 1.00% of gross investor equity for other sales. O&O Expenses are intended to reimburse the Company, Adviser and Placement Agents for the costs of maintaining the Continuous Offering and selling costs incurred in raising equity under the Continuous Offering. Payments for bona fide expenses and reimbursements are O&O Expenses which are recorded as a reduction to equity.
F-57
VINEBROOK HOMES TRUST, INC.
NOTES TO CONSOLIDATED UNAUDITED FINANCIAL STATEMENTS
See below for detail related to the O&O Expenses as of March 31, 2021 (dollars in thousands):
| Amount | ||||
Gross investor equity raised subject to O&O | $ | 355,064 | ||
O&O collected and available for reimbursements | $ | 2,280 | ||
|
| |||
O&O Expenses reimbursed for the period: | ||||
Inception through December 31, 2019 | $ | 686 | ||
January 1, 2020 through March 31, 2020 | 188 | |||
April 1, 2020 through June 30, 2020 | 235 | |||
July 1, 2020 through September 30, 2020 | 175 | |||
October 1, 2020 through December 31, 2020 | 385 | |||
January 1, 2020 through March 31, 2021 | 296 | |||
|
| |||
| $ | 1,965 | |||
|
| |||
O&O available for future reimbursements | $ | 315 | ||
|
| |||
NexBank
The Company and the OP maintain bank accounts with an affiliate of the Adviser, NexBank N.A. (“NexBank”). NexBank charges no recurring maintenance fees on the accounts.
NREO Note
On August 22, 2019, the Company, through the OP, entered into an approximately $1.3 million subordinated convertible note (the “NREO Note”) with NREO, who is an affiliate of the Adviser. The NREO Note bears interest at a variable rate equal to one-month LIBOR plus 2.25% and is full interest-only. The NREO Note was repaid in full and extinguished on January 26, 2021.
12. Commitments and Contingencies
Commitments
In the normal course of business, the Company enters into various construction related purchase commitments with parties that provide these goods and services. In the event the Company were to terminate construction services prior to the completion of projects, the Company could potentially be committed to satisfy outstanding or uncompleted purchase orders with such parties. As of March 31, 2021, management does not anticipate any material deviations from schedule or budget related to rehabilitation projects currently in process.
Contingencies
In the normal course of business, the Company is subject to claims, lawsuits, and legal proceedings. While it is not possible to ascertain the ultimate outcome of all such matters, management believes that the aggregate amount of such liabilities, if any, in excess of amounts provided or covered by insurance, will not have a material adverse effect on the consolidated balance sheets or consolidated statements of operations and comprehensive income (loss) of the Company. The Company is not involved in any material litigation nor, to management’s knowledge, is any material litigation currently threatened against the Company or its properties or subsidiaries.
The Company is not aware of any environmental liability with respect to the properties it owns that could have a material adverse effect on the Company’s business, assets, or results of operations. However, there can be no assurance that such a material environmental liability does not exist. The existence of any such material environmental liability could have an adverse effect on the Company’s results of operations and cash flows.
An entity purchased by the OP as a part of the Formation Transaction, the Huber Transaction Sub, LLC (“Huber”), had potential liability exposure to a legacy environmental issue related to a 1988 petroleum release from an underground storage tank located on a property subsequently not purchased by Huber. The owner of the property prior to Huber has assumed the defense of alleged environmental violations and is proceeding with the required regulatory investigation and remediation of the underground storage tank release clean up. Huber received an indemnification, and the Company and the OP in turn received an indemnification, which is evidenced by approximately $2.6 million of proceeds in an escrow account (the “Indemnification Escrow”) that is for the benefit of the Company and the OP in the event the prior owner fails to perform their obligations in regard to any required remediation of the issue. On January 27, 2021, the Indemnification Escrow was released.
F-58
VINEBROOK HOMES TRUST, INC.
NOTES TO CONSOLIDATED UNAUDITED FINANCIAL STATEMENTS
13. Subsequent Events
The Company evaluated subsequent events to determine if any significant events occurred subsequent to the balance sheet date that would have a material impact on these consolidated financial statements and determined the following events were material:
Acquisitions
Subsequent to March 31, 2021, the Company acquired 828 homes for a purchase price of approximately $82.5 million.
Warehouse Facility
On May 7, 2021, the OP drew $35.0 million under the Warehouse Facility. The proceeds were mostly used to fund acquisitions and other capital expenditures. As of June 9, 2021, the outstanding balance of the Warehouse Facility was $135.0 million.
Second Quarter 2021 Dividends
On April 14, 2021, the Company declared a dividend of $0.1767 per Share for shareholders of record as of April 15, 2021. On May 15, 2021, the Company declared a dividend of $0.1767 per Share for shareholders of record as of May 17, 2021.
Equity Issuance Pursuant to the Continuous Offering
The table below illustrates monthly equity issuances subsequent to March 31, 2021 (dollars in thousands):
Date of Close | Shares issued | Cash proceeds | ||||||
April 1, 2021 | 443,574 | $ | 16,270 | |||||
April 9, 2021 | 18,797 | 692 | ||||||
April 16, 2021 | 21,975 | 809 | ||||||
April 23, 2021 | 31,164 | 1,147 | ||||||
April 30, 2021 | 80,042 | 2,947 | ||||||
May 3, 2021 | 532,431 | 19,604 | ||||||
May 14, 2021 | 147,667 | 5,588 | ||||||
May 21, 2021 | 101,625 | 3,846 | ||||||
May 28, 2021 | 46,442 | 1,758 | ||||||
June 1, 2021 | 679,416 | 25,715 | ||||||
|
|
|
| |||||
| 2,103,133 | $ | 78,376 | ||||||
|
|
|
| |||||
NAV Determination
Pursuant to the terms of the Continuous Offering and calculated in accordance with the Valuation Methodology, on May 14, 2021, the pricing committee of the Board increased the NAV per Share to $37.85 as of April 30, 2021. In accordance with provisions in the OP’s partnership agreement, the value of the OP Units per OP Unit was also increased to $37.85. Shares and OP Units issued under the respective DRIPs will be issued at a 3% discount to the NAV in effect.
F-59