EQUINOX GOLD CORP.
Technical Report on the Fazenda Gold Mine
Bahia State, Brazil

| QUALIFIED PERSONS: | EFFECTIVE DATE: June 30, 2024 |
| | |
| David Warren, P.Eng. | REPORT DATE: January 31, 2025 |
| | |
| Dominic Claridge, P.Eng. | |
| | |
| João Paulo Santos, MAusIMM | |
| | |
| Gabriel Freire, FAusIMM | |
| | |
| Benoit Poupeau, FAusIMM | |
| | |
| Mo Molavi, P.Eng. | |
| | |
| Paul Sterling, P.Eng. | |
| | |
| Kelly Boychuk, P.Eng. | |
FORWARD-LOOKING INFORMATION
This Technical Report contains certain forward-looking information and forward-looking statements within the meaning of applicable securities legislation and may include future-oriented financial information (collectively, forward-looking Information). Forward-looking information in this Technical Report includes, but is not limited to, statements regarding: plans and expectations for the Fazenda Gold Mine, including estimated mine life, mining costs and production rates; estimates of Mineral Resources and the conversation of Mineral Resources to Mineral Reserves; projected metallurgical recoveries; and anticipated environmental liabilities. Forward-looking information can be identified by the use of words such as "will," "expect," "achieve," "strategy," "increase," "plan," "potential," "intend," "anticipate," "expect," "estimate," "target," "objective" and similar expressions and phrases or statements that certain actions, events or results "may," "could," or "should" occur, or the negative connotation of such terms. The material factors or assumptions regarding forward-looking information contained in this Technical Report are discussed in this report, where applicable.
Forward-looking information is subject to known and unknown risks, uncertainties and other factors that may cause actual results and developments to differ materially from those expressed or implied by such forward-looking information. Relevant risks and other factors include, without limitation: fluctuations in gold prices; fluctuations in prices for energy inputs, labour, materials, supplies and services; fluctuations in currency markets; operational risks and hazards inherent with the business of mining (including environmental accidents and hazards, industrial accidents, geotechnical incidents, equipment breakdown, unusual or unexpected geological or structural formations, cave-ins, flooding, fire and severe weather); inadequate insurance, or inability to obtain insurance to cover these risks and hazards; employee relations; relationships with, and claims by, local communities and indigenous populations; the ability to maintain existing or obtain all necessary permits, licenses and regulatory approvals in a timely manner or at all; changes in laws, regulations and government practices, including environmental and export and import laws and regulations; legal restrictions relating to mining; and risks relating to expropriation; increased competition in the mining industry. Forward-looking information is designed to help readers understand views as of that time with respect to future events and speaks only as of the date it is made.
All the forward-looking information in this Technical Report is qualified by these cautionary statements. Except as required by applicable law, Equinox Gold Corp. and the Qualified Persons who authored this Technical Report assume no obligation to update publicly or otherwise revise any forward-looking information in this Technical Report, whether because of new information or future events or otherwise.
Cautionary Note to U.S. Readers Concerning Estimates of Mineral Reserves and Mineral Resources
Disclosure regarding Equinox Gold Corp.'s mineral properties, including with respect to Mineral Reserve and Mineral Resource estimates included in this Technical Report, was prepared in accordance with National Instrument 43-101-Standards of Disclosure for Mineral Projects (NI 43-101). NI 43-101 is a rule developed by the Canadian Securities Administrators that establishes standards for all public disclosure an issuer makes of scientific and technical information concerning mineral projects. NI 43-101 differs significantly from the disclosure requirements of the Securities and Exchange Commission (SEC) generally applicable to U.S. companies. Accordingly, information contained in this Technical Report is not comparable to similar information made public by U.S. companies reporting pursuant to SEC disclosure requirements.
Contents
| 1 SUMMARY | 1-1 |
| | |
| 1.1 Executive Summary | 1-1 |
| 1.2 Technical Summary | 1-3 |
| 1.2.1 Property Description and Location | 1-3 |
| 1.2.2 Land Tenure | 1-3 |
| 1.2.3 History | 1-4 |
| 1.2.4 Geology and Mineralization | 1-4 |
| 1.2.5 Exploration Status | 1-4 |
| 1.2.6 Metallurgical Testing | 1-5 |
| 1.2.7 Mineral Resources | 1-5 |
| 1.2.8 Mineral Reserves | 1-6 |
| 1.2.9 Mining Methods | 1-6 |
| 1.2.10 Life-of-Mine Production Schedule | 1-7 |
| 1.2.11 Mineral Processing | 1-8 |
| 1.2.12 Project Infrastructure | 1-8 |
| 1.2.13 Market Studies | 1-9 |
| 1.2.14 Environmental, Permitting, and Social Considerations | 1-9 |
| 1.2.15 Capital and Operating Cost Estimates | 1-9 |
| 1.3 Economic Analysis | 1-10 |
| 1.4 Conclusions | 1-10 |
| 1.4.1 Geology and Mineral Resources | 1-10 |
| 1.4.2 Mining and Mineral Reserves | 1-11 |
| 1.4.3 Metallurgical Testing and Processing | 1-11 |
| 1.4.4 Infrastructure | 1-12 |
| 1.4.5 Environmental, Social, and Permitting Considerations | 1-12 |
| 1.4.6 Capital and Operating Costs | 1-12 |
| 1.5 Recommendations | 1-12 |
| 1.5.1 Geology and Mineral Resources | 1-12 |
| 1.5.2 Mining and Mineral Reserves | 1-13 |
| 1.5.3 Metallurgical Testing and Processing | 1-14 |
| 1.5.4 Infrastructure | 1-14 |
| 1.5.5 Environmental, Social, and Permitting Considerations | 1-15 |
| 1.5.6 Capital and Operating Costs | 1-15 |
| | |
| 2 INTRODUCTION | 2-1 |
| 2.1 Sources of Information | 2-1 |
| 2.2 Responsibility | 2-1 |
| 2.3 Qualified Persons Site Visits | 2-2 |
| 2.4 Abbreviations, Acronyms, and Units of Measure | 2-2 |
| | |
| 3 RELIANCE ON OTHER EXPERTS | 3-1 |
| | |
| 4 PROPERTY DESCRIPTION AND LOCATION | 4-1 |
| 4.1 Property Location | 4-1 |
| 4.2 Mineral and Surface Rights in Brazil | 4-1 |
| 4.3 Land Tenure | 4-3 |
| 4.4 Royalties | 4-6 |
| | |
| 5 ACCESSIBILITY, CLIMATE, LOCAL RESOURCES, INFRASTRUCTURE, AND PHYSIOGRAPHY | 5-1 |
| 5.1 Accessibility | 5-1 |
| 5.2 Climate | 5-1 |
| 5.3 Local Resources | 5-1 |
| 5.4 Infrastructure | 5-1 |
| 5.5 Physiography | 5-2 |
| | |
| 6 HISTORY | 6-1 |
| 6.1 Prior Ownership and Exploration History | 6-1 |
| 6.2 Historical Resource Estimates | 6-1 |
| 6.3 Past Production | 6-2 |
| | |
| 7 GEOLOGICAL SETTING AND MINERALIZATION | 7-1 |
| 7.1 Regional Geology | 7-1 |
| 7.2 Local Geology | 7-3 |
| 7.2.1 Lithology | 7-3 |
| 7.2.2 Riacho do Inco Unit | 7-4 |
| 7.2.3 Fazenda Brasileiro Unit | 7-4 |
| 7.2.4 Canto Unit | 7-5 |
| 7.2.5 Structure | 7-9 |
| 7.2.6 D1 Deformation Event | 7-9 |
| 7.2.7 D2 Deformation Event | 7-9 |
| 7.2.8 D3 Deformation Event | 7-10 |
| 7.2.9 D4 Deformation Event | 7-10 |
| 7.3 Mineralization | 7-10 |
| | |
| 8 DEPOSIT TYPES | 8-1 |
| | |
| 9 EXPLORATION | 9-1 |
| 9.1 Exploration Potential | 9-1 |
| | |
| 10 DRILLING | 10-1 |
| 10.1 Sampling Method and Approach | 10-3 |
| | |
| 11 SAMPLE PREPARATION, ANALYSES, AND SECURITY | 11-1 |
| 11.1 Sample Preparation and Analytical Procedures | 11-1 |
| 11.1.1 Fazenda Laboratory | 11-1 |
| 11.1.2 ALS Laboratory | 11-1 |
| 11.1.3 SGS Laboratory | 11-2 |
| 11.2 Quality Assurance and Quality Control | 11-2 |
| 11.2.1 QA/QC Sample Insert Definitions | 11-2 |
| 11.2.2 QA/QC Sample Insertion Frequency | 11-3 |
| 11.2.3 QA/QC Summary Results | 11-4 |
| 11.2.4 Fazenda QC Review and Laboratory Audit | 11-13 |
| 11.3 Sample Security | 11-14 |
| 11.4 Author Opinion | 11-14 |
| | |
| 12 DATA VERIFICATION | 12-1 |
| 12.1 Site Visit and Core Inspection | 12-1 |
| 12.2 Database Validation | 12-1 |
| 12.3 Independent Verification and Check Assays | 12-2 |
| 12.4 Conclusion | 12-2 |
| | |
| 13 MINERAL PROCESSING AND METALLURGICAL TESTING | 13-1 |
| 13.1 Metallurgical Testing | 13-1 |
| 13.1.1 Exploration Technological Characterization Testwork (SGS GEOSOL, 2024) | 13-1 |
| 13.2 Operational Improvements | 13-2 |
| 13.2.1 Process Changes for Different Plant Feed Ore | 13-2 |
| 13.2.2 Daily Geometallurgical Testwork | 13-2 |
| 13.2.3 Kerosene Addition to the Leaching Circuit (August 2019 Onwards) | 13-2 |
| 13.2.4 Lead Nitrate Addition to the Leaching Circuit (May 2020 Onwards) | 13-3 |
| 13.2.5 Optimized Leaching Particle Size (December 2020 Onwards) | 13-3 |
| 13.2.6 pH Optimization | 13-4 |
| 13.2.7 Elution Recovery Optimization | 13-4 |
| 13.2.8 Installation of Regeneration Kiln | 13-4 |
| 13.3 Necessary Structural Refurbishment | 13-4 |
| 13.4 Next Steps | 13-4 |
| | |
| 14 MINERAL RESOURCE ESTIMATES | 14-1 |
| 14.1 Summary of Mineral Resource Estimate | 14-1 |
| 14.2 Method and Data Sources | 14-4 |
| 14.2.1 Software | 14-4 |
| 14.2.2 Drill-Hole Databases | 14-4 |
| 14.2.3 Data Handling | 14-4 |
| 14.2.4 Editing of the Block Models | 14-5 |
| 14.3 Mineral Reserves | 14-7 |
| 14.4 Limitations on Data | 14-7 |
| 14.5 Independent Data Verification | 14-8 |
| 14.6 Geological Models | 14-8 |
| 14.6.1 Regolith Models | 14-8 |
| 14.6.2 Geological Models | 14-8 |
| 14.6.3 PPQ, F&G, CLX, Canto, and PR Deposits | 14-9 |
| 14.6.4 Barrocas and Barrocas SW Deposits | 14-10 |
| 14.6.5 Lagoa do Gato | 14-11 |
| 14.6.6 Buffer Zone | 14-11 |
| 14.7 Exploratory Data Analysis | 14-12 |
| 14.7.1 Grade Capping | 14-12 |
| 14.7.2 Compositing | 14-15 |
| 14.7.3 Declustering | 14-15 |
| 14.7.4 Boundary Analysis | 14-15 |
| 14.8 Variography | 14-16 |
| 14.9 Estimation | 14-17 |
| 14.10 Validation of Gold Grade Estimates | 14-19 |
| 14.10.1 Visual Inspections | 14-20 |
| 14.10.2 Swath Plots | 14-31 |
| 14.10.3 Comparison of Estimation Techniques | 14-31 |
| 14.10.4 Reconciliation to Past Production from CLX Open Pit and Underground | 14-32 |
| 14.11 Mineral Resource Classification | 14-32 |
| 14.12 Reasonable Prospects of Eventual Economic Extraction | 14-32 |
| 14.13 Mineral Resource Statement | 14-34 |
| 14.13.1 Qualified Person's Statement on Adequacy of Data | 14-36 |
| 14.14 Comparison with the Previous Mineral Resource Estimate | 14-37 |
| | |
| 15 MINERAL RESERVE ESTIMATES | 15-1 |
| 15.1 Mineral Reserves | 15-1 |
| 15.2 Open Pit | 15-4 |
| 15.2.1 Resource Block Models | 15-4 |
| 15.2.2 Dilution and Extraction | 15-4 |
| 15.2.3 Cut-Off Grade | 15-5 |
| 15.2.4 Open Pit Optimization Inputs | 15-7 |
| 15.2.5 Open Pit Optimization Results | 15-9 |
| 15.2.6 Open Pit Design | 15-17 |
| 15.2.7 Open Pit Mineral Reserve Comparison 2020 vs. 2024 | 15-17 |
| 15.3 Underground | 15-17 |
| 15.3.1 Mineral Resource Block Models | 15-17 |
| 15.3.2 Dilution and Extraction | 15-18 |
| 15.3.3 Cut-Off Grade | 15-18 |
| 15.3.4 Underground Mineral Reserves Estimate | 15-19 |
| 15.3.5 Underground Mineral Reserve Comparison 2020 vs. 2024 | 15-21 |
| | |
| 16 MINING METHODS | 16-1 |
| 16.1 Open Pit Mining | 16-1 |
| 16.1.1 Open Pit Design | 16-1 |
| 16.1.2 Waste Dump and Stockpile Design | 16-8 |
| 16.1.3 Mine Equipment | 16-12 |
| 16.1.4 Geotechnical Evaluation | 16-12 |
| 16.1.5 Labour Force | 16-18 |
| 16.2 Underground Mining | 16-20 |
| 16.2.1 Geotechnical Considerations | 16-24 |
| 16.2.2 Mining Method and Mine Design Considerations | 16-26 |
| 16.2.3 Mine Design | 16-31 |
| 16.2.4 Underground Access | 16-32 |
| 16.2.5 Material Handling | 16-32 |
| 16.2.6 Personnel | 16-32 |
| 16.2.7 Underground Mining Fleet | 16-32 |
| 16.2.8 Underground Mine Equipment | 16-32 |
| 16.2.9 Ventilation | 16-33 |
| 16.2.10 Ground Support | 16-34 |
| 16.2.11 Mine Dewatering | 16-34 |
| 16.2.12 Explosives Magazine | 16-35 |
| 16.2.13 Development Sections Drill and Blast | 16-36 |
| 16.2.14 Other Services | 16-36 |
| 16.3 Production Schedule | 16-37 |
| | |
| 17 RECOVERY METHODS | 17-1 |
| 17.1 Process Description | 17-1 |
| 17.1.1 Historical Production (1984 to 2024) | 17-3 |
| 17.1.2 Ore Sources and Characteristics | 17-3 |
| 17.1.3 Ore Delivery from the Mine | 17-4 |
| 17.1.4 Crushing | 17-4 |
| 17.1.5 Grinding | 17-4 |
| 17.1.6 Gravity Concentration | 17-5 |
| 17.1.7 Intensive Leaching-Acacia | 17-5 |
| 17.1.8 Thickening | 17-5 |
| 17.1.9 Carbon-in-Leaching | 17-5 |
| 17.1.10 Elution | 17-6 |
| 17.1.11 Carbon Regeneration | 17-7 |
| 17.1.12 Electrowinning and Doré Smelting | 17-7 |
| 17.1.13 Tailings | 17-7 |
| 17.2 Production Historical Data | 17-7 |
| | |
| 18 PROJECT INFRASTRUCTURE | 18-1 |
| 18.1 Access Roads | 18-1 |
| 18.2 Electrical Power Supply | 18-5 |
| 18.3 Water Supply | 18-5 |
| 18.4 Site Facilities | 18-5 |
| 18.5 Workforce Accommodation | 18-6 |
| 18.6 Security | 18-6 |
| 18.7 Occupational Health and Safety | 18-6 |
| 18.7.1 Hygiene, Medicine, and Occupational Safety | 18-6 |
| 18.7.2 Emergency Response Plan | 18-7 |
| 18.7.3 Emergency Organization | 18-7 |
| 18.7.4 Procedures and Responsibilities | 18-7 |
| 18.7.5 Additional Provisions | 18-7 |
| 18.8 Tailings Storage Facilities | 18-7 |
| 18.9 Explosives Magazine Facilities | 18-8 |
| | |
| 19 MARKET STUDIES AND CONTRACTS | 19-1 |
| 19.1 Markets | 19-1 |
| 19.2 Contracts | 19-1 |
| 19.2.1 Contractor Mining Agreement | 19-1 |
| 19.2.2 Electrical Energy Supply Agreement | 19-1 |
| 19.2.3 Diesel Fuel Supply Agreement | 19-1 |
| 19.2.4 Explosives Supply Agreement | 19-1 |
| 19.2.5 Cyanide Supply Agreement | 19-1 |
| | |
| 20 ENVIRONMENTAL STUDIES, PERMITTING, AND SOCIAL OR COMMUNITY IMPACT | 20-1 |
| 20.1 Environmental Licensing | 20-1 |
| 20.1.1 Land Use | 20-1 |
| 20.1.2 Environmental Impacts and Mitigation Actions | 20-4 |
| 20.2 Socioeconomics | 20-4 |
| 20.3 Acid Rock Drainage Evaluation | 20-5 |
| 20.4 Mine Closure Requirements | 20-6 |
| | |
| 21 CAPITAL AND OPERATING COSTS | 21-1 |
| 21.1 Capital Costs | 21-1 |
| 21.2 Operating Costs | 21-2 |
| 21.3 Workforce | 21-3 |
| 22 ECONOMIC ANALYSIS | 22-1 |
| | |
| 23 ADJACENT PROPERTIES | 23-1 |
| | |
| 24 OTHER RELEVANT DATA AND INFORMATION | 24-1 |
| | |
| 25 INTERPRETATION AND CONCLUSIONS | 25-1 |
| 25.1 Geology and Mineral Resources | 25-1 |
| 25.2 Mining and Mineral Reserves | 25-1 |
| 25.3 Metallurgical Testing and Processing | 25-2 |
| 25.4 Infrastructure | 25-3 |
| 25.5 Environmental, Social, and Permitting Considerations | 25-3 |
| 25.6 Capital and Operating Costs | 25-4 |
| | |
| 26 RECOMMENDATIONS | 26-1 |
| 26.1 Mineral Resource Estimate | 26-1 |
| 26.2 Mining and Mineral Reserves | 26-1 |
| 26.3 Metallurgical Testwork and Mineral Processing | 26-2 |
| 26.4 Infrastructure | 26-3 |
| 26.5 Environmental, Social, and Permitting Considerations | 26-3 |
| 26.6 Capital and Operating Costs | 26-3 |
| | |
| 27 REFERENCES | 27-1 |
| | |
| 28 DATE AND SIGNATURE PAGE | 28-1 |
| | |
| 29 CERTIFICATE OF QUALIFIED PERSON | 29-1 |
| 29.1 David Warren, P.Eng. | 29-1 |
| 29.2 Dominic Claridge, FAusIMM | 29-2 |
| 29.3 João Paulo Santos, FAusIMM | 29-3 |
| 29.4 Gabriel Freire, FAusIMM | 29-4 |
| 29.5 Benoit Poupeau, FAusIMM | 29-5 |
| 29.6 Mo Molavi, P.Eng. | 29-6 |
| 29.7 Paul Sterling, P.Eng. | 29-7 |
| 29.8 Kelly Boychuk, P.Eng. | 29-8 |
Tables
| Table 1-1: Mineral Resources Summary (Exclusive of Reserves) as at June 30, 2024 | 1-2 |
| Table 1-2: Mineral Reserves Summary as at June 30, 2024 | 1-3 |
| Table 1-3: Life-of-Mine Production Schedule (2024 to 2033) | 1-7 |
| Table 1-4: Life-of-Mine Projected Capital Costs | 1-9 |
| Table 1-5: Life-of-Mine Projected Unit Operating Costs | 1-10 |
| Table 2-1: Qualified Persons and their Respective Sections of Responsibility | 2-2 |
| Table 4-1: Summary of Fazenda Tenure Held by FBDM | 4-5 |
| Table 6-1: Exploration History | 6-1 |
| Table 6-2: Fazenda Historical Production 1984 to 2023 | 6-3 |
| Table 7-1: Fazenda Mine Area Stratigraphic Column (2023) | 7-6 |
| Table 10-1: Drilling Completed as of December 31, 2023 | 10-1 |
| Table 11-1: Fazenda Drilling QA/QC Protocols | 11-3 |
| Table 11-2: QA/QC Sample Insertion Summary | 11-4 |
| Table 11-3: List of Certified Reference Materials used and Performance Summary | 11-5 |
| Table 13-1: Summary of Test Results-GRG Knelson + CIL Kinects (24 h) | 13-1 |
| Table 14-1: Codes and Descriptions for Each Deposit | 14-1 |
| Table 14-2: Summary of Databases Informing Mineral Resource Estimates | 14-4 |
| Table 14-3: Summary of Topographic Surveys Used for the Mineral Resource Estimate | 14-5 |
| Table 14-4: Summary of Wireframes and Codes Used for the Mineral Resource Estimate | 14-5 |
| Table 14-5: Summary of Average Density Values for Fazenda Deposits | 14-7 |
| Table 14-6: Summary of Capping Values for Gold by Deposit | 14-13 |
| Table 14-7: Summary of Capping Values for Sulphur by Deposit | 14-14 |
| Table 14-8: Summary of Capping Values for Total Organic Carbon by Deposit | 14-14 |
| Table 14-9: Composite Summary | 14-15 |
| Table 14-10: Variogram Model Parameters by Deposit | 14-16 |
| Table 14-11: Open Pit Block and Underground Model Definitions by Deposit | 14-17 |
| Table 14-12: Search Interpolation Parameters by Deposit | 14-18 |
| Table 14-13: Estimator Comparison Results-CLX Underground | 14-32 |
| Table 14-14: Open Pit Optimization Parameters for Mineral Resources | 14-33 |
| Table 14-15: Underground Mining Stope Optimization Parameters for Mineral Resources | 14-33 |
| Table 14-16: Mineral Resources Inclusive of Mineral Reserves for the Fazenda Mine | 14-34 |
| Table 14-17: Mineral Resources Exclusive of Mineral Reserves for the Fazenda Mine | 14-35 |
| Table 14-18: Comparison between 2021 MRE and 2024 MRE, including Mineral Reserves | 14-37 |
| Table 15-1: Mineral Reserve Estimate Summary by Mine Area-June 30, 2024 | 15-1 |
| Table 15-2: Mineral Reserve Estimate Summary-June 30, 2024 | 15-3 |
| Table 15-3: Open Pit Dilution and Losses by Mining Area | 15-5 |
| Table 15-4: Open Pit Cut-Off Grade Estimation for CLX, Canto 1, and Canto 2 | 15-6 |
| Table 15-5: Open Pit Cut-Off Grade Estimation for LG, PPQ, and G | 15-6 |
| Table 15-6: Open Pit Optimization Inputs for CLX, Canto 1, and Canto 2 | 15-7 |
| Table 15-7: Open Pit Optimization Inputs for LG, PPQ, and G | 15-8 |
| Table 15-8: Geotechnical Inputs by Pit | 15-9 |
| Table 15-9: Open Pit Optimization Results-CLX | 15-11 |
| Table 15-10: Open Pit Optimization Results-Canto 1 | 15-12 |
| Table 15-11: Open Pit Optimization Results-Canto 2 | 15-13 |
| Table 15-12: Open Pit Optimization Results-LG | 15-14 |
| Table 15-13: Open Pit Optimization Results-G | 15-15 |
| Table 15-14: Open Pit Optimization Results-PPQ | 15-16 |
| Table 15-15: Open Pit Mineral Reserve Comparison 2020 vs. 2024 | 15-17 |
| Table 15-16: Underground Dilution and Losses by Mining Area | 15-18 |
| Table 15-17: Underground Cut-Off Grade and Supporting Parameters | 15-18 |
| Table 15-18: Underground Mineral Reserve Comparison 2020 vs. 2024 | 15-21 |
| Table 16-1: Open Pit Design Parameters | 16-1 |
| Table 16-2: Waste Dump and Stockpile Volumes and Design Parameters | 16-9 |
| Table 16-3: Current Mining Contractor Equipment Type and Size | 16-12 |
| Table 16-4: Summary of the Critical Stress Reduction Factors | 16-14 |
| Table 16-5: Current Mining Contractor Labour Force-Open Pit | 16-19 |
| Table 16-6: Summary of Underground Support | 16-25 |
| Table 16-7: Geotechnical Design Parameters | 16-26 |
| Table 16-8: Primary Production Equipment | 16-33 |
| Table 16-9: Fazenda Mine Production-2021 to 2023 | 16-37 |
| Table 16-10: Open Pit Mine Fleet Productivity Assumptions | 16-39 |
| Table 16-11: Underground Fleet Productivity Assumptions | 16-39 |
| Table 16-12: Life-of-Mine Production Schedule | 16-40 |
| Table 16-13: Life-of-Mine Ore Production by Area | 16-41 |
| Table 17-1: Historical Production Data 1984-2024 | 17-3 |
| Table 17-2: Processing Operating Parameters (January 2023 through June 2024) | 17-8 |
| Table 20-1: Environmental Permit Status | 20-2 |
| Table 20-2: Socioeconomic Impacts Associated with Mine Closure | 20-4 |
| Table 20-3: Estimated Mine Closure Costs | 20-6 |
| Table 21-1: Actual Sustaining Capital Costs-2021 to 2023 | 21-1 |
| Table 21-2: LOM Projected Capital Costs | 21-1 |
| Table 21-3: Actual Operating Costs-2021 to 2023 | 21-2 |
| Table 21-4: Actual Unit Operating Costs-2021 to 2023 | 21-2 |
| Table 21-5: LOM Projected Total Operating Costs | 21-3 |
| Table 21-6: LOM Projected Unit Operating Costs | 21-3 |
Figures
| Figure 1-1: Total Material Mined by Year (2024 to 2033) | 1-8 |
| Figure 4-1: Project Location | 4-2 |
| Figure 4-2: Land Tenure Status | 4-4 |
| Figure 7-1: Regional Geology | 7-2 |
| Figure 7-2: Weber Belt Surface Geology | 7-7 |
| Figure 7-3: Schematic Geologic Cross-Section | 7-8 |
| Figure 10-1: Drilling Plan View | 10-2 |
| Figure 11-1: Z-Score Charts of CRM Results | 11-6 |
| Figure 11-2: Blank Assay Results-Fazenda Lab | 11-7 |
| Figure 11-3: Blank Assay Results-SGS | 11-7 |
| Figure 11-4: Blank Assay Results-ALS | 11-8 |
| Figure 11-5: Scatterplot of Coarse Crush Duplicate Sample Results | 11-8 |
| Figure 11-6: Scatterplot of DDH Twin Sample Results | 11-9 |
| Figure 11-7: Scatterplot of the Same Data as Figure 11-6 with Results ≤2 ppm Au | 11-9 |
| Figure 11-8: Scatterplot of Lab Check Results (Fazenda Lab and ALS) | 11-10 |
| Figure 11-9: Scatterplot of Lab Check Results (Fazenda Lab and SGS) | 11-11 |
| Figure 11-10: Scatterplot of the Same Data as Figure 11-5b with Results ≤10 ppm Au | 11-11 |
| Figure 11-11 :Scatterplot of Lab Check Results with ALS as the Primary Lab and SGS as the Check Lab | 11-12 |
| Figure 11-12: Scatterplot of Lab Check Results with SGS as the Primary Lab and ALS as the Check Lab | 11-12 |
| Figure 11-13: Scatterplot of RC Field Duplicate Sample Results | 11-13 |
| Figure 12-1: Drill Holes Assayed between 2021 and 2023-Current Drilling Definition (in Light Grey), Resource Stopes (in Green) at $2,000/oz | 12-3 |
| Figure 13-1: Influence of Grind Size (P80) on Gold Recovery | 13-3 |
| Figure 14-1: Fazenda Deposit Block Model Locations | 14-2 |
| Figure 14-2: Deposits in the CL Block Model Area | 14-3 |
| Figure 14-3: Geological Model of PPQ, F&G, CLX, and PR Deposits | 14-9 |
| Figure 14-4: CLX and Canto Mineralized Zones, Showing the Location of the PPQ, F&G, CLX, and PR Deposits | 14-10 |
| Figure 14-5: Mineralized Zones in Barrocas SW and Barrocas Deposits | 14-10 |
| Figure 14-6: Mineralized Zones-Lagoa Do Gato | 14-11 |
| Figure 14-7: Buffer Zone Around the Mineralized Zones-CLX Deposit (Section: X=91,992 m) | 14-12 |
| Figure 14-8: Cross-Section of the Lago Do Gato (LG) Block Model | 14-21 |
| Figure 14-9: Cross-Section of the Barrocas (BR) Block Model | 14-22 |
| Figure 14-10: Cross-Section of the Barrocas SW (BS) Block Model | 14-23 |
| Figure 14-11: Cross-Section of the Papagaio & Raminhos (PR) Block Model | 14-24 |
| Figure 14-12: Cross-Section of the Pau-a-Pique (PP) Open Pit Block Model | 14-25 |
| Figure 14-13: Cross-Section of the Pau-a-Pique (PP) Underground Block Model | 14-26 |
| Figure 14-14: Cross-Section of the F&G (FG) Open pit Block Model | 14-27 |
| Figure 14-15: Cross-Section of the F&G (FG) Underground Block Model | 14-28 |
| Figure 14-16: Cross-Section of the CLX (CL) Open Pit Block Model | 14-29 |
| Figure 14-17: Cross-Section of the CLX (CL) Underground Block Model | 14-30 |
| Figure 14-18: An Example of Swath Plots-CLX Underground Model | 14-31 |
| Figure 14-19: Waterfall Showing an Increase of Ounces Between 2021 MRE and 2024 MRE (Measured and Indicated) | 14-38 |
| Figure 14-20: Comparison of Mineralized Wireframes used for the 2021 and 2024 Technical Reports | 14-39 |
| Figure 15-1: Cross-Section View of Regularized Open Pit Block Model Showing Dilution and Losses | 15-5 |
| Figure 15-2: Isometric View of Plant and Tailings Surface Infrastructure Constraint on CLX Pit Optimization | 15-9 |
| Figure 15-3: CLX Open Pit Optimization Results | 15-10 |
| Figure 15-4: Canto 1 Open Pit Optimization Results | 15-11 |
| Figure 15-5: Canto 2 Open Pit Optimization Results | 15-12 |
| Figure 15-6: LG Open Pit Optimization Results | 15-13 |
| Figure 15-7: G Open Pit Optimization Results | 15-14 |
| Figure 15-8: PPQ Open Pit Optimization Results | 15-16 |
| Figure 15-9: Underground Mineral Reserves for Main, Edeep, and Canto 1 | 15-19 |
| Figure 15-10: Underground Mineral Reserves for F and G | 15-20 |
| Figure 15-11: Underground Mineral Reserves for Canto 2 | 15-20 |
| Figure 16-1: CLX and Canto 1 Pit Designs | 16-2 |
| Figure 16-2: CLX Pit Intermediate Phase Designs | 16-3 |
| Figure 16-3: CLX Open Pit-Underground Interaction | 16-4 |
| Figure 16-4: Canto 2 Pit Design | 16-5 |
| Figure 16-5: LG Pit Designs | 16-6 |
| Figure 16-6: PPQ Pit Designs | 16-7 |
| Figure 16-7: G Pit Designs | 16-8 |
| Figure 16-8: Waste Dump Locations (Main Project Area) | 16-10 |
| Figure 16-9: Waste Dump Locations (LG) | 16-11 |
| Figure 16-10: CLX Pit and Critical Geotechnical Sections | 16-14 |
| Figure 16-11: CLX Pit and Local Infrastructure | 16-15 |
| Figure 16-12: TSF 4 and CLX Pit Section | 16-15 |
| Figure 16-13: Primary Crusher and CLX Pit Section | 16-16 |
| Figure 16-14: CLX Pit and TSF 4 Numerical Analysis with SSR Method | 16-17 |
| Figure 16-15: CLX Pit and Primary Crusher Numerical Analysis with SSR Method | 16-18 |
| Figure 16-16: Fazenda Deswik SO Blocks at UG Main, EDEEP and Canto 1 Mining Areas Prior to Depletion and Manual Analysis | 16-21 |
| Figure 16-17: Fazenda Deswik SO Blocks at F and G Mining Areas Prior to Depletion and Manual Analysis | 16-22 |
| Figure 16-18: Fazenda Deswik SO Blocks at Canto 2 Prior to Depletion and Manual Analysis | 16-23 |
| Figure 16-19: Reserve Blocks for UG Main, Canto 1 and EDEEP Following Depletion Analysis | 16-28 |
| Figure 16-20: Reserve Blocks for F and G Following Depletion Analysis | 16-29 |
| Figure 16-21: Reserve Blocks for Canto 2 Following Depletion Analysis | 16-30 |
| Figure 16-22: Fazenda FG Underground Development and Stope Mining | 16-31 |
| Figure 16-23: Underground Operators Shift Roster | 16-32 |
| Figure 16-24: Underground Ventilation Circuit | 16-34 |
| Figure 16-25: Underground Dewatering Flowchart | 16-35 |
| Figure 16-26: Underground Explosives Magazine | 16-36 |
| Figure 16-27: Typical Development Headings Drill and Blast Pattern | 16-36 |
| Figure 16-28: Total Material Mined by Year | 16-41 |
| Figure 17-1: Process Flowsheet | 17-2 |
| Figure 17-2: Mill Production, Budgeted vs. Actual, in 2023 through June 2024 | 17-9 |
| Figure 17-3: Gold Recovery and Gold Grade in 2023 through June 2024 | 17-9 |
| Figure 17-4: Reagent and Grinding Media Consumptions in 2023 through June 2024 | 17-10 |
| Figure 17-5: Process Plant Power Consumption from January 2023 through June 2024 | 17-11 |
| Figure 17-6: Process Plant Unit Operating Costs from January 2023 through June 2024 | 17-11 |
| Figure 18-1: Site Plan and Infrastructure | 18-2 |
| Figure 18-2: Site Photo of Facilities Layout and Infrastructure | 18-3 |
| Figure 18-3: Site Access Roads-Proposed Future Alignments | 18-4 |
| Figure 18-4: Monthly Power Consumption | 18-5 |
| Figure 20-1: Legal Reserve Areas | 20-3 |
| Figure 20-2: Acid-Base Accounting Characterization | 20-5 |
Abbreviations, Acronyms, and Units of Measure
Abbreviations and Acronyms
| 3-D | Three-dimensional |
| AA | Atomic absorption |
| Ag | Silver |
| ALS | ALS Global |
| AMC | AMC Mining Consultants Canada Ltd. |
| ANM | Agência Nacional de Mineração (Brazilian National Mining Agency) |
| ARD | Acid Rock Drainage |
| Au | Gold |
| BH | Blasthole |
| BR | Barrocas |
| BRSW | Barrocas SW |
| BWi | Ball Mill Work Index |
| CAX | Sericite-chlorite-carbonate schist (also chlorite-carbonate schist) |
| CCTV | Closed circuit television |
| CCX | Carbonate-chlorite schist |
| CIL | Carbon-in-leach |
| CIM | Canadian Institute of Mining, Metallurgy & Petroleum |
| CIM Definitions Standards | CIM Definition Standards for Mineral Resources and Mineral Reserves |
| CIP | Carbon-in-pulp |
| CLX | chlorite-magnetite schist (also magnetic quartz-chlorite schist; also quartz-chlorite schist) |
| CLX1 | Uppermost chlorite-magnetite schist |
| CLX2 | structurally lower chlorite-magnetite schist |
| COG | Cut-off grade |
| CRM | Certified reference material |
| CVRD | Companhia Vale do Rio Doce |
| D1 | First deformation event |
| D2 | Second deformation event |
| D3 | Third deformation event |
| D4 | Fourth deformation event |
| DD | Diamond drilling |
| DDH | Diamond drill-hole |
| DTEM | Digital terrain elevation model |
| EL | Exploration License |
| Equinox Gold | Equinox Gold Corp. |
| F2 | large-scale, asymmetric, tight to open folds |
| FBDM | Fazenda Brasileiro Desenvolvimento Mineral |
| FVU | Felsic volcanic unit |
| FW | Footwall |
| GPS | Global Positioning System |
| GRG | Gravity-recoverable gold |
| GRX | Graphitic schist hanging-wall marker horizon |
| HDPE | High-density polyethylene |
| HW | Hanging wall |
| IDW2 | Inverse distance weighting to the second power |
| IDW3 | Inverse distance weighting to the third power |
| Inco | Riacho do Inco unit |
| INEMA | Institute of Environment and Water Resources |
| LG | Lagoa do Gato |
| LHD | Load-haul-dump |
| LIMS | Laboratory information management system |
| LOM | Life-of-Mine |
| LUC | Local uniform conditioning |
| LVA | Locally varying anisotropy |
| M1 | Early oceanic sea-floor hydrothermal alteration metamorphism event |
| M2 | Regional metamorphism event |
| M3 | Local metamorphism event |
| MCP | Mine Closure Plan |
| Mine Lab(oratory) | Fazenda mine in-house laboratory |
| MRE | Mineral Resource estimate |
| MVU | mafic volcanic unit |
| NI 43-101 | National Instrument 43-101-Canadian Standards of Disclosure for Mineral Projects |
| NN | Nearest neighbour |
| OCH | Outcrop channel |
| OK | Ordinary kriging |
| PPE | Personal protective equipment |
| PR | Papagaio & Raminhos |
| PVC | Polyvinyl chloride |
| QA/QC | Quality assurance/quality control |
| QP | Qualified Person |
| RAB | Rotary air blast |
| RC | Reverse circulation |
| RF | Revenue factor |
| RIGB | Rio Itapicuru Greenstone Belt |
| RPA | Roscoe Postle Associates Inc. |
| S | Sulfur |
| SD | Standard deviation |
| SG | Specific gravity |
| SRF | Stress reduction factor |
| SSR | Shear-strength reduction |
| Technical Report | Technical Report on the Fazenda Gold Mine, Bahia State, Brazil |
| TOC | Total organic carbon |
| TR | Trench |
| TSF | Tailings storage facility |
| UTM | Universal Transverse Mercator |
| WGM | Watts, Griffis and McQuat Limited |
| Wi | Hardness |
| Yamana | Yamana Gold Inc. |
Units of Measure
| ɸ | Friction angle |
| µm | Micron (10−6 metre) |
| ′ | Minute |
| ″ | Inch |
| $ | U.S. dollar |
| $ M | Million dollars |
| $/oz | Dollars per troy ounce |
| $/t | Dollars per tonne |
| $/10 m | Dollars per 10 metres |
| ° | Degree |
| °C | Degree Celsius |
| cm | Centimetre |
| g | Gram |
| g/cm3 | Gram per cubic centimetre |
| g/L | Grams per litre |
| g/t Au | Grams of gold per tonne |
| g/t | Grams per tonne |
| Ga | Billion years |
| h | Hour |
| h/d | Hours per day |
| ha | Hectare |
| k | Thousand (kilo) |
| kg | Kilogram |
| kg/h | Kilograms per hour |
| kg/t | Kilograms per tonne |
| km | Kilometre |
| km2 | Square kilometre |
| koz | Thousands of troy ounces |
| kPa | Kilopascal |
| kt | Kilotonne |
| kt/a | Kilotonnes per annum |
| kV | Kilovolts |
| kW | Kilowatt |
| kWh | Kilowatt hour |
| kWh/t | Kilowatt hour per tonne |
| L | Litre |
| m | Metre |
| m2 | Square metre |
| m3 | Cubic metre |
| m³/h | Cubic metre per hour |
| masl | Metres above sea level |
| mg/L | Milligram per litre |
| mm | Millimetre |
| M | Million |
| Mm3 | Million cubic metres |
| Moz | Million troy ounces |
| Mt | Million tonnes |
| Mt/a | Million tonnes per annum |
| MW | Megawatt |
| oz | Troy ounce (31.10348 grams) |
| P80 | 80% passing |
| ppm | Parts per million |
| t | Tonne (1,000 kg) (metric ton) |
| t/d | Tonnes per day |
| t/m3 | Tonnes per cubic metre |
| ton | Short ton |
| V | Volt |
| w:o | Ratio of waste to ore |
1 Summary
1.1 Executive Summary
Equinox Gold Corp. (Equinox Gold) has prepared this report titled Technical Report on the Fazenda Gold Mine, Bahia State, Brazil (Technical Report), dated January 31, 2025, and with an effective date of June 30, 2024, under the guidance and supervision of several internal and independent Qualified Persons (QP).
The Technical Report provides an update on the Mineral Resources (reported both inclusive and exclusive of Mineral Reserves) and Mineral Reserves as of June 30, 2024. This Technical Report conforms to National Instrument 43‐101 Standards of Disclosure for Mineral Projects (NI 43-101), effective June 09, 2023. QPs carried out site visits between October 2023 and April 2024.
This Technical Report also supersedes the previous technical report that Equinox Gold prepared, titled NI 43-101 Technical Report on the Fazenda Brasileiro Gold Mine, Bahia State, Brazil, with an effective date of December 31, 2020, and a published date of October 22, 2021.
The Fazenda mine is operated by Fazenda Brasileiro Desenvolvimento Mineral (FBDM), a wholly owned Brazilian-domiciled subsidiary of Equinox Gold. Equinox Gold is a publicly listed Canadian mining company with significant gold-producing, development, and exploration-stage properties in Canada, U.S.A., Brazil, and Mexico. Gold production in 2023 totalled approximately 564 koz.
Fazenda has been operational since 1984, starting as a heap leaching operation. Carbon-in-pulp (CIP) milling facilities were added in 1988, and the process plant was subsequently converted to use pre-aeration with carbon-in-leach (CIL). Historically, it was primarily an underground mine with supplementary small open pits; however, it is now transitioning to primarily open pit operations following successful shallow exploration and a higher gold price environment. For the future mine life, 82% of the total 13.1 Mt of ore will be sourced from open pits, and 18% from underground over 9.5 years (mid-2024 to 2033). In 2023, 1.43 Mt of ore were processed, producing 66 koz Au, with 61% of the ore sourced from the underground mine and 39% from open pits.
The plant is scheduled to process approximately 3,945 t/d (1.44 Mt/a) and will recover 683 koz Au over the remaining mine life, which extends to 2033. Fazenda's gold production from 1984 through the end of June 2024 has totalled 3.58 Moz Au.
All currency in this report is given in United States dollars ($) unless otherwise noted.
Table 1-1 summarizes the Mineral Resource estimate exclusive of Mineral Reserves, as of June 20, 2024. Table 1-2 summarizes the updated Mineral Reserve estimates as of June 30, 2024. The Mineral Resource and Mineral Reserve estimates conform to Canadian Institute of Mining, Metallurgy and Petroleum (CIM) CIM Definition Standards for Mineral Resources & Mineral Reserves (CIM Definition Standards), dated May 10, 2014 (CIM, 2014).
Table 1-1: Mineral Resources Summary (Exclusive of Reserves) as at June 30, 2024
Category | Tonnage
(kt) | Gold Grade
(g/t) | Contained Gold
(koz) |
Measured | | | |
Underground | 12,646 | 2.49 | 1,014 |
Open Pit | 5,772 | 1.80 | 334 |
Total Measured | 18,418 | 2.28 | 1,348 |
Indicated | | | |
Underground | 2,302 | 2.01 | 149 |
Open Pit | 698 | 1.23 | 28 |
Total Indicated | 3,000 | 1.83 | 176 |
Measured + Indicated | | | |
Underground | 14,948 | 2.42 | 1,163 |
Open Pit | 6,470 | 1.74 | 361 |
Total Measured + Indicated | 21,418 | 2.21 | 1,524 |
Inferred | | | |
Inferred-Underground | 2,088 | 2.29 | 154 |
Inferred-Open Pit | 2,593 | 1.35 | 113 |
Total Inferred | 4,681 | 1.77 | 266 |
Notes:
- The CIM Definition Standards (CIM, 2014) were followed for the classification of Mineral Resources.
- Mineral Resources are reported exclusive of Mineral Reserves.
- Open pit Mineral Resources are reported within conceptual pit shells at a cut-off grade of 0.5 g/t Au, based on a gold price of $1,700/oz, mining cost of $1.79/t to $2.70/t, processing cost of $14.60/t, G&A cost of $4.69/t, recovery of 75% to 90%, and an exchange rate of R$4.80:US$1.00
- Underground Mineral Resources are reported within conceptual stope shapes based on a gold price of $2,000/oz, mining cost of $36.20/t, processing cost of $14.60/t, G&A cost of $4.69/t, recovery of 86% to 90%, a cut-off grade of 1.0 g/t Au, and an exchange rate of R$4.80:US$1.00.
- Mineral Resources that are not Mineral Reserves do not have demonstrated economic viability.
- Benoit Poupeau, FAusIMM (CP), a QP as defined by NI 43-101, who is independent of Equinox Gold, prepared this Mineral Resource estimate (MRE).
- Totals may not sum precisely due to rounding.
Table 1-2: Mineral Reserves Summary as at June 30, 2024
Category | Tonnage
(kt) | Gold Grade
(g/t) | Contained Gold
(koz) |
Proven | | | |
Underground | 1,935 | 1.99 | 124 |
Open Pit | 10,358 | 1.79 | 595 |
Subtotal Proven | 12,293 | 1.82 | 719 |
Probable | | | |
Underground | 462 | 1.90 | 28 |
Open Pit | 386 | 1.27 | 16 |
Stockpile | 20 | 0.99 | 1 |
Subtotal Probable | 868 | 1.60 | 45 |
Total Proven & Probable | 13,161 | 1.80 | 763 |
Notes:
- CIM Definition Standards (CIM, 2014) were followed for Mineral Reserves.
- Mineral Reserves are reported at a cut-off grade of 1.36 g/t Au for underground stoping and 0.43 g/t Au for underground development, at a cut-off grade between 0.54 and 0.66 g/t Au for open pits.
- Mineral Reserves are estimated using an average long-term gold price of $1,500/oz for open pits and $1,800/oz for underground, and an exchange rate of R$4.80:US$1.00.
- A minimum mining width of 2.0 m was used for underground Mineral Reserves.
- The QP for open pit is David Warren, P.Eng., of AMC Mining Consultants (Canada) Ltd.
- The QP for underground is Dominic Claridge, FAusIMM, of AMC Consultants (UK) Limited.
- Mineral Reserves include dilution and mining recovery.
- Numbers may not sum precisely due to rounding.
1.2 Technical Summary
1.2.1 Property Description and Location
The Fazenda mine is located in the eastern part of Bahia State in east-central Brazil, approximately 180 km northwest of the state capital, Salvador. Topographic coordinates of the mine area are 11° 27' south latitude and 39° 05' west longitude.
1.2.2 Land Tenure
The Fazenda property covers an area totalling approximately 58,651 ha, including:
28 Exploration Licenses (EL) covering approximately 33,522 ha
15 Exploration Applications covering approximately 12,909 ha
8 mining permits covering approximately 7,732 ha
3 mining permits in application covering approximately 2,556 ha
- 1 EL with a Final Positive Exploration Report submitted, covering approximately 1,932 ha.
Equinox Gold is not aware of any environmental liabilities on the property. Equinox Gold has all required permits to conduct the proposed work on the property. Equinox Gold is not aware of any other significant factors or risks that may affect access, title, or the right or ability to perform the work program on the property.
1.2.3 History
Companhia Vale do Rio Doce's (CVRD) exploration division, DOCEGEO, has explored the Weber Belt since the late 1960s. Mineralization at Fazenda was discovered in the late 1970s, and the mine entered production in 1984. Leagold Mining Corporation (Leagold) operated the mine from 2018 to 2020, and on March 10, 2020, Equinox Gold acquired Leagold.
1.2.4 Geology and Mineralization
Fazenda is within the Rio Itapicuru Greenstone Belt (RIGB), a 100 km-long, 60 km-wide, north-south-trending volcano-sedimentary belt within the São Francisco Craton. The structural history of the area is complex, with at least three phases of ductile and ductile-brittle deformation followed by late brittle faulting.
Fazenda is an epigenetic, structurally controlled, and hydrothermally altered Precambrian quartz-vein-hosted lode-gold deposit that has been subjected to greenschist facies metamorphism. The main gold mineralization is sulphide-bearing quartz veining associated with multiple deformation events. These vein systems vary in true width from 1.5 to 40 m, and horizontal s widths vary from 3 to 40 m. The regional strike of mineralization is north-south, while locally the veins are generally arcuate in an east-west trend, and south dipping at 40° to 70°, with a shallow-to-moderate east plunge. However, the plunge is quite variable, with some zones plunging westerly.
1.2.5 Exploration Status
The district has seen approximately 60 years of geological exploration along the mine trend, which has consistently identified new underground and open pit Mineral Resources. Exploration potential still exists along strike, at depth, and between historical open pits and stopes. Recent exploration at Fazenda has been focused on diamond and RC drilling to replace depleted Mineral Reserves and addition of new Mineral Resources. Drilling was carried out from both the surface and underground and targeted areas between historical open pits, along strike of high-grade underground ore shoots, extending open mineralization, and infill drilling of areas with lower gold grades that are now potentially economic.
Several regional concessions have seen early- to intermediate-stage exploration activity including geologic mapping, outcrop sampling, geophysical surveys, geochemical surveys, and exploration drilling. Both regional and near-mine exploration, including all the above-mentioned activities, continues.
The Fazenda geologic model and mineralization wireframes were rebuilt between 2022 and 2024 with a focus on geological continuity, shear zone architecture, and exploration potential. These new models have allowed for better exploration drill targeting outside of known Mineral Resources.
An aggressive exploration program for 2025, based on the revised geological model and new resource estimate, has been approved that includes a high-resolution aeromagnetic survey, geologic mapping, soil sampling at several prospects, and approximately 65,000 m of near-mine diamond drilling from both underground and surface.
1.2.6 Metallurgical Testing
Gold-bearing ore is processed at an average grind size of P80 75 µm and at an average recovery rate of 90.6%. A series of process improvements was implemented in 2019, 2020, and 2021 to improve the gold extraction efficiency as the feed grade decreased each year.
To reduce gold-recovery losses with more carbonaceous ore in the blend, kerosene is now used, which enables a gold-recovery increase of approximately 2%. A pre-aeration tank was transformed into a pre-lime tank and, at a dosage of pH 10.2, increased the effectiveness of lead nitrate addition. This change resulted in an approximately 10% reduction in cyanide consumption and an approximately 2% increase in gold recovery.
A grind size of P80 75 µm is targeted to enhance gold recovery; hence, the following process modifications have been carried out:
- Reducing the hydrocyclones apexes from 110 to 100 mm.
FBDM investigated an increase of the dissolved oxygen in the pre-aeration tanks to improve gold dissolution and thereby increase gold recovery. The testwork entailed dosing hydrogen peroxide in the pre-aeration tanks at 200 g/t.
The current first step of the elution process is desorption; the second step is acid washing, which removes base metals and scaling compounds such as calcium carbonate and sodium silicate from the carbon after elution. The current elution recovery is approximately 90%.
A new 500 kg/h capacity regeneration kiln was installed in 2021 to more efficiently regenerate the carbon.
Structural refurbishments within the processing area continue to replace support pillars and platforms for the leaching tanks; tanks and channels within the leaching area; and support beams for the desorption and mill buildings.
1.2.7 Mineral Resources
Dr. Benoit Poupeau (independent QP) prepared the Mineral Resource estimate as of June 30, 2024. The QP constructed a three-dimensional (3-D) block model to estimate the Mineral Resources, incorporating data from recent grade-control and exploration drilling Equinox Gold has conducted since 2021. The QP has compiled the Mineral Resources using the topographic surface as of June 30, 2024, summarized in Table 1-1. The Mineral Resources reported in Table 1-1 are exclusive of the Mineral Reserves.
The Mineral Resources for the open pits are reported within conceptual pit shells at a cut-off grade of 0.5 g/t Au and a gold price of $1,700/oz; the Mineral Resources for the underground are reported within conceptual stope shapes based on a cut-off grade of 1.0 g/t Au and a gold price of $2,000/oz.
1.2.8 Mineral Reserves
AMC prepared the Mineral Reserve estimate as of June 30, 2024.
The Mineral Reserves summarized in Table 1-2 were estimated using a cut-off grade of 0.54 to 0.66 g/t Au for open pit operations, with a gold price of $1,500/oz. The underground operations used a cut-off grade of 1.36 g/t Au, with a gold price of $1,800/oz Au.
After considering and applying appropriate modifying factors, the QPs believe that the resulting Measured and Indicated Mineral Resources within the final pits and underground stope designs may be classified as Proven and Probable Mineral Reserves, respectively; moreover, the QPs are not aware of any mining, metallurgical, infrastructure, permitting, or other relevant factors that could materially affect the Mineral Reserve estimate.
1.2.9 Mining Methods
Open Pit
Over the course of the operation's history, several shallow open pits have been excavated to extract near-surface portions of the mineral deposits. Currently, several small open pits are in operation in the CLX area, and initial work has commenced on expanding shallow open pits to include excavating the remaining underground crown pillars. CLX Central, East and West will be the major pits, with Canto 1, Canto 2, PPQ, LG and G to be minor pits. Contractors mine the open pits.
The small pits are being developed using air-track drills and backhoe excavators for mining, and highway-type trucks for haulage to the mill. From 2027 onwards, a larger contractor fleet consisting of 100-ton trucks (i.e., CAT 777 or similar) and appropriately matched loading units (i.e., Hitachi EX2500 for waste and Komatsu EX1250 for ore, or similar) is anticipated for the larger CLX pit. The CLX ultimate pit and phases have been designed appropriately to accommodate the larger fleet size.
Underground
The underground mining method is longhole open stoping (LHOS) from levels accessed via decline development in the mineralization footwall. The stoping areas are accessed via 5 m-wide by 5.5 m-high main haulage ramps developed at a 15% gradient, which lead to primary development crosscuts that are 4.5 m wide by 4.9 m high, and secondary development drifts. Levels are spaced at 20 m vertical intervals. Mined out stopes are not backfilled.
Active underground mining is being undertaken within areas known as Canto 1, UG Main, F, and G. A new underground mine, Canto 2, is planned to be developed following completion of the Canto 2 open pit. Mining operations have a planned dilution of between 15% and 20%. Planned mining recovery is estimated to be 90% for all areas.
From each level, access drifts are developed into the stoping areas. Blastholes are fan-drilled into the mineralization to further define its boundaries and facilitate design of ultimate blast patterns. After blasting, remote-controlled, 10-tonne-capacity load-haul-dump (LHD) machines are used to load and haul the ore from the stoping areas to 38-tonne-capacity haulage trucks at loading points in the sublevels.
Waste rock is generally hauled to surface and deposited in waste rock storage areas but is dumped into empty voids where practicable.
1.2.10 Life-of-Mine Production Schedule
The life-of-mine (LOM) production schedule is presented in Table 1-3. Total ore and waste mined from open pit and underground is shown in Figure 1-1. The plan is reasonable and achievable based on actual recent performance and LOM provisions for equipment and personnel.
Table 1-3: Life-of-Mine Production Schedule (2024 to 2033)
| Unit | Total | Years |
2024 | 2025 | 2026 | 2027 | 2028 | 2029 | 2030 | 2031 | 2032 | 2033 |
Ore Mined | | | | | | | | | | | | |
Underground | kt | 2,396 | 396 | 772 | 653 | 445 | 131 | - | - | - | - | - |
g/t Au | 1.97 | 2.02 | 2.01 | 2.00 | 1.89 | 1.73 | - | - | - | - | - |
koz Au | 152 | 26 | 50 | 42 | 27 | 7 | - | - | - | - | - |
Open Pit | kt | 10,744 | 132 | 759 | 825 | 995 | 1,297 | 1,440 | 1,442 | 1,314 | 1,427 | 1,113 |
g/t Au | 1.77 | 1.94 | 1.26 | 1.94 | 2.00 | 1.95 | 1.78 | 1.88 | 1.78 | 1.73 | 1.43 |
koz Au | 611 | 8 | 31 | 52 | 64 | 81 | 82 | 87 | 75 | 79 | 51 |
Total Ore Mined | kt | 13,140 | 527 | 1,531 | 1,478 | 1,440 | 1,428 | 1,440 | 1,442 | 1,314 | 1,427 | 1,113 |
g/t Au | 1.81 | 2.00 | 1.64 | 1.97 | 1.97 | 1.93 | 1.78 | 1.88 | 1.78 | 1.73 | 1.43 |
koz Au | 763 | 34 | 81 | 93 | 91 | 88 | 82 | 87 | 75 | 79 | 51 |
Stockpile Balance | | | | | | | | | | | | |
Stockpile | kt | 20 | 20 | 111 | 148 | 148 | 136 | 136 | 138 | 13 | - | - |
g/t Au | 0.99 | 0.87 | 0.84 | 0.84 | 0.80 | 0.80 | 0.80 | 0.80 | 0.00 | - | - |
Processed | | | | | | | | | | | | |
Total Ore Processed | kt | 13,160 | 527 | 1,440 | 1,440 | 1,440 | 1,440 | 1,440 | 1,440 | 1,440 | 1,440 | 1,113 |
g/t Au | 1.80 | 2.00 | 1.69 | 2.00 | 1.97 | 1.92 | 1.78 | 1.88 | 1.69 | 1.72 | 1.43 |
Recovery | % | 90 | 90 | 89 | 90 | 89 | 90 | 90 | 89 | 90 | 89 | 86 |
Recovered Gold | koz Au | 683 | 31 | 70 | 83 | 82 | 80 | 74 | 78 | 70 | 71 | 44 |
Waste Mined | | | | | | | | | | | | |
Underground | kt | 455 | 84 | 170 | 63 | 130 | 8 | - | - | - | - | - |
Open Pit | kt | 93,880 | 3,784 | 8,751 | 13,113 | 15,005 | 14,222 | 13,560 | 13,058 | 7,018 | 4,024 | 1,346 |
Total Waste Mined | kt | 94,335 | 3,868 | 8,921 | 13,175 | 15,134 | 14,230 | 13,560 | 13,058 | 7,018 | 4,024 | 1,346 |
Open Pit Strip Ratio | | 8.7 | 28.8 | 11.5 | 15.9 | 15.1 | 11.0 | 9.4 | 9.1 | 5.3 | 2.8 | 1.2 |
Note: Totals may not sum precisely due to rounding.
Year 2024 is for six months only, from July 1.

Figure 1-1: Total Material Mined by Year (2024 to 2033)
1.2.11 Mineral Processing
The plant is scheduled to process approximately 3,945 t/d (1.44 Mt/a). The overall process flowsheet consists of:
Three-stage crushing circuit
Two grinding ball mills, closed circuit with hydrocyclones
Thickener to produce a leach feed of 50% solids
Cyanide leaching circuit
Zadra pressure-stripping of the carbon
Electrowinning of the carbon eluent
- Casting of gold doré bars in an induction furnace.
1.2.12 Project Infrastructure
All necessary infrastructure for the operation is in place, which includes, but is not limited to: a 470 m vertical shaft; a series of underground ramps; underground ventilation and dewatering facilities; explosives magazines; power supply system; CIL milling and processing facility; associated process equipment from a previous heap leach operation; geomembrane-lined tailings storage facilities (TSF); waste rock storage facilities; warehouse; maintenance shops; drill core logging, splitting, and storage facilities; assay laboratory; cafeteria; helipad for emergency use and shipment of gold doré bars; office complexes; water supply system; and a fuel station.
1.2.13 Market Studies
The principal commodity the Fazenda mine produces is gold, which is freely traded, at prices that are widely known, so that prospect for sale of any production is virtually assured.
1.2.14 Environmental, Permitting, and Social Considerations
All required environmental licences and permits to conduct the proposed work on the property are in good standing or are in the process of being renewed. As of the date of this Technical Report, Equinox Gold has advised that all licences and permits are in good standing.
FBDM has developed a comprehensive environmental policy that has been developed in line with the Mine Closure Plan (MCP), as required by the Brazilian National Mining Agency (Agência Nacional de Mineração [ANM]). The environmental authorities in Brazil use the MCP as a commitment to complete the rehabilitation required for mine closure. The guidelines primarily involve revegetating the areas with native species; covering the pits or converting the pits to store water; along with stabilizing and rehabilitating waste dumps and TSFs. The estimated mine closure cost is $19.60 million.
1.2.15 Capital and Operating Cost Estimates
The LOM plan capital cost estimate includes sustaining capital cost, non-sustaining capital cost, and closure and reclamation cost. The capital cost of these activities is estimated to total $199 million as shown in Table 1-4.
Table 1-4: Life-of-Mine Projected Capital Costs
Description | 2024
($ M) | 2025
($ M) | 2026
($ M) | 2027
($ M) | 2028 & Beyond
($ M) | Total
($ M) |
Sustaining Capital | | | | | | |
Buildings & Infrastructure | 0.566 | 1.834 | 0.901 | 0.819 | 1.730 | 5.849 |
Hardware, Software & Automation | 0.073 | 0.780 | 0.278 | 0.160 | 0.000 | 1.291 |
Capitalized Underground + Open Pit | 9.691 | 19.228 | 12.696 | 16.389 | 2.495 | 60.499 |
Underground Mine Development | 2.635 | 7.895 | 0.397 | 1.383 | 0.298 | 12.609 |
Open Pit Mine Development | 7.056 | 11.332 | 12.299 | 15.005 | 2.197 | 47.890 |
Land Acquisition | - | 0.720 | - | - | - | 0.720 |
Machinery & Equipment | 3.968 | 8.116 | 8.254 | 6.061 | 2.944 | 29.342 |
Furniture & Fixture | 0.023 | 0.096 | 0.062 | 0.048 | 0.041 | 0.268 |
Tailings Dam Sustaining | - | - | 7.023 | - | 8.037 | 15.060 |
Subtotal Sustaining | 14.321 | 30.773 | 29.213 | 23.476 | 15.247 | 113.029 |
Non-Sustaining | | | | | | |
Underground Mine Development | 0.837 | 0.650 | 2.269 | 4.425 | 0.080 | 8.261 |
Capacity Increases | - | - | 0.889 | 0.889 | - | 1.777 |
Exploration | 2.288 | 4.919 | 4.919 | 4.919 | - | 17.047 |
Subtotal Non-Sustaining | 3.125 | 5.569 | 8.077 | 10.233 | 0.080 | 27.085 |
Closure & Reclamation | 0.346 | 1.912 | 0.083 | 0.232 | 16.568 | 19.141 |
Contingency | 4.448 | 9.563 | 9.343 | 8.485 | 7.974 | 39.814 |
Total | 22.240 | 47.817 | 46.717 | 42.426 | 39.868 | 199.068 |
Notes: Totals may not sum precisely due to rounding.
2024 represents only 6 months (July to December).
Projected unit operating costs for the envisaged mill feed are shown in Table 1-5. The LOM plan's estimated unit operating cost averages $55.15/t milled. Operating cost estimates are based on planned operating metrics and recent actual results.
Table 1-5: Life-of-Mine Projected Unit Operating Costs
Activity | 2024
($/t milled) | 2025
($/t milled) | 2026
($/t milled) | 2027
($/t milled) | 2028 & Beyond
($/t milled) | Average
($/t milled) |
Open Pit Mining | 12.21 | 13.21 | 22.42 | 19.13 | 20.13 | 19.20 |
Underground Mining | 39.79 | 28.41 | 24.03 | 16.38 | 0.83 | 9.65 |
Milling | 15.60 | 15.60 | 15.60 | 15.60 | 15.60 | 15.60 |
G&A | 10.70 | 10.70 | 10.70 | 10.70 | 10.70 | 10.70 |
Total | 78.30 | 67.92 | 72.75 | 61.81 | 47.26 | 55.15 |
Notes: Totals may not sum precisely due to rounding.
2024 represents only 6 months (July to December).
For both capital and operating LOM cost projections, the exchange rate used was R$5.00:$1.00 in 2024 and 2025, and R$4.80:$1.00 for the remaining mine life.
1.3 Economic Analysis
An economic analysis of the Fazenda LOM was performed using the estimates presented in this Technical Report and confirms that the outcome is a positive cash flow that supports the statement of Mineral Reserves.
1.4 Conclusions
Based on review of the available documentation, and from discussions with FBDM personnel, the QPs make the following conclusions.
1.4.1 Geology and Mineral Resources
Mineral Resources were prepared following CIM Definition Standards (2014).
The geological model generated by Equinox Gold geologists is reasonably well understood and is well supported by field observations in outcrops, mine faces, and drill intersections.
Interpretations of the geology and the 3-D wireframes of the estimation domains derived from these interpretations are reasonable.
Sampling and assaying have been carried out following standard industry quality assurance and quality control (QA/QC) practices.
The Mineral Resource model has been prepared using appropriate methodology and assumptions.
The block model has been validated using a reasonable level of rigour consistent with common industry practice.
- Mineral Resources for Fazenda comply with all disclosure requirements for Mineral Resources, as set out in NI 43-101.
1.4.2 Mining and Mineral Reserves
The mining methods used at Fazenda include both conventional open pit mining and underground mechanized open stoping. These methods are appropriate for the deposit.
Proven and Probable Mineral Reserves for the Fazenda mine as of June 30, 2024, total 13.2 Mt grading 1.80 g/t Au, containing 763 koz Au, including stockpile.
The mill feed is projected to be 18% from underground and 82% from open pits over the LOM.
Four separate declines originate on surface and access the various underground orebodies over a strike length of several kilometres.
The underground workings have good ground conditions that do not require any special support or backfill to ensure stable openings.
The LOM mining and processing schedules are based on Mineral Reserves only.
The main outcomes of the LOM schedule are presented below:
- Mining operations and processing LOM is 9.5 years.
- Underground operations finish in Year 2028. Open pit operations finish in Year 2033.
- Total annual ex-pit material movement peaks at approximately 16.5 Mt/a.
- Gold metal recovered averages approximately 75 koz/a over the LOM.
- Long-term stockpile capacity is 140 kt. The majority of this stockpile comprises the lowest-grade material and is fed to the process plant at the end of the mine life.
The Mineral Reserve estimates have been prepared using appropriate methodology and assumptions.
Mineral Reserves have been estimated in an appropriate manner using current mining software, procedures consistent with reasonable practice, and in accordance with CIM Definition Standards (CIM, 2014).
1.4.3 Metallurgical Testing and Processing
One of the main production constraints on Fazenda has been frequent power outages from the power grid supplier, COELBA; this circumstance has made it necessary to install diesel generator sets as a back-up to keep the agitators operating to avoid settling inside the leaching tanks.
Following a series of process improvements implemented in 2019, 2020, and 2021, Fazenda operates at P80 75 µm, at a feed rate of 168 t/h, recovering around 90% on average. The process had been improved every year to maximize the extraction and recovery efficiencies as the feed grade decreases each year with lower-grade open pit contribution increasing compared to the underground contribution.
The old CVRD heap leaching waste dumps show a potential for mining in the future, with an estimated 3 Mt of oxidized material at an estimated average grade of 0.6 g/t Au. Testwork was carried out, with gold recovery higher than 70%.
The plant facility requires refurbishments as well as normal maintenance. The structural steel in the grinding, leaching, and acid-wash circuits is showing significant deterioration due to corrosion. Maintenance work includes replacing the structural steel on a periodic basis, and over a span of several years during ongoing operations.
1.4.4 Infrastructure
Fazenda has been operational for 40 years and has all the necessary roads, power lines, access, and medical facilities; surrounding communities provide workers and services that one would expect to find for one of the state's major employers.
Water is supplied by a series of wellfields, with a total production capacity of 310 m3/h.
- The power requirement for Fazenda and site facilities is approximately 9.95 MW, which is supplied by the local grid. Emergency backup power has been established in the form of diesel generators.
1.4.5 Environmental, Social, and Permitting Considerations
Fazenda is an established gold mine with 40 years of history and in good corporate standing with the Brazilian and Bahia State government regulatory agencies.
A detailed acid rock-drainage (ARD) evaluation of the Fazenda tailings was carried out in 2012. The results showed that almost 100% of samples presented a neutralization potential two times higher than the acid-generating potential.
The arsenopyrite and pyrrhotite in the TSFs have low potential to become future ARD generators, as the proportion of carbonates is well in excess of the amount of the sulphides.
FBDM staff has developed an exemplary and credible program for social and community involvement in the area of the mine's operations, which should be maintained for the LOM.
- Fazenda has a comprehensive environmental policy developed according to the MCP, which the environmental authorities in Brazil use as a commitment to complete the rehabilitation required for mine closure.
1.4.6 Capital and Operating Costs
- The LOM plan capital cost estimate includes sustaining capital cost, non-sustaining capital cost, and closure and reclamation cost. The capital cost of these activities is estimated to total $199 million and is based on an exchange rate of R$5.00:USI$1.00 in 2024 and 2025, and R$4.80:US$1.00 for the remaining LOM.
- LOM plan operating costs are estimated to total $726 million, which averages $55.15/t milled.
1.5 Recommendations
The QPs make the following recommendations. The costs of all recommendations are anticipated to be covered as part of normal operating at Fazenda.
1.5.1 Geology and Mineral Resources
- Based on the distribution and grade of the Mineral Resources and on the geological continuity, significant exploration potential exists, which includes both open pit and underground near-mine conversion of Mineral Resources to Mineral Reserves, and addition of new Mineral Resources. Infill and step-out drill programs should be performed.
Refine the mineralized wireframes: enhance the quality of the mineralized wireframes for the Canto and CLX zones by subdividing these zones into stationary sub-domains. This approach will help to better capture the geological variability within each mineralized zone and improve the overall accuracy of the Mineral Resource model.
Improve wireframe definition: refine the wireframes by separating the roof and ceiling of each mineralized domain. This separation is essential for accurately computing a locally varying anisotropy field, allowing for a more precise modelling of the mineralization's spatial distribution and directional variability.
Enhance high-grade zone modelling: focus on improving the modelling of high-grade zones to better constrain the influence of high-grade assays. This will help to reduce smoothing effects and improve the definition of high-grade domains, ensuring that the Mineral Resource estimate better reflects the localized variations in grade.
Apply non-linear geostatistics: implement non-linear geostatistical methods such as local uniform conditioning (LUC) to capture fine-scale grade variability. LUC is particularly useful in regions with sparse drilling data, where traditional kriging methods may overlook local variability. This approach will provide more accurate Mineral Resource estimates, especially for smaller blocks, by conditioning the model to the local data distribution.
Implement QA/QC for density analyses: develop and implement a robust QA/QC process for density analysis to ensure the accuracy and consistency of density measurements used in the Mineral Resource estimation, which is critical for accurate tonnage calculations.
- Enhance QA/QC procedures for assay data: strengthen the current QA/QC procedures for internal and external laboratories involved in assay analysis. This will entail refining protocols for sample handling, analysis, and data validation, improving the reliability of assay results and minimizing analytical errors.
1.5.2 Mining and Mineral Reserves
FBDM should consider the opportunities for and potential impact of expanding the open pit extents. The Technical Report used a $1,500/oz gold price for open pit Mineral Reserves, while recent price levels have been much higher; the prevailing price at the time of this Technical Report is approximately $2,600/oz. The Whittle optimal pit analysis shows that the pit size is very susceptible to metal price. Current price levels would support pits more than twice as large as those used in the Technical Report. Additionally, placing infrastructure in the footprint of potential pit expansions should be carefully assessed.
FBDM should consider the potential impact of increasing the gold price used for Mineral Reserve calculation. Some Mineral Resources are prevented from converting to Mineral Reserves due to the distance from existing underground infrastructure and the associated cost of development. The Technical Report used a $1,800/oz gold price for underground Mineral Reserves, however; the prevailing price at the time of this Technical Report is approximately $2,600/oz. Increasing the gold price for Mineral Reserves may allow for conversion of Mineral Resources to Mineral Reserves.
Pit designs are preliminary, and further detailing is recommended to obtain optimal and most-practically viable designs.
Scheduling has been done to an annual level. Further refinements are recommended to obtain more comprehensive and accurate mine plans. Greater detail on equipment, labour requirements, and productivities would enhance accuracy and assurance on the study estimates.
The ongoing geotechnical program should be continued to collect additional data for pit-wall angle-stability analysis in open pits P&R, FW, and BRSW.
Further investigation should be undertaken on how to best deal with extensive underground voids: e.g., advance pilot drilling to delineate voids and potential backfill of areas. The assessment should also reference and review working procedures to minimize any operational or safety risk associated with interaction between open pit and underground workings.
A hydrogeological drilling program is recommended to confirm hydraulic properties and investigate drill targets, and to facilitate groundwater modelling to assess and optimize the location and timing of dewatering bores and horizontal drain holes.
Continue evaluating areas that were excluded from Mineral Reserves due to restricted access, proximity to infrastructure, and economic considerations.
- The suitability of applying paste backfill with cement to recover the pillars in high-grade zones should be investigated.
1.5.3 Metallurgical Testing and Processing
Undertake a long-term geometallurgical study to develop a process route to mitigate the impact of high-total organic carbon and high-sulphide ores in the plant recovery.
Carry out work-index testwork to arrive at necessary changes in the grinding circuit to maintain plant throughput and optimum gold recovery.
Analyze sulphur and arsenic chemistry of the leaching feed samples to better predict the necessary process changes for reagent additions.
Analyze the particle-size distribution of the blasted ore to improve the crushing-circuit product, which impacts the comminution-circuit final product reporting to the leaching circuit.
- Continue maintenance work at the plant, including refurbishing equipment and structures.
1.5.4 Infrastructure
In respect of providing services, ensure that interactions between the open pit and the continuation of the underground mining activities are effectively monitored and managed, as some of the portals will be taken out of service.
Regarding underground mine ventilation, re-evaluate the circuit and the Ventsim model to determine which entries will be lost when the pit breaks into underground openings, where stoppings need to be installed, and any other measures that may be required to maintain an appropriate and regulatory-compliant ventilation circuit underground, and avoid uncontrolled air gains or losses.
With CLX pits impacting Portals C and D, and breaking into the declines, stopes, and access drifts, changes to the mine's emergency warning system will be needed to mitigate the impact of any inrush of water during a major rainfall. Re-evaluating the current emergency procedures and introducing an advance-warning system to alert of any impending meteorological event in the mine vicinity.
A study is needed to determine requirements for installing water-control barriers with drainage holes to prevent a sudden inundation of the workings during a major rain event. A key aspect of the study would be determining which entries will be lost, and where stoppings need to be installed to offset risk of injury to workers and flooding of the underground openings.
Perform a trade-off study to compare the costs and scheduling of future expansions (dam raises) of TSF4 to store the LOM tailings as compared to building a new TSF downstream of TSF4.
1.5.5 Environmental, Social, and Permitting Considerations
- Complete studies and update the MCP for TSF1 and TSF2, as well as acid drainage studies, in accordance with the new LOM and to meet ANM requirements.
1.5.6 Capital and Operating Costs
- Collect quotes from multiple Brazilian mining contractors to firm up the mining cost estimates for the open pit operations in CLX, which anticipate using larger-scale equipment from 2027 onwards. Equinox Gold should acquire binding quotes from the primary mining contractor to achieve a higher level of estimation accuracy.
2 Introduction
In operation since 1984, the Fazenda mine has historically been an underground mine with supplementary small open pits and has been operated by Fazenda Desenvolvimento Mineral (FBDM). Fazenda started as a heap leaching operation, and carbon-in-pulp (CIP) milling facilities were added in 1988 to complement the heap leaching operation. The process plant was subsequently converted to use pre-aeration with carbon-in-leach (CIL), and heap leaching operations have since ceased. Open pit mining has increased in recent years as the underground operation has declined.
Equinox Gold Corp. (Equinox Gold) has prepared this Technical Report for the Fazenda mine, located in eastern Bahia State. The scope of this report, titled Technical Report on the Fazenda Gold Mine, Bahia State, Brazil (Technical Report), has an effective date of June 30, 2024, and includes updates to the geology, Mineral Resources, and Mineral Reserves. This Technical Report supersedes the previous Technical Report, titled NI 43-101 Technical Report on the Fazenda Gold Mine, with an effective date of December 31, 2020, and a published date of October 22, 2021.
Several engineering consulting firms have contributed to this Technical Report and project update as follows:
AMC Mining Consultants Canada Ltd. (AMC): estimate of Mineral Reserves; review and update of mining methods, economic analysis, operating costs pertaining to mining, processing, and G&A and review of capital costs.
SAFF Engenharia: validation of open pit geotechnical design parameters for the CLX open pit, including an assessment of the impact of the final open pit on the tailings storage facility (TSF) and processing plant.
- GEOTECH Consultoria e Projetos: review and analysis of underground geotechnical engineering and rock mechanics.
2.1 Sources of Information
This Technical Report is based on published and unpublished materials, and professional opinions formed by Equinox Gold and its consultants. Other sources of information include geological reports, drill-hole information, field observations, block models, geotechnical reports, mine plans, cost estimates, historical costs, productivity information, and economic models.
Any previous technical reports or literature used in the compilation of this Technical Report are referenced in the text, as necessary.
2.2 Responsibility
Table 2-1 provides a list of Qualified Persons (QP) and their responsibility for sections of this Technical Report. The QP certificates are included in Section 29.
Table 2-1: Qualified Persons and their Respective Sections of Responsibility
Qualified Persons | Company | Sections |
David Warren, P.Eng. | AMC Mining Consultants (Canada) Ltd. | 15.1, 15.2 (except 15.2.1), 16.1.1 to 16.1.3, 16.1.5, 16.3, 21 (open pit aspects), and corresponding portions of 1, 24, 25, 26, and 27 |
Dominic Claridge, FAusIMM. | AMC Mining Consultants (UK) Ltd. | 15.1, 15.3 (except 15.3.1), 16.2.2 to 16.2.8, 16.2.10, and corresponding portions of 1, 24, 25, 26, and 27 |
João Paulo Santos, MAusIMM | SAFF Engenharia | 16.1.4, and corresponding portions of 1, 24, 25, 26, and 27 |
Gabriel Freire, FAusIMM | GEOTECH Consultoria e Projetos | 16.2.1 and corresponding portions of 1, 24, 25, 26, and 27 |
Benoit Poupeau, FAusIMM | Trust Mineral Resources | 4, 5, 6, 7, 8, 9, 10, 11, 12, 14, 15.2.1, 15.3.1, 23, and corresponding portions of 1, 24, 25, 26, and 27 |
Mo Molavi, P.Eng. | AMC Mining Consultants (Canada) Ltd. | 16.2.9, 16.2.11 to 16.2.14 and 18 (except 18.8), and corresponding portions of 1, 24, 25, 26, and 27 |
Paul Sterling, P.Eng. | Equinox Gold Corp. | 13, 17, and corresponding portions of 1, 24, 25, 26, and 27 |
Kelly Boychuk, P.Eng. | Equinox Gold Corp. | 2, 3, 18.8, 19, 20, 21.2.6 to 21.2.8, 22, 23, 24, 25, 26, and 27, and corresponding portions of 1, 24, 25, 26, and 27 |
2.3 Qualified Persons Site Visits
The QPs visited the Fazenda mine on the following dates:
David Warren, P.Eng., AMC Consulting, April 24 to 26, 2024
Dominic Claridge, FAusIMM., AMC Consulting, April 24 to 26, 2024
João Paulo Santos, MAusIMM, SAFF Engenharia, April 24 to 26, 2024
Gabriel Freire, FAusIMM, GEOTECH Consultoria e Projetos, April 24 to 26, 2024
Benoit Poupeau, FAusIMM, Trust Mineral Resources, November 13 to 16, 2023
Paul Sterling, P.Eng., Equinox Gold Corp., April 24 to 26, 2024
- Kelly Boychuk, P.Eng., Equinox Gold Corp., October 4 to 5, 2023.
Mr. Mo Molavi, P.Eng., has not conducted a site visit and has relied on information provided by other QPs.
2.4 Abbreviations, Acronyms, and Units of Measure
Unless otherwise noted, the Technical Report uses the International System of Units (metric system). A list of the main symbols, units of measure, abbreviations, acronyms, and initialisms used in this Technical Report are presented below the table of contents. All currency in this Technical Report is expressed in United States dollars ($) or as otherwise stated.
3 Reliance on Other Experts
Unless otherwise stated, Equinox Gold and FBDM have provided the information and data contained in this Technical Report or used in its preparation. The QPs who prepared this Technical Report relied on this information. Alex Gallagher of HydroTechnica provided information for the hydrological review in Section 16.
The QPs have neither performed an independent verification of the land title and tenure information, as summarized in Section 4, nor have they verified the legality of any underlying agreements that may exist concerning the permits or other agreements between third parties, as summarized in Section 4. Instead, for land title and tenure information, and for the legality of any underlying agreements, the QPs have relied on information from Equinox Gold's legal department.
In addition, the QPs have not performed an independent verification of the permitting and environmental monitoring information and instead have relied on documents and information provided by Equinox Gold and FBDM.
4 Property Description and Location
4.1 Property Location
The Fazenda mine is located in the eastern part of Bahia State, approximately 180 km northwest of the state capital, Salvador (Figure 4-1). Geographic coordinates of the project area are 11° 27' south latitude and 39° 05' west longitude. Equinox Gold owns 100% of the mineral licenses through its indirect and wholly owned subsidiary FBDM.
4.2 Mineral and Surface Rights in Brazil
Brazilian mining rights are administered by the Brazilian National Mining Agency (Agência Nacional de Mineração [ANM]). In Brazil, all mineral ownership has standard protocols and applications for all aspects of exploration and mining of mineral deposits.
The exploration and exploitation of mineral deposits in Brazil are defined and regulated in the 1967 Mining Code (amended by government decree No. 9,406/2018) and overseen by ANM. Two main legal classifications under the Mining Code regulate exploration and mining: the Exploration License (EL or Autorização de Pesquisa) and the Mining Concession (Concessão de Lavra).
Applications for an EL are submitted to ANM and are available to any company incorporated under Brazilian law and which maintain a head office for administration purposes in Brazil. ELs are granted following submission of required documentation by a legally qualified geologist or mining engineer, including an exploration plan with an investment forecast. The EL holder pays an annual exploration fee per hectare to ANM based on the number of hectares held (as of December 31, 2023, the fee ranges from R$4.33/ha to R$6.48/ha), and reports of exploration work performed must be submitted when required according to law.
ELs are valid for a maximum of three years, with a maximum extension equal to the initial period. Extensions are issued at the discretion of ANM after the submission and approval of an exploration work report that outlines the plan to prove the existence of the mineral of interest and the economic feasibility of its extraction. The annual fee per hectare increases by 50% during the extension period. After submission of a final exploration report, feasibility study, and the evidence of funds or financing for the mine implementation, the EL holder may request a mining concession. These concessions are granted by the Brazilian Ministry of Mines and Energy, have no assigned expiry date (expiry upon Mineral Reserve depletion), and remain in good standing subject to submission of annual production reports and payments of royalties to the federal government.
For those areas where the maximum extension of an EL has been reached, and a positive final exploration report and mining concession request have not been submitted by the company holding the EL, the EL is terminated and the area in question is reassigned an "available" status. The EL is also terminated if the EL holder files a negative final exploration report.
Surface rights can be applied for if the land is not owned by a third party. By law, the owner of an EL is guaranteed access to perform exploration fieldwork provided adequate compensation is paid to third-party landowners. The EL holder accepts all environmental liabilities resulting from the exploration work.

Figure 4-1: Project Location
4.3 Land Tenure
The Fazenda mine property consists of 43 mineral licenses comprising 46,253.75 ha, including 8 active mining licenses (six of which are part of a mining group), 3 mining license applications, and 32 Els, as shown on Figure 4-2. Since the 2021 Technical Report, the land position has been decreased by 3,301.73 ha due to regulatory processes following negative final exploration reports. The mineral licenses FBDM holds are listed in Table 4-1.
The status of the ELs is indicated below:
Four are under Positive Final Exploration Report application (6,817.74 ha), pending ANM report approval
Thirteen are in EL Phase 2 (16,238.78 ha)
- Fifteen are in EL Phase 1 (12,908.73 ha).
There is one mining grouping process, No. 000.367/1997, which groups the following mining processes: 802.203/1975, 802.206/1975, 802.212/1975, 807.869/1975, 802.266/1978, and 870.226/1982. All technical obligations are conducted within the mining grouping process, except when specifically requested by ANM.
FBDM is not aware of any environmental liabilities on the property and has all required permits to conduct the proposed work on the property. The QP is not aware of any other significant factors and risks that may affect access, title, or the right or ability to perform the proposed work program on the property.
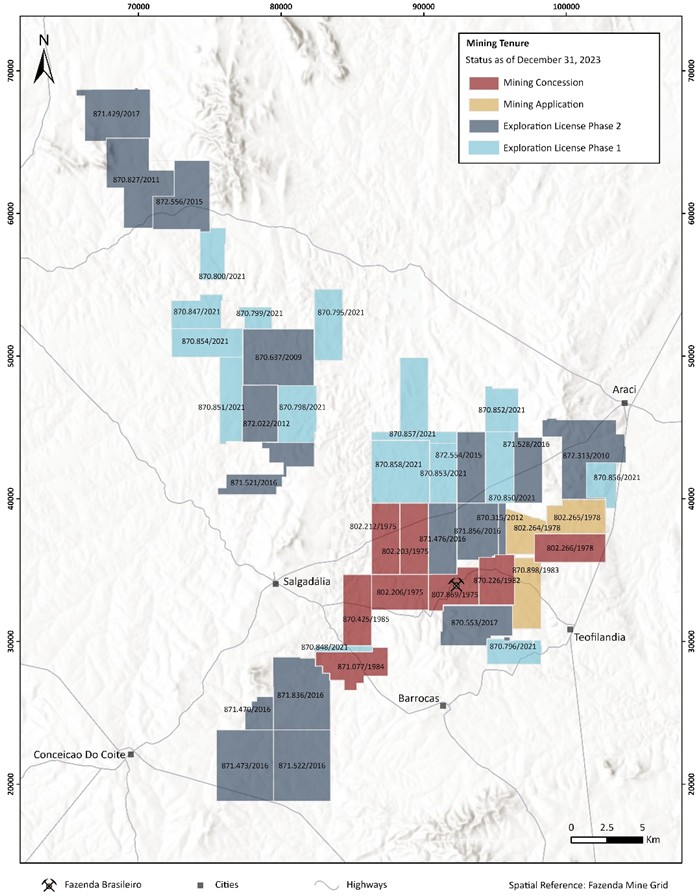
Figure 4-2: Land Tenure Status
Table 4-1: Summary of Fazenda Tenure Held by FBDM
Process | License
Number | Expiry Date | Status | Area
(ha) |
802.203/1975 | 20 | - | Mining Concession included in Mining Group | 1,000 |
802.206/1975 | 18 | - | Mining Concession included in Mining Group | 1,000 |
802.212/1975 | 218 | - | Mining Concession included in Mining Group | 1,000 |
807.869/1975 | 1293 | - | Mining Concession included in Mining Group | 876 |
802.266/1978 | 15 | - | Mining Concession included in Mining Group | 1,000 |
870.226/1982 | 288 | - | Mining Concession included in Mining Group | 856 |
871.077/1984 | 296 | - | Mining Concession | 1,000 |
870.425/1985 | 240 | - | Mining Concession | 1,000 |
802.264/1978 | N/A | - | Mining Application | 670 |
802.265/1978 | N/A | - | Mining Application | 950 |
870.898/1983 | N/A | - | Mining Application | 937 |
871.470/2016 | 11200 | 29-Sep-24 | Exploration License Phase 2 | 414 |
871.473/2016 | 11201 | 29-Sep-24 | Exploration License Phase 2 | 1,999 |
871.476/2016 | 11202 | 29-Sep-24 | Exploration License Phase 2 | 1,000 |
871.521/2016 | 11421 | 29-Sep-24 | Exploration License Phase 2 | 1,131 |
871.522/2016 | 11422 | 29-Sep-24 | Exploration License Phase 2 | 1,999 |
871.836/2016 | 2093 | 29-Sep-24 | Exploration License Phase 2 | 1,946 |
871.856/2016 | 2100 | 29-Sep-24 | Exploration License Phase 2 | 1,129 |
870.553/2017 | 5129 | 29-Sep-24 | Exploration License Phase 2 | 1,294 |
870.637/2009 | N/A | Pending ANM | Exploration License Phase 2 - Final Exploration Report Submitted | 1,974 |
872.313/2010 | N/A | Pending ANM | Exploration License Phase 2 - Final Exploration Report Submitted | 1,912 |
870.827/2011 | N/A | Pending ANM | Exploration License Phase 2 - Final Exploration Report Submitted | 1,932 |
872.022/2012 | N/A | Pending ANM | Exploration License Phase 2 - Final Exploration Report Submitted | 1,000 |
870.315/2012 | 8536 | 18-Sep-26 | Exploration License Phase 2 | 194 |
872.554/2015 | 5327 | 19-Aug-25 | Exploration License Phase 2 | 1,000 |
872.556/2015 | 5328 | 30-Aug-25 | Exploration License Phase 2 | 1,567 |
871.528/2016 | 10976 | 21-Mar-26 | Exploration License Phase 2 | 933 |
871.429/2017 | 9229 | 2-Jun-25 | Exploration License Phase 2 | 1,634 |
870.795/2021 | 7361 | 5-Oct-24 | Exploration License Phase 1 | 1,000 |
870.796/2021 | 7362 | 5-Oct-24 | Exploration License Phase 1 | 647 |
870.798/2021 | 7364 | 5-Oct-24 | Exploration License Phase 1 | 1,080 |
870.799/2021 | 7365 | 5-Oct-24 | Exploration License Phase 1 | 342 |
870.800/2021 | 7366 | 5-Oct-24 | Exploration License Phase 1 | 626 |
870.847/2021 | 8105 | 20-Oct-24 | Exploration License Phase 1 | 756 |
870.848/2021 | 8106 | 20-Oct-24 | Exploration License Phase 1 | 175 |
870.850/2021 | 8531 | 27-Oct-24 | Exploration License Phase 1 | 995 |
870.851/2021 | 8532 | 27-Oct-24 | Exploration License Phase 1 | 963 |
Process | License
Number | Expiry Date | Status | Area
(ha) |
870.852/2021 | 8533 | 27-Oct-24 | Exploration License Phase 1 | 714 |
870.853/2021 | 8534 | 27-Oct-24 | Exploration License Phase 1 | 801 |
870.854/2021 | 8535 | 27-Oct-24 | Exploration License Phase 1 | 997 |
870.856/2021 | 8537 | 27-Oct-24 | Exploration License Phase 1 | 572 |
870.857/2021 | 8538 | 27-Oct-24 | Exploration License Phase 1 | 1,439 |
870.858/2021 | 8539 | 27-Oct-24 | Exploration License Phase 1 | 1,802 |
| | | | 46,254 |
4.4 Royalties
The Brazilian government collects a 1.5% royalty on gross revenue of all gold production in Brazil. This royalty is split among the various levels of government, with 60% of the royalty payable to the municipality directly impacted. The percentage of the royalty for each municipality is calculated according to the extraction location by month. For the Fazenda mine, this portion of the royalty is split between Barrocas, Teofilândia, and Araci. The remainder of the royalty is divided as follows: 15% paid to the Bahia State government, 10% paid to the federal government, and the remaining 15% is nationally distributed to municipalities indirectly affected by mining. In addition to the royalty paid to the government, surface right owners receive a 0.75% royalty on gross revenue. Since FBDM owns most of the surface rights over the current and planned production areas, the royalty will only potentially apply to a few small portions of land parcels not owned by FBDM.
5 Accessibility, Climate, Local Resources, Infrastructure, and Physiography
5.1 Accessibility
Access to Fazenda from the state capital of Salvador is by 210 km of paved road via BR-324 (Salvador to Feira de Santana, 110 km), BR-116 (Feira de Santana to Teofilândia, 90 km), and 10 km on an unpaved but good-quality secondary road. There are numerous direct flights daily from Salvador to São Paulo, Belo Horizonte, Brasília, and other major Brazilian cities, and connections are available to various international destinations. Various secondary and tertiary roads lead from the mine area to the exploration properties, and the quality of these roads range from good to poor.
5.2 Climate
The climate is semi-arid, and seasonal variations are minimal; however, rain is more prevalent between November and January. The average annual rainfall measured on the site is approximately 500 mm. The yearly average temperature is about 24°C, with a minimal month-to-month variation. The local climate is conducive to year-round exploration and mining operations.
5.3 Local Resources
The town of Teofilândia in Bahia State serves as the main community for mine personnel. The local population is approximately 23,000, the vast majority of whom live in Teofilândia. The general area of the mining and exploration properties is largely uninhabited.
In addition to mining, local economic activity consists of subsistence agriculture and livestock ranching. Sisal is the main crop, which supplies materials for twine, rope, and various craft objects, primarily for export.
Teofilândia is a full-service town and, along with the mine, has access to electricity from the national power grid distributed by local supplier COELBA. A freight-only rail line passes through the area in a northwest-southeast direction close to Fazenda but is not used by the mine.
5.4 Infrastructure
Mine site infrastructure includes a series of open pits and underground ramps, an underground mine; a CIL process plant; four geomembrane-lined TSFs; several waste rock storage facilities; a small geomembrane-lined heap leach pad; a warehouse and maintenance shops; drill core processing and storage facilities; a sample preparation facility; a chemistry laboratory; a cafeteria; and several office complexes.
In addition, the mine has a water system consisting of a wellfield east of Teofilândia, a buried pipeline, and a pumping system to provide potable and processing water to the mine. The water supply is more than sufficient for the mining operations and has been relied on for years. Sufficient surface area exists for all necessary surface facilities, including the TSFs and waste rock dumps and stockpiles.
5.5 Physiography
Topography is gently rolling, with elevations of 300 to 500 m above sea level. Relief is generally 50 to 100 m, although in some areas the hills and ranges rise 200 to 300 m. Vegetation is generally sparse. Plant cover comprises rough, low grasses, algarroba (mesquite-like) trees, and commercially harvested sisal plants. There are very few flowing watercourses in the area, although several small, gentle depressions and valleys carry water during the occasional rainy periods.
6 History
6.1 Prior Ownership and Exploration History
Companhia Vale do Rio Doce's (CVRD) exploration division, DOCEGEO, has explored the Fazenda Brasileiro area since the late 1960s. Mineralization at the Fazenda deposit was discovered in the late 1970s, and the mine entered into production in 1984.
Table 6-1 summarizes Fazenda's exploration history prior to acquisition by Equinox Gold.
Table 6-1: Exploration History
Year | Description |
1969-1970 | CPRM, the Brazilian Federal government geologic survey, conducted prospecting for alluvial gold along the Itapicuru River. |
1972 | DOCEGEO conducted base-metal oriented regional stream geochemical surveys in the area. Numerous anomalies were detected. |
1974 and 1975 | DOCEGEO carried out ground follow-up, including detailed stream geochemical surveys. Numerous important copper and zinc anomalies were identified. |
1976 | DOCEGEO conducted airborne electromagnetic (EM) surveys, and 300 of the 2,500 anomalies were selected for follow-up. Surface sampling programs were implemented and the most significant sample returned 2.0 g/t Au. Additional magnetic, induced polarization (IP), and geochemical surveys were conducted at a higher level of detail than previous surveys. |
Post-1976 | DOCEGEO/CVRD conducted surface exploration programs, including significant diamond drilling focusing on the Weber Belt rocks, which contain the mineralization at Fazenda. CVRD drilled approximately 28,200 holes, for a total of approximately 1,288,000 m. CVRD discovered the Fazenda deposit in the late 1970s and began mining operations in 1984 with an open pit and heap leach gold operation. In 1988, underground mining operations commenced. Fazenda mine has been in continuous production since start-up. In the late 1990s, Barrick conducted limited work on some properties in the northern Rio Itapicurú Greenstone Belt (RIGB), which hosts most of the known gold deposits. |
2003 | Yamana Gold Inc. (Yamana) acquired the Fazenda mine and carried out drilling of approximately 20,300 holes for approximately 905,000 m. |
2015 | Brio Gold Inc. (Brio) acquired the Fazenda mine and carried out drilling of approximately 4,100 holes for approximately 220,000 m. |
2018 | Leagold Mining Corporation (Leagold) acquired the Fazenda mine through its acquisition of Brio and carried out drilling of approximately 1,762 holes for 101,807 m. |
2020-2023 | Equinox Gold acquired the Fazenda mine through its acquisition of Leagold, and carried out drilling of 1,177 holes for 186,756 m. |
6.2 Historical Resource Estimates
In 2003, immediately prior to the sale of the Fazenda mine to Yamana Gold Inc. (Yamana), CVRD estimated a Proven and Probable Mineral Reserve of 2,399 kt grading 3.39 g/t Au, for a total of 261.5 koz of contained gold. In addition, CVRD estimated an Indicated Mineral Resource for the G and F Zones of 311 kt at 6.12 g/t Au, for an additional 61.2 koz of contained gold.
Watts, Griffis and McOuat Limited (WGM, 2003) estimated an Indicated Mineral Resource for the E-DEEP zone of 462 kt grading 4.48 g/t Au, for an additional 66.6 koz of contained gold. A 2.0 g/t Au cut-off grade was applied.
Following the WGM (2003) report, Yamana internally updated the Mineral Resource estimate on a regular basis. Two technical reports were prepared for Yamana: the first by MCB Serviços e Mineração Ltda. (2011), and a second by Coffey Consultoria e Serviços Ltda (2014), which reported an open pit Indicated Mineral Resource of 1.5 Mt grading 2.35 g/t Au, for a total of 102.6 koz Au, and an underground Indicated Mineral Resource of 6.8 Mt grading 2.21 g/t Au, for a total of 486.8 koz of contained gold. In addition, Coffey (2014) estimated Inferred Mineral Resources to be 0.5 Mt grading 1.36 g/t Au, for a total of 23.3 koz of contained gold for the open pit, and 3.1 Mt grading 2.20 g/t Au, for a total of 219.4 koz of contained gold for the underground.
In May 2016, Roscoe Postle Associates Inc. (RPA) audited and prepared a National Instrument 43-101 Standards of Disclosure for Mineral Projects (NI 43-101) technical report on the Mineral Resources and Mineral Reserves estimated by Yamana as of December 31, 2015 (Michaud, Moore, & Hampton, 2015). Exclusive of Mineral Reserves, total open pit and underground Measured and Indicated Mineral Resources were estimated to be 1.9 Mt grading 3.72 g/t Au, containing 229 koz Au. Inferred Mineral Resources were estimated to be 1.0 Mt grading 2.8 g/t Au, containing 90 koz Au. Total open pit and underground Proven and Probable Mineral Reserves were estimated to be 6.5 Mt grading 1.88 g/t Au, containing 392 koz Au.
In November 2018, RPA audited and prepared an NI 43-101 technical report on the Mineral Resources and Mineral Reserves estimated by Leagold as of May 31, 2018 (Michaud et al., 2018). Inclusive of Mineral Reserves, total open pit and underground Measured and Indicated Mineral Resources were estimated to be 7.54 Mt grading 2.30 g/t Au, containing 558 koz Au. Inferred Mineral Resources were estimated to be 6.0 Mt grading 2.45 g/t Au, containing 476 koz Au. Total open pit and underground Proven and Probable Mineral Reserves were estimated to be 5.4 Mt grading 1.84 g/t Au, containing 319 koz Au.
In August 2021, Equinox Gold audited and prepared an NI 43-101 technical report on the Mineral Resources and Mineral Reserves estimated by FBDM mine personnel as of December 31, 2020. Exclusive of Mineral Reserves, total open pit and underground Measured and Indicated Mineral Resources were estimated to be 5.167 Mt grading 1.77 g/t Au, containing 294 koz Au. Inferred Mineral Resources were estimated to be 3.283 Mt grading 1.50 g/t Au, containing 158 koz Au. Total open pit and underground Proven and Probable Mineral Reserves were estimated to be 6.653 Mt grading 1.47 g/t Au, containing 315 koz Au.
The Mineral Resource and Mineral Reserve estimates described above are superseded by the estimates documented in Section 14.
6.3 Past Production
The Fazenda mine began production in 1984 as an open-pit mining operation with gold extraction by conventional heap leaching. In 1988, underground production operations commenced. A CIP plant was commissioned in 1988 and was subsequently converted to pre-aeration and a CIL circuit. A small amount of heap leach production continued until after 2003, when oxide resources were mostly exhausted; heap leach operations were stopped sometime between 2003 and 2007.
Table 6-2 summarizes historical production for the heap leach, CIP, and subsequent CIL operations. Fazenda had produced approximately 3.547 Moz Au by December 31, 2023.
Table 6-2: Fazenda Historical Production 1984 to 2023
Company | Method | Year | Production
(koz) |
CVRD | Heap leach | 1984 | 3 |
1985 | 15 |
1986 | 15 |
1987 | 17 |
1988 | 21 |
CIP + Heap leach | 1989 | 63 |
1990 | 77 |
1991 | 115 |
1992 | 138 |
1993 | 148 |
1994 | 148 |
1995 | 151 |
1996 | 175 |
1997 | 172 |
1998 | 170 |
1999 | 141 |
2000 | 154 |
2001 | 165 |
2002 | 152 |
Yamana | CIP
Converted to pre-aeration and CIL | 2003 | 79 |
2004 | 95 |
2005 | 74 |
2006 | 76 |
2007 | 88 |
2008 | 96 |
2009 | 76 |
2010 | 70 |
2011 | 55 |
2012 | 67 |
2013 | 70 |
2014 | 64 |
Brio | CIL | 2015 | 61 |
2016 | 71 |
2017 | 61 |
Jan-May 2018 | 27 |
Leagold | CIL | Jun-Dec 2018 | 47 |
2019 | 73 |
Jan-Feb 2020 | 12 |
Equinox Gold | CIL | Mar-Dec 2020 | 53 |
2021 | 60 |
2022 | 66 |
2023 | 66 |
2024 Q1+Q2 | 29 |
Total | | 3,576 |
7 Geological Setting and Mineralization
The following descriptions, data, and interpretations are based on internal and external reports (Monte Lopes, 1982; Teixeira, 1985; Teixeira et al., 1990; Reinhardt & Davison, 1990; Silva et al., 2001; Mello et al., 2006; and Siddorn, 2023), personal communications with FBDM site personnel, and reviews of geologic logging, mapping, and geologic models conducted or created by site personnel and the authors.
7.1 Regional Geology
The Rio Itapicuru Greenstone Belt (RIGB) is an elongate belt, roughly 100 km long by 60 km wide, which covers approximately 4,000 km2 within the Serrinha Block of the São Francisco Craton. The RIGB is primarily oriented north-south, but is deflected into a roughly east-west orientation at the southern end. This east-west-oriented portion is called the Weber Belt, which hosts the Fazenda gold deposits (Figure 7-1). The RIGB comprises a sequence of volcanic and sedimentary rocks with three main lithological units: a 5 km-thick lower mafic volcanic unit (MVU) composed of tholeiitic basalts with intercalated chemical sedimentary rocks; a 3.5 km-thick middle felsic volcanic unit (FVU) composed of andesites, dacites, and rhyodacites interbedded with pyroclastics; and an upper 1 km-thick sedimentary unit composed of volcanic greywackes, pelites, arkoses, conglomerates, and chemical sediments. A back-arc basin environment for supracrustal rock deposition has been hypothesized. These supracrustal rocks are underlain by Archean basement gneisses and migmatites and were intruded by and surround a series of Proterozoic granitic plutons and domes.
The RIGB's structural evolution is characterized by a complex history of deformation events. The primary deformation event (D1) involved E-W to NW-SE shortening, which resulted in subhorizontal and bedding-parallel foliation and shear zones, NW-SE trending lineation, and E- to SE-directed thrusts. The secondary event (D2) was characterized by NW-SE compression and associated left-lateral strike-slip tectonics, developed on steeply dipping D1 foliation. The tertiary event (D3) produced local crenulations to open metre-scale folds that refold the large-scale, asymmetric, tight to open folds (F2). No gold was introduced during this phase, and these are not important in the regional structural framework. A minor quaternary event (D4) produced NW-SE trending brittle faults, some of which are locally important, as they can offset mineralized zones.
The RIGB's structural framework is dominated by large synclines and anticlines, bounded by regional-scale, brittle-ductile shear zones. First-order shears exhibit a general N-S orientation and left-lateral offset in most of the greenstone belt and E-W to NW-SE orientation with dominantly reverse-slip offset in the Weber Belt. The D2 is the most prominent, during which the bulk of the felsic intrusives were emplaced.
RIGB metamorphism occurred in three distinct events. The early oceanic sea-floor hydrothermal alteration metamorphism event (M1) was responsible for hydration reactions and oxidation in volcanic rocks, which produced greenschist-facies mineral associations. A regional metamorphism event (M2) under greenschist-to-lower amphibolite facies conditions produced zoned mineral assemblages consisting of actinolite-epidote-albite in the inner part of the belt and hornblende-andesine in the outer part. M2 was synchronous with D2 and with the emplacement of the main granitic plutons. The third, local metamorphism event (M3) was thermal, related to contact metamorphism around late-tectonic bodies.
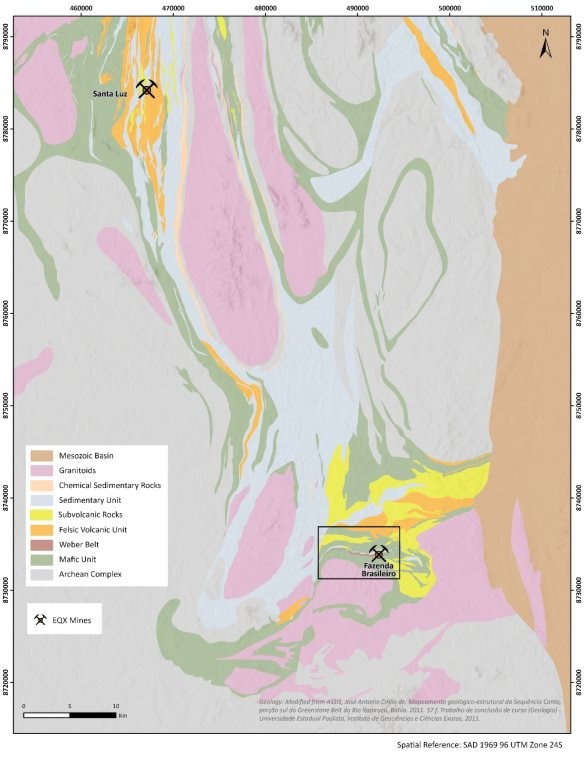
Figure 7-1: Regional Geology
Whole-rock metabasalt samples from the MVU produced a Pb-Pb isochron age date of 2.209 ± 0.060 Ga and a Sm-Nd model age of 2.200 Ga. Whole-rock andesite and dacite samples from the FVU produced an isochron 207Pb/206Pb age date of 2.170 ± 0.060 Ga and a Sm-Nd model age of 2.120 Ga, establishing belt-scale younging direction. Syntectonic granitoids in the RIGB yielded a Pb-Pb date on zircon of 2.100 Ga ± 0.020 Ga. Peak metamorphism was recorded by an Ar-Ar plateau age of 2.080 ± 0.005 Ga on a hornblende from amphibolite and a U-Pb sensitive high-resolution ion microprobe age of 2.076 ± 0.010 Ga on a detrital zircon from a quartzite. The timing of gold mineralization at Fazenda is constrained by hydrothermal sericite in alteration haloes around gold-bearing quartz veins. These have produced 40Ar/39Ar cooling ages of 2.083 and 2.031 Ga and 40Ar/39Ar plateau ages of 2.050 ± 0.004 Ga and 2.054 ± 0.002 Ga; and established that gold deposition was temporally associated with granitoid intrusion, peak to post-peak metamorphism, and the D2.
7.2 Local Geology
7.2.1 Lithology
The RIGB, although primarily oriented N-S, is deflected at its southern end into an E-W orientation. This portion of the RIGB is called the Weber Belt (Figure 7-2), and is an approximately 10 km-long, arcuate, east-west-trending, south-dipping package of mafic rocks and sediments that is abruptly folded toward the south near its western extremity. The Weber Belt hosts the most significant gold mineralization in the RIGB, including Fazenda, which comprises the Lagoa do Gato (LG), Papagaio, Raminhos, Fazenda Main, F, G, Pau-a-Pique (PPQ), Barrocas (BR) (previously referred to as Footwall Oeste), and Barrocas SW (BRSW) deposits.
Outcrop is sparse (±10%) throughout the Fazenda area. Most of the detailed geological information is obtained from surface trenching, drilling, and data collected from the open pit and underground operations. Stratigraphic facing directions in the Weber Belt are very rare, and complex multiphase deformation has affected the sequence so that the stratigraphic top and base are generally not known. The lithologic contacts and main tectonic foliation are subparallel and systematically dip between 40° and 70° south, so the Weber Belt is described from the south (structural top) to the north (structural base). The Weber Belt has been grouped into four units; from south to north these are:
Riacho do Inco unit (Inco): a tholeiitic mafic sequence composed of metabasalt, mafic schist, metagabbro sills, and interflow sedimentary beds.
Fazenda Brasileiro unit: a mafic sill derived from a gabbroic intrusion that was metamorphosed and altered to a chloritic schist. Differentiation resulted in a layered composition of metagabbro, iron-rich metagabbro, and lenses of meta-anorthosite at the top. A laterally extensive but thin horizon composed of graphitic metapelite, metachert, and rhyodacite serves as a marker for the top of this unit. Most of the gold deposits discovered to date lie along, within, and adjacent to this unit.
Canto unit: a probable turbidite sequence composed of metapelite, metachert, and metagraywacke locally intercalated with mafic volcanic intrusions. Several important gold deposits are located within this unit.
- Abóbora unit: a thick sequence of basalt flows with local, narrow sedimentary intercalations, that occurs in the northernmost part of the Weber Belt. This unit is not important to Fazenda and is not discussed further.
7.2.2 Riacho do Inco Unit
Inco is composed of a >1 km-thick sequence of tholeiitic basalt flows with interflow sedimentary beds and metagabbro sills metamorphosed and altered to greenschist facies. Two distinct metabasalts are recognized: the first has light- to dark-green colour, a pronounced foliation, and a fine-to-medium granular-to-oriented texture defined by chlorite, carbonate, plagioclase, epidote, and quartz. The second has a pale-green to faint blue-green colour, weak foliation, and a fine-grained, oriented texture defined by actinolite, plagioclase, and epidote. The metagabbro sills are dark green and isotropic with a fine-to-coarse grain size, and composed of hornblende, actinolite, plagioclase, and smaller amounts of chlorite, limonite, sphene, and leucoxene.
7.2.3 Fazenda Brasileiro Unit
The Fazenda gold deposits lie along, within, and adjacent to the Fazenda Brasileiro unit. The lithologic sequence is relatively consistent throughout the belt, except where repetitions by folding and thrusting occur. Intense deformation and hydrothermal alteration have obliterated original textures and mineralogy to such an extent that most original lithologies are difficult to determine.
The Fazenda Brasileiro unit has been mapped in more detail due to its being the main ore host, and is divided into several informal field subunits (Figure 7-3). From top to bottom, these are:
A graphitic schist hanging-wall marker horizon (GRX), also referred to as the Horizonte Guia (guide horizon) in some literature. This is a continuous sedimentary bed up to 10 m thick composed of graphitic metapelite, chert, and lesser fine-grained quartzofeldspathic rock layers, resting at the hanging wall of the main ore bodies. The chert layers are dark-grey to black, contain graphite and carbonate, and show a fine, granular texture with disseminated subhedral to euhedral pyrites. Narrow rhyodacite sills are also present within the marker horizon and comprise a fine-grained, white rock composed of quartz, plagioclase, sericite-muscovite, carbonate, and chlorite, with minor leucoxene and opaques. Chlorite and sericite occur together in thin layers, whereas carbonate remains dispersed or in veinlike form.
A chlorite-magnetite schist (CLX). This subunit hosts most of the gold mineralization defined to date. It varies between approximately 5 and 50 m thick and extends E-W for approximately 8 km. It is a dark-green chlorite schist, which becomes reddish under weathering, and can be traced on surface by magnetometric survey. In general, it is composed of ferroan chlorite (>50%); quartz (5% to 30%) as small aggregates or flattened dark grey-blue eyes up to 1 cm long; magnetite (2% to 20%) in euhedral crystals up to 5 mm long; iron-rich carbonate or calcite (5% to 20%) in aggregates or millimetre-thick laminae; albite (5% to 10%) as porphyroblasts up to several centimetres long or in irregular aggregates with quartz, limonite, and sulphides. This rock shows a remarkable variation in mineral composition due to hydrothermal alteration near the ore bodies. Quartz aggregates often show mylonitic recrystallization textures. Intense shearing, metamorphism, and hydrothermal alteration have rendered the original rock type difficult to determine. Proposed protoliths include altered banded-iron formation, meta-ferrogabbro, and quartz diorite based on the amount of original quartz (locally up to 10%). Two main CLX lenses are observed: one each at the top (below the marker horizon) and bottom of the Fazenda Brasileiro unit.
- An intermediate subunit, representing sericite-chlorite-carbonate schist (CAX). This subunit is a massive-to-foliated greenish-grey metagabbro with a few metasedimentary intercalations. The metagabbro shows locally preserved ophitic texture and is composed of plagioclase (albite to andesine), magnesian chlorite, calcite, clinozoisite, sphene, apatite, white mica, and quartz. Hornblende, rutile, and ilmenite are rare constituents. CAX typically occurs between the two lenses of CLX described above.
Previous workers have defined a fourth subunit, termed a "quartzofeldspathic breccia," described as comprising most of the high-grade ore, and which formed discontinuous and strongly deformed lenticular-shaped bodies within the magnetic schist. However, data collected during subsequent exploration and mining has shown that this unit is not a primary lithological body. Teixeira (1990) also stated that the quartzofeldspathic breccia should represent a hydrothermal alteration product of the CLX schist based on trace-element variations and rare-earth element patterns. The quartzofeldspathic breccia is thus interpreted as a product of structural overprint and hydrothermal alteration that affected the CLX.
Early in the history of the Fazenda mine, Teixeira (1985, 1990) interpreted the Fazenda Brasileiro unit as a differentiated and metamorphosed sill composed of three main lithologies: a basal gabbro (the intermediate subunit) grading upward to an iron-rich gabbro (the magnetic schist), and with lenses of porphyritic anorthosite at the top. In this interpretation, the iron-rich metagabbro appears at the north and south of the basal gabbro because of repetition by folding. Data collected from extensive exploration drilling and mining in the intervening years support the differentiated sill interpretation but indicate that the proposed isoclinal fold geometry is unlikely. The current interpretation is that the magnetic schist and intermediate subunit are proximal and more-distal hydrothermal-alteration products of a metagabbro protolith, respectively. However, detailed chemical and petrographic work to test this hypothesis have not been completed.
7.2.4 Canto Unit
The Canto unit is a turbidite sequence composed mainly of fine-grained carbonaceous metasediments, with alternating well-laminated meta-argillite and metasiltstone layers. The sequence also includes interlayered black metachert and metagraywacke. The predominant mineral assemblage comprises quartz, feldspar, chlorite, sericite, calcite, and a series of accessory minerals. Primary sedimentary features are rarely preserved, but bedding-plane cleavage, convoluted lamination, intraformational breccias, and slump structures can be locally recognized. Thin metabasalt layers, granular metagabbros, and bands of sericite schists appear within the sequence, the latter probably representing metamorphosed felsic tuffs. Basaltic rocks from this unit are geochemically similar to the metatholeiites of Inco.
Table 7-1: Fazenda Mine Area Stratigraphic Column (2023)
Unit | Logging Code | Description | Notes |
Cover | ATR | Fill | - |
SOIL | Soil, alluvium | - |
Riacho do Inco Unit | ANF | Amphibolite | local, rare |
CCX | Carbonate-chlorite schist | altered basalt |
Fazenda Unit | GRX | Graphitic schist | hanging wall marker unit |
CLX | Chlorite-magnetite schist | main ore zone |
CAX | Chlorite-carbonate schist | - |
MGB | Metagabbro | local, rare |
Canto Unit | GRX | Graphitic schist | local lenses |
MCH | Metachert | local lenses |
MDA | Metadacite | rare |
MPC | Metapelite-carbonaceous | common gold host |
AGV | Volcanic agglomerate | main ore zone |
MPV | Volcanic metapelite | main ore zone |
MAD | Meta-andesite | - |
FV | Felsic volcanic | - |
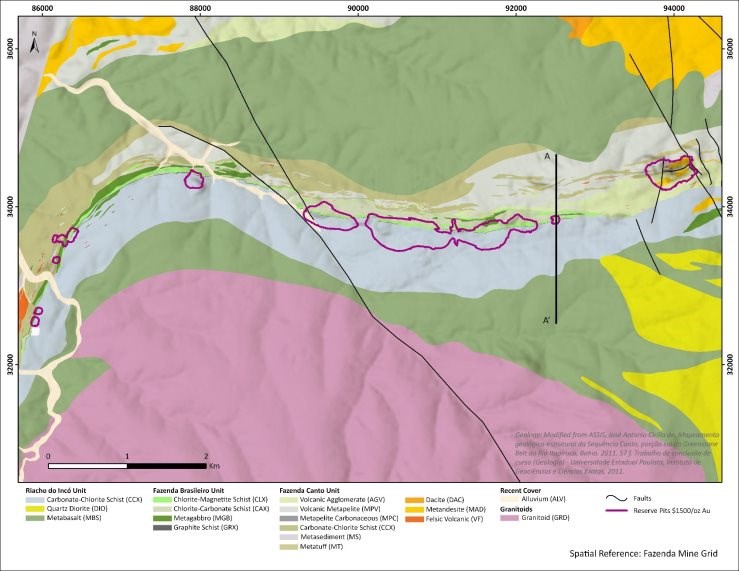
Figure 7-2: Weber Belt Surface Geology
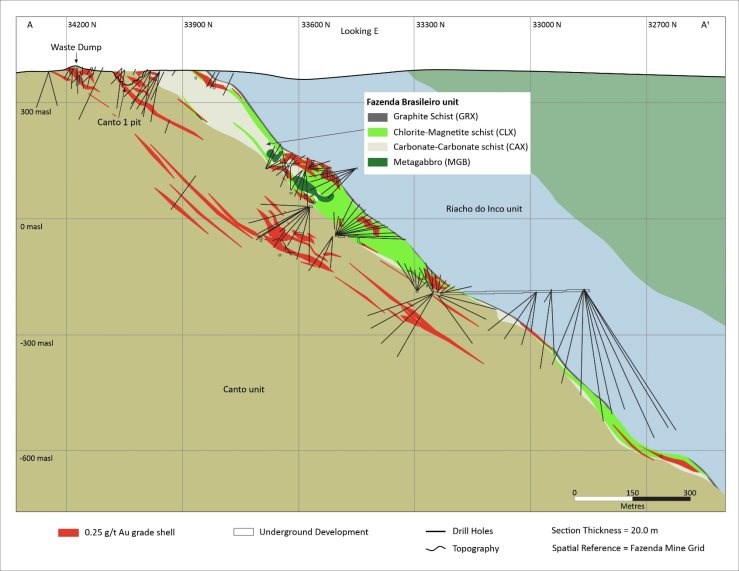
Figure 7-3: Schematic Geologic Cross-Section
7.2.5 Structure
This section was summarized from discussions with site personnel, and the work of Chauvet et al. (1997), Reinhardt & Davison (1990), Teixeira et al. (1990), and Siddorn (2023).
The structural histories of the RIGB are complex as a whole, and the Fazenda mine area in particular. At least three phases of ductile and ductile-brittle deformation are documented, followed by late, brittle faulting. The deformation events and their products in the Weber Belt and in the Fazenda mine vicinity are described below.
7.2.6 D1 Deformation Event
East-directed compression produced penetrative, mylonitic, greenschist-facies foliation (S1) parallel to lithological contacts. These structures are presently oriented NNW-SSE to N-S in the northern portion of the RIGB and E-W to NW-SE in the southern portion (the Weber Belt), where they are well-preserved. In the Weber Belt, an E-W to NW-SE trending, undulating, but overall sub-horizontal lineation is expressed by oriented micaceous aggregates on foliation. The D1 event also produced the overall N-S-trending Main Shear Zone, located east of the Ambrosio Dome in the northern RIGB, and which forms the western boundary of the Weber Belt in the southern RIGB, as a thrust. The D1 tectonic event is interpreted as a tops-to-E-SE intense ductile shearing that produced a shallowly dipping foliation. D1 structures were subsequently affected by large-scale upright folds attributed to D2.
Intense ductile shearing, localized within the Weber Belt, produced several distinct shear zones defined by S1, which is up to 50 m thick and parallel to lithologic contacts. Three main, sub-parallel shear zones, including associated features such as splays, internal thrusts, and shear bands, are known. Two of the main shears are centred on the upper and lower CLX horizons within the Fazenda Brasileiro unit, which accounts for the bulk of gold production to date. S1 foliation in CLX schist is defined by preferred orientations of chlorite, carbonate, and quartz, and asymmetric quartz-carbonate pressure-solution shadows are developed around magnetite crystals. A poorly defined stretching lineation, defined by quartz-feldspar aggregates and quartz eyes, undulates from a moderate east-to-west plunge. An additional shear, which also hosts important gold mineralization, is observed entirely within the Canto unit where the mylonitization formed S- and L-S tectonites defined by progressively attenuated basalt clasts within laminated sedimentary rocks.
7.2.7 D2 Deformation Event
NW-SE compression resulted in sinistral transpression of the northern RIGB domain and rotation of the Weber Belt into its current E-W orientation. This event folded shallow D1 N-S-trending foliation planes into high-angle orientations. Sinistral shear zones, characterized by S/C fabrics and asymmetric pressure shadows, formed on reoriented D1 foliation and produced a sub-horizontal stretching lineation defined by quartz rods and biotite/chlorite streaks. Continued thrusting produced E-W- to NE-SW-oriented F2 fold axes recognized north of the Fazenda mine. These folds have sinistral shear sense criteria in south-dipping limbs and dextral shear sense criteria in north-dipping and overturned south-dipping limbs. This relationship demonstrates that the shear criteria are related to an older tectonic event (D1) and were subsequently folded (D2). The D2 event also reactivated the Main Shear Zone as a sinistral strike-slip shear.
The major D2 deformation was responsible for the present overall-southerly dip in the mine area due to F2, with amplitudes up to 1 km. The Fazenda mine is situated on the right-way-up long-limb of one of these F2 antiforms. These northward-verging structures have south-dipping axial planes and minor F2 fold axes, which generally plunge between 10° and 20°. An axial planar crenulation cleavage with new chlorite growth was produced during this event, and pencil-type intersection lineation, quartz rodding, and carbonate fibers developed parallel to the F2 fold axes in the schists. Down-dip slickenlines are present on the thrust planes, indicating northward-directed thrusting. However, steeply dipping ductile-brittle shears with a transcurrent component of movement and associated folding, intense quartz veining, and gold mineralization also occurred during the D2 event. These produced horizontal displacements up to tens of metres in either a dextral or sinistral sense along E-W- to NE-SW-oriented zones, but true displacements are not known. The latest movements on the E-W-trending shears continued after gold mineralization ceased. The Barrocas dome is also interpreted as having been overthrust from the south during D2. The Weber Belt, including the shear zones and ore bodies, bends to a roughly north-south orientation at its western termination. This is interpreted as due to D2 deformation and structural buttressing attributed to the Barrocas Dome.
Gold mineralization, primarily as sulphide-bearing quartz veins within the brittle-ductile shear zones, has been attributed to the D2 event, although additional mineralization during D1 has not been precluded.
7.2.8 D3 Deformation Event
Late localized F3 crenulations to open metre-scale folds that refold the F2 folds are observed locally but are not important in the regional structural framework. Only minor modification of mineralized zones resulted from this deformation episode and no gold deposition occurred.
7.2.9 D4 Deformation Event
Late, high-angle, brittle faults strike primarily NW-SE, but a smaller set strikes NE-SW. These are primarily identified in granite domes but occur throughout the RIGB. Apparent offset is up to 500 m and both dextral and sinistral movement sense is observed. The Riacho do Inco fault is an important example, as it cuts and offsets the Fazenda ore bodies up to 100 m.
7.3 Mineralization
The major orebodies at the Fazenda mine are found within roughly E-W-trending and S-dipping brittle-ductile shear zones centred on the Fazenda Brasileiro unit. The bulk of gold mineralization is hosted by veins within the uppermost chlorite-magnetite schist (CLX1), and important mineralization is also found in the structurally lower CLX2 and Canto units. Economic mineralization occurs in horizontal to shallowly east- and west-plunging shoots, the locations of which are influenced by a combination of folding and shearing. Shoots range from tens of metres to hundreds of metres long, and tens of metres high. Gold mineralization is related to multi-phase veining events, and grade increases with vein thickness and abundance. Vein thicknesses typically range from millimetre- to decimetre-scale. Veinlet networks are also common and occur in sets that vary in true width from 1.5 to 40 m, and in horizontal mining widths from 3 to 40 m. Vein composition is mainly quartz, albite, and interstitial calcite (95%) with the remaining 5% comprising iron sulphides and oxides, including pyrite, arsenopyrite, ilmenite, magnetite, pyrrhotite, and chalcopyrite. Sphalerite, pentlandite, galena, and gold are accessory minerals. Marcasite is formed by alteration of pyrrhotite, and covellite and digenite by alteration of chalcopyrite. Gold occurs mainly as inclusions within sulphide crystals, in veinlets, fractures, and intergranular spaces of sulphides and gangue minerals. Gold grains typically contain less than 5% Ag and are normally smaller than 20 µm.
PAGE 7-11 |
January 31, 2025 |
8 Deposit Types
The Fazenda gold deposit is an epigenetic, structurally controlled, and hydrothermally altered Precambrian quartz-vein-hosted gold deposit formed in rocks subjected to brittle-ductile deformation and metamorphosed to greenschist facies conditions.
Hydrothermal alteration and the style of veining are typical of well-studied greenschist facies deposits such as Sigma and Kerr-Addison in the Canadian Archaean, and the Hunt Mine in Western Australia.
Fazenda's deposit area is well known and well-studied, with multiple scientific investigations completed over the past 40 years. The current models developed by Fazenda geologists reflect the large amount of available data in the area and provide both mining operations and exploration programs with a substantial database to guide further work.
9 Exploration
Historical exploration is described in Section 6. Recent exploration work at Fazenda has consisted primarily of infill and near-mine exploration drilling, as described in Section 10. Additional exploration at Fazenda includes geological mapping, the results of which are described in Section 7. A regional geophysical survey was conducted in 2023 that covered all of FBDM's concessions in the Weber Belt and the western RIGB. As of this report, the geological interpretation of the survey results is in progress.
9.1 Exploration Potential
Near-mine exploration potential exists at depth along strike, both between the known deposits and beyond. Initial drilling has shown that gold mineralization is present between and below historical open pits. These targets continue to be explored via diamond drilling (DD) from both the surface and underground.
FBDM is actively exploring several regional concessions through geologic mapping, geochemical surveys, geophysical surveys, and structural interpretation. These concessions are not material to the mine at this time.
10 Drilling
Since 1979, several companies have conducted diamond drill-hole (DDH) and reverse circulation (RC) drilling at Fazenda, comprising 57,230 drill holes totalling 2,780,859 m. The drilling at Fazenda is summarized in Table 10-1, and drill-hole collar locations are shown in Figure 10-1.
Table 10-1: Drilling Completed as of December 31, 2023
Mine Ownership | Number of Drill Holes | Metres Drilled |
CVRD 1979-2003 | 28,224 | 1,287,739 |
Yamana 2003-2014 | 20,295 | 905,205 |
Brio 2015-2017 | 4,104 | 220,106 |
Leagold 2018-2019 | 1,762 | 101,807 |
Equinox Gold 2020-2023 | 2,845 | 266,002 |
Total | 57,230 | 2,780,859 |
Mathisen et al. (2020) summarized pre-Equinox Gold drilling as follows:
Prior to 2003, CVRD conducted surface diamond drilling in the initial search for new mineralization. This was followed by underground fan drilling on a 100 m by 50 m grid using B-sized equipment to establish Indicated Mineral Resources. A-sized core fan drilling on a 25 m by 10 m grid pattern was then used to upgrade the classification of Mineral Resources from Indicated to Measured. Since 2003, both Yamana and Brio maintained the same methodology of drilling as CVRD.
Between 2018 and 2019 Leagold completed approximately 101,807 m of DDH drilling, primarily focused on grade control and resource conversion.
Between 2020 and 2023 Equinox Gold completed approximately 266,002 m of DDH and RC drilling, comprising programs for grade control, resource conversion, and exploration between, below, and on strike from historical pits, including both DDH and RC.
Results from 197,098 m of this drilling have been included in the updated Mineral Resource estimate.
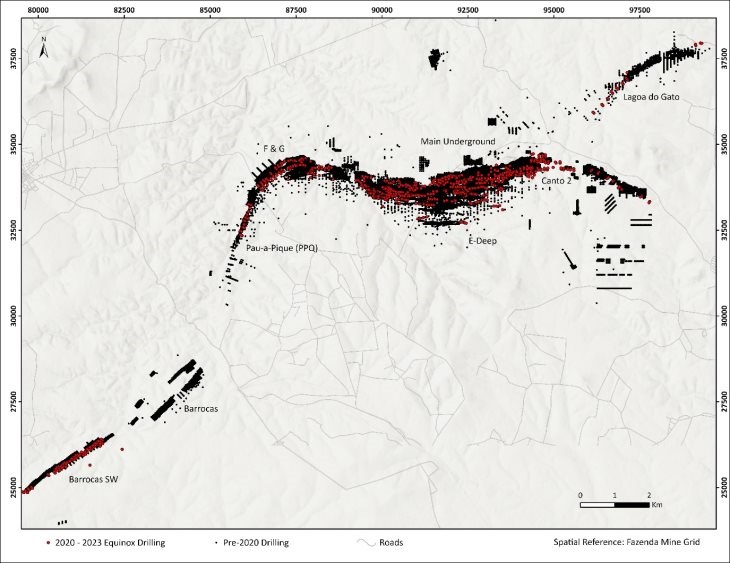
Figure 10-1: Drilling Plan View
10.1 Sampling Method and Approach
The following describes the procedures Equinox Gold used for sampling. Details on procedures used by previous operators can be found in the NI 43-101 technical reports by Araujo et al. (2021) and Mathisen et al. (2018), and references therein.
Site geologists and technicians locate surface hole collars using a handheld Global Positioning System (GPS) unit. A more accurate GPS or total station instrument is used to survey the actual collar coordinates in Universal Transverse Mercator (UTM) coordinates (Zone 24 South, SAD69 datum). FBDM surveyors mark underground DDH collars prior to drilling, then return when the hole is complete to survey actual collar coordinates.
Drill core is placed in wooden core boxes with a nominal capacity of 4 m for NQ-sized drill core, 4.6 m for LTK-sized core, and 3 m for HQ-sized core. The drill-hole identification, box number, and downhole depths are stamped onto an aluminum tag and affixed to the edge of the box. The driller places wooden downhole core depth-markers in the core box, affixed with an aluminum tag stamped with the depth, interval length, and the recovered sample length.
Upon receipt of the drill-hole core at the core processing facility, the entire length of the drill-hole core is photographed. A geologist logs the core, in detail, for lithology, structure, mineralization, oxidation, and alteration. The orientation of structures is recorded, including foliation, faults, and veins (among others). DDHs collared on the surface are typically oriented core; underground DDHs are not oriented. The core is marked with geological contacts and other notable features. Relevant observations are also described with text in the "remarks," especially the details of mineralized zones. Sample intervals and sample numbers are recorded in the log.
Diamond core holes are marked down the entire length of the hole at nominal 1.0 m intervals, except at lithological contacts or other important geological features where the sample size is adjusted. Plasticized sample-number tags are stapled to the core box next to the corresponding sample, with a red square marked on the box with a pen indicating the start and end of the sample interval.
The driller and core technicians record recovery for surface DDH holes. This practice began in 2020. The driller records underground core recovery. Recovery in the mineralized zones is typically >90%.
Drill core of HQ- and NQ-size is sawn in half with an electric diamond core saw. Underground drill core of LTK size is sampled in its entirety. A geological technician places samples in numbered plastic bags along with a paper sample tag. The bags are closed and secured with a string tie.
RC cuttings are sampled at the drill using a splitter. After the splitter, a plastic bag is affixed to the cyclone chute to catch the samples, which are collected at 1 m intervals. The drilling and sampling assemblies are cleaned after every 1 m sample using compressed air and a non-metallic spatula. A paper sample tag is placed in a plastic bag (for its protection), which is then placed into the sample bag. The sample number is also written in permanent ink on the sample bag. Cuttings that represent each 1 m drilled are captured in a chip tray, and a geologist logs lithology, mineralization, oxidation, and alteration. Structural information is not captured for RC cuttings. RC chip trays are photographed.
Downhole surveys are performed using a north-seeking gyro tool manufactured by REFLEX or Stockholm Precision Tools. Readings are taken at nominal 3 m intervals for the entire length of the hole. The drilling and logging methods are acceptable for the purposes of a Mineral Resource estimate (MRE).
11 Sample Preparation, Analyses, and Security
11.1 Sample Preparation and Analytical Procedures
Methods used for sample reduction and preparation for dispatch are discussed in Section 10.
Samples generated by FBDM between 2021 and 2023 that inform the MRE were processed and assayed at one of three laboratories. Multiple labs were used due to unusually long turn-around time for assay results, primarily attributed to issues related to the COVID-19 pandemic. Samples from surface drilling were analyzed at external laboratories, either ALS Global (ALS) or SGS. Both labs have preparation facilities in Belo Horizonte, Brazil. Following sample preparation, the labs send the pulps to their respective analytical facilities. Grade-control and underground-exploration drill samples were analyzed at the on-site Fazenda mine laboratory.
11.1.1 Fazenda Laboratory
A Thermo Fisher Emergency Use Authorization Sample Manager laboratory information management system (LIMS) is used for sample management. Crushing and grinding equipment in the preparation cycle are cleaned with compressed air after each sample. Barren silica sand is passed through the equipment prior to processing sample batches. Granulometric tests are performed three times per shift on the crushing and pulverizing processes. Preparation duplicates are inserted every 20 to 30 samples. Samples sent to the Fazenda laboratory are processed and assayed as follows:
- Crushed to P90 2.0 mm
- Passed through a rotary splitter
- 500 g aliquot pulverized to P95 150 mesh
- 50 g aliquot analyzed using fire assay with an Atomic Absorption Spectrometry (AAS) finish.
The Fazenda laboratory was previously accredited with ISO 17025:2005 and ISO 9001:2008. Although the lab is not currently ISO-accredited, the same procedures are followed as were followed when it was accredited. The Fazenda laboratory also participates annually in the Proficiency Test Programs in Gold Ore by FA/AAS, promoted by Instituto de Tecnologia August Kekule, Brazil, and Centro Tecnológico de Referência SulAmericano, Brazil.
11.1.2 ALS Laboratory
Sample management is performed using the ALS LIMS. Equipment is cleaned with compressed air between samples. Barren wash material is passed through the equipment between sample batches. Crushing and pulverizing quality is monitored, with sieving prepared materials at least every 1 in 50 samples. Preparation duplicates are inserted every 50 samples. Samples sent to ALS were processed and assayed as follows:
- PREP-31 or the custom preparation package PREP-33Y (crush to P90 2.0 mm, riffle splitter, 500 g aliquot pulverized to P95 150 mesh).
- Assayed using Au-AA23 or Au-AA24 (fire assay on a 30 or 50 g aliquot, resp., with an AA finish). Samples with assay results over 10 ppm Au were reanalyzed using Au-SCR21 or Au-SCR24.
11.1.3 SGS Laboratory
Sample management is performed using the SGS LIMS. SGS inserts QC samples including blanks, duplicates, and certified reference materials (CRM), at a 14% total frequency. Samples sent to the SGS laboratory are processed and assayed as follows:
- Crushed to P75 2.0 mm, riffle splitter, 1,000 g aliquot pulverized to P85 200 mesh.
- Assayed according to procedure FAA505 (fire assay on a 50 g aliquot with an AA finish). Samples with assay results over 10 ppm Au were reanalyzed using FAASCR.
11.2 Quality Assurance and Quality Control
The quality assurance and quality control (QA/QC) program at Fazenda was designed to ensure confidence in assay data by incorporating blanks, CRMs, and duplicates into the sample stream, and monitoring their performance to identify any potential issues. QA/QC practices prior to 2020 can be found in Araujo et al. (2021) and Mathisen et al. (2020), and references therein. FBDM personnel reviewed the QA/QC results from each drill hole upon receipt of assay results. Failed sample inserts, and five samples preceding and following the insert, were re-assayed by the respective primary laboratory. Monthly QA/QC summary reports that document all QA/QC activities and results are prepared.
11.2.1 QA/QC Sample Insert Definitions
Blank
Material barren of gold is inserted randomly into the sample sequence prior to sample shipment and subjected to the entire process of physical preparation and chemical analysis. The first sample in a batch must be a blank sample, and a blank sample must also be inserted in the probable gold-mineralized zone identified during geologic logging. The purpose of this sample is to identify and monitor potential cross-contamination during the sample preparation.
Certified Reference Material
A CRM is a well-characterized material with a known and precisely measured concentration of the property of interest, in this case, gold. The purpose is to assess repeatability, accuracy, and precision of measurements.
Twin Sample
Twin samples are the second half or quarter-core of a diamond drill core or a rock sample. The purpose is to assess the homogeneity, variability, and representativeness of the samples. Twin samples are not taken from RC drilling or from underground exploration DDH drilling. For underground drilling, the small diameter of the core (LTK-size) necessitates 100% consumption of the core during primary sampling.
Field Duplicate
In RC drilling a field duplicate is the product of sample division during the sampling process at the drill. This produces two samples that theoretically are equally representative. The purpose is to assess the sampling processes and monitor for potential bias. Field duplicates are not sampled from diamond drill core.
Coarse Crush Duplicate
A duplicate sample is taken after the primary crushing process, to identify and assess any bias introduced during mechanical sample reduction.
Check Assay
The check assay is a duplicate sample of pulverized material, where both original and duplicate samples are assayed by the primary laboratory. The purpose is to assess the variability and reproducibility of assay results by the primary laboratory.
Lab Check
A lab check is a replicate sample of pulverized material assayed by a secondary (or tertiary) laboratory. The purpose is to assess the accuracy of assay results from the primary laboratory and monitor for potential bias.
11.2.2 QA/QC Sample Insertion Frequency
Between January 1, 2021, and December 31, 2023, 21,200 QA/QC samples were submitted. QA/QC insertion and acceptance criteria are presented in Table 11-1 and QA/QC insert types and insertion rates are summarized in Table 11-2.
Table 11-1: Fazenda Drilling QA/QC Protocols
QA/QC Type | Underground
Insertion Frequency | Surface
Insertion Frequency | Acceptance Criteria |
Blank | 1 in 30 | 1 in 25 | FBDM lab: ≤ 0.16 g/t Au
ALS: ≤ 0.02 g/t Au
SGS: ≤ 0.02 g/t Au |
Coarse Crush Duplicate | 1 in 25 | 1 in 50 | Relative Difference: ≤ ±20% |
CRM | 1 in 30 | 1 in 25 | ≤ 3 SD from mean value |
Lab Check (Pulp Replicate) | 5% > 0.5 g/t Au | 5% of samples within grade shell sent to second lab annually | Relative Difference ≤ ±10% |
Field Duplicate | N/A | 1 in 50 RC only | - |
Twin Sample | 1 in 50 DDH only | 1 in 50 DDH only | - |
Check Assay (Pulp Duplicate) | N/A | N/A | - |
Proficiency Test Program | 4 times per year
12 samples sent to 8 labs | N/A | Z-score ≤3
Accuracy (Relative Error-RE), %
Precision (Amplitude-R), ppm
Youden Performance |
Note: SD = standard deviation.
Table 11-2: QA/QC Sample Insertion Summary
QA/QC Insert Type | Number of QA/QC Samples |
CRMs | 5,606 |
Blanks | 5,859 |
Coarse Crush Duplicates | 6,102 |
Field Duplicates | 850 |
Twin Samples | 116 |
Lab Checks | 2,667 |
11.2.3 QA/QC Summary Results
Certified Reference Materials
CRMs were purchased from Geostats Pty Ltd (Australia) and Rocklabs (New Zealand); both of which are well-known, commercial CRM providers. Each CRM has a known and certified gold content determined by round-robin assaying at accredited assay laboratories. Variation from the CRM mean value in standard deviation (SD) units (Z-Score) is used to determine acceptability of a CRM assay result; results within ±3 SD are considered acceptable. Prior to 2021, CRM failure criteria was based on the mean and SD presented on the CRM certificate provided by the manufacturer. Failure criteria was revised in 2021 to reflect lab-specific means and SD for CRMs that have been assayed more than 100 times per lab. These lab-specific criteria are reviewed annually prior to the start of any drill campaigns. CRMs analyzed after this procedure change are denoted with an underscore and a suffix that identifies the site and lab used. Since 2021, 22 different CRMs have been used; however, as of the report date the number of CRMs in use has been reduced to eight. Approximately 50 g of CRM sample material are submitted.
A total of 5,606 CRMs were submitted during the 2021-2023 drill campaigns. Most CRM Z-scores from the Fazenda lab fell within the acceptable ranges, and the means for each CRM are very close to the certificate value, demonstrating reliable accuracy and precision. However, irregular results and Z-Scores >3 from several CRMs were noted, which could indicate potential issues with assay accuracy or CRM quality. These issues prompted an audit of the mine lab, details of which can be found in Section 11.2.4.
The external laboratories, ALS and SGS, demonstrated high accuracy and precision in assay performance. Both labs apply rigorous QA/QC protocols that consistently meet industry standards. Z-score analyses were performed on CRMs for both ALS and SGS. This analysis confirmed the precision of external laboratory assays, with all Z-scores falling within acceptable limits, further reinforcing confidence in data quality from these laboratories.
The certified/calculated mean values, acceptable ranges for analyses, and other data for the CRMs are presented in Table 11-3. Z-Score charts for all labs are found in Figure 11-1 where the Z-Score is a normalization of the SD (1 SD = 1 Z-Score unit) and the data includes all CRM assay results, including failures that were subsequently re-assayed.
Table 11-3: List of Certified Reference Materials used and Performance Summary
CRM Name | Certified Au Value
(ppm) | Standard
Deviation | −3 SD
(ppm) | +3 SD
(ppm) | Number of
Samples | Failures
≥ ±3SD | Failure Rate
(%) |
G311-3 | 0.27 | 0.02 | 0.21 | 0.33 | 9 | 0 | 0 |
G311-5 | 1.32 | 0.06 | 1.14 | 1.5 | 12 | 0 | 0 |
G312-1 | 0.88 | 0.09 | 0.61 | 1.15 | 101 | 1 | 1 |
G312-1_FAZALS | 0.88 | 0.09 | 0.61 | 1.15 | 4 | 0 | 0 |
G312-1_FAZLAB | 0.866 | 0.041 | 0.743 | 0.989 | 134 | 0 | 0 |
G314-2 | 0.99 | 0.04 | 0.87 | 1.11 | 21 | 0 | 0 |
G314-3 | 6.7 | 0.21 | 6.07 | 7.33 | 79 | 0 | 0 |
G314-3_FAZLAB | 6.701 | 0.113 | 6.362 | 7.04 | 899 | 0 | 0 |
G314-7 | 2.45 | 0.1 | 2.15 | 2.75 | 160 | 0 | 0 |
G314-7_FAZALS | 2.45 | 0.1 | 2.15 | 2.75 | 39 | 0 | 0 |
G314-7_FAZLAB | 2.45 | 0.1 | 2.15 | 2.75 | 150 | 1 | 1 |
G316-5 | 0.5 | 0.02 | 0.44 | 0.56 | 130 | 2 | 2 |
G316-5_FAZLAB | 0.487 | 0.016 | 0.439 | 0.535 | 96 | 0 | 0 |
G316-6 | 1.4 | 0.05 | 1.25 | 1.55 | 92 | 1 | 1 |
G316-6_FAZALS | 1.4 | 0.05 | 1.25 | 1.55 | 70 | 0 | 0 |
G316-6_FAZLAB | 1.394 | 0.056 | 1.226 | 1.562 | 45 | 0 | 0 |
G319-4_FAZLAB | 0.5 | 0.03 | 0.41 | 0.59 | 729 | 0 | 0 |
G319-4_FAZSGS | 0.5 | 0.033 | 0.401 | 0.599 | 91 | 0 | 0 |
G911-10 | 1.3 | 0.05 | 1.15 | 1.45 | 107 | 0 | 0 |
G911-4 | 2.43 | 0.09 | 2.16 | 2.7 | 2 | 0 | 0 |
G912-5 | 0.38 | 0.02 | 0.32 | 0.44 | 173 | 1 | 1 |
G912-5_FAZALS | 0.38 | 0.02 | 0.32 | 0.44 | 36 | 0 | 0 |
G912-5_FAZLAB | 0.369 | 0.014 | 0.327 | 0.411 | 49 | 0 | 0 |
G916-1 | 1.72 | 0.06 | 1.54 | 1.9 | 129 | 2 | 2 |
G916-1_FAZALS | 1.72 | 0.06 | 1.54 | 1.9 | 2 | 0 | 0 |
G916-1_FAZLAB | 1.702 | 0.051 | 1.549 | 1.855 | 930 | 1 | 0 |
G997-6 | 1.68 | 0.08 | 1.44 | 1.92 | 1 | 0 | 0 |
G998-6 | 0.8 | 0.06 | 0.62 | 0.98 | 2 | 0 | 0 |
OxE156_FAZALS | 0.642 | 0.018 | 0.588 | 0.696 | 91 | 1 | 1 |
OxE166_FAZALS | 0.652 | 0.016 | 0.604 | 0.7 | 230 | 1 | 0 |
OXE166_FAZSGS | 0.652 | 0.016 | 0.604 | 0.7 | 4 | 0 | 0 |
OxF181_FAZALS | 0.814 | 0.019 | 0.757 | 0.871 | 51 | 0 | 0 |
OxF181_FAZSGS | 0.814 | 0.019 | 0.757 | 0.871 | 168 | 0 | 0 |
SE114 | 0.634 | 0.016 | 0.586 | 0.682 | 14 | 0 | 0 |
SE114_FAZALS | 0.629 | 0.015 | 0.584 | 0.674 | 11 | 1 | 9 |
SE125_FAZALS | 0.618 | 0.011 | 0.585 | 0.651 | 4 | 0 | 0 |
SE125_FAZSGS | 0.618 | 0.011 | 0.585 | 0.651 | 78 | 1 | 1 |
SH98 | 1.4 | 0.028 | 1.316 | 1.484 | 17 | 0 | 0 |
SH98_FAZALS | 1.401 | 0.031 | 1.308 | 1.494 | 394 | 10 | 3 |
SH98_FAZSGS | 1.401 | 0.031 | 1.308 | 1.494 | 162 | 0 | 0 |
Si81_FAZALS | 1.781 | 0.037 | 1.67 | 1.892 | 12 | 1 | 8 |
Si81_FAZSGS | 1.79 | 0.03 | 1.7 | 1.88 | 78 | 1 | 1 |
Note: SD = standard deviation.
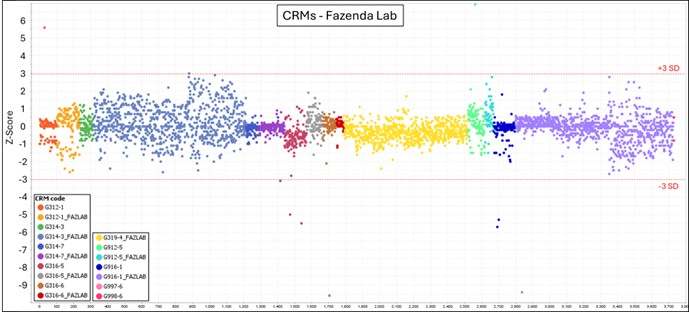


Figure 11-1: Z-Score Charts of CRM Results
Blanks
The blank material used is quartz vein purchased in bulk from Brasil Minas. During the 2021-2023 drilling campaigns, 5,859 blanks were inserted. Results indicate no significant contamination, with most results falling below the detection limits. However, some outliers in the Fazenda lab data were noted. Investigation indicated these likely represent sample swaps at the Fazenda lab, as discussed above. Corrective actions have been recommended. Blank performance is charted in Figure 11-2 to Figure 11-4.

Figure 11-2: Blank Assay Results-Fazenda Lab
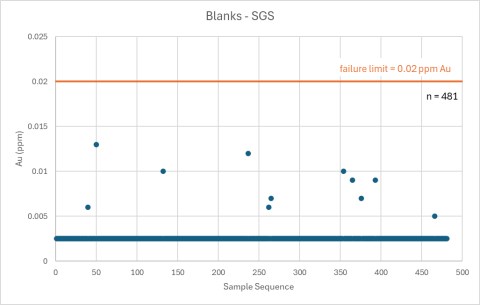
Figure 11-3: Blank Assay Results-SGS

Figure 11-4: Blank Assay Results-ALS
Duplicates, Twin Samples, and Lab Checks
Coarse Crush Duplicates
A total of 6,102 coarse crush duplicates were submitted from 2021 to 2023. All of these were processed and assayed at the Fazenda lab. Results are shown in Figure 11-5. No significant issues were detected; however, a small number of samples plot on either the X- or Y-axis. These are interpreted as sample swaps at the Fazenda lab as discussed in Section 11.2.4.
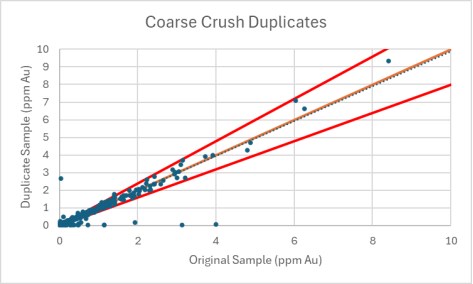
Figure 11-5: Scatterplot of Coarse Crush Duplicate Sample Results
Twin Samples
A total of 116 twin samples were submitted from 2021 to 2023. Results are shown in Figure 11-6 and Figure 11-7. The low number of twin samples is due to limited surface DDH drilling conducted during this period. No significant issues were detected. Agreement between primary and twin samples is good. Some scatter is noted at very-low gold grades. This is interpreted as natural variation in gold concentration between two halves of a core sample and is not a cause for concern.
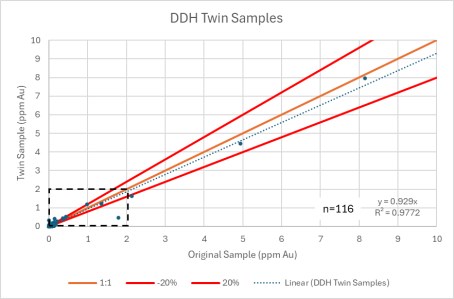
Figure 11-6: Scatterplot of DDH Twin Sample Results
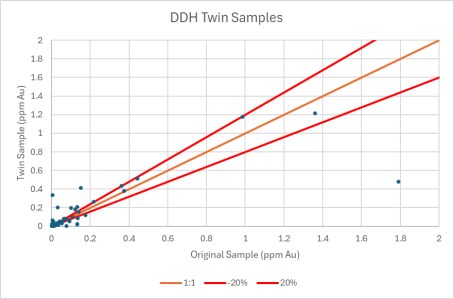
Figure 11-7: Scatterplot of the Same Data as Figure 11-6 with Results ≤2 ppm Au
Lab Checks
A total of 2,667 lab check (pulp replicate) samples were submitted from 2021 to 2023. Lab check studies were performed on each lab used. Results are shown in Figure 11-8 to Figure 11-12, with Fazenda as the primary lab and ALS and SGS as the check labs Figure 11-8. Two issues are noted for data from the Fazenda lab, including a pattern of samples plotting on either the X- or Y-axis and data scatter at low gold concentrations. The former are attributed to sample swaps at the Fazenda lab as discussed in Section 11.2.4. Data scatter is attributed to both sample swaps and natural variation in gold concentration. Results from SGS vs. ALS and ALS vs. SGS are very good.

Figure 11-8: Scatterplot of Lab Check Results (Fazenda Lab and ALS)
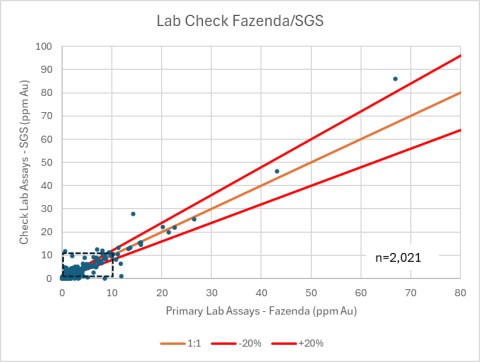
Figure 11-9: Scatterplot of Lab Check Results (Fazenda Lab and SGS)
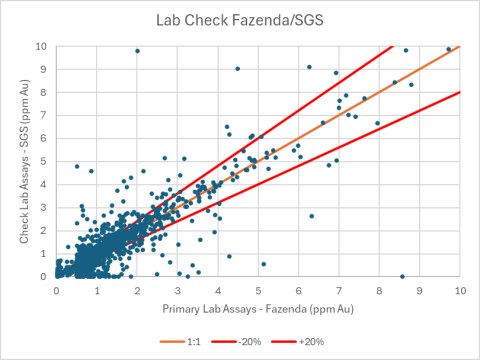
Figure 11-10: Scatterplot of the Same Data as Figure 11-5b with Results ≤10 ppm Au

Figure 11-11: Scatterplot of Lab Check Results with ALS as the Primary Lab and SGS as the Check Lab

Figure 11-12: Scatterplot of Lab Check Results with SGS as the Primary Lab and ALS as the Check Lab
Field Duplicates
In all, 850 field duplicates were submitted from 2021 to 2023. Results are shown in Figure 11-13. Field duplicates are sampled from RC drilling as described in Section 11.2.1. Agreement between original and duplicate samples is good and no systematic biases are noted.
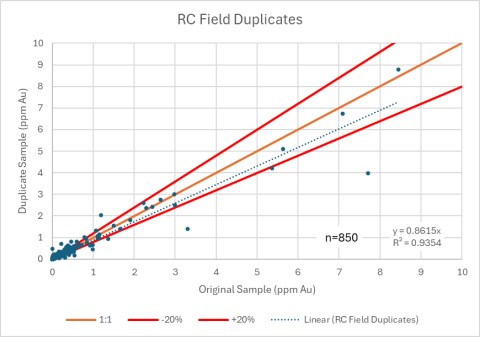
Figure 11-13: Scatterplot of RC Field Duplicate Sample Results
11.2.4 Fazenda QC Review and Laboratory Audit
An internal review of QC results in May 2023 identified several potential concerns and areas for improvement, which prompted a lab audit conducted in November 2023. The lab audit was completed by Dr. Benoit Poupeau, Dr. François-Bongarçon, and Equinox Gold personnel. Findings and resolutions include:
Apparent CRM sample swaps prior to shipment to the lab were recognized during the internal review. An internal investigation concluded that these were manual data entry errors rather than physical sample swaps. Improvements to data handling procedures were implemented and this issue has been resolved.
Irregular results and Z-Scores >3 from several CRMs assayed at the Fazenda lab were noted, which could indicate potential issues with assay accuracy or with CRM quality. An audit of the mine lab was conducted in response to these findings. Sub-optimal lab procedures were identified as the most likely cause, and targeted recommendations were provided, which included enhanced staff training and improved supervision protocols to mitigate future errors and uphold rigorous QA/QC standards.
Apparent sample swaps at the Fazenda lab were identified during the lab audit. Human error resulting from the use of multiple crucible trays with non-uniform sizes was identified as the most likely cause. Recommendations for removing this possible source of error were provided to the lab.
- Higher-than-expected frequency of low-grade gold in blank samples processed at the Fazenda lab were detected, although these anomalous assay results were below the failure threshold. The lab audit identified physical sample swaps at the lab (described above), which represented a blank sample swapped with a low-grade drill-core sample, as the most likely cause.
- The lab audit identified that the LIMS is not fully utilized. Recommendations were made for additional training and hardware upgrades.
11.3 Sample Security
The mine site is surrounded by a security fence, and there is controlled access at a gatehouse, which is staffed full-time by security personnel.
At the drill site, samples are under the control of FBDM employees and employees of the drilling company. Sample handling procedures at the drill rig are as described in Section 10. Drilling company personnel deliver samples daily to FBDM personnel at the mine's sample processing facility. Only employees of FBDM and of the drilling contractor are authorized to be at the drill sites and in the sample processing facility. Core is normally collected from the drill rig and taken directly to the core facility for processing and sampling. Samples are then sent directly to the chosen laboratory. All analytical pulps and archival split core are stored in a secure building within the mine fence.
11.4 Author Opinion
In the opinion of QP Dr. Benoit Poupeau, sample preparation, analytical methods, QA/QC, and security measures are of sufficient quality to support the MRE.
12 Data Verification
This section outlines the data verification procedures of Dr. Benoit Poupeau, the QP for the MRE presented in this Technical Report. The QP carried out comprehensive verification of the geological data, drilling, sampling, and assay results used to generate the MRE. The verification process involved a review of the procedures for both diamond drill core and RC drilling to ensure that the sampling and analytical methods meet industry standards. Additionally, Dr. Poupeau conducted an in-depth assessment of data integrity across multiple laboratories, with particular attention to resolving issues identified in assays from the Fazenda mine laboratory. The samples analyzed by the mine laboratory originate from now mined-out sections of the orebody and are representative of historical production, and have little to no impact on remaining Mineral Reserves and Mineral Resources.
12.1 Site Visit and Core Inspection
Dr. Poupeau made two visits to Fazenda from January 23 to 30, 2023, and from November 13 to 16, 2023. During the visits he conducted a lab audit in addition to the examinations of the following aspects:
- Core storage and condition: drill cores from the 2021, 2022, and 2023 drilling campaigns were inspected. It was noted that core samples and RC rejects from previous Fazenda owners were not retained. The cores from the more recent campaigns are stored in a well-organized, secure facility with proper labelling. The QP selected 20 core intervals from various drill holes for detailed inspection, focusing on those intervals corresponding to significant gold intersections.
- Sampling and logging procedures: the QP observed the core sampling and logging processes during the site visits. Core samples are halved using a diamond saw, with one half sent for analysis and the other half retained for reference. The QP noted that logging procedures are consistent and thorough, with detailed descriptions of lithology, alteration, mineralization, and structure accurately recorded in the database. Sampling intervals are typically around 0.5 to 1.0 m, but can vary to accommodate geological boundaries or vein contacts to ensure that the samples are representative of the mineralization boundaries.
12.2 Database Validation
The project database, exported from MX Deposit software on February 02, 2024, was subjected to a rigorous validation process. The validation aimed to ensure the accuracy, completeness, and reliability of the data used for the MRE. The QP focused on the following aspects:
- Assay data validation: assay results from 15 drill holes were randomly selected and cross-checked against original laboratory certificates ALS provided. No discrepancies were found between the database entries and the original laboratory results, confirming that the assay data in the database accurately reflects the laboratory-reported values.
- Collar coordinate verification: the QP did not check the collar coordinates with an alternate surveying method during his site visits; however, the current approach satisfies the requirements for an MRE. The collars are surveyed using a total station and reported in UTM coordinates before being converted into mine grid coordinates. The conversion from UTM to mine grid is performed by subtracting 400,000 m from the eastings and 870,000 m from the northings. The QP is confident that the collar coordinates are accurate based on the reliability of the surveying equipment used and the procedures followed. Thus, the collar coordinate data are adequate for MRE purposes and do not present any limitations.
- Downhole survey data check: the QP reviewed downhole survey data for 30 drill holes, verifying azimuths and dips at various depths against the planned survey, and conducting a statistical analysis. This verification process ensures that the recorded drill-hole paths aligned with the intended trajectories and did not reveal any significant deviations.
- Other tables: supplementary data tables, including rock quality designation, alteration, mineralization, and lithology, showed minor errors, such as instances of overlapping intervals in rock descriptions and inconsistencies in lithological codes and alteration types. Some gaps where data are incomplete or missing were also noted. The QP recommends correcting overlaps to ensure intervals are mutually exclusive; implementing standardized codes and descriptions for lithology and alteration to improve consistency; and filling in missing data where possible or noting gaps explicitly. These errors are minor and do not affect the resulting MRE. Addressing them will enhance data quality and support more precise geological interpretations.
Overall, the database validation process confirmed that the primary data used for the MRE-comprising assay results, collar coordinates, and downhole surveys-are accurate and reliable. Minor issues identified in supplementary data tables are being addressed to improve data cleanliness and consistency.
12.3 Independent Verification and Check Assays
The QP completed no independent verification; however, several external laboratories, including SGS and ALS, are routinely used as second or third laboratories to verify assay results (lab checks) and confirm the existence of no systematic bias. Check assays are regularly conducted between the mine laboratory, SGS, and ALS to ensure the accuracy and reliability of the data.
12.4 Conclusion
The data verification process for the Fazenda Gold Mine was comprehensive and thorough. Site visits, database validation, QA/QC review, and check assays collectively confirm that the data used in the MRE are accurate and reliable. Although the QP identified potential issues with some samples assayed by the mine lab, the data from areas that have already been mined out showed no significant discrepancies with the historical mill reconciliation. Consequently, these issues are not expected to affect other areas of the orebody or compromise the overall quality of the MRE. The exploration drill holes assayed by the mine lab (FBDM-BA) between 2021 and 2023 are illustrated in Figure 12-1 highlighting their limited impact on the current resource model relative to the broader dataset.
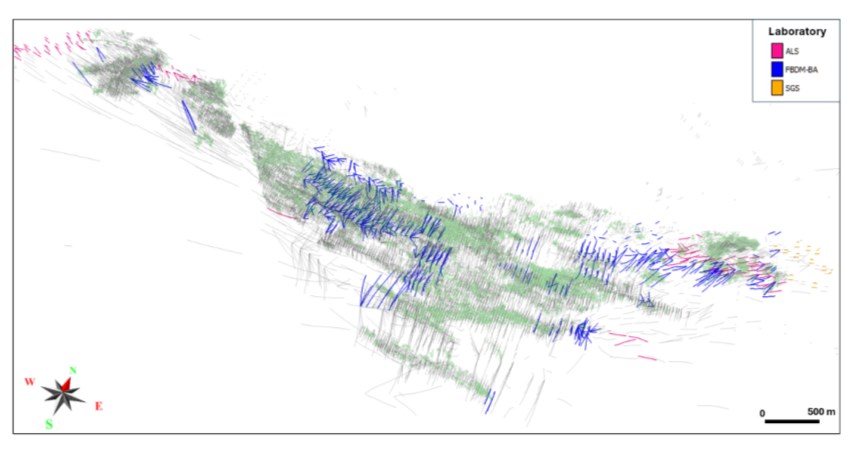
Figure 12-1: Drill Holes Assayed between 2021 and 2023-Current Drilling Definition (in Light Grey), Resource Stopes (in Green) at $2,000/oz
13 Mineral Processing and Metallurgical Testing
13.1 Metallurgical Testing
Extensive testwork programs have been undertaken at different laboratories for the Fazenda mine over the past four decades. Metallurgical testwork on samples from various deposits, ore sources, and ore types was conducted on drill core composites considered representative of the ore deposit at the time of each test program. The following presents mineral processing and metallurgical testing performed within the past five years at Fazenda.
13.1.1 Exploration Technological Characterization Testwork (SGS GEOSOL, 2024)
Exploration drill-hole samples were collected from both the CLX and Canto sequences, and submitted to SGS Geosol in Brazil for chemical analysis, gravity separation, and leaching. This testwork campaign was conducted from November 2023 to January 2024, and the results are summarized in Table 13-1.
Table 13-1: Summary of Test Results-GRG Knelson + CIL Kinects (24 h)
Sample | Feed Head Assay
(ppm) | Knelson
% Gold Recovery | 24 h Leaching
% Gold Extraction | Knelson + Leaching
% Global Gold Recovery |
FBDM_PPQ_MET 001_1 | 0.52 | 30.7 | 80.8 | 86.7 |
FBDM_PPQ_MET 001_3 | 2.20 | 36.1 | 85.2 | 90.6 |
FBDM_PPQ_MET 001_4 | 2.25 | 42.7 | 88.9 | 93.6 |
FBDM_PPQ_MET 001_5 | 0.70 | 32.4 | 83.1 | 88.5 |
FBDM_PPQ_MET 001_6 | 0.62 | 18.0 | 68.3 | 74.0 |
FBDM_PPQ_MET 001_8 | 0.64 | 20.9 | 77.2 | 82.0 |
FBDM_PPQ_MET 001_9 | 0.73 | 38.8 | 70.1 | 81.7 |
FBDM_PPQ_MET 001_10 | 0.92 | 24.9 | 81.4 | 86.0 |
FBDM_BSW_MET_002_01 | 0.57 | 41.4 | 82.2 | 89.6 |
FBDM_BSW_MET_002_02 | 1.09 | 40.3 | 86.1 | 91.7 |
FBDM_BSW_MET_002_03 | 8.13 | 54.0 | 83.4 | 92.4 |
FBDM_BSW_MET_002_04 | 1.96 | 13.3 | 84.8 | 86.8 |
FBDM_BSW_MET_002_05 | 0.78 | 40.4 | 78.4 | 87.1 |
FBDM_BSW_MET_002_06 | 0.79 | 31.5 | 74.3 | 82.4 |
The sample head grade was determined by means of fire assay triplicates and metallic screen, which is less affected by the nugget effect. The testwork results are summarized as:
- Sample head grades for the fire assay in triplicate ranged from 0.52 to 8.13 ppm Au (for FBDM_PPQ_MET 001_1 and FBDM_BSW_MET 002_3, respectively), and for the metallic screen method ranged from 0.46 to 5.07 ppm Au (for FBDM_PPQ_MET 001_1 and FBDM_BSW_MET 002_3, respectively).
- Grinding time to reach P80 75 µm ranged from 08:31 to 17:41 minutes (FBDM_BSW_MET_002_2 and FBDM_PPQ_MET 001_01, respectively).
- Gravity-recoverable gold (GRG) recovery ranged from 13.3% to 42.7% (FBDM_BSW_MET 002_4 and FBDM_PPQ_MET 001_4, respectively).
- Sample recovery in CIL kinetics curves in 24 h leaching time ranged from 70.1% to 88.9% (FBDM_QQP_MET 001_9 and FBDM_PPQ_MET 001_4, respectively).
- CIL kinetics demonstrate a general trend: a fast increase in gold extraction in the first 4 h, which then slows to a plateau after approximately 12 h of leaching.
- Global gold recovery ranged from 74.0% to 93.6% (FBDM_PPQ_MET 001_6 and FBDM_PPQ_MET_001_4, respectively).
13.2 Operational Improvements
13.2.1 Process Changes for Different Plant Feed Ore
Gold recovery was historically impacted when carbonaceous ore was initially fed to the plant in April 2019, which reduced the recovery to 89%. Following testwork with kerosene, the recovery increased and varied between 89% and 92%. In April 2020, the plant was fed with high sulphide-bearing ore, which again decreased the recovery to 89%. As a result, testing with lead nitrate was performed, and the recovery increased from 89% to 91%. The following points summarize the benefits of adding kerosene for high-carbonaceous ores, and lead nitrate for high-sulphide ores:
- To reduce gold recovery losses with more carbonaceous total organic carbon (TOC) ore in the blend, testwork using kerosene resulted in a gold recovery increase of approximately 2%.
- To reduce gold recovery losses with higher sulphides in the blend composition, lead nitrate proved to be efficient at accelerating gold dissolution in leaching, evidenced by a cyanide consumption reduction of approximately 10%, and gold recovery increase of approximately 2%.
13.2.2 Daily Geometallurgical Testwork
To improve production predictability and to foresee necessary process changes, FBDM performs daily bench-scale testwork with plant feed samples and with samples composed of ore forecast to be mined three months in the future. After the mine plan is issued by the geology department, drilling samples representing selected ore blocks are collected and submitted to the process laboratory for testwork. Testwork procedures consist of bottle roll tests to simulate a leaching circuit with a residence time of 24 h, 25 g/L of activated carbon, 600 ppm of sodium cyanide, pH corrected to 10.2, and 200 g/t of kerosene also dosed in the bottles.
13.2.3 Kerosene Addition to the Leaching Circuit (August 2019 Onwards)
To offset further gold losses after January 2019 due to the increase in carbonaceous ore in the feed blend composition, testwork was carried out using kerosene, which reported a gold recovery increase of approximately 2%. The process was modified in August 2019 to add kerosene to the circuit, which has continued to the present.
13.2.4 Lead Nitrate Addition to the Leaching Circuit (May 2020 Onwards)
High-sulphide and carbonaceous ores were introduced into the plant feed, which impacted the recovery with a 2% drop from 91% to 89%. To reduce gold recovery losses due to higher sulphide levels in the feed blend, testwork was carried out using lead nitrate, which proved to be efficient at passivating the exposed sulphide surfaces, and reported a 2% increase in gold recovery. Lead nitrate was added to the plant in May 2020 resulting in a gold recovery increase from 88% to 90%.
13.2.5 Optimized Leaching Particle Size (December 2020 Onwards)
In November 2020, overall plant recovery (gravity gold + cyanide leaching gold) decreased from 91% to 89% due to carbonaceous ores with high gold pre-robbing potential and encapsulation of gold in high-sulphide bearing ores being fed to the plant from the Canto Sequence ore source.
Grind optimization testwork was performed, without the addition of kerosene and lead nitrate, to determine the optimum grind size to maintain an overall recovery of 91%. Testwork results showed that a finer grind size was required to offset the overall recovery loss of 2%, and the lowest limit to prevent gold losses was P80 75 µm. Figure 13-1 illustrates the effect of grind size on gold recovery.
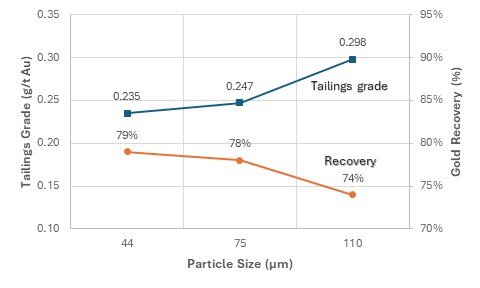
Figure 13-1: Influence of Grind Size (P80) on Gold Recovery
To reach P80 75 µm, the following process modifications were performed:
- Reduced the particle feed size to the ball mill by changing the screen openings of the tertiary screens from 8 to 5 mm.
- Increased the steel ball charge from 32% to 38%.
- Reduced the hydrocyclone apex diameter from 110 to 100 mm.
With these modifications, the process plant is presently operating at a product particle size of P80 75 µm.
13.2.6 pH Optimization
The pH was controlled by dosing lime at 1,100 g/t in the cyanide dosing tank prior to 2020 at a target pH of 9.8. The lime addition was changed to the pre-aeration tank, which resulted in better control of the pH, and a new pH target was set at 10.2. This change improved pH control by making use of the buffering effect of lime and residence time, which resulted in improving the effectiveness of adding lead nitrate, which reduced cyanide consumption by approximately 10%.
13.2.7 Elution Recovery Optimization
The current first step of the elution process is desorption, which removes the gold from the carbon; the second step is acid washing, which removes base metals and scaling compounds such as calcium carbonate and sodium silicate from the carbon. Current elution efficiency is approximately 90%; however, testwork needs to be performed to determine if it will be more efficient to use an acid wash before rather than after desorption in the current operation.
13.2.8 Installation of Regeneration Kiln
A process study was carried out in 2022 on the activity of regenerated carbon. The kiln's regenerative activity was 25% on average, which negatively affecting the performance of gold adsorption. As such, the kiln was replaced in 2023, with a higher capacity (500 kg/h), and improved carbon regenerative activity to 90%.
13.3 Necessary Structural Refurbishment
Due to the age of the process plant, several structural repairs are necessary, such as refurbishing the following:
Leaching tank support pillars
Leaching area tanks and steel support channels
Desorption building support beams
Milling building columns and structural beams
FBDM's maintenance department has prepared a structural repair schedule to be performed over the next three years (2025 to 2027).
13.4 Next Steps
An action plan is ongoing to continue with the improvements to the processing plant. The main initiatives are:
- Developing a long-term geometallurgy database and that integrates with short-term planning and operations
- Analyzing the particle-size distribution of blasted ore.
14 Mineral Resource Estimates
14.1 Summary of Mineral Resource Estimate
Dr. Benoit Poupeau, the QP responsible for this section, prepared this MRE for the Fazenda mine, which has been prepared following the Canadian Institute of Mining, Metallurgy and Petroleum (CIM) CIM Definition Standards for Mineral Resources & Reserves (CIM Definition Standards) (CIM, 2014) (adopted May 19, 2014) and is reported in accordance with NI 43-101.
The current MRE for Fazenda includes the following deposits (Figure 14-1): CLX (encompassing CLX and the Canto 1 and Canto 2 deposits as shown in Figure 14-2); F&G; Pau-a-Pique (PPQ); LG; BRSW; BR; and Papagaio & Raminhos (PR). Table 14-1 shows the codes and naming conventions used to describe these deposits.
Table 14-1: Codes and Descriptions for Each Deposit
Deposit | Other Naming | Block Model Naming | Comment |
CLX | - | CL | CLX deposit includes CLX, Canto 1, and Canto 2 pits |
F&G | FG | FG | F and G deposits |
Pau-a-Pique | PPQ | PP | |
Lagoa do Gato | LDG | LG | |
Barrocas SW | BSW | BS | |
Barrocas | BR | BR | Previously called FW Oeste |
Papagaio & Raminhos | PR | PR | |
The effective date of the MRE for all listed deposits is June 30, 2024. This estimate incorporates validated data from 197,098 m of recent exploration and grade-control drilling, which were reviewed and assessed to support the integrity of the Mineral Resource model.

Note: Map based on Mine grid.
Figure 14-1: Fazenda Deposit Block Model Locations
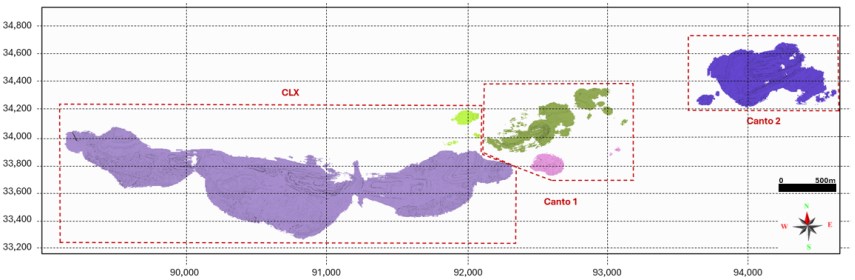
Note: Map based on Mine grid.
Figure 14-2: Deposits in the CL Block Model Area
14.2 Method and Data Sources
14.2.1 Software
Equinox Gold's exploration team performed geologic interpretations using Leapfrog 2022.1 (and later versions, up to Leapfrog 2023.2). The MRE was completed using Isatis Neo 2023.2.
14.2.2 Drill-Hole Databases
Equinox Gold provided the drill-hole databases supporting the MRE, which are summarized in Table 14-2. Drilling completed after the database cut-off date has not been incorporated into the current MRE, and it is not considered material.
Table 14-2: Summary of Databases Informing Mineral Resource Estimates
Deposit | Database | Delivery
(DD/MM/YYYY) | Database
Cut-Off Date
(DD/MM/YYYY) | Drilling
Method | Number of
Holes | Total
Metres | Number of
Samples |
PPQ, F&G, CLX and PR | Exploration | 21/02/2024 | 21/02/2024 | RC | 1,124 | 64,765 | 64,534 |
DD | 34,737 | 2,282,890 | 1,376,883 |
Grade Control | 21/02/2024 | 21/02/2024 | RC | 46 | 2,199 | 1,597 |
DD | 2,340 | 86,426 | 76,547 |
Barrocas SW | Exploration | 17/06/2024 | 17/06/2024 | DD | 51 | 4,477 | 4,513 |
RC | 114 | 9,099 | 9,089 |
Barrocas | Exploration | 20/06/2024 | 20/06/2024 | DD | 179 | 20,978 | 13,260 |
RC | 30 | 2,144 | 2,144 |
Lagoa do Gato | Exploration | 17/06/2024 | 17/06/2024 | DD | 19 | 46,216 | 43,661 |
RC | 303 | 2,120 | 2,118 |
Notes: DD = diamond drill; RC = reverse circulation.
14.2.3 Data Handling
The drill-hole databases were accepted with only minor modifications, which included the following:
Intervals representing unsampled or missing assay results were excluded to ensure the dataset used for MRE contained only complete and reliable data.
Rotary air blast (RAB), blastholes (BH), trenches (TR), and outcrop channels (OCH) were excluded from the MRE. These methods typically produce data of lower quality or precision compared to diamond (DD) or RC drilling. RAB and BH methods, for instance, often result in poor sample recovery and contamination risks, while TR and OCH data lack the depth control and geological consistency required for reliable resource modelling.
- Drill-hole FA-01434, in the PPQ area, was excluded from the MRE due to specific quality or reliability issues associated with its data, which could introduce inaccuracies into the Mineral Resource model.
14.2.4 Editing of the Block Models
Each block model was populated with density, topography, weathering, lithologies, and grade shell data to represent the characteristics of the mineralized zones.
Topography
A pre-mining digital terrain elevation model (DTEM) was generated for each deposit using drill-collar coordinates supplemented with photogrammetric or LiDAR survey data where available.
Table 14-3: Summary of Topographic Surveys Used for the Mineral Resource Estimate
Deposit | Acquisition Date
(DD/MM/YYYY) |
Fazenda (PPQ, F&G, CLX, and PR) | 28/03/2024 |
Barrocas | 21/06/2024 |
Barrocas SW | 21/06/2024 |
Lagoa do Gato | 29/06/2024 |
The resulting DTEMs were assigned to the block model based on block centroids.
Domain Assignment for Weathering, Lithological, and Mineralized Zone Domains
The weathering, lithological, and mineralized zone domains for blocks were assigned codes based on their centroids. Table 14-4 outlines the codes used to flag the block model according to the available information, including weathering, geology, and grade shells. In certain deposits, such as CLX, these codes were combined to provide a more comprehensive classification.
Table 14-4: Summary of Wireframes and Codes Used for the Mineral Resource Estimate
Type | Deposit | Wireframe Name | Code | Comments |
Weathering | All | Soil/ Saprolite | 1 | |
Transition | 2 |
Fresh Rock | 3 |
Lithology | PPQ, F&G, CLX, and PR | Canto | 100 | These rock codes could be combined with the weathering codes. For instance, 203 represents fresh rock CLX |
CLX | 200 |
Fazenda | 300 |
GRX | 400 |
Inco | 500 |
Barrocas SW | Lithology 'A' | 1,000 | |
Lithology 'B' | 2,000 |
Lithology 'C' | 3,000 |
Lithology 'D' | 4,000 |
Lithology 'E' | 5,000 |
Lithology 'F' | 6,000 |
Unknown lithology | 7,000 |
Type | Deposit | Wireframe Name | Code | Comments |
| Lithology | Barrocas | Canto | - | The lithology field was coded from the wireframe names. |
| CAX | - |
| Fazenda | - |
| Riacho do Inco Footwall (RdI_FW) | - |
| Riacho do Inco | - |
Lagoa do Gato | Bas_1 | - | The lithology field was coded from the wireframe names. |
DAC | - |
MT | - |
TON | - |
Mineralized Zone | PPQ, F&G, CLX | FBDM_Au_Grade_Shell_-_Canto
FBDM_Au_Grade_Shell_-_CLX | - | The mineralized zone field was coded from the wireframe names. |
PR | FBDM_Au_Grade_Shell_-_Canto | - | The mineralized zone field was coded as 1, when the blocks were within it, or 0. |
Barrocas SW | EQX_FBDM_BSW_GS_GK_-_1
EQX_FBDM_BSW_GS_GK_-_2
EQX_FBDM_BSW_GS_GK_-_3
EQX_FBDM_BSW_GS_GK_-_4
EQX_FBDM_BSW_GS_GK_-_5
EQX_FBDM_BSW_GS_GK_-_6
EQX_FBDM_BSW_GS_GK_-_7
EQX_FBDM_BSW_GS_GK_-_8
EQX_FBDM_BSW_GS_GK_-_9
EQX_FBDM_BSW_GS_GK_-_10
EQX_FBDM_BSW_GS_GK_-_11 | - | |
Barrocas | BARROCAS | - | The mineralized zone field was coded as 1 when the blocks were within it, or 0 otherwise. Selections were used to separate each vein during estimation. |
Lagoa do Gato | 18062024_LagaoDoGato_merged | - | The mineralized zone field was coded from the wireframe name. |
Density
Density was determined using the wax immersion method. Outliers were removed from histogram analysis, and the resulting average densities were assigned to each domain (Table 14-5).
PAGE 14-6 |
January 31, 2025 |
Table 14-5: Summary of Average Density Values for Fazenda Deposits
Deposit | Domain | Average Bulk Density
(g/cm3) | Number of
Samples |
PPQ, F&G, CLX, PR | 101 | 2.61 | 25 |
102 | 2.67 | 63 |
103 | 2.73 | 11,376 |
201 | 2.73 | 3 |
202 | 2.73 | 2 |
203 | 2.88 | 4,179 |
301 | 2.75 | 34 |
302 | 2.76 | 30 |
303 | 2.78 | 1,553 |
403 | 2.70 | 71 |
501 | 2.79 | 34 |
502 | 2.79 | 50 |
503 | 2.82 | 546 |
Lagoa do Gato | DAC | 2.66 | 614 |
MT | 2.81 | 1 |
TON | 2.73 | 46 |
BSW | All | 3.08 | 90 |
Barrocas | Canto | 2.82 | 0 |
Cax | 2.8 | 83 |
Fazenda | 2.86 | 397 |
RdI_FW | 2.82 | 22 |
Riacho do Inco | 2.79 | 340 |
14.3 Mineral Reserves
To report Mineral Resources exclusive of Mineral Reserves, portions of the mineralized zone domains that intersect or are contained within Mineral Reserve shapes-such as open pit designs and underground development areas, including stopes-were excluded from the MRE.
14.4 Limitations on Data
There were no material limitations impacting the accuracy or completeness of the MRE. Data coverage and density are sufficient across each deposit area to support the classification categories assigned. Areas of lower drill density have been conservatively classified as Unclassified or Inferred Mineral Resources to account for any uncertainty.
14.5 Independent Data Verification
In addition to the QP's reviews, the drill-hole data have undergone independent validation by AMC Consultants, an external party who confirmed the database's integrity for use in this MRE. This independent review supports the data's accuracy and reliability, with no discrepancies identified that would significantly impact the estimate.
14.6 Geological Models
14.6.1 Regolith Models
Regolith contacts between soil, soil-transition, and transition-fresh zones were delineated for all deposits using drill-hole interval selection and cross-sectional interpretation, based on logged regolith data. These surfaces were then used to assign densities throughout the deposits. Due to the limited thickness of the soil/saprolite and transition zones-typically less than 8 m-the mineralized zones were not subdivided by these weathering surfaces, as their thin profile provided insufficient sample quantities for reliable estimation within these specific domains.
14.6.2 Geological Models
The gold deposits evaluated in this report are located along the Weber Belt, a 10 km-long, arcuate, east-west-trending, south-dipping shear zone. Near its western end, the belt is sharply folded southward. The Weber Belt hosts the most significant gold mineralization within the RIGB.
The Weber Belt is composed of four distinct lithological units from south to north:
Inco: predominantly composed of carbonate-chlorite schist (CCX) with minor interlayers of carbonaceous schist, interpreted to have originated from basaltic lava flows. The Inco unit serves as the hanging wall to the mineralized zones.
Fazenda Brasileiro unit: primarily composed of mafic schists and contains the most significant concentrations of gold within the belt. It is further divided into three distinct subunits:
- GRX: this graphitic schist layer forms the hanging wall of the main mineralized zones and is an important marker horizon due to its lateral continuity and distinctive geophysical characteristics.
- Chlorite-magnetite schist (CLX): consisting of two prominent layers averaging 20 and 3 m thick; the CLX unit is subjacent to the GRX layer and hosts the primary ore shoots.
- Intermediate sequence: consists of primarily chlorite-carbonate schist (CAX) and represents a different rock type than the main ore body. This unit is derived from weakly altered gabbroic bodies with ophitic to subophitic textures and occur adjacent to and between the two CLX units.
Canto unit: primarily consists of fine-grained carbonaceous sediments, including pelites, rhythmically banded pelites, and psammites, as well as volcanic layers and an agglomeratic pyroclastic sequence.
Abóbora unit: situated at the northernmost part of the Weber Belt, the Abóbora unit is characterized by a thick sequence of basalt flows interspersed with narrow, intermittent sedimentary layers. This unit serves as a geological boundary for the Weber Belt and generally has a lower mineral potential compared to the other units.
14.6.3 PPQ, F&G, CLX, Canto, and PR Deposits
The mineralization in the PPQ, F&G, CLX, Canto, and PR deposits is hosted within the CLX and Canto lithological domains. The mineralized zones have been defined by wireframes, modelling areas where gold grades exceed 0.25 g/t, based on both assay data and the structural model developed by the exploration team (Figure 14-3, Figure 14-4).

Notes: TTG refers to Tonalite-Trondhjemite-Granodiorite, a suite of intrusive igneous rocks. These units are present to the north and south of the Weber Belt.
Map based on Mine grid.
Figure 14-3: Geological Model of PPQ, F&G, CLX, and PR Deposits
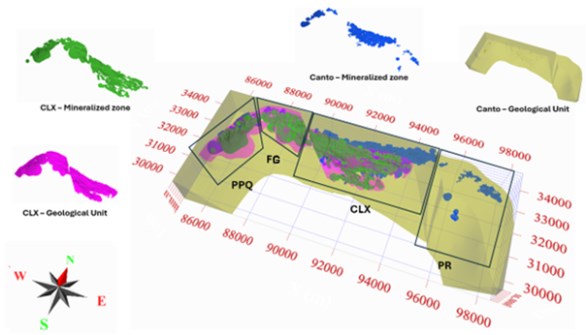
Note: Map based on Mine grid.
Figure 14-4: CLX and Canto Mineralized Zones, Showing the Location of the PPQ, F&G, CLX, and PR Deposits
14.6.4 Barrocas and Barrocas SW Deposits
The BR and BR SW deposits are southwest of the PPQ deposit along the Weber Belt. The geological modelling for these deposits was based on limited structural and lithological data, which guided the development of grade shells encompassing areas with gold grades above 0.25 g/t (Figure 14-5).

| 
|
Barrocas SW | Barrocas |
Note: Map based on Mine grid.
Figure 14-5: Mineralized Zones in Barrocas SW and Barrocas Deposits
14.6.5 Lagoa do Gato
LG is northeast of the PR deposit. Due to limited preserved information on LG, the geological model was extrapolated from the FBDM exploration team's surface mapping. Grade shells defined by gold grades above 0.25 g/t were created using structural data from surface mapping to guide the interpretation (Figure 14-6).
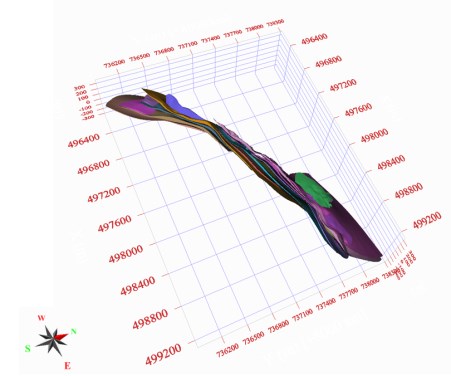
Note: Map based on Mine grid.
Figure 14-6: Mineralized Zones-Lagoa Do Gato
14.6.6 Buffer Zone
A 10-m buffer zone (Figure 14-7) was modelled around the mineralized zones to account for potential dilution during the design phase for both underground and open-pit operations.
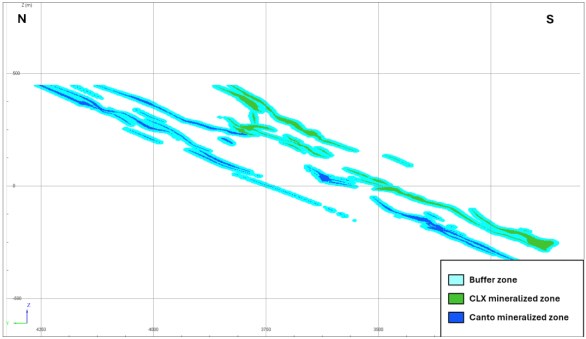
Figure 14-7: Buffer Zone Around the Mineralized Zones-CLX Deposit (Section: X=91,992 m)
14.7 Exploratory Data Analysis
14.7.1 Grade Capping
A consistent method was applied for grade capping of gold, sulphur, and TOC across all deposits to ensure a robust and accurate MRE. This process was undertaken to minimize the impact of high-grade outliers on the estimation model. The method for grade capping included the following steps:
Uncapped samples were evaluated to assess the spatial continuity of high-grade outliers across each deposit.
Sample statistics were calculated using length-weighted values, incorporating probability plots, cumulative-frequency distributions, and assessments of the mean and coefficients of variation relative to potential top-cut values.
Top-cut values were selected primarily based on population breaks observed in probability plots and histograms.
Once selected, top-cut values were applied to samples before compositing to retain the representativeness of capped values within the dataset.
- After capping, composite statistics were re-evaluated using probability plots and cumulative frequency plots to verify the appropriateness of the chosen top-cut values.
Summaries of the capping values by deposit and domain are given in Table 14-6 for gold, Table 14-7 for sulphur, and Table 14-8 for TOC. The buffer domain is a 10 m envelope wrapping the mineralized zones.
Table 14-6: Summary of Capping Values for Gold by Deposit
| Deposit | Domain | Number of
Assays | Length-Weighted
Average
Gold Grade
(g/t) | Capping
Value
(g/t) | Number of
Samples
Capped | Length-Weighted
Average
Capped Gold
Grade
(g/t) |
| CLX | CLX | 290,449 | 2.46 | 18.00 | 7,325 | 2.07 |
| Canto | 94,358 | 1.35 | 13.00 | 1,171 | 1.08 |
| Buffer | 417,296 | 0.15 | 1.50 | 2,624 | 0.10 |
| F&G | CLX | 66,927 | 1.27 | 12.00 | 667 | 1.18 |
| Canto | 1,292 | 0.66 | 7.00 | 7 | 0.66 |
| Buffer | 53,370 | 0.14 | 1.50 | 425 | 0.11 |
| PPQ | CLX | 14,250 | 1.13 | 18.00 | 52 | 1.06 |
| Canto | 4,384 | 0.94 | 9.00 | 19 | 0.78 |
| Buffer | 24,365 | 0.11 | 1.50 | 108 | 0.09 |
| PPR | Canto | 1,985 | 1.74 | 9.00 | 54 | 1.39 |
| Buffer | 17,417 | 0.10 | 1.50 | 28 | 0.10 |
| Lagoa do Gato | GS_JR_-_Vein_21 | 26 | 0.43 | 1.00 | 3 | 0.40 |
| GS_JR_-_Vein_20 | 44 | 0.37 | 1.52 | 0 | 0.37 |
| GS_JR_-_Vein_19 | 294 | 0.59 | 4.00 | 6 | 0.51 |
| GS_JR_-_Vein_17 | 61 | 0.49 | 0.80 | 9 | 0.31 |
| GS_JR_-_Vein_18 | 47 | 0.26 | 0.92 | 1 | 0.26 |
| GS_JR_-_Vein | 89 | 0.81 | 1.50 | 9 | 0.56 |
| GS_JR_-_Vein_15 | 48 | 0.30 | 0.50 | 5 | 0.26 |
| GS_JR_-_Vein_13 | 274 | 0.43 | 2.00 | 6 | 0.40 |
| GS_JR_-_Vein_10 | 617 | 0.43 | 2.50 | 10 | 0.41 |
| GS_JR_-_Vein_7 | 794 | 0.34 | 2.30 | 8 | 0.32 |
| GS_JR_-_Vein_9 | 768 | 0.50 | 3.20 | 10 | 0.38 |
| GS_JR_-_Vein_11 | 114 | 0.43 | 1.10 | 7 | 0.38 |
| GS_JR_-_Vein_12 | 111 | 0.30 | 0.65 | 6 | 0.27 |
| GS_JR_-_Vein_6 | 437 | 0.31 | 1.50 | 8 | 0.29 |
| GS_JR_-_Vein_5 | 832 | 0.86 | 3.90 | 31 | 0.57 |
| GS_JR_-_Vein_4 | 661 | 0.42 | 1.80 | 16 | 0.38 |
| GS_JR_-_Vein_3 | 2,628 | 0.48 | 4.00 | 26 | 0.46 |
| GS_JR_-_Vein_2 | 327 | 0.33 | 1.00 | 15 | 0.29 |
| GS_JR_-_Vein_1 | 3,301 | 0.60 | 6.00 | 17 | 0.57 |
| Buffer | 34,306 | 0.09 | 1.50 | 48 | 0.08 |
| Deposit | Domain | Number of
Assays | Length-Weighted
Average
Gold Grade
(g/t) | Capping
Value
(g/t) | Number of
Samples
Capped | Length-Weighted
Average
Capped Gold
Grade
(g/t) |
Barrocas SW | EQX_FBDM_BSW_GS_GK_-_1 | 558 | 0.95 | 4.00 | 20 | 0.70 |
EQX_FBDM_BSW_GS_GK_-_2 | 571 | 0.86 | 8.00 | 4 | 0.84 |
EQX_FBDM_BSW_GS_GK_-_3 | 125 | 0.77 | 1.80 | 10 | 0.52 |
EQX_FBDM_BSW_GS_GK_-_4 | 23 | 0.39 | - | 0 | 0.40 |
EQX_FBDM_BSW_GS_GK_-_5 | 51 | 0.42 | 0.80 | 5 | 0.29 |
EQX_FBDM_BSW_GS_GK_-_6 | 47 | 0.65 | 0.90 | 3 | 0.35 |
EQX_FBDM_BSW_GS_GK_-_7 | 97 | 0.96 | 4.00 | 2 | 0.91 |
EQX_FBDM_BSW_GS_GK_-_8 | 63 | 2.77 | 6.00 | 3 | 1.23 |
EQX_FBDM_BSW_GS_GK_-_9 | 15 | 0.42 | 1.22 | 1 | 0.42 |
EQX_FBDM_BSW_GS_GK_-_10 | 51 | 0.90 | 1.30 | 5 | 0.47 |
EQX_FBDM_BSW_GS_GK_-_11 | 6 | 0.87 | 1.00 | 1 | 0.40 |
Buffer | 7,429 | 0.09 | 1.00 | 14 | 0.09 |
Barrocas | Grade Shells-Vein_1 | 87 | 0.55 | 1.40 | 3 | 0.41 |
Grade Shells-Vein_2 | 765 | 1.10 | 4.30 | 46 | 0.88 |
Grade Shells-Vein_3 | 1,352 | 1.49 | 11.00 | 40 | 1.36 |
Grade Shells-Vein_4 | 947 | 1.69 | 11.00 | 42 | 1.40 |
Grade Shells-VeinEast_1 | 39 | 0.48 | 1.10 | 4 | 0.42 |
Grade Shells-VeinEast_2 | 17 | 4.36 | 1.50 | 4 | 0.76 |
Grade Shells-VeinWest_1 | 95 | 0.66 | 1.50 | 8 | 0.52 |
Grade Shells-VeinWest_2 | 37 | 0.31 | 0.50 | 2 | 0.21 |
Buffer | 12,413 | 0.11 | 1.30 | 22 | 0.11 |
Table 14-7: Summary of Capping Values for Sulphur by Deposit
Deposit | Domain | Number of
Assays | Length-Weighted
Average Sulphur Grade
(%) | Capping
Value
(%) | Number of
Samples Capped | Length-Weighted
Average Capped Sulphur Grade
(%) |
CLX | CLX | 978 | 0.84 | 4 | 5 | 0.74 |
Canto | 4,023 | 0.69 | 2.8 | 11 | 0.69 |
F&G | CLX | 93 | 0.83 | 2.7 | 3 | 0.79 |
Canto | 291 | 0.69 | 2 | 8 | 0.66 |
PPQ | CLX | 357 | 1.34 | 4 | 15 | 1.23 |
Canto | 168 | 0.77 | 2.8 | 6 | 0.74 |
PPR | Canto | 74 | 0.16 | - | 0 | 0.16 |
Table 14-8: Summary of Capping Values for Total Organic Carbon by Deposit
Deposit | Domain | Number of
Assays | Length-Weighted
Average TOC
(%) | Capping
Value
(%) | Number of
Samples Capped | Length-Weighted
Average Capped TOC
(%) |
CLX | TOC | 11,868 | 0.48 | 3.6 | 24 | 0.48 |
PPQ | TOC | 64 | 0.78 | 2.2 | 1 | 0.77 |
14.7.2 Compositing
Given that the modal sample length from all exploration and grade control databases is 1.0 m, a composite length of 1.0 m was selected for all samples across the databases. The compositing process was configured to respect mineralized zone boundaries, with composites broken at these boundaries to ensure accurate representation of grade distribution within each zone.
This composite summary in Table 14-9 provides an overview of sample and composite statistics for each deposit, showing that the mean grade values remain consistent after compositing, thereby preserving the integrity of the data within each mineralized zone.
Table 14-9: Composite Summary
Deposit | Mineralized Zone | Statistics Before Compositing and After
Capping | Statistics After Compositing and After
Capping |
Number of Samples | Mean | Number of Composites | Mean |
CLX | CLX | 290,449 | 2.072 | 236,686 | 2.070 |
Canto | 94,358 | 1.081 | 86,174 | 1.080 |
FG | CLX | 66,927 | 1.180 | 59,053 | 1.180 |
Canto | 1,292 | 0.611 | 1,257 | 0.613 |
PPQ | CLX | 14,250 | 1.056 | 13,486 | 1.056 |
Canto | 4,384 | 0.784 | 4,188 | 0.784 |
PR | Canto | 1,985 | 1.392 | 1,744 | 1.392 |
Lagoa do Gato | | 11,473 | 0.462 | 11,373 | 0.463 |
Barrocas | | 7,990 | 0.997 | 7,732 | 0.997 |
Barrocas SW | | 1,607 | 0.732 | 1,602 | 0.731 |
14.7.3 Declustering
To achieve representative estimates within the mineralized zones, declustering weights for composite samples were calculated using cell declustering. Cell sizes were set to two or three times the primary drill-hole spacing, ensuring appropriate spatial weighting across each deposit and minimizing the potential for sampling bias in areas of high drill-density.
14.7.4 Boundary Analysis
Boundary analysis was conducted for each mineralized zone within each deposit to determine the appropriate treatment of domain boundaries during the estimation process. After evaluating the grade distribution across boundaries, hard boundaries were applied between mineralized zones and host rocks for all deposits. This approach ensures clear differentiation between mineralized zones and surrounding material.
14.8 Variography
Directional variograms were calculated and modelled for each deposit to assess spatial continuity and inform grade estimation parameters. A summary of the variogram model parameters for each deposit is provided in Table 14-10.
Table 14-10: Variogram Model Parameters by Deposit
Deposit | Domain | Dip
(°) | Dip
Azimuth
(°) | Pitch
(°) | Nugget | Range 1
(U, V, W)
(m) | CC 1
(g/t)2 | Range 2
(U, V, W)
(m) | CC 2
(g/t)2 | Range 3
(U, V, W)
(m) | CC 3
(g/t)2 |
CLX | CLX-All | 45 | 180 | 0 | 3.445 | 2.8 | 4.227 | 13.0 | 1.984 | 30 | 1.273 |
5.9 | 9.7 | 91.1 |
5.0 | 11.0 | 11.5 |
CLX-Main Zones | 45 | 180 | 0 | 0.2930 | 3.0 | 0.3353 | 10.0 | 0.1898 | 20.0 | 0.1815 |
5.0 | 10.0 | 80.0 |
3.8 | 11.3 | 25.0 |
Canto-All | 45 | 180 | 0 | 0.962 | 5.0 | 1.012 | 7.0 | 1.073 | 10.0 | 0.753 |
5.0 | 7.0 | 10.0 |
3.5 | 13.0 | 75.0 |
Canto-Main Zones | 45 | 180 | 0 | 0.6953 | 5.0 | 0.7315 | 7.0 | 0.7758 | 10.0 | 0.5439 |
5.0 | 7.0 | 10.0 |
3.5 | 13.0 | 75.0 |
FG | Canto | 45 | 180 | | 0.3458 | 25 | 0.2508 | 50.0 | 0.1061 | | |
30 | 45.0 |
2.5 | 12.0 |
CLX | 45 | 180 | | 1.198 | 2.5 | 1.067 | 5.0 | 0.946 | | |
2.0 | 10.0 |
8.0 | 11.0 |
PPQ | Canto | 50 | 110 | 90 | 0.9140 | 50 | 0.2404 | 60.0 | 0.3449 | | |
100 | 400.0 |
3.0 | 8.0 |
CLX | 50 | 110 | 90 | 2.239 | 2.0 | 0.669 | 4.0 | 0.277 | 5.0 | 0.405 |
15 | 20 | 22.0 |
2.5 | 5.7 | 12.0 |
PR | Canto | 20 | 210 | 90 | 0.863 | 5.0 | 1.454 | 10.0 | 1.378 | | |
10.0 | 15.0 |
2.0 | 5.5 |
Lagoa do Gato | - | 60 | 330 | 90 | 0.1198 | 10.0 | 0.1180 | 25.0 | 0.215 | 2500.0 | 0.0280 |
8.0 | 10.0 | 15.0 |
5.0 | 12.0 | 15.0 |
Barrocas | - | 20 | 125 | 0 | 1.489 | 5.0 | 1.499 | 10.0 | 1.499 | 12.0 | 0.545 |
7.0 | 10.0 | 12.0 |
2.5 | 4.0 | 10.0 |
Barrocas SW | - | 30 | 135 | 0 | 0.5374 | 53 | 0.2471 | 55.0 | 0.1136 | | |
50 | 75.0 |
1.1 | 25.0 |
Notes: CC = Variance Structure.
The reference space (X, Y, Z) attached to the coordinates become (U, V, W) in the rotated space.
14.9 Estimation
A 10 m-wide buffer was calculated around all mineralized zones and estimated using inverse distance weighting to the third power (IDW³). Within the mineralized zones, locally varying anisotropy (LVA) was applied based on a reference surface representing the midpoints between the mineralized zone footwall and hanging wall. The search ellipse orientations for the anisotropy model were coded into the block model. TOC and sulphur elements were estimated by IDW³ with the same neighborhood. Gold-grade estimation was completed using ordinary kriging (OK).
The block model definitions and search-interpolated parameters are summarized for each deposit in Table 14-11 and Table 14-12.
Table 14-11: Open Pit Block and Underground Model Definitions by Deposit
Block Model | Type | Axis | Block Size
(m) | Block Rotation
(°) | Base Point
(centre) | Block
Count |
CL | Open Pit | X | 4 | 0 | 89,152 | 1,600 |
Y | 2 | 0 | 32,501 | 1,250 |
Z | 2.5 | 0 | -848.75 | 520 |
Total Number of Blocks | 1,040,000,000 |
CL | Underground | X | 2 | 0 | 89,151 | 3,200 |
Y | 2 | 0 | 32,501 | 1,250 |
Z | 2 | 0 | -849 | 650 |
Total Number of Blocks | 2,600,000,000 |
FG | Open Pit | X | 4 | 0 | 86,582 | 645 |
Y | 2 | 0 | 33,881 | 460 |
Z | 2.5 | 0 | 1.25 | 180 |
Total Number of Blocks | 53,406,000 |
FG | Underground | X | 2 | 0 | 86,581 | 1,460 |
Y | 2 | 0 | 33,481 | 656 |
Z | 2 | 0 | -541 | 496 |
Total Number of Blocks | 475,048,960 |
PP | Open Pit | X | 2 | 0 | 84,612.58 | 1,050 |
Y | 4 | 0 | 31,573.66 | 850 |
Z | 2.5 | -20 | 1.25 | 180 |
Total Number of Blocks | 160,650,000 |
PP | Underground | X | 2 | 0 | 84,574.65 | 1,090 |
Y | 2 | 0 | 31,586.40 | 1,860 |
Z | 2 | -20 | -539 | 495 |
Total Number of Blocks | 1,003,563,000 |
PR | Open Pit | X | 4 | 0 | 95,554 | 600 |
Y | 2 | 0 | 31,852 | 1,250 |
Z | 2.5 | 0 | -222.5 | 250 |
Total Number of Blocks | 187,500,000 |
Block Model | Type | Axis | Block Size
(m) | Block Rotation
(°) | Base Point
(centre) | Block
Count |
LG | Open Pit | X | 4 | 0 | 496,481.85 | 1,000 |
Y | 2 | 0 | 8,735,685.29 | 550 |
Z | 2.5 | 55 | -376.67 | 300 |
Total Number of Blocks | 165,000,000 |
BR | Open Pit | X | 4 | 0 | 83,763.06 | 500 |
Y | 2 | 0 | 27,166.97 | 425 |
Z | 2.5 | 55 | 78.75 | 125 |
Total Number of Blocks | 26,562,500 |
BS | Open Pit | X | 4 | 0 | 480,341.6 | 600 |
Y | 2 | 0 | 8,724,801.97 | 350 |
Z | 2.5 | 55 | 131.25 | 100 |
Total Number of Blocks | 21,000,000 |
Table 14-12: Search Interpolation Parameters by Deposit
Block Model | Domain | Pass | Search Axis Orientation | LVA | Search Radii
(m) | Min.
Sample | Max.
Sample |
Dip
(°) | Dip Azimuth
(°) | Pitch
(°) | X | Y | Z |
CL | CLX | 1 | 45 | 180 | 0 | Yes | 10 | 10 | 2.5 | 5 | 20 |
2 | 45 | 180 | 0 | Yes | 50 | 50 | 2.5 | 3 | 20 |
3 | 45 | 180 | 0 | Yes | 150 | 150 | 2.5 | 3 | 20 |
4 | 45 | 180 | 0 | Yes | Inf | Inf | Inf | 1 | 20 |
Canto | 1 | 45 | 180 | 0 | Yes | 10 | 10 | 2.5 | 5 | 20 |
2 | 45 | 180 | 0 | Yes | 50 | 50 | 5 | 3 | 20 |
3 | 45 | 180 | 0 | Yes | 150 | 150 | 5 | 3 | 20 |
4 | 45 | 180 | 0 | Yes | Inf | Inf | Inf | 1 | 20 |
FG | CLX | 1 | 45 | 180 | 0 | Yes | 10 | 10 | 2.5 | 5 | 20 |
2 | 45 | 180 | 0 | Yes | 50 | 50 | 2.5 | 3 | 20 |
3 | 45 | 180 | 0 | Yes | 150 | 150 | 2.5 | 3 | 20 |
4 | 45 | 180 | 0 | Yes | Inf | Inf | Inf | 1 | 20 |
Canto | 1 | 45 | 180 | 0 | Yes | 15 | 15 | 2.5 | 3 | 30 |
2 | 45 | 180 | 0 | Yes | 50 | 50 | 2.5 | 3 | 30 |
3 | 45 | 180 | 0 | Yes | 150 | 150 | 2.5 | 3 | 30 |
4 | 45 | 180 | 0 | Yes | Inf | Inf | Inf | 1 | 30 |
Block Model | Domain | Pass | Search Axis Orientation | LVA | Search Radii
(m) | Min.
Sample | Max.
Sample |
Dip
(°) | Dip Azimuth
(°) | Pitch
(°) | X | Y | Z |
PP | CLX | 1 | 50 | 110 | 90 | Yes | 15 | 15 | 2.5 | 5 | 20 |
2 | 50 | 110 | 90 | Yes | 50 | 50 | 2.5 | 3 | 20 |
3 | 50 | 110 | 90 | Yes | 150 | 150 | 2.5 | 3 | 20 |
4 | 50 | 110 | 90 | Yes | Inf | Inf | Inf | 1 | 20 |
Canto | 1 | 50 | 110 | 90 | Yes | 15 | 15 | 2.5 | 3 | 30 |
2 | 50 | 110 | 90 | Yes | 50 | 50 | 2.5 | 3 | 30 |
3 | 50 | 110 | 90 | Yes | 150 | 150 | 2.5 | 3 | 30 |
4 | 50 | 110 | 90 | Yes | Inf | Inf | Inf | 1 | 30 |
PR | Canto | 1 | 30 | 210 | 0 | Yes | 15 | 15 | 5 | 5 | 20 |
2 | 30 | 210 | 0 | Yes | 30 | 30 | 5 | 3 | 20 |
3 | 30 | 210 | 0 | Yes | 100 | 100 | 10 | 1 | 20 |
4 | 30 | 210 | 0 | Yes | Inf | Inf | Inf | 1 | 20 |
LG | Mineralized zones | 1 | 30 | 135 | 90 | Yes | 40 | 50 | 1.5 | 3 | 32 |
2 | 30 | 135 | 90 | Yes | 80 | 100 | 3 | 3 | 20 |
3 | 30 | 135 | 90 | Yes | 160 | 200 | 5 | 1 | 20 |
4 | 30 | 135 | 90 | Yes | Inf | Inf | Inf | 1 | 20 |
BR | Grade Shells-Vein_1,
Grade Shells-Vein_2,
Grade Shells-Vein_3,
Grade Shells-Vein_4,
Grade Shells-VeinWest_1,
Grade Shells-VeinWest_2 | 1 | 40 | 125 | 0 | Yes | 50 | 50 | 10 | 3 | 20 |
2 | 40 | 125 | 0 | Yes | 100 | 100 | 20 | 1 | 20 |
3 | 40 | 125 | 0 | Yes | 200 | 200 | 20 | 1 | 20 |
4 | 40 | 125 | 0 | Yes | Inf | Inf | Inf | 1 | 20 |
Grade Shells-VeinEast_1
Grade Shells-VeinEast_2 | 1 | 20 | 305 | 0 | Yes | 25 | 25 | 2.5 | 3 | 20 |
2 | 20 | 305 | 0 | Yes | 100 | 100 | 5 | 3 | 20 |
3 | 20 | 305 | 0 | Yes | 150 | 150 | 5 | 1 | 20 |
4 | 20 | 305 | 0 | Yes | Inf | Inf | Inf | 1 | 20 |
BS | Mineralized domain | 1 | 30 | 135 | 90 | Yes | 40 | 50 | 1.5 | 3 | 32 |
2 | 30 | 135 | 90 | Yes | 80 | 100 | 3 | 3 | 20 |
3 | 30 | 135 | 90 | Yes | 160 | 200 | 5 | 1 | 20 |
4 | 30 | 135 | 90 | Yes | Inf | Inf | Inf | 1 | 20 |
Note: Inf = Infinite.
14.10 Validation of Gold Grade Estimates
The gold grade estimates were validated through multiple approaches to ensure accuracy and reliability. These included:
- Visual inspections: visual checks were conducted in both plan view and cross-sectional slices to assess grade continuity and ensure consistency across the model.
Swath plot analysis: swath plots were generated for each domain along multiple directions, allowing for comparison of grade trends between block estimates and composite samples.
Comparison of estimation methods: OK estimates were cross-checked against estimates derived using IDW2 and IDW³ and the nearest neighbour (NN) method to identify any discrepancies.
- Reconciliation with historical data: the model was further validated by reconciling current estimates with historical production data and previous models to confirm the consistency of grade predictions over time.
14.10.1 Visual Inspections
Visual checks were conducted in both plan view and cross-sectional slices to assess grade continuity and ensure consistency across the model. Representative cross-sections for each of the block models showing the block gold grades, drill-hole gold grades, the Mineral Resource constraining pits shells (resource shell) and Mineral Reserve design pits are presented in Figure 14-8 to Figure 14-17.

Figure 14-8: Cross-Section of the Lago Do Gato (LG) Block Model

Figure 14-9: Cross-Section of the Barrocas (BR) Block Model

Figure 14-10: Cross-Section of the Barrocas SW (BS) Block Model

Figure 14-11: Cross-Section of the Papagaio & Raminhos (PR) Block Model
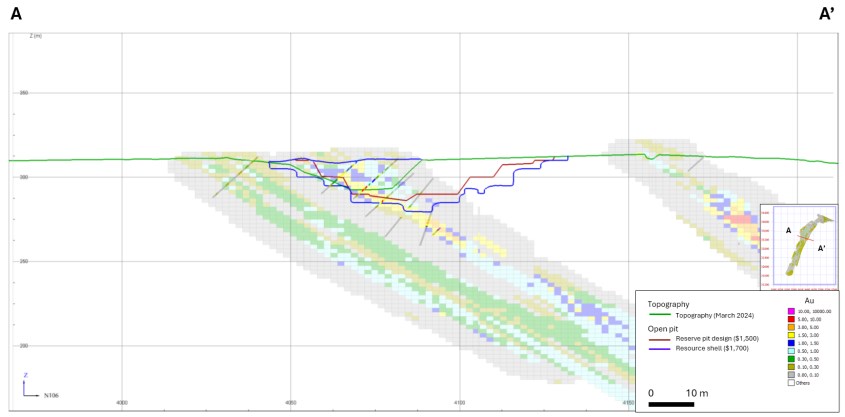
Figure 14-12: Cross-Section of the Pau-a-Pique (PP) Open Pit Block Model

Figure 14-13: Cross-Section of the Pau-a-Pique (PP) Underground Block Model
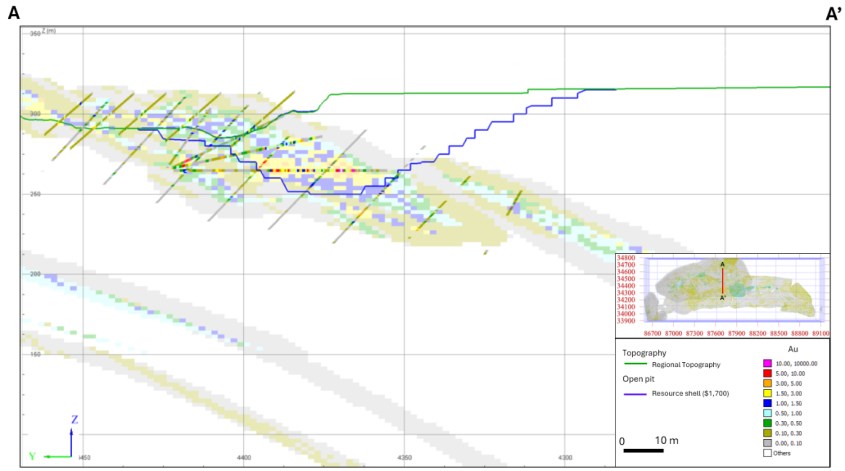
Figure 14-14: Cross-Section of the F&G (FG) Open pit Block Model
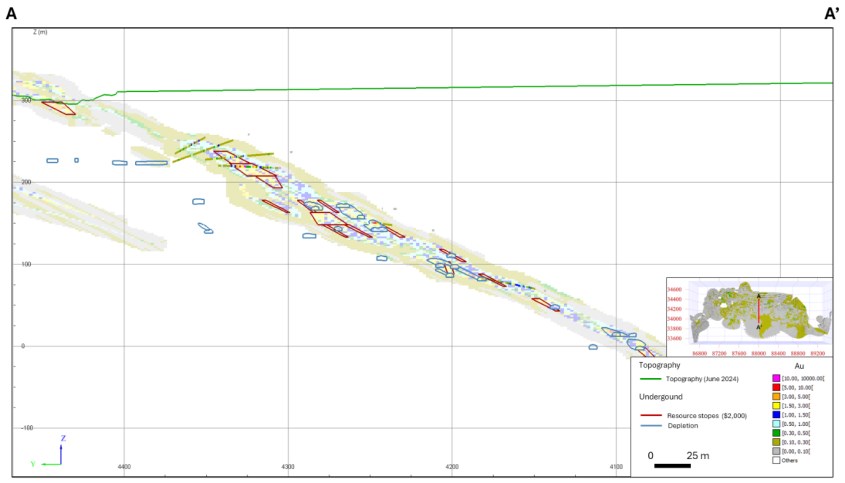
Figure 14-15: Cross-Section of the F&G (FG) Underground Block Model
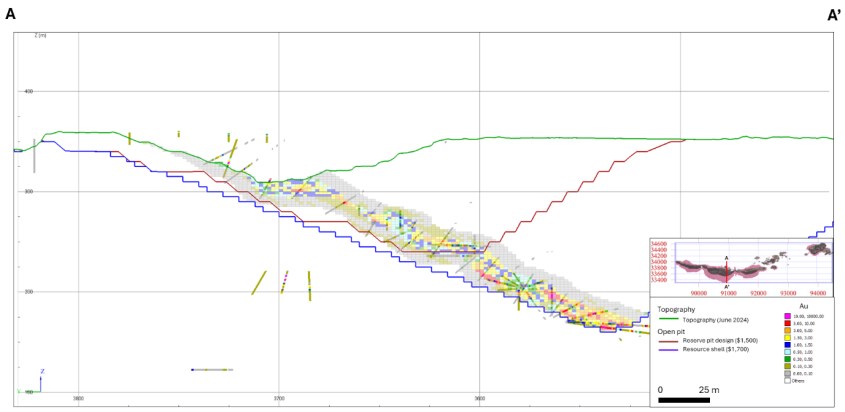
Figure 14-16: Cross-Section of the CLX (CL) Open Pit Block Model
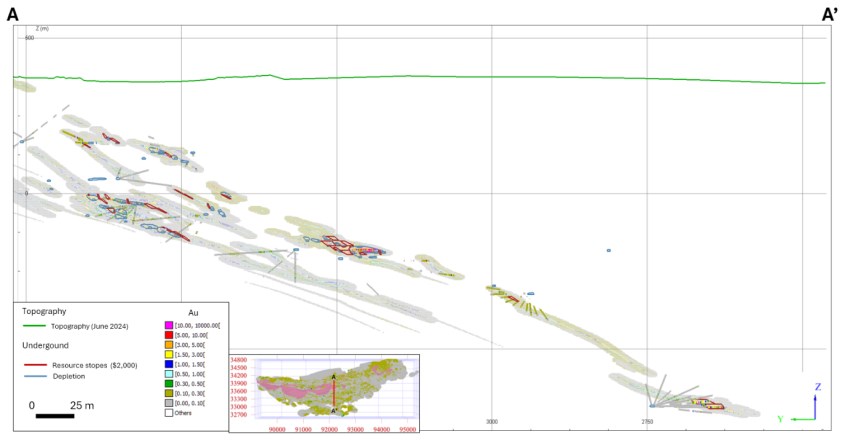
Figure 14-17: Cross-Section of the CLX (CL) Underground Block Model
14.10.2 Swath Plots
Swath plots were generated along the strike, perpendicular to the strike, and by depth, using 10 m slice intervals. An example swath plot for the CLX Underground deposit is shown in Figure 14-18. In these plots, OK-estimated gold grades were compared to NN estimates. Overall, the OK-estimated Mineral Resource model accurately reproduces the trends in the NN estimated gold grades, particularly in areas with sufficient sampling density.

| 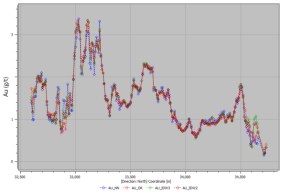
|
Swath plot: X Direction (Easting), slice size: 10 m | Swath plot: Y Direction (Northing), slice size: 10 m |

| |
Swath plot: Z Direction (Elevation), slice size: 10 m | |
Figure 14-18: An Example of Swath Plots-CLX Underground Model
14.10.3 Comparison of Estimation Techniques
Each deposit was estimated using OK, and estimates were compared to IDW2, IDW³, and NN. The results of the estimator comparison are summarized in Table 14-13.
Table 14-13: Estimator Comparison Results-CLX Underground
Estimator | Total
Count | Defined
Count | Estimated
Proportion
(%) | Mean Au
(g/t) | Variance | Standard
Deviation | Coefficient
of Variation | Min. Au
(g/t) | Max. Au
(g/t) | Difference
with NN
(%) |
NN | 6,787,539 | 6,325,924 | 93.20 | 1.604 | 8.555 | 2.925 | 1.823 | 0.002 | 18.000 | - |
OK | 6,787,539 | 6,396,463 | 94.24 | 1.606 | 2.422 | 1.556 | 0.969 | 0.003 | 18.000 | 0.13 |
IDW3 | 6,787,539 | 6,331,600 | 93.28 | 1.613 | 3.895 | 1.974 | 1.224 | 0.007 | 18.000 | 0.55 |
IDW2 | 6,787,539 | 6,331,600 | 93.28 | 1.611 | 3.287 | 1.813 | 1.125 | 0.008 | 18.000 | 0.43 |
14.10.4 Reconciliation to Past Production from CLX Open Pit and Underground
Reconciliation of the CLX open pit and underground Mineral Resource models with 2023 production data confirms the accuracy of the MRE. The models demonstrate a positive reconciliation of 2% in tonnes, 6% in grade, and 7% in ounces compared to mill data, all within a 10% variance. Updated models show good correlation with mine production data.
14.11 Mineral Resource Classification
The classification of Mineral Resources is inherently subjective and relies on the quality and interpretation of data used in the estimation process. Key considerations include geological continuity; data spacing, type, source, data quality; and geostatistical analysis. These factors collectively inform the classification criteria, which vary by deposit.
The classification process was conducted using three search passes with the following search dimensions and criteria:
1. Pass 1: 25 x 25 x 10 m³ grid, minimum of three drill holes → blocks classified as Measured
2. Pass 2: 50 x 50 x 10 m³ grid, minimum of three drill holes → blocks classified as Indicated
3. Pass 3: 150 x 150 x 20 m³ grid, minimum of two drill holes → blocks classified as Inferred.
Blocks that did not meet the criteria for any of these categories were classified as Unclassified.
To enhance the spatial continuity of the classifications and reduce isolated block occurrences, morphological operations (e.g., closing) were applied to smooth the classification boundaries.
14.12 Reasonable Prospects of Eventual Economic Extraction
The CIM Definition Standards state the following:
A Mineral Resource is a concentration or occurrence of solid material of economic interest in or on the Earth's crust in such form, grade or quality and quantity that there are reasonable prospects for eventual economic extraction. (CIM, 2014)
To sufficiently test the reasonable prospects for eventual economic extraction by an open pit, pit optimization was completed using the Lerchs-Grossman algorithm using the input parameters summarized in Table 14-14. The results of the pit optimization partially form the basis of the MRE. The results of the pit optimization are used to constrain the Mineral Resources with respect to the CIM Definition Standards and does not constitute an attempt to estimate Mineral Reserves. For CLX, F&G, and PPQ, the open pit Mineral Resources are restricted to blocks contained within the optimized pit and above the underground Mineral Resource datum.
Table 14-14: Open Pit Optimization Parameters for Mineral Resources
Parameter | Unit | Amount |
Gold Price | $/oz | 1,700 |
Exchange rate | Brazilian Real (R$) to USD (US$) | 4.80:1.00 |
Payability | % | 100 |
Scenario Discount Rate | % | 5 |
CEFEM Tax (BZL) | % | 1.5 |
Refining/Transportation | $/oz | 24.38 |
Process Costs | $/t processed | 14.60 |
Process Sustaining Cost | $/t | 1.80 |
Au Recovery | % | From 75 to 90 |
Bench Height | m | 10 |
Incremental Mining Cost | $/10 m | 0.04 |
Mining Cost (Waste) | $/t | From 1.79 to 2.70 |
Differential Mining Cost (Ore) | $/t | From 1.89 to 2.43 |
General & Administrative | $/t | 4.69 |
Note: Refer to Section 15 for details on mining costs, geotechnical inputs, and gold recovery.
The underground mining cost assumptions were used to generate conceptual optimized stopes to test the reasonable prospects for eventual economic extraction by underground mining (Table 14-15). These assumptions suggest that an underground mining scenario would support mining at a marginal cut-off grade varying from 1.01 to 1.06 g/t Au.
Table 14-15: Underground Mining Stope Optimization Parameters for Mineral Resources
Parameter | Unit | Amount |
Gold Price | $/oz | 2,000 |
Exchange Rate | Brazilian Real (R$) to USD (US$) | 4.80: 1.00 |
Payability | % | 100 |
Scenario Discount Rate | % | 5 |
CEFEM Tax (BZL) | % | 1.5 |
Refining/Transportation | $/oz | 24.38 |
Process Costs | $/t processed | 14.60 |
Process Sustaining Cost | $/t | 1.80 |
Au Recovery | % | From 86 to 90 |
Mining Costs | $/t | 36.20 |
Marginal Stope Cut-Off Grade | g/t | 1 |
General & Administrative | $/t | 4.69 |
Note: Refer to Section 15 for details on mining costs, geotechnical inputs, and gold recovery.
14.13 Mineral Resource Statement
A summary of the Fazenda mine's Mineral Resources, inclusive of Mineral Reserves, is provided in Table 14-16; the summary of the Fazenda mine's Mineral Resources, exclusive of Mineral Reserves, is presented in Table 14-17.
Table 14-16: Mineral Resources Inclusive of Mineral Reserves for the Fazenda Mine
Deposit | Area | Category | Tonnage
(kt) | Gold Grade
(g/t) | Contained Gold
(koz) |
CLX | Open Pit | Measured | 8,954 | 2.41 | 694 |
Indicated | 159 | 1.98 | 10 |
Inferred | 84 | 2.18 | 6 |
Canto 1 | Open Pit | Measured | 972 | 1.34 | 42 |
Indicated | 34 | 1.12 | 1 |
Inferred | 10 | 1.23 | <1 |
Canto 2 | Open Pit | Measured | 3,484 | 1.26 | 141 |
Indicated | 241 | 1.18 | 9 |
Inferred | 13 | 1.35 | 1 |
FG | Open Pit | Measured | 399 | 1.30 | 17 |
Indicated | 29 | 1.45 | 1 |
Inferred | 41 | 1.17 | 2 |
PPQ | Open Pit | Measured | 568 | 1.31 | 24 |
Indicated | 96 | 1.25 | 4 |
Inferred | 79 | 1.39 | 4 |
LG | Open Pit | Measured | 296 | 0.84 | 8 |
Indicated | 305 | 0.96 | 9 |
Inferred | 1,090 | 0.90 | 31 |
Barrocas | Open Pit | Measured | 237 | 1.18 | 9 |
Indicated | 12 | 1.10 | <1 |
Inferred | 14 | 0.87 | <1 |
Barrocas SW | Open Pit | Measured | 8 | 1.45 | <1 |
Indicated | 144 | 1.32 | 6 |
Inferred | 278 | 1.35 | 12 |
PR | Open Pit | Measured | 231 | 1.87 | 14 |
Indicated | 71 | 1.68 | 4 |
Inferred | 1,163 | 1.75 | 65 |
Total Open Pit | Measured | 15,150 | 1.95 | 949 |
Indicated | 1,091 | 1.30 | 45 |
M&I | 16,240 | 1.90 | 994 |
Inferred | 2,772 | 1.36 | 121 |
PPQ | Underground | Measured | 216 | 1.92 | 13 |
Indicated | 352 | 1.88 | 21 |
Inferred | 1,566 | 2.43 | 122 |
FG | Underground | Measured | 1,303 | 1.92 | 68 |
Indicated | 174 | 1.88 | 9 |
Inferred | 424 | 2.43 | 23 |
CLX | Underground | Measured | 11,963 | 1.92 | 997 |
Indicated | 2,000 | 1.88 | 135 |
Inferred | 108 | 2.43 | 10 |
Deposit | Area | Category | Tonnage
(kt) | Gold Grade
(g/t) | Contained Gold
(koz) |
Total Underground | Measured | 13,482 | 2.49 | 1,078 |
Indicated | 2,526 | 2.03 | 165 |
M&I | 16,008 | 2.42 | 1,243 |
Inferred | 2,098 | 2.29 | 155 |
Total Fazenda Resource | Measured | 28,632 | 2.20 | 2,027 |
Indicated | 3,616 | 1.81 | 210 |
M&I | 32,248 | 2.16 | 2,237 |
Inferred | 4,870 | 1.76 | 276 |
Notes:
- The CIM Definition Standards (CIM, 2014) were followed for the classification of Mineral Resources.
- Mineral Resources are reported inclusive of Mineral Reserves.
- Open pit Mineral Resources are reported within conceptual pit shells at a cut-off grade of 0.5 g/t Au, based on a gold price of $1,700/oz, mining cost of $1.79/t to $2.70/t, processing cost of $14.60/t, G&A cost of $4.69/t, recovery of 75% to 90%, and an exchange rate of R$4.80:US$1.00
- Underground Mineral Resources are reported within conceptual stope shapes based on a gold price of $2,000/oz, mining cost of $36.20/t, processing cost of $14.60/t, G&A cost of $4.69/t, recovery of 86% to 90%, a cut-off grade of 1 g/t Au, and an exchange rate of R$5.00:US$1.00.
- Mineral Resources that are not Mineral Reserves do not have demonstrated economic viability.
- Benoit Poupeau, FAusIMM (CP), a QP as defined by NI 43-101, who is independent of Equinox Gold, prepared this MRE.
- Totals may not sum precisely due to rounding.
Table 14-17: Mineral Resources Exclusive of Mineral Reserves for the Fazenda Mine
Deposit | Area | Category | Tonnage
(kt) | Gold Grade
(g/t) | Contained Gold
(koz) |
CLX | Open Pit | Measured | 2,738 | 2.43 | 214 |
Indicated | 51 | 1.63 | 3 |
Inferred | 14 | 1.96 | 1 |
Canto 1 | Open Pit | Measured | 951 | 1.33 | 41 |
Indicated | 32 | 1.09 | 1 |
Inferred | 9 | 1.16 | 0 |
Canto 2 | Open Pit | Measured | 1,112 | 1.09 | 39 |
Indicated | 170 | 1.21 | 7 |
Inferred | 13 | 1.36 | 1 |
FG | Open Pit | Measured | 53 | 1.30 | 2 |
Indicated | 28 | 1.46 | 1 |
Inferred | 41 | 1.17 | 2 |
PPQ | Open Pit | Measured | 318 | 1.18 | 12 |
Indicated | 66 | 1.00 | 2 |
Inferred | 71 | 1.40 | 3 |
LG | Open Pit | Measured | 124 | 0.79 | 3 |
Indicated | 123 | 0.84 | 3 |
Inferred | 990 | 0.89 | 28 |
Barrocas | Open Pit | Measured | 237 | 1.18 | 9 |
Indicated | 12 | 1.10 | 0 |
Inferred | 14 | 0.87 | 0 |
Deposit | Area | Category | Tonnage
(kt) | Gold Grade
(g/t) | Contained Gold
(koz) |
Barrocas SW | Open Pit | Measured | 8 | 1.45 | 0 |
Indicated | 144 | 1.32 | 6 |
Inferred | 278 | 1.35 | 12 |
PR | Open Pit | Measured | 231 | 1.87 | 14 |
Indicated | 71 | 1.68 | 4 |
Inferred | 1,163 | 1.75 | 65 |
Total Open Pit | Measured | 5,772 | 1.80 | 334 |
Indicated | 698 | 1.23 | 28 |
M&I | 6,470 | 1.74 | 361 |
Inferred | 2,593 | 1.35 | 113 |
PPQ | Underground | Measured | 216 | 1.92 | 13 |
Indicated | 352 | 1.88 | 21 |
Inferred | 1,566 | 2.43 | 122 |
FG | Underground | Measured | 1,047 | 1.63 | 53 |
Indicated | 139 | 1.55 | 7 |
Inferred | 419 | 1.66 | 22 |
CLX | Underground | Measured | 11,383 | 2.59 | 948 |
Indicated | 1,811 | 2.10 | 121 |
Inferred | 104 | 2.75 | 9 |
Total Underground | Measured | 12,646 | 2.49 | 1,014 |
Indicated | 2,302 | 2.01 | 149 |
M&I | 14,948 | 2.42 | 1,163 |
Inferred | 2,088 | 2.29 | 154 |
Total Fazenda Resource | Measured | 18,418 | 2.28 | 1,348 |
Indicated | 3,000 | 1.83 | 176 |
M&I | 21,418 | 2.21 | 1,524 |
Inferred | 4,681 | 1.77 | 266 |
Notes:
- The CIM Definition Standards (CIM, 2014) were followed for the classification of Mineral Resources.
- Mineral Resources are reported exclusive of Mineral Reserves.
- Open pit Mineral Resources are reported within conceptual pit shells at a cut-off grade of 0.5 g/t Au, based on a gold price of $1,700/oz, mining cost of $1.79/t to $2.70/t, processing cost of $14.60/t, G&A cost of $4.69/t, recovery of 75% to 90%, and an exchange rate of R$4.80:US$1.00
- Underground Mineral Resources are reported within conceptual stope shapes based on a gold price of $2,000/oz, mining cost of $36.20/t, processing cost of $14.60/t, G&A cost of $4.69/t, recovery of 86% to 90%, a cut-off grade of 1 g/t Au, and an exchange rate of R$5.00:US$1.00.
- Mineral Resources that are not Mineral Reserves do not have demonstrated economic viability.
- Benoit Poupeau, FAusIMM (CP), a QP as defined by NI 43-101, who is independent of Equinox Gold, prepared this MRE.
- Totals may not sum precisely due to rounding.
14.13.1 Qualified Person's Statement on Adequacy of Data
Dr. Benoit Poupeau has reviewed the data, estimation methods, and classification procedures. In Dr. Poupeau's opinion, the data supporting the MRE are reliable, and no material limitations or issues have been identified that would affect the validity of the estimate. Dr. Poupeau considers the data adequate and appropriate for reporting Mineral Resources in compliance with NI 43-101.
14.14 Comparison with the Previous Mineral Resource Estimate
The increase in both tonnes and contained ounces in the updated 2024 MRE, compared to the 2021 MRE, is primarily attributed to the implementation of wider wireframes that were consistently used throughout for all of the deposits and the new mineralized zones modelled in the Canto Unit (Table 14-18, Figure 14-19, Figure 14-20). This approach incorporates additional mineralization adjacent to high-grade zones, including lower-grade material that was previously excluded. By expanding the mineralized envelopes, the continuity of mineralization has been improved, providing a more comprehensive and accurate representation of the deposit. This method effectively captures the full potential of the Mineral Resource, resulting in a significant increase in reported tonnage and contained ounces, while adhering to industry best practices and standards for MRE. These adjustments are based on an enhanced understanding of the deposit's geometry and mineralization characteristics, supported by meticulous geological interpretation and data analysis.
Table 14-18: Comparison between 2021 MRE and 2024 MRE, including Mineral Reserves
Category | 2021 | 2024 | Difference |
Tonnage
(kt) | Gold Grade
(g/t) | Contained Gold
(koz) | Tonnage
(kt) | Gold Grade
(g/t) | Contained Gold
(koz) | Tonnage
(kt) | Gold Grade
(g/t) | Contained Gold
(koz) |
Measured | | | | | | | | | |
Underground | 4,944 | 2.57 | 409 | 13,482 | 2.49 | 1,078 | 8,538 | -0.08 | 669 |
Open Pit | 1,711 | 1.49 | 82 | 15,150 | 1.95 | 949 | 13,439 | 0.46 | 867 |
Total Measured | 6,655 | 2.29 | 491 | 28,632 | 2.20 | 2,027 | 21,977 | -0.09 | 1,536 |
Indicated | | | | | | | | | |
Underground | 1,476 | 2.04 | 97 | 2,526 | 2.03 | 165 | 1,050 | -0.01 | 68 |
Open Pit | 2,123 | 0.98 | 67 | 1,091 | 1.30 | 45 | -1,032 | 0.32 | -22 |
Total Indicated | 3,599 | 1.42 | 164 | 3,616 | 1.81 | 210 | 17 | 0.39 | 46 |
M+I | | | | | | | | | |
Underground | 6,420 | 2.45 | 506 | 16,008 | 2.42 | 1,243 | 9,588 | -0.03 | 737 |
Open Pit | 3,834 | 1.21 | 149 | 16,240 | 1.90 | 994 | 12,406 | 0.69 | 845 |
Total M+I | 10,254 | 1.99 | 655 | 32,248 | 2.16 | 2,237 | 21,994 | 0.17 | 1,582 |
Inferred | | | | | | | | | |
Inferred-Underground | 1,733 | 1.92 | 107 | 2,098 | 2.29 | 155 | 365 | 0.37 | 48 |
Inferred-Open Pit | 1,563 | 1.05 | 53 | 2,772 | 1.36 | 121 | 1,209 | 0.31 | 68 |
Total Inferred | 3,296 | 1.51 | 160 | 4,870 | 1.76 | 276 | 1,574 | 0.25 | 116 |

Figure 14-19: Waterfall Showing an Increase of Ounces Between 2021 MRE and 2024 MRE
(Measured and Indicated)
In Figure 14-19, the use of broader wireframes to estimate the Fazenda deposits-particularly CLX, F&G, and PPQ-had a notably positive and significant impact on the reported ounces. Totals may not sum precisely due to rounding.
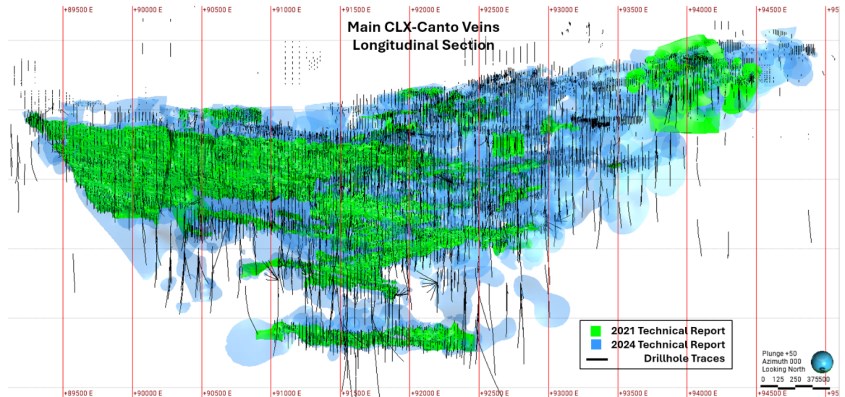
Figure 14-20: Comparison of Mineralized Wireframes used for the 2021 and 2024 Technical Reports
15 Mineral Reserve Estimates
15.1 Mineral Reserves
Open pit Mineral Reserves have been estimated for the CLX, Canto 1, Canto 2, Pau a Pique (PPQ), LG, and G pits. The process used to determine the open pit Mineral Reserves was as follows:
The Mineral Resource block models provided by Equinox Gold were modified to include the waste around the ore blocks up to an updated topographic surface and were then modelled to include the existing surface waste dumps and pit backfill. The modified models were depleted to reflect current open pit and underground mining surveys.
Dilution and losses were applied to the depleted block models by applying regularization from 4 x 2 x 2.5 m to 8 x 4 x 5 m blocks.
To create the mining block models, geotechnical slope regions were applied to the diluted block models along with pit optimization inputs including prices, costs, and recoveries that Equinox Gold provided.
Pit optimization was undertaken in Whittle using the mining block models as the input. Pit optimizations were based on a $1,500/oz gold price.
- Pit designs were generated in Datamine Studio OP and Deswik using the shells selected from pit optimization as a guide.
Underground Mineral Reserves have been estimated for the UG Main, Edeep, F, G, Canto 1, and Canto 2 deposits. Canto 2 would consist of a new mining operation to commence at the completion of mining the Canto 2 pit. The mining method at Canto 2 would be similar to the other operations, namely longhole open stoping (LHOS). UG Main is classified into discrete mining areas in accordance with current operating systems at Fazenda. The independent areas are known as C, D, E, and W and are shown as separate items Table 15-1.
Table 15-1: Mineral Reserve Estimate Summary by Mine Area-June 30, 2024
| Category | Mine Unit | Tonnage
(kt) | Au
(g/t) | Contained Gold
(koz) |
| Underground | | | | |
| Proven | Canto 1 | 111.5 | 1.80 | 6 |
| Canto 2 | 104 | 1.61 | 5 |
| UG Main (C) | 682.2 | 2.36 | 52 |
| UG Main (D) | 6.5 | 1.72 | 0 |
| UG Main (E) | 166.1 | 2.33 | 12 |
| UG Main (W) | 220.9 | 2.08 | 15 |
| Edeep | 197.2 | 1.84 | 12 |
| F | 243 | 1.51 | 12 |
| G | 203.6 | 1.38 | 9 |
| Total Proven | | 1,935 | 1.99 | 124 |
| Category | Mine Unit | Tonnage
(kt) | Au
(g/t) | Contained Gold
(koz) |
| Probable | Canto 1 | - | - | - |
| Canto 2 | 310.5 | 1.83 | 18 |
| UG Main (C | 66.5 | 2.37 | 5 |
| UG Main (D) | - | - | |
| UG Main (E) | 20.2 | 2.15 | 1 |
| UG Main (W) | 9.5 | 2.29 | 1 |
| Edeep | 8.7 | 1.72 | 0 |
| F | 18.9 | 1.5 | 1 |
| G | 27.7 | 1.49 | 1 |
| Total Probable | | 462 | 1.90 | 28 |
| Underground Total Proven & Probable | | 2,397 | 1.97 | 152 |
| Open Pit | | | | |
| Proven | CLX | 7,293 | 2.03 | 476 |
| Canto 1 | 20 | 1.77 | 1 |
| Canto 2 | 2,430 | 1.22 | 95 |
| Pau a Pique (PPQ) | 276 | 1.25 | 11 |
| Lagoa do Gato (LG) | 152 | 0.85 | 4 |
| G | 187 | 1.36 | 8 |
| Total Proven | | 10,358 | 1.79 | 596 |
| Probable | CLX | 112 | 1.74 | 6 |
| Canto 1 | 1 | 1.43 | 0 |
| Canto 2 | 75 | 1.06 | 3 |
| Pau a Pique (PPQ) | 33 | 1.37 | 1 |
| Lagoa do Gato (LG) | 165 | 1.02 | 5 |
| G | - | - | - |
| Total Probable | 386 | 1.27 | 16 |
| Open Pit Proven & Probable | 10,744 | 1.77 | 612 |
| Total Stockpile Probable | 20 | 0.99 | 1 |
| Totals | | | |
| Proven | 12,293 | 1.82 | 720 |
| Probable | 868 | 1.60 | 45 |
| Total Proven & Probable | 13,161 | 1.80 | 763 |
Notes:
- CIM Definition Standards (CIM, 2014) were followed for Mineral Reserves.
- Mineral Reserves are reported at a cut-off grade of 1.36 g/t Au for underground stoping and 0.43 g/t for underground development and between 0.54 and 0.66 g/t Au for open pits.
- Mineral Reserves are estimated using an average long-term gold price of $1,500/oz for open pits and $1,800/oz for underground and an exchange rate of R$4.80:US$1.00.
- A minimum mining width of 2.0 m was used for underground Mineral Reserves.
- The QP for open pit is David Warren, P.Eng., of AMC Mining Consultants (Canada) Ltd.
- The QP for underground is Dominic Claridge, FAusIMM, of AMC Consultants (UK) Limited.
- Mineral Reserves include dilution and mining recovery.
- Numbers may not sum precisely due to rounding.
A number of checks were performed to verify the procedures and numerical calculations used in preparing the Mineral Reserve estimate. The Mineral Reserves were estimated using a cut-off of 0.54 to 0.66 g/t Au for open pit operations and 1.36 g/t for underground stoping operations.
Table 15-2 summarizes the Mineral Reserve estimates as of June 30, 2024, for both Open Pit and Underground operations.
After considering and applying appropriate modifying factors, the QP believes that the Measured and Indicated Mineral Resources within the final pits and underground stope designs may be classified as Proven and Probable Mineral Reserves, respectively; moreover, the QP is not aware of any mining, metallurgical, infrastructure, permitting, or other relevant factors that could materially affect the Mineral Reserve estimate.
Table 15-2: Mineral Reserve Estimate Summary-June 30, 2024
Category | Tonnage
(kt) | Gold Grade
(g/t) | Contained Gold
(koz) |
Proven | | | |
Underground | 1,935 | 1.99 | 124 |
Open Pit | 10,358 | 1.79 | 595 |
Subtotal Proven | 12,293 | 1.82 | 719 |
Probable | | | |
Underground | 462 | 1.90 | 28 |
Open Pit | 386 | 1.27 | 16 |
Stockpile | 20 | 0.99 | 1 |
Subtotal Probable | 868 | 1.60 | 45 |
Total Proven & Probable | 13,161 | 1.80 | 763 |
Notes:
- CIM Definition Standards (CIM, 2014) were followed for Mineral Reserves.
- Mineral Reserves are reported at a cut-off grade of 1.36 g/t Au for underground stoping and 0.43 g/t for development, at a cut-off grade of between 0.54 and 0.66 g/t Au for open pits.
- Mineral Reserves are estimated using an average long-term gold price of $1,500/oz for open pits and $1,800/oz for underground, at an exchange rate of R$4.80: US$1.00.
- A minimum mining width of 2.0 m was used for underground Mineral Reserves.
- The QP for open pit is David Warren, P.Eng., of AMC Mining Consultants (Canada) Ltd.
- The QP for underground is Dominic Claridge, FAusIMM, of AMC Consultants (UK) Limited.
- Mineral Reserves include dilution and mining recovery.
- Numbers may not sum precisely due to rounding.
15.2 Open Pit
15.2.1 Resource Block Models
FBDM provided the Mineral Resource models that form the basis of the open pit Mineral Reserve estimate. The mine areas and associated model files are:
The Mineral Resource block models contain blocks within estimated mineralized domains and have a block size of 4 x 2 x 2.5 m (X by Y by Z). Density and gold grade fields were included in the models.
The following were applied to the block models before dilution and pit optimization:
Waste blocks were added around the mineralization with default densities of 2.7 t/m3 for fresh rock and 1.89 t/m3 for oxide, and with the oxide-to-fresh boundary determined using a wireframe surface FBDM provided.
Existing waste dumps and pit backfill were modelled based on historic pit surfaces and an updated site topographic wireframe using a density of 2.0 t/m3 for waste dumps and backfill.
Models were depleted to the updated surface topography to reflect the current status of open pit mining, and the underground workings were depleted using wireframe containing as-built development and stope solids provided by FBDM.
Mineral Resource models were reviewed by Dr. Benoit Poupeau as per Section 14.
15.2.2 Dilution and Extraction
To account for dilution and losses in the open pits, the 4 x 2 x 2.5 m block models were regularized to 8 x 4 x 5 m, then the original Mineral Resource block models were overlain onto the regularized block models to determine which material was included as dilution and which material was lost in the process. A cross-section view of the CLX dilution block model is presented in Figure 15-1.
A summary of the dilution and losses within each open pit is shown in Table 15-3. All reports have been undertaken using a 0.5 g/t Au cut-off grade contained within the ultimate pit designs for comparative purposes with respect to dilution.
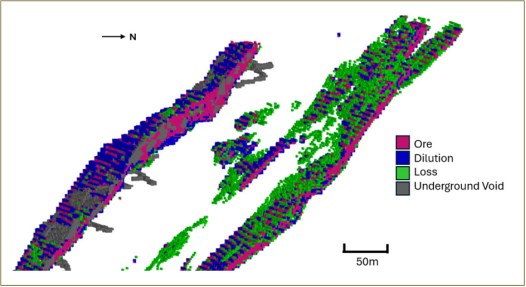
Figure 15-1: Cross-Section View of Regularized Open Pit Block Model Showing Dilution and Losses
Table 15-3: Open Pit Dilution and Losses by Mining Area
Design | Dilution
(%) | Loss
(%) |
CLX | 21 | 4 |
Canto 1 | 21 | 9 |
Canto 2 | 16 | 8 |
LG | 14 | 9 |
PPQ | 26 | 8 |
G | 8 | 1 |
15.2.3 Cut-Off Grade
Cut-off grades were estimated on an incremental basis for the open pits. The cut-off grade calculation parameters for open pit mining are shown in Table 15-4 and Table 15-5. A gold price of $1,500/oz was used for the open pit cut-off grade calculation.
The open pit cut-off grade calculation includes incremental open pit mining, processing, sustaining, and G&A costs. The cut-off calculation shown is a pit-rim incremental cut-off excluding mining costs.
Table 15-4: Open Pit Cut-Off Grade Estimation for CLX, Canto 1, and Canto 2
Parameter | Unit | CLX
(Oxide) | CLX
(Fresh) | Canto 1
(Oxide) | Canto 1
(Fresh) | Canto 2
(Oxide) | Canto 2
(Fresh) | Canto 2
(Oxide) CARB | Canto 2
(Fresh) CARB |
Au Price | $/oz | 1,500 | 1,500 | 1,500 | 1,500 | 1,500 | 1,500 | 1,500 | 1,500 |
Au Recovery | % | 90.1 | 90.1 | 75.0 | 75.0 | 86.0 | 86.0 | 90.1 | 90.1 |
CEFEM Tax (BZL) | % | 1.5 | 1.5 | 1.5 | 1.5 | 1.5 | 1.5 | 1.5 | 1.5 |
Refining Costs | $/oz | 24.38 | 24.38 | 24.38 | 24.38 | 24.38 | 24.38 | 24.38 | 24.38 |
Operating Cost | | | | | | | | | |
Differential Mining Cost (Ore) | $/t | 1.89 | 1.86 | 2.09 | 2.06 | 2.08 | 2.05 | 2.08 | 2.05 |
Process Cost | $/t | 14.60 | 14.60 | 14.60 | 14.60 | 14.60 | 14.60 | 14.60 | 14.60 |
Process Sustaining Cost | $/t | 1.80 | 1.80 | 1.80 | 1.80 | 1.80 | 1.80 | 1.80 | 1.80 |
Total Processing Costs | $/t | 18.29 | 18.26 | 18.49 | 18.46 | 18.48 | 18.45 | 18.48 | 18.45 |
G&A | $/t | 4.69 | 4.69 | 4.69 | 4.69 | 4.69 | 4.69 | 4.69 | 4.69 |
Total Cost1 | $/t | 22.98 | 22.95 | 23.18 | 23.15 | 23.17 | 23.14 | 23.17 | 23.14 |
Cut-Off Grade | g/t Au | 0.55 | 0.54 | 0.66 | 0.66 | 0.58 | 0.58 | 0.55 | 0.55 |
Note: 1 Excluding mining cost.
Table 15-5: Open Pit Cut-Off Grade Estimation for LG, PPQ, and G
Parameter | Unit | LG
(Oxide) | LG
(Fresh) | PPQ
(Oxide) | PPQ
(Fresh) | PPQ
(Oxide) CARB | PPQ
(Fresh) CARB | G
(Oxide) | G
(Fresh) |
Au Price | $/oz | 1,500 | 1,500 | 1,500 | 1,500 | 1,500 | 1,500 | 1,500 | 1,500 |
Au Recovery | % | 90.1 | 90.1 | 86.0 | 86.0 | 90.1 | 90.1 | 90.1 | 90.1 |
CEFEM Tax (BZL) | % | 1.5 | 1.5 | 1.5 | 1.5 | 1.5 | 1.5 | 1.5 | 1.5 |
Refining Costs | $/oz | 24.38 | 24.38 | 24.38 | 24.38 | 24.38 | 24.38 | 24.38 | 24.38 |
Operating Cost | | | | | | | | | |
Differential Mining Cost (Ore) | $/t | 2.43 | 2.41 | 2.16 | 2.14 | 2.16 | 2.14 | 2.03 | 2.00 |
Process Cost | $/t | 14.60 | 14.60 | 14.60 | 14.60 | 14.60 | 14.60 | 14.60 | 14.60 |
Process Sustaining Cost | $/t | 1.80 | 1.80 | 1.80 | 1.80 | 1.80 | 1.80 | 1.80 | 1.80 |
Total Processing Costs | $/t | 18.83 | 18.81 | 18.56 | 18.54 | 18.56 | 18.54 | 18.43 | 18.40 |
G&A | $/t | 4.69 | 4.69 | 4.69 | 4.69 | 4.69 | 4.69 | 4.69 | 4.69 |
Total Cost1 | $/t | 23.52 | 23.50 | 23.25 | 23.23 | 23.25 | 23.23 | 23.12 | 23.09 |
Cut-Off Grade | g/t Au | 0.56 | 0.56 | 0.58 | 0.58 | 0.55 | 0.55 | 0.55 | 0.55 |
Note: 1 Excluding mining cost.
15.2.4 Open Pit Optimization Inputs
The key inputs for pit optimization are summarized in Table 15-6 and Table 15-7.
Table 15-6: Open Pit Optimization Inputs for CLX, Canto 1, and Canto 2
Parameter | Unit | CLX
(Oxide) | CLX
(Fresh) | Canto 1
(Oxide) | Canto 1
(Fresh) | Canto 2
(Oxide) | Canto 2
(Fresh) | Canto 2
(Oxide)
CARB | Canto 2
(Fresh)
CARB |
Financial Inputs | | | | | | | | | |
Au Price | $/oz | 1,500 | 1,500 | 1,500 | 1,500 | 1,500 | 1,500 | 1,500 | 1,500 |
CEFEM Tax (BZL) | % | 1.5 | 1.5 | 1.5 | 1.5 | 1.5 | 1.5 | 1.5 | 1.5 |
Refining Costs | $/oz | 24.38 | 24.38 | 24.38 | 24.38 | 24.38 | 24.38 | 24.38 | 24.38 |
Scenario Discount
Rate | % | 5 | 5 | 5 | 5 | 5 | 5 | 5 | 5 |
Mining Inputs | | | | | | | | | |
Dilution and Losses | m | Regularization
8 x 4 x 5 | Regularization
8 x 4 x 5 | Regularization
8 x 4 x 5 | Regularization
8 x 4 x 5 | Regularization
8 x 4 x 5 | Regularization
8 x 4 x 5 | Regularization
8 x 4 x 5 | Regularization
8 x 4 x 5 |
Bench Height | m | 10 | 10 | 10 | 10 | 10 | 10 | 10 | 10 |
Reference Bench | masl | 360 | 360 | 370 | 370 | 360 | 360 | 360 | 360 |
Incremental Mining
Cost | $/10 m | 0.04 | 0.04 | 0.04 | 0.04 | 0.04 | 0.04 | 0.04 | 0.04 |
Mining Cost (Waste) | $/t | 1.81 | 2.66 | 1.79 | 2.64 | 1.81 | 2.66 | 1.81 | 2.66 |
Differential Mining
Cost (Ore) | $/t | 1.89 | 1.86 | 2.09 | 2.06 | 2.08 | 2.05 | 2.08 | 2.05 |
Geotechnical Inputs | | | | | | | | | |
Footwall | ° | - | 36 | - | 39 | - | 35 | - | 35 |
Hanging Wall | ° | - | 44 | - | 39 | - | 56 | - | 56 |
Laterite | ° | 31 | - | 31 | - | 31 | - | 31 | - |
Dumps & Backfill | ° | 27 | - | 27 | - | 27 | - | 27 | - |
Process and G&A
Inputs | | | | | | | | | |
Au Recovery | % | 90.1 | 90.1 | 75.0 | 75.0 | 86.0 | 86.0 | 90.1 | 90.1 |
Process Cost | $/t | 14.60 | 14.60 | 14.60 | 14.60 | 14.60 | 14.60 | 14.60 | 14.60 |
Process Sustaining
Cost | $/t | 1.80 | 1.80 | 1.80 | 1.80 | 1.80 | 1.80 | 1.80 | 1.80 |
G&A | $/t | 4.69 | 4.69 | 4.69 | 4.69 | 4.69 | 4.69 | 4.69 | 4.69 |
Note: CARB = carbonaceous ore.
Table 15-7: Open Pit Optimization Inputs for LG, PPQ, and G
Parameter | Unit | LG
(Oxide) | LG
(Fresh) | PPQ
(Oxide) | PPQ
(Fresh) | PPQ
(Oxide)
CARB | PPQ
(Fresh)
CARB | G
(Oxide) | G
(Fresh) |
Financial Inputs | | | | | | | | | |
Au Price | $/oz | 1,500 | 1,500 | 1,500 | 1,500 | 1,500 | 1,500 | 1,500 | 1,500 |
CEFEM Tax (BZL) | % | 1.5 | 1.5 | 1.5 | 1.5 | 1.5 | 1.5 | 1.5 | 1.5 |
Refining Costs | $/oz | 24.38 | 24.38 | 24.38 | 24.38 | 24.38 | 24.38 | 24.38 | 24.38 |
Scenario Throughput | kt/a | 50 | 50 | 50 | 50 | 50 | 50 | 100 | 100 |
Scenario Discount Rate | % | 5 | 5 | 5 | 5 | 5 | 5 | 5 | 5 |
Mining Inputs | | | | | | | | | |
Dilution and Losses | m | Regularization
8 x 4 x 5 | Regularization
8 x 4 x 5 | Regularization
8 x 4 x 5 | Regularization
8 x 4 x 5 | Regularization
8 x 4 x 5 | Regularization
8 x 4 x 5 | Regularization
8 x 4 x 5 | Regularization
8 x 4 x 5 |
Bench Height | m | 10 | 10 | 10 | 10 | 10 | 10 | 10 | 10 |
Reference Bench | masl | 320 | 320 | 320 | 320 | 320 | 320 | 370 | 370 |
Incremental Mining Cost | $/10 m | 0.04 | 0.04 | 0.04 | 0.04 | 0.04 | 0.04 | 0.04 | 0.04 |
Mining Cost (Waste) | $/t | 1.79 | 2.64 | 1.79 | 2.64 | 1.79 | 2.64 | 1.84 | 2.70 |
Differential Mining Cost
(Ore) | $/t | 2.43 | 2.41 | 2.16 | 2.14 | 2.16 | 2.14 | 2.03 | 2.00 |
Geotechnical Inputs | | | | | | | | | |
Footwall | ° | - | 45 | - | 36 | - | 36 | - | 45 |
Hanging Wall | ° | - | 45 | - | 43 | - | 43 | - | 45 |
Laterite | ° | 31 | - | 31 | - | 31 | - | 31 | - |
Dumps & Backfill | ° | 27 | - | 27 | - | 27 | - | 27 | - |
Process and
G&A Inputs | | | | | | | | | |
Au Recovery | % | 90.1 | 90.1 | 86.0 | 86.0 | 90.1 | 90.1 | 90.1 | 90.1 |
Process Cost | $/t | 14.60 | 14.60 | 14.60 | 14.60 | 14.60 | 14.60 | 14.60 | 14.60 |
Process Sustaining
Cost | $/t | 1.80 | 1.80 | 1.80 | 1.80 | 1.80 | 1.80 | 1.80 | 1.80 |
G&A | $/t | 4.69 | 4.69 | 4.69 | 4.69 | 4.69 | 4.69 | 4.69 | 4.69 |
Note: CARB = carbonaceous ore.
For the CLX optimization, the area around the current process plant and tailings storage facility infrastructure was sterilized to ensure that mining could not occur in that area (Figure 15-2).
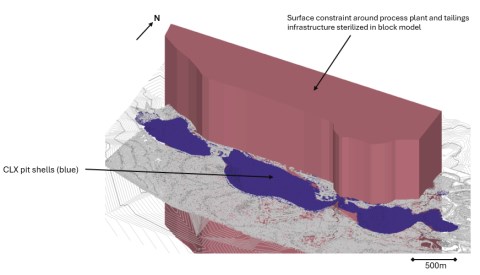
Figure 15-2: Isometric View of Plant and Tailings Surface Infrastructure Constraint on CLX Pit Optimization
FBDM provided geotechnical inter-ramp slope angles, and these were reduced to accommodate likely ramp requirements based on existing FBDM pit designs. The geotechnical parameters by pit are summarized in Table 15-8.
Table 15-8: Geotechnical Inputs by Pit
| Inter-Ramp Angle | Reduced Overall Slope Angle |
Bench Face
Angle
(°) | Bench
Height
(m) | Berm
Width
(m) | Inter-Ramp
Angle
(°) | Slope
Height
(m) | Dual Lane
Ramps
(No.) | Single Lane
Ramps
(No.) | Overall Slope
Angle
(°) |
Dumps | 35 | 10 | 5 | 27 | 20 | - | - | 27 |
Laterite | 40 | 10 | 5 | 31 | 20 | - | - | 31 |
CLX Footwall | 60 | 10 | 5 | 43 | 160 | 2 | - | 36 |
CLX Hanging Wall | 75 | 10 | 5 | 52 | 160 | 2 | - | 44 |
PPQ Footwall | 65 | 10 | 5 | 46 | 30 | - | 1 | 36 |
PPQ Hanging Wall | 80 | 10 | 5 | 56 | 30 | - | 1 | 43 |
Canto 2 Footwall | 65 | 10 | 5 | 46 | 130 | - | 5 | 35 |
Canto 2 Hanging Wall | 80 | 10 | 5 | 56 | 130 | - | - | 56 |
Canto 1 | 75 | 10 | 5 | 52 | 50 | - | 2 | 39 |
G | 75 | 10 | 5 | 52 | 100 | - | 2 | 45 |
LG | 75 | 10 | 5 | 52 | 100 | - | 2 | 45 |
15.2.5 Open Pit Optimization Results
Pit optimization was undertaken in Whittle. Scenarios were run by varying the revenue factor (RF), by which Whittle scales the revenue per block to generate a series of nested pit shells. The nested shells indicate the likely order in which mining would take place. Whittle was run from RF 0.1 to RF 1.5 in increments of 0.05.
Whittle generated two discounted open pit cashflows, as follows:
- Best-case scenario: the sequence that gives the maximum value by mining nested shells in the order Whittle generates them. This method gives the best value; however, it does not account for a practical mining sequence or the spatial relationship between pushbacks.
- Worst-case scenario: the simplest mining sequence whereby pits are mined in their entirety from top-to-bottom, "bench-by-bench." This gives the most practical mining solution, but the lowest relative value.
The optimization results for CLX are shown in Figure 15-3.
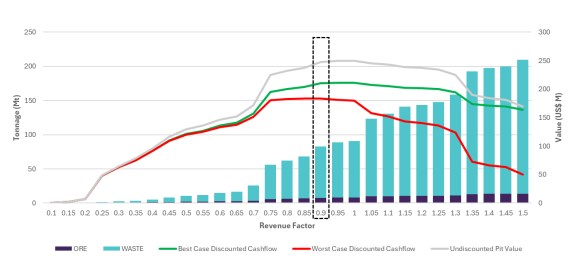
Figure 15-3: CLX Open Pit Optimization Results
The RF 0.9 pit shell was selected, totalling 7,597 kt of ore at 2.04 g/t Au and a 9.9 strip ratio. The optimization results for CLX are tabulated in Table 15-9.
Table 15-9: Open Pit Optimization Results-CLX
Revenue
Factor
(RF) | Gold
Price
(x RF)
($/oz) | Total
Rock
Mined
(kt) | Waste
Mined
(kt) | Ore Mined | Stripping
Ratio
(w:o) | Undiscounted
Cash Flow
($ M) | Discounted
Cash Flow
Best Case 5%
($ M) | Discounted
Cash Flow
Worst Case 5%
($ M) |
(kt) | (g/t) |
0.50 | 750 | 10,644 | 8,785 | 1,858 | 2.55 | 4.7 | 129 | 121 | 120 |
0.55 | 825 | 11,875 | 9,819 | 2,056 | 2.47 | 4.8 | 136 | 127 | 125 |
0.60 | 900 | 14,692 | 12,311 | 2,381 | 2.39 | 5.2 | 146 | 136 | 133 |
0.65 | 975 | 16,466 | 13,854 | 2,611 | 2.32 | 5.3 | 152 | 141 | 138 |
0.70 | 1,050 | 25,637 | 22,295 | 3,342 | 2.24 | 6.7 | 172 | 157 | 152 |
0.75 | 1,125 | 56,227 | 50,317 | 5,910 | 2.07 | 8.5 | 225 | 195 | 180 |
0.80 | 1,200 | 61,853 | 55,511 | 6,342 | 2.05 | 8.8 | 232 | 200 | 183 |
0.85 | 1,275 | 67,892 | 61,127 | 6,765 | 2.03 | 9.0 | 238 | 204 | 184 |
0.90 | 1,350 | 82,877 | 75,279 | 7,597 | 2.04 | 9.9 | 248 | 210 | 183 |
0.95 | 1,425 | 88,826 | 80,844 | 7,982 | 2.02 | 10.1 | 250 | 211 | 181 |
1.00 | 1,500 | 90,807 | 82,687 | 8,120 | 2.02 | 10.2 | 250 | 211 | 180 |
1.05 | 1,575 | 123,386 | 113,756 | 9,630 | 2.01 | 11.8 | 245 | 207 | 158 |
1.10 | 1,650 | 130,520 | 120,543 | 9,978 | 2.00 | 12.1 | 243 | 205 | 152 |
1.15 | 1,725 | 141,119 | 130,658 | 10,460 | 1.99 | 12.5 | 239 | 203 | 143 |
1.20 | 1,800 | 143,561 | 132,975 | 10,586 | 1.99 | 12.6 | 237 | 202 | 141 |
1.25 | 1,875 | 147,635 | 136,879 | 10,757 | 1.98 | 12.7 | 234 | 200 | 136 |
1.30 | 1,950 | 158,862 | 147,653 | 11,209 | 1.98 | 13.2 | 225 | 194 | 124 |
1.35 | 2,025 | 192,335 | 179,105 | 13,230 | 1.87 | 13.5 | 190 | 174 | 73 |
1.40 | 2,100 | 197,413 | 183,979 | 13,433 | 1.86 | 13.7 | 184 | 171 | 66 |
1.45 | 2,175 | 199,641 | 186,102 | 13,539 | 1.86 | 13.7 | 182 | 170 | 63 |
1.50 | 2,250 | 209,579 | 195,745 | 13,834 | 1.86 | 14.1 | 170 | 164 | 50 |
The optimization results for Canto 1 are shown in Figure 15-4.
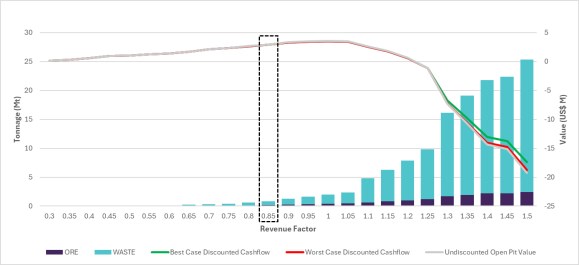
Figure 15-4: Canto 1 Open Pit Optimization Results
The RF 0.85 pit shell was selected, totalling 181 kt ore at 1.41 g/t Au and a 3.5 strip ratio. The optimization results for Canto 1 are shown in Table 15-10.
Table 15-10: Open Pit Optimization Results-Canto 1
Revenue
Factor
(RF) | Gold
Price
(x RF)
($/oz) | Total
Rock
Mined
(kt) | Waste
Mined
(kt) | Ore Mined | Stripping
Ratio
(w:o) | Undiscounted
Cash Flow
($ M) | Discounted
Cash Flow
Best Case 5%
($ M) | Discounted
Cash Flow
Worst Case 5%
($ M) |
(kt) | (g/t) |
0.5 | 750 | 54 | 29 | 26 | 1.99 | 1.1 | 1.0 | 1.0 | 1.0 |
0.55 | 825 | 79 | 46 | 33 | 1.90 | 1.4 | 1.2 | 1.2 | 1.2 |
0.6 | 900 | 113 | 74 | 39 | 1.87 | 1.9 | 1.4 | 1.4 | 1.4 |
0.65 | 975 | 226 | 173 | 53 | 1.87 | 3.2 | 1.7 | 1.7 | 1.7 |
0.7 | 1,050 | 322 | 238 | 84 | 1.63 | 2.8 | 2.1 | 2.1 | 2.1 |
0.75 | 1,125 | 400 | 297 | 102 | 1.56 | 2.9 | 2.3 | 2.3 | 2.3 |
0.8 | 1,200 | 611 | 472 | 139 | 1.48 | 3.4 | 2.7 | 2.7 | 2.7 |
0.85 | 1,275 | 812 | 631 | 181 | 1.41 | 3.5 | 2.9 | 2.9 | 2.9 |
0.9 | 1,350 | 1,274 | 1,010 | 264 | 1.33 | 3.8 | 3.3 | 3.3 | 3.3 |
0.95 | 1,425 | 1,654 | 1,326 | 328 | 1.28 | 4.0 | 3.5 | 3.5 | 3.5 |
1 | 1,500 | 1,994 | 1,609 | 385 | 1.25 | 4.2 | 3.6 | 3.5 | 3.5 |
1.05 | 1,575 | 2,328 | 1,887 | 440 | 1.23 | 4.3 | 3.5 | 3.4 | 3.4 |
1.1 | 1,650 | 4,845 | 4,206 | 640 | 1.26 | 6.6 | 2.6 | 2.6 | 2.6 |
1.15 | 1,725 | 6,287 | 5,467 | 819 | 1.20 | 6.7 | 1.8 | 1.7 | 1.7 |
1.2 | 1,800 | 7,895 | 6,921 | 974 | 1.19 | 7.1 | 0.6 | 0.6 | 0.6 |
1.25 | 1,875 | 9,813 | 8,640 | 1,173 | 1.16 | 7.4 | -1.2 | -1.1 | -1.1 |
1.3 | 1,950 | 16,168 | 14,487 | 1,681 | 1.18 | 8.6 | -7.3 | -6.7 | -7.2 |
1.35 | 2,025 | 19,116 | 17,174 | 1,942 | 1.16 | 8.8 | -10.8 | -9.8 | -10.6 |
1.4 | 2,100 | 21,801 | 19,626 | 2,175 | 1.14 | 9.0 | -14.3 | -13.0 | -14.0 |
1.45 | 2,175 | 22,389 | 20,178 | 2,211 | 1.14 | 9.1 | -15.1 | -13.7 | -14.8 |
1.5 | 2,250 | 25,359 | 22,964 | 2,395 | 1.14 | 9.6 | -19.3 | -17.4 | -18.8 |
The optimization results for Canto 2 are shown in Figure 15-5.
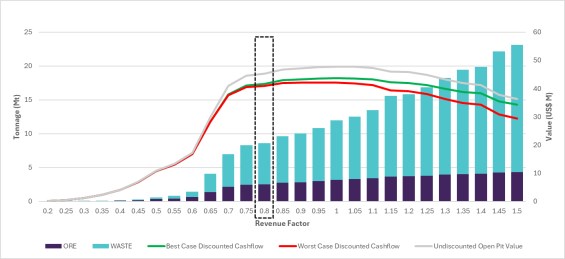
Figure 15-5: Canto 2 Open Pit Optimization Results
The RF 0.8 pit shell was selected, totalling 2,523 kt of ore at 1.24 g/t Au and a 2.4 strip ratio. The optimization results for Canto 2 are tabulated in Table 15-11.
Table 15-11: Open Pit Optimization Results-Canto 2
Revenue
Factor
(RF) | Gold
Price
(x RF)
($/oz) | Total
Rock
Mined
(kt) | Waste
Mined
(kt) | Ore Mined | Stripping
Ratio
(w:o) | Undiscounted
Cash Flow
($ M) | Discounted
Cash Flow
Best Case 5%
($ M) | Discounted
Cash Flow
Worst Case 5%
($ M) |
(kt) | (g/t) |
0.5 | 750 | 577 | 265 | 311 | 1.57 | 0.9 | 11 | 11 | 11 |
0.55 | 825 | 833 | 420 | 413 | 1.51 | 1.0 | 13 | 13 | 13 |
0.6 | 900 | 1,401 | 790 | 611 | 1.43 | 1.3 | 17 | 17 | 17 |
0.65 | 975 | 4,061 | 2,728 | 1,333 | 1.33 | 2.0 | 30 | 28 | 28 |
0.7 | 1,050 | 6,981 | 4,864 | 2,117 | 1.27 | 2.3 | 41 | 38 | 38 |
0.75 | 1,125 | 8,286 | 5,848 | 2,438 | 1.25 | 2.4 | 45 | 41 | 40 |
0.8 | 1,200 | 8,588 | 6,064 | 2,523 | 1.24 | 2.4 | 45 | 42 | 41 |
0.85 | 1,275 | 9,606 | 6,872 | 2,733 | 1.22 | 2.5 | 47 | 43 | 42 |
0.9 | 1,350 | 10,060 | 7,230 | 2,829 | 1.22 | 2.6 | 47 | 43 | 42 |
0.95 | 1,425 | 10,822 | 7,832 | 2,989 | 1.20 | 2.6 | 48 | 44 | 42 |
1 | 1,500 | 11,954 | 8,808 | 3,147 | 1.20 | 2.8 | 48 | 44 | 42 |
1.05 | 1,575 | 12,505 | 9,248 | 3,257 | 1.18 | 2.8 | 48 | 44 | 42 |
1.1 | 1,650 | 13,458 | 10,054 | 3,404 | 1.17 | 3.0 | 47 | 43 | 41 |
1.15 | 1,725 | 15,572 | 11,916 | 3,656 | 1.16 | 3.3 | 46 | 42 | 39 |
1.2 | 1,800 | 15,798 | 12,104 | 3,694 | 1.15 | 3.3 | 46 | 42 | 39 |
1.25 | 1,875 | 16,821 | 13,024 | 3,797 | 1.15 | 3.4 | 45 | 41 | 38 |
1.3 | 1,950 | 18,235 | 14,307 | 3,928 | 1.14 | 3.6 | 43 | 40 | 36 |
1.35 | 2,025 | 19,416 | 15,401 | 4,015 | 1.14 | 3.8 | 42 | 39 | 35 |
1.4 | 2,100 | 19,841 | 15,786 | 4,056 | 1.14 | 3.9 | 41 | 38 | 34 |
1.45 | 2,175 | 22,138 | 17,881 | 4,258 | 1.13 | 4.2 | 38 | 36 | 31 |
1.5 | 2,250 | 23,136 | 18,803 | 4,333 | 1.12 | 4.3 | 36 | 34 | 29 |
The optimization results for LG are shown in Figure 15-6.

Figure 15-6: LG Open Pit Optimization Results
The RF 1.0 pit shell was selected, totalling 374 kt of ore at 0.94 g/t Au and a 2.9 strip ratio. The optimization results for LG are tabulated in Table 15-12.
Table 15-12: Open Pit Optimization Results-LG
Revenue
Factor
(RF) | Gold
Price
(x RF)
($/oz) | Total
Rock
Mined
(kt) | Waste
Mined
(kt) | Ore Mined | Stripping
Ratio
(w:o) | Undiscounted
Cash Flow
($ M) | Discounted
Cash Flow
Best Case 5%
($ M) | Discounted
Cash Flow
Worst Case 5%
($ M) |
(kt) | (g/t) |
0.5 | 750 | 19 | 8 | 11 | 1.52 | 0.7 | 0.4 | 0.4 | 0.4 |
0.55 | 825 | 34 | 15 | 19 | 1.42 | 0.8 | 0.6 | 0.6 | 0.6 |
0.6 | 900 | 61 | 26 | 34 | 1.28 | 0.8 | 0.9 | 0.9 | 0.9 |
0.65 | 975 | 82 | 37 | 46 | 1.21 | 0.8 | 1.0 | 1.0 | 1.0 |
0.7 | 1,050 | 95 | 40 | 55 | 1.16 | 0.7 | 1.2 | 1.1 | 1.1 |
0.75 | 1,125 | 110 | 45 | 64 | 1.12 | 0.7 | 1.2 | 1.2 | 1.2 |
0.8 | 1,200 | 142 | 60 | 81 | 1.07 | 0.7 | 1.4 | 1.3 | 1.3 |
0.85 | 1,275 | 224 | 95 | 129 | 0.97 | 0.7 | 1.6 | 1.5 | 1.5 |
0.9 | 1,350 | 274 | 125 | 149 | 0.94 | 0.8 | 1.7 | 1.6 | 1.5 |
0.95 | 1,425 | 1,323 | 986 | 338 | 0.95 | 2.9 | 2.1 | 1.8 | 1.5 |
1 | 1,500 | 1,445 | 1,071 | 374 | 0.94 | 2.9 | 2.2 | 1.8 | 1.4 |
1.05 | 1,575 | 1,615 | 1,191 | 424 | 0.92 | 2.8 | 2.1 | 1.7 | 1.3 |
1.1 | 1,650 | 1,696 | 1,247 | 449 | 0.91 | 2.8 | 2.1 | 1.7 | 1.2 |
1.15 | 1,725 | 1,939 | 1,439 | 500 | 0.89 | 2.9 | 1.8 | 1.5 | 0.8 |
1.2 | 1,800 | 2,139 | 1,600 | 539 | 0.88 | 3.0 | 1.6 | 1.4 | 0.5 |
1.25 | 1,875 | 2,352 | 1,778 | 575 | 0.87 | 3.1 | 1.2 | 1.2 | 0.2 |
1.3 | 1,950 | 2,710 | 2,086 | 624 | 0.86 | 3.3 | 0.7 | 0.9 | -0.3 |
1.35 | 2,025 | 2,921 | 2,268 | 653 | 0.85 | 3.5 | 0.3 | 0.7 | -0.7 |
1.4 | 2,100 | 3,059 | 2,392 | 668 | 0.85 | 3.6 | 0.1 | 0.6 | -0.9 |
1.45 | 2,175 | 3,335 | 2,641 | 694 | 0.84 | 3.8 | -0.5 | 0.3 | -1.4 |
1.5 | 2,250 | 3,492 | 2,783 | 708 | 0.84 | 3.9 | -0.8 | 0.1 | -1.6 |
The optimization results for G are shown in Figure 15-7.

Figure 15-7: G Open Pit Optimization Results
The RF 1 pit shell was selected, totalling 238 kt of ore at 1.32 g/t Au and a 7.2 strip ratio. The optimization results for LG are tabulated in Table 15-13.
Table 15-13: Open Pit Optimization Results-G
Revenue
Factor
(RF) | Gold
Price
(x RF)
($/oz) | Total
Rock
Mined
(kt) | Waste
Mined
(kt) | Ore Mined | Stripping
Ratio
(w:o) | Undiscounted
Cash Flow
($ M) | Discounted
Cash Flow
Best Case 5%
($ M) | Discounted
Cash Flow
Worst Case 5%
($ M) |
(kt) | (g/t) |
0.5 | 750 | 21 | 8 | 13 | 1.52 | 0.6 | 0.5 | 0.5 | 0.5 |
0.55 | 825 | 24 | 9 | 15 | 1.48 | 0.6 | 0.5 | 0.5 | 0.5 |
0.6 | 900 | 38 | 17 | 21 | 1.38 | 0.8 | 0.6 | 0.6 | 0.6 |
0.65 | 975 | 41 | 17 | 24 | 1.33 | 0.7 | 0.7 | 0.7 | 0.7 |
0.7 | 1,050 | 65 | 36 | 29 | 1.30 | 1.2 | 0.8 | 0.8 | 0.8 |
0.75 | 1,125 | 87 | 51 | 36 | 1.24 | 1.4 | 0.8 | 0.8 | 0.8 |
0.8 | 1,200 | 934 | 816 | 118 | 1.43 | 6.9 | 2.0 | 1.9 | 1.9 |
0.85 | 1,275 | 1,322 | 1,165 | 157 | 1.42 | 7.4 | 2.4 | 2.2 | 2.2 |
0.9 | 1,350 | 1,428 | 1,253 | 175 | 1.38 | 7.2 | 2.5 | 2.3 | 2.3 |
0.95 | 1,425 | 1,885 | 1,657 | 228 | 1.34 | 7.3 | 2.7 | 2.5 | 2.3 |
1 | 1,500 | 1,949 | 1,711 | 238 | 1.32 | 7.2 | 2.7 | 2.5 | 2.3 |
1.05 | 1,575 | 2,026 | 1,779 | 247 | 1.31 | 7.2 | 2.7 | 2.5 | 2.3 |
1.1 | 1,650 | 2,030 | 1,781 | 249 | 1.31 | 7.2 | 2.7 | 2.5 | 2.3 |
1.15 | 1,725 | 2,165 | 1,904 | 261 | 1.30 | 7.3 | 2.6 | 2.4 | 2.2 |
1.2 | 1,800 | 7,548 | 6,885 | 663 | 1.25 | 10.4 | -1.0 | -1.5 | -2.7 |
1.25 | 1,875 | 7,715 | 7,034 | 681 | 1.25 | 10.3 | -1.2 | -1.6 | -2.9 |
1.3 | 1,950 | 7,912 | 7,214 | 699 | 1.24 | 10.3 | -1.4 | -1.8 | -3.2 |
1.35 | 2,025 | 9,405 | 8,579 | 827 | 1.20 | 10.4 | -3.2 | -3.1 | -5.3 |
1.4 | 2,100 | 9,776 | 8,916 | 860 | 1.19 | 10.4 | -3.7 | -3.4 | -5.9 |
1.45 | 2,175 | 13,749 | 12,640 | 1,109 | 1.19 | 11.4 | -9.0 | -7.0 | -12.2 |
1.5 | 2,250 | 14,042 | 12,911 | 1,131 | 1.18 | 11.4 | -9.5 | -7.3 | -12.7 |
The optimization results for PPQ are shown in Figure 15-8.

Figure 15-8: PPQ Open Pit Optimization Results
The RF 1 pit shell was selected, totalling 337 kt of ore at 1.32 g/t Au and a 4.3 strip ratio. The optimization results for PPQ are shown in Table 15-14.
Table 15-14: Open Pit Optimization Results-PPQ
Revenue
Factor
(RF) | Gold
Price
(x RF)
($/oz) | Total
Rock
Mined
(kt) | Waste
Mined
(kt) | Ore Mined | Stripping
Ratio
(w:o) | Undiscounted
Cash Flow
($ M) | Discounted
Cash Flow
Best Case 5%
($ M) | Discounted
Cash Flow
Worst Case 5%
($ M) |
(kt) | (g/t) |
0.5 | 750 | 137 | 104 | 33 | 2.53 | 3.2 | 2.4 | 2.3 | 2.3 |
0.55 | 825 | 240 | 180 | 60 | 2.04 | 3.0 | 3.1 | 3.0 | 3.0 |
0.6 | 900 | 249 | 184 | 65 | 1.96 | 2.8 | 3.2 | 3.1 | 3.1 |
0.65 | 975 | 418 | 312 | 107 | 1.70 | 2.9 | 4.0 | 3.7 | 3.7 |
0.7 | 1,050 | 475 | 354 | 121 | 1.65 | 2.9 | 4.2 | 3.9 | 3.9 |
0.75 | 1,125 | 779 | 605 | 175 | 1.53 | 3.5 | 5.0 | 4.6 | 4.4 |
0.8 | 1,200 | 921 | 718 | 203 | 1.47 | 3.5 | 5.3 | 4.8 | 4.6 |
0.85 | 1,275 | 1,150 | 897 | 253 | 1.39 | 3.5 | 5.7 | 5.1 | 4.8 |
0.9 | 1,350 | 1,237 | 969 | 268 | 1.37 | 3.6 | 5.8 | 5.2 | 4.8 |
0.95 | 1,425 | 1,339 | 1,056 | 283 | 1.36 | 3.7 | 5.8 | 5.2 | 4.8 |
1 | 1,500 | 1,786 | 1,449 | 337 | 1.32 | 4.3 | 5.8 | 5.2 | 4.5 |
1.05 | 1,575 | 2,207 | 1,814 | 393 | 1.28 | 4.6 | 5.8 | 5.1 | 4.3 |
1.1 | 1,650 | 6,039 | 5,285 | 754 | 1.25 | 7.0 | 4.7 | 3.8 | 2.3 |
1.15 | 1,725 | 6,887 | 6,030 | 857 | 1.22 | 7.0 | 4.1 | 3.5 | 1.3 |
1.2 | 1,800 | 7,025 | 6,147 | 878 | 1.21 | 7.0 | 4.0 | 3.4 | 1.1 |
1.25 | 1,875 | 7,536 | 6,605 | 931 | 1.19 | 7.1 | 3.5 | 3.2 | 0.6 |
1.3 | 1,950 | 10,481 | 9,332 | 1,149 | 1.18 | 8.1 | 0.4 | 1.9 | -3.2 |
1.35 | 2,025 | 10,913 | 9,718 | 1,194 | 1.17 | 8.1 | -0.2 | 1.7 | -3.8 |
1.4 | 2,100 | 12,645 | 11,297 | 1,348 | 1.15 | 8.4 | -2.6 | 0.9 | -6.3 |
1.45 | 2,175 | 14,782 | 13,338 | 1,444 | 1.16 | 9.2 | -5.1 | 0.2 | -9.7 |
1.5 | 2,250 | 15,675 | 14,159 | 1,516 | 1.15 | 9.3 | -6.6 | -0.1 | -11.1 |
15.2.6 Open Pit Design
Pit designs were generated based on the selected pit shells from optimization. These designs were interrogated against the mining block model to generate the open pit Mineral Reserve estimate. The pit designs are described in detail in Section 16.
15.2.7 Open Pit Mineral Reserve Comparison 2020 vs. 2024
A comparison of the open pit Mineral Reserves for 2020 and 2024 is shown in Table 15-15.
Table 15-15: Open Pit Mineral Reserve Comparison 2020 vs. 2024
Category | Tonnage
(kt) | Gold Grade
(g/t) | Contained Gold
(koz) |
Proven | | | |
2020 | 1,461 | 1.32 | 62 |
2024 | 10,358 | 1.79 | 596 |
Probable | | | |
2020 | 835 | 0.84 | 23 |
2024 | 386 | 1.27 | 16 |
Proven & Probable | | | |
2020 | 2,296 | 1.45 | 85 |
2024 | 10,744 | 1.77 | 612 |
15.3 Underground
Underground Mineral Reserves have been estimated for the UG Main, Edeep, F, G, Canto 1, and Canto 2 deposits. Canto 2 would consist of a new mining operation to commence at the completion of mining the Canto 2 pit. The mining method at Canto 2 would be similar to the other operations, namely LHOS.
Several checks were carried out to verify the procedures and numerical calculations used in preparing the Mineral Reserve estimate. The Mineral Reserves were estimated using a cut-off grade of 1.36 g/t Au for underground operations and a gold price of $1,800/oz.
15.3.1 Mineral Resource Block Models
For the underground Mineral Reserve estimates, FBDM provided the Mineral Resource models that form the basis of the underground Mineral Reserve estimation:
F and G: filename FGU24B2.csv
Canto 1, Canto 2, UG Main, Edeep: filename CLU24B1.csv
- No reserves generated: filename PPU_24B1.csv
The Mineral Resource block models have a block size of 2 x 2 x 2 m (X by Y by Z). FBDM provided mineralized block model cells for each of the block models, which were used for stope optimization and Mineral Reserve estimation. Mineral Resource models were reviewed by Dr. Benoit Poupeau as per Section 14.
15.3.2 Dilution and Extraction
The estimated dilution for the underground Mineral Reserves is based on historical reconciliation of mined stopes at Fazenda. All stopes are reconciled by comparing planned stope volumes (computer designs) to actual mined volumes based on cavity-monitoring surveys and production records. Comparisons are made for under-break-an estimate of ore loss, and overbreak-a measure of ore dilution. Typical mining recovery and dilution parameters applied to the Mineral Reserves in the stope design process are shown in Table 15-16.
Although Canto 2 is a new operation, mining recovery and dilution parameters were based on the Canto 1 parameters, as geological and geotechnical conditions are similar.
Table 15-16: Underground Dilution and Losses by Mining Area
Design | Dilution
(%) | Loss
(%) |
Canto 1 | 15 | 10 |
UG Main (C, D, E) | 15 | 10 |
UG Main (W) | 20 | 10 |
Edeep | 20 | 10 |
F & G | 15 | 10 |
Canto 2 | 15 | 10 |
15.3.3 Cut-Off Grade
Cut-off grades were estimated on a fully costed basis for the underground. The cut-off grade calculation parameters for underground mining are shown in Table 15-17.
A gold price of $1,800/oz was used for underground operations.
Table 15-17: Underground Cut-Off Grade and Supporting Parameters
Abbreviation | Component | Unit | Value |
Cm | Mining Cost | $/t ore mined | 36.20 |
Cm-rh | Rehandle | $/t processed | 0.65 |
Cm-capex | Mining Sustaining CAPEX | $/t mined | 10.93 |
Cp | Processing Cost | $/t processed | 14.60 |
Cp-capex | Process Sustaining CAPEX | $/t processed | 1.80 |
Cga | G&A Costs | $/t processed | 4.69 |
REC | Gold Recovery | % | 90.10 |
PAY | Payability | % | 100 |
SPReserve | Metal Price for Reserves | $/oz | 1,800 |
TAR | Metal Transportation and Refining Charge | $/oz | 24.38 |
ROY | Royalties | % | 0.00 |
STR | Streaming | % | 0 |
TAX | CEFEM Tax (BZL) | % | 1.50 |
COG | Cut-Off Grade | g/t | 1.36 |
The COG calculation equation for Fazenda underground is as follows:
COG = [(Cm + Cm-rh + Cm-capex + Cp + Cp-capex + Cga)/(REC * PAY *
(SPReserve - TAR - (TAX * SPReserve)))] * 31.10348
15.3.4 Underground Mineral Reserves Estimate
Stope shapes were generated using Deswik Stope Optimizer based on the gold cut-off of 1.36 g/t, minimum stope width of 5 m, a fixed stope height of 15 m, and a maximum footwall and hanging wall (FW/HW) angle of 45°.
Based on the extent of the ore body, and including outlying stope shapes, any material deemed uneconomic was not included in the mine plan or the Mineral Reserve estimate. Capital and operating development cost estimates were used in determining economic viability for these areas.
Within UG Main, FBDM personnel familiar with the operation assisted in determining areas that were deemed inaccessible or not viably mineable.
Figure 15-9, Figure 15-10, and Figure 15-11 show longitudinal section views indicating underground Mineral Reserves (shown in green). Only the primary haulage routes are shown.
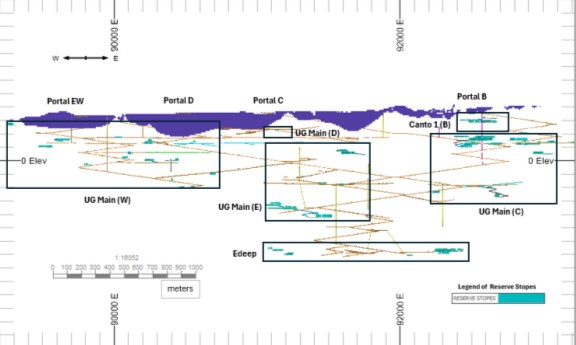
Figure 15-9: Underground Mineral Reserves for Main, Edeep, and Canto 1
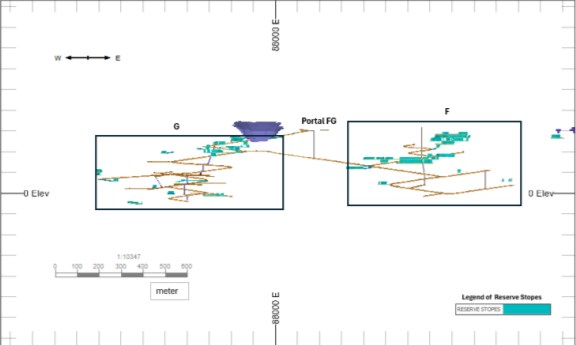
Figure 15-10: Underground Mineral Reserves for F and G

Figure 15-11: Underground Mineral Reserves for Canto 2
The UG Main, F, and G mining areas are almost completely developed with existing infrastructure including dewatering, ventilation, communications, and escapeways. Minor amounts of development are required to access some stoping blocks that are not adjacent to existing development.
The Canto 2 underground design and portal location were based on the optimized pit shell prior to final pit design being completed. Decline development would commence following completion of the Canto 2 open pit.
15.3.5 Underground Mineral Reserve Comparison 2020 vs. 2024
A comparison of the underground Mineral Reserves for 2020 and 2024 is shown in Table 15-18.
Table 15-18: Underground Mineral Reserve Comparison 2020 vs. 2024
Category | Tonnage
(kt) | Gold Grade
(g/t) | Contained Gold
(koz) |
Proven | | | |
2020 | 3,858 | 1.67 | 207 |
2024 | 1,935 | 1.99 | 124 |
Probable | | | |
2020 | 434 | 1.49 | 21 |
2024 | 462 | 1.90 | 28 |
Proven & Probable | | | |
2020 | 4,292 | 1.67 | 228 |
2024 | 2,397 | 1.97 | 152 |
16 Mining Methods
The mining methods used at Fazenda are conventional open pit mining and underground mining using mechanized LHOS. Both methods are widely used in the mining industry, and open pit mining has been in continuous use at Fazenda since mining operations were initiated in 1984, while underground mining commenced in 1988.
16.1 Open Pit Mining
Over the course of the operation's history, several shallow open pits have been excavated to extract near-surface deposits. Currently, several small open pits are in operation, and initial work has commenced on the expansion of shallow open pits to include excavating the remaining underground crown pillars. Contractors mine the open pits.
16.1.1 Open Pit Design
Pit designs were generated in Datamine Studio OP and Deswik based on the pit shells selected from pit optimization (Section 15.1.5). See Figure 16-8 and Figure 16-9 for an overview of all the pits and waste dumps. The design parameters used for each pit are summarized in Table 16-1.
Table 16-1: Open Pit Design Parameters
Parameter | Unit | CLX | Canto 1 | Canto 2 | LG | PPQ | G |
Bench Height | M | 10 | 10 | 10 | 10 | 10 | 10 |
Berm Width | M | 5 | 5 | 5 | 5 | 5 | 5 |
Ramp Width (Dual Lane) | M | 23 | 12 | 12 | 12 | 12 | 12 |
Ramp Width (Single Lane) | M | 16 | 6 | 6 | 6 | 6 | 6 |
Maximum Ramp Gradient | % | 10 | 12 | 12 | 12 | 12 | 12 |
Footwall Face Angle (Fresh) | ° | 60 | 65 | 65 | 75 | 65 | 75 |
Hanging Wall Face Angle (Fresh) | ° | 75 | 65 | 80 | 75 | 80 | 75 |
Laterite Face Angle | ° | 40 | 40 | 40 | 40 | 40 | 40 |
Dumps & Backfill Face Angle | ° | 35 | 35 | 35 | 35 | 35 | 35 |
The pit designs for CLX and Canto 1 are shown in Figure 16-1.
The CLX pit designs have a footprint of approximately 725,000 m2 and reach a maximum depth of 160 m. Canto 1 has a footprint of approximately 8,000 m2 and reaches a depth of 35 m.
Additional intermediate pushbacks were designed for the CLX East, Central, and West pits to assist with scheduling, as shown in Figure 16-2.
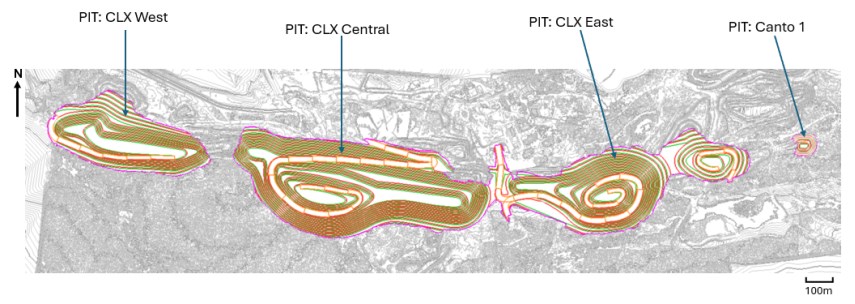
Figure 16-1: CLX and Canto 1 Pit Designs
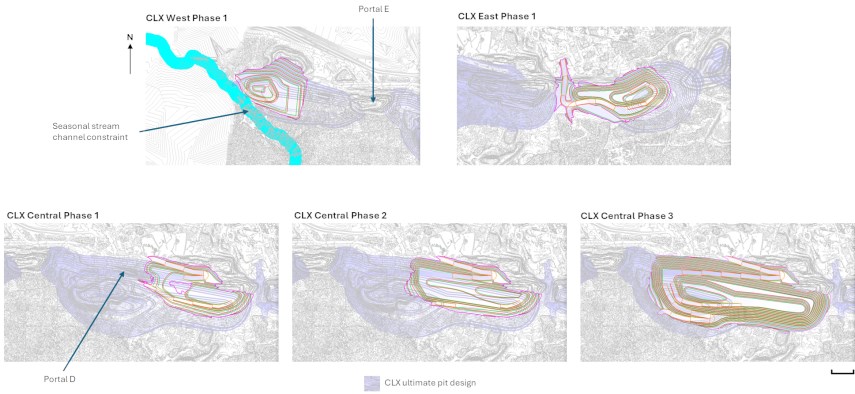
Figure 16-2: CLX Pit Intermediate Phase Designs
Phases in CLX Central were designed to allow initial mining prior to the decomissioning of Portal D, then to follow the Whittle nested pit shells as far as practicable to maximize value and balance the strip ratio. CLX West Phase 1 was designed to allow mining prior to the decommissioning of Portal E, while also avoiding a surface environmental stream channel constraint that remains to be permitted.
The CLX pits sit above an area that has been extensively mined underground and will entail mining through significant underground development and stope voids. An isometric view and cross section showing the location of underground voids in relation to the CLX pit design is shown in Figure 16-3.
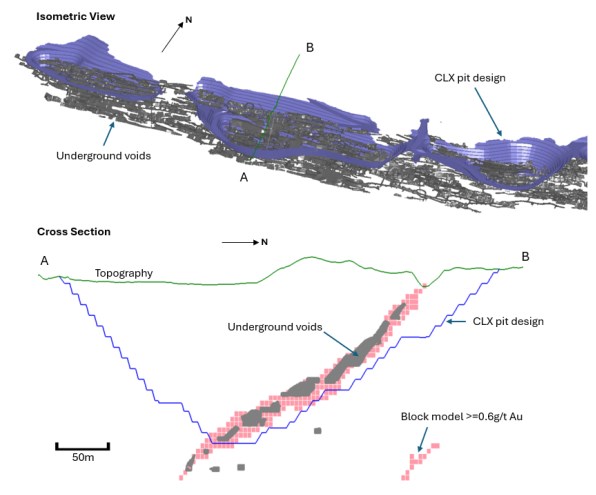
Figure 16-3: CLX Open Pit-Underground Interaction
The pit design for Canto 2 is shown in Figure 16-4. The Canto 2 pit design has a footprint of approximately 176,000 m2 and reaches a maximum depth of 150 m.
The pit designs for LG are shown in Figure 16-5. The LG pit designs have a footprint of approximately 35,000 m2 and reach a maximum depth of 40 m.
The PPQ pit designs are shown in Figure 16-6. The PPQ pit designs have a footprint of approximately 54,000 m2 and reach a maximum depth of 40 m.
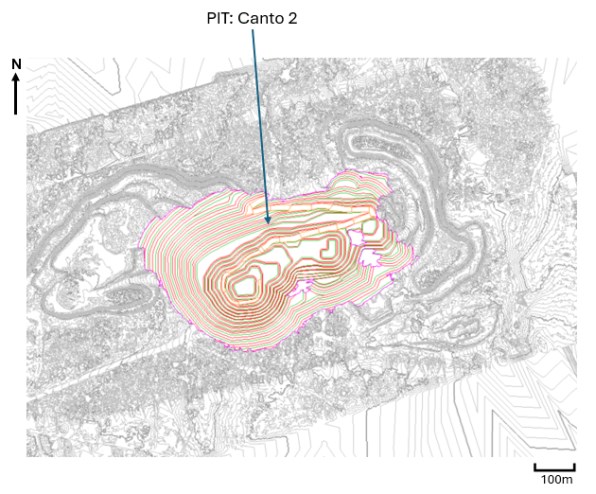
Figure 16-4: Canto 2 Pit Design
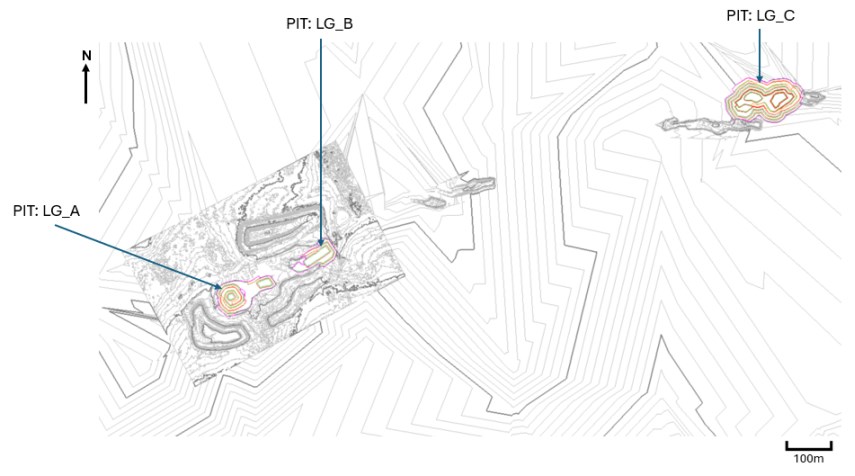
Figure 16-5: LG Pit Designs
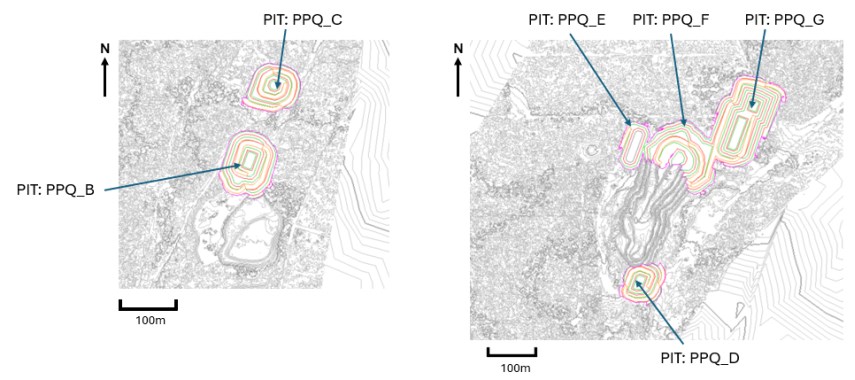
Figure 16-6: PPQ Pit Designs
The G pit design is shown in Figure 16-7. The G pit design has a footprint of approximately 39,000 m2 and will reach a maximum depth of 95 m.

Figure 16-7: G Pit Designs
16.1.2 Waste Dump and Stockpile Design
Waste dumps and stockpiles were designed based on the quantities of material to be excavated over the life-of-mine (LOM), with consideration for future expansion. The parameters used for the rock waste dump and stockpile designs, and the resulting design volumes, are summarized in Table 16-2.
Table 16-2: Waste Dump and Stockpile Volumes and Design Parameters
Waste Dump
Location | Volume
(m3 000s) | Height1
(m) | Lift Height
(m) | Face Angle
(°) | Berm Width
(m) | Ramp Width
(m) |
CANTO2 | 650 | 40 | 10 | 37 | 5 | 12 |
CANTO2_WEST | 4,632 | 70 | 10 | 30 | 5 | 12 |
CLX_PILE_1 | 23,453 | 120 | 10 | 30 | 5 | 18 |
CLX_PILE_2 | 36,999 | 135 | 10 | 37 | 5 | 18 |
CLX_PILE_3 | 3,297 | 45 | 10 | 30 | 5 | 18 |
CLX_EAST | 48,179 | 90 | 10 | 37 | 5 | 22 |
CLX_CENTRAL | 20,176 | 100 | 10 | 37 | 5 | 22 |
CLX_WEST | 9,809 | 80 | 10 | 37 | 5 | 22 |
WD_PPQ | 1,312 | 50 | 10 | 30 | 5 | 12 |
WD_F_2023 | 2,227 | 80 | 10 | 37 | 5 | 12 |
WD_3_LG | 2,003 | 70 | 10 | 37 | 5 | 12 |
WD_LG_SUL | 536 | 30 | 10 | 37 | 5 | 12 |
Total Waste Dumps | 153,271 | | | | | |
Stockpiles | | | | | | |
STK_LG | 149 | 20 | 10 | 35 | 5 | 12 |
STK_MO | 386 | 30 | 10 | 35 | 5 | 12 |
Total Stockpiles | 535 | | | | | |
Note: 1 Height measured from topo surface excluding pit backfill.
The locations of the designed waste dumps and stockpiles in relation to the open pit designs are presented in Figure 16-8 and Figure 16-9. LG pits are 4.5 km northeast of Canto West.
FBDM is currently in the process of applying for waste dump permits. The Canto2 and PPQ waste dumps are expected to be permitted by January 2025, and the CLX East, Central, and West waste dumps are expected to be permitted by January 2026. Fazenda reports that all other waste dumps have existing permits.

Figure 16-8: Waste Dump Locations (Main Project Area)
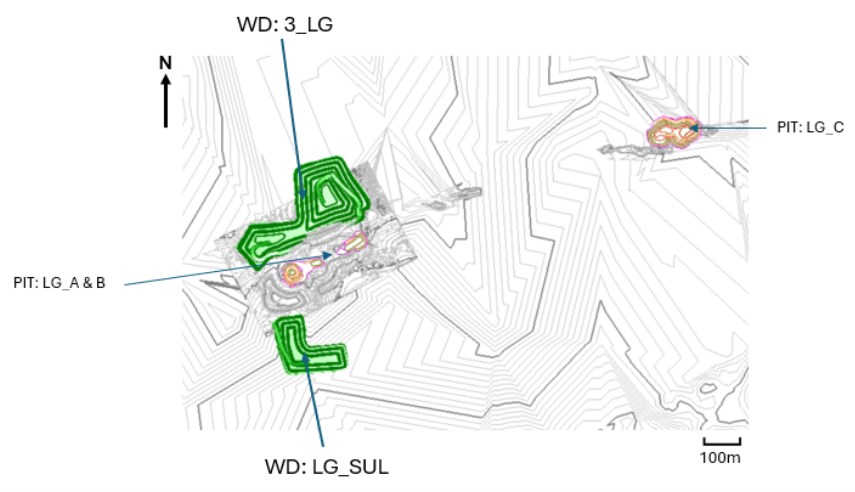
Figure 16-9: Waste Dump Locations (LG)
16.1.3 Mine Equipment
Open pit equipment will be provided by a mining contractor. An explosives contractor will provide all the blasting equipment, including all bulk-agent loading trucks. Table 16-3 presents the type and size of equipment the mining contractor currently provides for all pits. From 2027 onwards, a larger contractor fleet consisting of 100-ton trucks (i.e., CAT 777 or similar) and appropriately matched loading units (i.e., Hitachi EX2500 for waste and Komatsu EX1250 for ore, or similar) is anticipated for the larger CLX pit. In assessing equipment requirements over the LOM, the yearly tonnages, haulage distances, and drill and blast requirements have been accounted for in the economics of this study. The CLX ultimate pit and phases have been designed appropriately to accommodate the larger fleet size. Mine fleet productivity assumptions used in developing the LOM schedule are provided below in Section 16.3.
Table 16-3: Current Mining Contractor Equipment Type and Size
Type | Item |
Operations | |
Waste Excavator | 4.6 m3 bucket |
Ore Excavator | 2.4 m3 bucket |
Haul Truck | 32-40-tonne capacity |
Drilling | 4 PW LOBO XXI-Drilling with 4.5"
1 PUMA JUNIOR-Drilling with 3.5" for pre-splits and blast.
1 PW 5100C-Drilling with 3.5" for pre‐split and adjustment drilling |
Support | |
Front‐End Loader | VOLVO L90F (or equivalent) |
Grader | CAT 140K, NEW HOLLAND RG170B (or equivalent) |
Bulldozer | D6 (or equivalent) and D8 |
Water Truck | 20 m3 capacity |
16.1.4 Geotechnical Evaluation
Saff Engenharia (SAFF) performed a geotechnical data analysis for the CLX open pit to be used as a basis for the pit design. An additional analysis was performed at a conceptual level to understand the influence of the final open pit on TSF 4 and the process plant, and to validate the open pit slopes considered in the open pit design.
The geotechnical team evaluated the following information:
- Stability analysis (using stress x strain analysis and limit equilibrium).
Drilling and Geological Information
The 1,316 holes drilled (123,303 m) at Fazenda contain geotechnical information; this represents 5.3% of the total metres drilled at the mine. The CLX pit provides a low density of geotechnical information in the inner region of the proposed pit. The distribution of these drill holes is not yet ideal, with some regions having few to no geotechnical drill holes, which leads to geotechnical uncertainties at this stage of design.
FBDM's geological model has detailed geological information from drilling and underground geological mapping, with 46,727 drill holes well distributed in the proposed CLX pit area. Geological drilling is abundant and well-spaced in the whole area of, and for all stages of, the CLX pit and the Fazenda mine.
Structural Information
The structural geology presented in the geologic model and within the region of the CLX pit consists of a four-fault system (F5, F6, F7, and F8) whose geometry is not well defined; hence, the structural model is considered to be at a pre-feasibility level of design. Structural information is extremely abundant in the subsurface level due to the foliation (Sn), discontinuities (Jn, J1, J2, J3, J4, J5, and J6) and fault mapping. The abundance of information and understanding regarding the behaviour of the discontinuities through the project area are considered to be at a feasibility level of design.
Lab Tests and Geotechnical Parameters
The geotechnical database from laboratory testing programs in 2017, 2019, and 2022 was applied in underground mining and has shown to be functional in practice. The database does not include geotechnical parameters related to the resistance of discontinuities; the presence of directional anisotropies in the rock; or direct shear tests that are required for the major joints that will affect the pit. Uniaxial compression tests in relation to the rock structures are required to study resistance anisotropies of the intact rock. Hence, the intact strength assessment of the rock is currently at a pre-feasibility level, while the joint resistance is at conceptual stage of design, with respect to the open pit.
Geomechanical Information and Geotechnical Characterization
The FBDM geomechanical model was developed alongside its geological model and includes all stages of the CLX pit mining sequence. It uses rock mass parameters, rock mass rating (RMR), or Q, for the CLX pit stability analysis. There are inconsistencies between the geotechnical information provided by mapping, drill-hole description, and laboratory tests which influence the quality of the geomechanical model. The geotechnical characterization is currently at a pre-feasibility level of design.
Geotechnical Aspects
The numerical model of the CLX pit was analyzed using Rocscience RS2 software (Version 11.022) to estimate the preliminary geotechnical stability of the pit based on four critical sections (Figure 16-10).
The data used for estimating the geotechnical parameters were taken from the lab tests (updated to 2024) and the outputs were calculated by the Rocscience RSData software (Version 1.007) on Hoek-Brown failure criteria. In sections where voids were encountered from older underground mining, a rockfill backfill was considered to be present, with assumed friction angle of 35° and no cohesion.
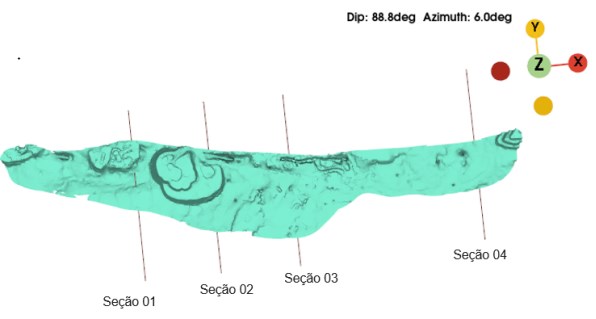
Figure 16-10: CLX Pit and Critical Geotechnical Sections
Slope stabilities were calculated by using the shear strength reduction (SSR) method; the critical stress-reduction factors (SRF) results are summarized in Table 16-4.
Table 16-4: Summary of the Critical Stress Reduction Factors
Section | Slope | Analytical Results SRF | Minimum Required SRF | Condition |
1 | North | 4.16 | 1.2 | OK |
South | 3.10 | 1.2 | OK |
2 | North | 2.70 | 1.2 | OK |
South | 1.44 | 1.2 | OK |
3 | North | 1.40 | 1.2 | OK |
South | 3.70 | 1.2 | OK |
4 | North | 2.29 | 1.2 | OK |
South | 2.10 | 1.2 | OK |
Based on the global geotechnical stability results of the pit slopes from the four sections in the CLX pit and the laboratory tests done to 2024, the factor of safety was achieved for the northern and southern pit slopes. This supports the CLX pit mine plan with its proposed geometry, including the historic underground excavations.
The influence of the planned CLX pit on adjacent structures was also evaluated using RS2, and additionally by the limit-equilibrium slice method in Rocscience Slide 2 software (Version 9.029). To evaluate the stability of the nearby primary crusher and TSF 4, two sections were selected to investigate the effect of the pit's footwall on these structures (Figure 16-11 to Figure 16-13).
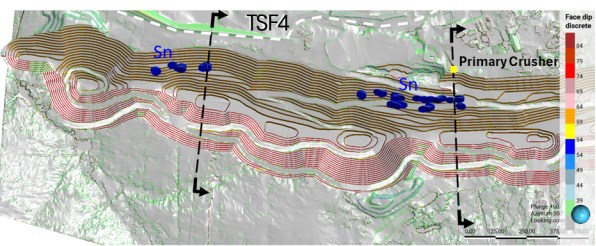
Figure 16-11: CLX Pit and Local Infrastructure
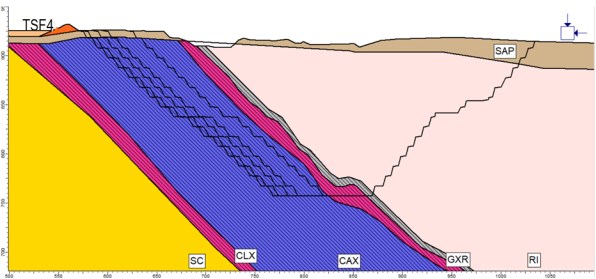
Figure 16-12: TSF 4 and CLX Pit Section

Figure 16-13: Primary Crusher and CLX Pit Section
Analyses were conducted using the SSR method to find the SRF for each scenario.
The analyses for the TSF 4 section highlighted the concentration of stresses at the bottom of the pit, with high safety factors even in scenarios where the pit is closer to TSF 4, as shown on Figure 16-14. There was no calculated impact of the pit on TSF 4 for the simulated scenarios under the given conditions. These scenarios assumed anisotropy with equal strength parameters for the rock, which is a simplified method. For the analyses using the SSR method, shear strains were observed to concentrate as the pit slope approached TSF 4, especially at distances of 20 m or less.
The current and planned pit scenarios were also evaluated for the primary crusher area. The results showed an accumulation of stress at the bottom of the pit, and there were no calculated accumulation of stresses, displacements, or significant shear stresses occurring near the primary crusher.

Figure 16-14: CLX Pit and TSF 4 Numerical Analysis with SSR Method
An analysis was conducted using the SSR method to assess the SRF for the planned pit scenario. A critical SRF of 5.6 was found for this scenario (Figure 16-15), with shear strains concentrating at the toe of the overall pit slope. The results show similar outcomes for the analyses of TSF 4 and the primary crusher area, with stress concentrations at the bottom of the pit, and a high critical-SRF value.
To evaluate the influence of discontinuities in each scenario, the model was reparametrized using the Mohr-Coulomb failure criterion, considering literature parameters for anisotropy/foliation (c = 1 kPa and φ = 27°). The SSR method was used, and stress-strain analyses were conducted for each scenario to evaluate the most probable failure surfaces. The SSR analyses showed the most likely failure surfaces for each scenario, indicating that for distances less than 30 m from the pit crest to TSF 4, a potential failure surface due to foliation could affect the structure.

Figure 16-15: CLX Pit and Primary Crusher Numerical Analysis with SSR Method
Similar analyses were performed for the primary crusher area to assess the influence of the discontinuities for the present and future pits by evaluating the variation of the maximum shear strains, total displacements, and total effective stresses. To evaluate the SRF and the most likely failure surface geometry, the SSR method was used, and stability analyses using limit equilibrium were performed. The results showed no significant variation in stress levels near the primary crusher area, and the stresses, deformations, and displacements were concentrated at the bottom of the pit.
Final Considerations
Stress accumulation is anticipated to occur at the toe of the pit slope and cause decompression of the rock mass, especially at the upper edges. Significant stress accumulations are not expected for the pits with overall slopes up to 300 m deep and global slope angles lower than 45°. Shear deformations and stresses are expected to increase as the pit edge approaches TSF 4 and the primary crusher.
The recommended criterion for the pit slopes near TSF 4 and the primary crusher should be a minimum factor of safety of 1.5. However, these slopes are most influenced not by the loading from these structures but by the slope geometry in relation to the foliation near TSF 4 and the slope geometry in the saprolite near the primary crusher.
16.1.5 Labour Force
Mining operations for the open pit mines will be 24 hours a day, seven days a week-three 8-hour shifts per day, from Monday to Sunday. The mine plan currently requires 267 contract employees. Table 16-5 shows the mining contractor personnel labour requirements summary for open pit mining operations. Employee numbers will vary relative to operating requirements over the LOM.
Table 16-5: Current Mining Contractor Labour Force-Open Pit
Position | Quantity |
Storekeeper | 1 |
Administrative Assistant | 2 |
Administrative Aide | 4 |
Maintenance Assistant | 1 |
Drilling Assistant | 17 |
General Services Assistant | 19 |
Survey Assistant | 3 |
Tire Technician | 1 |
Maintenance Controller | 1 |
Administrative Coordinator | 1 |
Maintenance Coordinator | 1 |
Production Coordinator | 1 |
Electrician II | 3 |
Workplace Safety Technician Intern | 1 |
Maintenance Leader | 2 |
Lubrication Technician | 3 |
Master Drive | 1 |
Mechanic I | 4 |
Mechanic II | 4 |
Mechanic III | 2 |
Combo Truck Driver | 4 |
Equipment Operator I | 92 |
Equipment Operator II | 17 |
Equipment Operator III | 41 |
Hydraulic and Pneumatic Drilling Operator | 18 |
Bricklayer | 3 |
Welder | 3 |
Maintenance Supervisor | 2 |
Operations Supervisor | 1 |
Production Supervisor | 2 |
Shift Supervisor | 5 |
Safety Technician II | 4 |
Surveyor | 3 |
Total Open Pit Employees | 267 |
16.2 Underground Mining
The underground mining method at Fazenda is LHOS. This method has been in use since underground operations commenced in 1988.
Over the 36 years of operations, multiple portals and access declines have been developed to access mineralization. Main access declines are 5.0 m wide by 5.5 m high and are situated in both the hanging wall and footwall of the mineralization. The distance between footwall declines and stopes is maintained at 20 m, with an increase to 30 m for hanging wall declines. Declines are on a gradient of 15% (7H:1V). Level spacing is nominally set at 20 m. Levels are accessed from the main haulage declines via crosscuts with dimensions of 4.5 m wide by 4.9 m high. As open pit operations continue, some portals will no longer be operational, due to pit expansions resulting in the loss of portal access.
The underground mining operations are made up of multiple zones, known as Canto 1, UG Main, F, and G. At Fazenda, active stoping areas within UG Main are called bodies, and are designated as C, D, E, W, and EDEEP (Figure 16-16, Figure 16-17). With the development of additional open pits along strike, a new underground operation known as Canto 2 is scheduled to commence once pit operations are completed (Figure 16-18). The average operational dilution is 15%, except for the EDEEP and EW, which have an average dilution of 20%. Planned mining recovery is 90%.
Mining activities are conducted top-down, and fill is not used at the mine for ground stability purposes. Nevertheless, waste rock is occasionally placed into voids to reduce haulage costs. From each level, access development is completed into the stoping areas. Blasthole fan drilling is used to further define the boundaries of the mineralization and for design of ultimate blast patterns. After blasting, remote-controlled, load-haul-dump (LHD) machines are used to load and haul the ore from the stoping areas into stockpile areas, or into 30 tonne-capacity trucks for haulage to surface.
Most waste rock is hauled to the surface, with small amounts placed into voids where possible.
To determine viable stopes, a "stope payable metre" calculation was made for all resource blocks. This provides an estimate of metres of development that could be completed to access the block for it to still be economic. The equation was applied in Deswik CAD and is as follows:
Stope Payable Metres = ((((Metal Selling Price) − (Metal Transportation and Refining
Charge) − (CEFEM) * (Metal Selling Price)) * (Plant Recovery) * [Oz ROM]) − (((Mining
Cost) + (Processing Cost) + (G&A Cost)) * [Tonnes ROM]))/(Development Cost)
The above terms are defined in Table 15-17.
Figure 16-16, Figure 16-17, and Figure 16-18 show all the underground mining areas of Fazenda.
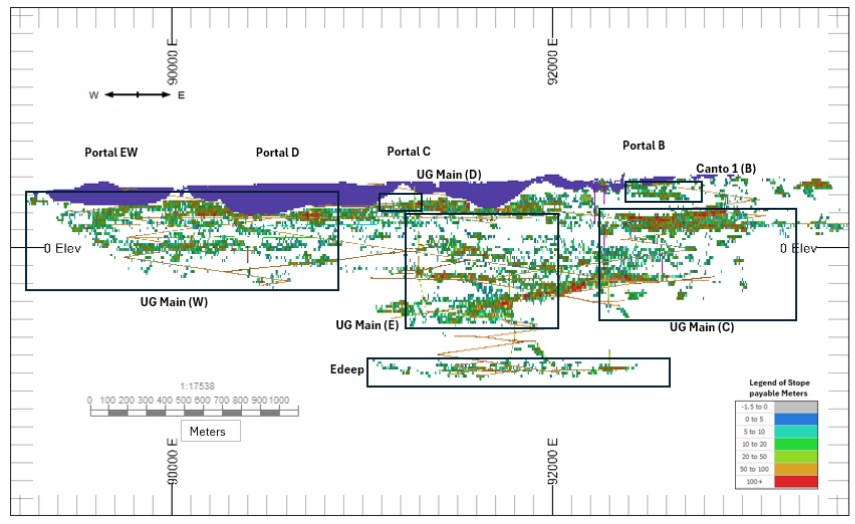
Figure 16-16: Fazenda Deswik SO Blocks at UG Main, EDEEP and Canto 1 Mining Areas Prior to Depletion and Manual Analysis

Figure 16-17: Fazenda Deswik SO Blocks at F and G Mining Areas Prior to Depletion and Manual Analysis
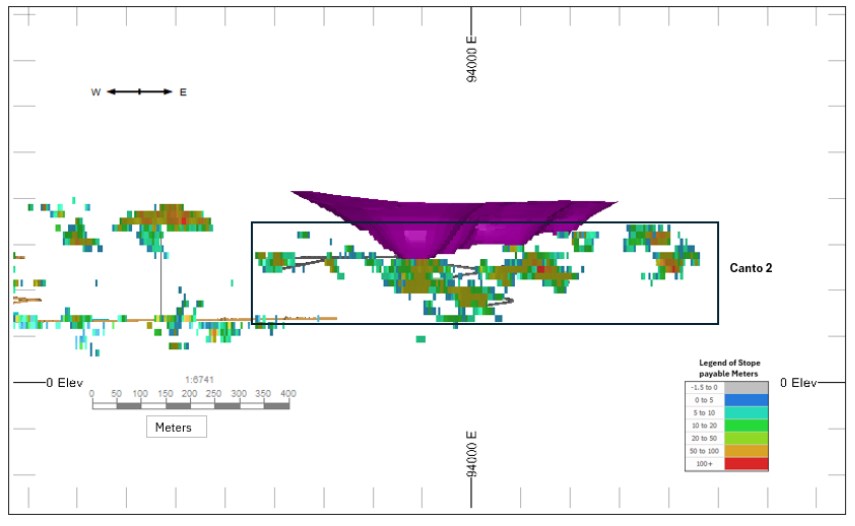
Figure 16-18: Fazenda Deswik SO Blocks at Canto 2 Prior to Depletion and Manual Analysis
16.2.1 Geotechnical Considerations
Geotechnical Parameters
The rock mass properties at Fazenda show varying degrees of quality, with bulk densities measured between 2.64 and 3.01 g/cm³. These measurements indicate strong rock mass quality in most areas, with certain localized weaker zones, such as those comprising carbonate schists in Orebody B, that require specific support strategies to ensure stability.
Understanding in situ stress conditions is critical for the design of underground excavations. Although field measurements using the overcoring method have been performed, their reliability is limited due to the influence of induced stresses from adjacent excavations. To address this, empirical data have been employed, providing K-ratios (horizontal to vertical stress ratios) between 1.2 and 1.3 at depths ranging from 600 to 1,100 m. For shallow areas, adjustments in stress distribution have been incorporated to account for potential variations.
Hydrological considerations also play a significant role in underground operations. Current dewatering infrastructure has proven adequate for managing groundwater inflows under existing conditions.
Geotechnical Database
The Fazenda operations maintain a robust geotechnical database, supported by extensive logging of drill holes and systematic classification of rock mass quality. Using the rock mass rating system, FBDM has categorized zones into quality classes ranging from Very Poor to Very Good. The detailed geotechnical information forms the foundation for strategic planning, allowing for tailored support designs and adjustments to mining methods in response to localized ground conditions. The comprehensive nature of the database facilitates effective geotechnical control and a commitment to ensuring safety and efficiency in underground operations.
Support Systems
The support systems at Fazenda have been developed to align with the specific geotechnical conditions of each area. The mine employs a combination of Swellex bolts, resin-coated rebar, and surface mesh to stabilize underground openings, depending on the observed rock mass quality.
In standard development areas with dimensions of 4.5 by 4.9 m, the primary support system comprises 2.4 m-long resin bolts. These bolts are installed in a 1.5 by 1.5 m square pattern, with five bolts per line providing adequate reinforcement. In larger excavations or intersections, additional measures are employed; for instance, T-intersections up to 9 m in radius also use resin-coated bolts, with lengths adjusted to 3.0 m, as required by the specific excavation conditions.
In zones requiring greater support strength, such as cross intersections or areas with significant widening (up to 12 m), the mine incorporates cable bolts, steel plates, and shotcrete for enhanced stabilization. For these cases, bolts up to 6 m long are installed in combination with surface mesh, which varies between 1.5 and 5.0 m square patterns, depending on geomechanical evaluations.
Special considerations are applied to areas exhibiting poorer rock mass quality, such as Orebody B. Here, use of surface mesh is standard practice to retain loose blocks, particularly in zones with high joint-persistence. These additional measures are vital for maintaining operational safety in areas with significant traffic or equipment movement.
A summary of the support patterns is provided in Table 16-6.
Table 16-6: Summary of Underground Support
Excavation Type | Support Type | Length
(m) | Bit Diameter
(mm) | Pattern
(m X m) | Bolts per
Line |
Regular Development (4.50 x 4.90 m) | Resin-coated bolt | 2.4 | 35 | 1.5 x 1.5 | 5 |
T-Intersections (up to 9 m radius) | Resin-coated bolt | 3.0 | 35 | 1.5 x 1.5 | As required |
Cross Intersections | Geotechnical analysis determines requirements |
Widening or Rehabilitation (6 to 8 m) | Resin-coated bolt | 2.4 to 3.0 | 35 | 1.5 x 1.5 | 5 to 6 |
Widening (10 to 12 m) | Cable, plates, and shotcrete | 4.0 to 6.0 | 64 | 2.0 x 5.0
(adjustable) | As required |
Stability of Structures
At Fazenda, the design and placement of stopes and pillars are based on empirical data and numerical modelling aimed at optimizing structural performance.
Stopes are typically spaced at 20 m vertical intervals and are developed without backfilling, except in areas with heightened geotechnical risk. Pillar dimensions are standardized based on the mine's geotechnical framework. Rib pillars feature a strike length of 10 m, with a minimum width of 5 m in major infrastructure areas.
Currently, there is no established and clear specific minimum thickness for the crown pillar separating the pits and underground excavations. The design standard applied is 20 m, applicable in both the medium and long terms. However, each case undergoes a thorough evaluation through numerical modelling to ensure the adequacy of this thickness. This approach is applied across all underground excavations, including stopes, galleries, infrastructure, the main decline, and escapeways, without differentiation based on the presence or absence of mining activities in the pits or the varying thickness of the stopes. Additionally, the potential impact of blasting activities in the pits on the stability of underground excavations must be considered and assessed.
Monitoring
While mining-induced seismicity is not a significant issue at Fazenda, proactive monitoring systems are in place to detect stress changes around pillars and stopes. Time-domain reflectometry is employed in critical zones to track rock movement and identify potential instability. This technology is particularly effective for monitoring the integrity of pillars in areas with high stress-concentrations.
Hydrogeology
Water management is a critical component of underground operations at Fazenda. The mine dewatering infrastructure is well-designed to handle the minor water inflows observed during operations. Pumping stations are distributed along the main declines, extending to the bottom levels, and are connected to surface systems. This configuration ensures efficient water removal and prevents flooding in active areas.
The hydrological conditions at Fazenda are considered manageable, with most water inflows attributed to mining activities rather than natural groundwater movement. Continuous monitoring of water levels and pumping performance is conducted to ensure that the dewatering system remains effective as the mine deepens.
Geotechnical Design Parameters
The geotechnical design parameters (Table 16-7) are critical for ensuring the stability and safety of the underground mining operations. Significant parameters include, in the absence of sill pillars, a minimum rib pillar strike length of 10 m; a minimum pillar length between parallel stopes of 10 m is also applied when necessary. The minimum stope and pillar width is less than 2 m in narrow-vein stopes.
Table 16-7: Geotechnical Design Parameters
Geotechnical & Design Parameters | Requirement |
Sill Pillar Vertical Thickness (m) | No |
Rib Pillar Strike Length (m) | 10 m, when applied |
Pillar Length Between Parallel Stopes (m) | 10 m, when applied |
Minimum Width (m) | <2 m |
Stopes Span (m)-DIP >= 37° | Not applied |
For pillars between ore drifts, and between crosscuts and the main decline, the standard dimension is 5 m. The distance between main declines and stopes is maintained at 20 m for both hanging wall and footwall declines. Mining operations are conducted top-down with no specific panel pattern, allowing for flexibility in operational planning.
16.2.2 Mining Method and Mine Design Considerations
The Deswik SO software package was used for mine planning and scheduling. The following basic mining criteria were used as SO inputs:
Minimum distance between lenses: 5 m
Development with a 15% maximum inclination
Main decline in the footwall at a minimum distance of 20 m from deposit
Cut-off grade: 1.36 g/t
Most stopes designed with minimum dimension of 5m x 2m x 15m (X by Y by Z)
Minimum stope width: 2 m
Overall average planned stope dilution: 15% to 20%
Mining recovery for LHOS: 90%.
Upon completion of the Deswik SO evaluation, mining blocks were evaluated for accessibility and block relationship to infrastructure and economics. As some blocks are no longer accessible or their mining would have a detrimental impact on infrastructure, they were removed from Mineral Reserve calculations. Blocks that required development were evaluated financially using a payable metres calculation. This relates to the cost of development to access the blocks. The payable metres calculation is based on an equation provided by FBDM personnel, as follows:
Payable Metres = ((((Gold Price)-(Metal Transportation and Refining Charge)-(CEFEM)*
(Gold Price))*(Plant Recovery)*[Oz ROM])-(((Mining Cost)+(Processing Cost)+(G&A Cost))*
[Tonnes ROM]))/(Development Cost)
The evaluation of blocks was undertaken in liaison with FBDM personnel due to their knowledge of the underground operations. This depletion analysis was applied to all mining areas. Figure 16-19 to Figure 16-21 show the remaining blocks (green) used for Mineral Reserve estimates.

Note: Not all development is shown in figure.
Figure 16-19: Reserve Blocks for UG Main, Canto 1 and EDEEP Following Depletion Analysis

Note: Not all development is shown in figure.
Figure 16-20: Reserve Blocks for F and G Following Depletion Analysis
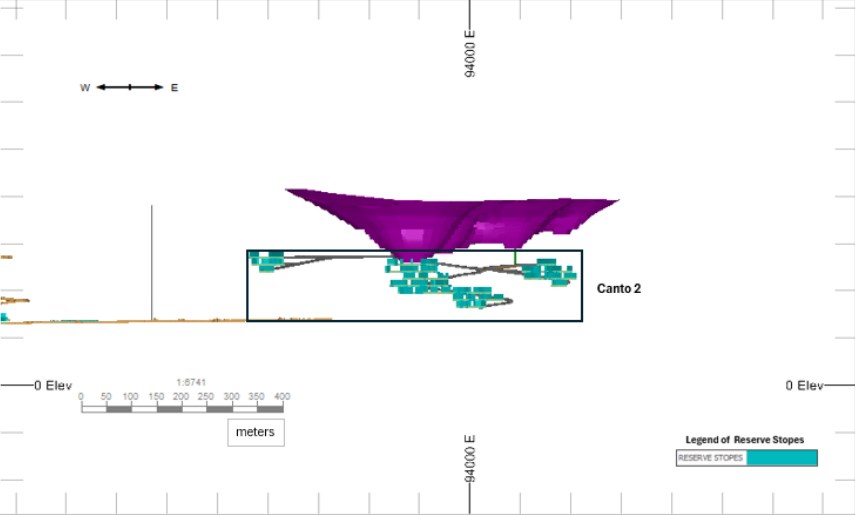
Note: Not all development is shown in figure.
Figure 16-21: Reserve Blocks for Canto 2 Following Depletion Analysis
16.2.3 Mine Design
Internal declines are generally placed in the footwall, although where accessibility to stoping blocks is difficult, internal development is in the hanging wall. Levels are spaced every 20 m vertically, with access crosscuts roughly midway along the strike length of the mineralization. Ore drives are developed following the mineralization along strike to its full extent. Slot raises are developed at each end of the mineralization to establish a void space for blasting. Fan drilling is completed, and blasting is undertaken by retreating towards the central access. Rib pillars are designed at a spacing of 35 m to ensure ground stability; however, if ground conditions are competent, based on geotechnical considerations, the distance between rib pillars is extended. Rib pillars are designed to be 10 m long.
Mining progresses top down from level to level. This eliminates the requirement for using fill. It must be noted that a minimal number of stoping blocks extend over multiple levels, as the majority of remaining ore reserves is remnant mining. The exception is Canto 2, which will be a new mine. All production drilling is up hole. Production holes are charged up the hole from the level. Once blasted, the ore is mucked from the same level and extracted to a remuck bay for storage, prior to truck loading for haulage to surface.
Figure 16-22 is a long section of Fazenda's FG area, providing a snapshot of the mining method used at the operation. Internal declines are established for truck haulage. Crosscuts to mineralization are shown as the "black domes" on the figure. The crosscuts are developed to intersect the ore body.
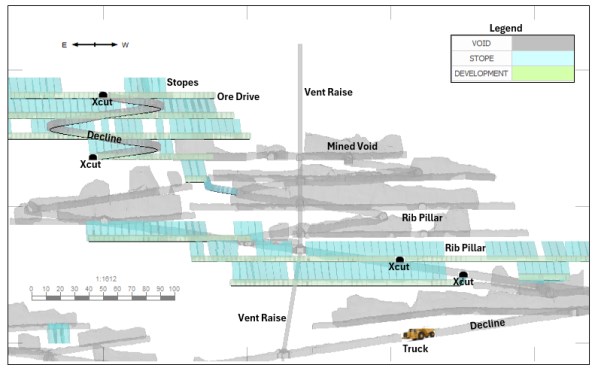
Figure 16-22: Fazenda FG Underground Development and Stope Mining
16.2.4 Underground Access
Several portals are in use that access the underground operations. UG Main and Canto 1 are currently serviced by Portals E, D, and B. The mining area known as FG is accessed via a single portal (G) from surface, with the decline bifurcating at depth to access the separate areas, F and G. A new portal will be established at Canto 2 following completion of the open pit.
All decline ramps are at a 15% gradient, and 5.0 m wide by 5.5 m high. Mining services are generally hung in the declines and are also channelled via strategically placed boreholes.
16.2.5 Material Handling
Currently all ore and waste are hauled via 38-tonne trucks to surface. A material handling trade-off study was completed in 2018 and determined that it was the most cost-effective solution for handling ore and waste.
16.2.6 Personnel
The underground mine currently operates 24 hours per day, seven days per week on four 6-hour shifts per day. The mine operates with five crews to allow one day off per week. An example of a monthly roster is shown in Figure 16-23. As of the end of June 2024, underground mining operations had a personnel count of 412.

Note: Folga = day off.
Figure 16-23: Underground Operators Shift Roster
16.2.7 Underground Mining Fleet
The main access for the mining fleet is via four active surface portals feeding to eight main declines developed along the strike of the mineralization-B, C, D, E, F, G, EW, and EDEEP. The B, D, E, and G declines have surface portals, and the F decline was developed from an underground split from the G decline. The EW and EDEEP declines were developed from an underground split from the E decline. The C portal has been decommissioned due to open pit mining activities.
A 470 m-deep main central shaft exists; however, it is no longer used for hoisting, as the portion of the deposit within economic distance of the shaft has been mined out. The shaft is now used only as a part of the escapeway and ventilation circuit.
16.2.8 Underground Mine Equipment
Decline and level development is carried out using two-boom electric hydraulic jumbos, and stope drilling is performed with a fandrill. Stope loading is carried out with remote-control LHD units with a nominal capacity of 7.5 m3. Ramp haulage involves 38-tonne trucks used for both ore and waste. The mine employs an equipment-monitoring and control system on surface that tracks and dispatches the mobile equipment to the various workplaces as required. The mine dispatch operates with daily plans, as well as recognizing ongoing progress and availability of equipment to optimize their allocation. Table 16-8 lists the primary mobile-mining underground production equipment.
Table 16-8: Primary Production Equipment
Type | Manufacturer | Model | Units |
Fandrill | Sandvik | DL321 | 1 |
Fandrill | Sandvik | DL421 | 2 |
Jumbo | Sandvik | DL321 | 1 |
Jumbo | Sandvik | DD321 | 3 |
LHD | Caterpillar | R1700G | 5 |
Plataforma | Atlas Copco | PT100 | 1 |
Plataforma | Getman | A64 | 3 |
Plataforma | Normet | Charmec 500 | 1 |
Plataforma | Normet | Charmec 400 | 1 |
Robolt | Sandvik | DS311 | 1 |
Scaler | Doosan | DX53W | 1 |
Scaler | Doosan | DX55W | 2 |
Scaler | Getman | S3120 | 2 |
Scaler | Caterpillar | 416F | 2 |
Truck | Volvo | FMX 460 | 9 |
Truck | Volvo | FMX500 | 2 |
16.2.9 Ventilation
The mine is primarily ventilated by a series of raises that exhaust air to surface, and the declines and shaft that provide fresh-air intake, as shown in Figure 16-24. The raises are connected to the main declines in the active mining areas, and secondary ventilation fans and tubing are used to carry fresh air into individual stoping areas. The main ventilation of the mine operates through the exhausting type of ventilation method, having 12 ventilation raises (shafts) of which five are active (RV2, RV5, RV6, RV9, and RV10), each with a main fan on surface. Currently, it is only necessary to serve bodies C and E. The air quality meets Brazilian regulations NR22 for an underground operation using diesel-powered mining equipment. The total air quantity will peak at 450 m³/s in 2025.
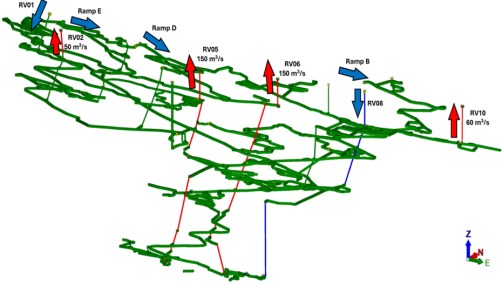
Figure 16-24: Underground Ventilation Circuit
With CLX pits taking out Portals C and D and breaking into the declines, stopes, and access drifts, changes will need to be made to the ventilation circuit to mitigate the impact. The QP recommends re-evaluating the circuit and the Ventsim model to determine which entries will be lost, where stoppings need to be installed, and any other measures that may be required to maintain an appropriate and regulatory-compliant ventilation circuit underground and avoid uncontrolled air gains or losses.
16.2.10 Ground Support
The underground openings have generally good ground conditions that do not require any special support to ensure stability. Development headings are typically scaled and bolted, using a combination of hand scaling and a single-boom scaler with rock bolting installed by single-boom bolters. Cable bolts are also used to secure the hanging wall in the rib pillar area at the entrance from the sublevels to the stoping areas. In the WRI block, shotcrete is used where it crosses the Riacho do Incó fault. Refer to Table 16-6 and accompanying text for support pattern details.
16.2.11 Mine Dewatering
The mine is considered to be relatively dry. The total installed dewatering system has a capacity to handle 160 m3/h. The mine's drainage system basically consists of a combination of channels and collection boxes, from which the water from the work fronts or infiltrations drains to the receiving boxes installed in places defined as pump stations. Figure 16-25 shows the flowchart of the mine's main pumping system in areas E and EW, noting that areas B, C, and D do not have a pumping system installed, and the water from those areas is collected and directed to E and EW zones.
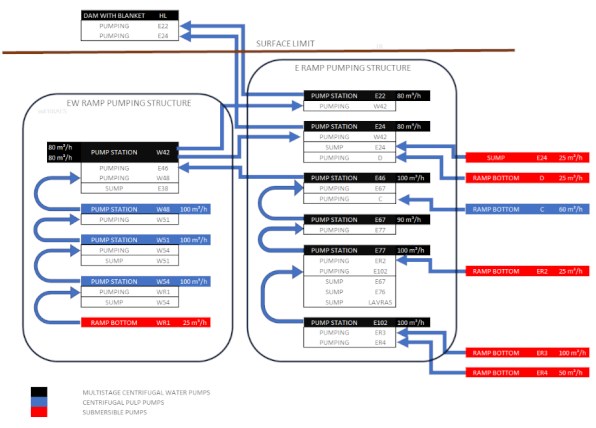
Figure 16-25: Underground Dewatering Flowchart
Again, with respect to CLX pits taking out Portals C and D and breaking into the declines, stopes, and access drifts, changes will need to be made to the mine emergency warning system to mitigate the impact of any inrush of water during a major rainfall. The QP recommends re-evaluating the current emergency procedures and introducing an advance-warning system to alert of any impending meteorological event in the mine vicinity. A study is also recommended to determine requirements for installing water-control barriers with drainage holes to prevent a sudden inundation of the workings during a major rain event. A key aspect of the study would be determining which entries will be lost and where stoppings need to be installed to offset risk of injury to workers and flooding of the underground openings.
16.2.12 Explosives Magazine
For a more comprehensive description of pertinent explosives regulations see Section 18.
There are two existing magazines in the underground mine, one in Level G9 and another in G5.
With changes to the mine plan emanating from interaction with the open pit, one magazine will be relocated to area C. Figure 16-26 shows one of the underground explosives magazines in area G.
Figure 16-26: Underground Explosives Magazine
16.2.13 Development Sections Drill and Blast
Two-boom jumbos are used for drilling the development rounds and bulk emulsion is used for loading the holes. Figure 16-27 shows the typical development drilling pattern. Bulk emulsion is also used for production blasting.

Figure 16-27: Typical Development Headings Drill and Blast Pattern
16.2.14 Other Services
The Fazenda mine's underground operations are powered from the local Bahia utility grid, with an estimated power requirement of approximately 8 MW at 1.3 Mt/a production capacity. The grid supplies power at 69 kV, which is stepped down to 13.8 kV and subsequently to 380 V/480 V for distribution within the mine. Diesel generators provide backup power for emergency situations.
Communications in the mine are by means of radios and leaky feeder.
With loss of Portals C and D, some services such as power and water will have to be redistributed to other portals and raises. The effect on location of underground substations is not significant.
There are no workshops or warehousing facilities in the underground mine. All equipment needing significant repair is brought to the surface workshop; however, there are small satellite bays and repair shops available underground where minor repairs can be performed.
Second egress is via exhaust raises and connecting drives between the raises.
Although not currently in use, the Avoca mining method will be used in stopes with weak or poor-quality rock. By using this method, only a relatively short stope length is extracted, and the void is immediately filled with waste rock to minimize any stope collapse. Although backfilling is not typically required for geotechnical purposes, in longhole-mined stopes due to the competent rock mass, waste rock could be dumped into any open stopes to reduce waste haulage to surface.
16.3 Production Schedule
Annual production for 2021 through 2023 is presented in Table 16-9.
Table 16-9: Fazenda Mine Production-2021 to 2023
| Unit | 2021 | 2022 | 2023 | Total |
Mining | | | | | |
Open Pit | | | | | |
Ore Mined | kt | 208 | 566 | 554 | 1,328 |
Grade | g/t Au | 1.39 | 1.60 | 1.37 | 1.47 |
Contained Ounces | koz Au | 9 | 29 | 24 | 63 |
Waste Mined | kt | 1,946 | 3,401 | 5,168 | 10,514 |
Strip Ratio | | 9.4 | 6.0 | 9.3 | 7.9 |
Underground | | | | | |
Ore Mined | kt | 1,177 | 979 | 854 | 3,010 |
Grade | g/t Au | 1.53 | 1.44 | 1.78 | 1.57 |
Contained Ounces | koz Au | 58 | 45 | 49 | 152 |
Waste Mined | kt | 472 | 473 | 300 | 1,244 |
Total Development | km | 7.2 | 6.8 | 4.8 | 18.8 |
Total Mining | | | | | |
Ore Mined | kt | 1,385 | 1,545 | 1,407 | 4,337 |
Grade | g/t Au | 1.51 | 1.50 | 1.62 | 1.54 |
Contained Ounces | koz Au | 67 | 74 | 73 | 215 |
Waste Mined | kt | 2,417 | 3,874 | 5,468 | 11,759 |
| Unit | 2021 | 2022 | 2023 | Total |
Total Material Mined | kt | 3,802 | 5,418 | 6,875 | 16,096 |
Processing | | | | | |
Ore Milled | kt | 1,367 | 1,426 | 1,429 | 4,221 |
Grade | g/t Au | 1.52 | 1.58 | 1.61 | 1.57 |
Contained Ounces | koz Au | 67 | 72 | 74 | 213 |
Recovery | % | 90.5 | 91.7 | 90.2 | 90.8 |
Recovered Ounces | koz Au | 60 | 66 | 67 | 193 |
Note: Numbers may not sum precisely due to rounding.
AMC developed the current LOM plan using Minemax Scheduler 7 software (Minemax). Minemax is a schedule optimizer that seeks to maximize the discounted operating cash flows while honouring constraints related to processing and mining inputs. The open pit LOM schedule was developed on an annual basis using a discount rate of 5% per annum.
The main inputs to the strategic schedule include the regularized mining model discussed in Section 15, the pit designs discussed in Section 16.1; stockpile and waste dump designs; primary fleet sizes and productivities; and haulage cycle times.
The following scheduling constraints were applied when developing the Open Pit LOM schedule:
Achieve planned plant feed tonnage of 3,945 t/d (1.44 Mt/a).
Maximum carbonaceous ore feed to mill of 20%. Gold feed-grade maximum of <2.0 g/t Au.
Maximum stockpile capacity of 200 kt. Maintain minimum of 100 kt stockpile to mitigate risk of mining voids in open pits.
Stockpiling utilizing three grade bins: high grade (>2.0 g/t Au), medium grade, (1.0 to 2.0 g/t Au), and low grade (COG to 1.0 g/t Au).
Levelize total material movement and haul truck requirements.
Limit vertical advance rate to eight benches per year, per phase. This is considered conservative to mitigate risk of mining voids in open pits.
Limit the number of open pit phases mined to a maximum of four per year.
Open pit G to be mined after completion of underground mining G and F.
Open pit PPQ to be mined towards the end of the schedule to allow time for land to be acquired.
Open pit phase CLX2 to be mined after Portal D decommissioned in February 2025.
Open pit phase CLX8 to be mined after Portal E decommissioned in January 2027.
Open pit phase CLX6 to be mined after Portal C decommissioned in April 2025.
- Open pit Canto 1 to be mined after Portal B decommissioned in January 2029.
The start date of the LOM schedule is July 1, 2024. The schedule uses 292 operating days per year in the schedule, based on contractor historical production and accounting for weather delays, schedule outages due to maintenance, etc. The mine fleet productivity assumptions used in the LOM schedule were based on contractor actuals from Fazenda and other local operations provided by Equinox Gold. These are summarized in Table 16-10.
Table 16-10: Open Pit Mine Fleet Productivity Assumptions
| Unit | Cat 390
(4.6 m3) | Cat 336
(2.4 m3) | Mercedes 4144
(32 t) | PC1250
(5 m3) | EX2500
(15 m3) | Cat 777
(90 t) |
Equipment Type | | Excavator | Excavator | Truck | Excavator | Excavator | Truck |
Use Criteria | | Waste mining | Ore mining | Ore and waste mining | Ore mining | Waste mining | Ore & waste mining |
Mechanical Availability | % | 80 | 80 | 80 | 85 | 85 | 85 |
Utilization | % | 74 | 74 | 74 | 85 | 85 | 85 |
Operating Efficiency | % | 59 | 59 | 59 | 72 | 72 | 72 |
Productivity | Mt/a | 2.5 | 1.1 | | 3.5 | 7.5 | |
Operating Hours Per Year | | 4,149 | 4,149 | 4,149 | 5,000 | 5,000 | 5,000 |
For underground operations the following scheduling constraints were applied:
Maximum horizontal development metres of 635 m per month
Maximum total ore tonnage of 70 kt per month
Maximum stope ore tonnage of 62 kt per month
- Maximum total material movement of 90 kt per month.
Underground mine scheduling priorities were applied to each mining area as either Priority 1 or 2. These priorities were used considering portal decommissioning dates. Priority 1 indicates that the activities are of higher importance and need to be considered first, while Priority 2 is of lesser importance in the schedule. The underground equipment productivity assumptions used were based on historical actuals from Fazenda, as summarized in Table 16-11.
Table 16-11: Underground Fleet Productivity Assumptions
| Cat R1700G | Volvo FMX 460 | Sandvik DD321 | Sandvik DL421 | Sandvik DS311 |
Equipment Type | Loader | Truck | Jumbo | Fan drill | Bolter |
Mechanical Availability | 63% | 70% | 69% | 66% | 60% |
Utilization | 59% | 71% | 53% | 57% | 60% |
Operating Efficiency | 37% | 50% | 35% | 38% | 36% |
Productivity Rates | 1,333 t/d | N/A | 150 m/month | 200 m/d | N/A |
The main outcomes of the LOM schedule are presented below:
Mining operations and processing LOM is 9.5 years.
Underground operations finish in Year 2028. Open pit operations finish in Year 2033.
Total annual ex-pit material movement peaks at approximately 16.5 Mt/a.
Gold metal recovered averages 75 koz/a over the LOM.
- Long-term stockpile capacity of 140 Kt. The majority of this stockpile is made up of the lowest-grade material, and is fed to the plant at the end of the mine life.
The LOM production schedule is presented in Table 16-12. The QPs note that the LOM production schedule reflects the fact that remaining mineralization classified as Fazenda Mineral Reserves for both open pit and underground has a higher average grade than has been mined at Fazenda in recent years. Table 16-13 summarizes which areas are projected to be mined each year during the LOM. A chart displaying total ore and waste mined from open pit and underground is shown in Figure 16-28. The plan is considered to be reasonable and achievable based on actual recent performance, as shown in Table 16-9, and LOM provisions for equipment and personnel.
Table 16-12: Life-of-Mine Production Schedule
| Unit | Total | Years |
2024 | 2025 | 2026 | 2027 | 2028 | 2029 | 2030 | 2031 | 2032 | 2033 |
Ore Mined | | | | | | | | | | | | |
Underground | kt | 2,396 | 396 | 772 | 653 | 445 | 131 | - | - | - | - | - |
g/t Au | 1.97 | 2.02 | 2.01 | 2.00 | 1.89 | 1.73 | - | - | - | - | - |
koz Au | 152 | 26 | 50 | 42 | 27 | 7 | - | - | - | - | - |
Open Pit | kt | 10,744 | 132 | 759 | 825 | 995 | 1,297 | 1,440 | 1,442 | 1,314 | 1,427 | 1,113 |
g/t Au | 1.77 | 1.94 | 1.26 | 1.94 | 2.00 | 1.95 | 1.78 | 1.88 | 1.78 | 1.73 | 1.43 |
koz Au | 611 | 8 | 31 | 52 | 64 | 81 | 82 | 87 | 75 | 79 | 51 |
Total Ore Mined | kt | 13,140 | 527 | 1,531 | 1,478 | 1,440 | 1,428 | 1,440 | 1,442 | 1,314 | 1,427 | 1,113 |
g/t Au | 1.81 | 2.00 | 1.64 | 1.97 | 1.97 | 1.93 | 1.78 | 1.88 | 1.78 | 1.73 | 1.43 |
koz Au | 763 | 34 | 81 | 93 | 91 | 88 | 82 | 87 | 75 | 79 | 51 |
Stockpile Balance | | | | | | | | | | | | |
Stockpile | kt | 20 | 20 | 111 | 148 | 148 | 136 | 136 | 138 | 13 | - | - |
g/t Au | 0.99 | 0.87 | 0.84 | 0.84 | 0.80 | 0.80 | 0.80 | 0.80 | 0.00 | - | - |
Processed | | | | | | | | | | | | |
Total Ore Processed | kt | 13,160 | 527 | 1,440 | 1,440 | 1,440 | 1,440 | 1,440 | 1,440 | 1,440 | 1,440 | 1,113 |
g/t Au | 1.80 | 2.00 | 1.69 | 2.00 | 1.97 | 1.92 | 1.78 | 1.88 | 1.69 | 1.72 | 1.43 |
Recovery | % | 90 | 90 | 89 | 90 | 89 | 90 | 90 | 89 | 90 | 89 | 86 |
Recovered Gold | koz Au | 683 | 31 | 70 | 83 | 82 | 80 | 74 | 78 | 70 | 71 | 44 |
Waste Mined | | | | | | | | | | | | |
Underground | kt | 455 | 84 | 170 | 63 | 130 | 8 | - | - | - | - | - |
Open Pit | kt | 93,880 | 3,784 | 8,751 | 13,113 | 15,005 | 14,222 | 13,560 | 13,058 | 7,018 | 4,024 | 1,346 |
Total Waste Mined | kt | 94,335 | 3,868 | 8,921 | 13,175 | 15,134 | 14,230 | 13,560 | 13,058 | 7,018 | 4,024 | 1,346 |
Open Pit Strip Ratio | | 8.7 | 28.8 | 11.5 | 15.9 | 15.1 | 11.0 | 9.4 | 9.1 | 5.3 | 2.8 | 1.2 |
Note: Totals may not sum precisely due to rounding.
Year 2024 is for six months only, from July 1.
Table 16-13: Life-of-Mine Ore Production by Area
| Unit | Total | Year |
2024 | 2025 | 2026 | 2027 | 2028 | 2029 | 2030 | 2031 | 2032 | 2033 |
Underground | | | | | | | | | | | | |
CLX | kt | 1,378 | 344 | 635 | 323 | 76 | - | - | - | - | - | - |
Canto 1 | kt | 111 | - | 11 | 101 | - | - | - | - | - | - | - |
Canto 2 | kt | 414 | - | - | 1 | 283 | 131 | - | - | - | - | - |
F | kt | 262 | 42 | 97 | 121 | 2 | - | - | - | - | - | - |
G | kt | 231 | 10 | 29 | 107 | 85 | - | - | - | - | - | - |
Underground Ore Mined | kt | 2,396 | 396 | 772 | 653 | 445 | 131 | - | - | - | - | - |
Open Pit | | | | | | | | | | | | |
CLX | kt | 7,406 | 132 | 329 | 825 | 707 | 1,297 | 1,294 | 1,176 | 1,006 | 642 | - |
Canto 1 | kt | 21 | - | - | - | - | - | - | - | - | - | 21 |
Canto 2 | kt | 2,504 | - | 430 | - | 288 | - | 146 | 266 | - | 281 | 1,092 |
PPQ | kt | 309 | - | - | - | - | - | - | - | 309 | - | - |
LG | kt | 317 | - | - | - | - | - | - | - | - | 317 | - |
G | kt | 187 | - | - | - | - | - | - | - | - | 187 | - |
Open Pit Ore Mined | kt | 10,744 | 132 | 759 | 825 | 995 | 1,297 | 1,440 | 1,442 | 1,314 | 1,427 | 1,113 |
Total Ore Mined | kt | 13,140 | 527 | 1,531 | 1,478 | 1,440 | 1,428 | 1,440 | 1,442 | 1,314 | 1,427 | 1,113 |
Note: Totals may not sum precisely due to rounding.
Year 2024 is for six months only, from July 1.
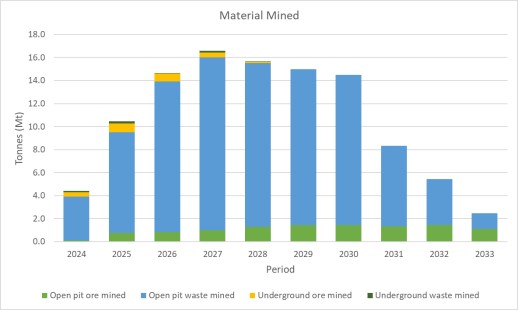
Figure 16-28: Total Material Mined by Year
17 Recovery Methods
17.1 Process Description
Production at Fazenda began in 1984 as a heap leach operation. A conventional cyanide leaching and CIP plant, Circuit 1, was added in 1988 to treat the underground ore at a rate of 34 t/h. In 1991, the plant was expanded by adding Circuit 2, a 95 t/h circuit, for a total capacity of 120 t/h, or approximately 960 kt/a (2.63 kt/d). Currently, the two leaching circuits operate with pre-aeration and CIL. With historic improvements, the plant is now capable of processing 192 t/h, and approximately 1.44 Mt/a (3,945 t/d). The heap leach operation was discontinued sometime between 2003 and 2007.
Milling capacity has increased due to several improvements: increasing ball charge in the two mills to achieve the final product size of 75 µm feeding the CIL circuit; closing the crusher closed-side setting to reduce the crushing product size feeding the ball mills; and improving hydrocyclone performance to achieve the desired particle size feeding the leach circuit. The process has been improved each year since 2020 to achieve better gold extraction and recovery efficiencies as the feed grade decreased and more carbonaceous matter and sulphides were being fed to the plant.
Figure 17-1 presents the process flowsheet for the processing plant, which consists of:
Three-stage crushing
Ball mill grinding consisting of two mills in parallel, closed, with hydrocyclones
Gravity concentration using centrifugal concentrators; treating the underflow of one hydrocyclone in each of the grinding hydrocyclone clusters
Thickening to produce a leach feed of 50% solids
Cyanide leaching in two parallel circuits, Circuits 1 and 2
CIL in two parallel circuits, Circuits 1 and 2
Zadra pressure stripping of the carbon
Intensive cyanidation of the centrifugal concentrator concentrates
Electrowinning of the carbon eluent and gravity concentrate leach solution
- Casting of gold bars in an induction furnace.
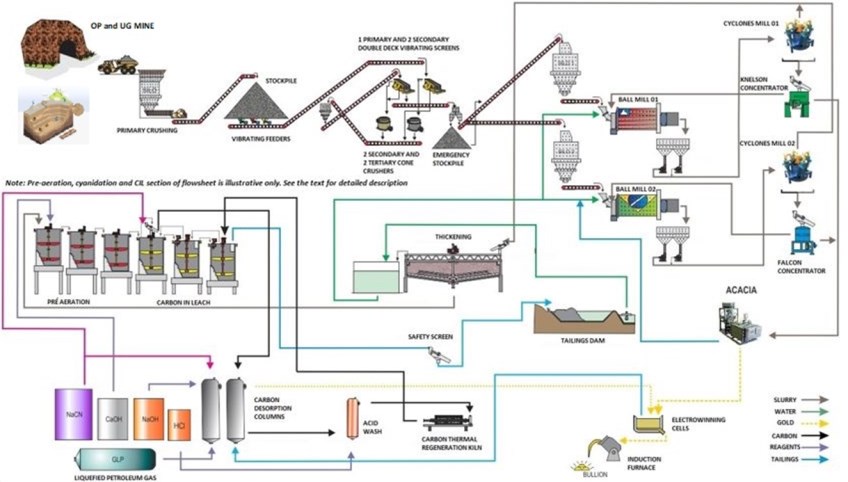
Figure 17-1: Process Flowsheet
17.1.1 Historical Production (1984 to 2024)
Over the decade preceding 2024, ore processing has been enhanced to improve both gold extraction and recovery efficiencies as the ore feed grade gradually decreases and more carbonaceous matter and sulphides are fed to the process plant. The historical production data are summarized in Table 17-1.
Table 17-1: Historical Production Data 1984-2024
Year | Tonnes Milled
(Mt) | Au Grade
(g/t) | Recovery
(%) | Produced Gold
(koz) |
1984 to 2014 | - | - | - | 2,950 |
2015 | 1.172 | 1.87 | 86.3 | 61 |
2016 | 1.259 | 2.00 | 87.8 | 71 |
2017 | 1.284 | 1.64 | 90.2 | 61 |
2018 | 1.326 | 1.86 | 91.8 | 73 |
2019 | 1.335 | 1.90 | 89.9 | 73 |
2020 | 1.342 | 1.68 | 90.6 | 65 |
2021 | 1.366 | 1.50 | 90.5 | 60 |
2022 | 1.426 | 1.58 | 91.7 | 66 |
2023 | 1.428 | 1.61 | 90.2 | 68 |
2024 Q1+Q2 | 0.727 | 1.35 | 90.5 | 29 |
Total | - | - | - | 3,577 |
Notes:
- CRVD heap leach operation produced 71 koz Au from 1984 to 1988.
- CVRD CIP and heap leach operations produced 1.969 Moz Au from 1989 to 2002.
- Yamana CIL (converted from CIP) operation produced 910 koz Au from 2003 to 2014.
- Brio Gold CIL operation produced 220 koz Au from 2015 to 2018.
- Leagold CIL operation produced 132 koz Au from 2018 to 2020.
- Equinox Gold CIL operation produced 276 koz Au from March 2020 to date (2024 results up to June 30, 2024).
17.1.2 Ore Sources and Characteristics
The LOM average plant feed composition is 40% to 60% from open pit and 40% to 60% from underground sources. The underground is composed of 17% from the Canto Sequence formation and 83% from Fazenda CLX formation. Each ore has its own characteristics:
- Canto Sequence formation (main orebody)
- Grade = 1.50 g/t Au
- Hardness (Wi) = 21 kWh/t
- Grade = 1.84 g/t Au
- Hardness (Bond ball mill work index [BWi]) = 14 kWh/t.
17.1.3 Ore Delivery from the Mine
Ore is delivered from the underground mine using articulated 25-tonne Volvo and Scania haul trucks, and from the open pit mine using 35-tonne Scania haul trucks. The underground and open pit ores are dumped directly into the primary crusher feed hopper, which is equipped with a static grizzly with 800 mm openings. A hydraulic impact hammer is used to break the large rocks retained by the grizzly.
17.1.4 Crushing
The ore flows from the feed hopper to a Metso C125 primary jaw crusher with a closed-side setting of 75 mm. The discharge from the primary crusher is conveyed to a crushed-ore stockpile with a nominal capacity of 19,000 tonnes.
The crushed ore is drawn from the stockpile by three vibrating feeders installed in a tunnel under the stockpile, and conveyed to the primary double-deck vibrating screen. The upper deck has 40 x 70 mm openings, and the bottom deck has 8 x 38 mm openings. The oversized material from the upper deck feeds a Metso HP300 secondary cone crusher with a closed-side setting of 17 mm, and the oversized material from the bottom deck feeds a Metso HP200 secondary cone crusher with a closed-side setting of 8 mm.
The secondary crusher product is conveyed to the secondary screen feed bin, then to two secondary double-deck vibrating screens operating in parallel. The upper decks of the secondary screens have 14 x 56 mm openings and the secondary screens' lower decks have 8 x 38 mm openings. The oversized material from the secondary screens feeds two tertiary Metso HP200 cone crushers operating in parallel, with closed-side settings of 7 mm. The tertiary crushers operate in closed circuit with the secondary screens; therefore, the tertiary crushers' discharge is conveyed to the secondary screen feed-bin and to the secondary vibrating screen, closing the circuit. The secondary HP200 cone crushers enable an increase in the nominal rate of secondary crushing from 200 to 230 t/h.
The <8 mm undersized material from the primary screen joins the undersize material from the secondary screen, and all is conveyed through a flow divider to the grinding mill feed silos, where a reversible conveyor distributes the ore between the two silos. There are separate feed bins for each of the two parallel mills. The flow divider allows material from tertiary crushing to be diverted to an emergency stockpile with a capacity of 6,000 tonnes. The emergency stockpile allows feed for the mills during interruptions in crusher operation, typically for maintenance.
17.1.5 Grinding
Belt feeders draw the crushed ore from the mill feed bins into the two overflow ball mills operating in parallel. Ball mill MO-01 is 3.0 m in diameter and 5.2 m long, with a 635 kW drive and a capacity of 66 t/h with 42% steel load. Ball mill MO-02 is 3.8 m in diameter and 7.3 m long, with a 1565 kW drive and a capacity of 126 t/h with 41% steel load. The ball mill discharges are fitted with trommel screens to remove ball chips.
The ball mills operate at a slurry density of approximately 75% solids. The slurry discharges into separate hydrocyclone-feed sumps. Each mill operates with a separate set of hydrocyclones for classification. The hydrocyclone clusters include two dedicated hydrocyclones that feed a portion of the hydrocyclone underflow slurry to the gravity concentration circuit. The hydrocyclone feed slurry density is controlled at approximately 60% solids, resulting in a hydrocyclone overflow density of 35% solids and P80 75 µm. The hydrocyclone underflow slurry will have a density of approximately 75% solids.
The hydrocyclone underflow flows to the ball mill feed chute, closing the circuit. The overflow slurry from all hydrocyclones flows to the thickener.
17.1.6 Gravity Concentration
The product of ball mill MO-01 feeds a bank of four hydrocyclones, with two hydrocyclones operating and two in reserve. The hydrocyclone overflow flows to the thickener. A portion of the hydrocyclone underflow is diluted to 40% solids, which feeds a centrifugal concentrator. Product from ball mill MO-02 feeds a bank of seven hydrocyclones, with four operating and three in reserve. A portion of the hydrocyclone underflow is diluted to 40% solids, which feeds a secondary centrifugal concentrator.
The concentrate from the centrifugal concentrators is pumped to the Acacia reactor for intensive leaching of the gold with cyanide. The tailings from the concentrators return to the respective ball mill's cyclone feed box.
17.1.7 Intensive Leaching-Acacia
The Acacia reactor is an automated system that leaches free gold from the gravity concentrate. Recovering the gold takes 8 hours of leaching at 35°C in a solution containing 2.0% sodium cyanide, 1.0% sodium hydroxide, and 1.2 kg/t of a special leach-enhancing reagent. The pregnant Acacia leach solution is then pumped to a storage tank in the refinery area to be treated further in the electrowinning cells.
17.1.8 Thickening
The hydrocyclone overflow is pumped to a horizontal vibrating screen to remove trash and other impurities. The high-frequency Derrick trash screen produces an underflow of 192 t/h that feeds a 32 m-diameter Metso high-rate thickener at 20% solids (specific gravity [SG] = 1.15 t/m³). The dosage of 20 g/t of flocculant is added into the thickener feed well. The thickener underflow slurry density is controlled to approximately 50% solids (SG = 1.48 t/m³) using a density measurement gauge and variable-speed underflow pumps. The underflow slurry is then pumped to the CIL cyanide-leaching tanks. The thickener overflow (water) flows to the process-water tank for distribution to the processing facilities, including the grinding circuit, to be used as dilution water.
17.1.9 Carbon-in-Leaching
The thickener underflow slurry is pumped to two parallel lines of CIL tanks. Line 1 consists of three 350 m3 pre-aeration tanks in series, followed by three 350 m3 and six 110 m3 CIL tanks in series. Pre-aeration tanks are necessary to oxidize the sulphides to reduce cyanide consumption. Lime is added to increase the pH to 10.2. Air is sparged into the tanks during pre-aeration from three compressors at 3 bar, which provide 4 mg/L of dissolved oxygen.
Line 2 consists of two 700 m3 pre-aeration tanks in parallel, followed by two parallel sets of two 700 m3 leach tanks that feed eight 200 m3 CIL tanks. Like Line 1, Line 2 has pre-aeration tanks; cyanide is added in Tank 3 to begin the leaching process, and carbon is transferred from Tanks 3 to 12 to operate as CIL tanks.
Each circuit was designed for a total retention time of 35 hours. The leaching configuration is intended to address recovery issues associated with sulphide minerals and organic carbon in the ore. The pre-aeration tanks will oxidize weakly bound sulphur that would combine with cyanide during leaching to form thiocyanate and cyanicides, increasing cyanide consumption. A process improvement was made by adding 50 g/t of lead nitrate to avoid the gold-robbing effect of the organic carbon in the ore, concomitant with the increase of pH from 9.8 to 10.2.
The organic carbon adsorbs the gold, causing gold-robbing during cyanidation, which in turn causes gold to be lost in the tailings. To mitigate this effect, the TOC is passivated by adding kerosene to the leaching tanks at 200 g/t.
The activated carbon has a grain size between 6 and 12 mesh sieve size (3.4 to 1.7 mm), and is added to the last downstream tank in the CIL circuits at a proportion of 4 t/month of virgin carbon to replace carbon consumed during the adsorption, elution, and regeneration processes. Activated carbon is transferred from tank to tank, countercurrent to the slurry flow. The concentration in the circuit is 25 g/L and is loaded to approximately 500 g/t Au. Loaded carbon is pumped from the first CIL tank to the loaded-carbon wash screens. The carbon is retained over the screen and collected in portable carbon-transfer bins. The carbon is transferred to a Zadra circuit for elution of gold from the carbon. After the elution process, the carbon is regenerated in a rotary kiln. The underflow slurry from the carbon wash screen is returned to the first CIL tank.
Process controls in the leaching circuit include continuous online analyzers for both pH and cyanide concentration, with feedback loops to control addition.
17.1.10 Elution
Gold is eluted from the carbon using the pressure Zadra process. Each elution cycle treats 4 tonnes of loaded carbon in an 8-hour cycle at a flow rate of two bed volumes per hour, which delivers three elutions per day.
The elution of gold from the carbon is the first step of the process. Loaded carbon is transferred to two separate columns and is stripped by a solution containing 0.5% sodium cyanide and 2.0% sodium hydroxide at 140°C and 360 kPa, flowing upward from the bottom. After 8 hours, the pregnant solution passes through a heat exchanger, where the solution is cooled to 80°C, then stored in the pregnant eluant tank. The solution is then pumped through electrowinning cells operating at a current density of 950 A/m2, and the gold is plated out on steel-wool cathodes. The barren solution is then pumped to the barren-solution tank, where the sodium cyanide and sodium hydroxide concentrations are adjusted. The barren solution is then pumped through a heat exchanger to raise the temperature to 140°C, and recirculates through the elution column, completing the cycle.
The second step is acid washing, which removes base metals and scaling compounds such as calcium carbonate and sodium silicate from the carbon. The carbon is added to a 4-tonne capacity acid wash column. The column is then filled with a 2.0% hydrochloric acid solution and allowed to soak for 5 hours. Fresh water is used to rinse the carbon and neutralize the pH. The rinsed carbon is pumped to a carbon dewatering screen to remove carbon. The screened carbon discharges into the barren-carbon storage tank ahead of the carbon regeneration kiln. The barren solution is then pumped to the head of the CIL circuit. The carbon fines are filtered and stored for further processing.
The current circuit consists of elution, acid washing, and carbon regeneration. The elution efficiency is 80%; however, a testwork program will be undertaken in 2025 to determine if acid washing prior to elution will increase elution efficiency.
17.1.11 Carbon Regeneration
Half of the barren carbon is reactivated in a horizontal electric rotary kiln operating at 700°C; the other half returns to the leach without regeneration. The hot carbon exiting the kiln is cooled in a quench tank, then screened to remove carbon fines, which report to the tailings and end up in the TSF. Regenerated carbon is then transferred to the CIL circuit to be reused. The kiln capacity is 500 kg/h.
A new regeneration kiln was installed in the circuit in 2023 to improve capacity and carbon activity.
17.1.12 Electrowinning and Doré Smelting
The pregnant gold solutions from the Acacia (3 batches/day) and elution (3 batches/day) are separately processed by electrowinning. The solutions are circulated through the electrowinning cells, and the gold in solution is plated out onto steel wool cathodes. Once the cathodes are loaded, they are removed from the cells, and the steel wool is added, with fluxes, into an electric induction furnace at 1,200°C, and melted to produce gold doré bars for sale. The doré from the leaching circuit typically contains 75% Au, and the doré from the gravity circuit typically contains 85% Au.
17.1.13 Tailings
There are four geomembrane-lined TSF. TSFs 1, 2, and 3 are full, while TSF 4 is operational and receives the CIL tailings slurry. The slurry is discharged via spigotting, and the solid-free solution percolates to a low-point collection area from which it is pumped back to the process water tank at the process plant. The tailings facilities are described in detail in Section 18.
17.2 Production Historical Data
Table 17-2 presents the key operating parameters and performance indicators for the processing facility from January 2023 to June 30, 2024, when both the open pit and underground operations were underway. Prior to the open pit operations, ore was supplied only from underground; since then, the open pit provided 39.4% of the ore production in 2023 and increased to 44.3% in 2024.
Table 17-2: Processing Operating Parameters (January 2023 through June 2024)
Operating Parameter Description | Unit | 2023 | 2024 (to June 30) |
Total Ore Mined | t/a | 1,404,169 | 941,154 |
Ore Mined from Open Pit | t/a | 553,402 | 417,000 |
Ore Mined from Underground | t/a | 850,766 | 524,154 |
Mill Production | t/a | 1,428,738 | 1,103,763 |
Production Rate | t/h | 175.3 | 180.2 |
Grinding Availability | % | 93.8 | 95.2 |
Grinding Utilization | % | 98.9 | 99.2 |
Grinding Product P80 | µm | 87 | 100 |
Gold Head Grade | g/t | 1.61 | 1.37 |
Overall Recovery | % | 90.15 | 90.56 |
NaCN Consumption | g/t | 591 | 646 |
Grinding Media Consumption | g/t | 639 | 572 |
Lime Consumption | kg/t | 1.31 | 1.52 |
Power | kWh/t | 30.0 | 29.0 |
Carbonaceous Ore in the Blend | % Max | 10 | 10 |
Plant Unitary Operating Costs | $/t | 14.50 | 13.14 |
Lead Nitrate | g/t | 43 | 38 |
Kerosene | g/t | 84 | 58 |
Dissolved Oxygen | mg/L | 6.0 | 6.2 |
% Solids Leaching Feed | % | 52 | 52 |
Carbon Concentration | g/L | 25 | 25 |
Ore Wi | kWh/t | 16.7 | 16.7 |
The capacity of the process plant is limited by the grinding circuit, which can consistently process ore at a rate of 192 t/h (3,945 t/d annual average). At an availability of 95% this results in an annual production rate of 1.44 Mt. The production rate in 2023 was 175.3 t/h with availability of 93.8%, which processed 1.43 Mt. The mill has processed similar tonnes and availability numbers to June 2024 as it did in 2023, namely at an average rate of 180.2 t/h at 95.2% availability, which processed 1.10 Mt. Production is primarily affected by the ore blend, mine supply rate, and plant availability. Figure 17-2 shows the budgeted grinding production compared to actual production from January 2023 through June 2024.

Figure 17-2: Mill Production, Budgeted vs. Actual, in 2023 through June 2024
Figure 17-3 illustrates the January 2023 through June 2024 budgeted and actual gold recovery compared to the head grade. The total gold recovery in 2023 was 90.2%, and in the first six months of 2024 was 90.5%. Recovery variance is primarily affected by the concentration of TOC and sulphides blended to the plant feed from the Canto Sequence and CLX zones. Blending of ore to the process facility is necessary to stabilize and effectively minimize the detrimental effects of TOC and high concentrations of soluble sulphides.

Figure 17-3: Gold Recovery and Gold Grade in 2023 through June 2024
Figure 17-4 shows the reagent consumptions for January 2023 through June 2024. Cyanide consumption was consistent throughout the period, with an average usage of 591 g/t in 2023 and 646 g/t currently in 2024. Grinding media consumption was also consistent, with an average of 639 g/t in 2023 and 572 g/t in 2024. Lime consumption increased from 1.31 kg/t in 2023 to 1.52 kg/t in the first six months of 2024.

Figure 17-4: Reagent and Grinding Media Consumptions in 2023 through June 2024
Figure 17-5 presents the plant power consumption from January 2023 through June 2024. Power usage averaged 30.0 kWh/t in 2023, and 29.0 kWh/t in the first six months of 2024.
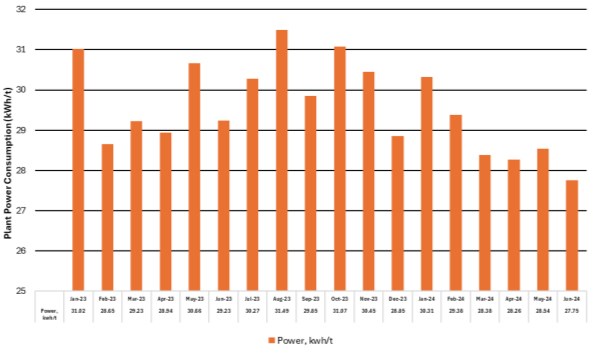
Figure 17-5: Process Plant Power Consumption from January 2023 through June 2024
Figure 17-6 presents the plant unitary operation costs from January 2023 through June 2024. The average processing operating cost for 2023 was $14.50/t, and $13.14/t in the first six months of 2024.
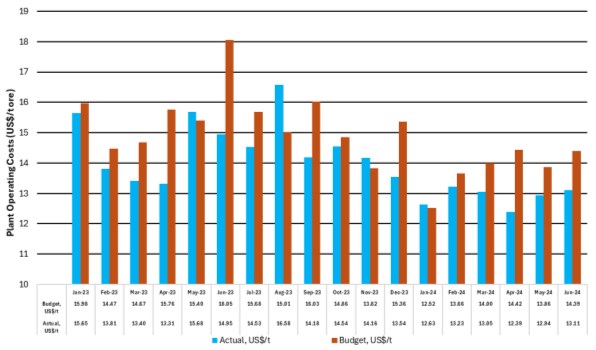
Figure 17-6: Process Plant Unit Operating Costs from January 2023 through June 2024
18 Project Infrastructure
FBDM has operated for 40 years and has all the necessary roads, power lines, access, medical facilities, and surrounding communities that provide workers and services, that one would expect to find for one of Bahia State's major employers.
Teofilândia is a full-service town and, along with the mine, has access to electricity from the national power grid. A freight-only rail line passes through the area in a northwest-southeast direction close to the mine; however, it is not used by the mine. Figure 18-1 shows the mine site plan with the existing infrastructure. Figure 18-2 shows the physical layout of the site and facilities.
18.1 Access Roads
The mine is in the municipality of Barrocas in northeastern Bahia State. It can be accessed from Salvador (population approximately 2.9 million) by way of approximately 180 km of paved road to Teofilândia (population approximately 22,555), and locally by a 12 km unpaved road.
Some of the site access roads will need to be re-routed upon development of the CLX pits. The proposed future site road alignments are shown in Figure 18-3.
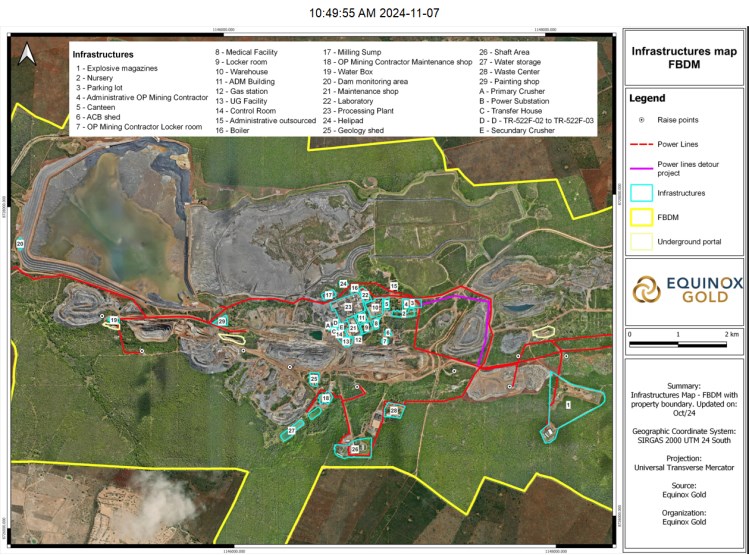
Figure 18-1: Site Plan and Infrastructure

Figure 18-2: Site Photo of Facilities Layout and Infrastructure

Figure 18-3: Site Access Roads-Proposed Future Alignments
18.2 Electrical Power Supply
The power requirement for the mine and site facilities is approximately 9.95 MW, which is supplied by the local grid. Figure 18-4 presents the approximate monthly power consumption in MWh by area of the operation for 2024. The historical power consumption is reported to average approximately 55 kWh/t of ore treated.

Figure 18-4: Monthly Power Consumption
18.3 Water Supply
Water is primarily supplied by a series of wellfields with a total production capacity of 310 m3/h. The water is delivered through a 10-inch diameter (25 cm), 36.3 km-long pipeline, which supplies local municipalities, communities, and the Fazenda mine. The aquifer has been utilized for decades to provide water to Fazenda; therefore, water supply appears to be secure. There is also water recycling from the operating TSF 4 back to the process plant at a rate of up to 500,000 m3 per year.
18.4 Site Facilities
Mine, process, and administration facilities are well established, and include:
Geomembrane-lined tailings storage facilities
Waste rock storage facilities
Warehouse
Maintenance shops
Drill core logging, splitting, and storage facilities
Assay laboratory
Cafeteria
Helipad for emergency use and shipment of gold bullion
Office complexes
Water system consisting of a wellfield east of Teofilândia, and a buried pipeline and water pumping system to provide potable and processing water to Teofilândia and the mine
Fuel station
Explosives magazine
- 470 m vertical shaft (currently not in service).
18.5 Workforce Accommodation
The town of Teofilândia serves as the main community for mine workers, although there is also a smaller village between Teofilândia and the mine. The local population base is approximately 22,555 of which the vast majority live in Teofilândia.
18.6 Security
The entire area of the mine, process plant, gold room, and explosives magazine is enclosed by security fences and is under 24 h/d, 7 d/week closed-circuit television (CCTV) surveillance. At the main entrance a guardhouse is equipped with an impact-resistant gate, and speed bumps controlling access of people, vehicles, and materials. Access to the explosives magazine is controlled by an additional guardhouse. The gold produced is stored in a safe while waiting for shipping. The area is protected by bulletproof doors; it is also monitored by cameras and has an alarm system. Mine security is backed by a local police force.
18.7 Occupational Health and Safety
The following summary covers the main aspects of the site emergency plan, focusing on safety measures, emergency response procedures, and organizational structure:
18.7.1 Hygiene, Medicine, and Occupational Safety
Regulatory standards: the plan adheres to various regulatory standards, including those for Personal Protective Equipment (PPE), Occupational Health Medical Control Program, and Internal Commission for the Prevention of Occupational Accidents.
Risk management: emphasizes the recognition of risks and implementation of both collective and individual protection measures.
- Training: includes specific training for respiratory and hearing protection, correct use of PPE, and emergency procedures.
18.7.2 Emergency Response Plan
Objective: establish guidelines for controlling and combating emergencies, applicable to all employees, contractors, and visitors.
Emergency scenarios: classified into three levels based on the severity and resources required for control:
- Level 1: contained with local resources
- Level 2: requires support from other areas
- Level 3: needs external support.
18.7.3 Emergency Organization
- Meeting points: designated safe areas for employees to gather during an emergency.
18.7.4 Procedures and Responsibilities
Detection and reporting: procedures for detecting and reporting emergencies, including specific actions for different types of incidents.
Internal and external resources: details on the use of internal resources like trained personnel and equipment, and the involvement of external agencies when necessary.
- Evacuation and safety: guidelines for orderly evacuation and ensuring the safety of all personnel.
18.7.5 Additional Provisions
- Visitor guidance: instructions for visitors during emergencies.
18.8 Tailings Storage Facilities
There are four TSFs at Fazenda. These were constructed in a cascading sequence over the past four decades as several expansions to existing facilities and construction of new facilities were required to accommodate continuing tailings production over this period.
TSF 4 is the current operating facility and has been active since 2013. It has undergone several expansions over the past decade, and is the primary TSF for the remaining LOM. Several downstream expansions have been built periodically, primarily using rockfill from mining operations as well as finer-grained soil for a low-permeability zone and crushed rock for a transition zone. The current maximum dam height is 36 m at a crest elevation of 350 m. Tailings are deposited into TSF 4 as a slurry via spigots, and water from the settled tailings are pumped back to the process plant for reuse.
TSF 3 was initially constructed in the late 1990s and ceased operation when TSF 4 was commissioned. TSF 3 has since been closed and was fully reclaimed in 2022. TSF 1 was built in 1988 to store the initial tailings from the new process plant operation. In approximately 1990, TSF 2 was built adjacent to TSF 1 to provide additional storage capacity. TSF 1 and TSF 2 were expanded concurrently over the following decades to store slurry tailings and, eventually, underflow (coarse) tailings from cycloning operations once TSF 3 was commissioned to store the overflow (fine) tailings. Tailings cycloning into TSF 1 and TSF 2 was halted in 2018, and only slurry tailings deposition into TSF 4 has occurred since. Closure and reclamation of TSF 1 and TSF 2 are planned for 2025.
All four tailings facilities are geomembrane-lined with polyvinyl chloride (PVC) in TSFs 1, 2, and 3 and High-density polyethylene (HDPE) in TSF 4. Piezometers and movement monuments have been installed in each facility, and these are monitored by both FBDM staff and the Engineer of Record. A foundation drain in TSF 4 is monitored for seepage. Any water collected from the tailings drainage collection system within TSF 1 and TSF 2 is pumped into the TSF 4 reservoir for storage.
TSF 4 was expanded in 2023-2024 and can store the LOM tailings with two additional expansions (i.e., dam raises of an additional 8 m in total). As a result of this recently completed expansion, TSF 4 is now connected to TSF 2; however, only with the addition of the future dam raises will tailings deposition into TSF 4 also flow into TSF 2 and eventually bury the TSF 2 main dam. The slurry tailings from TSF 4 will also eventually buttress the cycloned tailings within TSF 1 and TSF 2. The additional tailings storage capacity within TSF 4 from the recently completed expansion plus the two future expansions would total approximately 10 Mm3, or 13.6 Mt, which is sufficient for the projected LOM production.
The emergency overflow spillway for TSF 4 is sized to pass the design storm of the 24-hour Probable Maximum Flood for all the TSFs combined.
18.9 Explosives Magazine Facilities
The explosives magazine is a mandatory structure that must be used for the storage of explosives and detonators, which are licensed by the Public Security Police (Polícia Civil) and based on Ordinance No. 147-COLOG/Ministry of Defense, published on November 21, 2019.
The Fazenda mine has six magazines and all are certified by relevant authorities. The magazines are built as masonry buildings and have a protection system against electrical discharge and a 24-hour camera monitoring system. In addition to the explosives magazines, an emulsion storage tank with a capacity of 54 tonnes (60 tons) is installed in another area.
Based on the criteria established in Ordinance No. 147-COLOG, the characteristics and dimensions of the magazines will allow storage of a monthly capacity of up to 100,000 kg of explosives. This volume is sufficient to ensure the operational continuity of the mine with the monthly replacement of materials, which may vary according to consumption per period.
There are two main areas for storing explosives products: the central explosives magazine and two central accessory magazines. The surface magazines are equipped with iron doors, which are kept locked with double padlocks.
19 Market Studies and Contracts
19.1 Markets
FBDM has a standard industry contract for the sale of gold doré. The gold markets are mature global markets with reputable smelters and refiners throughout the world. Gold is a principal metal traded at spot prices for immediate delivery.
19.2 Contracts
FBDM has existing contracts for the supply of major consumables, including diesel fuel, electricity, cyanide, and explosives, as well as for major equipment and mining services.
19.2.1 Contractor Mining Agreement
FBDM has an agreement with Mecbrun Industrial Group for mining services of the open pit, which include excavation, loading, and transportation services. This current agreement is valid until May 30, 2027.
19.2.2 Electrical Energy Supply Agreement
FBDM has an agreement with Enel Green Power to supply electricity. This agreement is valid until December 31, 2032.
19.2.3 Diesel Fuel Supply Agreement
FBDM has an agreement with Ipiranga Produtos de Petroleo to supply fuel. This agreement is valid until January 31, 2026.
19.2.4 Explosives Supply Agreement
FBDM has an agreement with Orica Brazil Ltd. to supply explosives and services. This agreement is valid until June 30, 2026.
19.2.5 Cyanide Supply Agreement
FBDM has an agreement with Proquigel Quimica to supply solid sodium cyanide. This agreement is valid until January 31, 2025.
20 Environmental Studies, Permitting, and Social or Community Impact
20.1 Environmental Licensing
The Brazilian Environmental Policy was created in 1981 (Law 6938/1981). Based on this policy, Resolution CONAMA 01/1986 defined the nature of the studies required for permitting different types of activities that have the potential to cause environmental impacts. FBDM currently has several environmental licenses and water permits for the operation of the Fazenda mine. The Institute of Environment and Water Resources (INEMA) issued these permits through processes in the Environmental State Board.
All required environmental licences and permits to conduct the proposed work on the mine property are in good standing or in the process of being renewed. The permits currently in effect at Fazenda are summarized in Table 20-1.
There are no identified environmental liabilities associated with the tenements.
20.1.1 Land Use
The Fazenda mine currently occupies 1,240 ha. If use of a third-party-owned area is required, a contract is negotiated for land use, with royalty payments according to the production in that area. The contract also specifies that FBDM has the responsibility for reclaiming that area after cessation of use.
Figure 20-1 shows the legal reserve areas near the current infrastructure. These are protected areas that are not allowed to be disturbed by mining activities.
Table 20-1: Environmental Permit Status
Document | Agency | Description | Certificate
No. | Granting
Date | Expiry
Date | Status |
Main Operation License | INEMA | Mine operating license for mine, mineral processing facilities, waste rock storage, and tailings dam. | 20.184/2020 | 06/03/2020 | 06/03/2025 | License under renewal.
Still in force. |
Alteration License | INEMA | Alteration licence for TSF 4 dam raise to elevation 350 m. | 21.027/2020 | 16/07/2020 | 06/03/2025 | Active |
Operation License | INEMA | Open pit mining FW ore body. | 21.773/2020 | 10/11/2020 | 10/11/2024 | License under renewal.
Still in force. |
Operation License | INEMA | Operating permit for open pit mine Lagoa do Gato (LG3) | 22.791/2021 | 20/04/2021 | 20/04/2023 | License under renewal.
Still in force. |
Vegetation Suppression, Fauna Monitoring and Rescue | INEMA | Exploration Drilling. | 27.365/2022 | 10/11/2022 | 10/11/2025 | Active |
Alteration License | INEMA | Vegetal suppression and fauna monitoring and rescue for TSF 4 dam raise to El. 354 m | 28.614/2023 | 13/05/2023 | 06/03/2025 | Active |
Vegetation Suppression, Fauna Monitoring and Rescue | INEMA | Canto 1 South Pit. | 28.677/2023 | 20/05/2023 | 20/05/2026 | Active |
Alteration License | INEMA | Vegetation suppression, fauna monitoring and rescue for open pit mining of CLX. | 29.694/2023 | 21/10/2023 | 06/03/2025 | Active |
Alteration License | INEMA | Vegetation suppression and fauna monitoring and rescue for waste dumps EW and F. | 29.695/2023 | 21/10/2023 | 06/03/2025 | Active |
Alteration License (LA) | INEMA | Vegetal suppression and fauna monitoring and rescue, as well as implementation and operation, for heap leach pad. | 29.709/2023 | 25/10/2023 | 06/03/2025 | Active |
Water Wells for Industrial and Human Consumption | INEMA | Biritinga water source. | 30.320/2024 | 06/02/2024 | 06/02/2028 | Active |
Registration Certificate for Controlled Products and Explosives Store | Defense Ministry | The registration certificate includes the storage and the use of explosives. | 126647 | 14/10/2022 | 22/08/2024 | License under renewal. Still in force |
Annual Operating License Certificate for Controlled Products | Federal Police | The registration certificate includes the magazine and use of explosives. | 2021-00584908 | 22/03/2024 | 22/03/2025 | Active |
Municipal License | City Hall of Barrocas | Land usage. | 3452 | 15/05/2024 | 31/12/2024 | Active |
Sanitary License-Medical Service | Regional Sanitary Surveillance-Bahia | Sanitary services. | 79 | 26/09/2023 | 26/09/2024 | License under renewal. Still in force |
Sanitary License-Restaurant | Regional Sanitary Surveillance-Bahia | Sanitary services. | 10 | 15/10/2023 | 15/10/2024 | License under renewal. Still in force |
Inspection Certificate-AVCB | Fire Department-State of Bahia | Administrative and operational areas. | 3180/2024 | 11/06/2024 | 10/06/2025 | Active |
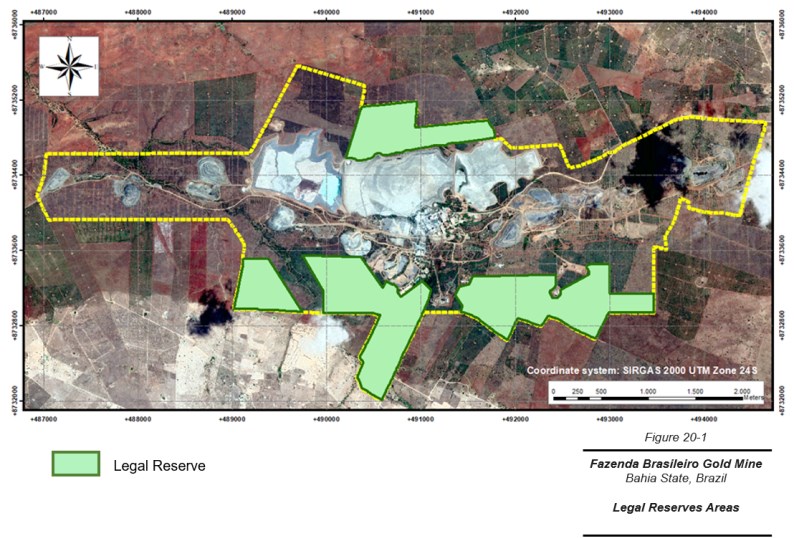
Figure 20-1: Legal Reserve Areas
20.1.2 Environmental Impacts and Mitigation Actions
An environmental control plan is in place for the Fazenda mine. All the impacts generated during operations are monitored and addressed as required, including submitting monitoring reports to the required regulatory agencies. The impacts must be mitigated during the closure phase in accordance with the Mine Closure Plan (MCP).
The systems and programs included in the environmental control plan are:
Environmental management system
Environmental education program
Erosive processes prevention and control program
Liquid effluents control program
Flora and fauna control program
Degraded areas rehabilitation program
Solid residues management program
Surface water quality monitoring program
Atmospheric emissions and air quality monitoring program
- Noise and vibration monitoring and control program.
20.2 Socioeconomics
The Environmental Impact Assessment identified the main socioeconomic impacts that closure of the Fazenda mine will generate, such as unemployment, decreased tax revenues, end of demand for local regional suppliers, reduction in personal income, and the end of projects with the local communities. A summary of these impacts is presented in Table 20-2.
Table 20-2: Socioeconomic Impacts Associated with Mine Closure
Impact | Frequency | Severity | Coverage | Nature | Mitigation Possibility |
Unemployment | Probable | High | Regional | Negative | Mitigable |
Termination of Tax Collection | Probable | High | Regional | Negative | Non-mitigable |
End of Demand for Local Suppliers | Probable | High | National | Negative | Mitigable |
Decrease of Personal Income | Probable | High | Regional | Negative | Mitigable |
End of Community Projects | Probable | Medium | Regional | Negative | Non-mitigable |
Unemployment could potentially be mitigated by relocating individual workers to other Equinox Gold operations such as the Santa Luz mine, which is approximately 70 km from Fazenda. Relocation to other mining projects and other mining companies within the state is also a possibility.
The loss of tax revenue income is irreversible in the short and medium terms because there are no prospective new enterprises scheduled or planned in FBBD's area of influence. The services and materials suppliers will have to look for new clients, and the Santa Luz mine may present an opportunity for them. The reduction of personal income can be partially offset with the implementation and support of sustainable projects within the communities, and educational training of the people before the mine closure.
The end of projects involving the community partnership program could potentially be mitigated by increasing the investments in these projects during the pre-closure phase. This investment support would focus on developing the autonomy and the sustainability of these projects, mainly in the generation of employment and income.
20.3 Acid Rock Drainage Evaluation
A detailed acid rock drainage (ARD) evaluation of the Fazenda tailings was carried out in November 2021. Thirty-three samples of tailings were collected from the existing TSFs and rock samples from the waste stockpiles. The analytical results showed that almost 100% of samples presented a neutralization potential ratio two times higher than the acid-generating potential. Figure 20-2 shows the acid-base accounting of these samples.

Figure 20-2: Acid-Base Accounting Characterization
These test results show that although sulphides such as arsenopyrite, pyrite, and pyrrhotite are present in the mineralogy of the site, the presence of carbonates is proportionately well in excess of the amount of these sulphides. From these results it can be concluded that ARD generation will not be a significant risk for Fazenda during operations and post-closure. In addition, the existing tailings facilities have geosynthetic liners to minimize seepage from their impoundments.
Although the risks of ARD generation are controlled by the natural presence of carbonates in the waste rocks, it is still possible to find some elevated arsenic concentrations in the water from the tailings facilities, according to the water-monitoring campaigns carried out through the decades of mining operations. According to these results, it is recommended that arsenic mobility should be controlled after the closure stage to avoid potential contamination of the surrounding areas.
To address the mitigation methods for this potential ARD issue, a field procedure was developed to test different types of tailings covers that could effectively prevent precipitation from contacting the tailings. This field-testing program was performed with different types and thicknesses of cover materials for the tailings to measure the water infiltration rate and infiltration depth into the tailings. The results from the testing program demonstrated that a 30 cm-thick cover layer of oxide material combined with a capillary break layer of at least 15 cm thick was sufficient to minimize the infiltration of water through the cover and into the tailings. Vegetation growth potential on the cover was also measured. The results from this testing program were refined and used for the successful closure of TSF 3 in 2023.
Implementing a cover layer with this configuration should gradually decrease the arsenic concentrations in the discharge water from the TSF's foundation drains, since the amount of water in contact with the tailings will decrease significantly after the cover is implemented.
20.4 Mine Closure Requirements
FBDM has a comprehensive environmental policy that is in accordance with the MCP guidelines as outlined by ANM. The Brazilian environmental authorities regard the MCP as FBDM's commitment to perform the rehabilitation required for mine closure.
The MCP guidelines lay out the process for revegetating disturbed areas with native species; covering the pits or converting them to water storage facilities; demolishing and removing all structures and facilities that will not be used in the future; and stabilizing and rehabilitating waste dumps and TSFs. A summary of the items presented in the MCP is presented in Table 20-3. The estimated total closure cost for the Fazenda mine is estimated at $19.60 million.
Table 20-3: Estimated Mine Closure Costs
Closure | Total
($ 000s) |
Closure Study | 506 |
Tailings Dam Closure | 5,186 |
Canto II Open Pit Reclamation | 645 |
Closure of the Open Pit Dam | 33 |
Closure of Open Pit G (G3+G West) | 938 |
Closure of Open Pit F | 535 |
Closure of Open Pit FW | 409 |
Closure of the Open Pit Canto 2 South | 409 |
Closure of the Open Pit Pau-a-Pique (PPQ03) | 449 |
Closure of the Open Pit Pau-a-Pique (PPQ14) | 213 |
Closure of the Open Pit Lagoa do Gato (LG3) | 396 |
Closure of the Open Pit C North | 253 |
Closure | Total
($ 000s) |
Closure of the Open Pit C South | 356 |
Closure of the Open Pit C South (East) | 529 |
Closure of the Open Pit D | 400 |
Topographic Contouring of Waste Dumps | 1,970 |
General Revegetation | 1,703 |
CIL Plant, Heap Leach Pads, and Shop Decommissioning | 3,783 |
Revegetation Maintenance | 194 |
UG Mine Stabilization and Closure | 270 |
Soil and Water Monitoring 5 years After Closure | 418 |
Total (Closure) | 19,595 |
Note. Numbers may not sum precisely due to rounding.
21 Capital and Operating Costs
21.1 Capital Costs
Recent (2021, 2022, and 2023) actual sustaining capital costs for Fazenda are presented in Table 21-1, along with the exchange rates for the respective years.
Table 21-2 provides a breakdown of the total $199 million for projected LOM sustaining capital cost, non-sustaining capital cost, and closure and reclamation cost estimates. An exchange rate of R$5.00:US$1.00 was assumed for 2024 and 2025, and R$4.80:US$1.00 for the remaining LOM.
Table 21-1: Actual Sustaining Capital Costs-2021 to 2023
Description | 2021
($ M) | 2022
($ M) | 2023
($ M) | Total
($ M) |
Buildings & Infrastructure | 0.630 | 1.134 | 0.503 | 2.268 |
Hardware, Software & Automation | 0.318 | 0.143 | 0.148 | 0.610 |
Capitalized Stripping | 9.070 | - | 0.982 | 10.053 |
Mine Development | - | 5.838 | 4.780 | 10.618 |
Mineral Properties | 0.616 | 1.242 | - | 1.858 |
Land Acquisition | 0.027 | 0.066 | - | 0.093 |
Machinery, Equipment & Vehicles | 2.123 | 1.057 | 3.064 | 6.244 |
Furniture & Fixture | 0.011 | 0.021 | 0.001 | 0.033 |
Tailings Dam Maintenance | 1.839 | 0.128 | 2.838 | 4.805 |
Foreign Exchange R$:US$ | 5.40:1.00 | 5.16:1.00 | 4.99:1.00 | - |
Total | 14.635 | 9.630 | 12.317 | 36.582 |
Note: Totals may not sum precisely due to rounding.
Table 21-2: LOM Projected Capital Costs
Description | 2024
($ M) | 2025
($ M) | 2026
($ M) | 2027
($ M) | 2028 & Beyond
($ M) | Total
($ M) |
Sustaining Capital | | | | | | |
Buildings & Infrastructure | 0.566 | 1.834 | 0.901 | 0.819 | 1.730 | 5.849 |
Hardware, Software & Automation | 0.073 | 0.780 | 0.278 | 0.160 | 0.000 | 1.291 |
Capitalized Underground + Open Pit | 9.691 | 19.228 | 12.696 | 16.389 | 2.495 | 60.499 |
Underground Mine Development | 2.635 | 7.895 | 0.397 | 1.383 | 0.298 | 12.609 |
Open Pit Mine Development | 7.056 | 11.332 | 12.299 | 15.005 | 2.197 | 47.890 |
Land Acquisition | - | 0.720 | - | - | - | 0.720 |
Machinery & Equipment | 3.968 | 8.116 | 8.254 | 6.061 | 2.944 | 29.342 |
Furniture & Fixture | 0.023 | 0.096 | 0.062 | 0.048 | 0.041 | 0.268 |
Tailings Dam Sustaining | - | - | 7.023 | - | 8.037 | 15.060 |
Description | 2024
($ M) | 2025
($ M) | 2026
($ M) | 2027
($ M) | 2028 & Beyond
($ M) | Total
($ M) |
Subtotal Sustaining | 14.321 | 30.773 | 29.213 | 23.476 | 15.247 | 113.029 |
Non-Sustaining | | | | | | |
UG Mine Development | 0.837 | 0.650 | 2.269 | 4.425 | 0.080 | 8.261 |
Capacity Increases | - | - | 0.889 | 0.889 | - | 1.777 |
Exploration | 2.288 | 4.919 | 4.919 | 4.919 | - | 17.047 |
Subtotal Non-Sustaining | 3.125 | 5.569 | 8.077 | 10.233 | 0.080 | 27.085 |
Closure & Reclamation | 0.346 | 1.912 | 0.083 | 0.232 | 16.568 | 19.141 |
Contingency | 4.448 | 9.563 | 9.343 | 8.485 | 7.974 | 39.814 |
Total | 22.240 | 47.817 | 46.717 | 42.426 | 39.868 | 199.068 |
Notes: Totals may not sum precisely due to rounding.
2024 represents only 6 months (July to December).
21.2 Operating Costs
Actual operating costs for 2021, 2022, and 2023 are presented in Table 21-3; Table 21-4 shows a summary breakdown of the same on a unit cost basis, referencing mining, milling, and G&A costs. The average total unit operating cost for 2021-2023 was $52.29/t milled.
Table 21-3: Actual Operating Costs-2021 to 2023
Activity | 2021
($ M) | 2022
($ M) | 2023
($ M) | Total
($ M) |
Open Pit Mining | 3.247 | 8.340 | 14.051 | 25.638 |
Underground Mining | 32.640 | 39.847 | 39.770 | 112.257 |
Milling | 15.382 | 19.555 | 20.721 | 55.658 |
G&A | 6.961 | 8.761 | 11.466 | 27.187 |
Total | 58.230 | 76.503 | 86.008 | 220.740 |
Note: Totals may not sum precisely due to rounding.
Table 21-4: Actual Unit Operating Costs-2021 to 2023
Activity | 2021
($/t milled) | 2022
($/t milled) | 2023
($/t milled) | Average
($/t milled) |
Open Pit Mining | 2.38 | 5.85 | 9.83 | 6.07 |
Underground Mining | 23.88 | 27.94 | 27.84 | 26.59 |
Milling | 11.26 | 13.71 | 14.50 | 13.19 |
G&A | 5.09 | 6.14 | 8.02 | 6.44 |
Total | 42.61 | 53.65 | 60.20 | 52.29 |
Exchange Rate (R$:US$) | 5.40 | 5.16 | 4.99 | |
Note: Totals may not sum precisely due to rounding.
As described in Section 16, the Fazenda operation is scheduled to extract 13.14 Mt of ore from its open pits and underground operation during the 2024 to 2033 LOM plan, processing a total of 13.16 Mt in the mill during that time. Projected total tonnes of waste moved are 94.3 Mt.
Total estimated operating costs of $726 million for the Fazenda LOM plan (2024 to 2033) are summarized in Table 21-5. As for operating costs estimates, the exchange rate used was R$5.00:US$1.00 in 2024 and 2025, and R$4.80:US$1.00 for the remaining LOM. Note that underground mining is scheduled to finish in 2028; hence the LOM operating costs decrease accordingly.
Table 21-5: LOM Projected Total Operating Costs
Activity | 2024
($ M) | 2025
($ M) | 2026
($ M) | 2027
($ M) | 2028 & Beyond
($ M) | Total
($ M) |
Open Pit Mining | 6.437 | 19.018 | 32.283 | 27.547 | 167.358 | 252.643 |
Underground Mining | 20.968 | 40.911 | 34.609 | 23.591 | 6.926 | 127.006 |
Milling | 8.221 | 22.464 | 22.464 | 22.464 | 129.688 | 205.301 |
G&A | 5.639 | 15.408 | 15.408 | 15.408 | 88.953 | 140.816 |
Total | 41.266 | 97.802 | 104.764 | 89.009 | 392.925 | 725.766 |
Notes: Totals may not sum precisely due to rounding.
2024 represents only 6 months (July to December).
Projected unit-operating costs for the envisaged mill feed are shown in Table 21-6. The LOM plan estimated unit-operating cost averages $55.15/t milled. Operating cost estimates are based on planned operating metrics and recent actual results.
Table 21-6: LOM Projected Unit Operating Costs
Activity | 2024
($/t milled) | 2025
($/t milled) | 2026
($/t milled) | 2027
($/t milled) | 2028 & Beyond
($/t milled) | Average
($/t milled) |
Open Pit Mining | 12.21 | 13.21 | 22.42 | 19.13 | 20.13 | 19.20 |
Underground Mining | 39.79 | 28.41 | 24.03 | 16.38 | 0.83 | 9.65 |
Milling | 15.60 | 15.60 | 15.60 | 15.60 | 15.60 | 15.60 |
G&A | 10.70 | 10.70 | 10.70 | 10.70 | 10.70 | 10.70 |
Total | 78.30 | 67.92 | 72.75 | 61.81 | 47.26 | 55.15 |
Notes: Totals may not sum precisely due to rounding.
2024 represents only 6 months (July to December).
21.3 Workforce
The total FBDM workforce in June 2024 included 794 direct employees and 942 employees from contractors.
22 Economic Analysis
Regulations exempt producing issuers from the requirement to disclose an economic analysis on properties currently in production-unless the technical report prepared by the issuer includes a material expansion of current production. Equinox Gold is a producing issuer, the Fazenda mine is in production, and a material expansion is not included in the Fazenda LOM plan. AMC has performed an economic analysis using the Mineral Reserves and LOM Plan presented in this report and confirms that the outcome is a positive cash flow that supports the statement of Mineral Reserves.
23 Adjacent Properties
There are no adjacent properties relevant to FBDM properties. Equinox Gold's Santa Luz mine is approximately 70 km from Fazenda.
24 Other Relevant Data and Information
To the best of the QP's knowledge and information, this Technical Report contains all scientific and technical information that is required to be disclosed to ensure that the technical report is not misleading.
25 Interpretation and Conclusions
Based on the site-visit findings, review of mine documentation, and discussions with FBDM personnel, the QPs provide the following conclusions about the Fazenda mine.
25.1 Geology and Mineral Resources
Mineral Resources were prepared following CIM Definition Standards (CIM, 2014).
The geological model generated by Equinox Gold geologists is reasonably well understood and is well supported by field observations in outcrops, mine facing, and drill intersections.
Interpretations of the geology and the 3-D wireframes of the estimation domains derived from these interpretations are reasonable.
Sampling and assaying have been carried out following standard industry QA/QC practices. These practices include, but are not limited to sampling, assaying, sample chain- of-custody, sample storage, the use of third-party laboratories for interlaboratory checks, and using standards, blanks, and duplicates.
The Mineral Resource model has been prepared using appropriate method and assumptions. These parameters include:
- Capping of high assays
- Compositing length
- Search parameters
- Bulk density
- Grade-estimate validation
- Cut-off grade
- Classification.
- The block model has been validated using a reasonable level of rigour consistent with common industry practice.
Mineral Resources for Fazenda comply with all disclosure requirements for Mineral Resources as set out in NI 43-101.
The distribution and grade of Mineral Resources warrants significant infill drilling, as a large proportion of Mineral Resources is likely to convert to Mineral Reserves. According to FBDM geologists, this program is already underway.
25.2 Mining and Mineral Reserves
- The mining methods used at Fazenda include both conventional open pit mining and underground mechanized open stoping. These methods are appropriate for the deposit.
- As of June 30, 2024, Proven and Probable Mineral Reserves for the mine total 13.2 Mt grading 1.80 g/t Au, containing 763 koz Au, including stockpile.
- The mill feed is projected to be 18% from underground and 82% from open pits over the LOM.
Four separate declines originate on surface and access the various underground orebodies over a strike length of several kilometres.
The underground workings have good ground conditions that generally do not require any special support or backfill to ensure stable openings.
The LOM mining and processing schedules are based on Mineral Reserves only.
The main outcomes of the LOM schedule are:
- Mining operations and processing LOM is 9.5 years.
- Underground operations finish in 2028. Open pit operations finish in 2033.
- Total annual ex-pit material movement peaks at approximately 16.5 Mt/a.
- Gold metal recovered averages approximately 75 koz/a over the LOM.
- Long-term stockpile capacity is 140 kt, with the majority made up of the lowest-grade material, which is fed to the plant at the end of the mine life.
- The MREs have been prepared using appropriate method and assumptions, including consideration of:
- Dilution
- Mining extraction
- Ground conditions
- Access development
- Stope design
- Extraction sequence
- Productivities
- Personnel and equipment requirements
- Operating costs
- Sustaining capital costs
- Mine closure costs (only for open pits).
- Mineral Reserves have been estimated in an appropriate manner using current mining software, procedures consistent with reasonable practice, and in accordance with CIM Definition Standards (CIM, 2014).
25.3 Metallurgical Testing and Processing
One of the main production constraints for Fazenda has been frequent power outages from the grid supplier, COELBA, making it necessary to install diesel generator sets to keep the agitators operating to avoid settlings inside the leaching tanks.
Fazenda operates at P80 80 µm, a feed rate of 168 t/h, and recovering around 90% on average after a series of process improvements were implemented in 2019 and 2020. Every year, the process had been improved to extract and recover more gold as the feed grade decreases due to more carbonaceous matter and sulphides being fed to the process plant every year.
To mitigate gold losses, the following actions took place:
- With more carbonaceous ore in the blend, testwork was carried out using kerosene, which increased gold recovery by approximately 2%.
- With higher sulphides in the blend composition, testwork used lead nitrate, which proved to be efficient at accelerating gold dissolution in the leaching, as evidenced by a cyanide consumption decrease of approximately 10% and an increase in gold recovery of approximately 2%.
- The pH was adjusted to 10.2 to increase the lead nitrate effectiveness, which reduced cyanide consumption by approximately 10% and increased gold recovery by approximately 2%.
The regeneration kiln was deteriorating, and therefore not able to regenerate the total carbon in the circuit. A process study investigated the activity of regenerated carbon, which is 25% on average, and which affected the performance of gold adsorption. A new regeneration kiln with a capacity of 500 kg/h was installed in 2021.
The old CVRD heap leaching waste dumps show potential for mining in the future, with 3 Mt of oxidized ore at an estimated average grade of 0.6 g/t Au. Several testwork programs have been carried out, which resulted in gold recoveries higher than 70%. A heap leaching pilot pad test has been planned to confirm gold recovery at a larger scale.
- The plant facility requires refurbishments as well as routine maintenance. The structural steel in the grinding, leaching, and acid wash circuits are showing significant deterioration due to corrosion. Maintenance work includes replacing the structural steel periodically and over several years during ongoing operations.
25.4 Infrastructure
Fazenda has been operational for 40 years and has all the necessary roads, power lines, access, medical facilities, and surrounding communities to provide workers and services that one would expect to find for one of Bahia State's major employers.
A series of wellfields supply water with a total production capacity of 310 m3/h.
- The power requirement for the Fazenda operation and site facilities is approximately 9.95 MW, which is supplied by the local grid.
25.5 Environmental, Social, and Permitting Considerations
Fazenda has a comprehensive environmental policy, partially inherited from the Yamana and CVRD operations. This policy has been developed according to the MCP, as outlined by the relevant authority. In 2018, an external consulting firm, Mineral Engenharia e Meio Ambiente, prepared the MCP for Fazenda. The environmental authorities in Brazil use the MCP as a commitment to complete the rehabilitation required for mine closure.
Fazenda is an established gold mine with 40 years of history and in good corporate standing with the Brazilian and Bahia State government regulatory agencies. All required environmental licences and permits to conduct the work on the property are in good standing or are currently being obtained.
In 2012, Fazenda carried out a detailed ARD evaluation of the tailings. A total of 57 samples of tailings was collected from the three existing tailings facilities at that time, and analytical results showed that almost 100% of samples presented a neutralization potential two times higher than the acid-generating potential.
The arsenopyrite and pyrrhotite in the tailings facilities have low potential to become future ARD generators, as the proportion of carbonates is well in excess of the amount of the sulphides. These results make it possible to conclude that ARD generation will not be a significant risk for the Fazenda operation and closure.
FBDM staff and consultants developed a field procedure to test different tailings covers that could effectively prevent surface water and precipitation from having contact with the tailings. Since 2013, ongoing tests of these barriers have been performed; the results have consistently shown that a cover layer with 30 cm of oxide material from an exhausted heap leach pad combined with a capillary break layer of 15 cm is sufficient to prevent the infiltration of water through the cover and into the tailings.
FBDM staff have developed an exemplary and credible program for social and community involvement in the area of the mine's operations, which should be maintained for the LOM.
- The main socioeconomic impacts that the Fazenda mine closure will generate include unemployment, decreased tax revenues, the end of demand for local and regional suppliers, reduction in personal income, and the end of projects with the local communities. FBDM staff have developed mitigation measures for some of these impacts.
25.6 Capital and Operating Costs
- The LOM plan capital cost estimate includes sustaining capital cost, non-sustaining capital cost, and closure and reclamation costs. The capital cost of these activities is estimated to total $199 million and is based on an exchange rate of R$5.00:US$1.00 in 2024 and 2025, and R$4.80:US$1.00 for the remaining LOM.
- LOM plan operating costs are estimated to total $726 million, which averages $55.15/t milled.
26 Recommendations
The QPs make the following recommendations, the costs of which are anticipated to be covered as part of normal operating at Fazenda.
26.1 Mineral Resource Estimate
- Based on the distribution and grade of the Mineral Resources and on the geological continuity, significant exploration potential exists, which includes both open pit and underground near-mine conversion of Mineral Resources to Mineral Reserves, and addition of new Mineral Resources. Infill and step-out drill programs should be performed.
Refine the mineralized wireframes: enhance the quality of the mineralized wireframes for the Canto and CLX zones by subdividing these zones into stationary sub-domains. This approach will help to better capture the geological variability within each mineralized zone and improve the overall accuracy of the MRE.
Improve wireframe definition: refine the wireframes by separating the roof and ceiling of each mineralized domain. This separation is essential for accurately computing an LVA field, allowing for a more precise modelling of the mineralization's spatial distribution and directional variability.
Enhance high-grade zone modelling: focus on improving the modelling of high-grade zones to better constrain the influence of high-grade assays. This will help to reduce smoothing effects and improve the definition of high-grade domains, ensuring that the MRE better reflects the localized variations in grade.
Apply non-linear geostatistics: implement non-linear geostatistical methods such as local uniform conditioning (LUC) to capture fine-scale grade variability. LUC is particularly useful in regions with sparse drilling data, where traditional kriging methods may overlook local variability. This approach will provide a more accurate MRE, especially for smaller blocks, by conditioning the model to the local data distribution.
Implement QA/QC for density analyses: develop and implement a robust QA/QC process for density analysis to ensure the accuracy and consistency of density measurements used in the Mineral Resource estimation, which is critical for accurate tonnage calculations.
- Enhance QA/QC procedures for assay data: strengthen the current QA/QC procedures for internal and external laboratories involved in assay analysis. This will entail refining protocols for sample handling, analysis, and data validation, improving the reliability of assay results and minimizing analytical errors.
26.2 Mining and Mineral Reserves
- FBDM should consider the opportunities for and potential impact of expanding the open pit extents. The Technical Report used a $1,500/oz gold price for open pit Mineral Reserves, while recent price levels have been much higher; the prevailing price at the time of this Technical Report is approximately $2,600/oz. The Whittle optimal pit analysis shows that the pit size is very susceptible to metal price. Current price levels would support pits more than twice as large as those used in the Technical Report. Additionally, placing infrastructure in the footprint of potential pit expansions should be carefully assessed.
FBDM should consider the potential impact of increasing the gold price used for Mineral Reserve calculation. Some Mineral Resources are prevented from converting to Mineral Reserves due to the distance from existing underground infrastructure and the associated cost of development. The Technical Report used a $1,800/oz gold price for underground Mineral Reserves, however; the prevailing price at the time of this Technical Report is approximately $2,600/oz. Increasing the gold price for Mineral Reserves may allow for conversion of Mineral Resources to Mineral Reserves.
Pit designs are preliminary, and further detailing is needed to obtain optimal and most-practically viable designs.
Scheduling has been done to an annual level. Further refinements are needed to obtain more comprehensive and accurate mine plans. Greater detail on equipment and labour requirements, and on productivities, would enhance accuracy and ensure fulfillment of the study estimates.
The ongoing geotechnical program should be continued to collect additional data for pit-wall angle stability analysis in open pits P&R, FW, and BRSW.
Further investigation should be undertaken on how to best deal with extensive underground voids, e.g., advance pilot drilling to delineate voids and potential backfill of areas. The assessment should also reference and review working procedures to minimize any operational or safety risk associated with interaction between open pit and underground workings.
A hydrogeological drilling program is needed to confirm hydraulic properties and investigate drill targets, and to facilitate groundwater modelling to assess and optimize the location and timing of dewatering bores and horizontal drain holes.
Continue evaluating of areas that were excluded from Mineral Reserves due to restricted access, proximity to infrastructure, and economic considerations.
- Investigate the suitability of applying paste backfill with cement to recover the pillars in high-grade zones.
26.3 Metallurgical Testwork and Mineral Processing
Undertake a long-term geometallurgical study to develop a process route to mitigate the impact of high-TOC and high-sulphide ores in the plant recovery.
Carry out work-index testwork to arrive at necessary changes in the grinding circuit to maintain plant throughput and optimum gold recovery.
Analyze sulphur and arsenic chemistry of the leaching feed samples to better predict the necessary process changes for reagent additions.
Analyze the particle-size distribution of the blasted ore to improve the crushing-circuit product, which impacts the comminution-circuit final product reporting to the leaching circuit.
- Continue maintenance work at the plant, including refurbishing equipment and structures.
26.4 Infrastructure
In respect of providing services, ensure that interactions between the open pit and the continuation of the underground mining activities are effectively monitored and managed, as some of the portals will be taken out of service.
Regarding underground mine ventilation, re-evaluate the circuit and the Ventsim model to determine which entries will be lost when the pit breaks into underground openings, where stoppings need to be installed, and any other measures that may be required to maintain an appropriate and regulatory-compliant ventilation circuit underground, and avoid uncontrolled air gains or losses.
With CLX pits impacting Portals C and D, and breaking into the declines, stopes, and access drifts, changes to the mine's emergency warning system will be needed to mitigate the impact of any inrush of water during a major rainfall. Re-evaluating the current emergency procedures and introducing an advance-warning system to alert of any impending meteorological event in the mine vicinity.
A study is needed to determine requirements for installing water-control barriers with drainage holes to prevent a sudden inundation of the workings during a major rain event. A key aspect of the study would be determining which entries will be lost, and where stoppings need to be installed to offset risk of injury to workers and flooding of the underground openings.
Perform a trade-off study to compare the costs and scheduling of future expansions (dam raises) of TSF4 to store the LOM tailings as compared to building a new TSF downstream of TSF4.
26.5 Environmental, Social, and Permitting Considerations
- Complete studies and update the MCP for TSF1 and TSF2, as well as acid drainage studies, in accordance with the new LOM and to meet the ANM's requirements.
26.6 Capital and Operating Costs
- Quotes from multiple Brazilian mining contractors should be collected to firm up the mining cost estimates for the open pit operations in CLX, which anticipate using larger-scale equipment from 2027 onwards. Equinox Gold should acquire binding (or "firm") quotes from the primary mining contractor to achieve a higher level of estimation accuracy.
27 References
Alves da Silva, F. C., Chauvet, A., & Faure, M. (1998). General Features of the Gold Deposits in the Rio Itapicura Greenstone Belt (RIGB, NE Brazil, Discussion of the Origin Timing and Tectonic Model. Revista Brasileira de Geociências, 28, 377-390.
Araujo, F., Filho, H., Lipper, G., Torresini, C., & Cardoso, T. (2021). NI 43-101 Technical Report on the Fazenda Brasileiro Gold Mine, Bahia State, Brazil. Prepared by Equinox Gold Corp.
Chauvet, A., Silva, F. C., Faure, M., & Guerrot, C., (1997). Structural Evolution of the Paleoproterozoic Rio Itapicuru granite-greenstone belt (Bahia, Brazil): the role of synkinematic plutons in the regional tectonics. Precambrian Research, 84, 139-162.
Coffey Consultoria e Serviҫos Ltda. (2014, July 31). Independent Technical Report on Mineral Resources and Mineral Reserves in the Fazenda Gold Mine, Bahia State, Brazil. Prepared for Yamana Gold Inc.
Companhia Vale do Rio Doce (CVRD). (1985). Revista CVRD, Volume 06, Março de 1985. Teofilândia, Bahia, Brasil.
Leagold Mining Inc. (2018). Relatório de Análise Geomecânica, PowerPoint presentation of geotechnical analyses for mining in Inco fault zone in Fazenda.
Instituto de Tecnologia August Kekulé LTDA (ITAK). (2020, June). Relatório Técnico - RT 081/2020. Ensaio de Proficiência em Análises de Minério de Ouro.
Instituto de Tecnologia August Kekulé LTDA (ITAK). (2020, October). Relatório Técnico RT-202-2020 PEP. Ensaio de Proficiência em Análises de Minério de Ouro.
Mathisen, M., Miranda, H., Michaud, R., Hampton, P. (2018). Technical Report on the Fazenda Brasileiro Mine, Bahia State, Brazil. Prepared for Leagold Mining Corp. by Roscoe Postle Associates, Inc.
Mello, E., Xavier, R., McNaughton, N., Hagemann, S., Fletcher, I., & Snee, L. (2006). Age constraints on felsic intrusions, metamorphism and gold mineralisation in the Palaeoproterozoic Rio Itapicuru greenstone belt, NE Bahia State, Brazil. Mineralium Deposita, 40, 849-866.
Monte Lopes, C. A. (1982). Algumas Caracteristicas Geologicas e Geoquimicas das Mineralizacoes de Ouro na Area da Jazida da Fazenda Brasileiro - Bahia. Dissertacao de Mestrado, Instituto de Geosciencias, Universidade da Bahia, 95 p.
MCB Serviços e Mineração Ltda. (2011, January). Technical Report Mineral Resource and Mineral Reserve Estimate. Fazenda Gold Mine.
Michaud, R. L., Moore, C. M., & Hampton, A. P. (2015, August 21). Technical Report on the Fazenda Mine, Bahia State, Brazil. Prepared for Brio Gold Inc. by Roscoe Postle Associates Inc. (RPA).
Michaud, R. L., Moore, C. M., & Hampton, A. P. (2016, May 12). Technical Report on the Fazenda Mine, Bahia State, Brazil. Prepared for Brio Gold Inc. by Roscoe Postle Associates Inc. (RPA).
Michaud, R. L., Mathisen, M. B., Miranda, H. M., & Hampton, A. P. (2018, May 31). Technical Report on the Fazenda Mine, Bahia State, Brazil. Prepared for Leagold Inc. by Roscoe Postle Associates Inc. (RPA).
Reinhardt, M. C., & Davison, I. (1990). Structural and lithologic controls on gold deposition in the shear zone-hosted Fazenda Mine, Bahia State, northeast Brazil. Economic Geology, 85, 952-967.
SGS GEOSOL. (2024, May 23). Technical characterization for samples from Fazenda. Prepared for Equinox Gold Corp.-Fazenda.
Siddorn, J. (2023). Bahia Aeromagnetic Interpretation. Internal Report for Equinox Gold Corp.
Silva, M. G., Coelho, C. E. S., Teixeira, J. B. G., Silva, F. C. A., Silva, R. A., & Souza, J. A. B, (2001). The Rio Itapicuru greenstone belt, Bahia, Brazil: geologic evolution and review of gold mineralization. Mineralium Deposita, 36, 345-357.
Teixeira, J. B. G. (1985). Geologia e controles da mineralização aurífera em Fazenda Brasileiro, Serrinha-Bahia. Geologia e Recursos Minerais do Estado da Bahia, Textos Basicos, 6, 9-49.
Teixeira, J. B. G., Kishida, A., Marimon, M. P. C., Xavier, R. P., & McReath, I. (1990). The Fazenda Gold deposit, Bahia: Geology, hydrothermal alteration, and fluid inclusion studies. Economic Geology, 85, 990-1009.
Watts, Griffis and McOuat Limited (WGM). (2003, July). A Technical Review of the Fazenda Gold Mine and Adjacent Exploration Property in Bahia State, Brazil. Internal Report for Santa Elina Mines Corporation.
Xavier, R. P., & Foster, R. P. (1999). Fluid evolution and chemical controls in the Fazenda Maria Preta (FMP) gold deposit, Rio Itapicuru Greenstone Belt, Bahia, Brazil. Chemical Geology, 154(1-4), 133-154.
Yamana Gold Inc. (2015a). QA/QC Yamana Gold: Fazenda-MFB Mine-Brazil-Annual QA/QC Report-January 2015 to October 2015. Internal Report.
Yamana Gold Inc. (2015b). QA/QC Yamana Gold: Laboratório da Mineração Fazenda-MFB-Brasil, Relatório de QA/QC-Janeiro/2012 a Dezembro/2014. Internal Report.
Yamana Gold Inc. (2015c) QA/QC Yamana Gold: Fazenda-MFB Mine-Brazil-Annual QA/QC Report-January 2014 to December 2014. Internal Report.
28 Date and Signature Page
This report titled Technical Report on the Fazenda Gold Mine, Bahia State, Brazil, with an effective date of June 30, 2024, and dated January 31, 2025, was prepared and signed by the following authors:
January 31, 2025 | | Original Signed and Sealed |
Dated at Vancouver, British Columbia | | David Warren, P.Eng. AMC Mining Consultants Canada Ltd. |
| | | |
January 31, 2025 | | Original Signed and Sealed |
Dated at Vancouver, British Columbia | | Dominic Claridge, FAusIMM AMC Mining Consultants UK Ltd. |
| | | |
January 31, 2025 | | Original Signed and Sealed |
Dated at Vancouver, British Columbia | | João Paulo Santos, MAusIMM SAFF Engenharia |
| | | |
January 31, 2025 | | Original Signed and Sealed |
Dated at Vancouver, British Columbia | | Gabriel Freire, FAusIMM GEOTECH Consultoria e Projetos |
| | | |
January 31, 2025 | | Original Signed and Sealed |
Dated at Vancouver, British Columbia | | Benoit Poupeau, FAusIMM Trust Mineral Resources |
| | | |
January 31, 2025 | | Original Signed and Sealed |
Dated at Vancouver, British Columbia | | Mo Molavi, P.Eng. AMC Mining Consultants (Canada) Ltd. |
| | | |
January 31, 2025 | | Original Signed and Sealed |
Dated at Vancouver, British Columbia | | Paul Sterling, P.Eng. Equinox Gold Corp. |
| | | |
January 31, 2025 | | Original Signed and Sealed |
Dated at Vancouver, British Columbia | | Kelly Boychuk, P.Eng. Equinox Gold Corp. |
29 Certificate of Qualified Person
29.1 David Warren, P.Eng.
I, David Warren, P.Eng., as an author of this report titled Technical Report on the Fazenda Gold Mine, Bahia State, Brazil (the "Technical Report") with an effective date of June 30, 2024, prepared for Equinox Gold Corp. (the "Issuer") on January 31, 2025, do hereby certify that:
1. I am currently employed as a Principal Mining Engineer with AMC Mining Consultants (Canada) Ltd. with an office at 200 Granville Street, Suite 202, Vancouver, B.C., V6C 1S4, Canada.
2. I am a graduate of the University of British Columbia in Vancouver, Canada (Bachelor of Applied Science (in Mining and Metals Engineering in 1978) and Helsinki University of Technology in Helsinki, Finland (Master of Science in Technology in 1997). I am a member in good standing of the Engineers and Geoscientists of British Columbia (License #15053) and L'ordre des ingénieurs du Québec. I have 45 years of experience as a mining engineer primarily in the mining industry.
3. I have read the definition of "qualified person" set out in National Instrument 43-101
(NI 43-101) and certify that by reason of my education, affiliation with a professional association (as defined in NI 43--101) and past relevant work experience, I fulfill the requirements to be a "qualified person" for the purposes of NI 43-101.
4. I have visited the Fazenda mine on April 24 to 26, 2024.
5. I am responsible for Sections 15.1, 15.2 (except 15.2.1), 16.1.1 to 16.1.3, 16.1.5, 16.3, 21 (open pit aspects), and corresponding portions of 1, 24, 25, 26 and 27 of the Technical Report.
6. I am independent of the Issuer and related companies applying all of the tests in Section 1.5 of NI 43-101.
7. I have had no prior involvement with the property that is the subject of the Technical Report.
8. I have read NI 43-101, and the Technical Report has been prepared in compliance with
NI 43-101 and Form 43-101F1.
9. As of the effective date of the Technical Report and the date of this certificate, to the best of my knowledge, information and belief, this Technical Report contains all scientific and technical information that is required to be disclosed to make the Technical Report not misleading.
Effective Date: June 30, 2024
Signing Date: January 31, 2025
Original Signed and Sealed |
David Warren, P.Eng. |
29.2 Dominic Claridge, FAusIMM
I, Dominic Claridge, FAusIMM, as an author of this report titled Technical Report on the Fazenda Gold Mine, Bahia State, Brazil (the "Technical Report") with an effective date of June 30, 2024, prepared for Equinox Gold Corp. (the "Issuer") on January 31, 2025, do hereby certify that:
1. I am currently employed as a Principal Mining Engineer with AMC Mining Consultants (United Kingdom) Ltd. with an office at Office 336a, Davidson House, Forbury Square, Reading, Berkshire, RG1 3EU, United Kingdom.
2. I am a graduate of the University of Syndey in Sydney, Australia (Bachelor of Engineering in Mining in 1988). I am a fellow in good standing of the Australasian Institute of Mining and Metallurgy (FAusIMM) (Membership number # 101409). I have 35 years of experience as a mining engineer primarily in the mining industry.
3. I have read the definition of "qualified person" set out in National Instrument 43-101
(NI 43-101) and certify that by reason of my education, affiliation with a professional association (as defined in NI 43--101) and past relevant work experience, I fulfill the requirements to be a "qualified person" for the purposes of NI 43-101.
4. I have visited the Fazenda mine on April 24 to 26, 2024.
5. I am responsible for Sections 15.1, 15.3 (except for 15.3.1), 16.2.2 to 16.2.8, 16.2.10, 21 (underground aspects) and corresponding portions of 1, 24, 25, 26, and 27 of the Technical Report.
6. I am independent of the Issuer and related companies applying all of the tests in Section 1.5 of NI 43-101.
7. I have not had prior involvement with the property that is the subject of the Technical Report.
8. I have read NI 43-101, and the Technical Report has been prepared in compliance with
NI 43-101 and Form 43-101F1.
9. As of the effective date of the Technical Report and the date of this certificate, to the best of my knowledge, information and belief, this Technical Report contains all scientific and technical information that is required to be disclosed to make the Technical Report not misleading.
Effective Date: June 30, 2024
Signing Date: January 31, 2025
Original Signed and Sealed |
Dominic Claridge, FAusIMM |
29.3 João Paulo Santos, MAusIMM
I, João Paulo Santos, MAusIMM, as an author of this report titled Technical Report on the Fazenda Gold Mine, Bahia State, Brazil (the "Technical Report") with an effective date of June 30, 2024, prepared for Equinox Gold Corp. (the "Issuer") on January 31, 2025, do hereby certify that:
1. I am currently employed as Managing Partner-Geotechnics and Mining with SAFF Engenharia with an office at Avenida Raja Gabáglia, 1492, Sala 1107, Gutierrez, Belo Horizonte, Minas Gerais, Brazil.
2. I am a graduate of the Minas Gerais Federal University in Mining Engineering, Brazil (bachelor's degree in mining engineering in 2011), post-graduate courses in Geotechnical Engineering, Brazil (2015), Project Management, Brazil (2016) and master's degree at University of Glasgow, Scotland (Master of Civil Engineering & Management in 2018). I am a member in good standing of the of the Australasian Institute of Mining and Metallurgy (MAusIMM) (Membership #337652). I have 14 years of experience as a civil and geotechnical engineer primarily in the mining industry.
3. I have read the definition of "qualified person" set out in National Instrument 43-101
(NI 43-101) and certify that by reason of my education, affiliation with a professional association (as defined in NI 43-101) and past relevant work experience, I fulfill the requirements to be a "qualified person" for the purposes of NI 43-101.
4. I have visited the Fazenda mine on April 24 to 26, 2024.
5. I am responsible for Section 16.1.4 and corresponding portions of 1, 24, 25, 26, and 27 of the Technical Report.
6. I am independent of the Issuer and related companies applying all of the tests in Section 1.5 of
NI 43-101.
7. I have had prior involvement with the property that is the subject of the Technical Report with geotechnical aspects of open pit mining.
8. I have read NI 43-101, and the Technical Report has been prepared in compliance with
NI 43-101 and Form 43-101F1.
9. As of the effective date of the Technical Report and the date of this certificate, to the best of my knowledge, information and belief, this Technical Report contains all scientific and technical information that is required to be disclosed to make the Technical Report not misleading.
Effective Date: June 30, 2024
Signing Date: January 31, 2025
Original Signed and Sealed |
João Paulo Santos, MAusIMM |
29.4 Gabriel Freire, FAusIMM
I, Gabriel Freire, FAusIMM, as an author of this report titled Technical Report on the Fazenda Gold Mine, Bahia State, Brazil (the "Technical Report") with an effective date of June 30, 2024, prepared for Equinox Gold Corp. (the "Issuer") on January 31, 2025, do hereby certify that:
1. I am currently employed as the Technical Director with GEOTECH Consultoria e Projetos Ltda. and GEOTECH Consulting and Projects LLC with an office at Rua Lincon, 157, bairro União, Belo Horizonte, Minas Gerais, Brazil and at 9650 Universal Boulevard, Orlando, Florida, USA, respectively.
2. I am a graduate of the Federal University of Minas Gerais in Belo Horizonte, Brazil (Bachelor of Geology in 2011). I am a member of the Regional Council of Engineering and Agronomy in Brazil (license number 140982870-0) and a fellow in good standing of the of the Australasian Institute of Mining and Metallurgy (FAusIMM) (Membership #3124376). I have 13 years of experience as a geotechnical geologist primarily in the mining industry.
3. I have read the definition of "qualified person" set out in National Instrument 43-101
(NI 43-101) and certify that by reason of my education, affiliation with a professional association (as defined in NI 43--101) and past relevant work experience, I fulfill the requirements to be a "qualified person" for the purposes of NI 43-101.
4. I have visited the Fazenda mine on April 24 to 26, 2024.
5. I am responsible for Section 16.2.1 and corresponding portions of 1, 24, 25, 26 and 27 of the Technical Report.
6. I am independent of the Issuer and related companies applying all of the tests in Section 1.5 of
NI 43-101.
7. I have had prior involvement with the property that is the subject of the Technical Report with geotechnical aspects of underground mining.
8. I have read NI 43-101, and the Technical Report has been prepared in compliance with
NI 43-101 and Form 43-101F1.
9. As of the effective date of the Technical Report and the date of this certificate, to the best of my knowledge, information and belief, this Technical Report contains all scientific and technical information that is required to be disclosed to make the Technical Report not misleading.
Effective Date: June 30, 2024
Signing Date: January 31, 2025
Original Signed and Sealed |
Gabriel Freire, FAusIMM |
29.5 Benoit Poupeau, FAusIMM
I, Benoit Poupeau, FAusIMM, as an author of this report titled Technical Report on the Fazenda Gold Mine, Bahia State, Brazil (the "Technical Report") with an effective date of June 30, 2024, prepared for Equinox Gold Corp. (the "Issuer") on January 31, 2025, do hereby certify that:
1. I am currently and independent consultant with Trust Mineral Resources with an office at 32 rue Falguière, 75015, France.
2. I hold a PhD from the University of Paris-East-Marne-La-Vallee in Paris, France. I am a fellow in good standing of the Australasian Institute of Mining and Metallurgy (Membership #311688). I have 17 years of experience as a geologist primarily in the mining industry.
3. I have read the definition of "qualified person" set out in National Instrument 43-101
(NI 43-101) and certify that by reason of my education, affiliation with a professional association (as defined in NI 43-101) and past relevant work experience, I fulfill the requirements to be a "qualified person" for the purposes of NI 43-101.
4. I have visited the Fazenda mine on November 13 to 16, 2023.
5. I am responsible for Sections 4, 5, 6, 7, 8, 9, 10, 11, 12, 14, 15.2.1, 15.3.1, 23 and corresponding portions of 1, 24, 25, 26 and 27 of the Technical Report.
6. I am independent of the Issuer and related companies applying all of the tests in Section 1.5 of the NI 43-101.
7. I have had prior involvement with the property that is the subject of the Technical Report.
8. I have read NI 43-101, and the Technical Report has been prepared in compliance with
NI 43-101 and Form 43-101F1.
9. As of the effective date of the Technical Report and the date of this certificate, to the best of my knowledge, information and belief, this Technical Report contains all scientific and technical information that is required to be disclosed to make the Technical Report not misleading.
Effective Date: June 30, 2024
Signing Date: January 31, 2025
Original Signed and Sealed |
Benoit Poupeau, FAusIMM |
29.6 Mo Molavi, P.Eng.
I, Mo Molavi, P.Eng., as an author of this report titled Technical Report on the Fazenda Gold Mine, Bahia State, Brazil (the "Technical Report") with an effective date of June 30, 2024, prepared for Equinox Gold Corp. (the "Issuer") on January 31, 2025, do hereby certify that:
1. I am currently employed as a Senior Principal Mining Engineer with AMC Mining Consultants (Canada) Ltd. with an office at Suite 202, 200 Granville Street, Vancouver, British Columbia,
V6C 1S4, Canada.
2. I am a graduate from Laurentian University in Sudbury, Canada (Bachelor of Engineering in 1979) and McGill University of Montreal, Canada (Master of Engineering in Rock Mechanics and Mining Methods in 1987). I am a registered member in good standing of the Association of Professional Engineers and Geoscientists of Saskatchewan (License #5646), the Engineers and Geoscientists British Columbia (License #37594), and a Member of the Canadian Institute of Mining, Metallurgy and Petroleum. I have worked as a Mining Engineer for a total of 45 years since my graduation from university and have relevant experience in project management, feasibility studies, and technical report preparations for mining projects.
3. I have read the definition of "qualified person" set out in National Instrument 43-101 (NI 43-101) and certify that by reason of my education, affiliation with a professional association (as defined in
NI 43-101) and past relevant work experience, I fulfill the requirements to be a "qualified person" for the purposes of NI 43-101.
4. I have not visited the Fazenda mine.
5. I am responsible for Sections 16.2.9, 16.2.11 to 16.2.14 and 18 (except for 18.8) and corresponding portions of 1, 24, 25, 26 and 27 of the Technical Report.
6. I am independent of the Issuer and related companies applying all of the tests in Section 1.5 of
NI 43-101.
7. I have not had prior involvement with the property that is the subject of the Technical Report.
8. I have read NI 43-101, and the Technical Report has been prepared in compliance with
NI 43-101 and Form 43-101F1.
9. As of the effective date of the Technical Report and the date of this certificate, to the best of my knowledge, information and belief, this Technical Report contains all scientific and technical information that is required to be disclosed to make the Technical Report not misleading.
Effective Date: June 30, 2024
Signing Date: January 31, 2025
Original Signed and Sealed |
Mo Molavi, P.Eng. |
29.7 Paul Sterling, P.Eng.
I, Paul Sterling, P.Eng., as an author of this report titled Technical Report on the Fazenda Gold Mine, Bahia State, Brazil (the "Technical Report") with an effective date of June 30, 2024, prepared for Equinox Gold Corp. (the "Issuer") on January 31, 2025, do hereby certify that:
1. I am currently employed as the Vice President-Processing and Metallurgy for Equinox Gold Corp. with a home office at 12812 Schaeffer Crescent, Summerland, British Columbia, V0H 1Z4, Canada.
2. I am a graduate of the University of British Columbia located in Vancouver, Canada (Bachelor of Applied Science in Chemical Engineering in 1984). I am a member in good standing of the Engineers and Geoscientists of British Columbia (License #18560). My Experience includes the following:
- 2023 to Present: Vice President of Processing and Metallurgy for Equinox Gold Corp., Vancouver, BC
- 2021 to 2023: Consulting Metallurgist to Imperial Metals Corporation, Vancouver, BC
- 2020 to 2023: Consulting Metallurgist to Equinox Gold Corp., Vancouver, BC
- 2017 to 2020: Consulting Metallurgist to Leagold Mining Corporation, Vancouver, BC
- 2016 to 2017: Consulting Metallurgist Northern Empire Inc., Vancouver, BC
- 2006 to 2016: Corporate Metallurgist-Imperial Metals Corp., Vancouver, BC
- 2001 to 2006: Consulting Metallurgical Engineer, Summerland, BC
- 1998 to 2001: Consulting Metallurgical Engineer, Reno, Nevada, USA
- 1993 to 1998: Kappes, Cassiday and Associates, Reno, Nevada, USA
3. I have read the definition of "qualified person" set out in National Instrument 43-101 (NI 43-101) and certify that by reason of my education, affiliation with a professional association (as defined in NI 43-101) and past relevant work experience, I fulfill the requirements to be a "qualified person" for the purposes of NI 43-101.
4. I have visited the Fazenda mine on April 24 to 26, 2024.
5. I am responsible for Sections 13 and 17 and corresponding portions of 1, 24, 25, 26, 27, 28 and 29 of the Technical Report.
6. I am not independent of the Issuer and related companies applying all of the tests in Section 1.5 of NI 43-101.
7. I have not had prior involvement with the property that is the subject of the Technical Report.
8. I have read NI 43-101, and the Technical Report has been prepared in compliance with
NI 43-101 and Form 43101F1.
9. As of the effective date of the Technical Report and the date of this certificate, to the best of my knowledge, information and belief, this Technical Report contains all scientific and technical information that is required to be disclosed to make the Technical Report not misleading.
Effective Date: June 30, 2024
Signing Date: January 31, 2025
Original Signed and Sealed |
Paul Sterling, P.Eng. |
29.8 Kelly Boychuk, P.Eng.
I, Kelly Boychuk, P.Eng., MBA, as an author of this report titled Technical Report on the Fazenda Gold Mine, Bahia State, Brazil (the "Technical Report") with an effective date of June 30, 2024, prepared for Equinox Gold Corp. (the "Issuer") on January 31, 2025, do hereby certify that:
1. I am currently employed as a Senior Vice President-Technical Services with Equinox Gold Corp. with an office at Suite 1501, 700 West Pender Street, Vancouver, BC, V6C 1G8, Canada.
2. I am a graduate of the University of British Columbia in Vancouver, Canada (Bachelor of Applied Science in Geological Engineering in 1990 and Master of Business Administration in 2002). I am a member in good standing of the Engineers and Geoscientists of British Columbia (License #109920). I have 35 years of experience as a geotechnical engineer primarily in the mining industry.
3. I have read the definition of "qualified person" set out in National Instrument 43-101
(NI 43-101) and certify that by reason of my education, affiliation with a professional association (as defined in NI 43-101) and past relevant work experience, I fulfill the requirements to be a "qualified person" for the purposes of NI 43-101.
4. I have visited the Fazenda mine on October 4 to 5, 2023.
5. I am responsible for Sections 2, 3, 18.8, 19, 20 and corresponding portions of 1, 24, 25, 26 and 27 of the Technical Report.
6. I am not independent of the Issuer and related companies applying all of the tests in Section 1.5 of NI 43-101.
7. I have had prior involvement with the property that is the subject of the Technical Report for the tailings storage facilities.
8. I have read NI 43-101, and the Technical Report has been prepared in compliance with NI 43-101 and Form 43-101F1.
9. As of the effective date of the Technical Report and the date of this certificate, to the best of my knowledge, information and belief, this Technical Report contains all scientific and technical information that is required to be disclosed to make the Technical Report not misleading.
Effective Date: June 30, 2024
Signing Date: January 31, 2025
Original Signed and Sealed |
Kelly Boychuk, P.Eng., MBA |