As filed with the United States Securities and Exchange Commission on September 7, 2022.
Registration
No. 333-_____
UNITED STATES
SECURITIES AND EXCHANGE COMMISSION
WASHINGTON, D.C. 20549
FORM
S-1
REGISTRATION STATEMENT
UNDER
THE SECURITIES ACT OF 1933
LINKBANCORP, Inc.
(Exact Name of Registrant as Specified in Its Charter)
Pennsylvania | 6022 | 82-5130531 | ||
(State or other jurisdiction of incorporation or organization) | (Primary Standard Industrial Classification Code Number) | (I.R.S. Employer Identification Number) |
3045 Market Street
Camp Hill, PA 17011
(855)
569-2265
(Address, Including Zip Code, and Telephone Number, Including Area Code, of Registrant’s Principal Executive Offices)
Andrew Samuel
Chief Executive Officer
LINKBANCORP, Inc.
3045 Market Street
Camp Hill, PA 17011
(855)
569-2265
(Address, Including Zip Code, and Telephone Number, Including Area Code, of Agent for Service)
Copies to: | ||
Benjamin M. Azoff, Esq. Gregory M. Sobczak, Esq. Luse Gorman, PC 5335 Wisconsin Avenue, N.W., Suite 780 Washington, D.C. 20015 (202) 274-2000 | James J. Barresi, Esq. Aaron A. Seamon, Esq. Squire Patton Boggs (US) LLP 221 E. Fourth Street, Suite 2900 Cincinnati, Ohio 45202 Telephone: (513) 361-1260 | |
Approximate date of commencement of proposed sale to the public:
If any of the securities being registered on this Form are to be offered on a delayed or continuous basis pursuant to Rule 415 under the Securities Act of 1933, check the following box: ☐
If this Form is filed to register additional shares for an offering pursuant to Rule 462(b) under the Securities Act, please check the following box and list the Securities Act registration statement number of the earlier effective registration statement for the same offering: ☐
If this Form is a post-effective amendment filed pursuant to Rule 462(c) under the Securities Act, check the following box and list the Securities Act registration statement number of the earlier effective registration statement for the same offering: ☐
If this Form is a post-effective amendment filed pursuant to Rule 462(d) under the Securities Act, check the following box and list the Securities Act registration statement number of the earlier effective registration statement for the same offering: ☐
Indicate by check mark whether the registrant is a large accelerated filer, an accelerated filer, a
non-accelerated
filer, a smaller reporting company, or an emerging growth company. See the definitions of “large accelerated filer,” “accelerated filer,” “smaller reporting company” and “emerging growth company” in Rule
12b-2
of the Exchange Act.
| Large accelerated filer | ☐ | Accelerated filer | ☐ | |||
Non-accelerated filer | ☒ | Smaller reporting company | ☒ | |||
| Emerging growth company | ☒ | |||||
If an emerging growth company, indicate by check mark if the registrant has elected not to use the extended transition period for complying with any new or revised financial accounting standards provided to Section 7(a)(2)(B) of the Securities Act. ☐
The registrant hereby amends this registration statement on such date or dates as may be necessary to delay its effective date until the registrant shall file a further amendment which specifically states that this registration statement shall thereafter become effective in accordance with Section 8(a) of the Securities Act of 1933 or until the registration statement shall become effective on such date as the Securities and Exchange Commission, acting pursuant to said Section 8(a), may determine.
The information in this preliminary prospectus is not complete and may be changed. We may not sell these securities until the Registration Statement filed with the Securities and Exchange Commission is effective. This preliminary prospectus is not an offer to sell nor does it seek an offer to buy these securities in any jurisdiction where the offer or sale is not permitted.
SUBJECT TO COMPLETION, DATED SEPTEMBER 7, 2022
PRELIMINARY PROSPECTUS
4,575,000 Shares

COMMON STOCK
This prospectus relates to the initial public offering of the common stock of LINKBANCORP, Inc., the holding company for The Gratz Bank, a Pennsylvania state-chartered commercial bank headquartered in Camp Hill, Pennsylvania.
We are offering 4,575,000 shares of common stock. Prior to this offering, shares of our common stock were quoted on the Pink Open Market operated by the OTC Markets Group, Inc., or the Pink Market, under the symbol “LNKB.” On September 6, 2022, the last reported sales price for shares of our common stock as reported on the Pink Market was $9.02 per share. We have applied to list our common stock on the Nasdaq Capital Market under the symbol “LNKB.”
We anticipate that the public offering price of our common stock will be between $8.00 and $9.50 per share.
We are an “emerging growth company” as defined in the Jumpstart Our Business Startups Act of 2012 and, as such, have elected to comply with certain reduced public company disclosure standards.
Investing in our common stock involves risk. See “Risk Factors” beginning on page 33 of this prospectus to read about factors you should consider before investing in our common stock.
Per Share | Total | |||||||
Public offering price | ||||||||
Underwriting discounts and commissions(1) | ||||||||
Proceeds to us, before expenses | ||||||||
| (1) | The offering of our common stock will be conducted on a firm commitment basis. See “Underwriting” for a description of all underwriting compensation payable and expense reimbursement in connection with this offering. |
The underwriters have an option to purchase up to an additional 686,250 shares from us at the public offering price, less the underwriting discount, within 30 days from the date of this prospectus.
Neither the Securities and Exchange Commission nor any state securities commission has approved or disapproved of these securities or passed upon the adequacy or accuracy of this prospectus. Any representation to the contrary is a criminal offense.
The shares of our common stock in this offering are not savings accounts, deposits or other obligations of any bank and are not insured or guaranteed by the Federal Deposit Insurance Corporation or any other governmental agency.
The underwriters expect to deliver the shares of our common stock against payment on or about , 2022, subject to customary closing conditions.
 |  |

The date of this prospectus is , 2022
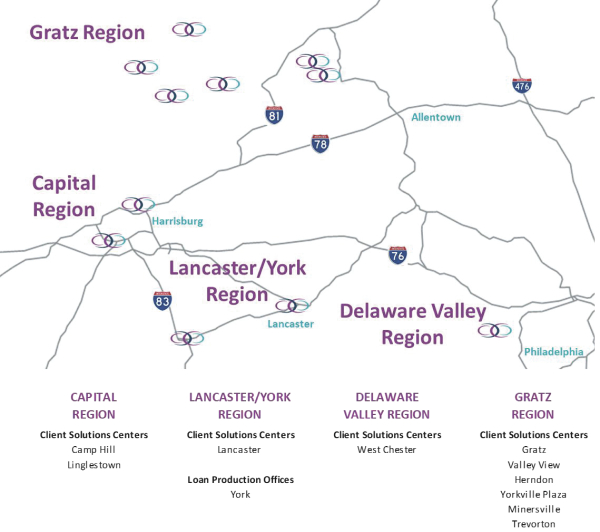
TABLE OF CONTENTS
| 1 | ||||
| 33 | ||||
| 55 | ||||
| 57 | ||||
| 58 | ||||
| 59 | ||||
| 61 | ||||
| 63 | ||||
| 64 | ||||
| 91 | ||||
| 109 | ||||
| 118 | ||||
| 124 | ||||
| 132 | ||||
| 134 | ||||
| 137 | ||||
| 140 | ||||
| 142 | ||||
| 146 | ||||
| 151 | ||||
| 152 | ||||
| 152 | ||||
| 152 | ||||
| F-1 |
About This Prospectus
You should rely only on the information contained in this prospectus or in any free writing prospectus that we authorize to be delivered to you. We and the underwriters have not authorized anyone to provide you with different or additional information. We and the underwriters are not making an offer of these securities in any jurisdiction where the offer is not permitted. You should not assume that the information contained in this prospectus is accurate as of any date other than the date on the front of this prospectus. Our business, financial condition, results of operations and prospects may have changed since that date.
Unless we state otherwise or the context otherwise requires, references in this prospectus to “we,” “our,” “us,” “LINKBANCORP” or “the Company” refer to LINKBANCORP, Inc., a Pennsylvania corporation, and its subsidiary The Gratz Bank, which we sometimes refer to as “the Bank” or “The Gratz Bank.”
Presentation of Information
Effective on September 18, 2021, the Company completed its previously announced acquisition of GNB Financial Services, Inc. (“GNBF”), pursuant to an Agreement and Plan of Merger, dated as of December 10, 2020 (the “Merger Agreement”), by and between the Company, LINKBANK, GNBF and The Gratz Bank. Under the terms of the Merger Agreement, GNBF merged with and into the Company, with the Company being the surviving entity, and LINKBANK merged with and into The Gratz Bank, with The Gratz Bank being the surviving entity. We refer to this transaction in this prospectus as the “Merger.” The Merger constituted a
i
business combination and was accounted for as a reverse acquisition using the acquisition method of accounting, in accordance with the provisions of FASB ASC 805 Business Combinations. As such, GNBF was the accounting acquirer and the Company was the accounting acquiree. LINKBANCORP issued 4.85 million common shares to GNBF shareholders which represented approximately 49.4% of the post-merger outstanding common shares of LINKBANCORP. We refer to the Company prior to the completion of the Merger in this prospectus as “Legacy LINKBANCORP.”
The following diagram illustrates the legal and accounting reorganization that occurred as a result of the Merger:
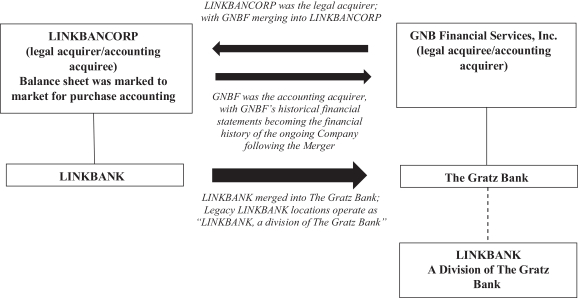
The Company’s financial statements and results of operations for the year ended December 31, 2021 and interim period through June 30, 2022, included in this prospectus, include the results of operations of the combined companies on and after the effective date of the Merger. Results for periods before the effective date of the Merger for the Company for the year ended December 31, 2020 reflect only the consolidated results of GNBF, and do not include the results of operations of Legacy LINKBANCORP before the completion of the Merger.
The Legacy LINKBANCORP financial statements and related financial results of operations for the years ended December 31, 2020 and December 31, 2019, and the interim period through June 30, 2021, included in this prospectus, reflect the results of operations of Legacy LINKBANCORP before the effective date of the Merger and do not include the results of GNBF before the completion of the Merger.
See below under “Summary — Summary Historical Consolidated Financial Data of the Company” and “— Summary Historical Consolidated Financial Data of Legacy LINKBANCORP” for additional information regarding the summary historical consolidated financial data as of the dates and for the periods shown with respect to the Company and Legacy LINKBANCORP, respectively.
This prospectus describes the specific details regarding this offering and the terms and conditions of our common stock being offered hereby and the risks of investing in our common stock. For additional information, please see the section entitled “Where You Can Find Additional Information.”
You should not interpret the contents of this prospectus or any free writing prospectus to be legal, business, investment or tax advice. You should consult with your own advisors for that type of advice and consult with them about the legal, tax, business, financial and other issues that you should consider before investing in our common stock.
ii
Unless otherwise stated, all information in this prospectus assumes that the underwriters have not exercised their option to purchase additional shares of common stock.
Until , 2022 (the 25th day after the date of this prospectus), all dealers that buy, sell or trade shares of our common stock, whether or not participating in this offering, may be required to deliver a prospectus. This delivery requirement is in addition to a dealer’s obligation to deliver a prospectus when acting as an underwriter and with respect to their unsold allotments or subscriptions.
Market and Industry Data
Within this prospectus, we reference certain market, industry and demographic data and other statistical information. We have obtained this data and information from various independent, third-party industry sources and publications. Nothing in the data or information used or derived from third party sources should be construed as advice. Some data and other information are also based on our good faith estimates, which are derived from our review of internal surveys and independent sources. We believe that these external sources and estimates are reliable, but have not independently verified them. Statements as to our market position are based on market data currently available to us. While we are not aware of any misstatements regarding the economic, employment, industry and other market data presented herein, our estimates involve risks and uncertainties and are subject to change based on various factors, including those discussed under the heading “Risk Factors” in this prospectus. In addition, forward-looking information obtained from these sources is subject to the same qualifications and the additional uncertainties regarding the other forward-looking statements in this prospectus. Trademarks used in this prospectus are the property of their respective owners, although for presentational convenience we may not use the
®
or the ™ symbols to identify such trademarks.Implications of Being an Emerging Growth Company
As a company with less than $1.07 billion in revenue during our last fiscal year, we qualify as an “emerging growth company” under the Jumpstart Our Business Startups Act of 2012, or the JOBS Act. An emerging growth company may take advantage of reduced reporting requirements and is relieved of certain other significant requirements that are otherwise generally applicable to public companies. As an emerging growth company:
| • | we may present as few as two years of audited financial statements and two years of related management discussion and analysis of financial condition and results of operations; |
| • | we are exempt from the requirement to obtain an attestation and report from our auditors on management’s assessment of our internal control over financial reporting under the Sarbanes-Oxley Act of 2002; |
| • | we are permitted to provide reduced disclosure regarding our executive compensation arrangements pursuant to the rules applicable to smaller reporting companies, which means we do not have to include a compensation discussion and analysis and certain other disclosures regarding our executive compensation; and |
| • | we are not required to hold non-binding advisory votes on executive compensation or golden parachute arrangements. |
In addition to the relief described above, the JOBS Act permits us an extended transition period for complying with new or revised accounting standards affecting public companies. We have irrevocably determined to take advantage of this extended transition period, which means that the financial statements included in this prospectus, as well as financial statements that we file in the future, may not be comparable to the financial statements of public companies that comply with such new or revised accounting standards on a non-delayed basis.
iii
In this prospectus we have elected to take advantage of the reduced disclosure requirements relating to executive compensation, and in the future we may take advantage of any or all of these exemptions for so long as we remain an emerging growth company. We will remain an emerging growth company until the earliest of (i) the end of the fiscal year during which we have total annual gross revenues of $1.07 billion or more, (ii) the end of the fiscal year following the fifth anniversary of the completion of this offering, (iii) the date on which we have, during the previous three-year period, issued more than $1.0 billion in non-convertible debt and (iv) the date on which we are deemed to be a “large accelerated filer” under the Securities Exchange Act of 1934, as amended.
iv
SUMMARY
This summary highlights selected information contained in greater detail elsewhere in this prospectus. This summary may not contain all of the information that you should consider before investing in our securities. You should carefully read this entire prospectus, including the sections entitled “Risk Factors” and “Management’s Discussion and Analysis of Financial Condition and Results of Operations” and our consolidated financial statements and the notes related thereto before making an investment decision. Some of the statements in this prospectus constitute forward-looking statements. See “Cautionary Note Regarding Forward-Looking Statements.”
Our Company
We are a Pennsylvania corporation headquartered in Camp Hill, Pennsylvania and formed in 2018 with a mission to positively impact lives through community banking. In October 2018, we completed the acquisition of Stonebridge Bank, which was subsequently named LINKBANK. In September 2021, LINKBANCORP and GNB Financial Services, Inc., or GNBF, completed a strategic combination, resulting in The Gratz Bank becoming our wholly owned subsidiary. We are a bank holding company registered under the Bank Holding Company Act of 1956, as amended, or the BHC Act. The Gratz Bank is a Pennsylvania state-chartered commercial bank offering personal and business lending and deposit services to individuals, families, nonprofit and business clients throughout Central and Southeastern Pennsylvania, primarily through our digital presence on the internet and 10 client solutions centers in Chester, Cumberland, Dauphin, Lancaster, Northumberland and Schuylkill Counties. In markets other than those serviced pre-Merger by The Gratz Bank, the Bank operates as “LINKBANK, a division of The Gratz Bank.” The Bank intends to legally change its name to LINKBANK in November 2022 to create one single brand, subject to the receipt of applicable regulatory approvals.
Our community banking strategy seeks to provide our customers with personal service, financial sophistication and the full array of product offerings of a larger regional bank, focusing on developing local lending relationships funded by the generation of local retail and business deposits. We believe our culture of highly engaged employees enhances productivity and results in lower employee turnover, ultimately, leading to greater operational efficiencies and customer loyalty. We differentiate ourselves based on high touch, relationship building service, supported by the convenience of technology. Our high touch level of service led us to change how we think about bank branches. We call our branches “solutions centers” because our personnel are all trained across our full product offerings so they can quickly and efficiently serve our customers’ needs for loan or deposit products. We are committed to increasing our market share in the communities we serve by continuing to leverage available technology, existing branch locations, and new branch locations, and by considering other strategic opportunities in both the markets we serve and the surrounding areas.
As of June 30, 2022, our consolidated assets, net loans, deposits and shareholders’ equity totaled $1.1 billion, $786.5 million, $902.4 million and $104.8 million, respectively.
As a bank holding company, we are subject to the supervision of the Board of Governors of the Federal Reserve System, or FRB. We are required to file with the FRB reports and other information regarding our business operations and the business operations of our subsidiaries. As a state-chartered commercial bank, The Gratz Bank is subject to primary supervision, periodic examination and regulation by the Pennsylvania Department of Banking and Securities, or PADOBS, and by the Federal Deposit Insurance Corporation, or FDIC, as its primary federal bank regulator.
1
Creating a Community Bank to Positively Impact its Community
 | LINKBANCORP was organized in 2018 with a mission to positively impact lives through community banking. Members of the founding management team and board of directors had worked together with multiple financial institutions of various sizes, primarily focused in Central and Southeastern Pennsylvania, over a period of more than 20 years. Informed by these experiences, the founders sought to establish an entrepreneurial and growth-oriented community bank that would leverage talented relationship bankers, coupled with emerging innovations in technology, to meet the needs of the local community. Rather than organize a de novo bank to facilitate these objectives, in October 2018 LINKBANCORP acquired and recapitalized Stonebridge Bank, a community bank primarily serving Chester County, Pennsylvania, in a transaction conducted under the U.S. Bankruptcy Code, funded with proceeds from a private placement of common stock to friends and family. At the time of the acquisition of Stonebridge Bank, it had $55.2 million in total assets and one branch office. Stonebridge Bank had been party to a consent order with the FDIC and the PADOBS at the time of the acquisition, which was successfully resolved by the Company’s management team, with the consent order terminated in February 2019. |
2
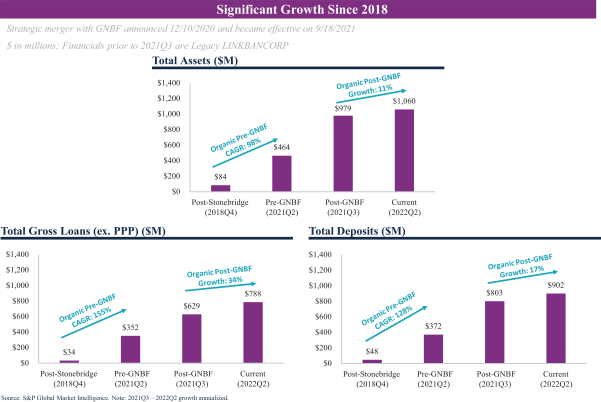
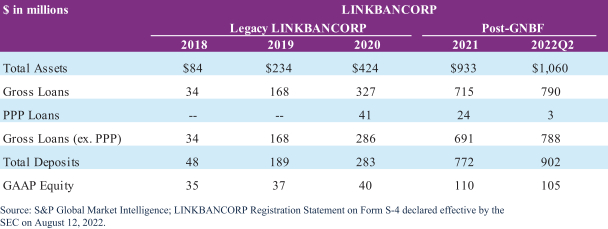
Following the acquisition and private placement, the Company adopted a strategic plan focused on providing differentiated consumer and commercial banking services to clients in the Central and Southeastern Pennsylvania markets. As a result, the Bank has grown its balance sheet significantly both through organic loan and deposit growth, as well as the opportunistic strategic merger with GNBF as described in this prospectus. The Company’s management team has leveraged their strong local community ties, extensive merger and acquisition experience and experience with the bank regulatory agencies to create an entrepreneurial and rapidly-growing bank supported by an advanced risk management infrastructure and strong credit quality. A summary of our growth in assets, deposits and loans is set forth below:
3
Our Key Accomplishments
The summary below highlights our recent business accomplishments and key milestones, commencing with the 2018 acquisition of Stonebridge Bank. The history below that occurred prior to the Merger is the history of Legacy LINKBANCORP and not GNBF:
| • | October 2018: |
| • | December 2018: |
| • | January 2019: |
| • | May – June 2019: |
| • | April – July 2020: |
| • | June 2020: |
| • | September – October 2020: |
| • | December 2020: |
| • | December 2020: |
| • | September 2021: |
| • | Executive management roles continue to be filled by the Legacy LINKBANCORP officers, including Andrew Samuel - CEO; Carl Lundblad - President; Brent Smith, President of The Gratz Bank; Kristofer Paul - CFO; and Tiffanie Horton - Chief Credit Officer. |
| • | Achieves critical mass in the Central Pennsylvania market. |
| • | Doubles the Company’s asset size and provides opportunity to capture economies of scale on both the revenue and cost sides. |
| • | Diversifies the loan portfolio and provides low cost, stable and highly granular retail deposits. |
| • | GNBF’s relatively low loan-to-deposit ratio prior to the Merger provides additional liquidity to fuel LINKBANCORP’s strong loan generation capabilities. |
| • | Significantly enhances the loan-to-one borrower limit with a doubling of regulatory capital. |
| • | December 2021: |
| • | January 2022: |
| • | January 2022: |
| • | February 2022: |
4
| • | April 2022: |
| • | April 2022 |
| • | May 2022 |
| • | June 2022: |
Our Mission & Business Strategy
Our mission is to positively impact lives by building the premier community bank franchise serving consumers and businesses in the Central and Southeastern Pennsylvania markets and the surrounding areas. We have a seasoned management team and have been able to attract experienced and long-tenured bankers with proven track records.
Although our executive management team has had success throughout the community bank industry since the early 2000’s, in building our business plan and go-to market strategy for LINKBANCORP, we knew that the traditional community bank model would need to be adjusted and enhanced to compete and win in the current environment. This shift in strategy had several tenants:
| • | Hire talented, entrepreneurial bankers with demonstrated track records. |
| • | Focus on profitable customer relationships and taking wallet share. |
| • | Operate with a branch-lite footprint. |
| • | �� | Leverage technology, digital banking and information systems. |
| • | Achieve economies of scale and increase operating leverage as we grow. |
The key ingredient to implementing this strategy is attracting and retaining top talent, which is driven by our culture and values that reflect authenticity and enthusiasm in all interactions. Blending a strong heritage of banking expertise with strong values, we are committed to providing compelling products, services, and financial consulting.
Branch-Lite Organic Growth Engine
Prior to completing our strategic merger with GNBF in 2021, we grew to over $450 million in total assets with only four branch offices. Our offices look and operate differently than branches of most of our competitors in the marketplace. Recognizing that client interactions continue to trend more toward digital transactions, our offices are designed to function as “client solutions centers,” many with no traditional teller line and staffed with just 3-4 full-time employees who are cross-trained to address a variety of client needs.
Our go-to market approach is focused on hiring experienced and talented bankers that operate as a team in a particular region, under the leadership of a regional president who has significant decision-making authority for both consumer and commercial banking, thereby providing clients with a level of access and responsiveness not available from most of our competitors. Client solutions centers are strategically placed in each regional market and serve as a “home base” for each team.
We have experienced great success utilizing this relationship-focus combined with regional leadership and decision-making in communities with strong local identities and a significant population of family-owned operating/manufacturing businesses.
5
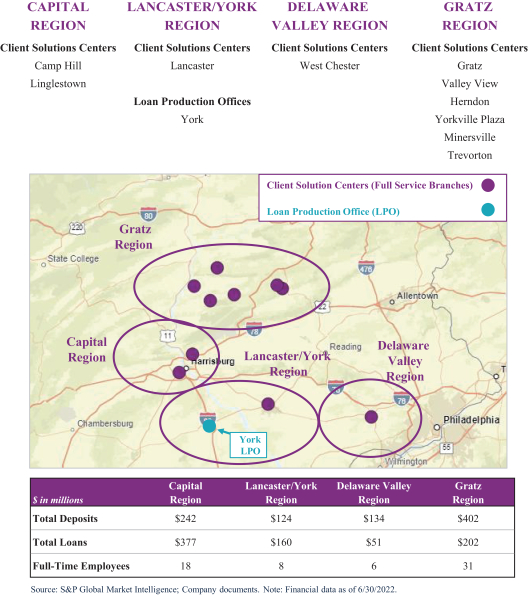
The de novo build out of our regional business development teams in the Capital, Lancaster/York and Delaware Valley Regions was supplemented with the strategic merger with GNBF, which forms the Gratz Region. Given the more rural demographics and long-tenured Gratz Bank customers, our strategy has been to continue operating those branches as they previously were with a focus on core deposit gathering in that region to fuel organic loan growth in our other regions.
Our community banking strategy is focused on high touch relationship management and exceptional service supported by technology, primarily directed toward three different areas:
| • | Personal Banking: Strategically placed client solutions centers leveraging our strong local community identity and complemented with digital banking solutions. |
| • | Business Banking: Focused on family-owned businesses with under $100 million in annual revenue. |
6
| • | Nonprofit Banking: Bank of choice for nonprofits, with strong individual and organizational engagement in the communities we serve. |
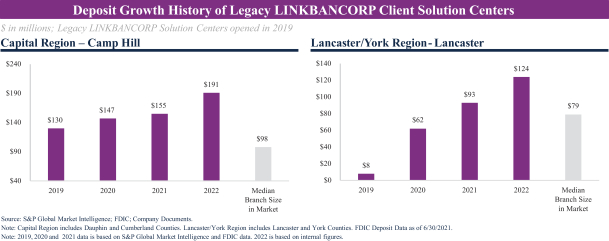
We seek to maintain an average of more than $100 million in deposits per office to support our “branch-lite” footprint and achieve desired efficiencies. Below is a summary of our deposit growth for our client solutions centers located in the Capital and Lancaster/York Regions. Both of these solutions centers have been open since 2019 and we believe best demonstrate our community bank strategy as described above. We also recently hired a business development team to focus on our relocated solutions center in the Delaware Valley Region, where we will continue to execute this strategy.
Through the GNBF Merger we inherited six branch offices, all of which remain open. The strategy for these legacy GNBF offices are different than our legacy LINKBANK client solutions centers, although we believe they provide a strong core funding base for our organic loan growth. As of June 30, 2022, our overall average branch size for offices open more than one year, was $94.6 million. While industry wide data for 2022 is not publicly available, we believe our average branch size of $85 million as of June 30, 2021 compares favorably to the $74 million average branch size in our markets of operation at June 30, 2021. | 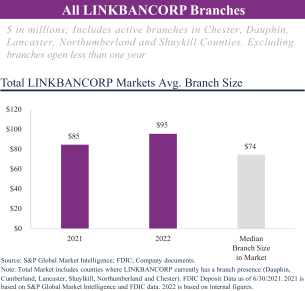 |
Nimble and Innovative Tech Forward Operating Platform
From its inception, the Company had a vision for entrepreneurial growth and innovation in technology. We knew that the traditional community bank operating model and philosophy would need to change and focus on technology that would support our branch-lite model as well as a more efficient operating and risk management
7
infrastructure. To accomplish this, we have sought to develop a platform that will achieve objectives of native mobility, modular architecture, open API and cloud-based infrastructure. Early investments in virtualization and cloud capabilities have successfully enabled partnering for technology services that facilitate a more efficient and integrated workflow while enhancing responsiveness and the overall client experience.
We also recognize that innovation is not possible without skilled technologists who understand the business of banking. In early 2022, we made a significant investment to recruit highly experienced professionals from community and regional financial services companies specifically skilled in the areas of data, digital banking, automation and process maturity. These business solutions architects, representing decades of combined banking operations and technology experience, are embedded and positioned in direct partnership with our business lines to accelerate service delivery and strategic advancements, shifting away from the typical community bank technology model of incremental improvements constrained by operational expense, toward a more nimble model where opportunities are identified and then promptly implemented for near-term impact.
Growth Strategy Focused in Sizeable Markets with Above Average Growth
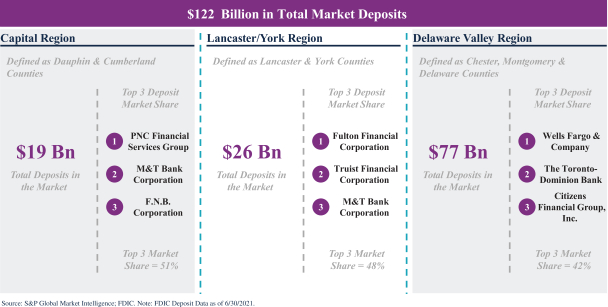
Our organic growth strategy is focused in the Capital, Lancaster and Delaware Valley Regions. Population growth in each of these counties well exceeds the Pennsylvania average:
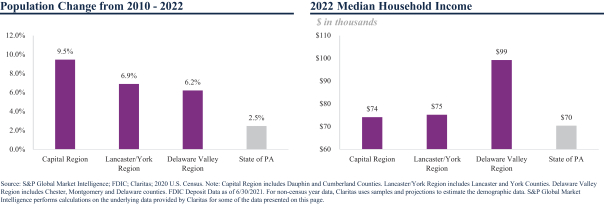
These three regions collectively have $122 billion in deposit balances (per June 30, 2021 FDIC data), which is more than 20% of the entire Commonwealth of Pennsylvania with $553 billion in deposit balances. This addressable market of $122 billion in deposit balances is 1.7x times larger than the Philadelphia County market which is the closest major metropolitan area. These markets are amongst the largest in Pennsylvania, have strong demographics and the competitive landscape is such that they are heavily banked by the large money center and regional banks.
8
Capitalizing on Market Disruption
Our market area has undergone significant consolidation, particularly in the last twelve months. We intend to take advantage of the recent disruption caused by mergers and acquisitions in our operating markets, which we believe has created an environment of underbanked customers and has created opportunities to hire seasoned
bankers. We have successfully employed this strategy in the past, hiring experienced bankers from merged institutions, which has helped us enhance critical aspects of our operations. We believe the most recent wave of consolidations, together with what we anticipate will be further consolidation, will create additional opportunities for us to attract additional experienced bankers. Below are some of the merger transactions announced and/or closed in and around our geographic footprint since 2017:
| • | First Commonwealth Corporation / Centric Financial Corporation |
| • | Fulton Financial Corporation / Prudential Bancorp, Inc. |
| • | Mid Penn Bancorp, Inc. / Riverview Financial Corporation |
| • | WSFS Financial Corporation / Bryn Mawr Bank Corporation |
| • | Citizens & Northern Corporation / Covenant Financial Inc. |
| • | S&T Bancorp, Inc. / DNB Financial Corporation |
| • | Citizens & Northern Corporation / Monument Bancorp, Inc. |
| • | WSFS Financial Corporation / Beneficial Bancorp, Inc. |
| • | Northwest Bancshares, Inc. / Donegal Financial Services Corp. |
Consistent with this strategy, we recently added teams of experienced bankers to supplement our efforts in both the York/Lancaster Region and the Delaware Valley Region. In each case, these “lift outs” involved well-respected lending teams that are familiar with these markets from regional financial institutions impacted by consolidation and other disruptions. In a short period of time, the investment in these teams has resulted in significant opportunities for new client relationships and increasing market share.
9

Opportunistic Mergers and Acquisitions Strategy
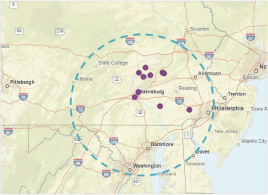
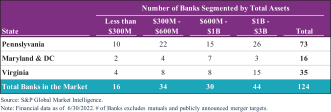
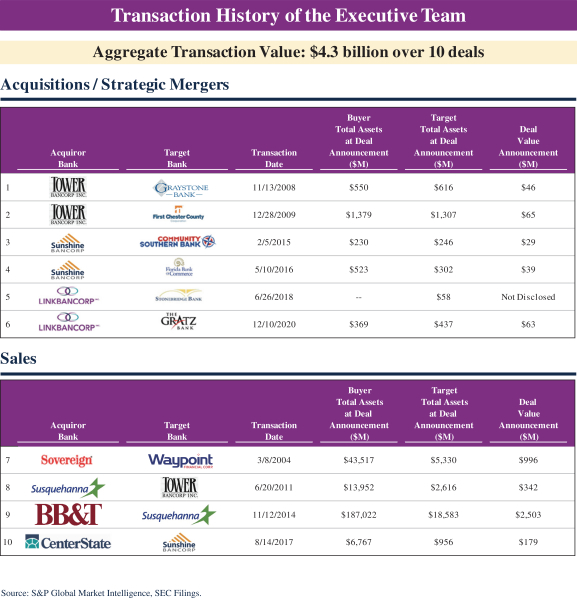
Our mergers and acquisitions strategy has been and will continue to be highly opportunistic. We will pursue strategic merger and acquisition opportunities, including whole bank and branch acquisitions, and non-bank acquisitions, that build long-term shareholder value. Our executive team has extensive experience in merger and acquisition integration with 10+ completed transactions since the early 2000s. The focus of our mergers and acquisitions strategy is to identify community banks open to a potential combination that are within a two-hour drive time radius or approximately 50-100 miles from our headquarters in Camp Hill, Pennsylvania. While the geographic radius of approximately 50-100 miles encapsulates many market areas, our focus is on acquiring banks operating outside of the major metropolitan markets. Throughout our history we have focused on the more suburban market areas that benefit from densely populated metropolitan markets. The most recent example of this is our business development opportunity in the Delaware Valley Region, which benefits from the growth and disruption in the Philadelphia metropolitan market. We also believe that the Maryland and northern Virginia marketplace offers potential growth opportunities. These markets have strong demographics and look and feel much like our existing markets. Our executive team actively develops relationships with community banks within these areas in order to explore such opportunities when the time is appropriate.
10
 |  |
We have disciplined acquisition criteria that any potential merger and acquisition transaction must meet:
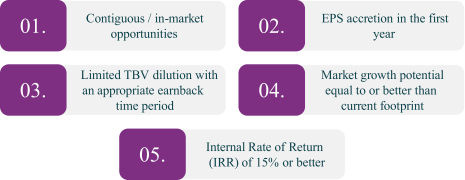
There may be highly strategic and compelling situations that arise which may not meet all five of the criteria listed above; these situations are likely very unique and rare and will be fully vetted by the LINKBANCORP Board and Management team before pursuing such a transaction. We would only pursue a nonconforming transaction if we believed the risk-adjusted return and shareholder value creation potential was well in-excess of other strategic initiatives.
Our Competitive Strengths
We believe the following strengths differentiate us from our competitors and position us to execute our business strategy successfully:
Seasoned Executive Team with Value Creation Track Record
Our seasoned executive management team, which is led by our Chief Executive Officer, Andrew Samuel, has significant experience and success with building, operating, and creating shareholder value at numerous banking institutions.
This management team has long tenure together in our markets, providing a familiarity with each other and with the marketplace that is unique among our competitors. Executives are highly engaged in business development and community engagement initiatives and are able to attract and recruit top talent due to a reputation for developing high performing and successful teams.
11

Differentiated Brand and Culture
We believe our corporate culture is a differentiating factor in our demonstrated growth and ability to gain market share. Central to our culture and brand are our core “L-I-N-K” values which support our mission of positively impacting lives.

In our brief history, we have intentionally nurtured this culture to support development of a well-defined internal and external brand reflecting a purpose-driven, entrepreneurial and relational organization that is highly responsive to client needs and our communities and attracts best-in-class bank professionals.
This culture starts with our mission to positively impact lives through community banking. In pursuing this mission, we invest in the development of strong future leaders for the banking industry and our communities,
12
contribute to economically and socially flourishing communities, and seek to demonstrate the continued viability and integral role of community banking for our economic and social development. As one example of these efforts, we launched and continue to support The LINK Foundation, established as a separate legal entity and governed by a distinct board of trustees, but fully aligned with our mission. The LINK Foundation provides financial support to organizations within our markets focused on three funding priorities—developing future leaders, promoting financial literacy and fortifying personal growth.
Our culture and brand are significantly dependent on highly engaged employees, so we are intentionally committed to investing in the development of our employees. Under the leadership of our Chief Culture Officer, we offer our employees hands-on leadership training, performance management and professional development training, monthly sessions focused on our core values, fun celebration and team-building events and time dedicated to participating in community volunteer opportunities. In recognition of these initiatives, we have been recognized regionally and nationally within the banking industry as a best place to work. We believe our culture of highly engaged employees committed to a common purpose enhances productivity and results in lower employee turnover, leading to greater operational efficiencies, a consistent brand experience and customer loyalty.
Significant Experience in Acquiring and Integrating Banks
Our executive team has a long-term track record and significant experience with acquiring and integrating community bank acquisitions as well as executing on sales and strategic mergers. Our executive team, including experience at prior institutions, has successfully closed on and integrated six whole bank transactions (acquisitions or strategic mergers) and numerous branch acquisitions. In September 2021, we closed the GNBF strategic merger and have successfully grown the GNBF deposit franchise. As anticipated, the GNBF strategic merger has provided an attractive core funding base that has helped fund our commercial loan growth in the Capital, Lancaster/York, and Delaware Valley markets. We successfully completed the systems integration with GNBF in October 2021 which was only one month after closing. While we are confident in our organic growth prospects, we intend to pursue prudent and commercially attractive acquisitions that will position us to further capitalize on market opportunities and help us continue to improve our platform’s operating leverage.
13
Disciplined Underwriting and Robust Enterprise Risk Management
Our holistic approach to risk management has been an asset that supports our growth strategies. Our enterprise risk management program follows a “three lines of defense” structure and is designed to permeate across all functional areas. From our inception, we placed a very high priority on establishing an effective risk management culture, including appointing a Board-level Enterprise Risk Management Committee which reviews information each quarter regarding exposure to strategic risk, reputation risk, credit risk, market risk, liquidity risk, legal and regulatory compliance risk, operations and technology (including cybersecurity) risk, as well as the Company’s strategies to monitor, control and mitigate these risks. The Company’s Chief Risk Officer and officer-level Management Enterprise Risk Committee meets quarterly to review and discuss existing and emerging risks, including key risk indicators (KRIs) that are tracked and monitored regularly, and serve as a primary avenue for escalation and reporting to the Board’s Enterprise Risk Management Committee.
14
We understand that credit is one of the most critical risks for any financial institution. As a result of our disciplined underwriting standards and procedures, we have achieved significant balance sheet growth while maintaining superior credit quality. Our nonperforming assets to total assets ratio was 0.14% as of June 30, 2022 and our allowance represented 260.4% of our nonperforming loans as of June 30, 2022.
Our credit culture is guided by the following principles:
| • | Focus on relationship lending, in many cases with clients that our relationship managers and executive management team have known for decades; |
| • | Development of underwriting and credit risk management processes tailored to each of our products and regions; |
| • | Centralized credit oversight and segregated reporting of credit and lending teams; |
| • | Utilization of regional credit officers with specific lending authority, allowing for localized analysis and decision making and faster turnaround time; |
| • | Commitment to maintaining a diverse portfolio; |
| • | Sophisticated monitoring and analysis of our portfolio and establishment of sub-portfolio limits that we review regularly and adjust in response to changes in our lending strategy and market conditions; and |
| • | Proactive problem asset management. |
Although we maintain a cautious credit outlook due to continued uncertainty in the current economic environment, we believe we are well positioned for the months ahead given a strong loan reserve, application of prudent underwriting standards and a diverse loan portfolio with no significant concentrations. We also expect a rising interest rate environment to be a positive given that our portfolio is more heavily weighted toward variable and adjustable-rate loans.
Recent Developments
On August 18, 2022, we declared a quarterly dividend of $0.075 per share of common stock for the second quarter of 2022. This dividend is payable to shareholders of record at the close of business on August 31, 2022, payable on September 15, 2022. Investors in this offering are not entitled to receive this dividend.
Risks Relating to Our Company and an Investment in Our Common Stock
An investment in our common stock involves substantial risks and uncertainties. Investors should carefully consider all of the information in this prospectus, including the detailed discussion of these and other risks under “Risk Factors” beginning on page 33, prior to investing in our common stock. Some of the significant risks include the following:
| • | Changes in economic conditions, in particular an economic slowdown in Pennsylvania, could materially and negatively affect our business. |
| • | A significant portion of our loan portfolio is secured by real estate, and events that negatively impact the real estate market could hurt our business. |
| • | Inflation can have an adverse impact on our business and on our customers. |
| • | The economic impact of the COVID-19 outbreak could continue to affect our financial condition and results of operations. |
| • | Changes in prevailing interest rates may reduce our profitability, and we may not be able to adequately anticipate and respond to changes in market interest rates. |
15
| • | Our commercial real estate loans may increase our exposure to credit risk. |
| • | Repayment of commercial business loans is often dependent on the cash flows of the borrower, which may be unpredictable, and the collateral securing these loans may fluctuate in value. |
| • | Our decisions regarding allowance for loan losses and credit risk may materially and adversely affect our business. If the allowance for loan losses is not sufficient to cover actual loan losses, our earnings could decrease. |
| • | If our non-performing assets increase, our earnings will be adversely affected. |
| • | A portion of our loan portfolio consists of loan participations. Loan participations may have a higher risk of loss than loans we originate because we are not the lead lender, and we have limited control over credit monitoring. |
| • | The implementation of the current expected credit loss accounting standard could require us to increase our allowance for loan losses and may have a material adverse effect on our financial condition and results of operations. |
| • | We may be unable to effectively manage our growth. |
| • | We may encounter significant difficulties in integrating with GNBF and may fail to realize the anticipated benefits of the Merger, or those benefits may take longer to realize than expected. |
| • | Future acquisitions could disrupt our business and adversely affect our results of operations, financial condition and cash flows. |
| • | We rely heavily on technology, and our information systems may experience an interruption or breach in security. |
| • | We rely on third party vendors, which could expose us to additional cybersecurity risks. |
| • | Liquidity needs could adversely affect our financial condition and results of operation. |
| • | We rely heavily on our senior management team and the unexpected loss of any of those personnel could adversely affect our operations. |
| • | Competition with other financial institutions may have an adverse effect on our ability to retain and grow our client base, which could have a negative effect on our financial condition or results of operations. |
| • | We are subject to extensive government regulation and supervision that could interfere with our ability to conduct our business and may negatively impact our financial results, restrict our activities, have an adverse impact on our operations, and impose financial requirements or limitations on the conduct of our business. |
| • | The Bank is subject to federal and state fair lending laws, and failure to comply with these laws could lead to material penalties. |
| • | The Bank faces a risk of noncompliance and enforcement action with the Bank Secrecy Act and other anti-money laundering statutes and regulations. |
| • | Regulations relating to privacy, information security and data protection could increase our costs, affect or limit how they collect and use personal information and adversely affect their business opportunities. |
| • | The trading history of our common stock is characterized by low trading volume. An active, liquid trading market for our common stock may not develop, and you may not be able to sell your common stock at or above the public offering price, or at all. |
16
| • | You will incur immediate dilution as a result of this offering. |
| • | The price of our common stock could be volatile following this offering. |
| • | Our management will have broad discretion as to the use of proceeds from this offering, and we may not use the proceeds effectively. |
| • | Our directors and executive officers beneficially own a significant portion of our common stock and have substantial influence over us. |
| • | Our Articles of Incorporation and Bylaws, and certain banking laws applicable to us, could have an anti-takeover effect that decreases our chances of being acquired, even if our acquisition is in our shareholders’ best interests. |
Corporate Information
Our principal executive offices are located at 3045 Market Street, Camp Hill, Pennsylvania 17011 and our telephone number at that address is (855) 569-2265. Our website address is
ir.linkbancorp.com
. The information contained on our website is not a part of, or incorporated by reference into, this prospectus.17
The Offering
Common stock offered by us | 4,575,000 shares |
Underwriters’ purchase option | 686,250 shares from us |
Common stock outstanding after completion of this offering | 14,413,435 shares (or 15,099,685 shares if the underwriters exercise their option to purchase additional shares in full). |
Use of proceeds | We estimate that the net proceeds to us from this offering, after deducting underwriting discounts and estimated offering expenses, will be approximately $36.2 million (or approximately $41.8 million if the underwriters exercise their option to purchase additional shares in full), based on an assumed public offering price of $8.75 per share, which is the midpoint of the price range set forth on the cover of this prospectus. We intend to use the net proceeds of the offering to support the growth of The Gratz Bank, including providing capital to The Gratz Bank to support growth of its operations, including, without limitation, expansion of its lending activities, financing strategic acquisitions that may from time to time arise and for other general corporate purposes. See “Use of Proceeds.” |
Dividend policy | Through the second quarter of 2022, we paid total dividends of $0.15 per share, or an annualized yield of 3.43%, based on an assumed market price of $8.75 per share. The Merger Agreement with GNBF provides that, for three years following the effective time of the Merger, the Company will pay a quarterly cash dividend in an amount equal to or greater than $0.30 per share per year, provided sufficient funds are legally available and that the Company and the Bank remain “well-capitalized” in accordance with applicable regulatory guidelines. Subject to the approval of our board of directors and regulatory restrictions, the Company anticipates that it will continue to pay cash dividends on a quarterly basis in an amount equal to or greater than $0.30 per share per year. Our board of directors will make any determination whether or not to pay dividends based upon our financial condition, results of operations, capital and regulatory restrictions and other relevant factors. See “Dividend Policy.” |
Listing and trading symbol | We have applied to list our common stock on the Nasdaq Capital Market under the symbol “LNKB.” |
Directed Share Program | At our request, the underwriters have reserved up to 5% of the shares of our common stock offered by this prospectus for sale, at the initial public offering price, to our directors, officers, principal shareholders, employees, business associates, and related persons who have expressed an interest in purchasing our common stock in this offering. We will offer these shares to the extent permitted under applicable regulations in the United States through a directed share program. See the section entitled “Underwriting—Directed Share Program.” |
18
Risk factors | Investing in our common stock involves certain risks. See “Risk Factors,” beginning on page 33 of this prospectus, for a discussion of factors that you should carefully consider before investing in our common stock. |
Unless otherwise indicated, all information in this prospectus relating to the number of shares of common stock to be outstanding immediately after the completion of this offering is based on 9,838,435 shares outstanding as of June 30, 2022 and:
| • | assumes no exercise of the underwriters’ option to purchase up to 686,250 additional shares of common stock from us; |
| • | excludes 403,900 shares of our common stock issuable upon the exercise of outstanding stock options at a weighted average exercise price of $10.86 per share (195,700 options of which are exercisable) as of June 30, 2022; |
| • | excludes 1,537,484 shares of our common stock issuable upon the exercise of outstanding warrants at a weighted average exercise price of $10.00 per share (all which are exercisable) as of June 30, 2022; and |
| • | does not attribute to any director, officer, principal shareholder or related person any purchases of shares of our common stock in this offering, including through the directed share program described in the section entitled “Underwriting — Directed Share Program.” |
19
Summary Historical Consolidated Financial Data of the Company
The following table sets forth summary historical consolidated financial data for the Company as of the dates and for the periods shown. The summary balance sheet data as of December 31, 2021 and 2020 and the summary income statement data for the years then ended have been derived from our audited consolidated financial statements included elsewhere in this prospectus. The summary balance sheet data as of December 31, 2019 and the summary income statement data for the year then ended is derived from our audited financial statements not included in this prospectus. The summary consolidated financial data as of June 30, 2022 and for the six months ended June 30, 2022 and 2021 is derived from our unaudited consolidated financial statements included elsewhere in this prospectus and includes all normal and recurring adjustments that we consider necessary for a fair presentation. Operating results for the six months ended June 30, 2022 are not necessarily indicative of the results that may be expected for the year ending December 31, 2022. The summary consolidated financial data as of and for the year ended December 31, 2021 and as of and for the six months ended June 30, 2022 include the results of operations on and after the effective date of the Merger. Results for periods before the effective date of the Merger for the Company at or for the years ended December 31, 2020 and 2019 and for the six months ended June 30, 2021 reflect only the consolidated results of GNBF and do not include the results of operations of Legacy LINKBANCORP before the completion of the Merger. The selected financial data presented below should be read in conjunction with “Risk Factors,” “Management’s Discussion and Analysis of Financial Condition and Results of Operations” and our consolidated financial statements and the related notes included elsewhere in this prospectus.
At June 30, 2022 | At December 31, | |||||||||||||||
2021 | 2020 | 2019 | ||||||||||||||
(In thousands) | ||||||||||||||||
Selected Balance Sheet Data: | ||||||||||||||||
Total assets | $ | 1,059,885 | $ | 932,763 | $ | 429,544 | $ | 383,366 | ||||||||
Cash and cash equivalents | 62,996 | 22,590 | 33,162 | 27,708 | ||||||||||||
Certificates of deposit with other banks | 11,088 | 12,828 | 17,051 | 18,794 | ||||||||||||
Securities available for sale | 85,756 | 103,783 | 125,447 | 84,916 | ||||||||||||
Securities held to maturity | 28,816 | — | — | — | ||||||||||||
Loans receivable, net | 786,516 | 711,665 | 233,795 | 235,083 | ||||||||||||
Goodwill and other intangible assets | 37,020 | 37,152 | 2,509 | 2,575 | ||||||||||||
Deposits | 902,373 | 771,665 | 375,124 | 330,907 | ||||||||||||
Other borrowings | 1,639 | 19,814 | 1,120 | 2,759 | ||||||||||||
Subordinated debt | 40,585 | 20,696 | — | — | ||||||||||||
Total shareholders’ equity | 104,771 | 109,623 | 50,674 | 45,706 | ||||||||||||
For the Six Months Ended June 30, | For the Years Ended December 31, | |||||||||||||||||||
2022 | 2021 | 2021 | 2020 | 2019 | ||||||||||||||||
(In thousands) | ||||||||||||||||||||
Selected Operating Data: | ||||||||||||||||||||
Interest and dividend income | $ | 17,478 | $ | 6,657 | $ | 18,496 | $ | 14,291 | $ | 14,811 | ||||||||||
Interest expense | 2,148 | 977 | 2,390 | 2,717 | 3,007 | |||||||||||||||
Net interest income | 15,330 | 5,680 | 16,106 | 11,574 | 11,804 | |||||||||||||||
Provision for loan losses | 675 | 91 | 648 | 184 | 416 | |||||||||||||||
Noninterest income | 1,408 | 1,214 | 2,139 | 1,754 | 1,163 | |||||||||||||||
Noninterest expense | 12,342 | 4,130 | 17,497 | 8,306 | 7,788 | |||||||||||||||
Income before income tax (benefit) expense | 3,721 | 2,673 | 100 | 4,838 | 4,763 | |||||||||||||||
Income tax (benefit) expense | 591 | 375 | (189 | ) | 645 | 757 | ||||||||||||||
Net income | $ | 3,130 | $ | 2,298 | $ | 289 | $ | 4,193 | $ | 4,006 | ||||||||||
20
At or For the Six Months Ended June 30, | At or For the Years Ended December 31, | |||||||||||||||||||
2022 | 2021 | 2021 | 2020 | 2019 | ||||||||||||||||
Performance Ratios (1): | ||||||||||||||||||||
Return on average assets | 0.63 | % | 1.05 | % | 0.05 | % | 1.02 | % | 1.12 | % | ||||||||||
Adjusted return on average assets (2) | 0.63 | % | 1.05 | % | 0.68 | % | 1.00 | % | 1.12 | % | ||||||||||
Return on average equity | 5.91 | % | 9.14 | % | 0.56 | % | 8.79 | % | 9.13 | % | ||||||||||
Adjusted return on average equity (2) | 5.89 | % | 9.14 | % | 7.52 | % | 8.61 | % | 9.11 | % | ||||||||||
Return on average tangible equity (2) | 9.06 | % | 9.61 | % | 0.74 | % | 9.28 | % | 9.66 | % | ||||||||||
Adjusted return on average tangible equity (2) | 9.03 | % | 9.61 | % | 9.92 | % | 9.09 | % | 9.63 | % | ||||||||||
Interest rate spread (3) | 3.31 | % | 2.64 | % | 3.01 | % | 2.84 | % | 3.09 | % | ||||||||||
Net interest margin (4) | 3.39 | % | 2.73 | % | 3.07 | % | 2.97 | % | 3.48 | % | ||||||||||
Efficiency ratio (5) | 73.7 | % | 59.9 | % | 96 | % | 62 | % | 60 | % | ||||||||||
Efficiency ratio, as adjusted (6) | 73.8 | % | 59.9 | % | 71 | % | 63 | % | 60 | % | ||||||||||
Noninterest income to average total assets | 0.28 | % | 0.56 | % | 0.37 | % | 0.43 | % | 0.33 | % | ||||||||||
Noninterest income to total revenue (7) | 8.35 | % | 17.61 | % | 12.82 | % | 13.16 | % | 8.98 | % | ||||||||||
Noninterest expense to average total assets | 2.49 | % | 1.89 | % | 3.07 | % | 2.02 | % | 2.12 | % | ||||||||||
Average interest-earning assets to average interest-bearing liabilities | 123.14 | % | 134.98 | % | 126.69 | % | 130.78 | % | 130.21 | % | ||||||||||
Average equity to average total assets | 10.68 | % | 11.54 | % | 8.99 | % | 11.61 | % | 12.27 | % | ||||||||||
Share and Per Share Data: | ||||||||||||||||||||
Basic earnings | $ | 0.32 | $ | 0.40 | $ | 0.04 | $ | 0.74 | $ | 0.70 | ||||||||||
Diluted earnings | $ | 0.31 | $ | 0.40 | $ | 0.04 | $ | 0.74 | $ | 0.70 | ||||||||||
Book value | $ | 10.65 | $ | 9.15 | $ | 11.16 | $ | 8.90 | $ | 8.03 | ||||||||||
Tangible book value (8) | $ | 6.89 | $ | 8.71 | $ | 7.38 | $ | 8.46 | $ | 7.58 | ||||||||||
Dividend payout ratio (9) | 47.12 | % | 21.05 | % | 505.9 | % | 34.2 | % | 30.1 | % | ||||||||||
Number of shares outstanding | 9,838,435 | 5,691,685 | 9,826,435 | 5,691,686 | 5,691,686 | |||||||||||||||
Weighted average number of shares Outstanding—diluted | 9,983,742 | 5,691,686 | 7,250,463 | 5,691,686 | 5,686,323 | |||||||||||||||
Capital Ratios: | ||||||||||||||||||||
Tangible common equity to tangible assets (10) | 6.62 | % | 11.54 | % | 8.09 | % | 11.28 | % | 11.33 | % | ||||||||||
Common equity tier 1 capital to risk weighted assets (11) | 11.94 | % | 13.35 | % | 11.02 | % | 13.22 | % | 12.99 | % | ||||||||||
Tier 1 capital to average assets (11) | 10.10 | % | 8.33 | % | 8.85 | % | 7.90 | % | 8.50 | % | ||||||||||
Tier 1 capital to risk weighted assets (11) | 11.94 | % | 13.35 | % | 11.02 | % | 13.22 | % | 12.99 | % | ||||||||||
Total capital to risk weighted assets (11) | 12.42 | % | 14.45 | % | 11.50 | % | 14.33 | % | 14.14 | % | ||||||||||
Asset Quality Ratios: | ||||||||||||||||||||
Non-performing assets to total assets | 0.14 | % | 0.12 | % | 0.15 | % | 0.14 | % | 0.23 | % | ||||||||||
Non-performing loans to total loans | 0.19 | % | 0.21 | % | 0.20 | % | 0.26 | % | 0.38 | % | ||||||||||
Allowance for loan losses to non-performing loans | 260.37 | % | 538.76 | % | 225.79 | % | 452.76 | % | 301.90 | % | ||||||||||
Allowance for loan losses to total loans | 0.49 | % | 1.16 | % | 0.44 | % | 1.18 | % | 1.14 | % | ||||||||||
Net charge-offs (recoveries) to average outstanding loans during the period | (0.02 | )% | 0.00 | % | 0.08 | % | 0.04 | % | (0.01 | )% | ||||||||||
Other: | ||||||||||||||||||||
Number of offices | 10 | 6 | 10 | 6 | 6 | |||||||||||||||
Number of full-time equivalent employees | 135 | 47 | 106 | 48 | 54 | |||||||||||||||
| (1) | Annualized for the six-month periods ended June 30, 2022 and 2021. |
21
| (2) | This is a non-GAAP financial measure. See our reconciliation of non-GAAP financial measures to their most directly comparable GAAP financial measures under the caption “Summary Historical Consolidated Financial Data of the Company—Non-GAAP Financial Measure Reconciliation.” |
| (3) | Represents the difference between the weighted average yield on interest-earning assets and the weighted average cost of interest-bearing liabilities for the periods. |
| (4) | The net interest margin represents net interest income as a percent of average interest-earning assets for the periods. |
| (5) | The efficiency ratio represents noninterest expense divided by the sum of net interest income and noninterest income. |
| (6) | The efficiency ratio, as adjusted represents noninterest expense divided by the sum of net interest income and noninterest income, excluding gains or losses from securities sales and Merger expenses. This is a non-GAAP financial measure. See our reconciliation of non-GAAP financial measures to their most directly comparable GAAP financial measures under the caption “—Non-GAAP Financial Measure Reconciliation.” |
| (7) | We calculate revenue as net interest income plus noninterest income, excluding gains or losses from securities sales, before provision for loan losses for the relevant periods. This is a non-GAAP financial measure. See our reconciliation of non-GAAP financial measures to their most directly comparable GAAP financial measures under the caption “—Non-GAAP Financial Measure Reconciliation.” |
| (8) | We calculate tangible book value per common share as total shareholders’ equity less goodwill and other intangibles, divided by the outstanding number of shares of our common stock at the end of the relevant period. Tangible book value per common share is a non-GAAP financial measure, and, as we calculate tangible book value per common share, the most directly comparable GAAP financial measure is book value per common share. See our reconciliation of non-GAAP financial measures to their most directly comparable GAAP financial measures under the caption “—Non-GAAP Financial Measure Reconciliation.” |
| (9) | The dividend payout ratio represents dividends paid per share divided by net income per share. |
| (10) | We calculate tangible common equity as total shareholders’ equity less goodwill and other intangibles, and we calculate tangible assets as total assets less goodwill and other intangibles. This is a non-GAAP financial measure. See our reconciliation of non-GAAP financial measures to their most directly comparable GAAP financial measures under the caption “—Non-GAAP Financial Measure Reconciliation.” |
| (11) | Ratios are only for The Gratz Bank. |
Non-GAAP Financial Measure Reconciliation for the Company
Our accounting and reporting policies conform to accounting principles generally accepted in the United States, or GAAP, and the prevailing practices in the banking industry. However, we also evaluate our performance based on certain additional metrics. Tangible book value per share and the ratio of tangible equity to tangible assets are not financial measures recognized under GAAP and, therefore, are considered non-GAAP financial measures.
Our management, banking regulators, many financial analysts and other investors use these non-GAAP financial measures to compare the capital adequacy of banking organizations with significant amounts of goodwill or other intangible assets, which typically stem from the use of the purchase accounting method of accounting for mergers and acquisitions. Tangible equity, tangible assets, tangible book value per share or related measures should not be considered in isolation or as a substitute for total shareholders’ equity, total assets, book value per share or any other measure calculated in accordance with GAAP. Moreover, the manner in which we calculate tangible equity, tangible assets, tangible book value per share and any other related measures may differ from that of other companies reporting measures with similar names.
22
The following table reconciles, as of the dates set forth below, shareholders’ equity (on a GAAP basis) to tangible equity and total assets (on a GAAP basis) to tangible assets and calculates our tangible book value per share.
At June 30, | At December 31, | |||||||||||||||||||
2022 | 2021 | 2021 | 2020 | 2019 | ||||||||||||||||
(Dollars in thousands, except for share data) | ||||||||||||||||||||
Tangible Common Equity: | ||||||||||||||||||||
Total shareholders’ equity | $ | 104,771 | $ | 52,076 | $ | 109,623 | $ | 50,674 | $ | 45,706 | ||||||||||
Adjustments: | ||||||||||||||||||||
Goodwill | 35,842 | 2,333 | 35,842 | 2,333 | 2,333 | |||||||||||||||
Other intangible assets | 1,178 | 149 | 1,310 | 176 | 242 | |||||||||||||||
Tangible common equity | $ | 67,751 | $ | 49,594 | $ | 72,471 | $ | 48,165 | $ | 43,131 | ||||||||||
Common shares outstanding | 9,838,435 | 5,691,685 | 9,826,435 | 5,691,686 | 5,691,686 | |||||||||||||||
Book value per common share | $ | 10.65 | $ | 9.15 | $ | 11.16 | $ | 8.90 | $ | 8.03 | ||||||||||
Tangible book value per common share | $ | 6.89 | $ | 8.71 | $ | 7.38 | $ | 8.46 | $ | 7.58 | ||||||||||
Tangible Assets: | ||||||||||||||||||||
Total assets | $ | 1,059,885 | $ | 432,170 | $ | 932,763 | $ | 429,544 | $ | 383,366 | ||||||||||
Adjustments: | ||||||||||||||||||||
Goodwill | 35,842 | 2,333 | 35,842 | 2,333 | 2,333 | |||||||||||||||
Other intangible assets | 1,178 | 149 | 1,310 | 176 | 242 | |||||||||||||||
Tangible assets | $ | 1,022,865 | $ | 429,688 | $ | 895,611 | $ | 427,035 | $ | 380,791 | ||||||||||
Tangible common equity to tangible assets | 6.62 | % | 11.54 | % | 8.09 | % | 11.28 | % | 11.33 | % | ||||||||||
The efficiency ratio, as adjusted, is a non-GAAP measure of expense control relative to adjusted revenue. We calculate the efficiency ratio, adjusted, by dividing total noninterest expenses, as determined under GAAP but excluding merger related expenses, by the sum of total net interest income and total noninterest income, each as determined under GAAP, but excluding net gains or losses on the sale of securities and other non-recurring income sources, if applicable, from this calculation, which we refer to below as adjusted revenue. We believe that this provides one reasonable measure of core expenses relative to core revenue.
The following table reconciles our efficiency ratio, as adjusted, for the periods set forth below.
For the Six Months Ended June 30, | For the Years Ended December 31, | |||||||||||||||||||
2022 | 2021 | 2021 | 2020 | 2019 | ||||||||||||||||
(Dollars in thousands) | ||||||||||||||||||||
GAAP-based efficiency ratio | 73.7 | % | 59.9 | % | 96 | % | 62 | % | 60 | % | ||||||||||
Net interest income | $ | 15,330 | $ | 5,680 | $ | 16,106 | $ | 11,574 | $ | 11,804 | ||||||||||
Noninterest income | 1,408 | 1,214 | 2,139 | 1,754 | 1,163 | |||||||||||||||
Less: net gains on sales of securities | 13 | — | 74 | 110 | 13 | |||||||||||||||
Adjusted revenue | $ | 16,725 | $ | 6,894 | $ | 18,171 | $ | 13,218 | $ | 12,954 | ||||||||||
Total noninterest expense | 12,342 | 4,130 | 17,497 | 8,306 | 7,788 | |||||||||||||||
Less: merger expenses | — | — | 4,584 | — | — | |||||||||||||||
Adjusted noninterest expense | 12,342 | 4,130 | 12,913 | 8,306 | 7,788 | |||||||||||||||
Efficiency ratio, as adjusted | 73.8 | % | 59.9 | % | 71 | % | 63 | % | 60 | % | ||||||||||
Management will often make adjustments to our results of operations when completing analysis of our operations in order to exclude certain items that we do not consider to be indicative of our core banking operations. For the tables below, net income is adjusted to remove Merger related expenses as well as gains on
23
sales of securities. While we acknowledge that these items are likely to recur in future periods, they are not considered to be indicative of our core banking operations, and therefore, management often excludes them from our analysis of our return on average assets and our return on average equity to better understand our core operating performance.
The following table reconciles our return on average assets, as adjusted, for the periods set forth below.
For the Six Months Ended June 30, | For the Years Ended December 31, | |||||||||||||||||||
2022 | 2021 | 2021 | 2020 | 2019 | ||||||||||||||||
(Dollars in thousands) | ||||||||||||||||||||
Net income | $ | 3,130 | $ | 2,298 | $ | 289 | $ | 4,193 | $ | 4,006 | ||||||||||
Average assets | 999,378 | 439,548 | 570,422 | 411,008 | 357,560 | |||||||||||||||
Return on average assets(1) | 0.63 | % | 1.05 | % | 0.05 | % | 1.02 | % | 1.12 | % | ||||||||||
Net income | $ | 3,130 | $ | 2,298 | $ | 289 | $ | 4,193 | $ | 4,006 | ||||||||||
Net (gain) loss on sale of securities | (13 | ) | — | (74 | ) | (110 | ) | (13 | ) | |||||||||||
Tax effect at 21% | 3 | — | 16 | 23 | 3 | |||||||||||||||
Merger expenses | — | — | 4,584 | — | — | |||||||||||||||
Tax benefit at 21% | — | — | (963 | ) | — | — | ||||||||||||||
Adjusted net income | 3,120 | 2,298 | 3,852 | 4,106 | 3,996 | |||||||||||||||
Average assets | 999,378 | 439,548 | 570,422 | 411,008 | 357,560 | |||||||||||||||
Adjusted return on average assets(1) | 0.63 | % | 1.05 | % | 0.68 | % | 1.00 | % | 1.12 | % | ||||||||||
| (1) | Annualized for the six-month periods ended June 30, 2022 and 2021. |
The following table reconciles our return on average equity, as adjusted, for the periods set forth below.
For the Six Months Ended June 30, | For the Years Ended December 31, | |||||||||||||||||||
2022 | 2021 | 2021 | 2020 | 2019 | ||||||||||||||||
(Dollars in thousands) | ||||||||||||||||||||
Net income | $ | 3,130 | $ | 2,298 | $ | 289 | $ | 4,193 | $ | 4,006 | ||||||||||
Average shareholders’ equity | 106,767 | 50,725 | 51,257 | 47,711 | 43,864 | |||||||||||||||
Return on average shareholders’ equity(1) | 5.91 | % | 9.14 | % | 0.56 | % | 8.79 | % | 9.13 | % | ||||||||||
Net income | $ | 3,130 | $ | 2,298 | $ | 289 | $ | 4,193 | $ | 4,006 | ||||||||||
Net (gain) loss on sale of securities | (13 | ) | — | (74 | ) | (110 | ) | (13 | ) | |||||||||||
Tax effect at 21% | 3 | — | 16 | 23 | 3 | |||||||||||||||
Merger expenses | — | — | 4,584 | — | — | |||||||||||||||
Tax benefit at 21% | — | — | (963 | ) | — | — | ||||||||||||||
Adjusted net income | 3,120 | 2,298 | 3,852 | 4,106 | 3,996 | |||||||||||||||
Average shareholders’ equity | 106,767 | 50,725 | 51,257 | 47,711 | 43,864 | |||||||||||||||
Adjusted return on average shareholders’ equity(1) | 5.89 | % | 9.14 | % | 7.52 | % | 8.61 | % | 9.11 | % | ||||||||||
| (1) | Annualized for the six-month periods ended June 30, 2022 and 2021. |
24
The following table reconciles, as of the dates set forth below, the calculation of the return on average equity (on a GAAP basis) to the calculation of the return on average tangible equity and the calculation of the adjusted return on average tangible equity.
For the Six Months Ended June 30, | For the Years Ended December 31, | |||||||||||||||||||
2022 | 2021 | 2021 | 2020 | 2019 | ||||||||||||||||
(Dollars in thousands) | ||||||||||||||||||||
Net income | $ | 3,130 | $ | 2,298 | $ | 289 | $ | 4,193 | $ | 4,006 | ||||||||||
Average shareholders’ equity | 106,767 | 50,725 | 51,257 | 47,711 | 43,864 | |||||||||||||||
Return on average shareholders’ equity(1) | 5.91 | % | 9.14 | % | 0.56 | % | 8.79 | % | 9.13 | % | ||||||||||
Average Tangible Common Equity: | ||||||||||||||||||||
Average total shareholders’ equity | $ | 106,767 | $ | 50,725 | $ | 51,257 | $ | 47,711 | $ | 43,864 | ||||||||||
Adjustments: | ||||||||||||||||||||
Average goodwill | (35,842 | ) | (2,333 | ) | (11,919 | ) | (2,333 | ) | (2,213 | ) | ||||||||||
Average other intangible assets | (1,254 | ) | (163 | ) | (506 | ) | (213 | ) | (163 | ) | ||||||||||
Average tangible common equity | $ | 69,671 | $ | 48,229 | $ | 38,832 | $ | 45,165 | $ | 41,488 | ||||||||||
Return on average tangible common shareholders’ equity | 9.06 | % | 9.61 | % | 0.74 | % | 9.28 | % | 9.66 | % | ||||||||||
Net income | $ | 3,130 | $ | 2,298 | $ | 289 | $ | 4,193 | $ | 4,006 | ||||||||||
Net (gain) loss on sale of securities | (13 | ) | — | (74 | ) | (110 | ) | (13 | ) | |||||||||||
Tax effect at 21% | 3 | — | 16 | 23 | 3 | |||||||||||||||
Merger expenses | — | — | 4,584 | — | — | |||||||||||||||
Tax benefit at 21% | — | — | (963 | ) | — | — | ||||||||||||||
Adjusted net income | 3,120 | 2,298 | 3,852 | 4,106 | 3,996 | |||||||||||||||
Average tangible common equity | $ | 69,671 | $ | 48,229 | $ | 38,832 | $ | 45,165 | $ | 41,488 | ||||||||||
Adjusted return on average tangible equity(1) | 9.03 | % | 9.61 | % | 9.92 | % | 9.09 | % | 9.63 | % | ||||||||||
| (1) | Annualized for the six-month periods ended June 30, 2022 and 2021. |
25
Summary Historical Consolidated Financial Data of Legacy LINKBANCORP
The following table sets forth summary historical consolidated financial data as of the dates and for the periods shown for Legacy LINKBANCORP. The summary balance sheet data as of December 31, 2020 and 2019 and the summary income statement data for the years then ended have been derived from Legacy LINKBANCORP’s audited consolidated financial statements included elsewhere in this prospectus. The summary consolidated financial data as of June 30, 2021 and for the six months ended June 30, 2021 is derived from Legacy LINKBANCORP’s unaudited consolidated financial statements included elsewhere in this prospectus and includes all normal and recurring adjustments that we consider necessary for a fair presentation.
At June 30, 2021 | At December 31, | |||||||||||
2020 | 2019 | |||||||||||
(In thousands) | ||||||||||||
Selected Balance Sheet Data: | ||||||||||||
Total assets | $ | 464,430 | $ | 424,106 | $ | 233,500 | ||||||
Cash and cash equivalents | 31,449 | 9,002 | 11,210 | |||||||||
Securities available for sale | 3,398 | 79,205 | 46,975 | |||||||||
Loans receivable, net | 409,427 | 323,214 | 166,793 | |||||||||
Goodwill and other intangible assets | 1,357 | 1,371 | 1,402 | |||||||||
Deposits | 372,053 | 283,054 | 188,673 | |||||||||
Borrowings | 23,087 | 78,982 | 6,914 | |||||||||
Subordinated debt | 19,973 | 19,970 | — | |||||||||
Total shareholders’ equity | 43,477 | 40,334 | 36,873 | |||||||||
For the Six Months Ended June 30, 2021 | For the Years Ended December 31, | |||||||||||
2020 | 2019 | |||||||||||
(In thousands) | ||||||||||||
Selected Operating Data: | ||||||||||||
Interest and dividend income | $ | 8,163 | $ | 12,558 | $ | 5,714 | ||||||
Interest expense | 1,372 | 3,381 | 1,710 | |||||||||
Net interest income | 6,791 | 9,177 | 4,004 | |||||||||
Provision for loan losses | 617 | 2,470 | 1,605 | |||||||||
Noninterest income | 269 | 649 | 393 | |||||||||
Noninterest expense | 6,229 | 9,120 | 8,867 | |||||||||
Income (loss) before income tax (benefit) expense | 214 | (1,764 | ) | (6,075 | ) | |||||||
Income tax (benefit) expense | (2,953 | ) | — | — | ||||||||
Net income (loss) | $ | 3,167 | $ | (1,764 | ) | $ | (6,075 | ) | ||||
26
At or For the Six Months Ended June 30, 2021 | At or For the Years Ended December 31, | |||||||||||
2020 | 2019 | |||||||||||
Performance Ratios (1): | ||||||||||||
Return on average assets | 1.51 | % | (0.54 | )% | (4.27 | )% | ||||||
Adjusted return on average assets (2) | 0.33 | % | (0.54 | )% | (4.27 | )% | ||||||
Return on average equity | 14.96 | % | (4.86 | )% | (15.29 | )% | ||||||
Adjusted return on average equity (2) | 3.23 | % | (4.86 | )% | (15.29 | )% | ||||||
Return on average tangible equity (2) | 15.46 | % | (5.05 | )% | (15.85 | )% | ||||||
Adjusted return on average tangible equity (2) | 3.33 | % | (5.05 | )% | (15.85 | )% | ||||||
Interest rate spread (3) | 3.16 | % | 2.78 | % | 2.64 | % | ||||||
Net interest margin (4) | 3.35 | % | 2.89 | % | 3.03 | % | ||||||
Efficiency ratio (5) | 88 | % | 93 | % | 202 | % | ||||||
Noninterest income to average total assets | 0.13 | % | 0.20 | % | 0.28 | % | ||||||
Noninterest income to total revenue (6) | 3.81 | % | 6.60 | % | 8.94 | % | ||||||
Noninterest expense to average total assets | 2.98 | % | 2.80 | % | 6.24 | % | ||||||
Average interest-earning assets to average interest-bearing liabilities | 127.82 | % | 124.35 | % | 139.26 | % | ||||||
Average equity to average total assets | 10.12 | % | 11.14 | % | 27.95 | % | ||||||
Share and Per Share Data: | ||||||||||||
Basic earnings | $ | 0.64 | $ | (0.38 | ) | $ | (1.34 | ) | ||||
Diluted earnings | $ | 0.60 | $ | (0.38 | ) | $ | (1.34 | ) | ||||
Book value | $ | 8.75 | $ | 8.12 | $ | 8.11 | ||||||
Tangible book value (7) | $ | 8.48 | $ | 7.84 | $ | 7.80 | ||||||
Dividend payout ratio (8) | 0.00 | % | 0.00 | % | 0.00 | % | ||||||
Number of shares outstanding | 4,968,089 | 4,967,089 | 4,545,297 | |||||||||
Weighted average number of shares Outstanding—diluted | 5,212,236 | 4,627,274 | 4,545,297 | |||||||||
Capital Ratios: | ||||||||||||
Tangible common equity to tangible assets (9) | 9.10 | % | 9.22 | % | 15.28 | % | ||||||
Common equity tier 1 capital to risk weighted assets(10) | 12.38 | % | 14.61 | % | 17.34 | % | ||||||
Tier 1 capital to average assets(10) | 12.52 | % | 12.84 | % | 14.05 | % | ||||||
Tier 1 capital to risk weighted assets(10) | 12.38 | % | 14.61 | % | 17.34 | % | ||||||
Total capital to risk weighted assets(10) | 13.60 | % | 15.86 | % | 18.33 | % | ||||||
Asset Quality Ratios: | ||||||||||||
Non-performing assets to total assets | 0.11 | % | 0.05 | % | 0.39 | % | ||||||
Non-performing loans to total loans | 0.13 | % | 0.06 | % | 0.55 | % | ||||||
Allowance for loan losses to non-performing loans | 933.85 | % | 2088.50 | % | 183.79 | % | ||||||
Allowance for loan losses to total loans | 1.16 | % | 1.27 | % | 1.00 | % | ||||||
Net charge-offs (recoveries) to average outstanding loans during the period | 0.00 | % | (0.01 | )% | (0.04 | )% | ||||||
Other: | ||||||||||||
Number of offices | 3 | 3 | 3 | |||||||||
Number of full-time equivalent employees | 64 | 54 | 46 | |||||||||
| (1) | Annualized for the six-month period ended June 30, 2021. |
27
| (2) | This is a non-GAAP financial measure. See our reconciliation of non-GAAP financial measures to their most directly comparable GAAP financial measures under the caption “—Non-GAAP Financial Measure Reconciliation for Legacy LINKBANCORP.” |
| (3) | Represents the difference between the weighted average yield on interest-earning assets and the weighted average cost of interest-bearing liabilities for the periods. |
| (4) | The net interest margin represents net interest income as a percent of average interest-earning assets for the periods. |
| (5) | The efficiency ratio represents noninterest expense divided by the sum of net interest income and noninterest income. |
| (6) | We calculate revenue as net interest income plus noninterest income, excluding gains or losses from securities sales, before provision for loan losses for the relevant periods. This is a non-GAAP financial measure. See our reconciliation of non-GAAP financial measures to their most directly comparable GAAP financial measures under the caption “—Non-GAAP Financial Measure Reconciliation for Legacy LINKBANCORP.” |
| (7) | We calculate tangible book value per common share as total shareholders’ equity less goodwill and other intangibles, divided by the outstanding number of shares of our common stock at the end of the relevant period. Tangible book value per common share is a non-GAAP financial measure, and, as we calculate tangible book value per common share, the most directly comparable GAAP financial measure is book value per common share. See our reconciliation of non-GAAP financial measures to their most directly comparable GAAP financial measures under the caption “—Non-GAAP Financial Measure Reconciliation for Legacy LINKBANCORP.” |
| (8) | The dividend payout ratio represents dividends paid per share divided by net income per share. |
| (9) | We calculate tangible common equity as total shareholders’ equity less goodwill and other intangibles, and we calculate tangible assets as total assets less goodwill and other intangibles. This is a non-GAAP financial measure. See our reconciliation of non-GAAP financial measures to their most directly comparable GAAP financial measures under the caption “—Non-GAAP Financial Measure Reconciliation for Legacy LINKBANCORP.” |
| (10) | Ratios are only for LINKBANK. |
Non-GAAP Financial Measure Reconciliation for Legacy LINKBANCORP
Legacy LINKBANCORP’s accounting and reporting policies conform to accounting principles generally accepted in the United States, or GAAP, and the prevailing practices in the banking industry. However, we also evaluate our performance based on certain additional metrics. Tangible book value per share and the ratio of tangible equity to tangible assets are not financial measures recognized under GAAP and, therefore, are considered non-GAAP financial measures.
Our management, banking regulators, many financial analysts and other investors use these non-GAAP financial measures to compare the capital adequacy of banking organizations with significant amounts of goodwill or other intangible assets, which typically stem from the use of the purchase accounting method of accounting for mergers and acquisitions. Tangible equity, tangible assets, tangible book value per share or related measures should not be considered in isolation or as a substitute for total shareholders’ equity, total assets, book value per share or any other measure calculated in accordance with GAAP. Moreover, the manner in which we calculate tangible equity, tangible assets, tangible book value per share and any other related measures may differ from that of other companies reporting measures with similar names.
28
The following table reconciles, as of the dates set forth below, Legacy LINKBANCORP’s shareholders’ equity (on a GAAP basis) to tangible equity and total assets (on a GAAP basis) to tangible assets and calculates the Legacy LINKBANCORP tangible book value per share.
At June 30, 2021 | At December 31, | |||||||||||
2020 | 2019 | |||||||||||
(Dollars in thousands, except for share data) | ||||||||||||
Tangible Common Equity: | ||||||||||||
Total shareholders’ equity | $ | 43,477 | $ | 40,334 | $ | 36,873 | ||||||
Adjustments: | ||||||||||||
Goodwill | 1,253 | 1,253 | 1,253 | |||||||||
Other intangible assets | 104 | 118 | 147 | |||||||||
Tangible common equity | $ | 42,120 | $ | 38,963 | $ | 35,473 | ||||||
Common shares outstanding | 4,968,089 | 4,967,089 | 4,545,297 | |||||||||
Book value per common share | $ | 8.75 | $ | 8.12 | $ | 8.11 | ||||||
Tangible book value per common share | $ | 8.48 | $ | 7.84 | $ | 7.80 | ||||||
Tangible Assets: | ||||||||||||
Total assets | $ | 464,430 | $ | 424,106 | $ | 233,500 | ||||||
Adjustments: | ||||||||||||
Goodwill | 1,253 | 1,253 | 1,253 | |||||||||
Other intangible assets | 104 | 118 | 147 | |||||||||
Tangible assets | $ | 463,073 | $ | 422,735 | $ | 232,100 | ||||||
Tangible common equity to tangible assets | 9.10 | % | 9.22 | % | 15.28 | % | ||||||
Management will often make adjustments to our results of operations when completing analysis of our operations in order to exclude certain items that we do not consider to be indicative of our core banking operations. For the tables below, net income is adjusted to remove the impact of the reversal of the deferred tax asset valuation allowance during the six months ended June 30, 2021. Based on our current level of taxable income along with our forecasted projections, we would expect that this type of tax adjustment would not occur in the future. Therefore, management excluded this item from our analysis of our return on average assets and our return on average equity to better understand our core operating performance.
The following tables reconcile our return on average assets, as adjusted, and return on average equity, as adjusted, for the six months ended June 30, 2021. There were no adjustments to net income for the years ended December 31, 2020 and 2019.
For the Six Months Ended June 30, 2021 | ||||
(Dollars in thousands) | ||||
Net income | $ | 3,167 | ||
Average assets | 421,950 | |||
Return on average assets(1) | 1.51 | % | ||
Net income | $ | 3,167 | ||
Merger related expenses | 560 | |||
Reversal of deferred tax asset valuation allowance | (3,044 | ) | ||
Adjusted net income | 683 | |||
Average assets | 421,950 | |||
Adjusted return on average assets(1) | 0.33 | % | ||
| (1) | Annualized for the six-month period ended June 30, 2021. |
29
For the Six Months Ended June 30, 2021 | ||||
(Dollars in thousands) | ||||
Net income | $ | 3,167 | ||
Average equity | 42,687 | |||
Return on average equity(1) | 14.96 | % | ||
Net income | $ | 3,167 | ||
Merger related expenses | 560 | |||
Reversal of deferred tax asset valuation allowance | (3,044 | ) | ||
Adjusted net income | 683 | |||
Average equity | 42,687 | |||
Adjusted return on average equity(1) | 3.23 | % | ||
| (1) | Annualized for the six-month period ended June 30, 2021. |
The following table reconciles, as of the dates set forth below, the calculation of the return on average equity (on a GAAP basis) to the calculation of the return on average tangible equity and the calculation of the adjusted return on average tangible equity.
For the Six Months Ended June 30, 2021 | For the Years Ended December 31, | |||||||||||
2020 | 2019 | |||||||||||
(Dollars in thousands) | ||||||||||||
Net income | $ | 3,167 | $ | (1,764 | ) | $ | (6,075 | ) | ||||
Average equity | 42,687 | 36,325 | 39,721 | |||||||||
Return (loss) on average equity(1) | 14.96 | % | (4.86 | )% | (15.29 | )% | ||||||
Average Tangible Common Equity: | ||||||||||||
Average total shareholders’ equity | $ | 42,687 | $ | 36,325 | $ | 39,721 | ||||||
Adjustments: | ||||||||||||
Average goodwill | (1,253 | ) | (1,253 | ) | (1,253 | ) | ||||||
Average other intangible assets | (119 | ) | (134 | ) | (152 | ) | ||||||
Average tangible common equity | $ | 41,315 | $ | 34,938 | $ | 38,316 | ||||||
Return on average tangible common shareholders’ equity | 15.46 | % | (5.05 | )% | (15.85 | )% | ||||||
Net income | $ | 3,167 | $ | (1,764 | ) | $ | (6,075 | ) | ||||
Merger related expenses | 560 | — | — | |||||||||
Reversal of deferred tax asset valuation allowance | (3,044 | ) | — | — | ||||||||
Adjusted net income (loss) | 683 | (1,764 | ) | (6,075 | ) | |||||||
Average tangible common equity | $ | 41,315 | $ | 34,938 | $ | 38,316 | ||||||
Adjusted return (loss) on average tangible common shareholders’ equity(1) | 3.33 | % | (5.05 | )% | (15.85 | )% | ||||||
| (1) | Annualized for the six-month period ended June 30, 2021. |
30
SUMMARY UNAUDITED PRO FORMA FINANCIAL DATA
The following sets forth summary unaudited pro forma financial data, which combines our historical financial information with GNBF for the twelve months ended December 31, 2021 after giving effect to the closing of the Merger on September 18, 2021. The summary unaudited pro forma financial data are provided for illustrative purposes only and do not purport to represent what the actual results of operations if combined with GNBF (referred to as the “Combined Company”) would have been had the Merger occurred on the dates assumed, nor are they indicative of future results of operations or financial position of the Combined Company.
LINKBANCORP, Inc. for the Twelve Months Ended December 31, 2021 | (Accounting Acquiree) LINKBANCORP, Inc. (1/1/2021 to 9/17/2021) | Transaction Accounting Adjustments | Pro Forma Combined for the Twelve Months Ended December 31, 2021 | |||||||||||||||||
INTEREST AND DIVIDEND INCOME | ||||||||||||||||||||
Loans, including fees | $ | 15,924 | $ | 11,546 | $ | 1,813 | (1 | ) | $ | 29,283 | ||||||||||
Other | 2,572 | 106 | (6 | ) | (2 | ) | 2,672 | |||||||||||||
Total interest and dividend income | 18,496 | 11,652 | 1,807 | 31,955 | ||||||||||||||||
INTEREST EXPENSE | ||||||||||||||||||||
Deposits | 2,091 | 1,077 | (165 | ) | (3 | ) | 3,003 | |||||||||||||
Borrowings | 50 | 10 | — | 60 | ||||||||||||||||
Subordinated debt | 249 | 1,177 | (130 | ) | (4 | ) | 1,296 | |||||||||||||
Total interest expense | 2,390 | 2,264 | (295 | ) | 4,359 | |||||||||||||||
NET INTEREST INCOME BEFORE | ||||||||||||||||||||
PROVISION FOR LOAN LOSSES | 16,106 | 9,388 | 2,102 | 27,596 | ||||||||||||||||
Provision for Loan Losses | 648 | 768 | — | 1,416 | ||||||||||||||||
NET INTEREST INCOME AFTER | ||||||||||||||||||||
PROVISION FOR LOAN LOSSES | 15,458 | 8,620 | 2,102 | 26,180 | ||||||||||||||||
NONINTEREST INCOME | ||||||||||||||||||||
Service charges on accounts | 733 | 99 | — | 832 | ||||||||||||||||
Bank owned life insurance | 253 | 96 | — | 349 | ||||||||||||||||
Gain on sale of secondary market mortgage loans | 316 | — | — | 316 | ||||||||||||||||
Other | 837 | 217 | — | 1,054 | ||||||||||||||||
T otal noninterest incom | 2,139 | 412 | — | 2,551 | ||||||||||||||||
NONINTEREST EXPENSE | ||||||||||||||||||||
Salaries and employee benefits | 6,999 | 5,586 | — | 12,585 | ||||||||||||||||
Occupancy | 913 | 627 | — | 1,540 | ||||||||||||||||
Equipment and data processing | 1,340 | 1,088 | — | 2,428 | ||||||||||||||||
Professional fees | 685 | 713 | — | 1,398 | ||||||||||||||||
FDIC insurance | 231 | 159 | — | 390 | ||||||||||||||||
Bank shares tax | 434 | 265 | — | 699 | ||||||||||||||||
Merger related expenses | 4,584 | 922 | (5,506 | ) | (5 | ) | — | |||||||||||||
Other | 2,311 | 1,163 | 122 | (6 | ) | 3,596 | ||||||||||||||
Total noninterest expenses | 17,497 | 10,523 | (5,384 | ) | 22,636 | |||||||||||||||
Income (loss) before income tax (benefit) expense | 100 | (1,491 | ) | 7,486 | 6,095 | |||||||||||||||
Income tax (benefit) expense | (189 | ) | (2,922 | ) | 1,425 | (7 | ) | (1,686 | ) | |||||||||||
NET INCOME | $ | 289 | $ | 1,431 | $ | 6,061 | $ | 7,781 | ||||||||||||
EARNINGS PER SHARE | ||||||||||||||||||||
EARNINGS PER SHARE, BASIC | $ | 0.04 | $ | 0.29 | $ | 0.79 | ||||||||||||||
EARNINGS PER SHARE, DILUTED | $ | 0.04 | $ | 0.27 | $ | 0.76 | ||||||||||||||
WEIGHTED-AVERAGE COMMON SHARES OUTSTANDING | ||||||||||||||||||||
BASIC | 6,879,658 | 4,967,986 | (2,034,451 | ) | (8 | ) | 9,813,193 | |||||||||||||
DILUTED | 7,250,463 | 5,379,387 | (2,405,256 | ) | (8 | ) | 10,224,594 | |||||||||||||
| (1) | The ASC 310-20 loan interest rate fair value and general credit fair value adjustments and the ASC 310-30 accretable yield will be substantially recognized over the expected life of the loans and is expected to |
31
| increase pro forma pre-tax interest income by $1.8 million for the year ended December 31, 2021. No pro forma earnings impact was assumed from the ASC310-30 non-accretable discount or ASC 310-20 loan fee reversals and existing loan fair value balances. |
| (2) | An other interest income adjustment of $6 thousand for the year ended December 31, 2021, was made to reflect lost interest income related to the payment of cash consideration of $10.1 million at a rate of 0.08%, the average federal funds rate from January 1, 2021 through the Merger date. |
| (3) | Adjustment to reflect the amortization of certificate of deposit fair value adjustment which will be substantially recognized over the life of the deposits. These adjustments are expected to decrease pro forma pre-tax interest expense by $165 thousand for the year ended December 31, 2021. |
| (4) | Adjustment to reflect the amortization of subordinated debt fair value adjustment which will be substantially recognized over the period to the call date. This adjustment is expected to decrease pro forma pre-tax interest expense by $130 thousand for year ended December 31, 2021. |
| (5) | Adjustment to other noninterest expense to reflect the reversal of Merger-related expenses. For the year ended December 31, 2021, total Merger expenses were $5.5 million. |
| (6) | Adjustment to reflect the amortization of the new core deposit intangible based upon an expected life of 10 years using sum-of-the-years’ digits method and is expected to increase pro forma pre-tax expense by $122 thousand for the year ended December 31, 2021. |
| (7) | Provision for income taxes was applied on income statement adjustments using an effective tax rate of 21%. |
| (8) | Adjustment to eliminate GNBF’s average common shares outstanding and recognize the issuance of LINKBANCORP common stock based on the election of those GNBF shareholders that elected to receive LINKBANCORP common stock at an exchange ratio of 7.3064. Adjusted diluted shares outstanding include the effect of LINKBANCORP’s stock options and stock warrants. |
32
RISK FACTORS
Investing in our common stock involves a significant degree of risk. You should carefully consider the following risk factors, in addition to the other information contained in this prospectus, including our consolidated financial statements and related notes, before deciding to invest in our common stock. Any of the following risks could have a material adverse effect on our business, financial condition, results of operations and future prospects. As a result, the trading price of our common stock could decline, and you could lose all or part of your investment. Some statements in this prospectus, including statements in the following risk factors section, constitute forward-looking statements. Please refer to “Cautionary Note Regarding Forward-Looking Statements.”
Risks Related to Our Business
Risks Related to Economic Conditions
Changes in economic conditions, in particular an economic slowdown in Pennsylvania, could materially and negatively affect our business.
We primarily serve individuals, businesses and municipalities located in Chester, Cumberland, Dauphin, Lancaster, Northumberland and Schuylkill Counties, Pennsylvania. As of June 30, 2022, a majority of our loan portfolio was secured by real estate and other assets located in these areas in Pennsylvania. Our business is directly impacted by factors such as economic, political and market conditions, broad trends in industry and finance, legislative and regulatory changes, changes in government monetary and fiscal policies and inflation, all of which are beyond our control. Any deterioration in economic conditions, whether caused by national or local concerns, in particular any economic slowdown in Pennsylvania, could result in the following consequences, any of which could adversely affect the value of our assets, revenues, results of operations and financial condition: loan delinquencies may increase; problem assets and foreclosures may increase; demand for our products and services may decrease; low cost or noninterest-bearing deposits may decrease; and collateral for loans made by us, especially real estate, may decline in value, in turn reducing customers’ borrowing power, and reducing the value of assets and collateral associated with our existing loans.
Our success significantly depends upon the growth in population, income levels, deposits, and housing starts in our markets. If the communities in which we operate do not grow or if prevailing economic conditions locally or nationally are unfavorable, our business may not succeed. An economic downturn or prolonged recession would likely result in further deterioration of the quality of our loan portfolio and reduce our level of deposits, which in turn would hurt our business. If we experience an economic downturn or a prolonged economic recession occurs in the economy as a whole, borrowers will be less likely to repay their loans as scheduled. Moreover, in many cases the value of the real estate or other collateral that secures our loans would be adversely affected by an economic downtown or a prolonged economic recession. Unlike many larger institutions, we are not able to spread the risks of unfavorable local economic conditions across a large number of diversified economies. An economic downturn could, therefore, result in losses that materially and adversely affect our business.
A significant portion of our loan portfolio is secured by real estate, and events that negatively impact the real estate market could hurt our business.
At June 30, 2022, approximately $677.3 million, or 85.7%, of our total loan portfolio was secured by real estate, almost all of which is located in our primary lending market. The real estate collateral in each case provides an alternate source of repayment in the event of default by the borrower and may deteriorate in value during the time the credit is extended. A weakening of the real estate market in our primary market areas could result in an increase in the number of borrowers who default on their loans, resulting in an increase to our allowance for loan losses, and a reduction in the value of the collateral securing their loans, which in turn could
33
have an adverse effect on our profitability and asset quality. If we are required to liquidate the collateral securing a loan to satisfy the debt during a period of reduced real estate values, our earnings and capital could be adversely affected. Acts of nature, including hurricanes, tornados, earthquakes, fires and floods, which may cause uninsured damage and other loss of value to real estate that secures these loans, may also negatively impact our financial condition.
Inflation can have an adverse impact on our business and on our customers.
Inflation risk is the risk that the value of assets or income from investments will be worth less in the future as inflation decreases the value of money. The annual inflation rate in the United States increased to 9.1% in June 2022, the highest rate since November 1981. As a result, the FRB has increased the federal funds rate by 225 basis points to date in 2022 and has indicated its intention to continue to increase interest rates in an effort to combat inflation. As inflation increases, the value of our investment securities, particularly those with longer maturities, would decrease, although this effect can be less pronounced for floating rate instruments. In addition, inflation increases the cost of goods and services we use in our business operations, such as electricity and other utilities, which increases our noninterest expenses. Furthermore, our customers are also affected by inflation and the rising costs of goods and services used in their households and businesses, which could have a negative impact on their ability to repay their loans with us.
Our small- and medium-sized business target market may have fewer financial resources to weather a downturn in the economy, which may impair their ability as a borrower to repay a loan.
We target our commercial development and marketing strategy to serve the banking and financial services needs of small- and medium-sized businesses. These businesses generally have fewer financial resources in terms of capital or borrowing capacity than larger entities, frequently have smaller market shares than their competition, may be more vulnerable to economic downturns, often need substantial additional capital to expand or compete, and may experience substantial volatility in operating results, any of which, individually or in the aggregate, may impair their ability as a borrower to repay a loan. If general economic conditions negatively impact the markets in which we operate, our small- and medium-sized business borrowers may be disproportionally affected and negatively impact their ability to repay outstanding loans, which would adversely affect our results of operations and financial condition.
The economic impact of the COVID-19 pandemic could continue to affect our financial condition and results of operations.
The COVID-19 pandemic caused significant economic dislocation in the United States and internationally, resulting in a slow-down in economic activity, increased unemployment levels, and disruptions in global supply chains and financial markets. The pandemic and related government actions to curb its spread also resulted in closures of many organizations and the institution of social distancing requirements in many states and communities. Certain industries have been particularly hard-hit, including the travel and hospitality industry, the restaurant industry and the retail industry. In response to the pandemic, various state governments and federal agencies required lenders to provide forbearance and other relief to borrowers (e.g., waiving late payment and other fees). Federal banking agencies encouraged financial institutions to prudently work with affected borrowers and legislation provided relief from reporting loan classifications due to modifications related to the COVID-19 outbreak. The spread of the coronavirus also caused us to modify our business practices, including employee travel, employee work locations, and cancellation of physical participation in meetings, events and conferences.
Given the ongoing dynamic nature of the pandemic, it is difficult to predict the full impact of the COVID-19 outbreak on our business. As the result of the COVID-19 pandemic and the related adverse local and national economic consequences, we could be subject to a number of risks, any of which could have a material, adverse effect on our business, financial condition, liquidity, results of operations, ability to execute our growth strategy, and ability to pay dividends. These risks include, but are not limited to, changes in demand for our products and
34
services; increased loan losses or other impairments in our loan portfolios and increases in our allowance for loan losses; a decline in collateral for our loans, especially real estate; unanticipated unavailability of employees; increased cyber security risks as employees work remotely; a prolonged weakness in economic conditions resulting in a reduction of future projected earnings could necessitate a valuation allowance against our current outstanding deferred tax assets; a triggering event leading to impairment testing on our goodwill or core deposit and customer relationships intangibles, which could result in an impairment charge; and increased costs as the Company and our regulators, customers and vendors adapt to evolving pandemic conditions.
Risks Related to Lending Activities
Changes in prevailing interest rates may reduce our profitability, and we may not be able to adequately anticipate and respond to changes in market interest rates.
The majority of our banking assets are monetary in nature and subject to risk from changes in interest rates. Like most community banks, our earnings and cash flows depend to a great extent upon the level of our net interest income, or the difference between the interest income we earn on loans, investments and other interest-earning assets, and the interest we pay on interest-bearing liabilities, such as deposits and borrowings. Depending on the terms and maturities of our assets and liabilities, a significant change in interest rates could have a material adverse effect on our profitability.
When interest-bearing liabilities mature or reprice more quickly, or to a greater degree than interest-earning assets in a period, an increase in interest rates could reduce net interest income. Similarly, when interest-earning assets mature or reprice more quickly, or to a greater degree than interest-bearing liabilities, falling interest rates could reduce net interest income. An increase in interest rates may, among other things, reduce the demand for loans and our ability to originate loans and decrease loan repayment rates. Conversely, a decrease in the general level of interest rates may affect us through, among other things, increased prepayments on our loan portfolio and increased competition for deposits. Accordingly, changes in the level of market interest rates affect our net yield on interest-earning assets, loan origination volume and our overall results. Although our asset-liability management strategy is designed to control and mitigate exposure to the risks related to changes in market interest rates, those rates are affected by many factors outside of our control, including governmental monetary policies, domestic and international economic conditions, inflation, deflation, recession, changes in unemployment, the money supply, international disorder and instability in domestic and foreign financial markets.
Our commercial real estate loans may increase our exposure to credit risk.
At June 30, 2022, our commercial real estate loans totaled $435.6 million, or 55.1%, of our total loan portfolio. Loans secured by commercial real estate are generally viewed as having more risk of default than loans secured by residential real estate or consumer loans because repayment of the loans often depends on the successful operation of the property, the income stream of the borrowers, and, if applicable, the accuracy of the estimate of the property’s value at completion of construction and the estimated cost of construction. If we foreclose on a commercial real estate loan, our holding period for the collateral is typically longer than for a one- to four-family residential property because there are fewer potential purchasers of the collateral. Further, an adverse development with respect to one lending relationship can expose us to a significantly greater risk of loss compared with a single-family residential mortgage loan because we typically has more than one loan with such borrowers. Commercial real estate loans typically involve larger loan balances to single borrowers or groups of related borrowers compared with single-family residential mortgage loans. Therefore, the deterioration of one or a few of these loans could cause a significant decline in the related asset quality. Further, if our primary market areas experience an economic slowdown, these loans represent higher risk and could result in a sharp increase in loans charged off and could require us to significantly increase our allowance for loan losses, which could have a material adverse impact on our business, financial condition, results of operations, and cash flows.
35
Our loan portfolio contains a number of real estate loans with relatively large balances.
Our loan portfolio contains a number of real estate loans with relatively large balances. The deterioration of one or a few of these loans could cause a significant increase in nonperforming loans, which could result in a net loss of earnings, an increase in the provision for loan losses and an increase in loan charge-offs, all of which could have a material adverse effect on our financial condition and results of operations.
Repayment of commercial business loans is often dependent on the cash flows of the borrower, which may be unpredictable, and the collateral securing these loans may fluctuate in value.
At June 30, 2022, $88.5 million, or 11.2% of our total loan portfolio, consisted of commercial business loans (excluding PPP loans, which are expected to be fully guaranteed by the SBA). Our commercial business loans are originated primarily based on the borrower’s cash flow and general liquidity and secondarily on the underlying collateral provided by the borrower and/or repayment capacity of any guarantor. The repayment of commercial business loans is thus often dependent upon the success of the borrower’s underlying business. The borrower’s cash flow may be unpredictable, and collateral securing these loans may fluctuate in value. Although commercial business loans are often collateralized by equipment, inventory, accounts receivable, or other business assets, the liquidation of collateral in the event of default is often an insufficient source of repayment because accounts receivable may be uncollectible and inventories may be obsolete or of limited use. In addition, business assets may depreciate over time, may be difficult to appraise or sell, and may fluctuate in value based on the success of the business. Accordingly, the repayment of commercial business loans depends primarily on the cash flow and credit worthiness of the borrower and secondarily on the underlying collateral value provided by the borrower and liquidity of the guarantor. Commercial business loans may be larger in amount than loans to individuals and, therefore, have the potential for larger losses on a per loan basis.
A portion of our loan portfolio consists of construction loans, which may expose us to increased credit risk.
At June 30, 2022, $36.2 million, or 4.6%, of our total loan portfolio consisted of construction loans. Construction lending is generally considered to involve a higher degree of risk than single-family permanent mortgage lending because funds are advanced upon the collateral for the project based on an estimate of the costs that will produce a future value at completion. Because of the uncertainties inherent in estimating construction costs, as well as the market value of the completed project and the effects of governmental regulation on real property, it is relatively difficult to evaluate accurately the total funds required to complete a project and the completed project loan-to-value ratio. With regard to loans originated to builders for speculative projects, changes in the demand, such as for new housing and higher than anticipated building costs, may cause actual results to vary significantly from those estimated. A downturn in the housing, or the real estate market, could increase loan delinquencies, defaults, and foreclosures, and significantly impair the value of our collateral and our ability to sell the collateral upon foreclosure.
Our decisions regarding allowance for loan losses and credit risk may materially and adversely affect our business. If the allowance for loan losses is not sufficient to cover actual loan losses, our earnings could decrease.
Making loans and other extensions of credit is an essential element of our business. Although we seek to mitigate risks inherent in lending by adhering to specific underwriting practices, our loans and other extensions of credit may not be repaid. The risk of nonpayment is affected by a number of factors, including:
| • | the duration of the credit; |
| • | credit risks of a particular customer; |
| • | changes in economic and industry conditions; and |
| • | evaluation of economic conditions; |
36
| • | in the case of a collateralized loan, risks resulting from uncertainties about the future value of the collateral. |
We attempt to maintain an appropriate allowance for loan losses to provide for probable losses in our loan portfolio. At June 30, 2022, our allowance for loan losses was 0.49% of total gross loans, or approximately 0.90% of the non-purchased portfolio, and 260.4% of nonperforming loans. We periodically determine the amount of the allowance based on consideration of several factors, including but not limited to:
| • | an ongoing review of the quality, mix, and size of our overall loan portfolio; |
| • | our historical loan loss experience; |
| • | evaluation of economic conditions; |
| • | regular reviews of loan delinquencies and loan portfolio quality; |
| • | ongoing review of financial information provided by borrowers; and |
| • | the amount and quality of collateral, including guarantees, securing the loans. |
The determination of the appropriate level of the allowance for loan losses inherently involves a high degree of subjectivity and requires us to make significant estimates of current credit risks and future trends, all of which may undergo material changes. Deterioration in economic conditions affecting borrowers, new information regarding existing loans, identification of additional problem loans, increased charge-offs, and other factors, both within and outside of our control, may require an increase in the allowance for loan losses. In addition, regulatory agencies periodically review our allowance for loan losses and may require an increase in the provision for loan losses or the recognition of further loan charge-offs, based on judgments different than those of management. Any increases in the allowance for loan losses will result in a decrease in net income and, possibly, capital, and may have a material adverse effect on our financial condition and results of operations.
If our non-performing assets increase, our earnings will be adversely affected.
At June 30, 2022, our non-performing assets, which consist of non-performing loans and other real estate owned, were $1.5 million, or 0.14% of total assets. Our non-performing assets adversely affect our net income in various ways:
| • | we record interest income only on the cash basis or cost-recovery method for nonaccrual loans and we do not record interest income for other real estate owned; |
| • | we must provide for probable loan losses through a current period charge to the provision for loan losses; |
| • | noninterest expense increases when we write down the value of properties in our other real estate owned portfolio to reflect changing market values; |
| • | there are legal fees associated with the resolution of problem assets, as well as carrying costs, such as taxes, insurance, and maintenance fees; and |
| • | the resolution of non-performing assets requires the active involvement of management, which can distract them from more profitable activity. |
If additional borrowers become delinquent and do not pay their loans and we are unable to successfully manage our non-performing assets, our losses and troubled assets could increase significantly, which could have a material adverse effect on our financial condition and results of operations.
37
Appraisals and other valuation techniques we use in evaluating and monitoring loans secured by real property, other real estate owned and repossessed personal property may not accurately describe the net value of the asset.
In considering whether to make a loan secured by real property, we generally require an appraisal of the property. However, an appraisal is only an estimate of the value of the property at the time the appraisal is made and, as real estate values may change significantly in value in relatively short periods of time (especially in periods of heightened economic uncertainty), this estimate may not accurately describe the net value of the real property collateral after the loan is made. As a result, we may not be able to realize the full amount of any remaining indebtedness when we foreclose on and sell the relevant property. In addition, we rely on appraisals and other valuation techniques to establish the value of our other real estate owned, and personal property that we acquire through foreclosure proceedings and to determine certain loan impairments. If any of these valuations are inaccurate, our consolidated financial statements may not reflect the correct value of our other real estate owned, and our allowance for loan losses may not reflect accurate loan impairments. This could have an adverse effect on our business, financial condition or results of operations.
A portion of our loan portfolio consists of loan participations. Loan participations may have a higher risk of loss than loans we originate because we are not the lead lender, and we have limited control over credit monitoring.
We participate in commercial real estate loans and commercial business loans with other financial institutions from time to time in which we are not the lead lender. Our commercial real estate loan participations are generally located in Pennsylvania although we have from time to time participated in loans located in the states of Maryland and Virginia. We also occasionally participate in commercial business loans with other financial institutions in which we are not the lead lender. These loans are limited to our geographic lending market and are generally secured by blanket UCC liens. At June 30, 2022, commercial real estate loan participations for which we were not the lead lender totaled $34.9 million, or 8.0% of our commercial real estate loan portfolio, and commercial business loan participations for which we were not the lead lender totaled $2.3 million, or 2.6% of our commercial business loan portfolio.
We underwrite each commercial real estate loan and commercial business loan that we participate in and establish the loan classification and loan provision using the same criteria we use for loans we originate. Loan participations may have a higher risk of loss than loans we originate because we rely on the lead lender to service and to monitor the performance of the loan. Moreover, our decisions regarding the classification of a loan participation and loan loss provisions associated with a loan participation are made in part based upon information provided by the lead lender. A lead lender also may not monitor a participation loan in the same manner as we would for loans that we originate. At June 30, 2022, no loan participations were delinquent 60 days or more. If our underwriting of these participation loans is not sufficient, our non-performing loans may increase, and our earnings may decrease.
The implementation of the current expected credit loss (“CECL”) accounting standard could require us to increase our allowance for loan losses and may have a material adverse effect on our financial condition and results of operations.
In June 2016, the Financial Accounting Standards Board (the “FASB”) issued ASU 2016-13, Financial Instruments – Credit Losses (Topic 326): Measurement of Credit Losses on Financial Instruments. ASU 2016-13 replaces the incurred loss model with a lifetime loss model, which is referred to as the current expected credit loss model, or CECL. CECL will become effective for us beginning January 1, 2023. This standard requires earlier recognition of expected credit losses on loans and certain other instruments, compared to the incurred loss model. The change to the CECL framework requires us to greatly increase the data we must collect and review to determine the appropriate level of the allowance for credit losses. The adoption of CECL may result in greater volatility in the level of the allowance for credit losses, depending on various factors and assumptions applied in the model, such as the reasonable and supportable forecasted economic conditions and loan payment behaviors. Any increase in the allowance for credit losses, or expenses incurred to determine the appropriate level of the allowance for credit losses, may have an adverse effect on our financial condition and results of operations.
38
We may be exposed to risk of environmental liabilities with respect to properties to which we take title.
In the course of our business, we may foreclose and take title to real estate, potentially becoming subject to environmental liabilities associated with the properties. We may be held liable to a governmental entity or to third parties for property damage, personal injury, investigation and clean-up costs associated with one of these properties, or we may be required to investigate or clean up hazardous or toxic substances or chemical releases at a property. Costs associated with investigation or remediation activities can be substantial. If we are the owner or former owner of a contaminated site, we may be subject to common law claims by third parties based on damages and costs resulting from environmental contamination emanating from the property. These costs and claims could adversely affect our business, results of operations and financial condition.
Risks Related to Growth
We may be unable to effectively manage our growth.
Our business strategy anticipates the rapid expansion of our business to pursue existing and potential market opportunities. A high pace of growth places significant demands on our management and operational resources. In order to manage such growth effectively, we must implement effective operational systems, procedures and internal controls. Failure to implement these systems, procedures and controls on a timely basis could materially and adversely affect our results of operation or financial condition. Further, our continued expansion of our business may include entering new lines of business or introducing new products and services, which may involve increased expenses and risk of loss.
We cannot assure you that we will be successful in such expansion efforts. We can provide no assurance that we will be successful in increasing the volume of our loans and deposits at acceptable levels and upon terms acceptable to us. We also can provide no assurance that we will be successful in expanding our operations organically or through strategic acquisitions while managing the costs and implementation risks associated with this growth strategy. Any failure to execute our growth strategy could materially and adversely affect our results of operation or financial condition.
We may encounter difficulties in integrating with GNBF and may fail to realize the anticipated benefits of the Merger, or those benefits may take longer to realize than expected.
LINKBANCORP consummated its merger with GNBF on September 18, 2021. The successful integration of LINKBANCORP and GNBF will depend, in part, on our ability to combine and manage the businesses of LINKBANCORP and GNBF in a manner that permits growth opportunities, including enhanced revenues and revenue synergies, operating efficiencies, an expanded market reach, and that does not materially disrupt the existing customer relationships of LINKBANCORP or GNBF nor result in decreased revenues due to loss of customers. If we are not able to successfully achieve these objectives, the anticipated benefits of the Merger may not be fully realized or at all, or may take longer to realize than expected.
Failure to achieve these anticipated benefits could also result in increased costs, decreases in the amount of expected revenues, and diversion of management’s time and energy, and could have an adverse effect on the combined company’s business, financial condition, results of operations, and prospects. In addition, it is possible that the integration process could result in the disruption of our ongoing business or cause inconsistencies in standards, controls, procedures, and policies that adversely affect our ability to maintain relationships with customers and employees or to achieve the anticipated benefits of the Merger.
Future acquisitions could disrupt our business and adversely affect our results of operations, financial condition and cash flows.
We have grown through a combination of organic growth and acquisitions, including the completion of the Merger with GNBF. We may choose to expand by making additional acquisitions, including other financial
39
institutions, branches or fee-based businesses, that could be material to our business, results of operations, financial condition and cash flows. Acquisitions involve many risks, including the following:
| • | an acquisition may negatively affect our results of operations, financial condition or cash flows because it may require us to incur charges or assume substantial debt or other liabilities, may cause adverse tax consequences or unfavorable accounting treatment, may expose us to claims and disputes by third parties, or may not generate sufficient financial return to offset additional costs and expenses related to the acquisition; |
| • | we may encounter difficulties or unforeseen expenditures in integrating acquired operations, including the associated internal controls and regulatory functions, into our operations, particularly if key personnel of the acquired company decide not to work for us; |
| • | an acquisition may disrupt our ongoing business, divert resources, increase our expenses and distract our management; |
| • | an acquisition may involve the entry into geographic or business markets in which we have little or no prior experience or where competitors have stronger market positions; |
| • | if we incur debt to fund such acquisition, such debt may subject us to material restrictions on our ability to conduct our business as well as financial maintenance covenants; and |
| • | to the extent that we issue a significant amount of equity securities in connection with future acquisitions, existing shareholders may be diluted and earnings per share may decrease. |
The occurrence of any of these risks could have a material adverse effect on our business, results of operations, financial condition and cash flows.
Risks Related to Operations and Security
We depend on the accuracy and completeness of information about clients and counterparties and our financial condition could be adversely affected if we rely on misleading information.
In deciding whether to extend credit or to enter into other transactions with clients and counterparties, we may rely on information furnished to us by or on behalf of clients and counterparties, including financial statements and other financial information, which we do not independently verify. We also may rely on representations of clients and counterparties as to the accuracy and completeness of that information and, with respect to financial statements, on reports of independent auditors. For example, in deciding whether to extend credit to clients, we may assume that a customer’s audited financial statements conform with GAAP and present fairly, in all material respects, the financial condition, results of operations and cash flows of the customer. Our financial condition and results of operations could be negatively impacted to the extent it relies on financial statements that do not comply with GAAP or are materially misleading.
We face significant operational risks because the nature of the financial services business involves a high volume of transactions.
We operate in diverse markets and rely on the ability of our employees and systems to process a high number of transactions. Operational risk is the risk of loss resulting from our operations, including but not limited to, the risk of fraud by employees or persons outside our company, the execution of unauthorized transactions by employees, errors relating to transaction processing and technology, breaches of our internal control systems and compliance requirements. Insurance coverage may not be available for such losses, or where available, such losses may exceed insurance limits. This risk of loss also includes the potential legal actions that could arise as a result of operational deficiencies or as a result of non-compliance with applicable regulatory standards, adverse business decisions or their implementation, or customer attrition due to potential negative publicity. In the event of a breakdown in our internal control systems, improper operation of systems or improper employee actions, we could suffer financial loss, face regulatory action, and/or suffer damage to our reputation.
40
We are dependent on the use of data and modeling in our management’s decision-making, and faulty data or modeling approaches could negatively impact our decision-making ability or possibly subject us to regulatory scrutiny in the future
.
The use of statistical and quantitative models and other quantitative and qualitative analyses is necessary for bank decision-making, and the employment of such analyses is becoming increasingly widespread in our operations.
Liquidity stress testing, interest rate sensitivity analysis, the identification of possible violations of anti-money laundering regulations and the estimation of credit losses are all examples of areas in which we are dependent on models and the data that underlies them. The use of statistical and quantitative models is also becoming more prevalent in regulatory compliance. While we are not currently subject to annual Dodd-Frank Wall Street Reform and Consumer Protection Act, or Dodd-Frank Act, stress testing and the Comprehensive Capital Analysis and Review submissions, we anticipate that model-derived testing may become more extensively implemented by regulators in the future.
We anticipate data-based modeling will penetrate further into bank decision-making, particularly risk management efforts, as the capacities developed to meet rigorous stress testing requirements are able to be employed more widely and in differing applications. While we believe these quantitative techniques and approaches improve our decision-making, they also create the possibility that faulty data or flawed quantitative approaches could negatively impact our decision-making ability or, if we become subject to regulatory stress-testing in the future, cause increased adverse regulatory scrutiny. Secondarily, because of the complexity inherent in these approaches, misunderstanding or misuse of their outputs could similarly result in suboptimal decision-making.
We rely heavily on technology, and our information systems may experience an interruption or breach in security.
We rely heavily on new technology-driven products and services and on communications and information systems to conduct our business. Our future success will depend, in part, on our ability to address the needs of our customers by using technology to provide products and services that will satisfy customer demands for convenience as well as to create additional efficiencies in operations.
Any failure, interruption or breach of the security of our information systems could result in failures or disruptions in our customer relationship management, general ledger, deposit, loan and other systems. We regularly collect, process, transmit and store significant amounts of confidential information regarding our customers, employees and others and concerning our own business, operations, plans and strategies. In some cases, this confidential or proprietary information is collected, compiled, processed, transmitted or stored by third parties on our behalf. While we have policies and procedures designed to prevent or limit the effect of the failure, interruption or security breach of our information systems, there can be no assurance that we can prevent any such failures, interruptions or security breaches or, if they do occur, that they will be adequately addressed.
Information security risks have generally increased in recent years because of the proliferation of new technologies, the use of the Internet and telecommunications technologies to conduct financial and other transactions and the increased sophistication and activities of perpetrators of cyber-attacks and mobile phishing. Mobile phishing, a means for identity thieves to obtain sensitive personal information through fraudulent e-mail, text or voice mail, is an emerging threat targeting the customers of financial entities. During the normal course of our business, we have experienced and expect to continue to experience attempts to breach our systems and we may be unable to protect sensitive data and the integrity of our systems. The occurrence of any failures, interruptions or security breaches of our information systems could damage out reputation, result in a loss of customer business, subject us to additional regulatory scrutiny, or expose us to civil litigation and possible financial liability, any of which could have a material adverse effect on our financial condition and results of
41
operations. As information security risks and cyber threats continue to evolve, we may be required to expend additional resources to continue to enhance our information security measures and/or to investigate and remediate any information security vulnerabilities.
Our risk management framework may not be effective in mitigating risk and reducing the potential for significant losses.
Our risk management framework is designed to minimize risk and loss to us. We seek to identify, measure, monitor, report and control our exposure to risk, including strategic, market, liquidity, compliance and operational risks. While we use broad and diversified risk monitoring and mitigation techniques, these techniques are inherently limited because they cannot anticipate the existence or future development of currently unanticipated or unknown risks. Recent economic conditions and heightened legislative and regulatory scrutiny of the financial services industry, among other developments, have increased our level of risk. Accordingly, we could suffer losses if we fail to properly anticipate and manage these risks.
Our controls and procedures may fail or be circumvented.
We regularly review and update our internal controls, disclosure controls and procedures, and corporate governance policies and procedures. Any system of controls, however well-designed and operated, is based in part on certain assumptions and can provide only reasonable, not absolute, assurances that the objectives of the system are met. Any failure or circumvention of our controls and procedures or failure to comply with regulations related to controls and procedures could have a material adverse effect on our business, results of operations and financial condition.
We rely on third party vendors, which could expose us to additional cybersecurity risks.
Third party vendors provide key components of our business infrastructure, including certain data processing and information services. Accordingly, our operations are exposed to risk that these vendors will not perform in accordance with our contractual agreements with them, or we also could be adversely affected if such an agreement is not renewed by the third-party vendor or is renewed on terms less favorable to us. If our third-party providers encounter difficulties, or if we have difficulty communicating with those service providers, our ability to adequately process and account for transactions could be affected, and our business operations could be adversely affected, which could have a material adverse effect on our financial condition and results of operations. Threats to information security also exist in the processing of customer information through various other vendors and their personnel. To our knowledge, the services and programs provided to us by third parties have not experienced any material security breaches. However, the existence of cyber-attacks or security breaches at third parties with access to our data, such as vendors, may not be disclosed to us in a timely manner.
Our use of third-party vendors and other third-party business relationships are subject to increasing regulatory requirements and attention.
We regularly use third party vendors as part of our business. These types of third-party relationships are subject to increasingly demanding regulatory requirements and attention by our federal bank regulators. Regulatory guidance requires all banking organizations to enhance due diligence, ongoing monitoring and control over organizations’ third-party vendors and other ongoing third-party business relationships. We expect that regulators will hold us responsible for any deficiencies in our oversight and control of our third-party relationships and in the performance of the parties with which we have these relationships. As a result, if our regulators conclude that we have not exercised adequate oversight and control over our third party vendors or other ongoing third party business relationships or that such third parties have not performed appropriately, we could be subject to enforcement actions, including civil money penalties or other administrative or judicial penalties or fines as well as requirements for customer remediation, any of which could have a material adverse effect on our business, results of operations and financial condition.
42
Liquidity needs could adversely affect our financial condition and results of operation.
Our primary sources of funds are customer deposits and loan repayments. While scheduled loan repayments are a relatively stable source of funds, they are subject to the ability of borrowers to repay the loans. The ability of borrowers to repay loans can be adversely affected by a number of factors, including changes in economic conditions, adverse trends or events affecting business industry groups, reductions in real estate values or markets, business closings or lay-offs, inclement weather, which could be exacerbated by potential climate change, natural disasters and international instability.
Additionally, deposit levels may be affected by a number of factors, including rates paid by competitors, general interest rate levels, regulatory capital requirements, returns available to customers on alternative investments and general economic conditions. Accordingly, we may be required from time to time to rely on secondary sources of liquidity to meet withdrawal demands or otherwise fund operations. Such sources include proceeds from FHLB advances, sales of investment securities and loans, and federal funds lines of credit from correspondent banks, as well as out-of-market time deposits. While we believe that these sources are currently adequate, there can be no assurance they will be sufficient to meet future liquidity demands, particularly if we continue to grow and experience increasing loan demand. We may be required to slow or discontinue loan growth, capital expenditures or other investments or liquidate assets should such sources not be adequate.
We rely heavily on our senior management team and the unexpected loss of any of those personnel could adversely affect our operations.
We are a customer-focused and relationship-driven organization. Our success depends in large part on the performance of our key personnel. We expect our future growth to be driven in a large part by the relationships maintained with our customers by our chief executive officer and by other senior officers. The unexpected loss of any of our key employees could have a material adverse effect on our business and operations, which would have an adverse effect on our business, results of operations and financial condition.
The success of our strategy depends on our ability to identify and retain individuals with experience and relationships in our markets.
In order to be successful, we must identify and retain experienced key management members with local expertise and relationships. Competition for qualified personnel is intense and there are a limited number of qualified persons with knowledge of and experience in the community banking industry in our chosen geographic markets. Even if we identify individuals that we believe could assist us in building our franchise, we may be unable to recruit these individuals away from more established banks. In addition, the process of identifying and recruiting individuals with the combination of skills and attributes required to carry out our strategy is often lengthy. Our inability to identify, recruit, and retain talented personnel could limit our growth and could materially adversely affect our business, results of operations and financial condition.
Risks Related to the Financial Services Industry
Higher FDIC deposit insurance premiums and assessments could adversely impact our financial condition.
Our deposits are insured up to applicable limits by the Deposit Insurance Fund of the FDIC and are subject to deposit insurance assessments to maintain deposit insurance. As an FDIC-insured institution, the Bank is required to pay quarterly deposit insurance premium assessments to the FDIC. Although we cannot predict what the insurance assessment rates will be, either a deterioration in our risk-based capital ratios or adjustments to the base assessment rates could have a material adverse impact on our business, financial condition, results of operations, and cash flows.
We may be adversely affected by the soundness of other financial institutions.
Financial services institutions are interrelated as a result of trading, clearing, counterparty, or other relationships. We have exposure to many different industries and counterparties, and routinely execute
43
transactions with counterparties in the financial services industry, including commercial banks, brokers and dealers, investment banks, and other institutional clients. Many of these transactions expose us to credit risk in the event of a default by a counterparty or client. In addition, our credit risk may be exacerbated when the collateral held by the Bank cannot be realized upon or is liquidated at prices not sufficient to recover the full amount of the credit or derivative exposure due to the Bank. Any such losses could have a material adverse effect on our financial condition and results of operations.
Competition with other financial institutions may have an adverse effect on our ability to retain and grow our client base, which could have a negative effect on our financial condition or results of operations.
The banking and financial services industry is very competitive and includes services offered from other banks, savings and loan associations, credit unions, mortgage companies, other lenders, and institutions offering uninsured investment alternatives. Legal and regulatory developments have made it easier for new and sometimes unregulated competitors to compete with us. The financial services industry has and is experiencing an ongoing trend towards consolidation in which fewer large national and regional banks and other financial institutions are replacing many smaller and more local banks. These larger banks and other financial institutions hold a large accumulation of assets and have significantly greater resources and a wider geographic presence or greater accessibility. In some instances, these larger entities operate without the traditional brick and mortar facilities that restrict geographic presence. Some competitors have more aggressive marketing campaigns and better brand recognition, and are able to offer more services, more favorable pricing or greater customer convenience than we can. In addition, competition has increased from new banks and other financial services providers that target our existing or potential customers. As consolidation continues among large banks, we expect other smaller institutions to try to compete in the markets we plan to serve. This competition could reduce our net income by decreasing the number and size of the loans that we originate and the interest rates we charge on these loans. Additionally, these competitors may offer higher interest rates, which could decrease the deposits we attract or require us to increase rates to retain existing deposits or attract new deposits. Increased deposit competition could adversely affect our ability to generate the funds necessary for lending operations which could increase our cost of funds.
The financial services industry could become even more competitive as a result of legislative, regulatory and technological changes and continued consolidation. Banks, securities firms and insurance companies can merge as part of a financial holding company, which can offer virtually any type of financial service, including banking, securities underwriting, insurance (both agency and underwriting) and merchant banking. Technological developments have allowed competitors, including some non-depository institutions, to compete more effectively in local markets and have expanded the range of financial products, services and capital available to our target customers. If we are unable to implement, maintain and use such technologies effectively, we may not be able to offer products or achieve cost-efficiencies necessary to compete in the industry. In addition, some of these competitors have fewer regulatory constraints and lower cost structures.
Regulatory, Legal and Accounting Risks
We are subject to extensive government regulation and supervision that could interfere with our ability to conduct our business and may negatively impact our financial results, restrict our activities, have an adverse impact on our operations, and impose financial requirements or limitations on the conduct of our business.
The Bank is subject to extensive federal and state regulation and supervision. Banking regulations are primarily intended to protect depositors’ funds, the Federal Deposit Insurance Fund and the safety and soundness of the banking system as a whole, not shareholders. These regulations affect our lending practices, capital structure, investment practices, dividend policy and growth, among other things. Congress and federal regulatory agencies continually review banking laws, regulations and policies for possible changes. Changes to statutes, regulations or regulatory policies, including changes in interpretation or implementation of statutes, regulations or policies, could affect us in substantial and unpredictable ways. Such changes could subject us to additional
44
costs, limit the types of financial services and products we may offer, and/or limit the pricing we may charge on certain banking services, among other things. We will have to apply resources to ensure that we are in compliance with any changes to statutes, regulations or regulatory policies, including changes in interpretations or implementation, which may increase our costs of operations and adversely impact our earnings.
Imposition of limits by bank regulators on commercial real estate lending activities could curtail our growth and adversely affect our earnings.
In 2006, the Office of the Comptroller of the Currency, the FDIC and the FRB (collectively, the “Agencies”) issued joint guidance entitled “Concentrations in Commercial Real Estate Lending, Sound Risk Management Practices” (the “CRE Guidance”). Although the CRE Guidance did not establish specific lending limits, it provides that a bank’s commercial real estate lending exposure could receive increased supervisory scrutiny where total non-owner-occupied commercial real estate loans, including loans secured by apartment buildings, investor commercial real estate, and construction and land loans, represent 300% or more of an institution’s total risk-based capital, and the outstanding balance of the commercial real estate loan portfolio has increased by 50% or more during the preceding 36 months. Commercial real estate loans represent 276% of our risk-based capital at June 30, 2022 and the outstanding balance of our commercial real estate loan portfolio has increased by greater than 50% during the 36 months preceding June 30, 2022.
In December 2015, the Agencies released a new statement on prudent risk management for commercial real estate lending (the “2015 Statement”). In the 2015 Statement, the Agencies, among other things, indicate the intent to continue “to pay special attention” to commercial real estate lending activities and concentrations going forward. If our regulators were to impose restrictions on the amount of such loans we can hold in our portfolio or require us to implement additional compliance measures, for reasons noted above or otherwise, our earnings would be adversely affected as would our earnings per share.
The Bank is limited in the amount it can lend to one borrower.
The Bank is limited in the amount it can lend to a single borrower. The legal lending limit is 15% of the Bank’s capital and surplus with an additional 10% available for certain loans meeting heightened collateral requirements. However, we generally impose an internal limit that is more conservative than the legal maximum. Our lending limit is significantly less than the limit for most of our competitors and may affect our ability to seek relationships with larger businesses in our market area. From time to time, we attempt to accommodate larger loans by selling participations in those loans to other financial institutions. However, we cannot assure you that we will be able to attract or maintain customers seeking larger loans or that we will be able to sell participations in such loans on terms we consider favorable. Our inability to attract and maintain these customers or our inability to sell loan participations on favorable terms could adversely impact our business, financial condition and results of operation.
Federal, state and local consumer lending laws may restrict our ability to originate certain mortgage loans or increase our risk of liability with respect to such loans and could increase our cost of doing business.
Federal, state and local laws have been adopted that are intended to eliminate certain lending practices considered “predatory.” These laws prohibit practices such as steering borrowers away from more affordable products, selling unnecessary insurance to borrowers, repeatedly refinancing loans and making loans without a reasonable expectation that the borrowers will be able to repay the loans irrespective of the value of the underlying property. Loans with certain terms and conditions and that otherwise meet the definition of a “qualified mortgage” may be protected from liability to a borrower for failing to make the necessary determinations. We may find it necessary to tighten our mortgage loan underwriting standards in response to these rules, which may constrain our ability to make loans consistent with our business strategies. It is our policy not to make predatory loans and to determine borrowers’ ability to repay, but the law and related rules create the potential for increased liability with respect to our lending and loan investment activities. They increase our cost
45
of doing business and, ultimately, may prevent us from making certain loans and cause us to reduce the average percentage rate or the points and fees on loans that we do make.
The Bank is subject to federal and state fair lending laws, and failure to comply with these laws could lead to material penalties.
Federal and state fair lending laws and regulations, such as the Equal Credit Opportunity Act and the Fair Housing Act, impose nondiscriminatory lending requirements on financial institutions. The Department of Justice, Consumer Financial Protection Bureau and other federal and state agencies are responsible for enforcing these laws and regulations. Private parties may also have the ability to challenge an institution’s performance under fair lending laws in private class action litigation. A successful challenge to our performance under the fair lending laws and regulations could adversely impact our rating under the Community Reinvestment Act and result in a wide variety of sanctions, including the required payment of damages and civil money penalties, injunctive relief, imposition of restrictions on merger and acquisition activity and restrictions on expansion activity, which could negatively impact our reputation, business, financial condition and results of operations. The Bank’s current Community Reinvestment Act rating is “Satisfactory.”
The Bank faces a risk of noncompliance and enforcement action with the Bank Secrecy Act and other anti-money laundering statutes and regulations.
The Bank Secrecy Act, as amended by the Uniting and Strengthening America by Providing Appropriate Tools Required to Intercept and Obstruct Terrorism Act of 2001 (the “Patriot Act”), and other laws and regulations require financial institutions, among other duties, to institute and maintain effective anti-money laundering programs and file suspicious activity and currency transaction reports as appropriate. The Financial Crimes Enforcement Network, established by the U.S. Treasury to administer the Bank Secrecy Act, is authorized to impose significant civil money penalties for violations of those requirements and has recently engaged in coordinated enforcement efforts with the individual federal banking regulators, as well as the U.S. Department of Justice, Drug Enforcement Administration and Internal Revenue Service. There is also increased scrutiny of compliance with the rules enforced by the Office of Foreign Assets Control. Federal and state bank regulators also have begun to increase focus on compliance with Bank Secrecy Act and anti-money laundering regulations. If our policies, procedures and systems are deemed deficient or the policies, procedures and systems of the financial institutions that we have already acquired or may acquire in the future are deficient, it would subject us to liability, including fines and regulatory actions such as restrictions on our ability to pay dividends and the necessity to obtain regulatory approvals to proceed with certain aspects of our business plan, including our acquisition plans, which would negatively impact our business, financial condition and results of operations. Failure to maintain and implement adequate programs to combat money laundering and terrorist financing could also have serious reputational consequences for the Bank.
Regulations relating to privacy, information security and data protection could increase our costs, affect or limit how they collect and use personal information and adversely affect their business opportunities.
We are subject to various privacy, information security and data protection laws, including requirements concerning security breach notification, and we could be negatively impacted by these laws. For example, our business is subject to the Financial Services Modernization Act of 1999, also known as the Gramm-Leach-Bliley Act, which, among other things: (i) imposes certain limitations on our ability to share nonpublic personal information about our customers with nonaffiliated third parties; (ii) requires that we provide certain disclosures to customers about our information collection, sharing and security practices and afford customers the right to “opt out” of any information sharing by us with nonaffiliated third parties (with certain exceptions) and (iii) requires us to develop, implement and maintain a written comprehensive information security program containing safeguards appropriate based on our size and complexity, the nature and scope of our activities, and the sensitivity of customer information we process, as well as plans for responding to data security breaches. Various state and federal banking regulators and states have also enacted data security breach notification
46
requirements with varying levels of individual, consumer, regulatory or law enforcement notification in certain circumstances in the event of a security breach. Moreover, legislators and regulators in the United States are increasingly adopting or revising privacy, information security and data protection laws that potentially could have a significant impact on our current and planned privacy, data protection and information security-related practices, our collection, use, sharing, retention and safeguarding of consumer or employee information, and some of our current or planned business activities. This could also increase our costs of compliance and business operations and could reduce income from certain business initiatives. This includes increased privacy-related enforcement activity at the federal level, by the Federal Trade Commission, as well as at the state level, such as with regard to mobile applications.
Compliance with current or future privacy, data protection and information security laws (including those regarding security breach notification) affecting customer or employee data to which we are subject could result in higher compliance and technology costs and could restrict our ability to provide certain products and services, which could have a material adverse effect on our business, financial conditions or results of operations. Our failure to comply with privacy, data protection and information security laws could result in potentially significant regulatory or governmental investigations or actions, litigation, fines, sanctions and damage to our reputation, which could have a material adverse effect on our business, results of operations and financial condition.
The FRB may require the Company to commit capital resources to support the Bank.
The FRB requires a bank holding company to act as a source of financial and managerial strength to a subsidiary bank and to commit resources to support such subsidiary bank. Under the “source of strength” doctrine, the FRB may require a bank holding company to make capital injections into a troubled subsidiary bank and may charge the bank holding company with engaging in unsafe and unsound practices for failure to commit resources to such a subsidiary bank. In addition, the Dodd-Frank Act directs the federal bank regulators to require that all companies that directly or indirectly control an insured depository institution serve as a source of financial strength for the institution. Under these requirements, in the future, the Company could be required to provide financial assistance to the Bank, if it experiences financial distress.
A capital injection may be required at times when the Company does not have the resources to provide it, and therefore the Company may be required to borrow the funds. In the event of a bank holding company’s bankruptcy, the bankruptcy trustee will assume any commitment by the holding company to a federal bank regulatory agency to maintain the capital of a subsidiary bank. Moreover, bankruptcy law provides that claims based on any such commitment will be entitled to a priority of payment over the claims of the holding company’s general unsecured creditors, including the holders of our note obligations. Thus, any borrowing that must be done by the holding company in order to make the required capital injection becomes more difficult and expensive and will adversely impact the holding company’s cash flows, financial condition, results of operations and prospects.
We are subject to stringent capital requirements, which may adversely impact our return on equity, require us to raise additional capital, or restrict us from paying dividends or repurchasing shares.
Federal regulations establish minimum capital requirements for insured depository institutions, including minimum risk-based capital and leverage ratios and define what constitutes “capital” for calculating these ratios. The regulations also establish a “capital conservation buffer” of 2.5%, effectively resulting in the following minimum capital ratios after giving effect to the additional capital conservation buffer: (1) a common equity Tier 1 capital ratio of 7.0%, (2) a Tier 1 to risk-based assets capital ratio of 8.5%, and (3) a total capital ratio of 10.5%. Additionally, if our consolidated assets were to exceed $3.0 billion or larger, the Company would be subject to consolidated holding company capital requirements similar to those applicable to the Bank. The application of such stringent capital requirements could, among other things, result in lower returns on equity, requiring the raising of additional capital, and resulting in regulatory actions constraining us from paying dividends or repurchasing shares if we are unable to comply with such requirements.
47
We may be a party to various lawsuits or regulatory proceedings. Litigation is subject to many uncertainties such that the expenses and ultimate exposure with respect to many of these matters cannot be ascertained.
From time to time, customers and others make claims and take legal action pertaining to our performance of fiduciary responsibilities or other matters. Whether customer claims and legal action are legitimate or unfounded, if such claims and legal actions are not resolved in our favor they may result in significant financial liability and/or adversely affect the market perception of us and our products and services as well as impact customer demand for those products and services. Further, we may be subject to regulatory proceedings. Any financial liability or reputation damage could have a material adverse effect on our business, which, in turn, could have a material adverse effect on our financial condition and results of operations.
The use of estimates and valuations may be different from actual results, which could have a material adverse effect on our consolidated financial statements.
We make various estimates that affect reported amounts and disclosures. Broadly, those estimates are used in measuring the fair value of certain financial instruments, establishing provision for loan losses and potential litigation liability. Market volatility may make it difficult to determine the fair value for certain of our assets and liabilities. Subsequent valuations, in light of factors then prevailing, may result in significant changes in the values of these financial instruments in future periods. In addition, at the time of any sales and settlements of these assets and liabilities, the price we ultimately realize will depend on the demand and liquidity in the market at that time for that particular type of asset or liability and may be materially lower than our estimate of their current fair value. Estimates are based on available information and judgment. Therefore, actual values and results could differ from our estimates and that difference could have a material adverse effect on our consolidated financial statements.
General Risks
Negative public opinion surrounding the Bank and the financial institutions industry generally could damage our reputation and adversely impact our earnings. Our ability to maintain our reputation is critical to the success of our business, and the failure to do so may materially adversely affect our performance.
We are a community bank and our reputation is one of the most valuable assets of our business. Reputation risk, or the risk to our business, earnings and capital from the actions of employees, the manner in which we conduct our business, or negative public opinion surrounding the Bank and the financial institutions industry generally, is inherent in our business. Negative public opinion can result from our actual or alleged conduct in any number of activities, including lending practices, corporate governance and acquisitions, and from actions taken by government regulators and community organizations in response to those activities. Negative public opinion can adversely affect our ability to keep and attract clients and employees and can expose us to litigation and regulatory action. Although we take steps to minimize reputation risk in dealing with our clients and communities, this risk will always be present given the nature of our business.
Furthermore, shareholders and other stakeholders have begun to consider how corporations are addressing environmental, social and governance (“ESG”) issues. Governments, investors, customers and the general public are increasingly focused on ESG practices and disclosures, and views about ESG are diverse and rapidly changing. These shifts in investing priorities may result in adverse effects on the trading price of our common stock if investors determine that we have not made sufficient progress on ESG matters. We could also face potential negative ESG-related publicity in traditional media or social media if shareholders or other stakeholders determine that we have not adequately considered or addressed ESG matters. If we, or our relationships with certain customers, vendors or suppliers became the subject of negative publicity, our ability to attract and retain customers and employees, and our financial condition and results of operations, could be adversely impacted.
48
Adverse weather events could negatively affect our local economies or disrupt it operations, which would have an adverse effect on our business or results of operations.
Adverse weather events can disrupt our operations, result in damage to our properties and negatively affect the local economies in which it operates. In addition, these weather events may result in a decline in value or destruction of properties securing our loans and an increase in delinquencies, foreclosures and loan losses.
Societal responses to climate change could adversely affect our business and performance, including indirectly through impacts on our customers.
Concerns over the long-term impacts of climate change have led and will continue to lead to governmental efforts around the world to mitigate those impacts. Consumers and businesses also may change their behavior on their own as a result of these concerns. We and our customers will need to respond to new laws and regulations as well as consumer and business preferences resulting from climate change concerns. We and our customers may face cost increases, asset value reductions and operating process changes. The impact on our customers will likely vary depending on their specific attributes, including reliance on or role in carbon intensive activities. Among the impacts to us could be a drop in demand for our products and services, particularly in certain sectors. In addition, we could face reductions in creditworthiness on the part of some customers or in the value of assets securing loans. Our efforts to take these risks into account in making lending and other decisions, including by increasing our business with climate-friendly companies, may not be effective in protecting us from the negative impact of new laws and regulations or changes in consumer or business behavior.
Risks Related to the Offering and an Investment in our Securities
The trading history of our common stock is characterized by low trading volume. An active, liquid trading market for our common stock may not develop, and you may not be able to sell your common stock at or above the public offering price, or at all.
Our common stock is currently quoted on the Pink Market operated by the OTC Markets Group under the trading symbol “LNKB.” Although our common stock is quoted on the Pink Market, it trades infrequently.
Upon the completion of the offering, our common stock is expected to be listed on the Nasdaq Capital Market under the symbol “LNKB.” We cannot predict the extent to which investor interest in us and additional shares outstanding will lead to a more active trading market in our common stock or how liquid that market might become. A public trading market having the desired characteristics of depth, liquidity and orderliness depends upon the presence in the marketplace of willing buyers and sellers of our common stock at any given time, which presence is dependent upon the individual decisions of investors, over which we have no control. If an active trading market does not develop, you may have difficulty selling your shares of common stock at an attractive price, or at all. An inactive market may also impair our ability to raise capital by selling our common stock and may impair our ability to expand our business by using our common stock as consideration in an acquisition.
Additionally, the public offering price for our common stock will be determined by negotiations between us and the representatives of the underwriters and may not be indicative of prices that will prevail in the open market following this offering. Consequently, you may not be able to sell your common stock at or above the public offering price or at any other price or at the time that you would like to sell.
You will incur immediate dilution as a result of this offering.
If you purchase our common stock in this offering, you will pay more for your shares than the net tangible book value per share immediately following consummation of this offering. As a result, you will incur immediate dilution of $1.53 per share representing the difference between the offering price of $8.75, the midpoint of the estimated initial public offering price range set forth on the cover page of this prospectus, and our adjusted net
49
tangible book value per share as of June 30, 2022 of $7.22 per share of common stock. This represents 17.5% dilution from the midpoint of the initial public offering price set forth on the cover page of this prospectus. Accordingly, if we were to be liquidated at our book value immediately following this offering, you would not receive the full amount of your investment. See section titled “Dilution” for additional information.
The price of our common stock could be volatile following this offering.
The market price of our common stock following this offering may be volatile and could be subject to wide fluctuations in price in response to various factors, some of which are beyond our control. These factors include, among other things:
| • | changes in general economic conditions and overall market fluctuations; |
| • | changes in interest rates; |
| • | actual or anticipated fluctuations in our quarterly or annual operating results; |
| • | changes in accounting standards, policies, guidance, interpretations or principles; |
| • | the public reaction to our press releases, our other public announcements and our filings with the SEC, or other news concerning our competitors or trends in our industry; |
| • | changes in financial estimates and recommendations by securities analysts following our stock, or the failure of securities analysts to cover our common stock after this offering; |
| • | changes in earnings estimates by securities analysts or our ability to meet those estimates; |
| • | the operating and stock price performance of other comparable companies; |
| • | the trading volume of our common stock; |
| • | new technology used, or services offered, by competitors; |
| • | changes in business, legal or regulatory conditions, or other developments affecting the financial services industry, participants in our industry; and |
| • | future sales of our common stock by us, directors, executives and significant shareholders, including the sale of our common stock by our existing shareholders who are not subject to the lock-up agreements described in “Underwriting.” |
These factors, and any of the risks described in this “Risk Factors” section, may adversely affect the trading price of our common stock, regardless of our actual operating performance, and could prevent you from selling your common stock at or above the price at which you purchased shares. In addition, the stock markets, from time to time, experience extreme price and volume fluctuations that may be unrelated or disproportionate to the operating performance of companies. These broad fluctuations may adversely affect investor confidence and the market price of our common stock, regardless of our actual performance.
If the market price of our common stock reaches an elevated level following this offering, it may materially and rapidly decline. In the past, following periods of volatility in the market price of a company’s securities, shareholders have often instituted securities class action litigation. If we were to be involved in a class action lawsuit, we could incur substantial costs and it could divert the attention of senior management and have a material adverse effect on our business, financial condition and results of operations.
If equity research analysts do not publish research or reports about our business, or if they do publish such reports but issue unfavorable commentary or downgrade our common stock, the price and trading volume of our common stock could decline.
The trading market for our common stock could be affected by whether equity research analysts publish research or reports about us and our business. We currently have no research analysts that publishes reports about
50
us and our business. We cannot predict at this time whether any research analysts will publish research and reports on us and our common stock. If one or more equity analysts do cover us and our common stock and publish research reports about us, the price of our stock could decline if one or more securities analysts downgrade our stock or if those analysts issue other unfavorable commentary or cease publishing reports about us or our business.
If any of the analysts who elect to cover us downgrades our stock, our stock price could decline rapidly. If any of these analysts ceases coverage of us, we could lose visibility in the market, which in turn could cause our common stock price or trading volume to decline and our common stock to be less liquid.
If a substantial number of shares become available for sale and are sold in a short period of time, the market price of our common stock could decline.
If our existing shareholders sell substantial amounts of our common stock in the public market following this offering, the market price of our common stock could decrease significantly. The perception in the public market that our existing shareholders might sell shares of common stock could also depress our market price. Upon completion of this offering, we will have 14,413,435 shares of our common stock outstanding, or 15,099,685 shares if the underwriters exercise in full their option to purchase additional shares. Our directors and executive officers, collectively representing 19.44% of our beneficial ownership of common shares outstanding upon completion of this offering, or 18.63% if the underwriters exercise in full their option to purchase additional shares, will be subject to the lock-up agreements described in “Underwriting” and the Rule 144 holding period requirements described in “Shares Eligible for Future Sale.” After all of the lock-up periods have expired and the holding periods have elapsed, an estimated 1,718,545 additional shares (excluding exercisable options and warrants) of our outstanding common stock will be eligible for sale in the public market. In addition, the underwriters may, at any time and without notice, release all or a portion of the shares subject to lock-up agreements. The market price of shares of our common stock may drop significantly when the restrictions on resale by our existing shareholders lapse. A decline in the price of shares of our common stock might impede our ability to raise capital through the issuance of additional shares of our common stock or other equity securities and could result in a decline in the value of the shares of our common stock purchased in this offering.
We are an “emerging growth company” under the JOBS Act, and we cannot be certain whether the reduced disclosure requirements applicable to emerging growth companies will make our common stock less attractive to investors.
We are an “emerging growth company” under the Jumpstart Our Business Startups Act (the “JOBS Act”), and is, therefore, permitted to, and intends to, take advantage of certain exemptions from certain disclosure requirements. We will be an “emerging growth company” until the earliest of: (i) the last day of the fiscal year during which the Company had total annual gross revenues of $1.07 billion or more, (ii) December 31, 2026, (iii) the date on which the Company has, during the previous three-year period, issued more than $1.0 billion in non-convertible debt or (iv) the date on which the Company is deemed a “large accelerated filer,” as defined under the federal securities laws.
For so long as we remain an “emerging growth company,” we may take advantage of certain exemptions from various reporting requirements that are applicable to other public companies that are not “emerging growth companies,” including, but not limited to, not being required to comply with the auditor attestation requirements of Section 404 of the Sarbanes-Oxley Act of 2002, as amended, reduced disclosure obligations regarding executive compensation in our periodic reports and proxy statements and exemptions from the requirements of holding a nonbinding advisory vote on certain executive compensation matters, such advisory votes on executive compensation and shareholder approval of any golden parachute payments not previously approved. As a result, our shareholders may not have access to certain information that they may deem important. Although we intend to rely on the exemptions provided in the JOBS Act, the exact implications of the JOBS Act for the Company are still subject to interpretations and guidance by the SEC and other regulatory agencies.
51
In addition, Section 107 of the JOBS Act provides that an “emerging growth company” can take advantage of the extended transition period provided in Section 7(a)(2)(B) of the Securities Act for complying with new or revised financial accounting standards. We have elected to delay the adoption of certain accounting standards until those standards would otherwise apply to private companies.
We cannot predict whether investors will find our common stock less attractive as a result of taking advantage of these exemptions. If some investors find our common stock less attractive as a result of these choices, there may be a less active trading market for our common stock, and our stock price may be more volatile.
Our management will have broad discretion as to the use of proceeds from this offering, and we may not use the proceeds effectively.
We are not required to apply any portion of the net proceeds of this offering for any particular purpose. Accordingly, our management will have broad discretion as to the application of the net proceeds of this offering and could use them for purposes other than those contemplated at the time of this offering. At June 30, 2022, our total shareholders’ equity was $104.8 million and our annualized total return on average common equity was 5.91% for the six months ended June 30, 2022. We expect our total shareholders’ equity to be $141.0 million upon completion of the offering, based on the midpoint of the estimated initial public offering price range set forth on the cover page of this prospectus. A portion of the proceeds from this offering are expected to be used to provide additional capital as a cushion against minimum regulatory capital requirements, which may tend to reduce our return on equity as opposed to if such proceeds were used for further growth. Our shareholders may not agree with the manner in which our management chooses to allocate and invest the net proceeds. We may not be successful in using the net proceeds from this offering to increase our profitability or market value and we cannot predict whether the proceeds will be invested to yield a favorable return.
Our shareholders have limited control over changes in our policies and operations, which increases the uncertainty and risks that shareholders face.
The board of directors of the Company determine the major policies of the Company, including our policies regarding growth and distributions. The board of directors may amend or revise these and other policies without a vote of the shareholders. The board of directors’ broad discretion in setting policies and shareholders’ inability to exert control over those policies increases the uncertainty and risks the shareholders face.
Our directors and executive officers beneficially own a significant portion of our common stock and have substantial influence over us.
Our directors and executive officers, as a group, beneficially owned approximately 25.7% of our outstanding shares of common stock as of August 15, 2022. As a result of this level of ownership, our directors and executive officers have the ability, by taking coordinated action, to exercise significant influence over our affairs and policies. The interests of our directors and executive officers may not be consistent with your interests as a shareholder. This influence may also have the effect of delaying or preventing changes of control or changes in management, or limiting the ability of our other shareholders to approve transactions that they may deem to be in the best interests of our Company.
Our dividend policy may change without notice and any payment of dividends in the future is subject to the discretion of our board of directors.
The holders of our common stock will receive cash dividends if and when declared by our board of directors out of legally available funds. Our principal business operations are conducted through our subsidiary, The Gratz Bank. Cash available to pay dividends to our shareholders is derived primarily, if not entirely, from dividends paid by The Gratz Bank to us. The ability of The Gratz Bank to pay dividends to us, as well as our ability to pay
52
dividends to our shareholders, will continue to be subject to, and limited by, certain legal and regulatory restrictions. Further, any lenders making loans to us may impose financial covenants that may be more restrictive with respect to dividend payments than the regulatory requirements.
Pursuant to our Merger Agreement with GNBF, for three years following the effective time of the Merger, the Company will pay a quarterly cash dividend in an amount equal to or greater than $0.30 per share per year, provided sufficient funds are legally available and that the Company and the Bank remain “well-capitalized” in accordance with applicable regulatory guidelines. Subject to the approval of our board of directors and regulatory restrictions, the Company anticipates that it will continue to pay cash dividends on a quarterly basis in an amount equal to or greater than $0.30 per share per year. Any future determination relating to our dividend policy will be made at the discretion of our board of directors and will depend on a number of factors, including our future earnings, capital requirements, financial condition, future prospects, regulatory restrictions, and other factors that our board of directors may deem relevant.
A future issuance of stock could dilute the value of our common stock.
We may sell additional shares of common stock, or securities convertible into or exchangeable for such shares, in subsequent public or private offerings. Upon completion of this offering, there will be 14,413,435 shares of our common stock issued and outstanding, or 15,099,685 shares if the underwriters exercise in full their option to purchase additional shares. Future issuance of any new shares could cause further dilution in the value of our outstanding shares of common stock. We cannot predict the size of future issuances of our common stock, or securities convertible into or exchangeable for such shares, or the effect, if any, that future issuances and sales of shares of our common stock will have on the market price of our common stock. Sales of substantial amounts of our common stock (including shares issued in connection with an acquisition), or the perception that such sales could occur, may adversely affect prevailing market prices of our common stock.
Our common stock is subordinate to our existing and future indebtedness.
Shares of our common stock are equity interests and do not constitute indebtedness. As such, our common stock ranks junior to all our customer deposits and indebtedness, and other non-equity claims on us, with respect to assets available to satisfy claims. In addition, the shares of common stock rank junior to the $20.0 million in subordinated debt that we assumed in connection with the Merger and the $20.0 million of subordinated debt that we issued in April 2022.
Our Articles of Incorporation permit the board of directors to issue stock with terms that may subordinate the rights of the holders of our common stock or discourage a third party from acquiring the Company in a manner that could result in a premium price to shareholders.
The board of directors may classify or reclassify any unissued shares of our common stock, classify any unissued shares of our preferred stock and reclassify any previously classified but unissued shares of our preferred stock into other classes or series of stock and set the preferences, conversion or other rights, voting powers, restrictions, limitations as to dividends or other distributions, qualifications and terms and conditions of redemption of any such stock. Thus, the board of directors could authorize the issuance of preferred stock with priority as to distributions and amounts payable upon liquidation over the rights of the holders of our common stock. Such preferred stock could also have the effect of delaying, deferring or preventing a change in control of the Company, including an extraordinary transaction (such as a merger, tender offer or sale of all or substantially all of our assets) that might provide a premium price to holders of our common stock.
Our Articles of Incorporation and Bylaws, and certain banking laws applicable to us, could have an anti-takeover effect that decreases our chances of being acquired, even if our acquisition is in our shareholders’ best interests.
Certain provisions of our Articles of Incorporation and Bylaws, and federal and state banking laws, including regulatory approval requirements, could make it more difficult for a third party to acquire control of
53
our organization or conduct a proxy contest, even if those events were perceived by many of our shareholders as beneficial to their interests. These provisions, and the corporate and banking laws and regulations applicable to us:
| • | enable our board of directors to increase the size of the board and fill the vacancies created by the increase; |
| • | provide that directors may only be removed for cause and by a majority of the votes entitled to be cast; |
| • | enable our board of directors to amend our Bylaws without shareholder approval, subject, however, to any provision of the Articles of Incorporation, Bylaws, or the Pennsylvania Business Corporation Law that requires action to be taken by the shareholders and the general power of the shareholders to change such action in accordance with the Bylaws and Pennsylvania Business Corporation Law; |
| • | require advance notice for shareholder proposals and director nominations; |
| • | require a supermajority vote of the shareholders to approve a merger that has not been approved by the board of directors, and to amend certain provisions in the Articles of Incorporation and the Bylaws; and |
| • | require prior regulatory approval of any transaction involving control of our organization. |
The foregoing may discourage potential acquisition proposals and could delay or prevent a change in control.
An investment in our common stock is not an insured deposit and is not guaranteed by the FDIC, so you could lose some or all of your investment.
An investment in our common stock is not a deposit account or other obligation of the Bank and, therefore, is not insured against loss or guaranteed by the FDIC, any other deposit insurance fund or by any other governmental, public or private entity. An investment in our common stock is inherently risky for the reasons described herein. As a result, if you acquire our common stock, you could lose some or all of your investment.
54
CAUTIONARY NOTE REGARDING FORWARD-LOOKING STATEMENTS
This prospectus contains forward-looking statements within the meaning of the federal securities laws. These forward-looking statements reflect our current views with respect to, among other things, future events and our financial performance. These statements are often, but not always, made through the use of words or phrases such as “may,” “might,” “should,” “could,” “predict,” “potential,” “believe,” “expect,” “attribute,” “continue,” “will,” “anticipate,” “seek,” “estimate,” “intend,” “plan,” “projection,” “goal,” “target,” “outlook,” “aim,” “would,” “annualized” and “outlook,” or the negative version of those words or other comparable words or phrases of a future or forward-looking nature. These forward-looking statements include, but are not limited to:
| • | statements of our goals, intentions and expectations; |
| • | statements regarding our business plans, prospects, growth and operating strategies; |
| • | statements regarding the quality of our loan and investment portfolios; and |
| • | estimates of our risks and future costs and benefits. |
These forward-looking statements are not historical facts, and are based on current expectations, estimates and projections about our industry, management’s beliefs and certain assumptions made by management, many of which, by their nature, are inherently uncertain and beyond our control. Accordingly, we caution you that any such forward-looking statements are not guarantees of future performance and are subject to risks, assumptions, estimates and uncertainties that are difficult to predict. Although we believe that the expectations reflected in these forward-looking statements are reasonable as of the date made, actual results may prove to be materially different from the results expressed or implied by the forward-looking statements.
The following factors, among others, could cause actual results to differ materially from the anticipated results or other expectations expressed in the forward-looking statements:
| • | general economic conditions, either nationally or in our market areas, that are worse than expected; |
| • | fluctuations in real estate values and both residential and commercial real estate market conditions; |
| • | demand for loans and deposits in our market area; |
| • | conditions relating to the COVID-19 pandemic, including the severity and duration of the associated economic slowdown either nationally or in our market areas and the effectiveness of vaccination programs, that are worse than expected; |
| • | changes in the level and direction of loan delinquencies and write-offs and changes in estimates of the adequacy of the allowance for loan losses; |
| • | our ability to access cost-effective funding; |
| • | our ability to implement and change our business strategies; |
| • | competition among depository and other financial institutions; |
| • | inflation and changes in the interest rate environment that reduce our margins or reduce the fair value of financial instruments; |
| • | the rate of delinquencies and amounts of loans charged-off; |
| • | adverse changes in the securities markets; |
| • | changes in laws or government regulations or policies affecting financial institutions, including changes in regulatory fees and capital requirements; |
| • | our ability to capitalize on strategic opportunities; |
55
| • | our ability to successfully introduce new products and services, enter new markets, and capitalize on growth opportunities; |
| • | our ability to successfully integrate into our operations any assets, liabilities, customers, systems and management personnel we may acquire and our ability to realize related revenue synergies and cost savings within expected time frames, and any goodwill charges related thereto; |
| • | our ability to retain our existing customers; |
| • | changes in consumer spending, borrowing and savings habits; |
| • | changes in accounting policies and practices, as may be adopted by the bank regulatory agencies, the Financial Accounting Standards Board, the Securities and Exchange Commission or the Public Company Accounting Oversight Board; |
| • | changes in our organization, compensation and benefit plans; |
| • | changes in the quality or composition of our loan or investment portfolios; |
| • | a breach in security of our information systems, including the occurrence of a cyber incident or a deficiency in cyber security; |
| • | political instability or civil unrest; |
| • | acts of war or terrorism; |
| • | competition and innovation with respect to financial products and services by banks, financial institutions and non-traditional providers, including retail businesses and technology companies; |
| • | the failure to attract and retain skilled people; |
| • | the fiscal and monetary policies of the federal government and its agencies; and |
| • | other economic, competitive, governmental, regulatory and operational factors affecting our operations, pricing, products and services described elsewhere in this prospectus. |
The foregoing factors should not be construed as exhaustive and should be read in conjunction with other cautionary statements that are included in this prospectus. If one or more events related to these or other risks or uncertainties materialize, or if our underlying assumptions prove to be incorrect, actual results may differ materially from what we anticipate. Accordingly, you should not place undue reliance on any such forward-looking statements. Any forward-looking statement speaks only as of the date on which it is made, and we do not undertake any obligation to publicly update or review any forward-looking statement, whether as a result of new information, future developments or otherwise. New risks and uncertainties arise from time to time, and it is not possible for us to predict those events or how they may affect us. In addition, we cannot assess the impact of each factor on our business or the extent to which any factor, or combination of factors, may cause actual results to differ materially from those contained in any forward-looking statements.
Further information on other factors that could affect us are included in the section captioned “Risk Factors.”
56
USE OF PROCEEDS
Assuming a public offering price of $8.75 per share, we estimate that the net proceeds from the sale of the shares of common stock by us will be approximately $36.2 million (or approximately $41.8 million if the underwriters exercise in full their option to purchase additional shares of common stock from us), after deducting the estimated underwriting discounts and commissions and estimated offering expenses payable by us. Each $1.00 increase (or decrease) in the per share public offering price would increase (or decrease) the net proceeds to us of this offering by approximately $4.3 million (or approximately $4.9 million if the underwriters elect to exercise their purchase option in full), after deducting estimated underwriting discounts and offering expenses.
We intend to use the net proceeds of the offering to support the growth of The Gratz Bank, including providing capital to The Gratz Bank to support growth of its operations, including, without limitation, expansion of its lending activities, financing strategic acquisitions that may from time to time arise and for other general corporate purposes.
Our management will retain broad discretion to allocate the net proceeds of this offering, and the precise amounts and timing of our use of the net proceeds of this offering will depend upon market conditions, as well as other factors. Until we deploy the proceeds of this offering for the uses described above, we expect to hold such proceeds in short-term investments.
57
CAPITALIZATION
The following table shows our capitalization, including regulatory capital ratios, on a consolidated basis, as of June 30, 2022:
| • | on an actual basis; and |
| • | on a pro forma basis to give effect to the issuance and sale by us of 4,575,000 shares of common stock in this offering (assuming the underwriters do not exercise their option to purchase any additional shares to cover over-allotments, if any), and the receipt and application of the net proceeds from the sale of these shares at an initial public offering price of $8.75 per share after deducting underwriting discounts and commissions and the estimated offering expenses payable by us. |
You should read this table in conjunction with “Use of Proceeds,” “Summary Historical Consolidated Financial Data of the Company,” “Management’s Discussion and Analysis of Financial Condition and Results of Operations” and our consolidated financial statements and the related notes included elsewhere in this prospectus.
At June 30, 2022 | ||||||||
Actual | As Adjusted | |||||||
(dollars in thousands except per share data) | ||||||||
(unaudited) | ||||||||
Short term debt | $ | 1,639 | $ | 1,639 | ||||
Long term debt | 40,585 | 40,585 | ||||||
Total debt | 42,224 | 42,224 | ||||||
Shareholders’ equity: | ||||||||
Common stock, par value $0.01 per share; authorized—25,000,000 shares; outstanding—9,838,435 shares actual and 14,413,435 shares as adjusted | $ | 99 | $ | 104 | ||||
Surplus | 83,070 | 119,288 | ||||||
Retained earnings | 26,491 | 26,491 | ||||||
Accumulated other comprehensive income (loss), net of taxes | (4,889 | ) | (4,889 | ) | ||||
Total shareholders’ equity | $ | 104,771 | $ | 140,994 | ||||
Total capitalization | $ | 146,995 | $ | 183,218 | ||||
Capital ratios | ||||||||
Tangible common equity to tangible assets(1) | 6.62 | % | 10.16 | % | ||||
Common equity tier 1 capital to risk-weighted assets(2) | 11.94 | % | 15.73 | % | ||||
Tier 1 capital to average assets(2) | 10.10 | % | 12.83 | % | ||||
Tier 1 capital to risk-weighted assets(2) | 11.94 | % | 15.73 | % | ||||
Total capital to risk-weighted assets(2) | 12.42 | % | 16.22 | % | ||||
Per share data | ||||||||
Book value per common share | $ | 10.66 | $ | 9.78 | ||||
Tangible book value per common share(1) | $ | 6.89 | $ | 7.22 | ||||
| (1) | Tangible book value represents the amount of our total tangible assets reduced by our total liabilities. Tangible assets are calculated by reducing total assets, as defined by GAAP, by $35.8 million in goodwill and $1.2 million in other intangible assets. Tangible book value at June 30, 2022 was $67.8 million “Actual” and $104.0 million “As Adjusted.” Tangible book value per common share represents our tangible book value divided by the number of shares of our common stock outstanding. |
| (2) | Ratios are for the Bank only. |
58
DILUTION
If you invest in our common stock, your ownership interest will be immediately diluted to the extent of the difference between the initial public offering price per share of our common stock in this offering and the net tangible book value per share of common stock upon completion of this offering.
Net tangible book value per common share represents the amount of our total tangible assets less total liabilities, divided by the number of shares of common stock outstanding. Tangible assets are calculated by reducing total assets by $35.8 million in goodwill and $1.2 million in other intangible assets. Our net tangible book value as of June 30, 2022 was $67.8 million, or $6.89 per share of common stock, based upon 9,838,435 shares of common stock outstanding as of such date.
After giving effect to the sale of 4,575,000 shares of our common stock by us at the initial public offering price of $8.75 per share, the midpoint of the estimated initial public offering price range set forth on the cover page of this prospectus, and after deducting the estimated underwriting discounts and commissions and estimated offering expenses payable by us, our net tangible book value as of June 30, 2022 would have been approximately $104.0 million, or approximately $7.22 per share of common stock. This represents an immediate increase in net tangible book value of $0.33 per share to existing common shareholders, and an immediate dilution of $1.53 per share to investors participating in this offering. If the initial public offering price is higher or lower, the dilution to new shareholders will be greater or less, respectively.
The following table illustrates this dilution on a per share basis:
Assumed initial public offering price per share | $ | 8.75 | ||||||
Net tangible book value per share at June 30, 2022 | $ | 6.89 | ||||||
Increase in net tangible book value per share attributable to this offering | 0.33 | |||||||
As adjusted tangible book value per share after this offering | 7.22 | |||||||
Dilution in net tangible book value per share to new investors | $ | 1.53 | ||||||
A $1.00 increase (or decrease) in the assumed initial public offering price of $8.75 per share, which is the midpoint of the estimated initial public offering price range set forth on the cover page of this prospectus, would increase (or decrease) the as adjusted net tangible book value per common share after this offering by approximately $0.30, and dilution in net tangible book value per common share to new investors by approximately $2.24, assuming that the number of shares offered by us, as set forth on the cover page of this prospectus, remains the same and after deducting estimated underwriting discounts and commissions and estimated offering expenses payable by us. If the underwriters exercise in full their option to purchase additional shares of our common stock in this offering, the as adjusted net tangible book value after this offering would be $7.58 per share, the increase in net tangible book value to existing shareholders would be $0.69 per share and the dilution to new investors would be $1.17 per share, in each case assuming an initial public offering price of $8.75 per share, which is the midpoint of the estimated initial public offering price range set forth on the cover page of this prospectus.
59
The following table summarizes, as of June 30, 2022, the differences between our existing shareholders and new investors with respect to the number of shares of our common stock purchased from us, the total consideration paid and the average price per share paid. The calculations with respect to shares purchased by new investors in this offering reflect an assumed offering price of $8.75 per share, which is the midpoint of the estimated initial public offering price range set forth on the cover page of this prospectus, before deducting estimated underwriting discounts and commissions and estimated offering expenses payable by us:
Shares Purchased | Total Consideration | Average Price Per Share | ||||||||||||||||||
Number | Percentage | Amount | Percentage | |||||||||||||||||
Existing shareholders as of June 30, 2022 | 9,838,435 | 68.3% | $ | 83,169 | 67.5% | $8.45 | ||||||||||||||
New Investors | 4,575,000 | 31.7% | 40,031 | 32.5% | 8.75 | |||||||||||||||
Total | 14,413,435 | 100.0% | $ | 123,200 | 100.0% | 8.55 | ||||||||||||||
If the underwriters exercise their option to purchase additional shares in full, then our pro forma net tangible book value of our common stock as of June 30, 2022, would be approximately $114.5 million, or $7.58 per share, representing an immediate increase in net tangible book value to our existing shareholders of approximately $0.69 per share and immediate dilution in net tangible book value to investors purchasing shares in this offering of approximately $1.17 per share.
The table above excludes 475,000 shares of our common stock reserved for issuance in connection with equity awards available for issuance under our 2022 Equity Incentive Plan as of June 30, 2022. If equity awards are issued under our 2022 Equity Incentive Plan, investors purchasing in this offering will experience further dilution.
60
DIVIDEND POLICY
On December 15, 2021, the Company paid its first quarterly cash dividend of $0.075 per share. The following table shows the amount and the dividends paid on shares of LINKBANCORP common stock in 2021 and through June 30, 2022:
Quarterly Period | Amount Per Share | |||
June 30, 2022 | $ | 0.075 | ||
March 31, 2022 | $ | 0.075 | ||
December 31, 2021 | $ | 0.075 | ||
On August 18, 2022, we declared a quarterly dividend of $0.075 per share of common stock for the second quarter of 2022. This dividend is payable to shareholders of record at the close of business on August 31, 2022, payable on September 15, 2022. Investors in this offering are not entitled to receive this dividend.
The Merger Agreement with GNBF provides that, for three years following the effective time of the Merger, the Company will pay a quarterly cash dividend in an amount equal to or greater than $0.30 per share per year, provided sufficient funds are legally available and that the Company and the Bank remain “well-capitalized” in accordance with applicable regulatory guidelines. Subject to the approval of our board of directors and regulatory restrictions, the Company anticipates that it will continue to pay cash dividends on a quarterly basis in an amount equal to or greater than $0.30 per share per year. Any future determination to pay cash dividends on our common stock will be made by our board of directors and will depend on a number of factors, including:
| • | our historical and projected financial condition, liquidity and results of operations; |
| • | our capital levels and requirements; |
| • | statutory and regulatory prohibitions and other limitations; |
| • | any contractual restriction on our ability to pay cash dividends, including pursuant to the terms of any of our credit agreements or other borrowing arrangements; |
| • | our business strategy; |
| • | tax considerations; |
| • | any acquisitions or potential acquisitions that we may examine; |
| • | general economic conditions; and |
| • | other factors deemed relevant by our board of directors. |
As a Pennsylvania corporation, we are subject to certain restrictions on dividends under Pennsylvania General Corporation Law. Generally, Pennsylvania law limits cash dividends if the corporation would be unable to pay its debts as they become due in the usual course of business or if the corporation’s total assets would be less than the sum of its total liabilities plus the amount that would be needed, if the corporation were to be dissolved when the distribution is measured, to satisfy the shareholders whose preferential rights are superior to those receiving the distribution.
We are also subject to certain restrictions on the payment of cash dividends as a result of banking laws, regulations and policies. The FRB has issued a policy statement regarding the payment of dividends by bank holding companies. In general, the FRB’s policy provides that dividends should be paid only to the extent that the company’s net income for the past two years is sufficient to fund the dividends and only if the prospective rate of earnings retention by the bank holding company appears consistent with the organization’s capital needs, asset quality and overall financial condition. The FRB has the authority to prohibit a bank holding company from paying dividends if such payment is deemed to be an unsafe or unsound practice. See “Supervision and Regulation – Holding Company Regulation.”
61
Because we are a bank holding company, we are dependent upon the payment of dividends by The Gratz Bank to us as our principal source of funds to pay dividends in the future and to make other payments. The Gratz Bank is also subject to various legal, regulatory and other restrictions on its ability to pay dividends and make other distributions and payments to us. The Pennsylvania Banking Code states, in part, that dividends may be declared and paid only out of accumulated net earnings and may not be declared or paid unless surplus is at least equal to capital. Dividends may not reduce surplus without the prior consent of the PADOBS. The PADOBS and the FDIC have the authority to prohibit a Pennsylvania commercial bank from paying dividends if such payment is deemed to be an unsafe or unsound practice. In addition, as a depository institution the deposits of which are insured by the FDIC, The Gratz Bank may not pay dividends or distribute any of its capital assets while it remains in default on any assessment due to the FDIC. The Gratz Bank currently is not (and never has been) in default under any of its obligations to the FDIC. See “Supervision and Regulation— Bank Regulation—Capital Distributions.” To pay a cash dividend, a state bank must also maintain an adequate capital conservation buffer under the capital rules described in “Supervision and Regulation— Bank Regulation—Capital Requirements.”
62
MARKET FOR THE COMMON STOCK
Existing shares of LINKBANCORP’s common stock are quoted on the Pink Open Market operated by the OTC Markets Group, Inc. (the “Pink Market”) under the symbol “LNKB.” As of September 1, 2022, there were approximately 593 holders of record of our common stock. Upon completion of the offering, we expect that shares of our common stock will be traded on the Nasdaq Capital Market under the symbol “LNKB.”
The following table sets forth the high and low bid prices for shares of LINKBANCORP common stock for the periods indicated, as obtained from the Pink Market. These reported market quotations reflect inter-dealer prices, without retail mark-up, markdown or commission and may not necessarily represent actual transactions.
Fiscal Year Ending December 31, 2022 | High | Low | ||||||
Third Quarter through September 2, 2022 | $ | 9.50 | $ | 8.80 | ||||
Second Quarter | 11.21 | 9.20 | ||||||
First Quarter | 11.95 | 11.05 | ||||||
Fiscal Year Ending December 31, 2021 | ||||||||
Fourth Quarter | $ | 13.40 | $ | 11.50 | ||||
Third Quarter | 19.00 | 13.05 | ||||||
Second Quarter | 13.75 | 11.55 | ||||||
First Quarter | 12.00 | 11.25 | ||||||
Fiscal Year Ending December 31, 2020 | ||||||||
Fourth Quarter | $ | 12.09 | $ | 10.25 | ||||
Third Quarter | 11.00 | 9.99 | ||||||
Second Quarter | 12.00 | 9.05 | ||||||
First Quarter | 10.00 | 10.00 | ||||||
Although our shares have been quoted on the Pink Market, the prices at which such transactions occurred may not necessarily reflect the price that would be paid for our common stock in a more active market. We anticipate that this offering and the listing of our common stock on the Nasdaq Capital Market will result in a more active trading market for our common stock. However, we cannot assure you that a liquid trading market for our common stock will develop or be sustained after this offering. You may not be able to sell your shares quickly or at the market price if trading in our common stock is not active. See “Underwriting” for more information regarding our arrangements with the underwriters.
63
MANAGEMENT’S DISCUSSION AND ANALYSIS OF FINANCIAL CONDITION AND RESULTS OF OPERATIONS
The following discussion and analysis of our financial condition and results of operations at and for the three and six months ended June 30, 2022 and 2021 and at and for the years ended December 31, 2021 and 2020 should be read in conjunction with our consolidated financial statements and the accompanying notes included elsewhere in this prospectus. Financial information prior to September 18, 2021 refers to the consolidated financial statements of GNBF, the accounting acquiror in the Merger described below. This discussion and analysis contains forward-looking statements that are subject to certain risks and uncertainties and are based on certain assumptions that we believe are reasonable but may prove to be inaccurate. Certain risks, uncertainties and other factors, including those set forth under “Cautionary Note Regarding Forward-Looking Statements,” “Risk Factors” and elsewhere in this prospectus, may cause actual results to differ materially from those projected results discussed in the forward-looking statements appearing in this discussion and analysis. We assume no obligation to update any of these forward-looking statements.
Overview
The Company operates primarily through its sole subsidiary, The Gratz Bank and LINKBANK, a division of The Gratz Bank, which provides traditional lending, deposit gathering and cash services to retail customers, small businesses and nonprofit organizations. The Bank focuses its lending activities on small businesses, targeted to create a diverse loan portfolio in relation to its underlying collateral and different business segments with unique cash flow generation and varied interest rate sensitivity. The Bank offers a full suite of deposit products and cash management services focused on the small business and nonprofit segments. The Bank intends to legally change its name to LINKBANK in November 2022 to create one single brand, subject to the receipt of applicable regulatory approvals.
Our revenues consist primarily of interest income earned on loans and investments. Interest income is partially offset by interest expense incurred on deposits, borrowings and other interest-bearing liabilities. Net interest income is affected by the balances of interest-earning assets and interest-bearing liabilities and their relative interest rates. Net interest income is typically further reduced by a provision for loan losses.
Noninterest income also contributes to our operating results, consisting of service charges on deposit accounts, earnings on bank-owned life insurance, revenue from the sale of securities, revenue from the sale of SBA loans and residential mortgage loans to the secondary market and related servicing fees. Noninterest expense, which include salaries and employee benefits, occupancy and equipment costs, data processing, professional fees, FDIC insurance and other general and administrative expenses, are the Company’s primary expenditures incurred as a result of operations.
Financial institutions, in general, are significantly affected by economic conditions, competition, and the monetary and fiscal policies of the federal government. Lending activities are influenced by the demand for and supply of housing and commercial real estate, competition among lenders, interest rate conditions, and funds availability. Our operations and lending are primarily located in Central and Southeastern Pennsylvania in Dauphin, Chester, Cumberland, Lancaster, Northumberland, and Schuylkill Counties, and are influenced by local economic conditions. Deposit balances and cost of funds are influenced by prevailing market rates on competing investments, customer preferences, and levels of personal income and savings in our primary market area. Operations are also significantly impacted by government policies and actions of regulatory authorities. Future changes in applicable law, regulations or government policies may materially impact the Company.
Completion of Merger
On September 18, 2021, the Company completed its merger with GNB Financial Services, Inc., with LINKBANCORP as the surviving corporation. Immediately following the Merger, LINKBANK merged with and into The Gratz Bank, a wholly-owned subsidiary of GNBF, with The Gratz Bank as the surviving bank. LINKBANK’s banking offices continue to operate as LINKBANK, a division of The Gratz Bank.
64
Under the Merger Agreement, GNBF shareholders had the opportunity to elect to receive $87.68 per share in cash or 7.3064 of LINKBANCORP common shares for each share they owned. The Merger Agreement provided for proration procedures intended to ensure that, in the aggregate, at least 80% of the GNBF common shares outstanding would be exchanged for LINKBANCORP common stock. The Merger was effective on September 18, 2021, with the GNBF shareholders collectively electing to receive cash for 14.865% of their common shares and LINKBANCORP common shares for 85.135% of existing GNBF common shares. These elections resulted in LINKBANCORP issuing 4.85 million common shares to GNBF shareholders which represented approximately 49.4% of the post-merger outstanding common shares of LINKBANCORP.
As described in Note 2 of the Company’s notes to the audited consolidated financial statements, the Merger has been accounted for as a reverse acquisition and, accordingly, the historical financial information of the Company for all periods prior to September 18, 2021 is that of GNBF and its subsidiaries. For all periods beginning on September 18, 2021 and thereafter, the financial information is that of the Combined Company. See Note 2 “Merger” of the Company’s notes to the audited consolidated financial statements for further information.
Key Factors Affecting Our Business
COVID-19
.
Net Interest Income
The cost of our deposits and short-term borrowings is primarily based on short-term interest rates, which are largely driven by the FRB’s actions and market competition. The yields generated by our loans and securities are typically affected by short-term and long-term interest rates, which are driven by market competition and market rates which are often impacted by the FRB’s actions. The level of net interest income is influenced by movements in such interest rates and the pace at which such movements occur.
Based on our asset sensitivity, a steepened yield curve and higher interest rates generally could have a beneficial impact on our net interest income. Conversely, a flat yield curve at lower rates would be expected to have an adverse impact on our net interest income.
Noninterest Income
.
65
Noninterest Expense
.
Credit Quality
.
Competition.
Economic Conditions.
At the beginning of 2020, the FRB set the target range for the Fed Funds rate at 1.50% to 1.75% and by March 31, 2020, the Fed Funds target range was reduced to 0% to 0.25% in response to the COVID-19 pandemic. The Fed Funds rate was left unchanged through the remainder of 2020 and through December 31, 2021. However, on March 16, 2022, the FRB increased the Fed Funds target range to 0.25% to 0.5% and subsequently has further increased the Fed Funds rate multiple times to a target range of 2.25% to 2.50% in order to combat high inflation. The consensus is that rates will be increased additional times during 2022. Additionally, the current geopolitical environment in Europe provides yet another layer of uncertainty around the actions that the FRB might take. It is reasonably foreseeable that estimates made in the financial statements could be materially and adversely impacted in the near term as a result of these conditions, including expected credit losses on loans.
Regulatory Trends.
Public Company Costs
.
66
Critical Accounting Estimates
The Company’s consolidated financial statements are prepared in accordance with GAAP and follow general practices within the financial services industry. It is management’s opinion that accounting estimates covering certain aspects of the Company’s business have more significance than others due to the relative importance of those areas to overall performance, or the level of subjectivity required in making such estimates. See Note 1 of the Company’s notes to the audited consolidated financial statements included within this prospectus for all our accounting policies, including these identified critical accounting estimates.
Allowance for loan losses – The loan portfolio is the largest asset on the Company’s balance sheet. The allowance for loan losses represents the amount that, in management’s judgement , reflects credit losses inherent in the loan portfolio at the balance sheet date. Loan loss estimates are determined by historical experience, the size and composition of the loan portfolio, situations that may affect the borrower’s ability to repay, estimated value of any underlying collateral, and prevailing economic conditions. Because economic conditions can change and future events are inherently difficult to predict, the anticipated amount of estimated loan losses, and therefore the appropriateness of the allowance for loan losses, could change significantly.
Accounting for business combinations – The Company accounts for acquisitions under the acquisition method of accounting. All identifiable assets acquired, including loans, and liabilities assumed, are recorded at fair value, Because the acquired loans were recorded at fair value, no allowance for loan losses was recorded related to these loans because the fair value of the loans incorporates assumptions regarding credit risk.
Discussion and Analysis of Financial Condition
Summary Financial Condition
.
Change | ||||||||||||||||||||||||||||
As of June 30, 2022 | As of December 31, | June 30, 2022 vs. December 31, 2021 | December 31, 2021 vs. December 31, 2020 | |||||||||||||||||||||||||
2021 | 2020 | Amount | Percentage | Amount | Percentage | |||||||||||||||||||||||
(Dollars in thousands) | ||||||||||||||||||||||||||||
Total assets | $ | 1,059,885 | $ | 932,763 | $ | 429,544 | $ | 127,092 | 13.6 | % | $ | 503,219 | 117.2 | % | ||||||||||||||
Cash and cash equivalents | 62,996 | 22,590 | 33,162 | 40,406 | 178.9 | % | (10,572 | ) | (31.9 | )% | ||||||||||||||||||
Loans receivable, net | 786,516 | 711,664 | 233,795 | 74,852 | 10.5 | % | 477,869 | 204.4 | % | |||||||||||||||||||
Securities available for sale | 85,756 | 103,783 | 125,447 | (18,027 | ) | (17.4 | )% | (21,664 | ) | (17.3 | )% | |||||||||||||||||
Securities held to maturity | 28,816 | — | — | 28,816 | 100.0 | % | — | — | ||||||||||||||||||||
Total deposits | 902,373 | 771,665 | 375,124 | 130,708 | 16.9 | % | 396,541 | 105.7 | % | |||||||||||||||||||
Other borrowings | 1,639 | 19,814 | 1,120 | (18,175 | ) | (91.7 | )% | 18,694 | 1669.1 | % | ||||||||||||||||||
Subordinated debt | 40,585 | 20,696 | — | 19,889 | 96.1 | % | 20,694 | N/A | % | |||||||||||||||||||
Shareholders’ Equity | 104,771 | 109,623 | 50,674 | (4,852 | ) | (4.4 | )% | 58,949 | 116.3 | % | ||||||||||||||||||
Total Assets.
67
Total assets at December 31, 2021, were $932.8 million, an increase of $503.3 million, or 117.2%, from $429.5 million at December 31, 2020. The increase in total assets was primarily due to the assets acquired from LINKBANCORP in the Merger, which totaled $523.2 million and consisted of:
(amounts in thousands) | ||||
Cash and cash equivalents | $ | 49,962 | ||
Securities available for sale | 3,111 | |||
Loans | 415,905 | |||
Premises and equipment | 2,087 | |||
Right-of-use asset | 4,544 | |||
Intangible assets | 1,246 | |||
Goodwill | 33,508 | |||
Investment in bank owned life insurance | 4,784 | |||
Deferred taxes | 3,675 | |||
Other assets | 4,394 |
Excluding the assets acquired through the Merger, assets at December 31, 2021 would have decreased $20.0 million from December 31, 2020.
Cash and cash equivalents.
Primary Cash Inflows
| • | Net increase in deposits of $130.7 million; |
| • | Cash received from investment securities (calls, maturities, and principal repayments) of $9.6 million; |
| • | Proceeds from the issuance of subordinated debt of $20.0 million; and |
| • | Cash provided by operating activities of $803 thousand. |
Primary Cash Outflows
| • | Repayments of borrowings of $18.2 million; |
| • | Net increase in the funding of loans receivable of $70.6 million; |
| • | Purchase of investment securities held to maturity of $29.4 million; and |
| • | Payment of dividends of $1.5 million. |
Cash and cash equivalents decreased $10.6 million, or 31.9%, from $33.2 million at December 31, 2020 to $22.6 million at December 31, 2021. The decrease was primarily due to:
Primary Cash Inflows
| • | Cash provided by operating activities of $4.8 million; |
| • | Net cash acquired through the Merger of $39.9 million; |
| • | Net increase in deposits of $5.4 million; |
| • | Net cash from available for sale investment securities (sales, calls, maturities, and principal repayments less purchases) of $21.7 million; and |
| • | Net proceeds from redemption of certificates of deposits with other banks of $4.2 million. |
68
Primary Cash Outflows
| • | Repayments of borrowings of $14.3 million; |
| • | Net increase in the funding of loans receivable of $66.5 million; |
| • | Payment of dividends of $1.5 million; and |
| • | Purchase of bank-owned life insurance of $5.0 million. |
Securities.
The following table shows the amortized cost, gross unrealized gains and losses, and fair value of investment securities at the dates indicated.
June 30, 2022 | ||||||||||||||||
(In Thousands) | Amortized Cost | Gross Unrealized Gain | Gross Unrealized Losses | Fair Value | ||||||||||||
Available for Sale: | ||||||||||||||||
Small Business Administration loan pools | $ | 706 | $ | — | $ | (13 | ) | $ | 693 | |||||||
Obligations of state and political subdivisions | 44,389 | 50 | (3,446 | ) | 40,993 | |||||||||||
Mortgage-backed securities in government-sponsored entities | 46,847 | 3 | (2,780 | ) | 44,070 | |||||||||||
Total | $ | 91,942 | $ | 53 | $ | (6,239 | ) | $ | 85,756 | |||||||
June 30, 2022 | ||||||||||||||||
(In Thousands) | Amortized Cost | Gross Unrealized Gain | Gross Unrealized Losses | Fair Value | ||||||||||||
Held to Maturity: | ||||||||||||||||
Corporate debentures | $ | 9,993 | $ | — | $ | (241 | ) | $ | 9,752 | |||||||
Mortgage-backed securities in government-sponsored entities | 18,823 | — | (285 | ) | 18,538 | |||||||||||
Total | $ | 28,816 | $ | — | $ | (526 | ) | $ | 28,290 | |||||||
December 31, 2021 | ||||||||||||||||
(In Thousands) | Amortized Cost | Gross Unrealized Gain | Gross Unrealized Losses | Fair Value | ||||||||||||
Available for Sale: | ||||||||||||||||
Small Business Administration loan pools | $ | 1,099 | $ | — | $ | (15 | ) | $ | 1,084 | |||||||
Obligations of state and political subdivisions | 46,115 | 2,405 | (38 | ) | 48,482 | |||||||||||
Mortgage-backed securities in government-sponsored entities | 54,239 | 382 | (404 | ) | 54,217 | |||||||||||
Total | $ | 101,453 | $ | 2,787 | $ | (457 | ) | $ | 103,783 | |||||||
69
The following table sets forth the estimated fair value and amortized cost of our available-for-sale and held to maturity securities portfolio, by contractual maturity, as of June 30, 2022.
Available for Sale Securities | Held to Maturity Securities | |||||||||||||||
(In Thousands) | Amortized Cost | Fair Value | Amortized Cost | Fair Value | ||||||||||||
Due within one year | $ | 95 | $ | 95 | $ | — | $ | — | ||||||||
Due after one year through five years | 5,554 | 5,535 | 3,000 | 2,965 | ||||||||||||
Due after five years through ten years | 11,983 | 11,532 | 6,993 | 6,787 | ||||||||||||
Due after ten years | 29,872 | 26,757 | — | — | ||||||||||||
Mortgage-backed securities and collateralized mortgage obligations | 44,438 | 41,837 | 18,823 | 18,538 | ||||||||||||
| $ | 91,942 | $ | 85,756 | $ | 28,816 | $ | 28,290 | |||||||||
Securities available-for-sale decreased by $21.6 million, or 17.3%, to $103.8 million at December 31, 2021 from $125.4 million at December 31, 2020. The decrease was primarily due to the sale of $11.3 million of securities available-for-sale, a decrease in fair value of our holdings of $1.7 million and net amortization of premiums and discounts of $1.4 million. Additionally during 2021, we purchased $14.2 million of securities and received a return of principal of $24.5 million. The proceeds from securities sales and the net return of principal repayments were used to fund loan growth during 2021.
Loans.
Change | ||||||||||||||||||||||||||||
As of June 30, | As of December 31, | June 30, 2022 vs. December 31, 2021 | December 31, 2021 vs. December 31, 2020 | |||||||||||||||||||||||||
2022 | 2021 | 2020 | Amount | Percentage | Amount | Percentage | ||||||||||||||||||||||
(Dollars in thousands) | ||||||||||||||||||||||||||||
Agriculture loans | $ | 7,710 | $ | 9,341 | $ | 11,246 | $ | (1,631 | ) | (17.46 | )% | $ | (1,905 | ) | (16.94 | )% | ||||||||||||
Commercial business loans | 88,452 | 98,604 | 21,534 | (10,152 | ) | (10.30 | )% | 77,070 | 357.90 | % | ||||||||||||||||||
PPP loans | 2,527 | 23,774 | — | (21,247 | ) | (89.37 | )% | 23,774 | N/A | |||||||||||||||||||
Commercial real estate loans | 435,588 | 338,749 | 27,261 | 96,839 | 28.59 | % | 311,488 | 1142.61 | % | |||||||||||||||||||
Residential real estate loans(1) | 241,401 | 231,302 | 167,536 | 10,099 | 4.37 | % | 63,766 | 38.06 | % | |||||||||||||||||||
Consumer loans | 8,689 | 7,087 | 2,514 | 1,602 | 22.60 | % | 4,573 | 181.90 | % | |||||||||||||||||||
Municipal loans | 5,814 | 6,182 | 6,749 | (368 | ) | (5.95 | )% | (567 | ) | (8.40 | )% | |||||||||||||||||
Total Loans | 790,181 | 715,039 | 236,840 | 75,142 | 10.51 | % | 478,199 | 201.91 | % | |||||||||||||||||||
Deferred (fees) costs | 225 | (223 | ) | (256 | ) | 448 | 200.90 | % | 33 | (12.89 | )% | |||||||||||||||||
Allowance for loan losses | (3,890 | ) | (3,152 | ) | (2,789 | ) | 738 | 23.41 | % | (363 | ) | 13.02 | % | |||||||||||||||
Net Loans | $ | 786,516 | $ | 711,664 | $ | 233,795 | $ | 74,852 | 10.52 | % | $ | 477,869 | 204.40 | % | ||||||||||||||
| (1) | Residential real estate loans consist of one- to four-family residential, residential development, home equity and farmland loans. |
The growth in our commercial real estate loans was not attributable to any one significant loan relationship and was primarily generated in markets serviced by our Camp Hill, Lancaster, and Delaware Valley client solutions centers. Residential real estate loans increased $10.1 million during the first half of 2022 with $23.8 million related to new loan originations of mortgage loans for investment properties partially offset by normal principal amortization and payoffs. The reduction in PPP loans since December 31, 2021 related to SBA loan forgiveness of PPP loans during the first half of 2022.
70
At June 30, 2022, commercial real estate loans included commercial construction loans with a balance of $26.7 million compared to $28.5 million at December 31, 2021. Residential construction loans contained within residential real estate loans totaled $9.5 million compared to $2.5 million at December 31, 2021. Total construction loans represented a 62% draw percentage at both June 30, 2022 and December 31, 2021.
The majority of the growth in net loans during 2021 was a result of the loans acquired through the Merger which totaled $415.9 million. Following the Merger, during the fourth quarter of 2021, total loans grew by $46.4 million, primarily in commercial business and commercial real estate loans, which equated to an approximate annualized growth rate of 27% for that quarter.
Loan Portfolio Maturities.
(In Thousands) | Due in One Year or Less | After One but Within Five Years | After Five but Within Fifteen Years | After Fifteen Years | Total due after One Year | Total | ||||||||||||||||||
Agriculture loans | $ | 1,317 | $ | 1,117 | $ | 806 | $ | 4,470 | $ | 6,393 | $ | 7,710 | ||||||||||||
Commercial business loans | 9,254 | 26,048 | 19,849 | 33,301 | 79,198 | 88,452 | ||||||||||||||||||
PPP loans | — | 2,527 | — | — | 2,527 | 2,527 | ||||||||||||||||||
Commercial real estate loans | 15,800 | 48,673 | 327,778 | 43,337 | 419,788 | 435,588 | ||||||||||||||||||
Residential real estate loans | 6,278 | 51,552 | 93,797 | 89,774 | 235,123 | 241,401 | ||||||||||||||||||
Consumer and other loans | 134 | 689 | 7,449 | 417 | 8,555 | 8,689 | ||||||||||||||||||
Municipal loans | 197 | 495 | 2,725 | 2,397 | 5,617 | 5,814 | ||||||||||||||||||
Total | $ | 32,980 | $ | 131,101 | $ | 452,404 | $ | 173,696 | $ | 757,201 | $ | 790,181 | ||||||||||||
Loans with fixed interest rates | ||||||||||||||||||||||||
Agriculture loans | $ | 139 | $ | 627 | $ | 166 | $ | — | $ | 793 | $ | 932 | ||||||||||||
Commercial business loans | 1,431 | 19,095 | 8,105 | 260 | 27,460 | 28,891 | ||||||||||||||||||
PPP loans | — | 2,527 | — | — | 2,527 | 2,527 | ||||||||||||||||||
Commercial real estate loans | 2,652 | 21,217 | 139,794 | 993 | 162,004 | 164,656 | ||||||||||||||||||
Residential real estate loans | 1,058 | 13,555 | 37,920 | 18,630 | 70,105 | 71,163 | ||||||||||||||||||
Consumer and other loans | 69 | 658 | 44 | 417 | 1,119 | 1,188 | ||||||||||||||||||
Municipal loans | 197 | 106 | 2,486 | 700 | 3,292 | 3,489 | ||||||||||||||||||
Total | $ | 5,546 | $ | 57,785 | $ | 188,515 | $ | 21,000 | $ | 267,300 | $ | 272,846 | ||||||||||||
Loans with floating interest rates | ||||||||||||||||||||||||
Agriculture loans | $ | 1,178 | $ | 490 | $ | 640 | $ | 4,470 | $ | 5,600 | $ | 6,778 | ||||||||||||
Commercial business loans | 7,823 | 6,953 | 11,744 | 33,041 | 51,738 | 59,561 | ||||||||||||||||||
PPP loans | — | — | — | — | — | — | ||||||||||||||||||
Commercial real estate loans | 13,148 | 27,456 | 187,984 | 42,344 | 257,784 | 270,932 | ||||||||||||||||||
Residential real estate loans | 5,220 | 37,997 | 55,877 | 71,144 | 165,018 | 170,238 | ||||||||||||||||||
Consumer and other loans | 65 | 31 | 7,405 | — | 7,436 | 7,501 | ||||||||||||||||||
Municipal loans | — | 389 | 239 | 1,697 | 2,325 | 2,325 | ||||||||||||||||||
Total | $ | 27,434 | $ | 73,316 | $ | 263,889 | $ | 152,696 | $ | 489,901 | $ | 517,335 | ||||||||||||
71
Nonperforming Loans.
June 30, 2022 | December 31, 2021 | |||||||||||||||||||||||
Nonperforming Loans | Nonperforming Loans | |||||||||||||||||||||||
(In Thousands) | Total Loans | Amount | Percent of Loans in Category | Total Loans | Amount | Percent of Loans in Category | ||||||||||||||||||
Agriculture loans | $ | 7,710 | $ | — | — | $ | 9,341 | $ | — | — | ||||||||||||||
Commercial business loans | 88,452 | 36 | 0.04 | % | 98,604 | 39 | 0.04 | % | ||||||||||||||||
PPP loans | 2,527 | — | — | 23,774 | — | — | ||||||||||||||||||
Commercial real estate loans | 435,588 | 137 | 0.03 | % | 338,749 | 144 | 0.04 | % | ||||||||||||||||
Residential real estate loans | 241,401 | 1,321 | 0.55 | % | 231,302 | 1,211 | 0.52 | % | ||||||||||||||||
Consumer and other loans | 8,689 | — | — | 7,087 | 2 | 0.03 | % | |||||||||||||||||
Municipal loans | 5,814 | — | — | 6,182 | — | — | ||||||||||||||||||
Total | $ | 790,181 | $ | 1,494 | 0.19 | % | $ | 715,039 | $ | 1,396 | 0.20 | % | ||||||||||||
Excluding PPP loans | $ | 787,654 | $ | 1,494 | 0.19 | % | $ | 691,265 | $ | 1,396 | 0.20 | % | ||||||||||||
Allowance for loan losses | $ | 3,89 0 | $ | 3,152 | ||||||||||||||||||||
Ratio of allowance for loan losses to total loans | 0.49 | % | 0.44 | % | ||||||||||||||||||||
Ratio of nonperforming loans to total loans | 0.19 | % | 0.19 | % | ||||||||||||||||||||
Ratio of allowance for loan losses to nonperforming loans | 260.37 | % | 225.79 | % | ||||||||||||||||||||
December 31, 2020 | ||||||||||||
Nonperforming Loans | ||||||||||||
(In Thousands) | Total Loans | Amount | Percent of Loans in Category | |||||||||
Agriculture loans | $ | 11,246 | $ | — | — | |||||||
Commercial business loans | 21,534 | 48 | 0.22 | % | ||||||||
PPP loans | — | — | — | |||||||||
Commercial real estate loans | 27,261 | — | — | |||||||||
Residential real estate loans | 167,536 | 568 | 0.34 | % | ||||||||
Consumer and other loans | 2,514 | — | — | |||||||||
Municipal loans | 6,749 | — | — | |||||||||
Total | $ | 236,840 | $ | 616 | 0.26 | % | ||||||
Excluding PPP loans | $ | 236,840 | $ | 616 | 0.26 | % | ||||||
Allowance for loan losses | $ | 2,789 | ||||||||||
Ratio of allowance for loan losses to total loans | 1.18 | % | ||||||||||
Ratio of nonperforming loans to total loans | 0.26 | % | ||||||||||
Ratio of allowance for loan losses to nonperforming loans | 452.76 | % | ||||||||||
72
Allowance for Loan Losses
(In Thousands) | Amount of Allowance Allocated | Percent of Loans in Each Category to Total Loans | Total Loans | Ratio of Allowance Allocated to Loans in Each Category | ||||||||||||
June 30, 2022 | ||||||||||||||||
Agriculture loans | $ | 17 | 0.98 | % | $ | 7,710 | 0.22 | % | ||||||||
Commercial business loans | 506 | 11.19 | % | 88,452 | 0.57 | % | ||||||||||
PPP loans | — | 0.32 | % | 2,527 | 0.00 | % | ||||||||||
Commercial real estate loans | 1,786 | 55.13 | % | 435,588 | 0.41 | % | ||||||||||
Residential real estate loans | 1,547 | 30.55 | % | 241,401 | 0.64 | % | ||||||||||
Consumer and other loans | 21 | 1.10 | % | 8,689 | 0.24 | % | ||||||||||
Municipal loans | 13 | 0.73 | %�� | 5,814 | 0.22 | % | ||||||||||
Unallocated Allowance | — | — | — | — | ||||||||||||
Total | $ | 3,890 | 100.00 | % | $ | 790,181 | 0.49 | % | ||||||||
December 31, 2021 | ||||||||||||||||
Agriculture loans | $ | 23 | 1.31 | % | $ | 9,341 | 0.25 | % | ||||||||
Commercial business loans | 582 | 13.79 | % | 98,604 | 0.59 | % | ||||||||||
PPP loans | — | 3.32 | % | 23,774 | 0.00 | % | ||||||||||
Commercial real estate loans | 799 | 47.37 | % | 338,749 | 0.24 | % | ||||||||||
Residential real estate loans | 1,634 | 32.35 | % | 231,302 | 0.71 | % | ||||||||||
Consumer and other loans | 22 | 0.99 | % | 7,087 | 0.31 | % | ||||||||||
Municipal loans | 15 | 0.86 | % | 6,182 | 0.24 | % | ||||||||||
Unallocated Allowance | 77 | — | — | — | ||||||||||||
Total | $ | 3,152 | 100.00 | % | $ | 715,039 | 0.44 | % | ||||||||
December 31, 2020 | ||||||||||||||||
Agriculture loans | $ | 120 | 4.75 | % | $ | 11,246 | 1.07 | % | ||||||||
Commercial business loans | 290 | 9.09 | % | 21,534 | 1.35 | % | ||||||||||
Commercial real estate loans | 314 | 11.51 | % | 27,261 | 1.15 | % | ||||||||||
Residential real estate loans | 1,702 | 70.74 | % | 167,536 | 1.02 | % | ||||||||||
Consumer and other loans | 35 | 1.06 | % | 2,514 | 1.39 | % | ||||||||||
Municipal loans | 18 | 2.85 | % | 6,749 | 0.27 | % | ||||||||||
Unallocated Allowance | 310 | — | — | — | ||||||||||||
Total | $ | 2,789 | 100.00 | % | $ | 236,840 | 1.18 | % | ||||||||
The allowance for loan losses increased $738 thousand from $3.2 million at December 31, 2021 to $3.9 million at June 30, 2022. The primary driver of the increased allowance for loan losses was a provision for loan losses recognized during the six months ended June 30, 2022 of $675 thousand.
73
The allowance for loan losses increased $363 thousand from $2.8 million at December 31, 2020 to $3.2 million at December 31, 2021. The primary driver of the increased allowance for loan losses was a provision for loan losses recognized during the year ended December 31, 2021 of $648 thousand, offset by net charge-offs of $285 thousand. During the year ended December 31, 2021, management noted that a total of eight pre-merger loans with an outstanding principal balance of $560 thousand had migrated from the Pass risk rating category to the Substandard category and an additional eight pre-merger loans with an outstanding principal balance of $4.3 million had migrated from the Pass risk rating category to the Special Mention category resulting in a need to increase the provision for loan losses. Additionally, management adjusted the qualitative allowance factors to reflect a change in management over the credit portfolio, also adding to the 2021 provision when compared to the prior year.
Not included in the table above is the remaining unamortized credit fair value adjustment on loans acquired through the Merger, which are shown in the table below.
��
(In Thousands) | ||||||||
Nature of Loan Adjustment | June 30, 2022 | December 31, 2021 | ||||||
To reflect a market interest rate | $ | (1,058 | ) | $ | (1,337 | ) | ||
To reflect additional credit risk | (6,071 | ) | (7,105 | ) | ||||
Total | $ | (7,128 | ) | $ | (8,442 | ) | ||
Asset Quality
Asset quality remained strong at December 31, 2021 with non-performing loans totaling $1.4 million or 0.20% of total gross loans. This is compared to $616 thousand of non-performing loans at December 31, 2020, which equated to 0.26% of gross loans. Additionally, to compare our allowance for loan losses as a percentage of our gross loans outstanding, we also consider the credit fair value adjustment that was made to the loans acquired through the Merger, which totaled $7.1 million at December 31, 2021, in order to capture a truer picture of our overall coverage related to potential loan losses. Our allowance for loan losses and our credit fair value adjustment totaled $10.2 million at December 31, 2021 and represented 1.39% of our total gross loans, which is an increase from 1.18% at December 31, 2020. At December 31, 2021, we had no other real estate owned.
74
Additional information related to the provision for loan losses and net (charge-offs) recoveries is presented in the table below. Also see Note 6—Allowance for Loan Losses in the accompanying notes to the Company’s audited consolidated financial statements included elsewhere in this prospectus.
(In Thousands) | Provision Expense (Benefit) | Net (Charge- Offs) Recoveries | Average Loans | Ratio of Annualized Net (Charge-Offs) Recoveries to Average Loans | ||||||||||||
At June 30, 2022 | ||||||||||||||||
Agriculture loans | $ | (6 | ) | $ | — | $ | 8,153 | — | % | |||||||
Commercial business loans | (82 | ) | 6 | 96,073 | 0.01 | % | ||||||||||
PPP loans | — | — | 12,011 | — | % | |||||||||||
Commercial real estate loans | 988 | (1 | ) | 379,301 | (0.00 | )% | ||||||||||
Residential real estate loans | (143 | ) | 56 | 226,781 | 0.02 | % | ||||||||||
Consumer and other loans | (3 | ) | 2 | 6,878 | 0.03 | % | ||||||||||
Municipal loans | (2 | ) | — | 6,059 | — | % | ||||||||||
Unallocated | (77 | ) | — | — | — | % | ||||||||||
Total | $ | 675 | $ | 63 | $ | 735,256 | 0.01 | % | ||||||||
Excluding PPP loans | $ | 675 | $ | 63 | $ | 723,245 | 0.01 | % | ||||||||
At December 31, 2021 | ||||||||||||||||
Agriculture loans | $ | (97 | ) | $ | — | $ | 9,386 | 0.00 | % | |||||||
Commercial business loans | 294 | (2 | ) | 43,102 | 0.00 | % | ||||||||||
PPP loans | — | — | 6,523 | 0.00 | % | |||||||||||
Commercial real estate loans | 503 | (18 | ) | 119,217 | (0.02 | )% | ||||||||||
Residential real estate loans | 197 | (265 | ) | 181,494 | (0.15 | )% | ||||||||||
Consumer and other loans | (13 | ) | — | 3,550 | 0.00 | % | ||||||||||
Municipal loans | (3 | ) | — | 6,577 | 0.00 | % | ||||||||||
Unallocated | (233 | ) | — | — | ||||||||||||
Total | $ | 648 | $ | (285 | ) | $ | 369,849 | (0.08 | )% | |||||||
Excluding PPP loans | $ | 648 | $ | (285 | ) | $ | 363,325 | (0.08 | )% | |||||||
At December 31, 2020 | ||||||||||||||||
Agriculture loans | $ | (32 | ) | $ | — | $ | 11,988 | 0.00 | % | |||||||
Commercial business loans | (22 | ) | — | 21,284 | 0.00 | % | ||||||||||
PPP loans | — | — | — | 0.00 | % | |||||||||||
Commercial real estate loans | 59 | — | 36,473 | 0.00 | % | |||||||||||
Residential real estate loans | 87 | (92 | ) | 153,051 | (0.06 | )% | ||||||||||
Consumer and other loans | (3 | ) | (5 | ) | 3,171 | (0.16 | )% | |||||||||
Municipal loans | 5 | — | 6,476 | 0.00 | % | |||||||||||
Unallocated | 90 | — | — | |||||||||||||
Total | $ | 184 | $ | (97 | ) | $ | 232,443 | (0.04 | )% | |||||||
Excluding PPP loans | $ | 184 | $ | (97 | ) | $ | 232,443 | (0.04 | )% | |||||||
Deposits.
75
Changes in the deposit types during the six months ended June 30, 2022 and the years ended December 31, 2021 and 2020 are presented in the table below:
Change | ||||||||||||||||||||||||||||||||
As of June 30, 2022 | As of December 31, | June 30, 2022 vs. December 31, 2021 | December 31, 2021 vs. December 31, 2020 | |||||||||||||||||||||||||||||
2021 | 2020 | Amount | Percentage | Amount | Percentage | |||||||||||||||||||||||||||
(Dollars in thousands) | ||||||||||||||||||||||||||||||||
Demand, noninterest-bearing | $ | 184,345 | $ | 129,243 | $ | 66,573 | $ | 55,102 | 42.6 | % | $ | 62,670 | 94.1 | % | ||||||||||||||||||
Demand, interest-bearing | 269,493 | 256,258 | 158,708 | 13,235 | 5.2 | % | 97,550 | 61.5 | % | |||||||||||||||||||||||
Money market and savings | 235,411 | 205,843 | 69,188 | 29,568 | 14.4 | % | 136,655 | 197.5 | % | |||||||||||||||||||||||
Time deposits, $250,000 and over | 55,507 | 56,266 | 14,253 | (759 | ) | (1.3 | )% | 42,013 | 294.8 | % | ||||||||||||||||||||||
Time deposits, other | 157,617 | 124,055 | 66,402 | 33,562 | 27.1 | % | 57,653 | 86.8 | % | |||||||||||||||||||||||
Total deposits | $ | 902,373 | $ | 771,665 | $ | 375,124 | $ | 130,708 | 16.9 | % | $ | 396,541 | 105.7 | % | ||||||||||||||||||
The increase of $68.3 million in demand deposits during the first half of 2022 was the result of new accounts opened during the first six months of 2022, partially offset by a net decrease in existing account balances, with new accounts contributing approximately $77.6 million in balance at June 30, 2022. Included in the time deposits balance at June 30, 2022 above were brokered time deposits with a balance of $20.0 million, and $0 as of June 30, 2022 and December 31, 2021, respectively.
Of the increase in total deposits of $396.5 million at December 31, 2021 as compared to at December 31, 2020, the deposits assumed in the Merger contributed $391.2 million resulting in deposit growth outside of the Merger of $5.4 million, or 1.4%, from December 31, 2020.
The table below presents the daily average balances by deposit type and weighted average rates paid thereon for the six months ended June 30, 2022 and the years ended December 31, 2021 and 2020.
June 30, 2022 | December 31, 2021 | December 31, 2020 | ||||||||||||||||||||||
(In Thousands) | Average Balance | Average Rate Paid | Average Balance | Average Rate Paid | Average Balance | Average Rate Paid | ||||||||||||||||||
Demand, noninterest-bearing | $ | 142,323 | 0.00 | % | $ | 99,747 | 0.00 | % | $ | 61,780 | 0.00 | % | ||||||||||||
Demand, interest-bearing | 264,527 | 0.38 | % | 175,133 | 0.59 | % | 144,081 | 0.94 | % | |||||||||||||||
Money market and savings | 219,972 | 0.35 | % | 112,511 | 0.18 | % | 70,238 | 0.09 | % | |||||||||||||||
Time deposits | 203,009 | 0.60 | % | 110,928 | 0.77 | % | 81,701 | 1.52 | % | |||||||||||||||
Total Deposits | $ | 829,831 | 0.36 | % | $ | 498,319 | 0.42 | % | $ | 357,800 | 0.74 | % | ||||||||||||
76
We had deposits that exceeded the FDIC insurance limit of $250,000 of $390.0 million and $317.2 million at June 30, 2022 and December 31, 2021, respectively. We estimate deposits that exceeded the FDIC insurance limit of $250,000 of $101.8 million at December 31, 2020. Total uninsured deposits are calculated based on regulatory reporting requirements and reflects the portion of any deposit of a customer at an insured depository institution that exceeds the applicable FDIC insurance coverage for that depositor at that institution and amounts in any other uninsured investment or deposit accounts that are classified as deposits and not subject to any federal or state deposit insurance regime. At June 30, 2022, the scheduled maturities of time deposits that exceeded the FDIC insurance limit or otherwise uninsured were as follows:
(In Thousands) | June 30, 2022 | |||
Due within 3 months or less | $12,247 | |||
Due after 3 months and within 6 months | 6,221 | |||
Due after 6 months and within 12 months | 4,350 | |||
Due after 12 months | 12,918 | |||
Total | $ | 35,736 | ||
Borrowings
At December 31, 2021, other borrowings consisted of $19.8 million in borrowings under PPPLF, which were assumed as part of the Merger. At December 31, 2020, other borrowings consisted of $1.1 million in FHLB fixed rate advances. Additionally, subordinated debt with a fair value of $20.7 million was assumed as part of the Merger. These notes bear interest at a fixed interest rate of 5.0% per year for the first five years and then float at an index tied to the SOFR for years six through ten. The notes have a term of ten years, with a maturity date of October 1, 2030. The notes are redeemable at the option of the Company, in whole or in part, subject to any required regulatory approvals after the first five years.
Additionally, on April 8, 2022, LINKBANCORP issued subordinated debt with a carrying value of $20.0 million. These notes bear interest at a fixed annual rate of 4.50% per year up to April 15, 2027 and then float to an index tied to the three-month SOFR, plus 203 basis points. Subject to limited exceptions, the Company cannot redeem the notes before the fifth anniversary of the issuance date. The balance of subordinated debt was $40.6 million and $20.7 million at June 30, 2022 and December 31, 2021, respectively.
Shareholders’ Equity
Total shareholders’ equity increased by $58.9 million, or 116.3%, from $50.7 million at December 31, 2020, to $109.6 million at December 31, 2021. The increase was primarily attributable to the stock issued in association with the Merger which added $61.4 million to shareholders’ equity and net income of $289 thousand. This addition to equity was partially offset by dividends paid of $1.5 million and other comprehensive loss of $1.4 million.
Comparison of Results of Operations for the Three Months Ended June 30, 2022 and 2021
General.
Net income for the three months ended June 30, 2022 reflected the results of the combined company following the completion of the Merger on September 18, 2021 whereas net income for the three months ended June 30, 2021 reflected the results of GNBF prior to the Merger.
77
Net income for the three months ended June 30, 2022, as compared to the same prior year period was the result of an increase in net interest income of $5.0 million. This increase was partially offset by an increase in noninterest expense of $4.2 million and increases in the provision for loan losses of $351 thousand and income tax expense of $104 thousand.
Analysis of Net Interest Income.
Average Balances, Interest and Average Yields.
For the Three Months Ended June 30, | ||||||||||||||||||||||||
2022 | 2021 | |||||||||||||||||||||||
(Dollars in thousands) | Average Outstanding Balance | Interest | Average Yield/ Rate (1) | Average Outstanding Balance | Interest | Average Yield/ Rate (1) | ||||||||||||||||||
Interest Earning Cash Securities | $ | 60,718 | $ | 97 | 0.64 | % | $ | 42,634 | $ | 37 | 0.35 | % | ||||||||||||
Securities | ||||||||||||||||||||||||
Taxable (2) | 74,105 | 587 | 3.18 | % | 94,370 | 299 | 1.27 | % | ||||||||||||||||
Tax-Exempt | 45,030 | 377 | 3.36 | % | 48,420 | 382 | 3.16 | % | ||||||||||||||||
Total Securities | 119,135 | 964 | 3.28 | % | 142,790 | 681 | 1.93 | % | ||||||||||||||||
Total Cash Equivalents and Investments | 179,853 | 1,061 | 2.37 | % | 185,424 | 718 | 1.55 | % | ||||||||||||||||
Total Loans | 751,347 | 8,114 | 4.33 | % | 235,477 | 2,695 | 4.59 | % | ||||||||||||||||
Total Interest Earning Assets | 931,200 | 9,175 | 3.95 | % | 420,901 | 3,413 | 3.25 | % | ||||||||||||||||
Other Assets | 90,361 | 19,105 | ||||||||||||||||||||||
Total Assets | $ | 1,021,561 | $ | 440,006 | ||||||||||||||||||||
Interest-bearing demand | $ | 270,844 | $ | 260 | 0.39 | % | $ | 156,342 | $ | 254 | 0.65 | % | ||||||||||||
Money market demand | 224,483 | 238 | 0.43 | % | 78,808 | 18 | 0.09 | % | ||||||||||||||||
Time deposits | 211,033 | 320 | 0.61 | % | 72,615 | 190 | 1.05 | % | ||||||||||||||||
Total Borrowings | 46,961 | 424 | 3.62 | % | 534 | 4 | 3.00 | % | ||||||||||||||||
Total Interest-Bearing Liabilities | 753,321 | 1,242 | 0.66 | % | 308,299 | 466 | 0.61 | % | ||||||||||||||||
Non-Interest Bearing Deposits | 152,691 | — | — | 76,770 | — | — | ||||||||||||||||||
Total Cost of Funds | $ | 906,012 | $ | 1,242 | 0.55 | % | $ | 385,069 | $ | 466 | 0.49 | % | ||||||||||||
Other Liabilities | 10,489 | 3,099 | ||||||||||||||||||||||
Total Liabilities | $ | 916,501 | $ | 388,168 | ||||||||||||||||||||
Shareholders’ Equity | $ | 105,060 | $ | 51,840 | ||||||||||||||||||||
Total Liabilities and Shareholders’ Equity | $ | 1,021,561 | $ | 440,008 | ||||||||||||||||||||
Net Interest Income/Spread (FTE) | 7,933 | 3.29 | % | 2,947 | 2.64 | % | ||||||||||||||||||
Tax-Equivalent Basis Adjustment | (80 | ) | (80 | ) | ||||||||||||||||||||
Net Interest Income | $ | 7,853 | $ | 2,867 | ||||||||||||||||||||
Net Interest Margin | 3.38 | % | 2.73 | % | ||||||||||||||||||||
| (1) | Annualized. |
| (2) | Taxable income on securities includes income from available for sale securities and income from certificates of deposits with other banks. |
78
Rate/Volume Analysis
Three Months Ended June 30, 2022 vs. 2021 Increase (Decrease) Due To: | ||||||||||||
(Dollars in thousands) | Rate | Volume | Net | |||||||||
Interest Income: | ||||||||||||
Interest Earning Cash | $ | 31 | $ | 29 | $ | 60 | ||||||
Securities | ||||||||||||
Taxable | 449 | (161 | ) | 288 | ||||||||
Tax-Exempt | 23 | (28 | ) | (5 | ) | |||||||
Total Securities | 472 | (189 | ) | 283 | ||||||||
Total Loans | (153 | ) | 5,572 | 5,419 | ||||||||
Total Interest Earning Assets | 350 | 5,412 | 5,762 | |||||||||
Interest Expense: | ||||||||||||
Interest-bearing demand | (101 | ) | 107 | 6 | ||||||||
Money market demand | 67 | 153 | 220 | |||||||||
Time deposits | (80 | ) | 210 | 130 | ||||||||
Total Borrowings | 1 | 419 | 420 | |||||||||
Total Interest-Bearing Liabilities | (113 | ) | 889 | 776 | ||||||||
Change in Net Interest Income | $ | 463 | $ | 4,523 | $ | 4,986 | ||||||
Net Interest Income.
Interest Income.
Interest Expense.
79
comparative period in 2021 as a result of the completion of the Merger which had the effect of increasing the average balances of deposits and borrowings. This average balance growth resulted in an increase in interest expense of $889 thousand during the three months ended June 30, 2022 as compared to the same period in 2021. The average rates paid on interest-bearing liabilities increased five basis points on an annualized basis from 0.61% for the three months ended June 30, 2021 to 0.66% for the three months ended June 30, 2022 due to the increasing interest rate environment during the current period as well as the impact of interest on $40 million in subordinated notes which were not present in the three months ended June 30, 2021.
Provision for Loan Losses.
We complete a comprehensive quarterly evaluation to determine its provision for loan losses. The evaluation reflects analyses of individual borrowers and historical loss experience, and changes in net loan balances, supplemented as necessary by credit judgment that considers observable trends, conditions, and other relevant environmental and economic factors.
Non-interest Income.
Non-interest Expense.
Income Tax Expense.
Results of Operations for the Six Months Ended June 30, 2022 and 2021
General.
Net income for the six months ended June 30, 2022 reflected the results of the combined company following the completion of the Merger on September 18, 2021 whereas net income for the six months ended June 30, 2021 reflected the results of GNBF prior to the Merger.
80
Net income for the six months ended June 30, 2022, as compared to the same prior year period was the result of an increase in net interest income of $9.7 million and an increase in noninterest income of $194 thousand. These increases were partially offset by an increase in noninterest expense of $8.2 million and increases in the provision for loan losses of $584 thousand and income tax expense of $216 thousand.
Analysis of Net Interest Income.
Average Balances, Interest and Average Yields.
For the Six Months Ended June 30, | ||||||||||||||||||||||||
2022 | 2021 | |||||||||||||||||||||||
(Dollars in thousands) | Average Outstanding Balance | Interest | Average Yield/ Rate (1) | Average Outstanding Balance | Interest | Average Yield/ Rate (1) | ||||||||||||||||||
Interest Earning Cash Securities | $ | 60,229 | $ | 149 | 0.50 | % | $ | 41,558 | $ | 67 | 0.33 | % | ||||||||||||
Securities | ||||||||||||||||||||||||
Taxable (2) | 70,674 | 863 | 2.46 | % | 94,000 | 612 | 1.31 | % | ||||||||||||||||
Tax-Exempt | 45,030 | 746 | 3.34 | % | 48,602 | 768 | 3.19 | % | ||||||||||||||||
Total Securities | 115,704 | 1,609 | 2.80 | % | 142,602 | 1,380 | 1.95 | % | ||||||||||||||||
Total Cash Equivalents and Investments | 175,933 | 1,758 | 2.02 | % | 184,160 | 1,447 | 1.58 | % | ||||||||||||||||
Total Loans | 735,256 | 15,877 | 4.35 | % | 235,779 | 5,371 | 4.59 | % | ||||||||||||||||
Total Interest Earning Assets | 911,189 | 17,635 | 3.90 | % | 419,939 | 6,818 | 3.27 | % | ||||||||||||||||
Other Assets | 88,189 | 19,609 | ||||||||||||||||||||||
Total Assets | $ | 999,378 | $ | 439,548 | ||||||||||||||||||||
Interest-bearing demand | $ | 264,527 | $ | 505 | 0.38 | % | $ | 159,550 | $ | 535 | 0.68 | % | ||||||||||||
Money market demand | 219,972 | 377 | 0.35 | % | 77,364 | 37 | 0.10 | % | ||||||||||||||||
Time deposits | 203,009 | 601 | 0.60 | % | 73,450 | 394 | 1.08 | % | ||||||||||||||||
Total Borrowings | 52,433 | 665 | 2.56 | % | 744 | 11 | 2.98 | % | ||||||||||||||||
Total Interest-Bearing Liabilities | 739,941 | 2,148 | 0.59 | % | 311,108 | 977 | 0.63 | % | ||||||||||||||||
Non Interest Bearing Deposits | 142,323 | — | — | 73,791 | — | — | ||||||||||||||||||
Total Cost of Funds | $ | 882,264 | $ | 2,148 | 0.49 | % | $ | 384,899 | $ | 977 | 0.51 | % | ||||||||||||
Other Liabilities | 10,347 | 3,924 | ||||||||||||||||||||||
Total Liabilities | $ | 892,611 | $ | 388,823 | ||||||||||||||||||||
Shareholders’ Equity | $ | 106,767 | $ | 50,725 | ||||||||||||||||||||
Total Liabilities and Shareholders’ Equity | $ | 999,378 | $ | 439,548 | ||||||||||||||||||||
Net Interest Income/Spread (FTE) | 15,487 | 3.31 | % | 5,841 | 2.64 | % | ||||||||||||||||||
Tax-Equivalent Basis Adjustment | (157 | ) | (161 | ) | ||||||||||||||||||||
Net Interest Income | $ | 15,330 | $ | 5,680 | ||||||||||||||||||||
Net Interest Margin | 3.39 | % | 2.73 | % | ||||||||||||||||||||
| (1) | Annualized. |
| (2) | Taxable income on securities includes income from available for sale securities and income from certificates of deposits with other banks. |
81
Rate/Volume Analysis
Six Months Ended June 30, 2022 vs. 2021 Increase (Decrease) Due To: | ||||||||||||
(Dollars in thousands) | Rate | Volume | Net | |||||||||
Interest Income: | ||||||||||||
Interest Earning Cash | $ | 35 | $ | 47 | $ | 82 | ||||||
Securities | ||||||||||||
Taxable | 536 | (285 | ) | 251 | ||||||||
Tax-Exempt | 36 | (58 | ) | (22 | ) | |||||||
Total Securities | 572 | (343 | ) | 229 | ||||||||
Total Loans | (281 | ) | 10,787 | 10,506 | ||||||||
Total Interest Earning Assets | 326 | 10,491 | 10,817 | |||||||||
Interest Expense: | ||||||||||||
Interest-bearing demand | (228 | ) | 198 | (30 | ) | |||||||
Money market demand | 96 | 244 | 340 | |||||||||
Time deposits | (175 | ) | 382 | 207 | ||||||||
Total Borrowings | (2 | ) | 656 | 654 | ||||||||
Total Interest-Bearing Liabilities | (309 | ) | 1,480 | 1,171 | ||||||||
Change in Net Interest Income | $ | 635 | $ | 9,011 | $ | 9,646 | ||||||
Net Interest Income.
Interest Income.
82
Interest Expense.
Provision for Loan Losses.
We complete a comprehensive quarterly evaluation to determine its provision for loan losses. The evaluation reflects analyses of individual borrowers and historical loss experience, and changes in net loan balances, supplemented as necessary by credit judgment that considers observable trends, conditions, and other relevant environmental and economic factors.
Noninterest Income.
Noninterest Expense.
Income Tax Expense.
83
income and non-deductible expenses. We recognized an income tax expense for the six months ended June 30, 2022 at an effective tax rate of 15.9% which is less than our statutory tax rate of 21%. This is compared to income tax expense for the six months ended June 30, 2021 which resulted in an effective tax rate of 14.0%.
Results of Operations for the Years Ended December 31, 2021 and 2020
General
.
Net income for the year ended December 31, 2021 reflected the results of GNBF for the period from January 1, 2021 through September 17, 2021 and the results of the combined company following the completion of the Merger on September 18, 2021 through December 31, 2021.
The decrease in net income for the year ended December 31, 2021 as compared to the prior year was the result of an increase in noninterest expense of $9.2 million, $4.6 million of which related to Merger expenses, and an increase in the provision for loan losses of $464 thousand. These were partially offset by an increase in interest and dividend income of $4.2 million, a decrease in interest expense of $327 thousand, a decrease in income tax expense of $834 thousand, and an increase in noninterest income of $385 thousand.
Analysis of Net Interest Income.
Average Balances, Interest and Average Yields.
84
the years indicated. The average balances for loans are net of allowance for loan losses, but include nonaccrual loans. The loan yields include net amortization of certain deferred fees and costs that are considered adjustments to yields, but were not material adjustments to the yields. Yields on earning assets are shown on a fully taxable-equivalent basis assuming a tax rate of 21%.
For the Year Ended December 31, | ||||||||||||||||||||||||
2021 | 2020 | |||||||||||||||||||||||
(Dollars in thousands) | Average Outstanding Balance | Interest | Average Yield/Rate | Average Outstanding Balance | Interest | Average Yield/Rate | ||||||||||||||||||
Interest Earning Cash | $ | 35,279 | $ | 381 | 1.08 | % | $ | 46,324 | $ | 561 | 1.21 | % | ||||||||||||
Securities | ||||||||||||||||||||||||
Taxable (1) | 73,960 | 939 | 1.27 | % | 65,010 | 1,002 | 1.54 | % | ||||||||||||||||
Tax-Exempt | 44,719 | 1,585 | 3.54 | % | 46,004 | 1,562 | 3.40 | % | ||||||||||||||||
Total Available for Sale Securities | 118,679 | 2,524 | 2.13 | % | 111,014 | 2,564 | 2.31 | % | ||||||||||||||||
Total Cash Equivalents and Investments | 153,958 | 2,905 | 1.89 | % | 157,338 | 3,125 | 1.99 | % | ||||||||||||||||
Total Loans | 369,849 | 15,924 | 4.31 | % | 232,443 | 11,494 | 4.94 | % | ||||||||||||||||
Total Interest Earning Assets | 523,807 | 18,829 | 3.59 | % | 389,781 | 14,619 | 3.75 | % | ||||||||||||||||
Other Assets | 46,615 | 21,227 | ||||||||||||||||||||||
Total Assets | $ | 570,422 | $ | 411,008 | ||||||||||||||||||||
Interest-bearing demand | $ | 175,133 | $ | 1,034 | 0.59 | % | $ | 144,081 | $ | 1,349 | 0.94 | % | ||||||||||||
Money market demand | 112,511 | 198 | 0.18 | % | 70,238 | 66 | 0.09 | % | ||||||||||||||||
Time deposits | 110,928 | 859 | 0.77 | % | 81,701 | 1,243 | 1.52 | % | ||||||||||||||||
Total Borrowings | 14,881 | 299 | 2.01 | % | 2,021 | 59 | 2.92 | % | ||||||||||||||||
Total Interest-Bearing Liabilities | 413,453 | 2,390 | 0.58 | % | 298,041 | 2,717 | 0.91 | % | ||||||||||||||||
Non Interest Bearing Deposits | 99,747 | — | — | 61,780 | — | — | ||||||||||||||||||
Total Cost of Funds | $ | 513,200 | $ | 2,390 | 0.47 | % | $ | 359,821 | $ | 2,717 | 0.76 | % | ||||||||||||
Other Liabilities | 5,965 | 3,476 | ||||||||||||||||||||||
Total Liabilities | $ | 519,165 | $ | 363,297 | ||||||||||||||||||||
Shareholders’ Equity | $ | 51,257 | $ | 47,711 | ||||||||||||||||||||
Total Liabilities and Shareholders’ Equity | $ | 570,422 | $ | 411,008 | ||||||||||||||||||||
Net Interest Income/Spread (FTE) | 16,439 | 3.01 | % | 11,902 | 2.84 | % | ||||||||||||||||||
Tax-Equivalent Basis Adjustment | (333 | ) | (328 | ) | ||||||||||||||||||||
Net Interest Income | $ | 16,106 | $ | 11,574 | ||||||||||||||||||||
Net Interest Margin | 3.07 | % | 2.97 | % | ||||||||||||||||||||
| (1) | Taxable income on securities includes income from available for sale securities and income from certificates of deposits with other banks. |
85
Rate/Volume Analysis.
Year Ended December 31, 2021 vs. 2020 Increase (Decrease) Due To: | ||||||||||||
(Dollars in thousands) | Rate | Volume | Net | |||||||||
Interest Income: | ||||||||||||
Interest Earning Cash | $ | (61 | ) | $ | (119 | ) | $ | (180 | ) | |||
Available for Sale Securities | ||||||||||||
Taxable | (177 | ) | 114 | (63 | ) | |||||||
Tax-Exempt | 68 | (46 | ) | 23 | ||||||||
Total Available for Sale Securities | (108 | ) | 68 | (40 | ) | |||||||
Total Loans | (1,486 | ) | 5,916 | 4,430 | ||||||||
Total Interest Earning Assets | (1,655 | ) | 5,865 | 4,210 | ||||||||
Interest Expense: | ||||||||||||
Interest-bearing demand | (498 | ) | 183 | (315 | ) | |||||||
Money market demand | 58 | 74 | 132 | |||||||||
Time deposits | (610 | ) | 226 | (384 | ) | |||||||
Total Borrowings | (18 | ) | 258 | 240 | ||||||||
Total Interest-Bearing Liabilities | (1,069 | ) | 742 | (327 | ) | |||||||
Change in Net Interest Income | $ | (586 | ) | $ | 5,122 | $ | 4,537 | |||||
Net Interest Income
.
Interest Income
.
Interest Expense
.
86
demand deposits. This decrease in rates was partially offset by an increase in the average balances of interest-bearing liabilities, which increased $115.4 million to $413.5 million for the year ended December 31 2021 compared to $298.0 million for the year ended December 31, 2020 as a result of the increase in the average balance of our deposits. While the aforementioned lower rate environment has helped us reduce overall cost of funds, the evolution of our business has also played a role in this reduction of cost. As we continue to grow and mature, we have been able to continue to foster customer relationships that grow core deposits and decrease our reliance upon higher cost time deposits.
Provision for Loan Losses
.
We complete a comprehensive, quarterly evaluation to determine its provision for loan losses. The evaluation reflects analyses of individual borrowers and historical loss experience, and changes in net loan balances, supplemented as necessary by credit judgment that considers observable trends, conditions, and other relevant environmental and economic factors.
Noninterest Income
.
Noninterest Expense
.
Income Tax Benefit/Expense
.
Management of Market Risk
General
87
Risk Committee has oversight of our asset and liability management function, which is managed by our Asset/Liability Management Committee. Our Asset/Liability Management Committee meets regularly to review, among other things, the sensitivity of our assets and liabilities to market interest rate changes, local and national market conditions and market interest rates. That group also reviews our liquidity, capital, deposit mix, loan mix and investment positions.
As a financial institution, our primary component of market risk is interest rate volatility. Fluctuations in interest rates will ultimately impact both the level of income and expense recorded on most of our assets and liabilities, and the fair value of all interest-earning assets and interest-bearing liabilities, other than those which have a short term to maturity. Interest rate risk is the potential of economic losses due to future interest rate changes. These economic losses can be reflected as a loss of future net interest income and/or a loss of current fair values. The objective is to measure the effect on net interest income and to adjust the balance sheet to minimize the inherent risk while at the same time maximizing income.
We manage our exposure to interest rates primarily by structuring our balance sheet in the ordinary course of business. We do not typically enter into derivative contracts for the purpose of managing interest rate risk, but we may do so in the future. Based upon the nature of our operations, we are not subject to foreign exchange or commodity price risk. We do not own any trading assets.
Net Interest Income Simulation.
The following table presents the estimated changes in our net interest income, calculated on a bank-only basis, which would result from changes in market interest rates over twelve-month period as of June 30, 2022. The table below demonstrates that we are asset-sensitive in a rising interest rate environment.
At June 30, 2022 | ||||||||
Change in Interest Rates (basis points) (1) | Net Interest Income Year 1 Forecast | Year 1 Change from Level | ||||||
(Dollars in thousands) | ||||||||
+400 | $ | 40,611 | 14.14 | % | ||||
+300 | 39,381 | 10.68 | % | |||||
+200 | 38,122 | 7.14 | % | |||||
+100 | 36,878 | 3.65 | % | |||||
Level | 35,580 | — | ||||||
-100 | 34,175 | (3.95 | )% | |||||
| (1) | This analysis assumes an instantaneous and parallel rate shock across the entire yield curve for the scenarios indicated. |
Economic Value of Equity Simulation.
88
The following table presents the estimated changes in our EVE, calculated on a bank-only basis, that would result from changes in market interest rates as of June 30, 2022.
At June 30, 2022 | ||||||||||||||||||||||||
Change in Interest Rates (basis points) (1) | Estimated EVE (2) | EVE as a Percentage of Present Value of Assets (3) | Present Value of Assets | |||||||||||||||||||||
Estimated Increase (Decrease) in EVE | EVE Ratio (4) | Increase (Decrease) (basis points) | ||||||||||||||||||||||
Amount | Percent | Amount | ||||||||||||||||||||||
(Dollars in thousands) | ||||||||||||||||||||||||
+400 | $ | 147,260 | $ | (15,962 | ) | (9.78 | )% | 16.15 | % | 6 | $ | 911,827 | ||||||||||||
+300 | 151,537 | (11,685 | ) | (7.16 | )% | 16.19 | % | 10 | 935,991 | |||||||||||||||
+200 | 155,262 | (7,960 | ) | (4.88 | )% | 16.16 | % | 7 | 960,780 | |||||||||||||||
+100 | 159,080 | (4,142 | ) | (2.54 | )% | 16.12 | % | 3 | 986,849 | |||||||||||||||
Level | 163,222 | — | — | % | 16.09 | % | — | 1,014,431 | ||||||||||||||||
-100 | 165,646 | 2,424 | 1.49 | % | 15.88 | % | (21 | ) | 1,043,111 | |||||||||||||||
| (1) | This analysis assumes an instantaneous and parallel rate shock across the entire yield curve for the scenarios indicated. |
| (2) | The estimated EVE is the present value of all assets less the present value of all liabilities as calculated for the corresponding scenario. |
| (3) | The EVE as a percentage of the Present Value of Assets is used as a present value capital measure. The EVE ratio is a market value capital ratio. |
| (4) | The EVE ratio is defined as “Estimated EVE” divided by the Present Value of Assets. |
Many assumptions are used to calculate the impact of interest rate fluctuations. Actual results may be significantly different than our projections due to several factors, including the timing and frequency of rate changes, market conditions and the shape of the yield curve. The computations of interest rate risk shown above do not include actions that our management may undertake to manage the risks in response to anticipated changes in interest rates, and actual results may also differ due to any actions taken in response to the changing rates.
Liquidity, Commitments, and Capital Resources
Our liquidity, represented by cash and due from banks, is a product of our operating, investing and financing activities. Our primary sources of funds are deposits, principal repayments of securities and outstanding loans, and funds provided from operations. In addition, we invest excess funds in short-term interest-earnings assets such as overnight deposits or U.S. agency securities, which provide liquidity to meet lending requirements. While scheduled payments from the amortization of loans and securities and short-term investments are relatively predictable sources of funds, general interest rates, economic conditions and competition greatly influence deposit flows and repayments on loans and mortgage-backed securities.
We strive to maintain sufficient liquidity to fund operations, loan demand and to satisfy fluctuations in deposit levels. We are required to have enough investments that qualify as liquid assets in order to maintain sufficient liquidity to ensure safe and sound banking operations. Liquidity may increase or decrease depending upon the availability of funds and comparative yields on investments in relation to the return on loans. Our attempts to maintain adequate but not excessive liquidity, and liquidity management is both a daily and long-term function of our business management. We manage our liquidity in accordance with a board of directors-approved asset liability policy, which is administered by our asset-liability committee (“ALCO”). ALCO reports interest rate sensitivity, liquidity, capital and investment-related matters on a quarterly basis to our board of directors.
We review cash flow projections regularly and update them in order to maintain liquid assets at levels believed to meet the requirements of normal operations, including loan commitments and potential deposit
89
outflows from maturing certificates of deposit and savings withdrawals. Certificates of deposit, excluding brokered deposits, due within one year of June 30, 2022 totaled $134.3 million, or 69.5% of our certificates of deposit, and 15.2% of total deposits. If these deposits do not remain with us, we will be required to seek other sources of funds, including other deposits and FHLB advances. Depending on market conditions, we may be required to pay higher rates on such deposits or borrowings than we currently pay. We believe, however, based on past experience that a significant portion of such deposits will remain with us. We have the ability to attract and retain deposits by adjusting the interest rates offered. While deposits are our primary source of funds, when needed we are also able to generate cash through borrowings from the Federal Home Loan Bank of Pittsburgh (“FHLB”). At June 30, 2022, we had no outstanding FHLB borrowings with a remaining available capacity with FHLB, subject to certain collateral restrictions, of approximately $276.2 million. In addition, the Company had $51 million in available lines of credit with other banks at June 30, 2022.
Capital Resources.
Off-Balance Sheet Arrangements and Contractual Obligations
Off-Balance Sheet Arrangements.
At June 30, 2022, we had $189.1 million in loan commitments outstanding. We also had $8.8 million in standby letters of credit at June 30, 2022. At December 31, 2021, we had $145.1 million in loan commitments outstanding. We also had $6.2 million in standby letters of credit at December 31, 2021.
90
BUSINESS
Overview
We are a Pennsylvania corporation headquartered in Camp Hill, Pennsylvania and formed in 2018 with a mission to positively impact lives through community banking. In October 2018, we completed the acquisition of Stonebridge Bank, which was subsequently named LINKBANK. In September 2021, LINKBANCORP and GNBF, completed a strategic combination, resulting in The Gratz Bank becoming our wholly owned subsidiary. We are a bank holding company registered under the BHC Act. The Gratz Bank is a Pennsylvania state-chartered commercial bank offering personal and business lending and deposit services to individuals, families, nonprofit and business clients throughout Central and Southeastern Pennsylvania, primarily through our digital presence on the internet and 10 client solutions centers in Chester, Cumberland, Dauphin, Lancaster, Northumberland and Schuylkill Counties. In markets other than those serviced pre-Merger by The Gratz Bank, the Bank operates as “LINKBANK, a division of The Gratz Bank.” The Bank intends to legally change its name to LINKBANK in November 2022 to create one single brand, subject to the receipt of applicable regulatory approvals.
Our community banking strategy seeks to provide our customers with personal service, financial sophistication and the full array of product offerings of a larger regional bank, focusing on developing local lending relationships funded by the generation of local retail and business deposits. We believe our culture of highly engaged employees enhances productivity and results in lower employee turnover, ultimately, leading to greater operational efficiencies and customer loyalty. We differentiate ourselves based on high touch, relationship building service, supported by the convenience of technology. Our high touch level of service led us to change how we think about bank branches. We call our branches “solutions centers” because our personnel are all trained across our full product offerings so they can quickly and efficiently serve our customers’ needs for loan or deposit products. We are committed to increasing our market share in the communities we serve by continuing to leverage available technology, existing branch locations, and new branch locations, and by considering other strategic opportunities in both the markets we serve and the surrounding areas.
As of June 30, 2022, our consolidated assets, net loans, deposits and shareholders’ equity totaled $1.1 billion, $786.5 million, $902.4 million and $104.8 million, respectively.
As a bank holding company, we are subject to the supervision of the FRB. We are required to file with the FRB reports and other information regarding our business operations and the business operations of our subsidiaries. As a state-chartered commercial bank, the Bank is subject to primary supervision, periodic examination and regulation by the PADOBS and by the FDIC as its primary federal regulator.
Creating a Community Bank to Positively Impact its Community
| LINKBANCORP was organized in 2018 with a mission to positively impact lives through community banking. Members of the founding management team and board of directors had worked together with multiple financial institutions of various sizes, primarily focused in Central and Southeastern Pennsylvania, over a period of more than 20 years. Informed by these experiences, the founders sought to establish an entrepreneurial and growth-oriented community bank that would leverage talented relationship bankers, coupled with emerging innovations in technology, to meet the needs of the local community. Rather than organize a de novo bank to facilitate these objectives, in October 2018 LINKBANCORP |
91
| acquired and recapitalized Stonebridge Bank, a community bank primarily serving Chester County, Pennsylvania, in a transaction conducted under the U.S. Bankruptcy Code, funded with proceeds from a private placement of common stock to friends and family. At the time of the acquisition of Stonebridge Bank, it had $55.2 million in total assets and one branch office. Stonebridge Bank had been party to a consent order with the FDIC and the PADOBS at the time of the acquisition, which was successfully resolved by the Company’s management team, with the consent order terminated in February 2019. |
Following the acquisition and private placement, the Company adopted a strategic plan focused on providing differentiated consumer and commercial banking services to clients in the Central and Southeastern Pennsylvania markets. As a result, the Bank has grown its balance sheet significantly both through organic loan and deposit growth, as well as the opportunistic strategic merger with GNBF as described in the prospectus. The Company’s management team has leveraged their strong local community ties, extensive merger and acquisition experience and experience with the bank regulatory agencies to create an entrepreneurial and rapidly-growing bank supported by an advanced risk management infrastructure and strong credit quality.
Our Key Accomplishments
The summary below highlights our recent business accomplishments and key milestones, commencing with the 2018 acquisition of Stonebridge Bank. The history below that occurred prior to the Merger is the history of Legacy LINKBANCORP and not GNBF:
| • | October 2018: |
| • | December 2018: |
| • | January 2019: |
| • | May – June 2019: |
| • | April – July 2020: |
| • | June 2020: |
| • | September – October 2020: |
| • | December 2020: |
| • | December 2020: |
| • | September 2021: |
| • | Executive management roles continue to be filled by the Legacy LINKBANCORP officers, including Andrew Samuel—CEO; Carl Lundblad—President; Brent Smith, President of The Gratz Bank; Kristofer Paul—CFO; and Tiffanie Horton—Chief Credit Officer. |
92
| • | Achieves critical mass in the Central Pennsylvania market. |
| • | Doubles the Company’s asset size and provides opportunity to capture economies of scale on both the revenue and cost sides. |
| • | Diversifies the loan portfolio and provides low cost, stable and highly granular retail deposits. |
| • | GNBF’s relatively low loan-to-deposit ratio prior to the Merger provides additional liquidity to fuel LINKBANCORP’s strong loan generation capabilities. |
| • | Significantly enhances the loan-to-one borrower limit with a doubling of regulatory capital. |
| • | December 2021: |
| • | January 2022: |
| • | January 2022: |
| • | February 2022: |
| • | April 2022: |
| • | April 2022 |
| • | May 2022 |
| • | June 2022: |
Our Mission & Business Strategy
Our mission is to positively impact lives by building the premier community bank franchise serving consumers and businesses in the Central and Southeastern Pennsylvania markets and the surrounding areas. We have a seasoned management team and have been able to attract experienced and long-tenured bankers with proven track records.
Although our executive management team has had success throughout the community bank industry since the early 2000’s, in building our business plan and go-to market strategy for LINKBANCORP, we knew that the traditional community bank model would need to be adjusted and enhanced to compete and win in the current environment. This shift in strategy had several tenants:
| • | Hire talented, entrepreneurial bankers with demonstrated track records. |
| • | Focus on profitable customer relationships and taking wallet share. |
| • | Operate with a branch-lite footprint. |
| • | Leverage technology, digital banking and information systems. |
| • | Achieve economies of scale and increase operating leverage as we grow. |
93
The key ingredient to implementing this strategy is attracting and retaining top talent, which is driven by our culture and values that reflect authenticity and enthusiasm in all interactions. Blending a strong heritage of banking expertise with strong values, we are committed to providing compelling products, services, and financial consulting.
Branch-Lite Organic Growth Engine
Prior to completing our strategic merger with GNBF in 2021, we grew to over $450 million in total assets with only four branch offices. Our offices look and operate differently than branches of most of our competitors in the marketplace. Recognizing that client interactions continue to trend more toward digital transactions, our offices are designed to function as “client solutions centers,” many with no traditional teller line and staffed with just 3-4 full-time employees who are cross-trained to address a variety of client needs.
Our go-to market approach is focused on hiring experienced and talented bankers that operate as a team in a particular region, under the leadership of a regional president who has significant decision-making authority for both consumer and commercial banking, thereby providing clients with a level of access and responsiveness not available from most of our competitors. Client solutions centers are strategically placed in each regional market and serve as a “home base” for each team.
We have experienced great success utilizing this relationship-focus combined with regional leadership and decision-making in communities with strong local identities and a significant population of family-owned operating/manufacturing businesses.

The de novo build out of our regional business development teams in the Capital, Lancaster/York and Delaware Valley Regions was supplemented with the strategic merger with GNBF, which forms the Gratz Region. Given the more rural demographics and long-tenured Gratz Bank customers, our strategy has been to continue operating those branches as they previously were with a focus on core deposit gathering in that region to fuel organic loan growth in our other regions.
Our community banking strategy is focused on high touch relationship management and exceptional service supported by technology, primarily directed toward three different areas:
| • | Personal Banking: Strategically placed client solutions centers leveraging our strong local community identity and complemented with digital banking solutions. |
| • | Business Banking: Focused on family-owned businesses with under $100 million in annual revenue. |
| • | Nonprofit Banking: Bank of choice for nonprofits, with strong individual and organizational engagement in the communities we serve. |
94
We seek to maintain an average of more than $100 million in deposits per office to support our “branch-lite” footprint and achieve desired efficiencies. Below is a summary of our deposit growth for client solutions centers located in the Capital and Lancaster/York Regions. Both of these solutions centers have been open since 2019 and we believe best demonstrate our community bank strategy as described above. We also recently hired a business development team to focus on our relocated solutions center in the Delaware Valley Region, where we will continue to execute this strategy.
Through the GNBF Merger we inherited six branch offices, all of which remain open. The strategy for these legacy GNBF offices are different than our legacy LINKBANK client solutions centers, although we believe they provide a strong core funding base for our organic loan growth. As of June 30, 2022, our overall average branch size for offices open more than one year, was $94.6 million. While industry wide data for 2022 is not publicly available, we believe our average branch size of $85 million as of June 30, 2021 compares favorably to the $74 million average branch size in our markets of operation at June 30, 2021. | |
Nimble and Innovative Tech Forward Operating Platform
From its inception, the Company had a vision for entrepreneurial growth and innovation in technology. We knew that the traditional community bank operating model and philosophy would need to change and focus on technology that would support our branch-lite model as well as a more efficient operating and risk management infrastructure. To accomplish this, we have sought to develop a platform that will achieve objectives of native mobility, modular architecture, open API and cloud-based infrastructure. Early investments in virtualization and cloud capabilities have successfully enabled partnering for technology services that facilitate a more efficient and integrated workflow while enhancing responsiveness and the overall client experience.
95
We also recognize that innovation is not possible without skilled technologists who understand the business of banking. In early 2022, we made a significant investment to recruit highly experienced professionals from community and regional financial services companies specifically skilled in the areas of data, digital banking, automation and process maturity. These business solutions architects, representing decades of combined banking operations and technology experience, are embedded and positioned in direct partnership with our business lines to accelerate service delivery and strategic advancements, shifting away from the typical community bank technology model of incremental improvements constrained by operational expense, toward a more nimble model where opportunities are identified and then promptly implemented for near-term impact.
Growth Strategy Focused in Sizeable Markets with Above Average Growth
Our organic growth strategy is focused in the Capital, Lancaster and Delaware Valley Regions. Population growth in each of these counties well exceeds the Pennsylvania average:
These three regions collectively have $122 billion in deposit balances (per June 30, 2021 FDIC data), which is more than 20% of the entire Commonwealth of Pennsylvania with $553 billion in deposit balances. This addressable market of $122 billion in deposit balances is 1.7x times larger than the Philadelphia County market which is the closest major metropolitan area. These markets are amongst the largest in Pennsylvania, have strong demographics and the competitive landscape is such that they are heavily banked by the large money center and regional banks.
Capitalizing on Market Disruption
Our market area has undergone significant consolidation, particularly in the last twelve months. We intend to take advantage of the recent disruption caused by mergers and acquisitions in our operating markets, which we believe has created an environment of underbanked customers and has created opportunities to hire seasoned bankers. We have successfully employed this strategy in the past, hiring experienced bankers from merged institutions, which has helped us enhance critical aspects of our operations. We believe the most recent wave of consolidations, together with what we anticipate will be further consolidation, will create additional opportunities for us to attract additional experienced bankers. Below are some of the merger transactions announced and/or closed in and around our geographic footprint since 2017:
| • | First Commonwealth Corporation / Centric Financial Corporation |
| • | Fulton Financial Corporation / Prudential Bancorp, Inc. |
| • | Mid Penn Bancorp, Inc. / Riverview Financial Corporation |
| • | WSFS Financial Corporation / Bryn Mawr Bank Corporation |
96
| • | Citizens & Northern Corporation / Covenant Financial Inc. |
| • | S&T Bancorp, Inc. / DNB Financial Corporation |
| • | Citizens & Northern Corporation / Monument Bancorp, Inc. |
| • | WSFS Financial Corporation / Beneficial Bancorp, Inc. |
| • | Northwest Bancshares, Inc. / Donegal Financial Services Corp. |
Consistent with this strategy, we recently added teams of experienced bankers to supplement our efforts in both the York/Lancaster Region and the Delaware Valley Region. In each case, these “lift outs” involved well-respected lending teams that are familiar with these markets from regional financial institutions impacted by consolidation and other disruptions. In a short period of time, the investment in these teams has resulted in significant opportunities for new client relationships and increasing market share.
Opportunistic Mergers and Acquisitions Strategy
Our mergers and acquisitions strategy has been and will continue to be highly opportunistic. We will pursue strategic merger and acquisition opportunities, including whole bank and branch acquisitions, and non-bank acquisitions, that build long-term shareholder value. Our executive team has extensive experience in merger and acquisition integration with 10+ completed transactions since the early 2000s. The focus of our mergers and acquisitions strategy is to identify community banks open to a potential combination that are within a two-hour drive time radius or approximately 50-100 miles from our headquarters in Camp Hill, Pennsylvania. While the geographic radius of approximately 50-100 miles encapsulates many market areas, our focus is on acquiring banks operating outside of the major metropolitan markets. Throughout our history we have focused on the more suburban market areas that benefit from densely populated metropolitan markets. The most recent example of this is our business development opportunity in the Delaware Valley Region, which benefits from the growth and disruption in the Philadelphia metropolitan market. We also believe that the Maryland and northern Virginia marketplace offers potential growth opportunities. These markets have strong demographics and look and feel much like our existing markets. Our executive team actively develops relationships with community banks within these areas in order to explore such opportunities when the time is appropriate.
We have disciplined acquisition criteria that any potential merger and acquisition transaction must meet:
There may be highly strategic and compelling situations that arise which may not meet all five of the criteria listed above; these situations are likely very unique and rare and will be fully vetted by the LINKBANCORP Board and Management team before pursuing such a transaction. We would only pursue a nonconforming transaction if we believed the risk-adjusted return and shareholder value creation potential was well in-excess of other strategic initiatives.
97
Our Competitive Strengths
We believe the following strengths differentiate us from our competitors and position us to execute our business strategy successfully:
Seasoned Executive Team with Value Creation Track Record
Our seasoned executive management team, which is led by our Chief Executive Officer, Andrew Samuel, has significant experience and success with building, operating, and creating shareholder value at numerous banking institutions.
This management team has long tenure together in our markets, providing a familiarity with each other and with the marketplace that is unique among our competitors. Executives are highly engaged in business development and community engagement initiatives and are able to attract and recruit top talent due to a reputation for developing high performing and successful teams.
Differentiated Brand and Culture
We believe our corporate culture is a differentiating factor in our demonstrated growth and ability to gain market share. Central to our culture and brand are our core “L-I-N-K” values which support our mission of positively impacting lives.
In our brief history, we have intentionally nurtured this culture to support development of a well-defined internal and external brand reflecting a purpose-driven, entrepreneurial and relational organization that is highly responsive to client needs and our communities and attracts best-in-class bank professionals.
98
This culture starts with our mission to positively impact lives through community banking. In pursuing this mission, we invest in the development of strong future leaders for the banking industry and our communities, contribute to economically and socially flourishing communities, and seek to demonstrate the continued viability and integral role of community banking for our economic and social development. As one example of these efforts, we launched and continue to support The LINK Foundation, established as a separate legal entity and governed by a distinct board of trustees, but fully aligned with our mission. The LINK Foundation provides financial support to organizations within our markets focused on three funding priorities—developing future leaders, promoting financial literacy and fortifying personal growth.
Our culture and brand is significantly dependent on highly engaged employees, so we are intentionally committed to investing in the development of our employees. Under the leadership of our Chief Culture Officer, we offer our employees hands-on leadership training, performance management and professional development training, monthly sessions focused on our core values, fun celebration and team-building events and time dedicated to participating in community volunteer opportunities. In recognition of these initiatives, we have been recognized regionally and nationally within the banking industry as a best place to work. We believe our culture of highly engaged employees committed to a common purpose enhances productivity and results in lower employee turnover, leading to greater operational efficiencies, a consistent brand experience and customer loyalty.
Significant Experience in Acquiring and Integrating Banks
Our executive team has a long-term track record and significant experience with acquiring and integrating community bank acquisitions as well as executing on sales and strategic mergers. Our executive team, including experience at prior institutions, has successfully closed on and integrated six whole bank transactions (acquisitions or strategic mergers) and numerous branch acquisitions. In September 2021, we closed the GNBF strategic merger and have successfully grown the GNBF deposit franchise. As anticipated, the GNBF strategic merger has provided an attractive core funding base that has helped fund our commercial loan growth in the Capital, Lancaster/York, and Delaware Valley markets. We successfully completed the systems integration with GNBF in October 2021 which was only one month after closing. While we are confident in our organic growth prospects, we intend to pursue prudent and commercially attractive acquisitions that will position us to further capitalize on market opportunities and help us continue to improve our platform’s operating leverage.
Disciplined Underwriting and Robust Enterprise Risk Management
Our holistic approach to risk management has been an asset that supports our growth strategies. Our enterprise risk management program follows a “three lines of defense” structure and is designed to permeate across all functional areas. From our inception, we placed a very high priority on establishing an effective risk management culture, including appointing a Board-level Enterprise Risk Management Committee which reviews information each quarter regarding exposure to strategic risk, reputation risk, credit risk, market risk, liquidity risk, legal and regulatory compliance risk, operations and technology (including cybersecurity) risk, as well as the Company’s strategies to monitor, control and mitigate these risks. The Company’s Chief Risk Officer and officer-level Management Enterprise Risk Committee meets quarterly to review and discuss existing and emerging risks, including key risk indicators (KRIs) that are tracked and monitored regularly, and serve as a primary avenue for escalation and reporting to the Board’s Enterprise Risk Management Committee.
We understand that credit is one of the most critical risks for any financial institution. As a result of our disciplined underwriting standards and procedures, we have achieved significant balance sheet growth while maintaining superior credit quality. Our nonperforming assets to total assets ratio was 0.14% as of June 30, 2022 and our allowance represented 260.4% of our nonperforming loans as of June 30, 2022.
Our credit culture is guided by the following principles:
| • | Focus on relationship lending, in many cases with clients that our relationship managers and executive management team have known for decades; |
99
| • | Development of underwriting and credit risk management processes tailored to each of our products and regions; |
| • | Centralized credit oversight and segregated reporting of credit and lending teams; |
| • | Utilization of regional credit officers with specific lending authority, allowing for localized analysis and decision making and faster turnaround time; |
| • | Commitment to maintaining a diverse portfolio; |
| • | Sophisticated monitoring and analysis of our portfolio and establishment of sub-portfolio limits that we review regularly and adjust in response to changes in our lending strategy and market conditions; and |
| • | Proactive problem asset management. |
Although we maintain a cautious credit outlook due to continued uncertainty in the current economic environment, we believe we are well positioned for the months ahead given a strong loan reserve, application of prudent underwriting standards and a diverse loan portfolio with no significant concentrations. We also expect a rising interest rate environment to be a positive given that our portfolio is more heavily weighted toward variable and adjustable-rate loans.
Lending Activities
General.
The following table sets forth the composition of the Bank’s loan portfolio by type of loan as of June 30, 2022:
(In Thousands) | June 30, 2022 | Percent | ||||||
Agriculture loans | $ | 7,710 | 1.0 | % | ||||
Commercial business loans | 88,452 | 11.2 | % | |||||
PPP loans | 2,527 | 0.3 | % | |||||
Commercial real estate loans | 435,588 | 55.1 | % | |||||
Residential real estate loans | 241,401 | 30.6 | % | |||||
Consumer and other loans | 8,689 | 1.1 | % | |||||
Municipal loans | 5,814 | 0.7 | % | |||||
Total loans | 790,181 | 100.0 | % | |||||
Deferred fees | 225 | |||||||
Allowance for loan losses | (3,890 | ) | ||||||
Net Loans | $ | 786,516 | ||||||
Commercial Business Lending
100
our market area to finance short-term working capital needs such as accounts receivable and inventory. Our commercial lines of credit are typically adjustable-rate and are generally priced on a floating rate basis utilizing the Prime Rate. We generally obtain personal guarantees with respect to all commercial business lines of credit.
We typically originate commercial business loans on the basis of the borrower’s ability to make repayment from the cash flow of the borrower’s business, the experience and stability of the borrower’s management team, earnings projections and the underlying assumptions, and the value and marketability of any collateral securing the loan. As a result, the availability of funds for the repayment of commercial business loans may be substantially dependent on the success of the business itself and the general economic environment in our market area. Therefore, commercial business loans that we originate generally have greater credit risk than one-to-four family residential real estate loans or consumer loans. In addition, commercial business loans often result in larger outstanding balances to single borrowers, or related groups of borrowers, and also generally require substantially greater evaluation and oversight efforts.
We also have the ability to originate loans that are guaranteed by the U.S. Small Business Administration (the “SBA”), an independent agency of the federal government. The SBA 7(a) loan program supports, through a U.S. Government guarantee, some portion of the traditional commercial loan underwriting that might not be fully covered absent the guarantee. In the future, we intend to increase our originations of 7(a) SBA loans as requested by our customers and we intend to sell the guaranteed portion to unrelated third parties. As of June 30, 2022, we had no SBA loans held for sale and two SBA loans in our loan portfolio, and were servicing $3.7 million of SBA loans sold to investors.
As a result of the Merger, we acquired loans made through the Paycheck Protection Program (“PPP”), administered directly by the SBA. The PPP provided loans to small businesses who were affected by economic conditions as a result of the COVID-19 pandemic to provide cash-flow assistance to employers who maintain their payroll (including healthcare and certain related expenses), mortgage interest, rent, leases, utilities and interest on existing debt during the COVID-19 emergency. As of June 30, 2022, we had outstanding principal balance of $2.5 million of PPP loans. The PPP loans are fully guaranteed by the SBA and may be eligible for forgiveness by the SBA to the extent that the proceeds are used to cover eligible payroll costs, interest costs, rent, and utility costs. PPP loans deemed eligible for forgiveness by the SBA will be repaid by the SBA to the Bank.
Commercial Real Estate Lending
We consider a number of factors in originating commercial real estate and multi-family loans. We evaluate the qualifications and financial condition of the borrower, including project-level and global cash flows, credit history, and management expertise, as well as the value and condition of the property securing the loan. When evaluating the qualifications of the borrower, we consider the financial resources of the borrower, the borrower’s experience in owning or managing similar property and the borrower’s payment history with us and other financial institutions. In evaluating the property securing the loan, the factors we consider include the net operating income of the mortgaged property before debt service and depreciation, the ratio of the loan amount to the appraised value of the mortgaged property and the debt service coverage ratio (the ratio of net operating income to debt service). We generally require a debt service ratio of at least 1.25x.
101
Personal guarantees are generally obtained from the principals of commercial real estate and multi-family loan borrowers, although this requirement may be waived in limited circumstances depending upon the loan-to-value ratio and the debt service ratio associated with the loan. We require property and casualty insurance and flood insurance if the property is in a flood zone area. In addition, borrowers are required to obtain title insurance unless the balance of the loan is less than $250,000. In such cases, we will require an ownership and encumbrance report relating to the title of the property.
Construction and Land Development Lending
Construction and land lending generally involves greater credit risk than long-term financing on improved, owner-occupied real estate. Risk of loss on a construction or land loan depends largely upon the accuracy of the initial estimate of the value of the property at completion of construction compared to the estimated cost (including interest) of construction and other assumptions. If the estimate of construction cost is inaccurate, we may be required to advance additional funds beyond the amount originally committed in order to protect the value of the property. Moreover, if the estimated value of the completed project is inaccurate, the borrower may hold a property with a value that is insufficient to assure full repayment of the construction loan upon the sale of the property. Construction and land loans also expose us to the risk that improvements will not be completed on time in accordance with specifications and projected costs. In addition, the ultimate sale or rental of the property may not occur as anticipated. Land loans pose additional risk because the property generally does not produce income and may be relatively illiquid.
Residential Real Estate Lending.
Our adjustable-rate residential real estate loans carry terms to maturity ranging from 10 to 30 years and generally have fixed rates for initial terms of five years, although we also offer terms of one, two, three, seven or ten years, and adjust annually thereafter at a margin. The maximum amount by which the interest rate may be increased or decreased is generally 5% for the first adjustment period and 2% per adjustment period thereafter, with a lifetime interest rate cap of generally 5% over the initial interest rate of the loan. We typically hold in portfolio our adjustable-rate residential real estate loans.
Residential real estate loans are generally underwritten in accordance with secondary market standards and The Federal National Mortgage Association, commonly known as Fannie Mae, underwriting guidelines to comply with ability to repay and qualified mortgage rules. We generally originate both fixed- and adjustable-rate mortgage loans in amounts up to the maximum conforming loan limits for secondary loan sales although we do originate some jumbo loans which exceed those limits. We generally retain the servicing of the residential loans that we sell into the secondary market.
Due to the interest rate risk inherent in holding long-term fixed rate residential real estate loans in the portfolio, we have recently limited our origination of residential real estate loans secured by single-family
102
properties. Depending on future market conditions, we expect to originate residential mortgage loans with the intention of selling a portion of these loans into the secondary market through the Federal Home Loan Bank of Pittsburgh while retaining adjustable-rate, jumbo and select fixed rate residential real estate loans in our portfolio.
Residential real estate loans include loans secured by owner-occupied farmland. As of June 30, 2022, owner-occupied farmland loans totaled $37.7 million, or 15.6% of our residential real estate loan portfolio. Such loans are generally fixed-rate loans at a margin over the Prime Rate with terms up to 10 years and amortization schedules of up to 30 years. Loans secured by owner-occupied farmland may be made in amounts up to 80% of the value of the farm. Generally, we obtain personal guarantees from the borrower on all loans secured by owner-occupied farmland.
In underwriting residential real estate loans, we evaluate both the borrower’s ability to make monthly payments and the value of the property securing the loan. Properties securing real estate loans we make are appraised by independent appraisers. We generally require borrowers to obtain an attorney’s title opinion or title insurance, and fire and property insurance (including flood insurance, if necessary) in an amount not less than the amount of the loan.
Home Equity Loans.
Consumer Lending.
Consumer loans can have either a variable rate based on the index of Prime Rate or a fixed-rate of interest for a term of up to 10 years, depending on the type of collateral, product and the creditworthiness of the borrower. Our lending policy allows for unsecured, nonreal estate secured, and real estate secured loan products that are either installment or open-end credit. Our consumer loans may be secured with deposits, automobiles, motorcycles, or real property.
Our consumer loan policy sets forth our underwriting guidelines overall for all loan applications and addresses specific guidelines such as acceptable loan amounts, credit score, debt-to-income ratios, loan-to-value ratios, and collateral allowable by product type. The policy guidelines address applications, structuring, stability, credit standards, collateral, consumer compliance, insurance requirements and appraisal requirements.
Other Loans.
103
Loan Purchases, Participations and Sales
We sold $12.1 million and $31.4 million in residential real estate loans during the years ended December 31, 2021 or 2020. We did not sell any residential loans in the first half of 2022. We did sell the guaranteed portion of one SBA loan for $1.9 million during the first quarter of 2022.
Credit Risk Management
Loan Approval Procedures and Authority
Our lending activities follow written, nondiscriminatory underwriting standards and loan origination procedures established by our board of directors and management. The Bank has established the Officers’ Loan Committee (OLC) to be able to more efficiently service our commercial customers, prudently manage credit risks, and effectively ensure that credit policies are followed. The OLC requires a quorum of the Chief Executive Officer, Bank President, Chief Credit Officer, Senior Credit Officer, Chief Risk Officer, and the Regional Presidents. Each of these individuals have extensive experience in the approval of commercial loans. The OLC has authority to approve loans beginning over $3.0 million up to and including $8.0 million. In addition, the Director’s Loan Committee (DLC) has authority to approve loans over $8.0 million up to the legal lending limit of the Bank (with the exception of Regulation O (insider) loans which need to be approved by the board of directors).
The loan approval structure prohibits any single signature loan authority. Dual signatures are in effect up to $3.0 million. The Chief Executive Officer and Chief Credit Officer have been given dual signature authority up to $8.0 million in situations where timing is essential. These approvals must be ratified by OLC at the next meeting.
Ongoing Credit Risk Management.
Although we maintain a cautious credit outlook due to continued uncertainty in the economic environment, we believe the Bank is very well positioned for the months ahead given a strong loan loss reserve, application of prudent underwriting standards and a diverse loan portfolio, which does not include a significant concentration of loans in restaurants, lodging or other industries that are perceived to be at higher risk in the current economic environment.
104
Allowance for Loan Losses.
Investments
Our board of directors is responsible for approving and overseeing our investment policy. The investment policy is reviewed at least annually by management and any changes to the policy are recommended to the board of directors and are subject to its approval. This policy dictates that investment decisions be made based on the safety of the investment, regulatory standards, liquidity requirements, potential returns and consistency with our interest rate risk management strategy. We also use our investment portfolio to collateralize our municipal deposits. Our asset liability management committee, which consists of our President and Chief Risk Officer, Chief Executive Officer, Bank President, Chief Financial Officer and Chief Credit Officer, oversees our investing activities and strategies.
Our current investment policy authorizes us to invest in debt securities issued by the U.S. government and its agencies or government sponsored enterprises. In addition, management is authorized to invest in investment grade state and municipal obligations. The policy also permits investments in mortgage-backed securities, including pass-through securities, issued and guaranteed by Fannie Mae, Freddie Mac and Ginnie Mae, as well as investments in corporate debentures, federal funds and deposits in other insured institutions. We also are required to maintain an investment in FHLB stock, which investment is based primarily on the level of our FHLB borrowings. Additionally, we are required to maintain an investment in Federal Reserve Bank of Philadelphia stock equal to six percent of our capital and surplus. We do not engage in any investment hedging activities or trading activities, nor do we purchase any high-risk mortgage derivative products, corporate junk bonds, and certain types of structured notes.
At June 30, 2022, we had a portfolio of investment securities available for sale which is reported at fair value and a portfolio of held to maturity investment securities that were not carried at fair value through earnings.
Source of Funds
General.
Deposits
105
transaction accounts. We also provide online banking, mobile banking, and direct deposit services. In 2021, we added a team of bankers focused on originating low cost deposits from and servicing accounts of professional services firms with cash management and other deposit servicing products.
We offer a selection of deposit accounts, including demand accounts (interest-bearing and noninterest-bearing), money market deposit accounts, savings accounts and certificates of deposit. Deposit account terms vary, with the principal differences being the minimum balance required, the amount of time the funds must remain on deposit and the interest rate. At June 30, 2022, our core deposits (which includes all deposits except for time deposit accounts greater than $250,000 and brokered deposits) totaled $826.9 million, or 91.6% of our total deposits, and our cost of funds on this stable funding source was 0.45%. We had $20.0 million in brokered deposits at June 30, 2022. Our reciprocal CDARS and ICS deposits totaled $12.5 million at June 30, 2022.
The following table sets forth the distribution of total deposits for the Bank by account type as of June 30, 2022.
June 30, 2022 | ||||||||
(In Thousands) | Amount | % | ||||||
Demand, noninterest-bearing | $ | 184,345 | 20.4 | % | ||||
Demand, interest-bearing | 269,493 | 29.9 | ||||||
Money market and savings | 235,411 | 26.1 | ||||||
Time deposits, $250,000 and over | 55,507 | 6.1 | ||||||
Time deposits, other | 157,617 | 17.5 | ||||||
Total Deposits | $ | 902,373 | 100.0 | % | ||||
All deposits are generated from in-market relationships through our client solutions centers and our convenient digital account opening solution.
Borrowings.
At June 30, 2022, the Company had subordinated notes outstanding that were issued in 2020 with a fair value of $20.6 million. These notes bear interest at a fixed interest rate of 5.0% per year for the first five years and then float at an index tied to the Secured Overnight Finance Rate (“SOFR”) for years six through ten. The notes have a term of ten years, with a maturity date of October 1, 2030. The notes are redeemable at the option of the Company, in whole or in part, subject to any required regulatory approvals after the first five years.
Additionally, on April 8, 2022, the Company issued $20.0 million in aggregate principal amount of subordinated notes. The notes, which mature on April 15, 2032, bear interest at a fixed annual rate of 4.50% for the period up to but excluding April 15, 2027. From and including April 15, 2027 until maturity or redemption, the interest rate will adjust to a floating rate equal to a benchmark rate, which is expected to be the then-current three-month SOFR, plus 203 basis points. Subject to limited exceptions, the Company cannot redeem the notes before the fifth anniversary of the issuance date.
Competition
Commercial banking in Pennsylvania is extremely competitive. For example, as of June 30, 2021 (the most recent date for which data is available), data provided by the FDIC Deposit Market Share Report indicated that within the Company’s Central and Southeastern Pennsylvania market area, there were 57 different FDIC-insured institutions operating a total of 534 offices.
106
The Company’s market areas are served by branches of the largest banks in the Northeast, some of which are among the largest institutions in the United States. We must compete in our current and future growth market areas with large regional and nationwide banking organizations, other federally and state-chartered financial institutions such as savings and loan institutions and credit unions, mortgage companies, and other lenders engaged in the business of extending commercial credit. Many of the Company’s competitors have broader geographic markets and higher lending limits than we do and are also able to provide more services and make greater use of media advertising. Competitive threats also continue to emerge from in-and out-of-market providers and entities with powerful non-traditional and sometimes unregulated products, services, and technology, including numerous new fintech firms. The Bank’s comparatively small branch network will be a competitive disadvantage in attracting retail customers since a number of large national bank and regional state bank franchises have significant branch office coverage in the Bank’s market area.
Human Capital
We believe our employees are our most valuable asset. We are committed to building a culture of integrity and excellence and seek to provide a challenging and rewarding work environment in which employees are supported professionally. Our team members receive benefits including competitive compensation, comprehensive medical, dental and vision coverage, 401(k) plan with employer contributions and short-term and long-term disability coverage.
Personnel
As of June 30, 2022, we had 128 full-time employees and 15 part-time employees at LINKBANCORP and The Gratz Bank, none of whom are represented by a collective bargaining unit. We believe we have a good working relationship with our employees.
Subsidiaries
The Gratz Bank and GNB Investment Corp., a Delaware investment company subsidiary, are the only subsidiaries of LINKBANCORP and there are no subsidiaries of The Gratz Bank and GNB Investment Corp.
Legal Proceedings
From time to time, we are a party to various litigation matters incidental to the conduct of our business. As of June 30, 2022, we do not believe that any currently pending legal proceedings will have a material adverse effect on our business, financial condition or results of operations.
107
Properties
The Company’s principal offices are located at 3045 Market Street, Camp Hill, Pennsylvania. The Company owns and leases other premises for use as client solutions centers in Dauphin, Chester, Cumberland, Lancaster, Northumberland, and Schuylkill counties within Pennsylvania. The following table sets forth the location and other information of our Bank facilities.
Brand | Location | Street Address | City, State and Zip Code | Region | Owned/ Leased | |||||
LINKBANK | Camp Hill Solutions Center | 3045 Market Street | Camp Hill, PA 17011 | Capital Region | Leased | |||||
LINKBANK | Linglestown Solutions Center | 2057 EG Drive | Harrisburg, PA 17110 | Capital Region | Leased | |||||
LINKBANK | Lancaster Solutions Center | 2010 Fruitville Pike | Lancaster, PA 17601 | Lancaster Region | Leased | |||||
The Gratz Bank | Gratz Solutions Center | 32 West Market Street | Gratz, PA 17030 | Gratz Region | Owned | |||||
The Gratz Bank | Herndon Solutions Center | 4231 State Route 147 | Herndon, PA 17830 | Gratz Region | Owned | |||||
The Gratz Bank | Minersville Solutions Center | 260 West Sunbury Street | Minersville, PA 17954 | Gratz Region | Owned | |||||
The Gratz Bank | Pottsville Solutions Center | 2221 West Market Street | Pottsville, PA 17901 | Gratz Region | Leased | |||||
The Gratz Bank | Treverton Solutions Center | 450 West Shamokin Street | Trevorton, PA 17881 | Gratz Region | Owned | |||||
The Gratz Bank | Valley View Solutions Center | 1625 West Main Street | Valley View, PA 17983 | Gratz Region | Owned | |||||
LINKBANK | West Chester Solutions Center | 1436 Pottstown Pike | West Chester, PA 19380 | Delaware Valley Region | Leased | |||||
Loan Production Office: | ||||||||||
LINKBANK | York Loan Production Office | 135 N. George Street, Suite 201 | York, PA 17401 | York Region | Leased | |||||
108
SUPERVISION AND REGULATION
General
LINKBANCORP, is a bank holding company within the meaning of the BHC Act. As such, it is registered with, subject to examination and supervision by, and otherwise required to comply with the rules and regulations of the FRB.
The Bank is a Pennsylvania-chartered commercial bank subject to extensive regulation by the PADOBS and the FDIC. The Bank’s deposit accounts are insured up to applicable limits by the FDIC. The Bank must file reports with the PADOBS and the FDIC concerning its activities and financial condition, in addition to obtaining regulatory approvals prior to entering into certain transactions, such as mergers or acquisitions with other depository institutions and the opening of new branches. There are periodic examinations of the Bank by the PADOBS and the FDIC to review the Bank’s compliance with various regulatory requirements and to ascertain the financial health and stability of the Bank. This regulation and supervision establishes a comprehensive oversight framework of the activities in which a commercial bank can engage and is intended primarily for the protection of the FDIC insurance fund and depositors. The regulatory structure also gives the regulatory authorities extensive discretion in connection with their supervisory and enforcement activities and examination policies, including policies with respect to the classification of assets and the establishment of adequate loan loss reserves for regulatory purposes. Adverse findings and conclusions reached by regulators in connection with the examination process could result in the imposition of significant restrictions and limitations on the Bank’s business activities until the regulatory concerns which gave rise to such adverse findings and conclusions have been adequately addressed. Such restrictions and limitations could have an adverse impact on the operations and financial condition of the Bank. Any change in such regulations, whether by the PADOBS, the FDIC, the FRB or Congress could have a material impact on the operations and financial condition of the Bank.
Set forth below is a brief description of material regulatory requirements that are or will be applicable to LINKBANCORP, and the Bank. The description is limited to certain material aspects of the statutes and regulations addressed, is not intended to be a complete description of such statutes and regulations and their effects on LINKBANCORP and the Bank, and is qualified in its entirety by reference to the actual statutes and regulations involved.
Bank Regulation
Capital Requirements
Federal regulations require FDIC-insured depository institutions to meet several minimum capital standards: a common equity Tier 1 capital to risk-based assets ratio of 4.5%, a Tier 1 capital to risk-based assets ratio of 6.0%, a total capital to risk-based assets of 8%, and a 4% Tier 1 capital to total assets leverage ratio.
For purposes of the regulatory capital requirements, common equity Tier 1 capital is generally defined as common shareholders’ equity and retained earnings. Tier 1 capital is generally defined as common equity Tier 1 and additional Tier 1 capital. Additional Tier 1 capital includes certain noncumulative perpetual preferred stock and related surplus and minority interests in equity accounts of consolidated subsidiaries. Total capital includes Tier 1 capital (common equity Tier 1 capital plus additional Tier 1 capital) and Tier 2 capital. Tier 2 capital is comprised of capital instruments and related surplus, and may include cumulative preferred stock and long-term perpetual preferred stock, mandatory convertible securities, intermediate preferred stock and subordinated debt that satisfies certain specific and detailed requirements. Also included in Tier 2 capital is the allowance for loan and lease losses limited to a maximum of 1.25% of risk-weighted assets and, for institutions such as the Bank, that have exercised an opt-out election regarding the treatment of Accumulated Other Comprehensive Income (“AOCI”), up to 45% of net unrealized gains on available for sale equity securities with readily determinable fair market values. Calculation of all types of regulatory capital is subject to deductions and adjustments specified in the applicable regulations.
109
In determining the amount of risk-weighted assets for purposes of calculating risk-based capital ratios, all assets, including certain off-balance sheet assets (e.g., recourse obligations, direct credit substitutes, residual interests) are multiplied by a risk weight factor assigned by the regulations based on the risks believed inherent in the type of asset. Higher levels of capital are required for asset categories believed to present greater risk. For example, a risk weight of 0% is assigned to cash and U.S. government securities, a risk weight of 50% is generally assigned to prudently underwritten first lien one-to four-family residential mortgages, a risk weight of 100% is assigned to commercial and consumer loans, a risk weight of 150% is assigned to certain past due loans and a risk weight of between 0% to 600% is assigned to permissible equity interests, depending on certain specified factors.
In addition to establishing the minimum regulatory capital requirements, the regulations limit capital distributions, repurchase of outstanding stock and certain discretionary bonus payments to management if the institution does not hold a “capital conservation buffer” consisting of 2.5% of common equity Tier 1 capital to risk-weighted asset above the amount necessary to meet its minimum risk-based capital requirements.
In assessing an institution’s capital adequacy, the FDIC takes into consideration, not only these numeric factors, but qualitative factors as well, and has the authority to establish higher capital requirements for individual institutions where deemed necessary.
Notwithstanding the foregoing, the FDIC finalized a rule, effective January 1, 2020, that established a community bank leverage ratio (tier 1 capital to average consolidated assets) at 9% for institutions under $10 billion in assets that such institutions may elect to utilize in lieu of the general applicable risk-based capital requirements under Basel III described above. Such institutions that meet the community bank leverage ratio and certain other qualifying criteria will automatically be deemed to be well-capitalized. The CARES Act required that the community bank leverage ratio be temporarily lowered to 8%. The federal regulators issued a rule making the reduced ratio effective for the second quarter of 2020. Another rule was issued to transition back to the 9% community bank leverage ratio by increasing the ratio to 8.5% for calendar year 2021 and to 9% thereafter. Eligible institutions may opt into and out of the community bank ratio framework on their quarterly call report. The Bank did not elect to follow the community bank leverage ratio as of June 30, 2022.
At June 30, 2022, the Bank exceeded all applicable regulatory capital requirements and was considered to be well-capitalized based on FDIC guidelines.
Loans-to-One Borrower
Generally, a Pennsylvania-chartered commercial bank may not make a loan or extend credit to a single or related group of borrowers in excess of 15% of its capital. An additional amount may be loaned, equal to 10% of unimpaired capital and surplus, if the loan is secured by readily marketable collateral, which generally does not include real estate. As of June 30, 2022, the Bank was in compliance with the loans-to-one borrower limitations.
Capital Distributions
The Pennsylvania Banking Code states, in part, that dividends may be declared and paid only out of accumulated net earnings and may not be declared or paid unless surplus is at least equal to capital. Dividends may not reduce surplus without the prior consent of the PADOBS. In addition, the Federal Deposit Insurance Act provides that an insured depository institution may not make any capital distribution if, after making such distribution, the institution would fail to meet any applicable regulatory capital requirement.
Community Reinvestment Act and Fair Lending Laws
All insured institutions have a responsibility under the Community Reinvestment Act (“CRA”) and related regulations to help meet the credit needs of their communities, including low- and moderate-income borrowers.
110
The FDIC is required to assess the Bank’s record of compliance with the Community Reinvestment Act. Failure to comply with the provisions of the Community Reinvestment Act could, at a minimum, result in denial of certain corporate applications, such as branches or mergers, or in restrictions on its activities. In addition, the Equal Credit Opportunity Act and the Fair Housing Act prohibit lenders from discriminating in their lending practices on the basis of characteristics specified in those statutes. The failure to comply with the Equal Credit Opportunity Act and the Fair Housing Act could result in enforcement actions by the FDIC, as well as other federal regulatory agencies and the Department of Justice.
The Community Reinvestment Act requires all institutions insured by the FDIC to publicly disclose their CRA rating. The Bank received a “satisfactory” rating in its most recent federal examination.
Transactions with Related Parties
A state-chartered bank’s authority to engage in transactions with its affiliates is limited by Sections 23A and 23B of the Federal Reserve Act and related federal regulations. An affiliate of a company is generally a company that controls, is controlled by, or is under common control with another company, including an insured depository institution such as the Bank. The Company is an affiliate of the Bank because of its control of the Bank. In general, transactions between an insured depository institution and its affiliates are subject to certain prohibitions, quantitative limits and collateral requirements. In addition, federal regulations prohibit a state-chartered bank from lending to any of its affiliates that are engaged in activities that are not permissible for bank holding companies and from purchasing the securities of any affiliate, other than a subsidiary. Finally, transactions with affiliates must be consistent with safe and sound banking practices, not involve the purchase of low-quality assets and be on terms that are as favorable to the institution as comparable transactions with non-affiliates.
The Bank’s authority to extend credit to its directors, executive officers and 10% shareholders, as well as to entities controlled by such persons, is governed by the requirements of Sections 22(g) and 22(h) of the Federal Reserve Act and Regulation O of the FRB. Among other things, these provisions generally require that extensions of credit to insiders be made on terms that are substantially the same as, and follow credit underwriting procedures that are not less stringent than, those prevailing for comparable transactions with unaffiliated persons and that do not involve more than the normal risk of repayment or present other unfavorable features; and not exceed certain limitations on the amount of credit extended to such persons, individually and in the aggregate, which limits are based, in part, on the amount of the Bank’s capital. In addition, extensions of credit in excess of certain limits must be approved by the Bank’s Board. Extensions of credit to executive officers are subject to additional limits based on the type of extension involved.
Standards for Safety and Soundness
Federal law requires each federal banking agency to prescribe certain standards for all insured depository institutions. These standards relate to, among other things, internal controls, information systems and audit systems, loan documentation, credit underwriting, interest rate risk exposure, asset growth, compensation, and other operational and managerial standards as the agency deems appropriate. Interagency guidelines set forth the safety and soundness standards that the federal banking agencies use to identify and address problems at insured depository institutions before capital becomes impaired. If the appropriate federal banking agency determines that an institution fails to meet any standard prescribed by the guidelines, the agency may require the institution to submit to the agency an acceptable plan to achieve compliance with the standard. If an institution fails to meet these standards, the appropriate federal banking agency may require the institution to implement an acceptable compliance plan. Failure to implement such a plan can result in further enforcement action, including the issuance of a cease and desist order or the imposition of civil money penalties.
The PADOBS implements a similar set of laws, regulations and restrictions applicable to the Bank under Pennsylvania law.
111
Prompt Corrective Regulatory Action
Federal law requires, among other things, that federal bank regulatory authorities take “prompt corrective action” with respect to banks that do not meet certain applicable minimum capital requirements. For these purposes, the law establishes five capital categories: well capitalized, adequately capitalized, undercapitalized, significantly undercapitalized and critically undercapitalized.
An institution is deemed to be “well capitalized” if it has a total risk-based capital ratio of 10.0% or greater, a Tier 1 risk-based capital ratio of 8.0% or greater, a leverage ratio of 5.0% or greater and a common equity Tier 1 ratio of 6.5% or greater. An institution is “adequately capitalized” if it has a total risk-based capital ratio of 8.0% or greater, a Tier 1 risk-based capital ratio of 6.0% or greater, a leverage ratio of 4.0% or greater and a common equity Tier 1 ratio of 4.5% or greater. An institution is “undercapitalized” if it has a total risk-based capital ratio of less than 8.0%, a Tier 1 risk-based capital ratio of less than 6.0%, a leverage ratio of less than 4.0% or a common equity Tier 1 ratio of less than 4.5%. An institution is deemed to be “significantly undercapitalized” if it has a total risk-based capital ratio of less than 6.0%, a Tier 1 risk-based capital ratio of less than 4.0%, a leverage ratio of less than 3.0% or a common equity Tier 1 ratio of less than 3.0%. An institution is considered to be “critically undercapitalized” if it has a ratio of tangible equity (as defined in the regulations) to total assets that is equal to or less than 2.0%.
The regulations also provide that a capital restoration plan must be filed with the FDIC within 45 days of the date that an institution is deemed to have received notice that it is “undercapitalized,” “significantly undercapitalized” or “critically undercapitalized.” Any bank holding company of an institution that is required to submit a capital restoration plan must guarantee performance under the plan in an amount of up to the lesser of 5% of the institution’s assets at the time it was deemed to be undercapitalized by the FDIC or the amount necessary to restore the institution to adequately capitalized status. This guarantee remains in place until the FDIC notifies the institution that it has maintained adequately capitalized status for each of four consecutive calendar quarters. Institutions that are undercapitalized become subject to certain mandatory measures, such as restrictions on capital distributions and asset growth.
Generally, the PADOBS is required to appoint a receiver or conservator for a state-chartered bank that is “critically undercapitalized” within specific time frames. The PADBS may also take any one of a number of discretionary supervisory actions against undercapitalized institutions, including the issuance of a capital directive and the replacement of senior executive officers and directors.
At June 30, 2022, the Bank met the criteria for being considered “well capitalized.”
Enforcement
The PADOBS maintains enforcement authority over the Bank, including the power to issue cease and desist orders and civil money penalties and to remove directors, officers or employees. It also has the power to appoint a conservator or receiver for a bank upon insolvency, imminent insolvency, unsafe or unsound condition or certain other situations. The FDIC has primary federal enforcement responsibility over non-member state banks and has authority to bring actions against the institution and all institution-affiliated parties, including officers, directors, shareholders, and any attorneys, appraisers and accountants who knowingly or recklessly participate in wrongful actions likely to have an adverse effect on the bank. Formal enforcement action may range from the issuance of a capital directive or cease and desist order to removal of officers and/or directors. Civil money penalties cover a wide range of violations and can amount to $25,000 per day, or even $1 million per day in especially egregious cases. In general, regulatory enforcement actions occur with respect to situations involving unsafe or unsound practices or conditions, violations of law or regulation or breaches of fiduciary duty, including self-dealing. Federal and Pennsylvania laws also establish criminal penalties for certain violations.
Federal Insurance of Deposit Accounts
The maximum amount of deposit insurance for depositary institutions is $250,000 per depositor. The FDIC requires depositary institutions to pay assessments to the FDIC to cover the cost of this insurance. Such
112
assessments for most insured depository institutions are now based on financial measures and supervisory ratings derived from statistical modeling which estimate the probability of failure within three years. The assessment range (inclusive of possible adjustments) is for institutions of the Bank’s size is 1.5 basis points to 30 basis points of the institution’s deposit base. The FDIC has authority to increase insurance assessments. Any significant increases would have an adverse effect on the operating expenses and results of operations of the Bank. Management cannot predict what assessment rates will be in the future.
Insurance of deposits may be terminated by the FDIC upon a finding that an institution has engaged in unsafe or unsound practices, is in an unsafe or unsound condition to continue operations or has violated any applicable law, regulation, rule, order or condition imposed by the FDIC. We do not currently know of any practice, condition or violation that may lead to termination of our deposit insurance.
Prohibitions Against Tying Arrangements
State-chartered banks are prohibited, subject to some exceptions, from extending credit to or offering any other service, or fixing or varying the consideration for such extension of credit or service, on the condition that the customer obtain some additional service from the institution or its affiliates or not obtain services of a competitor of the institution.
FHLB System
The Bank is a member of the FHLB System, which consists of 11 regional FHLBs. The FHLB System provides a central credit facility primarily for member institutions as well as other entities involved in home mortgage lending. As a member of the FHLB of Pittsburgh, the Bank is required to acquire and hold shares of capital stock in the FHLB. As of June 30, 2022, the Bank was in compliance with this requirement. The Bank also is able to borrow from the FHLB of Pittsburgh, which provides an additional source of liquidity for the Bank.
Other Regulations
Interest and other charges collected or contracted for by the Bank are subject to state usury laws and federal laws concerning interest rates. The Bank’s operations are also subject to federal laws applicable to credit transactions, such as the:
| • | Truth-In-Lending Act, governing disclosures of credit terms to consumer borrowers; |
| • | Real Estate Settlement Procedures Act, requiring that borrowers for mortgage loans for one-to four-family residential real estate receive various disclosures, including good faith estimates of settlement costs, lender servicing and escrow account practices, and prohibiting certain practices that increase the cost of settlement services; |
| • | Home Mortgage Disclosure Act, requiring financial institutions to provide information to enable the public and public officials to determine whether a financial institution is fulfilling its obligation to help meet the housing needs of the community it serves; |
| • | Equal Credit Opportunity Act, prohibiting discrimination on the basis of race, creed or other prohibited factors in extending credit; |
| • | Fair Credit Reporting Act, governing the use and provision of information to credit reporting agencies; |
| • | Fair Debt Collection Act, governing the manner in which consumer debts may be collected by collection agencies; |
| • | Truth in Savings Act; and |
| • | Rules and regulations of the various federal agencies charged with the responsibility of implementing such federal laws. |
113
The operations of the Bank also are subject to the:
| • | Right to Financial Privacy Act, which imposes a duty to maintain confidentiality of consumer financial records and prescribes procedures for complying with administrative subpoenas of financial records; |
| • | Electronic Funds Transfer Act and Regulation E promulgated thereunder, which govern automatic deposits to and withdrawals from deposit accounts and customers’ rights and liabilities arising from the use of automated teller machines and other electronic banking services; |
| • | Check Clearing for the 21st Century Act (also known as “Check 21”), which gives “substitute checks,” such as digital check images and copies made from that image, the same legal standing as the original paper check; |
| • | The PATRIOT Act, which requires banks operating to, among other things, establish broadened anti-money laundering compliance programs, due diligence policies and controls to ensure the detection and reporting of money laundering. Such required compliance programs are intended to supplement existing compliance requirements, also applicable to financial institutions, under the Bank Secrecy Act and the Office of Foreign Assets Control regulations; and |
| • | Gramm-Leach-Bliley Act, which places limitations on the sharing of consumer financial information by financial institutions with unaffiliated third parties. Specifically, the Gramm-Leach-Bliley Act requires all financial institutions offering financial products or services to retail customers to provide such customers with the financial institution’s privacy policy and provide such customers the opportunity to “opt out” of the sharing of certain personal financial information with unaffiliated third parties. |
Holding Company Regulation
General
The Company, as a bank holding company controlling the Bank, is subject to regulation and supervision by the FRB under the BHCA. The Company is periodically examined by and required to submit reports to the FRB and must comply with the FRB’s rules and regulations. Among other things, the FRB has authority to restrict activities by a bank holding company that are deemed to pose a serious risk to the subsidiary bank.
Permissible Activities
A bank holding company is generally prohibited from engaging in non-banking activities, or acquiring direct or indirect control of more than 5% of the voting securities of any company engaged in non-banking activities. One of the principal exceptions to this prohibition is for activities found by the FRB to be so closely related to banking or managing or controlling banks as to be a proper incident thereto. Some of the principal activities that the FRB has determined by regulation to be so closely related to banking are: (i) making or servicing loans; (ii) performing certain data processing services; (iii) providing discount brokerage services; (iv) acting as fiduciary, investment or financial advisor; (v) leasing personal or real property; (vi) making investments in corporations or projects designed primarily to promote community welfare; and (vii) acquiring a savings and loan association whose direct and indirect activities are limited to those permitted for bank holding companies.
The Gramm-Leach-Bliley Act of 1999 authorized a bank holding company that meets specified conditions, including being “well capitalized” and “well managed,” to opt to become a “financial holding company” and thereby engage in a broader array of financial activities than previously permitted. Such activities can include insurance underwriting and investment banking. A “financial holding company” may engage in a broader array of financial activities than permitted a typical bank holding company. Such activities can include insurance underwriting and investment banking. The Company has not elected “financial holding company” status.
114
Capital
Bank holding companies are subject to consolidated regulatory capital requirements, which have historically been similar to, though less stringent than, those of the for the Bank. Federal legislation, however, required the FRB to promulgate consolidated capital requirements for depository institution holding companies that are no less stringent, both quantitatively and in terms of components of capital, than those applicable to institutions themselves. As a result, consolidated regulatory capital requirements identical to those applicable to the subsidiary banks generally apply to bank holding companies. However, the FRB has provided a “Small Bank Holding Company” exception to its consolidated capital requirements, and subsequent legislation and the related issuance of regulations by the FRB have increased the threshold for the exception to $3.0 billion of consolidated assets. Consequently, bank holding companies such as the Company with less than $3.0 billion of consolidated assets are not subject to the consolidated holding company capital requirements unless otherwise directed by the FRB.
Source of Strength
The FRB has issued regulations requiring that all bank holding companies serve as a source of strength to their subsidiary depository institutions by providing financial, managerial and other support in times of an institution’s distress.
Dividends and Stock Repurchases
The FRB has issued a policy statement regarding the payment of dividends by holding companies. In general, the policy provides that dividends should be paid only out of current earnings and only if the prospective rate of earnings retention by the holding company appears consistent with the organization’s capital needs, asset quality and overall supervisory financial condition. Separate regulatory guidance provides for prior consultation with FRB staff concerning dividends in certain circumstances such as where the company’s net income for the past four quarters, net of dividends previously paid over that period, is insufficient to fully fund the dividend or the company’s overall rate or earnings retention is inconsistent with the company’s capital needs and overall financial condition. The ability of a bank holding company to pay dividends may be restricted if a subsidiary bank becomes undercapitalized.
The regulatory guidance also states that a bank holding company should consult with FRB supervisory staff prior to redeeming or repurchasing common stock or perpetual preferred stock if the bank holding company is experiencing financial weaknesses or the repurchase or redemption would result in a net reduction, at the end of a quarter, in the amount of such equity instruments outstanding compared with the beginning of the quarter in which the redemption or repurchase occurred.
There is a separate requirement that a bank holding company give the FRB prior written notice of any purchase or redemption of then outstanding equity securities if the gross consideration for the purchase or redemption, when combined with the net consideration paid for all such purchases or redemptions during the preceding 12 months, is equal to 10% or more of the company’s consolidated net worth. The FRB may disapprove such a purchase or redemption if it determines that the proposal would constitute an unsafe and unsound practice, or would violate any law, regulation, FRB order or directive, or any condition imposed by, or written agreement with, the FRB. There is an exception to this approval requirement for well-capitalized bank holding companies that meet certain other conditions.
These regulatory policies may affect the ability of LINKBANCORP, Inc. to pay dividends, repurchase shares of common stock or otherwise engage in capital distributions.
115
Acquisition of Control of the Company
Under the Change in Bank Control Act, no person may acquire control of a bank holding company such as the Company unless the FRB has prior written notice and has not issued a notice disapproving the proposed acquisition. In evaluating such notices, the FRB takes into consideration such factors as the financial resources, competence, experience and integrity of the acquirer, the future prospects the bank holding company involved and its subsidiary bank and the competitive effects of the acquisition. Control, as defined under federal law, means ownership, control of or holding irrevocable proxies representing more than 25% of any class of voting stock, control in any manner of the election of a majority of the company’s directors, or a determination by the regulator that the acquirer has the power to direct, or directly or indirectly to exercise a controlling influence over, the management or policies of the institution. Acquisition of more than 10% of any class of a bank holding company’s voting stock constitutes a rebuttable presumption of control under the regulations under certain circumstances including where, as will be the case with the Company, the issuer has registered securities under Section 12 of the Securities Exchange Act of 1934.
Federal Securities Laws
LINKBANCORP, Inc.’s common stock will be registered with the Securities and Exchange Commission under Section 12(b) of the Securities Exchange Act of 1934 (the “Exchange Act”) prior to the completion of the stock offering. LINKBANCORP, Inc. is currently a reporting company subject to the periodic and current reporting requirements of Section 15(d) of the Exchange Act and, following its registration under Section 12(b) of the Exchange Act, LINKBANCORP, Inc. will be a reporting company subject to additional Exchange Act requirements, including requirements related to proxy solicitation, insider trading restrictions and beneficial ownership reporting.
Emerging Growth Company Status
The Jumpstart Our Business Startups Act (the “JOBS Act”), which was enacted in April 2012, has made numerous changes to the federal securities laws to facilitate access to capital markets. Under the JOBS Act, a company with total annual gross revenues of less than $1.07 billion during its most recently completed fiscal year qualifies as an “emerging growth company.” LINKBANCORP, Inc. qualifies as an emerging growth company under the JOBS Act.
An “emerging growth company” may choose not to hold shareholder votes to approve annual executive compensation (more frequently referred to as “say-on-pay” votes) or executive compensation payable in connection with a merger (more frequently referred to as “say-on-golden parachute” votes). An emerging growth company also is not subject to the requirement that its auditors attest to the effectiveness of the company’s internal control over financial reporting, and can provide scaled disclosure regarding executive compensation; however, LINKBANCORP, Inc. will also not be subject to the auditor attestation requirement or additional executive compensation disclosure so long as it remains a “non-accelerated filer” and a “smaller reporting company,” respectively, under Securities and Exchange Commission regulations (generally less than $75 million and $250 million, respectively, of voting and non-voting equity held by non-affiliates or less than $100.0 million in annual revenue). Finally, an emerging growth company may elect to comply with new or amended accounting pronouncements in the same manner as a private company, but must make such election when the company is first required to file a registration statement. LINKBANCORP, Inc. has previously elected to comply with new or amended accounting pronouncements in the same manner as a private company.
A company loses emerging growth company status on the earlier of: (i) the last day of the fiscal year of the company during which it had total annual gross revenues of $1.07 billion or more; (ii) the last day of the fiscal year of the issuer following the fifth anniversary of the date of the first sale of common equity securities of the company pursuant to an effective registration statement under the Securities Act of 1933; (iii) the date on which such company has, during the previous three-year period, issued more than $1.0 billion in non-convertible debt; or (iv) the date on which such company is deemed to be a “large accelerated filer” under Securities and Exchange Commission regulations (generally, at least $700 million of voting and non-voting equity held by non-affiliates).
116
Sarbanes-Oxley Act of 2002
The Sarbanes-Oxley Act of 2002 is intended to improve corporate responsibility, to provide for enhanced penalties for accounting and auditing improprieties at publicly traded companies and to protect investors by improving the accuracy and reliability of corporate disclosures pursuant to the securities laws. We have policies, procedures and systems designed to comply with these regulations, and we review and document such policies, procedures and systems to ensure continued compliance with these regulations.
117
MANAGEMENT
Our Directors and Executive Officers
Our board of directors is comprised of fifteen members. Our Bylaws provide that directors are each elected annually. Our directors are elected to serve for a one-year period and until their respective successors shall have been elected and shall qualify. The following table states our directors’ names, their ages as of August 15, 2022, the years that they began serving as directors and when their current term as directors of LINKBANCORP expires.
Name | Position(s) Held With LINKBANCORP/The Gratz Bank | Age | Director Since | Term Expires | ||||||||||
DIRECTORS | ||||||||||||||
Andrew Samuel | Chief Executive Officer and Vice-Chairman of the Board | 60 | 2018 | 2023 | ||||||||||
Brent Smith | Executive Vice President, President of The Gratz Bank and Director | 40 | 2018 | 2023 | ||||||||||
Jennifer Delaye | Director | 56 | 2018 | 2023 | ||||||||||
Anson Flake | Director | 56 | 2019 | 2023 | ||||||||||
George Parmer | Director | 82 | 2018 | 2023 | ||||||||||
Debra Pierson | Director | 54 | 2018 | 2023 | ||||||||||
Diane Poillon | Director | 53 | 2019 | 2023 | ||||||||||
William E. Pommerening | Director | 63 | 2018 | 2023 | ||||||||||
Timothy J. Allison | Director | 73 | 2021 | (1) | 2023 | |||||||||
William L. Jones | Director | 67 | 2021 | (1) | 2023 | |||||||||
David H. Koppenhaver | Director | 74 | 2021 | (1) | 2023 | |||||||||
Joseph C. Michetti, Jr. | Chairman of the Board | 68 | 2021 | (1) | 2023 | |||||||||
Kristen Snyder | Director | 37 | 2021 | (1) | 2023 | |||||||||
Steven I. Tressler | Director | 68 | 2021 | (1) | 2023 | |||||||||
Wesley M. Weymers | Director and Executive Chairman of The Gratz Bank | 65 | 2021 | (1) | 2023 | |||||||||
EXECUTIVE OFFICERS WHO ARE NOT DIRECTORS | ||||||||||||||
Carl Lundblad | President and Chief Risk Officer | 51 | N/A | N/A | ||||||||||
Tiffanie Horton | Chief Credit Officer | 41 | N/A | N/A | ||||||||||
Adam Pierce | Chief Operations and Technology Officer | 47 | N/A | N/A | ||||||||||
Kristofer Paul | Chief Financial Officer | 42 | N/A | N/A | ||||||||||
| (1) | Appointed pursuant to the Agreement and Plan of Merger among LINKBANCORP, LINKBANK, GNB Financial Services, Inc. and The Gratz Bank, dated December 10, 2020. |
The Business Background of Our Directors and Executive Officers
The biographies of each of the directors and executive officers are set forth below. With respect to the directors, the biographies also contain information regarding the person’s business experience and the experiences, qualifications, attributes or skills that caused the Nominating and Corporate Governance Committee to determine that the person should serve as a director. LINKBANCORP believes that each of these individuals have reputations for integrity, honesty, and adherence to high ethical standards. Each has demonstrated business insight and an ability to exercise sound judgement as well as a commitment to service. None of the LINKBANCORP directors are directors of any other publicly-traded company. Each director of LINKBANCORP is also a director of The Gratz Bank.
Andrew Samuel, Vice-Chairman and Chief Executive Officer:
118
his service with LINKBANCORP, Mr. Samuel served as President and Chief Executive Officer of Sunshine Bancorp, Inc. (Nasdaq: SBPC) and Sunshine Bank since October 2014 through its acquisition in January 2018. He served as a Director and President of Susquehanna Bancshares, Inc. (Nasdaq: SUSQ) and President and Chief Executive Officer and Chairman of the board of Susquehanna Bank, from February 2012 to October 2014. Prior to joining Susquehanna and, beginning in 2005, Mr. Samuel served as Chairman, Chief Executive Officer and President of Tower Bancorp, Inc. (Nasdaq: TOBC) and Graystone Bank, a de novo bank he co-founded in 2005 that grew to approximately $2.7 billion in assets at the time of the sale to Susquehanna Bancshares, Inc. Mr. Samuel has served in various executive and other positions at other financial institutions dating back to 1984, including Waypoint Financial Corp., Sovereign Bank, Fulton Bank, and Commonwealth National Banks/Mellon. Mr. Samuel’s leadership experience and vast knowledge of the banking industry led to his nomination to the board.
Brent Smith, Director, Executive Vice President and President of The Gratz Bank:
George Parmer, Director:
William Pommerening, Director:
Jennifer Delaye, Director:
Debra Pierson, Director
119
Anson Flake, Director
Diane Poillon, Director
Timothy J. Allison, Director:
William L. Jones, Director:
David H. Koppenhaver, Director
Joseph C. Michetti, Jr., Director:
Kristen Snyder, Director:
.
Steven I. Tressler, Director
120
Wesley M. Weymers, Director
Executive Officers Who Are Not Directors
Carl Lundblad, President and Chief Risk Officer:
Kristofer Paul, Chief Financial Officer:
Tiffanie Horton, Chief Credit Officer:
Adam Pierce, Chief Operations and Technology Officer:
Board Independence
Based on information provided by each director concerning his or her background, employment and affiliations, LINKBANCORP believes that all of the directors other than Messrs. Samuel, Smith and Weymers are “independent” directors as defined in the Nasdaq Listing Rules which the Company has adopted as its
121
independence standard. Mr. Samuel, who serves as LINKBANCORP’s Vice-Chairman and Chief Executive Officer, Mr. Smith, who serves as President of The Gratz Bank and Executive Vice President of LINKBANCORP, and Mr. Weymers, who serves as Executive Chairman of The Gratz Bank, are executive officers and therefore are not considered to be independent. In evaluating the independence of our independent directors, the Board considered, in addition to the transactions reported under “Certain Relationships and Related Party Transactions” below, the Bank’s purchase of catering services from a company in which Ms. Delaye has a controlling interest; propane supplies purchased from a company in which Mr. Koppenhaver and Ms. Snyder have a controlling interest; legal services engaged from a law firm in which Mr. Michetti has a controlling interest; and air and surface disinfection products from a company in which Mr. Pommerening has a controlling interest.
Committees of the Board of Directors
The business of LINKBANCORP is conducted at regular and special meetings of the board of directors and its committees. In addition, the “independent” members of the board of directors (as defined in the listing rules of the Nasdaq Stock Market) regularly meet in executive sessions. The primary committees of the board of directors of LINKBANCORP are the Audit Committee, Compensation Committee and the Nominating and Corporate Governance Committee.
Audit Committee.
Nominating and Corporate Governance Committee.
Compensation Committee.
The Compensation Committee is responsible for establishing the compensation philosophy, developing compensation guidelines, establishing the compensation of the Chief Executive Officer and the other senior executive officers. No executive officer who is also a director participates with respect to decisions on his compensation. The Compensation Committee also administers stock-based incentive and compensation plans. The Compensation Committee may retain, at its discretion, compensation consultants to assist it in making compensation related decisions.
The Compensation Committee retains responsibility for all compensation determinations as to executive officers. The Compensation Committee may utilize information and benchmarks from an independent
122
compensation consulting firm, and from other sources, to determine how executive compensation levels compare to those companies within the industry. The Compensation Committee may review published data for companies of similar size, location, financial characteristics and stage of development among other factors.
In designing the compensation program for LINKBANCORP, the Committee takes into consideration methods to avoid encouraging the taking of excessive risk by executive management or by any other employees. The Committee assessed risks posed by the incentive compensation paid to executive management and other employees and determined that LINKBANCORP’s compensation policies, practices and programs do not pose risks that are reasonably likely to have a material adverse effect on LINKBANCORP.
Other Committees.
Board’s Role in Cybersecurity Risk Oversight.
Code of Business Conduct and Ethics
The Company has adopted a Code of Ethics that is applicable to its senior financial officers, including the principal executive officer, principal financial officer, principal accounting officer and all officers performing similar functions. We have posted this Code of Ethics on our Investor Relations website at
https://ir.linkbancorp.com
under “Governance Documents.” Amendments to and waivers from the Code of Ethics will also be disclosed on the Company’s website. The information contained on our website is not a part of, or incorporated by reference into, this prospectus.123
EXECUTIVE COMPENSATION
As an emerging growth company under the JOBS Act, we have opted to comply with the executive compensation disclosure rules applicable to “smaller reporting companies” as such term is defined in the rules promulgated under the Securities Act of 1933, which permit us to limit reporting of executive compensation to our principal executive officer and our two other most highly compensated executive officers, which are referred to as our “named executive officers.” As more fully described below, we have elected to voluntarily add one more executive officer to our named executive officers in order to provide a more complete presentation of the compensation of key executives.
The compensation reported in the Summary Compensation Table below is not necessarily indicative of how we will compensate our named executive officers in the future. We will continue to review, evaluate and modify our compensation framework to maintain a competitive total compensation package. As such, and as a result of our becoming a publicly traded company, the compensation program following this offering could vary from our historical practices.
Our named executive officers, which consist of our principal executive officer and the Company’s three other most highly compensated executive officers during the year ended December 31, 2021, are:
| • | Andrew Samuel, Vice Chairman and Chief Executive Officer; |
| • | Carl Lundblad, President and Chief Risk Officer; |
| • | Brent Smith, Executive Vice President and President of The Gratz Bank; and |
| • | Wesley Weymers, Executive Vice President and Executive Chairman of The Gratz Bank. |
Summary Compensation Table
Summary Compensation Table.
Name and Principal Position | Year | Salary ($) | Bonus ($) | Option Awards ($) | Nonqualified Deferred Compensation Earnings ($) (1) | All Other Compensation ($) (2) | Total ($) | |||||||||||||||||||||
Andrew Samuel | 2021 | 500,000 | 285,000 | — | — | 15,138 | 800,138 | |||||||||||||||||||||
Vice-Chairman and Chief Executive Officer | 2020 | 250,000 | 200,000 | — | — | 15,479 | 465,479 | |||||||||||||||||||||
Carl Lundblad | 2021 | 230,000 | 83,375 | — | — | 30,343 | 343,718 | |||||||||||||||||||||
President and Chief Risk Officer | 2020 | 180,000 | 50,000 | — | — | 6,022 | 236,022 | |||||||||||||||||||||
Brent Smith (3) | 2021 | 210,000 | 76,125 | — | — | 33,237 | 319,362 | |||||||||||||||||||||
Executive Vice President and President of The Gratz Bank | 2020 | 180,000 | 50,000 | — | — | 11,796 | 241,796 | |||||||||||||||||||||
Wesley Weymers (4) | 2021 | 80,577 | 350,000 | (5) | 2,320 | (6) | 1,620 | 3,639 | 438,156 | |||||||||||||||||||
Executive Vice President and Executive Chairman of The Gratz Bank | ||||||||||||||||||||||||||||
| (1) | The non-qualified deferred compensation earnings represent the above market earnings on compensation that was credited to the applicable named executive officer’s account under the deferred compensation agreements, which are described below. |
124
| (2) | The amounts in this column include the following elements of compensation: |
Name | Year | 401(k) Match ($) | Deferred Compensation Plan ($) | Life Insurance ($) | Country Club Dues ($) | Company Car ($) | Total ($) | |||||||||||||||||||||
Andrew Samuel | 2021 | 8,700 | — | 828 | 4,370 | 1,240 | 15,138 | |||||||||||||||||||||
Carl Lundblad | 2021 | 6,927 | 23,000 | 416 | — | — | 30,343 | |||||||||||||||||||||
Brent Smith | 2021 | 6,430 | 21,000 | 165 | 4,370 | 1,272 | 33,237 | |||||||||||||||||||||
Wesley Weymers | 2021 | 370 | — | 269 | — | 3,000 | 3,639 | |||||||||||||||||||||
| (3) | Under the Securities and Exchange Commission rules, Mr. Smith’s compensation is not required to be disclosed. However, since Mr. Smith is a key executive and his total compensation is similar to Mr. Lundblad’s total compensation, LINKBANCORP voluntarily elected to disclose Mr. Smith’s compensation in order to provide a more complete presentation of the compensation of key executives. |
| (4) | Includes compensation since Mr. Weymers became an executive officer upon completion of the Merger with GNBF effective September 18, 2021. Since Mr. Weymers is a named executive officer for the first time in 2021, pursuant to Securities and Exchange Commission rules, compensation for prior years is not required to be reported. |
| (5) | Includes $300,000 retention bonus paid following completion of the Merger and a $50,000 annual bonus stipulated in Mr. Weymers’ employment agreement. |
| (6) | In accordance with FASB ASC Topic 718, the reported amount is the grant date fair value computed based upon the Black-Scholes option valuation model, and the actual value, if any, that may be realized will depend on the excess of the stock price over the exercise price on the date the option is exercised. Therefore, there is no assurance that the value of an option realized by a named executive officer will be at or near the value shown above. The assumptions used in the calculation of the amount shown is included in Note 16 to the Company’s audited consolidated financial statements included in this prospectus. |
Cash Bonus Awards.
2022 Base Salaries.
Employment Agreements
Andrew Samuel, Carl Lundblad and Brent Smith.
The term of the Employment Agreements is three years (two years for Messrs. Lundblad and Smith) and commencing as of October 28, 2022, and on each subsequent October 28, thereafter, the term of the Employment Agreements will renew for an additional year so that the remaining term will again become three years (two years for Messrs. Lundblad and Smith) unless the Company, the Bank (collectively, the “Employer”) or the executive gives written notice to the contrary not less than ninety (90) days prior to a renewal date. In the event written notice of non-renewal is provided, the executive would have no right to receive compensation or other benefits under the Employment Agreement other than payment of the executive’s accrued benefits (as defined in the Employment Agreement), as of the date of the expiration of the Employment Agreement or until the
125
executive voluntarily terminates employment, whichever occurs earlier. The current annual base salaries under the Employment Agreements with Messrs. Samuel, Lundblad and Smith are $625,000, $305,000 and $275,000, respectively. In addition to base salary, the Employment Agreements provide for, among other things, participation in bonus programs and other benefit plans and arrangements applicable to executive employees.
The Employer may terminate the executive’s employment for “cause” (as defined in the Employment Agreement) at any time, in which event the executive would have no right to receive compensation or other benefits for any period after his termination of employment except for the executive’s accrued benefits. Certain events resulting in the executive’s termination of employment entitle the executive to severance benefits. In the event of the executive’s involuntary termination of employment or in the event of a voluntary termination for “good reason” (as defined in the Employment Agreement), the executive would become entitled to a severance payment in the form of a cash lump sum payment equal to three times the executive’s annual base salary and the average cash bonus and other cash incentive compensation earned by the executive with respect to the three calendar years immediately preceding the year of termination. In addition, the executive would become entitled to the continuation of life, disability, medical insurance and other health and welfare benefits for the earlier of three years or until the executive obtains substantially similar benefits through other employment, or if the coverage cannot be provided because the executive is no longer an executive, the Employer shall reimburse the executive in an amount equal to the monthly premium paid by the executive to obtain substantially similar health and welfare benefits which reimbursement shall continue until the earlier of the expiration of three years from the date of termination of employment or until the executive obtains substantially similar benefits through other employment.
In the event of a “change in control” (as defined in the Employment Agreements) of the Employer followed within two years by the executive’s involuntary termination of employment for a reason other than for cause or upon his voluntary termination for good reason, the executive would become entitled to a severance payment in the form of a cash lump sum payment equal to three times the executive’s annual base salary and the average cash bonus and other cash incentive compensation earned by the executive with respect to the three calendar years immediately preceding the year of termination. In addition, the executive would become entitled to the continuation of life, disability, medical insurance and other health and welfare benefits for the earlier of three years or until the executive obtains substantially similar benefits through other employment, or if the coverage cannot be provided because the executive is no longer an executive, the Employer shall reimburse the executive in an amount equal to the monthly premium paid by the executive to obtain substantially similar health and welfare benefits which reimbursement shall continue until the earlier of the expiration of three years from the date of termination of employment or until the executive obtains substantially similar benefits through other employment. In the event that an excise tax under Sections 280G and 4999 of the Internal Revenue Code would be assessed on the payments or other benefits received under the Employment Agreement in connection with a change in control of the Employer, the executive would receive either: (1) all the payments and benefits to which the executive is entitled under the Employment Agreement, subject to the excise tax; or (2) have such payments and benefits reduced by the minimum amount necessary so that the excise tax will not apply, if such reduction would result in a greater net after-tax benefit to the executive.
Upon termination of the executive’s employment, the executive will be subject to certain restrictions on the executive’s ability to compete or to solicit business or employees of the Employer for a period of eighteen (18) months (one year for Messrs. Lundblad and Smith) following his termination of employment. The Employment Agreements also include provisions protecting the Employer’s confidential business information.
Wesley M. Weymers.
126
the Merger, (B) $200,000 payable on the first anniversary of the closing of the Merger, (C) $200,000 payable on the second anniversary of the closing of the Merger and (D) $167,900 payable on March 6, 2024, (iv) as soon as reasonably practicable following the closing of the Merger, and on or promptly following each of the first and second anniversaries of the closing of the Merger, grants of options to purchase 7,000 shares of LINKBANCORP common stock, with each such grant vesting ratably over five years from the applicable grant date, and (v) an automobile allowance of $1,000 per month. The Weymers Employment Agreement includes non-compete and non-solicit provisions for the benefit of LINKBANCORP and The Gratz Bank (running for two years from the termination of employment). The agreement also provides for severance upon a termination following a change in control or if Mr. Weymers’ employment is involuntarily terminated without cause or if he resigns for good reason, payable in an amount equal to the sum of 2.99 times his annual base salary and the aggregate amount of all unpaid retention bonuses, if any, and the continuation of life, disability, medical insurance and other normal health and benefits for a period of 2.99 years.
Deferred Compensation Agreements
On October 28, 2021, the Bank entered into deferred compensation agreements (collectively, the “Deferral Agreements”) with Carl Lundblad and Brent Smith. The purpose of the Deferral Agreements is to provide Messrs. Lundblad and Smith with retirement benefits.
Under the Deferral Agreements, Messrs. Lundblad and Smith may annually elect to defer the payment of a portion of their base salary and/or bonus by filing a deferral election form with the plan administrator, setting forth the amount of the deferral and its duration. Benefits under the Deferral Agreements will be paid to the executives upon termination of employment after “normal retirement age,” upon “early termination,” or upon a “disability” prior to normal retirement age or “disability” (as such terms are defined in the Deferral Agreements). Benefits will be distributed in 180 monthly installments if termination of employment occurs after normal retirement age or 120 monthly installments upon the occurrence of an early termination or disability, with the payment commencing in the month following the payment event. In the event a “change in control” (as defined in the Deferral Agreements) followed within twenty-four (24) months by a termination of employment prior to the executive’s normal retirement age, the executive’s deferral account will be paid in a lump sum within thirty (30) days following the date of termination of employment. In addition to any deferrals, the Bank will make a contribution to the executive’s deferral account, commencing in 2022 and continuing until the earliest of termination of employment, normal retirement age, disability or death of the executive, in an amount up to 15% of base salary based on the Company’s operating return on assets (as defined in the Deferral Agreements). In addition, the executive’s deferral account will be credited with interest at a rate equal to the crediting rate (as defined in the Deferral Agreements).
Mr. Weymers is party to a deferred compensation agreement with the Bank, pursuant to which Mr. Weymers may defer a percentage of his salary and/or bonus and such amounts will earn a rate of interest equal to one hundred fifty percent (150%) of the average one-year Treasury instrument for the plan year. Mr. Weymers is fully vested in the account balance and will receive payments on the first day of the calendar month, following his termination of service or his sixty-fifth (65
th
) birthday or upon death.Supplemental Executive Retirement Plan Agreements
On October 28, 2021, the Bank entered into a supplemental executive retirement plan agreement (the “Samuel SERP”) with Mr. Samuel to provide certain benefits upon retirement or other termination of employment. Under the terms of the Samuel SERP, upon separation from service (as defined in the Samuel SERP) after normal retirement age (age 70), the executive will be entitled to an annual benefit in the amount of $300,000, payable in monthly installments over a period of fifteen (15) years, commencing the month following separation from service. In the event of a separation from service prior to normal retirement age, except when such separation from service is an involuntary termination (as defined in the Samuel SERP) or termination for
127
good reason (as defined in the Samuel SERP) occurring within two years after a change in control (as defined in the Samuel SERP) or a termination for cause (as defined in the Samuel SERP), the executive will be entitled to a reduced benefit, payable in monthly installments over a period of fifteen (15) years, commencing the month following separation from service. If a change in control (as defined in the Samuel SERP) occurs, followed within twenty-four (24) months by an involuntary termination or termination for good reason prior to normal retirement age, the executive will be entitled to an annual benefit in the amount of $300,000, payable in monthly installments over a period of fifteen (15) years, commencing the month following separation from service. The Samuel SERP also provides a death benefit, payable in a lump sum, in the event the executive dies prior to a separation from service. In the event the executive is terminated by the Bank for cause (as defined in the Samuel SERP), the executive will not receive any benefits under the Samuel SERP.
The Bank is also party to an Executive Supplemental Retirement Plan (the “Weymers SERP”) with Wesley M. Weymers. Under the terms of the Weymers SERP, upon Mr. Weymers’ termination of employment after retiring after the age of sixty-five and one-half (65-1/2), he will be entitled to an annual payment equal to $72,000 payable in equal installments for fifteen (15) years. In the event that his employment is terminated prior to age sixty-five and one-half (65-1/2) including for death or disability, he will be entitled to an annual amount equal to the vested annual benefit as provided in the Weymers SERP payable in monthly installments for fifteen (15) years. If Mr. Weymers has an early termination of employment prior to reaching age sixty-five and one-half (65-1/2) as a result of (i) the termination by the Bank without “cause” (as defined in the Weymers SERP), (ii) the expiration of the employment period under his employment agreement or (iii) the resignation by Mr. Weymers for “good reason” (as defined in his employment agreement), then Mr. Weymers will be entitled to receive the full annual benefit of $72,000 payable in equal monthly installments for fifteen (15) years. If Mr. Weymers’ employment is terminated for cause, as defined in the Weymers SERP, he will not be entitled to any benefits under the Weymers SERP.
Split Dollar Life Insurance Plan
Pursuant to a Split Dollar Life Insurance Plan, each of the participating officers of The Gratz Bank is entitled to certain life insurance coverage in connection with certain bank-owned life insurance purchased by the Bank. If a participating officer dies prior to a separation from service to the Bank, then such officer’s designated beneficiary shall be entitled to receive the lesser of $100,000 or the net death proceeds under the purchased policy, after subtracting the greater of the policy’s cash surrender value or the aggregate premiums paid by the Bank. Messrs. Samuel, Lundblad and Smith are each a participant in the Split Dollar Life Insurance Plan.
2022 Equity Incentive Plan
On May 26, 2022, the shareholders of LINKBANCORP approved the LINKBANCORP, Inc. 2022 Equity Incentive Plan (the “2022 Equity Incentive Plan”). The 2022 Equity Incentive Plan authorizes the issuance of up to 475,000 shares of LINKBANCORP’s common stock pursuant to grants of restricted stock, restricted stock units, stock options, including incentive stock options and non-qualified stock options, any of which may vest based either on the passage of time or achievement of performance, or a combination of each, to officers, employees, directors and service providers of LINKBANCORP and its subsidiaries. At least 95% of the awards under the 2022 Equity Incentive Plan will vest no earlier than one year after the grant date. For a non-employee director, the sum of the grant date fair value of equity awards granted under the 2022 Equity Incentive Plan, including stock options, restricted stock and restricted stock units may not exceed $50,000 for any calendar year. An employee may not: (i) receive a grant of more than 30,000 stock options during any calendar year, and (ii) the sum of the grant date fair value of restricted stock and restricted stock units may not exceed $500,000 for any calendar year. As of June 30, 2022, no options to purchase shares of common stock have been granted to officers, directors, and others, no shares of restricted stock have been granted to directors and executive officers and 475,000 shares remain available for grant under the 2022 Equity Incentive Plan.
128
Unless otherwise specified by the Compensation Committee, in the event of a participant’s termination of service due to disability or death, awards will vest and stock options remain exercisable for one year. Unless otherwise specified by the Compensation Committee, in the event of a participant’s voluntary resignation for any reason (except death or disability), all unvested awards will be forfeited and upon a participant’s termination for cause, all unvested awards, including unexercised stock options, will be forfeited. Generally, all vested stock options remain exercisable for three months from the date of termination of service due to a resignation of a director or employee for any reason (except death or disability, in which case they will remain exercisable for one year).
Unless otherwise specified by the Compensation Committee, all unvested service-based awards will vest upon an Involuntary Termination of Service following a Change in Control (as defined in the 2022 Equity Incentive Plan). Stock options will remain exercisable for one year following an Involuntary Termination of Service following a Change in Control (as defined in the 2022 Equity Incentive Plan). All Performance Awards will vest upon an Involuntary Termination of Service following a Change in Control based on the greater of actual performance or at the target level (as defined in the 2022 Equity Incentive Plan).
The 2022 Equity Incentive Plan is administered by the members of the Compensation Committee who are “Disinterested Board Members,” as defined in the 2022 Equity Incentive Plan. The Compensation Committee has full and exclusive power within the limitations set forth in the 2022 Equity Incentive to make all decisions and determinations regarding the selection of participants and the granting of awards; establishing the terms and conditions relating to each award; and interpreting and otherwise construing the plan.
2019 Equity Incentive Plan
Following the receipt of shareholder approval of the 2022 Equity Incentive Plan, LINKBANCORP will no longer make grants under the LINKBANCORP 2019 Equity Incentive Plan. As of June 30, 2022, options to purchase 403,900 shares of common stock have been granted (and are outstanding) to officers, directors, and others, and since the 2019 Equity Incentive Plan is frozen, no shares remain available for grant under the 2019 Equity Incentive Plan.
Securities Authorized for Issuance under Equity Compensation Plans
The following table sets forth information as of December 31, 2021 regarding the Company’s equity compensation plan that has been approved by shareholders.
Plan Category | Number of Securities to be Issued Upon Exercise of Outstanding Options, Warrants and Rights (a) | Weighted-Average Exercise Price of Outstanding Options, Warrants and Rights (b) | Number of Securities Remaining Available for Future Issuance Under Equity Compensation Plans (excluding securities reflected in column (a)) (c) | |||||||||
Equity compensation plans approved by security holders | ||||||||||||
2019 Equity Incentive Plan | 421,500 | $ | 10.46 | 14,200 | ||||||||
Equity compensation plans not approved by security holders | — | — | — | |||||||||
Total | 421,500 | $ | 10.46 | 14,200 | ||||||||
129
Outstanding Equity Awards at Fiscal Year End
The following table shows stock options outstanding for each of our named executive officers as of December 31, 2021.
Option Awards | ||||||||||||||||||||
Name | Grant Date | Number of Securities Underlying Unexercised Options Exercisable | Number of Securities Underlying Unexercised Options Unexercisable (1) | Option Exercise Price ($) | Option Expiration Date | |||||||||||||||
Andrew Samuel | 10/19/2019 | 16,000 | 24,000 | 10.00 | 10/19/2029 | |||||||||||||||
Carl Lundblad | 06/14/2019 | 12,000 | 18,000 | 10.00 | 06/14/2029 | |||||||||||||||
Brent Smith | 06/14/2019 | 16,000 | 24,000 | 10.00 | 06/14/2029 | |||||||||||||||
Wesley Weymers | 10/28/2021 | — | 7,000 | 12.98 | 10/28/2031 | |||||||||||||||
| (1) | The options vest ratably over 5 years from the grant date. Vesting may be accelerated under certain conditions or at the discretion of the LINKBANCORP Compensation Committee. |
Director Compensation
The following table sets forth for the year ended December 31, 2021 certain information as to total compensation paid to non-employee directors. Messrs. Samuel, Smith and Weymers did not receive any additional compensation for service on our board of directors or The Gratz Bank’s board of directors.
Name | Fees Earned or Paid in Cash ($) | Nonqualified Deferred Compensation Earnings (2) ($) | Option Awards ($) (3) | All Other Compensation ($) | Total ($) | |||||||||||||||
Jennifer Delaye | 10,000 | — | — | — | 10,000 | |||||||||||||||
Anson Flake | 11,125 | — | — | — | 11,125 | |||||||||||||||
George Parmer | 11,750 | — | — | — | 11,750 | |||||||||||||||
Debra Pierson | 10,000 | — | — | — | 10,000 | |||||||||||||||
Diane Poillon | 10,000 | — | — | — | 10,000 | |||||||||||||||
William E. Pommerening | 11,750 | — | — | — | 11,750 | |||||||||||||||
Timothy J. Allison (1) | 6,250 | 1,446 | — | — | 7,696 | |||||||||||||||
William L. Jones (1) | 6,875 | — | — | — | 6,875 | |||||||||||||||
Samuel K. Kauffman (1) | 6,250 | — | — | — | 6,250 | |||||||||||||||
David H. Koppenhaver (1) | 6,875 | — | — | — | 6,875 | |||||||||||||||
Joseph C. Michetti, Jr. (1) | 7,500 | 3,428 | — | — | 10,928 | |||||||||||||||
Kristen Snyder (1) | 6,250 | — | — | — | 6,250 | |||||||||||||||
Steven I. Tressler (1) | 6,250 | — | — | — | 6,250 | |||||||||||||||
| (1) | Fees paid since appointment as a Director of LINKBANCORP upon completion of the Merger. Mr. Kauffman’s term as a director ended on May 26, 2022. |
| (2) | The non-qualified deferred compensation earnings represent the above market earnings on compensation that was deferred by the director under the deferred compensation agreements, which are described below. |
| (3) | As of December 31, 2021, Directors Delaye, Flake, Parmer, Pierson, Poillon and Pommerening each held options to purchase 5,000 shares. |
130
Director Fees
Through September 17, 2021, non-employee directors who attended at least 75% of all board and committee meetings were entitled to receive an annual retainer equal to $6,500 for the chairs of the Risk Committee, Audit Committee and Compensation Committee and $5,000 for all other outside directors. Following effectiveness of the Merger, non-employee directors who attend at least 75% of all board and committee meetings are entitled to receive an annual retainer of $25,000; Chairs of the Compensation, Risk, Nominating and Corporate Governance and Audit Committees are entitled to an additional $2,500 annual retainer. Mr. Michetti, as Chair of the LINKBANCORP board of directors, receives an additional $5,000 annual retainer. Fees are paid quarterly.
Directors Deferred Compensation Agreements
Directors Koppenhaver, Allision and Michetti are each party to deferred compensation agreements with the Bank wherein the director may elect to defer a percentage of fees and compensation received and such deferral will accrue interest equal to one hundred fifty percent (150%) of the average one-year Treasury instrument for the plan year. The participants are always 100% vested in the amount they defer. The director is entitled to receive a distribution from his deferred account upon death, termination of service or reaching age sixty-five, in the manner elected in a previously executed election form.
131
CERTAIN RELATIONSHIPS AND RELATED PARTY TRANSACTIONS
In addition to the compensation arrangements with directors and executive officers described in “Executive Compensation” above, the following is a description of transactions since January 1, 2019, to which we have been a party in which the amount involved exceeded or will exceed $120,000, and in which any of our directors, executive officers or beneficial holders of more than five percent of our capital stock, or their immediate family members or entities affiliated with them, had or will have a direct or indirect material interest.
Policies and Procedures Regarding Related Party Transactions
Transactions by the Company or The Gratz Bank with related parties are subject to certain regulatory requirements and restrictions, including Sections 23A and 23B of the Federal Reserve Act (which govern certain transactions by The Gratz Bank with its affiliates) and the Federal Reserve’s Regulation O (which governs certain loans by The Gratz Bank to its executive officers, directors and principal shareholders).
Under applicable SEC and Nasdaq rules, related party transactions are transactions in which we are a participant, the amount involved exceeds $120,000 and a related party has or will have a direct or indirect material interest. Related parties of the Company include directors (including nominees for election as directors), executive officers, five percent shareholders and the immediate family members of these persons. In determining whether to approve a related party transaction, the board of directors will consider, among other factors, the fairness of the proposed transaction, the direct or indirect nature of the related party’s interest in the transaction, the appearance of an improper conflict of interests for any director or executive officer taking into account the size of the transaction and the financial position of the related party, whether the transaction would impair an outside director’s independence, the acceptability of the transaction to our regulators and the potential violations of other corporate policies.
Banking Relationships and Related Party Transactions
The Sarbanes-Oxley Act of 2002 generally prohibits publicly traded companies from making loans to their executive officers and directors, but it contains a specific exemption from the prohibition for loans made by federally insured financial institutions, such as The Gratz Bank, to their executive officers and directors in compliance with federal banking regulations. At June 30, 2022, all of our loans to directors and executive officers were made in the ordinary course of business, were made on substantially the same terms, including interest rates and collateral, as those prevailing at the time for comparable loans with persons not related to The Gratz Bank, and did not involve more than the normal risk of collectability or present other unfavorable features. These loans were performing according to their original terms at June 30, 2022, and were made in compliance with federal banking regulations.
At June 30, 2022, the aggregate amount of extensions of credit to our directors, executive officers, principal shareholders and their associates was $2.8 million, or approximately 2.7% of our total equity. At June 30, 2022, unfunded commitments totaled $1.5 million.
On September 30, 2020, LINKBANCORP completed a $20.0 million private placement of Fixed-to-Floating Rate Subordinated Notes due 2030. The notes have a maturity date of October 1, 2030 and will initially bear interest at a fixed rate of 5.0% until October 1, 2025. From October 1, 2025 to the stated maturity date or early redemption date, the interest rate will reset semi-annually to an annual floating rate equal to the then-current three-month term Secured Overnight Financing Rate (SOFR) plus a spread of 475 basis points, but no less than 5.0%. The investors in the notes included Derry Management, Inc., which purchased $2.0 million in principal amount of the notes, and Residential Warranty Company LLC, which purchased $17.0 million in principal amount of the notes. George Parmer, a director of LINKBANCORP, is the President and owner of each of the foregoing entities.
132
On April 8, 2022, LINKBANCORP completed a $20.0 million private placement of Fixed-to-Floating Rate Subordinated Notes due 2032. The notes have a maturity date of April 15, 2032 and will initially bear interest at a fixed rate of 4.5% up to but excluding April 15, 2027. From and including April 15, 2027 to the stated maturity date or early redemption date, the interest rate will reset quarterly to a floating rate equal to the then-current three-month term Secured Overnight Financing Rate (SOFR) plus a spread of 203 basis points. The investors in the notes included Residential Warranty Company LLC, which purchased $7.0 million in principal amount of the notes. George Parmer, a director of LINKBANCORP, is the President and owner of Residential Warranty Company LLC.
Directed Share Program
At our request, the underwriters have reserved up to 228,750 shares of our common stock offered by this prospectus for sale, at the initial public offering price, to our directors, officers, principal shareholders, employees, business associates, and related persons who have expressed an interest in purchasing our common stock in this offering. We will offer these shares to the extent permitted under applicable regulations in the United States through a directed share program. See the section entitled “Underwriting—Directed Share Program.”
133
PRINCIPAL SHAREHOLDERS
The following table sets forth information as of August 15, 2022 regarding the beneficial ownership of our common stock, and as adjusted to reflect the completion of this offering:
| • | each shareholder known by us to beneficially own more than 5% of our outstanding common stock; |
| • | each of our directors; |
| • | each of our named executive officers; and |
| • | all of our directors and executive officers as a group. |
We have determined beneficial ownership in accordance with the rules of the SEC. These rules generally provide that a person is the beneficial owner of securities if such person has or shares the power to vote or direct the voting of securities, or to dispose or direct the disposition of securities, or has the right to acquire such powers within 60 days. For purposes of calculating each person’s percentage ownership, common stock issuable pursuant to options or warrants exercisable within 60 days are included as outstanding and beneficially owned for that person or group, but are not deemed outstanding for the purposes of computing the percentage ownership of any other person.
The percentage of beneficial ownership is based on 9,838,435 shares of our common stock outstanding as of August 15, 2022 and 14,413,435 shares to be outstanding after the completion of this offering (or 15,099,685 shares if the underwriters exercise their purchase option in full).
134
Unless otherwise indicated, the address for each listed shareholder is: c/o LINKBANCORP, Inc., 3045 Market Street, Camp Hill, Pennsylvania 17011.
Shares Beneficially Owned as of August 15, 2022 | Shares Beneficially Owned After the Offering | |||||||||||||||||||||||||||||||
Name and Address of Beneficial Owner | Number of Shares | Options and Warrants Exercisable within 60 Days | Total Beneficial Ownership of Common Stock(1) | Percentage of Shares Outstanding (2) | Shares to be Purchased in the Offering(16) | Total Beneficial Ownership of Common Stock | Percent, assuming no exercise of underwriters’ purchase option | Percent, assuming full exercise of underwriters’ purchase option | ||||||||||||||||||||||||
Directors and Named Executive Officers: | ||||||||||||||||||||||||||||||||
Andrew Samuel | 228,870 | (3) | 927,740 | (4) | 1,156,610 | 10.74 | % | 2,857 | 1,159,467 | 7.56 | % | 7.23 | % | |||||||||||||||||||
Brent Smith | 60,000 | (5) | 264,000 | (6) | 324,000 | 3.21 | % | 2,857 | 326,857 | 2.23 | % | 2.13 | % | |||||||||||||||||||
Carl Lundblad | 15,000 | 78,000 | (7) | 93,000 | * | 20,000 | 113,000 | * | * | |||||||||||||||||||||||
Jennifer Delaye | 15,000 | 3,000 | (13) | 18,000 | * | 5,714 | 23,714 | * | * | |||||||||||||||||||||||
Anson Flake | 60,416 | 3,000 | (13 ) | 63,416 | * | 25,714 | 89,130 | * | * | |||||||||||||||||||||||
George Parmer | 486,775 | (8) | 3,000 | (13) | 489,775 | 4.98 | % | 11,428 | 501,203 | 3.48 | % | 3.32 | % | |||||||||||||||||||
Debra Pierson | 24,992 | 3,000 | (13) | 27,992 | * | 22,857 | 50,849 | * | * | |||||||||||||||||||||||
Diane Poillon | 5,000 | 3,000 | (13) | 8,000 | * | 2,285 | 10,285 | * | * | |||||||||||||||||||||||
William E. Pommerening | 57,750 | (9) | 3,000 | (13) | 60,750 | * | 1,142 | 61,892 | * | * | ||||||||||||||||||||||
Timothy J. Allison | 11,091 | — | 11,091 | * | 571 | 11,662 | * | * | ||||||||||||||||||||||||
William L. Jones | 7,306 | (10) | — | 7,306 | * | 571 | 7,877 | * | * | |||||||||||||||||||||||
David H. Koppenhaver | 193,992 | — | 193,992 | 1.97 | % | 57,142 | 251,134 | 1.74 | % | 1.66 | % | |||||||||||||||||||||
Joseph C. Michetti, Jr. | 98,815 | (11) | — | 98,815 | 1.00 | % | 11,428 | 110,243 | * | * | ||||||||||||||||||||||
Kristen Snyder | 4,397 | (12) | — | 4,397 | * | 11,428 | 15,825 | * | * | |||||||||||||||||||||||
Steven I. Tressler | 245,020 | — | 245,020 | 2.49 | % | 10,000 | 255,020 | 1.77 | % | 1.69 | % | |||||||||||||||||||||
Wesley M. Weymers | 2,191 | — | 2,191 | * | 1,000 | 3,191 | * | * | ||||||||||||||||||||||||
All directors and executive officers as a group (19 persons total) | 1,527,124 | (14) | 1,345,444 | (15) | 2,872,568 | 25.69 | % | 191,421 | (17) | 3,063,989 | 19.44 | % | 18.63 | % | ||||||||||||||||||
| * | Less than 1% |
| (1) | A person is deemed to be the beneficial owner for purposes of this table, of any shares of common stock if he or she has shared or sole voting or investment power with respect to such security, or has a right to acquire beneficial ownership at any time within 60 days from the date as of which beneficial ownership is being determined. Except as otherwise noted, ownership is direct and the named individuals and group |
135
| exercise sole voting and investment power over the shares of Company common stock. No shares of common stock are pledged as collateral by a director or a named executive officer. |
| (2) | Calculated based on 9,838,435 shares outstanding at August 15, 2022, and adding the number of shares of common stock underlying options and warrants that such shareholder is considered to beneficially own. |
| (3) | Includes 27,500 shares held in Mr. Samuel’s IRA account and 6,060 shares held in an IRA account of Mr. Samuel’s daughter who shares the same household. Mr. Samuel disclaims beneficial ownership of the shares held in his daughter’s IRA. |
| (4) | Includes 907,240 shares which Mr. Samuel is entitled to purchase pursuant to warrants granted to founders of LINKBANCORP based on their initial investment in LINKBANCORP, and 16,000 options exercisable within 60 days of August 15, 2022. Also includes 4,500 options held by Mr. Samuel’s daughter, exercisable within 60 days of August 15, 2022. |
| (5) | Includes 35,500 shares held in Mr. Smith’s IRA account. |
| (6) | Includes 240,000 shares which Mr. Smith is entitled to purchase pursuant to warrants granted to founders of LINKBANCORP based on their initial investment in LINKBANCORP, and 24,000 options exercisable within 60 days of August 15, 2022. |
| (7) | Includes 60,000 shares which Mr. Lundblad is entitled to purchase pursuant to warrants granted to founders of LINKBANCORP based on their initial investment in LINKBANCORP, and 18,000 options exercisable within 60 days of August 15, 2022. |
| (8) | Includes 27,863 shares held by Mr. Parmer’s spouse, 10,926 shares held in a limited partnership in which Mr. Parmer is the general partner and 338,722 shares held in various related family trusts. Mr. Parmer disclaims beneficial ownership of the shares held in family trusts. |
| (9) | Includes 55,000 shares held in Mr. Pommerening’s SEP IRA account. |
| (10) | Includes 7,306 shares held in a brokerage account. |
| (11) | Includes 32,358 shares held in a joint account with Mr. Michetti’s spouse as well as 591 shares held individually by his spouse. Also includes 59,269 shares in Mr. Michetti’s IRA. |
| (12) | Includes 3,835 shares held in a joint account with Ms. Snyder’s spouse. |
| (13) | All are options exercisable within 60 days of August 15, 2022. |
| (14) | Includes 10,509 shares which other executive officers own. |
| (15) | Includes 38,704 shares which other executive officers are entitled to purchase pursuant to warrants granted to founders of LINKBANCORP based on their initial investment in LINKBANCORP, and 19,000 options exercisable within 60 days of August 15, 2022. |
| (16) | Assumes the purchase of shares at the midpoint of the price range. |
| (17) | Includes 4,427 shares to be purchased in the offering by other executive officers. |
136
DESCRIPTION OF CAPITAL STOCK
The following is a summary of the material rights of our capital stock and related provisions of our Articles of Incorporation and Bylaws. This discussion may not contain all of the information regarding our capital stock that is important to you. Reference is made to the more detailed provisions of our Articles of Incorporation and Bylaws, copies of which are filed with the SEC as exhibits to the registration statement of which this prospectus is a part.
General
Our authorized capital consists of 25,000,000 shares of common stock, $0.01 par value, and 5,000,000 shares of preferred stock, no par value per share. At June 30, 2022, there were 9,838,435 shares of common stock outstanding and no shares of preferred stock outstanding. All issued and outstanding shares at that date were, and the shares of common stock to be issued upon completion of this offering will be, fully paid and nonassessable. Immediately following the completion of this offering, we will have 14,413,435 shares of common stock outstanding (assuming the underwriters do not exercise their option to purchase any additional shares). At June 30, 2022, options or warrants to purchase 1,941,384 shares of our common stock held by employees and directors were outstanding.
Common Stock
Dividends
.
Voting Rights.
Liquidation or Dissolution.
Preemptive Rights.
Preferred Stock
LINKBANCORP’s board of directors, without shareholder approval, is empowered to authorize the issuance, in one or more series, of shares of preferred stock at such times, for such purposes and for such consideration as it may deem advisable. The board of directors is also authorized to fix before the issuance thereof the designation, voting, conversion, preference and other relative rights, qualifications and limitations of any such series of preferred stock. Accordingly, LINKBANCORP’s board of directors, without shareholder approval, may authorize the issuance of one or more series of preferred stock with voting and conversion rights which could adversely affect the voting power of the holders of common stock and, under certain circumstances, discourage an attempt by others to gain control of LINKBANCORP.
The creation and issuance of any additional series of preferred stock, and the relative rights, designations and preferences of such series, if and when established, will depend on, among other things, LINKBANCORP’s future capital needs, then existing market conditions and other factors that, in the judgment of LINKBANCORP’s board of directors, might warrant the issuance of preferred stock.
137
Restrictions on Acquisition of LINKBANCORP, Inc.
The following discussion is a general summary of the material provisions of Pennsylvania law, our Articles of Incorporation and Bylaws and certain other regulatory provisions that may be deemed to have an “anti-takeover” effect. The following description is necessarily general and is not intended to be a complete description of the document or regulatory provision in question.
Pennsylvania Law and Our Articles of Incorporation and Bylaws
Authorized but Unissued Stock
No Cumulative Voting
.
Shareholder Nominations and Proposals.
Special Meetings of Shareholders
.
Removing Directors from Office
.
Bylaw Amendments
.
Approval of Certain Transactions
.
Change in Control Law and Regulations.
138
Control, as defined under federal law, means ownership, control of or holding irrevocable proxies representing more than 25% of any class of voting stock, control in any manner of the election of a majority of the company’s directors, or a determination by the FRB that the acquirer has the power to direct, or directly or indirectly exercise a controlling influence over, the management or policies of the institution. Acquisition of more than 10% of any class of a bank holding company’s voting stock constitutes a rebuttable determination of control under the regulations under certain circumstances including where, as will be the case with LINKBANCORP, the issuer has registered securities under Section 12 of the Securities Exchange Act of 1934. FRB regulations provide that parties seeking to rebut control will be provided an opportunity to do so in writing.
Listing and Trading
Our common stock is currently not listed on any securities exchange. We have applied to have our common stock approved for listing on the Nasdaq Capital Market under the symbol “LNKB.”
Transfer Agent and Registrar
The transfer agent and registrar for our common stock is American Stock Transfer & Trust Company LLC, Brooklyn, New York.
139
SHARES ELIGIBLE FOR FUTURE SALE
Prior to this offering, there was a limited public market for shares of our common stock. Shares of our common stock were quoted on the Pink Market, under the symbol “LNKB.” Future sales of substantial amounts of our common stock in the public market, or the perception that such sales may occur, could adversely affect market prices prevailing from time to time. Furthermore, because only a limited number of shares will be available for sale shortly after this offering due to existing contractual and legal restrictions on resale as described below, there may be sales of substantial amounts of our common stock in the public market after the restrictions lapse. This may adversely affect the prevailing market price and our ability to raise equity capital in the future.
Upon completion of this offering, we will have 14,413,435 shares of common stock outstanding (or 15,099,685 shares if the underwriters exercise their option to purchase additional shares in full). Of these shares, 4,575,000 shares of our common stock (or 5,261,250 shares if the underwriters exercise their purchase option in full) sold in this offering will be freely transferable without restriction or further registration under the Securities Act of 1933, except for any shares purchased by our “affiliates,” as that term is defined in Rule 144 under the Securities Act of 1933, including those shares purchased by certain of our directors and officers through the directed share program described in the section entitled “Underwriting.” In addition, we registered and issued 4,845,897 shares of Company common stock that was issued as merger consideration to GNBF shareholders that is freely transferable without restriction or further registration under the Securities Act of 1933, except for any shares issued to our affiliates as defined above. The remaining 4,992,538 shares of our common stock outstanding are “restricted shares” as defined in Rule 144. Restricted shares may be sold in the public market only if registered under the Securities Act of 1933 or if they qualify for an exemption from registration under Rule 144. As a result of the contractual 180-day lock-up period described below, 1,718,545 shares (excluding exercisable options and warrants) will be available for sale in the public market only after 180 days from the date of this prospectus (generally subject to volume and other offering limitations).
Rule 144
In general, a person who has beneficially owned restricted shares of our common stock for at least six months would be entitled to sell such securities, provided that (i) such person is not deemed to have been one of our affiliates at the time of, or at any time during the 90 days preceding, the sale and (ii) we are subject to the Exchange Act periodic reporting requirements for at least 90 days before the sale. Persons who have beneficially owned restricted shares of our common stock for at least six months but who are our affiliates at the time of, or any time during the 90 days preceding, the sale, would be subject to additional restrictions, by which such person would be entitled to sell within any three-month period only a number of securities that does not exceed the greater of the following:
| • | 1% of the number of shares of our common stock then outstanding, which will equal approximately 144,134 shares immediately after this offering (or approximately 150,996 shares if the underwriters exercise their purchase option in full); or |
| • | the average weekly trading volume of our common stock on the Nasdaq Capital Market during the four calendar weeks preceding the filing of a notice on Form 144 with respect to the sale; |
provided, in each case, that we are subject to the Exchange Act periodic reporting requirements for at least 90 days before the sale. Such sales both by affiliates and by non-affiliates must also comply with the manner of sale and notice provisions of Rule 144 to the extent applicable.
Registration Statement on Form S-8
In connection with or as soon as practicable following the completion of this offering, we intend to file a registration statement with the SEC on Form S-8 to register approximately 1,365,900 shares of our common stock reserved for future issuance under our equity incentive plans and employee stock purchase plan. That registration statement will become effective upon filing and shares of common stock covered by such registration statement will be eligible for sale in the public market immediately after the effective date of such registration statement (unless held by affiliates) subject to the lock-up agreements described below.
140
Lock-up Agreements
We and each of our directors and executive officers have agreed, subject to certain exceptions, not to offer, pledge, sell, contract to sell, sell any option or contract to purchase, purchase any option or contract to sell, grant any option, right or warrant for the sale of, otherwise dispose of or transfer any shares of our common stock or any securities convertible into or exchangeable or exercisable for common stock for a period of 180 days after the date of this prospectus, without the prior written consent of Stephens Inc. See “Underwriting.” The underwriters do not have any present intention or arrangement to release any shares of our common stock subject to lock-up agreements prior to the expiration of the 180-day lock-up period.
141
CERTAIN MATERIAL U.S. FEDERAL INCOME TAX CONSEQUENCES
FOR NON-U.S. HOLDERS OF COMMON STOCK
The following is a summary of certain material United States federal income tax consequences relevant to non-U.S. holders, as defined below, of the purchase, ownership and disposition of our common stock by a non-U.S. holder (as defined below) that acquires our common stock in this offering and holds our common stock as a “capital asset” (generally, property held for investment). This summary is based on current provisions of the Internal Revenue Code of 1986, as amended, or the Code, Treasury regulations and judicial and administrative authority, all of which are subject to change, possibly with retroactive effect. Any such change could result in U.S. federal income tax consequences that differ from those summarized below. We have not sought any ruling from the Internal Revenue Service (“IRS”) with respect to any of the U.S. federal income tax consequences discussed below and there can be no assurance that the IRS would not assert, or that a court would not sustain, positions contrary to those described in this summary.
This summary does not address all aspects of U.S. federal income taxation that may be relevant to particular investors in light of their individual circumstances, or to investors subject to special treatment under U.S. federal income tax laws, including, but not limited to, tax-exempt organizations, insurance companies, banks or other financial institutions, partnerships or other entities classified as partnerships for U.S. federal income tax purposes, dealers in securities, persons liable for the alternative minimum tax, traders in securities that elect to use a mark-to-market method of accounting for their securities holdings, persons who have acquired our common stock as compensation or otherwise in connection with the performance of services, persons subject to special tax accounting rules under Code Section 451(b), or persons that will hold our common stock as a position in a “hedging transaction,” “straddle,” “conversion transaction” or other risk reduction transaction. This summary does not address all aspects of U.S. federal income taxes, such as consequences under the Medicare contribution tax or the alternative minimum tax. Further, this summary does not address the consequences under any U.S. federal tax laws other than U.S federal income tax laws (such as U.S. federal estate or gift tax laws), and does not address the consequences under the tax laws of any state, local, or non-U.S. jurisdiction.
This discussion is provided for general information only and does not constitute legal advice to any prospective purchaser of our common stock. You are urged to consult your tax advisor with respect to the application of the U.S. federal income tax laws to your particular situation, as well as any tax consequences of the purchase, ownership and disposition of our common stock arising under the U.S. federal estate or gift tax rules or under the laws of any state, local, non- U.S. or other taxing jurisdiction or under any applicable tax treaty.
As used in this summary, the terms “non-U.S. holder” or “you” refer to a beneficial owner of our common stock that for U.S. federal income tax purposes is neither a partnership (including any entity or arrangement treated as a partnership for such purposes) nor a “United States person” which term refers to any person that, for U.S. federal income tax purposes, is or is treated as any of the following:
| • | an individual who is a citizen or resident of the United States (including certain former citizens and former long-term residents of the United States); |
| • | a corporation (or other entity or arrangement taxable for U.S. federal income tax purposes as a corporation) created or organized in or under the laws of the United States or any state thereof, including the District of Columbia; |
| • | an estate the income of which is subject to U.S. federal income tax regardless of its source; or |
| • | a trust which (1) is subject to the primary supervision of a court within the United States and one or more United States persons as defined under Section 7701(a)(30) of the Code have the authority to control all substantial decisions of the trust, or (2) has a valid election in effect under applicable Treasury regulations to be treated as a United States person. |
142
If an entity or arrangement treated as a partnership for U.S. federal income tax purposes holds our common stock, the tax treatment of a partner in the partnership generally will depend upon the status of the partner and the activities of the partnership. If you are treated as a partner in such an entity holding our common stock, you should consult your tax advisor as to the U.S. federal income tax consequences applicable to you.
Distributions
Distributions paid with respect to our common stock will be treated as dividends for U.S. federal income tax purposes to the extent of our current or accumulated earnings and profits, as determined for U.S. federal income tax purposes. Distributions not treated as dividends for U.S. federal income tax purposes will constitute a return of capital and first be applied against and reduce a non-U.S. Holder’s adjusted tax basis in its common stock, but not below zero. Any excess will be treated as capital gain and will be treated as described below under “-Sale or Other Taxable Disposition.”
Subject to the discussion below on effectively connected income, dividends paid to a non-U.S. Holder of our common stock will be subject to United States federal withholding tax at a rate of 30% of the gross amount of the dividends (or such lower rate specified by an applicable income tax treaty, provided the non-U.S. Holder furnishes a valid IRS Form W-8BEN or W-8BEN-E (or other applicable documentation) certifying qualification for the lower treaty rate). If a non-U.S. Holder holds the stock through a financial institution or other intermediary, the non-U.S. Holder will be required to provide appropriate documentation to the intermediary, which then will be required to provide certification to the applicable withholding agent, either directly or through other intermediaries. A non-U.S. Holder that does not timely furnish the required documentation, but that qualifies for a reduced treaty rate, may obtain a refund of any excess amounts withheld by timely filing an appropriate claim for refund with the IRS. Non-U.S. Holders should consult their tax advisors regarding their entitlement to benefits under any applicable income tax treaty.
If dividends paid to a non-U.S. Holder are effectively connected with the non-U.S. Holder’s conduct of a trade or business within the United States (and, if required by an applicable income tax treaty, the non-U.S. Holder maintains a permanent establishment in the United States to which such dividends are attributable), the non-U.S. Holder will be exempt from the U.S. federal withholding tax described above. To claim the exemption, the non-U.S. Holder must furnish to the applicable withholding agent a valid IRS Form W-8ECI, certifying that the dividends are effectively connected with the non-U.S. Holder’s conduct of a trade or business within the United States.
Any such effectively connected dividends will be subject to U.S. federal income tax on a net income basis at the regular graduated rates. A non-U.S. Holder that is a corporation also may be subject to a branch profits tax at a rate of 30% (or such lower rate specified by an applicable income tax treaty) on such effectively connected dividends, as adjusted for certain items. Non-U.S. Holders should consult their tax advisors regarding any applicable tax treaties that may provide for different rules.
Sale or Other Taxable Disposition
A non-U.S. holder generally will not be subject to U.S. federal income or withholding tax on gain realized on the sale or other taxable disposition of our common stock unless:
| • | you are a nonresident alien individual present in the United States for 183 days or more during the taxable year of the disposition and certain other requirements are met; |
| • | the gain is effectively connected with your conduct of a trade or business within the United States (and, if required by an applicable income tax treaty, you maintain a permanent establishment or fixed base in the United States to which such gain is attributable); or |
| • | our common stock constitutes a United States real property interest (“USRPI”) by reason of our status as a U.S. real property holding corporation (“USRPHC”) for U.S. federal income tax purposes and certain other conditions are satisfied. |
143
Gain described in the first bullet point above will be subject to a flat 30% tax (or such lower rate as specified by any applicable income tax treaty), which may be offset by U.S. source capital losses of the non-U.S. Holder (even though the individual is not considered a resident of the United States), provided the non-U.S. Holder has timely filed U.S. federal income tax returns with respect to such losses.
Gain described in the second bullet point above generally will be subject to U.S. federal income tax, net of certain deductions, at regular U.S. federal income tax rates. A non-U.S. holder that is a corporation also may be subject to a branch profits tax at a rate of 30% (or such lower rate specified by an applicable income tax treaty) on such effectively connected gain, as adjusted for certain items.
With respect to the third bullet point above, we believe we currently are not, and do not anticipate becoming, a USRPHC. However, because the determination of whether we are a USRPHC depends on the fair market value of our U.S. real property relative to the fair market value of our worldwide real property interests plus certain other business assets, there can be no assurance that we are not or will not become a USRPHC. Generally, a corporation is a USRPHC only if the fair market value of its USRPIs equals or exceeds 50% of the sum of the fair market value of its worldwide real property interests plus certain other business assets.
Even if we are or were to become a USRPHC, gain arising from a non-U.S. Holder’s sale or other taxable disposition of our common stock will not be subject to U.S. federal income tax if our common stock is regularly traded on an established securities market (within the meaning of Code Section 897(c)(3)) and the non-U.S. Holder actually and constructively owns 5% or less of our common stock throughout the shorter of the five-year period preceding the non-U.S. Holder’s disposition of, or the non-U.S. Holder’s holding period for, our common stock. Please note, though, that we can provide no assurance that our common stock will be or remain regularly traded.
Information Reporting and Backup Withholding
Annual reporting to the IRS and to each non-U.S. Holder will be required as to the amount of dividends paid to such non-U.S. Holder and the amount, if any, of tax withheld with respect to such dividends. This information may also be made available to the tax authorities in the non-U.S. Holder’s country of residence. Dividends generally are not subject to “backup withholding” if the non-U.S. Holder properly certifies as to its non-U.S. status (usually by completing an IRS Form W-8BEN, Form W-8BEN-E or Form W-8ECI).
The payment of the proceeds of the sale or other disposition of our common stock to or through the U.S. office of a broker will be subject to both backup withholding and information reporting unless the non-U.S. Holder certifies its non-U.S. status (usually by completing an IRS Form W-8BEN, Form W-8BEN-E or Form W-8ECI) or otherwise establishes an exemption. Information reporting requirements, but not backup withholding, generally will also apply to payments of the proceeds of a sale or other disposition of our common stock by a non-U.S. office of a U.S. broker or a non-U.S. broker with certain types of relationships to the United States unless the non-U.S. Holder certifies its non-U.S. status or otherwise establishes an exemption.
Backup withholding is not an additional tax. Any amounts withheld under the backup withholding rules from payments made to a non-U.S. Holder may be refunded or credited against such non-U.S. Holder’s U.S. federal income tax liability, if any, provided that the required information is timely furnished to the IRS.
Foreign Account Tax Compliance Act
Sections 1471 through 1474 of the Code, known as the Foreign Account Tax Compliance Act (“FATCA”), and the relevant administrative guidance thereunder, impose a withholding tax of 30% on certain types of payments, including U.S.-source dividends, that are received by foreign financial institutions and certain other non-U.S. entities unless certain certification, information reporting and other specified requirements are satisfied. An inter-governmental agreement between the United States and an applicable non-U.S. country may modify
144
such requirements. Although withholding under FATCA would have applied to payments of gross proceeds from the taxable disposition of the our common stock on or after January 1, 2019, proposed Treasury regulations eliminate FATCA withholding on payments of gross proceeds entirely. Taxpayers generally may rely on these proposed Treasury regulations until final Treasury regulations are issued. Under certain circumstances, a non-U.S. holder might be eligible for refunds or credits of such taxes. Prospective investors should consult their own tax advisors regarding the relevant U.S. law and other official guidance on FATCA withholding.
145
UNDERWRITING
We and Stephens Inc., as representative for the underwriters named below, will enter into an underwriting agreement with respect to the shares of common stock being offered hereby. Subject to the terms and conditions contained in the underwriting agreement, each underwriter will severally and not jointly agree to purchase, and we have agreed to sell the number of shares of our common stock set forth in the table below.
Name | Number of Shares | |||
Stephens Inc. | ||||
Piper Sandler & Co. | ||||
D.A. Davidson & Co. | ||||
Total | ||||
The underwriting agreement provides that the underwriters’ obligation to purchase shares of our common stock depends on the satisfaction of the conditions contained in the underwriting agreement, including:
| • | the representations and warranties made by us are true and agreements have been performed; |
| • | there is no material adverse change in the financial markets or in our business; and |
| • | we deliver customary closing documents. |
Subject to these conditions, the underwriters are committed to purchase and pay for all such shares of common stock if any are purchased. However, the underwriters are not obligated to take or pay for the shares of our common stock covered by the underwriters’ purchase option described below, unless and until such option is exercised.
The shares of common stock are being offered by the underwriters, subject to prior sale, when, as and if issued to and accepted by them, subject to approval of certain legal matters by counsel for the underwriters and other conditions specified in the underwriting agreement. The underwriters reserve the right to withdraw, cancel or modify this offer and to reject orders in whole or in part. The underwriting agreement provides that the obligations of the underwriters are conditional and may be terminated at their discretion based on their assessment of the state of the financial markets. The obligations of the underwriters may also be terminated upon the occurrence of the events specified in the underwriting agreement. The underwriting agreement provides that the underwriters are obligated to purchase all the shares of common stock in this offering if any are purchased, other than those shares covered by the purchase option described below.
Purchase Option
We have granted to the underwriters an option, exercisable no later than 30 days after the date of this prospectus, to purchase up to 686,250 additional shares of common stock at the public offering price less the underwriting discount set forth on the cover page of this prospectus. We will be obligated to sell these shares of common stock to the underwriters to the extent the purchase option is exercised. The underwriters may exercise this option only to cover over-allotments, if any, made in connection with the sale of our common stock offered by this prospectus.
Discounts and Expenses
The underwriters propose to offer the shares of common stock directly to the public at the offering price set forth on the cover page of this prospectus and to certain securities dealers at the public offering price less a concession not in excess of $ per share. The underwriters may allow, and these dealers may re-allow, a concession not in excess of $ per share on sales to other dealers. After the public offering of the common stock, the underwriters may change the offering price and other selling terms.
146
The following table shows the per share and total underwriting discount that we will pay to the underwriters and the proceeds we will receive before expenses. These amounts are shown assuming both no exercise and full exercise of the underwriters’ over-allotment option to purchase additional shares.
Per Share | Total Without Over-Allotment | Total With Over-Allotment | ||||||||||
Price to public | ||||||||||||
Underwriting discount | ||||||||||||
Proceeds to us, before expenses | ||||||||||||
We estimate that the total expenses of the offering, excluding the underwriting discount, will be approximately $975,000 and are payable by us. We have agreed to reimburse the underwriters for certain actual out-of-pocket expenses up to $250,000 incurred by the underwriters on our behalf in connection with the offering.
The shares of common stock are being offered by the underwriters, subject to prior sale, when, as and if issued to and accepted by them, subject to approval of certain legal matters by counsel for the underwriters and other conditions specified in the underwriting agreement. The underwriters reserve the right to withdraw, cancel or modify this offer and to reject orders in whole or in part.
Lock-up Agreements
We, each of our executive officers and directors, have agreed, subject to certain exceptions for a period of 180 days after the date of this prospectus, not to sell, offer, agree to sell, contract to sell, hypothecate, pledge, grant any option to sell, make any short sale, or otherwise dispose of or hedge, directly or indirectly, any shares of our common stock or securities convertible into, exchangeable or exercisable for any shares of our common stock or warrants or other rights to purchase shares of our common stock or other similar securities without, in each case, the prior written consent of Stephens Inc., as representative of the underwriters. These restrictions are expressly agreed to preclude us, and our executive officers and directors and certain other persons, from engaging in any hedging or other transaction or arrangement that is designed to, or which reasonably could be expected to, lead to or result in a sale, disposition or transfer, in whole or in part, of any of the economic consequences of ownership of our common stock, whether such transaction would be settled by delivery of common stock or other securities, in cash or otherwise.
Indemnification and Contribution
We have agreed to indemnify the underwriters, and persons who control the underwriters, and the underwriters’ respective partners, directors, officers, employees and agents, against certain liabilities, including liabilities under the Securities Act of 1933, and to contribute to payments that the underwriters may be required to make in respect of these liabilities.
Stabilization
In connection with this offering, the underwriters may engage in stabilizing transactions, over-allotment transactions, syndicate covering transactions and penalty bids.
| • | Stabilizing transactions permit bids to purchase shares of common stock so long as the stabilizing bids do not exceed a specified maximum, and are engaged in for the purpose of preventing or retarding a decline in the market price of the common stock while the offering is in progress. |
| • | Over-allotment transactions involve sales by the underwriters of shares of common stock in excess of the number of shares the underwriters are obligated to purchase. This creates a syndicate short |
147
position which may be either a covered short position or a naked short position. In a covered short position, the number of shares of common stock over-allotted by the underwriters are not greater than the number of shares that they may purchase in the over-allotment option. In a naked short position, the number of shares involved is greater than the number of shares in the over-allotment option. The underwriters may close out any short position by exercising their over-allotment option and/or purchasing shares in the open market. |
| • | Syndicate covering transactions involve purchases of common stock in the open market after the distribution has been completed in order to cover syndicate short positions. In determining the source of shares to close out the short position, the underwriters will consider, among other things, the price of shares available for purchase in the open market as compared with the price at which they may purchase shares through exercise of the over-allotment option. If the underwriters sell more shares than could be covered by exercise of the over-allotment option and, therefore, have a naked short position, the position can be closed out only by buying shares in the open market. A naked short position is more likely to be created if the underwriters are concerned that after pricing there could be downward pressure on the price of the shares in the open market that could adversely affect investors who purchase in the offering. |
| • | Penalty bids permit the representative to reclaim a selling concession from a syndicate member when the common stock originally sold by that syndicate member is purchased in stabilizing or syndicate covering transactions to cover syndicate short positions. |
These stabilizing transactions, syndicate covering transactions and penalty bids may have the effect of raising or maintaining the market price of our common stock or preventing or retarding a decline in the market price of our common stock. As a result, the price of our common stock in the open market may be higher than it would otherwise be in the absence of these transactions. Neither we nor the underwriters make any representation or prediction as to the effect that the transactions described above may have on the price of our common stock. These transactions may be effected on the Nasdaq Capital Market, in the over-the-counter market or otherwise and, if commenced, may be discontinued at any time.
Passive Market Making
In connection with this offering, the underwriters may engage in passive market making transactions in our common stock on the Nasdaq Capital Market in accordance with Rule 103 of Regulation M under the Exchange Act during a period before the commencement of offers or sales of our common stock in this offering and extending through the completion of the distribution of this offering. A passive market maker must display its bid at a price not in excess of the highest independent bid of that security. However, if all independent bids are lowered below the passive market maker’s bid, that bid must then be lowered when specified purchase limits are exceeded. Passive market making may cause the price of our common stock to be higher than the price that otherwise would exist in the open market in the absence of those transactions. The underwriters are not required to engage in a passive market making and may end passive market making activities at any time.
Nasdaq Capital Market Listing
We expect the shares to be approved for listing on the Nasdaq Capital Market, subject to notice of issuance, under the symbol “LNKB.”
Offering Price Determination
Before this offering, there has been a limited public market for our common stock. The initial public offering price will be determined through negotiations between us and the underwriters. In addition to prevailing market conditions, the factors to be considered in determining the initial public offering price are:
| • | the valuation multiples of publicly traded companies that the underwriter believes to be comparable to us; |
148
| • | our financial information; |
| • | the history of, and the prospects for, our company and the industry in which we compete; |
| • | an assessment of our management, its past and present operations, and the prospects for, and timing of, our future revenues; |
| • | our book value; and |
| • | the above factors in relation to market values and various valuation measures of other companies engaged in activities similar to ours. |
An active trading market for the shares may not develop. It is also possible that after the offering the shares will not trade in the public market at or above the initial public offering price.
Our Relationship with the Underwriters
The underwriters and their respective affiliates have engaged in, and may in the future engage in, investment banking and other commercial dealings in the ordinary course of business with us or our affiliates and have received, or may in the future receive, customary fees and commissions for these transactions.
In addition, in the ordinary course of their business activities, the underwriters and their respective affiliates may make or hold a broad array of investments and actively trade debt and equity securities (or related derivative securities) and financial instruments (including bank loans) for their own account and for the accounts of their customers. Such investments and securities activities may involve securities and/or instruments of ours or our affiliates. The underwriters and their respective affiliates may make investment recommendations and/or publish or express independent research views in respect of such securities or financial instruments and may hold, or recommend to clients that they acquire, long and/or short positions in such securities and instruments.
Our common stock is being offered by the underwriters, subject to prior sale, when, as and if issued to and accepted by them, subject to approval of certain legal matters by counsel for the underwriters and other conditions.
Electronic Distribution
A prospectus in electronic format may be made available by e-mail or on the websites or through online services maintained by the underwriter or its affiliates. In those cases, prospective investors may view offering terms online and may be allowed to place orders online. The underwriters may agree with us to allocate a specific number of shares for sale to online brokerage account holders. Any such allocation for online distributions will be made by the underwriters on the same basis as other allocations. Other than the prospectus in electronic format, the information on the underwriters’ websites and any information contained on any other website maintained by the underwriters are not part of this prospectus, has not been approved and/or endorsed by the underwriters or us and should not be relied upon by investors.
Selling Restrictions
Other than in the United States, no action has been taken by us or the underwriters that would permit a public offering of the securities offered by this prospectus in any jurisdiction where action for that purpose is required. The securities offered by this prospectus may not be offered or sold, directly or indirectly, nor may this prospectus or any other offering material or advertisements in connection with the offer and sale of any such securities be distributed or published in any jurisdiction, except under circumstances that will result in compliance with the applicable rules and regulations of that jurisdiction. Persons into whose possession this prospectus comes are advised to inform themselves about and to observe any restrictions relating to the offering and the distribution of this prospectus. This prospectus does not constitute an offer to sell or a solicitation of an offer to buy any securities offered by this prospectus in any jurisdiction in which such an offer or a solicitation is unlawful.
149
Directed Share Program
At our request, the underwriters have reserved for sale, at the initial public offering price, up to 5% of the shares of our common stock offered by this prospectus for sale to our directors, officers, principal shareholders, employees, business associates, and related persons. Our directed share program will be administered by Stephens Inc. or its affiliate. Reserved shares purchased by our directors and executive officers will be subject to the lock-up provisions described above. The number of shares of our common stock available for sale to the general public will be reduced to the extent these persons purchase the reserved shares. Any reserved shares of our common stock that are not so purchased will be offered by the underwriters to the general public on the same terms as the other shares of common stock offered by this prospectus.
150
CHANGE IN ACCOUNTANTS
Effective on September 18, 2021, the Company completed its Merger with GNBF. The Merger was treated as a “reverse merger” for accounting purposes with GNBF as the accounting acquirer and the Company as the legal acquirer. The Securities and Exchange Commission has released guidance that, in the case of a reverse merger, unless the same independent accountant reported on the most recent financial statements of both the accounting acquirer and the legal acquirer, a change in accountants will occur. Prior to the completion of the Merger, GNBF’s independent accountant was Hacker, Johnson & Smith PA and the Company’s independent accountant was S.R. Snodgrass, P.C. In addition, S.R. Snodgrass, P.C. had previously served as the independent accountant for GNBF for the year ended December 31, 2019.
On September 17, 2021, Hacker, Johnson & Smith PA resigned as principal accountant of the Company as a result of the completion of the Merger.
The audit report of Hacker, Johnson & Smith PA on GNBF’s consolidated financial statements as of and for the year ended December 31, 2020 did not contain an adverse opinion or a disclaimer of opinion, and was not qualified or modified as to uncertainty, audit scope or accounting principles. During the year ended December 31, 2020 and the subsequent interim period through September 17, 2021, there were no: (1) disagreements with Hacker, Johnson & Smith PA on any matter of accounting principles or practices, financial statement disclosure or auditing scope or procedure which disagreements, if not resolved to the satisfaction of Hacker, Johnson & Smith PA, would have caused Hacker, Johnson & Smith PA to make reference to the subject matter of the disagreements in connection with its audit report, or (2) reportable events under Item 304(a)(1)(v) of SEC Regulation S-K.
The audit report of S.R. Snodgrass, P.C. on GNBF’s consolidated financial statements as of and for the year ended December 31, 2019 did not contain an adverse opinion or a disclaimer of opinion, and was not qualified or modified as to uncertainty, audit scope or accounting principles. During the year ended December 31, 2019, there were no: (1) disagreements with S.R. Snodgrass, P.C. on any matter of accounting principles or practices, financial statement disclosure or auditing scope or procedure which disagreements, if not resolved to the satisfaction of S.R. Snodgrass, P.C., would have caused S.R. Snodgrass, P.C. to make reference to the subject matter of the disagreements in connection with its audit report, or (2) reportable events under Item 304(a)(1)(v) of SEC Regulation S-K.
The Company provided Hacker, Johnson & Smith PA with a copy of this disclosure contained in a Current Report on Form 8-K prior to filing with the Securities and Exchange Commission. The Company requested that Hacker, Johnson & Smith PA issue a letter stating whether or not it agreed with the above statements. The letter from Hacker, Johnson & Smith PA to the Securities and Exchange Commission is filed as Exhibit 16.1 to this registration statement.
The Company has provided S.R. Snodgrass, P.C. with a copy of this disclosure contained in a Current Report on Form 8-K prior to filing with the Securities and Exchange Commission. The Company requested that S.R. Snodgrass, P.C. issue a letter stating whether or not it agreed with the above and below statements. The letter from S.R. Snodgrass, P.C. to the Securities and Exchange Commission is attached as Exhibit 16.2 to this registration statement.
Concurrent with the Merger, the Audit Committee of the Company engaged S.R. Snodgrass, P.C. as the Company’s new principal accountant for the year ending December 31, 2021. During the years ended December 31, 2020 and 2019 and the subsequent interim period prior to engaging S.R. Snodgrass, P.C., the Company did not consult with S.R. Snodgrass, P.C. regarding (i) the application of accounting principles to a specified transaction, either completed or proposed, or the type of audit opinion that might be rendered on the Company’s financial statements, and neither a written report nor oral advice was provided to the Company that S.R. Snodgrass, P.C. concluded was an important factor considered by the Company in reaching a decision as to any accounting, auditing or financial reporting issue, or (ii) any matter that was either the subject of a disagreement or a reportable event, each as defined in Regulation S-K Item 304(a)(1)(v), respectively.
151
LEGAL MATTERS
The validity of the shares of common stock being offered by this prospectus will be passed upon for us by Luse Gorman, PC, Washington, DC. Certain legal matters will be passed upon for the underwriters by Squire Patton Boggs (US) LLP, Cincinnati, Ohio.
EXPERTS
The consolidated financial statements of LINKBANCORP, Inc. and subsidiaries as of December 31, 2021 and for the year ended December 31, 2021, included in this prospectus, have been so included in reliance on the report of S.R. Snodgrass, P.C., independent registered public accounting firm, upon the authority of said firm as experts in accounting and auditing.
The consolidated financial statements of LINKBANCORP, Inc. and subsidiaries as of December 31, 2020 and for the year ended December 31, 2020, included in this prospectus, have been so included in reliance on the report of Hacker, Johnson & Smith PA, independent registered public accounting firm, upon the authority of said firm as experts in accounting and auditing.
The consolidated financial statements of Legacy LINKBANCORP and subsidiaries as of December 31, 2020 and 2019 and for the years ended December 31, 2020 and 2019, included in this prospectus, have been so included in reliance on the report of S.R. Snodgrass, P.C., independent registered public accounting firm, upon the authority of said firm as experts in accounting and auditing.
WHERE YOU CAN FIND ADDITIONAL INFORMATION
LINKBANCORP, Inc. has filed with the Securities and Exchange Commission a registration statement under the Securities Act of 1933 with respect to the shares of common stock offered hereby. As permitted by the rules and regulations of the Securities and Exchange Commission, this prospectus does not contain all the information set forth in the registration statement. The Securities and Exchange Commission maintains a web site (http://www.sec.gov) that contains reports, proxy and information statements and other information regarding registrants that file electronically with the Securities and Exchange Commission, including LINKBANCORP, Inc. The statements contained in this prospectus as to the contents of any contract or other document filed as an exhibit to the registration statement are, of necessity, brief descriptions of the material terms of, and should be read in conjunction with, such contract or document.
152
INDEX TO FINANCIAL STATEMENTS
LINKBANCORP, INC.
FINANCIAL STATEMENTS
AS OF JUNE 30, 2022 AND DECEMBER 31, 2021
AND FOR THE THREE AND SIX MONTHS ENDED JUNE 30, 2022 AND 2021
(UNAUDITED)
| F-2 | ||||
| F-3 | ||||
| F-4 | ||||
| F-5 | ||||
| F-6 | ||||
| F-8 |
FINANCIAL STATEMENTS
AS OF AND FOR THE YEARS ENDED DECEMBER 31, 2021 AND 2020
(AUDITED)
| F-40 | ||||
| F-44 | ||||
| F-45 | ||||
| F-46 | ||||
| F-47 | ||||
| F-48 | ||||
| F-50 |
LINKBANCORP, INC. (As Accounting Acquiree)
FINANCIAL STATEMENTS OF ACQUISITION TARGET
AS OF JUNE 30, 2021 AND DECEMBER 31, 2020
AND FOR THE THREE AND SIX MONTHS ENDED JUNE 30, 2021 AND 2020
(UNAUDITED)
| F-89 | ||||
| F-90 | ||||
| F-91 | ||||
| F-92 | ||||
| F-94 | ||||
| F-95 |
FINANCIAL STATEMENTS OF ACQUISITION TARGET
AS OF AND FOR THE YEARS ENDED DECEMBER 31, 2020 AND 2019
(AUDITED)
| F-131 | ||||
| F-134 | ||||
| F-135 | ||||
| F-136 | ||||
| F-137 | ||||
| F-138 | ||||
| F-139 |
F-1
LINKBANCORP, Inc. and Subsidiaries
Consolidated Balance Sheets (Unaudited)
June 30, 2022 | December 31, 2021 | |||||||
(In Thousands, except share and per share data) | ||||||||
ASSETS | ||||||||
Noninterest-bearing cash equivalents | $ | 7,563 | $ | 8,620 | ||||
Interest-bearing deposits with other institutions | 55,433 | 13,970 | ||||||
Cash and cash equivalents | 62,996 | 22,590 | ||||||
Certificates of deposit with other banks | 11,088 | 12,828 | ||||||
Securities available for sale, at fair value | 85,756 | 103,783 | ||||||
Securities held to maturity (Fair value of $28,290 and $0, respectively) | 28,816 | — | ||||||
Loans held for sale | — | 3,860 | ||||||
Loans receivable, net of allowance for loan losses of $3,890 at June 30, 2022, and $3,152 at December 31, 2021 | 786,516 | 711,664 | ||||||
Investments in restricted bank stock | 2,567 | 2,685 | ||||||
Premises and equipment, net | 7,915 | 5,289 | ||||||
Right-of-Use | 4,513 | 4,680 | ||||||
Bank-owned life insurance | 19,012 | 18,787 | ||||||
Goodwill and other intangible assets | 37,020 | 37,152 | ||||||
Deferred tax asset | 5,777 | 4,038 | ||||||
Accrued interest receivable and other assets | 7,909 | 5,407 | ||||||
TOTAL ASSETS | $ | 1,059,885 | $ | 932,763 | ||||
LIABILITIES | ||||||||
Deposits: | ||||||||
Demand, noninterest bearing | $ | 184,345 | $ | 129,243 | ||||
Interest bearing | 718,028 | 642,422 | ||||||
Total deposits | 902,373 | 771,665 | ||||||
Other borrowings | 1,639 | 19,814 | ||||||
Subordinated debt | 40,585 | 20,696 | ||||||
Operating lease liabilities | 4,513 | 4,680 | ||||||
Accrued interest payable and other liabilities | 6,004 | 6,285 | ||||||
TOTAL LIABILITIES | 955,114 | 823,140 | ||||||
COMMITMENTS AND CONTINGENT LIABILITIES (Note 11) | ||||||||
SHAREHOLDERS’ EQUITY | ||||||||
Preferred stock (At June 30 , 2022 and December 31, 2021: no par value; | — | — | ||||||
Common stock (At June 30 , 2022 and December 31, 2021: $0.01 par value; 25,000,000 shares authorized; 9,838,435and 9,826,435 shares issued and outstanding, respectively.) | 99 | 99 | ||||||
Surplus | 83,070 | 82,910 | ||||||
Retained earnings | 26,491 | 24,836 | ||||||
Accumulated other comprehensive (loss) income | (4,889 | ) | 1,778 | |||||
TOTAL SHAREHOLDERS’ EQUITY | 104,771 | 109,623 | ||||||
TOTAL LIABILITIES AND SHAREHOLDERS’ EQUITY | $ | 1,059,885 | $ | 932,763 | ||||
See accompanying notes to the unaudited consolidated financial
statements.
F-2
LINKBANCORP, Inc. and Subsidiaries
Consolidated Statements of Operations (Unaudited)
Three Months Ended June 30, | Six Months Ended June 30, | ||||||||||||||||
(In Thousands, except share and per share data) | 2022 | 2021 | 2022 | 2021 | |||||||||||||
INTEREST AND DIVIDEND INCOME | |||||||||||||||||
Loans receivable, including fees | $ | 8,114 | $ | 2,695 | $ | 15,877 | $ | 5,371 | |||||||||
Investment securities and certificates of deposit: | |||||||||||||||||
Taxable | 587 | 299 | 863 | $ | 612 | ||||||||||||
Exempt from federal income tax | 298 | 302 | 589 | 607 | |||||||||||||
Other | 96 | 37 | 149 | 67 | |||||||||||||
Total interest and dividend income | 9,095 | 3,333 | 17,478 | 6,657 | |||||||||||||
INTEREST EXPENSE | |||||||||||||||||
Deposits | 818 | 462 | 1,483 | 966 | |||||||||||||
Other borrowings | 2 | 4 | 24 | 11 | |||||||||||||
Subordinated debt | 422 | — | 641 | — | |||||||||||||
Total interest expense | 1,242 | 466 | 2,148 | 977 | |||||||||||||
NET INTEREST INCOME BEFORE PROVISION FOR LOAN LOSSES | 7,853 | 2,867 | 15,330 | 5,680 | |||||||||||||
Provision for loan losses | 395 | 44 | 675 | 91 | |||||||||||||
NET INTEREST INCOME AFTER PROVISION FOR LOAN LOSSES | 7,458 | 2,823 | 14,655 | 5,589 | |||||||||||||
NONINTEREST INCOME | |||||||||||||||||
Service charges on deposit accounts | 218 | 147 | 428 | 341 | |||||||||||||
Bank-owned life insurance | 114 | 50 | 225 | 95 | |||||||||||||
Net realized gains on the sales of debt securities, available for sale | — | — | 13 | 0 | |||||||||||||
Gain on sale of loans | 153 | 81 | 333 | 271 | |||||||||||||
Other | 211 | 366 | 409 | 507 | |||||||||||||
Total noninterest income | 696 | 644 | 1,408 | 1,214 | |||||||||||||
NONINTEREST EXPENSE | |||||||||||||||||
Salaries and employee benefits | 3,722 | 1,143 | 7,378 | 2,246 | |||||||||||||
Occupancy | 433 | 113 | 907 | 275 | |||||||||||||
Equipment and data processing | 595 | 230 | 1,192 | 468 | |||||||||||||
Professional fees | 307 | 70 | 535 | 293 | |||||||||||||
FDIC insurance | 138 | 29 | 342 | 59 | |||||||||||||
Bank shares tax | 201 | 86 | 384 | 173 | |||||||||||||
Other | 846 | 421 | 1,604 | 616 | |||||||||||||
Total noninterest expense | 6,242 | 2,092 | 12,342 | 4,130 | |||||||||||||
Income before income tax expense | 1,912 | 1,375 | 3,721 | 2,673 | |||||||||||||
Income tax expense | 306 | 202 | 591 | 375 | |||||||||||||
NET INCOME | $ | 1,606 | $ | 1,173 | $ | 3,130 | $ | 2,298 | |||||||||
EARNINGS PER SHARE, BASIC | $ | 0.16 | $ | 0.21 | $ | 0.32 | 0.40 | ||||||||||
EARNINGS PER SHARE, DILUTED | $ | 0.16 | $ | 0.21 | $ | 0.31 | 0.40 | ||||||||||
DIVIDENDS PAID PER SHARE | $ | 0.075 | $ | 0.04 | $ | 0.150 | $ | 0.08 | |||||||||
WEIGHTED-AVERAGE COMMON SHARES OUTSTANDING, | |||||||||||||||||
BASIC | 9,836,984 | 5,691,686 | 9,831,739 | 5,691,686 | |||||||||||||
DILUTED | 9,913,477 | 5,691,686 | 9,983,742 | 5,691,686 | |||||||||||||
See accompanying notes to the unaudited consolidated financial
statements.
F-3
LINKBANCORP, Inc. and Subsidiaries
Consolidated Statements of Comprehensive (Loss) Income (Unaudited)
Three Months Ended June 30, | Six Months Ended June 30, | |||||||||||||||
2022 | 2021 | 2022 | 2021 | |||||||||||||
(In Thousands) | ||||||||||||||||
Net income | $ | 1,606 | $ | 1,173 | $ | 3,130 | $ | 2,298 | ||||||||
Components of other comprehensive (loss) income: | ||||||||||||||||
Unrealized holding (loss) gain on available-for-sale securities | (3,262 | ) | 500 | (8,427 | ) | (520 | ) | |||||||||
Tax effect | 685 | (105 | ) | 1,770 | 108 | |||||||||||
Net of tax amount | (2,577 | ) | 395 | (6,657 | ) | (412 | ) | |||||||||
Reclassification adjustment for debt securities gains realized in net income | — | — | (13 | ) | — | |||||||||||
Tax effect | — | — | 3 | — | ||||||||||||
Net of tax amount | — | — | (10 | ) | — | |||||||||||
Total other comprehensive (loss) income | (2,577 | ) | 395 | (6,667 | ) | (412 | ) | |||||||||
Total comprehensive (loss) income | $ | (971 | ) | $ | 1,568 | $ | (3,537 | ) | $ | 1,886 | ||||||
See accompanying notes to the unaudited consolidated financial
statements.
F-4
LINKBANCORP, Inc. and Subsidiaries
Consolidated Statements of Shareholders’ Equity (Unaudited)
(In Thousands, except share data) | Common Stock Shares | Common Stock Amount | Surplus | Retained Earnings | Accumulated Other Comprehensive Income (Loss) | Total | ||||||||||||||||||
Balance, March 31, 2022 | 9,826,435 | $ | 99 | $ | 82,930 | $ | 25,623 | $ | (2,312 | ) | $ | 106,340 | ||||||||||||
Net income | — | — | — | 1,606 | — | 1,606 | ||||||||||||||||||
Dividends declared ($0.075 per share) | — | — | — | (738 | ) | — | (738 | ) | ||||||||||||||||
Exercise of stock options | 12,000 | — | 120 | — | — | 120 | ||||||||||||||||||
Stock option expense | — | — | 20 | — | — | 20 | ||||||||||||||||||
Other comprehensive loss | — | — | — | — | (2,577 | ) | (2,577 | ) | ||||||||||||||||
Balance, June 30, 2022 | 9,838,435 | $ | 99 | $ | 83,070 | $ | 26,491 | $ | (4,889 | ) | $ | 104,771 | ||||||||||||
(In Thousands, except share data) | Common Stock Shares | Common Stock Amount | Surplus | Retained Earnings | Accumulated Other Comprehensive Income (Loss) | Treasury Stock | Total | |||||||||||||||||||||
Balance, March 31, 2021* | 5,715,950 | $ | 57 | $ | 21,604 | $ | 26,892 | $ | 2,385 | $ | (188 | ) | $ | 50,750 | ||||||||||||||
Net income | — | — | — | 1,173 | — | — | 1,173 | |||||||||||||||||||||
Dividends declared ($0.04 per share)* | — | — | — | (242 | ) | — | — | (242 | ) | |||||||||||||||||||
Other comprehensive income | — | — | — | — | 395 | — | 395 | |||||||||||||||||||||
Balance, June 30, 2021 | 5,715,950 | $ | 57 | $ | 21,604 | $ | 27,823 | $ | 2,780 | $ | (188 | ) | $ | 52,076 | ||||||||||||||
| * | Common Stock Share, Common Stock Amount, Surplus, and Dividends per share amount have been retrospectively adjusted to reflect the effect of the recapitalization due to the Merger, which has been accounted for as a reverse acquisition. |
(In Thousands, except share data) | Common Stock Shares | Common Stock Amount | Surplus | Retained Earnings | Accumulated Other Comprehensive Income (Loss) | Total | ||||||||||||||||||
Balance, December 31, 2021 | 9,826,435 | $ | 99 | $ | 82,910 | $ | 24,836 | $ | 1,778 | $ | 109,623 | |||||||||||||
Net income | — | — | — | 3,130 | — | 3,130 | ||||||||||||||||||
Dividends declared ($0.15 per share) | — | — | — | (1,475 | ) | — | (1,475 | ) | ||||||||||||||||
Exercise of stock options | 12,000 | — | 120 | — | — | 120 | ||||||||||||||||||
Stock option expense | — | — | 40 | — | — | 40 | ||||||||||||||||||
Other comprehensive loss | — | — | — | — | (6,667 | ) | (6,667 | ) | ||||||||||||||||
Balance, June 30, 2022 | 9,838,435 | $ | 99 | $ | 83,070 | $ | 26,491 | $ | (4,889 | ) | $ | 104,771 | ||||||||||||
(In Thousands, except share data) | Common Stock Shares | Common Stock Amount | Surplus | Retained Earnings | Accumulated Other Comprehensive Income (Loss) | Treasury Stock | Total | |||||||||||||||||||||||||
Balance, December 31, 2020 | * | 5,715,950 | $ | 57 | $ | 21,604 | $ | 26,009 | $ | 3,192 | $ | (188 | ) | $ | 50,674 | |||||||||||||||||
Net income | — | — | — | 2,298 | — | — | 2,298 | |||||||||||||||||||||||||
Dividends declared ($0.08 per share) | — | — | — | (484 | ) | — | — | (484 | ) | |||||||||||||||||||||||
Other comprehensive loss | — | — | — | — | (412 | ) | — | (412 | ) | |||||||||||||||||||||||
Balance, June 30, 2021 | 5,715,950 | $ | 57 | $ | 21,604 | $ | 27,823 | $ | 2,780 | $ | (188 | ) | $ | 52,076 | ||||||||||||||||||
| * | Common Stock Shares, Common Stock Amount, Surplus, and Dividends per share amount have been retrospectively adjusted to reflect the effect of the recapitalization due to the Merger, which has been accounted for as a reverse acquisition. |
See accompanying notes to the unaudited consolidated financial
statements.
F-5
LINKBANCORP, Inc. and Subsidiaries
Consolidated Statement of Cash Flows (Unaudited)
For the Six Months Ended June 30, | ||||||||
(In Thousands) | 2022 | 2021 | ||||||
OPERATING ACTIVITIES | ||||||||
Net income | $ | 3,130 | $ | 2,298 | ||||
Adjustments to reconcile net income to net cash (used for) provided by operating activities: | ||||||||
Provision for loan losses | 675 | 91 | ||||||
Depreciation | 384 | 109 | ||||||
Amortization of intangible assets | 132 | 27 | ||||||
(Accretion) amortization of premiums and (discounts), net | (683 | ) | 750 | |||||
Origination of loans to be sold | (3,659 | ) | (8,226 | ) | ||||
Proceeds from loan sales | 3,992 | 9,512 | ||||||
Gain on sale of loans | (333 | ) | (271 | ) | ||||
Share-based and deferred compensation | 349 | — | ||||||
Bank-owned life insurance income | (225 | ) | (95 | ) | ||||
Gain on sale of debt securities, available for sale | (13 | ) | — | |||||
Change in accrued interest receivable and other assets | (2,356 | ) | (789 | ) | ||||
Change in accrued interest payable and other liabilities | (590 | ) | 914 | |||||
Net cash provided by operating activities | 803 | 4,320 | ||||||
INVESTING ACTIVITIES | ||||||||
Investment securities available for sale: | ||||||||
Proceeds from sales | 513 | — | ||||||
Proceeds from calls and maturities | 1,150 | 1,155 | ||||||
Proceeds from principal repayments | 7,271 | 10,804 | ||||||
Purchases | — | (14,192 | ) | |||||
Investment securities held to maturity | ||||||||
| Proceeds from principal repayments | 628 | — | ||||||
| Purchases | (29,389 | ) | — | |||||
Purchase of certificates of deposit with other banks | — | (249 | ) | |||||
Proceeds from redemptions of certificates of deposit with other banks | 1,740 | 2,730 | ||||||
Purchase of restricted investment in bank stocks | (999 | ) | (439 | ) | ||||
Redemption of restricted investment in bank stocks | 1,117 | 138 | ||||||
Increase in loans, net | (70,596 | ) | (12,481 | ) | ||||
Proceeds from death benefit under bank-owned life insurance | — | 190 | ||||||
Purchase of premises and equipment | (3,010 | ) | — | |||||
Net cash used for investing activities | (91,575 | ) | (12,344 | ) | ||||
FINANCING ACTIVITIES | ||||||||
Increase in deposits, net | 130,708 | 1,176 | ||||||
Change in short-term borrowings, net | (18,175 | ) | 282 | |||||
Proceeds from issuance of subordinated debt | 20,000 | — | ||||||
Repayments of other borrowings | — | (1,120 | ) | |||||
Issuance of shares from exercise of stock options | 120 | — | ||||||
Dividends paid | (1,475 | ) | (484 | ) | ||||
Net cash provided by (used in) financing activities | 131,178 | (146 | ) | |||||
Increase (decrease) in cash and cash equivalents | 40,406 | (8,170 | ) | |||||
CASH AND CASH EQUIVALENTS AT BEGINNING OF PERIOD | 22,590 | 33,162 | ||||||
CASH AND CASH EQUIVALENTS AT END OF PERIOD | $ | 62,996 | $ | 24,992 | ||||
See accompanying notes to the unaudited consolidated financial
statements.
F-6
LINKBANCORP, Inc. and Subsidiaries
Consolidated Statement of Cash Flows (Unaudited)
For the Six Months Ended June 30, | ||||||||
2022 | 2021 | |||||||
SUPPLEMENTAL CASH FLOW DISCLOSURES | ||||||||
Cash paid during the period for: | ||||||||
Interest | $ | 1,926 | $ | 1,032 | ||||
Income taxes | $ | 200 | $ | 425 | ||||
See accompanying notes to the unaudited consolidated financial
statements.
F-7
LINKBANCORP, Inc. and Subsidiaries
Notes to the Consolidated Financial Statements (Unaudited)
[In Thousands, Except Share Data]
1. | SUMMARY OF SIGNIFICANT ACCOUNTING POLICIES |
A summary of significant accounting and reporting policies applied in the presentation of the accompanying consolidated financial statements follows:
Nature of Operations
LINKBANCORP, Inc. (the “Company” or “LINKBANCORP”) is a bank holding company that operates
The Gratz Bank (the “Bank”). The Company was incorporated on April 6, 2018, under the laws of the Commonwealth of Pennsylvania. The Company was formed with the intent of becoming a bank holding company through acquisition of a bank.On September 17, 2018, the Pennsylvania Department of Banking and Securities (the “PADOBS”) approved the acquisition of 100 percent of the shares of Stonebridge Bank. LINKBANCORP purchased 100 percent of the outstanding shares of Stonebridge Bank, from its former parent company Stonebridge Financial Corp. under section 363 of the Bankruptcy Code. LINKBANCORP subsequently renamed the bank LINKBANK.
On December 10, 2020, the Company and its wholly owned subsidiary, LINKBANK, and GNB Financial Services, Inc. (“GNBF”), and its wholly owned subsidiary, The Gratz Bank (the “Bank”) entered into an Agreement and Plan of Merger (the “Merger Agreement”) pursuant to which GNBF merged with and into the Company, with the Company as the surviving corporation. LINKBANK merged with and into The Gratz Bank, with The Gratz Bank as the surviving institution. The merger was consummated effective September 18, 2021 (collectively, the “Merger”). Additionally, as part of the Merger, the Company acquired 100% ownership of GNB Investments, Inc., a Delaware investment company which was wholly-owned by GNB Financial Services, Inc. at the time of Merger.
The Bank is a full-service commercial bank providing personal and business lending and deposit services. The Bank’s operations are conducted from its ten Solutions Centers located in Dauphin, Chester, Cumberland, Lancaster, Northumberland, and Schuylkill Counties within Pennsylvania. The Company’s corporate office resides in Camp Hill, Pennsylvania. As a state chartered,
non-Federal
Reserve member bank, the Bank is subject to regulation and supervision by the PADOBS and the Federal Deposit Insurance Corporation (the “FDIC”). The Company is regulated by the Federal Reserve Bank of Philadelphia. The Bank’s deposits are insured up to the applicable limits by the FDIC.Basis of Presentation
The merger of GNBF with and into the Company was accounted for as a reverse acquisition using the acquisition method of accounting, in accordance with the provisions of FASB ASC 805 Business Combinations. As such, GNBF was the accounting acquirer and LINKBANCORP was the accounting acquiree. Accordingly, GNBF’s historical financial statements are the historical financial statements of the combined company for all periods prior to September 18, 2021 (the “Merger Date”).
The Company’s results of operations for the first half of 2022 include the results of operations of the combined company after the Merger Date. Results for periods before the Merger Date reflect only those consolidated results of GNBF and do not include the results of operations of LINKBANCORP. The number of shares issued and outstanding, earnings per share, additional
paid-in
capital, dividends paid and all references to share quantities of the Company have been retrospectively adjusted to reflect the equivalent number of shares issued to holders of GNBF common stock in the Merger. The assets and liabilities of LINKBANCORP as of the Merger Date have been recorded at their estimated fair value and added to those of GNBF. See Note 2. Merger for further information.F-8
LINKBANCORP, Inc. and Subsidiaries
Notes to the Consolidated Financial Statements (Unaudited)
[In Thousands, Except Share Data]
The accompanying unaudited condensed consolidated financial statements include the accounts of the Company and the Bank. All significant intercompany accounts and transactions have been eliminated in consolidation. The accounting and reporting practices of the Company conform to accounting principles generally accepted in the United States of America (GAAP) and to general practices within the banking industry.
The Company has evaluated events and transactions occurring subsequent to the consolidated balance sheet date of June 30, 2022 for items that should potentially be recognized or disclosed in these unaudited condensed consolidated financial statements. The evaluation was conducted through the date these unaudited condensed consolidated financial statements were issued.
Estimates
The preparation of financial statements in conformity with accounting principles generally accepted in the United States of America requires management to make estimates and assumptions that affect the reported amounts of assets and liabilities and disclosure of contingent assets and liabilities at the date of the financial statements and the reported amounts of revenues and expenses during the reporting period. Actual results could differ from those estimates. Material estimates that are particularly susceptible to significant change in the near term relate to the allowance for loan losses, and the valuation of deferred tax assets.
Interim Financial Information
The accompanying unaudited condensed consolidated financial statements have been prepared in accordance with GAAP for interim financial information. Accordingly, they do not include all of the information and footnotes required by GAAP for complete financial statements.
In the opinion of management, all adjustments considered necessary for a fair presentation have been included. Operating results for the three and six months ended June 30, 2022 are not necessarily indicative of the results that may be expected for the year ending December 31, 2022. The accompanying unaudited condensed consolidated financial statements should be read in conjunction with the audited consolidated financial statements and notes thereto, included in the Company’s Annual Report on Form
10-K
for the year ended December 31, 2021.Loans Receivable
Loans receivable that management has the intent and ability to hold for the foreseeable future or until maturity or payoff are stated at their outstanding unpaid principal balances, net of an allowance for loan losses and any deferred fees or costs. Interest income is accrued on the unpaid principal balance. Loan origination fees, net of certain direct origination costs, are deferred and recognized as an adjustment of the yield (interest income) of the related loans. The Bank is generally amortizing these amounts over the contractual life of the loan. Premiums and discounts on purchased loans are amortized as adjustments to interest income using the effective yield method.
The loans receivable portfolio is segmented into commercial and consumer loans. Commercial loans consist of the following classes: agriculture, commercial and industrial, commercial real estate, and municipal. Consumer loans consist of the following classes: residential real estate, and other consumer. The loan segments are based on collateral type.
F-9
LINKBANCORP, Inc. and Subsidiaries
Notes to the Consolidated Financial Statements (Unaudited)
[In Thousands, Except Share Data]
The accrual of interest on all portfolio classes, including troubled debt restructurings, is discontinued at the time the loan is more than ninety days delinquent unless the loan is well collateralized and in process of collection. Nonaccrual loans are reviewed for
charge-off
if more than ninety-days past due, except for residential loans and consumer loans. Residential loans are reviewed at 180 days and consumer loans are reviewed at 120 days past due. In all cases, loans are placed on nonaccrual orcharged-off
at an earlier date if collection of principal or interest is considered unlikely.All interest accrued but not collected for loans placed on nonaccrual or
charged-off
is reversed against interest income. The interest on these loans is accounted for on the cash-basis or cost-recovery method, until qualifying for return to accrual. Loans are returned to accrual status when all the principal and interest amounts contractually due are brought current and future payments are reasonably assured. In addition, a loan should be in accordance with the contractual terms for a reasonable period, usually requiring a payment history of six
months.
Recent Accounting Pronouncements Not Yet Adopted
In January 2017, the FASB issued ASU
2017-04,
Intangibles - Goodwill and Other (Topic 350): Simplifying the Test for Goodwill Impairment. This standard simplifies the test for goodwill impairment by eliminating the requirement to calculate the implied fair value of goodwill, which currently is Step 2 of the goodwill impairment test. Instead the goodwill impairment test will consist of a single quantitative step comparing the fair value of the reporting unit with its carrying amount. An entity should recognize a goodwill impairment charge for the amount by which the carrying amount exceeds the reporting unit’s fair value. The new standard is effective for annual and any interim goodwill impairment tests in reporting periods beginning after December 15, 2022. The adoption of this standard is not expected to have a material effect on the Company’s operating results or financial condition.In June 2016, the FASB issued ASUdebt securities. This model is also applicable todebt securities to be presented as a valuation allowance rather than as a direct write down. This Update is intended to improve financial reporting by requiring more timely recording of credit losses on these financial instruments. The underlying premise of the Update is that financial assets measured at amortized cost should be presented at the net amount expected to be collected, through an allowance for credit losses that is deducted from the amortized cost basis. The allowance for credit losses should reflect management’s current estimate of credit losses that are expected to occur over the remaining life of a financial asset. The income statement will be affected for the measurement of credit losses for newly recognized financial assets, as well as the expected increases or decreases of expected credit losses that have taken place during the period. With certain exceptions, transition to the new requirements will be through a cumulative-effect adjustment to opening retained earnings as of the beginning of the first reporting period in which the guidance is adopted. This Update is effective for SEC filers that are eligible to be smaller reporting companies,
2016-13,
Financial Instruments – Credit Losses: Measurement of Credit Losses on Financial Instruments, which changes the impairment model for most financial assets measured at amortized cost, including loan receivables andheld-to-maturity
off-balance
sheet credit exposures not accounted for as insurance, such as loan commitments, standby letters of credit, financial guarantees, and other similar instruments. In addition, the amendments in ASU2016-03
require credit losses onavailable-for-sale
non-SEC
filers, and all other companies, to fiscal years beginning after December 15, 2022, including interim periods within those fiscal years. The Company is evaluating the impact of ASU2016-13
and has individuals from multiple disciplines working with a third-party vendor solution to assist with the application of ASU2016-13,
which includes historical data validation, methodology selection, and the development of policies, procedures and appropriate internal controls. The Company expects to recognize aone-time
cumulative-effect adjustment to the allowance for loan losses as of the beginning of the first reporting period in which the new standard isF-10
LINKBANCORP, Inc. and Subsidiaries
Notes to the Consolidated Financial Statements (Unaudited)
[In Thousands, Except Share Data]
effective but cannot yet determine the magnitude of any such
one-time
adjustment or the overall impact of the new guidance on the consolidated financial statements, but recognizes that the impact of adoption and implementation could be material to the consolidated financial statements and related footnote disclosures. The Company anticipates the magnitude of the adoption of ASU2016-13
and its related amendments will be influenced by the composition, characteristics, and quality of its loan and investment securities portfolios, and economic conditions and forecasts as of the date of adoption. For debt securities with other-than-temporary impairment (“OTTI”), the guidance will be applied prospectively. Existing PCI assets will be grandfathered and classified as purchased credit deteriorated (“PCD”) assets at the date of adoption. The asset will be grossed up for the allowance for expected losses for all PCD assets at the date of adoption and will continue to recognize the noncredit discount in interest income based on the yield of such assets as of the adoption date. Subsequent changes in the expected credit losses will be recorded through the allowance.In January 2021, the FASB issued ASUdebt securities that reference an interest rate affected by reference rate reform. The amendments in this ASU are effective for all entities upon issuance through December 31, 2022. The Company has identified our loan receivables that have an interest rate indexed to LIBOR and is currently assessing the appropriate transition path. As such, the Company does not have an estimate of the financial impact of this update but does not expect the impact to be material to the financial statements of the Company.
2021-01,
Reference Rate Reform (Topic 848): Facilitation of the Effects of Reference Rate Reform on Financial Reporting, which added to ASU2020-04
on optional expedients and exceptions to the U.S. GAAP guidance on contract modifications and hedge accounting to ease the financial reporting burdens of the expected market transition from LIBOR and other interbank offered rates to alternative reference rates, such as the Secured Overnight Financing Rate. Entities can elect not to apply certain modification accounting requirements to contracts affected by what the guidance calls “reference rate reform” if certain criteria are met. An entity that makes this election would not have to remeasure the contracts at the modification date or reassess a previous accounting determination. Also, entities can elect various optional expedients that would allow them to continue applying hedge accounting for hedging relationships affected by reference rate reform if certain criteria are met, and can make a onetime election to sell and/or reclassifyheld-to-maturity
In March 2022, the FASB issued ASUwhich eliminates accounting guidance for troubled debt restructurings (“TDRs”) by creditors that have adopted ASU
2022-02,
Financial Instruments - Credit Losses: Troubled Debt Restructurings and Vintage Disclosures,
2016-13
and its related amendments. The amendments require that an entity evaluate whether the loan modification represents a new loan or a continuation of an existing loan, and introduce new requirements related to modifications made to borrowers experiencing financial difficulty. The amendments also require public business entities to disclose current-period gross write-offs for financing receivables by year of origination in the vintage disclosures. For entities that have adopted ASU2016-13,
the amendments in this ASU are effective for fiscal years beginning after December 15, 2022. For entities that have not adopted ASU2016-13,
the amendments in this update are effective at the time the entity adopts ASU2016-13.
The adoption of this standard is not expected to have a material effect on the Company’s operating results or financial condition.2. | MERGER |
Effective September 18, 2021 the Company completed its merger with GNBF by acquiring 100% of the outstanding common shares of GNBF.
Pursuant to the Merger Agreement, GNBF merged with and into LINKBANCORP with LINKBANCORP as the surviving corporation. Additionally, LINKBANK, the wholly owned subsidiary of LINKBANCORP merged with and into The Gratz Bank, a wholly owned subsidiary of GNBF with The Gratz Bank as the surviving bank subsidiary of the Company. This transaction, in total, is herein referred to as the Merger.
F-1
1
LINKBANCORP, Inc. and Subsidiaries
Notes to the Consolidated Financial Statements (Unaudited)
[In Thousands, Except Share Data]
The Merger constituted a business combination and was accounted for as a reverse acquisition using the acquisition method of accounting, in accordance with the provisions of FASB ASC 805 Business Combinations. As such, GNBF was the accounting acquirer and LINKBANCORP was the accounting acquiree and the historical financial statements of the combined company are the historical financial statements of GNBF.
Under the Merger Agreement, GNBF shareholders had the opportunity to elect to receive $87.68 per share in cash or 7.3064 80% of the GNBF common shares outstanding be exchanged for LINKBANCORP common stock. The Merger was effective on September 18, 2021, with the GNBF shareholders collectively electing to receive cash for 14.865% of their shares and LINKBANCORP common shares for 85.135% of existing GNBF shares. These elections resulted in LINKBANCORP issuing 4.85 million common shares to GNBF shareholders which represented approximately 49.4% of the post-merger outstanding common shares of the Company.
of LINKBANCORP common
shares for each share theyowned. The Merger
agreement provided for proration procedures intended to ensure that, in the aggregate, at leastIn accordance with FASB ASCthe fair value consideration of a reverse acquisition is determined based on a number of hypothetical equity interest the legal acquiree would have had to issue to give the owners of the legal acquirer the same percentage equity interest in the combined entity that results from the reverse acquisition.
805-40-30-2,
The total fair value consideration was $71.5 million which consisted of $54.0 million for the fair value of common stock issued, $10.1 million in cash consideration and $7.4 million for the fair value of LINKBANCORP options and warrants. The consideration assigned to cash and common stock in this reverse acquisition was determined based on the hypothetical number of equity interests that GNBF would have had to issue to give
LINKBANCORRP
shareholders a 50.62%ownership, the same percentage equity interest in the combined entity that results from the reverse acquisition. The allocation of the consideration assigned to cash and common stock was allocated between the actual cash to be paid by the legal acquirer with the resultant amount being assigned to common equity.
F-1
2
LINKBANCORP, Inc. and Subsidiaries
Notes to the Consolidated Financial Statements (Unaudited)
[In Thousands, Except Share Data]
The following table summarizes the fair value consideration paid for GNBF as of the date of acquisition:
(Dollars in thousands except per share amounts) | ||||
Total GNBF common shares outstanding | 779,000 | |||
GNBF shares outstanding exchanged for LINKBANCORP, Inc. common stock | 663,240 | |||
GNBF shares outstanding exchanged for cash | 115,760 | |||
Exchange Ratio | 7.3064 | |||
LINKBANCORP, Inc. shares to be issued to GNBF shareholders | 4,845,897 | |||
LINKBANCORP, Inc. Shares currently outstanding | 4,968,550 | |||
Total LINKBANCORP, Inc. shares to be outstanding | 9,814,447 | |||
GNBF pro forma common share % ownership | 49.38 | % | ||
LINKBANCORP, Inc. pro forma common share % ownership | 50.62 | % | ||
Reverse Acquisition Hypothetical Purchase Price Consideration | ||||
GNBF shares outstanding exchanged for LINKBANCORP, Inc. common stock | 663,240 | |||
Ownership % to be owned by current GNBF shareholders | 49.38 | % | ||
Hypothetical GNBF shares outstanding based on GNBF % ownership | 1,343,267 | |||
Ownership % by legacy LINKBANCORP, Inc. shareholders | 50.62 | % | ||
Hypothetical GNBF shares to be issued as consideration | 680,027 | |||
Fair value of GNBF shares (LINKBANCORP, Inc. fair value per share of $12.90 as of 9/17/2021 multiplied by the exchange rate) | $ | 94.25 | ||
Purchase price assigned to hypothetical GNBF shares issued to LINKBANCORP, Inc. shareholders | $ | 64,094 | ||
LINKBANCORP, Inc. options and warrants | 1,962,484 | |||
Fair value per options and warrants | $ | 3.76 | ||
Purchase price assigned to LINKBANCORP, Inc. options and warrants | 7,379 | |||
Total purchase price consideration | $ | 71,473 | ||
Pro Forma Purchase Price Allocation Between Stock & Cash: | ||||
Cash consideration | $ | 10,077 | ||
Common Stock | 61,396 | |||
Total Purchase Price For Accounting Purposes | $ | 71,473 | ||
The Company accounts for business combinations under the acquisition method in accordance with ASC Topic 805, Business Combinations. Accordingly, for each transaction, the purchase price is allocated to the fair value of the assets acquired and liabilities assumed as of the date of the acquisition. In conjunction with the adoption of ASU
2015-16,
upon receipt of final fair value estimates during the measurement period, which must be within one year of the acquisition date, the Company records any adjustments to the preliminary fair value estimates in the reporting period in which the adjustments are determined. The Company is continuing to finalize the fair values of loans, intangible assets, and income taxes. As a result,F-1
3
LINKBANCORP, Inc. and Subsidiaries
Notes to the Consolidated Financial Statements (Unaudited)
[In Thousands, Except Share Data]
the recorded fair value adjustments are preliminary and may change as additional information becomes available. Based on management’s preliminary valuation of tangible and intangible assets acquired and liabilities assumed, the purchase price for the Merger is allocated in the table below.
Total Consideration in the Merger | $ | 71,473 | ||||||
Calculated Fair Value of Assets Acquired | ||||||||
Cash and cash equivalents | $ | 49,962 | ||||||
Securities available for sale | 3,111 | |||||||
Loans | 415,905 | |||||||
Premises and equipment | 2,087 | |||||||
Right-of-use | 4,544 | |||||||
Intangible assets | 1,246 | |||||||
Investment in bank owned life insurance | 4,784 | |||||||
Deferred taxes | 3,675 | |||||||
Other assets | 4,394 | |||||||
Total Assets Acquired | 489,708 | |||||||
Calculated Fair Value of Liabilities Assumed | ||||||||
Deposits | 391,160 | |||||||
Long term borrowings | 33,034 | |||||||
Subordinated debt | 20,740 | |||||||
Operating lease liabilities | 4,544 | |||||||
Other liabilities | 2,265 | |||||||
Total Liabilities Assumed | 451,743 | |||||||
Net Assets Acquired | 37,965 | |||||||
Goodwill From the Merger | $ | 33,508 | ||||||
The following table summarizes the Merger as of September 18, 2021:
Total Consideration in the Merger | $ | 71,473 | ||||||
LINKBANCORP, Inc. stockholders’ equity | $ | 43,124 | ||||||
LINKBANCORP, Inc. goodwill and intangibles | (1,353 | ) | ||||||
Fair Value Adjustments: | ||||||||
Loans | ||||||||
Interest rate | (1,521 | ) | ||||||
General credit | (6,346 | ) | ||||||
Credit adjustment for loans acquired with deteriorated credit quality | (1,243 | ) | ||||||
Remove existing deferred loan fees, net at acquisition | 1,192 | |||||||
Remove the allowance for loan losses present at acquisition | 4,953 | |||||||
Intangible assets | 1,146 | |||||||
Other assets | (991 | ) | ||||||
Time deposits | (231 | ) | ||||||
Subordinated debt | (765 | ) | ||||||
| 37,965 | ||||||||
Goodwill From the Merger | $ | 33,508 | ||||||
F-1
4
LINKBANCORP, Inc. and Subsidiaries
Notes to the Consolidated Financial Statements (Unaudited)
[In Thousands, Except Share Data]
Pursuant to the accounting requirements, the Company assigned a fair value to the assets acquired and liabilities assumed of LINKBANCORP ASC 820 defines fair value as “the price that would be received to sell an asset or paid to transfer a liability in an orderly transaction between market participants at the measurement date.”
The assets acquired and liabilities assumed in the acquisition of LINKBANCORP were recorded at their estimated fair values based on management’s best estimates using information available at the date of the acquisition and are subject to adjustment for up to one year after the closing date of the acquisition. While the fair values are not expected to be materially different from the estimates, any material adjustments to the estimates will be reflected, retroactively, as of the date of the acquisition. The items most susceptible to adjustment are the fair value adjustments on loans, core deposit intangible and the deferred income tax assets resulting from the acquisition. Fair values of the major categories of assets acquired and liabilities assumed were determined as follows:
Investment securities
available-for-sale
The estimated fair values of the investment securities available for sale, primarily comprised of U.S. Government agency mortgage-backed securities were determined using Level 1 and Level 2 inputs in the fair value hierarchy. A fair value premium of $96 thousand was recorded and will be amortized over the estimated life of the investments using the interest rate method.
Loans
Acquired loans (performing and non-performing) are initially recorded at their acquisition-date fair values using Level 3 inputs. Fair values are based on a discounted cash flow methodology that involves assumptions and judgments as to credit risk, expected lifetime losses, environmental factors, collateral values, discount rates, expected payments and expected prepayments. Specifically, the Company has prepared three separate loan fair value adjustments that it believed a market participant might employ in estimating the entire fair value adjustment for the acquired loan portfolio. The three fair value adjustments employed were for loans acquired without evidence of credit quality deterioration, the Company prepared the interest rate loan fair value and credit fair value adjustments and for ASC 310-30 purchased credit impaired loans a specific credit fair value adjustment was made. The acquired loans were recorded at fair value at the acquisition date without carryover of LINKBANCORP’s previously established allowance for loan losses. The fair value of the financial assets acquired included loans receivable with an unpaid principal balance of
$425.0 million.
The table below illustrates the fair value adjustments made to the amortized cost basis in order to present the fair value of the loans acquired.
Unpaid principal balance at Merger | $ | 425,015 | ||
Interest rate fair value adjustment on pools of homogeneous loans | (1,520 | ) | ||
Credit fair value adjustment on pools of homogeneous loans | (6,347 | ) | ||
Credit fair value adjustment on purchased credit impaired loans | (1,243 | ) | ||
Fair value of acquired loans | $ | 415,905 | ||
F-1
5
LINKBANCORP, Inc. and Subsidiaries
Notes to the Consolidated Financial Statements (Unaudited)
[In Thousands, Except Share Data]
For loans acquired without evidence of credit quality deterioration were grouped into homogeneous pools by characteristics such as loan type, term, collateral, and rate. Market rates for similar loans were obtained from various internal and external data sources. From each pool a monthly expected cash flow was prepared that incorporated expected monthly payments, impact of prepayments and expected monthly net charge-offs. A discounted cash flow was calculated for each pool to estimate the fair value. In this analysis the fair value adjustment was bifurcated into two components an interest rate fair value adjustment and a general credit fair value adjustment. Additionally, it is noted the credit fair value adjustment incorporated assumptions for: 1) expected lifetime credit migration losses; and 2) estimated fair value adjustment for certain qualitative factors. Both the interest rate and credit fair value adjustments relate to loans acquired with evidence of credit quality deterioration will be substantially recognized as interest income on a level yield amortization method over the expected life of the loans.
For loans acquired with evidence of credit quality deterioration, ASC
310-30
loans, the fair value was calculated with a non-accretable fair value discount based on an adjusted collateral value and if there was a collateral shortfall a non-accretable discount was established. This non-accretable discount would not be amortized for GAAP purposes. In additional an accretable yield fair value discount was created to reflect the time value of money a market participant would discount the loan for the time it would take to recover the adjusted collateral value. The accretable yield fair value will be recognized over the workout period of the loan on a level yield basis as a component of interest income.The following table presents the acquired purchased credit impaired loans receivable at the Merger Date:
Contractual principal and interest at Merger | $ | 8,509 | ||
Nonaccretable difference | (2,716 | ) | ||
Expected cash flows at Merger | 5,793 | |||
Accretable yield | (409 | ) | ||
Fair value of purchased credit impaired loans | $ | 5,384 | ||
Facilities Leases
The Company assumed leases on four
facilities of LINKBANCORP. The Company believed that the current lease costs were at market terms therefore no fair value adjustment is needed. LINKBANCORP did not operate any owned facilities.
Core Deposit Intangible
The fair value of the core deposit intangible was determined based on a discounted cash flow analysis using a discount rate commensurate with market participants. To calculate cash flows, deposit account servicing costs (net of deposit fee income) and interest expense on deposits were compared to the higher cost of alternative funding sources available through national brokered CD offering rates and FHLB advance rates. The projected cash flows were developed using expected deposit attrition. The core deposit intangible will be amortized over ten years using thedigits method.
sum-of-years
Time Deposits
The fair value adjustment for time deposits was based on a discounted cash flow methodology of the contract rates and contractual repayments of fixed maturity deposits using prevailing market interest rates for similar-term time deposits. The time deposit fair value adjustment will be amortized into income on a level yield amortization method over the contractual life of the deposits.
F-16
LINKBANCORP, Inc. and Subsidiaries
Notes to the Consolidated Financial Statements (Unaudited)
[In Thousands, Except Share Data]
Long Term Borrowings
The Company reviewed the cost of the borrowings to market interest rates for similar instruments and believed that the rates were comparable and that no fair value adjustment was
recorded.
Subordinated Debt
The fair value of the subordinated debt was determined using a discounted cash flow method using a market participant discount rate for similar instruments. The subordinated debt fair value adjustment will be amortized into income on a level yield amortization method based upon the assumed market rate and the term of the subordinated debt.
Pro Forma Combined Results of Operations
The following pro forma financial information presents the consolidated results of operations of GNBF and LINKBANCORP as if the Merger occurred as of January 1, 2021 with pro forma adjustments. The pro forma adjustments give effect to any change in interest income due to the accretion of discounts (premiums) associated with the fair value adjustments of acquired loans, any change in interest expense due to estimated premium amortization/discount accretion associated with the fair value adjustments to acquired time deposits and other debt, and the amortization of the core deposit intangible that would have resulted had the deposits been acquired as of January 1, 2021. Merger related expenses incurred by the Company during the three and six months ended June 30, 2021 are not reflected in the pro forma amounts. The pro forma information does not necessarily reflect the results of operations that would have occurred had GNBF merged with LINKBANCORP at the beginning of 2021. The pro forma amounts for the three and six months ended June 30, 2021 do not reflect the anticipated cost savings that had not yet been realized.
| (Dollars in thousands) | For the Three Months Ended June 30, 2021 | For the Six Months Ended June 30, 2021 | ||||||
Net interest income | $ | 7,381 | $ | 13,737 | ||||
Non-interest income | 803 | 1,483 | ||||||
Net income | 2,280 | 6,502 | ||||||
Basic earnings per common share | $ | 0.23 | $ | 0.66 | ||||
Diluted earnings per common share | $ | 0.22 | $ | 0.64 | ||||
F-17
LINKBANCORP, Inc. and Subsidiaries
Notes to the Consolidated Financial Statements (Unaudited)
[In Thousands, Except Share Data]
3. | INVESTMENT SECURITIES |
The amortized cost, gross unrealized gains and losses, and fair value of investment securities available for sale are summarized as follows:
June 30, 2022 | ||||||||||||||||
(In Thousands) | Amortized Cost | Gross Unrealized Gains | Gross Unrealized Losses | Fair Value | ||||||||||||
Available for Sale: | ||||||||||||||||
Small Business Administration loan pools | $ | 706 | $ | — | $ | (13 | ) | $ | 693 | |||||||
Obligations of state and political subdivisions | 44,389 | 50 | (3,446 | ) | 40,993 | |||||||||||
Mortgage-backed securities in government-sponsored entities | 46,847 | 3 | (2,780 | ) | 44,070 | |||||||||||
$ | 91,942 | $ | 53 | $ | (6,239 | ) | $ | 85,756 | ||||||||
Held to Maturity: | ||||||||||||||||
Corporate debentures | $ | 9,993 | $ | — | $ | (241 | ) | $ | 9,752 | |||||||
Structured mortgage-backed securities | 18,823 | — | (285 | ) | 18,538 | |||||||||||
$ | 28,816 | $ | — | $ | (526 | ) | $ | 28,290 | ||||||||
December 31, 2021 | ||||||||||||||||
(In Thousands) | Amortized Cost | Gross Unrealized Gains | Gross Unrealized Losses | Fair Value | ||||||||||||
Available for Sale: | ||||||||||||||||
Small Business Administration loan pools | $ | 1,099 | $ | — | $ | (15 | ) | $ | 1,084 | |||||||
Obligations of state and political subdivisions | 46,115 | 2,405 | (38 | ) | 48,482 | |||||||||||
Mortgage-backed securities in government-sponsored entities | 54,239 | 382 | (404 | ) | 54,217 | |||||||||||
$ | 101,453 | $ | 2,787 | $ | (457 | ) | $ | 103,783 | ||||||||
F-1
8
LINKBANCORP, Inc. and Subsidiaries
Notes to the Consolidated Financial Statements (Unaudited)
[In Thousands, Except Share Data]
The following tables show the Company’s gross unrealized losses and fair value, aggregated by investment category and length of time the individual debt securities have been in a continuous unrealized loss position.
June 30, 2022 | ||||||||||||||||||||||||
Less Than Twelve Months | Twelve Months or Greater | Total | ||||||||||||||||||||||
| (In Thousands) | Fair Value | Gross Unrealized Loss | Fair Value | Gross Unrealized Loss | Fair Value | Gross Unrealized Loss | ||||||||||||||||||
Available for Sale: | ||||||||||||||||||||||||
Small Business Administration loan pools | $ | — | $ | — | $ | 693 | $ | (13 | ) | $ | 693 | $ | (13 | ) | ||||||||||
Obligations of state and political subdivisions | 35,196 | (3,326 | ) | 313 | (120 | ) | 35,509 | (3,446 | ) | |||||||||||||||
Mortgage-backed securities in government-sponsored entities | 32,614 | (1,808 | ) | 10,603 | (972 | ) | 43,217 | (2,780 | ) | |||||||||||||||
$ | 67,810 | $ | (5,134 | ) | $ | 11,609 | $ | (1,105 | ) | $ | 79,419 | $ | (6,239 | ) | ||||||||||
Held to Maturity: | ||||||||||||||||||||||||
Corporate debentures | $ | 9,752 | $ | (241 | ) | $ | — | $ | — | $ | 9,752 | $ | (241 | ) | ||||||||||
Structured mortgage-backed securities | 18,538 | (285 | ) | — | — | 18,538 | (285 | ) | ||||||||||||||||
$ | 28,290 | $ | (526 | ) | $ | — | $ | — | $ | 28,290 | $ | (526 | ) | |||||||||||
December 31, 2021 | ||||||||||||||||||||||||
Less Than Twelve Months | Twelve Months or Greater | Total | ||||||||||||||||||||||
(In Thousands) | Fair Value | Gross Unrealized Loss | Fair Value | Gross Unrealized Loss | Fair Value | Gross Unrealized Loss | ||||||||||||||||||
Available for Sale: | ||||||||||||||||||||||||
Small Business Administration loan pools | $ | — | $ | — | $ | 1,084 | $ | (15 | ) | $ | 1,084 | $ | (15 | ) | ||||||||||
Obligations of state and political subdivisions | 3,189 | (38 | ) | — | — | 3,189 | (38 | ) | ||||||||||||||||
Mortgage-backed securities in government-sponsored entities | 23,420 | (266 | ) | 4,687 | (102 | ) | 28,107 | (368 | ) | |||||||||||||||
$ | 26,609 | $ | (304 | ) | $ | 5,771 | $ | (117 | ) | $ | 32,380 | $ | (421 | ) | ||||||||||
The Company reviews its position quarterly and believes that as of June 30, 2022 and December 31, 2021, the declines outlined in the above tables represent temporary declines, and the Company does not intend to sell, and does not believe it will be required to sell, these debt securities before recovery of their cost basis, which may be at maturity. There were
162available for sale debt securities with unrealized losses at June 30, 2022 and December 31, 2021, respectively. There were 9 and zero held to maturity debt securities with unrealized losses at June 30, 2022 and December 31, 2021, respectively. The Company has concluded that the unrealized losses disclosed above are not other than temporary, but are the result of interest rate changes that are not expected to result in the noncollection of principal and interest during the year.
F-1
9
LINKBANCORP, Inc. and Subsidiaries
Notes to the Consolidated Financial Statements (Unaudited)
[In Thousands, Except Share Data]
As of June 30, 2022, amortized cost and fair value by contractual maturity, where applicable, are shown below. Actual maturities may differ from contractual maturities because the borrower may have the right to prepay obligations with or without penalty.
Available for Sale Securities | Held to Maturity Securities | |||||||||||||||
(In Thousands) | Amortized Cost | Fair Value | Amortized Cost | Fair Value | ||||||||||||
Due within one year | $ | 95 | $ | 95 | $ | — | $ | — | ||||||||
Due after one year through five years | 5,554 | 5,535 | 3,000 | 2,965 | ||||||||||||
Due after five years through ten years | 11,983 | 11,532 | 6,993 | 6,787 | ||||||||||||
Due after ten years | 29,872 | 26,757 | — | — | ||||||||||||
Mortgage-backed securities and Collateralized Mortgage Obligations | 44,438 | 41,837 | 18,823 | 18,538 | ||||||||||||
$ | 91,942 | $ | 85,756 | $ | 28,816 | $ | 28,290 | |||||||||
The following table summarizes sales of debt securities for the three and six months ended June 30, 2022. There were no sales of debt securities for the three and six months ended June 30, 2021.
| (In Thousands) | For the Three Months Ended June 30, | For the Six Months Ended June 30, | ||||||
2022 | 2022 | |||||||
Proceeds | $ | — | $ | 513 | ||||
Gross gains | — | 13 | ||||||
Gross losses | — | — | ||||||
Net gain | $ | — | $ | 13 | ||||
The Company had pledged debt securities with a carrying value of $37,869 and $45,300
to secure public monies as of June 30, 2022 and December 31, 2021, respectively.
4. | LOANS RECEIVABLE |
The portfolio segments and classes of loans are as follows:
(In Thousands) | June | December 31, 2021 | ||||||
Agriculture loans | $ | 7,710 | $ | 9,341 | ||||
Commercial loans | 88,452 | 98,604 | ||||||
Paycheck Protection Program (“PPP”) loans | 2,527 | 23,774 | ||||||
Commercial real estate loans | 435,588 | 338,749 | ||||||
Residential real estate loans | 241,401 | 231,302 | ||||||
Consumer and other loans | 8,689 | 7,087 | ||||||
Municipal loans | 5,814 | 6,182 | ||||||
790,181 | 715,039 | |||||||
Deferred costs (fees) | 225 | (223 | ) | |||||
Allowance for loan losses | (3,890 | ) | (3,152 | ) | ||||
Total | $ | 786,516 | $ | 711,664 | ||||
F-20
LINKBANCORP, Inc. and Subsidiaries
Notes to the Consolidated Financial Statements (Unaudited)
[In Thousands, Except Share Data]
The Company
as of June 30, 2022 and December 31, 2021, respectively.
5. | ALLOWANCE FOR LOAN LOSSES |
The segments of the Company’s loan portfolio are disaggregated to a level that allows management to monitor risk and performance. The loan segments used are consistent with the internal reports evaluated by the Company’s management and Board of Directors to monitor risk and performance within various segments of its loan portfolio and, therefore, no further disaggregation is considered necessary. The Company’s loan portfolio consists primarily of real estate loans on commercial and residential property. The portfolio also includes agricultural loans, commercial loans, municipal loans, and consumer loans.
The Company’s primary lending activity is the origination of commercial loans extended to small and
mid-sized
commercial and industrial entities.Commercial loans are primarily underwritten on the basis of the borrowers’ ability to service such debt from income. The cash flows of borrowers, however, may not be as expected and the collateral securing these loans may fluctuate in value. As a general practice, the Company takes as collateral a security interest in any equipment, or other chattel, although loans may also be made on an unsecured basis. Collateralized working capital loans typically are secured by short-term assets whereas long-term loans are primarily secured by long-term assets.
Construction and Land loans are to finance the construction of owner-occupied and income producing properties. These loans are categorized within commercial orfamily residential loans based upon the underlying collateral and intended use following the completion of the construction period. Real estate development and construction loans are approved based on an analysis of the borrower and guarantor, the viability of the project and on an acceptable percentage of the appraised value of the property securing the loan. Construction loan funds are disbursed periodically based on the percentage of construction or development completed. The Company carefully monitors these loans with
one-to-four
on-site
inspections and requires the receipt of lien waivers on funds advanced. The Company considers the market conditions and feasibility of proposed projects, the financial condition and reputation of the borrower and guarantors, the amount of the borrower’s equity in the project, independent appraisals, cost estimates andpre-construction
sale information. The Company also makes loans on occasion for the purchase of land for future development by the borrower. Land loans are extended for the future development for either commercial or residential use by the borrower. The Company carefully analyzes the intended use of the property and the viability thereof.The Company’s commercial real estate loans consist of mortgage loans secured by nonresidential real estate, such as by apartment buildings, small office buildings, and owner-occupied properties. Commercial real estate loans are secured by the subject property and are underwritten based on loan to value limits, cash flow coverage and general creditworthiness of the obligors. These loans tend to involve larger loan balances and their repayment is typically dependent upon the successful operation and management of the underlying
real estate.
Residential real estate loans are underwritten based on the borrower’s repayment capacity and source, value of the underlying property, credit history and stability. These loans are secured by a first or second mortgage on the borrower’s principal residence or their second/vacation home (excluding investment/rental property).
F-
21
LINKBANCORP, Inc. and Subsidiaries
Notes to the Consolidated Financial Statements (Unaudited)
[In Thousands, Except Share Data]
In addition to the main types of loans discussed above, the Company also originates agricultural loans, consumer loans, and municipal loans. The agricultural loan portfolio consists of loans to local farmers and agricultural businesses that are generally secured by farmland and equipment. The consumer loan portfolio consists of lending in the form of home equity loans secured by financed property and personal consumer loans, which may be secured or unsecured. The municipal loan portfolio consists of loans to qualified local municipalities, which are generally supported by the taxing authority of the borrowing municipality, and is frequently secured by collateral.
Management has an established methodology to determine the adequacy of the allowance for loan losses that assesses the risks and losses inherent in the loan portfolio. For purposes of determining the allowance for loan losses the Company has segmented certain loans in the portfolio by product type. Loans are segmented into the following pools: agriculture loans, commercial real estate loans, commercial loans, residential real estate loans, consumer loans, and municipal loans. Historical loss percentages for each risk category are calculated and used as the basis for calculating allowance allocations. These historical loss percentages are calculated over a four-year period for all portfolio segments.
Certain qualitative factors are then added to the historical allocation percentage to get the adjusted factor to be applied to
non-classified
loans. The following qualitative factors are analyzed for each portfolio segment:| • | Levels of and trends in delinquencies |
| • | Trends in volume and terms |
| • | Changes in collateral |
| • | Changes in management and lending staff |
| • | Economic trends |
| • | Concentrations of credit |
| • | Changes in lending policies |
| • | External factors |
| • | Changes in underwriting process |
| • | Trends in credit quality ratings |
These qualitative factors are reviewed each quarter and adjusted based upon relevant changes within the portfolio.
The total allowance reflects management’s estimate of loan losses inherent in the loan portfolio at the Consolidated Balance Sheet date. The Company considers the allowance for loan losses adequate to cover loan losses inherent in the loan portfolio at June 30, 2022 and December 31, 2021.
F-22
LINKBANCORP, Inc. and Subsidiaries
Notes to the Consolidated Financial Statements (Unaudited)
[In Thousands, Except Share Data]
The following table summarizes the activity in the allowance for loan losses by loan class for the three month periods ended June 30, 2022 and 2021.
Agriculture Loans | Commercial Loans | Commercial Real Estate Loans | Residential Real Estate Loan | Consumer Loans | Municipal Loans | Unallocated Loans | Total | |||||||||||||||||||||||||
(In Thousands) | For the Three Months Ended June 30, 2022 | |||||||||||||||||||||||||||||||
Allowance for loan losses: | ||||||||||||||||||||||||||||||||
Beginning balance | $ | 20 | $ | 585 | $ | 1,070 | $ | 1,728 | $ | 13 | $ | 15 | $ | 12 | $ | 3,443 | ||||||||||||||||
Charge-offs | — | (1 | ) | (1 | ) | — | — | — | — | (2 | ) | |||||||||||||||||||||
Recoveries | — | 5 | — | 49 | — | — | — | 54 | ||||||||||||||||||||||||
Provision | (3 | ) | (83 | ) | 717 | (230 | ) | 8 | (2 | ) | (12 | ) | 395 | |||||||||||||||||||
Ending balance | $ | 17 | $ | 506 | $ | 1,786 | $ | 1,547 | $ | 21 | $ | 13 | $ | 0 | $ | 3,890 | ||||||||||||||||
For the Three Months Ended June 30, 202 1 | ||||||||||||||||||||||||||||||||
Allowance for loan losses: | ||||||||||||||||||||||||||||||||
Beginning balance | $ | 105 | $ | 315 | $ | 315 | $ | 1,674 | $ | 24 | $ | 18 | $ | 336 | $ | 2,787 | ||||||||||||||||
Charge-offs | — | — | — | — | — | — | — | — | ||||||||||||||||||||||||
Recoveries | — | 19 | — | 25 | — | — | — | 44 | ||||||||||||||||||||||||
Provision | (7 | ) | 18 | 25 | (29 | ) | (1 | ) | (2 | ) | 40 | 44 | ||||||||||||||||||||
Ending balance | $ | 98 | $ | 352 | $ | 340 | $ | 1,670 | $ | 23 | $ | 16 | $ | 376 | $ | 2,875 | ||||||||||||||||
The following table summarizes the activity in the allowance for loan losses by loan class for the six month periods ended June 30, 2022 and 2021.
Agriculture Loans | Commercial and PPP Loans | Commercial Real Estate Loans | Residential Real Estate Loan | Consumer Loans | Municipal Loans | Unallocated Loans | Total | |||||||||||||||||||||||||
(In Thousands) | For the Six Months Ended June 30, 2022 | |||||||||||||||||||||||||||||||
Allowance for loan losses: | ||||||||||||||||||||||||||||||||
Beginning balance | $ | 23 | $ | 582 | $ | 799 | $ | 1,634 | $ | 22 | $ | 15 | $ | 77 | $ | 3,152 | ||||||||||||||||
Charge-offs | — | (1 | ) | (1 | ) | — | — | — | — | (2 | ) | |||||||||||||||||||||
Recoveries | — | 7 | — | 56 | 2 | — | — | 65 | ||||||||||||||||||||||||
Provision | (6 | ) | (82 | ) | 988 | (143 | ) | (3 | ) | (2 | ) | (77 | ) | 675 | ||||||||||||||||||
Ending balance | $ | 17 | $ | 506 | $ | 1,786 | $ | 1,547 | $ | 21 | $ | 13 | $ | 0 | $ | 3,890 | ||||||||||||||||
For the Six Months Ended June 30, 2021 | ||||||||||||||||||||||||||||||||
Allowance for loan losses: | ||||||||||||||||||||||||||||||||
Beginning balance | $ | 120 | $ | 290 | $ | 314 | $ | 1,702 | $ | 35 | $ | 18 | $ | 310 | $ | 2,789 | ||||||||||||||||
Charge-offs | — | — | — | (49 | ) | (3 | ) | — | — | (52 | ) | |||||||||||||||||||||
Recoveries | — | 19 | — | 27 | 1 | — | — | 47 | ||||||||||||||||||||||||
Provision | (22 | ) | 43 | 26 | (10 | ) | (10 | ) | (2 | ) | 66 | 91 | ||||||||||||||||||||
Ending balance | $ | 98 | $ | 352 | $ | 340 | $ | 1,670 | $ | 23 | $ | 16 | $ | 376 | $ | 2,875 | ||||||||||||||||
F-23
LINKBANCORP, Inc. and Subsidiaries
Notes to the Consolidated Financial Statements (Unaudited)
[In Thousands, Except Share Data]
The increase in the allowance for loan losses allocated to the commercial real estate loans can be attributed to the risk associated with the increased balances in commercial real estate loans. The decreased allocation in the allowance for loan losses allocated to residential real estate loans can be attributed to an increased balance of loans individually assessed for impairment as of June 30, 2022, which required no reserve based on the estimated recoverable value of collateral in comparison to the outstanding balance due on these credits. Please see the “Credit Quality Information” section below for further details.
The following table illustrates the balance of loans individually evaluated vs. collectively evaluated for impairment at June 30, 2022 and December 31, 2021.
Agriculture Loans | Commercial and PPP Loans | Commercial Real Estate Loans | Residential Real Estate Loan | Consumer Loans | Municipal Loans | Unallocated Loans | Total | |||||||||||||||||||||||||
(In Thousands) | As of June 30, 2022 | |||||||||||||||||||||||||||||||
Allowance for loan losses: | ||||||||||||||||||||||||||||||||
Ending balance | $ | 17 | $ | 506 | $ | 1,786 | $ | 1,547 | $ | 21 | $ | 13 | $ | 0 | $ | 3,890 | ||||||||||||||||
Ending balance: individually evaluated for impairment | $ | — | $ | — | $ | — | $ | — | $ | — | $ | — | $ | — | $ | — | ||||||||||||||||
Ending balance: collectively evaluated for impairment | $ | 17 | $ | 506 | $ | 1,786 | $ | 1,547 | $ | 21 | $ | 13 | $ | 0 | $ | 3,890 | ||||||||||||||||
Loans: | ||||||||||||||||||||||||||||||||
Ending balance | $ | 7,710 | $ | 90,979 | $ | 435,588 | $ | 241,401 | $ | 8,689 | $ | 5,814 | $ | 790,181 | ||||||||||||||||||
Ending balance: individually evaluated for impairment | $ | 200 | $ | 2,451 | $ | 2,501 | $ | 3,145 | $ | — | $ | — | $ | 8,297 | ||||||||||||||||||
Ending balance: loans acquired with deteriorated credit quality | $ | — | $ | 601 | $ | 4,369 | $ | 597 | $ | — | $ | — | $ | 5,567 | ||||||||||||||||||
Ending balance: collectively evaluated for impairment | $ | 7,510 | $ | 87,927 | $ | 428,718 | $ | 237,659 | $ | 8,689 | $ | 5,814 | $ | 776,317 | ||||||||||||||||||
F-24
LINKBANCORP, Inc. and Subsidiaries
Notes to the Consolidated Financial Statements (Unaudited)
[In Thousands, Except Share Data]
Agriculture Loans | Commercial and PPP Loans | Commercial Real Estate Loans | Residential Real Estate Loan | Consumer Loans | Municipal Loans | Unallocated Loans | Total | |||||||||||||||||||||||||
(In Thousands) | As of December 31, 2021 | |||||||||||||||||||||||||||||||
Allowance for loan losses: | ||||||||||||||||||||||||||||||||
Ending balance | $ | 23 | $ | 582 | $ | 799 | $ | 1,634 | $ | 22 | $ | 15 | 77 | $ | 3,152 | |||||||||||||||||
Ending balance: individually evaluated for impairment | $ | — | $ | — | $ | — | $ | — | $ | — | $ | — | $ | — | $ | — | ||||||||||||||||
Ending balance: collectively evaluated for impairment | $ | 23 | $ | 582 | $ | 799 | $ | 1,634 | $ | 22 | $ | 15 | 77 | $ | 3,152 | |||||||||||||||||
Loans: | ||||||||||||||||||||||||||||||||
Ending balance | $ | 9,341 | $ | 122,378 | $ | 338,749 | $ | 231,302 | $ | 7,087 | $ | 6,182 | $ | 715,039 | ||||||||||||||||||
Ending balance: individually evaluated for impairment | $ | — | $ | 42 | $ | — | $ | 709 | $ | — | $ | — | $ | 751 | ||||||||||||||||||
Ending balance: loans acquired with deteriorated credit quality | $ | — | $ | 512 | $ | 4,394 | $ | 650 | $ | — | $ | — | $ | 5,556 | ||||||||||||||||||
Ending balance: collectively evaluated for impairment | $ | 9,341 | $ | 121,824 | $ | 334,355 | $ | 229,943 | $ | 7,087 | $ | 6,182 | $ | 708,732 | ||||||||||||||||||
The Company evaluated whether loans acquired in the Merger were within the scope of ASC
310-30,
Receivables - Loans and Debt Securities Acquired with Deteriorated Credit Quality. Purchased credit-impaired loans (“PCI”) are loans that have evidence of credit deterioration since origination and it is probable at the date of acquisition that the Company will not collect all contractually required principal and interest payments. The fair value of purchased credit-impaired loans, on the acquisition date, was determined, primarily based on the fair value of loan collateral. The carrying value of purchased loans acquired with deteriorated credit quality as a result of the Merger was$
5,249and $
5,556at June 30, 2022 and December 31, 2021, respectively.
On the acquisition date, the preliminary estimate of the unpaid principal balance for all PCI loans acquired through the Merger was $
6,627and the estimated fair value of the loans was $
5,384. Total contractually required payments on these loans, including interest, at acquisition was $
8,509. The Company’s preliminary estimate of expected cash flows was $
5,793at the acquisition date. The Company established a credit risk related non-accretable discount of $
2,716relating to these impaired loans, reflected in the recorded net fair value. The Company further estimated the timing and amount of expected cash flows in excess of the estimated fair value and established an accretable discount of $
409relating to these impaired
loans.
F-25
LINKBANCORP, Inc. and Subsidiaries
Notes to the Consolidated Financial Statements (Unaudited)
[In Thousands, Except Share Data]
The following table provides activity for the accretable yield of PCI loans for the three and six months ended June 30, 2022:
(In Thousands) | Three Months Ended June 30, 2022 | Six Months Ended June 30, 2022 | ||||||
Accretable yield, beginning of period | $ | 206 | $ | 307 | ||||
Additions | — | — | ||||||
Accretion of income | (25 | ) | (126 | ) | ||||
Reclassifications from nonaccretable difference due to improvement in cash flows | — | — | ||||||
Other changes, net | — | — | ||||||
Accretable yield, end of period | $ | 181 | $ | 181 | ||||
Credit Quality Information
The following tables represent credit exposures by internally assigned grades as of June 30, 2022 and December 31, 2021. The grading analysis estimates the capability of the borrower to repay the contractual obligations of the loan agreements as scheduled or at all.
The Company’s internally assigned grades are as follows:
Pass – loans that are protected by the current net worth and paying capacity of the obligor or by the value of the underlying collateral. There are four
sub-grades
within the Pass category to further distinguish the loan.Special Mention – loans where a potential weakness or risk exists, which could cause a more serious problem if not corrected.
Substandard – loans that have a well-defined weakness based on objective evidence and are characterized by the distinct possibility that the Bank will sustain some loss if the deficiencies are not corrected.
Doubtful – loans classified as Doubtful have all the weaknesses inherent in a Substandard asset. In addition, these weaknesses make collection or liquidation in full highly questionable and improbable, based on existing circumstances.
Loss – loans classified as a Loss are considered uncollectible and are immediately charged against
allowances.
The following table presents the classes of the loan portfolio summarized by the internal risk rating system as of June 30, 2022 and December 31, 2021:
(In Thousands) | Special | |||||||||||||||||||
As of June 30, 2022 | Pass | Mention | Substandard | Doubtful | Total | |||||||||||||||
Agriculture loans | $ | 7,510 | $ | — | $ | 200 | $ | — | $ | 7,710 | ||||||||||
Commercial and PPP loans | 86,141 | 1,785 | 3,053 | — | 90,979 | |||||||||||||||
Commercial real estate loans | 428,458 | 310 | 4,743 | 2,077 | 435,588 | |||||||||||||||
Residential real estate loans | 236,123 | 1,453 | 3,202 | 623 | 241,401 | |||||||||||||||
Consumer loans | 8,689 | — | — | — | 8,689 | |||||||||||||||
Municipal loans | 5,814 | — | — | — | 5,814 | |||||||||||||||
Total | $ | 772,735 | $ | 3,548 | $ | 11,198 | $ | 2,700 | $ | 790,181 | ||||||||||
F-26
LINKBANCORP, Inc. and Subsidiaries
Notes to the Consolidated Financial Statements (Unaudited)
[In Thousands, Except Share Data]
(In Thousands) | Special | |||||||||||||||||||
As of December 31, 2021 | Pass | Mention | Substandard | Doubtful | Total | |||||||||||||||
Agriculture loans | $ | 9,341 | $ | — | $ | — | $ | — | $ | 9,341 | ||||||||||
Commercial and PPP | 117,918 | 3,757 | 703 | — | 122,378 | |||||||||||||||
Commercial real estate loans | 332,156 | 2,077 | 4,516 | — | 338,749 | |||||||||||||||
Residential real estate loans | 228,664 | 1,657 | 981 | — | 231,302 | |||||||||||||||
Consumer loans | 7,087 | — | — | — | 7,087 | |||||||||||||||
Municipal loans | 6,182 | — | — | — | 6,182 | |||||||||||||||
Total | $ | 701,348 | $ | 7,491 | $ | 6,200 | $ | — | $ | 715,039 | ||||||||||
The following tables present an aging analysis of the recorded investment of
past-due
loans.June 30, 2022 | ||||||||||||||||||||||||||||||||
(In Thousands) | 30-59 Days Past Due | 60-89 Days Past Due | 90 Days or Greater Past Due | Total Past Due | Current | Purchased Credit Impaired Loans | Total Loans | Total > 90 Days and Accruing | ||||||||||||||||||||||||
Agriculture loans | $ | 154 | $ | — | $ | — | $ | 154 | $ | 7,556 | $ | — | $ | 7,710 | $ | — | ||||||||||||||||
Commercial and PPP loans | — | 21 | — | 21 | 90,958 | — | 90,979 | — | ||||||||||||||||||||||||
Commercial real estate loans | 460 | 140 | — | 600 | 430,623 | 4,365 | 435,588 | — | ||||||||||||||||||||||||
Residential real estate loans | 1,467 | 210 | 338 | 2,015 | 239,386 | — | 241,401 | — | ||||||||||||||||||||||||
Consumer loans | 15 | 2 | — | 17 | 8,672 | — | 8,689 | — | ||||||||||||||||||||||||
Municipal loans | — | — | — | 5,814 | — | 5,814 | — | |||||||||||||||||||||||||
Total | $ | 2,096 | $ | 373 | $ | 338 | $ | 2,807 | $ | 783,009 | $ | 4,365 | $ | 790,181 | $ | — | ||||||||||||||||
December 31, 2021 | ||||||||||||||||||||||||||||||||
(In Thousands) | 30-59 Days Past | 60-89 Days Past | 90 or Past | Total Past | Current | Purchased Credit Impaired Loans | Total Loans | Total Days Accruing | ||||||||||||||||||||||||
Agriculture loans | $ | 83 | $ | — | $ | — | $ | 83 | $ | 9,258 | $ | — | $ | 9,341 | $ | — | ||||||||||||||||
Commercial and PPP loans | 66 | — | — | 66 | 121,800 | 512 | 122,378 | — | ||||||||||||||||||||||||
Commercial real estate loans | 245 | — | — | 245 | 334,110 | 4,394 | 338,749 | — | ||||||||||||||||||||||||
Residential real estate loans | 1,427 | 211 | 869 | 2,507 | 228,145 | 650 | 231,302 | 762 | ||||||||||||||||||||||||
Consumer loans | 31 | 2 | — | 33 | 7,054 | — | 7,087 | — | ||||||||||||||||||||||||
Municipal loans | — | — | — | — | 6,182 | — | 6,182 | — | ||||||||||||||||||||||||
Total | $ | 1,852 | $ | 213 | $ | 869 | $ | 2,934 | $ | 706,549 | $ | 5,556 | $ | 715,039 | $ | 762 | ||||||||||||||||
F-2
7
LINKBANCORP, Inc. and Subsidiaries
Notes to the Consolidated Financial Statements (Unaudited)
[In Thousands, Except Share Data]
Impaired Loans
The following tables present the recorded investment and unpaid principal balances for impaired loans and related allowance, if applicable. Also presented are the average recorded investments and the related amount of interest recognized during the time within the period that the impaired loans were
impaired.
As of June 30, 2022 | ||||||||||||
(In Thousands) | Recorded Investment | Unpaid Principal Balance | Related Allowance | |||||||||
With no related allowance recorded: | ||||||||||||
Agriculture loans | $ | 200 | $ | 200 | $ | — | ||||||
Commercial loans | 2,451 | 2,471 | — | |||||||||
Commercial real estate loans | 2,501 | 2,501 | — | |||||||||
Residential real estate loans | 3,145 | 3,269 | — | |||||||||
Consumer loans | — | — | — | |||||||||
Municipal loans | — | — | — | |||||||||
With an allowance recorded: | ||||||||||||
Agriculture loans | $ | — | $ | — | $ | — | ||||||
Commercial loans | — | — | — | |||||||||
Commercial real estate loans | — | — | — | |||||||||
Residential real estate loans | — | — | — | |||||||||
Consumer loans | — | — | — | |||||||||
Municipal loans | — | — | — | |||||||||
Total | ||||||||||||
Agriculture loans | $ | 200 | $ | 200 | $ | — | ||||||
Commercial loans | 2,451 | 2,471 | — | |||||||||
Commercial real estate loans | 2,501 | 2,501 | — | |||||||||
Residential real estate loans | 3,145 | 3,269 | — | |||||||||
Consumer loans | — | — | — | |||||||||
Municipal loans | — | — | — | |||||||||
$ | 8,297 | $ | 8,441 | $ | — | |||||||
F-28
LINKBANCORP, Inc. and Subsidiaries
Notes to the Consolidated Financial Statements (Unaudited)
[In Thousands, Except Share
Data]
As of December 31, 2021 | ||||||||||||
(In Thousands) | Recorded Investment | Unpaid Principal Balance | Related Allowance | |||||||||
| With no related allowance recorded: | ||||||||||||
| Agriculture loans | $ | — | $ | — | $ | — | ||||||
| Commercial loans | 42 | 61 | — | |||||||||
| Commercial real estate loans | — | — | — | |||||||||
| Residential real estate loans | 709 | 779 | — | |||||||||
| Consumer loans | — | — | — | |||||||||
| Municipal loans | — | — | — | |||||||||
| With an allowance recorded: | ||||||||||||
| Agriculture loans | $ | — | $ | — | $ | — | ||||||
| Commercial loans | — | — | — | |||||||||
| Commercial real estate loans | — | — | — | |||||||||
| Residential real estate loans | — | — | — | |||||||||
| Consumer loans | — | — | — | |||||||||
| Municipal loans | — | — | — | |||||||||
| — | — | — | ||||||||||
| Total | ||||||||||||
| Agriculture loans | $ | — | $ | — | $ | — | ||||||
Commercial loans | 42 | 61 | — | |||||||||
| Commercial real estate loans | — | — | — | |||||||||
| Residential real estate loans | 709 | 779 | — | |||||||||
| Consumer loans | — | — | — | |||||||||
| Municipal loans | — | — | — | |||||||||
| $ | 751 | $ | 840 | $ | — | |||||||
For the Three Months Ended June 30, | ||||||||||||||||
2022 | 2021 | |||||||||||||||
(In Thousands) | Average Recorded Investment | Interest Income Recognized | Average Recorded Investment | Interest Income Recognized | ||||||||||||
| With no related allowance recorded: | ||||||||||||||||
Agriculture loans | $ | 237 | $ | 3 | $ | — | $ | — | ||||||||
Commercial loans | 4,706 | 66 | — | — | ||||||||||||
Commercial real estate loans | 455 | 4 | — | — | ||||||||||||
Residential real estate loans | 3,143 | 23 | 213 | 4 | ||||||||||||
Consumer loans | — | — | — | — | ||||||||||||
Municipal loans | — | — | — | — | ||||||||||||
| 8,541 | 96 | 213 | 4 | |||||||||||||
With an allowance recorded: | ||||||||||||||||
Agriculture loans | $ | — | $ | — | $ | — | $ | — | ||||||||
Commercial loans | — | — | — | |||||||||||||
Commercial real estate loans | — | — | — | — | ||||||||||||
Residential real estate loans | — | — | — | — | ||||||||||||
Consumer loans | — | — | — | — | ||||||||||||
Municipal loans | — | — | — | — | ||||||||||||
| — | — | — | — | |||||||||||||
Total | $ | 8,541 | $ | 96 | $ | 213 | $ | 4 | ||||||||
F-29
LINKBANCORP, Inc. and Subsidiaries
Notes to the Consolidated Financial Statements (Unaudited)
[In Thousands, Except Share Data]
For the Six Months Ended June 30, | ||||||||||||||||
2022 | 2021 | |||||||||||||||
(In Thousands) | Average Recorded Investment | Interest Income Recognized | Average Recorded Investment | Interest Income Recognized | ||||||||||||
With no related allowance recorded: | ||||||||||||||||
Agriculture loans | $ | 242 | $ | 6 | $ | — | $ | — | ||||||||
Commercial loans | 4,935 | 132 | — | — | ||||||||||||
Commercial real estate loans | 461 | 9 | — | — | ||||||||||||
Residential real estate loans | 3,171 | 48 | 225 | 8 | ||||||||||||
Consumer loans | — | — | — | |||||||||||||
Municipal loans | — | — | — | |||||||||||||
| $ | 8,809 | $ | 195 | $ | 225 | $ | 8 | |||||||||
With an allowance recorded: | ||||||||||||||||
Agriculture loans | $ | — | $ | — | $ | — | $ | — | ||||||||
Commercial loans | — | — | — | — | ||||||||||||
Commercial real estate loans | — | — | — | — | ||||||||||||
Residential real estate loans | — | — | — | — | ||||||||||||
Consumer loans | — | — | — | — | ||||||||||||
Municipal loans | — | — | — | — | ||||||||||||
| — | — | — | — | |||||||||||||
Total | $ | 8,809 | $ | 195 | $ | 225 | $ | 8 | ||||||||
The following table presents nonaccrual loans by classes of the loan
portfolio:
(In Thousands) | June 30, 2022 | December 31, 2021 | ||||||
Commercial loans | $ | 36 | $ | 39 | ||||
Commercial real estate loans | 137 | 144 | ||||||
Residential real estate loans | 1,321 | 449 | ||||||
Consumer loans | — | 2 | ||||||
Total | $ | 1,494 | $ | 634 | ||||
Approximately
$435,588 or 55.1%
of the Bank’s loan portfolio was in commercial real estate loans at June 30, 2022. While the Bank does not have a concentration of credit risk with any single borrower or industry, repayments on loans in these portfolios can be negatively influenced by decreases in real estate values. The Bank mitigates this risk through conservative underwriting policies and procedures. In addition,
$165,203of real estate-commercial loans were owner occupied properties as of June 30, 2022. These types of loans are generally considered to involve less risk than nonowner-occupied mortgages.
At June 30, 2022 and December 31, 2021, the carrying amount of borrowings
secured by loans pledged to the FHLB under its blanket lien was $0 and $1,120, respectively.Loan Modifications and Troubled Debt Restructurings (TDRs)
A loan is considered to be a TDR loan when the Company grants a concession to the borrower because of the borrower’s financial condition that it would not otherwise consider. Such concessions include the reduction of interest rates, forgiveness of principal or interest, or other modifications of interest rates that are less than the current market rate for new obligations with similar risk.
F-
30
LINKBANCORP, Inc. and Subsidiaries
Notes to the Consolidated Financial Statements (Unaudited)
[In Thousands, Except Share Data]
The Bank may grant a concession or modification for economic or legal reasons related to a borrower’s financial condition that it would not otherwise consider resulting in a modified loan which is then identified as a troubled debt restructuring (TDR). The Bank may modify loans through rate reductions, extensions of maturity, interest only payments, or payment modifications to better match the timing of cash flows due under the modified terms with the cash flows from the borrowers’ operations. Loan modifications are intended to minimize the economic loss and to avoid foreclosure or repossession of the collateral. TDRs are considered impaired loans for purposes of calculating the Bank’s allowance for loan losses.
The Bank identifies loans for potential restructure primarily through direct communication with the borrower and evaluation of the borrower’s financial statements, revenue projections, tax returns, and credit reports. Even if the borrower is not presently in default, management will consider the likelihood that cash flow shortages, adverse economic conditions, and negative trends may result in a payment default in the near future. As of June 30, 2022 and December 31, 2021, the Company had no loans identified as TDRs. There were also no new loan modifications during the periods that were considered TDRs.
6. | DEPOSITS |
Deposit accounts are summarized as follows:
June 30, 2022 | December 31, 2021 | |||||||||||||||
(In Thousands) | Amount | % | Amount | % | ||||||||||||
Demand, noninterest-bearing | $ | 184,345 | 20.43 | % | $ | 129,243 | 16.75 | % | ||||||||
Demand, interest-bearing | 269,493 | 29.86 | 256,258 | 33.21 | ||||||||||||
Money market and savings | 235,411 | 26.09 | 205,843 | 26.68 | ||||||||||||
Time deposits, $250 and over | 55,507 | 6.15 | 56,266 | 7.29 | ||||||||||||
Time deposits, other | 157,617 | 17.47 | 124,055 | 16.08 | ||||||||||||
$ | 902,373 | 100.0 | % | $ | 771,665 | 100.0 | % | |||||||||
Within time deposits, other, there were $20,000 and $0
in brokered deposits outstanding at June 30, 2022 and December 31, 2021, respectively.
7. | BORROWINGS AND SUBORDINATED DEBENTURES |
Borrowings and subordinated debt was as follows:
(in Thousands) | June 30, 2022 | December 31, 2021 | ||||||
Long-term FHLB advances | $ | — | $ | — | ||||
Subordinated Debt | 40,585 | 20,696 | ||||||
Federal Reserve PPPLF | 1,639 | 19,814 | ||||||
Total | $ | 42,224 | $ | 40,510 | ||||
On April 8, 2022, LINKBANCORP entered into Subordinated Note Purchase Agreements (the “Agreements”) with certain institutional accredited investors (the “Purchasers”) and, pursuant to the Agreements, issued to the Purchasers $20,000 in aggregate principal amount of its 4.50%Rate Subordinated Notes due 2032 (the “Notes”). The investors included a related party entity that is controlled by a member of the Board of Directors of the Company, which purchased $7,000 in principal amount of the note. During the three months
Fixed-to-Floating
F-31
LINKBANCORP, Inc. and Subsidiaries
Notes to the Consolidated Financial Statements (Unaudited)
[In Thousands, Except Share Data]
ended June 30, 2022, the Company contributed $15,000 of the subordinated note proceeds to the Bank as equity capital, the impact of which, can be seen within Note 10 Regulatory Capital Requirements later in this document.
The Notes are intended to qualify at the holding company level as Tier 2 capital under the capital guidelines of the Federal Reserve Board.
The Notes, which mature on April 15, 2032, bear interest at a fixed annual rate of 4.50% for the period up to but excluding April 15, 2027 (the “Fixed Interest Rate Period”). From April 15, 2027 until maturity or redemption (the “Floating Interest Rate Period”), the interest rate will adjust to a floating rate equal to a benchmark rate, which is expected to be the then-current three-month Secured Overnight Financing Rate (SOFR), plus 203 basis points. The Company will pay interest in arrears semi-annually during the Fixed Interest Rate Period and quarterly during the Floating Interest Rate Period. The Notes constitute unsecured and subordinated obligations of the Company and rank junior in right of payment to any senior indebtedness and obligations to general and secured creditors. Subject to limited exceptions, the Company cannot redeem the Notes before the fifth anniversary of the issuance date.
The Agreements and Notes contain customary subordination provisions, representations and warranties, covenants, and events of default.
The Bank has available unsecured lines of credit, with interest based on the daily Federal Funds rate, with four correspondent banks totaling $51,000 at June 30, 2022. There were no borrowings under these lines of credit at June 30, 2022 and December 31, 2021.
8. | FAIR VALUE MEASUREMENTS |
Management uses its best judgment in estimating the fair value of the Company’s financial instruments; however, there are inherent weaknesses in an estimation technique. Therefore, for substantially all financial instruments, the fair value estimates herein are not necessarily indicative of the amounts The Company could have realized in a sales transaction on the dates indicated. The estimated fair value amounts have been measured as of their respective year-ends and have not been
re-evaluated
or updated for purposes of these financial statements subsequent to those respective dates. As such, the estimated fair values of these financial instruments subsequent to the respective reporting dates may be different than the amounts reported at eachyear-end.
The Company uses fair value measurements to record fair value adjustments to certain assets and liabilities and to determine fair value disclosures. In accordance with the fair value measurements accounting guidance (FASB ASC 820,
Fair Value Measurements
), the fair value of a financial instrument is the price that would be received to sell an asset or paid to transfer a liability in an orderly transaction between market participants at the measurement date. Fair value is best determined based upon quoted market prices. However, in many instances, there are no quoted market prices for the Company’s various financial instruments. In cases where quoted market prices are not available, fair values are based on estimates using present value or other valuation techniques. Those techniques are significantly affected by the assumptions used, including the discount rate and estimates of future cash flows. Accordingly, the fair value estimates may not be realized in an immediate settlement of the instrument.
The Company uses a consistent definition of fair value, which focuses on exit price in an orderly transaction (that is, not a forced liquidation or distressed sale) between market participants at the measurement date under current market conditions. If there has been a significant decrease in the volume and level of activity for the asset or liability, a change in valuation technique or the use of multiple valuation techniques may be
F-32
LINKBANCORP, Inc. and Subsidiaries
Notes to the Consolidated Financial Statements (Unaudited)
[In Thousands, Except Share Data]
appropriate. In such instances, determining the price at which willing market participants would transact at the measurement date under current market conditions depends on the facts and circumstances and requires the use of significant judgment. The fair value guidance establishes a fair value hierarchy that prioritizes the inputs to valuation methods used to measure fair value. The hierarchy gives the highest priority to unadjusted quoted prices in active markets for identical assets or liabilities (Level 1 measurements) and the lowest priority to unobservable inputs (Level 3 measurements). The three levels of the fair value hierarchy are as follows:
The following disclosures show the hierarchal disclosure framework associated with the level of pricing observations utilized in measuring assets and liabilities at fair value. The three broad levels of pricing are as follows:
Level I: | Quoted prices are available in active markets for identical assets or liabilities as of the reported date. | |||
Level II: | Pricing inputs are other than the quoted prices in active markets, which are either directly or indirectly observable as of the reported date. The nature of these assets and liabilities includes items for which quoted prices are available but traded less frequently and items that are fair-valued using other financial instruments, the parameters of which can be directly observed. | |||
Level III: | Valuations derived from valuation techniques in which one or more significant inputs or significant value drivers are unobservable. |
This hierarchy requires the use of observable market data when available.
The estimated fair values of the Company’s financial instruments that are not required to be measured or reported at fair value are as
follows:
At June 30, 2022 | At December 31, 2021 | |||||||||||||||
(In Thousands) | Carrying Amount | Fair Value | Carrying Amount | Fair Value | ||||||||||||
Financial assets: | ||||||||||||||||
Cash and cash equivalents (Level 1) | $ | 62,996 | $ | 62,996 | $ | 22,590 | $ | 22,590 | ||||||||
Certificates of deposit with other banks (Level 3) | 11,088 | 11,088 | 12,828 | 12,828 | ||||||||||||
Securities held to maturity (Level 2) | 28,816 | 28,290 | — | — | ||||||||||||
Loans (Level 3) | 786,516 | 774,687 | 711,664 | 705,706 | ||||||||||||
Accrued interest receivable (Level 1) | 3,797 | 3,797 | 3,022 | 3,022 | ||||||||||||
Restricted investments in bank stock (Level 1) | 2,567 | 2,567 | 2,685 | 2,685 | ||||||||||||
Cash surrender value of life insurance (Level 1) | 19,012 | 19,012 | 18,787 | 18,787 | ||||||||||||
| Financial liabilities: | ||||||||||||||||
Non-maturity deposits (Level 1) | 689,249 | 689,249 | 591,344 | 591,344 | ||||||||||||
Time Deposits (Level 3) | 213,124 | 210,984 | 180,321 | 180,485 | ||||||||||||
Other borrowings (Level 3) | 1,639 | 1,639 | 19,814 | 19,819 | ||||||||||||
Subordinated Notes (Level 3) | 40,585 | 38,026 | 20,696 | 20,696 | ||||||||||||
Accrued interest payable (Level 1) | 325 | 325 | 103 | 103 | ||||||||||||
The following tables present the assets reported on the Consolidated Balance Sheet at their fair value on a recurring basis as of June 30, 2022 and December 31, 2021, by level within the fair value hierarchy. Financial assets and liabilities are classified in their entirety based on the lowest level of input that is significant to the fair value measurement.
F-33
LINKBANCORP, Inc. and Subsidiaries
Notes to the Consolidated Financial Statements (Unaudited)
[In Thousands, Except Share Data]
The Company’sinvestment securities are reported at fair value. These securities are valued by an independent third party. The valuations are based on market data. They utilize evaluated pricing models that vary by asset and incorporate available trade, bid and other market information. For securities that do not trade on a daily basis, their evaluated pricing applications apply available information such as benchmarking and matrix pricing. The market inputs normally sought in the evaluation of securities include benchmark yields, reported trades, broker/dealer quotes (only obtained from market makers or broker/dealers recognized as market participants), issuer spreads,
available-for-sale
two-sided
markets, benchmark securities, bid, offers and reference data. For certain securities additional inputs may be used or some market inputs may not be applicable. Inputs are prioritized differently on any given day based on market conditions.June 30, 2022 | ||||||||||||||||
(In Thousands) | Level I | Level II | Level III | Total | ||||||||||||
Assets: | ||||||||||||||||
Small Business Administration loan pools | $ | — | $ | 693 | $ | — | $ | 693 | ||||||||
Obligations of state and political subdivisions | — | 40,993 | — | 40,993 | ||||||||||||
Mortgage backed securities | — | 44,070 | — | 44,070 | ||||||||||||
Total | $ | — | $ | 85,756 | $ | — | $ | 85,756 | ||||||||
December 31, 2021 | ||||||||||||||||
(In Thousands) | Level I | Level II | Level III | Total | ||||||||||||
Assets: | ||||||||||||||||
Small Business Administration loan pools | $ | — | $ | 1,084 | $ | — | $ | 1,084 | ||||||||
Obligations of state and political subdivisions | — | 48,482 | — | 48,482 | ||||||||||||
Mortgage backed securities | — | 54,217 | — | 54,217 | ||||||||||||
Total | $ | — | $ | 103,783 | $ | — | $ | 103,783 | ||||||||
For financial assets measured at fair value on a nonrecurring basis, the fair value measurements by level within the fair value hierarchy used as of June 30, 2022 and December 31, 2021 are presented in the table below.
June 30, 2022 | ||||||||||||||||
(In Thousands) | Level I | Level II | Level III | Total | ||||||||||||
Impaired loans | — | $ | — | $ | 8,297 | $ | 8,297 | |||||||||
December 31, 2021 | ||||||||||||||||
(In Thousands) | Level I | Level II | Level III | Total | ||||||||||||
Impaired loans | $ | — | $ | — | $ | 751 | $ | 751 | ||||||||
Loans Held for Sale | $ | — | $ | — | $ | 3,860 | $ | 3,860 | ||||||||
The following tables provide information describing the valuation processes used to determine nonrecurring fair value measurements categorized within Level III of the fair value
hierarchy:
June 30, 2022 | ||||||||||||||||
| Quantitative Information About Level III Fair Value Measurements | ||||||||||||||||
(In Thousands) | Fair Value | Valuation Techniques | Unobservable Input | Range (Weighted Average) | ||||||||||||
Impaired loans | $ | 8,297 | Appraisal of collateral | (1) | | Liquidation expenses | 10 | % | ||||||||
F-34
LINKBANCORP, Inc. and Subsidiaries
Notes to the Consolidated Financial Statements (Unaudited)
[In Thousands, Except Share Data]
December 31, 2021 | ||||||||||||||||
| Quantitative Information About Level III Fair Value Measurements | ||||||||||||||||
(In Thousands) | Fair Value | Valuation Techniques | Unobservable Input | Range (Weighted Average) | ||||||||||||
Impaired loans | $ | 751 | Appraisal of collateral | (1) | | Liquidation expenses | 10 | % | ||||||||
Loans Held for Sale | $ | 3,860 | Appraisal of collateral | (1) | | Liquidation collateral | | 15 | % | |||||||
(1) | Fair value is generally determined through independent appraisals of the underlying collateral, which include various Level III inputs that are not identifiable. |
Appraisals may be adjusted by management for qualitative factors, such as economic conditions, aging, and/or estimated liquidation expenses incurred when selling the collateral. The range and weighted average of appraisal adjustments and liquidation expenses are presented as a percentage of the
appraisal.
9 . | STOCK-BASED COMPENSATION |
On May 14, 2019, the Company’s shareholders approved the LINKBANCORP, Inc. 2019 Equity Incentive Plan (the “Plan”). The Plan authorizes the issuance or delivery to participants of up to
shares of LINKBANCORP common stock pursuant to grants of incentive and
non-statutory
stock options. The Plan is administered by the members of LINKBANCORP’s Compensation Committee (the “Committee”). Unless the Committee specifies a different vesting schedule, awards under the Plan shall be granted with a vesting rate of 20
percent per year. Vesting may be accelerated under certain conditions or at the discretion of the Committee at any time. Employees and directors of LINKBANCORP or its subsidiaries are eligible to receive awards under the plan, except that nonemployees may not be granted incentive stock options. Stock options are either “incentive” stock options or “nonqualified” stock options. Incentive stock options have certain tax advantages and must comply with the requirements of Section 422 of the Internal Revenue Code. The table below provides details of the Company’s stock options at June 30, 2022.
Number of Stock Options | Weighted- Average Exercise Price | Weighted- Average Remaining Contractual Term in Years | Aggregate Intrinsic Value (in ‘000s) | |||||||||||||
Outstanding, December 31, 2021 | 421,500 | $ | 10.46 | 7.9 | $ | 780 | ||||||||||
Granted | — | |||||||||||||||
Expired/terminated | (5,600 | ) | 12.00 | 8.3 | ||||||||||||
Exercised | (12,000 | ) | 10.00 | — | ||||||||||||
Outstanding, June 30, 2022 | 403,900 | $ | 10.86 | 7.4 | $ | — | ||||||||||
Exercisable at period end | 195,700 | $ | 10.08 | 7.1 | $ | — | ||||||||||
The exercise prices
for options outstanding as of
June
30
, 2022 ranged from $10.00 to $14.50. Because the stock options issued by the Company historically relate to LINKBANK employees and given the reverse acquisition accounting described in Note 1 paired with the timing of the Merger between the Company andF-35
LINKBANCORP, Inc. and Subsidiaries
Notes to the Consolidated Financial Statements (Unaudited)
[In Thousands, Except Share Data]
GNBF, the Company recognized no compensation expense during the six months ended June 30, 2021. The Company recognized compensation expense of $39 during the six months ended June 30, 2022. At June 30, 2022, the total unrecognized stock-based compensation costs totaled $169 and will be recognized ratably as expense through December 31, 2026.
On May 26, 2022, the Company’s shareholders approved the LINKBANCORP, Inc. 2022 Equity Incentive Plan (the “2022 Equity Incentive Plan”). The Plan authorizes the issuance or delivery to participants of up to 475,000 shares of the Company’s common stock pursuant to grants of restricted stock, restricted stock units, stock options, and
non-qualified
stock options. The Plan is administered by the members of LINKBANCORP’s Compensation Committee (the “Committee”). At least 95% of the awards under the 2022 Equity Incentive Plan will vest no earlier than one year after the grant date.10. | REGULATORY CAPITAL REQUIREMENTS |
The Bank is subject to various regulatory capital requirements administered by the Federal Deposit Insurance Corporation and the Pennsylvania Department of Banking and Securities. Failure to meet minimum capital requirements can initiate certain mandatory, and possible additional discretionary, actions by regulators that, if undertaken, could have a direct material effect on the Company’s consolidated financial statements. Under capital adequacy guidelines and the regulatory framework for prompt corrective action, the Bank must meet specific capital guidelines that involve quantitative measures of the Bank’s assets, liabilities, and certain
off-balance
sheet items as calculated under regulatory accounting practices. The Bank’s capital amounts and classification are also subject to qualitative judgments by the regulators about components, risk-weightings, and other factors.The Bank is subject to regulatory capital requirements administered by banking agencies. Capital adequacy guidelines and prompt corrective action regulations involve quantitative measures of assets, liabilities, and certain
off-balance-sheet
items calculated under regulatory accounting practices. Capital amounts and classifications are also subject to qualitative judgments by regulators about components, risk weightings, and other factors and the regulators can lower classifications in certain cases. Failure to meet various capital requirements can initiate regulatory action that could have a direct material effect on the financial statements. As of June 30, 2022, the Bank has met all capital adequacy requirements to which it is subject.The prompt corrective action regulations provide five classifications, including well capitalized, adequately capitalized, under-capitalized, significantly undercapitalized, and critically undercapitalized, although these terms are not used to represent overall financial condition. If an institution is adequately capitalized, regulatory approval is required before the institution may accept brokered deposits. If an institution is undercapitalized, capital distributions are limited, as is asset growth and expansion, and plans for capital restoration are required.
The
capital conservation buffer is designed to absorb losses during periods of economic stress. Banking institutions with a ratio of Common Equity Tier 1 capital to risk-weighted assets above the minimum but below the conservation buffer will face limitations on dividends, stock repurchases and certain discretionary bonus payments to management based on the amount of the shortfall. Under Basel III rules,
ban
ks mus
t hold a capital conservation buffer above the adequately capitalized risk-based capital ratios. The required capital conservation
buffer is 2.50%.F-36
LINKBANCORP, Inc. and Subsidiaries
Notes to the Consolidated Financial Statements (Unaudited)
[In Thousands, Except Share Data]
The following tables present actual and required capital ratios as of June 30, 2022 and December 31, 2021 under the Basel III Capital Rules. Bank capital levels required to be considered well capitalized are based upon prompt corrective action regulations.
June 30, 2022 | December 31, 2021 | |||||||||||||||
(In Thousands) | Amount | Ratio | Amount | Ratio | ||||||||||||
| Total capital | ||||||||||||||||
(to risk-weighted assets) | ||||||||||||||||
| Actual | $ | 101,598 | 12.42 | % | $ | 81,355 | 11.50 | % | ||||||||
| For capital adequacy purposes | 65,422 | 8.00 | 56,578 | 8.00 | ||||||||||||
| To be well capitalized | 81,777 | 10.00 | 70,722 | 10.00 | ||||||||||||
| Tier 1 capital | ||||||||||||||||
(to risk-weighted assets) | ||||||||||||||||
| Actual | $ | 97,654 | 11.94 | % | $ | 77,904 | 11.02 | % | ||||||||
| For capital adequacy purposes | 49,066 | 6.00 | 42,433 | 6.00 | ||||||||||||
| To be well capitalized | 65,422 | 8.00 | 56,578 | 8.00 | ||||||||||||
| Common equity | ||||||||||||||||
(to risk-weighted assets) | ||||||||||||||||
| Actual | $ | 97,654 | 11.94 | % | $ | 77,904 | 11.02 | % | ||||||||
| For capital adequacy purposes | 36,800 | 4.50 | 31,825 | 4.50 | ||||||||||||
| To be well capitalized | 53,155 | 6.50 | 45,969 | 6.50 | ||||||||||||
| Tier 1 capital | ||||||||||||||||
(to average assets) | ||||||||||||||||
| Actual | $ | 97,654 | 10.10 | % | $ | 77,904 | 8.85 | % | ||||||||
| For capital adequacy purposes | 38,657 | 4.00 | 35,230 | 4.00 | ||||||||||||
| To be well capitalized | 48,321 | 5.00 | 44,038 | 5.00 | ||||||||||||
The federal banking agencies, including the FDIC, issued a rule pursuant to The Economic Growth, Regulatory Relief and Consumer Protection Act of 2018 to establish for institutions with assets of less than $10 billion a “community bank leverage ratio” (the ratio of a bank’s tier 1 capital to average total consolidated assets) of 9% that qualifying institutions may elect to use in lieu of the generally applicable leverage and risk-based capital requirements under Basel III. If an election to use the community bank leverage ratio capital framework is made, a qualifying bank with less than $10
billion in assets with capital exceeding the specified community bank leverage ratio is considered compliant with all applicable regulatory capital and leverage requirements, including the requirement to be “well capitalized.” As of June 30, 2022 and December 31, 2021, the Bank had not elected to be subject to the alternative framework.
Federal and state banking regulations place certain restrictions on dividends paid by the Bank. The Pennsylvania Banking Code provides that cash dividends may be declared and paid out of accumulated net earnings. In addition, dividends paid by the Bank would be prohibited if the effect thereof would cause the Bank’s capital to be reduced below applicable minimum capital requirements. Loans or advances by the Bank to the Company are limited to 10 percent of the Bank’s capital stock and surplus and must have collateral securing the loans
or advances.
11. | FINANCIAL INSTRUMENTS WITH OFF-BALANCE SHEET RISK |
The Company is a party to financial instruments with
off-balance
sheet risk in the normal course of business to meet the financing needs of its customers. These financial instruments include commitments to extend credit. Such commitments involve, to varying degrees, elements of credit and interest rate risk in excess of the amount recognized in the consolidated balance sheets. F-37
LINKBANCORP, Inc. and Subsidiaries
Notes to the Consolidated Financial Statements (Unaudited)
[In Thousands, Except Share Data]
The Company’s exposure to credit loss in the event of nonperformance by the other party to the financial instrument for commitments to extend credit is represented by the contractual amount of those instruments. The Company uses the same credit policies in making and monitoring commitments and conditional obligations as it does for on-balance sheet instruments. As of June 30, 2022 and December 31, 2021, the Company has a reserve related to credit losses for off-balance sheet instruments
of
other liabilities.
At June 30, 2022 and December 31, 2021, the following financial instruments were outstanding whose contract amounts represent credit risk:
(In Thousands) | June 30, 2022 | December 31, 2021 | ||||||
Unfunded commitments under lines of credit: | ||||||||
Home equity loans | $ | 36,193 | $ | 17,774 | ||||
Commercial real estate, construction, and land development | 29,012 | 20,609 | ||||||
Commercial and industrial | 115,107 | 100,440 | ||||||
Other | 8,797 | 6,244 | ||||||
Total | $ | 189,109 | $ | 145,067 | ||||
Commitments to extend credit are agreements to lend to a customer as long as there is no violation of any condition established in the contract. Since many of the commitments are expected to expire without being drawn upon, the total commitment amounts do not necessarily represent future cash requirements. Commitments generally have fixed expiration dates or other termination clauses and may require payment of a fee. The Company evaluates each customer’s credit worthiness on abasis. The amount of collateral obtained, if deemed necessary by the Company upon extension of credit, is based on management’s credit evaluation. Collateral held varies but may include personal or commercial real estate, accounts receivable, inventory, and equipment.
case-by-case
1 2 . | EARNINGS PER SHARE |
The following table sets forth the composition of earnings per share:
(In Thousands, except share and per share data) | Three Months Ended June 30, | Six Months Ended June 30, | ||||||||||||||
2022 | 2021 | 2022 | 2021 | |||||||||||||
Net income | $ | 1,606 | $ | 1,173 | $ | 3,130 | $ | 2,298 | ||||||||
Basic weighted average common shares outstanding | 9,836,984 | 5,691,686 | 9,831,739 | 5,691,686 | ||||||||||||
Net effect of dilutive stock options and warrants | 76,493 | — | 152,003 | — | ||||||||||||
Diluted weighted average common shares outstanding | 9,913,477 | 5,691,686 | 9,983,742 | 5,691,686 | ||||||||||||
Net income per common share: | ||||||||||||||||
Basic | $ | 0.16 | $ | 0.21 | $ | 0.32 | $ | 0.40 | ||||||||
Diluted | $ | 0.16 | $ | 0.21 | $ | 0.31 | $ | 0.40 | ||||||||
F-38
LINKBANCORP, Inc. and Subsidiaries
Notes to the Consolidated Financial Statements (Unaudited)
[In Thousands, Except Share Data]
The
following is a summary of securities that could potentially dilute basic earnings per common share in future periods that were included in the computation of diluted earnings per common share for the three and six months ended June 30, 2022. There were
dilutive securities outstanding during the first six months of 2021. For the three and six months ended June 30, 2022 and 2021, the Company had
securities that were excluded from the calculation of diluted weighted average common shares because their inclusion would have been anti-dilutive.
Share-based compensation awards | 195,700 | |||
Warrants | 1,537,484 | |||
Total dilutive securities | 1,733,184 | |||
13. | SUBSEQUENT EVENT |
During July 2022, to accommodate growth, the Company took occupancy of an office lease for a new corporate headquarters, located in Camp Hill, Pennsylvania. The office space consists of approximately 24,000 square feet, and the lease expires on June 30, 2032, with two additional five year renewal options.
F-39

Report of Independent Registered Public Accounting Firm
To the Shareholders and
the Board of Directors of LINKBANCORP, Inc.
Opinion on the Financial Statements
We have audited the accompanying consolidated balance sheet of LINKBANCORP, Inc. and subsidiaries (the “Company”) as of December 31, 2021; the related consolidated statements of operations, comprehensive income (loss), shareholders’ equity, and cash flows for the year then ended; and the related notes to the consolidated financial statements (collectively, the financial statements). In our opinion, the financial statements present fairly, in all material respects, the financial position of the Company as of December 31, 2021, and the results of its operations and its cash flows for the year then ended, in conformity with accounting principles generally accepted in the United States of America.
Basis for Opinion
These financial statements are the responsibility of the Company’s management. Our responsibility is to express an opinion on the Company’s financial statements based on our audits. We are a public accounting firm registered with the Public Company Accounting Oversight Board (United States) (PCAOB) and are required to be independent, with respect to the Company, in accordance with U.S. federal securities laws and the applicable rules and regulations of the Securities and Exchange Commission and the PCAOB.
We conducted our audits in accordance with the standards of the PCAOB. Those standards require that we plan and perform the audit to obtain reasonable assurance about whether the financial statements are free of material misstatement, whether due to error or fraud. The Company is not required to have, nor were we engaged to perform, an audit of its internal control over financial reporting. As part of our audits, we are required to obtain an understanding of internal control over financial reporting but not for the purpose of expressing an opinion on the effectiveness of the Company’s internal control over financial reporting. Accordingly, we express no such opinion.
Our audits included performing procedures to assess the risks of material misstatement of the financial statements, whether due to error or fraud, and performing procedures that respond to those risks. Such procedures included examining, on a test basis, evidence regarding the amounts and disclosures in the financial statements. Our audits also included evaluating the accounting principles used and significant estimates made by management, as well as evaluating the overall presentation of the financial statements. We believe that our audits provide a reasonable basis for our opinion.
Critical Audit Matters
The critical audit matters communicated below are matters arising from the current period audit of the financial statements that were communicated or required to be communicated to the audit committee and that: (1) relate to accounts or disclosures that are material to the financial statements; and (2) involved our especially challenging, subjective, or complex judgments. The communication of critical audit matters does not alter, in any way, our opinion on the financial statements, taken as a whole, and we are not, by communicating the critical audit matters below, providing separate opinions on the critical audit matters or on the accounts or disclosures to which they relate.
F-40
Allowance for Loan Losses (ALL)
Description of the Matter
The Company’s loan portfolio totaled $715 million as of December 31, 2021, and the associated ALL was $3.2 million. As discussed in Notes 1 and 6 to the consolidated financial statements, determining the amount of the ALL requires significant judgment about the collectability of loans, which includes an assessment of quantitative factors such as historical loss experience within each risk category of loans and testing of certain commercial loans for impairment. Management applies additional qualitative adjustments to reflect the inherent losses that exist in the loan portfolio at the balance sheet date that are not reflected in the historical loss experience. Qualitative adjustments are made based upon changes in lending policies and practices, economic conditions, changes in the loan portfolio mix, trends in loan delinquencies and classified loans, collateral values, and concentrations of credit risk for the commercial loan portfolios.
We identified these qualitative adjustments within the ALL as critical audit matters because they involve a high degree of subjectivity. In turn, auditing management’s judgments regarding the qualitative factors applied in the ALL calculation involved a high degree of subjectivity.
Allowance for Loan Losses (ALL) – Qualitative Factors (Continued)
How We Addressed the Matter in Our Audit
We gained an understanding of the Company’s process for establishing the ALL, including the qualitative adjustments made to the ALL. We evaluated the design and tested the operating effectiveness of controls over the Company’s ALL process, which included, among others, management’s review and approval controls designed to assess the need and level of qualitative adjustments to the ALL, as well as the reliability of the data utilized to support management’s assessment.
To test the qualitative adjustments, we evaluated the appropriateness of management’s methodology and assessed whether all relevant risks were reflected in the ALL and the need to consider qualitative adjustments, including the potential effect of
COVID-19
on the adjustments.Regarding the measurement of the qualitative adjustments, we evaluated the completeness, accuracy, and relevance of the data and inputs utilized in management’s estimate. For example, we compared the inputs and data to the Company’s historical loan performance data, third-party macroeconomic data, and peer bank data and considered the existence of new or contrary information. We also compared the ALL to a range of historical losses to evaluate the ALL, including the reasonableness of qualitative adjustments. Furthermore, we analyzed the changes in the components of the qualitative reserves relative to changes in external market factors, the Company’s loan portfolio, and asset quality trends, which included the evaluation of management’s ability to capture and assess relevant data from both external sources and internal reports on loan customers affected by the
COVID-19
pandemic and the supporting documentation for substantiating revisions to qualitative factors.We also utilized internal credit review specialists with knowledge to evaluate the appropriateness of management’s risk-rating processes, to ensure that the risk ratings applied to the commercial loan portfolio were reasonable.
Accounting for Acquisitions
Description of the Matter
During 2021, the Company completed the reverse acquisition of GNB Financial Services, Inc. (GNBF) for net consideration of $71.5 million, as disclosed in Note 2 to the consolidated financial statements. The transaction was accounted for by applying the acquisition method.
F-41
Auditing the Company’s accounting for the reverse acquisition was complex due to the significant estimation required by management to determine the fair value of the loans acquired and intangible assets, which includes core deposit intangibles, of $9.1 million and $1.2 million, respectively. The Company determined the fair value of the acquired loans by estimating the principal and interest cash flows expected to be collected on the loans and discounting those cash flows at a market rate of interest. Management considered a number of factors in evaluating the acquisition-date fair value, including the remaining life of the acquired loans, delinquency status, estimated prepayments, payment options and other loan features, internal risk grade, estimated value of the underlying collateral, and interest rate environment. The Company determined the fair value of the core deposit intangibles by using a discounted cash flow model based on various factors, including discount rate, attrition rate, interest rate, cost of alternative funds, and net maintenance costs. The significant estimation was primarily due to the judgement involved in determining the discount rate used to discount the expected cash flows for acquired loans and core deposit intangibles, along with other factors described above, to establish the acquisition-date fair value of the loans and core deposit intangibles. These factors are forward-looking and could be affected by future economic and market conditions.
How We Addressed the Matter in Our Audit
We obtained an understanding, evaluated the design, and tested the operating effectiveness of controls over the Company’s accounting for the acquisition. Our tests included testing controls over the completeness and accuracy of the data and the estimation process supporting the fair value of loans acquired and core deposit intangibles. We also tested management’s review of factors used in the valuation models.
To test the estimated fair value of the loans acquired and intangible assets, which include core deposit intangibles, we performed audit procedures that included, among others, evaluating the Company’s valuation methodology, evaluating the factors used by the Company’s valuation specialist, and evaluating the completeness and accuracy of the underlying data supporting the factors and estimates. For example, when evaluating the discount rate and other factors noted above, we compared the factors to current industry, market, and economic information, in addition to factors used in historical acquisitions.
We have served as the Company’s auditor since 2020.
 |
Cranberry Township, Pennsylvania |
March 31, 2022 |
F-42
Report of Independent Registered Public Accounting Firm
To the Shareholders and the Board of Directors
GNB Financial Services, Inc.
Gratz, Pennsylvania
Opinion on the Consolidated Financial Statements
We have audited the accompanying consolidated balance sheet of GNB Financial Services, Inc. (the “Company”), as of December 31, 2020 and the related consolidated statements of income, comprehensive income, stockholders’ equity, and cash flows for the year ended December 31, 2020 and the related notes (collectively referred to as the “consolidated financial statements”). In our opinion, the consolidated financial statements referred to above present fairly, in all material respects, the financial position of the Company at December 31, 2020, and the consolidated results of its income and its cash flows for the year ended December 31, 2020, in conformity with accounting principles generally accepted in the United States of America.
Basis for Opinion
These consolidated financial statements are the responsibility of the Company’s management. Our responsibility is to express an opinion on the Company’s consolidated financial statements based on our audit. We are a public accounting firm registered with the Public Company Accounting Oversight Board (United States) (“PCAOB”) and are required to be independent with respect to the Company in accordance with the U.S. federal securities laws and the applicable rules and regulations of the Securities and Exchange Commission and the PCAOB.
We conducted our audit in accordance with the standards of the PCAOB and in accordance with auditing standards generally accepted in the United States of America. Those standards require that we plan and perform the audit to obtain reasonable assurance about whether the consolidated financial statements are free of material misstatement, whether due to error or fraud.
Our audit included performing procedures to assess the risks of material misstatement of the consolidated financial statements, whether due to error or fraud, and performing procedures that respond to those risks. Such procedures included examining, on a test basis, evidence regarding the amounts and disclosures in the consolidated financial statements. Our audit also included evaluating the accounting principles used and significant estimates made by management, as well as evaluating the overall presentation of the consolidated financial statements. We believe that our audits provide a reasonable basis for our opinion.
/s/ HACKER, JOHNSON & SMITH PA |
We have served as the Company’s auditor since 2021. |
Tampa, Florida |
May 7, 2021 |
PCAOB ID: 400 |
F-43
LINKBANCORP, Inc. and Subsidiaries
Consolidated Balance Sheets
(In Thousands, except share and per share data) | December 31, 2021 | December 31, 2020 | ||||||
ASSETS | ||||||||
Noninterest-bearing cash equivalents | $ | 8,620 | $ | 5,709 | ||||
Interest-bearing deposits with other institutions | 13,970 | 27,453 | ||||||
Cash and cash equivalents | 22,590 | 33,162 | ||||||
Certificates of deposit with other banks | 12,828 | 17,051 | ||||||
Securities available for sale, at fair value | 103,783 | 125,447 | ||||||
Loans held for sale | 3,860 | 1,015 | ||||||
Loans receivable, net of allowance for loan losses of $3,152 at December 31, 2021, and $2,789 at December 31, 2020 | 711,664 | 233,795 | ||||||
Investments in restricted bank stock | 2,685 | 2,268 | ||||||
Premises and equipment, net | 5,289 | 3,428 | ||||||
Right-of-Use | 4,680 | 370 | ||||||
Bank-owned life insurance | 18,787 | 8,941 | ||||||
Goodwill and other intangible assets | 37,152 | 2,509 | ||||||
Deferred tax asset | 4,038 | — | ||||||
Accrued interest receivable and other assets | 5,407 | 1,558 | ||||||
TOTAL ASSETS | $ | 932,763 | $ | 429,544 | ||||
LIABILITIES | ||||||||
Deposits: | ||||||||
Demand, noninterest bearing | $ | 129,243 | $ | 66,573 | ||||
Interest bearing | 642,422 | 308,551 | ||||||
Total deposits | 771,665 | 375,124 | ||||||
Other Borrowings | 19,814 | 1,120 | ||||||
Subordinated Debt | 20,696 | — | ||||||
Operating Lease Liabilities | 4,680 | 370 | ||||||
Deferred tax liability | — | 22 | ||||||
Accrued interest payable and other liabilities | 6,285 | 2,234 | ||||||
TOTAL LIABILITIES | 823,140 | 378,870 | ||||||
COMMITMENTS AND CONTINGENT LIABILITIES (Notes 1, 8, and 18) | ||||||||
SHAREHOLDERS’ EQUITY | ||||||||
Preferred stock (At December 31, 2021: no par value; 5,000,000 shares authorized; no shares issued and outstanding. At December 31, 2020: no shares authorized) | — | — | ||||||
Common stock (At December 31, 2021: $0.01 par value; 25,000,000 shares authorized; 9,826,435 shares issued and outstanding. At December 31, 2020: $0.01 par value; 14,612,800 shares authorized; 5,715,950 shares issued and 5,691,686 shares outstanding) | 99 | 57 | ||||||
Surplus | 82,910 | 21,604 | ||||||
Retained earnings | 24,836 | 26,009 | ||||||
Accumulated other comprehensive income | 1,778 | 3,192 | ||||||
Treasury stock (0 and 24,265 shares at December 31, 2021 and December 31, 2020, respectively | — | (188 | ) | |||||
TOTAL SHAREHOLDERS’ EQUITY | 109,623 | 50,674 | ||||||
TOTAL LIABILITIES AND SHAREHOLDERS’ EQUITY | $ | 932,763 | $ | 429,544 | ||||
See accompanying notes to the unaudited consolidated financial
statements.
F-
44
LINKBANCORP, Inc. and Subsidiaries
Consolidated Statements of Operations
(In Thousands, except share and per share data) | Year Ended December 31, | |||||||
2021 | 2020 | |||||||
INTEREST AND DIVIDEND INCOME | ||||||||
Loans receivable, including fees | $ | 15,924 | $ | 11,494 | ||||
Investment securities and certificates of deposit: | ||||||||
Taxable | 873 | $ | 1,409 | |||||
Exempt from federal income tax | 1,252 | $ | 1,221 | |||||
Other | 447 | 167 | ||||||
Total interest and dividend income | 18,496 | 14,291 | ||||||
INTEREST EXPENSE | ||||||||
Deposits | 2,091 | 2,658 | ||||||
Other Borrowings | 50 | 59 | ||||||
Subordinated Debt | 249 | — | ||||||
Total interest expense | 2,390 | 2,717 | ||||||
NET INTEREST INCOME BEFORE PROVISION FOR LOAN LOSSES | 16,106 | 11,574 | ||||||
Provision for loan losses | 648 | 184 | ||||||
NET INTEREST INCOME AFTER PROVISION FOR LOAN LOSSES | 15,458 | 11,390 | ||||||
NONINTEREST INCOME | ||||||||
Service charges on deposit accounts | 733 | 743 | ||||||
Bank-owned life insurance | 253 | 186 | ||||||
Net realized gains on the sales of debt securities, available for sale | 74 | 110 | ||||||
Gain on sale of secondary market mortgage loans | 316 | 358 | ||||||
Other | 763 | 357 | ||||||
Total noninterest income | 2,139 | 1,754 | ||||||
NONINTEREST EXPENSE | ||||||||
Salaries and employee benefits | 6,999 | 4,544 | ||||||
Occupancy | 913 | 447 | ||||||
Equipment and data processing | 1,340 | 1,188 | ||||||
Professional fees | 685 | 538 | ||||||
FDIC insurance | 231 | 73 | ||||||
Bank Shares Tax | 434 | 294 | ||||||
Merger Related Expenses | 4,584 | — | ||||||
Other | 2,311 | 1,222 | ||||||
Total noninterest expense | 17,497 | 8,306 | ||||||
Income before income tax (benefit) expense | 100 | 4,838 | ||||||
Income tax (benefit) expense | (189 | ) | 645 | |||||
NET INCOME | $ | 289 | $ | 4,193 | ||||
EARNINGS PER SHARE, BASIC | $ | 0.04 | $ | 0.74 | ||||
EARNINGS PER SHARE, DILUTED | $ | 0.04 | $ | 0.74 | ||||
WEIGHTED-AVERAGE COMMON SHARES OUTSTANDING, | ||||||||
BASIC | 6,879,658 | 5,691,686 | ||||||
DILUTED | 7,250,463 | 5,691,686 | ||||||
See accompanying notes to the unaudited consolidated financial
statements.
F-
45
LINKBANCORP, Inc. and Subsidiaries
Consolidated Statements of Comprehensive Income (Loss)
Year Ended December 31, | ||||||||
(In Thousands) | 2021 | 2020 | ||||||
Net income | $ | 289 | $ | 4,193 | ||||
Components of other comprehensive income (loss): | ||||||||
Unrealized holding gain (loss) on available-for-sale | (1,716 | ) | 2,904 | |||||
Tax effect | 360 | (609 | ) | |||||
Net of tax amount | (1,356 | ) | 2,295 | |||||
Reclassification adjustment for debt securities gains realized in net income | (74 | ) | (110 | ) | ||||
Tax effect | 16 | 23 | ||||||
Net of tax amount | (58 | ) | (87 | ) | ||||
Total other comprehensive income (loss) | (1,414 | ) | 2,208 | |||||
Total comprehensive income (loss) | $ | (1,125 | ) | $ | 6,401 | |||
See accompanying notes to the unaudited consolidated financial
statements.
F-
46
LINKBANCORP, Inc. and Subsidiaries
Consolidated Statements of Shareholders’ Equity
(In Thousands, except share data) | Common Stock Shares | Common Stock Amount | Surplus | Retained Earnings | Accumulated Other Comprehensive Income (Loss) | Treasury Stock | Total | |||||||||||||||||||||||||
Balance, December 31, 2020 | * | 5,715,950 | $ | 57 | $ | 21,604 | $ | 26,009 | $ | 3,192 | $ | (188 | ) | $ | 50,674 | |||||||||||||||||
Net income | — | — | — | 289 | — | — | 289 | |||||||||||||||||||||||||
Dividends declared ($0.205 per share) | — | — | — | (1,462 | ) | — | — | (1,462 | ) | |||||||||||||||||||||||
Impact of merger with GNB Financial Services, Inc. | 4,098,485 | 41 | 61,167 | — | — | 188 | 61,396 | |||||||||||||||||||||||||
Exercise of stock options | 12,000 | 1 | 119 | — | — | — | 120 | |||||||||||||||||||||||||
Stock option expense | — | — | 20 | — | — | — | 20 | |||||||||||||||||||||||||
Other comprehensive loss | — | — | — | — | (1,414 | ) | — | (1,414 | ) | |||||||||||||||||||||||
Balance, December 31, 2021 | 9,826,435 | $ | 99 | $ | 82,910 | $ | 24,836 | $ | 1,778 | $ | — | $ | 109,623 | |||||||||||||||||||
(In Thousands, except share data) | Common Stock Shares | Common Stock Amount | Surplus | Retained Earnings | Accumulated Other Comprehensive Income (Loss) | Treasury Stock | Total | |||||||||||||||||||||||||
Balance, December 31, 2019 | * | 5,715,950 | $ | 57 | $ | 21,604 | $ | 23,249 | $ | 984 | $ | (188 | ) | $ | 45,706 | |||||||||||||||||
Net income | — | — | — | 4,193 | — | — | 4,193 | |||||||||||||||||||||||||
Dividends declared ($0.25 per share) | — | — | — | (1,433 | ) | — | — | (1,433 | ) | |||||||||||||||||||||||
Other comprehensive income | — | — | — | — | 2,208 | — | 2,208 | |||||||||||||||||||||||||
Balance, December 31, 2020 | 5,715,950 | $ | 57 | $ | 21,604 | $ | 26,009 | $ | 3,192 | $ | (188 | ) | $ | 50,674 | ||||||||||||||||||
| * | Common Stock Shares, Common Stock Amount, Surplus, and Dividends per share amount have been retrospectively adjusted to reflect the effect of the recapitalization due to the Merger, which has been accounted for as a reverse acquisition. |
See accompanying notes to the unaudited consolidated financial
statements.
F-
47
LINKBANCORP, Inc. and Subsidiaries
Consolidated Statement of Cash Flows
For the Twelve Months Ended December 31, | ||||||||
(In Thousands) | 2021 | 2020 | ||||||
OPERATING ACTIVITIES | ||||||||
Net income | $ | 289 | $ | 4,193 | ||||
Adjustments to reconcile net income to net cash used for operating activities: | ||||||||
Provision for loan losses | 648 | 184 | ||||||
Depreciation | 355 | 244 | ||||||
Amortization of intangible assets | 125 | 65 | ||||||
Amortization of premiums and discounts | 1,379 | 954 | ||||||
Origination of loans to be sold | (12,079 | ) | (31,441 | ) | ||||
Proceeds from loan sales | 13,410 | 30,784 | ||||||
Gain on sale of loans | (316 | ) | (358 | ) | ||||
Share-based and deferred compensation | 292 | — | ||||||
Capitalized mortgage servicing rights | (169 | ) | (275 | ) | ||||
Bank-owned life insurance income | (253 | ) | (186 | ) | ||||
Gain on sale of debt securities, available for sale | (74 | ) | (110 | ) | ||||
Change in accrued interest receivable and other assets | (165 | ) | (544 | ) | ||||
Change in accrued interest payable and other liabilities | 1,332 | (382 | ) | |||||
Net cash provided by operating activities | 4,774 | 3,128 | ||||||
INVESTING ACTIVITIES | ||||||||
Investment securities available for sale: | ||||||||
Proceeds from sales | 11,371 | 5,706 | ||||||
Proceeds from calls and maturities | 2,900 | 12,250 | ||||||
Proceeds from principal repayments | 21,592 | 14,593 | ||||||
Purchases | (14,192 | ) | (71,130 | ) | ||||
Purchase of certificates of deposit with other banks | (249 | ) | (996 | ) | ||||
Proceeds from redemptions of certificates of deposit with other banks | 4,472 | 2,739 | ||||||
Purchase of restricted investment in bank stocks | (536 | ) | (1,129 | ) | ||||
Redemption of restricted investment in bank stocks | 1,122 | 153 | ||||||
(Increase) decrease in loans, net | (66,472 | ) | 1,104 | |||||
Purchase of bank-owned life insurance | (5,000 | ) | (2,000 | ) | ||||
Proceeds from death benefit under bank-owned life insurance | 191 | — | ||||||
Proceeds from disposal of premises and equipment | 131 | — | ||||||
Purchase of premises and equipment | (260 | ) | (109 | ) | ||||
Net cash acquired through merger and acquisition | 39,885 | — | ||||||
Net cash used for investing activities | (5,045 | ) | (38,819 | ) | ||||
FINANCING ACTIVITIES | ||||||||
Increase in deposits, net | 5,381 | 44,217 | ||||||
Repayments of long-term borrowings | (14,340 | ) | (1,639 | ) | ||||
Issuance of shares from exercise of stock options | 120 | — | ||||||
Dividends paid | (1,462 | ) | (1,433 | ) | ||||
Net cash (used in) provided by financing activities | (10,301 | ) | 41,145 | |||||
(Decrease) increase in cash and cash equivalents | (10,572 | ) | 5,454 | |||||
CASH AND CASH EQUIVALENTS AT BEGINNING OF PERIOD | 33,162 | 27,708 | ||||||
CASH AND CASH EQUIVALENTS AT END OF PERIOD | $ | 22,590 | $ | 33,162 | ||||
See accompanying notes to the unaudited consolidated financial
statements.
F-
48
LINKBANCORP, Inc. and Subsidiaries
Consolidated Statement of Cash Flows
For the Twelve Months Ended December 31, | ||||||||
2021 | 2020 | |||||||
SUPPLEMENTAL CASH FLOW DISCLOSURES | ||||||||
Cash paid during the period for: | ||||||||
Interest | $ | 2,520 | $ | 2,831 | ||||
Income taxes | $ | 560 | $ | 745 | �� | |||
MERGER AND ACQUISITION CASH FLOW DISCLOSURES | ||||||||
Non-cash assets acquired: | ||||||||
Securities available for sale | 3,111 | — | ||||||
Loans | 415,905 | — | ||||||
Investments in restricted bank stock | 1,039 | — | ||||||
Premises and equipment | 2,087 | — | ||||||
Right-of-Use | 4,544 | — | ||||||
Bank-owned life insurance | 4,784 | — | ||||||
Goodwill | 33,508 | — | ||||||
Intangible assets | 1,246 | — | ||||||
Deferred tax assets | 3,675 | — | ||||||
Accrued interest receivable and other assets | 3,295 | — | ||||||
Liabilities assumed: | — | |||||||
Deposits | 391,160 | — | ||||||
Other borrowings | 33,034 | — | ||||||
Subordinated debt | 20,740 | — | ||||||
Operating lease liabilities | 4,544 | — | ||||||
Accrued interest payable and other liabilities | 2,026 | — | ||||||
Net non-cash assets acquired | 61,396 | — | ||||||
Cash and cash equivalents acquired | $ | 49,962 | $ | — | ||||
See accompanying notes to the unaudited consolidated financial
statements.
F-
49
1. | SUMMARY OF SIGNIFICANT ACCOUNTING POLICIES |
A summary of significant accounting and reporting policies applied in the presentation of the accompanying consolidated financial statements follows:
Nature of Operations
LINKBANCORP, Inc. (the “Company”) was incorporated on April 6, 2018, under the laws of the Commonwealth of Pennsylvania. The Company was formed with the intent of becoming a bank holding company through acquisition of a bank.
On September 17, 2018, the Pennsylvania Department of Banking and Securities (the “PADOBS”) approved the acquisition of 100 percent of the shares of Stonebridge Bank, subject to recapitalization of the bank and continued compliance with capital ratios outlined in Note 10. On October 5, 2018, LINKBANCORP, Inc. purchased 100 percent of the outstanding shares of Stonebridge Bank, from its former parent company Stonebridge Financial Corp. under section 363 of the Bankruptcy Code. LINKBANCORP subsequently renamed the bank LINKBANK.
On December 10, 2020, the Company and its wholly owned subsidiary, LINKBANK, and GNB Financial Services, Inc. (“GNBF”), and its wholly owned subsidiary, The Gratz Bank (the “Bank”) entered into an Agreement and Plan of Merger (the “Merger Agreement”) pursuant to which GNBF merged with and into the Company, with the Company as the surviving corporation. LINKBANK merged with and into The Gratz Bank, with The Gratz Bank as the surviving institution. The merger was consummated effective September 18, 2021.
The Bank is a full-service commercial bank providing personal and business lending and deposit services. The Bank’s operations are conducted from its ten Solution Centers located in Dauphin, Chester, Cumberland, Lancaster, Northumberland, and Schuylkill Counties within Pennsylvania. The Company’s corporate office resides in Camp Hill, Pennsylvania. As a state chartered,
non-Federal
Reserve member bank, the Bank is subject to regulation and supervision by the PADOBS and the Federal Deposit Insurance Corporation (the “FDIC”). The Company is regulated by the Federal Reserve Bank of Philadelphia. The Bank’s deposits are insured up to the applicable limits by the FDIC.Basis of Presentation
The merger of GNBF with and into the Company was accounted for as a reverse acquisition using the acquisition method of accounting, in accordance with the provisions of FASB ASC 805 Business Combinations. As such, GNBF was the accounting acquirer and LINKBANCORP was the accounting acquiree. Factors considered within this guidance included, but were not limited to the following:
| • | the relative voting interests of GNB shareholders and LINK shareholders in the resulting company after the merger was completed; |
| • | the composition of the board of directors of the Company after the merger was completed; |
| • | the composition of executive and senior management of the resulting company after the merger was completed; |
| • | the terms of the exchange of equity securities in the merger; and |
| • | the relative size of GNB and LINK at the time of the merger. |
Accordingly, GNBF’s historical financial statements are the historical financial statements of the combined company for all periods prior to September 18, 2021 (the “Merger Date”).
The Company’s results of operations for 2021 include the results of operations of the combined company on and after the Merger Date. Results for periods before the Merger Date reflect only those consolidated results
F-
50
of GNBF and do not include the results of operations of LINKBANCORP, Inc. The number of shares issued and outstanding, earnings per share, additional
paid-in
capital, dividends paid and all references to share quantities of the Company have been retrospectively adjusted to reflect the equivalent number of shares issued to holders of GNBF common stock in the Merger. The assets and liabilities of LINKBANCORP, Inc. as of the Merger Date have been recorded at their estimated fair value and added to those of GNBF. See Note 2. Merger for further information.The accompanying consolidated financial statements include the accounts of the Company and the Bank. All significant intercompany accounts and transactions have been eliminated in consolidation. The accounting and reporting practices of the Company conform to accounting principles generally accepted in the United States of America (GAAP) and to general practices within the banking industry. The following summarizes the more significant of these policies and practices.
Reclassification of Prior Period Financial Statements
Certain previously reported items have been reclassified to conform to the current year’s classifications. Certain components of equity have been retrospectively adjusted to reflect the effect of the Merger, which has been accounted for as a reverse acquisition. Common Stock Shares and Amount, Surplus, and Dividends per share amount have been adjusted to reflect the the merger exchange ratio.
Use of Estimates
The preparation of financial statements in conformity with accounting principles generally accepted in the United States of America requires management to make estimates and assumptions that affect the reported amounts of assets and liabilities and disclosure of contingent assets and liabilities at the date of the financial statements and the reported amounts of revenues and expenses during the reporting period. Actual results could differ from those estimates. Material estimates that are particularly susceptible to significant change in the near term relate to the allowance for loan losses and the valuation of deferred tax assets.
Acquisition Method of Accounting
The Company accounts for acquisitions using the acquisition method of accounting. The acquisition method of accounting requires the Company to estimate the fair value of the tangible assets and identifiable intangible assets acquired and liabilities assumed. The estimated fair values are based on available information and current economic conditions at the date of acquisition. Fair value may be obtained from independent appraisers, discounted cash flow present value techniques, management valuation models, quoted prices on national markets or quoted market prices from brokers. These fair value estimates will affect future earnings through the disposition or amortization of the underlying assets and liabilities. Accounting for business combination under GAAP acquisition method prohibits “carrying over” valuation allowances, such as the allowance for loan losses. Uncertainties relating to the expected future cash flows are reflected in the fair value measurement of the acquired loans and reflected in the purchase price. The Company will establish loan loss allowances for the acquired loans in periods after the acquisition, but only for losses incurred on these loans due to credit deterioration after acquisition.
For business acquisitions, whereby the Company acquires loans that have shown evidence of credit deterioration since origination, the Company will classify these loans as purchased credit-impaired (“PCI”) loans. The Company will determine which loans will be classified as PCI loans based on borrower payment history, past due status, loan credit grading, value of underlying collateral and other factors that affect the collectability of contractual cash flows. Under GAAP, purchasers are permitted to individually evaluate or collectively aggregate PCI loans into pools. PCI loans acquired in the same fiscal quarter may be assembled into one or more pools with common risk characteristics. Once pooled, a single composite interest rate is used to determine aggregate expected cash flows for each respective pool. PCI loans are recorded on the acquisition date at fair value. The Company estimates the amount and timing of expected cash flows for
F-
51
each individually analyzed loan. Estimated cash flows in excess of the amount paid is recorded as interest income over the remaining life of the loan.
On a quarterly basis, the Company will update the amount of loan principal and interest cash flows expected to be collected, incorporating assumptions regarding default rates, loss severities, the amounts and timing of prepayments and other factors that are reflective of current market conditions. Probable decreases in expected loan principal cash flows trigger the recognition of impairment, which is then measured as the present value of the expected principal loss plus any related foregone interest cash flows discounted at the loan’s effective interest rate. Impairments that occur after the acquisition date are recognized through the allowance for loan losses. Probable and significant increases in expected cash flows would first reverse any previously recorded allowance for loan losses; any remaining increases are recognized prospectively as interest income. The impacts of (i) prepayments, (ii) changes in variable interest rates, and (iii) any other changes in the timing of expected cash flows are recognized prospectively as adjustments to interest income. Disposals of loans, which may include sales of loans, receipt of payments in full by the borrower, or foreclosure, result in removal of the loan from the PCI portfolio.
Goodwill and Other Intangible Assets
Goodwill represents the excess of the acquisition cost over the fair value of the net assets acquired in the acquisition. GAAP requires goodwill to be tested for impairment on an annual basis and between annual tests in certain circumstances and written down when impaired. There can be no assurance that future goodwill impairment tests will not result in a charge to income. Core deposit intangible assets (“CDI”) are initially measured at fair value and then amortized over the expected life on an accelerated basis using projected decay rates of the underlying core deposits. The expected life is generally ten years. The principal factors considered when valuing the CDI consist of the following: (1) the rate and maturity structure of the interest-bearing liabilities, (2) estimated retention rates for each deposit liability category, (3) the current interest rate environment, and (4) estimated noninterest income potential of the acquired relationship. The CDI is evaluated periodically for impairment.
Goodwill and other intangible assets are reviewed for impairment annually as of December 31 and between annual tests when events and circumstances indicate that impairment may have occurred. If there is a goodwill impairment charge, it will be the amount by which the reporting unit’s carrying amount exceeds its fair value; however, the loss recognized should not exceed the total amount of goodwill allocated to that reporting unit. The same
one-step
impairment test is applied to goodwill at all reporting units.The determination of the fair value of the Company incorporates assumptions that marketplace participants would use in their estimates of fair value of the Company in a change of control transaction, as prescribed by ASC Topic 820.
To arrive at a conclusion of fair value, we utilize both the Income and Market Approach and then apply weighting factors to each result. Weighting factors represent our best business judgment of the weightings a market participant would utilize in arriving at a fair value for the Company. In performing our analyses, we also made numerous assumptions with respect to industry performance, business, economic and market conditions, and various other matters, many of which cannot be predicted and are beyond our control. With respect to financial projections, projections reflect the best currently available estimates and judgments as to the expected future financial performance of the Company.
Cash and Cash Equivalents
For purposes of reporting cash flows, cash and cash equivalents include cash on hand and amounts due from banks. Generally, federal funds are purchased and sold for
one-day
periods. Short-term investments include interest bearing-deposits with banks with an original maturity of less than 90 days.F-
52
Investment Securities
Available for sale – Debt securities that will be held for indefinite periods of time, including securities that may be sold in response to changes in market interest or prepayment rates, needs for liquidity, and changes in the availability of and in the yield of alternative investments, are classified as available for sale. These assets are carried at fair value. Fair values of securities available for sale are determined by using Level 2 fair value measures calculated through the use of matrix pricing. Matrix pricing is a common mathematical technique that does not rely exclusively on quoted market prices for specific securities but rather utilizes the security’s relationship to other benchmark quoted prices in determining fair value. The Company uses independent service providers to calculate our Level 2 fair value measures. Unrealized gains and losses are excluded from operations and are reported net of tax as a separate component of other comprehensive income until realized. Realized gains and losses on the sale of investment securities are reported in the consolidated statements of income and determined using the adjusted cost of the specific security sold on the trade date. Purchase premiums and discounts are recognized in interest income using the interest method over the terms of the securities.
Investment securities are evaluated on at least a quarterly basis, and more frequently when market conditions warrant such an evaluation, to determine whether a decline in their value is other-than-temporary. To determine whether a loss in value is other-than-temporary, management utilizes criteria such as the reasons underlying the decline, the magnitude and duration of the decline, the intent to hold the security and the likelihood of the Company not being required to sell the security prior to an anticipated recovery in the fair value. The term “other-than-temporary” is not intended to indicate that the decline is permanent but indicates that the prospects for a near-term recovery of value is not necessarily favorable, or that there is a lack of evidence to support a realizable value equal to or greater than the carrying value of the investment. Once a decline in value is determined to be other-than-temporary, the portion of the decline related to credit impairment is charged to earnings, and any other-than-temporary impairment related to other factors is recognized in other comprehensive income.
Loans Receivable
Loans receivable that management has the intent and ability to hold for the foreseeable future or until maturity or payoff are stated at their outstanding unpaid principal balances, net of an allowance for loan losses and any deferred fees or costs. Interest income is accrued on the unpaid principal balance. Loan origination fees, net of certain direct origination costs, are deferred and recognized as an adjustment of the yield (interest income) of the related loans. The Bank is generally amortizing these amounts over the contractual life of the loan. Premiums and discounts on purchased loans are amortized as adjustments to interest income using the effective yield method.
The loans receivable portfolio is segmented into commercial and consumer loans. Commercial loans consist of the following classes: agriculture, commercial and industrial, commercial real estate, and municipal. Consumer loans consist of the following classes: residential real estate, and other consumer.
The accrual of interest on all portfolio classes, including troubled debt restructurings, is discontinued at the time the loan is more than ninety days delinquent unless the loan is well collateralized and in process of collection. Nonaccrual loans are reviewed for
charge-off
if more than ninety-days past due, except for residential loans and consumer loans. Residential loans are reviewed at 180 days and consumer loans are reviewed at 120 days past due. In all cases, loans are placed on nonaccrual orcharged-off
at an earlier date if collection of principal or interest is considered unlikely.All interest accrued but not collected for loans placed on nonaccrual or
charged-off
is reversed against interest income. The interest on these loans is accounted for on the cash-basis or cost-recovery method, until qualifying for return to accrual. Loans are returned to accrual status when all the principal and interest amounts contractually due are brought current and future payments are reasonably assured. In addition, a loan should be in accordance with the contractual terms for a reasonable period, usually requiring a payment history of six months.F-
53
Loans Held for Sale
Mortgage loans originated and intended for sale in the secondary market are carried at the lower of aggregate cost or fair value, as determined by outstanding commitments from investors. Net unrealized losses, if any, are recorded as a valuation allowance and charged to earnings.
Allowance for Loan Losses
The allowance for loan losses is a valuation allowance for probable incurred credit losses. Loan losses are charged against the allowance when management believes the collectability of a loan balance is confirmed. Subsequent recoveries, if any, are credited to the allowance. There were no material changes in the Bank’s accounting policies or methodology related to the allowance for loan losses during the year ended December 31, 2021.
The allowance for loan losses is evaluated on a quarterly basis by management and is based upon management’s periodic review of the collectability of the loans considering historical experience, the size and composition of the loan portfolio, adverse situations that may affect the borrower’s ability to repay, estimated value of any underlying collateral and prevailing economic conditions. This evaluation is inherently subjective as it requires estimates that are susceptible to significant revision as more information becomes available.
The allowance consists of specific and general components. The specific component relates to loans that are classified as impaired. For such loans, an allowance is established when the discounted cash flows, collateral value or observable market price of the impaired loan is lower than the carrying value of that loan. The general component covers all other loans and is based on historical loss experience adjusted for qualitative factors.
The historical loss component of the allowance is determined by losses recognized by portfolio segment over the preceding sixteen quarters. This is supplemented by the risks for each portfolio segment. Risk factors impacting loans in each of the portfolio segments include broad deterioration of property values, reduced consumer, and business spending as a result of unemployment and reduced credit availability and lack of confidence in the economy. The historical experience is adjusted for the following qualitative factors: (a) the existence and effect of any concentrations of credit and changes in the level of such concentrations; (b) changes in national, regional and local economic conditions that affect the collectability of the loan portfolio; (c) changes in levels or trends in charge-offs and recoveries; (d) changes in the volume and severity of past due loans, nonaccrual loans or loans classified special mention, substandard, doubtful or loss; (e) changes in the nature and volume of the loan portfolio and terms of loans; (f) changes in lending policies and procedures, risk selection and underwriting standards; (g) changes in the experience, ability and depth of lending management and other relevant staff; (h) quality of loan review; (i) the effect of other external factors, trends or uncertainties that could affect management’s estimate of probable losses, such as competition and industry conditions. The Company uses peer data when they have insufficient history to use their own loss data. The peer group is made up of various Bank’s with similar size and geographical location to obtain comparable data.
A loan is considered impaired when, based on current information and events, it is probable that the Company will be unable to collect the scheduled payments of principal or interest when due according to the contractual terms of the loan agreement. Factors considered by management in determining impairment include payment status, collateral value, and the probability of collecting scheduled principal and interest payments when due. Loans that experience insignificant payment delays and payment shortfalls generally are not classified as impaired. Management determines the significance of payment delays and payment shortfalls on abasis, taking into consideration all circumstances surrounding the loan and the borrower, including the length of the delay, the reasons for the delay, the borrower’s prior payment record, and the amount of the shortfall in relation to the principal and interest owed. Impairment is measured on abasis for commercial, commercial real estate, and residential mortgage loan segments by either
case-by-case
loan-by-loan
F-
54
the present value of expected future cash flows discounted at the loan’s effective interest rate, the loan’s obtainable market price, or the fair value of the collateral if the loan is collateral-dependent. Loans for which the terms have been modified resulting in a concession, and for which the borrower is experiencing financial difficulties, are considered troubled debt restructurings (TDRs) and classified as impaired.
Large groups of smaller balance homogeneous loans are collectively evaluated for impairment. Accordingly, the Company does not separately identify individual consumer loans for impairment disclosures.
Purchased Credit Impaired Loans
The Company purchased loans in connection with the Merger. These purchased credit impaired (“PCI”) loans were recorded at the amount paid, such that there is no carryover of the seller’s allowance for loan losses. After acquisition, losses are recognized by an increase in the allowance for loan losses. Over the life of the loan, expected cash flows continue to be estimated. If this subsequent estimate indicated that the present value of expected cash flows is less than the carrying amount, a charge to the allowance for loan loss is made through a provision. If the estimate indicates that the present value of the expected cash flows is greater than the carrying amount, it is recognized as part of future interest income.
Such PCI loans are accounted for individually, and the Company estimates the amount and timing of expected cash flows for each loan. The expected cash flows in excess of the amount paid is recorded as interest income over the remaining life of the loan (accretable yield). The excess of the loan’s contractual principal and interest over expected cash flows is not amortized over the remaining life of the loan (nonaccretable difference).
For loans purchased that did not show evidence of credit deterioration, the difference between the fair value of the loan at the acquisition date and the loan’s face value is being amortized as a yield adjustment over the estimated remaining life of the loan using the effective interest method.
Investment in Restricted Stock, at Cost
The Company holds restricted stock in the Federal Home Loan Bank (“FHLB”) of Pittsburgh and the Atlantic Community Bancshares, Inc. (“ACBB”) which is carried at cost. The Company holds $194 and $170 of ACBB stock at December 31, 2021 and 2020, respectively. The Company holds $2,491 and $2,062 of FHLB stock at December 31, 2021 and 2020, respectively. The FHLB stock is bought from and sold to the FHLB based upon its $100 par value. The stock does not have a readily determinable fair value and as such is classified as restricted stock, carried at cost, and evaluated for impairment as necessary. The stock’s value is determined by the ultimate recoverability of the par value rather than by recognizing temporary declines. The determination of whether the par value will ultimately be recovered is influenced by criteria such as the following: (a) the significance of the decline in net assets of the FHLB as compared to the capital stock amount and the length of time this situation has persisted; (b) commitments by the FHLB to make payments required by law or regulation and the level of such payments in relation to the operating performance; (c) the impact of legislative and regulatory changes on the customer base of the FHLB; and (d) the liquidity position of the FHLB. Management evaluated the stock and concluded that the stock was not impaired for the periods presented herein.
Bank-Owned Life Insurance
The Company invests in bank-owned life insurance (“BOLI”) as a source of funding for employee benefit expenses. BOLI involves the purchasing of life insurance by the Company on a chosen group of employees. The Company is the owner and beneficiary of the policies. This life insurance investment is carried at the cash surrender value of the underlying policies. Income from the increase in cash surrender value of the policies is included in
non-interest
income in the Consolidated Statement of Operations, net of expenses.F-
55
Premises and Equipment
Leasehold improvements and furniture and equipment are stated at cost, less accumulated depreciation. Depreciation and amortization expense is computed using the straight-line method over the estimated useful lives of the assets. Estimated useful lives for furniture and equipment are three to ten years; leasehold improvements are amortized over the shorter of their respective lease term or estimated life of the improvement.
Other Real Estate Owned
Foreclosed assets acquired in settlement of loans are carried at fair value, less estimated costs to sell. Prior to foreclosure, as the value of the underlying loan is written down to fair value of the real estate or other assets to be acquired by a charge to the allowance for loan losses, if necessary. Any subsequent write-downs are charged against operating expenses. Operating expenses of such properties, net of related income and losses on disposition, are included in other expenses and gains and losses are included in other noninterest income or other noninterest expense. As of December 31, 2021 and 2020, the Company had no other real estate owned. As of December 31, 2021, the Company has initiated formal foreclosure proceedings on no consumer residential mortgages, which have not yet been transferred into foreclosed assets.
Transfers of Financial Assets
Transfers of financial assets are accounted for as sales when control of the assets has been surrendered. Control over transferred assets is deemed to be surrendered when (1) the assets have been isolated from the Bank, (2) the transferee obtains the right (free of conditions that constrain it from taking advantage of that right) to pledge or exchange the transferred assets, and (3) the Bank does not maintain effective control over the transferred assets through an agreement to repurchase them before their maturity.
Income Taxes
The income tax accounting guidance results in two components of income tax expense: current and deferred. Current income tax expense reflects taxes to be paid or refunded for the current period by applying the provisions of the enacted tax law to the taxable income or excess of deductions over revenues. The Bank determines deferred income taxes using the liability (or balance sheet) method. Under this method, the net deferred tax asset or liability is based on the tax effects of the differences between the book and tax bases of assets and liabilities, and enacted changes in tax rates and laws are recognized in the period in which they occur. Deferred income tax expense results from changes in deferred tax assets and liabilities between periods. Deferred tax assets are reduced by a valuation allowance if, based on the weight of the evidence available, it is more likely than not that some portion or all of a deferred tax asset will not be realized.
The Company accounts for uncertain tax positions if it is more likely than not, based on the technical merits, that the tax position will be realized or sustained upon examination. The term more likely than not means a likelihood of more than 50 percent; the terms examined and upon examination also include resolution of the related appeals or litigation processes, if any. A tax position that meets the
more-likely-than-not
recognition threshold is initially and subsequently measured as the largest amount of tax benefit that has a greater than 50 percent likelihood of being realized upon settlement with a taxing authority that has full knowledge of all relevant information. The determination of whether a tax position has met themore-likely-than-not
recognition threshold considers the facts, circumstances, and information available at the reporting date and is subject to management’s judgment. The Bank recognizes interest and penalties on income taxes as a component of income tax expense.F-
56
Off-balance
Sheet Financial InstrumentsIn the ordinary course of business, the Bank has entered into
off-balance
sheet financial instruments consisting of commitments to extend credit and letters of credit. Such financial instruments are recorded in the consolidated balance sheets when they are funded.Share-based Compensation
The Bank follows the provisions of ASC
718-10,
Compensation – Stock Compensation. This standard requires the Bank to recognize the cost of employee and organizer services received in share-based payment transactions and measure the cost based on the grant-date fair value of the award. The cost will be recognized over the period during which the employee or organizer is required to provide service in exchange for the award.The stock compensation accounting guidance requires that compensation cost for all stock awards be calculated and recognized over the employee’s service period, generally defined as the vesting period. For awards with graded-vesting, compensation cost is recognized on a straight-line basis over the requisite service period for the entire award. A Black-Scholes model is used to estimate the fair value of stock options, while the fair value of the Company’s common stock as the date of grant is used for restricted stock awards.
Stock Warrants
The Company issued stock purchase warrants in connection with its initial stock offering via private placement, giving organizers the right to purchase shares of common stock at the initial offering price of $10 per share. For organizers, the warrants serve as a reward for bearing the financial risk of the Company’s organization by advancing “seed money” for its organizational and
pre-opening
expenses. The organizers’ warrants arenon-voting
and are exercisable for a period of ten years from the date of grant. All grants were issued during 2019. These warrants are transferable in accordance with the warrant agreement, but are not puttable to the Company. These shares may be issued from previously authorized but unissued shares of stock. The Board has made no additional authorization to issue any further warrants as of December 31, 2021 and has no current plans for future issuance of warrants. To date, organizers have not exercised any warrants since their issuance.Based on the contractual terms, the warrants do not fall within the scope of ASC, and they meet the requirements within ASC 815,, to be classified within shareholders’ equity. The fair value of these shares upon issuance using the Black-Scholes model was zero, based on the fair value for the stock on the date of grant.
480-10,
Distinguishing Liabilities from Equity
Derivatives and Hedging
Comprehensive Income
Comprehensive Income consists of net income and other comprehensive income. Other comprehensive income includes unrealized gains and losses on securities available for sale, which is also recognized as a separate component of equity.
Treasury Stock
Common stock shares repurchased are recorded as treasury stock, at cost on the consolidated balance sheets, on a settlement date basis.
Earnings Per Share
Basic earnings per share (EPS) represents net income available to common shareholders divided by the weighted-average number of common shares outstanding during the period. Diluted earnings per
share
F-
57
includes the dilutive effect of additional potential common shares issuable under stock options. Potential common shares that may be issued related to outstanding stock options are determined using the treasury stock
method.
Operating Segments
While the chief decision maker monitors the revenue streams of the various products and services, operations are managed and financial performance is evaluated on a Company-wide basis. Discrete financial information is not available other than on a Company-wide basis, as management does not separately allocate expenses between the various operations of the Company.
Advertising Expenses
The Company expenses advertising costs as incurred. Advertising costs for the years ended December 31, 2021 and 2020 were $171 and $37, respectively, and were included within Other Expenses within the Consolidated Statements of Operations.
Recent Accounting Pronouncements Not Yet Adopted
In January 2017, the FASB issued ASUThis standard simplifies the test for goodwill impairment by eliminating the requirement to calculate the implied fair value of goodwill, which currently is Step 2 of the goodwill impairment test. Instead the goodwill impairment test will consist of a single quantitative step comparing the fair value of the reporting unit with its carrying amount. An entity should recognize a goodwill impairment charge for the amount by which the carrying amount exceeds the reporting unit’s fair value. The new standard is effective for annual and any interim goodwill impairment tests in reporting periods beginning after December 15, 2022. The adoption of this standard is not expected to have a material effect on the Company’s operating results or financial condition.
2017-04,
Intangibles - Goodwill and Other (Topic 350): Simplifying the Test for Goodwill Impairment.
In June 2016, the FASB issued ASU, which changes the impairment model for most financial assets measured at amortized cost, including loan receivables anddebt securities. This model is also applicable todebt securities to be presented as a valuation rather than as a direct write down. This Update is intended to improve financial reporting by requiring more timely recording of credit losses on these financial instruments. The underlying premise of the Update is that financial assets measured at amortized cost should be presented at the net amount expected to be collected, through an allowance for credit losses that is deducted from the amortized cost basis. The allowance for credit losses should reflect management’s current estimate of credit losses that are expected to occur over the remaining life of a financial asset. The income statement will be affected for the measurement of credit losses for newly recognized financial assets, as well as the expected increases or decreases of expected credit losses that have taken place during the period. With certain exceptions, transition to the new requirements will be through a cumulative-effect adjustment to opening retained earnings as of the beginning of the first reporting period in which the guidance is adopted. This Update is effective for SEC filers that are eligible to be smaller reporting companies,
2016-13,
Financial Instruments – Credit Losses: Measurement of Credit Losses on Financial Instruments
held-to-maturity
off-balance
sheet credit exposures not accounted for as insurance, such as loan commitments, standby letters of credit, financial guarantees, and other similar instruments. In addition, the amendments in ASU2016-03
require credit losses onavailable-for-sale
non-SEC
filers, and all other companies, to fiscal years beginning after December 15, 2022, including interim periods within those fiscal years. The Company is evaluating the impact of ASU2016-13
and has individuals from multiple disciplines working with a third-party vendor solution to assist with the application of ASU2016-13.
The Company expects to recognize aone-time
cumulative-effect adjustment to the allowance for loan losses as of the beginning of the first reporting period in which the new standard is effective but cannot yet determine the magnitude of any suchone-time
adjustment or the overall impact of the new guidance on the consolidatedF-
58
financial statements. For debt securities with other-than-temporary impairment (“OTTI”), the guidance will be applied prospectively. Existing PCI assets will be grandfathered and classified as purchased credit deteriorated (“PCD”) assets at the date of adoption. The asset will be grossed up for the allowance for expected losses for all PCD assets at the date of adoption and will continue to recognize the noncredit discount in interest income based on the yield of such assets as of the adoption date. Subsequent changes in the expected credit losses swill be recorded through the allowance.
In January 2021, the FASB issued ASUwhich added to ASUdebt securities that reference an interest rate affected by reference rate reform. The amendments in this ASU are effective for all entities upon issuance through December 31, 2022. The Company has identified our loan receivables that have an interest rate indexed to LIBOR and is currently assessing the appropriate transition path. As such, the Company does not have an estimate of the financial impact of this update but does not expect the impact to be material to the financial statements of the Company.
2021-01,
Reference Rate Reform (Topic 848): Facilitation of the Effects of Reference Rate Reform on Financial Reporting,
2020-04
on optional expedients and exceptions to the U.S. GAAP guidance on contract modifications and hedge accounting to ease the financial reporting burdens of the expected market transition from LIBOR and other interbank offered rates to alternative reference rates, such as the Secured Overnight Financing Rate. Entities can elect not to apply certain modification accounting requirements to contracts affected by what the guidance calls “reference rate reform” if certain criteria are met. An entity that makes this election would not have to remeasure the contracts at the modification date or reassess a previous accounting determination. Also, entities can elect various optional expedients that would allow them to continue applying hedge accounting for hedging relationships affected by reference rate reform if certain criteria are met, and can make a onetime election to sell and/or reclassifyheld-to-maturity
2. | MERGER |
As described in Note 1. Summary of Significant Accounting Policies, effective September 18, 2021 the Company completed its merger with GNBF by acquiring 100% of the outstanding common shares of GNBF.
Pursuant to the Merger Agreement, GNBF merged with and into LINKBANCORP, Inc. with LINKBANCORP, Inc. as the surviving corporation. Additionally, LINKBANK, the wholly owned subsidiary of LINKBANCORP, Inc. merged with and into The Gratz Bank, a wholly owned subsidiary of GNBF with The Gratz Bank as the surviving bank subsidiary of the Company. This transaction, in total, is herein referred to as the Merger.
The Merger constituted a business combination and was accounted for as a reverse acquisition using the acquisition method of accounting, in accordance with the provisions of FASB ASC 805 Business Combinations. As such, GNBF was the accounting acquirer and LINKBANCORP, Inc. was the accounting acquiree and the historical financial statements of the combined company are the historical financial statements of GNBF.
Under the Merger Agreement, GNBF shareholders had the opportunity to elect to receive $87.68 per share in cash or 7.3064 of LINKBANCORP, Inc. common shares for each share they own. The agreement provided for proration procedures intended to ensure that, in the aggregate, at least 80% of the GNBF common shares outstanding will be exchanged for LINKBANCORP, Inc. common stock. The Merger was effective on September 18, 2021, with the GNBF shareholders collectively electing to receive cash for 14.865% of their shares and LINKBANCORP, Inc. common shares for 85.135% of existing GNBF shares. These elections resulted in LINKBANCORP issuing 4.85 million common shares to GNBF shareholders which represented approximately 49.4% of the post-merger outstanding common shares of the Company.
In accordance with FASB ASCthe fair value consideration of a reverse acquisition is determined based on a number of hypothetical equity interest the legal acquiree would have had to issue to
805-40-30-2,
F-
59
give the owners of the legal acquirer the same percentage equity interest in the combined entity that results from the reverse acquisition.
The total fair value consideration was $71.5 million which consisted of $54.0 million for the fair value of common stock issued, $10.1 million in cash consideration and $7.4 million for the fair value of LINKBANCORP, Inc. options and warrants. The consideration assigned to cash and common stock in this reverse acquisition was determined based on the hypothetical number of equity interests that GNBF would have had to issue to give LINK shareholders a 50.62% ownership, the same percentage equity interest in the combined entity that results from the reverse acquisition. The allocation of the consideration assigned to cash and common stock was allocated between the actual cash to be paid by the legal acquirer with the resultant amount being assigned to common equity.
The following table summarizes the fair value consideration paid for GNBF as of the date of acquisition:
(Dollars in thousands except per share amounts) | ||||
Total GNBF common shares outstanding | 779,000 | |||
GNBF shares outstanding exchanged for LINKBANCORP, Inc. common stock | 663,240 | |||
GNBF shares outstanding exchanged for cash | 115,760 | |||
Exchange Ratio | 7.3064 | |||
LINKBANCORP, Inc. shares to be issued to GNBF shareholders | 4,845,897 | |||
LINKBANCORP, Inc. Shares currently outstanding | 4,968,550 | |||
Total LINKBANCORP, Inc. shares to be outstanding | 9,814,447 | |||
GNBF pro forma common share % ownership | 49.38 | % | ||
LINKBANCORP, Inc. pro forma common share % ownership | 50.62 | % | ||
Reverse Acquisition Hypothetical Purchase Price Consideration | ||||
GNBF shares outstanding exchanged for LINKBANCORP, Inc. common stock | 663,240 | |||
Ownership % to be owned by current GNBF shareholders | 49.38 | % | ||
Hypothetical GNBF shares outstanding based on GNBF % ownership | 1,343,267 | |||
Ownership % by legacy LINKBANCORP, Inc. shareholders | 50.62 | % | ||
Hypothetical GNBF shares to be issued as consideration | 680,027 | |||
Fair value of GNBF shares (LINKBANCORP, Inc. fair value per share of $12.90 as of 9/17/2021 multiplied by the exchange rate) | $ | 94.25 | ||
Purchase price assigned to hypothetical GNBF shares issued to LINKBANCORP, Inc. shareholders | $ | 64,094 | ||
LINKBANCORP, Inc. options and warrants | 1,962,484 | |||
Fair value per options and warrants | $ | 3.76 | ||
Purchase price assigned to LINKBANCORP, Inc. options and warrants | 7,379 | |||
Total purchase price consideration | $ | 71,473 | ||
Pro Forma Purchase Price Allocation Between Stock & Cash: | ||||
Cash consideration | $ | 10,077 | ||
Common Stock | 61,396 | |||
Total Purchase Price For Accounting Purposes | $ | 71,473 | ||
F-
60
The Company accounts for business combinations under the acquisition method in accordance with ASC Topic 805, Business Combinations. Accordingly, for each transaction, the purchase price is allocated to the fair value of the assets acquired and liabilities assumed as of the date of the acquisition. In conjunction with the adoption of ASU
2015-16,
upon receipt of final fair value estimates during the measurement period, which must be within one year of the acquisition date, the Company records any adjustments to the preliminary fair value estimates in the reporting period in which the adjustments are determined. The Company is continuing to finalize the fair values of loans, intangible assets, and income taxes. As a result, the recorded fair value adjustments are preliminary and may change as additional information becomes available. Based on management’s preliminary valuation of tangible and intangible assets acquired and liabilities assumed, the purchase price for the Merger is allocated in the table below.Total Consideration in the Merger | $ | 71,473 | ||||||
Calculated Fair Value of Assets Acquired | ||||||||
Cash and cash equivalents | $ | 49,962 | ||||||
Securities available for sale | 3,111 | |||||||
Loans | 415,905 | |||||||
Premises and equipment | 2,087 | |||||||
Right-of-use | 4,544 | |||||||
Intangible assets | 1,246 | |||||||
Investment in bank owned life insurance | 4,784 | |||||||
Deferred taxes | 3,675 | |||||||
Other assets | 4,394 | |||||||
Total Assets Acquired | 489,708 | |||||||
Calculated Fair Value of Liabilities Assumed | ||||||||
Deposits | 391,160 | |||||||
Long term borrowings | 33,034 | |||||||
Subordinated debt | 20,740 | |||||||
Operating lease liabilities | 4,544 | |||||||
Other liabilities | 2,265 | |||||||
Total Liabilities Assumed | 451,743 | |||||||
Net Assets Acquired | 37,965 | |||||||
Goodwill From the Merger | $ | 33,508 | ||||||
The following table summarizes the Merger as of September 18, 2021:
Total Consideration in the Merger | $ | 71,473 | ||||||
| LINKBANCORP, Inc. stockholders’ equity | $ | 43,124 | ||||||
| LINKBANCORP, Inc. goodwill and intangibles | (1,353 | ) | ||||||
Fair Value Adjustments: | ||||||||
| Loans | ||||||||
| Interest rate | (1,521 | ) | ||||||
| General credit | (6,346 | ) | ||||||
| Credit adjustment for loans acquired with deteriorated credit quality | (1,243 | ) | ||||||
| Remove existing deferred loan fees, net at acquisition | 1,192 | |||||||
| Remove the allowance for loan losses present at acquisition | 4,953 | |||||||
| Intangible assets | 1,146 | |||||||
| Other assets | (991 | ) | ||||||
| Time deposits | (231 | ) | ||||||
| Subordinated debt | (765 | ) | ||||||
| 37,965 | ||||||||
Goodwill From the Merger | $ | 33,508 | ||||||
F-
61
Pursuant to the accounting requirements, the Company assigned a fair value to the assets acquired and liabilities assumed of LINKBANCORP, Inc. ASC 820 defines fair value as “the price that would be received to sell an asset or paid to transfer a liability in an orderly transaction between market participants at the measurement date.”
The assets acquired and liabilities assumed in the acquisition of LINKBANCORP, Inc. were recorded at their estimated fair values based on management’s best estimates using information available at the date of the acquisition and are subject to adjustment for up to one year after the closing date of the acquisition. While the fair values are not expected to be materially different from the estimates, any material adjustments to the estimates will be reflected, retroactively, as of the date of the acquisition. The items most susceptible to adjustment are the fair value adjustments on loans, core deposit intangible and the deferred income tax assets resulting from the acquisition.
Goodwill represents consideration transferred in excess of the fair value of the net assets acquired. The goodwill resulting from the acquisition represents the value expected from the expansion of the Company’s market and enhancement of operations and efficiencies. Goodwill acquired in the acquisition is not deductible for tax purposes.
Fair values of the major categories of assets acquired and liabilities assumed were determined as follows:
Investment securities
available-for-sale
The estimated fair values of the investment securities available for sale, primarily comprised of U.S. Government agency mortgage-backed securities were determined using Level 1 and Level 2 inputs in the fair value hierarchy. A fair value premium of $96 was recorded and will be amortized over the estimated life of the investments using the interest rate method.
Loans
Acquired loans (performing and
non-performing)
are initially recorded at their acquisition-date fair values using Level 3 inputs. Fair values are based on a discounted cash flow methodology that involves assumptions and judgments as to credit risk, expected lifetime losses, environmental factors, collateral values, discount rates, expected payments and expected prepayments. Specifically, the Company has prepared three separate loan fair value adjustments that it believed a market participant might employ in estimating the entire fair value adjustment for the acquired loan portfolio. The three fair value adjustments employed were for loans acquired without evidence of credit quality deterioration, the Company prepared the interest rate loan fair value and credit fair value adjustments and for ASC310-30
purchased credit impaired loans a specific credit fair value adjustment was made. The acquired loans were recorded at fair value at the acquisition date without carryover of LINKBANCORP, Inc.’s previously established allowance for loan losses. The fair value of the financial assets acquired included loans receivable with an unpaid principal balance of $425.0 million.The table below illustrates the fair value adjustments made to the amortized cost basis in order to present the fair value of the loans acquired.
Unpaid principal balance at merger | $ | 425,015 | ||
Interest rate fair value adjustment on pools of homogeneous loans | (1,520 | ) | ||
Credit fair value adjustment on pools of homogeneous loans | (6,347 | ) | ||
Credit fair value adjustment on purchased credit impaired loans | (1,243 | ) | ||
Fair value of acquired loans | $ | 415,905 | ||
F-
62
For loans acquired without evidence of credit quality deterioration were grouped into homogeneous pools by characteristics such as loan type, term, collateral, and rate. Market rates for similar loans were obtained from various internal and external data sources. From each pool a monthly expected cash flow was prepared that incorporated expected monthly payments, impact of prepayments and expected monthly net charge-offs. A discounted cash flow was calculated for each pool to estimate the fair value. In this analysis the fair value adjustment was bifurcated into two components an interest rate fair value adjustment and a general credit fair value adjustment. Additionally, it is noted the credit fair value adjustment incorporated assumptions for: 1) expected lifetime credit migration losses; and 2) estimated fair value adjustment for certain qualitative factors. Both the interest rate and credit fair value adjustments relate to loans acquired with evidence of credit quality deterioration will be substantially recognized as interest income on a level yield amortization method over the expected life of the loans.
For loans acquired with evidence of credit quality deterioration, ASC
310-30
loans, the fair value was calculated with a non-accretable fair value discount based on an adjusted collateral value and if there was a collateral shortfall a non-accretable discount was established. This non-accretable discount would not be amortized for GAAP purposes. In additional an accretable yield fair value discount was created to reflect the time value of money a market participant would discount the loan for the time it would take to recover the adjusted collateral value. The accretable yield fair value will be recognized over the workout period of the loan on a level yield basis as a component of interest income.The following table presents the acquired purchased credit impaired loans receivable at the merger date:
Contractual principal and interest at merger | $ | 8,509 | ||
Nonaccretable difference | (2,716 | ) | ||
Expected cash flows at merger | 5,793 | |||
Accretable yield | (409 | ) | ||
Fair value of purchased credit impaired loans | $ | 5,384 | ||
Facilities Leases
The Company assumed leases on four facilities of LINKBANCORP, Inc.. The Company believed that the current lease costs were at market terms therefore no fair value adjustment is needed. It is noted that LINKBANCORP, Inc. did not operate any owned facilities.
Core Deposit Intangible
The fair value of the core deposit intangible was determined based on a discounted cash flow analysis using a discount rate commensurate with market participants. To calculate cash flows, deposit account servicing costs (net of deposit fee income) and interest expense on deposits were compared to the higher cost of alternative funding sources available through national brokered CD offering rates and FHLB advance rates. The projected cash flows were developed using expected deposit attrition. The core deposit intangible will be amortized over ten years using thedigits method.
sum-of-years
Time Deposits
The fair value adjustment for time deposits was based on a discounted cash flow methodology of the contract rates and contractual repayments of fixed maturity deposits using prevailing market interest rates for similar-term time deposits. The time deposit fair value adjustment will be amortized into income on a level yield amortization method over the contractual life of the deposits.
Long Term Borrowings
The Company reviewed the cost of the borrowings to market interest rates for similar instruments and believed that the rates were comparable and that no fair value adjustment was recorded.
F-
63
Subordinated Debt
The fair value of the subordinated debt was determined using a discounted cash flow method using a market participant discount rate for similar instruments. The subordinated debt fair value adjustment will be amortized into income on a level yield amortization method based upon the assumed market rate and the term of the subordinated debt.
Pro Forma Combined Results of Operations (Unaudited)
The following pro forma financial information presents the consolidated results of operations of GNBF and LINKBANCORP, Inc. as if the Merger occurred as of January 1, 2020 with pro forma adjustments. The pro forma adjustments give effect to any change in interest income due to the accretion of discounts (premiums) associated with the fair value adjustments of acquired loans, any change in interest expense due to estimated premium amortization/discount accretion associated with the fair value adjustments to acquired time deposits and other debt, and the amortization of the core deposit intangible that would have resulted had the deposits been acquired as of January 1, 2020. Merger related expenses incurred by the Company during the year ended December 31, 2021 are not reflected in the pro forma amounts. The pro forma information does not necessarily reflect the results of operations that would have occurred had GNBF merged with LINKBANCORP, Inc. at the beginning of 2020. The pro forma amounts for the years ended December 31, 2021 and 2020 do not reflect the anticipated cost savings that have not yet been realized.
Twelve months ended December 31, | ||||||||
| (Dollars in thousands) | 2021 | 2020 | ||||||
Net interest income | $ | 28,075 | $ | 23,392 | ||||
Non-interest income | 2,551 | 2,403 | ||||||
Net income (loss) | 8,159 | 4,387 | ||||||
Basic earnings (loss) per common share | $ | 0.83 | $ | 0.47 | ||||
Diluted earnings (loss) per common share | $ | 0.80 | $ | 0.46 | ||||
3. | INVESTMENT SECURITIES |
The amortized cost, gross unrealized gains and losses, and fair value of investment securities available for sale are summarized as follows:
December 31, 2021 | ||||||||||||||||
(In Thousands) | Amortized Cost | Gross Unrealized Gains | Gross Unrealized Losses | Fair Value | ||||||||||||
Available for Sale: | ||||||||||||||||
Small Business Administration loan pools | $ | 1,099 | $ | — | $ | (15 | ) | $ | 1,084 | |||||||
Obligations of state and political subdivisions | 46,115 | 2,405 | (38 | ) | 48,482 | |||||||||||
Mortgage-backed securities in government-sponsored entities | 54,239 | 382 | (404 | ) | 54,217 | |||||||||||
Total available-for-sale | $ | 101,453 | $ | 2,787 | $ | (457 | ) | $ | 103,783 | |||||||
December 31, 2020 | ||||||||||||||||
(In Thousands) | Amortized Cost | Gross Unrealized Gains | Gross Unrealized Losses | Fair Value | ||||||||||||
Available for Sale: | ||||||||||||||||
Small Business Administration loan pools | $ | 7,835 | $ | 198 | $ | (39 | ) | $ | 7,994 | |||||||
Obligations of state and political subdivisions | 49,167 | 2,895 | (3 | ) | 52,059 | |||||||||||
Mortgage-backed securities in government-sponsored entities | 64,406 | 1,068 | (80 | ) | 65,394 | |||||||||||
Total available-for-sale | $ | 121,408 | $ | 4,161 | $ | (122 | ) | $ | 125,447 | |||||||
F-
64
The following tables show the Company’s gross unrealized losses and fair value, aggregated by investment category and length of time the individual debt securities have been in a continuous unrealized loss position.
December 31, 2021 | ||||||||||||||||||||||||
Less Than Twelve Months | Twelve Months or Greater | Total | ||||||||||||||||||||||
(In Thousands) | Fair Value | Gross Unrealized Loss | Fair Value | Gross Unrealized Loss | Fair Value | Gross Unrealized Loss | ||||||||||||||||||
Available for Sale: | ||||||||||||||||||||||||
Small Business Administration loan pools | $ | — | $ | — | $ | 1,084 | $ | (15 | ) | $ | 1,084 | $ | (15 | ) | ||||||||||
Obligations of state and political subdivisions | 3,189 | (38 | ) | — | — | 3,189 | (38 | ) | ||||||||||||||||
Mortgage-backed securities in government-sponsored entities | 23,420 | (266 | ) | 4,687 | (102 | ) | 28,107 | (368 | ) | |||||||||||||||
Total available-for-sale | $ | 26,609 | $ | (304 | ) | $ | 5,771 | $ | (117 | ) | $ | 32,380 | $ | (421 | ) | |||||||||
December 31, 2020 | ||||||||||||||||||||||||
Less Than Twelve Months | Twelve Months or Greater | Total | ||||||||||||||||||||||
(In Thousands) | Fair Value | Gross Unrealized Loss | Fair Value | Gross Unrealized Loss | Fair Value | Gross Unrealized Loss | ||||||||||||||||||
Available for Sale: | ||||||||||||||||||||||||
Small Business Administration loan pools | $ | 2,059 | $ | (9 | ) | $ | 1,539 | $ | (30 | ) | $ | 3,598 | $ | (39 | ) | |||||||||
Obligations of state and political subdivisions | 557 | (3 | ) | — | — | 557 | (3 | ) | ||||||||||||||||
Mortgage-backed securities in government-sponsored entities | 12,245 | (80 | ) | — | — | 12,245 | (80 | ) | ||||||||||||||||
Total available-for-sale | $ | 14,861 | $ | (92 | ) | $ | 1,539 | $ | (30 | ) | $ | 16,400 | $ | (122 | ) | |||||||||
The Company reviews its position quarterly and has asserted that as of December 31, 2021 and 2020, the declines outlined in the above tables represent temporary declines, and the Company does not intend to sell, and does not believe it will be required to sell, these debt securities before recovery of their cost basis, which may be at maturity. There were 41 and 19 debt securities with unrealized losses at December 31, 2021 and 2020, respectively. The Company has concluded that the unrealized losses disclosed above are not other than temporary, but are the result of interest rate changes that are not expected to result in the noncollection of principal and interest during the year.
Amortized cost and fair value by contractual maturity, where applicable, are shown below. Actual maturities may differ from contractual maturities because the borrower may have the right to prepay obligations with or without penalty.
December 31, 2021 | ||||||||
(In Thousands) | Amortized Cost | Fair Value | ||||||
Available for Sale: | ||||||||
Due within one year | $ | 1,195 | $ | 1,200 | ||||
Due after one year through five years | 5,442 | 5,593 | ||||||
Due after five years through ten years | 12,006 | 12,400 | ||||||
Due after ten years | 28,571 | 30,373 | ||||||
Mortgage-backed securities and Collateralized Mortgage Obligations | 54,239 | 54,217 | ||||||
$ | 101,453 | $ | 103,783 | |||||
F-
65
The following table summarizes sales of debt securities:
For the Year Ended December 31, | ||||||||
| (In Thousands) | 2021 | 2020 | ||||||
Proceeds | $ | 11,371 | $ | 5,706 | ||||
Gross gains | 127 | 221 | ||||||
Gross losses | (53 | ) | (111 | ) | ||||
Net gain | $ | 74 | $ | 110 | ||||
The Company had pledged debt securities with a carrying value of $45,300 and $52,100 to secure public monies as of December 31, 2021 and 2020, respectively.
4. | CERTIFICATES OF DEPOSIT WITH OTHER BANKS |
Interest-earning certificates of deposit with other banks are held at cost. The contractual maturity of these certificates of deposit as of December 31, 2021 and 2020 is as follows:
December 31 | ||||||||
(in thousands) | 2021 | 2020 | ||||||
Due in one year or less | $ | 7,205 | $ | 4,472 | ||||
Due after one year through five years | 5,623 | 11,583 | ||||||
Due after five years through ten years | — | 996 | ||||||
| $ | 12,828 | $ | 17,051 | |||||
5. | LOANS RECEIVABLE |
The portfolio segments and classes of loans are as follows:
(In Thousands) | December 31, 2021 | December 31, 2020 | ||||||
Agriculture loans | $ | 9,341 | $ | 11,246 | ||||
Commercial loans | 98,604 | 21,534 | ||||||
Paycheck Protection Program (“PPP”) loans | 23,774 | — | ||||||
Commercial real estate loans | 338,749 | 27,261 | ||||||
Residential real estate loans | 231,302 | 167,536 | ||||||
Consumer and other loans | 7,087 | 2,514 | ||||||
Municipal loans | 6,182 | 6,749 | ||||||
715,039 | 236,840 | |||||||
Deferred fees | (223 | ) | (256 | ) | ||||
Allowance for loan losses | (3,152 | ) | (2,789 | ) | ||||
Total | $ | 711,664 | $ | 233,795 | ||||
The Company originates commercial, residential, and consumer loans within its primary market areas of southcentral and southeastern Pennsylvania. A significant portion of the loan portfolio is secured by real estate. In the normal course of business, the Company extends loans to officers, directors, and corporations in which they are beneficially interested as stockholders, officers, or directors. The balance of these loans and extensions of credit totaled $10,631 and $2,586 as of December 31, 2021 and 2020, respectively. At December 31, 2021 and 2020, the Company serviced residential mortgage loans for the Federal Home Loan Bank of Pittsburgh in the amount of $51,101 and $45,356,
respectively.
F-
66
6. | ALLOWANCE FOR LOAN LOSSES |
The segments of the Company’s loan portfolio are disaggregated to a level that allows management to monitor risk and performance. The loan segments used are consistent with the internal reports evaluated by the Company’s management and Board of Directors to monitor risk and performance within various segments of its loan portfolio and, therefore, no further disaggregation is considered necessary. The Company’s loan portfolio consists primarily of real estate loans on commercial and residential property. The portfolio also includes agricultural loans, commercial loans, municipal loans, and consumer loans.
The Company’s primary lending activity is the origination of commercial loans extended to small and
mid-sized
commercial and industrial entities.Commercial loans are primarily underwritten on the basis of the borrowers’ ability to service such debt from income. The cash flows of borrowers, however, may not be as expected and the collateral securing these loans may fluctuate in value. As a general practice, the Company takes as collateral a security interest in any equipment, or other chattel, although loans may also be made on an unsecured basis. Collateralized working capital loans typically are secured by short-term assets whereas long-term loans are primarily secured by long-term assets.
Construction and Land loans are to finance the construction of owner-occupied and income producing properties. These loans are categorized within commercial orfamily residential loans based upon the underlying collateral and intended use following the completion of the construction period. Real estate development and construction loans are approved based on an analysis of the borrower and guarantor, the viability of the project and on an acceptable percentage of the appraised value of the property securing the loan. Construction loan funds are disbursed periodically based on the percentage of construction or development completed. The Company carefully monitors these loans with
one-to-four
on-site
inspections and requires the receipt of lien waivers on funds advanced. The Company considers the market conditions and feasibility of proposed projects, the financial condition and reputation of the borrower and guarantors, the amount of the borrower’s equity in the project, independent appraisals, cost estimates andpre-construction
sale information. The Company also makes loans on occasion for the purchase of land for future development by the borrower. Land loans are extended for the future development for either commercial or residential use by the borrower. The Company carefully analyzes the intended use of the property and the viability thereof.The Company’s commercial real estate loans consist of mortgage loans secured by nonresidential real estate, such as by apartment buildings, small office buildings, and owner-occupied properties. Commercial real estate loans are secured by the subject property and are underwritten based on loan to value limits, cash flow coverage and general creditworthiness of the obligors. These loans tend to involve larger loan balances and their repayment is typically dependent upon the successful operation and management of the underlying real estate.
Residential real estate loans are underwritten based on the borrower’s repayment capacity and source, value of the underlying property, credit history and stability. These loans are secured by a first or second mortgage on the borrower’s principal residence or their second/vacation home (excluding investment/rental property).
In addition to the main types of loans discussed above, the Company also originates agricultural loans, consumer loans, and municipal loans. The agricultural loan portfolio consists of loans to local farmers and agricultural businesses that are generally secured by farmland and equipment. The consumer loan portfolio consists of lending in the form of home equity loans secured by financed property and personal consumer loans, which may be secured or unsecured. The municipal loan portfolio consists of loans to qualified local municipalities, which are generally supported by the taxing authority of the borrowing municipality, and is frequently secured by collateral.
Management has an established methodology to determine the adequacy of the allowance for loan losses that assesses the risks and losses inherent in the loan portfolio. For purposes of determining the allowance for loan losses the Company has segmented certain loans in the portfolio by product type. Loans are segmented into the following pools: agriculture loans, commercial real estate loans, commercial
loans,
F-
67
residential real estate loans, consumer loans, and municipal loans. Historical loss percentages for each risk category are calculated and used as the basis for calculating allowance allocations. These historical loss percentages are calculated over a four-year period for all portfolio segments.
Certain qualitative factors are then added to the historical allocation percentage to get the adjusted factor to be applied to
non-classified
loans. The following qualitative factors are analyzed for each portfolio segment:| • | Levels of and trends in delinquencies |
| • | Trends in volume and terms |
| • | Changes in collateral |
| • | Changes in management and lending staff |
| • | Economic trends |
| • | Concentrations of credit |
| • | Changes in lending policies |
| • | External factors |
| • | Changes in underwriting process |
| • | Trends in credit quality ratings |
These qualitative factors are reviewed each quarter and adjusted based upon relevant changes within the portfolio.
The total allowance reflects management’s estimate of loan losses inherent in the loan portfolio at the Consolidated Balance Sheet date. The Company considers the allowance for loan losses adequate to cover loan losses inherent in the loan portfolio at December 31, 2021 and 2020.
The following table summarizes the activity in the allowance for loan losses by loan class for the years ended December 31, 2021 and 2020.
Agriculture Loans | Commercial and PPP Loans | Commercial Real Estate Loans | Residential Real Estate Loan | Consumer Loans | Municipal Loans | Unallocated Loans | Total | |||||||||||||||||||||||||
For the Year Ended December 31, 2021 | ||||||||||||||||||||||||||||||||
Allowance for loan losses: | ||||||||||||||||||||||||||||||||
Beginning balance | $ | 120 | $ | 290 | $ | 314 | $ | 1,702 | $ | 35 | $ | 18 | $ | 310 | $ | 2,789 | ||||||||||||||||
Charge-offs | — | (24 | ) | (18 | ) | (297 | ) | — | — | — | (339 | ) | ||||||||||||||||||||
Recoveries | — | 22 | — | 32 | — | — | — | 54 | ||||||||||||||||||||||||
Provision | (97 | ) | 294 | 503 | 197 | (13 | ) | (3 | ) | (233 | ) | 648 | ||||||||||||||||||||
Ending balance | $ | 23 | $ | 582 | $ | 799 | $ | 1,634 | $ | 22 | $ | 15 | $ | 77 | $ | 3,152 | ||||||||||||||||
For the Year Ended December 31, 2020 | ||||||||||||||||||||||||||||||||
Allowance for loan losses: | ||||||||||||||||||||||||||||||||
Beginning balance | $ | 152 | $ | 312 | $ | 255 | $ | 1,707 | $ | 43 | $ | 13 | $ | 220 | $ | 2,702 | ||||||||||||||||
Charge-offs | — | — | — | (99 | ) | (12 | ) | — | — | (111 | ) | |||||||||||||||||||||
Recoveries | — | — | — | 7 | 7 | — | — | 14 | ||||||||||||||||||||||||
Provision | (32 | ) | (22 | ) | 59 | 87 | (3 | ) | 5 | 90 | 184 | |||||||||||||||||||||
Ending balance | $ | 120 | $ | 290 | $ | 314 | $ | 1,702 | $ | 35 | $ | 18 | $ | 310 | $ | 2,789 | ||||||||||||||||
The increase in the allowance for loan losses allocated to the commercial loans and commercial real estate loans can be attributed to the increase in the carrying value of loans that have been risk rated as Special Mention and Substandard as of December 31, 2021. Please see the “Credit Quality Information” section below for further
details.
F-
68
The following table illustrates the balance of loans individually evaluated vs. collectively evaluated for impairment at December 31, 2021 and 2020.
Agriculture Loans | Commercial and PPP Loans | Commercial Real Estate Loans | Residential Real Estate Loan | Consumer Loans | Municipal Loans | Unallocated Loans | Total | |||||||||||||||||||||||||
As of December 31, 2021 | ||||||||||||||||||||||||||||||||
Allowance for loan losses: | ||||||||||||||||||||||||||||||||
Ending balance | $ | 23 | $ | 582 | $ | 799 | $ | 1,634 | $ | 22 | $ | 15 | $ | 77 | $ | 3,152 | ||||||||||||||||
Ending balance: individually evaluated for impairment | $ | — | $ | — | $ | — | $ | — | $ | — | $ | — | $ | — | $ | — | ||||||||||||||||
Ending balance: collectively evaluated for impairment | $ | 23 | $ | 582 | $ | 799 | $ | 1,634 | $ | 22 | $ | 15 | $ | 77 | $ | 3,152 | ||||||||||||||||
Loans: | ||||||||||||||||||||||||||||||||
Ending balance | $ | 9,341 | $ | 122,378 | $ | 338,749 | $ | 231,302 | $ | 7,087 | $ | 6,182 | $ | 715,039 | ||||||||||||||||||
Ending balance: individually evaluated for impairment | $ | — | $ | 42 | $ | — | $ | 709 | $ | — | $ | — | $ | 751 | ||||||||||||||||||
Ending balance: loans acquired with deteriorated credit quality | $ | — | $ | 512 | $ | 4,394 | $ | 650 | $ | — | $ | — | $ | 5,556 | ||||||||||||||||||
Ending balance: collectively evaluated for impairment | $ | 9,341 | $ | 121,824 | $ | 334,355 | $ | 229,943 | $ | 7,087 | $ | 6,182 | $ | 708,732 | ||||||||||||||||||
Agriculture Loans | Commercial Loans | Commercial Real Estate Loans | Residential Real Estate Loan | Consumer Loans | Municipal Loans | Unallocated Loans | Total | |||||||||||||||||||||||||
As of December 31, 2020 | ||||||||||||||||||||||||||||||||
Allowance for loan losses: | ||||||||||||||||||||||||||||||||
Ending balance | $ | 120 | $ | 290 | $ | 314 | $ | 1,702 | $ | 35 | $ | 18 | 310 | $ | 2,789 | |||||||||||||||||
Ending balance: individually evaluated for impairment | $ | — | $ | — | $ | — | $ | — | $ | — | $ | — | $ | — | $ | — | ||||||||||||||||
Ending balance: collectively evaluated for impairment | $ | 120 | $ | 290 | $ | 314 | $ | 1,702 | $ | 35 | $ | 18 | 310 | $ | 2,789 | |||||||||||||||||
Loans: | ||||||||||||||||||||||||||||||||
Ending balance | $ | 11,246 | $ | 21,534 | $ | 27,261 | $ | 167,536 | $ | 2,514 | $ | 6,749 | $ | 236,840 | ||||||||||||||||||
Ending balance: individually evaluated for impairment | $ | — | $ | 2 | $ | — | $ | 295 | $ | — | $ | — | $ | 297 | ||||||||||||||||||
Ending balance: collectively evaluated for impairment | $ | 11,246 | $ | 21,532 | $ | 27,261 | $ | 167,241 | $ | 2,514 | $ | 6,749 | $ | 236,543 | ||||||||||||||||||
F-
69
The Company evaluated whether loans acquired in the Merger were within the scope of ASC
310-30,
Receivables— Loans and Debt Securities Acquired with Deteriorated Credit Quality. Purchased credit-impaired loans (“PCI”) are loans that have evidence of credit deterioration since origination and it is probable at the date of acquisition that the Company will not collect all contractually required principal and interest payments. The fair value of purchased credit-impaired loans, on the acquisition date, was determined, primarily based on the fair value of loan collateral. The carrying value of purchased loans acquired with deteriorated credit quality as a result of the Merger was $5,527 at December 31, 2021.On the acquisition date, the preliminary estimate of the unpaid principal balance for all PCI loans acquired through the Merger was $6,627 and the estimated fair value of the loans was $5,384. Total contractually required payments on these loans, including interest, at acquisition was $8,509. The Company’s preliminary estimate of expected cash flows was $5,793 at the acquisition date. The Company established a credit risk related non-accretable discount of $2,716 relating to these PCI loans, reflected in the recorded net fair value. The Company further estimated the timing and amount of expected cash flows in excess of the estimated fair value and established an accretable discount of $409 relating to these PCI loans. The remaining unamortized accretable discount at December 31, 2021 totaled $307.
Credit Quality Information
The following tables represent credit exposures by internally assigned grades as of December 31, 2021 and 2020. The grading analysis estimates the capability of the borrower to repay the contractual obligations of the loan agreements as scheduled or at all.
The Company’s internally assigned grades are as follows:
Pass – loans that are protected by the current net worth and paying capacity of the obligor or by the value of the underlying collateral. There are four
sub-grades
within the Pass category to further distinguish the loan.Special Mention – loans where a potential weakness or risk exists, which could cause a more serious problem if not corrected.
Substandard – loans that have a well-defined weakness based on objective evidence and are characterized by the distinct possibility that the Bank will sustain some loss if the deficiencies are not corrected.
Doubtful – loans classified as Doubtful have all the weaknesses inherent in a Substandard asset. In addition, these weaknesses make collection or liquidation in full highly questionable and improbable, based on existing circumstances.
Loss – loans classified as a Loss are considered uncollectible and are immediately charged against allowances.
The following table presents the classes of the loan portfolio summarized by the internal risk rating system as of December 31, 2021 and 2020:
(In Thousands) As of December 31, 2021 | Pass | Special Mention | Substandard | Doubtful | Total | |||||||||||||||
Agriculture loans | $ | 9,341 | — | — | — | $ | 9,341 | |||||||||||||
Commercial and PPP loans | $ | 117,918 | 3,757 | 703 | — | $ | 122,378 | |||||||||||||
Commercial real estate loans | $ | 332,156 | 2,077 | 4,516 | — | $ | 338,749 | |||||||||||||
Residential real estate loans | $ | 228,664 | 1,657 | 981 | — | $ | 231,302 | |||||||||||||
Consumer loans | $ | 7,087 | — | — | — | $ | 7,087 | |||||||||||||
Municipal loans | $ | 6,182 | — | — | — | $ | 6,182 | |||||||||||||
Total | $ | 701,348 | $ | 7,491 | $ | 6,200 | $ | — | $ | 715,039 | ||||||||||
F-
70
(In Thousands) As of December 31, 2020 | Pass | Special Mention | Substandard | Doubtful | Total | |||||||||||||||
Agriculture loans | $ | 11,246 | — | — | — | $ | 11,246 | |||||||||||||
Commercial loans | $ | 21,259 | — | 275 | — | $ | 21,534 | |||||||||||||
Commercial real estate loans | $ | 27,261 | — | — | — | $ | 27,261 | |||||||||||||
Residential real estate loans | $ | 166,968 | — | 568 | — | $ | 167,536 | |||||||||||||
Consumer loans | $ | 2,514 | — | — | — | $ | 2,514 | |||||||||||||
Municipal loans | $ | 6,749 | — | — | — | $ | 6,749 | |||||||||||||
Total | $ | 235,997 | $ | — | $ | 843 | $ | — | $ | 236,840 | ||||||||||
The following tables present an aging analysis of the recorded investment of
past-due
loans.December 31, 2021 | ||||||||||||||||||||||||||||||||
(In Thousands) | 30-59 Days Past Due | 60-89 Days Past Due | 90 Days or Greater Past Due | Total Past Due | Current | Purchased Credit Impaired Loans | Total Loans | Total > 90 Days and Accruing | ||||||||||||||||||||||||
Agriculture loans | $ | 83 | $ | — | $ | — | $ | 83 | $ | 9,258 | $ | — | $ | 9,341 | $ | — | ||||||||||||||||
Commercial and PPP loans | 66 | — | — | 66 | 121,800 | 512 | 122,378 | — | ||||||||||||||||||||||||
Commercial real estate loans | 245 | — | — | 245 | 334,110 | 4,394 | 338,749 | — | ||||||||||||||||||||||||
Residential real estate loans | 1,427 | 211 | 869 | 2,507 | 228,145 | 650 | 231,302 | 762 | ||||||||||||||||||||||||
Consumer loans | 31 | 2 | — | 33 | 7,054 | — | 7,087 | — | ||||||||||||||||||||||||
Municipal loans | — | — | — | — | 6,182 | — | 6,182 | — | ||||||||||||||||||||||||
Total | $ | 1,852 | $ | 213 | $ | 869 | $ | 2,934 | $ | 706,549 | $ | 5,556 | $ | 715,039 | $ | 762 | ||||||||||||||||
December 31, 2020 | ||||||||||||||||||||||||||||||||
(In Thousands) | 30-59 Days Past Due | 60-89 Days Past Due | 90 Days or Greater Past Due | Total Past Due | Current | Total Loans | Total > 90 Days and Accruing | |||||||||||||||||||||||||
Agriculture loans | $ | 171 | $ | — | $ | — | $ | 171 | $ | 11,075 | $ | 11,246 | $ | — | ||||||||||||||||||
Commercial loans | 66 | — | 6 | 72 | 21,462 | 21,534 | — | |||||||||||||||||||||||||
Commercial real estate loans | 1,297 | — | — | 1,297 | 25,964 | 27,261 | — | |||||||||||||||||||||||||
Residential real estate loans | 1,248 | 831 | 338 | 2,417 | 165,119 | 167,536 | 147 | |||||||||||||||||||||||||
Consumer loans | 69 | 26 | — | 95 | 2,419 | 2,514 | — | |||||||||||||||||||||||||
Municipal loans | — | — | — | — | 6,749 | 6,749 | — | |||||||||||||||||||||||||
Total | $ | 2,851 | $ | 857 | $ | 344 | $ | 4,052 | $ | 232,788 | $ | 236,840 | $ | 147 | ||||||||||||||||||
F-
71
Impaired Loans
The following tables present the recorded investment and unpaid principal balances for impaired loans and related allowance, if applicable. Also presented are the average recorded investments and the related amount of interest recognized during the time within the period that the impaired loans were impaired.
As of December 31, 2021 | ||||||||||||
(In Thousands) | Recorded Investment | Unpaid Principal Balance | Related Allowance | |||||||||
With no related allowance recorded: | ||||||||||||
Agriculture loans | $ | — | $ | — | $ | — | ||||||
Commercial loans | 42 | 61 | — | |||||||||
Commercial real estate loans | — | — | — | |||||||||
Residential real estate loans | 709 | 779 | — | |||||||||
Consumer loans | — | — | — | |||||||||
Municipal loans | — | — | — | |||||||||
| — | — | — | ||||||||||
With an allowance recorded: | ||||||||||||
Agriculture loans | $ | — | $ | — | $ | — | ||||||
Commercial loans | — | — | — | |||||||||
Commercial real estate loans | — | — | — | |||||||||
Residential real estate loans | — | — | — | |||||||||
Consumer loans | — | — | — | |||||||||
Municipal loans | — | — | — | |||||||||
| — | — | — | ||||||||||
Total | ||||||||||||
Agriculture loans | $ | — | $ | — | $ | — | ||||||
Commercial loans | 42 | 61 | — | |||||||||
Commercial real estate loans | — | — | — | |||||||||
Residential real estate loans | 709 | 779 | — | |||||||||
Consumer loans | — | — | — | |||||||||
Municipal loans | — | — | — | |||||||||
$ | 751 | $ | 840 | $ | — | |||||||
As of December 31, 2020 | ||||||||||||
| Recorded Investment | Unpaid Principal Balance | Related Allowance | ||||||||||
With no related allowance recorded: | ||||||||||||
Agriculture loans | $ | — | $ | — | $ | — | ||||||
Commercial loans | 2 | 7 | — | |||||||||
Commercial real estate loans | — | — | — | |||||||||
Residential real estate loans | 295 | 332 | — | |||||||||
Consumer loans | — | — | — | |||||||||
Municipal loans | — | — | — | |||||||||
With an allowance recorded: | ||||||||||||
Agriculture loans | $ | — | $ | — | $ | — | ||||||
Commercial loans | — | — | — | |||||||||
F-
72
As of December 31, 2020 | ||||||||||||
| Recorded Investment | Unpaid Principal Balance | Related Allowance | ||||||||||
Commercial real estate loans | — | — | — | |||||||||
Residential real estate loans | — | — | — | |||||||||
Consumer loans | — | �� | — | — | ||||||||
Municipal loans | — | — | — | |||||||||
| — | — | — | ||||||||||
Total | ||||||||||||
Agriculture loans | $ | — | $ | — | $ | — | ||||||
Commercial loans | 2 | 7 | — | |||||||||
Commercial real estate loans | — | — | — | |||||||||
Residential real estate loans | 295 | 332 | — | |||||||||
Consumer loans | — | — | — | |||||||||
Municipal loans | — | — | — | |||||||||
| $ | 297 | $ | 339 | $ | — | |||||||
For the Year Ended December 31, | ||||||||||||||||
2021 | 2020 | |||||||||||||||
(In Thousands) | Average Recorded Investment | Interest Income Recognized | Average Recorded Investment | Interest Income Recognized | ||||||||||||
With no related allowance recorded: | ||||||||||||||||
Agriculture loans | $ | — | $ | — | $ | — | $ | — | ||||||||
Commercial loans | — | 3 | 1 | |||||||||||||
Commercial real estate loans | — | — | — | — | ||||||||||||
Residential real estate loans | 759 | 20 | 345 | 11 | ||||||||||||
Consumer loans | — | — | — | — | ||||||||||||
Municipal loans | — | — | — | — | ||||||||||||
| $ | 759 | $ | 20 | $ | 348 | $ | 12 | |||||||||
With an allowance recorded: | ||||||||||||||||
Agriculture loans | — | — | — | — | ||||||||||||
Commercial loans | — | — | — | — | ||||||||||||
Commercial real estate loans | — | — | — | — | ||||||||||||
Residential real estate loans | — | — | — | — | ||||||||||||
Consumer loans | — | — | — | — | ||||||||||||
Municipal loans | — | — | — | — | ||||||||||||
| $ | — | $ | — | $ | — | $ | — | |||||||||
Total | $ | 759 | $ | 20 | $ | 348 | $ | 12 | ||||||||
The following table present nonaccrual loans by classes of the loan portfolio:
(In Thousands) | December 31, 2021 | December 31, 2020 | ||||||
Agriculture loans | $ | — | $ | — | ||||
Commercial loans | 39 | 48 | ||||||
Commercial real estate loans | 144 | — | ||||||
Residential real estate loans | 449 | 421 | ||||||
Consumer loans | 2 | — | ||||||
Municipal loans | — | — | ||||||
Total | $ | 634 | $ | 469 | ||||
F-
73
Approximately $338,749 or 47.4% of the Bank’s loan portfolio was in commercial real estate loans at December 31, 2021. While the Bank does not have a concentration of credit risk with any single borrower or industry, repayments on loans in these portfolios can be negatively influenced by decreases in real estate values. The Bank mitigates this risk through conservative underwriting policies and procedures. In addition, $109,226 of real estate-commercial loans were owner occupied properties as of December 31, 2021. These types of loans are generally considered to involve less risk than nonowner-occupied mortgages.
At December 31, 2021 and 2020, the carrying amount of borrowings secured by loans pledged to the FHLB under its blanket lien was $0 and $1,120, respectively.
Loan Modifications and Troubled Debt Restructurings (TDRs)
A loan is considered to be a TDR loan when the Company grants a concession to the borrower because of the borrower’s financial condition that it would not otherwise consider. Such concessions include the reduction of interest rates, forgiveness of principal or interest, or other modifications of interest rates that are less than the current market rate for new obligations with similar risk.
The Bank may grant a concession or modification for economic or legal reasons related to a borrower’s financial condition that it would not otherwise consider resulting in a modified loan which is then identified as a troubled debt restructuring (TDR). The Bank may modify loans through rate reductions, extensions of maturity, interest only payments, or payment modifications to better match the timing of cash flows due under the modified terms with the cash flows from the borrowers’ operations. Loan modifications are intended to minimize the economic loss and to avoid foreclosure or repossession of the collateral. TDRs are considered impaired loans for purposes of calculating the Bank’s allowance for loan losses.
The Bank identifies loans for potential restructure primarily through direct communication with the borrower and evaluation of the borrower’s financial statements, revenue projections, tax returns, and credit reports. Even if the borrower is not presently in default, management will consider the likelihood that cash flow shortages, adverse economic conditions, and negative trends may result in a payment default in the near future. As of December 31, 2021 and December 31, 2020, the Company had no loans identified as TDRs. There were also no new loan modifications during the periods that were considered TDRs.
COVID-19
Loan Forbearance ProgramsSection 4013 of the CARES Act provides that banks may elect not to categorize a loan modification as a TDR if the loan modification is (1) related to
COVID-19;
(2) executed on a loan that was not more than 30 days past due as of December 31, 2019; and (3) executed between March 1, 2020, and the earlier of (A) 60 days after the date on which the national emergency concerning the novel coronavirus disease (COVID–19) outbreak declared by the President on March 13, 2020, under the National Emergencies Act terminates, or (B) January 1, 2022.On April 7, 2020, federal banking regulators issued a revised interagency statement that included guidance on their approach for the accounting of loan modifications in light of the economic impact of the
COVID-19
pandemic. The guidance interprets current accounting standards and indicates that a lender can conclude that a borrower is not experiencing financial difficulty if short-term modifications are made in response toCOVID-19,
such as payment deferrals, fee waivers, extensions of repayment terms, or other delays in payment that are insignificant related to the loans in which the borrower is less than 30 days past due on its contractual payments at the time a modification program is implemented.According to the Interagency Statement on Loan Modifications and Reporting for Financial Institutions Working with Customers Affected by the Coronavirus (Revised) issued by the federal bank regulatory agencies on April 7, 2020, short-term loan modifications not otherwise eligible under Section 4013 that are made on a good faith basis in response to
COVID-19
to borrowers who were current prior to any relief are not TDRs. This includes short-term (e.g., six months) modifications such as payment deferrals, fee waivers, extensions of repayment terms, or other delays in payment that are insignificant. As of December 31, 2021, the Company had no loans that remain on a CARES Act modification.F-
74
In addition, the risk-rating on
COVID-19
modified loans did not change, and these loans will not be considered past due until after the deferral period is over and scheduled payments resume. The credit quality of these loans will be reevaluated after the deferral period ends.7. | PROPERTY, PLANT, AND EQUIPMENT |
Year-end
premises and equipment owned and utilized in the operations of the Company were as follows:December 31, | ||||||||
(In Thousands) | 2021 | 2020 | ||||||
Land | $ | 689 | $ | 821 | ||||
Buildings and improvements | 4,190 | 4,146 | ||||||
Furniture, fixtures, and equipment | 2,939 | 1,576 | ||||||
Leasehold Improvements | 941 | — | ||||||
| 8,759 | 6,543 | |||||||
Accumulated Depreciation | (3,470 | ) | (3,115 | ) | ||||
Total | $ | 5,289 | $ | 3,428 | ||||
Depreciation expense was $355 and $244 for 2021 and 2020, respectively.
8. | LEASE COMMITMENTS |
The following table presents information associated with our obligations under leases for the year ended December 31, 2021.
2021 | 2020 | |||||||
Weighted-average remaining term (years) | 12.9 | 6.1 | ||||||
Weighted-average discount rate | 4.9 | % | 2.4 | % | ||||
Total lease expense recorded during the year ended December 31, 2021 and 2020 was $206 and $65, respectively. The Company leases its administration and operating facility and six offices under lease agreements with various expirations through February 2039.
Certain of the Company’s leases contain options to renew the lease after the initial term. Management considers the Company’s historical pattern of exercising renewal options on leases and the positive performance of the leased locations, when determining whether it is reasonably certain that the leases will be renewed. If management concludes that there is reasonable certainty about the renewal option, it is included in the calculation of the remaining term of each applicable lease.
The following table presents the undiscounted cash flows due related to operating leases as of December 31, 2021:
(In Thousands) | Amount | |||
2022 | $ | 403 | ||
2023 | 409 | |||
2024 | 426 | |||
2025 | 434 | |||
2026 and thereafter | 4,424 | |||
Total Undiscounted Cash Flows | $ | 6,096 | ||
Discount on Cash Flows | (1,416 | ) | ||
Total lease liabilities | $ | 4,680 | ||
F-
75
9. | GOODWILL AND INTANGIBLE ASSETS |
Goodwill
The change in goodwill during the year is as follows:
2021 | 2020 | |||||||
Beginning of year | $ | 2,333 | $ | 2,333 | ||||
Acquired Goodwill | 33,509 | — | ||||||
Impairment | — | — | ||||||
End of year | $ | 35,842 | $ | 2,333 | ||||
Impairment exists when a reporting unit’s carrying value of goodwill exceeds its fair value. At December 31, 2021, the Company’s reporting unit had positive equity and the Company elected to perform a qualitative assessment to determine if it was more likely than not that the fair value of the reporting unit exceeded its carrying value, including goodwill. The qualitative assessment indicated that it was more likely than not that the fair value of the reporting unit exceeded its carrying value, resulting in no impairment of goodwill.
Acquired Intangible Assets
Acquired intangible assets were as follows at
year-end:
2021 | 2020 | |||||||||||||||
Gross Carrying Amount | Accumulated Amortization | Gross Carrying Amount | Accumulated Amortization | |||||||||||||
Amortized intangible assets: | ||||||||||||||||
Core deposit intangibles | $ | 1,566 | $ | 589 | $ | 656 | $ | 479 | ||||||||
Trade name intangibles | 348 | 15 | — | — | ||||||||||||
Total | $ | 1,914 | $ | 604 | $ | 656 | $ | 479 | ||||||||
Aggregate amortization expense for the years ended December 31, 2021 and 2020 was $125 and $65, respectively.
Expected amortization for the next five years is as follows:
(In Thousands) | ||||
2022 | $ | 263 | ||
2023 | 238 | |||
2024 | 212 | |||
2025 | 185 | |||
2026 | 166 | |||
10. | DEPOSITS |
Deposit accounts are summarized as follows:
December 31, 2021 | December 31, 2020 | |||||||||||||||
(In Thousands) | Amount | % | Amount | % | ||||||||||||
Demand, noninterest-bearing | $ | 129,243 | 16.75 | % | $ | 66,573 | 17.75 | % | ||||||||
Demand, interest-bearing | 256,258 | 33.21 | 158,708 | 42.31 | ||||||||||||
Money market and savings | 205,843 | 26.67 | 69,188 | 18.44 | ||||||||||||
Time deposits, $250 and over | 56,266 | 7.29 | 14,253 | 3.80 | ||||||||||||
Time deposits, other | 124,055 | 16.08 | 66,402 | 17.70 | ||||||||||||
$ | 771,665 | 100.0 | % | $ | 375,124 | 100.0 | % | |||||||||
F-
76
The scheduled maturities of time deposits are as follows:
(In Thousands) | December 31, 2021 | |||
One year or less | $ | 118,629 | ||
More than one year to two years | 36,575 | |||
More than two years to three years | 10,754 | |||
More than three years to four years | 9,026 | |||
More than four years to five years | 4,888 | |||
More than five years | 449 | |||
Total | $ | 180,321 | ||
11. | BORROWINGS AND SUBORDINATED DEBENTURES |
Other borrowings and subordinated debt was as follows:
(in Thousands) | December 31, 2021 | December 31, 2020 | ||||||
Long-term FHLB advances | $ | — | $ | 1,120 | ||||
Subordinated Debt | 20,696 | — | ||||||
Federal Reserve PPPLF | 19,814 | — | ||||||
Total Long-term borrowings | $ | 40,510 | $ | 1,120 | ||||
As part of the Merger, the Company assumed $20.0 million ofRate Subordinated Notes. The notes mature October 1, 2030 and will initially bear interest at a fixed rate of 5.0% until October 1, 2025. From October 1, 2025 to the stated maturity date or early redemption date, the interest rate will reset semi-annually to an annual floating rate equal to the then-current three-month term Secured Overnight Financing Rate (SOFR) plus a spread of 475 basis points, but no less than 5.0%.
Fixed-to-Floating
The Company may redeem the the Subordinated Notes, in whole or in part, on or after October 1, 2025, plus accrued and unpaid interest. The Subordinated Notes are also redeemable in whole or in part upon the occurrence of specific events defined within the indenture.
The Subordinated Notes may be included in Tier I capital (subject to certain limitations) under current regulatory guidelines and interpretations.
The investors in the Subordinated Notes included two related party entities that are controlled by a member of the Board of Directors of the Company, which purchased a combined $19 million in principal amounts of the note.
12. | EMPLOYEE BENEFITS |
Retirement Plan
The Company maintains a 401(k) Plan for its eligible employees. The Plan allows employee contributions from their compensation as defined in the 401(k) Plan, subject to Internal Revenue Code limitations. For the year ended December 31, 2020, the Company made a 3 percent
non-elective
contribution to all eligible participants as of the end of the plan year, based onW-2
wages for that period. The Company also made a discretionary contribution of 6 percent ofW-2
wages for the year ended December 31, 2020. Effective January 1, 2021 until September 30, 2021, the Company made anon-elective
contribution of 4 percent ofW-2
wages to all participants. Effective October 1, 2021, the Company matches 50 percent of the first 6 percent of the employee’s contribution, and this match is immediately vested. Matching contributions to the 401(k) Plan recognized in Compensation expense for the year ended December 31, 2021 and 2020, was $65 and $154,respectively.
F-
77
Deferred Compensation Plans
The Company has a deferred compensation plan for the benefit of members of the Board of Directors and certain officers. The plan provides all directors and certain officers with the ability to defer receipt of some or all of their director fees or salary and bonuses. The deferrals, along with accumulated earnings, are payable at retirement. The Bank has purchased life insurance policies on each director and officer that are actuarially designed to offset the annual expenses associated with the deferred compensation and the supplemental executive retirement plan (“SERP”). The Bank is the sole owner and beneficiary of all policies. The Bank accrues the estimated annual costs of the deferred amounts that will be payable at retirement. At December 31, 2021 and 2020, the accumulated liability was approximately $1.24 million and $1.21 million, respectively. For the years ended December 31, 2021 and 2020, the Company recognized director deferred compensation cost in noninterest expense of $57 and $128.
Supplemental Executive Retirement Plan
The Company maintains a SERP for certain executives. At December 31, 2021 and 2020, the accumulated liability was $953 and $743, respectively, and is included in other liabilities on the accompanying Consolidated Balance Sheets. The expense for the years ended December 31, 2021 and 2020, was $206 and $140, respectively. Benefit payments amounted to $119 and $112 for the years ended December 31, 2021 and 2020, respectively.
13. | INCOME TAXES |
The provision for income taxes consists of:
For the Twelve Months Ended | ||||||||
(In Thousands) | 2021 | 2020 | ||||||
Current tax (benefit) expense | $ | (265 | ) | $ | 663 | |||
Deferred tax expense (benefit) | 76 | (18 | ) | |||||
Total | $ | (189 | ) | $ | 645 | |||
The tax effects of deductible and taxable temporary differences that gave rise to significant portions of the deferred tax assets and deferred tax liabilities, respectively, are as follows:
(In Thousands) | December 31, 2021 | December 31, 2020 | ||||||
Deferred tax assets: | ||||||||
Allowance for loan losses | $ | 706 | $ | 571 | ||||
Deferred compensation | 295 | 266 | ||||||
Net fair value adjustment on acquired net assets | 1,700 | 59 | ||||||
Net operating loss carryforwards | 2,263 | 67 | ||||||
Other | 8 | 23 | ||||||
Total deferred tax assets | 4,972 | 986 | ||||||
Deferred tax liabilities: | ||||||||
Premises and equipment | $ | (350 | ) | $ | (95 | ) | ||
Net unrealized gain on debt securities | (491 | ) | (847 | ) | ||||
Mortgage servicing rights | (93 | ) | (58 | ) | ||||
Deferred loan fees | 0 | (8 | ) | |||||
Total deferred tax liabilities | (934 | ) | (1,008 | ) | ||||
Net deferred tax asset (liability) | $ | 4,038 | $ | (22 | ) | |||
F-
78
The Company also has a $10,778 net operating loss carryforward at December 31, 2021 of which $450 will begin to expire in 2030. The remaining $10,328 of net operating loss carryforward does not expire. The Company had no valuation allowance against its deferred tax assets in view of the Company’s ability to realize the net deferred tax assets against future anticipated taxable income.
The reconciliation of the federal statutory rate and the Company’s effective income tax rate is as follows:
For the Year Ended December 31, | ||||||||||||||||
2021 | 2020 | |||||||||||||||
(In Thousands) | Amount | % of Pretax Income | Amount | % of Pretax Income | ||||||||||||
Provision at statutory rate | $ | 21 | 21.0 | % | $ | 1,016 | 21.0 | % | ||||||||
Tax-exempt income on debt securities | (291 | ) | (291.3 | ) | (299 | ) | (6.2 | ) | ||||||||
Bank-owned life insurance | (53 | ) | (53.0 | ) | (39 | ) | (0.8 | ) | ||||||||
Non-deductible merger expenses | 149 | (149.2 | ) | — | — | |||||||||||
Other | (15 | ) | (14.6 | ) | (33 | ) | (0.7 | ) | ||||||||
Actual tax expense and effective rate | $ | (189 | ) | (188.6 | )% | $ | 645 | 13.3 | % | |||||||
The Company recognized no adjustment for uncertain tax positions or unrecognized income tax benefits for the years ended December 31, 2021 and 2020. The Company’s policy is to recognize interest and penalties on unrecognized tax benefits in the provision for income tax expense in the consolidated statements of operation. The Company did not recognize any interest and penalties for the years ended December 31, 2021 and 2020. With few exceptions, the Company is no longer subject to U.S. federal, state, or local income tax examinations by tax authorities for years before 2018.
14. | FAIR VALUE MEASUREMENTS |
Management uses its best judgment in estimating the fair value of the Company’s financial instruments; however, there are inherent weaknesses in an estimation technique. Therefore, for substantially all financial instruments, the fair value estimates herein are not necessarily indicative of the amounts The Company could have realized in a sales transaction on the dates indicated. The estimated fair value amounts have been measured as of their respective year-ends and have not been
re-evaluated
or updated for purposes of these financial statements subsequent to those respective dates. As such, the estimated fair values of these financial instruments subsequent to the respective reporting dates may be different than the amounts reported at eachyear-end.
The Company uses fair value measurements to record fair value adjustments to certain assets and liabilities and to determine fair value disclosures. In accordance with the fair value measurements accounting guidance (FASB ASC 820,), the fair value of a financial instrument is the price that would be received to sell an asset or paid to transfer a liability in an orderly transaction between market participants at the measurement date. Fair value is best determined based upon quoted market prices. However, in many instances, there are no quoted market prices for the Company’s various financial instruments. In cases where quoted market prices are not available, fair values are based on estimates using present value or other valuation techniques. Those techniques are significantly affected by the assumptions used, including the discount rate and estimates of future cash flows. Accordingly, the fair value estimates may not be realized in an immediate settlement of the instrument.
Fair Value Measurements
The Company uses a consistent definition of fair value, which focuses on exit price in an orderly transaction (that is, not a forced liquidation or distressed sale) between market participants at the measurement date under current market conditions. If there has been a significant decrease in the volume and level of activity for the asset or liability, a change in valuation technique or the use of multiple valuation techniques may be appropriate. In such instances, determining the price at which willing market participants would transact at the measurement date under current market conditions depends on the facts and circumstances and requires
F-
79
the use of significant judgment. The fair value guidance establishes a fair value hierarchy that prioritizes the inputs to valuation methods used to measure fair value. The hierarchy gives the highest priority to unadjusted quoted prices in active markets for identical assets or liabilities (Level 1 measurements) and the lowest priority to unobservable inputs (Level 3 measurements). The three levels of the fair value hierarchy are as follows:
The following disclosures show the hierarchal disclosure framework associated with the level of pricing observations utilized in measuring assets and liabilities at fair value. The three broad levels of pricing are as follows:
| Level I: | Quoted prices are available in active markets for identical assets or liabilities as of the reported date. | |||
| Level II: | Pricing inputs are other than the quoted prices in active markets, which are either directly or indirectly observable as of the reported date. The nature of these assets and liabilities includes items for which quoted prices are available but traded less frequently and items that are fair-valued using other financial instruments, the parameters of which can be directly observed. | |||
| Level III: | Valuations derived from valuation techniques in which one or more significant inputs or significant value drivers are unobservable. | |||
This hierarchy requires the use of observable market data when available.
The estimated fair values of the Company’s financial instruments that are not required to be measured or reported at fair value are as follows:
At December 31, 2021 | At December 31, 2020 | |||||||||||||||
(In Thousands) | Carrying Amount | Fair Value | Carrying Amount | Fair Value | ||||||||||||
Financial assets: | ||||||||||||||||
Cash and cash equivalents (Level 1) | $ | 22,590 | $ | 22,590 | $ | 33,162 | $ | 33,162 | ||||||||
Certificates of deposit with other banks (Level 3) | 12,828 | 12,828 | 17,051 | 17,051 | ||||||||||||
Loans (Level 3) | 711,664 | 705,706 | 233,795 | 236,030 | ||||||||||||
Accrued interest receivable (Level 1) | 3,022 | 3,022 | 1,675 | 1,675 | ||||||||||||
Restricted investments in bank stock (Level 1) | 2,685 | 2,685 | 2,268 | 2,268 | ||||||||||||
Cash surrender value of life insurance (Level 1) | 18,787 | 18,787 | 8,941 | 8,941 | ||||||||||||
Financial liabilities: | ||||||||||||||||
Non-maturity deposits (Level 1) | 591,344 | 591,344 | 294,469 | 294,469 | ||||||||||||
Time Deposits (Level 3) | 180,321 | 180,485 | 80,655 | 81,164 | ||||||||||||
Long-term borrowings (Level 3) | 19,814 | 19,819 | 1,120 | 1,116 | ||||||||||||
Subordinated Notes (Level 3) | 20,696 | 20,696 | — | — | ||||||||||||
Accrued interest payable (Level 1) | 103 | 103 | 233 | 233 | ||||||||||||
The following tables present the assets reported on the Consolidated Balance Sheet at their fair value on a recurring basis as of December 31, 2021 and 2020, by level within the fair value hierarchy. Financial assets and liabilities are classified in their entirety based on the lowest level of input that is significant to the fair value measurement.
The Company’sinvestment securities are reported at fair value. These securities are valued by an independent third party. The valuations are based on market data. They utilize evaluated pricing models that vary by asset and incorporate available trade, bid and other market information. For securities that do not trade on a daily basis, their evaluated pricing applications apply available information such as benchmarking and matrix pricing. The market inputs normally sought in the evaluation of securities include benchmark yields, reported trades, broker/dealer quotes (only obtained from market makers or broker/dealers recognized as market participants), issuer spreads,
available-for-sale
two-sided
markets, benchmark securities, bid, offers and reference data. For certain securities additional inputs may be used or some market inputs may not be applicable. Inputs are prioritized differently on any given day based on market conditions.F-
80
December 31, 2021 | ||||||||||||||||
(In Thousands) | Level I | Level II | Level III | Total | ||||||||||||
Assets: | ||||||||||||||||
Small Business Administration loan pools | — | 1,084 | — | 1,084 | ||||||||||||
Obligations of state and political subdivisions | — | 48,482 | — | 48,482 | ||||||||||||
Mortgage backed securities | — | 54,217 | — | 54,217 | ||||||||||||
Total | $ | — | $ | 103,783 | $ | — | $ | 103,783 | ||||||||
December 31, 2020 | ||||||||||||||||
(In Thousands) | Level I | Level II | Level III | Total | ||||||||||||
Assets: | ||||||||||||||||
Small Business Administration loan pools | $ | — | $ | 7,994 | $ | — | $ | 7,994 | ||||||||
Obligations of state and political subdivisions | — | 52,059 | — | 52,059 | ||||||||||||
Mortgage backed securities | — | 65,394 | — | 65,394 | ||||||||||||
Total | $ | — | $ | 125,447 | $ | — | $ | 125,447 | ||||||||
For financial assets measured at fair value on a nonrecurring basis, the fair value measurements by level within the fair value hierarchy used as of December 31, 2021 are presented in the table below. There were no impaired loans measured at their fair value on a nonrecurring basis as of December 31, 2020.
December 31, 2021 | ||||||||||||||||
(In Thousands) | Level I | Level II | Level III | Total | ||||||||||||
Impaired loans | $ | — | $ | — | $ | 751 | $ | 751 | ||||||||
Loans Held for Sale | $ | — | $ | — | $ | 3,860 | $ | 3,860 | ||||||||
December 31, 2020 | ||||||||||||||||
(In Thousands) | Level I | Level II | Level III | Total | ||||||||||||
Loans Held for Sale | $ | — | $ | — | $ | 1,015 | $ | 1,015 | ||||||||
The following tables provide information describing the valuation processes used to determine nonrecurring fair value measurements categorized within Level III of the fair value hierarchy:
December 31, 2021 | ||||||||||||||||||||
| Quantitative Information About Level III Fair Value Measurements | ||||||||||||||||||||
(In Thousands) | Fair Value | Valuation Techniques | Unobservable Input | Range (Weighted Average) | ||||||||||||||||
Impaired loans | $ | 751 | | Appraisal of collateral | | (1 | ) | | Liquidation expenses | 10 | % | |||||||||
Loans Held for Sale | $ | 3,860 | | Appraisal of collateral | | (1 | ) | | Liquidation of collateral | | 15 | % | ||||||||
December 31, 2020 | ||||||||||||||||||||
| Quantitative Information About Level III Fair Value Measurements | ||||||||||||||||||||
(In Thousands) | Fair Value | Valuation Techniques | Unobservable Input | Range (Weighted Average) | ||||||||||||||||
Loans Held for Sale | $ | 1,015 | | Appraisal of collateral | | (1 | ) | | Liquidation of collateral | | 10 | % | ||||||||
F-
81
(1) | Fair value is generally determined through independent appraisals of the underlying collateral, which include various Level III inputs that are not identifiable. |
Appraisals may be adjusted by management for qualitative factors, such as economic conditions, aging, and/or estimated liquidation expenses incurred when selling the collateral. The range and weighted average of appraisal adjustments and liquidation expenses are presented as a percentage of the appraisal.
15. | RELATED PARTY TRANSACTIONS |
Loans to principal officers, directors, and their affiliates during 2021 were as follows:
2021 | ||||
Beginning balance | $ | 325 | ||
New loans | 1,305 | |||
Effect of changes in composition of related parties | 4,774 | |||
Net repayments in existing accounts | (28 | ) | ||
Ending balance | $ | 6,376 | ||
Deposits from principal officers, directors, and their affiliates as of December 31, 2021 and 2020 were $34,211 and $2,874, respectively.
Two companies owned by a Director of the Company invested in the subordinated debentures issued by the Company. Refer to Note 11 for further information.
16. | STOCK-BASED COMPENSATION |
As a result of the Merger, the Company assumed the LINKBANCORP, Inc. 2019 Equity Incentive Plan (the “Plan”).The Plan authorizes the issuance or delivery to participants of up to 450,000 shares of LINKBANCORP, Inc. common stock pursuant to grants of incentive and
non-statutory
stock options. The Plan is administered by the members of LINKBANCORP, Inc.’s Compensation Committee (the “Committee”). Unless the Committee specifies a different vesting schedule, awards under the Plan shall be granted with a vesting rate of 20 percent per year. Vesting may be accelerated under certain conditions or at the discretion of the Committee at any time. Employees and directors of LINKBANCORP, Inc. or its subsidiaries are eligible to receive awards under the plan, except that nonemployees may not be granted incentive stock options. Stock options are either “incentive” stock options or “nonqualified” stock options. Incentive stock options have certain tax advantages and must comply with the requirements of Section 422 of the Internal Revenue Code. The table below provides details of the Company’s stock options at December 31, 2021.Number of Stock Options | Weighted- Average Exercise Price | Weighted- Average Remaining Contractual Term in Years | Aggregate Intrinsic Value (in ‘000s) | |||||||||||||
Outstanding, December 31, 2020 | — | $ | — | — | $ | — | ||||||||||
Assumed in business combination | 406,000 | 10.19 | 7.9 | |||||||||||||
Granted | 35,500 | 12.26 | 7.9 | |||||||||||||
Expired/terminated | (8,000 | ) | 12.00 | — | ||||||||||||
Exercised | (12,000 | ) | 10.00 | — | ||||||||||||
Outstanding, December 31, 2021 | 421,500 | $ | 10.46 | 7.9 | $ | 780 | ||||||||||
Exercisable at period end | 145,200 | $ | 10.04 | 7.5 | $ | 315 | ||||||||||
The exercise prices for options outstanding as of December 31, 2021 ranged from $10.00 to $14.50. Because the stock options issued by the Company historically relate to LINKBANK employees and given
F-
82
the reverse acquisition accounting described in Note 1 paired with the timing of the Merger between the Company and GNBF, the Company recognized no compensation expense during the years ended December 31, 2021 and 2020.
The Company determined the expected life of the stock options using a simplified method approach allowed for plain-vanilla share options. The risk-free interest rate is based on the U.S. treasury yield curve in effect as of the grant date. Expected volatility was determined using the calculated value method of an option pricing model that substitutes the historical volatility of an appropriate industry/sector index for the expected volatility.
December 31, | ||||||||
2021 | 2020 | |||||||
Weighted average fair value of options granted | $ | 1.13 | $ | 0.25 | ||||
Dividend yield | 0.00 | % | 0.00 | % | ||||
Expected volatility | 4.36 | % | 4.36 | % | ||||
Risk-free interest rate | 0.08 | % | 0.62 | % | ||||
Expected life (in years) | 7.0 | 6.0 | ||||||
Assumed forfeiture rate | 8.00 | % | 8.00 | % | ||||
Additional information related to the stock option plan during each year follows:
December 31, | ||||||||
2021 | 2020 | |||||||
Stock-based compensation expense recognized | $ | 25 | $ | — | ||||
Number of unvested stock options | 276,300 | — | ||||||
Fair value of unvested stock options | $ | 210 | $ | — | ||||
Amount remaining to be recognized as expense | $ | 218 | $ | — | ||||
The remaining amount of $218 will be recognized ratably as expense through December 31, 2026.
17. | REGULATORY CAPITAL REQUIREMENTS |
The Company is subject to various regulatory capital requirements administered by the Federal Deposit Insurance Corporation and the Pennsylvania Department of Banking and Securities. Failure to meet minimum capital requirements can initiate certain mandatory, and possible additional discretionary, actions by regulators that, if undertaken, could have a direct material effect on the Company’s consolidated financial statements. Under capital adequacy guidelines and the regulatory framework for prompt corrective action, the Company must meet specific capital guidelines that involve quantitative measures of the Company’s assets, liabilities, and certain
off-balance
sheet items as calculated under regulatory accounting practices. The Company’s capital amounts and classification are also subject to qualitative judgments by the regulators about components, risk-weightings, and other factors.The Bank and Company are subject to regulatory capital requirements administered by banking agencies. Capital adequacy guidelines and prompt corrective action regulations involve quantitative measures of assets, liabilities, and certain
off-balance-sheet
items calculated under regulatory accounting practices. Capital amounts and classifications are also subject to qualitative judgments by regulators about components, risk weightings, and other factors and the regulators can lower classifications in certain cases. Failure to meet various capital requirements can initiate regulatory action that could have a direct material effect on the financial statements. As of December 31, 2021, the Bank has met all capital adequacy requirements to which it is subject.The prompt corrective action regulations provide five classifications, including well capitalized, adequately capitalized, under-capitalized, significantly undercapitalized, and critically undercapitalized, although these terms are not used to represent overall financial condition. If an institution is adequately capitalized,
F-
83
regulatory approval is required before the institution may accept brokered deposits. If an institution is undercapitalized, capital distributions are limited, as is asset growth and expansion, and plans for capital restoration are required.
The capital conservation buffer is designed to absorb losses during periods of economic stress. Banking institutions with a ratio of Common Equity Tier 1 capital to risk-weighted assets above the minimum but below the conservation buffer (or below the combined capital conservation buffer and countercyclical capital buffer, when the latter is applied) will face limitations on dividends, stock repurchases and certain discretionary bonus payments to management based on the amount of the shortfall. Under Basel III rules, banks must hold a capital conservation buffer above the adequately capitalized risk-based capital ratios. The required capital conservation buffer is 2.50%.
The following tables present actual and required capital ratios as of December 31, 2021 and 2020 under the Basel III Capital Rules. Capital levels required to be considered well capitalized are based upon prompt corrective action regulations:
December 31, 2021 | December 31, 2020 | |||||||||||||||
(In Thousands) | Amount | Ratio | Amount | Ratio | ||||||||||||
Total capital | ||||||||||||||||
(to risk-weighted assets) | ||||||||||||||||
Actual | $ | 81,355 | 11.50 | % | $ | 36,484 | 14.33 | % | ||||||||
For capital adequacy purposes | 56,578 | 8.00 | 20,367 | 8.00 | ||||||||||||
To be well capitalized | 70,722 | 10.00 | 24,459 | 10.00 | ||||||||||||
Tier 1 capital | ||||||||||||||||
(to risk-weighted assets) | ||||||||||||||||
Actual | $ | 77,904 | 11.02 | % | $ | 33,666 | 13.22 | % | ||||||||
For capital adequacy purposes | 42,433 | 6.00 | 15,275 | 6.00 | ||||||||||||
To be well capitalized | 56,578 | 8.00 | 20,367 | 8.00 | ||||||||||||
Common equity | ||||||||||||||||
(to risk-weighted assets) | ||||||||||||||||
Actual | $ | 77,904 | 11.02 | % | $ | 33,666 | 13.22 | % | ||||||||
For capital adequacy purposes | 31,825 | 4.50 | 11,456 | 4.50 | ||||||||||||
To be well capitalized | 45,969 | 6.50 | 16,548 | 6.50 | ||||||||||||
Tier 1 capital | ||||||||||||||||
(to average assets) | ||||||||||||||||
Actual | $ | 77,904 | 8.85 | % | $ | 33,666 | 7.90 | % | ||||||||
For capital adequacy purposes | 35,230 | 4.00 | 17,054 | 4.00 | ||||||||||||
To be well capitalized | 44,038 | 5.00 | 21,317 | 5.00 | ||||||||||||
The federal banking agencies, including the FDIC, issued a rule pursuant to The Economic Growth, Regulatory Relief and Consumer Protection Act of 2018 to establish for institutions with assets of less than $10 billion a “community bank leverage ratio” (the ratio of a bank’s tier 1 capital to average total consolidated assets) of 9% that qualifying institutions may elect to use in lieu of the generally applicable leverage and risk-based capital requirements under Basel III. Pursuant to the CARES Act, the federal banking agencies issued a final rule in August 2020 to lower the community bank leverage ratio to 8% beginning in the second calendar quarter of 2020 through the end of 2020. In 2021, the community bank leverage ratio increased to 8.5% for the calendar year. The community bank leverage ratio requirement will return to 9% effective January 1, 2022. If an election to use the community bank leverage ratio capital framework is made, a qualifying bank with less than $10 billion in assets with capital exceeding the specified community bank leverage ratio is considered compliant with all applicable regulatory capital and leverage requirements, including the requirement to be “well capitalized.” As of December 31, 2021, the Bank had not elected to be subject to the alternative
framework.
F-84
Federal and state banking regulations place certain restrictions on dividends paid by the Bank. The Pennsylvania Banking Code provides that cash dividends may be declared and paid out of accumulated net earnings. In addition, dividends paid by the Bank would be prohibited if the effect thereof would cause the Bank’s capital to be reduced below applicable minimum capital requirements. Loans or advances by the Bank to the Company are limited to 10 percent of the Bank’s capital stock and surplus and must have collateral securing the loans or advances.
18. | FINANCIAL INSTRUMENTS WITH OFF-BALANCE SHEET RISK |
The Company is a party to financial instruments with
off-balance
sheet risk in the normal course of business to meet the financing needs of its customers. These financial instruments include commitments to extend credit. Such commitments involve, to varying degrees, elements of credit and interest rate risk in excess of the amount recognized in the consolidated balance sheets.The Company’s exposure to credit loss in the event of nonperformance by the other party to the financial instrument for commitments to extend credit is represented by the contractual amount of those instruments. The Company uses the same credit policies in making and monitoring commitments and conditional obligations as it does for
on-balance
sheet instruments. As of December 31, 2021 and 2020, the Company has a reserve related to credit losses foroff-balance
sheet instruments totaling $54 and $29, respectively, which is included in other liabilities.At December 31, 2021 and 2020, the following financial instruments were outstanding whose contract amounts represent credit risk:
(In Thousands) | December 31, 2021 | December 31, 2020 | ||||||
Unfunded commitments under lines of credit: | ||||||||
Home equity loans | $ | 17,774 | $ | 6,815 | ||||
Commercial real estate, construction, and land development | 20,609 | 3,801 | ||||||
Commercial and industrial | 100,440 | 35,517 | ||||||
Other | 6,244 | 1,081 | ||||||
Total | $ | 145,067 | $ | 47,214 | ||||
Commitments to extend credit are agreements to lend to a customer as long as there is no violation of any condition established in the contract. Since many of the commitments are expected to expire without being drawn upon, the total commitment amounts do not necessarily represent future cash requirements. Commitments generally have fixed expiration dates or other termination clauses and may require payment of a fee. The Company evaluates each customer’s credit worthiness on abasis. The amount of collateral obtained, if deemed necessary by the Company upon extension of credit, is based on management’s credit evaluation. Collateral held varies but may include personal or commercial real estate, accounts receivable, inventory, and equipment.
case-by-case
19. | EARNINGS PER SHARE |
The following table sets forth the composition of earnings per share:
Year Ended December 31, | ||||||||
(In Thousands, except share and per share data) | 2021 | 2020 | ||||||
Net income | $ | 289 | $ | 4,193 | ||||
Basic weighted average common shares outstanding | 6,879,658 | 5,691,686 | ||||||
Net effect of dilutive stock options and warrants | 370,805 | — | ||||||
Diluted weighted average common shares outstanding | 7,250,463 | 5,691,686 | ||||||
Net income per common share: | ||||||||
Basic | $ | 0.04 | $ | 0.74 | ||||
Diluted | $ | 0.04 | $ | 0.74 | ||||
F-
85
The following is a summary of securities that could potentially dilute basic earnings per common share in future periods that were included in the computation of diluted earnings per common share for the year ended December 31, 2021. There were no dilutive securities in 2020. For the years ended December 31, 2021 and 2020, the Company had no securities that were excluded from the calculation of diluted weighted average common shares because their inclusion would have been anti-dilutive.
Warrants | $ | 1,537,484 | ||
Share-based compensation awards | 161,100 | |||
Total dilutive securities | $ | 1,698,584 | ||
20. | CONCENTRATION OF CREDIT RISK |
The Company grants commercial, residential and consumer loans to customers primarily located in the South Central and Greater Delaware Valley of Pennsylvania. The concentration of credit by type of loan is set forth in Note 5. The debtors’ ability to honor their contracts is influenced by the region’s economy.
There are numerous risks associated with commercial loans that could impact the borrower’s ability to repay on a timely basis. They include but are not limited to, the owner’s business expertise, changes in local economies, competition, government regulation, and the general financial stability of the borrowing entity.
The Company attempts to mitigate these risks by making an analysis of the borrower’s business and industry history, its financial position, as well as that of the business owner. The Company will also require the borrower to provide financial information on the operations of the business periodically over the life of the loan. In addition, most commercial loans are secured by assets of the business or those of the business owner, which can be liquidated if the borrower defaults, along with the personal surety of the business owner.
From time to time, the Company will maintain balances with its correspondent banks that exceed the $250,000 federally insured deposit limits. Management routinely evaluates the credit worthiness of these correspondent banks and does not feel they pose significant risk to the Company.
21. | REVENUE RECOGNITION |
All of the Company’s revenue within the scope of Accounting Standards Codification (ASC) 606 is recognized within
Non-Interest
Income on the Consolidated Statements of Operations. ASC 606 is applicable to certainnon-interest
income streams, which are discussed below.Service Charges and Activity Fees on Deposits
Service charges on deposit accounts consist of monthly ATM Income, Wire Transfer Fees,
Non-Sufficient
Funds Charges, and other deposit related fees. The Company’s performance obligation for monthly service fees is generally satisfied, and the related revenue recognized, over the period in which the service is provided. Check orders and other deposit account related fees are largely transactional based, and, therefore, the Company’s performance obligation is satisfied, and related revenue recognized, at a point in time. Payment for service charges on deposit accounts is primarily received immediately or in the following month through a direct charge to customers’ accounts. The Company’s performance obligation for wire transfers and returned deposit fees, are largely satisfied, and related revenue recognized, when the services are rendered or upon completion. Payment is typically received immediately or in the following month.Fees on loan related activity
Fees from loan related activity is comprised mostly of upfront fees recognized on Assumable Rate Conversion Agreements, where Bank originates a floating rate loan. The borrower concurrently signs an addendum to the promissory note with a third party permitting the borrower to pay a fixed rate of interest. The Bank through a master servicing agreement services the Assumable Rate Conversion between the third party and borrower.
F-
86
Other
Other fees are primarily comprised of Remote/Mobile Deposit Fees and other service charges. Other noninterest income consists primarily of other nonrecurring revenue which is not recorded in the categories listed above. This revenue is miscellaneous in nature and is recognized as income upon receipt.
The following presents noninterest income, segregated by revenue streamsof Topic 606, for the years ended December 31, 2021 and 2020.
in-scope
andout-of-scope
For the Year Ended December 31, | ||||||||
2021 | 2020 | |||||||
Non-interest incomein-scope of Topic 606 | ||||||||
Service charges and activity fees on deposits | $ | 733 | $ | 743 | ||||
Fees on loan related activity | 227 | — | ||||||
Other | 367 | 82 | ||||||
Non-interest income(in-scope of Topic 606) | 1,327 | 825 | ||||||
Non-interest income(out-of-scope | 812 | 929 | ||||||
Total non-interest income | $ | 2,139 | $ | 1,754 | ||||
22. | PARENT COMPANY ONLY CONDENSED FINANCIAL INFORMATION |
Condensed financial information of LINKBANCORP, Inc. follows:
Balance Sheets
December 31, | ||||||||
2021 | 2020 | |||||||
(In thousands) | ||||||||
ASSETS | ||||||||
Noninterest-bearing cash equivalents | $ | 276 | $ | 12 | ||||
Securities available for sale, at fair value | 517 | 516 | ||||||
Investment in subsidiaries | 129,181 | 50,169 | ||||||
Other Assets | 365 | 5 | ||||||
TOTAL ASSETS | $ | 130,339 | $ | 50,702 | ||||
LIABILITIES AND SHAREHOLDERS’ EQUITY | ||||||||
Subordinated debt | $ | 20,696 | $ | — | ||||
Other liabilities | 20 | 28 | ||||||
Shareholders’ equity | 109,623 | 50,674 | ||||||
TOTAL LIABILITIES AND SHAREHOLDERS’ EQUITY | $ | 130,339 | $ | 50,702 | ||||
Condensed Statements of Operations and Comprehensive Income
Years Ended December 31, | ||||||||
2021 | 2020 | |||||||
(in thousands) | ||||||||
Income: | ||||||||
Interest income | $ | 18 | $ | 15 | ||||
Dividend income from subsidiaries | 724 | 1,433 | ||||||
Expenses: | ||||||||
Interest expense | 249 | — | ||||||
Other noninterest expenses | 794 | 261 | ||||||
F-
87
Years Ended December 31, | ||||||||
2021 | 2020 | |||||||
(in thousands) | ||||||||
Income before income tax | (301 | ) | 1,186 | |||||
Income tax benefit | (199 | ) | — | |||||
| (102 | ) | 1,186 | ||||||
Equity in undistributed subsidiary income | 391 | 3,007 | ||||||
Net income | $ | 289 | $ | 4,193 | ||||
Comprehensive (Loss) Income | $ | (1,125 | ) | $ | 6,401 | |||
Condensed Statements of Cash Flows
Years Ended December 31, | ||||||||
2021 | 2020 | |||||||
(in thousands) | ||||||||
OPERATING ACTIVITIES | ||||||||
Net income | $ | 289 | $ | 4,193 | ||||
Adjustments: | ||||||||
Undistributed earnings of subsidiaries | (391 | ) | (3,007 | ) | ||||
Other, net | (72 | ) | 6 | |||||
Net cash (used in) provided by operating activities | (174 | ) | 1,192 | |||||
INVESTING ACTIVITIES | ||||||||
Net cash acquired through merger and acquisition | 3,080 | — | ||||||
Investments in subsidiaries | (1,300 | ) | — | |||||
Net cash from investing activities | 1,780 | — | ||||||
FINANCING ACTIVITIES | ||||||||
Issuance of shares from exercise of stock options | 120 | — | ||||||
Dividends paid | (1,462 | ) | (1,433 | ) | ||||
Net cash used in financing activities | (1,342 | ) | (1,433 | ) | ||||
Increase (decrease) in cash and cash equivalents | 264 | (241 | ) | |||||
Cash and cash equivalents at the beginning of the period | 12 | 253 | ||||||
Cash and cash equivalents at the end of the period | $ | 276 | $ | 12 | ||||
23. | SUBSEQUENT EVENTS |
On February 15, 2022, the Company’s Board of Directors declared a quarterly cash dividend of $0.075 per share of common stock to shareholders of record on February 28, 2022, resulting in $737 being paid on March 15, 2022.
F-
88
LINKBANCORP, Inc. and Subsidiary
Consolidated Balance Sheets (Unaudited)
June 30, 2021 | December 31, 2020 | |||||||
(In Thousands, except share data) | ||||||||
ASSETS | ||||||||
Noninterest-bearing cash equivalents | $ | 2,117 | $ | 767 | ||||
Interest-bearing deposits with other institutions | 29,332 | 8,235 | ||||||
Cash and cash equivalents | 31,449 | 9,002 | ||||||
Securities available for sale, at fair value | 3,398 | 79,205 | ||||||
Loans receivable, net of allowance for loan losses of $4,800 at June 30, 2021, and $4,177 at December 31, 2020 | 409,427 | 323,214 | ||||||
Investments in restricted bank stock | 1,039 | 2,615 | ||||||
Premises and equipment, net | 1,771 | 1,386 | ||||||
Right-to-Use | 4,428 | — | ||||||
Bank-owned life insurance | 4,756 | 4,688 | ||||||
Goodwill and other intangible assets | 1,357 | 1,371 | ||||||
Deferred tax asset | 3,033 | 98 | ||||||
Accrued interest receivable and other assets | 3,772 | 2,527 | ||||||
TOTAL ASSETS | $ | 464,430 | $ | 424,106 | ||||
LIABILITIES | ||||||||
Deposits: | ||||||||
Demand, noninterest bearing | $ | 74,303 | $ | 42,374 | ||||
Interest bearing | 297,750 | 240,680 | ||||||
Total deposits | 372,053 | 283,054 | ||||||
Short-Term Borrowings | — | 41,667 | ||||||
Other Borrowings | 23,087 | 37,315 | ||||||
Subordinated Debt | 19,973 | 19,970 | ||||||
Operating Lease Liabilities | 4,428 | — | ||||||
Accrued interest payable and other liabilities | 1,412 | 1,766 | ||||||
TOTAL LIABILITIES | 420,953 | 383,772 | ||||||
SHAREHOLDERS’ EQUITY | ||||||||
Common stock ($0.01 par value; 25,000,000 shares authorized; 4,968,089 and 4,967,089 shares issued and outstanding at June 30, 2021 and December 31, 2020) | 50 | 50 | ||||||
Surplus | 50,567 | 50,516 | ||||||
Accumulated deficit | (7,207 | ) | (10,374 | ) | ||||
Accumulated other comprehensive income | 67 | 142 | ||||||
TOTAL SHAREHOLDERS’ EQUITY | 43,477 | 40,334 | ||||||
TOTAL LIABILITIES AND SHAREHOLDERS’ EQUITY | $ | 464,430 | $ | 424,106 | ||||
See accompanying notes to the unaudited consolidated financial statements.
F-89
LINKBANCORP, Inc. and Subsidiary
Consolidated Statements of Operations (Unaudited)
Three Months Ended June 30, | Six Months Ended June 30, | |||||||||||||||
2021 | 2020 | 2021 | 2020 | |||||||||||||
(In Thousands, except per share data) | ||||||||||||||||
INTEREST AND DIVIDEND INCOME | ||||||||||||||||
Loans receivable, including fees | $ | 4,367 | $ | 3,815 | $ | 8,097 | $ | 5,981 | ||||||||
Other | 31 | 52 | 66 | 201 | ||||||||||||
Total interest and dividend income | 4,398 | 3,867 | 8,163 | 6,182 | ||||||||||||
INTEREST EXPENSE | ||||||||||||||||
Deposits | 365 | 832 | 783 | 1,801 | ||||||||||||
Short-term Borrowings | 8 | — | 10 | 1 | ||||||||||||
Other Borrowings | 61 | 102 | 74 | 102 | ||||||||||||
Subordinated Debt | 254 | — | 505 | — | ||||||||||||
Total interest expense | 688 | 934 | 1,372 | 1,904 | ||||||||||||
NET INTEREST INCOME BEFORE PROVISION FOR LOAN LOSSES | 3,710 | 2,933 | 6,791 | 4,278 | ||||||||||||
Provision for loan losses | 410 | 115 | 617 | 2,065 | ||||||||||||
NET INTEREST INCOME AFTER PROVISION FOR LOAN LOSSES | 3,300 | 2,818 | 6,174 | 2,213 | ||||||||||||
NONINTEREST INCOME | ||||||||||||||||
Service charges on deposit accounts | 36 | 13 | 64 | 25 | ||||||||||||
Bank-owned life insurance | 34 | 36 | 68 | 73 | ||||||||||||
Other | 89 | 71 | 137 | 99 | ||||||||||||
Total noninterest income | 159 | 120 | 269 | 197 | ||||||||||||
NONINTEREST EXPENSE | ||||||||||||||||
Salaries and employee benefits | 1,840 | 1,639 | 3,746 | 2,937 | ||||||||||||
Occupancy | 200 | 226 | 403 | 422 | ||||||||||||
Equipment and data processing | 277 | 197 | 493 | 382 | ||||||||||||
Professional fees | 98 | 123 | 201 | 238 | ||||||||||||
FDIC insurance | 41 | 107 | 63 | 161 | ||||||||||||
Bank Shares Tax | 88 | 57 | 177 | 114 | ||||||||||||
Advertising | 103 | 13 | 180 | 33 | ||||||||||||
Merger Related Expenses | 129 | — | 560 | — | ||||||||||||
Other | 228 | 137 | 406 | 281 | ||||||||||||
Total noninterest expense | 3,004 | 2,499 | 6,229 | 4,568 | ||||||||||||
Income (Loss) before income tax (benefit) expense | 455 | 439 | 214 | (2,158 | ) | |||||||||||
Income tax (benefit) expense | 53 | — | (2,953 | ) | — | |||||||||||
NET INCOME (LOSS) | $ | 402 | $ | 439 | $ | 3,167 | $ | (2,158 | ) | |||||||
EARNINGS (LOSS) PER SHARE, BASIC | $ | 0.08 | $ | 0.10 | $ | 0.64 | $ | (0.47 | ) | |||||||
EARNINGS (LOSS) PER SHARE, DILUTED | $ | 0.08 | $ | 0.09 | $ | 0.60 | $ | (0.47 | ) | |||||||
WEIGHTED-AVERAGE COMMON SHARES OUTSTANDING, | ||||||||||||||||
BASIC | 4,968,089 | 4,545,297 | 4,967,780 | 4,545,297 | ||||||||||||
DILUTED | 5,290,002 | 4,621,230 | 5,257,216 | 4,545,297 | ||||||||||||
See accompanying notes to the unaudited consolidated financial statements.
F-90
LINKBANCORP, Inc. and Subsidiary
Consolidated Statements of Comprehensive Income (Loss) (Unaudited)
Three Months Ended June 30, | Six Months Ended June 30, | |||||||||||||||
2021 | 2020 | 2021 | 2020 | |||||||||||||
(In Thousands) | ||||||||||||||||
Net income (loss) | $ | 402 | $ | 439 | $ | 3,167 | $ | (2,158 | ) | |||||||
Components of other comprehensive income (loss): | ||||||||||||||||
Unrealized holding gain (loss) on available-for-sale | (33 | ) | 57 | (95 | ) | 133 | ||||||||||
Tax effect | 7 | — | 20 | — | ||||||||||||
Total other comprehensive income (loss) | (26 | ) | 57 | (75 | ) | 133 | ||||||||||
Total comprehensive income (loss) | $ | 376 | $ | 496 | $ | 3,092 | $ | (2,025 | ) | |||||||
See accompanying notes to the unaudited consolidated financial statements.
F-91
LINKBANCORP, Inc. and Subsidiary
Consolidated Statements of Shareholders’ Equity (Unaudited)
(In Thousands, except share data) | Common Stock Shares | Common Stock Amount | Additional Paid-in-Capital | Accumulated Deficit | Accumulated Other Comprehensive Income (Loss) | Total | ||||||||||||||||||
Balance, March 31, 2021 | 4,968,089 | $ | 50 | $ | 50,547 | $ | (7,609 | ) | $ | 93 | $ | 43,081 | ||||||||||||
Net income | — | — | — | 402 | — | 402 | ||||||||||||||||||
Stock-based compensation | — | — | 20 | — | — | 20 | ||||||||||||||||||
Other comprehensive loss | — | — | — | — | (26 | ) | (26 | ) | ||||||||||||||||
Balance, June 30, 2021 | 4,968,089 | $ | 50 | $ | 50,567 | $ | (7,207 | ) | $ | 67 | $ | 43,477 | ||||||||||||
(In Thousands, except share data) | Common Stock Shares | Common Stock Amount | Additional Paid-in-Capital | Accumulated Deficit | Accumulated Other Comprehensive Income (Loss) | Total | ||||||||||||||||||
Balance, March 31, 2020 | 4,545,297 | $ | 45 | $ | 45,470 | $ | (11,207 | ) | $ | 65 | $ | 34,373 | ||||||||||||
Net income | — | — | — | 439 | — | 439 | ||||||||||||||||||
Stock-based compensation | — | — | 21 | — | — | 21 | ||||||||||||||||||
Other comprehensive income | — | — | — | — | 57 | 57 | ||||||||||||||||||
Balance, June 30, 2020 | 4,545,297 | $ | 45 | $ | 45,491 | $ | (10,768 | ) | $ | 122 | $ | 34,890 | ||||||||||||
See accompanying notes to the unaudited consolidated financial statements
F-92
LINKBANCORP, Inc. and Subsidiary
Consolidated Statements of Shareholders’ Equity (Unaudited)
(In Thousands, except share data) | Common Stock Shares | Common Stock Amount | Additional Paid-in-Capital | Retained Earnings | Accumulated Other Comprehensive Income (Loss) | Total | ||||||||||||||||||
Balance, December 31, 2020 | 4,967,089 | $ | 50 | $ | 50,516 | $ | (10,374 | ) | $ | 142 | $ | 40,334 | ||||||||||||
Proceeds from exercise of stock options | 1,000 | — | 10 | — | — | 10 | ||||||||||||||||||
Net income | — | — | — | 3,167 | — | 3,167 | ||||||||||||||||||
Stock-based compensation | — | — | 41 | — | — | 41 | ||||||||||||||||||
Other comprehensive loss | — | — | — | — | (75 | ) | (75 | ) | ||||||||||||||||
Balance, June 30, 2021 | 4,968,089 | $ | 50 | $ | 50,567 | $ | (7,207 | ) | $ | 67 | $ | 43,477 | ||||||||||||
(In Thousands, except share data) | Common Stock Shares | Common Stock Amount | Additional Paid-in-Capital | Retained Earnings | Accumulated Other Comprehensive Income (Loss) | Total | ||||||||||||||||||
Balance, December 31, 2019 | 4,545,297 | $ | 45 | $ | 45,449 | $ | (8,610 | ) | $ | (11 | ) | $ | 36,873 | |||||||||||
Proceeds from issuance of common stock | — | — | — | — | — | — | ||||||||||||||||||
Net loss | — | — | — | (2,158 | ) | — | (2,158 | ) | ||||||||||||||||
Stock-based compensation | — | — | 42 | — | — | 42 | ||||||||||||||||||
Other comprehensive income | — | — | — | — | 133 | 133 | ||||||||||||||||||
Balance, June 30, 2020 | 4,545,297 | $ | 45 | $ | 45,491 | $ | (10,768 | ) | $ | 122 | $ | 34,890 | ||||||||||||
See accompanying notes to the unaudited consolidated financial statements.
F-93
LINKBANCORP, Inc. and Subsidiary
Consolidated Statement of Cash Flows (Unaudited)
For the Six Months Ended June 30, | ||||||||
(In Thousands) | 2021 | 2020 | ||||||
OPERATING ACTIVITIES | Unaudited | |||||||
Net income (loss) | $ | 3,167 | $ | (2,158 | ) | |||
Adjustments to reconcile net income to net cash used for operating activities: | ||||||||
Provision for loan losses | 617 | 2,065 | ||||||
Depreciation | 123 | 127 | ||||||
Amortization of intangible assets | 14 | 16 | ||||||
Amortization of premiums and discounts on investment securities, net | 23 | 13 | ||||||
Share-based compensation | 41 | 42 | ||||||
Amortization of premiums on purchased loans | 27 | 11 | ||||||
Bank-owned life insurance income | (68 | ) | (73 | ) | ||||
Deferred tax benefit | (3,044 | ) | — | |||||
Change in accrued interest receivable and other assets | (1,153 | ) | (740 | ) | ||||
Change in accrued interest payable and other liabilities | (351 | ) | 120 | |||||
Net cash used for operating activities | (604 | ) | (577 | ) | ||||
INVESTING ACTIVITIES | ||||||||
Investment securities available for sale: | ||||||||
Proceeds from calls and maturities | 75,000 | 47,000 | ||||||
Proceeds from principal repayments | 726 | 1,048 | ||||||
Purchases | — | (10,171 | ) | |||||
Purchase of restricted investment in bank stocks | (1,341 | ) | (906 | ) | ||||
Redemption of restricted investment in bank stocks | 2,917 | — | ||||||
Increase in loans, net | (86,857 | ) | (119,750 | ) | ||||
Purchase of premises and equipment | (508 | ) | (235 | ) | ||||
Net cash used for investing activities | (10,063 | ) | (83,014 | ) | ||||
FINANCING ACTIVITIES | ||||||||
Increase in deposits, net | 88,999 | 28,111 | ||||||
Change in Short-term borrowings, net | (41,667 | ) | (6,914 | ) | ||||
Proceeds from Long-term borrowings | — | 86,404 | ||||||
Repayments of Long-term borrowings | (14,228 | ) | — | |||||
Proceeds from exercise of stock options | 10 | — | ||||||
Net cash provided by financing activities | 33,114 | 107,601 | ||||||
Increase in cash and cash equivalents | 22,447 | 24,010 | ||||||
CASH AND CASH EQUIVALENTS AT BEGINNING OF PERIOD | 9,002 | 11,210 | ||||||
CASH AND CASH EQUIVALENTS AT END OF PERIOD | $ | 31,449 | $ | 35,220 | ||||
SUPPLEMENTAL CASH FLOW DISCLOSURES | ||||||||
Cash paid during the period for: | ||||||||
Interest | $ | 1,705 | $ | 1,882 | ||||
Income taxes | $ | — | $ | — | ||||
Non-Cash activities : | ||||||||
Right of Use asset | $ | 4,495 | $ | — | ||||
Operating lease liability | $ | 4,495 | $ | — | ||||
See accompanying notes to the unaudited consolidated financial statements.
F-94
LINKBANCORP, Inc. and Subsidiary
Notes to the Consolidated Financial Statements (Unaudited)
[In Thousands, Except Share Data]
1. | SUMMARY OF SIGNIFICANT ACCOUNTING POLICIES |
A summary of significant accounting and reporting policies applied in the presentation of the accompanying consolidated financial statements follows:
Nature of Operations and Basis of Presentation
LINKBANCORP, Inc. (the “Company”) was incorporated on April 6, 2018, under the laws of the Commonwealth of Pennsylvania. The Company was formed with the intent of becoming a bank holding company through acquisition of a bank.
On September 17, 2018, the Pennsylvania Department of Banking and Securities (PADOBS) approved the acquisition of 100 percent of the shares of Stonebridge Bank, subject to recapitalization of the Bank and continued compliance with capital ratios outlined in Note 12. On October 5, 2018, LINKBANCORP, Inc. purchased 100 percent of the outstanding shares of Stonebridge Bank, from its former parent company Stonebridge Financial Corp. under section 363 of the Bankruptcy Code. LINKBANCORP subsequently renamed the bank LINKBANK (the “Bank”). The Bank is a full-service commercial bank providing personal and business lending and deposit services. The Bank’s operations are conducted from its three Solution Centers in Camp Hill, West Chester, and Lancaster, Pennsylvania. The Company’s corporate office resides in Camp Hill, Pennsylvania. As a state chartered, non-Federal Reserve member bank, the Bank is subject to regulation and supervision by the Pennsylvania Department of Banking and Securities (the PADOBS) and the Federal Deposit Insurance Corporation (the FDIC). The Company is regulated by the Federal Reserve Bank of Philadelphia. The Bank’s deposits are insured up to the applicable limits by the FDIC.
Basis of Presentation
The accompanying consolidated financial statements include the accounts of the Company and the Bank. All significant intercompany accounts and transactions have been eliminated in consolidation. The accounting and reporting practices of the Company conform to accounting principles generally accepted in the United States of America (GAAP) and to general practices within the banking industry. The following summarized the more significant of these policies and practices.
Estimates
The preparation of financial statements in conformity with accounting principles generally accepted in the United States of America requires management to make estimates and assumptions that affect the reported amounts of assets and liabilities and disclosure of contingent assets and liabilities at the date of the financial statements and the reported amounts of revenues and expenses during the reporting period. Actual results could differ from those estimates. Material estimates that are particularly susceptible to significant change in the near term relate to the allowance for loan losses, and the valuation of deferred tax assets.
Interim Financial Information
The accompanying unaudited consolidated financial statements have been prepared in accordance with GAAP for interim financial information. Accordingly, they do not include all of the information and footnotes required by GAAP for complete financial statements.
In the opinion of management, all adjustments considered necessary for a fair presentation have been included. Operating results for the three and six month periods ended June 30, 2021 are not necessarily
F-95
LINKBANCORP, Inc. and Subsidiary
Notes to the Consolidated Financial Statements (Unaudited)
[In Thousands, Except Share Data]
1. | SUMMARY OF SIGNIFICANT ACCOUNTING POLICIES (Continued) |
Interim Financial Information (Continued)
indicative of the results for the year ending December 31, 2021. For further information, refer to the audited consolidated financial statements and notes thereto for the year ended December 31, 2020 contained in the Company’s definitive prospectus dated August 12, 2021 as filed with the Securities and Exchange Commission pursuant to Securities Act Rule 424(b)(3) on August 12, 2021.
Acquisition Method of Accounting
The Company accounts for acquisitions using the acquisition method of accounting. The acquisition method of accounting requires the Company to estimate the fair value of the tangible assets and identifiable intangible assets acquired and liabilities assumed. The estimated fair values are based on available information and current economic conditions at the date of acquisition. Fair value may be obtained from independent appraisers, discounted cash flow present value techniques, management valuation models, quoted prices on national markets or quoted market prices from brokers. These fair value estimates will affect future earnings through the disposition or amortization of the underlying assets and liabilities. Accounting for business combination under GAAP acquisition method prohibits “carrying over” valuation allowances, such as the allowance for loan losses. Uncertainties relating to the expected future cash flows are reflected in the fair value measurement of the acquired loans and reflected in the purchase price. The Company will establish loan loss allowances for the acquired loans in periods after the acquisition, but only for losses incurred on these loans due to credit deterioration after acquisition.
For business acquisitions, whereby the Company acquires loans that have shown evidence of credit deterioration since origination, the Company will classify these loans as purchased credit-impaired (“PCI”) loans. The Company will determine which loans will be classified as PCI loans based on borrower payment history, past due status, loan credit grading, value of underlying collateral and other factors that affect the collectability of contractual cash flows. Under GAAP, purchasers are permitted to individually evaluate or collectively aggregate PCI loans into pools. PCI loans acquired in the same fiscal quarter may be assembled into one or more pools with common risk characteristics. Once pooled, a single composite interest rate is used to determine aggregate expected cash flows for each respective pool. PCI loans are recorded on the acquisition date at fair value. The Company estimates the amount and timing of expected cash flows for each individually analyzed loan. Estimated cash flows in excess of the amount paid is recorded as interest income over the remaining life of the loan.
On a quarterly basis, the Company will update the amount of loan principal and interest cash flows expected to be collected, incorporating assumptions regarding default rates, loss severities, the amounts and timing of prepayments and other factors that are reflective of current market conditions. Probable decreases in expected loan principal cash flows trigger the recognition of impairment, which is then measured as the present value of the expected principal loss plus any related foregone interest cash flows discounted at the loan’s effective interest rate. Impairments that occur after the acquisition date are recognized through the allowance for loan losses. Probable and significant increases in expected cash flows would first reverse any previously recorded allowance for loan losses; any remaining increases are recognized prospectively as interest income. The impacts of (i) prepayments, (ii) changes in variable interest rates, and (iii) any other changes in the timing of expected cash flows are recognized prospectively as adjustments to interest income. Disposals of loans, which may include sales of loans, receipt of payments in full by the borrower, or foreclosure, result in removal of the loan from the PCI portfolio.
F-96
LINKBANCORP, Inc. and Subsidiary
Notes to the Consolidated Financial Statements (Unaudited)
[In Thousands, Except Share Data]
1. | SUMMARY OF SIGNIFICANT ACCOUNTING POLICIES (Continued) |
Goodwill and Core Deposit Intangible
Goodwill represents the excess of the acquisition cost over the fair value of the net assets acquired in the acquisition. GAAP requires goodwill to be tested for impairment on an annual basis and between annual tests in certain circumstances and written down when impaired. There can be no assurance that future goodwill impairment tests will not result in a charge to income. Core deposit intangible assets (“CDI”) are initially measure at fair value and then amortized over the expected life on an accelerated basis using projected decay rates of the underlying core deposits. The principal factors considered when valuing the CDI consist of the following: (1) the rate and maturity structure of the interest-bearing liabilities, (2) estimated retention rates for each deposit liability category, (3) the current interest rate environment, and (4) estimated noninterest income potential of the acquired relationship. The CDI is evaluated periodically for impairment.
Goodwill and other intangible assets are reviewed for impairment annually as of December 31 and between annual tests when events and circumstances indicate that impairment may have occurred. If there is a goodwill impairment charge, it will be the amount by which the reporting unit’s carrying amount exceeds its fair value; however, the loss recognized should not exceed the total amount of goodwill allocated to that reporting unit. The same
one-step
impairment test is applied to goodwill at all reporting units.The determination of the fair value of the Company incorporates assumptions that marketplace participants would use in their estimates of fair value of the Company in a change of control transaction, as prescribed by ASC Topic 820.
To arrive at a conclusion of fair value, we utilize both the Income and Market Approach and then apply weighting factors to each result. Weighting factors represent our best business judgment of the weightings a market participant would utilize in arriving at a fair value for the Company. In performing our analyses, we also made numerous assumptions with respect to industry performance, business, economic and market conditions, and various other matters, many of which cannot be predicted and are beyond our control. With respect to financial projections, projections reflect the best currently available estimates and judgments as to the expected future financial performance of the Company.
Cash and Cash Equivalents
For purposes of reporting cash flows, cash and cash equivalents include cash on hand and amounts due from banks. Generally, federal funds are purchased and sold for
one-day
periods. Short-term investments include interest bearing-deposits with banks with an original maturity of less than 90 days.Investment Securities
Available for sale – Debt securities that will be held for indefinite periods of time, including securities that may be sold in response to changes in market interest or prepayment rates, needs for liquidity, and changes in the availability of and in the yield of alternative investments, are classified as available for sale. These assets are carried at fair value. Fair values of securities available for sale are determined by using Level 2 fair value measures calculated through the use of matrix pricing. Matrix pricing is a common mathematical technique that does not rely exclusively on quoted market prices for specific securities but rather utilizes the security’s relationship to other benchmark quoted prices in determining fair value. The Company uses independent service providers to calculate our Level 2 fair value measures. Unrealized gains and losses are
F-97
LINKBANCORP, Inc. and Subsidiary
Notes to the Consolidated Financial Statements (Unaudited)
[In Thousands, Except Share Data]
1. | SUMMARY OF SIGNIFICANT ACCOUNTING POLICIES (Continued) |
Investment Securities (Continued)
excluded from operations and are reported net of tax as a separate component of other comprehensive income until realized. Realized gains and losses on the sale of investment securities are reported in the consolidated statements of income and determined using the adjusted cost of the specific security sold on the trade date. Purchase premiums and discounts are recognized in interest income using the interest method over the terms of the securities.
Investment securities are evaluated on at least a quarterly basis, and more frequently when market conditions warrant such an evaluation, to determine whether a decline in their value is other-than-temporary. To determine whether a loss in value is other-than-temporary, management utilizes criteria such as the reasons underlying the decline, the magnitude and duration of the decline, the intent to hold the security and the likelihood of the Company not being required to sell the security prior to an anticipated recovery in the fair value. The term “other-than-temporary” is not intended to indicate that the decline is permanent but indicates that the prospects for a near-term recovery of value is not necessarily favorable, or that there is a lack of evidence to support a realizable value equal to or greater than the carrying value of the investment. Once a decline in value is determined to be other-than-temporary, the portion of the decline related to credit impairment is charged to earnings.
Loans Receivable
Loans receivable that management has the intent and ability to hold for the foreseeable future or until maturity or payoff are stated at their outstanding unpaid principal balances, net of an allowance for loan losses and any deferred fees or costs. Interest income is accrued on the unpaid principal balance. Loan origination fees, net of certain direct origination costs, are deferred and recognized as an adjustment of the yield (interest income) of the related loans. The Bank is generally amortizing these amounts over the contractual life of the loan. Premiums and discounts on purchased loans are amortized as adjustments to interest income using the effective yield method.
The loans receivable portfolio is segmented into commercial and consumer loans. Commercial loans consist of the following classes: commercial and industrial, construction and land development, and commercial real estate. Consumer loans consist of the following classes: residential real estate, home equity, and other consumer.
Loan origination fees are deferred, and certain direct origination costs are capitalized. The net amounts are deferred and are recognized as an adjustment of the yield of the related loan
The accrual of interest on all portfolio classes, including troubled debt restructurings, is discontinued at the time the loan is more than ninety days delinquent unless the loan is well collateralized and in process of collection. Nonaccrual loans are reviewed for
charge-off
if more than ninety-days past due, except for residential loans and consumer loans. Residential loans are reviewed at 180 days and consumer loans are reviewed at 120 days past due. In all cases, loans are placed on nonaccrual orcharged-off
at an earlier date if collection of principal or interest is considered unlikely.All interest accrued but not collected for loans placed on nonaccrual or
charged-off
is reversed against interest income. The interest on these loans is accounted for on the cash-basis or cost-recovery method, until qualifying for return to accrual. Loans are returned to accrual status when all the principal and interestF-98
LINKBANCORP, Inc. and Subsidiary
Notes to the Consolidated Financial Statements (Unaudited)
[In Thousands, Except Share Data]
1. | SUMMARY OF SIGNIFICANT ACCOUNTING POLICIES (Continued) |
Loans Receivable (Continued)
amounts contractually due are brought current and future payments are reasonably assured. In addition, a loan should be in accordance with the contractual terms for a reasonable period, usually requiring a payment history of six months.
Allowance for Loan Losses
The allowance for loan losses is established as losses are estimated to have occurred through a provision for loan losses charged to operations. Loan losses are charged against the allowance when management believes the collectability of a loan balance is confirmed. Subsequent recoveries, if any, are credited to the allowance. There were no material changes in the Bank’s accounting policies or methodology related to the allowance for loan losses during the three months ended and six months ended June 30, 2021.
The allowance for loan losses is evaluated on a quarterly basis by management and is based upon management’s periodic review of the collectability of the loans considering historical experience, the size and composition of the loan portfolio, adverse situations that may affect the borrower’s ability to repay, estimated value of any underlying collateral and prevailing economic conditions. This evaluation is inherently subjective as it requires estimates that are susceptible to significant revision as more information becomes available.
The allowance consists of specific and general components. The specific component relates to loans that are classified as impaired. For such loans, an allowance is established when the discounted cash flows, collateral value or observable market price of the impaired loan is lower than the carrying value of that loan. The general component covers all other loans and is based on historical loss experience adjusted for qualitative factors.
The historical loss component of the allowance is determined by losses recognized by portfolio segment over the preceding sixteen quarters. This is supplemented by the risks for each portfolio segment. Risk factors impacting loans in each of the portfolio segments include broad deterioration of property values, reduced consumer, and business spending as a result of unemployment and reduced credit availability and lack of confidence in the economy. The historical experience is adjusted for the following qualitative factors: (a) the existence and effect of any concentrations of credit and changes in the level of such concentrations; (b) changes in national, regional and local economic conditions that affect the collectability of the loan portfolio; (c) changes in levels or trends in charge-offs and recoveries; (d) changes in the volume and severity of past due loans, nonaccrual loans or loans classified special mention, substandard, doubtful or loss; (e) changes in the nature and volume of the loan portfolio and terms of loans; (f) changes in lending policies and procedures, risk selection and underwriting standards; (g) changes in the experience, ability and depth of lending management and other relevant staff; (h) quality of loan review; (i) the effect of other external factors, trends or uncertainties that could affect management’s estimate of probable losses, such as competition and industry conditions. The Company uses peer data when they have insufficient history to use their own loss data. The peer group is made up of various Bank’s with similar size and geographical location to obtain comparable data.
A loan is considered impaired when, based on current information and events, it is probable that the Company will be unable to collect the scheduled payments of principal or interest when due according to the contractual terms of the loan agreement. Factors considered by management in determining impairment
F-99
LINKBANCORP, Inc. and Subsidiary
Notes to the Consolidated Financial Statements (Unaudited)
[In Thousands, Except Share Data]
1. | SUMMARY OF SIGNIFICANT ACCOUNTING POLICIES (Continued) |
Allowance for Loan Losses (Continued)
include payment status, collateral value, and the probability of collecting scheduled principal and interest payments when due. Loans that experience insignificant payment delays and payment shortfalls generally are not classified as impaired. Management determines the significance of payment delays and payment shortfalls on abasis, taking into consideration all circumstances surrounding the loan and the borrower, including the length of the delay, the reasons for the delay, the borrower’s prior payment record, and the amount of the shortfall in relation to the principal and interest owed. Impairment is measured on abasis for commercial, commercial real estate, and residential mortgage loan segments by either the present value of expected future cash flows discounted at the loan’s effective interest rate, the loan’s obtainable market price, or the fair value of the collateral if the loan is collateral-dependent.
case-by-case
loan-by-loan
Large groups of smaller balance homogeneous loans are collectively evaluated for impairment. Accordingly, the Company does not separately identify individual consumer loans for impairment disclosures.
Investment in Restricted Stock, at Cost
The Company holds restricted stock in the Federal Home Loan Bank (“FHLB”) of Pittsburgh and the Atlantic Community Bancshares, Inc. (“ACBB”) which is carried at cost. The Company holds $24,000 of ACBB stock at June 30, 2021 and December 31, 2020, respectively. The Company holds $1,015,000 and $2,591,000 of FHLB stock at June 30, 2021 and December 31, 2020, respectively. The FHLB stock is bought from and sold to the FHLB based upon its $100 par value. The stock does not have a readily determinable fair value and as such is classified as restricted stock, carried at cost, and evaluated for impairment as necessary. The stock’s value is determined by the ultimate recoverability of the par value rather than by recognizing temporary declines. The determination of whether the par value will ultimately be recovered is influenced by criteria such as the following: (a) the significance of the decline in net assets of the FHLB as compared to the capital stock amount and the length of time this situation has persisted; (b) commitments by the FHLB to make payments required by law or regulation and the level of such payments in relation to the operating performance; (c) the impact of legislative and regulatory changes on the customer base of the FHLB; and (d) the liquidity position of the FHLB. Management evaluated the stock and concluded that the stock was not impaired for the periods presented herein.
Bank-Owned Life Insurance
The Company invests in bank-owned life insurance (“BOLI”) as a source of funding for employee benefit expenses. BOLI involves the purchasing of life insurance by the Company on a chosen group of employees. The Company is the owner and beneficiary of the policies. This life insurance investment is carried at the cash surrender value of the underlying policies. Income from the increase in cash surrender value of the policies is included in non-interest income in the Consolidated Statement of Operations, net of expenses.
Premises and Equipment
Leasehold improvements and furniture and equipment are stated at cost, less accumulated depreciation. Depreciation and amortization expense is computed using the straight-line method over the estimated useful lives of the assets. Estimate useful lives for furniture and equipment from three to ten years; leasehold improvements are amortized over the lease term or estimated life of the improvement, if shorter.
F-100
LINKBANCORP, Inc. and Subsidiary
Notes to the Consolidated Financial Statements (Unaudited)
[In Thousands, Except Share Data]
1. | SUMMARY OF SIGNIFICANT ACCOUNTING POLICIES (Continued) |
Transfers of Financial Assets
Transfers of financial assets are accounted for as sales when control of the assets has been surrendered. Control over transferred assets is deemed to be surrendered when (1) the assets have been isolated from the Bank, (2) the transferee obtains the right (free of conditions that constrain it from taking advantage of that right) to pledge or exchange the transferred assets, and (3) the Bank does not maintain effective control over the transferred assets through an agreement to repurchase them before their maturity.
Income Taxes
The income tax accounting guidance results in two components of income tax expense: current and deferred. Current income tax expense reflects taxes to be paid or refunded for the current period by applying the provisions of the enacted tax law to the taxable income or excess of deductions over revenues. The Bank determines deferred income taxes using the liability (or balance sheet) method. Under this method, the net deferred tax asset or liability is based on the tax effects of the differences between the book and tax bases of assets and liabilities, and enacted changes in tax rates and laws are recognized in the period in which they occur. Deferred income tax expense results from changes in deferred tax assets and liabilities between periods. Deferred tax assets are reduced by a valuation allowance if, based on the weight of the evidence available, it is more likely than not that some portion or all of a deferred tax asset will not be realized.
The Company accounts for uncertain tax positions if it is more likely than not, based on the technical merits, that the tax position will be realized or sustained upon examination. The term more likely than not means a likelihood of more than 50 percent; the terms examined and upon examination also include resolution of the related appeals or litigation processes, if any. A tax position that meets the
more-likely-than-not
recognition threshold is initially and subsequently measured as the largest amount of tax benefit that has a greater than 50 percent likelihood of being realized upon settlement with a taxing authority that has full knowledge of all relevant information. The determination of whether a tax position has met themore-likely-than-not
recognition threshold considers the facts, circumstances, and information available at the reporting date and is subject to management’s judgment. The Bank recognizes interest and penalties on income taxes as a component of income tax expense.Off-balance
Sheet Financial InstrumentsIn the ordinary course of business, the Bank has entered into
off-balance
sheet financial instruments consisting of commitments to extend credit and letters of credit. Such financial instruments are recorded in the consolidated balance sheets when they are funded.Share-based Compensation
The Bank follows the provisions of ASC
718-10,
Compensation – Stock Compensation. This standard requires the Bank to recognize the cost of employee and organizer services received in share-based payment transactions and measure the cost based on the grant-date fair value of the award. The cost will be recognized over the period during which the employee or organizer is required to provide service in exchange for the award.The stock compensation accounting guidance requires that compensation cost for all stock awards be calculated and recognized over the employee’s service period, generally defined as the vesting period. For
F-101
LINKBANCORP, Inc. and Subsidiary
Notes to the Consolidated Financial Statements (Unaudited)
[In Thousands, Except Share Data]
1. | SUMMARY OF SIGNIFICANT ACCOUNTING POLICIES (Continued) |
Share-based Compensation (Continued)
awards with graded-vesting, compensation cost is recognized on a straight-line basis over the requisite service period for the entire award. A Black-Scholes model is used to estimate the fair value of stock options, while the fair value of the Company’s common stock as the date of grant is used for restricted stock awards.
Stock Warrants
The Company issued stock purchase warrants in connection with its initial stock offering via private placement, giving organizers the right to purchase shares of common stock at the initial offering price of $10 per share. For organizers, the warrants serve as a reward for bearing the financial risk of the Company’s organization by advancing “seed money” for its organizational and
pre-opening
expenses. The organizers’ warrants arenon-voting
and are exercisable for a period of ten years from the date of grant. All grants were issued during 2019. These warrants are transferable in accordance with the warrant agreement, but are not puttable to the Company. These shares may be issued from previously authorized but unissued shares of stock. The Board has made no additional authorization to issue any further warrants as of June 30, 2021 and has no current plans for future issuance of warrants. To date, organizers have not exercised any warrants since their issuance.Based on the contractual terms, the warrants do not fall within the scope of ASC, and they meet the requirements within ASC 815,, to be classified within shareholders’ equity. The fair value of these shares upon issuance using the Black-Scholes model was zero, based on the fair value for the stock on the date of grant.
480-10,
Distinguishing Liabilities from Equity
Derivatives and Hedging
Earnings Per Share
Basic earnings per share (EPS) represents net income available to common shareholders divided by the weighted-average number of common shares outstanding during the period. Potential common shares that may be issued related to outstanding stock options are determined using the treasury stock method.
The following table sets forth the composition of earnings per share:
(In Thousands, except share and per share data) | Three Months Ended June 30, | Six Months Ended June 30, | ||||||||||||||
2021 | 2020 | 2021 | 2020 | |||||||||||||
Net income | $ | 402 | $ | 439 | $ | 3,167 | $ | (2,158 | ) | |||||||
Basic weighted average common shares outstanding | 4,968,089 | 4,545,297 | 4,967,780 | 4,545,297 | ||||||||||||
Net effect of dilutive stock options and warrants | 321,913 | 75,933 | 289,436 | — | ||||||||||||
Diluted weighted average common shares outstanding | 5,290,002 | 4,621,230 | 5,257,216 | 4,545,297 | ||||||||||||
Net income per common share: | ||||||||||||||||
Basic | $ | 0.08 | $ | 0.10 | $ | 0.64 | $ | (0.47 | ) | |||||||
Diluted | $ | 0.08 | $ | 0.09 | $ | 0.60 | $ | (0.47 | ) | |||||||
F-102
LINKBANCORP, Inc. and Subsidiary
Notes to the Consolidated Financial Statements (Unaudited)
[In Thousands, Except Share Data]
1. | SUMMARY OF SIGNIFICANT ACCOUNTING POLICIES (Continued) |
Earnings Per Share (Continued)
The following is a summary of securities that could potentially dilute basic earnings per common share in future periods that were not included in the computation of diluted earnings per common share because to do so would have been anti-dilutive for the periods presented. There were no anti-dilutive securities in 2021.
Six Months Ended June 30, 2020 | ||||
Warrants | $ | 1,537,484 | ||
Share-based compensation awards | 74,800 | |||
Total anti-dilutive securities | $ | 1,612,284 | ||
Recently Adopted Accounting Pronouncements
In February 2016, the Financial Accounting Standards Board (FASB) issued ASU. The standard requires lessees to recognize the assets and liabilities that arise from leases on the balance sheet. A lessee should recognize in the statement of financial position a liability to make lease payments (the lease liability) and aasset representing its right to use the underlying asset for the lease term. A short-term lease is defined as one in which (a) the lease term is 12 months or less, and (b) there is not an option to purchase the underlying asset that the lessee is reasonably certain to exercise. For short-term leases, lessees may elect to recognize lease payments over the lease term on a straight-line basis. The Company adopted this standard as of January 1, 2021. Additionally, in July 2018, the FASB issued ASU, which, among other things, provides an additional transition method that would allow entities to not apply the guidance in ASUassets totaling $3.8 million, as well as lease liabilities totaling $3.8 million. The Company elected to adopt the transition relief provisions from ASU
2016-02,
Leases (Topic 842)
right-of-use
2018-11,
Leases (Topic 842)
2016-02
in the comparative periods presented in the financial statements and instead recognize a cumulative-effect adjustment to the opening balance of retained earnings in the period of adoption. The Company adopted ASU2016-02
and its related amendments as of January 1, 2021, which resulted in the recognition ofright-of-use
2018-11
and recorded the impact of adoption as of January 1, 2021, without restating any prior-year amounts or disclosures. There was no cumulative effect adjustment to the opening balance of retained earnings required.Recent Accounting Pronouncements Not Yet Adopted
In June 2016, the FASB issued ASU, which changes the impairment model for most financial assets. This Update is intended to improve financial reporting by requiring timelier recording of credit losses on loans and other financial instruments held by financial institutions and other organizations. The underlying premise of the Update is that financial assets measured at amortized cost should be presented at the net amount expected to be collected, through an allowance for credit losses that is deducted from the amortized cost basis. The allowance for credit losses should reflect management’s current estimate of credit losses that are expected to occur over the remaining life of a financial asset. The income statement will be affected for the measurement of credit losses for newly recognized financial assets, as well as the expected increases or decreases of expected credit losses that have taken place during the period. With certain exceptions, transition to the new requirements will be through a cumulative-effect adjustment to opening retained earnings as of the beginning of the first reporting period in which the guidance is adopted. This Update is effective for SEC filers that are eligible to be smaller reporting companies,
2016-13,
Financial Instruments – Credit Losses: Measurement of Credit Losses on Financial Instruments
non-SEC
filers, and all otherF-103
LINKBANCORP, Inc. and Subsidiary
Notes to the Consolidated Financial Statements (Unaudited)
[In Thousands, Except Share Data]
1. | SUMMARY OF SIGNIFICANT ACCOUNTING POLICIES (Continued) |
Recent Accounting Pronouncements Not Yet Adopted (Continued)
companies, to fiscal years beginning after December 15, 2022, including interim periods within those fiscal years. We expect to recognize a
one-time
cumulative-effect adjustment to the allowance for loan losses as of the beginning of the first reporting period in which the new standard is effective but cannot yet determine the magnitude of any suchone-time
adjustment or the overall impact of the new guidance on the consolidated financial statements.In January 2021, the FASB issued ASUwhich added to ASUdebt securities that reference an interest rate affected by reference rate reform. The amendments in this ASU are effective for all entities upon issuance through December 31, 2022. The Company has identified our loan receivables that have an interest rate indexed to LIBOR and is currently assessing the appropriate transition path. As such, the Company does not have an estimate of the financial impact of this update but does not expect the impact to be material to the financial statements of the Company.
2021-01,
Reference Rate Reform (Topic 848): Facilitation of the Effects of Reference Rate Reform on Financial Reporting,
2020-04
on optional expedients and exceptions to the U.S. GAAP guidance on contract modifications and hedge accounting to ease the financial reporting burdens of the expected market transition from LIBOR and other interbank offered rates to alternative reference rates, such as the Secured Overnight Financing Rate. Entities can elect not to apply certain modification accounting requirements to contracts affected by what the guidance calls “reference rate reform” if certain criteria are met. An entity that makes this election would not have to remeasure the contracts at the modification date or reassess a previous accounting determination. Also, entities can elect various optional expedients that would allow them to continue applying hedge accounting for hedging relationships affected by reference rate reform if certain criteria are met, and can make a onetime election to sell and/or reclassifyheld-to-maturity
2. | INVESTMENT SECURITIES |
The amortized cost, gross unrealized gains and losses, and fair value of investment securities available for sale are summarized as follows:
June 30, 2021 | ||||||||||||||||
(In Thousands) | Amortized Cost | Gross Unrealized Gains | Gross Unrealized Losses | Fair Value | ||||||||||||
U.S. treasury securities | $ | — | $ | — | $ | — | $ | — | ||||||||
Mortgage backed securities, residential | 3,313 | 85 | — | 3,398 | ||||||||||||
Total available-for-sale | $ | 3,313 | $ | 85 | $ | — | $ | 3,398 | ||||||||
December 31, 2020 | ||||||||||||||||
(In Thousands) | Amortized Cost | Gross Unrealized Gains | Gross Unrealized Losses | Fair Value | ||||||||||||
Available for Sale: | ||||||||||||||||
U.S. treasury securities | $ | 75,000 | $ | — | $ | (1 | ) | $ | 74,999 | |||||||
Mortgage backed securities, residential | 4,063 | 143 | — | 4,206 | ||||||||||||
Total available-for-sale | $ | 79,063 | $ | 143 | $ | (1 | ) | $ | 79,205 | |||||||
F-104
LINKBANCORP, Inc. and Subsidiary
Notes to the Consolidated Financial Statements (Unaudited)
[In Thousands, Except Share Data]
2. | INVESTMENT SECURITIES (Continued) |
The investments in U.S. treasury securities at December 31, 2020 are made of up two U.S. treasury securities that have been in a continuous loss position for less than 12 months. The unrealized loss position relates principally to changes in interest rates subsequent to the acquisition of the securities. The securities were made up of U.S. treasuries and management believe there is no credit risk and therefore, no other-than-temporary impairment.
All mortgage-backed security investments are government sponsored enterprises (“GSE”) pass-through instruments issued by the Federal National Mortgage Association (“FNMA”), or Federal Home Loan Mortgage Corporation (“FHLMC”), which guarantee the timely payment of principal on acquisition of the specific securities.
Amortized cost and fair value by contractual maturity, where applicable, are shown below. Actual maturities may differ from contractual maturities because the borrower may have the right to prepay obligations with or without penalty.
(In Thousands) | June 30, 2021 | |||||||
Amortized Cost | Fair Value | |||||||
Available for Sale: | ||||||||
1 year or less | $ | — | $ | — | ||||
Mortgage-backed securities, residential | 3,313 | 3,398 | ||||||
$ | 3,313 | $ | 3,398 | |||||
(In Thousands) | December 31, 2020 | |||||||
Amortized Cost | Fair Value | |||||||
Available for Sale: | ||||||||
1 year or less | $ | 75,000 | $ | 74,999 | ||||
Mortgage-backed securities, residential | 4,063 | 4,206 | ||||||
$ | 79,063 | $ | 79,205 | |||||
F-105
LINKBANCORP, Inc. and Subsidiary
Notes to the Consolidated Financial Statements (Unaudited)
[In Thousands, Except Share Data]
3. | LOANS RECEIVABLE |
The portfolio segments and classes of loans are as follows:
(In Thousands) | June 30, 2021 | December 31, 2020 | ||||||
Commercial and industrial | $ | 129,835 | $ | 101,370 | ||||
Construction and land development | 25,177 | 20,935 | ||||||
Real estate - commercial | 193,488 | 145,800 | ||||||
Real estate - residential | 41,891 | 37,302 | ||||||
Real estate - home equity | 21,987 | 20,218 | ||||||
Consumer | 3,429 | 2,622 | ||||||
415,807 | 328,247 | |||||||
Less: | ||||||||
Deferred fees | (1,580 | ) | (856 | ) | ||||
Allowance for loan losses | (4,800 | ) | (4,177 | ) | ||||
Total | $ | 409,427 | $ | 323,214 | ||||
The Company originates commercial, residential, and consumer loans within its primary market areas of southcentral and southeastern Pennsylvania. A significant portion of the loan portfolio is secured by real estate.
Since April 2020, the Company has participated in the Paycheck Protection Program (“PPP”), administered directly by the U.S. Small Business Administration (“SBA”). The PPP provides loans to small businesses who were affected by economic conditions as a result of
COVID-19
to provide cash-flow assistance to employers who maintain their payroll (including healthcare and certain related expenses), mortgage interest, rent, leases, utilities and interest on existing debt during theCOVID-19
emergency. As of June 30, 2021, and December 31, 2020, the Company had outstanding principal balances of $63,358 and $40,953, respectively. The PPP loans are fully guaranteed by the SBA and may be eligible for forgiveness by the SBA to the extent that the proceeds are used to cover eligible payroll costs, interest costs, rent, and utility costs. PPP loans deemed eligible for forgiveness by the SBA will be repaid by the SBA to the Company. PPP loans are included in the Commercial and Industrial category.In accordance with the SBA terms and conditions on these PPP loans, the Company received approximately $5.0 million in fees associated with the processing of these loans. For the three months ended June 30, 2021 and 2020, the Company recognized $545 and $1,417 in fees relating to PPP loans, respectively. For the six months ended June 30, 2021 and 2020, the Company recognized $1,401 and $1,417 in fees relating to PPP loans, respectively. These fees are deferred upon receipt are amortized over the life of the loan as an adjustment to yield in accordance with FASB ASC
310-20-25-2.
4. | ALLOWANCE FOR LOAN LOSSES |
The segments of the Company’s loan portfolio are disaggregated to a level that allows management to monitor risk and performance. The loan segments used are consistent with the internal reports evaluated by the Company’s management and Board of Directors to monitor risk and performance within various segments of its loan portfolio and, therefore, no further disaggregation is considered
F-106
LINKBANCORP, Inc. and Subsidiary
Notes to the Consolidated Financial Statements (Unaudited)
[In Thousands, Except Share Data]
4. | ALLOWANCE FOR LOAN LOSSES (Continued) |
necessary. The Company’s loan portfolio consists primarily of real estate loans on commercial and, to a lesser extent residential property. The portfolio also includes commercial loans, and consumer loans.
The Company’s primary lending activity is the origination of commercial loans extended to small and
mid-sized
commercial and industrial entities.Commercial loans are primarily underwritten on the basis of the borrowers’ ability to service such debt from income. The cash flows of borrowers, however, may not be as expected and the collateral securing these loans may fluctuate in value. As a general practice, the Company takes as collateral a security interest in any equipment, or other chattel, although loans may also be made on an unsecured basis. Collateralized working capital loans typically are secured by short-term assets whereas long-term loans are primarily secured by long-term assets.
Construction and Land loans are to finance the construction of owner-occupied and income producing properties. These loans are categorized as construction loans during the construction period, later converting to commercialresidential loans after the construction is complete and amortization of the loan begins. Real estate development and construction loans are approved based on an analysis of the borrower and guarantor, the viability of the project and on an acceptable percentage of the appraised value of the property securing the loan. Construction loan funds are disbursed periodically based on the percentage of construction or development completed. The Company carefully monitors these loans
or one-to-four family
with on-site inspections
and requires the receipt of lien waivers on funds advanced. The Company considers the market conditions and feasibility of proposed projects, the financial condition and reputation of the borrower and guarantors, the amount of the borrower’s equity in the project, independent appraisals, cost estimatesand pre-construction sale
information. The Company also makes loans on occasion for the purchase of land for future development by the borrower. Land loans are extended for the future development for either commercial or residential use by the borrower. The Company carefully analyzes the intended use of the property and the viability thereof.The Company’s commercial real estate loans consist of mortgage loans secured by nonresidential real estate, such as by apartment buildings, small office buildings, and owner-occupied properties. Commercial real estate loans are secured by the subject property and are underwritten based on loan to value limits, cash flow coverage and general creditworthiness of the obligors. These loans tend to involve larger loan balances and their repayment is typically dependent upon the successful operation and management of the underlying real estate.
Residential real estate loans are underwritten based on the borrower’s repayment capacity and source, value of the underlying property, credit history and stability. These loans are secured by a first or second mortgage on the borrower’s principal residence or their second/vacation home (excluding investment/rental property).
Home equity loans consists of either revolving line of credit, term, or second mortgage loans securedresidential real estate. These loans are secured by a first or second lien on the borrower’s residence. There are minimum credit score standards,and other credit requirements. Home equity lines of credit are variable rate based on an index of Wall Street Journal prime rate with a margin.
by one-to-four family
loan-to-value,
The consumer loan portfolio consists of lending in the form of home equity loans secured by financed property and personal consumer loans, which may be secured or unsecured.
F-107
LINKBANCORP, Inc. and Subsidiary
Notes to the Consolidated Financial Statements (Unaudited)
[In Thousands, Except Share Data]
4. | ALLOWANCE FOR LOAN LOSSES (Continued) |
Management has an established methodology to determine the adequacy of the allowance for loan losses that assesses the risks and losses inherent in the loan portfolio. For purposes of determining the allowance for loan losses the Company has segmented certain loans in the portfolio by product type. Loans are segmented into the following pools: agriculture loans, commercial real estate loans, commercial loans, residential real estate loans, consumer loans, and municipal loans. Historical loss percentages for each risk category are calculated and used as the basis for calculating allowance allocations. These historical loss percentages are calculated over a four-year period for all portfolio segments.
Certain qualitative factors are then added to the historical allocation percentage to get the adjusted factor to be applied to
non-classified
loans. The following qualitative factors are analyzed for each portfolio segment:| • | Levels of and trends in delinquencies |
| • | Trends in volume and terms |
| • | Changes in collateral |
| • | Changes in management and lending staff |
| • | Economic trends |
| • | Concentrations of credit |
| • | Changes in lending policies |
| • | External factors |
| • | Changes in underwriting process |
| • | Trends in credit quality ratings |
These qualitative factors are reviewed each quarter and adjusted based upon relevant changes within the portfolio.
The total allowance reflects management’s estimate of loan losses inherent in the loan portfolio at the Consolidated Balance Sheet date. The Company considers the allowance for loan losses adequate to cover loan losses inherent in the loan portfolio at June 30, 2021 and December 31, 2020.
F-108
LINKBANCORP, Inc. and Subsidiary
Notes to the Consolidated Financial Statements (Unaudited)
[In Thousands, Except Share Data]
4. | ALLOWANCE FOR LOAN LOSSES (Continued) |
The following table summarizes the activity in the allowance for loan losses by loan class for the three-month periods ended June 30, 2021 and 2020.
(in thousands)
Commercial and Industrial | Construction and Land Development | Real Estate Commercial | Real Estate Residential | Real Estate Home Equity | Consumer Other | Unallocated | Total | |||||||||||||||||||||||||
For the Three Months Ended June 30, 2021 | ||||||||||||||||||||||||||||||||
Allowance for loan losses: | ||||||||||||||||||||||||||||||||
Beginning balance | $ | 901 | $ | 408 | $ | 2,343 | $ | 484 | $ | 219 | $ | 31 | $ | — | $ | 4,386 | ||||||||||||||||
Charge-offs | — | — | — | — | — | — | — | — | ||||||||||||||||||||||||
Recoveries | 2 | — | — | 2 | — | — | — | 4 | ||||||||||||||||||||||||
Provision | 73 | 84 | 177 | 24 | 36 | 16 | — | 410 | ||||||||||||||||||||||||
Ending balance | $ | 976 | $ | 492 | $ | 2,520 | $ | 510 | $ | 255 | $ | 47 | $ | — | $ | 4,800 | ||||||||||||||||
For the Three Months Ended June 30, 2020 | ||||||||||||||||||||||||||||||||
Allowance for loan losses: | ||||||||||||||||||||||||||||||||
Beginning balance | $ | 904 | $ | 226 | $ | 1,638 | $ | 526 | $ | 103 | $ | 76 | $ | 171 | $ | 3,644 | ||||||||||||||||
Charge-offs | — | — | — | — | — | — | — | — | ||||||||||||||||||||||||
Recoveries | 4 | — | — | 3 | — | — | — | 5 | ||||||||||||||||||||||||
Provision | 32 | 100 | 127 | (32 | ) | (6 | ) | (62 | ) | (44 | ) | 115 | ||||||||||||||||||||
Ending balance | $ | 940 | 326 | $ | 1,765 | $ | 497 | $ | 97 | $ | 14 | $ | 127 | $ | 3,766 | |||||||||||||||||
F-109
LINKBANCORP, Inc. and Subsidiary
Notes to the Consolidated Financial Statements (Unaudited)
[In Thousands, Except Share Data]
4. | ALLOWANCE FOR LOAN LOSSES (Continued) |
The following table summarizes the activity in the allowance for loan losses by loan class for the six month periods ended June 30, 2021 and 2020.
(in thousands)
Commercial and Industrial | Construction and Land Development | Real Estate Commercial | Real Estate Residential | Real Estate Home Equity | Consumer Other | Unallocated | Total | |||||||||||||||||||||||||
For the Six Months Ended June 30, 2021 | ||||||||||||||||||||||||||||||||
Allowance for loan losses: | ||||||||||||||||||||||||||||||||
Beginning balance | $ | 1,002 | $ | 397 | $ | 2,082 | $ | 418 | $ | 242 | $ | 35 | $ | 1 | $ | 4,177 | ||||||||||||||||
Charge-offs | — | — | — | — | — | — | — | — | ||||||||||||||||||||||||
Recoveries | 3 | — | — | 3 | — | — | — | 6 | ||||||||||||||||||||||||
Provision | (29 | ) | 95 | 438 | 89 | 13 | 12 | (1 | ) | 617 | ||||||||||||||||||||||
Ending balance | $ | 976 | $ | 492 | $ | 2,520 | $ | 510 | $ | 255 | $ | 47 | $ | — | $ | 4,800 | ||||||||||||||||
For the Six Months Ended June 30, 2020 | ||||||||||||||||||||||||||||||||
Allowance for loan losses: | ||||||||||||||||||||||||||||||||
Beginning balance | $ | 623 | $ | 170 | $ | 598 | $ | 214 | $ | 45 | $ | 9 | $ | 30 | $ | 1,689 | ||||||||||||||||
Charge-offs | — | — | — | — | — | — | — | — | ||||||||||||||||||||||||
Recoveries | 6 | — | — | 6 | — | — | — | 12 | ||||||||||||||||||||||||
Provision | 311 | 156 | 1,167 | 277 | 52 | 5 | 97 | 2,065 | ||||||||||||||||||||||||
Ending balance | $ | 940 | 326 | $ | 1,765 | $ | 497 | $ | 97 | $ | 14 | $ | 127 | $ | 3,766 | |||||||||||||||||
F-110
LINKBANCORP, Inc. and Subsidiary
Notes to the Consolidated Financial Statements (Unaudited)
[In Thousands, Except Share Data]
4. | ALLOWANCE FOR LOAN LOSSES (Continued) |
The following table illustrates the balance of loans individually evaluated vs. collectively evaluated for impairment at June 30, 2021 and December 31, 2020.
(in thousands)
Commercial and Industrial | Construction and Land Development | Real Estate Commercial | Real Estate Residential | Real Estate Home Equity | Consumer Other | Unallocated | Total | |||||||||||||||||||||||||
As of June 30, 2021 | ||||||||||||||||||||||||||||||||
Allowance for loan losses: | ||||||||||||||||||||||||||||||||
Ending balance | $ | 976 | $ | 492 | $ | 2,520 | $ | 510 | $ | 255 | $ | 47 | $ | — | $ | 4,800 | ||||||||||||||||
Ending balance: individually evaluated for impairment | $ | 45 | $ | — | $ | 37 | $ | 17 | $ | — | $ | 3 | $ | — | $ | 102 | ||||||||||||||||
Ending balance: collectively evaluated for impairment | $ | 931 | $ | 492 | $ | 2,483 | $ | 493 | $ | 255 | $ | 44 | $ | — | $ | 4,698 | ||||||||||||||||
Loans: | ||||||||||||||||||||||||||||||||
Ending balance | $ | 129,835 | $ | 25,177 | $ | 193,488 | $ | 41,891 | $ | 21,987 | $ | 3,429 | $ | 415,807 | ||||||||||||||||||
Ending balance: individually evaluated for impairment | $ | 950 | $ | — | $ | 4,916 | $ | 823 | $ | — | 3 | $ | 6,692 | |||||||||||||||||||
Ending balance: collectively evaluated for impairment | $ | 128,885 | $ | 25,177 | $ | 188,572 | $ | 41,068 | $ | 21,987 | $ | 3,426 | $ | 409,115 | ||||||||||||||||||
F-111
LINKBANCORP, Inc. and Subsidiary
Notes to the Consolidated Financial Statements (Unaudited)
[In Thousands, Except Share Data]
4. | ALLOWANCE FOR LOAN LOSSES (Continued) |
Commercial and Industrial | Construction and Land Development | Real Estate Commercial | Real Estate Residential | Real Estate Home Equity | Consumer Other | Unallocated | Total | |||||||||||||||||||||||||
As of December 31, 2020 | ||||||||||||||||||||||||||||||||
Allowance for loan losses: | ||||||||||||||||||||||||||||||||
Ending balance | $ | 1,002 | $ | 397 | $ | 2,082 | $ | 418 | $ | 242 | $ | 35 | $ | 1 | $ | 4,177 | ||||||||||||||||
Ending balance: individually evaluated for impairment | $ | 111 | $ | — | $ | — | $ | 18 | $ | — | 3 | — | $ | 132 | ||||||||||||||||||
Ending balance: collectively evaluated for impairment | $ | 891 | $ | 397 | $ | 2,082 | $ | 400 | $ | 242 | 32 | 1 | $ | 4,045 | ||||||||||||||||||
Loans: | ||||||||||||||||||||||||||||||||
Ending balance | $ | 101,370 | $ | 20,935 | $ | 145,800 | $ | 37,302 | $ | 20,218 | $ | 2,622 | $ | 328,247 | ||||||||||||||||||
Ending balance: individually evaluated for impairment | $ | 1,081 | $ | — | $ | 230 | $ | 331 | $ | — | $ | 3 | $ | 1,645 | ||||||||||||||||||
Ending balance: collectively evaluated for impairment | $ | 100,289 | $ | 20,935 | $ | 145,570 | $ | 36,971 | $ | 20,218 | $ | 2,619 | $ | 326,602 | ||||||||||||||||||
Credit Quality Information
The following tables represent credit exposures by internally assigned grades as of June 30, 2021 and December 31, 2020. The grading analysis estimates the capability of the borrower to repay the contractual obligations of the loan agreements as scheduled or at all.
The Company’s internally assigned grades are as follows:
Pass – loans that are protected by the current net worth and paying capacity of the obligor or by the value of the underlying collateral. There are four
sub-grades
within the Pass category to further distinguish the loan.Special Mention – loans where a potential weakness or risk exists, which could cause a more serious problem if not corrected.
Substandard – loans that have a well-defined weakness based on objective evidence and are characterized by the distinct possibility that the Bank will sustain some loss if the deficiencies are not corrected.
F-112
LINKBANCORP, Inc. and Subsidiary
Notes to the Consolidated Financial Statements (Unaudited)
[In Thousands, Except Share Data]
4. | ALLOWANCE FOR LOAN LOSSES (Continued) |
Credit Quality Information (Continued)
Doubtful – loans classified as Doubtful have all the weaknesses inherent in a Substandard asset. In addition, these weaknesses make collection or liquidation in full highly questionable and improbable, based on existing circumstances.
Loss – loans classified as a Loss are considered uncollectible and are immediately charged against allowances.
The following table presents the classes of the loan portfolio summarized by the internal risk rating system as of June 30, 2021 and December 31, 2020:
(In Thousands) | Special Mention | |||||||||||||||||||
As of June 30, 2021 | Pass | Substandard | Doubtful | Total | ||||||||||||||||
Commercial and industrial | $ | 125,705 | $ | 3,180 | $ | 950 | $ | — | $ | 129,835 | ||||||||||
Construction and land development | 25,177 | — | — | — | 25,177 | |||||||||||||||
Real estate - commercial | 188,367 | 4,568 | 553 | — | 193,488 | |||||||||||||||
Real estate - residential | 41,559 | 107 | 225 | — | 41,891 | |||||||||||||||
Real estate - home equity | 21,987 | — | — | — | 21,987 | |||||||||||||||
Consumer | 3,426 | — | 3 | — | 3,429 | |||||||||||||||
Total | $ | 406,221 | $ | 7,855 | $ | 1,731 | $ | — | $ | 415,807 | ||||||||||
(In Thousands) | Special Mention | |||||||||||||||||||
As of December 31, 2020 | Pass | Substandard | Doubtful | Total | ||||||||||||||||
Commercial and industrial | $ | 100,289 | $ | — | $ | 1,081 | $ | — | $ | 101,370 | ||||||||||
Construction and land development | 20,935 | — | — | — | 20,935 | |||||||||||||||
Real estate - commercial | 145,358 | 212 | 230 | — | 145,800 | |||||||||||||||
Real estate - residential | 36,892 | 142 | 268 | — | 37,302 | |||||||||||||||
Real estate - home equity | 20,155 | — | 63 | — | 20,218 | |||||||||||||||
Consumer | 2,619 | — | 3 | — | 2,622 | |||||||||||||||
Total | $ | 326,248 | $ | 354 | $ | 1,645 | $ | — | $ | 328,247 | ||||||||||
F-113
LINKBANCORP, Inc. and Subsidiary
Notes to the Consolidated Financial Statements (Unaudited)
[In Thousands, Except Share Data]
4. | ALLOWANCE FOR LOAN LOSSES (Continued) |
Credit Quality Information (Continued)
The following tables present an aging analysis of the recorded investment of
past-due
loans.June 30, 2021 | ||||||||||||||||||||||||||||
(In Thousands) | 30-59 Days Past Due | 60-89 Days Past Due | 90 Days or Greater Past Due | Total Past Due | Current | Total Loans | Total > 90 Days and Accruing | |||||||||||||||||||||
Commercial and industrial | $ | 1,878 | $ | — | $ | — | $ | 1,878 | $ | 127,957 | $ | 129,835 | $ | — | ||||||||||||||
Construction and land development | — | — | — | — | 25,177 | 25,177 | — | |||||||||||||||||||||
Real estate - commercial | 2,779 | — | — | 2,779 | 190,709 | 193,488 | — | |||||||||||||||||||||
Real estate - residential | 150 | 225 | — | 375 | 41,516 | 41,891 | — | |||||||||||||||||||||
Real estate - home equity | — | — | — | — | 21,987 | 21,987 | — | |||||||||||||||||||||
Consumer | — | 14 | — | 14 | 3,415 | 3,429 | — | |||||||||||||||||||||
Total | $ | 4,807 | $ | 239 | $ | — | $ | 5,046 | 410,761 | $ | 415,807 | $ | — | |||||||||||||||
December 31, 2020 | ||||||||||||||||||||||||||||
(In Thousands) | 30-59 Days Past Due | 60-89 Days Past Due | 90 Days or Greater Past Due | Total Past Due | Current | Total Loans | Total > 90 Days and Accruing | |||||||||||||||||||||
Commercial and industrial | $ | 10 | $ | — | $ | — | $ | 10 | $ | 101,360 | $ | 101,370 | $ | — | ||||||||||||||
Construction and land development | — | — | — | — | 20,935 | 20,935 | — | |||||||||||||||||||||
Real estate - commercial | 480 | — | 156 | 636 | 145,164 | 145,800 | — | |||||||||||||||||||||
Real estate - residential | 711 | 719 | 133 | 1,563 | 35,739 | 37,302 | 97 | |||||||||||||||||||||
Real estate - home equity | — | — | — | — | 20,218 | 20,218 | — | |||||||||||||||||||||
Consumer | — | — | — | — | 2,622 | 2,622 | — | |||||||||||||||||||||
Total | $ | 1,201 | $ | 719 | $ | 289 | $ | 2,209 | $ | 326,038 | $ | 328,247 | $ | 97 | ||||||||||||||
F-114
LINKBANCORP, Inc. and Subsidiary
Notes to the Consolidated Financial Statements (Unaudited)
[In Thousands, Except Share Data]
4. | ALLOWANCE FOR LOAN LOSSES (Continued) |
Impaired Loans
The following tables present the recorded investment and unpaid principal balances for impaired loans and related allowance, if applicable. Also presented are the average recorded investments and the related amount of interest recognized during the time within the period that the impaired loans were impaired.
As of June 30, 2021 | ||||||||||||
(In Thousands) | Recorded Investment | Unpaid Principal Balance | Related Allowance | |||||||||
With no related allowance recorded: | ||||||||||||
Commercial and industrial | $ | 526 | $ | 526 | $ | — | ||||||
Construction and land development | — | — | — | |||||||||
Real estate - commercial | 2,431 | 2,431 | — | |||||||||
Real estate - residential | 789 | 789 | — | |||||||||
Real estate - home equity | — | — | — | |||||||||
Consumer | — | — | — | |||||||||
With an allowance recorded: | ||||||||||||
Commercial and industrial | $ | 424 | $ | 424 | $ | 45 | ||||||
Construction and land development | — | — | — | |||||||||
Real estate - commercial | 2,485 | 2,485 | 37 | |||||||||
Real estate - residential | 34 | 34 | 17 | |||||||||
Real estate - home equity | — | — | — | |||||||||
Consumer | 3 | 3 | 3 | |||||||||
Total | ||||||||||||
Commercial and industrial | $ | 950 | 950 | 45 | ||||||||
Construction and land development | — | — | — | |||||||||
Real estate - commercial | 4,916 | 4,916 | 37 | |||||||||
Real estate - residential | 823 | 823 | 17 | |||||||||
Real estate - home equity | — | — | — | |||||||||
Consumer | 3 | 3 | 3 | |||||||||
$ | 6,692 | 6,692 | 102 | |||||||||
As of December 31, 2020 | ||||||||||||
With no related allowance recorded: | ||||||||||||
Commercial and industrial | $ | — | $ | — | $ | — | ||||||
Construction and land development | — | — | — | |||||||||
Real estate - commercial | 230 | 230 | — | |||||||||
Real estate - residential | 295 | 295 | — | |||||||||
Real estate - home equity | — | — | — | |||||||||
Consumer | — | — | — | |||||||||
With an allowance recorded: | ||||||||||||
Commercial and industrial | $ | 1,081 | $ | 1,081 | $ | 111 | ||||||
Construction and land development | — | — | — | |||||||||
Real estate - commercial | — | — | — | |||||||||
Real estate - residential | 36 | 36 | 18 | |||||||||
Real estate - home equity | — | — | — | |||||||||
Consumer | 3 | 3 | 3 | |||||||||
Total | ||||||||||||
Commercial and industrial | $ | 1,081 | 1,081 | 111 | ||||||||
Construction and land development | — | — | — | |||||||||
Real estate - commercial | 230 | 230 | — | |||||||||
Real estate - residential | 331 | 331 | 18 | |||||||||
Real estate - home equity | — | — | — | |||||||||
Consumer | 3 | 3 | 3 | |||||||||
| $ | 1,645 | $ | 1,645 | $ | 132 | |||||||
F-115
LINKBANCORP, Inc. and Subsidiary
Notes to the Consolidated Financial Statements (Unaudited)
[In Thousands, Except Share Data]
4. | ALLOWANCE FOR LOAN LOSSES (Continued) |
Impaired Loans (Continued)
Three Months Ended June 30, | ||||||||||||||||
2021 | 2020 | |||||||||||||||
(In Thousands) | Average Recorded Investment | Interest Income Recognized | Average Recorded Investment | Interest Income Recognized | ||||||||||||
With no related allowance recorded: | ||||||||||||||||
Commercial and industrial | $ | 548 | $ | 7 | $ | 762 | $ | 10 | ||||||||
Construction and land development | — | — | — | — | ||||||||||||
Real estate - commercial | 2,435 | 16 | 2,426 | 26 | ||||||||||||
Real estate - residential | 790 | 8 | 812 | 11 | ||||||||||||
Real estate - home equity | — | — | — | — | ||||||||||||
Consumer | — | — | — | — | ||||||||||||
| 3,773 | 31 | 4,000 | 47 | |||||||||||||
With an allowance recorded: | ||||||||||||||||
Commercial and industrial | 424 | $ | 4 | $ | 499 | $ | 6 | |||||||||
Construction and land development | — | — | — | — | ||||||||||||
Real estate - commercial | 2,486 | 10 | 2,532 | 31 | ||||||||||||
Real estate - residential | 35 | — | 38 | 1 | ||||||||||||
Real estate - home equity | — | — | — | — | ||||||||||||
Consumer | 3 | — | 4 | — | ||||||||||||
| 2,948 | 14 | 3,073 | 38 | |||||||||||||
Total | $ | 6,721 | $ | 45 | $ | 7,073 | $ | 85 | ||||||||
Six Months Ended June 30, | ||||||||||||||||
2021 | 2020 | |||||||||||||||
(In Thousands) | Average Recorded Investment | Interest Income Recognized | Average Recorded Investment | Interest Income Recognized | ||||||||||||
With no related allowance recorded: | ||||||||||||||||
Commercial and industrial | $ | 584 | $ | 15 | $ | 783 | $ | 20 | ||||||||
Construction and land development | — | — | — | — | ||||||||||||
Real estate - commercial | 2,435 | 34 | 2,431 | 55 | ||||||||||||
Real estate - residential | 793 | 17 | 816 | 22 | ||||||||||||
Real estate - home equity | — | — | — | — | ||||||||||||
Consumer | — | — | — | — | ||||||||||||
| 3,812 | 66 | 4,030 | 97 | |||||||||||||
With an allowance recorded: | ||||||||||||||||
Commercial and industrial | 424 | $ | 9 | $ | 499 | $ | 13 | |||||||||
Construction and land development | — | — | — | — | ||||||||||||
Real estate - commercial | 2,491 | 41 | 2,538 | 63 | ||||||||||||
Real estate - residential | 35 | — | 38 | 1 | ||||||||||||
Real estate - home equity | — | — | — | — | ||||||||||||
Consumer | 3 | — | 4 | — | ||||||||||||
| 2,953 | 50 | 3,079 | 77 | |||||||||||||
Total | $ | 6,765 | $ | 116 | $ | 7,109 | $ | 174 | ||||||||
F-116
LINKBANCORP, Inc. and Subsidiary
Notes to the Consolidated Financial Statements (Unaudited)
[In Thousands, Except Share Data]
4. | ALLOWANCE FOR LOAN LOSSES (Continued) |
Impaired Loans (Continued)
The following table present nonaccrual loans by classes of the loan portfolio:
(In Thousands) | June 30, 2021 | December 31, 2020 | ||||||
Commercial and industrial | $ | — | $ | — | ||||
Construction and land development | — | — | ||||||
Real estate - commercial | 250 | — | ||||||
Real estate - residential | 261 | 100 | ||||||
Real estate - home equity | — | — | ||||||
Consumer | 3 | 3 | ||||||
Total | $ | 514 | $ | 103 | ||||
The recorded investment in
non-accrual
loans was $514 and $103 at June 30, 2021 and December 31, 2020.Approximately $218,665 or 52.6% of the Bank’s loan portfolio was in real estate-commercial loans and construction and land development loans at June 30, 2021. While the Bank does not have a concentration of credit risk with any single borrower or industry, repayments on loans in these portfolios can be negatively influenced by decreases in real estate values. The Bank mitigates this risk through conservative underwriting policies and procedures. In addition, $60,126 of real estate-commercial loans were owner occupied properties as of June 30, 2021. These types of loans are generally considered to involve less risk than nonowner-occupied mortgages.
At June 30, 2021 and December 31, 2020, the carrying amount of borrowings secured by loans pledged to the FHLB under its blanket lien was $20,000 and $61,667, respectively.
Loan Modifications and Troubled Debt Restructurings (TDRs)
A loan is considered to be a TDR loan when the Company grants a concession to the borrower because of the borrower’s financial condition that it would not otherwise consider. Such concessions include the reduction of interest rates, forgiveness of principal or interest, or other modifications of interest rates that are less than the current market rate for new obligations with similar risk.
The Bank may grant a concession or modification for economic or legal reasons related to a borrower’s financial condition that it would not otherwise consider resulting in a modified loan which is then identified as a troubled debt restructuring (TDR). The Bank may modify loans through rate reductions, extensions of maturity, interest only payments, or payment modifications to better match the timing of cash flows due under the modified terms with the cash flows from the borrowers’ operations. Loan modifications are intended to minimize the economic loss and to avoid foreclosure or repossession of the collateral. TDRs are considered impaired loans for purposes of calculating the Bank’s allowance for loan losses.
The Bank identifies loans for potential restructure primarily through direct communication with the borrower and evaluation of the borrower’s financial statements, revenue projections, tax returns, and credit reports. Even if the borrower is not presently in default, management will consider the likelihood that cash flow shortages, adverse economic conditions, and negative trends may result in a payment default in the near future. As of June 30, 2021 and December 31, 2020, the Company had no loans identified as TDR’s. There were also no new loan modifications during the periods that were considered TDRs.
F-117
LINKBANCORP, Inc. and Subsidiary
Notes to the Consolidated Financial Statements (Unaudited)
[In Thousands, Except Share Data]
4. | ALLOWANCE FOR LOAN LOSSES (Continued) |
COVID-19
Loan Forbearance ProgramsSection 4013 of the CARES Act provides that banks may elect not to categorize a loan modification as a TDR if the loan modification is (1) related to
COVID-19;
(2) executed on a loan that was not more than 30 days past due as of December 31, 2019; and (3) executed between March 1, 2020, and the earlier of (A) 60 days after the date on which the national emergency concerning the novel coronavirus disease (COVID–19) outbreak declared by the President on March 13, 2020, under the National Emergencies Act terminates, or (B) January 1, 2022.On April 7, 2020, federal banking regulators issued a revised interagency statement that included guidance on their approach for the accounting of loan modifications in light of the economic impact of the
COVID-19
pandemic. The guidance interprets current accounting standards and indicates that a lender can conclude that a borrower is not experiencing financial difficulty if short-term modifications are made in response toCOVID-19,
such as payment deferrals, fee waivers, extensions of repayment terms, or other delays in payment that are insignificant related to the loans in which the borrower is less than 30 days past due on its contractual payments at the time a modification program is implemented.According to the Interagency Statement on Loan Modifications and Reporting for Financial Institutions Working with Customers Affected by the Coronavirus (Revised) issued by the federal bank regulatory agencies on April 7, 2020, short-term loan modifications not otherwise eligible under Section 4013 that are made on a good faith basis in response to
COVID-19
to borrowers who were current prior to any relief are not TDRs. This includes short-term (e.g., six months) modifications such as payment deferrals, fee waivers, extensions of repayment terms, or other delays in payment that are insignificant.During 2020, our customers had requested 82 loan payment deferrals or payments of interest only on loans totaling $53,700. In accordance with Section 4013 of the CARES Act and the interagency guidance issued on April 7, 2020, these short-term deferrals are not considered troubled debt restructurings. As of June 30, 2021, the Company had 9 loans totaling $17,708 that remain on a CARES Act modification.
In addition, the risk-rating on
COVID-19
modified loans did not change, and these loans will not be considered past due until after the deferral period is over and scheduled payments resume. The credit quality of these loans will be reevaluated after the deferral period ends.5. | DEPOSITS |
Deposit accounts are summarized as follows:
June 30, 2021 | December 31, 2020 | |||||||||||||||
(In Thousands) | Amount | % | Amount | % | ||||||||||||
Demand, noninterest-bearing | $ | 74,303 | 19.97 | % | $ | 42,374 | 14.97 | % | ||||||||
Demand, interest-bearing | 31,666 | 8.51 | 15,883 | 5.61 | ||||||||||||
Money market and savings | 132,412 | 35.59 | 81,756 | 28.88 | ||||||||||||
Time deposits, $250 and over | 45,214 | 12.15 | 47,112 | 16.64 | ||||||||||||
Time deposits, other | 88,458 | 23.78 | 95,929 | 33.89 | ||||||||||||
$ | 372,053 | 100.0 | % | $ | 283,054 | 100.0 | % | |||||||||
F-118
LINKBANCORP, Inc. and Subsidiary
Notes to the Consolidated Financial Statements (Unaudited)
[In Thousands, Except Share Data]
5. | DEPOSITS (Continued) |
The scheduled maturities of time deposits are as follows:
(In Thousands) | June 30, 2021 | December 31, 2020 | ||||||
One year or less | $ | 109,784 | $ | 122,859 | ||||
More than one year to two years | 12,432 | 13,441 | ||||||
More than two years to three years | 9,376 | 5,921 | ||||||
More than three years to four years | 1,739 | 288 | ||||||
More than four years to five years | 341 | 532 | ||||||
More than five years | — | — | ||||||
Total | $ | 133,672 | $ | 143,041 | ||||
Time deposits include those in denominations of $250 or more. Such deposits aggregated $45,214 and $47,112 at June 30, 2021 and December 31, 2020, respectively. There were $20,000 brokered deposits outstanding at June 30, 2021 maturing in November 2021 and $25,000 in brokered deposits as of December 31, 2020 maturing in January 2021.
6. | SHORT-TERM BORROWINGS |
The outstanding balances and related information of short-term borrowings represent federal funds purchased and short-term advances with the FHLB are summarized as follows:
(In Thousands) | June 30, 2021 | December 31, 2020 | ||||||
Balance at period end | $ | — | $ | 41,667 | ||||
Average balance outstanding | 6,330 | 474 | ||||||
Maximum month-end balance | 20,833 | 41,667 | ||||||
Weighted-average rate at period end | 0.00 | % | 0.35 | % | ||||
Weighted-average rate during the period | 0.15 | % | 0.35 | % | ||||
Average balances outstanding during the period represent daily average balances.
The Company had no short-term borrowings at June 30, 2021. The Company had $41.7 million in
13-day
FHLB advances at December 31, 2020 which matured on January 5, 2021. Borrowings from the FHLB of Pittsburgh are secured by FHLB stock, qualifying loans, and investments. The Company maintains stock in the FHLB of Pittsburgh of $1,015 as of June 30, 2021 and $2,591 as of December 31, 2020. The Company has a maximum borrowing capacity with the FHLB of approximately $132,756 of which $20,000 was outstanding at June 30, 2021.At June 30, 2021 and December 31, 2020, the Company also has lines of credit at three financial institutions that would allow the Company to borrow up to $25,000. None of the credit lines were drawn upon at June 30, 2021 or December 31, 2020 .
F-119
LINKBANCORP, Inc. and Subsidiary
Notes to the Consolidated Financial Statements (Unaudited)
[In Thousands, Except Share Data]
7. | OTHER BORROWINGS AND SUBORDINATED DEBT |
The Company’s other Borrowings consisted of:
(in Thousands) | June 30, 2021 | December 31, 2020 | ||||||
Long-term FHLB advances | $ | 20,000 | $ | 20,000 | ||||
Subordinated Debt | 19,973 | 19,970 | ||||||
Federal Reserve PPPLF | 3,087 | 17,315 | ||||||
Total Long-term borrowings | $ | 43,060 | $ | 57,285 | ||||
All borrowings from the FHLB are secured by a blanket lien on qualified collateral, defined principally as investment securities and mortgage loans, which are owned by the Company, free and clear of any liens or encumbrances.
Contractual maturities and scheduled cash flows of Federal Home Loan Bank long-term advances, in thousands, consist of the following at June 30, 2021:
Type | Amount | Rate | Due in | |||||||||
Mid Term Repo Fixed Rate | $ | 5,000 | 0.91 | % | 2023 | |||||||
Fixed Rate | 5,000 | 0.97 | % | 2024 | ||||||||
Fixed Rate | 5,000 | 1.10 | % | 2025 | ||||||||
Fixed Rate | 3,000 | 1.01 | % | 2025 | ||||||||
Fixed Rate | 2,000 | 1.02 | % | 2025 | ||||||||
$ | 20,000 | 1.00 | % | |||||||||
In April 2020, the Federal Reserve initiated the Paycheck Protection Program Liquidity Facility (“PPPLF”) , which is designed to facilitate lending by financial institutions to small businesses under the PPP provision of the CARES Act. Only PPP loans are eligible to serve as collateral for the PPPLF, with each dollar of PPP loans providing one dollar of advance availability. The maturity date of an extension of credit under the PPPLF will equal the maturity date of the pool of PPP loans pledged to secure the extension of credit. Any principal payments received by the financial institution on the PPP loans, such as PPP loan forgiveness payments from the Small Business Administration or principal payments from the borrower after the initial six -month deferment period, must be used to pay down the PPPLF advance by the same dollar amount, maintaining theadvance amount and PPP aggregate loan balance relationship. The interest rate on PPPLF advances is fixed at 0.35%. As of June 30, 2021, the Company’s advances under the PPPLF totaled $3,084.
dollar-for-dollar
On September 30, 2020, the Company accepted subscriptions for and sold, at 100% of their principal amount, an aggregate of $20,000 of subordinated notes (the “Notes”), on a private placement basis, to accredited investors. The investors included companies owned and controlled by a director of the Company, which purchased $19,000 in principal amount of the Notes. The Notes bear interest at a fixed interest rate of 5.0% per year for five years and then float at an index tied to the Secured Overnight Finance Rate (“SOFR”). The Notes have a term of ten years and have a maturity date of October 1, 2030. The Notes are redeemable at the option of the Company, in whole or in part, subject to any required regulatory approvals after five years. The Company contributed $15,000 of the proceeds from the Notes to the Bank as equity capital to support the Bank’s continued growth, including ongoing lending activities.
F-120
LINKBANCORP, Inc. and Subsidiary
Notes to the Consolidated Financial Statements (Unaudited)
[In Thousands, Except Share Data]
8. | INCOME TAXES |
The provision for income taxes consists of:
| For the Six Months Ended June 30, | ||||||||
(In Thousands) | 2021 | 2020 | ||||||
Current tax expense | $ | 91 | $ | — | ||||
Deferred tax benefit | (3,044 | ) | — | |||||
Total | $ | (2,953 | ) | $ | — | |||
The tax effects of deductible and taxable temporary differences that gave rise to significant portions of the deferred tax assets and deferred tax liabilities, respectively, are as follows:
(In Thousands) | June 30, 2021 | December 31, 2020 | ||||||
Deferred tax assets: | ||||||||
Allowance for loan losses | $ | 1,008 | $ | 877 | ||||
Fair value adjustment on acquired loans | 515 | 535 | ||||||
Alternative minimum tax credit | 98 | 98 | ||||||
Net operating loss carryforwards | 1,665 | 1,872 | ||||||
Other | (253 | ) | (240 | ) | ||||
Total gross deferred tax assets before valuation allowance | 3,033 | 3,142 | ||||||
Valuation allowance | — | (3,044 | ) | |||||
Net deferred tax assets | $ | 3,033 | $ | 98 | ||||
In assessing the realizability of deferred tax assets, management considers whether it is more-likely-
than-not
that some portion or all the deferred tax assets will not be realized. The ultimate realization of deferred tax assets is dependent upon the generation of future taxable income during the periods in which those temporary differences become deductible. Management considers the reversal of deferred tax liabilities (including the impact of available carry back and carry forward periods), projected future taxable income andtax-planning
strategies in making this assessment. The amount of the deferred tax asset considered realizable, however, could change in the near term if estimates of future taxable income during the carry forward period change and the deferred tax asset will continue to be analyzed on a quarterly basis for changes affecting realizability. During formation year for the Company of 2018, the Company generated apre-tax
loss and since there was no verifiable evidence that the Company would be profitable in the near future, a full deferred tax asset valuation allowance was established at December 31, 2018 and had been maintained through December 31, 2020.At March 31, 2021, Management updated its realizability analysis over the deferred tax asset and reached the determination that it is more likely than not that the deferred tax asset will be realized in future periods. As such, the Company recorded a complete reversal of the deferred tax asset valuation allowance as of March 31, 2021. The Company considered all available evidence and applied judgment in determining the effect of positive and negative evidence and the weight that should be given to that evidence based on its ability to objectively verify it. In the assessing and weighing the positive evidence against the negative evidence, Management determined that more weight could be placed on the positive evidence while the context surrounding the accumulated losses allowed the Company to
F-121
LINKBANCORP, Inc. and Subsidiary
Notes to the Consolidated Financial Statements (Unaudited)
[In Thousands, Except Share Data]
8. | INCOME TAXES (Continued) |
place a slightly lower weight on the negative evidence. The only piece of negative evidence that management identified was the cumulative loss that the Company has incurred from its inception in October 2018 through March 31, 2021. While ASCstates that forming a conclusion that a valuation allowance is not needed is difficult when there is negative evidence such as cumulative losses in recent years, management also notes that ASCstates, “Sometimes, however, historical information may not be available (for example,Through March 31, 2020, the Company had an accumulated loss of $11.2 million, which is the result of incurring
740-10-30-21
740-10-30-17
start-up
operations) or it may not be as relevant (for example, if there has been a significant, recent change in circumstances) and special attention is required.” Management notes that the Company’s circumstances apply to ASC740-10-30-17.
start-up
costs, increased costs associated with remediating the regulatory consent order that the bank was under at the time that the Company purchased the bank charter out of bankruptcy, and costs associated with the establishment of sound banking processes and procedures. Strong positive evidence that can overcome such negative evidence, however, is a recent history of sustainablepre-tax
income. The Company achieved positivepre-tax
income, excluding merger costs in its four most recent quarters as of March 31, 2021. As a result of this recent profitability, the Company utilized $284 thousand of net operating losses in 2020. The Company achieved the transition frompre-tax
losses topre-tax
income through organic growth. Since December 31, 2018 through March 31, 2021, the Company grew its interest earning assets from $79.9 million to $405.7 million, which represents a compounded annual growth rate of approximately 106%. Our improvements in operating profitability has been driven by the Company’s rapid growth since inception and its ability to generate revenue producing assets to a level that sufficiently covers our funding costs and direct operating costs along with our corporate overhead. The Company’s primary business is driven by our net interest spread which is generated through monthly recurring interest income earned on loans reduced by the cost of deposits and borrowings. During 2020, the U.S. economy was negatively affected on a significant level as a result of the COVID 19 global pandemic yet during 2020, the Company grew its net interest spread in comparison to 2019 and during the first quarter of 2021, we further grew our net interest spread despite the continued low interest rate environment in our markets and in the U.S. This was achieved because our Company continues to evolve from a de novo institution to a more mature financial institution and as part of that evolution, we have been able to generate a greater amount of lower cost deposits as we build customer relationships which allows us to place less reliance onnon-core,
higher cost funding options. This growth as a Company helps support the assumption that ourpre-tax
income growth is sustainable and reasonable.With respect to the material assumptions underlying the Company’s determination of the expected U.S.
pre-tax
income needed to realize its deferred tax assets, it understands that forecasts are inherently subjective and that it is generally preferred that the source of positive evidence for the utilization of the deferred tax assets comes from what has already been demonstrated or is otherwise objectively verifiable. Accordingly, the foundation of the projection process is the amount and trend ofpre-tax
income during the past year because this evidence is typically the most objective indicator available. At the end of 2020, the Company prepared a forecast ofpre-tax
income, exclusive of merger expenses, for 2021 based on the existing loan and deposit portfolios along with growth projections. The Company’spre-tax
income for the quarter ending March 31, 2021 yielded annualized results of an assumed full yearpre-tax
income of approximately $800 thousand, which is relatively consistent with the forecast ofpre-tax
income prepared for 2021.At June 30, 2021, Management updated the aforementioned March 31, 2021 analysis and continues to conclude that it is more likely than not that the deferred tax asset will be realized in future periods.
F-122
LINKBANCORP, Inc. and Subsidiary
Notes to the Consolidated Financial Statements (Unaudited)
[In Thousands, Except Share Data]
8. | INCOME TAXES (Continued) |
As of June 30, 2021, the Company had federal net operating loss carry forwards of $7,930. Approximately $489 of these net operating loss carryforwards are subject to Section 382 limitations.
9. | STOCK-BASED COMPENSATION |
On May 14, 2019, the Company’s shareholders approved the LINKBANCORP, Inc. 2019 Equity Incentive Plan (the “Plan”).The plan authorizes the issuance or delivery to participants of up to 450,000 share of LINK BANCORP common stock pursuant to grants of incentive and
non-statutory
stock options. The plan is administered by the members of LINKBANCORP’s Compensation Committee. Unless the Committee specifies a different vesting schedule, awards under the Plan shall be granted with a vesting rate of 20 percent per year. Vesting may be accelerated under certain conditions or at the discretion of the Committee at any time. Employees and directors of LINKBANCORP or its subsidiaries are eligible to receive awards under the plan, except that nonemployees may not be granted incentive stock options. Stock options are either “incentive” stock options or “nonqualified” stock options. Incentive stock options have certain tax advantages and must comply with the requirements of Section 422 of the Internal Revenue Code.Number of Stock Options | Weighted- Average Exercise Price | Weighted- Average Remaining Contractual Term in Years | Aggregate Intrinsic Value (in ‘000s) | |||||||||||||
Outstanding, December 31, 2020 | 396,000 | $ | 10.10 | 8.6 | $ | 455 | ||||||||||
Granted | 30,000 | 11.77 | 9.7 | |||||||||||||
Expired/terminated | 1,200 | 10.00 | — | |||||||||||||
Exercised | 1,000 | 10.00 | — | |||||||||||||
Outstanding, June 30, 2021 | 423,800 | $ | 10.19 | 8.2 | $ | 1,509 | ||||||||||
Exercisable at period end | 146,700 | $ | 10.00 | 8.0 | $ | 550 | ||||||||||
The exercise prices for options outstanding as of June 30, 2021 ranged from $10.00 to $11.78. During the three months ended June 30, 2021 and 2020, the Company recognized stock-based compensation expense of $20 and $21. For the six months ended June 30, 2021 and 2020, the Company recognized stock-based compensation expense of $41 and $42. At June 30, 2021, the total unrecognized stock-based compensation costs totaled $248 and will be recognized ratably as expense through December 31, 2026.
10. | FINANCIAL INSTRUMENTS WITH OFF-BALANCE SHEET RISK |
The Company is a party to financial instruments with
off-balance
sheet risk in the normal course of business to meet the financing needs of its customers. These financial instruments include commitments to extend credit. Such commitments involve, to varying degrees, elements of credit and interest rate risk in excess of the amount recognized in the consolidated balance sheets.The Company’s exposure to credit loss in the event of nonperformance by the other party to the financial instrument for commitments to extend credit is represented by the contractual amount of those instruments. The Company uses the same credit policies in making and monitoring commitments and conditional obligations as it does for
on-balance
sheet instruments. As of June 30, 2021, and December 31, 2020, The Company has a reserve related to credit losses foroff-balance
sheet instruments totaling $25, which is included in other liabilities.F-123
LINKBANCORP, Inc. and Subsidiary
Notes to the Consolidated Financial Statements (Unaudited)
[In Thousands, Except Share Data]
10. | FINANCIAL INSTRUMENTS WITH OFF-BALANCE SHEET RISK (Continued) |
At June 30, 2021 and December 31, 2020, the following financial instruments were outstanding whose contract amounts represent credit risk:
(In Thousands) | June 30, 2021 | December 31, 2020 | ||||||
Unfunded commitments under lines of credit: | ||||||||
Home equity loans | $ | 17,278 | $ | 17,483 | ||||
Commercial real estate, construction, and land development | 15,217 | 10,252 | ||||||
Commercial and industrial | 50,403 | 33,471 | ||||||
Other | 22,810 | 3,937 | ||||||
Total | $ | 105,708 | $ | 65,143 | ||||
Commitments to extend credit are agreements to lend to a customer as long as there is no violation of any condition established in the contract. Since many of the commitments are expected to expire without being drawn upon, the total commitment amounts do not necessarily represent future cash requirements. Commitments generally have fixed expiration dates or other termination clauses and may require payment of a fee. The Company evaluates each customer’s credit worthiness on abasis. The amount of collateral obtained, if deemed necessary by the Company upon extension of credit, is based on management’s credit evaluation. Collateral held varies but may include personal or commercial real estate, accounts receivable, inventory, and equipment.
case-by-case
11. | LEASE COMMITMENTS AND CONTINGENCIES |
Due to the adoption of ASUassets and lease liabilities reported on the Balance Sheet. The following table presents the lease cost associated with leases for the three and six months ending June 30, 2021. Total rent expense recorded during the three and six months ended June 30, 2020 was $112, and $229, respectively. The Company leases its administration and operating facility and three offices under lease agreements with various expirations through March 2031.
2016-02,
Leases (Topic 842), the Company determined that two of its three office locations are under operating leases. Several assumptions and judgments were made when applying the requirements of Topic 842 to the Company’s existing lease commitments, including the allocation of consideration in the contracts between lease andnon-lease
components, determination of the lease term, and determination of the discount rate used in calculating the present value of the lease payments. The Company has elected to account for the variablenon-lease
components, such as common area maintenance charges, utilities, real estate taxes, and insurance, separately from the lease component. Such variablenon-lease
components are reported in net occupancy expense on the Consolidated Statements of Operations when paid. These variablenon-lease
components were excluded from the calculation of the present value of the remaining lease payments, therefore, they are not included in theright-of-use
Lease cost (In Thousands) | Three months ended June 30, 2021 | Six months ended June 30, 2021 | ||||||
Amortization of right-of-use | $ | 69 | $ | 139 | ||||
Interest expense | 48 | 96 | ||||||
Total lease cost | $ | 118 | $ | 235 | ||||
Weighted-average remaining term (years) | 14.0 | |||||||
Weighted-average discount rate | 5.0 | % | ||||||
F-124
LINKBANCORP, Inc. and Subsidiary
Notes to the Consolidated Financial Statements (Unaudited)
[In Thousands, Except Share Data]
11. | LEASE COMMITMENTS AND CONTINGENCIES (Continued) |
Certain of the Company’s leases contain options to renew the lease after the initial term. Management considers the Company’s historical pattern of exercising renewal options on leases and the positive performance of the leased locations, when determining whether it is reasonably certain that the leases will be renewed. If management concludes that there is reasonable certainty about the renewal option, it is included in the calculation of the remaining term of each applicable lease. The discount rate utilized in calculating the present value of the remaining lease payments for each lease was the cost of funds on the Company’s subordinated notes.
The following table presents the undiscounted cash flows due related to operating leases as of June 30, 2021:
(In Thousands) | Amount | |||
2021 | $ | 199 | ||
2022 | 403 | |||
2023 | 409 | |||
2024 | 426 | |||
2025 and thereafter | 4,857 | |||
Total Undiscounted Cash Flows | $ | 6,294 | ||
Discount on Cash Flows | (1,866 | ) | ||
Total lease liabilities | $ | 4,428 | ||
12. | REGULATORY CAPITAL REQUIREMENTS |
The Company is subject to various regulatory capital requirements administered by the Federal Deposit Insurance Corporation and the Pennsylvania Department of Banking and Securities. Failure to meet minimum capital requirements can initiate certain mandatory, and possible additional discretionary, actions by regulators that, if undertaken, could have a direct material effect on the Company’s consolidated financial statements. Under capital adequacy guidelines and the regulatory framework for prompt corrective action, the Company must meet specific capital guidelines that involve quantitative measures of the Company’s assets, liabilities, and certain
off-balance
sheet items as calculated under regulatory accounting practices. The Company’s capital amounts and classification are also subject to qualitative judgments by the regulators about components, risk-weightings, and other factors.The Bank and Company are subject to regulatory capital requirements administered by banking agencies. Capital adequacy guidelines and prompt corrective action regulations involve quantitative measures of assets, liabilities, and certain
off-balance-sheet
items calculated under regulatory accounting practices. Capital amounts and classifications are also subject to qualitative judgments by regulators about components, risk weightings, and other factors and the regulators can lower classifications in certain cases. Failure to meet various capital requirements can initiate regulatory action that could have a direct material effect on the financial statements. As of June 30, 2021, the Bank has met all capital adequacy requirements to which they are subject.The prompt corrective action regulations provide five classifications, including well capitalized, adequately capitalized, under-capitalized, significantly undercapitalized, and critically undercapitalized, although these terms are not used to represent overall financial condition. If an institution is adequately capitalized, regulatory approval is required before the institution may accept brokered deposits. If an institution is undercapitalized, capital distributions are limited, as is asset growth and expansion, and plans for capital restoration are required.
F-125
LINKBANCORP, Inc. and Subsidiary
Notes to the Consolidated Financial Statements (Unaudited)
[In Thousands, Except Share Data]
12. | REGULATORY CAPITAL REQUIREMENTS (Continued) |
The capital conservation buffer is designed to absorb losses during periods of economic stress. Banking institutions with a ratio of Common Equity Tier 1 capital to risk-weighted assets above the minimum but below the conservation buffer (or below the combined capital conservation buffer and countercyclical capital buffer, when the latter is applied) will face limitations on dividends, stock repurchases and certain discretionary bonus payments to management based on the amount of the shortfall. Under Basel III rule, banks must hold a capital conservation buffer above the adequately capitalized risk-based capital ratios. The required capital conservation buffer is 2.50%.
In accordance with the PADOBS approval referenced in Note 1, the Bank must maintain a quarterly minimum ratio of Tier 1 capital to average assets of 8% during the first three years after the acquisition. The Bank’s capital amounts and ratios are presented in the table (dollars in thousands):
The following tables present actual and required capital ratios as of June 30, 2021 and December 31, 2020 under the Basel III Capital Rules. Capital levels required to be considered well capitalized are based upon prompt corrective action regulations, as amended to reflect the changes under the Basel III Capital Rules:
June 30, 2021 | December 31, 2020 | |||||||||||||||
(In Thousands) | Amount | Ratio | Amount | Ratio | ||||||||||||
Total capital | ||||||||||||||||
(to risk-weighted assets) | ||||||||||||||||
Actual | $ | 53,574 | 13.60 | % | $ | 48,810 | 15.86 | % | ||||||||
For capital adequacy purposes | 31,505 | 8.00 | 24,624 | 8.00 | ||||||||||||
To be well capitalized | 39,382 | 10.00 | 30,780 | 10.00 | ||||||||||||
Tier 1 capital | ||||||||||||||||
(to risk-weighted assets) | ||||||||||||||||
Actual | $ | 48,750 | 12.38 | % | $ | 44,958 | 14.61 | % | ||||||||
For capital adequacy purposes | 23,629 | 6.00 | 18,468 | 6.00 | ||||||||||||
To be well capitalized | 31,505 | 8.00 | 24,624 | 8.00 | ||||||||||||
Common equity | ||||||||||||||||
(to risk-weighted assets) | ||||||||||||||||
Actual | $ | 48,750 | 12.38 | % | $ | 44,958 | 14.61 | % | ||||||||
For capital adequacy purposes | 17,722 | 4.50 | 18,468 | 4.50 | ||||||||||||
To be well capitalized | 25,598 | 6.50 | 24,624 | 6.50 | ||||||||||||
Tier 1 capital | ||||||||||||||||
(to average assets) | ||||||||||||||||
Actual | $ | 48,750 | 12.52 | % | $ | 44,958 | 12.84 | % | ||||||||
For capital adequacy purposes | 17,427 | 4.00 | 12,375 | 4.00 | ||||||||||||
To be well capitalized | 21,784 | 5.00 | 15,469 | 5.00 | ||||||||||||
The federal banking agencies, including the FDIC, issued a rule pursuant to The Economic Growth, Regulatory Relief and Consumer Protection Act of 2018 to establish for institutions with assets of less than $10 billion a “community bank leverage ratio” (the ratio of a bank’s tier 1 capital to average total consolidated assets) of 9% that qualifying institutions may elect to use in lieu of the generally applicable leverage and risk-based capital requirements under Basel III. Pursuant to the CARES Act, the federal banking agencies issued a final rule in August 2020 to lower the community bank leverage ratio to 8% beginning in the second calendar quarter of 2020 through the end of 2020. In 2021, the
F-126
LINKBANCORP, Inc. and Subsidiary
Notes to the Consolidated Financial Statements (Unaudited)
[In Thousands, Except Share Data]
12. | REGULATORY CAPITAL REQUIREMENTS (Continued) |
community bank leverage ratio increased to 8.5% for the calendar year. The community bank leverage ratio requirement will return to 9% effective January 1, 2022. If an election to use the community bank leverage ratio capital framework is made, a qualifying bank with less than $10 billion in assets with capital exceeding the specified community bank leverage ratio is considered compliant with all applicable regulatory capital and leverage requirements, including the requirement to be “well capitalized.” As of June 30, 2021, the Bank had not elected to be subject to the alternative framework.
Federal and state banking regulations place certain restrictions on dividends paid by the Bank. The Pennsylvania Banking Code provides that cash dividends may be declared and paid out of accumulated net earnings. In addition, dividends paid by the Bank would be prohibited if the effect thereof would cause the Bank’s capital to be reduced below applicable minimum capital requirements. Loans or advances by the Bank to the Company are limited to 10 percent of the Bank’s capital stock and surplus and must have collateral securing the loans or advances. Because the Bank is currently in an accumulated deficit position, dividends cannot be paid at this time.
13. | FAIR VALUE MEASUREMENTS |
Management uses its best judgment in estimating the fair value of the Company’s financial instruments; however, there are inherent weaknesses in an estimation technique. Therefore, for substantially all financial instruments, the fair value estimates herein are not necessarily indicative of the amounts The Company could have realized in a sales transaction on the dates indicated. The estimated fair value amounts have been measured as of their respective year-ends and have not been
re-evaluated
or updated for purposes of these financial statements subsequent to those respective dates. As such, the estimated fair values of these financial instruments subsequent to the respective reporting dates may be different than the amounts reported at eachyear-end.
The Company uses fair value measurements to record fair value adjustments to certain assets and liabilities and to determine fair value disclosures. In accordance with the fair value measurements accounting guidance (FASB ASC 820,), the fair value of a financial instrument is the price that would be received to sell an asset or paid to transfer a liability in an orderly transaction between market participants at the measurement date. Fair value is best determined based upon quoted market prices. However, in many instances, there are no quoted market prices for the Company’s various financial instruments. In cases where quoted market prices are not available, fair values are based on estimates using present value or other valuation techniques. Those techniques are significantly affected by the assumptions used, including the discount rate and estimates of future cash flows. Accordingly, the fair value estimates may not be realized in an immediate settlement of the instrument.
Fair Value Measurements
The Company uses a consistent definition of fair value, which focuses on exit price in an orderly transaction (that is, not a forced liquidation or distressed sale) between market participants at the measurement date under current market conditions. If there has been a significant decrease in the volume and level of activity for the asset or liability, a change in valuation technique or the use of multiple valuation techniques may be appropriate. In such instances, determining the price at which willing market participants would transact at the measurement date under current market conditions depends on the facts and circumstances and requires the use of significant judgment. The fair value guidance establishes a fair value hierarchy that prioritizes the inputs to valuation methods used to measure fair value. The hierarchy gives the highest priority to unadjusted quoted prices in active
F-127
LINKBANCORP, Inc. and Subsidiary
Notes to the Consolidated Financial Statements (Unaudited)
[In Thousands, Except Share Data]
13. | FAIR VALUE MEASUREMENTS (Continued) |
markets for identical assets or liabilities (Level 1 measurements) and the lowest priority to unobservable inputs (Level 3 measurements). The three levels of the fair value hierarchy are as follows:
The following disclosures show the hierarchal disclosure framework associated with the level of pricing observations utilized in measuring assets and liabilities at fair value. The three broad levels of pricing are as follows:
| Level I: | Quoted prices are available in active markets for identical assets or liabilities as of the reported date. | |||
| Level II: | Pricing inputs are other than the quoted prices in active markets, which are either directly or indirectly observable as of the reported date. The nature of these assets and liabilities includes items for which quoted prices are available but traded less frequently and items that are fair-valued using other financial instruments, the parameters of which can be directly observed. | |||
| Level III: | Valuations derived from valuation techniques in which one or more significant inputs or significant value drivers are unobservable. | |||
This hierarchy requires the use of observable market data when available.
The estimated fair values of the Company’s financial instruments that are not required to be measured or reported at fair value are as follows:
At June 30, 2021 | At December 31, 2020 | |||||||||||||||
(In Thousands) | Carrying Amount | Fair Value | Carrying Amount | Fair Value | ||||||||||||
Financial assets: | ||||||||||||||||
Cash and cash equivalents (Level 1) | $ | 31,449 | $ | 31,449 | $ | 9,002 | $ | 9,002 | ||||||||
Loans (Level 3) | 409,427 | 405,474 | 323,214 | 324,160 | ||||||||||||
Accrued interest receivable (Level 1) | 2,509 | 2,509 | 1,842 | 1,842 | ||||||||||||
Federal Home Loan Bank stock (Level 1) | 1,015 | 1,015 | 2,615 | 2,615 | ||||||||||||
Financial liabilities: | ||||||||||||||||
Non-maturity deposits (Level 1) | 238,381 | 238,381 | 140,013 | 140,013 | ||||||||||||
Time Deposits (Level 3) | 133,672 | 128,804 | 143,041 | 142,787 | ||||||||||||
Short-term borrowings (Level 1) | — | — | 41,667 | 41,667 | ||||||||||||
Long-term borrowings (Level 3) | 23,087 | 23,087 | 37,315 | 37,738 | ||||||||||||
Subordinated Notes (Level 3) | 20,000 | 20,479 | 20,000 | 20,256 | ||||||||||||
Accrued interest payable (Level 1) | 81 | 81 | 414 | 414 | ||||||||||||
Off-balance-sheet financial instruments (Level 3) | — | — | — | — | ||||||||||||
F-128
LINKBANCORP, Inc. and Subsidiary
Notes to the Consolidated Financial Statements (Unaudited)
[In Thousands, Except Share Data]
13. | FAIR VALUE MEASUREMENTS (Continued) |
The following tables present the assets reported on the Consolidated Balance Sheet at their fair value on a recurring basis as of June 30, 2021 and December 31, 2020, by level within the fair value hierarchy. Financial assets and liabilities are classified in their entirety based on the lowest level of input that is significant to the fair value measurement.
The Company’sinvestment securities are reported at fair value. These securities are valued by an independent third party. The valuations are based on market data. They utilize evaluated pricing models that vary by asset and incorporate available trade, bid and other market information. For securities that do not trade on a daily basis, their evaluated pricing applications apply available information such as benchmarking and matrix pricing. The market inputs normally sought in the evaluation of securities include benchmark yields, reported trades, broker/dealer quotes (only obtained from market makers or broker/dealers recognized as market participants), issuer spreads,
available-for-sale
two-sided
markets, benchmark securities, bid, offers and reference data. For certain securities additional inputs may be used or some market inputs may not be applicable. Inputs are prioritized differently on any given day based on market conditions.June 30, 2021 | ||||||||||||||||
(In Thousands) | Level I | Level II | Level III | Total | ||||||||||||
Assets: | ||||||||||||||||
U.S. treasury securities | $ | — | $ | — | $ | — | $ | — | ||||||||
Mortgage backed securities | — | 3,398 | — | 3,398 | ||||||||||||
Total | $ | — | $ | 3,398 | $ | — | $ | 3,398 | ||||||||
December 31, 2020 | ||||||||||||||||
(In Thousands) | Level I | Level II | Level III | Total | ||||||||||||
Assets: | ||||||||||||||||
U.S. treasury securities | $ | — | $ | 74,999 | $ | — | $ | 74,999 | ||||||||
Mortgage backed securities | $ | — | $ | 4,206 | — | 4,206 | ||||||||||
Total | — | 79,205 | $ | — | $ | 79,205 | ||||||||||
For financial assets measured at fair value on a nonrecurring basis, the fair value measurements by level within the fair value hierarchy used as of June 30, 2021 and December 31, 2020, are as follows:
June 30, 2021 | ||||||||||||||||
(In Thousands) | Level I | Level II | Level III | Total | ||||||||||||
Impaired loans | $ | — | $ | — | $ | 2,844 | $ | 2,844 | ||||||||
December 31, 2020 | ||||||||||||||||
(In Thousands) | Level I | Level II | Level III | Total | ||||||||||||
Impaired loans | $ | — | $ | — | $ | 988 | $ | 988 | ||||||||
F-129
LINKBANCORP, Inc. and Subsidiary
Notes to the Consolidated Financial Statements (Unaudited)
[In Thousands, Except Share Data]
13. | FAIR VALUE MEASUREMENTS (Continued) |
The following tables provide information describing the valuation processes used to determine nonrecurring fair value measurements categorized within Level III of the fair value hierarchy:
June 30, 2021 | ||||||||||||||||||||
| Quantitative Information About Level III Fair Value Measurements | ||||||||||||||||||||
(In Thousands) | Fair Value | Valuation Techniques | Unobservable Input | Range (Weighted Average) | ||||||||||||||||
Impaired loans | $ | 2,844 | | Appraisal of collateral | | (1 | ) | | Liquidation expenses | | 10 | % | ||||||||
December 31, 2020 | ||||||||||||||||||||
| Quantitative Information About Level III Fair Value Measurements | ||||||||||||||||||||
(In Thousands) | Fair Value | Valuation Techniques | Unobservable Input | Range (Weighted Average) | ||||||||||||||||
Impaired loans | $ | 988 | | Appraisal of collateral | | (1 | ) | | Liquidation expenses | | 10 | % | ||||||||
(1) | Fair value is generally determined through independent appraisals of the underlying collateral, which include various Level III inputs that are not identifiable. |
Appraisals may be adjusted by management for qualitative factors, such as economic conditions, aging, and/or estimated liquidation expenses incurred when selling the collateral. The range and weighted average of appraisal adjustments and liquidation expenses are presented as a percentage of the appraisal.
14. | PROPOSED MERGER WITH GNB FINANCIAL SERVICES, INC. |
On December 10, 2020, LINKBANCORP, Inc. (LINK) and its wholly owned subsidiary, LINKBANK (Bank), and GNB Financial Services Inc. (GNB), and its wholly owned subsidiary, The Gratz Bank (“Gratz Bank”) entered into an Agreement and Plan of Merger (the “Merger Agreement”) pursuant to which GNB will merge with and into LINK, with LINK as the surviving corporation. Concurrent with the merger, it is expected that the Bank will merge with and into Gratz Bank, with the Gratz Bank as the surviving institution.
Under the agreement, GNB shareholders will have the opportunity to elect to receive $87.68 per share in cash or 7.3064 of LINK common shares for each share they own. The agreement provides for proration procedures intended to ensure that, in the aggregate, at least 80% of the GNB common shares outstanding will be exchanged for LINK common stock. The transaction is expected to be a
tax-free
exchange to the extent shareholders of GNB receive stock in exchange for their shares. The transaction is subject to customary closing conditions, including the receipt of regulatory approvals and approval by the shareholders of both companies. The merger was completed on September 18, 2021. The Company is currently in the process of finalizing the accounting for this merger which will be included in the quarterly report on Form 10-Q filed for the period ended September 30, 2021.F-130
REPORT OF INDEPENDENT REGISTERED PUBLIC ACCOUNTING FIRM
To the Shareholders and the Board of Directors of LINKBANCORP, Inc.
Opinion on the Financial Statements
We have audited the accompanying consolidated balance sheets of LINKBANCORP, Inc. and subsidiary (the “Company”) as of December 31, 2020 and 2019; the related consolidated statements of operations, comprehensive loss, shareholders’ equity, and cash flows for the years then ended; and the related notes to the consolidated financial statements (collectively, the financial statements). In our opinion, the financial statements present fairly, in all material respects, the financial position of the Company as of December 31, 2020 and 2019, and the results of its operations and its cash flows for the years then ended, in conformity with accounting principles generally accepted in the United States of America.
Basis for Opinion
These financial statements are the responsibility of the Company’s management. Our responsibility is to express an opinion on the Company’s financial statements based on our audits. We are a public accounting firm registered with the Public Company Accounting Oversight Board (United States) (PCAOB) and are required to be independent, with respect to the Company, in accordance with U.S. federal securities laws and the applicable rules and regulations of the Securities and Exchange Commission and the PCAOB.
We conducted our audits in accordance with the standards of the PCAOB. Those standards require that we plan and perform the audit to obtain reasonable assurance about whether the financial statements are free of material misstatement, whether due to error or fraud. The Company is not required to have, nor were we engaged to perform, an audit of its internal control over financial reporting. As part of our audits, we are required to obtain an understanding of internal control over financial reporting but not for the purpose of expressing an opinion on the effectiveness of the Company’s internal control over financial reporting. Accordingly, we express no such opinion.
Our audits included performing procedures to assess the risks of material misstatement of the financial statements, whether due to error or fraud, and performing procedures that respond to those risks. Such procedures included examining, on a test basis, evidence regarding the amounts and disclosures in the financial statements. Our audits also included evaluating the accounting principles used and significant estimates made by management, as well as evaluating the overall presentation of the financial statements. We believe that our audits provide a reasonable basis for our opinion.
Critical Audit Matters
The critical audit matters communicated below are matters arising from the current period audit of the financial statements that were communicated or required to be communicated to the audit committee and that: (1) relate to accounts or disclosures that are material to the financial statements; and (2) involved our especially challenging, subjective, or complex judgments. The communication of critical audit matters does not alter, in any way, our opinion on the financial statements, taken as a whole, and we are not, by communicating the critical audit matters below, providing separate opinions on the critical audit matters or on the accounts or disclosures to which they relate.
F-131

Allowance for Loan Losses (ALL)
Description of the Matter
The Company’s loan portfolio totaled $327.4 million as of December 31, 2020, and the associated ALL was $4.2 million. As discussed in Notes 1 and 4 to the consolidated financial statements, determining the amount of the ALL requires significant judgment about the collectability of loans, which includes an assessment of quantitative factors such as historical loss experience within each risk category of loans and testing of certain commercial loans for impairment. Management applies additional qualitative adjustments to reflect the inherent losses that exist in the loan portfolio at the balance sheet date that are not reflected in the historical loss experience. Qualitative adjustments are made based upon changes in lending policies and practices, economic conditions, changes in the loan portfolio mix, trends in loan delinquencies and classified loans, collateral values, and concentrations of credit risk.
We identified the qualitative adjustments within the ALL as critical audit matters because they involve a high degree of subjectivity. In turn, auditing management’s judgments regarding the qualitative factors applied in the ALL calculation involved a high degree of subjectivity.
Furthermore, concern about the spread of
COVID-19
has caused and is likely to continue to cause business shutdowns, limitations on commercial activity and financial transactions, labor shortages, supply chain interruptions, increased unemployment and commercial property vacancy rates, reduced profitability and ability for property owners to make mortgage payments, and overall economic and financial market instability, all of which may cause borrowers to be unable to make scheduled loan payments. If the effects ofCOVID-19
result in widespread and sustained loan repayment shortfalls, significant loan delinquencies, foreclosures, declines in collateral values, and credit losses could result in, and significantly impact, the overall adequacy of the ALL. The extent ofCOVID-19’s
effects on business, operations, or the global economy as a whole is highly uncertain and cannot be predicted, including the scope and duration of the pandemic, which increases the degree of subjectivity involved in estimating the related qualitative factors within the ALL.How We Addressed the Matter in Our Audit
We gained an understanding of the Company’s process for establishing the ALL, including the qualitative adjustments made to the ALL. We evaluated the design and tested the operating effectiveness of controls over the Company’s ALL process, which included, among others, management’s review and approval controls designed to assess the need and level of qualitative adjustments to the ALL, as well as the reliability of the data utilized to support management’s assessment.
To test the qualitative adjustments, we evaluated the appropriateness of management’s methodology and assessed whether all relevant risks were reflected in the ALL and the need to consider qualitative adjustments, including the potential effect of
COVID-19
on the adjustmentsRegarding the measurement of the qualitative adjustments, we evaluated the completeness, accuracy, and relevance of the data and inputs utilized in management’s estimate. For example, we compared the inputs and data to the Company’s historical loan performance data, third-party macroeconomic data, and considered the existence of new or contrary information. Furthermore, we analyzed the changes in the components of the qualitative reserves relative to changes in external market factors, the Company’s loan portfolio, and asset quality trends, which included the evaluation of management’s ability to capture and assess relevant data from both external sources and internal reports on loan customers affected by the
COVID-19
pandemic and the supporting documentation for substantiating revisions to qualitative factors.We also utilized internal credit review specialists with knowledge to evaluate the appropriateness of management’s risk-rating processes, to ensure that the risk ratings applied to the commercial loan portfolio were reasonable.
F-132
We have served as the Company’s auditor since 2020.
Cranberry Township, Pennsylvania
March 18, 2021
F-133
LINKBANCORP, Inc. and Subsidiary
Consolidated Balance Sheet
December 31, | ||||||||
(In Thousands, except share data) | 2020 | 2019 | ||||||
ASSETS | ||||||||
Noninterest-bearing cash equivalents | $ | 767 | $ | 971 | ||||
Interest-bearing deposits with other institutions | 8,235 | 10,239 | ||||||
Cash and cash equivalents | 9,002 | 11,210 | ||||||
Securities available for sale, at fair value | 79,205 | 46,975 | ||||||
Loans receivable, net of allowance for loan losses of $4,177 at December 31, 2020, and $1,689 at December 31, 2019 | 323,214 | 166,793 | ||||||
Investments in restricted bank stock | 2,615 | 43 | ||||||
Premises and equipment, net | 1,386 | 1,380 | ||||||
Bank-owned life insurance | 4,688 | 4,542 | ||||||
Goodwill and other intangible assets | 1,371 | 1,402 | ||||||
Deferred tax asset | 98 | 98 | ||||||
Accrued interest receivable and other assets | 2,527 | 1,057 | ||||||
TOTAL ASSETS | $ | 424,106 | $ | 233,500 | ||||
LIABILITIES | ||||||||
Deposits: | ||||||||
Demand, noninterest bearing | $ | 42,374 | $ | 12,644 | ||||
Interest bearing | 240,680 | 176,029 | ||||||
Total deposits | 283,054 | 188,673 | ||||||
Short-term borrowings | 41,667 | 6,914 | ||||||
Other borrowings | 37,315 | — | ||||||
Subordinated debt | 19,970 | — | ||||||
Accrued interest payable and other liabilities | 1,766 | 1,040 | ||||||
TOTAL LIABILITIES | 383,772 | 196,627 | ||||||
SHAREHOLDERS’ EQUITY | ||||||||
Common stock ($0.01 par value; 25,000,000 shares authorized; 4,967,089 and 4,545,297 shares issued and outstanding at December 31, 2020 and 2019) | 50 | 45 | ||||||
Surplus | 50,516 | 45,449 | ||||||
Accumulated deficit | (10,374 | ) | (8,610 | ) | ||||
Accumulated other comprehensive income (loss) | 142 | (11 | ) | |||||
TOTAL SHAREHOLDERS’ EQUITY | 40,334 | 36,873 | ||||||
TOTAL LIABILITIES AND SHAREHOLDERS’ EQUITY | $ | 424,106 | $ | 233,500 | ||||
See accompanying notes to the consolidated financial statements.
F-134
LINKBANCORP, Inc. and Subsidiary
Consolidated Statement of Operations
Year Ended December 31, | ||||||||
(In Thousands, except share and per share data) | 2020 | 2019 | ||||||
INTEREST AND DIVIDEND INCOME | ||||||||
Loans receivable, including fees | $ | 12,267 | $ | 4,600 | ||||
Other | 291 | 1,114 | ||||||
Total interest and dividend income | 12,558 | 5,714 | ||||||
INTEREST EXPENSE | ||||||||
Deposits | 2,784 | 1,710 | ||||||
Short-term borrowings | 5 | — | ||||||
Other borrowings | 332 | — | ||||||
Subordinated debt | 260 | — | ||||||
Total interest expense | 3,381 | 1,710 | ||||||
NET INTEREST INCOME BEFORE PROVISION FOR LOAN LOSSES | 9,177 | 4,004 | ||||||
Provision for loan losses | 2,470 | 1,605 | ||||||
NET INTEREST INCOME AFTER PROVISION FOR LOAN LOSSES | 6,707 | 2,399 | ||||||
NONINTEREST INCOME | ||||||||
Service charges on deposit accounts | 74 | 37 | ||||||
Bank-owned life insurance | 146 | 140 | ||||||
Gain on sale of asset | 105 | — | ||||||
Other | 324 | 216 | ||||||
Total noninterest income | 649 | 393 | ||||||
NONINTEREST EXPENSE | ||||||||
Salaries and employee benefits | 5,785 | 4,837 | ||||||
Occupancy | 813 | 661 | ||||||
Equipment and data processing | 870 | 1,032 | ||||||
Professional fees | 441 | 723 | ||||||
FDIC insurance | 261 | 63 | ||||||
Bank shares tax | 228 | 328 | ||||||
Advertising | 126 | 299 | ||||||
Charitable contribution | — | 250 | ||||||
Merger related expenses | 119 | — | ||||||
Other | 477 | 674 | ||||||
Total noninterest expense | 9,120 | 8,867 | ||||||
Loss before income tax expense | (1,764 | ) | (6,075 | ) | ||||
Income tax expense | — | — | ||||||
NET LOSS | $ | (1,764) | $ | (6,075) | ||||
EARNINGS PER SHARE, BASIC AND DILUTED | $ | (0.38) | $ | (1.34) | ||||
WEIGHTED-AVERAGE COMMON SHARES OUTSTANDING, BASIC AND DILUTED | 4,627,274 | 4,545,297 | ||||||
See accompanying notes to the consolidated financial statements.
F-135
LINKBANCORP, Inc. and Subsidiary
Consolidated Statement of Comprehensive Loss
Year Ended December 31, | ||||||||
(In Thousands) | 2020 | 2019 | ||||||
Net loss | $ | (1,764 | ) | $ | (6,075 | ) | ||
Components of other comprehensive income (loss): | ||||||||
Unrealized holding gain (loss) on available-for-sale | 153 | (11 | ) | |||||
Tax effect | — | — | ||||||
Total other comprehensive income (loss) | 153 | (11 | ) | |||||
Total comprehensive loss | $ | (1,611 | ) | $ | (6,086 | ) | ||
See accompanying notes to the consolidated financial statements.
F-136
LINKBANCORP, Inc. and Subsidiary
Consolidated Statement of Shareholders’ Equity
Common Stock | Additional Paid-In Capital | Retained Earnings | Accumulated Other Comprehensive Income (Loss) | Total | ||||||||||||||||||||
(In Thousands, except share data) | Shares | Amount | ||||||||||||||||||||||
Balance, December 31, 2018 | 3,696,438 | $ | 37 | $ | 36,928 | $ | (2,535 | ) | $ | — | $ | 34,430 | ||||||||||||
Proceeds from issuance of common stock | 848,859 | 8 | 8,490 | — | — | 8,498 | ||||||||||||||||||
Net loss | — | — | — | (6,075 | ) | — | (6,075 | ) | ||||||||||||||||
Stock-based compensation | — | — | 31 | — | — | 31 | ||||||||||||||||||
Other comprehensive loss | — | — | — | — | (11 | ) | (11 | ) | ||||||||||||||||
Balance, December 31, 2019 | 4,545,297 | 45 | 45,449 | (8,610 | ) | (11 | ) | 36,873 | ||||||||||||||||
Proceeds from issuance of common stock | 421,792 | 5 | 4,980 | — | — | 4,985 | ||||||||||||||||||
Net loss | — | — | — | (1,764 | ) | — | (1,764 | ) | ||||||||||||||||
Stock-based compensation | — | — | 87 | — | — | 87 | ||||||||||||||||||
Other comprehensive income | — | — | — | — | 153 | 153 | ||||||||||||||||||
Balance, December 31, 2020 | 4,967,089 | $ | 50 | $ | 50,516 | $ | (10,374) | $ | 142 | $ | 40,334 | |||||||||||||
See accompanying notes to the consolidated financial statements.
F-137
LINKBANCORP, Inc. and Subsidary
Consolidated Statement of Cash Flows
Year Ended December 31, | ||||||||
(In Thousands) | 2020 | 2019 | ||||||
OPERATING ACTIVITIES | ||||||||
Net loss | $ | (1,764 | ) | $ | (6,075 | ) | ||
Adjustments to reconcile net income to net cash provided by operating activities: | ||||||||
Provision for loan losses | 2,470 | 1,605 | ||||||
Depreciation | 252 | 156 | ||||||
Amortization of intangible assets | 31 | 34 | ||||||
Amortization of premiums and discounts on investment securities, net | 29 | (16 | ) | |||||
Share-based compensation | 87 | 31 | ||||||
Amortization of premiums on purchased loans | 23 | (5 | ) | |||||
Bank-owned life insurance income | (146 | ) | (140 | ) | ||||
Increase in accrued interest receivable | (1,449 | ) | (438 | ) | ||||
Other, net | 705 | (279 | ) | |||||
Net cash provided by (used in) operating activities | 238 | (5,127 | ) | |||||
INVESTING ACTIVITIES | ||||||||
Investment securities available for sale: | ||||||||
Proceeds from maturities of investment securities available-for-sale | 47,000 | — | ||||||
Proceeds from principal repayments of investment securities available-for-sale | 1,056 | — | ||||||
Purchases of investment securities available-for-sale | (80,133 | ) | (46,970 | ) | ||||
Proceeds from maturities of Certificates of deposit | 5,000 | — | ||||||
Purchases of Certificates of deposit | (5,000 | ) | — | |||||
Purchases of bank-owned life insurance | — | (4,402 | ) | |||||
Purchases of restricted investment in bank stocks | (2,572 | ) | — | |||||
Redemption of restricted investment in bank stocks | — | 8 | ||||||
Increase in loans, net | (158,943 | ) | (134,639 | ) | ||||
Purchase of premises and equipment | (258 | ) | (1,089 | ) | ||||
Net cash used for investing activities | (193,850 | ) | (187,092 | ) | ||||
FINANCING ACTIVITIES | ||||||||
Increase in deposits, net | 94,381 | 141,215 | ||||||
Increase in short-term borrowings, net | 34,753 | 6,914 | ||||||
Proceeds from other borrowings | 37,315 | — | ||||||
Proceeds from issuance of subordinated debt | 19,970 | — | ||||||
Proceeds from issuance of common stock | 4,985 | 8,498 | ||||||
Net cash provided by financing activities | 191,404 | 156,627 | ||||||
Decrease in cash and cash equivalents | (2,208 | ) | (35,592 | ) | ||||
CASH AND CASH EQUIVALENTS AT BEGINNING OF PERIOD | 11,210 | 46,802 | ||||||
CASH AND CASH EQUIVALENTS AT END OF PERIOD | $ | 9,002 | $ | 11,210 | ||||
SUPPLEMENTAL CASH FLOW DISCLOSURES | ||||||||
Cash paid during the period for: | ||||||||
Interest | $ | 3,119 | $ | 1,569 | ||||
Income taxes | — | — | ||||||
See accompanying notes to the consolidated financial statements.
F-138
LINKBANCORP, INC. AND SUBSIDIARY
NOTES TO THE CONSOLIDATED FINANCIAL STATEMENTS
1. | SUMMARY OF SIGNIFICANT ACCOUNTING POLICIES |
A summary of significant accounting and reporting policies applied in the presentation of the accompanying consolidated financial statements follows:
Nature of Operations and Basis of Presentation
LINKBANCORP, Inc. (the “Company”) was incorporated on April 6, 2018, under the laws of the Commonwealth of Pennsylvania. The Company was formed with the intent of becoming a bank holding company through acquisition of a bank.
On September 17, 2018, the Pennsylvania Department of Banking and Securities (PADOBS) approved the acquisition of 100 percent of the shares of Stonebridge Bank, subject to recapitalization of the Bank and continued compliance with capital ratios outlined in Note 17. On October 5, 2018, LINKBANCORP, Inc. purchased 100 percent of the outstanding shares of Stonebridge Bank, from its former parent company Stonebridge Financial Corp. under section 363 of the Bankruptcy Code. LINKBANCORP subsequently renamed the bank LINKBANK (the “Bank”). The Bank is a full-service commercial bank providing personal and business lending and deposit services. The Bank’s operations are conducted from its three Solution Centers in Camp Hill, West Chester, and Lancaster, Pennsylvania. The Company’s corporate office resides in Camp Hill, Pennsylvania. As a state chartered, non-Federal Reserve member bank, the Bank is subject to regulation by the Pennsylvania Department of Banking and Securities (the PADOBS) and the Federal Deposit Insurance Corporation (the FDIC). The Company is regulated by the Federal Reserve Bank of Philadelphia. The Bank’s deposits are insured up to the applicable limits by the FDIC.
Basis of Presentation
The accompanying consolidated financial statements include the accounts of the Company and the Bank. All significant intercompany accounts and transactions have been eliminated in consolidation. The accounting and reporting practices of the Company conform to accounting principles generally accepted in the United States of America (GAAP) and to general practices within the banking industry. The following summarized the more significant of these policies and practices.
Estimates
The preparation of financial statements in conformity with accounting principles generally accepted in the United States of America requires management to make estimates and assumptions that affect the reported amounts of assets and liabilities and disclosure of contingent assets and liabilities at the date of the financial statements and the reported amounts of revenues and expenses during the reporting period. Actual results could differ from those estimates. Material estimates that are particularly susceptible to significant change in the near term relate to the allowance for loan losses, and the valuation of deferred tax assets
Acquisition Method of Accounting
The Company accounts for acquisitions using the acquisition method of accounting. The acquisition method of accounting requires the Company to estimate the fair value of the tangible assets and identifiable intangible assets acquired and liabilities assumed. The estimated fair values are based on available information and current economic conditions at the date of acquisition. Fair value may be obtained from independent appraisers, discounted cash flow present value techniques, management valuation models, quoted prices on national markets or quoted market prices from brokers. These fair value estimates will affect future earnings through the disposition or amortization of the underlying assets and liabilities.
F-139
LINKBANCORP, INC. AND SUBSIDIARY
NOTES TO THE CONSOLIDATED FINANCIAL STATEMENTS (Continued)
1. | SUMMARY OF SIGNIFICANT ACCOUNTING POLICIES (Continued) |
Acquisition Method of Accounting (Continued)
Accounting for business combination under GAAP acquisition method prohibits “carrying over” valuation allowances, such as the allowance for loan losses. Uncertainties relating to the expected future cash flows are reflected in the fair value measurement of the acquired loans and reflected in the purchase price. The Company will establish loan loss allowances for the acquired loans in periods after the acquisition, but only for losses incurred on these loans due to credit deterioration after acquisition.
For business acquisitions, whereby the Company acquires loan that have shown evidence of credit deterioration since origination, the Company will classify these loans as purchased credit-impaired (“PCI”) loans. The Company will determine which loans will be classified as PCI loans based on borrower payment history, past due status, loan credit grading, value of underlying collateral and other factors that affect the collectability of contractual cash flows. Under GAAP, purchasers are permitted to individually evaluate or collectively aggregate PCI loans into pools. PCI loans acquired in the same fiscal quarter may be assembled into one or more pools with common risk characteristics. Once pooled, a single composite interest rate is used to determine aggregate expected cash flows for each respective pool. PCI loans are recorded on the acquisition date at fair value. The Company estimates the amount and timing of expected cash flows for each individually analyzed loan. Estimated cash flows in excess of the amount paid is recorded as interest income over the remaining life of the loan.
On a quarterly basis, the Company will update the amount of loan principal and interest cash flows expected to be collected, incorporating assumptions regarding default rates, loss severities, the amounts and timing of prepayments and other factors that are reflective of current market conditions. Probable decreases in expected loan principal cash flows trigger the recognition of impairment, which is then measured as the present value of the expected principal loss plus any related foregone interest cash flows discounted at the loan’s effective interest rate. Impairments that occur after the acquisition date are recognized through the allowance for loan losses. Probable and significant increases in expected cash flows would first reverse any previously recorded allowance for loan losses; any remaining increases are recognized prospectively as interest income. The impacts of (i) prepayments, (ii) changes in variable interest rates, and (iii) any other changes in the timing of expected cash flows are recognized prospectively as adjustments to interest income. Disposals of loans, which may include sales of loans, receipt of payments in full by the borrower, or foreclosure, result in removal of the loan from the PCI portfolio.
Goodwill and Core Deposit Intangible
Goodwill represents the excess of the acquisition cost over the fair value of the net assets acquired in the acquisition. GAAP requires goodwill to be tested for impairment on an annual basis and between annual tests in certain circumstances and written down when impaired. There can be no assurance that future goodwill impairment tests will not result in a charge to income. Core deposit intangible assets (“CDI”) are initially measure at fair value and then amortized over the expected life on an accelerated basis using projected decay rates of the underlying core deposits. The principal factors considered when valuing the CDI consist of the following:
(1) the rate and maturity structure of the interest-bearing liabilities, (2) estimated retention rates for each deposit liability category, (3) the current interest rate environment, and (4) estimated noninterest income potential of the acquired relationship. The CDI is evaluated periodically for impairment.
Goodwill and other intangible assets are reviewed for impairment annually as of December 31 and between annual tests when events and circumstances indicate that impairment may have occurred. If there is a goodwill impairment charge, it will be the amount by which the reporting unit’s carrying amount exceeds its fair value; however, the loss recognized should not exceed the total amount of goodwill allocated to that reporting unit. The same
one-step
impairment test is applied to goodwill at all reporting units.F-140
LINKBANCORP, INC. AND SUBSIDIARY
NOTES TO THE CONSOLIDATED FINANCIAL STATEMENTS (Continued)
1. | SUMMARY OF SIGNIFICANT ACCOUNTING POLICIES (Continued) |
Goodwill and Core Deposit Intangible (Continued)
The determination of the fair value of the Company incorporates assumptions that marketplace participants would use in their estimates of fair value of the Company in a change of control transaction, as prescribed by ASC Topic 820.
To arrive at a conclusion of fair value, we utilize both the Income and Market Approach and then apply weighting factors to each result. Weighting factors represent our best business judgment of the weightings a market participant would utilize in arriving at a fair value for the Company. In performing our analyses, we also made numerous assumptions with respect to industry performance, business, economic and market conditions, and various other matters, many of which cannot be predicted and are beyond our control. With respect to financial projections, projections reflect the best currently available estimates and judgments as to the expected future financial performance of the Company.
Prior to the Company’s acquisition of the Bank, the Bank entered into a regulatory agreement. Specifically, on May 19, 2011, the Bank and the Federal Deposit Insurance Corporation and the Pennsylvania Department of Banking and Securities entered into a joint Consent Order. Effective February 19, 2019, the consent order was terminated, and the Bank is no longer considered a troubled institution.
Cash and Cash Equivalents
For purposes of reporting cash flows, cash and cash equivalents include cash on hand and amounts due from banks. Generally, federal funds are purchased and sold for
one-day
periods. Short-term investments include interest bearing-deposits with banks with an original maturity of less than 90 days.Investment Securities
Available for sale – Debt securities that will be held for indefinite periods of time, including securities that may be sold in response to changes in market interest or prepayment rates, needs for liquidity, and changes in the availability of and in the yield of alternative investments, are classified as available for sale. These assets are carried at fair value. Fair values of securities available for sale are determined by using Level 2 fair value measures calculated through the use of matrix pricing. Matrix pricing is a common mathematical technique that does not rely exclusively on quoted market prices for specific securities but rather utilizes the security’s relationship to other benchmark quoted prices in determining fair value. The Company uses independent service providers to calculate our Level 2 fair value measures. Unrealized gains and losses are excluded from operations and are reported net of tax as a separate component of other comprehensive income until realized. Realized gains and losses on the sale of investment securities are reported in the consolidated statements of income and determined using the adjusted cost of the specific security sold on the trade date. Purchase premiums and discounts are recognized in interest income using the interest method over the terms of the securities.
Investment securities are evaluated on at least a quarterly basis, and more frequently when market conditions warrant such an evaluation, to determine whether a decline in their value is other-than-temporary. To determine whether a loss in value is other-than-temporary, management utilizes criteria such as the reasons underlying the decline, the magnitude and duration of the decline, the intent to hold the security and the likelihood of the Company not being required to sell the security prior to an anticipated recovery in the fair value. The term “other-than-temporary” is not intended to indicate that the decline is permanent but indicates that the prospects for a near-term recovery of value is not necessarily favorable, or that there is a lack of evidence to support a realizable value equal to or greater than the carrying value of the investment. Once a decline in value is determined to be other-than-temporary, the portion of the decline related to credit impairment is charged to earnings.
F-141
LINKBANCORP, INC. AND SUBSIDIARY
NOTES TO THE CONSOLIDATED FINANCIAL STATEMENTS (Continued)
1. | SUMMARY OF SIGNIFICANT ACCOUNTING POLICIES (Continued) |
Loans Receivable
Loans receivable that management has the intent and ability to hold for the foreseeable future or until maturity or payoff are stated at their outstanding unpaid principal balances, net of an allowance for loan losses and any deferred fees or costs. Interest income is accrued on the unpaid principal balance. Loan origination fees, net of certain direct origination costs, are deferred and recognized as an adjustment of the yield (interest income) of the related loans. The Bank is generally amortizing these amounts over the contractual life of the loan. Premiums and discounts on purchased loans are amortized as adjustments to interest income using the effective yield method.
The loans receivable portfolio is segmented into commercial and consumer loans. Commercial loans consist of the following classes: commercial and industrial, construction and land development, and commercial real estate. Consumer loans consist of the following classes: residential real estate, home equity, and other consumer.
Loan origination fees are deferred, and certain direct origination costs are capitalized. The net amounts are deferred and are recognized as an adjustment of the yield of the related loan
The accrual of interest on all portfolio classes, including troubled debt restructurings, is discontinued at the time the loan is more than ninety days delinquent unless the loan is well collateralized and in process of collection. Nonaccrual loans are reviewed for
charge-off
if more than ninety-days past due, except for residential loans and consumer loans. Residential loans are reviewed at 180 days and consumer loans are reviewed at 120 days past due. In all cases, loans are placed on nonaccrual orcharged-off
at an earlier date if collection of principal or interest is considered unlikely.All interest accrued but not collected for loans placed on nonaccrual or
charged-off
is reversed against interest income. The interest on these loans is accounted for on the cash-basis or cost-recovery method, until qualifying for return to accrual. Loans are returned to accrual status when all the principal and interest amounts contractually due are brought current and future payments are reasonably assured. In addition, a loan should be in accordance with the contractual terms for a reasonable period, usually requiring a payment history of six months.Allowance for Loan Losses
The allowance for loan losses is established as losses are estimated to have occurred through a provision for loan losses charged to operations. Loan losses are charged against the allowance when management believes the collectability of a loan balance is confirmed. Subsequent recoveries, if any, are credited to the allowance. There were no material changes in the Bank’s accounting policies or methodology related to the allowance for loan losses during the year ended December 31, 2020.
The allowance for loan losses is evaluated on a quarterly basis by management and is based upon management’s periodic review of the collectability of the loans considering historical experience, the size and composition of the loan portfolio, adverse situations that may affect the borrower’s ability to repay, estimated value of any underlying collateral and prevailing economic conditions. This evaluation is inherently subjective as it requires estimates that are susceptible to significant revision as more information becomes available.
The allowance consists of specific and general components. The specific component relates to loans that are classified as impaired. For such loans, an allowance is established when the discounted cash flows, collateral value or observable market price of the impaired loan is lower than the carrying value of that loan. The general component covers all other loans and is based on historical loss experience adjusted for qualitative factors.
F-142
LINKBANCORP, INC. AND SUBSIDIARY
NOTES TO THE CONSOLIDATED FINANCIAL STATEMENTS (Continued)
1. | SUMMARY OF SIGNIFICANT ACCOUNTING POLICIES (Continued) |
Allowance for Loan Losses (Continued)
The historical loss component of the allowance is determined by losses recognized by portfolio segment over the preceding sixteen quarters. This is supplemented by the risks for each portfolio segment. Risk factors impacting loans in each of the portfolio segments include broad deterioration of property values, reduced consumer, and business spending as a result of unemployment and reduced credit availability and lack of confidence in the economy. The historical experience is adjusted for the following qualitative factors: (a) the existence and effect of any concentrations of credit and changes in the level of such concentrations; (b) changes in national, regional and local economic conditions that affect the collectability of the loan portfolio; (c) changes in levels or trends in charge-offs and recoveries; (d) changes in the volume and severity of past due loans, nonaccrual loans or loans classified special mention, substandard, doubtful or loss; (e) changes in the nature and volume of the loan portfolio and terms of loans; (f) changes in lending policies and procedures, risk selection and underwriting standards; (g) changes in the experience, ability and depth of lending management and other relevant staff; (h) quality of loan review; (i) the effect of other external factors, trends or uncertainties that could affect management’s estimate of probable losses, such as competition and industry conditions. The Company uses peer data when they have insufficient history to use their own loss data. The peer group is made up of various Bank’s with similar size and geographical location to obtain comparable data.
A loan is considered impaired when, based on current information and events, it is probable that the Company will be unable to collect the scheduled payments of principal or interest when due according to the contractual terms of the loan agreement. Factors considered by management in determining impairment include payment status, collateral value, and the probability of collecting scheduled principal and interest payments when due. Loans that experience insignificant payment delays and payment shortfalls generally are not classified as impaired. Management determines the significance of payment delays and payment shortfalls on acase basis, taking into consideration all circumstances surrounding the loan and the borrower, including the length of the delay, the reasons for the delay, the borrower’s prior payment record, and the amount of the shortfall in relation to the principal and interest owed. Impairment is measured on abasis for commercial, commercial real estate, and residential mortgage loan segments by either the present value of expected future cash flows discounted at the loan’s effective interest rate, the loan’s obtainable market price, or the fair value of the collateral if the loan is collateral-dependent.
case-by-
loan-by-loan
Large groups of smaller balance homogeneous loans are collectively evaluated for impairment. Accordingly, the Company does not separately identify individual consumer loans for impairment disclosures.
Investment in Restricted Stock, at Cost
The Company holds restricted stock in the Federal Home Loan Bank (“FHLB”) of Pittsburgh and the Atlantic Community Bankers Bank (“ACBB”) which is carried at cost. The Company holds $24,000 of ACBB stock at December 31, 2020 and 2019. The Company holds $2,591,000 and $19,000 of FHLB stock at December 31, 2020 and 2019, respectively. The FHLB stock is bought from and sold to the FHLB based upon its $100 par value. The stock does not have a readily determinable fair value and as such is classified as restricted stock, carried at cost, and evaluated for impairment as necessary. The stock’s value is determined by the ultimate recoverability of the par value rather than by recognizing temporary declines. The determination of whether the par value will ultimately be recovered is influenced by criteria such as the following: (a) the significance of the decline in net assets of the FHLB as compared to the capital stock amount and the length of time this situation has persisted; (b) commitments by the FHLB to make payments required by law or regulation and the level of such payments in relation to the operating performance; (c) the impact of legislative and regulatory changes on the customer base of the FHLB; and (d) the liquidity position of the FHLB. Management evaluated the stock and concluded that the stock was not impaired for the periods presented herein.
F-143
LINKBANCORP, INC. AND SUBSIDIARY
NOTES TO THE CONSOLIDATED FINANCIAL STATEMENTS (Continued)
1. | SUMMARY OF SIGNIFICANT ACCOUNTING POLICIES (Continued) |
Bank-Owned Life Insurance
The Company invests in bank-owned life insurance (“BOLI”) as a source of funding for employee benefit expenses. BOLI involves the purchasing of life insurance by the Company on a chosen group of employees. The Company is the owner and beneficiary of the policies. This life insurance investment is carried at the cash surrender value of the underlying policies. Income from the increase in cash surrender value of the policies is included in other income in the Consolidated Statement of Operations, net of expenses.
Premises and Equipment
Leasehold improvements and furniture and equipment are stated at cost, less accumulated depreciation. Depreciation and amortization expense is computed using the straight-line method over the estimated useful lives of the assets. Estimate useful lives for furniture and equipment from three to ten years; leasehold improvements are amortized over the lease term or estimated life of the improvement, if shorter.
Transfers of Financial Assets
Transfers of financial assets are accounted for as sales when control of the assets has been surrendered. Control over transferred assets is deemed to be surrendered when (1) the assets have been isolated from the Bank, (2) the transferee obtains the right (free of conditions that constrain it from taking advantage of that right) to pledge or exchange the transferred assets, and (3) the Bank does not maintain effective control over the transferred assets through an agreement to repurchase them before their maturity.
Income Taxes
The income tax accounting guidance results in two components of income tax expense: current and deferred. Current income tax expense reflects taxes to be paid or refunded for the current period by applying the provisions of the enacted tax law to the taxable income or excess of deductions over revenues. The Bank determines deferred income taxes using the liability (or balance sheet) method. Under this method, the net deferred tax asset or liability is based on the tax effects of the differences between the book and tax bases of assets and liabilities, and enacted changes in tax rates and laws are recognized in the period in which they occur. Deferred income tax expense results from changes in deferred tax assets and liabilities between periods. Deferred tax assets are reduced by a valuation allowance if, based on the weight of the evidence available, it is more likely than not that some portion or all of a deferred tax asset will not be realized.
The Company accounts for uncertain tax positions if it is more likely than not, based on the technical merits, that the tax position will be realized or sustained upon examination. The term more likely than not means a likelihood of more than 50 percent; the terms examined and upon examination also include resolution of the related appeals or litigation processes, if any. A tax position that meets the
more-likely-than-not
recognition threshold is initially and subsequently measured as the largest amount of tax benefit that has a greater than 50 percent likelihood of being realized upon settlement with a taxing authority that has full knowledge of all relevant information. The determination of whether a tax position has met themore-likely-than-not
recognition threshold considers the facts, circumstances, and information available at the reporting date and is subject to management’s judgment. The Bank recognizes interest and penalties on income taxes as a component of income tax expense.Off-balance
Sheet Financial InstrumentsIn the ordinary course of business, the Bank has entered into
off-balance
sheet financial instruments consisting of commitments to extend credit and letters of credit. Such financial instruments are recorded in the consolidated balance sheets when they are funded.F-144
LINKBANCORP, INC. AND SUBSIDIARY
NOTES TO THE CONSOLIDATED FINANCIAL STATEMENTS (Continued)
1. | SUMMARY OF SIGNIFICANT ACCOUNTING POLICIES (Continued) |
Share-based Compensation
The Bank follows the provisions of ASC
718-10,
Compensation – Stock Compensation. This standard requires the Bank to recognize the cost of employee and organizer services received in share-based payment transactions and measure the cost based on the grant-date fair value of the award. The cost will be recognized over the period during which the employee or organizer is required to provide service in exchange for the award.The stock compensation accounting guidance requires that compensation cost for all stock awards be calculated and recognized over the employee’s service period, generally defined as the vesting period. For awards with graded-vesting, compensation cost is recognized on a straight-line basis over the requisite service period for the entire award. A Black-Scholes model is used to estimate the fair value of stock options, while the fair value of the Company’s common stock as the date of grant is used for restricted stock awards.
Earnings Per Share
Basic earnings per share (EPS) represents net income available to common shareholders divided by the weighted-average number of common shares outstanding during the period. Potential common shares that may be issued related to outstanding stock options are determined using the treasury stock method.
The following table sets forth the composition of earnings per share:
(In Thousands, except share and per share data) | 2020 | 2019 | ||||||
Net loss | $ | (1,764 | ) | $ | (6,075 | ) | ||
Weighted-average common shares outstanding | 4,627,274 | 4,545,297 | ||||||
Average treasury stock shares | — | — | ||||||
Weighted-average common shares used to calculate basic and diluted earnings per share | 4,627,274 | 4,545,297 | ||||||
Net loss per common share: | ||||||||
Basic | $ | (0.38 | ) | $ | (1.34 | ) | ||
Diluted | $ | (0.38 | ) | $ | (1.34 | ) | ||
The following is a summary of securities that could potentially dilute basic earnings per common share in future periods that were not included in the computation of diluted earnings per common share because to do so would have been anti-dilutive for the periods presented.
2020 | 2019 | |||||||
Warrants | $ | 1,537,484 | $ | 1,537,484 | ||||
Share-based compensation awards | 396,000 | 394,500 | ||||||
Total anti-dilutive securities | $ | 1,933,484 | $ | 1,931,984 | ||||
Recent Accounting Pronouncements
In February 2016, the Financial Accounting Standards Board (FASB) issued ASU. The standard requires lessees to recognize the assets and liabilities that arise from leases on the
2016-02,
Leases (Topic 842)
F-145
LINKBANCORP, INC. AND SUBSIDIARY
NOTES TO THE CONSOLIDATED FINANCIAL STATEMENTS (Continued)
1. | SUMMARY OF SIGNIFICANT ACCOUNTING POLICIES (Continued) |
Recent Accounting Pronouncements (Continued)
balance sheet. A lessee should recognize in the statement of financial position a liability to make lease payments (the lease liability) and aasset representing its right to use the underlying asset for the lease term. A short-term lease is defined as one in which (a) the lease term is 12 months or less, and (b) there is not an option to purchase the underlying asset that the lessee is reasonably certain to exercise. For short-term leases, lessees may elect to recognize lease payments over the lease term on a straight-line basis. This Update will be adopted by the Company as of January 1, 2021. The amendments will be applied using a modified retrospective approach beginning as of the period of adoption. Based on our current estimates, we anticipate the value of the initial lease liability and corresponding right of use asset to be less than 1% of our total assets at December 31, 2020.
right-of-use
In June 2016, the FASB issued ASU, which changes the impairment model for most financial assets. This Update is intended to improve financial reporting by requiring timelier recording of credit losses on loans and other financial instruments held by financial institutions and other organizations. The underlying premise of the Update is that financial assets measured at amortized cost should be presented at the net amount expected to be collected, through an allowance for credit losses that is deducted from the amortized cost basis. The allowance for credit losses should reflect management’s current estimate of credit losses that are expected to occur over the remaining life of a financial asset. The income statement will be affected for the measurement of credit losses for newly recognized financial assets, as well as the expected increases or decreases of expected credit losses that have taken place during the period. With certain exceptions, transition to the new requirements will be through a cumulative-effect adjustment to opening retained earnings as of the beginning of the first reporting period in which the guidance is adopted. This Update is effective for SEC filers that are eligible to be smaller reporting companies,
2016-13,
Financial Instruments – Credit Losses: Measurement of Credit Losses on Financial Instruments
non-SEC
filers, and all other companies, to fiscal years beginning after December 15, 2022, including interim periods within those fiscal years. We expect to recognize aone-
time cumulative-effect adjustment to the allowance for loan losses as of the beginning of the first reporting period in which the new standard is effective but cannot yet determine the magnitude of any suchone-time
adjustment or the overall impact of the new guidance on the consolidated financial statements.In January 2020, the FASB issued ASU, to provide temporary optional expedients and exceptions to the U.S. GAAP guidance on contract modifications and hedge accounting to ease the financial reporting burdens of the expected market transition from LIBOR and other interbank offered rates to alternative reference rates, such as the Secured Overnight Financing Rate. Entities can elect not to apply certain modification accounting requirements to contracts affected by what the guidance calls “reference rate reform” if certain criteria are met. An entity that makes this election would not have to remeasure the contracts at the modification date or reassess a previous accounting determination. Also, entities can elect various optional expedients that would allow them to continue applying hedge accounting for hedging relationships affected by reference rate reform if certain criteria are met, and can make a onetime election to sell and/or reclassifydebt securities that reference an interest rate affected by reference rate reform. The amendments in this ASU are effective for all entities upon issuance through December 31, 2022. The Company has identified our loan receivables that have an interest rate indexed to LIBOR and is currently assessing the appropriate transition path. As such, the Company does not have an estimate of the financial impact of this update but does not expect the impact to be material to the financial statements of the Company.
2020-04,
Reference Rate Reform (Topic 848): Facilitation of the Effects of Reference Rate Reform on Financial Reporting, March 2020
held-to-maturity
F-146
LINKBANCORP, INC. AND SUBSIDIARY
NOTES TO THE CONSOLIDATED FINANCIAL STATEMENTS (Continued)
2. | INVESTMENT SECURITIES |
The amortized cost, gross unrealized gains and losses, and fair value of investment securities available for sale are summarized as follows:
December 31, 2020 | ||||||||||||||||
(In Thousands) Available for Sale: | Amortized Cost | Gross Unrealized Gains | Gross Unrealized Losses | Fair Value | ||||||||||||
U.S. treasury securities | $ | 75,000 | $ | — | $ | (1 | ) | $ | 74,999 | |||||||
Mortgage backed securities, residential | 4,063 | 143 | — | 4,206 | ||||||||||||
Total available-for-sale | $ | 79,063 | $ | 143 | $ | (1 | ) | $ | 79,205 | |||||||
December 31, 2019 | ||||||||||||||||
(In Thousands) Available for Sale: | Amortized Cost | Gross Unrealized Gains | Gross Unrealized Losses | Fair Value | ||||||||||||
U.S. treasury securities | $ | 46,986 | $ | — | $ | (11 | ) | $ | 46,975 | |||||||
Total available-for-sale | $ | 46,986 | $ | — | $ | (11 | ) | $ | 46,975 | |||||||
The investments in U.S. treasury securities at December 31, 2020 are made of up two U.S. treasury securities that have been in a continuous loss position for less than 12 months. The investments in U.S. treasury securities at December 31, 2019 are made up of three U.S. treasuries that had been in a continuous loss position for less than 12 months. The unrealized loss positions for both periods relate principally to changes in interest rates subsequent to the acquisition of the securities. The securities were made up of U.S. treasuries and management believe there is no credit risk and therefore, no other-than-temporary impairment.
All mortgage-backed security investments are government sponsored enterprises (“GSE”) pass-through instruments issued by the Federal National Mortgage Association (“FNMA”), or Federal Home Loan Mortgage Corporation (“FHLMC”), which guarantee the timely payment of principal on acquisition of the specific securities.
Amortized cost and fair value at December 31, 2020, by contractual maturity, where applicable, are shown below.
(In Thousands) Available for Sale: | Amortized Cost | Fair Value | ||||||
1 year or less | $ | 75,000 | $ | 74,999 | ||||
Mortgage-backed securities, residential | 4,063 | 4,206 | ||||||
$ | 79,063 | $ | 79,205 | |||||
3. | LOANS RECEIVABLE |
The portfolio segments and classes of loans are as follows:
December 31, | ||||||||
( In Thousands) | 2020 | 2019 | ||||||
Commercial and industrial | $ | 101,370 | $ | 34,057 | ||||
Construction and land development | 20,935 | 14,681 | ||||||
Real estate - commercial | 145,800 | 75,999 | ||||||
Real estate - residential | 37,302 | 34,817 | ||||||
Real estate - home equity | 20,218 | 8,300 | ||||||
Consumer | 2,622 | 702 | ||||||
328,247 | 168,556 | |||||||
F-147
LINKBANCORP, INC. AND SUBSIDIARY
NOTES TO THE CONSOLIDATED FINANCIAL STATEMENTS (Continued)
3. | LOANS RECEIVABLE (Continued) |
December 31, | ||||||||
( In Thousands) | 2020 | 2019 | ||||||
Less: | ||||||||
Deferred fees | (856 | ) | (74 | ) | ||||
Allowance for loan losses | (4,177 | ) | (1,689 | ) | ||||
Total | $ | 323,214 | $ | 166,793 | ||||
The Company originates commercial, residential, and consumer loans within its primary market areas of southcentral and southeastern Pennsylvania. A significant portion of the loan portfolio is secured by real estate.
During 2020 the Company participated in the Paycheck Protection Program (“PPP”), administered directly by the U.S. SBA. The PPP provides loans to small businesses who were affected by economic conditions as a result of
COVID-19
to provide cash-flow assistance to employers who maintain their payroll (including healthcare and certain related expenses), mortgage interest, rent, leases, utilities and interest on existing debt during the COVID- 19 emergency. As of December 31, 2020, the Company had outstanding principal balances of $41.0 million. The PPP loans are fully guaranteed by the SBA and may be eligible for forgiveness by the SBA to the extent that the proceeds are used to cover eligible payroll costs, interest costs, rent, and utility costs over a period of up to 24 weeks after the loan is made as long as certain conditions are met regarding employee retention and compensation levels. PPP loans deemed eligible for forgiveness by the SBA will be repaid by the SBA to the Company. PPP loans are included in the Commercial and industrial category.In accordance with the SBA terms and conditions on these PPP loans, the Company received approximately $3.0 million in fees associated with the processing of these loans. For the year ended December 31, 2020, the Company recognized $2.0 million in fees relating to PPP loans. Upon funding of the loan, these fees were deferred and will be amortized over the life of the loan as an adjustment to yield in accordance with FASB ASC
310-20-25-2.
4. | ALLOWANCE FOR LOAN LOSSES |
The segments of the Company’s loan portfolio are disaggregated to a level that allows management to monitor risk and performance. The loan segments used are consistent with the internal reports evaluated by the Company’s management and Board of Directors to monitor risk and performance within various segments of its loan portfolio and, therefore, no further disaggregation is considered necessary. The Company’s loan portfolio consists primarily of real estate loans on commercial and, to a lesser extent residential property. The portfolio also includes commercial loans, and consumer loans.
The Company’s primary lending activity is the origination of commercial loans extended to small and
mid-
sized commercial and industrial entities.Commercial loans are primarily underwritten on the basis of the borrowers’ ability to service such debt from income. The cash flows of borrowers, however, may not be as expected and the collateral securing these loans may fluctuate in value. As a general practice, the Company takes as collateral a security interest in any equipment, or other chattel, although loans may also be made on an unsecured basis. Collateralized working capital loans typically are secured by short-term assets whereas long-term loans are primarily secured by long-term assets.
Construction and Land loans are to finance the construction of owner-occupied and income producing properties. These loans are categorized as construction loans during the construction period, later converting
F-148
LINKBANCORP, INC. AND SUBSIDIARY
NOTES TO THE CONSOLIDATED FINANCIAL STATEMENTS (Continued)
4. | ALLOWANCE FOR LOAN LOSSES (Continued) |
to commercial orfamily residential loans after the construction is complete and amortization of the loan begins. Real estate development and construction loans are approved based on an analysis of the borrower and guarantor, the viability of the project and on an acceptable percentage of the appraised value of the property securing the loan. Construction loan funds are disbursed periodically based on the percentage of construction or development completed. The Company carefully monitors these loans with
one-to-four
on-site
inspections and requires the receipt of lien waivers on funds advanced. The Company considers the market conditions and feasibility of proposed projects, the financial condition and reputation of the borrower and guarantors, the amount of the borrower’s equity in the project, independent appraisals, cost estimates andpre-construction
sale information. The Company also makes loans on occasion for the purchase of land for future development by the borrower. Land loans are extended for the future development for either commercial or residential use by the borrower. The Company carefully analyzes the intended use of the property and the viability thereof.The Company’s commercial real estate loans consist of mortgage loans secured by nonresidential real estate, such as by apartment buildings, small office buildings, and owner-occupied properties. Commercial real estate loans are secured by the subject property and are underwritten based on loan to value limits, cash flow coverage and general creditworthiness of the obligors. These loans tend to involve larger loan balances and their repayment is typically dependent upon the successful operation and management of the underlying real estate.
Residential real estate loans are underwritten based on the borrower’s repayment capacity and source, value of the underlying property, credit history and stability. These loans are secured by a first or second mortgage on the borrower’s principal residence or their second/vacation home (excluding investment/rental property).
Home equity loans consists of either revolving line of credit, term, or second mortgage loans secured byfour family residential real estate. These loans are secured by a first or second lien on the borrower’s residence. There are minimum credit score standards,and other credit requirements. Home equity lines of credit are variable rate based on an index of Wall Street Journal prime rate with a margin.
one-to-
loan-to-value,
The consumer loan portfolio consists of lending in the form of home equity loans secured by financed property and personal consumer loans, which may be secured or unsecured.
Management has an established methodology to determine the adequacy of the allowance for loan losses that assesses the risks and losses inherent in the loan portfolio. For purposes of determining the allowance for loan losses the Company has segmented certain loans in the portfolio by product type. Loans are segmented into the following pools: agriculture loans, commercial real estate loans, commercial loans, residential real estate loans, consumer loans, and municipal loans. Historical loss percentages for each risk category are calculated and used as the basis for calculating allowance allocations. These historical loss percentages are calculated over a four-year period for all portfolio segments.
Certain qualitative factors are then added to the historical allocation percentage to get the adjusted factor to be applied to
non-classified
loans. The following qualitative factors are analyzed for each portfolio segment:| • | Levels of and trends in delinquencies |
| • | Trends in volume and terms |
| • | Changes in collateral |
| • | Changes in management and lending staff |
| • | Economic trends |
F-149
LINKBANCORP, INC. AND SUBSIDIARY
NOTES TO THE CONSOLIDATED FINANCIAL STATEMENTS (Continued)
4. | ALLOWANCE FOR LOAN LOSSES (Continued) |
| • | Concentrations of credit |
| • | Changes in lending policies |
| • | External factors |
| • | Changes in underwriting process |
| • | Trends in credit quality ratings |
These qualitative factors are reviewed each quarter and adjusted based upon relevant changes within the portfolio.
The total allowance reflects management’s estimate of loan losses inherent in the loan portfolio at the Consolidated Balance Sheet date. The Company considers the allowance for loan losses adequate to cover loan losses inherent in the loan portfolio at December 31, 2020 and 2019.
The following table summarizes the activity in the allowance for loan losses by loan class for the period ended December 31, 2020 and 2019 and information regarding the allowance for loan losses by loan class as of December 31, 2020 and 2019.
(in Thousands)
For the Year Ended December 31, 2020 | ||||||||||||||||||||||||||||||||
Commercial and Industrial | Construction and Land Development | Real Estate Commercial | Real Estate Residential | Real Estate Home Equity | Consumer Other | Unallocated | Total | |||||||||||||||||||||||||
Allowance for loan losses: | ||||||||||||||||||||||||||||||||
Beginning balance | $ | 623 | $ | 170 | $ | 598 | $ | 214 | $ | 45 | $ | 9 | $ | 30 | $ | 1,689 | ||||||||||||||||
Charge-offs | — | — | 10 | — | — | — | — | 10 | ||||||||||||||||||||||||
Recoveries | 10 | — | 18 | — | — | — | — | 28 | ||||||||||||||||||||||||
Provision | 369 | 227 | 1,476 | 204 | 197 | 26 | (29 | ) | 2,470 | |||||||||||||||||||||||
| Ending balance | $ | 1,002 | $ | 397 | $ | 2,082 | $ | 418 | $ | 242 | $ | 35 | $ | 1 | $ | 4,177 | ||||||||||||||||
Ending balance: | ||||||||||||||||||||||||||||||||
| individually evaluated for impairment | $ | 111 | $ | — | $ | — | $ | 18 | $ | — | 3 | — | $ | 132 | ||||||||||||||||||
Ending balance: | ||||||||||||||||||||||||||||||||
| collectively evaluated for impairment | $ | 891 | $ | 397 | $ | 2,082 | $ | 400 | $ | 242 | 32 | 1 | $ | 4,045 | ||||||||||||||||||
Loans: | ||||||||||||||||||||||||||||||||
| Ending balance | $ | 101,370 | $ | 20,935 | $ | 145,800 | $ | 37,302 | $ | 20,218 | $ | 2,622 | $ | 328,247 | ||||||||||||||||||
Ending balance: | ||||||||||||||||||||||||||||||||
| individually evaluated for impairment | $ | 1,081 | $ | — | $ | 230 | $ | 331 | $ | — | $ | 3 | $ | 1,645 | ||||||||||||||||||
Ending balance: | ||||||||||||||||||||||||||||||||
| collectively evaluated for impairment | $ | 100,289 | $ | 20,935 | $ | 145,570 | $ | 36,971 | $ | 20,218 | $ | 2,619 | $ | 326,602 | ||||||||||||||||||
F-150
LINKBANCORP, INC. AND SUBSIDIARY
NOTES TO THE CONSOLIDATED FINANCIAL STATEMENTS (Continued)
4. | ALLOWANCE FOR LOAN LOSSES (Continued) |
For the Year Ended December 31, 2019 | ||||||||||||||||||||||||||||||||
Commercial and Industrial | Construction and Land Development | Real Estate Commercial | Real Estate Residential | Real Estate Home Equity | Consumer Other | Unallocated | Total | |||||||||||||||||||||||||
Allowance for loan losses: | ||||||||||||||||||||||||||||||||
Beginning balance | $ | — | $ | — | $ | 27 | $ | 22 | $ | — | $ | — | $ | — | $ | 49 | ||||||||||||||||
Charge-offs | — | — | — | — | — | — | — | — | ||||||||||||||||||||||||
Recoveries | 7 | 14 | — | 11 | — | 3 | — | 35 | ||||||||||||||||||||||||
Provision | 616 | 156 | 571 | 181 | 45 | 6 | 30 | 1,605 | ||||||||||||||||||||||||
| Ending balance | $ | 623 | $ | 170 | $ | 598 | $ | 214 | $ | 45 | $ | 9 | $ | 30 | $ | 1,689 | ||||||||||||||||
Ending balance: | ||||||||||||||||||||||||||||||||
| individually evaluated for impairment | $ | 325 | $ | — | $ | — | $ | — | $ | — | 5 | — | $ | 330 | ||||||||||||||||||
Ending balance: | ||||||||||||||||||||||||||||||||
| collectively evaluated for impairment | $ | 298 | $ | 170 | $ | 598 | $ | 214 | $ | 45 | 4 | 30 | $ | 1,359 | ||||||||||||||||||
Loans: | ||||||||||||||||||||||||||||||||
| Ending balance | $ | 34,057 | $ | 14,681 | $ | 75,999 | $ | 34,817 | $ | 8,300 | $ | 702 | $ | 168,556 | ||||||||||||||||||
Ending balance: | ||||||||||||||||||||||||||||||||
| individually evaluated for impairment | $ | 1,323 | $ | — | $ | — | $ | 182 | $ | — | $ | 5 | $ | 1,510 | ||||||||||||||||||
Ending balance: | ||||||||||||||||||||||||||||||||
| collectively evaluated for impairment | $ | 32,734 | $ | 14,681 | $ | 75,999 | $ | 34,635 | $ | 8,300 | $ | 697 | $ | 167,046 | ||||||||||||||||||
Credit Quality Information
The following tables represent credit exposures by internally assigned grades as of December 31, 2020 and 2019. The grading analysis estimates the capability of the borrower to repay the contractual obligations of the loan agreements as scheduled or at all.
The Company’s internally assigned grades are as follows:
Pass – loans that are protected by the current net worth and paying capacity of the obligor or by the value of the underlying collateral. There are four
sub-grades
within the Pass category to further distinguish the loan.Special Mention – loans where a potential weakness or risk exists, which could cause a more serious problem if not corrected.
Substandard – loans that have a well-defined weakness based on objective evidence and are characterized by the distinct possibility that the Bank will sustain some loss if the deficiencies are not corrected.
Doubtful – loans classified as Doubtful have all the weaknesses inherent in a Substandard asset. In addition, these weaknesses make collection or liquidation in full highly questionable and improbable, based on existing circumstances.
Loss – loans classified as a Loss are considered uncollectible and are immediately charged against allowances.
F-151
LINKBANCORP, INC. AND SUBSIDIARY
NOTES TO THE CONSOLIDATED FINANCIAL STATEMENTS (Continued)
4. | ALLOWANCE FOR LOAN LOSSES (Continued) |
Credit Quality Information (Continued)
The following table presents the classes of the loan portfolio summarized by the internal risk rating system as of December 31, 2020 and 2019:
(In Thousands) | Special | |||||||||||||||||||
| As of December 31, 2020 | Pass | Mention | Substandard | Doubtful | Total | |||||||||||||||
Commercial and industrial | $ | 100,289 | $ | — | $ | 1,081 | $ | — | $ | 101,370 | ||||||||||
Construction and land development | 20,935 | — | — | — | 20,935 | |||||||||||||||
Real estate - commercial | 145,358 | 212 | 230 | — | 145,800 | |||||||||||||||
Real estate - residential | 36,892 | 142 | 268 | — | 37,302 | |||||||||||||||
Real estate - home equity | 20,155 | — | 63 | — | 20,218 | |||||||||||||||
Consumer | 2,619 | — | 3 | — | 2,622 | |||||||||||||||
Total | $ | 326,248 | $ | 354 | $ | 1,645 | $ | — | $ | 328,247 | ||||||||||
(In Thousands) | Special | |||||||||||||||||||
| As of December 31, 2019 | Pass | Mention | Substandard | Doubtful | Total | |||||||||||||||
Commercial and industrial | $ | 32,644 | $ | — | $ | 1,323 | $ | — | $ | 33,967 | ||||||||||
Construction and land development | 14,681 | — | — | — | 14,681 | |||||||||||||||
Real estate - commercial | 75,797 | 218 | — | — | 76,015 | |||||||||||||||
Real estate - residential | 34,121 | 514 | 182 | — | 34,817 | |||||||||||||||
Real estate - home equity | 8,300 | — | — | — | 8,300 | |||||||||||||||
Consumer | 697 | — | 5 | — | 702 | |||||||||||||||
Total | $ | 166,240 | $ | 732 | $ | 1,510 | $ | — | $ | 168,482 | ||||||||||
The following tables present an aging analysis of the recorded investment of
past-due
loans.December 31, 2020 | ||||||||||||||||||||||||||||
(In Thousands) | 30-59 Days Past Due | 60-89 Days Past Due | 90 Days or Greater Past Due | Total Past Due | Current | Total Loans | Total > 90 Days and Accruing | |||||||||||||||||||||
Commercial and industrial | $ | 10 | $ | — | $ | — | $ | 10 | $ | 101,360 | $ | 101,370 | $ | — | ||||||||||||||
Construction and land development | — | — | — | — | 20,935 | 20,935 | — | |||||||||||||||||||||
Real estate - commercial | 480 | — | 156 | 636 | 145,164 | 145,800 | — | |||||||||||||||||||||
Real estate - residential | 711 | 719 | 133 | 1,563 | 35,739 | 37,302 | 97 | |||||||||||||||||||||
Real estate - home equity | — | — | — | — | 20,218 | 20,218 | — | |||||||||||||||||||||
Consumer | — | — | — | — | 2,622 | 2,622 | — | |||||||||||||||||||||
Total | $ | 1,201 | $ | 719 | $ | 289 | $ | 2,209 | $ | 326,038 | $ | 328,247 | $ | 97 | ||||||||||||||
F-152
LINKBANCORP, INC. AND SUBSIDIARY
NOTES TO THE CONSOLIDATED FINANCIAL STATEMENTS (Continued)
4. | ALLOWANCE FOR LOAN LOSSES (Continued) |
Credit Quality Information (Continued)
December 31, 2019 | ||||||||||||||||||||||||||||
(In Thousands) | 30-59 Days Past Due | 60-89 Days Past Due | 90 Days or Greater Past Due | Total Past Due | Current | Total Loans | Total > 90 Days and Accruing | |||||||||||||||||||||
Commercial and industrial | $ | — | $ | — | $ | — | $ | — | $ | 33,967 | $ | 33,967 | $ | — | ||||||||||||||
Construction and land development | — | — | — | — | 14,681 | 14,681 | — | |||||||||||||||||||||
Real estate - commercial | 93 | 161 | 218 | 472 | 75,543 | 76,015 | 218 | |||||||||||||||||||||
Real estate - residential | 108 | 306 | 696 | 1,110 | 33,707 | 34,817 | 514 | |||||||||||||||||||||
Real estate - home equity | — | — | — | — | 8,300 | 8,300 | — | |||||||||||||||||||||
Consumer | 2 | — | 5 | 7 | 695 | 702 | — | |||||||||||||||||||||
Total | $ | 203 | $ | 467 | $ | 919 | $ | 1,589 | $ | 166,893 | $ | 168,482 | $ | 732 | ||||||||||||||
Impaired Loans
The following tables present the recorded investment and unpaid principal balances for impaired loans and related allowance, if applicable. Also presented are the average recorded investments and the related amount of interest recognized during the time within the period that the impaired loans were impaired.
December 31, 2020 | ||||||||||||||||||||
(In T h ou s an ds) | Recorded Investment | Unpaid Principal Balance | Related Allowance | Average Recorded Investment | Interest Recognized | |||||||||||||||
With no related allowance recorded: | ||||||||||||||||||||
Commercial and industrial | $ | — | $ | — | $ | — | $ | — | $ | — | ||||||||||
Construction and land development | — | — | — | — | — | |||||||||||||||
Real estate - commercial | 230 | 230 | — | 238 | 10 | |||||||||||||||
Real estate - residential | 295 | 295 | — | 307 | 15 | |||||||||||||||
Real estate - home equity | — | — | — | — | — | |||||||||||||||
Consumer | — | — | — | — | — | |||||||||||||||
With an allowance recorded: | ||||||||||||||||||||
Commercial and industrial | $ | 1,081 | $ | 1,081 | $ | 111 | $ | 1,196 | $ | 60 | ||||||||||
Construction and land development | — | — | — | — | — | |||||||||||||||
Real estate - commercial | — | — | — | — | — | |||||||||||||||
Real estate - residential | 36 | 36 | 18 | 38 | 2 | |||||||||||||||
Real estate - home equity | — | — | — | — | — | |||||||||||||||
Consumer | 3 | 3 | 3 | — | — | |||||||||||||||
Total | ||||||||||||||||||||
Commercial and industrial | $ | 1,081 | 1,081 | 111 | 1,196 | 60 | ||||||||||||||
Construction and land development | — | — | — | — | — | |||||||||||||||
Real estate - commercial | 230 | 230 | — | 238 | 10 | |||||||||||||||
Real estate - residential | 331 | 331 | 18 | 345 | 17 | |||||||||||||||
Real estate - home equity | — | — | — | — | — | |||||||||||||||
Consumer | 3 | 3 | 3 | — | — | |||||||||||||||
| $ | 1,645 | $ | 1,645 | $ | 132 | $ | 1,779 | $ | 87 | |||||||||||
F-153
LINKBANCORP, INC. AND SUBSIDIARY
NOTES TO THE CONSOLIDATED FINANCIAL STATEMENTS (Continued)
4. | ALLOWANCE FOR LOAN LOSSES (Continued) |
Impaired Loans (Continued)
December 31, 2019 | ||||||||||||||||||||
(In T h ou s an ds) | Recorded Investment | Unpaid Principal Balance | Related Allowance | Average Recorded Investment | Interest Recognized | |||||||||||||||
With no related allowance recorded: | ||||||||||||||||||||
Commercial and industrial | $ | — | $ | — | $ | — | $ | — | $ | — | ||||||||||
Construction and land development | — | — | — | — | — | |||||||||||||||
Real estate - commercial | — | — | — | — | — | |||||||||||||||
Real estate - residential | 182 | 182 | — | 190 | — | |||||||||||||||
Real estate - home equity | — | — | — | — | — | |||||||||||||||
Consumer | — | — | — | — | — | |||||||||||||||
With an allowance recorded: | ||||||||||||||||||||
Commercial and industrial | $ | 1,323 | $ | 1,323 | $ | 325 | $ | 1,290 | $ | 40 | ||||||||||
Construction and land development | — | — | — | — | — | |||||||||||||||
Real estate - commercial | — | — | — | — | — | |||||||||||||||
Real estate - residential | — | — | — | — | — | |||||||||||||||
Real estate - home equity | — | — | — | — | — | |||||||||||||||
Consumer | 5 | — | 5 | — | — | |||||||||||||||
Total | ||||||||||||||||||||
Commercial and industrial | $ | 1,323 | $ | 1,323 | $ | 325 | $ | 1,290 | $ | 40 | ||||||||||
Construction and land development | — | — | — | — | — | |||||||||||||||
Real estate - commercial | — | — | — | — | — | |||||||||||||||
Real estate - residential | 182 | 182 | — | 190 | — | |||||||||||||||
Real estate - home equity | — | — | — | — | — | |||||||||||||||
Consumer | 5 | — | 5 | — | — | |||||||||||||||
$ | 1,510 | $ | 1,505 | $ | 330 | $ | 1,480 | $ | 40 | |||||||||||
The following table present nonaccrual loans by classes of the loan portfolio:
December 31, | ||||||||
(In Thousands) | 2020 | 2019 | ||||||
Commercial and industrial | $ | — | $ | — | ||||
Construction and land development | — | — | ||||||
Real estate - commercial | — | — | ||||||
Real estate - residential | 100 | 182 | ||||||
Real estate - home equity | — | — | ||||||
Consumer | 3 | 5 | ||||||
Total | $ | 103 | $ | 187 | ||||
The recorded investment in
non-accrual
loans was $103,000 and $187,000 at December 31, 2020 and December 31, 2019.Approximately $145.8 and $20.9 million or 50.1% of the Bank’s loan portfolio was in real estate-commercial loans and construction and land development loans at December 31, 2020. While the Bank does not have a concentration of credit risk with any single borrower or industry, repayments on loans in these portfolios can be negatively influenced by decreases in real estate values. The Bank mitigates this risk
F-154
LINKBANCORP, INC. AND SUBSIDIARY
NOTES TO THE CONSOLIDATED FINANCIAL STATEMENTS (Continued)
4. | ALLOWANCE FOR LOAN LOSSES (Continued) |
Impaired Loans (Continued)
through conservative underwriting policies and procedures. In addition, of real estate-commercial loans were owner occupied properties as of December 31, 2020. These types of loans are generally considered to involve less risk than nonowner-occupied mortgages.
At December 31, 2020 and 2019, the carrying amount of loans pledged to secure borrowings was $61.6 million and $25.5 million.
Loan Modifications and Troubled Debt Restructurings (TDRs)
A loan is considered to be a TDR loan when the Company grants a concession to the borrower because of the borrower’s financial condition that it would not otherwise consider. Such concessions include the reduction of interest rates, forgiveness of principal or interest, or other modifications of interest rates that are less than the current market rate for new obligations with similar risk.
The Bank may grant a concession or modification for economic or legal reasons related to a borrower’s financial condition that it would not otherwise consider resulting in a modified loan which is then identified as a troubled debt restructuring (TDR). The Bank may modify loans through rate reductions, extensions of maturity, interest only payments, or payment modifications to better match the timing of cash flows due under the modified terms with the cash flows from the borrowers’ operations. Loan modifications are intended to minimize the economic loss and to avoid foreclosure or repossession of the collateral. TDRs are considered impaired loans for purposes of calculating the Bank’s allowance for loan losses.
The Bank identifies loans for potential restructure primarily through direct communication with the borrower and evaluation of the borrower’s financial statements, revenue projections, tax returns, and credit reports. Even if the borrower is not presently in default, management will consider the likelihood that cash flow shortages, adverse economic conditions, and negative trends may result in a payment default in the near future. As of December 31, 2020 and 2019, the Company had no loans identified as TDR’s. There were also no new loan modifications during the periods that were considered TDRs.
COVID-19
Loan Forbearance ProgramsSection 4013 of the CARES Act provides that banks may elect not to categorize a loan modification as a TDR if the loan modification is (1) related to
COVID-19;
(2) executed on a loan that was not more than 30 days past due as of December 31, 2019; and (3) executed between March 1, 2020, and the earlier of (A) 60 days after the date on which the national emergency concerning the novel coronavirus disease (COVID–19) outbreak declared by the President on March 13, 2020, under the National Emergencies Act terminates, or (B) December 31, 2020.On April 7, 2020, federal banking regulators issued a revised interagency statement that included guidance on their approach for the accounting of loan modifications in light of the economic impact of the
COVID-19
pandemic. The guidance interprets current accounting standards and indicates that a lender can conclude that a borrower is not experiencing financial difficulty if short-term modifications are made in response toCOVID-19,
such as payment deferrals, fee waivers, extensions of repayment terms, or other delays in payment that are insignificant related to the loans in which the borrower is less than 30 days past due on its contractual payments at the time a modification program is implemented.According to the Interagency Statement on Loan Modifications and Reporting for Financial Institutions Working with Customers Affected by the Coronavirus (Revised) issued by the federal bank regulatory agencies on April 7, 2020, short-term loan modifications not otherwise eligible under Section 4013 that are made on a good faith basis
F-155
LINKBANCORP, INC. AND SUBSIDIARY
NOTES TO THE CONSOLIDATED FINANCIAL STATEMENTS (Continued)
4. | ALLOWANCE FOR LOAN LOSSES (Continued) |
COVID-19
Loan Forbearance Programs (Continued)in response to
COVID-19
to borrowers who were current prior to any relief are not TDRs. This includes short-term (e.g., six months) modifications such as payment deferrals, fee waivers, extensions of repayment terms, or other delays in payment that are insignificant.During 2020, our customers had requested 82 loan payment deferrals or payments of interest only on loans totaling $53.7 million. In accordance with Section 4013 of the CARES Act and the interagency guidance issued on April 7, 2020, these short-term deferrals are not considered troubled debt restructurings. As of December 31, 2020, the Company has 15 loans totaling $18.2 million that remain on a CARES Act modification.
In addition, the risk-rating on
COVID-19
modified loans did not change, and these loans will not be considered past due until after the deferral period is over and scheduled payments resume. The credit quality of these loans will be reevaluated after the deferral period ends.5. | GOODWILL AND INTANGIBLE ASSETS |
Goodwill totaled $1.3 million at December 31, 2020. The Company recorded goodwill of $1.3 million due to the Stonebridge Bank acquisition during the year ended December 31, 2018. Core deposit intangible net carrying amounts were $118,000 and $149,000 at the years ended December 31, 2020 and 2019. Core deposit intangible assets are amortized using themethod over their estimated lives of seven years. Amortization expense totaled $30,000 and $34,000 for the years ended December 31, 2020 and 2019, respectively.
sum-of-the-years-digits
The assets acquired and liabilities assumed were initially presented at their estimated fair values based on a preliminary allocation of the purchase price. In many cases, the determination of these fair values required management to make estimates about discount rates, future expected cash flows, market conditions and other future events that were highly subjective and subject to change. The fair value estimates were considered preliminary and subject to change after the closing date of the acquisition if additional information became available. Based on a preliminary purchase price allocation, the Company recorded $1.24 million in goodwill as a result of the acquisition. At December 31, 2019, the Company recorded adjustments to goodwill the estimated fair values of assets acquired, and liabilities assumed, which resulted in a $13,000 increase in goodwill. The adjusted amount of goodwill of $1.25 million reflects the excess purchase price over the estimated fair value of the net assets acquired. The goodwill recorded is deductible for tax purposes. The purchase price allocation was considered final as of December 31, 2019.
Goodwill and Core Deposit Intangible (CDI) are as follows (in thousands):
December 31, | ||||||||
(In Thousands) | 2020 | 2019 | ||||||
Goodwill | $ | 1,253 | $ | 1,253 | ||||
CDI | 118 | 149 | ||||||
Total | $ | 1,371 | $ | 1,402 | ||||
Accumulated amortization on the CDI was $64,000 at December 31, 2020, and $34,000 for the period ended December 31, 2019.
F-156
LINKBANCORP, INC. AND SUBSIDIARY
NOTES TO THE CONSOLIDATED FINANCIAL STATEMENTS (Continued)
5. | GOODWILL AND INTANGIBLE ASSETS (Continued) |
The future expected amortization of CDI as of December 31, 2020, are as follows:
(in thousands)
2021 | $ | 27 | ||
2022 | 23 | |||
2023 | 20 | |||
2024 | 17 | |||
2025 and thereafter | 31 | |||
Total | $ | 118 | ||
6. | PREMISES AND EQUIPMENT |
Premises and equipment consist of the following:
December 31, | ||||||||
(In Thousands) | 2020 | 2019 | ||||||
Leasehold improvements | $ | 812 | $ | 816 | ||||
Furniture and fixtures | 1,030 | 884 | ||||||
Office equipment | 37 | 37 | ||||||
Computer hardware | 245 | 131 | ||||||
Less accumulated depreciation | (738 | ) | (488 | ) | ||||
Total | $ | 1,386 | $ | 1,380 | ||||
Depreciation expense amounted to $252,000 and $156,000 for the years ended December 31, 2020 and 2019, respectively.
7. | DEPOSITS |
Deposit accounts are summarized as follows:
December 31, | ||||||||||||||||
2020 | 2019 | |||||||||||||||
(In Thousands) | Amount | % | Amount | % | ||||||||||||
Demand, noninterest-bearing | $ | 42,374 | 14.97 | % | $ | 12,644 | 6.7 | % | ||||||||
Demand, interest-bearing | 15,883 | 5.61 | 7,923 | 4.2 | ||||||||||||
Money market and savings | 81,756 | 28.88 | 49,039 | 26.0 | ||||||||||||
Time deposits, $250,000 and over | 47,112 | 16.64 | 26,302 | 13.9 | ||||||||||||
Time deposits, other | 95,929 | 33.89 | 92,765 | 49.2 | ||||||||||||
$ | 283,054 | 100.0 | % | $ | 188,673 | 100.0 | % | |||||||||
F-157
LINKBANCORP, INC. AND SUBSIDIARY
NOTES TO THE CONSOLIDATED FINANCIAL STATEMENTS (Continued)
7. | DEPOSITS (Continued) |
The scheduled maturities of time deposits are as follows:
December 31, | ||||||||
(In Thousands) | 2020 | 2019 | ||||||
One year or less | $ | 122,859 | $ | 104,061 | ||||
More than one year to two years | 13,441 | 14,429 | ||||||
More than two years to three years | 5,921 | 270 | ||||||
More than three years to four years | 288 | 74 | ||||||
More than four years to five years | 532 | 233 | ||||||
More than five years | — | — | ||||||
Total | $ | 143,041 | $ | 119,067 | ||||
Time deposits include those in denominations of $250,000 or more. Such deposits aggregated $47.1 million and $26.8 million at December 31, 2020 and 2019, respectively. There were $25.0 million in brokered deposits as of December 31, 2020 maturing in January 2021 and $10.75 million in brokered deposits as of December 31, 2019 maturing in January 2020.
8. | SHORT-TERM BORROWINGS |
The outstanding balances and related information of short-term borrowings represent federal funds purchased and short-term advances with the FHLB are summarized as follows:
December 31, | ||||||||
(In Thousands) | 2020 | 2019 | ||||||
Balance at year-end | $ | 41,667 | $ | 6,914 | ||||
Average balance outstanding | 474 | 19 | ||||||
Maximum month-end balance | 41,667 | 6,914 | ||||||
Weighted-average rate at year-end | 0.35 | % | 2.48 | % | ||||
Weighted-average rate during the year | 0.35 | % | 2.48 | % | ||||
Average balances outstanding during the year represent daily average balances.
The Company had $41.7 million in
13-day
FHLB advances at December 31, 2020 which matured on January 5, 2021. The Company had $6.9 million in overnight short-term borrowings at December 31, 2019 which matured on January 2, 2020. Borrowings from the FHLB of Pittsburgh are secured by FHLB stock, qualifying loans, and investments. The Company is required to maintain stock in the FHLB of Pittsburgh of $2.6 million as of December 31, 2020 and $19,400 as of December 31, 2019. The Company has a maximum borrowing capacity with the FHLB of approximately $115.8 million of which $61.7 was outstanding at December 31, 2020.At December 31, 2020 and 2019, the Company also has lines of credit at three financial institutions that would allow the Company to borrow up to $25.0 million. None of the credit lines were drawn upon at December 31, 2020 and $6.9 million was drawn at December 31, 2019.
F-158
LINKBANCORP, INC. AND SUBSIDIARY
NOTES TO THE CONSOLIDATED FINANCIAL STATEMENTS (Continued)
9. | OTHER BORROWINGS AND SUBORDINATED DEBT |
December 31, | ||||||||
(in Thousands) | 2020 | 2019 | ||||||
Long-term FHLB advances | $ | 20,000 | — | |||||
Subordinated Debt | 19,970 | — | ||||||
Federal Reserve PPPLF | 17,315 | — | ||||||
Total Long-term borrowings | $ | 57,285 | — | |||||
All borrowings from the FHLB are secured by a blanket lien on qualified collateral, defined principally as investment securities and mortgage loans, which are owned by the Company, free and clear of any liens or encumbrances.
Contractual maturities and scheduled cash flows of Federal Home Loan Bank long-term advances, in thousands, consist of the following at December 31, 2020: (In Thousands)
Type | Amount | Rate | Due in | |||||||||
Mid Term Repo Fixed Rate | $ | 5,000,000 | 0.91 | % | 2023 | |||||||
Fixed Rate | 5,000,000 | 0.97 | % | 2024 | ||||||||
Fixed Rate | 5,000,000 | 1.10 | % | 2025 | ||||||||
Fixed Rate | 3,000,000 | 1.01 | % | 2025 | ||||||||
Fixed Rate | 2,000,000 | 1.02 | % | 2025 | ||||||||
$ | 20,000,000 | 1.00 | % | |||||||||
In April 2020, the Federal Reserve initiated the Paycheck Protection Program Liquidity Facility (“PPPLF”) , which is designed to facilitate lending by financial institutions to small businesses under the PPP provision of the CARES Act. Only PPP loans are eligible to serve as collateral for the PPPLF, with each dollar of PPP loans providing one dollar of advance availability. The maturity date of an extension of credit under the PPPLF will equal the maturity date of the pool of PPP loans pledged to secure the extension of credit. Any principal payments received by the financial institution on the PPP loans, such as PPP loan forgiveness payments from the Small Business Administration or principal payments from the borrower after the initial six -month deferment period, must be used to pay down the PPPLF advance by the same dollar amount, maintaining theadvance amount and PPP aggregate loan balance relationship. The interest rate on PPPLF advances is fixed at 0.35%. As of December 31, 2020, our advances under the PPPLF totaled $17.3 million.
dollar-for-dollar
On September 30, 2020, the Company accepted subscriptions for and sold, at 100% of their principal amount, an aggregate of $20.0 million of subordinated notes (the “Notes”), on a private placement basis, to accredited investors. The investors included Company’s owned and controlled by a director of the Company, which purchased $19.0 million in principal amount of the Notes. The investors included Company’s owned and controlled by a director of the Company, which purchased $19.0 million in principal amount of the Notes. The Notes bear interest at a fixed interest rate of 5.0% per year for five years and then float at an index tied to the Secured Overnight Finance Rate (“SOFR”) . The Notes have a term of ten years and have a maturity date of October 1, 2030. The Notes are redeemable at the option of the Company, in whole or in part, subject to any required regulatory approvals after five years. The Company contributed $15.0 million of the proceeds from the Notes to the Bank as equity capital to support the Bank’s continued growth, including ongoing lending activities.
F-159
LINKBANCORP, INC. AND SUBSIDIARY
NOTES TO THE CONSOLIDATED FINANCIAL STATEMENTS (Continued)
10. | INCOME TAXES |
The provision for income taxes consists of:
| For the Year Ended December 31, | ||||||||
(In Thousands) | 2020 | 2019 | ||||||
Current tax expense | $ | — | $ | — | ||||
Deferred taxes | — | — | ||||||
Total | $ | — | $ | — | ||||
The tax effects of deductible and taxable temporary differences that gave rise to significant portions of the deferred tax assets and deferred tax liabilities, respectively, are as follows:
| December 31, | ||||||||
(In Thousands) | 2020 | 2019 | ||||||
Deferred tax assets: | ||||||||
Allowance for loan losses | $ | 877 | $ | 355 | ||||
Fair value adjustment on acquired loans | 535 | 638 | ||||||
Alternative minimum tax credit | 98 | 98 | ||||||
Net operating loss carryforwards | 1,872 | 1,661 | ||||||
Other | (240 | ) | 3 | |||||
Total gross deferred tax assets before valuation allowance | 3,142 | 2,755 | ||||||
Valuation allowance | (3,044 | ) | (2,657 | ) | ||||
Net deferred tax assets | $ | 98 | $ | 98 | ||||
In assessing the realizability of deferred tax assets, management considers whether it is more-likely-
than-not
that some portion or all the deferred tax assets will not be realized. The ultimate realization of deferred tax assets is dependent upon the generation of future taxable income during the periods in which those temporary differences become deductible. Management considers the reversal of deferred tax liabilities (including the impact of available carry back and carry forward periods), projected future taxable income andtax-planning
strategies in making this assessment. Based upon the Company’s cumulative three-year loss position and projections for future taxable income over the periods in which the deferred tax assets are deductible, management believes it ismore-likely-than-not
that The Company will be unable to realize the benefits of these deductible differences, except for the alternative minimum tax credits. The amount of the deferred tax asset considered realizable, however, could change in the near term if estimates of future taxable income during the carry forward period change and the deferred tax asset will continue to be analyzed on a quarterly basis for changes affecting realizability and the valuation allowance may be adjusted in future periods accordingly.As of December 31, 2020, the Company has federal net operating loss carry forwards of approximately $8.9 million. Approximately $489,000 of these net operating loss carryforwards are subject to Section 382 limitations.
The Company recognized no adjustment for unrecognized income tax benefits for the year ended December 31, 2020. The Company is subject to examination by the taxing authorities for the operating period since inception. The Company’s policy is to recognize interest and penalties on unrecognized tax benefits in the provision for income tax expense in the consolidated statements of operations. The Company did not recognize any interest and penalties for the year ended December 31, 2020.
F-160
LINKBANCORP, INC. AND SUBSIDIARY
NOTES TO THE CONSOLIDATED FINANCIAL STATEMENTS (Continued)
11. | RELATED-PARTY TRANSACTIONS |
The Company has had, and may be expected to have in the future, banking transactions in the ordinary course of business with its executive officers, directors, principal shareholders, their immediate families and affiliated companies (commonly referred to as related parties).
Year Ended December 31, | ||||||||
(In Thousands) | 2020 | 2019 | ||||||
Loans: | ||||||||
Balance at beginning of year | $ | 2,088 | 1,052 | |||||
Additions | 321 | 1,948 | ||||||
Amounts Collected | (243 | ) | (912 | ) | ||||
Balance at end of year | $ | 2,166 | 2,088 | |||||
Total unused commitments at end of year | 2,258 | 1,500 | ||||||
Aggregate amount of all extensions of credit | $ | 4,424 | 3,588 | |||||
Deposits at end of year | $ | 14,669 | 7,381 | |||||
Subordinated notes | $ | 19,000 | — | |||||
There was no interest paid on the subordinated notes to related parties totaled because the first interest payment is not due until June of 2021.
12. | STOCK-BASED COMPENSATION |
On May 14, 2019, the Company’s shareholders approved the LINKBANCORP, Inc. 2019 Equity Incentive Plan (the “Plan”).The plan authorizes the issuance or delivery to participants of up to 450,000 share of LINK BANCORP common stock pursuant to grants of incentive and
non-statutory
stock options. The plan is administered by the members of LINKBANCORP’s Compensation Committee. Unless the Committee specifies a different vesting schedule, awards under the Plan shall be granted with a vesting rate not exceeding 20 percent per year. Vesting may be accelerated under certain conditions or at the discretion of the Committee at any time. Employees and directors of LINKBANCORP or its subsidiaries are eligible to receive awards under the plan, except that nonemployees may not be granted incentive stock options. Stock options are either “incentive” stock options or “nonqualified” stock options. Incentive stock options have certain tax advantages and must comply with the requirements of Section 422 of the Internal Revenue Code.Number of Stock Options | Weighted- Average Exercise Price | Weighted- Average Remaining Contractual Term | Aggregate Intrinsic Value | |||||||||||||
Outstanding, December 31, 2019 | 394,500 | $ | 10.00 | $ | 9.50 | $ | ||||||||||
Granted | 21,500 | 11.77 | 9.80 | |||||||||||||
Expired/terminated | 19,500 | 10.00 | — | |||||||||||||
Exercised | 500 | 10.00 | — | |||||||||||||
Outstanding, December 31, 2020 | 396,000 | $ | — | $ | 8.60 | $ | 471,250 | |||||||||
Exercisable at year-end | 75,400 | $ | — | $ | 8.60 | $ | 94,250 | |||||||||
The exercise prices for options outstanding as of December 31, 2020 ranged from $10.00 to $12.00.
F-161
LINKBANCORP, INC. AND SUBSIDIARY
NOTES TO THE CONSOLIDATED FINANCIAL STATEMENTS (Continued)
12. | STOCK-BASED COMPENSATION (Continued) |
The Company determined the expected life of the stock options using a simplified method approach allowed for plain-vanilla share options. The risk-free interest rate is based on the U.S. treasury yield curve in effect as of the grant date. Expected volatility was determined using the calculated value method of an option pricing model that substitutes the historical volatility of an appropriate industry/sector index for the expected volatility.
December 31, | ||||||||
2020 | 2019 | |||||||
Weighted average fair value of options granted | $ | 0.25 | $ | 1.15 | ||||
Dividend yield | 0.00 | % | 1.00 | % | ||||
Expected volatility | 4.36 | % | 10.00 | % | ||||
Risk-free interest rate | 0.62 | % | 1.85 | % | ||||
Expected life (in years) | 6.00 | 6.00 | ||||||
Assumed forfeiture rate | 8.00 | % | 0.00 | % | ||||
Information regarding stock-based compensation for the years ended December 31, 2020 and 2019, is set forth below:
December 31, | ||||||||
2020 | 2019 | |||||||
Stock-based compensation expense recognized | $ | 87,000 | $ | 31,000 | ||||
Number of unvested stock options | 320,600 | 394,500 | ||||||
Fair value of unvested stock options | $ | 351,000 | $ | 451,000 | ||||
Amount remaining to be recognized as expense | $ | 286,000 | $ | 420,000 | ||||
The remaining amount of $286,000 will be recognized ratably as expense through December 31, 2025.
13. | FINANCIAL INSTRUMENTS WITH OFF-BALANCE SHEET RISK |
The Company is a party to financial instruments with
off-balance
sheet risk in the normal course of business to meet the financing needs of its customers. These financial instruments include commitments to extend credit. Such commitments involve, to varying degrees, elements of credit and interest rate risk in excess of the amount recognized in the consolidated balance sheets.The Company’s exposure to credit loss in the event of nonperformance by the other party to the financial instrument for commitments to extend credit is represented by the contractual amount of those instruments. The Company uses the same credit policies in making and monitoring commitments and conditional obligations as it does for
on-balance
sheet instruments. As of December 31, 2020, and 2019, The Company has a reserve related to credit losses foroff-balance
sheet instruments totaling $25,000, which is included in other liabilities.At December 31, 2020 and 2019, the following financial instruments were outstanding whose contract amounts represent credit risk:
December 31, | ||||||||
(In Thousands) | 2020 | 2019 | ||||||
Unfunded commitments under lines of credit: | ||||||||
Home equity loans | $ | 17,483 | $ | 9,138 | ||||
Commercial real estate, construction, and land development | 10,252 | 24,261 | ||||||
Commercial and industrial | 33,471 | 15,051 | ||||||
Other | 3,937 | 5,682 | ||||||
Total | $ | 65,143 | $ | 54,132 | ||||
F-162
LINKBANCORP, INC. AND SUBSIDIARY
NOTES TO THE CONSOLIDATED FINANCIAL STATEMENTS (Continued)
13. | FINANCIAL INSTRUMENTS WITH OFF-BALANCE SHEET RISK (Continued) |
Commitments to extend credit are agreements to lend to a customer as long as there is no violation of any condition established in the contract. Since many of the commitments are expected to expire without being drawn upon, the total commitment amounts do not necessarily represent future cash requirements. Commitments generally have fixed expiration dates or other termination clauses and may require payment of a fee. The Company evaluates each customer’s credit worthiness on abasis. The amount of collateral obtained, if deemed necessary by the Company upon extension of credit, is based on management’s credit evaluation. Collateral held varies but may include personal or commercial real estate, accounts receivable, inventory, and equipment.
case-by-case
14. | CONCENTRATION OF CREDIT RISK |
The Company grants commercial, residential and consumer loans to customers primarily located in the South Central and Greater Delaware Valley of Pennsylvania. The concentration of credit by type of loan is set forth in Note 3. The debtors’ ability to honor their contracts is influenced by the region’s economy.
There are numerous risks associated with commercial loans that could impact the borrower’s ability to repay on a timely basis. They include but are not limited to, the owner’s business expertise, changes in local economies, competition, government regulation, and the general financial stability of the borrowing entity.
The Company attempts to mitigate these risks by making an analysis of the borrower’s business and industry history, its financial position, as well as that of the business owner. The Company will also require the borrower to provide financial information on the operations of the business periodically over the life of the loan. In addition, most commercial loans are secured by assets of the business or those of the business owner, which can be liquidated if the borrower defaults, along with the personal surety of the business owner.
From time to time, the Company will maintain balances with its correspondent banks that exceed the $250,000 federally insured deposit limits. Management routinely evaluates the credit worthiness of these correspondent banks and does not feel they pose significant risk to the Company.
15. | LEASE COMMITMENTS AND CONTINGENCIES |
The Company leases its administration and operating facility and two branches under lease agreements expiring in October 2029. As additional rent, The Company is responsible for its proportionate share of operating expenses, including real estate taxes, insurance, utilities, and maintenance.
The following table presents the undiscounted cash flows due related to operating leases as of December 31, 2020:
(In Thousands) | Amount | |||
2021 | $ | 369 | ||
2022 | 254 | |||
2023 | 257 | |||
2024 | 131 | |||
2025 | 138 | |||
2026 and thereafter | 527 | |||
Total lease liabilities | $ | 1,676 | ||
Total rent expense was $463,000 and $390,000 for year ended December 31, 2020 and, 2019, respectively.
F-163
LINKBANCORP, INC. AND SUBSIDIARY
NOTES TO THE CONSOLIDATED FINANCIAL STATEMENTS (Continued)
16. | EMPLOYEE BENEFITS |
The Company has a 401(k) Plan for its eligible employees. The Company contributed a match of $125,000 and $98,000 to the Plan during the years ended December 31, 2020 and December 31, 2019, respectively.
17. | REGULATORY CAPITAL REQUIREMENTS |
The Company is subject to various regulatory capital requirements administered by the Federal Deposit Insurance Corporation and the Pennsylvania Department of Banking and Securities. Failure to meet minimum capital requirements can initiate certain mandatory, and possible additional discretionary, actions by regulators that, if undertaken, could have a direct material effect on the Company’s consolidated financial statements. Under capital adequacy guidelines and the regulatory framework for prompt corrective action, the Company must meet specific capital guidelines that involve quantitative measures of the Company’s assets, liabilities, and certain
off-balance
sheet items as calculated under regulatory accounting practices. The Company’s capital amounts and classification are also subject to qualitative judgments by the regulators about components, risk- weightings, and other factors.The Bank and Company are subject to regulatory capital requirements administered by banking agencies. Capital adequacy guidelines and prompt corrective action regulations involve quantitative measures of assets, liabilities, and certain
off-balance-sheet
items calculated under regulatory accounting practices. Capital amounts and classifications are also subject to qualitative judgments by regulators about components, risk weightings, and other factors and the regulators can lower classifications in certain cases. Failure to meet various capital requirements can initiate regulatory action that could have a direct material effect on the financial statements. As of December 31, 2020, the Bank and Company have met all capital adequacy requirements to which they are subject.The prompt corrective action regulations provide five classifications, including well capitalized, adequately capitalized, under-capitalized, significantly undercapitalized, and critically undercapitalized, although these terms are not used to represent overall financial condition. If an institution is adequately capitalized, regulatory approval is required before the institution may accept brokered deposits. If an institution is undercapitalized, capital distributions are limited, as is asset growth and expansion, and plans for capital restoration are required.
The capital conservation buffer is designed to absorb losses during periods of economic stress. Banking institutions with a ratio of Common Equity Tier 1 capital to risk-weighted assets above the minimum but below the conservation buffer (or below the combined capital conservation buffer and countercyclical capital buffer, when the latter is applied) will face constraints on dividends, equity repurchases and compensation based on the amount of the shortfall.
In accordance with the PADOBS approval referenced in Note 1, the Bank must maintain increased minimum capital ratios summarized in Note 1. In addition to the PADOBS approval requires that during the first three years after the acquisition, the Tier 1 Leverage Ratio not fall below 8% during any quarter. The Bank’s capital amounts and ratios are presented in the table (dollars in thousands):
F-164
LINKBANCORP, INC. AND SUBSIDIARY
NOTES TO THE CONSOLIDATED FINANCIAL STATEMENTS (Continued)
17. | REGULATORY CAPITAL REQUIREMENTS (Continued) |
The following tables present actual and required capital ratios as of December 31, 2020 and 2019, under the Basel III Capital Rules. Capital levels required to be considered well capitalized are based upon prompt corrective action regulations, as amended to reflect the changes under the Basel III Capital Rules:
December 31, | ||||||||||||||||
2020 | 2019 | |||||||||||||||
(In Thousands) | Amount | Ratio | Amount | Ratio | ||||||||||||
Total capital | ||||||||||||||||
(to risk-weighted assets) | ||||||||||||||||
Actual | $ | 48,810 | 15.86 | % | $ | 31,691 | 18.33 | % | ||||||||
For capital adequacy purposes | 24,624 | 8.00 | 13,833 | 8.00 | ||||||||||||
To be well capitalized | 30,780 | 10.00 | 17,291 | 10.00 | ||||||||||||
Tier 1 capital | ||||||||||||||||
(to risk-weighted assets) | ||||||||||||||||
Actual | $ | 44,958 | 14.61 | % | $ | 29,977 | 17.34 | % | ||||||||
For capital adequacy purposes | 18,468 | 6.00 | 10,374 | 6.00 | ||||||||||||
To be well capitalized | 24,624 | 8.00 | 13,833 | 8.00 | ||||||||||||
Common equity | ||||||||||||||||
(to risk-weighted assets) | ||||||||||||||||
Actual | $ | 44,958 | 14.61 | % | $ | 29,977 | 17.34 | % | ||||||||
For capital adequacy purposes | 18,468 | 4.50 | 7,781 | 4.50 | ||||||||||||
To be well capitalized | 24,624 | 6.50 | 10,374 | 6.50 | ||||||||||||
Tier 1 capital | ||||||||||||||||
(to average assets) | ||||||||||||||||
Actual | $ | 44,958 | 12.84 | % | $ | 29,977 | 14.05 | % | ||||||||
For capital adequacy purposes | 14,006 | 4.00 | 8,531 | 4.00 | ||||||||||||
To be well capitalized | 17,508 | 5.00 | 10,664 | 5.00 | ||||||||||||
Federal and state banking regulations place certain restrictions on dividends paid by the Bank. The Pennsylvania Banking Code provides that cash dividends may be declared and paid out of accumulated net earnings. In addition, dividends paid by the Bank would be prohibited if the effect thereof would cause the Bank’s capital to be reduced below applicable minimum capital requirements. Loans or advances by the Bank to the Company are limited to 10 percent of the Bank’s capital stock and surplus and must have collateral securing the loans or advances. Because the Bank is currently in an accumulated deficit position, dividends cannot be paid at this time.
Federal Reserve Cash Requirements
Effective March 26, 2020, The Federal Reserve Board set the Bank’s reserve requirements ratios to zero percent. As a result, the Bank is no longer required to maintain an average cash reserve balance in vault cash or with the Federal Reserve Bank. The required minimum balance was $5.3 million at December 31, 2019.
Loans
Federal law prevents the Company from borrowing from the Bank unless the loans are secured by specific collateral. Further, such secured loans are limited in amount to 10 percent of the Bank’s common stock and capital surplus.
F-165
LINKBANCORP, INC. AND SUBSIDIARY
NOTES TO THE CONSOLIDATED FINANCIAL STATEMENTS (Continued)
18. | FAIR VALUE MEASUREMENTS |
Management uses its best judgment in estimating the fair value of the Company’s financial instruments; however, there are inherent weaknesses in an estimation technique. Therefore, for substantially all financial instruments, the fair value estimates herein are not necessarily indicative of the amounts The Company could have realized in a sales transaction on the dates indicated. The estimated fair value amounts have been measured as of their respective year-ends and have not been
re-evaluated
or updated for purposes of these financial statements subsequent to those respective dates. As such, the estimated fair values of these financial instruments subsequent to the respective reporting dates may be different than the amounts reported at eachyear-end.
The Company uses fair value measurements to record fair value adjustments to certain assets and liabilities and to determine fair value disclosures. In accordance with the fair value measurements accounting guidance (FASB ASC 820,), the fair value of a financial instrument is the price that would be received to sell an asset or paid to transfer a liability in an orderly transaction between market participants at the measurement date. Fair value is best determined based upon quoted market prices. However, in many instances, there are no quoted market prices for the Company’s various financial instruments. In cases where quoted market prices are not available, fair values are based on estimates using present value or other valuation techniques. Those techniques are significantly affected by the assumptions used, including the discount rate and estimates of future cash flows. Accordingly, the fair value estimates may not be realized in an immediate settlement of the instrument.
Fair Value Measurements
The Company uses a consistent definition of fair value, which focuses on exit price in an orderly transaction (that is, not a forced liquidation or distressed sale) between market participants at the measurement date under current market conditions. If there has been a significant decrease in the volume and level of activity for the asset or liability, a change in valuation technique or the use of multiple valuation techniques may be appropriate. In such instances, determining the price at which willing market participants would transact at the measurement date under current market conditions depends on the facts and circumstances and requires the use of significant judgment. The fair value guidance establishes a fair value hierarchy that prioritizes the inputs to valuation methods used to measure fair value. The hierarchy gives the highest priority to unadjusted quoted prices in active markets for identical assets or liabilities (Level 1 measurements) and the lowest priority to unobservable inputs (Level 3 measurements). The three levels of the fair value hierarchy are as follows:
The following disclosures show the hierarchal disclosure framework associated with the level of pricing observations utilized in measuring assets and liabilities at fair value. The three broad levels of pricing are as follows:
| Level I: | Quoted prices are available in active markets for identical assets or liabilities as of the reported date. | |
| Level II: | Pricing inputs are other than the quoted prices in active markets, which are either directly or indirectly observable as of the reported date. The nature of these assets and liabilities includes items for which quoted prices are available but traded less frequently and items that are fair- valued using other financial instruments, the parameters of which can be directly observed. | |
| Level III: | Valuations derived from valuation techniques in which one or more significant inputs or significant value drivers are unobservable. | |
This hierarchy requires the use of observable market data when available.
F-166
LINKBANCORP, INC. AND SUBSIDIARY
NOTES TO THE CONSOLIDATED FINANCIAL STATEMENTS (Continued)
18. | FAIR VALUE MEASUREMENTS (Continued) |
The estimated fair values of the Company’s financial instruments that are not required to be measured or reported at fair value are as follows:
At December 31, 2020 | At December 31, 2019 | |||||||||||||||
(In Thousands) | Carrying Amount | Fair Value | Carrying Amount | Fair Value | ||||||||||||
Financial assets: | ||||||||||||||||
Cash and cash equivalents (Level 1) | $ | 9,002 | $ | 9,002 | $ | 11,210 | $ | 11,210 | ||||||||
Loans (Level 3) | 323,214 | 324,160 | 166,793 | 168,487 | ||||||||||||
Federal Home Loan Bank stock (Level 1) | 2,615 | 2,615 | 43 | 43 | ||||||||||||
Financial liabilities: | ||||||||||||||||
Deposits (Level 3) | 283,054 | 282,800 | 188,673 | 188,136 | ||||||||||||
Short-term borrowings (Level 1) | 41,667 | 41,667 | 6,914 | 6,914 | ||||||||||||
Long-term borrowings (Level 3) | 37,315 | 37,738 | — | — | ||||||||||||
Subordinated Notes (Level 3) | 20,000 | 20,256 | — | — | ||||||||||||
Off-balance-sheet financial instruments (Level 3) | — | — | — | — | ||||||||||||
The following tables present the assets reported on the Consolidated Balance Sheet at their fair value on a recurring basis as of December 31, 2020 and 2019, by level within the fair value hierarchy. Financial assets and liabilities are classified in their entirety based on the lowest level of input that is significant to the fair value measurement.
The Company’sinvestment securities are reported at fair value. These securities are valued by an independent third party. The valuations are based on market data. They utilize evaluated pricing models that vary by asset and incorporate available trade, bid and other market information. For securities that do not trade on a daily basis, their evaluated pricing applications apply available information such as benchmarking and matrix pricing. The market inputs normally sought in the evaluation of securities include benchmark yields, reported trades, broker/dealer quotes (only obtained from market makers or broker/dealers recognized as market participants), issuer spreads,
available-for-sale
two-sided
markets, benchmark securities, bid, offers and reference data. For certain securities additional inputs may be used or some market inputs may not be applicable. Inputs are prioritized differently on any given day based on market conditions.December 31, 2020 | ||||||||||||||||
(In Thousands) | Level I | Level II | Level III | Total | ||||||||||||
Assets: | ||||||||||||||||
U.S. treasury securities | $ | — | $ | 74,999 | $ | — | $ | 74,999 | ||||||||
Mortgage backed securities | — | 4,206 | — | 4,206 | ||||||||||||
Total | $ | — | $ | 79,205 | $ | — | $ | 79,205 | ||||||||
December 31, 2019 | ||||||||||||||||
(In Thousands) | Level I | Level II | Level III | Total | ||||||||||||
Assets: | ||||||||||||||||
U.S. treasury securities | $ | — | $ | 46,975 | $ | — | $ | 46,975 | ||||||||
Total | $ | — | $ | 46,975 | $ | — | $ | 46,975 | ||||||||
F-167
LINKBANCORP, INC. AND SUBSIDIARY
NOTES TO THE CONSOLIDATED FINANCIAL STATEMENTS (Continued)
18. | FAIR VALUE MEASUREMENTS (Continued) |
For financial assets measured at fair value on a nonrecurring basis, the fair value measurements by level within the fair value hierarchy used at December 31, 2020 and 2019, are as follows:
December 31, 2020 | ||||||||||||||||
(In Thousands) | Level I | Level II | Level III | Total | ||||||||||||
Impaired loans | $ | — | $ | — | $ | 988 | $ | 988 | ||||||||
December 31, 2019 | ||||||||||||||||
(In Thousands) | Level I | Level II | Level III | Total | ||||||||||||
Impaired loans | $ | — | $ | — | $ | 1,003 | $ | 1,003 | ||||||||
The following tables provide information describing the valuation processes used to determine nonrecurring fair value measurements categorized within Level III of the fair value hierarchy:
December 31, 2020 | ||||||||||||
| Quantitative Information About Level III Fair Value Measurements | ||||||||||||
(In Thousands) | Fair Value | Valuation Techniques | Unobservable Input | Range (Weighted Average) | ||||||||
Impaired loans | $ | 988 | Appraisal of collateral (1) | Liquidation expenses | 10 | % | ||||||
December 31, 2019 | ||||||||||||
| Quantitative Information About Level III Fair Value Measurements | ||||||||||||
(In Thousands) | Fair Value | Valuation Techniques | Unobservable Input | Range (Weighted Average) | ||||||||
Impaired loans | $ | 1,003 | Appraisal of collateral (1) | Liquidation expenses | 10 | % | ||||||
(1) | Fair value is generally determined through independent appraisals of the underlying collateral, which include various Level III inputs that are not identifiable. |
Appraisals may be adjusted by management for qualitative factors, such as economic conditions, aging, and/or estimated liquidation expenses incurred when selling the collateral. The range and weighted average of appraisal adjustments and liquidation expenses are presented as a percentage of the appraisal.
19. | REVENUE RECOGNITION |
The Company adopted Topic 606 using the modified retrospective method applied to all contracts not completed as of the date of incorporation on April 6, 2018. Results for reporting periods beginning after April 6, 2018 are presented under Topic 606.
The revenue standard’s core principle is built on the contract between a vendor and a customer for the provision of goods and services. It attempts to depict the exchange of rights and obligations between the parties in the pattern of revenue recognition based on the consideration to which the vendor is entitled.
Management determined that revenue derived from financial instruments, including revenue from loans, along with
non-interest
income resulting from commitment and other loan related fees as well as income from bank owned life insurance are not within the scope of Topic 606. As a result, no changes were made during the period related to these sources of revenue.Topic 606 is applicable to
non-interest
income streams such as service charges on deposits and othernon-
interest income. Noninterest revenue streamsin-scope
of Topic 606 are discussed below.F-168
LINKBANCORP, INC. AND SUBSIDIARY
NOTES TO THE CONSOLIDATED FINANCIAL STATEMENTS (Continued)
19. | REVENUE RECOGNITION (Continued) |
Service Charges and Activity Fees on Deposits
Service charges on deposit accounts consist of monthly ATM Income, Wire Transfer Fees,
Non-
Sufficient Funds Charges, and other Deposit related fees. The Company’s performance obligation for monthly service fees is generally satisfied, and the related revenue recognized, over the period in which the service is provided. Check orders and other deposit account related fees are largely transactional based, and, therefore, the Company’s performance obligation is satisfied, and related revenue recognized, at a point in time. Payment for service charges on deposit accounts is primarily received immediately or in the following month through a direct charge to customers’ accounts. The Company’s performance obligation for wire transfers and returned deposit fees, are largely satisfied, and related revenue recognized, when the services are rendered or upon completion. Payment is typically received immediately or in the following month.Fees on loan related activity
Fees from loan related activity is comprised mostly of upfront fees recognized on Assumable Rate Conversion Agreements, where Bank originates, a floating rate loan. The borrower concurrently signs an addendum to the promissory note with a third party permitting the borrower to pay a fixed rate of interest. The Bank through a master servicing agreement services the Assumable Rate Conversion between the third party and borrower.
Other
Other fees are primarily comprised of Remote/Mobile Deposit Fees and other service charges. Other noninterest income consists primarily of other nonrecurring revenue which is not recorded in the categories listed above. This revenue is miscellaneous in nature and is recognized as income upon receipt.
The following presents noninterest income, segregated by revenue streams
in-scope
andout-of-
scope of Topic 606, for the years ended December 31, 2020 and 2019.For the Year Ended December 31, | ||||||||
(In Thousands) | 2020 | 2019 | ||||||
Non-interest incomein-scope of Topic 606 | ||||||||
Service charges and activity fees on deposits | $ | 74 | $ | 38 | ||||
Fees on loan related activity | 194 | 167 | ||||||
Other | 130 | 49 | ||||||
Non-interest income(in-scope of Topic 606) | 204 | 254 | ||||||
Non-interest income(out-of-scope | 251 | 139 | ||||||
Total non-interest income | $ | 649 | $ | 393 | ||||
Contract Balances
A contract asset balance occurs when an entity performs a service for a customer before the customer pays consideration (resulting in a contract receivable) or before payment is due (resulting in a contract asset). A contract liability balance is an entity’s obligation to transfer a service to a customer for which the entity has already received payment (or payment is due) from the customer. The Company’s noninterest revenue streams are largely based on transactional activity. Consideration is often received immediately or shortly
F-169
LINKBANCORP, INC. AND SUBSIDIARY
NOTES TO THE CONSOLIDATED FINANCIAL STATEMENTS (Continued)
19. | REVENUE RECOGNITION (Continued) |
Contract Balances (Continued)
after the Company satisfies its performance obligation and revenue is recognized. The Company does not typically enter into long-term revenue contracts with customers, and therefore, does not experience significant contract balances. As of December 31, 2020, and December 31, 2019, the Company did not have any contract balances.
Contract Acquisition Costs
In connection with the adoption of Topic 606, an entity is required to capitalize, and subsequently amortize into expense, certain incremental costs of obtaining a contract with a customer if these costs are expected to be recovered. The incremental costs of obtaining a contract are those costs that an entity incurs to obtain a contract with a customer that it would not have incurred if the contract had not been obtained (for example, sales commission). The Company utilizes the practical expedient which allows entities to immediately expense contract acquisition costs when the asset that would have resulted from capitalizing these costs would have been amortized in one year or less. Upon adoption of Topic 606, the Bank did not capitalize any contract acquisition cost.
20. | PROPOSED MERGER WITH GNB FINANCIAL, INC. |
On December 10, 2020, LINKBANCORP, Inc. (LINK) and its wholly owned subsidiary, LINKBANK (Bank), and GNB Financial Corp, Inc. (GNB), and its wholly owned subsidiary, The Gratz Bank (“Gratz Bank”) entered into an Agreement and Plan of Merger (the “Merger Agreement”) pursuant to which GNB will merge with and into LINK, with the LINK as the surviving corporation. Concurrent with the merger, it is expected that the Bank will merge with and into Gratz Bank, with the Gratz Bank as the surviving institution.
Under the agreement, GNB shareholders will have the opportunity to elect to receive $87.68 per share in cash or 7.3064 of LINK common shares for each share they own. The agreement provides for proration procedures intended to ensure that, in the aggregate, at least 80% of the GNB common shares outstanding will be exchanged for LINK common stock. The transaction is expected to be a
tax-free
exchange to the extent shareholders of GNB receive stock in exchange for their shares. The transaction is subject to customary closing conditions, including the receipt of regulatory approvals and approval by the shareholders of both companies. The merger is currently expected to be completed in the third quarter of 2021. Each of the directors of LINK and GNB have agreed to vote their shares in favor of the approval of the Merger Agreement at the shareholders’ meeting to be held to vote on the proposed transaction. The board of the combined company will be evenly split between the two institutions and will be chaired by the current chairman of GNB Financial Services.21. | SUBSEQUENT EVENTS |
The Company has evaluated events and transactions occurring subsequent to the balance sheet date of March 18, 2021, for items that should potentially be recognized or disclosed in these consolidated financial statements. The evaluation was conducted through March 18, 2021, the date these consolidated financial statements were available to be issued, and no subsequent events have occurred requiring accrual or disclosure.
F-170
Until , 2022, all dealers that buy, sell or trade our common stock, whether or not participating in this offering, may be required to deliver a prospectus. This is in addition to the dealers’ obligation to deliver a prospectus when acting as underwriter and with respect to their unsold allotments or subscriptions.
4,575,000 Shares
COMMON STOCK
PROSPECTUS
| |
, 2022
Neither we nor the underwriters have authorized anyone to provide information different from that contained in this prospectus. When you make a decision about whether to invest in our common stock, you should not rely upon any information other than the information in this prospectus. Neither the delivery of this prospectus nor the sale of our common stock means that information contained in this prospectus is correct after the date of this prospectus. This prospectus is not an offer to sell or solicitation of an offer to buy these shares of common stock in any circumstances under which the offer or solicitation is unlawful.
PART II: | INFORMATION NOT REQUIRED IN PROSPECTUS |
Item 13. | Other Expenses of Issuance and Distribution |
The following table sets forth all costs and expenses, other than underwriting discounts and commissions, in connection with the sale of shares of our common stock being registered, all of which will be paid by us. All amounts shown are estimates, except for the SEC registration fee, the FINRA filing fee and the NASDAQ listing fee.
SEC registration fee | $ | 4,634 | ||
NASDAQ listing fee | 50,000 | |||
FINRA filing fee | 7,998 | |||
Printing fees and expenses | 185,000 | |||
Legal fees and expenses | 400,000 | |||
Accounting fees and expenses | 72,500 | |||
Transfer agent fees and expenses | 5,500 | |||
Miscellaneous | 249,042 | |||
Total | $ | 974,674 | ||
Item 14. | Indemnification of Directors and Officers |
LINKBANCORP, Inc. (“LINKBANCORP”) is a Pennsylvania corporation. Sections 1741-1743 of the Pennsylvania Business Corporation Law of 1988 (“BCL”), provide that a business corporation may indemnify directors and officers against liabilities they may incur in such capacities provided certain standards are met, including good faith and the belief that the particular action is in the best interests of the corporation. In general, this power to indemnify does not exist in the case of actions against a director or officer by or in the right of the corporation if the person entitled to indemnification shall have been adjudged to be liable to the corporation unless and only to the extent a court determines that the person is fairly and reasonably entitled to indemnification. A corporation is required to indemnify directors and officers against expenses they may incur in defending actions against them in such capacities if they are successful on the merits or otherwise in the defense of such actions. Section 1746 of the BCL provides that the foregoing provisions shall not be deemed exclusive of any other rights to which a person seeking indemnification may be entitled under, among other things, any by-law provision, provided that no indemnification may be made in any case where the act or failure or act giving rise to the claim for indemnification is determined by a court to have constituted willful misconduct or recklessness. Section 1747 of the BCL authorizes a corporation to purchase insurance for directors and other representatives. The foregoing statement is subject to the detailed provisions of Section 1741-1850 of the BCL.
The bylaws of LINKBANCORP provide indemnification or reimbursement for reasonable expenses actually incurred by directors or officers. However, indemnification or reimbursement shall not be provided to a director or officer for willful misconduct or recklessness.
LINKBANCORP maintains, on behalf of its directors and officers, insurance protection against certain liabilities arising out of the discharge of their duties, as well as insurance covering LINKBANCORP for indemnification payments made to its directors and officers for certain liabilities. The premiums for such insurance are paid by LINKBANCORP.
Item 15. | Recent Sales of Unregistered Securities |
The following sets forth information regarding unregistered securities that were sold by LINKBANCORP within the past three years.
| (1) | In the past three years, LINKBANCORP has granted 133,500 stock options pursuant to its former 2019 Equity Incentive Plan to LINKBANCORP’s or its subsidiaries’ officers and directors, at exercise prices |
II-1
| ranging from $10.00 to $14.50 per share. No underwriter or placement agent was involved in the issuance or sale of any of these securities, and no underwriting discounts or commissions were paid. The issuance and sale of the securities described above were made in reliance upon exemptions from registration requirements under Section 4(a)(2) of the Securities Act and pursuant to Rule 701 promulgated under the Securities Act as a transaction by an issuer not involving any public offering and pursuant to benefit plans and contracts relating to compensation. |
| (2) | In the past three years, LINKBANCORP has issued and sold to LINKBANCORP’s employees and directors or its subsidiaries’ officers and directors, an aggregate of 26,300 shares of common stock upon the exercise of options under its former 2019 Equity Incentive Plan at an exercise price of $10.00 per share, for an aggregate exercise price of $263,000. The issuance and sale of the securities described above were made in reliance upon exemptions from registration requirements under Section 4(a)(2) of the Securities Act and pursuant to Rule 701 promulgated under the Securities Act as a transaction by an issuer not involving any public offering and pursuant to benefit plans and contracts relating to compensation. |
| (3) | On April 8, 2022, LINKBANCORP completed the issuance of $20.0 million in aggregate principal amount of fixed-to-floating rate subordinated notes due 2032 to certain institutional accredited investors. No underwriter or placement agent was involved in the issuance or sale of any of the common stock, and no underwriting discounts or commissions were paid. The subordinated notes were issued under an exemption from registration pursuant to Section 4(a)(2) of the Securities Act and Rule 506 of Regulation D promulgated thereunder as a transaction by an issuer not involving any public offering. |
| (4) | On September 30, 2020, LINKBANCORP completed the issuance of $20.0 million in aggregate principal amount of fixed-to-floating rate subordinated notes due 2030 to certain institutional accredited investors. No underwriter or placement agent was involved in the issuance or sale of any of the common stock, and no underwriting discounts or commissions were paid. The subordinated notes were issued under an exemption from registration pursuant to Section 4(a)(2) of the Securities Act and Rule 506 of Regulation D promulgated thereunder as a transaction by an issuer not involving any public offering. |
| (5) | On October 20, 2020, LINKBANCORP issued an aggregate of 421,292 shares of common stock, par value $0.01 per share, to accredited investors, at a price of $12.00 per share, for aggregate consideration of approximately $5.0 million. No underwriter or placement agent was involved in the issuance or sale of any of the common stock, and no underwriting discounts or commissions were paid. The common stock was issued under an exemption from registration pursuant to Section 4(a)(2) of the Securities Act and Rule 506 of Regulation D promulgated thereunder as a transaction by an issuer not involving any public offering. |
II-2
Item 16. | Exhibits and Financial Statement Schedules: |
The exhibits and financial statement schedules filed as part of this registration statement are as follows:
(a) | List of Exhibits |
II-3
II-4
Exhibit No. | Description | |
| 101.DEF* | Inline XBRL Taxonomy Extension Definition Linkbase Document | |
| 101.LAB* | Inline XBRL Taxonomy Extension Label Linkbase Document | |
| 101.PRE* | Inline XBRL Taxonomy Extension Presentation Linkbase Document | |
| 104* | Cover Page Interactive Data File (embedded within the Inline XBRL document) | |
| 107* | Filing fee table | |
| * | Filed herewith. |
(b) | Financial Statement Schedules |
No financial statement schedules are filed because the required information is not applicable or is included in the consolidated financial statements or related notes.
Item 17. | Undertakings |
The undersigned registrant hereby undertakes to provide to the underwriters at the closing specified in the underwriting agreement certificates in such denominations and registered in such names as required by the underwriters to permit prompt delivery to each purchaser.
Insofar as indemnification for liabilities arising under the Securities Act may be permitted to directors, officers and controlling persons of the registrant pursuant to the indemnification provisions described herein, or otherwise, the registrant has been advised that in the opinion of the SEC such indemnification is against public policy as expressed in the Securities Act and is, therefore, unenforceable. In the event that a claim for indemnification against such liabilities (other than the payment by the registrant of expenses incurred or paid by a director, officer or controlling person of the registrant in the successful defense of any action, suit or proceeding) is asserted by such director, officer or controlling person in connection with the securities being registered, the registrant will, unless in the opinion of its counsel the matter has been settled by controlling precedent, submit to a court of appropriate jurisdiction the question whether such indemnification by it is against public policy as expressed in the Securities Act and will be governed by the final adjudication of such issue.
The undersigned registrant hereby undertakes that:
(1) For purposes of determining any liability under the Securities Act, the information omitted from the form of prospectus as filed as part of this registration statement in reliance upon Rule 430A and contained in a form of prospectus filed by the registrant pursuant to Rule 424(b)(1) or (4) or 497(h) under the Securities Act shall be deemed to be part of this registration statement as of the time it was declared effective.
(2) For the purpose of determining any liability under the Securities Act, each post-effective amendment that contains a form of prospectus shall be deemed to be a new registration statement relating to the securities offered therein, and the offering of such securities at that time shall be deemed to be the initial bona fide offering thereof.
II-5
SIGNATURES
Pursuant to the requirements of the Securities Act of 1933, the registrant has duly caused this registration statement to be signed on its behalf by the undersigned, thereunto duly authorized in the City of Camp Hill, Commonwealth of Pennsylvania on September 7, 2022.
LINKBANCORP, INC. | ||
| By: | /s/ Andrew Samuel | |
| Andrew Samuel | ||
| Chief Executive Officer | ||
| (Duly Authorized Representative) | ||
POWER OF ATTORNEY
We, the undersigned directors of LINKBANCORP, Inc. (the “Company”), severally constitute and appoint Andrew Samuel with full power of substitution, our true and lawful attorney and agent, to do any and all things and acts in our names in the capacities indicated below which said Andrew Samuel may deem necessary or advisable to enable the Company to comply with the Securities Act of 1933, and any rules, regulations and requirements of the Securities and Exchange Commission, in connection with the registration statement on Form S-1 relating to the offering of the Company common stock, including specifically, but not limited to, power and authority to sign for us or any of us in our names in the capacities indicated below the registration statement and any and all amendments (including post-effective amendments) thereto; and we hereby approve, ratify and confirm all that said Andrew Samuel shall do or cause to be done by virtue hereof.
Pursuant to the requirements of the Securities Act of 1933, this Registration Statement has been signed by the following persons in the capacities and on the dates indicated.
Signatures | Title | Date | ||
/s/ Andrew Samuel Andrew Samuel | Chief Executive Officer and Director (Principal Executive Officer) | September 7, 2022 | ||
/s/ Kristofer Paul Kristofer Paul | Chief Financial Officer (Principal Financial and Accounting Officer) | September 7, 2022 | ||
/s/ Jennifer Delaye Jennifer Delaye | Director | September 7, 2022 | ||
/s/ Anson Flake Anson Flake | Director | September 7, 2022 | ||
/s/ George Parmer George Parmer | Director | September 7, 2022 | ||
/s/ Debra Pierson Debra Pierson | Director | September 7, 2022 | ||
/s/ Diane Poillon Diane Poillon | Director | September 7, 2022 | ||
/s/ William Pommerening William Pommerening | Director | September 7, 2022 | ||
/s/ Brent Smith Brent Smith | Executive Vice President and Director | September 7, 2022 | ||
/s/ Joseph C. Michetti, Jr. Joseph C. Michetti, Jr. | Chairman and Director | September 7, 2022 | ||
/s/ Timothy Allison Timothy Allison | Director | September 7, 2022 | ||
Signatures | Title | Date | ||
/s/ Samuel Kauffman Samuel Kauffman | Director | September 7, 2022 | ||
/s/ Kristen Snyder Kristen Snyder | Director | September 7, 2022 | ||
/s/ Wesley M. Weymers Wesley M. Weymers | Director | September 7, 2022 | ||
/s/ David Koppenhaver David Koppenhaver | Director | September 7, 2022 | ||
/s/ Steven Tressler Steven Tressler | Director | September 7, 2022 | ||
/s/ William Jones William Jones | Director | September 7, 2022 | ||