
PROPRIETARY AND CONFIDENTIAL J.P. Morgan Healthcare Conference January 10, 2022 Empowering Physicians TRANSFORMING HEALTHCARE
2 Forward-Looking Statements This presentation contains forward-looking statements that express the Company’s opinions, expectations, beliefs, plans, objectives, assumptions or projections regarding future events or future results. These forward-looking statements involve a number of risks, uncertainties (some of which are beyond the Company’s control) or other assumptions that may cause actual results or performance to be materially different from those expressed or implied by these forward-looking statements. These risks and uncertainties include, but are not limited to, those factors described in filings with the Securities and Exchange Commission (“SEC”), including those under “Risk Factors” therein. Should one or more of these risks or uncertainties materialize, or should any of the assumptions prove incorrect, actual results may vary in material respects from those projected in these forward-looking statements. Forward-looking statements speak only as of the date made. The Company does not undertake any obligation to update or revise any forward-looking statements, whether as a result of new information, future events or otherwise, except as may be required under applicable securities laws. Use of Non-GAAP Financial Information In order to provide investors with greater insight, promote transparency and allow for a more comprehensive understanding of the information used by management in its financial and operational decision-making, the Company supplements its condensed consolidated financial statements presented on a GAAP basis herein with certain non-GAAP financial information, including: Practice Collections, Care Margin; Platform Contribution; Platform Contribution margin; Adjusted EBITDA; and Adjusted EBITDA margin. Reconciliations of these non-GAAP measures to their most directly comparable GAAP measures are included in the financial schedules in the Appendix of this presentation, as well as in the Company’s quarterly financial press releases and related Form 8-K filings with the SEC. This information can be accessed for free by visiting www.priviahealth.com or www.sec.gov. Management has not reconciled forward-looking non-GAAP measures to its most directly comparable GAAP measure of Operating Income and Net Income. This is because the Company cannot predict with reasonable certainty and without unreasonable efforts the ultimate outcome of certain GAAP components of such reconciliations due to market-related assumptions that are not within our control as well as certain legal or advisory costs, tax costs or other costs that may arise. For these reasons, management is unable to assess the probable significance of the unavailable information, which could materially impact the amount of the future directly comparable GAAP measures. Disclaimer

3 Who is Privia Health? Privia Health is building the leading next generation physician organization and care delivery network Our revolutionary business model is comprised of three interdependent elements: Single TIN Medical Group Risk-Bearing Entity Tech-Enabled Clinical and Performance Operations Platform We partner with all provider types, regardless of affiliation or ownership, in all reimbursement models across all geographies Our value-based care platform has proven success across the risk-bearing spectrum as we accelerate the movement of providers into risk-based arrangements
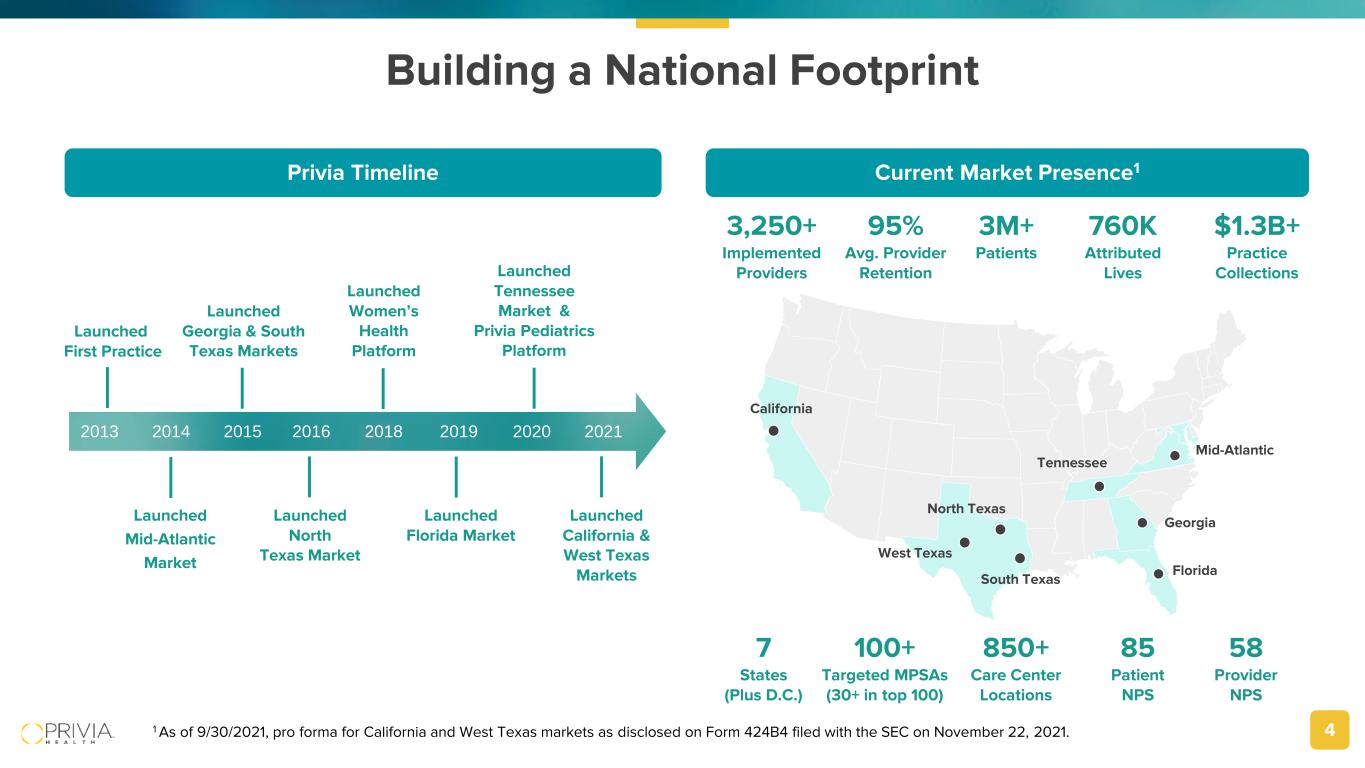
4 Building a National Footprint Privia Timeline Launched Mid-Atlantic Market Launched Women’s Health Platform Launched Tennessee Market & Privia Pediatrics Platform Launched North Texas Market Launched Georgia & South Texas Markets Launched Florida Market Launched First Practice Current Market Presence1 2013 2014 2015 2016 2018 2019 2020 2021 850+ Care Center Locations 100+ Targeted MPSAs (30+ in top 100) 3,250+ Implemented Providers 7 States (Plus D.C.) 1 As of 9/30/2021, pro forma for California and West Texas markets as disclosed on Form 424B4 filed with the SEC on November 22, 2021. Launched California & West Texas Markets Mid-Atlantic Tennessee Georgia Florida North Texas South Texas California West Texas 3M+ Patients $1.3B+ Practice Collections 760K Attributed Lives 95% Avg. Provider Retention 85 Patient NPS 58 Provider NPS
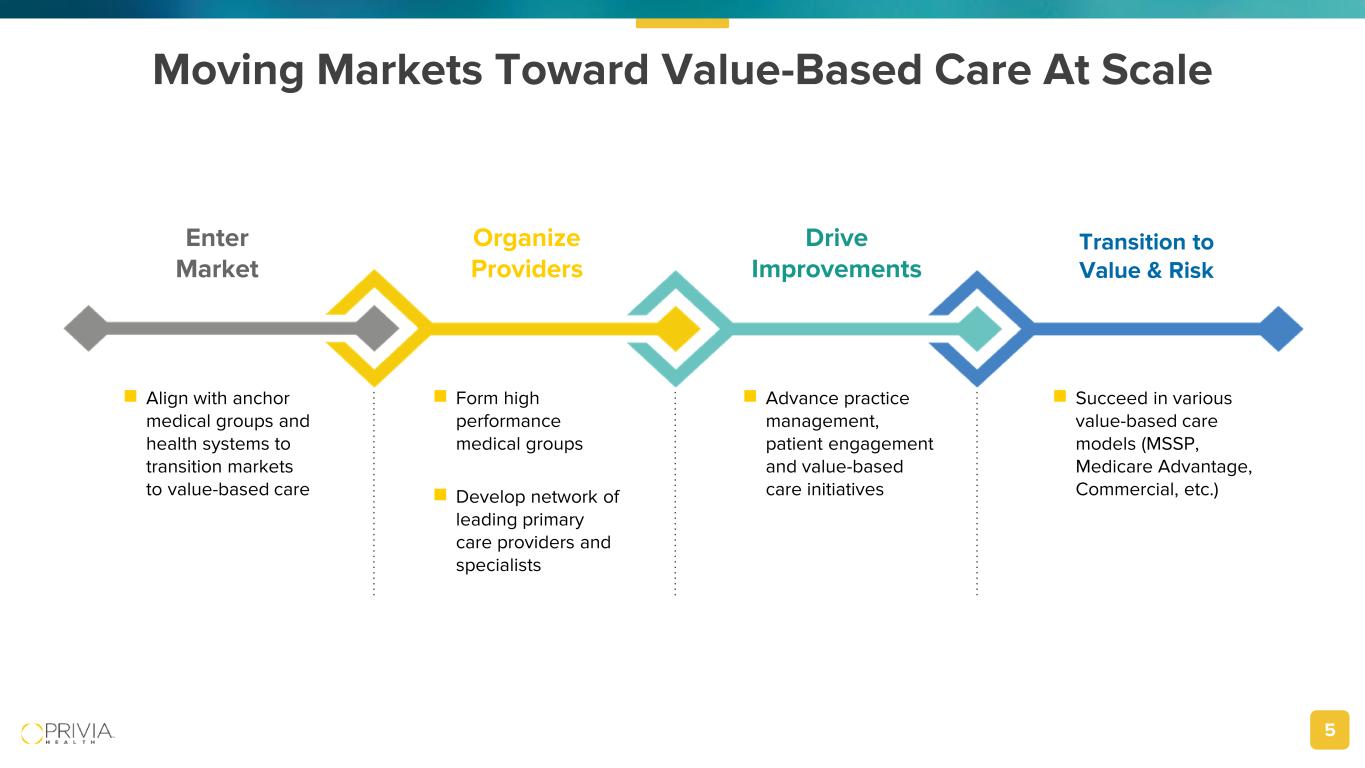
5 Moving Markets Toward Value-Based Care At Scale Enter Market Align with anchor medical groups and health systems to transition markets to value-based care Organize Providers Form high performance medical groups Develop network of leading primary care providers and specialists Drive Improvements Advance practice management, patient engagement and value-based care initiatives Transition to Value & Risk Succeed in various value-based care models (MSSP, Medicare Advantage, Commercial, etc.)
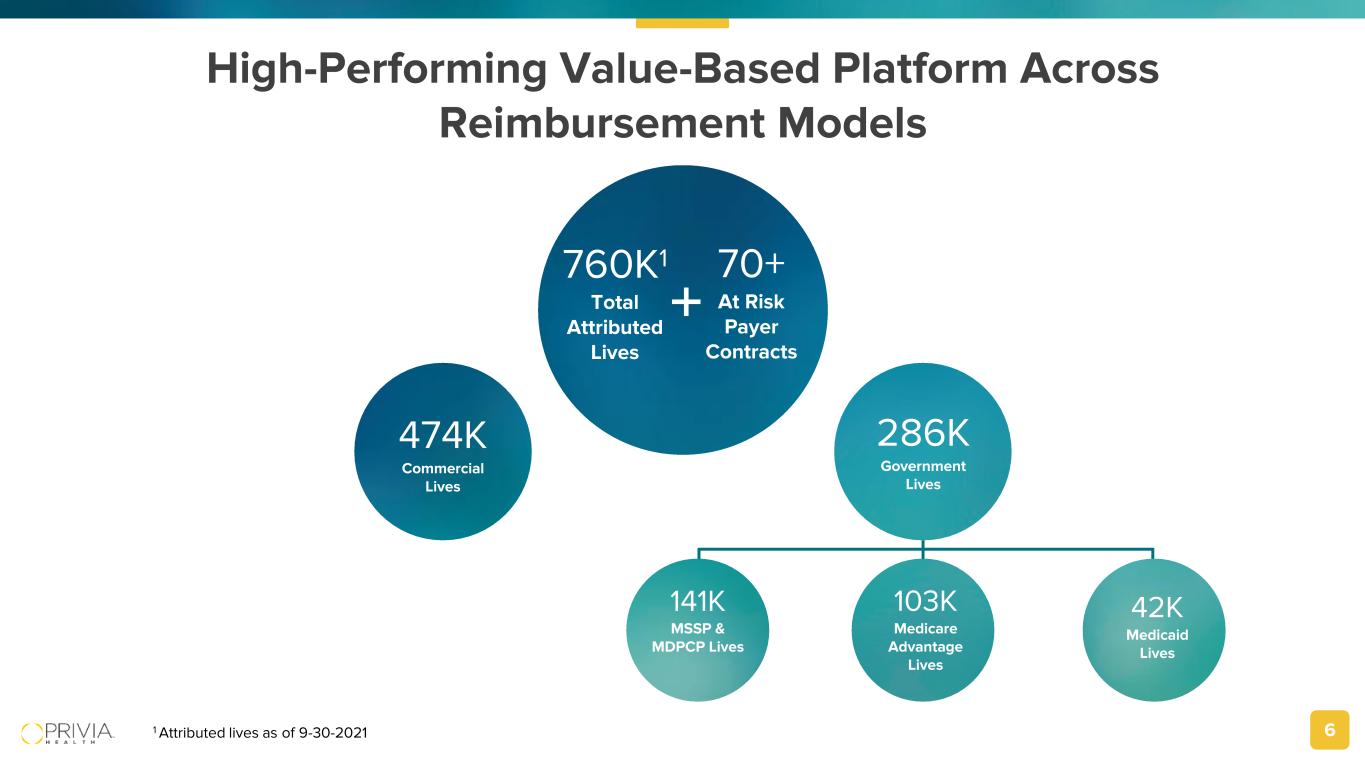
6 High-Performing Value-Based Platform Across Reimbursement Models 70+ At Risk Payer Contracts 760K1 Total Attributed Lives 286K Government Lives 474K Commercial Lives 103K Medicare Advantage Lives 141K MSSP & MDPCP Lives 42K Medicaid Lives 1 Attributed lives as of 9-30-2021

7 Delivering Demonstrable Value to Our Providers Fee-for-Service Rate Lift Expense Savings on EMR / PMS & Group Purchasing Net Realization Rate Improvement Through Robust Revenue Cycle Management Enhanced Provider Productivity & Same- Store Patient Volume Value-Based Care Revenue: Commercial, MSSP, MA Organic Practice Growth through Provider / Specialty Addition Incremental Revenue Opportunities Direct to Consumer Direct to Employer Ancillaries Clinical Research
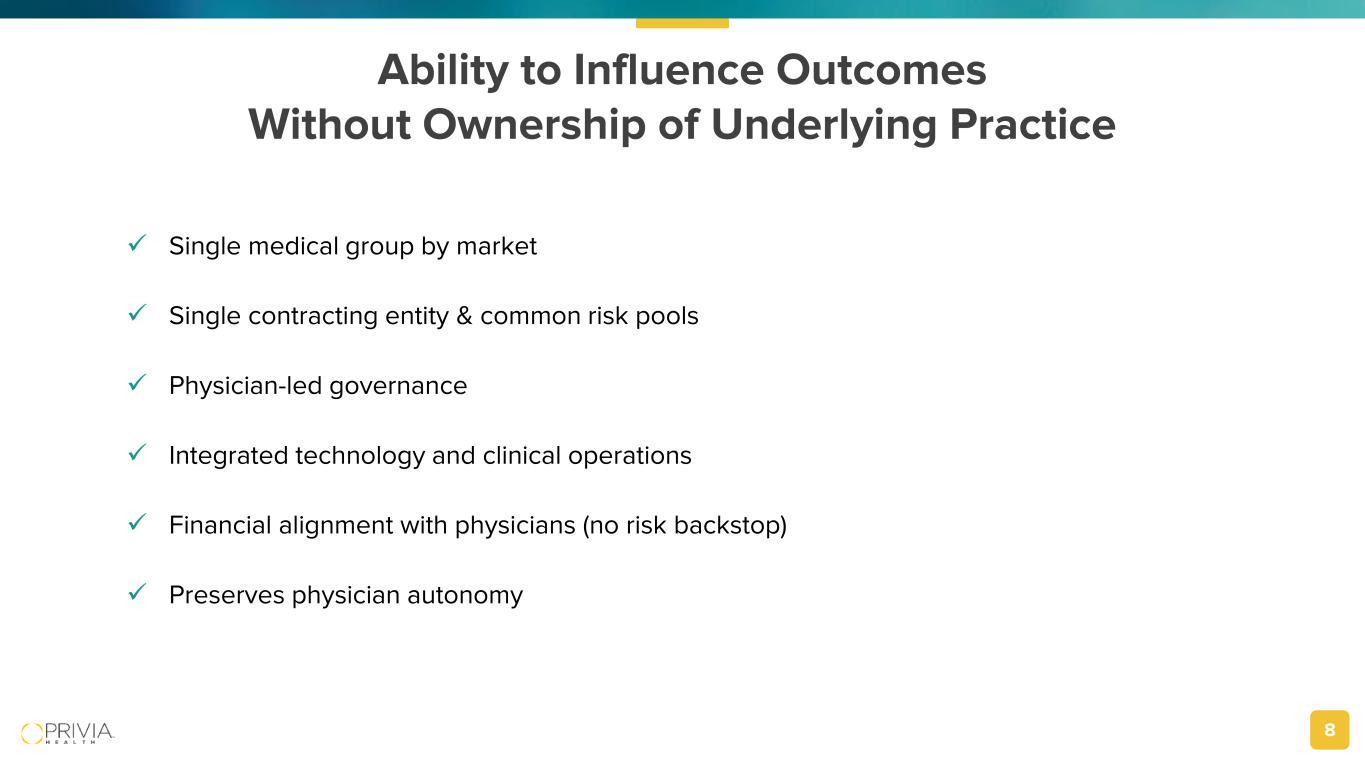
8 Ability to Influence Outcomes Without Ownership of Underlying Practice Single medical group by market Single contracting entity & common risk pools Physician-led governance Integrated technology and clinical operations Financial alignment with physicians (no risk backstop) Preserves physician autonomy
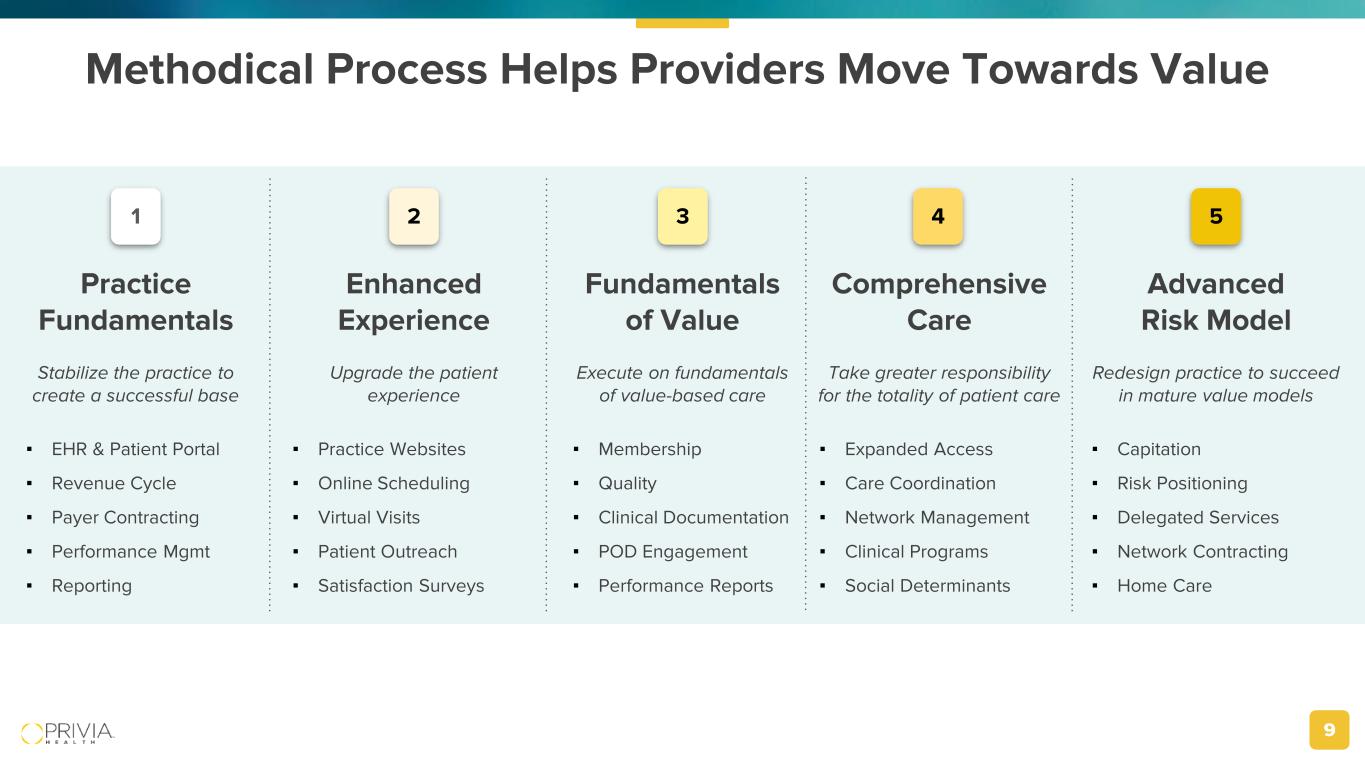
9 Methodical Process Helps Providers Move Towards Value Practice Fundamentals Stabilize the practice to create a successful base Enhanced Experience Upgrade the patient experience Fundamentals of Value Execute on fundamentals of value-based care Comprehensive Care Take greater responsibility for the totality of patient care Advanced Risk Model Redesign practice to succeed in mature value models 2 43 51 ▪ EHR & Patient Portal ▪ Revenue Cycle ▪ Payer Contracting ▪ Performance Mgmt ▪ Reporting ▪ Practice Websites ▪ Online Scheduling ▪ Virtual Visits ▪ Patient Outreach ▪ Satisfaction Surveys ▪ Membership ▪ Quality ▪ Clinical Documentation ▪ POD Engagement ▪ Performance Reports ▪ Expanded Access ▪ Care Coordination ▪ Network Management ▪ Clinical Programs ▪ Social Determinants ▪ Capitation ▪ Risk Positioning ▪ Delegated Services ▪ Network Contracting ▪ Home Care
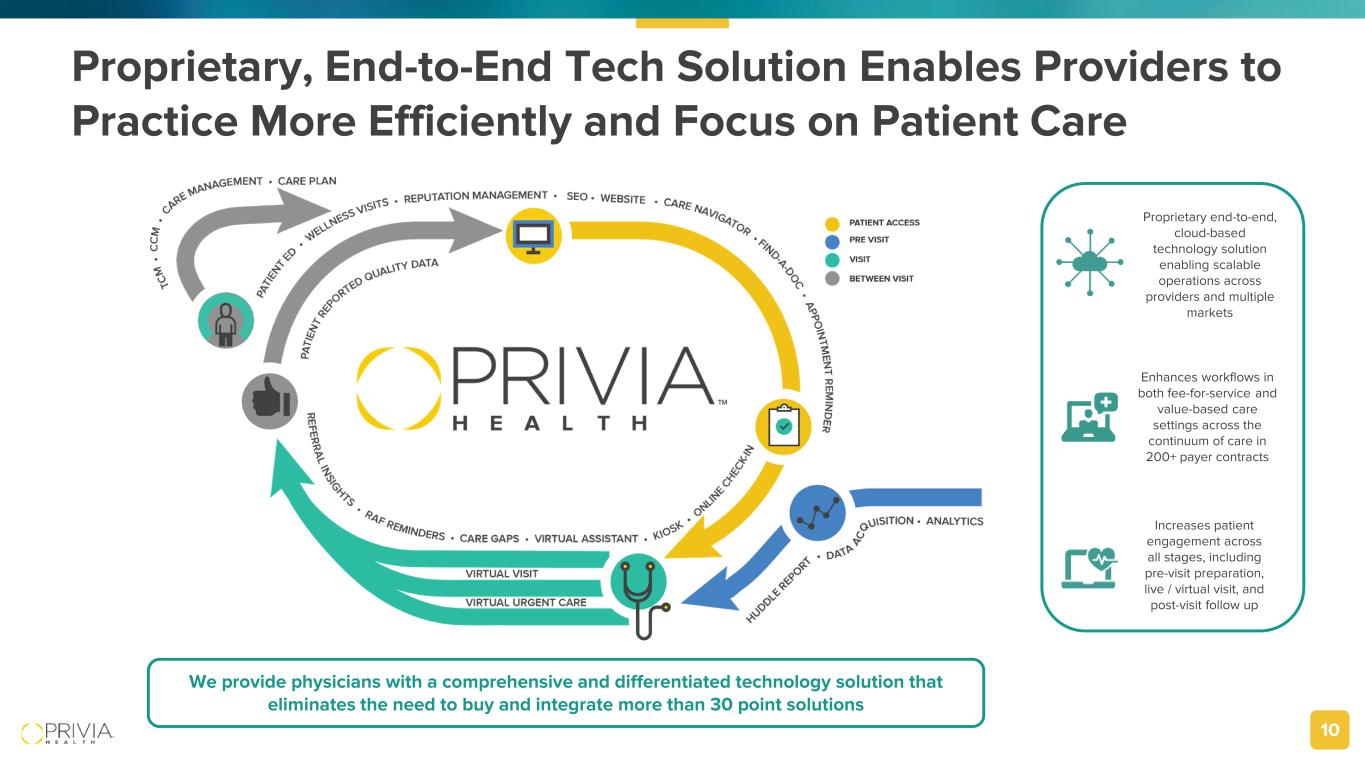
10 Proprietary, End-to-End Tech Solution Enables Providers to Practice More Efficiently and Focus on Patient Care Proprietary end-to-end, cloud-based technology solution enabling scalable operations across providers and multiple markets Enhances workflows in both fee-for-service and value-based care settings across the continuum of care in 200+ payer contracts Increases patient engagement across all stages, including pre-visit preparation, live / virtual visit, and post-visit follow up We provide physicians with a comprehensive and differentiated technology solution that eliminates the need to buy and integrate more than 30 point solutions
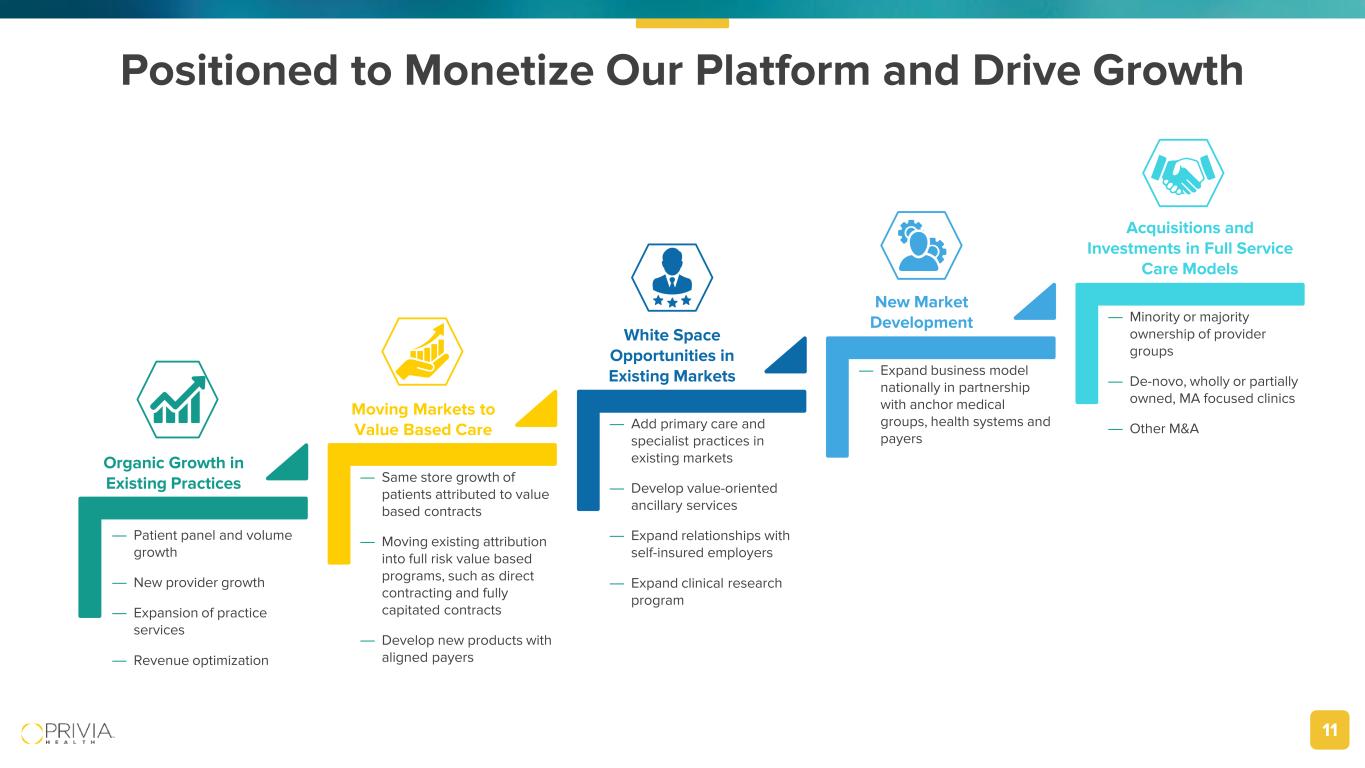
11 Positioned to Monetize Our Platform and Drive Growth — Same store growth of patients attributed to value based contracts — Moving existing attribution into full risk value based programs, such as direct contracting and fully capitated contracts — Develop new products with aligned payers — Add primary care and specialist practices in existing markets — Develop value-oriented ancillary services — Expand relationships with self-insured employers — Expand clinical research program — Expand business model nationally in partnership with anchor medical groups, health systems and payers — Minority or majority ownership of provider groups — De-novo, wholly or partially owned, MA focused clinics — Other M&A Organic Growth in Existing Practices Moving Markets to Value Based Care White Space Opportunities in Existing Markets New Market Development Acquisitions and Investments in Full Service Care Models — Patient panel and volume growth — New provider growth — Expansion of practice services — Revenue optimization

12 Confirming FY’21 Guidance ($ in millions) Initial Guidance (5.27.21) Revised Guidance (8.9.21) Updated Guidance (11.8.21) Low High Low High Implemented Providers 2,850 2,900 Mid-to-High End 3,300 3,330 Attributed Lives 730,000 750,000 High End 760,000 765,000 Practice Collections $ 1,445 $ 1,465 High End $ 1,520 $ 1,540 GAAP Revenue $ 860 $ 880 High End $ 900 $ 920 Care Margin $ 215 $ 221 High End $ 225 $ 230 Platform Contribution $ 93 $ 98 High End $ 102 $ 105 Adjusted EBITDA $ 34 $ 38 High End $ 39 $ 41 Other Guidance Assumptions: • Adjusted EBITDA guidance does not add back actual or estimated new market entry and development costs • Capital expenditures of < $1M
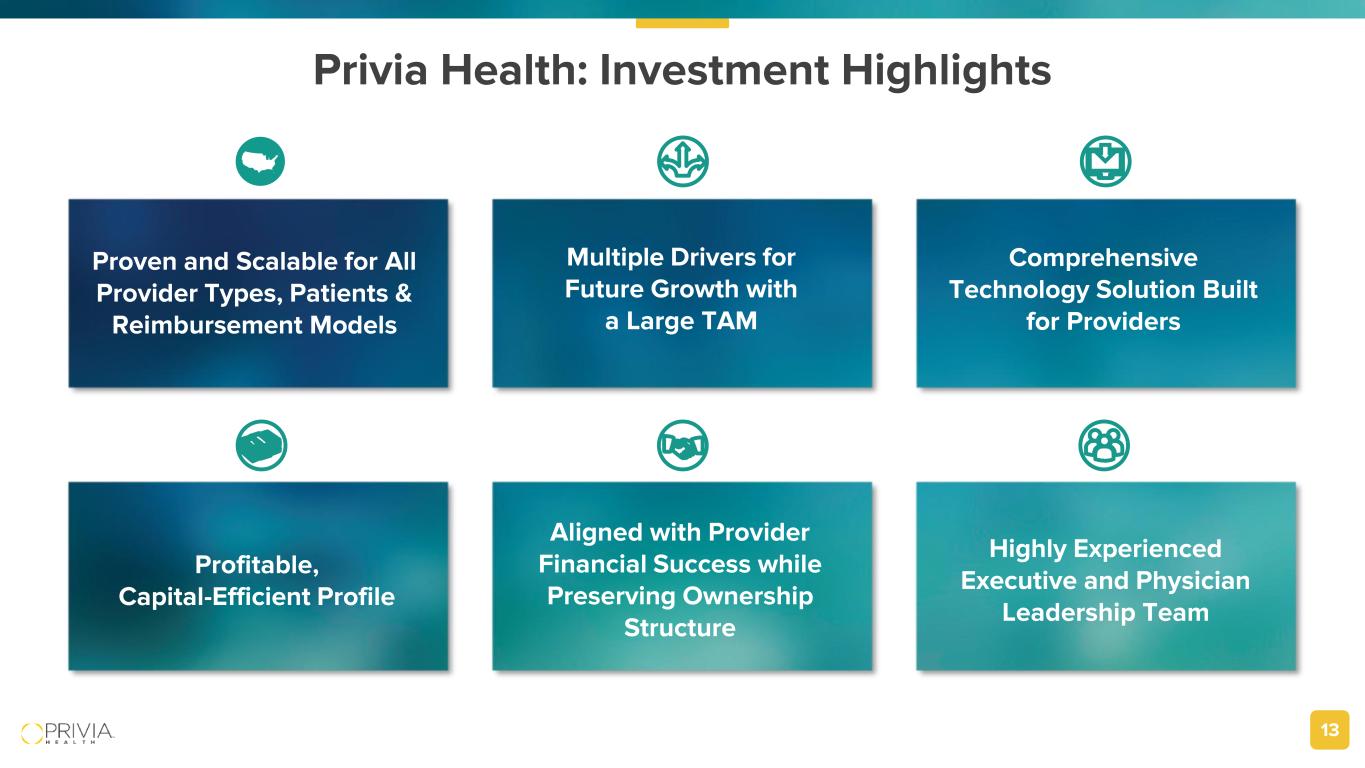
13 Privia Health: Investment Highlights Proven and Scalable for All Provider Types, Patients & Reimbursement Models Multiple Drivers for Future Growth with a Large TAM Comprehensive Technology Solution Built for Providers Profitable, Capital-Efficient Profile Aligned with Provider Financial Success while Preserving Ownership Structure Highly Experienced Executive and Physician Leadership Team

14 Thank You PriviaHealth.com Contact: Robert P. Borchert SVP, Investor & Corporate Communications robert.borchert@priviahealth.com Phone: 817.783.4841


