UNITED STATES
SECURITIES AND EXCHANGE COMMISSION
Washington, D.C. 20549
FORM 10-K
(Mark One)
| |
☒ | ANNUAL REPORT PURSUANT TO SECTION 13 OR 15(d) OF THE SECURITIES EXCHANGE ACT OF 1934 |
For the fiscal year ended December 31, 2024
OR
| |
☐ | TRANSITION REPORT PURSUANT TO SECTION 13 OR 15(d) OF THE SECURITIES EXCHANGE ACT OF 1934 For the transition period from to |
Commission File Number 001-38864
ALTA EQUIPMENT GROUP INC.
(Exact name of Registrant as specified in its Charter)
| |
Delaware | 83-2583782 |
(State or other jurisdiction of incorporation or organization) | (I.R.S. Employer Identification No.) |
13211 Merriman Road Livonia, MI | 48150 |
(Address of principal executive offices) | (Zip Code) |
Registrant’s telephone number, including area code: (248) 449-6700
Securities registered pursuant to Section 12(b) of the Act:
| | | | |
Title of each class | | Trading Symbol(s) | | Name of each exchange on which registered |
Common stock, $0.0001 par value per share | | ALTG | | The New York Stock Exchange |
Depositary Shares representing a 1/1000th fractional interest in a share of 10% Series A Cumulative Perpetual Preferred Stock, $0.0001 par value per share | | ALTG PRA | | The New York Stock Exchange |
Securities registered pursuant to Section 12(g) of the Act: None
Indicate by check mark if the Registrant is a well-known seasoned issuer, as defined in Rule 405 of the Securities Act. Yes ☐ No ☒
Indicate by check mark if the Registrant is not required to file reports pursuant to Section 13 or 15(d) of the Act. Yes ☐ No ☒
Indicate by check mark whether the Registrant: (1) has filed all reports required to be filed by Section 13 or 15(d) of the Securities Exchange Act of 1934 during the preceding 12 months (or for such shorter period that the Registrant was required to file such reports), and (2) has been subject to such filing requirements for the past 90 days. Yes ☒ No ☐
Indicate by check mark whether the Registrant has submitted electronically every Interactive Data File required to be submitted pursuant to Rule 405 of Regulation S-T (§232.405 of this chapter) during the preceding 12 months (or for such shorter period that the Registrant was required to submit such files). Yes ☒ No ☐
Indicate by check mark whether the registrant is a large accelerated filer, an accelerated filer, a non-accelerated filer, a smaller reporting company, or an emerging growth company. See the definitions of “large accelerated filer,” “accelerated filer,” “smaller reporting company,” and “emerging growth company” in Rule 12b-2 of the Exchange Act.
| | | | | | |
Large accelerated filer |
| ☐ |
| Accelerated filer |
| ☒ |
| | | |
Non-accelerated filer |
| ☐ |
| Smaller reporting company |
| ☐ |
| | | | | | |
Emerging growth company | | ☐ | | | | |
If an emerging growth company, indicate by check mark if the registrant has elected not to use the extended transition period for complying with any new or revised financial accounting standards provided pursuant to Section 13(a) of the Exchange Act. ☐
Indicate by check mark whether the registrant has filed a report on and attestation to its management’s assessment of the effectiveness of its internal control over financial reporting under Section 404(b) of the Sarbanes-Oxley Act (15 U.S.C. 7262(b)) by the registered public accounting firm that prepared or issued its audit report. ☒
If securities are registered pursuant to Section 12(b) of the Act, indicate by check mark whether the financial statements of the registrant included in the filing reflect the correction of an error to previously issued financial statements. ☒
Indicate by check mark whether any of those error corrections are restatements that required a recovery analysis of incentive-based compensation received by any of the registrant’s executive officers during the relevant recovery period pursuant to §240.10D-1(b). ☒
Indicate by check mark whether the Registrant is a shell company (as defined in Rule 12b-2 of the Exchange Act). YES ☐ NO ☒
As of June 30, 2024, the aggregate market value of Common Stock held by non-affiliates was approximately $215.6 million, calculated by using the closing price of the Common Stock on such date on the New York Stock Exchange of $8.04.
As of March 3, 2025, there were 32,859,690 shares of Common Stock, $0.0001 par value, and 1,200 shares of Preferred Stock, $0.0001 par value, which Preferred Stock is evidenced by 1,200,000 depositary shares, issued and outstanding.
DOCUMENTS INCORPORATED BY REFERENCE
Portions of the registrant's proxy statement relating to the 2025 Annual Meeting of Shareholders are incorporated by reference into Part III of this report.
Table of Contents
CAUTIONARY NOTE REGARDING FORWARD LOOKING STATEMENTS AND RISK FACTOR SUMMARY
Certain statements contained in this Annual Report on Form 10-K may be considered “forward-looking statements” as that term is defined in the Private Securities Litigation Reform Act of 1995. The forward-looking statements contained herein are subject to known and unknown risks, uncertainties, assumptions and other factors that may cause our actual results, performance or achievements to be materially different from those expressed or implied by any such forward-looking statements. Forward-looking statements include, but are not limited to, statements that refer to projections, forecasts or other characterizations of future events or circumstances, including any underlying assumptions. The words “anticipate,” “believe,” “continue,” “could,” “estimate,” “expect,” “intends,” “may,” “might,” “plan,” “possible,” “potential,” “predict,” “project,” “should,” “would” and similar expressions may identify forward-looking statements, but the absence of these words does not mean that a statement is not forward-looking. Forward-looking statements may include, for example, statements about: our future financial performance; our plans for expansion and acquisitions; and changes in our strategy, future operations, financial position, estimated revenues, income or loss, projected costs, prospects, plans and objectives of management.
These forward-looking statements are based on current information available, and current expectations, forecasts and assumptions, and involve a number of judgments, risks and uncertainties. Accordingly, forward-looking statements should not be relied upon as representing the Company’s views as of any subsequent date, and we do not undertake any obligation to update forward-looking statements to reflect events or circumstances after the date they were made, whether as a result of new information, future events or otherwise, except as may be required under applicable securities laws. As a result of a number of known and unknown risks and uncertainties, actual results or performance may be materially different from those expressed or implied by these forward-looking statements.
Some factors that could cause actual results to differ include, but are not limited to the risks below, which also serves as a summary of the principal risks of an investment in our securities:
•supply chain disruptions and inflationary pressures resulting from supply chain disruptions;
•labor market dynamics that impact the price and availability of labor;
•negative impacts on customer payment policies;
•adverse banking and governmental regulations, resulting in a potential reduction to the fair value of our assets;
•the performance and financial viability of key suppliers, contractors, customers, and financing sources;
•our key OEM's relative approaches to competitive pricing dynamics in the marketplace and how their approaches impact the competitiveness of the equipment we sell and our market share;
•economic, industry, business and political conditions including their effects on governmental policy and government actions that disrupt our supply chain or sales channels, including taxes and tariffs which impact us or our key suppliers;
•fluctuations in interest rate levels and the relative tenor of those levels;
•the demand and market price for our equipment and product support;
•collective bargaining agreements and our relationship with our union-represented employees;
•our success in identifying acquisition targets and integrating acquisitions;
•our success in expanding into and doing business in additional markets;
•our ability to raise capital at favorable terms;
•the competitive environment for our products and services;
•our ability to continue to innovate and develop new business lines;
•our ability to attract and retain key personnel, including, but not limited to, skilled technicians;
•our ability to maintain our listing on the New York Stock Exchange (“NYSE”);
•the impact of cyber or other security threats or other disruptions to our businesses;
•our ability to realize the anticipated benefits of acquisitions or divestitures, rental fleet and other organic investments or internal reorganizations;
•federal, state and local government budget uncertainty, especially as it relates to infrastructure projects and taxation;
•currency risks and other risks associated with international operations; and
•other risks and uncertainties identified in the section entitled “Risk Factors” in this annual report on Form 10-K and other filings with the United States ("U.S.") Securities and Exchange Commission (the “SEC”).
The foregoing list of factors is not exclusive and undue reliance should not be placed upon any forward-looking statements, which speak only as of the date made.
PART I
References herein to “the Company”, “Alta”, “we”, “our” or “us” mean Alta Equipment Group Inc., and its wholly owned subsidiaries, unless the context requires otherwise.
Item 1. Business.
Overview
We own and operate one of the largest integrated equipment dealership platforms in North America. Through our branch network, we sell, rent, and provide parts and service support for several categories of specialized equipment, including lift trucks and other material handling equipment, heavy and compact earthmoving equipment, crushing and screening equipment, environmental processing equipment, cranes and aerial work platforms, paving and asphalt equipment, other construction equipment and allied products. We engage in five principal business activities in these equipment categories:
(i)new and used equipment sales;
(iii)repair and maintenance services;
(iv)equipment rentals and
(v)rent-to-sell equipment.
Within our territories, we are primarily the exclusive distributor of new equipment and replacement parts on behalf of our Original Equipment Manufacturer (“OEM”) partners. We and our regional subsidiaries enjoy long-standing relationships with leading material handling and construction equipment OEMs including Hyster-Yale, Volvo, JCB, CNH, Takeuchi, McCloskey, and Kubota, among many others, as well as master dealer rights throughout North America for environmental processing equipment with Doppstadt and Backers, among others. We are consistently recognized by OEMs as a top dealership partner and have been identified as an internationally recognized Hyster-Yale dealer and multi-year recipient of the Volvo Dealer of the Year award. More recently, given the Company’s successful history with electrified forklifts, battery charging, and power generation, we are pursuing a synergistic, asset-light strategy focused on the distribution and powering of commercial electric vehicles in the over-the-road vehicle segment. While our electromobility (“e-mobility”) business, and the industry in general, is in its early stages of development, we believe that our expertise in this emerging market represents a future growth opportunity.
We are committed to providing our customers with a best-in-class equipment dealership experience. Our customers are principally focused on equipment reliability and uptime, and our teams of skilled technicians and commitment to service are key to establishing and maintaining long-term customer relationships, representing a critical competitive advantage for the Company. Parts and service are also our most predictable and profitable businesses, with the dealership model structured to drive aftermarket parts and service revenues. Through our new and used equipment sales and our sale of lightly used rental fleet, we populate our exclusive territories with serviceable equipment. As the field population ages, we capitalize on aftermarket parts and service sales through the equipment maintenance cycle.
Products and Services
New equipment sales. We sell new heavy construction, material handling and environmental processing equipment and are a leading regional distributor for nationally recognized equipment manufacturers. Our new equipment sales operation is a primary source of new customers for our rental, parts and service business. The majority of our new equipment sales are predicated on exclusive distribution agreements we have with best-in-class OEMs. The sale of new equipment to customers, while profitable from a gross margin perspective, acts as a means of generating equipment field population and activity for our higher-margin aftermarket revenue streams, specifically service and parts. We also sell tangential products and services related to our material handling equipment offerings which include, but are not limited to, automated equipment installation and warehouse management systems integration.
Used equipment sales. We sell used equipment which is typically equipment that has been taken in on trade from a customer that is purchasing new equipment, equipment coming off a third-party lease arrangement where we purchase the equipment from the finance company or used equipment that is sourced for our customers in the open market by our used equipment specialists. Used equipment sales in our territories, like new equipment sales, generate parts and service business for the Company.
Parts sales. We sell replacement parts to customers and supply parts to our own rental fleet. Our in-house parts inventory is extensive such that we are able to provide timely service support to our customers. The majority of our parts inventory is made up of OEM replacement parts for those OEMs with which we have exclusive agreements to sell new equipment.
Service support. We provide maintenance and repair services for customer-owned equipment and maintain our own rental fleet. In addition to repair and maintenance on an as needed or scheduled basis, we provide ongoing preventative maintenance services and warranty repairs for our customers. We have committed substantial resources to training our technical service employees and have a full-scale service infrastructure that we believe helps to differentiate us from our competitors.
Equipment rentals. We rent heavy construction, compact, aerial, material handling, and a variety of other types of equipment to our customers on a daily, weekly, and monthly basis. We view our rental fleet as an important component of our one-stop-shop model, allowing for customers to be flexible with their capital and rely on our rental equipment to integrate into their business when increasing their fleet capacity for a project or when customer-owned equipment is being serviced. Our rental business also supports our rent-to-sell strategy, in which we sell equipment from our rental fleet to customers who prefer to purchase lightly used equipment. As with new and used equipment sales, the rent-to-sell approach to the market generates parts and service revenues as equipment is sold into our territories.
Industry Background
The industries for material handling, construction, and environmental processing equipment are driven by a broad range of economic factors and trends in certain end markets, including, but not limited to, manufacturing, distribution and logistics activity, e-commerce, food and beverage, medical, general construction, aggregate and mining, infrastructure, biofuel, composting, recycling and waste management. In addition, regional factors have an impact, particularly where equipment dealerships have territorial exclusivity with OEM partners.
OEMs have pushed for consolidation in their dealership networks, and we have been and continue to be one of the few consolidators in our industry. We are one of a very limited number of public equipment dealerships, and we believe our public profile will be a significant advantage when sourcing and competing for acquisition targets. Furthermore, many equipment dealerships are family-owned operations, and retiring management teams have struggled to develop succession plans. We are a recognized consolidator in the material handling and construction equipment industries, and many incumbent dealership owners have approached our management about potential sale transactions as a result. We believe these dynamics will contribute to a consistent acquisition pipeline at attractive valuation levels, over the long run.
Competitive Strengths
We believe the following attributes are important to our ability to compete effectively and achieve our financial objectives:
Integrated Dealership Platform Providing Full Scale Solutions to Customers. We believe that our integrated equipment sales, service, and rental platform provides a one-stop-shop for a highly diverse group of customers, enabling us to profitably grow our revenues over time and providing a competitive advantage over our single channel competitors and traditional equipment rental houses, which may have difficulty expanding due to the infrastructure, training, and relationships necessary to support a growing population of equipment in a designated territory and that typically have limited parts and service offerings. With our over 85 dealership locations, we believe our scale will help us be the leading provider of material handling, construction, and environmental processing equipment and aftermarket parts and service support in each of our territories.
Leading Dealer for Equipment Manufacturers. We are a leading U.S. dealer for many globally recognized material handling, construction, and environmental processing equipment OEMs, including Hyster-Yale, Volvo, JCB, Kubota, CNH and Doppstadt. Our primary dealer agreements grant us exclusivity for new equipment, replacement part sales, and diagnostic service software in our territories. The OEM relationships also promote our acquisition strategy, as the OEMs prefer to partner with fewer, larger, financially stable dealerships and view us as a prominent consolidator.
Superior Parts and Services Operations Supporting Customer Relationships. We provide parts and service to our customers 24 hours a day, 365 days a year. Our parts and service capabilities support customers in maximizing equipment uptime, which we believe is a key consideration when an equipment customer is making a selection among competing product offerings. The aftermarket parts and service businesses provide us with a predictable, high-margin revenue source that is relatively insulated from the typical business cycle.
Ability to Attract and Retain Skilled Technical Employees. We believe we provide best-in-class parts and service support to our customers, and the ability to attract and retain skilled technicians is critical to aftermarket performance. We have partnered with trade and technical schools in many of our territories and these relationships, along with our recruiting prowess, provide us with a pipeline of skilled employees. To retain employees, we offer attractive benefits, clean facilities with the most advanced diagnostic software, modern tools and OEM parts. Above all, we view our technicians as key contributors to future success, and we accord respect to our skilled technicians.
High-Quality Rental Fleet for Rent-to-Sell and Rent-to-Rent Programs. Equipment rental is complementary to our new and used equipment sales and is an important component of our one-stop-shop model, allowing customers to be flexible with their capital spend on equipment needed to operate their businesses. Rental operations are fully aligned with our dealership strategy, as the rent-to-sell solution provides an additional sales channel through which we are able to populate our territories with equipment and generate high-margin parts and service revenues thereafter. In addition, our existing equipment customers rely on our rental fleet when facing short-term equipment needs and when customer equipment is being serviced.
Experienced Management Team. Our senior management team is led by Chief Executive Officer (“CEO”) Ryan Greenawalt, Chief Financial Officer (“CFO”) Anthony Colucci, Chief Operating Officer (“COO”) Craig Brubaker and Chief Legal Officer and General Counsel, Jeffrey Hoover, each of whom has substantial experience in the equipment distribution industry. Our senior leadership is well known and highly respected in the industry. Industry relationships provide a meaningful portion of our acquisition pipeline, as dealership owners frequently approach our management team to discuss a sale. Additionally, our senior leadership team is experienced in managing our business throughout the business cycle.
Business Strategy
We employ the following business strategies:
Align with World-Class OEMs by Securing Dealership Agreements for Exclusive Territories. We contractually agree with best-in-class material handling, construction, and environmental processing equipment OEMs to represent them exclusively in designated territories (i.e., a county, state or province). These exclusive agreements allow us to take a long-term view to a given marketplace as we invest in rental fleet for the products we represent and build a high-end, complementary product offering that drives wallet share with customers and ultimately allows us, and our OEMs, to focus on growing market share within the territory. Importantly, these agreements give us exclusive rights to purchase OEM parts and access to OEM software which allows us to safely and effectively repair our customers equipment.
Grow the Field Population of Equipment in Our Territories and Leverage that Equipment to Grow Parts and Service Revenues. We actively populate our territories with new and used equipment, which generates predictable, high-margin parts and service revenues. We follow this strategy with each of our acquisitions into new territories and with new OEM partnerships, growing the field population of equipment through our new, used, and rent-to-sell sales channels upon market entry. As a result, we expect future benefits from increasing aftermarket parts and service revenues driven by the equipment maintenance cycle.
Recruit Skilled Technicians to Expand the Parts and Service Operations. We depend on our teams of technicians to provide customers with best-in-class parts and service support, and we have developed a multifaceted strategy to recruit skilled mechanics. We regularly attract technicians from independent rental or service businesses in our markets, where a lack of access to OEM parts and diagnostic tools make servicing increasingly sophisticated equipment difficult. Additionally, we have been successful in hiring skilled technicians from other industries, such as the automotive industry. Also, our partnerships with technical schools and community colleges provide consistent access to new technicians. We regularly replicate this strategy as we acquire additional dealership territories.
Pursue Strategic Acquisitions. Our management team has successfully completed 16 acquisitions since 2020. We have two primary areas of focus when pursuing acquisitions:
•Territory In-Fill. Within our existing territories, we pursue acquisitions that may provide for new OEM relationships whose equipment will complement the existing product portfolio in a territory, new customer relationships and pools of skilled technicians. These acquisitions advance the parts and service strategy by simultaneously increasing the field population within the existing territory and expanding the number of skilled technicians to generate predictable, high-margin parts and service revenues.
•Territorial Expansion. Our geographic footprint has grown through acquisitions, from our original Michigan lift truck territory to a leading equipment dealer with operations in the Midwest, New York, New England, Florida, Nevada, and the Canadian provinces of Ontario and Quebec. In selecting additional territories for acquisition, we prioritize markets with a high density of equipment users.
Pursue Synergistic Verticals. With our existing expertise with commercial equipment dealerships, we pursue strategic opportunities to leverage our knowledge in operating equipment dealerships to grow into other tangential verticals of commercial equipment. As an example, we recently entered the over-the-road vehicle dealership industry by virtue of various partnerships with commercial electric vehicle and charging and infrastructure related OEMs. Similarly, with our historic success and customer relationships in equipment distribution for OEMs in exclusive territories, we will pursue growth opportunities in the wholesale equipment distribution sector, where we look to contractually possess master dealer rights to distribute OEM equipment in a significant geographic territory (e.g., North America). Our 2022 acquisition of Ecoverse Industries, LTD ("Ecoverse") represented our entrance into the wholesale equipment master distribution sector.
Customers
Our customer end markets include food and beverage, diversified manufacturing, automotive, municipal/government, education, pharmaceutical and medical, wholesale and retail distribution, construction, agriculture and forestry, road building, aggregate and mining, utilities and power generation, and recycling and waste management, among others. Our customers vary from small, single machine owners to large construction contractors and leading multi-national commercial companies. In 2024, no single customer accounted for more than 1% of our total revenues. Our top ten customers combined accounted for approximately 5% of our total revenues in 2024.
Floor Plan Financing
New equipment inventory is primarily financed with OEM floor plan facilities with an initial promotional period that is either subsidized or interest-free. OEMs provide this financing to enable dealers to carry equipment in anticipation of customer orders and to increase market share. In many cases we sell the equipment before the expiration of the promotional interest period. We view floor plan financing on new equipment inventory that is less than a year old as a component of our working capital, and do not consider floor plan financing on new equipment as part of our corporate indebtedness.
Sales and Marketing
We have organized our sales forces to be aligned around specific equipment types, which allows our sales teams to develop expertise in certain end markets which allows them to effectively meet the demands of our diverse customer base. We have commission-based compensation programs for our sales forces.
We provide extensive training, including frequent factory and in-house training by OEM representatives regarding the operational features of our equipment to further develop our sales team’s knowledge and experience. This training is essential, as our sales personnel regularly call on customers’ job sites and facilities, often assisting customers in assessing their immediate and ongoing equipment needs.
We utilize a customized Enterprise Resource Planning (“ERP”) tool, called e-Emphasys, which includes customer relationship management ("CRM") functionality. e-Emphasys was designed specifically for equipment dealerships. We believe our ERP and its CRM functionality enhances our territory management capabilities by increasing the productivity of our sales teams and tracking equipment service history to advance our customer support goals.
While our specialized, well-trained sales forces strengthen our customer relationships and foster customer loyalty, we also promote our business through marketing and advertising, including industry publications and trade shows, digital marketing, direct mail campaigns, television and radio, and our website at www.altg.com. The information contained on such websites is not a part of this Annual Report on Form 10-K and is not deemed incorporated by reference into this Annual report on Form 10-K or any other public filing made with the SEC. Advertising and marketing costs are expensed as incurred and for the years ended December 31, 2024, 2023 and 2022 were $9.9 million, $10.2 million, and $5.4 million respectively.
Suppliers
We purchase a significant amount of equipment and parts from a large number of manufacturers with whom we have distribution agreements. We purchased approximately 58% of our equipment and parts sold during the year ended December 31, 2024 from five major OEMs (Volvo, Hyster-Yale, Kubota, CNH, and JCB). Notably, we are the exclusive OEM replacement parts distributor in substantially all our territories, allowing us to provide superior aftermarket service support to our customers.
Information Technology ("IT") Systems
Among other metrics, our IT systems track new, used and rental inventory and labor utilization statistics, and detailed operational and financial information. Our integrated services platform enables us to closely monitor our performance and our business. Our point-of-sale systems enable us to maintain visibility into all of our facilities, permitting universal access to real-time data concerning equipment located at the individual facility locations and the status and maintenance history for each piece of equipment. Our business system is a full suite of highly integrated software solutions intended to manage equipment dealership activities at all essential levels. Real-time data and analytics provide detailed visibility to information across all functional areas, promoting proactive, data-driven decisions. Points of integration with our OEMs and other third-parties have been implemented which have greatly streamlined activities in the areas of operations, customer support, and accounting and finance. Additional operational efficiencies are gained through our use of integrated solutions such as electronic document management, service scheduling and technician dispatch, mobile field service, and mobile equipment inspection. Analytics are provided through a data warehouse which is tightly integrated with the business system, providing real-time reports and key performance indicator dashboards that are tailored to meet the specific needs of each department and region. We also have integrations for account reconciliations, consolidations, transaction matching, and task management that support critical accounting processes such as the financial close, account reconciliations, intercompany accounting, compliance and reporting.
Our CRM system provides sales and customer information, available rental fleet and inventory information, a quote system and other organizational tools to assist our sales forces. We maintain customer database which allows us to monitor the status and maintenance history of our customers’ owned equipment and enables us to provide parts and services to meet their needs. Our critical business systems are deployed across a hybrid infrastructure, leveraging both on-premise and cloud environments.
Product Warranties
Product warranties for new equipment and parts are provided by our OEM partners. The term and scope of these warranties vary greatly by supplier and by product. The OEMs pay us for repairs we perform on equipment under warranty in our territories.
Seasonality and Weather
The demand for our construction equipment, product support, and rentals tends to be lower in the winter months so severe cold weather conditions typically have a negative impact on our business in our northern territories. That said, some of the negative impact of severe winters can be mitigated given our exposure to the snow removal market and additional service work related to extreme cold temperatures impact on our customers equipment. Additionally, a notable portion of our construction segment operates in Florida, which can be impacted by severe summer heat, thunderstorms, tornados and hurricanes which can have an impact our customers and business operations.
Parts and services activities are less affected by changes in demand caused by seasonality, especially in our material handling segment, and are generally more predictable than our other revenue generating activities based on our knowledge of historical maintenance and service trends as equipment ages.
Competition
The equipment distribution and service industry is competitive and fragmented, with large numbers of competitors operating on a regional or local scale. Within our territories, our competitors range from multi-location, regional operators to single-location dealers of competing equipment brands. We compete with equipment dealers that sell other brands of equipment we do not represent anywhere in our footprint or that we do not represent in a particular market. We also compete with local and nationwide rental businesses in certain product categories.
Competition among equipment dealers is primarily based on customer service, including repair and maintenance service provided by the dealer, reputation of the OEM and dealer, quality and design of the products, and price. In our experience, reliability and uptime are the key considerations for customers in selecting an equipment dealer, and we believe our focus on parts and service support has helped us win and maintain customer business. While we believe a dealers service capabilities are a primary factor in a customer's purchasing decision, price can be a key point of differentiation in selecting among competing equipment, as our OEM partners often provide pricing flexibility and discounting in order to drive market share in their relative segments of the market.
Within substantially all our territories, we are the exclusive distributor of new equipment and replacement parts on behalf of our OEM partners. This exclusivity affords us effectively no competition from others when selling these brands in our territories.
Environmental, Health and Safety Regulations
Environmental
Our facilities and operations are subject to various, comprehensive, and frequently changing federal, state, and local environmental and occupational health and safety laws and regulations in the U.S and Canada. These requirements govern, among other things, the handling, storage, use and disposal of hazardous materials and wastes and, if any, the associated cleanup of properties affected by discharges, releases, or exposure to pollutants, air quality (emissions) and wastewater, as well as the protection of human health and safety. We currently do not anticipate an adverse effect on our business, financial condition or competitive position as a result of our compliance with such requirements. We will continue to take necessary steps to comply with environmental requirements, but we do not expect to incur material capital or other expenditures for environmental controls or compliance.
Health and Safety
The health and safety of our employees is an important focus at Alta. As part of our continuing goal to reduce our recordable injuries, we are committed to regularly reinforcing the importance of our safety programs and encouraging a culture of safe work practices in all our locations. As part of our evaluation of our management employees, we evaluate the safety records of the employees for whom they have management responsibility. We also, in the normal course of business in connection with our OEM partners and other third parties, provide our skilled technician base with regular health and safety training based on the latest industry protocols.
Human Capital
Employees
As of December 31, 2024, we had approximately 2,900 employees. Of these employees, approximately 1,275 are skilled technicians paid on an hourly basis and the remainder are hourly and salaried corporate, sales, operating, and administrative personnel. We have approximately 700 employees covered by collective bargaining agreements. We believe our relations with our employees are good, and we have never experienced a long-term work stoppage.
Generally, the total number of employees does not significantly fluctuate throughout the year. However, acquisition activity may increase the number of our employees. Fluctuations in the level of our business activity could require some staffing level adjustments in response to actual or anticipated customer demand. Lastly, dependent on performance, operating optimization initiatives which may be underpinned by strategic OEM eliminations and/or branch consolidations could result in headcount reductions.
Talent Development and Employee Training
Our goal is to attract, develop, and retain a talented and high-performing workforce. We are committed to our employees and their development, and we strive to create opportunities for the continual professional development of our employee base. These opportunities include continuing education and specialty training. Our in-house recruiters and partnerships with colleges and trade schools help build relationships and recruit talent from various sources within our territories.
Compensation and Benefits
We are committed to providing competitive compensation and benefits programs for our employees as we believe they are core to an engaged and productive employee base. We believe our compensation programs align both individual and team contributions to promote our culture and drive our performance. Substantially all of the Company’s employees are eligible to participate in the Company’s 401(k) and profit-sharing plan. Eligible employees may contribute a percentage of their salary up to the Internal Revenue Service limit. The Company may contribute a discretionary percentage of the amount deferred by the employee. Total contributions made by the Company to the 401(k) plan amounted to $5.8 million, $5.4 million and $4.0 million for the years ended December 31, 2024, 2023 and 2022, respectively.
In April 2022, the Company's Board of Directors adopted the 2022 Employee Stock Purchase Plan (the "ESPP"), which became effective upon approval by the Company's shareholders at the Annual Meeting of Stockholders on June 9, 2022. On June 8, 2023 the Company filed a Form S-8 to register 325,000 common stock shares, the total shares reserved for the ESPP. Total contributions made by the Company to the ESPP amounted to $0.5 million and $0.2 million for the years ended December 31, 2024 and 2023, respectively.
Legal Proceedings
There is no material litigation, arbitration, or governmental proceeding currently pending against us or any members of our management team where the potential liability is not offset by expected insurance proceeds.
Available Information
We electronically file annual reports, quarterly reports, proxy statements and other reports and information statements with the SEC. We make our annual reports on Form 10-K, quarterly reports on Form 10-Q, current reports on Form 8-K and amendments to these reports, as well as our other SEC filings, available on our website, investors.altg.com, free of charge, as soon as reasonably practicable after they are electronically filed or furnished pursuant to section 13(a) or 15(d) of the Exchange Act. The SEC maintains a website that contains reports, proxy and information statements and other information regarding issuers that file electronically with the SEC and the address of that site is http://www.sec.gov.
Our principal executive offices are located at 13211 Merriman Road, Livonia, Michigan 48150, and our telephone number is (248) 449-6700. We also make available on our website copies of materials regarding our corporate governance policies and practices, including our Corporate Governance Guidelines; our Code of Business Conduct and Ethics; and the charters relating to the committees of our Board of Directors.
Item 1A. Risk Factors.
Risks Related to the Company’s Business and Industry
The Company’s business has in the past and could in the future be adversely affected by declines in construction, material handling, and environmental processing activities, or a downturn in the economy in general, which could lead to decreased demand for equipment, depressed equipment rental rates, and lower sales prices, resulting in a decline in the Company’s revenues, gross margins, and operating results.
The Company’s equipment is principally used in connection with construction, material handling, and environmental processing activities. Consequently, a downturn in these activities, or the economy in general, has in the past and may in the future lead to a decrease in the demand for equipment and services or depress rental rates and the sales prices for the Company’s replacement parts, services, and equipment. The Company’s business has in the past and may in the future be negatively impacted, either temporarily or long-term, by:
•a reduction in spending levels by our customers;
•the lack of availability of credit for our customers;
•adverse changes in federal, state, and local government infrastructure spending and taxation;
•excess supply in the equipment markets we participate in;
•our inability to pass along operating cost increases related to inflation or otherwise to customers;
•an increase in costs generally, including the cost of inputs for our OEMs or customers' operations, as a result of tariffs, inflation or other factors;
•adverse weather conditions or natural disasters which may affect a particular region;
•a pandemic or similar national or global health crisis;
•a labor work stoppage or shortage of skilled technicians;
•labor market conditions in the U.S. or Canada that would impair the Company’s, our OEM’s, or our customers’ ability to hire and/or retain appropriately skilled employees to support ongoing operations;
•a prolonged shutdown of the U.S., state or local government;
•an increase in interest rates;
•adverse foreign currency fluctuations;
•terrorism, war or hostilities involving the U.S. or Canada;
•our failure to execute on strategic plans generally, including those associated with commercial electric vehicle business model;
•disruptions to global supply chains, specifically our major OEM partner supply chains; or
•other unforeseen or catastrophic events.
The Company’s inability to forecast trends accurately may adversely impact the Company’s business and financial condition.
An economic downturn or economic uncertainty makes it difficult for the Company to forecast trends, which may have an adverse impact on the Company’s business and financial condition. Uncertainty regarding future equipment demand could cause the Company to maintain excess equipment inventory and increase the Company’s equipment inventory carrying costs. Alternatively, this forecasting difficulty could cause a shortage of equipment for sale or rental that could result in an inability to satisfy demand for the Company’s products and a loss of market share.
Variations in the Company’s revenues and operating results have in the past and could in the future result in a decline in the Company’s profitability and make it more difficult for the Company to grow our business.
The Company’s revenues and operating results vary from quarter to quarter and by season. Periods of decline have in the past and could in the future result in an overall decline in profitability and make it more difficult for the Company to make payments on our indebtedness and grow the Company’s business. We expect the Company’s quarterly results to fluctuate in the future due to a number of factors, including:
•general economic conditions in the markets where we operate;
•the cyclical and seasonal nature of the Company’s customers’ business and our sales and rental patterns, particularly the Company’s construction customers;
•the weather conditions, specifically in our northern markets;
•the timeliness of OEM equipment deliveries;
•ad hoc, period-based, competitive pricing programs offered by competitive equipment OEMs and their dealers that put our products at a disadvantage in a given market from a pricing perspective;
•changes in the size of the Company’s rental fleet, the rate at which we rent our fleet, and the price at which we sell equipment from our fleet;
•changes in corporate or government spending for commercial and infrastructure projects;
•changes in interest rates and related changes in the Company’s interest expense and debt service obligations;
•changes or fluctuations in skilled technician headcount levels;
•timing of technician non-billable hours primarily associated with holiday, paid time off and training programs;
•the effectiveness of integrating acquired businesses and new start-up locations; and
•timing of acquisitions and new location openings and related costs.
In addition, the Company incurs various costs when integrating newly acquired businesses or opening new start-up locations, and the profitability of a new location is generally expected to be lower in the initial months or years of operation.
The Company is subject to competition, which may have an adverse effect on the Company’s business by reducing the Company’s ability to increase or maintain revenues or profitability.
The equipment dealership and rental industries are highly competitive and fragmented. Many of the markets in which the Company operates are served by a large number of competitors, ranging from national and multi-regional equipment dealerships and rental companies to small, independent businesses with a limited number of locations. Some of the Company’s competitors have significantly greater financial, marketing, and other resources than the Company does, and may be able to reduce rental rates or sales prices in the market, which could negatively impact our business. The Company may encounter increased competition from existing competitors or new market entrants in the future which could have an adverse effect on the Company’s business, financial condition and results of operations.
The Company is subject to the ability of our OEMs to deliver cost competitive equipment and parts timely.
To the extent the cost of our OEMs equipment is not competitive versus our competition’s equipment, the Company could suffer lost sales and market share over time. This loss of market share would ultimately reduce our serviceable field population of equipment which yields revenues in our high-margin product support departments. Additionally, to the extent our OEMs replacement parts are not cost competitive versus the competition this could impact the total cost of ownership of a piece of equipment from a customer perspective and ultimately lead to lost sales for the Company.
The Company purchases a significant amount of our equipment from a limited number of manufacturers. Termination of one or more of the Company’s relationships with any of those manufacturers could have an adverse effect on the Company’s business.
The Company purchases most of our sales and rental equipment, and aftermarket parts from leading, internationally known OEMs. During the year ended December 31, 2024, approximately 58% of the Company’s equipment and aftermarket parts sales were purchased from five major manufacturers (Volvo, Hyster-Yale, Kubota, CNH, and JCB). Although the Company believes we have alternative sources of supply for equipment sales and aftermarket parts we purchase in each of our core product categories, termination of one or more of the Company’s relationships with any of these major suppliers could have an adverse effect on the Company’s business, financial condition and results of operations if we were unable to obtain an adequate replacement supplier.
The Company is dependent upon the success and continued viability of our OEM suppliers for which we are distributors.
The success of our business is, to a certain degree, dependent on our OEMs in several key respects. First, we rely on our various OEMs for our new equipment and replacement parts inventory. Our ability to sell new equipment is dependent on an OEM’s ability to design, manufacture, and allocate to our branch locations an attractive, high-quality, and desirable product mix at the right time and at the right price in order to satisfy customer demand. Second, some of the Company's OEMs support their dealers by providing direct floor plan lending for new, used and rental equipment through related-party OEM captive finance companies. To the extent an OEMs commercial business suffers it could have an adverse effect on its related OEM captive finance company, and vice versa. Third, manufacturers provide product warranties and, in some cases, service contracts to customers. Our technicians perform warranty and service contract work for equipment under manufacturer product warranties and service contracts, and we direct bill the manufacturer as opposed to invoicing the customer. At any particular time, we have significant receivables from manufacturers for warranty and service work performed for customers. In addition, we rely on manufacturers to varying extents for training, product brochures and point of sale materials, and other items for our operation. Our business, results of operations, and financial condition could be adversely affected as a result of any event that has an adverse effect on our equipment OEMs.
Some of the Company’s suppliers of new equipment and aftermarket parts may appoint additional distributors, sell directly, or unilaterally terminate the Company’s distribution agreements, which could have an adverse effect on the Company’s business due to a reduction of, or inability to increase, the Company’s revenues.
The Company is a distributor of new equipment and parts supplied by leading, nationally recognized suppliers. In certain instances, under the Company’s distribution agreements with these suppliers, manufacturers may generally retain the right to appoint additional dealers and sell directly to national accounts and government agencies. Additionally, most of our distribution agreements grant our suppliers the right to unilaterally terminate distribution agreements with the Company at any time without cause. Any such actions could have an adverse effect on the Company’s business, financial condition and results of operations.
The cost of new equipment the Company sells or purchases for use in our rental fleet may increase and the Company may not be able to pass these increases along to customers or otherwise offset these cost increases in our operation.
The cost of new equipment from manufacturers that the Company sells or purchases for use in our rental fleet may increase as a result of increased raw material costs, including increases in the cost of steel which is a primary material used in most of this equipment, or due to increased regulatory requirements, such as those related to taxes, tariffs or emissions. These increases could materially impact the Company’s financial condition and results of operations in future periods if the Company is not able to pass such cost increases through to the Company’s customers. Similarly, any increase in the cost of parts the Company purchases for resale could materially impact the Company’s financial condition and results of operations in future periods if the Company is not able to pass such cost increases through to the Company’s customers.
The Company’s rental fleet and used equipment is subject to market value risk.
The market value of any given piece of rental or used equipment could be less than its depreciated value at the time it is sold. The market value of used equipment depends on several factors including: the market price for new equipment of a like kind; wear and tear on the equipment relative to its age; worldwide and domestic demands for used equipment; the supply of used equipment on the market; and general economic conditions. Additionally, the Company’s collateral base for borrowings, and thus available liquidity, is linked to the market value, obtained via third-party appraisals, of its rental fleet and used equipment. Any significant decline in the selling prices for used equipment could have an adverse effect on the Company’s business, available liquidity, financial condition and results of operations.
The Company incurs maintenance and repair costs associated with our rental fleet equipment that could have an adverse effect on our business in the event these costs are greater than anticipated.
As the Company’s fleet of rental equipment ages, the cost of maintaining such equipment generally increases, if not replaced within a certain period of time. Determining the optimal age for the Company’s rental fleet equipment is based on subjective estimates made by the Company’s management team. The Company’s future operating results could be adversely affected because the Company’s maintenance and repair costs on our rental fleet may be higher than anticipated.
Security breaches and other disruptions in the Company’s IT systems, including the Company’s ERP system, could limit the Company’s capacity to effectively monitor and control our operations, compromise ours or our employees', customers’ and suppliers’ confidential information, or otherwise adversely affect the Company’s operating results or business reputation.
The Company’s IT systems, some of which are managed by third parties, facilitate the Company’s ability to monitor and control the Company’s operations and adjust to changing market conditions, including processing, transmitting, storing, managing, and supporting a variety of business processes, activities, and information. Further, as the Company pursues a strategy to grow through acquisitions and pursue new initiatives that require IT solutions, we are expanding our information technologies, resulting in a larger technological presence and corresponding exposure to cybersecurity risk, including emerging risks posed by artificial intelligence.
Any disruption in any of these systems, including the Company’s customer management system, or the failure of any of these systems to operate as expected could, depending on the magnitude of the problem, adversely affect the Company’s operating results by limiting the Company’s capacity to effectively monitor and control the Company’s operations and adjust to changing market conditions, which in turn could adversely affect our financial results, stock price and reputation.
The Company collects and stores sensitive data, including proprietary business information and the proprietary business information of the Company’s customers and suppliers, in data centers and on IT networks, including cloud-based networks. The secure operation of these IT networks and the processing and maintenance of this information is critical to the Company’s business operations and strategy. Despite security measures and business continuity plans, the Company’s IT networks and infrastructure are vulnerable to damage, disruptions or shutdowns due to the threat of attacks by cyber criminals, breaches due to employee error or malfeasance or other disruptions during the process of upgrading or replacing computer software or hardware, power outages, computer viruses, telecommunication or utility failures, terrorist acts, natural disasters or other catastrophic events. The Company faces risks from cybersecurity threats that could potentially have an adverse effect on our business, financial condition, results of operations, cash flows and reputation. Although such risks have not materially affected our business, to date, we have experienced various immaterial threats to our data and systems. The growing use and rapid evolution of technology, including mobile devices, has heightened the risk of unintentional data breaches or leaks. The occurrence of any of these events could compromise the Company’s networks, and the information stored there could be accessed, publicly disclosed, lost or stolen. In addition, the Company may need to invest additional resources to protect the security of the Company’s systems or to comply with evolving privacy, data security, cybersecurity, and data protection laws applicable to the Company’s business.
Any failure to effectively prevent, detect, and/or recover from any breach, disclosure or other loss of information, or to comply with any such current or future law related thereto, could result in legal claims or proceedings, liability or regulatory penalties under laws protecting the privacy of personal information, disrupt operations, and damage the Company’s reputation, which could adversely affect the Company’s business, stock price and reputation.
We are in the midst of a multiyear process of implementing a new ERP system. Implementing a new ERP system is not only costly but complex and difficult. Implementing a new ERP system can negatively affect not only financial accounting and reporting processes, but also external commercial activities such as order receipt and product delivery. We cannot be assured that we will successfully implement our new ERP system or that we will avoid these and other negative impacts from our implementation efforts.
Fluctuations in fuel costs or reduced supplies of fuel could harm the Company’s business.
The Company could be adversely affected by limitations on fuel supplies or significant increases in fuel prices that result in higher costs related to deploying the Company’s field service fleet and for transporting equipment from one location to another. A significant or protracted disruption of fuel supplies could have an adverse effect on the Company’s financial condition and results of operations.
The Company is dependent on key personnel. A loss of key personnel could have an adverse effect on the Company’s business which could result in a decline in the Company’s revenues and profitability.
The Company’s success is dependent, in part, on the experience and skills of the Company’s management team. Competition for top management talent within the Company’s industry is generally significant. If the Company is unable to recruit and keep talent in all of the Company’s senior management positions, or if the Company loses the services of any key member of the Company’s senior management team and is unable to find a suitable replacement in a timely manner, the Company may be challenged to effectively manage our business and execute our strategy.
If the Company fails to maintain an effective system of internal controls, the Company may not be able to accurately report financial results or prevent fraud and losses of investor confidence and an adverse impact on our stock price could result.
If we are unable to maintain effective internal control over financial reporting or disclosure controls and procedures, as such standards are modified, supplemented or amended from time to time, our ability to record, process and report financial information accurately, prevent fraud, and to prepare financial statements within required time periods could be adversely affected. This could subject us to regulatory scrutiny, civil or criminal penalties, stockholder litigation or investigations requiring management resources and payment of legal and other expenses as well as negatively affect investor confidence in our financial statements and adversely impact our stock price.
There can be no assurance the Company will be able to maintain a system of internal controls that fully complies with the requirements of the Sarbanes-Oxley Act or that the Company’s management and independent registered public accounting firm will conclude the Company’s internal controls are effective.
Labor disputes could disrupt the Company’s ability to serve our customers and/or lead to higher labor costs.
The Company has approximately 700 employees who are covered by a collective bargaining agreement and approximately 2,200 employees who are not represented by unions or covered by collective bargaining agreements. Various unions periodically seek to organize certain departments and/or locations of the Company’s non-union employees. Union organizing efforts or collective bargaining negotiations could potentially lead to work stoppages, strikes and/or slowdowns by certain employees of the Company, which could adversely affect the Company’s ability to serve our customers. Further, the inability to reach a feasible agreement could lead to the exit of a region, business line or segment, which could have an adverse effect on our results of operations. Lastly, settlement of actual or threatened labor disputes or an increase in the number of the Company’s employees covered by collective bargaining agreements could have adverse effects on the Company’s labor costs, productivity and business flexibility.
Increases in healthcare, pension and other costs under the Company’s benefit plans could adversely affect our financial condition and results of operations.
We provide single employer and multiemployer health, defined benefit pension and defined contribution benefits to many of our employees. The costs of such benefits continue to increase, and the extent of any increase depends on a number of different factors, many of which are beyond our control. These factors include governmental regulations such as The Patient Protection and Affordable Care Act, which resulted in changes to the U.S. healthcare system and impose mandatory types of coverage, reporting and other requirements on U.S. companies; return on plan assets; changes in actuarial valuations, estimates, or assumptions used to determine our benefit obligations for certain benefit plans, which require the use of significant estimates, including the discount rate, expected long-term rate of return on plan assets, mortality rates and the rates of increase in compensation and healthcare costs; for multiemployer plans, the outcome of collective bargaining and actions taken by trustees who manage the plans; and potential changes to applicable legislation or regulation.
The Company has various health plans that cover eligible employees, including a self-insured group health plan, workers compensation, and auto coverage which contain certain stop-loss provisions. While we endeavor to purchase insurance coverage appropriate to our risk assessment, we are unable to predict with certainty the frequency, nature or magnitude of claims. Our business may be adversely impacted if our insurance proves to be inadequate. In addition, claims associated with risks we have retained through our self-insurance may exceed our recorded liabilities which could negatively impact future earnings. Accrued health insurance for both known claims and an estimated amount of claims incurred but not reported was $5.1 million and $3.1 million, as of December 31, 2024 and 2023, respectively. Also, if there are significant increases in healthcare costs, the premiums paid by the Company could adversely affect the Company's financial condition and results of operations. Health benefit plan expenses, including benefits paid and insurance premiums, totaled approximately $30.9 million, $29.9 million, and $25.6 million for the years ended December 31, 2024, 2023 and 2022, respectively. If we are unable to control these benefits and costs, we may experience increased operating costs, which may adversely affect our financial condition and results of operations.
Risks Related to the Company’s Growth, Acquisitions and Integration
The Company may not be able to identify or complete transactions with attractive acquisition candidates. Future acquisitions may result in significant transaction expenses, and the Company may experience integration and consolidation risks.
An important element of the Company’s growth strategy is to selectively pursue, on an opportunistic basis, acquisitions of additional businesses, in particular companies that complement the Company’s existing business and footprint. The success of this element of the Company’s growth strategy depends, in part, on selecting strategic acquisition candidates at attractive prices and effectively integrating their businesses into the Company’s own, including with respect to financial reporting and regulatory matters. The Company cannot assure you we will be able to identify attractive acquisition candidates or complete the acquisition of any identified candidates at favorable prices or upon advantageous terms and conditions.
The Company may not have sufficient management, financial, and other resources to integrate and consolidate any future acquisitions. Any significant diversion of management’s attention or any major difficulties encountered in the integration of the businesses the Company acquires could have an adverse effect on the Company’s business, financial condition and results of operations, which could decrease the Company’s profitability and make it more difficult for the Company to grow. Among other things, these integration risks could include:
•the loss of key employees;
•disruption of operations and business;
•retention or transition of existing customers and vendors;
•integration of corporate cultures and maintenance of employee morale;
•inability to maintain and increase competitive presence;
•customers and revenue losses;
•the inability to properly implement the Company's standards, control procedures, and policies;
•problems with the assimilation of new operations, sites or personnel, which could divert resources from the Company’s regular operations;
•impairment of goodwill or other acquisition-related intangible assets;
•integration of financial reporting, treasury, and regulatory reporting functions; and/or
•potential unknown liabilities.
In addition, general economic conditions or unfavorable capital and credit markets could affect the timing and extent to which the Company can successfully acquire or integrate new businesses, which could limit the Company’s revenues and profitability and make it more difficult for the Company to grow.
The Company may not be able to facilitate our growth strategy by identifying and opening start-up locations, which could limit the Company’s revenues and profitability.
An element of the Company’s growth strategy is to selectively identify and implement start-up locations in order to add new customers. The success of this element of the Company’s growth strategy depends, in part, on identifying strategic start-up locations. The Company cannot be sure we will be able to identify attractive start-up locations and opening start-up locations may involve significant costs and limit the Company’s ability to expand our operations.
The Company may not have sufficient management, financial, and other resources to successfully operate new locations. Any significant diversion of management’s attention or any major difficulties encountered in the locations the Company opens in the future could have an adverse effect on the Company’s business, financial condition and results of operations, which could decrease the Company’s profitability and make it more difficult for the Company to grow.
The Company may not be able to successfully or profitably launch our commercial electric vehicle and hydrogen related businesses.
With our existing expertise in electro-mobility, we have elected to pursue the strategic opportunity to leverage our knowledge to meet the growing demand for zero-emission commercial vehicles and deliver service to commercial vehicle fleet customers within our existing territories. This strategic opportunity requires us to devote certain resources to it, including the time and attention of management. Failure to execute on this plan or a failure of the Company, or our partners, in its choice of strategy to pursue zero-emission commercial vehicles or to successfully capitalize on its strategy could cause a diversion of management’s attention and have an adverse effect on the Company’s business, financial condition and results of operations, which could decrease the Company’s profitability and make it more difficult for the Company to grow. In an effort related to accelerating the adoption of zero-emissions commercial electric vehicles and lift trucks, the Company is also in the process of investing in a hydrogen gas production plant, as compressed hydrogen gas powers hydrogen fuel cells for several of our current lift truck customers. We believe, like several other market participants, that hydrogen gas will also power fuel cell electric vehicles in the future. To the extent we are unable to execute on our plan to produce and sell hydrogen gas to our customers, or the adoption of hydrogen consuming vehicles and lift trucks in the marketplace does not develop, it could have an adverse effect on the Company’s profitability and make it more difficult for the Company to grow.
If we determine our goodwill or other intangible assets have become impaired, we may incur impairment charges which would negatively impact our operating results.
At December 31, 2024, we had $77.5 million of goodwill and $54.7 million of other intangible assets on our Consolidated Balance Sheet. Goodwill represents the excess of purchase price over the fair value of net assets acquired in business combinations. We assess potential impairment of our goodwill and other intangible assets at least annually. Impairment may result from significant changes in the manner of use of the acquired assets, negative industry or economic trends, and/or significant underperformance relative to historic or projected operating results. For a discussion of our goodwill and long-lived assets impairment testing, see “Evaluation of Goodwill Impairment” and "Evaluation of Long-lived Asset Impairment (excluding goodwill)" in Note 2, Summary of Significant Accounting Policies.
Financial Risks and Risks Related to our Indebtedness and Liquidity
The Company’s substantial indebtedness could adversely affect the Company’s financial condition.
The Company has, and will continue to have, a significant amount of indebtedness outstanding. The Company’s indebtedness may result in important consequences, such as:
•increasing the Company’s vulnerability to general adverse economic, industry, and competitive conditions;
•requiring the Company to dedicate a substantial portion of our cash flow from operations to payments on our indebtedness, thereby reducing the availability of our cash flows to fund working capital, capital expenditures, acquisitions, and other general corporate initiatives;
•limiting the Company’s flexibility in planning for, or reacting to, changes in the Company’s business and the industry in which we operate;
•making it more difficult to refinance or pay our debts as they become due during adverse economic, financial market, or industry conditions;
•placing the Company at a competitive disadvantage compared to our competitors that have less debt;
•resulting in a downgrade in our credit rating, which could increase the cost of further borrowings;
•requiring our debt to become due and payable upon a change in control; and
•limiting the Company’s ability to obtain additional financing for working capital, capital expenditures, acquisitions or general corporate purposes.
The Company expects to use cash flow from operations and borrowings under our credit facilities to meet our current and future financial obligations, including funding our operations, service debt, and capital expenditures. The Company’s business may not generate sufficient cash flow from operations in the future, which could result in the Company being unable to repay indebtedness or to fund other liquidity needs.
The Company may not be able to generate sufficient cash flow to service all of the Company’s indebtedness and may be forced to take other actions to satisfy our obligations under our indebtedness, which may not be successful.
The Company’s ability to make scheduled debt payments depends on our financial and operating performance, which is subject to prevailing economic and competitive conditions and to certain financial, business, legislative, regulatory and other factors beyond the Company’s control. The Company cannot make assurances we will maintain a level of cash flows from operating activities sufficient to permit us to pay scheduled payments of principal and interest on the Company’s indebtedness. In the absence of adequate operating performance, the Company could face substantial liquidity problems and might be required to dispose of material assets or operations to meet our debt service and other obligations. The Company may not be able to consummate those dispositions, and any proceeds we do receive from a disposition may not be adequate to meet any debt service obligations then due.
If the Company’s cash flows and capital resources are insufficient to fund our debt service obligations, the Company may be forced to reduce or delay business activities and capital expenditures, sell assets or operations, seek additional capital or restructure or refinance all or a portion of our indebtedness. The Company cannot make any assurances we will be able to accomplish any of these alternatives on a timely basis or on satisfactory terms or at all, or that these actions would enable us to continue to satisfy our capital requirements. In addition, our existing debt agreements, as well as any future debt agreements, contain or may contain restrictive covenants, which may prohibit us from adopting any of these alternatives. Our failure to comply with these covenants could result in an event of default which, if not cured or waived, could result in the acceleration of all our debt.
The agreements governing credit facilities may restrict the Company’s business and our ability to engage in certain corporate and financial transactions.
The agreements governing the credit facilities contain certain covenants that, among other things, may restrict or limit the Company and its subsidiaries’ ability to:
•pay dividends (including dividends on preferred and common stock) and make distributions;
•make acquisitions or investments;
•enter into transactions with affiliates;
•enter into sale and lease-back transactions;
•merge or consolidate; and
•transfer and sell assets.
Events beyond the Company’s control may also affect our ability to comply with other provisions governing the Company’s credit facilities. The Company’s failure to comply with obligations under the agreements may result in an event of default. A default, if not cured or waived, may permit acceleration of this indebtedness and the Company’s other indebtedness. The Company may not be able to remedy these defaults. If the Company’s indebtedness is accelerated, we may not have sufficient funds available to pay the accelerated indebtedness and may not have the ability to refinance the accelerated indebtedness on terms favorable to the Company or at all.
The Company relies on OEM captive finance companies to provide floor plan financing primarily for new equipment. This OEM captive floor plan financing provides for a large portion of the Company’s ongoing working capital requirements. The Company’s liquidity position, financial condition, cash flows and results from operations could be adversely affected in the event any of our OEM captive finance company agreements were terminated and/or amended to the detriment of the Company.
As our OEM captive floor plan finance agreements are annually renewing and subject to ongoing credit review, which can be judgment-based and over which the Company has no control, the Company cannot make any assurances that our OEM captive finance agreements will be renewed in the future or renewed with terms that are favorable to the Company. To the extent we are unable to renew, or renew on favorable terms, any of our OEM captive floor plan finance agreements our liquidity position, financial condition, cash flows and results from operations could be adversely impacted.
The Company’s business could be adversely affected if we are unable to obtain additional capital as required and could result in a decrease in the Company’s revenues and profitability. In addition, the Company’s inability to refinance our indebtedness on favorable terms, or at all, could adversely affect the Company’s liquidity and our ongoing results of operations.
The cash the Company generates from our business, together with cash we may borrow, if credit is available, may not be sufficient to fund the Company’s operations or capital requirements. The Company may require additional financing to obtain capital for, among other purposes, purchasing equipment, completing acquisitions, establishing new locations and to repay or refinance existing indebtedness. Any additional indebtedness the Company incurs will make us more vulnerable to business downturns and limit the Company’s ability to withstand competitive pressures. Moreover, the Company may not be able to obtain additional capital on acceptable terms, if at all. If we are unable to obtain sufficient additional financing in the future, the Company’s business could be adversely affected.
In addition, prevailing interest rates or other factors at the time of refinancing could increase the Company’s interest expense. A refinancing of the Company’s indebtedness could also require us to comply with more onerous covenants and further restrict the Company’s business operations. The Company’s inability to refinance its indebtedness or to do so upon attractive terms could materially and adversely affect the Company’s business prospects, results of operations and cash flows, financial condition, and make us vulnerable to adverse industry and general economic conditions.
Unfavorable conditions or disruptions in the capital and credit markets may adversely impact business conditions and the availability of credit.
Disruptions in the global capital and credit markets as a result of an economic downturn, economic uncertainty, changing or increased regulation, reduced alternatives or failures of significant financial institutions could adversely affect the Company’s customers’ ability to access capital and could adversely affect the Company’s access to liquidity needed to fund business operations in the future. Additionally, unfavorable financial market conditions may depress demand for the Company’s products and services and/or make it difficult for the Company’s customers to obtain financing and credit on reasonable terms. Unfavorable financial market conditions also may cause more of the Company’s customers to be unable to meet their payment obligations to the Company, increasing delinquencies and credit losses. If the Company is unable to manage credit risk or customer risk adequately, the Company’s credit losses could increase above historical levels and the Company’s operating results would be adversely affected. The Company’s suppliers may also be adversely impacted by unfavorable capital and credit markets, causing disruption or delay of product availability or their competitiveness in the market overall. Additionally, many of our key OEM suppliers provide floor plan financing to the Company through related party captive finance companies (e.g. Volvo Financial Services). To the extent our OEM captive finance partners are impacted by unfavorable capital and/or credit market conditions, the Company’s liquidity position, ability to borrow, or ability to borrow at favorable rates could be adversely impacted. These events could negatively impact the Company’s business, financial condition, results of operations and cash flows.
Risk Related to Our Series A Preferred Stock and Depositary Shares
The Series A Preferred Stock and the depositary shares rank junior to all our indebtedness and other liabilities and are effectively junior to all indebtedness and other liabilities of our subsidiaries.
In the event of our bankruptcy, liquidation, dissolution or winding-up of our affairs, our assets will be available to pay obligations on the Series A Preferred Stock only after all our indebtedness and other liabilities have been paid. The rights of holders of the Series A Preferred Stock to participate in the distribution of our assets will rank junior to the priority claims of our current and future creditors and any future series or class of preferred stock we may issue that ranks senior to the Series A Preferred Stock. In addition, the Series A Preferred Stock effectively ranks junior to all existing and future indebtedness and other liabilities of our existing subsidiaries and any future subsidiaries. Our existing subsidiaries are, and any future subsidiaries would be, separate legal entities and have no legal obligation to pay any amounts with respect to dividends due on the Series A Preferred Stock. If we are forced to liquidate our assets to pay our creditors, we may not have sufficient assets to pay amounts due on any or all of the Series A Preferred Stock then outstanding. We and our subsidiaries have incurred and may in the future incur substantial amounts of debt and other obligations that will rank senior to the Series A Preferred Stock. We may incur additional indebtedness and become more highly leveraged in the future, which could harm our financial position and potentially limit our cash available to pay dividends. As a result, we may not have sufficient funds remaining to satisfy our dividend obligations relating to our Series A Preferred Stock if we incur additional indebtedness. In addition, our existing credit arrangements include events of default which could result in acceleration of such indebtedness upon the occurrence of certain events, including failure to meet certain financial covenants.
We may not be able to pay dividends on the Series A Preferred Stock if we have insufficient cash or available ‘surplus’ as defined under Delaware law to make such dividend payments.
Our ability to pay cash dividends on the Series A Preferred Stock is restricted by Delaware law and generally requires us to have either net profits or positive net assets (total assets less total liabilities) as calculated in accordance with the Delaware General Corporation Law, and that we have sufficient working capital in order to be able to pay our debts as they become due in the usual course of business. Our ability to pay dividends may be impaired by a number of factors, including the other risks identified herein. Also, our payment of dividends depends upon our financial condition and other factors as our Board of Directors may deem relevant from time to time. Our businesses may not generate sufficient cash flow from operations or future borrowings may not be available to us in an amount sufficient to enable us to fund our liquidity needs and pay dividends on the Series A Preferred Stock.
Our depositary shares representing interests in the Series A Preferred Stock have extremely limited voting rights.
The voting rights of holders of our depositary shares are limited. Our common stock is the only class of our securities that carries full voting rights. Voting rights for holders of depositary shares exist primarily with respect to the ability to elect (together with the holders of other outstanding series of our preferred stock, or depositary shares representing interests in our preferred stock, or additional series of preferred stock we may issue in the future and upon which similar voting rights have been or are in the future conferred and are exercisable) two additional directors to our Board of Directors in the event six quarterly dividends (whether or not declared or consecutive) payable on the Series A Preferred Stock are in arrears, and with respect to voting on amendments to our articles of incorporation or certificate of designation (in some cases voting together with the holders of other outstanding series of our preferred stock as a single class) that adversely affect the rights of the holders of depositary shares representing interests in the Series A Preferred Stock (and other series of preferred stock, as applicable) or create additional classes or series of our stock that are senior to the Series A Preferred Stock, provided that in any event adequate provision for redemption has not been made. Other than the limited circumstances included in the certificate of designations for the Series A Preferred Stock and the agreement creating the depositary shares, holders of depositary shares will not have any voting rights.
Legal and Regulatory Risks Related to the Company’s Operations
The Company is exposed to various risks related to legal proceedings or claims that could adversely affect the Company’s operating results. The nature of the Company’s business exposes us to various liability claims, which may exceed the level of the Company’s insurance coverage resulting in the Company not being fully protected.
The Company is a party to lawsuits in the normal course of business. Litigation in general can be expensive, lengthy, and disruptive to normal business operations. Moreover, the results of complex legal proceedings are difficult to predict. Responding to lawsuits brought against the Company, or legal actions that the Company may initiate, can often be expensive and time-consuming. Unfavorable outcomes from these claims and/or lawsuits could adversely affect the Company’s business, results of operations and financial condition, and the Company could incur substantial monetary liability and/or be required to change our business practices.
The Company’s business exposes us to claims for personal injury, death or property damage resulting from the use of the equipment we rent or sell and from injuries caused in motor vehicle accidents in which the Company’s delivery and service personnel are involved and claims related to other employee related matters. Additionally, the Company could be subject to potential litigation associated with compliance with various laws and governmental regulations at the federal, state or local levels, such as those relating to the protection of persons with disabilities, employment, health, safety, security and other regulations under which the Company operates.
The Company carries comprehensive insurance, subject to deductibles, at levels we believe are sufficient to cover existing and future claims made during the respective policy periods. However, the Company may be exposed to multiple claims, and, as a result, could incur significant out-of-pocket costs before reaching the deductible amount which could adversely affect the Company’s financial condition and results of operations. In addition, the cost of such insurance policies may increase significantly upon renewal of those policies as a result of general rate increases for the type of insurance the Company carries as well as the Company’s historical experience and experience in the Company’s industry. Although the Company has not experienced any material losses that were not covered by insurance, the Company’s existing or future claims may exceed the coverage level of the Company’s insurance, and such insurance may not continue to be available on economically reasonable terms, or at all. If the Company is required to pay significantly higher premiums for insurance, is not able to maintain insurance coverage at affordable rates or if we must pay amounts in excess of claims covered by the Company’s insurance, the Company could experience higher costs that could adversely affect the Company’s financial condition and results of operations.
The Company has operations throughout the U.S. and Canada and purchases capital goods from Europe which exposes us to multiple international, federal, state and local regulations. Changes in applicable law, regulations or requirements, or the Company’s material failure to comply with any of them, can increase the Company’s costs and have other negative impacts on the Company’s business.
The Company’s 80 branch locations in the U.S. are located in 15 different states, which exposes us to different federal, state, and local regulations and taxation. The Company also has seven locations throughout Canada and acquires inventory from Europe which exposes us to foreign regulations and taxation as well. These laws and requirements address multiple aspects of the Company’s operations, such as worker safety, consumer rights, privacy, employee benefits, taxation, securities law compliance and more, and can often have different requirements in different jurisdictions. Changes in these requirements, or any material failure by the Company to comply with them, could increase the Company’s costs, affect our reputation, limit our business, consume management’s time and attention or otherwise generally impact our operations and financial results in adverse ways.
The Company could be adversely affected by environmental and safety requirements which could force us to use significant capital resources, increase operational costs and/or may subject us to unanticipated liabilities.
The Company’s operations, like those of other companies engaged in similar businesses, require the handling, use, storage, and disposal of certain regulated materials. As a result, the Company is subject to the requirements of federal, state, and local environmental and occupational health and safety laws and regulations. The Company is subject to potentially significant civil or criminal fines or penalties if we fail to comply with any of these requirements. The Company has made, and will continue to make, capital and other expenditures in order to comply with these laws and regulations, but the requirements of these laws and regulations are complex, change frequently, and could become more stringent in the future. It is possible that these requirements will change or that liabilities will arise in the future in a manner that could have an adverse effect on the Company’s business, financial condition and results of operations.
Environmental laws also impose obligations and liability for the cleanup of properties affected by hazardous substance spills or releases. These liabilities can be imposed on the parties generating or disposing of such substances or the operator of the affected property, often without regard to whether the owner or operator knew of, or was responsible for, the presence of hazardous substances. Accordingly, the Company may become liable, either contractually or by operation of law, for remediation costs even if a contaminated property is not currently owned or operated by the Company, or if the contamination was caused by third parties during or prior to the Company’s ownership or operation of the property. Given the nature of the Company’s operations (which involve the use of batteries, petroleum products, solvents and other hazardous substances for fueling and maintaining the Company’s equipment and vehicles), there can be no assurance that prior site assessments or investigations have identified all potential instances of soil or groundwater contamination.
In the future, international, federal, state, or local governments could enact new or more stringent laws or issue new or more stringent regulations concerning environmental and worker health and safety matters or effect a change in their enforcement of existing laws or regulations, that could affect our operations. There can be no assurance that we, or various environmental regulatory agencies, will not discover previously unknown environmental non-compliance or contamination, for which we could be held liable. It is possible that changes in environmental and worker health and safety laws or liabilities from newly discovered non-compliance or contamination could have an adverse effect on our business, financial condition and results of operations.
None.
Item 1C. Cybersecurity.
Governance
Governance and oversight of cybersecurity risks and strategies form a core component of our risk management framework. Recognizing the critical importance of cybersecurity in protecting our operations and preserving shareholder value, we have established a governance structure that emphasizes risk identification, management, and mitigation across our organization.
Central to our governance approach is the involvement of our Audit Committee, which maintains oversight over the Company's cybersecurity strategy.
Key to the Audit Committee's role is its periodic engagement with our cybersecurity team, as further described below, which provides direct communication and alignment on cybersecurity matters between members of our board and management. During these critical meetings, several pivotal areas are reviewed to assess the adequacy and effectiveness of our cybersecurity measures:
•Incident Response: Evaluation of our readiness and response strategies to potential cybersecurity incidents.
•Cybersecurity Industry Updates: Review of recent industry developments (i.e., new threats/tactics, industry news) to focus on compliance and adaptation of our strategies accordingly.
•Acquisition Security Integration: Discussion on the security aspects of recent or upcoming acquisitions, focusing on the integration of their cybersecurity frameworks into our broader security posture.
•Employee Security Awareness and Training: Information regarding our regular testing and training of employees is presented and discussed.
•Penetration Test Results: Analysis of our regular penetration testing exercises, which help identify vulnerabilities and strengthen our defenses.
•Questions and Answers: An open forum for the Audit Committee to seek clarifications and provide guidance on cybersecurity matters, fostering a culture of transparency and continuous improvement.
This structured approach to governance and oversight, with an emphasis on receiving feedback allows us to align across the Alta organization. By prioritizing the identification and management of cybersecurity risks, we aim to safeguard our assets and maintain the continuity of our business operations in the face of evolving cyber threats.
Management
Our Senior Director of IT and Director of Security and Compliance have primary responsibility for assessing and managing cybersecurity risks. An internal team of cybersecurity professionals execute our cybersecurity program while our VP of Information Services provides executive oversight. Combined, our experts bring multiple decades of cybersecurity experience and have earned cybersecurity-related certifications. Our internal team is bolstered by strategic third-party security partners leveraged to provide 24x7 monitoring and response. Third parties routinely assess our security practices providing tactical assistance or strategic guidance through audits and penetration tests. All members of the team routinely discuss emerging security threats and ways to mitigate risk.
Strategy
We utilize an in-depth layered approach to security. This allows us to respond and mitigate cybersecurity risks, underscoring our commitment to the confidentiality, integrity, and availability of our data and systems. The Company has processes to oversee and identify risks from cybersecurity threats associated with our use of third-party service providers. Our strategy includes the deployment of advanced security products and penetration testing to identify and mitigate vulnerabilities by continuous vulnerability scanning and monitoring by both internal and external teams. This approach is bolstered by backup and recovery protocols, including data resilience, email security measures and endpoint detection and response systems to thwart malicious activities.
Additionally, our commitment to security is evident in our security awareness training for all employees, dark web monitoring, and 24x7 threat monitoring.
Our incident response plan is designed to address security incidents effectively, supported by stringent information security policies and the implementation of a security information and event manager system for real-time analysis and reporting of security events and incidents. As part of our security commitment, we undergo penetration testing to assess whether our necessary security controls are maintained.
The Company faces risks from cybersecurity threats that could potentially have an adverse effect on our business, financial condition, results of operations, cash flows and reputation. Although such risks have not materially affected our business, to date, we have experienced various immaterial threats to our data and systems. For more information about the cybersecurity risks we face, see the risk factor entitled “Security breaches and other disruptions in the Company’s IT systems, including the Company’s ERP system, could limit the Company’s capacity to effectively monitor and control our operations, compromise ours or our employees', customers’ and suppliers’ confidential information, or otherwise adversely affect the Company’s operating results or business reputation” in Item 1A. Risk Factors.
Item 2. Properties.
As of December 31, 2024, we leased substantially all our facilities used in our operations. These leases are generally with terms ranging from month-to-month at some locations to an expiration date in 2039 and are typically structured to include renewal options at our election. We believe our properties, taken as a whole, are in good operating condition, are suitable and adequate for our current business operations, and that additional or alternative space will be available on commercially reasonable terms for future use and expansion. The number of locations in each state, territory, province or country is shown in the table below, as is the number of locations that are in our Material Handling (MH), Construction (CE), Master Distribution (MD), and Corporate and Other (OTH) segments. Some locations contain operations in multiple segments but are listed as separate locations below.
| | | | |
United States |
Connecticut (MH 1, CE 1, OTH 1) | | Maine (MH 1, CE 1) | | Ohio (CE 2, MD 1) |
Florida (CE 10, OTH 1) | | Michigan (MH 10, CE 11, OTH 2) | | Pennsylvania (CE 4) |
Illinois (MH 4, CE 7, OTH 1) | | Nevada (MD 1) | | Rhode Island (MH 1) |
Indiana (MH 2, CE 1) | | New Hampshire (MH 1, CE 2) | | Vermont (MH 1) |
Massachusetts (MH 5, CE 1, OTH 1) | | New York (MH 9, CE 3, OTH 2) | | Virginia (MH 1) |
Canada |
Ontario (MH 3, CE 1, MD 1) | | Quebec (MH 1, CE 1) | | |
Item 3. Legal Proceedings.
The information required with respect to this item can be found in Note 11, Contingencies, of the notes to the consolidated financial statements contained in this Annual Report and is incorporated by reference into this Item 3.
Item 4. Mine Safety Disclosures.
Not applicable.
PART II
Item 5. Market for Registrant’s Common and Preferred Equity, Related Stockholder Matters and Issuer Purchases of Equity Securities.
Market Information
Our common stock is traded on the NYSE under the symbol “ALTG.” Our preferred stock depositary shares are traded on the NYSE under the symbol “ALTG PRA”.
Holders
As of March 3, 2025, there were 8 holders of record of our common stock and 1 holder of record of our preferred stock depositary shares.
Dividends
During the years ended December 31, 2024 and 2023, we paid quarterly cash dividends totaling $2,500 per share of our Series A Preferred Stock, or $2.50 per depositary share, which was $3.0 million each year.
During the years ended December 31, 2024 and 2023, we declared and paid quarterly cash dividends on common stock and dividend equivalents on stock-based compensation totaling $0.228 per share each year, which was $7.8 million and $7.6 million, respectively.
Our ability to pay cash dividends is restricted by Delaware law and generally requires us to have either net profits or positive net assets (total assets less total liabilities) as calculated in accordance with the Delaware General Corporation Law, and that we have sufficient working capital in order to be able to pay our debts as they become due in the usual course of business. The payment of cash dividends in the future, including payment of accrued dividends related to the depositary shares, will be dependent upon our revenues and earnings, expected capital requirements, compliance with our credit agreements and general financial condition. The payment of any cash dividends is within the discretion of our Board of Directors.
Securities Authorized for Issuance Under Equity Compensation Plans
The information called for by this item regarding equity compensation plans is incorporated by reference to Part III, Item 12 of this Annual Report on Form 10-K.
Recent Sales of Unregistered Securities; Use of Proceeds from Registered Offerings
In connection with the purchases of Ecoverse and Ault Industries, LLC ("Ault"), we issued 339,847 shares and 163,880 shares, respectively, during the year ended December 31, 2024 that were not registered under the Securities Act in reliance on the exemption from registration provided by Section 4(a)(2) of Securities Act of 1933, as amended.
Securities Repurchases
On July 6, 2022 the Company's Board approved a share repurchase program authorizing Alta to repurchase shares of our common stock for an aggregate purchase price of not more than $12.5 million. On October 30, 2024, the Company's Board of Directors approved an increase to the share repurchase program authorization from $12.5 million to $20.0 million. Subject to applicable rules and regulations, the Company may repurchase shares of our common stock from time to time in the open market or by negotiated transactions and in compliance with Rule 10b-18 of the Exchange Act. Such purchases will be at times and in amounts as the Company deems appropriate, based on market conditions, cash reserves, cash flow and the balancing of uses of cash for operations, growth, and share repurchase. The amount and timing of repurchases will be based on a variety of factors, including stock acquisition price, regulatory limitations and other market and economic factors. No limit was placed on the duration of the repurchase program. The stock repurchase program does not require the Company to repurchase any specific number of shares, and the Company may terminate the repurchase program at any time.
The table below sets forth information regarding repurchases by the Company of its common stock during the fourth quarter of 2024.
| | | | | | | | | | | | | | | | |
ISSUER PURCHASES OF EQUITY SECURITIES | |
Period | | Total number of shares purchased | | | Average price paid per share | | | Total number of shares purchased as part of publicly announced program | | | Approximate dollar value of shares that may yet be purchased under the program (in millions) (1) | |
October 1, 2024 - October 31, 2024 | | | — | | | | — | | | | — | | | | 18.0 | |
November 1, 2024 - November 30, 2024 | | | 218,152 | | | | 7.57 | | | | 218,152 | | | | 16.3 | |
December 1, 2024 - December 31, 2024 | | | 276,034 | | | | 7.75 | | | | 276,034 | | | | 14.2 | |
Total | | | 494,186 | | | | 7.67 | | | | 494,186 | | | | 14.2 | |
(1) Includes commission costs.
Performance Graph
The following graph compares the cumulative stockholder return ("CSR") of the Company's common stock as of the last trading day of each fiscal year since our initial public offering with that of the Russell 2000 Index and an industry peer group selected by us. The peer group for 2024 consists of the following companies: MRC Global Inc.; Herc Holdings Inc.; BlueLinx Holdings Inc.; Trinity Industries, Inc; MarineMax, Inc.; DNOW Inc.; The Manitowoc Company, Inc.; Titan Machinery Inc.; Custom Truck One Source, Inc.; OneWater Marine Inc.; DXP Enterprises, Inc.; H&E Equipment Services, Inc.; Astec Industries, Inc.; Monro, Inc.; Global Industrial Company; America’s Car-Mart, Inc.; and McGrath RentCorp. The peer groups used to calculate Peer Group CSR in prior years are disclosed in our 2024 and 2023 proxy statements.
The performance graph comparison assumes $100 was invested in our common stock, Russell 2000 Index and our peer group on February 14, 2020 and all dividends have been reinvested.
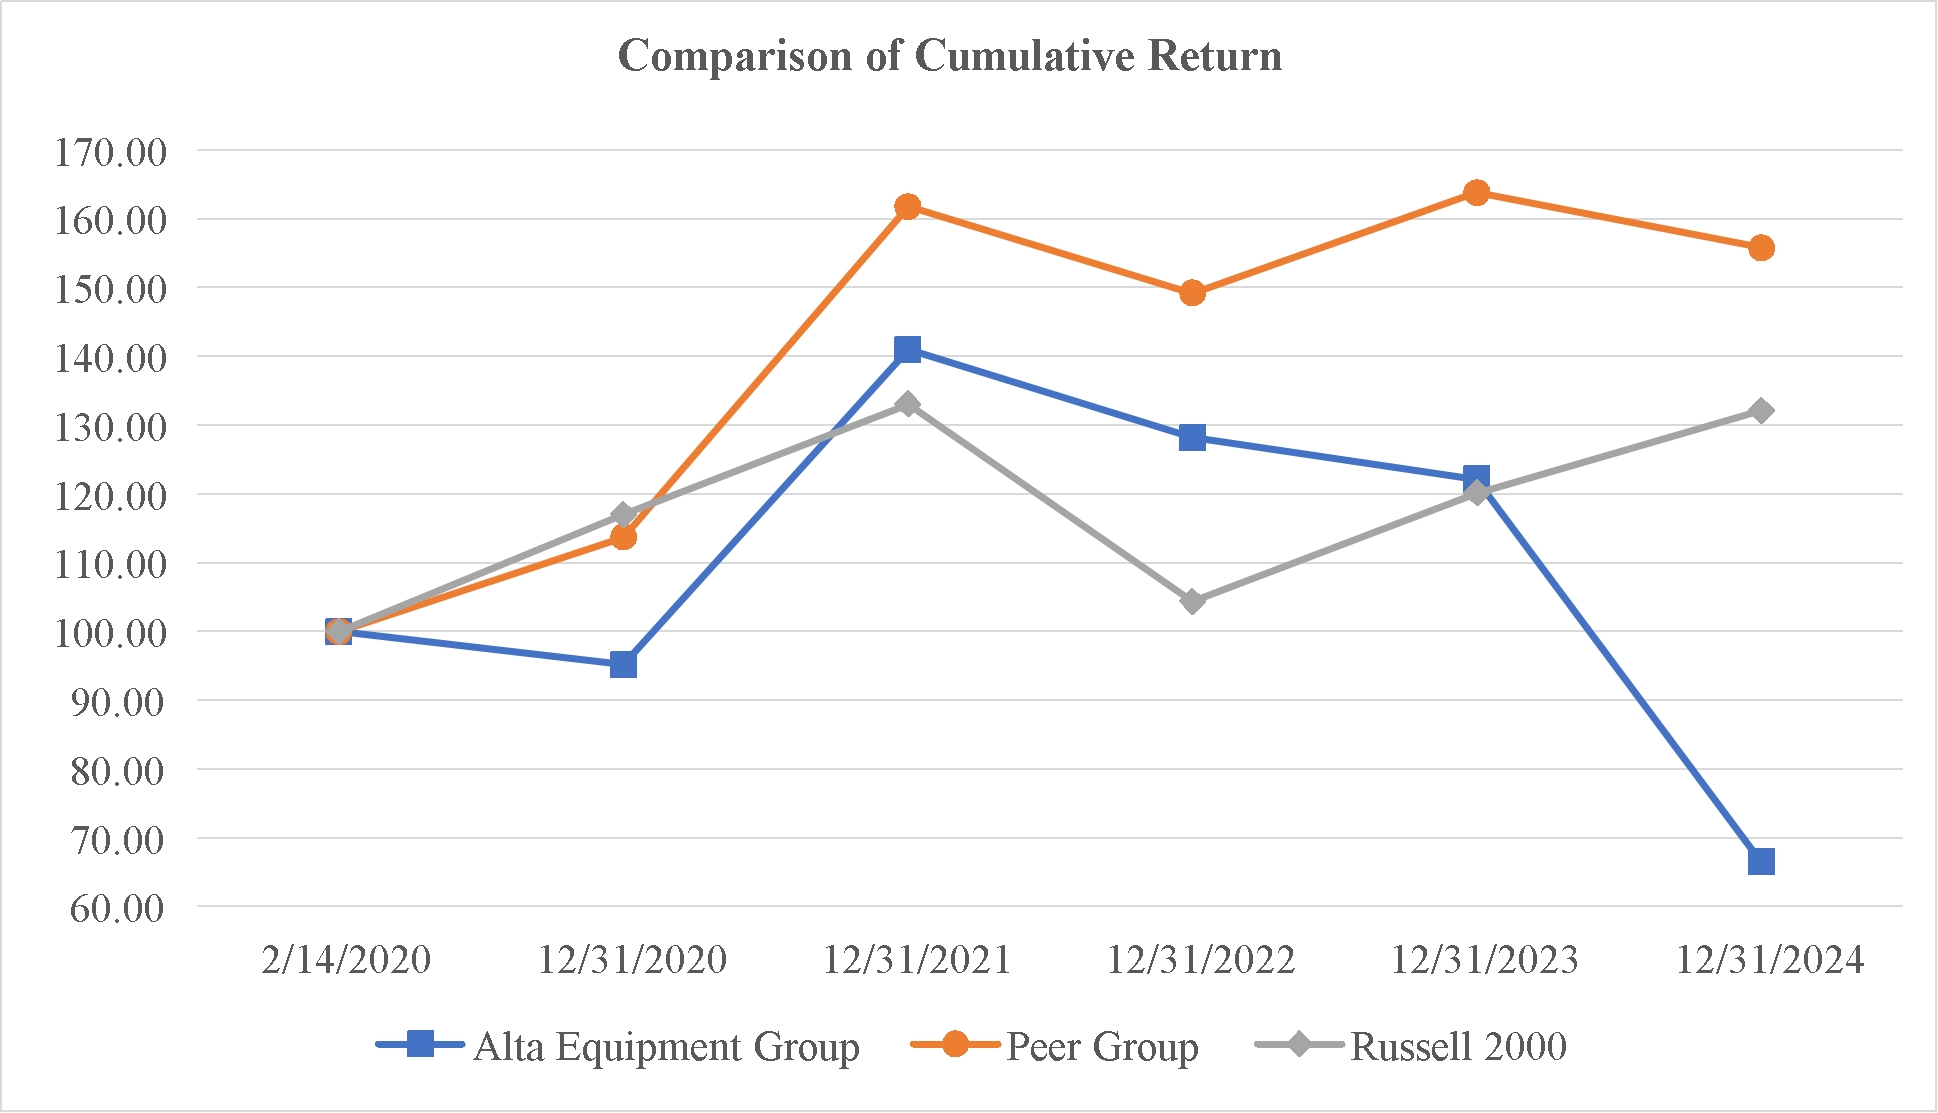
| | | | | | | | | | | | | | | | | | | | | | | | | |
| Ticker | | 2/14/2020 | | | 12/31/2020 | | | 12/31/2021 | | | 12/31/2022 | | | 12/31/2023 | | | 12/31/2024 | |
Alta Equipment Group | ALTG | | | 100.00 | | | | 95.18 | | | | 141.04 | | | | 128.19 | | | | 122.17 | | | | 66.49 | |
Peer Group | Various | | | 100.00 | | | | 113.71 | | | | 161.79 | | | | 149.21 | | | | 163.80 | | | | 155.78 | |
Russell 2000 | RUT | | | 100.00 | | | | 117.02 | | | | 133.05 | | | | 104.37 | | | | 120.12 | | | | 132.15 | |
Item 6. [Reserved].
Item 7. Management’s Discussion and Analysis of Financial Condition and Results of Operations.
The following discussion and analysis should be read in conjunction with the financial statements and related notes included elsewhere in this annual report. This discussion contains “forward-looking statements” reflecting Alta’s current expectations, estimates, and assumptions concerning events and financial trends that may affect our future operating results and financial position. Actual results and the timing of events may differ materially from those contained in these forward-looking statements due to a number of factors. Factors that could cause or contribute to such differences include, but are not limited to, economic and competitive conditions, regulatory changes and other uncertainties, as well as those factors discussed below and elsewhere in this annual report, particularly in “Risk Factors” and “Cautionary Note Regarding Forward-Looking Statements,” all of which are difficult to predict. In light of these risks, uncertainties, and assumptions, the forward-looking events discussed may not occur. Alta assumes no obligation to update any of these forward-looking statements.
Equipment Industry Overview 2024
The North American construction equipment market experienced a downturn in 2024, with overall sales declining by approximately 10%, while some of the regions we operate in experienced reductions of up to 20%. This decline aligns with the cyclical nature of the industry. Notably, construction equipment manufacturers like Caterpillar and John Deere reported reduced sales in North America, attributed to slowing end-user demand and elevated inventory levels at machinery dealers throughout North America. Similarly, Volvo Construction Equipment reported a 20% decline in North American sales. Elevated interest rates and volatile sentiment in the marketplace underpinned by the U.S. presidential election contributed to a decrease in equipment orders. Market participants have noted that specifically, smaller to mid-sized local contractors focused on privately funded non-residential projects, were negatively impacted by the aforementioned factors and thus hesitant to committing capital to new equipment in 2024. This softening amongst local contractors and small privately funded projects was offset by continued growth amongst larger contractors working on multi-year publicly funded projects (e.g. state or federal funded infrastructure projects). Lastly, with construction equipment supply in the OEM dealer channel at historically high levels in the face of weakening demand, competitive pricing, discounting and compressed margins were all thematic across the construction equipment industry in 2024.
In contrast, the North American lift truck market exhibited growth in 2024, in terms of shipments to end users, as the industry continued to deliver off of record levels of bookings in the 2021-2022 post-COVID timeframe. Robust manufacturing sectors and expanding logistics operations are driving investments in advanced material handling solutions, including trends toward lithium battery and fuel cell-powered lift trucks and autonomous solutions. Given the sales backlog overhang that the industry continued to navigate in 2024, bookings for future lift trucks declined in 2024 when compared to previous years, as lead times and production schedules at industry OEMs continued to normalize. As backlogs reduced, lift truck manufacturing volumes are projected to be down in 2025 as supply and demand factors find their level with industry bookings expected to rebound in the second half of 2025. Although the North American lift truck industry faces production headwinds entering 2025, we remain generally optimistic about this segment. This confidence stems from the resilience of our material handling end markets - key pillars of the U.S. economy such as food production, retail, and logistics - as well as our ability to continue gaining market share.
Equipment Inventory Availability, Rental Fleet Investment and Product Support Trends
Throughout 2021 and 2022, our industry was unfavorably impacted by equipment supply chain constraints leading to shortages across construction and material handling equipment categories and limiting our ability to meet customer demand and potentially increase our market share. Throughout 2023, equipment supply chain constraints gradually subsided, resulting in an increase in our new equipment inventories relative to prior periods. This theme continued into early 2024 as dealer stock levels continued to rise industrywide, especially in the Construction Equipment segment, exasperated by demand contraction at the end user level. This dynamic led to intense pressure on equipment sales pricing in 2024, which impacted our sales and our equipment sales gross margins. Despite the difficult competitive environment and the challenging supply and demand dynamics that existed throughout 2024, we were pleased to have kept new inventory levels essentially flat, year over year.
As it pertains to rental fleet, with the increase in equipment availability, in 2023 we were able to replenish and strategically grow our rental fleet in a period where utilization and pricing remained strong. In 2024, North American rental utilization rates began to recede as supply of rental fleet was robust, and rental rates moderated. Accordingly, and in-line with foreseeable demand, in mid-2024 we strategically optimized our fleet by reducing identified excess, primarily in our rent-to-sell product categories. This initiative led to a $46.0 million reduction in rental fleet gross cost from June 30, 2024, bringing the total to $571.2 million as of December 31, 2024.
In terms of product support, as our customers focus on the “up-time” of their equipment, we continued to see strong demand for skilled technicians' labor and replacement parts in 2024, as evidenced by our growing organic product support revenues, despite certain industry indicators pointing to a reduction in equipment utilization (e.g. the amount of hours equipment was utilized) year over year. With the level of new equipment deliveries over the previous two years, parts sales growth has moderated as the newer age field population consumes fewer parts in the earlier stages of the equipment life cycle. Additionally, as the material handling industry continues the trend toward electric forklifts, versus gas-powered, parts yields on equipment field population will continue to be pressured. Given our history, the reduction in parts consumption on electric trucks, over time, will be offset by skilled technician labor as software diagnostics and the complexity of new electrified, and potentially autonomous, equipment will demand high-end, closed-network service solutions from OEM dealers to keep customer equipment operational. Additionally, electric trucks present ancillary revenue opportunities related to batteries, chargers and charging infrastructure when compared to gas-powered trucks.
Business Description and Segments
For detailed description of our business and segments, refer to Part I, Item 1, Business, and Note 17, Segments, respectively.
Financial Statement Overview
Our revenues are primarily derived from the sale or rental of equipment and product support (e.g., parts and service) related activities, and consist of:
New equipment sales. We sell new heavy construction, material handling and environmental processing equipment and are a leading regional distributor for nationally recognized equipment manufacturers. Our new equipment sales operation is a primary source of new customers for our rental, parts and service business. The majority of our new equipment sales are predicated on exclusive distribution agreements we have with best-in-class OEMs. The sale of new equipment to customers, while profitable from a gross margin perspective, acts as a means of generating equipment field population and activity for our higher-margin aftermarket revenue streams, specifically service and parts. We also sell tangential products and services related to our material handling equipment offerings which include, but are not limited to, automated equipment installation and warehouse management systems integration.
Used equipment sales. We sell used equipment which is typically equipment that has been taken in on trade from a customer that is purchasing new equipment, equipment coming off a third-party lease arrangement where we purchase the equipment from the finance company or used equipment that is sourced for our customers in the open market by our used equipment specialists. Used equipment sales in our territories, like new equipment sales, generate parts and service business for the Company.
Parts sales. We sell replacement parts to customers and supply parts to our own rental fleet. Our in-house parts inventory is extensive such that we are able to provide timely service support to our customers. The majority of our parts inventory is made up of OEM replacement parts for those OEMs with which we have exclusive agreements to sell new equipment.
Service revenues. We provide maintenance and repair services for customer-owned equipment and maintain our own rental fleet. In addition to repair and maintenance on an as needed or scheduled basis, we provide ongoing preventative maintenance services and warranty repairs for our customers. We have committed substantial resources to training our technical service employees and have a full-scale service infrastructure that we believe differentiates us from our competitors. Approximately 44% of our employees are skilled service technicians.
Rental revenues. We rent heavy construction, compact, aerial, material handling, and a variety of other types of equipment to our customers on a daily, weekly and monthly basis. Our rental fleet, which is well-maintained, has an original acquisition cost (which we define as the cost originally paid to manufacturers plus any capitalized costs) of $565.5 million as of December 31, 2024. The original acquisition cost of our rental fleet excludes $5.7 million of assets associated with our guaranteed purchase obligations, which are assets that are not in our day-to-day operational control. In addition to being a core business, our rental business also creates cross-selling opportunities for us in our sales and product support activities.
Rental equipment sales. We also sell rental equipment from our rental fleet. Rental equipment sales may occur at various stages in an equipment’s lifecycle, depending on customer demand and original purchase intentions of the equipment. Rental equipment purchased directly into the rental fleet tends to be rented for the majority of its useful life before being sold (which we refer as rent-to-rent equipment), and rental equipment purchased as new inventory then later transferred into the rental fleet tends to be rented until a retail opportunity presents itself (which we refer as rent-to-sell equipment). In our Material Handling segment, our rental equipment sales are primarily of rent-to-rent equipment and in our Construction Equipment segment, our rental equipment sales are primarily of rent-to-sell equipment. Selling lightly used construction equipment from our rental fleet allows us to meet customer demand for specific model years of equipment at various price points versus only offering brand new equipment to the market. Customers often have options to purchase equipment after or before rental agreements have matured. Rental equipment sales, like new and used equipment sales, generate customer-owned equipment field population within our territories that ultimately yield high-margin parts and service revenues for us.
Principal Costs and Expenses
Our cost of revenues are primarily related to the costs associated with the sale or rental of equipment and product support activities, which include direct labor costs for our skilled technicians. Our operating expenses consist principally of selling, general and administrative expenses, which primarily include personnel costs associated with our sales and administrative staff and expenses associated with the deployment of our service vehicle fleet and occupancy expenses. In addition, we have interest expense related to our floor plan payables, finance leases, line of credit, and senior secured second lien notes. These principal costs and expenses are described further below:
New equipment sales. Cost of new equipment sold consists of the total acquisition costs of the new equipment we purchase from third parties.
Used equipment sales. Cost of used equipment sold consists of the net book value, or cost, of used equipment we purchase from third parties or the trade-in value of used equipment that we obtain from customers in new equipment sales transactions.
Parts sales. Cost of parts sales represents the average cost of parts used in the maintenance and repair of customer-owned equipment we service or parts sold directly to customers for their owned equipment (e.g., over-the-counter parts sales).
Services revenues. Cost of service revenues primarily represents the labor costs attributable to services provided for the maintenance and repair of customer-owned equipment. Training, paid time off, and other non-billable costs of maintaining our expert technicians are recorded in this line item in addition to the costs of direct customer-billable labor.
Rental revenues. Rental expense represents the costs associated with rental equipment, including, among other things, the cost of repairing and maintaining our rental equipment and other miscellaneous costs of owning rental equipment. Other rental expenses consist primarily of equipment support activities that we provide our customers in connection with renting equipment, such as freight services and damage waiver policies.
Rental depreciation. Depreciation of rental equipment represents the depreciation costs attributable to rental equipment. Estimated useful lives vary based upon type of equipment. See Note 2, Summary of Significant Accounting Policies, for information on our rental equipment depreciation methods.
Rental equipment sales. Cost of previously rented equipment sold consists of the net book value (e.g., net of accumulated depreciation) of rental equipment sold from our rental fleet.
Operating expenses. These costs are comprised of three main components: personnel, operational, and occupancy costs. Personnel costs are comprised of hourly and salaried wages for administrative employees, including incentive compensation, sale commissions, and employee benefits, such as medical benefits. Operational costs include marketing activities, costs associated with deploying and leasing our service vehicle fleet, insurance, IT, office and shop supplies, general corporate costs, depreciation on non-sales and rental related assets, and intangible amortization. Occupancy costs are comprised of all expenses related to our facility infrastructure, including rent, utilities, property taxes, and building insurance.
Other expense, net. This section of the Consolidated Statements of Operations is mostly comprised of interest expense and other miscellaneous items that result in income or expense. Interest expense is driven by our floor plan facilities, line of credit, senior secured second lien notes, and finance lease arrangements.
Results of Operations
Years ended December 31, 2024 and 2023
Consolidated Results
| | | | | | | | | | | | | | | |
| Year Ended December 31, | | | Increase (Decrease) | |
| 2024 | | | 2023 | | | 2024 versus 2023 | |
Revenues: | | | | | | | | | | | |
New and used equipment sales | $ | 987.0 | | | $ | 1,025.9 | | | $ | (38.9 | ) | | | (3.8 | )% |
Parts sales | | 294.4 | | | | 278.3 | | | | 16.1 | | | | 5.8 | % |
Service revenues | | 253.8 | | | | 241.3 | | | | 12.5 | | | | 5.2 | % |
Rental revenues | | 203.4 | | | | 202.4 | | | | 1.0 | | | | 0.5 | % |
Rental equipment sales | | 138.0 | | | | 128.9 | | | | 9.1 | | | | 7.1 | % |
Total revenues | | 1,876.6 | | | | 1,876.8 | | | | (0.2 | ) | | | — | |
Cost of revenues: | | | | | | | | | | | |
New and used equipment sales | | 837.9 | | | | 853.6 | | | | (15.7 | ) | | | (1.8 | )% |
Parts sales | | 196.2 | | | | 183.2 | | | | 13.0 | | | | 7.1 | % |
Service revenues | | 105.8 | | | | 103.4 | | | | 2.4 | | | | 2.3 | % |
Rental revenues | | 22.5 | | | | 24.8 | | | | (2.3 | ) | | | (9.3 | )% |
Rental depreciation | | 115.9 | | | | 110.1 | | | | 5.8 | | | | 5.3 | % |
Rental equipment sales | | 104.6 | | | | 94.5 | | | | 10.1 | | | | 10.7 | % |
Total cost of revenues | | 1,382.9 | | | | 1,369.6 | | | | 13.3 | | | | 1.0 | % |
Gross profit | | 493.7 | | | | 507.2 | | | | (13.5 | ) | | | (2.7 | )% |
Selling, general and administrative expenses | | 446.5 | | | | 430.3 | | | | 16.2 | | | | 3.8 | % |
Non-rental depreciation and amortization | | 28.6 | | | | 22.5 | | | | 6.1 | | | | 27.1 | % |
Total operating expenses | | 475.1 | | | | 452.8 | | | | 22.3 | | | | 4.9 | % |
Income from operations | | 18.6 | | | | 54.4 | | | | (35.8 | ) | | | (65.8 | )% |
Other (expense) income: | | | | | | | | | | | |
Interest expense, floor plan payable – new equipment | | (12.1 | ) | | | (8.4 | ) | | | (3.7 | ) | | | 44.0 | % |
Interest expense – other | | (69.2 | ) | | | (48.6 | ) | | | (20.6 | ) | | | 42.4 | % |
Other income | | 3.1 | | | | 5.1 | | | | (2.0 | ) | | | (39.2 | )% |
Loss on extinguishment of debt | | (6.7 | ) | | | — | | | | (6.7 | ) | | NM | |
Total other expense, net | | (84.9 | ) | | | (51.9 | ) | | | (33.0 | ) | | | 63.6 | % |
(Loss) income before taxes | | (66.3 | ) | | | 2.5 | | | | (68.8 | ) | | NM | |
Income tax benefit | | (4.2 | ) | | | (6.4 | ) | | | 2.2 | | | NM | |
Net (loss) income | | (62.1 | ) | | | 8.9 | | | | (71.0 | ) | | NM | |
Preferred stock dividends | | (3.0 | ) | | | (3.0 | ) | | | — | | | | — | |
Net (loss) income available to common stockholders | $ | (65.1 | ) | | $ | 5.9 | | | $ | (71.0 | ) | | NM | |
Adjusted EBITDA(1) | $ | 168.3 | | | $ | 191.4 | | | $ | (23.1 | ) | | | (12.1 | )% |
NM - calculated change not meaningful | | | | | | | | | | | |
(1) Adjusted EBITDA is a non-GAAP measure. Refer to “Non-GAAP Financial Measures” for a definition of Adjusted EBITDA and below for a reconciliation of our Adjusted EBITDA to net (loss) income, the most comparable U.S. GAAP measure. | |
| | | | | | | |
| Percent of Revenues | |
| Year Ended December 31, | |
| 2024 | | | 2023 | |
Revenues: | | | | | |
New and used equipment sales | | 52.6 | % | | | 54.6 | % |
Parts sales | | 15.7 | % | | | 14.8 | % |
Service revenues | | 13.5 | % | | | 12.9 | % |
Rental revenues | | 10.8 | % | | | 10.8 | % |
Rental equipment sales | | 7.4 | % | | | 6.9 | % |
Total revenues | | 100.0 | % | | | 100.0 | % |
Cost of revenues: | | | | | |
New and used equipment sales | | 44.6 | % | | | 45.5 | % |
Parts sales | | 10.5 | % | | | 9.8 | % |
Service revenues | | 5.6 | % | | | 5.5 | % |
Rental revenues | | 1.2 | % | | | 1.3 | % |
Rental depreciation | | 6.2 | % | | | 5.9 | % |
Rental equipment sales | | 5.6 | % | | | 5.0 | % |
Total cost of revenues | | 73.7 | % | | | 73.0 | % |
Gross profit | | 26.3 | % | | | 27.0 | % |
Non-GAAP Financial Measures:
Adjusted EBITDA
| | | | | | | | | | | | | | | |
| Adjusted EBITDA | |
| Year Ended December 31, | | | Increase (Decrease) | |
| 2024 | | | 2023 | | | 2024 versus 2023 | |
Net (loss) income available to common stockholders | $ | (65.1 | ) | | $ | 5.9 | | | $ | (71.0 | ) | | NM | |
Depreciation and amortization | | 144.5 | | | | 132.6 | | | | 11.9 | | | | 9.0 | % |
Interest expense | | 81.3 | | | | 57.0 | | | 24.3 | | | | 42.6 | % |
Income tax benefit | | (4.2 | ) | | | (6.4 | ) | | | 2.2 | | | NM | |
Transaction and consulting costs | | 2.3 | | | | 1.6 | | | | 0.7 | | | NM | |
Non-cash adjustments | | — | | | | (1.5 | ) | | | 1.5 | | | NM | |
Loss on debt extinguishment | | 6.7 | | | | — | | | | 6.7 | | | | — | |
Share-based incentives | | 4.8 | | | | 4.3 | | | | 0.5 | | | | 11.6 | % |
Other expenses | | 4.3 | | | | 3.3 | | | | 1.0 | | | NM | |
Preferred stock dividend | | 3.0 | | | | 3.0 | | | | — | | | | — | |
Loss on auction sale | | 2.8 | | | | — | | | | 2.8 | | | | — | |
Showroom-ready equipment interest expense | | (12.1 | ) | | | (8.4 | ) | | | (3.7 | ) | | | 44.0 | % |
Adjusted EBITDA | $ | 168.3 | | | $ | 191.4 | | | $ | (23.1 | ) | | | (12.1 | )% |
NM - calculated change not meaningful | |
Organic Revenues
| | | | | | | | | | | | | | | |
| Organic Revenues | | |
| Year Ended December 31, | | | Increase (Decrease) | |
| 2024 | | | 2023 | | | 2024 versus 2023 | |
Total revenues | $ | 1,876.6 | | | $ | 1,876.8 | | | $ | (0.2 | ) | | | — | |
Acquisitions revenues | | 65.7 | | | | — | | | | | | | |
Organic revenues: | | | | | | | | | | | |
New and used equipment sales | | 949.3 | | | | 1,025.9 | | | | (76.6 | ) | | | (7.5 | )% |
Parts sales | | 281.1 | | | | 278.3 | | | | 2.8 | | | | 1.0 | % |
Service revenues | | 250.6 | | | | 241.3 | | | | 9.3 | | | | 3.9 | % |
Rental revenues | | 193.9 | | | | 202.4 | | | | (8.5 | ) | | | (4.2 | )% |
Rental equipment sales | | 136.0 | | | | 128.9 | | | | 7.1 | | | | 5.5 | % |
Total organic revenues | $ | 1,810.9 | | | $ | 1,876.8 | | | $ | (65.9 | ) | | | (3.5 | )% |
The above tables contain non-GAAP financial measures. A “non-GAAP financial measure” is defined as a numerical measure of a company’s financial performance that excludes or includes amounts so as to be different than the most directly comparable measure calculated and presented in accordance with GAAP in the consolidated statements of operations, balance sheets or statements of cash flows of the company. We disclose non-GAAP financial measures, including Adjusted EBITDA and organic revenues and growth rates associated with organic revenues because we believe they are useful performance measures that assist in an effective evaluation of our operating performance. We believe such measures are useful for investors and others in understanding and evaluating our operating results in the same manner as our management. However, such measures are not financial measures calculated in accordance with U.S. GAAP and should not be considered as a substitute for, or in isolation from, net income, revenues, or any other operating performance measures calculated in accordance with U.S. GAAP.
We define Adjusted EBITDA as net income before interest expense (not including floor plan interest paid on new equipment), income taxes, depreciation and amortization, adjustments for certain one-time or non-recurring items, other items not necessarily indicative of our underlying operating performance and other items. We exclude these items from net income in arriving at Adjusted EBITDA because these amounts are either non-recurring or can vary substantially within the industry depending upon accounting methods and book values of assets, capital structures and the method by which the assets were acquired.
We define organic revenue growth as revenue growth excluding the impact of acquisitions that do not appear fully in both periods in the current and prior years. We believe organic revenue growth is a meaningful metric to investors as it provides a more consistent comparison of our revenues to prior periods as well as to industry peers.
Pursuant to the requirements of Regulation G, we have provided a reconciliation of Adjusted EBITDA and organic revenues to the most directly comparable U.S. GAAP financial measure in the tables above and organic revenues in subsequent tables in management's discussion and analysis of our individual business segments. This measure is supplemental to, and should be used in conjunction with, the most comparable U.S. GAAP measures. Management uses these non-GAAP financial measures to monitor and evaluate financial results and trends.
Revenues: Consolidated revenues decreased by $0.2 million to $1,876.6 million for the year ended December 31, 2024 as compared to 2023. The increases in product support, rental revenues and rental equipment sales were substantially offset by the decrease in new and used equipment sales due to weakened market demand for heavy equipment. The decline in new and used equipment sales was most significant in our Master Distribution segment, which primarily supplies equipment to sub-dealers, with revenues for the year ended December 31, 2024, decreasing by $24.5 million compared to the prior year. This was followed by our Construction Equipment segment, which saw a $23.5 million decline in new and used equipment sales. While new and used equipment revenues stagnated on weaker demand versus last year, our product support departments (parts and service) grew 2.3% organically for the year ended December 31, 2024. Rental revenues exhibited a 4.2% organic decrease, as rates moderated and utilization decreased from the prior year. Rental equipment sales increased organically by 5.5% for the year ended December 31, 2024 as we looked to sell rental equipment to help bolster field population for our aftermarket departments, however some of the increase was processed through auction sale channels impacting gross profit margins.
Gross profit (GP):
| | | | | | | | | | | |
| Year Ended December 31, | | | Increase (Decrease) | |
| 2024 | | | 2023 | | | 2024 versus 2023 | |
Consolidated | GP% | | | GP% | | | GP% | |
New and used equipment sales | | 15.1 | % | | | 16.8 | % | | | (1.7 | )% |
Parts sales | | 33.4 | % | | | 34.2 | % | | | (0.8 | )% |
Service revenues | | 58.3 | % | | | 57.1 | % | | | 1.2 | % |
Rental revenues | | 32.0 | % | | | 33.3 | % | | | (1.3 | )% |
Rental equipment sales | | 24.2 | % | | | 26.7 | % | | | (2.5 | )% |
| | | | | | | | |
Consolidated gross profit | | 26.3 | % | | | 27.0 | % | | | (0.7 | )% |
Consolidated gross profit decreased by 70 basis points from 27.0% in the year ended December 31, 2023 to 26.3% over the same period in 2024. New and used equipment sales margins decreased 170 basis points to 15.1%, a reflection of a comparably softened pricing environment, which was primarily observed in both our Material Handling and Construction Equipment segments, and due to our use of the auction sales channel in the fourth quarter for a number of aged used and rental units in the Material Handling fleet. Primarily, the impact of an over-supplied construction equipment market and historically competitive pricing led to a 250 basis point gross profit margin decrease when compared to the prior year. Parts gross profit margins decreased by 80 basis points from the prior year, isolated primarily within the Master Distribution segment but remained within our range of expectation overall. Service gross profit margins improved in the year ended December 31, 2024 when compared to the prior year increasing 120 basis points, primarily due to an improved rate realization on service labor. We realized a 130 basis point decrease in rental revenues gross profit margin for the year ended December 31, 2024, largely a result of moderating rental rates and fleet utilization as well as higher rental depreciation expense.
Operating expenses: Consolidated operating expenses increased by 4.9% to $475.1 million for the year ended December 31, 2024 compared to the prior year, primarily driven by the full period impact from our 2023 acquisitions and additional expenses to support our organic growth including new branches with associated one-time costs, such as grand openings and initial stocking costs.
Other expense, net: Consolidated other expense, net for the year ended December 31, 2024 was $84.9 million compared to $51.9 million for the year ended December 31, 2023. The increase is primarily due to an increase in interest expense, namely a result of the refinance of our Senior Secured Second Lien Notes during the second quarter of 2024.
Income tax benefit: The Company recorded an income tax benefit of $4.2 million and $6.4 million for the years ended December 31, 2024 and 2023, respectively. The income tax benefit in the current year was primarily due to pre-tax losses partially offset by the valuation allowance recorded against a portion of the deferred tax asset relating to the U.S. disallowed interest expense carryforwards created by the provisions of the TCJA while the prior year benefit was due to the release of the valuation allowance on certain U.S. federal and state deferred tax assets.
Material Handling Results
| | | | | | | | | | | | | | | |
| Year Ended December 31, | | | Increase (Decrease) | |
| 2024 | | | 2023 | | | 2024 versus 2023 | |
Revenues: | | | | | | | | | | | |
New and used equipment sales | $ | 365.2 | | | $ | 367.6 | | | | (2.4 | ) | | | (0.7 | )% |
Parts sales | | 99.6 | | | | 99.5 | | | | 0.1 | | | | 0.1 | % |
Service revenues | | 135.9 | | | | 132.8 | | | | 3.1 | | | | 2.3 | % |
Rental revenues | | 76.2 | | | | 76.4 | | | | (0.2 | ) | | | (0.3 | )% |
Rental equipment sales | | 10.5 | | | | 5.2 | | | | 5.3 | | | | 101.9 | % |
Total revenues | | 687.4 | | | | 681.5 | | | | 5.9 | | | | 0.9 | % |
Cost of revenues: | | | | | | | | | | | |
New and used equipment sales | | 300.2 | | | | 294.3 | | | | 5.9 | | | | 2.0 | % |
Parts sales | | 62.6 | | | | 61.8 | | | | 0.8 | | | | 1.3 | % |
Service revenues | | 56.2 | | | | 57.3 | | | | (1.1 | ) | | | (1.9 | )% |
Rental revenues | | 6.5 | | | | 9.7 | | | | (3.2 | ) | | | (33.0 | )% |
Rental depreciation | | 31.6 | | | | 26.8 | | | | 4.8 | | | | 17.9 | % |
Rental equipment sales | | 7.6 | | | | 3.4 | | | | 4.2 | | | | 123.5 | % |
Total cost of revenues | | 464.7 | | | | 453.3 | | | | 11.4 | | | | 2.5 | % |
Gross profit | | 222.7 | | | | 228.2 | | | | (5.5 | ) | | | (2.4 | )% |
Selling, general and administrative expenses | | 184.7 | | | | 187.8 | | | | (3.1 | ) | | | (1.7 | )% |
Non-rental depreciation and amortization | | 9.4 | | | | 8.1 | | | | 1.3 | | | | 16.0 | % |
Total operating expenses | | 194.1 | | | | 195.9 | | | | (1.8 | ) | | | (0.9 | )% |
Income from operations | | 28.6 | | | | 32.3 | | | | (3.7 | ) | | | (11.5 | )% |
Other (expense) income: | | | | | | | | | | | |
Interest expense, floor plan payable – new equipment | | (3.6 | ) | | | (2.7 | ) | | | (0.9 | ) | | | 33.3 | % |
Interest expense – other | | (20.6 | ) | | | (15.4 | ) | | | (5.2 | ) | | | 33.8 | % |
Other income | | 0.6 | | | | 0.5 | | | | 0.1 | | | | 20.0 | % |
Total other expense, net | | (23.6 | ) | | | (17.6 | ) | | | (6.0 | ) | | | 34.1 | % |
Income before taxes | $ | 5.0 | | | $ | 14.7 | | | $ | (9.7 | ) | | | (66.0 | )% |
Segment adjusted EBITDA | $ | 70.1 | | | $ | 65.7 | | | $ | 4.4 | | | | 6.7 | % |
| | | | | | | |
| Percent of Revenues | |
| Year Ended December 31, | |
| 2024 | | | 2023 | |
Revenues: | | | | | |
New and used equipment sales | | 53.1 | % | | | 53.9 | % |
Parts sales | | 14.5 | % | | | 14.6 | % |
Service revenues | | 19.8 | % | | | 19.5 | % |
Rental revenues | | 11.1 | % | | | 11.2 | % |
Rental equipment sales | | 1.5 | % | | | 0.8 | % |
Total revenues | | 100.0 | % | | | 100.0 | % |
Cost of revenues: | | | | | |
New and used equipment sales | | 43.7 | % | | | 43.2 | % |
Parts sales | | 9.1 | % | | | 9.1 | % |
Service revenues | | 8.2 | % | | | 8.4 | % |
Rental revenues | | 0.9 | % | | | 1.4 | % |
Rental depreciation | | 4.6 | % | | | 3.9 | % |
Rental equipment sales | | 1.1 | % | | | 0.5 | % |
Total cost of revenues | | 67.6 | % | | | 66.5 | % |
Gross profit | | 32.4 | % | | | 33.5 | % |
Non-GAAP Financial Measure: Organic Revenues
| | | | | | | | | | | | | | | |
| Organic Revenues | |
| Year Ended December 31, | | | Increase (Decrease) | |
| 2024 | | | 2023 | | | 2024 versus 2023 | |
Total revenues | $ | 687.4 | | | $ | 681.5 | | | $ | 5.9 | | | | 0.9 | % |
Acquisitions revenues | | 1.8 | | | | — | | | | | | | |
Organic revenues: | | | | | | | | | | | |
New and used equipment sales | | 364.7 | | | | 367.6 | | | | (2.9 | ) | | | (0.8 | )% |
Parts sales | | 99.0 | | | | 99.5 | | | | (0.5 | ) | | | (0.5 | )% |
Service revenues | | 135.3 | | | | 132.8 | | | | 2.5 | | | | 1.9 | % |
Rental revenues | | 76.1 | | | | 76.4 | | | | (0.3 | ) | | | (0.4 | )% |
Rental equipment sales | | 10.5 | | | | 5.2 | | | | 5.3 | | | | 101.9 | % |
Total organic revenues | $ | 685.6 | | | $ | 681.5 | | | $ | 4.1 | | | | 0.6 | % |
Revenues: Material Handling segment revenues increased by $5.9 million to $687.4 million for the year ended December 31, 2024 as compared to the same period last year. Organically, the segment revenues increased $4.1 million, or 0.6% for the year ended December 31, 2024. New and used equipment sales were relatively flat over last year as we worked through a notable new equipment sales backlog to begin 2024 that helped stabilize results despite a depressed demand environment in the equipment spot market. New equipment sales for lift trucks improved in 2024 due to our strong backlog and equipment availability during the year, but used equipment pricing and demand suffered along with fewer opportunities for our automated equipment installation and warehouse management systems integration offerings. Product support revenues improved by 0.9%, with service revenues increasing 1.9% for the year ended December 31, 2024 as compared to prior year reflecting our ability to pass along inflationary-based pricing increases to our customers to support their fleets. Rental revenues decreased 0.4% for the year ended December 31, 2024 as compared to last year primarily due to reduced physical utilization of our fleet. Rental equipment sales increased $5.3 million organically, or 101.9%, on low volume as we have strategically targeted and disposed of underperforming rental units or rental units that have reached the end of their useful life in our fleet. In the fourth quarter of 2024, we specifically leveraged auction channels to offload an atypical volume of aged used equipment, primarily from our rental department, as a strategic measure to adjust our fleet size.
Gross profit (GP):
| | | | | | | | | | | |
| Year Ended December 31, | | | Increase (Decrease) | |
| 2024 | | | 2023 | | | 2024 versus 2023 | |
| GP% | | | GP% | | | GP% | |
New and used equipment sales | | 17.8 | % | | | 19.9 | % | | | (2.1 | )% |
Parts sales | | 37.1 | % | | | 37.9 | % | | | (0.8 | )% |
Service revenues | | 58.6 | % | | | 56.9 | % | | | 1.7 | % |
Rental revenues | | 50.0 | % | | | 52.2 | % | | | (2.2 | )% |
Rental equipment sales | | 27.6 | % | | | 34.6 | % | | | (7.0 | )% |
| | | | | | | | |
Segment gross profit | | 32.4 | % | | | 33.5 | % | | | (1.1 | )% |
Material Handling gross profit for the year ended December 31, 2024 decreased 110 basis points to 32.4% compared to the same period in 2023. New and used equipment gross margins compressed in part from the used equipment auction related losses experienced in the fourth quarter, but also due to sales mix variances, with reduced sales coming from Peaklogix, our higher margin warehousing solutions platform and increased pressure on used equipment pricing throughout 2024. Parts gross margins have remained relatively consistent year over year and in line with expectations. The 170 basis point service margin increase for the year ended December 31, 2024 can be attributed to margin improvements in major service categories, including customer and OEM warranty and fleet work, and on better pricing realization and technician productivity measures. Rental revenues gross margins declined 220 basis points primarily due to replenishing our rental fleet and the associated increase in depreciation expense as well as lower utilization levels. Rental equipment sales margins decreased on low volumes amid pricing pressures from greater availability of equipment in the marketplace relative to the prior year and disposal of underperforming units through the auction channel in the fourth quarter.
Operating expenses: Operating expenses decreased by $1.8 million to $194.1 million for the year ended December 31, 2024 as compared to the prior year, primarily due to a change in the intercompany allocation of costs and cost savings initiatives implemented during 2024 which primarily impacted personnel related expenses.
Other (expense) income, net: Other expenses increased by $6.0 million to $23.6 million for the year ended December 31, 2024 as compared to the same period last year. The increase is mainly related to the aforementioned cumulative change in intercompany expense allocation for shared service functions and increased interest expense due to higher effective interest rates, inventory, and rental fleet levels realized in 2024 when compared to 2023.
Construction Equipment Results
| | | | | | | | | | | | | | | |
| Year Ended December 31, | | | Increase (Decrease) | |
| 2024 | | | 2023 | | | 2024 versus 2023 | |
Revenues: | | | | | | | | | | | |
New and used equipment sales | $ | 574.4 | | | $ | 597.9 | | | $ | (23.5 | ) | | | (3.9 | )% |
Parts sales | | 186.7 | | | | 170.1 | | | | 16.6 | | | | 9.8 | % |
Service revenues | | 117.1 | | | | 108.2 | | | | 8.9 | | | | 8.2 | % |
Rental revenues | | 125.7 | | | | 124.8 | | | | 0.9 | | | | 0.7 | % |
Rental equipment sales | | 127.5 | | | | 123.7 | | | | 3.8 | | | | 3.1 | % |
Total revenues | | 1,131.4 | | | | 1,124.7 | | | | 6.7 | | | | 0.6 | % |
Cost of revenues: | | | | | | | | | | | |
New and used equipment sales | | 503.3 | | | | 515.5 | | | | (12.2 | ) | | | (2.4 | )% |
Parts sales | | 129.5 | | | | 117.5 | | | | 12.0 | | | | 10.2 | % |
Service revenues | | 48.8 | | | | 45.9 | | | | 2.9 | | | | 6.3 | % |
Rental revenues | | 16.0 | | | | 15.1 | | | | 0.9 | | | | 6.0 | % |
Rental depreciation | | 82.7 | | | | 81.8 | | | | 0.9 | | | | 1.1 | % |
Rental equipment sales | | 97.0 | | | | 91.1 | | | | 5.9 | | | | 6.5 | % |
Total cost of revenues | | 877.3 | | | | 866.9 | | | | 10.4 | | | | 1.2 | % |
Gross profit | | 254.1 | | | | 257.8 | | | | (3.7 | ) | | | (1.4 | )% |
Selling, general and administrative expenses | | 229.6 | | | | 211.6 | | | | 18.0 | | | | 8.5 | % |
Non-rental depreciation and amortization | | 15.2 | | | | 10.7 | | | | 4.5 | | | | 42.1 | % |
Total operating expenses | | 244.8 | | | | 222.3 | | | | 22.5 | | | | 10.1 | % |
Income from operations | | 9.3 | | | | 35.5 | | | | (26.2 | ) | | | (73.8 | )% |
Other (expense) income: | | | | | | | | | | | |
Interest expense, floor plan payable – new equipment | | (7.3 | ) | | | (4.8 | ) | | | (2.5 | ) | | | 52.1 | % |
Interest expense – other | | (41.2 | ) | | | (28.3 | ) | | | (12.9 | ) | | | 45.6 | % |
Other income | | 2.4 | | | | 4.6 | | | | (2.2 | ) | | | (47.8 | )% |
Total other expense, net | | (46.1 | ) | | | (28.5 | ) | | | (17.6 | ) | | | 61.8 | % |
(Loss) income before taxes | $ | (36.8 | ) | | $ | 7.0 | | | $ | (43.8 | ) | | | (625.7 | )% |
Segment adjusted EBITDA | $ | 104.2 | | | $ | 128.6 | | | $ | (24.4 | ) | | | (19.0 | )% |
| | | | | | | |
| Percent of Revenues | |
| Year Ended December 31, | |
| 2024 | | | 2023 | |
Revenues: | | | | | |
New and used equipment sales | | 50.7 | % | | | 53.2 | % |
Parts sales | | 16.5 | % | | | 15.1 | % |
Service revenues | | 10.4 | % | | | 9.6 | % |
Rental revenues | | 11.1 | % | | | 11.1 | % |
Rental equipment sales | | 11.3 | % | | | 11.0 | % |
Total revenues | | 100.0 | % | | | 100.0 | % |
Cost of revenues: | | | | | |
New and used equipment sales | | 44.5 | % | | | 45.9 | % |
Parts sales | | 11.4 | % | | | 10.4 | % |
Service revenues | | 4.3 | % | | | 4.1 | % |
Rental revenues | | 1.4 | % | | | 1.3 | % |
Rental depreciation and amortization | | 7.3 | % | | | 7.3 | % |
Rental equipment sales | | 8.6 | % | | | 8.1 | % |
Total cost of revenues | | 77.5 | % | | | 77.1 | % |
Gross profit | | 22.5 | % | | | 22.9 | % |
Non-GAAP Financial Measure: Organic Revenues
| | | | | | | | | | | | | | | |
| Organic Revenues | |
| Year Ended December 31, | | | Increase (Decrease) | |
| 2024 | | | 2023 | | | 2024 versus 2023 | |
Total revenues | $ | 1,131.4 | | | $ | 1,124.7 | | | $ | 6.7 | | | | 0.6 | % |
Acquisitions revenues | | 63.9 | | | | — | | | | | | | |
Organic revenues: | | | | | | | | | | | |
New and used equipment sales | | 537.2 | | | | 597.9 | | | | (60.7 | ) | | | (10.2 | )% |
Parts sales | | 174.0 | | | | 170.1 | | | | 3.9 | | | | 2.3 | % |
Service revenues | | 114.5 | | | | 108.2 | | | | 6.3 | | | | 5.8 | % |
Rental revenues | | 116.3 | | | | 124.8 | | | | (8.5 | ) | | | (6.8 | )% |
Rental equipment sales | | 125.5 | | | | 123.7 | | | | 1.8 | | | | 1.5 | % |
Total organic revenues | $ | 1,067.5 | | | $ | 1,124.7 | | | $ | (57.2 | ) | | | (5.1 | )% |
Revenues: Construction Equipment segment revenues increased by 0.6% to $1,131.4 million for the year ended December 31, 2024 as compared to the same period last year, primarily related to the full-period impact from the Burris and Ault acquisitions made in the fourth quarter of 2023. Organically, the segment revenues decreased 5.1% for the year ended December 31, 2024 as compared to the same period last year. Organic new and used equipment sales decreased by $60.7 million, or 10.2%, amidst an overall decline in demand for heavy equipment in 2024, with certain of our markets (defined as volume of new heavy construction units sold into a region) declining by approximately 20%. Market demand for equipment from small and medium sized contractors declined as uncertainty surrounding the U.S. presidential election created apprehension amongst contractors and as elevated interest rates made new project funding more challenging than previous years. Further, heightened new equipment availability and dealer stock levels throughout the industry resulted in an increased competitive environment compared to the prior year making holding market share in certain regions and product categories more difficult. Despite a challenging environment for equipment sales, product support revenues, consisting of parts and service revenues, increased 3.7% organically as we have been able to increase skilled technician headcount and improve rate realization on service labor. Rental revenues decreased 6.8%, on an organic basis for the year ended December 31, 2024 as compared to the prior year on a reduced average fleet size, while rental equipment sales increased for the year ended December 31, 2024 by $1.8 million due to strategic sales of rental equipment to generate field population and right-sizing fleet levels to match realized levels of rental equipment demand.
Gross profit (GP):
| | | | | | | | | | | |
| Year Ended December 31, | | | Increase (Decrease) | |
| 2024 | | | 2023 | | | 2024 versus 2023 | |
| GP% | | | GP% | | | GP% | |
New and used equipment sales | | 12.4 | % | | | 13.8 | % | | | (1.4 | )% |
Parts sales | | 30.6 | % | | | 30.9 | % | | | (0.3 | )% |
Service revenues | | 58.3 | % | | | 57.6 | % | | | 0.7 | % |
Rental revenues | | 21.5 | % | | | 22.4 | % | | | (0.9 | )% |
Rental equipment sales | | 23.9 | % | | | 26.4 | % | | | (2.5 | )% |
| | | | | | | | |
Segment gross profit | | 22.5 | % | | | 22.9 | % | | | (0.4 | )% |
Construction Equipment gross profit decreased by 40 basis points to 22.5% from 22.9% for the year ended December 31, 2024 as compared to 2023, with lower margins on equipment sales reflective of elevated new inventory levels at heavy machinery dealers throughout the industry combined with softening demand, both of which led to a highly competitive pricing environment and lower margins realized in 2024 when compared to history. Specifically, new and used equipment sales margins decreased by 140 basis points to 12.4%, given the aforementioned market dynamics, leading to new and used gross profit decreasing to $71.1 million from $82.4 million in the same period last year. Despite higher rental equipment sales, the softened and highly competitive used equipment pricing environment in 2024 led to a 250 basis point decrease in rental equipment sales margin when comparing the year-over-year periods (equating to rental equipment gross profits of $30.5 million compared to $32.6 million from the same period last year). Parts sales margins for the year ended December 31, 2024 remained consistent when compared to the same time last year, decreasing by 30 basis points but within our expected range. Service gross margins increased by 70 basis points from 2023 primarily related to improved rate realization. Rental revenues gross margin for the year ended December 31, 2024 decreased by 90 basis points compared to the same period last year as depreciation increased despite a lower level of average fleet size.
Operating expenses: Construction Equipment operating expenses increased by $22.5 million to $244.8 million for the year ended December 31, 2024 as compared to 2023. The overall increase is mainly due to the full-period impact from the Burris and Ault acquisitions made in the fourth quarter of 2023 but is also influenced by relatively higher facility-related expenses from new branch openings. Sequentially across quarters, organic operating expenses decreased in both of the last two quarters of 2024, as cost-saving measures were successfully implemented, primarily impacting personnel related expenses. Additionally, and similar to the Material Handling segment, a year-to-date cumulative change in the allocation of intercompany expenses for shared service functions from Other income to General and administrative expenses was made during the third quarter of 2023, partially offsetting the aforementioned increases from acquisitions.
Other (expense) income, net: Construction Equipment other expense, net increased by $17.6 million to $46.1 million for the year ended December 31, 2024 as compared to the same period in 2023. The variance was mainly due to increased floor plan interest expense related to a combination of higher effective interest rates on higher levels of new inventory that were no longer within the subsidized period of our OEMs, higher effective interest rates on operating debt borrowings and increased debt from financed acquisitions within the segment (Ault and Burris purchased Q4 2023).
Master Distribution Results
| | | | | | | | | | | | | | | |
| Year Ended December 31, | | | Increase (Decrease) | |
| 2024 | | | 2023 | | | 2024 versus 2023 | |
Revenues: | | | | | | | | | | | |
New and used equipment sales | $ | 48.0 | | | $ | 72.5 | | | $ | (24.5 | ) | | | (33.8 | )% |
Parts sales | | 8.9 | | | | 9.8 | | | | (0.9 | ) | | | (9.2 | )% |
Service revenues | | 0.8 | | | | 0.3 | | | | 0.5 | | | | 166.7 | % |
Rental revenues | | 1.5 | | | | 1.2 | | | | 0.3 | | | | 25.0 | % |
Total revenues | | 59.2 | | | | 83.8 | | | | (24.6 | ) | | | (29.4 | )% |
Cost of revenues: | | | | | | | | | | | |
New and used equipment sales | | 35.9 | | | | 54.4 | | | | (18.5 | ) | | | (34.0 | )% |
Parts sales | | 5.0 | | | | 5.0 | | | | — | | | | — | |
Service revenues | | 0.9 | | | | 0.2 | | | | 0.7 | | | | 350.0 | % |
Rental depreciation | | 1.1 | | | | 0.8 | | | | 0.3 | | | | 37.5 | % |
Total cost of revenues | | 42.9 | | | | 60.4 | | | | (17.5 | ) | | | (29.0 | )% |
Gross profit | | 16.3 | | | | 23.4 | | | | (7.1 | ) | | | (30.3 | )% |
Selling, general and administrative expenses | | 13.0 | | | | 12.3 | | | | 0.7 | | | | 5.7 | % |
Non-rental depreciation and amortization | | 3.5 | | | | 3.6 | | | | (0.1 | ) | | | (2.8 | )% |
Total operating expenses | | 16.5 | | | | 15.9 | | | | 0.6 | | | | 3.8 | % |
(Loss) income from operations | | (0.2 | ) | | | 7.5 | | | | (7.7 | ) | | | (102.7 | )% |
Other (expense) income: | | | | | | | | | | | |
Interest expense, floor plan payable – new equipment | | (1.4 | ) | | | (0.7 | ) | | | (0.7 | ) | | | 100.0 | % |
Interest expense – other | | (3.1 | ) | | | (2.7 | ) | | | (0.4 | ) | | | 14.8 | % |
Other expense | | (0.3 | ) | | | — | | | | (0.3 | ) | | | — | |
Total other expense, net | | (4.8 | ) | | | (3.4 | ) | | | (1.4 | ) | | | 41.2 | % |
(Loss) income before taxes | $ | (5.0 | ) | | $ | 4.1 | | | $ | (9.1 | ) | | | (222.0 | )% |
Segment adjusted EBITDA | $ | 4.7 | | | $ | 12.5 | | | $ | (7.8 | ) | | | (62.4 | )% |
| | | | | | | |
| Percent of Revenues | |
| Year Ended December 31, | |
| 2024 | | | 2023 | |
Revenues: | | | | | |
New and used equipment sales | | 81.1 | % | | | 86.5 | % |
Parts sales | | 15.0 | % | | | 11.7 | % |
Service revenues | | 1.4 | % | | | 0.4 | % |
Rental revenues | | 2.5 | % | | | 1.4 | % |
Total revenues | | 100.0 | % | | | 100.0 | % |
Cost of revenues: | | | | | |
New and used equipment sales | | 60.6 | % | | | 64.9 | % |
Parts sales | | 8.5 | % | | | 6.0 | % |
Service revenues | | 1.5 | % | | | 0.2 | % |
Rental depreciation and amortization | | 1.9 | % | | | 1.0 | % |
Total cost of revenues | | 72.5 | % | | | 72.1 | % |
Gross profit | | 27.5 | % | | | 27.9 | % |
Revenues: Master Distribution segment revenues for the year ended December 31, 2024 were $59.2 million, a decrease of $24.6 million from the prior year same period. Our Master Distribution segment has established a distinct position in the marketplace for sales of specialized equipment designed for customers in environmental processing and waste management throughout North America. The Master Distribution segment has two primary sales channels for which it sells equipment: (1) through its dealer channel whereby contractual relationships are established with sub-dealers that hold stock inventory and ultimately sell to end users and (2) through direct sale relationships whereby end customers source specific types of equipment directly. As dealer channel sales depend on sub-dealer stocking levels, in 2023 the supply of new equipment was in the initial phase of meeting high levels of pent-up post-pandemic demand and our Master Distribution sub-dealers fulfilled stocking needs. With sub-dealer stocking levels full in 2024, by contrast, sales volumes reduced for our Master Distribution segment. Further, a challenging equipment demand environment due in part to an elevated interest rate environment contributed to volume and revenues declines in 2024. On a positive note, despite being a smaller portion of the total sales mix, the Master Distribution segment's direct sale business, primarily consisting of compost turning and bulk commercial food waste processing machinery, gained traction in 2024. Segment-level parts sales were down for the year ended December 31, 2024 as we sold multiple large component parts in 2023 when compared to 2024 and we observed increased competition from parts "Will-Fitters" (non-OEM manufacturers) on high-volume wear parts, all coupled with an overall depressed demand environment.
Gross profit (GP):
| | | | | | | | | | | |
| Year Ended December 31, | | | Increase (Decrease) | |
| 2024 | | | 2023 | | | 2024 versus 2023 | |
| GP% | | | GP% | | | GP% | |
New and used equipment sales | | 25.2 | % | | | 25.0 | % | | | 0.2 | % |
Parts sales | | 43.8 | % | | | 49.0 | % | | | (5.2 | )% |
Service revenues | | (12.5 | )% | | | 33.3 | % | | NM | |
Rental revenues | | 26.7 | % | | | 33.3 | % | | | (6.6 | )% |
| | | | | | | | |
Segment gross profit | | 27.5 | % | | | 27.9 | % | | | (0.4 | )% |
NM - calculated change not meaningful | | | | | | | | |
For the year ended December 31, 2024, gross profit margin on new and used equipment sales were 25.2%, relatively flat from prior year and in line with expectations. Parts gross profit margin was 43.8% for the year ended December 31, 2024, down 520 basis points compared to the same period last year, related to the aforementioned large component parts sales in 2023 and pricing pressures from aftermarket competitors of high-volume wear parts.
Operating expenses: Master Distribution segment operating expenses were $16.5 million for the year ended December 31, 2024, up $0.6 million from 2023. The increase from the prior year is primarily related to non-cash adjustments for contingent consideration earn-outs associated with the acquisition of Ecoverse in November 2022. Removing the impact of earn-out related expenses, segment-level operating expenses were slightly down against 2023.
Other expense, net: Master Distribution other expense was $4.8 million for the year ended December 31, 2024, an increase of $1.4 million over the prior year primarily attributed to higher interest costs on larger inventory balances.
Liquidity and Capital Resources
Years ended December 31, 2024 and 2023 Cash Flows
Cash Flow from Operating Activities. Cash flows from operating activities include net income adjusted for non-cash items and the effects of changes in working capital. For the year ended December 31, 2024, operating activities resulted in net cash provided by operations of $57.0 million. Our reported net loss of $62.1 million, when adjusted for non-cash income and expense items, primarily depreciation and amortization, the gain on sale of rental equipment, inventory obsolescence and bad debt reserves, and stock-based compensation, provided net cash inflows of $63.5 million. Changes in working capital included $145.3 million of inventory purchased (of which $120.6 million was transferred into our rental fleet for replenishment purposes), and a $42.7 million decrease in accounts receivable. Cash flows from operating activities were favorably impacted by $126.1 million due to proceeds from the sale of rent-to-sell equipment, and a $4.7 million net change in prepaid expenses and other assets and leases, deferred revenue, and other liabilities and unfavorably impacted by a $26.9 million decrease in accounts payable, accrued expenses, customer deposits, and other current liabilities and $7.8 million in net outflows related to manufacturer floor plans.
For the year ended December 31, 2023, operating activities resulted in net cash provided by operations of $58.4 million. Our reported net income of $8.9 million, when adjusted for non-cash income and expense items, primarily depreciation and amortization, the gain on sale of rental equipment, inventory obsolescence and bad debt reserves, and stock-based compensation, provided net cash inflows of $111.8 million. Changes in working capital included $286.3 million of inventory purchased (of which $180.2 million was transferred into our rental fleet for replenishment and growth purposes), and a $16.6 million increase in accounts receivable. Cash flows from operating activities were favorably impacted by $123.5 million due to proceeds from the sale of rent-to-sell equipment, $122.5 million in net inflows related to manufacturer floor plans and by a $7.3 million increase in accounts payable, accrued expenses, customer deposits, and other current liabilities partially offset by a $3.8 million net change in prepaid expenses and other assets and leases, deferred revenue, and other liabilities.
Cash Flow from Investing Activities. For the year ended December 31, 2024, our cash used in investing activities was $56.2 million. This was mainly due to $73.4 million purchases of rent-to-rent equipment, non-rental property and equipment, and other investing activities partially offset by $17.2 million proceeds from the sale of rent-to-rent equipment and non-rental property and equipment.
For the year ended December 31, 2023, our cash used in investing activities was $117.4 million. This was mainly due to $123.3 million purchases of rent-to-rent equipment, non-rental property and equipment, Burris and Ault acquisition activity, and other investing activities partially offset by $5.4 million proceeds from the sale of rent-to-rent equipment and $0.5 million proceeds from the sale of non-rental property and equipment.
Cash Flow from Financing Activities. For the year ended December 31, 2024, cash used in financing activities was $17.9 million. This cash outflow was mainly due to the extinguishment of the Senior Secured Second Lien Notes due 2026 of $319.4 million combined with principal payments on long-term debt and finance lease obligations of $639.9 million and net payments related to non-manufacturer floor plans for the year of $12.8 million more than offsetting the $974.2 million of proceeds from long-term borrowings including the new $500.0 million Senior Secured Second Lien Notes due 2029. Additionally, there were cash outflows of $10.8 million for preferred and common stock dividends, $5.8 million for repurchases of common stock, and $1.5 million related to other financing activities.
For the year ended December 31, 2023, cash provided by financing activities was $87.3 million. This cash inflow was mainly due to $91.3 million of net borrowings under our line of credit, which funded the Burris and Ault acquisitions, and the increase in net working capital and rental fleet as previously noted. Additionally, there were net borrowings of $8.7 million related to non-manufacturer floor plans for the year. These cash inflows were partially offset by payments of $10.6 million for preferred and common stock dividends and $2.1 million related to other financing activities.
Sources of Liquidity
Our principal sources of liquidity have been from cash provided by our service, parts and rental operations and the sales of new, used, and rental fleet equipment, proceeds from the issuance of debt, and borrowings available under our line of credit and floor plans. The Company reported $13.4 million in cash as of December 31, 2024. For more information on our available borrowings under the revolving line of credit, senior secured second lien notes, and floor plans, please refer to Note 8, Floor Plans and Note 9, Long-term Debt. We consider the undistributed earnings of our foreign subsidiaries to be indefinitely reinvested as we do not anticipate the need to repatriate funds to the U.S. to satisfy domestic liquidity needs.
Cash Requirements Related to Operations
Our principal uses of cash have been to fund operating activities and working capital (including new and used equipment inventories), purchases of rental fleet equipment and property and equipment, fund payments due under line of credit and floor plans payable, fund acquisitions, meet debt service requirements, stock repurchases, and fund the preferred stock and common stock dividends. In the future, we may pursue additional strategic acquisitions and seek to open new start-up locations. We anticipate that the uses described above encompass the principal demands on our cash and availability under our line of credit and floor plans in the future.
The amount of our future capital expenditures will depend on a number of factors including general economic conditions, the state of our industry and the markets we serve and our growth prospects. Our gross rental fleet capital expenditures for the period ended December 31, 2024 were approximately $175.7 million, including $120.6 million of transfers from new and used inventory to rent-to-sell rental fleet. This gross rental fleet capital expenditure was offset by sales proceeds of rental equipment of approximately $138.0 million for the period ended December 31, 2024, of which $126.1 million came from rent-to-sell equipment categories, as our business model is to sell lightly used inventory to customers from our rental fleet to increase field population in our geographies. In response to changing economic conditions, we have the flexibility to modify our capital expenditures, especially as it relates to rental fleet.
To service our debt, we will require a significant amount of cash. Our ability to pay interest and principal on our indebtedness will depend upon our future operating performance and the availability of borrowings under the line of credit and/or other debt and equity financing alternatives available to us, which will be affected by prevailing economic conditions and conditions in the global credit and capital markets, as well as financial, business and other factors, some of which are beyond our control. Based on our current level of operations and given the current state of the capital markets, we believe our cash flows from operations, available cash, and available borrowings under the line of credit will be adequate to meet our future liquidity needs for the foreseeable future. As of December 31, 2024, we had $441.0 million of available borrowings under the revolving line of credit and floor plans.
Critical Accounting Policies and Estimates
In the preparation of consolidated financial statements in conformity with accounting principles generally accepted in the United States of America (“U.S. GAAP”), we are required to make estimates and judgments that affect the reported amounts of assets, liabilities, revenues, expenses, and the related disclosures. Our management reviews these estimates and assumptions on an ongoing basis. While we believe the estimates and judgments we use in preparing our consolidated financial statements are reasonable and appropriate, they are subject to future events and uncertainties regarding their outcome; therefore, actual results may materially differ from these estimates. If actual amounts are ultimately different from our estimates, the revisions are included in our results of operations for the period in which the actual amounts first become known. We consider the following items in the consolidated financial statements to require significant estimation or judgment. See Note 2 to our consolidated financial statements for a summary of our significant accounting policies.
Revenue Recognition
Refer to Note 2, Summary of Significant Accounting Policies, and Note 3, Revenue Recognition, herein for more information.
Impairment of Goodwill and Long-lived Assets
Refer to Note 2, Summary of Significant Accounting Policies, herein for more information.
Useful Lives of Property and Equipment
We depreciate rental equipment and property and equipment over their estimated useful lives. The useful life of rental equipment is determined based on our estimate of the period the asset will generate revenues. The principal methods of depreciation used are straight-line basis over the estimated useful lives or percentage of rental revenues based on the unit of activity method. We periodically review the assumptions used in calculating rates of depreciation. We may be required to change these estimates based on changes in our industry or changes in other circumstances. If these estimates change in the future, we may be required to recognize increased or decreased depreciation expense for these assets. The amount of depreciation expense we record is highly dependent upon the estimated useful lives assigned to each category of equipment and the utilization of equipment where the unit of activity method is applied.
Generally, we assign the following useful lives to the below categories of Property and Equipment and Rental Fleet:
| | |
| | Estimated
Useful Life |
Transportation equipment (autos and trucks) | | 2 – 5 years |
Rental fleet | | 5 - 10 years |
Machinery and equipment excluding rental fleet | | 3 – 20 years |
Office equipment | | 5 – 7 years |
Computer equipment | | 2 – 5 years |
Leasehold improvements | | 3 – 15 years |
The useful lives and methods of depreciation are reviewed at each financial year-end and adjusted prospectively, if appropriate.
Acquisition Accounting
We have made significant acquisitions in the past and we intend to make additional acquisitions in the future that meet our selection criteria with an objective of increasing our revenues, improving our profitability, diversifying our end market and geographic exposure and strengthening our competitive position. The assets acquired and liabilities assumed (including contingent purchase consideration) are recorded based on their respective fair values at the date of acquisition. Such fair value assessments require judgments and estimates that can be affected by various factors over time, which may cause final amounts to differ materially from original estimates. The significant judgments include the estimation of future cash flows, which are dependent on forecasts; the estimation of a long-term rate of growth; the estimation of the useful life over which cash flows will occur; and the determination of a risk-adjusted weighted average cost of capital. When appropriate, our estimates of the fair values of assets and liabilities acquired include assistance from independent third-party appraisal firms. The judgments made in determining the estimated fair value assigned to the assets acquired, as well as the estimated life of the assets, can materially impact net income in periods subsequent to the acquisition through depreciation and amortization, and in certain instances through impairment charges, if the asset becomes impaired in the future. As discussed below, we regularly review impairment indicators.
New and used equipment inventories, long-lived assets (primarily rental equipment), goodwill, and other intangible assets generally represent the largest component of our acquisitions. Equipment inventory and rental fleet acquired in the transaction are valued at fair value, which approximates a market participant’s estimated selling price adjusted for (1) costs to sell and (2) a reasonable profit allowance. In addition to long-lived assets, we also acquire other assets and assume liabilities. These other assets and liabilities typically include, but are not limited to, parts inventory, accounts receivable, accounts payable, floor plans payable and other working capital items. Because of their short-term nature, the fair values of these assets and liabilities generally approximate the carrying values reflected on the acquired entities' balance sheets. However, when appropriate, we adjust these carrying values for factors such as collectability, existence, and consistency with Company accounting policies.
For acquisitions involving additional consideration to be transferred to the selling parties in the event certain future events occur or conditions are met (“contingent consideration”), we recognize the acquisition date fair value of contingent consideration as part of the consideration transferred in exchange for the business combination. Contingent consideration meeting the criteria to be classified as equity is not remeasured and is recorded within "Additional paid-in capital" on the Consolidated Balance Sheets. Contingent consideration classified as a liability is remeasured to fair value at each reporting date until the contingency is resolved, with any changes in fair value recognized in our Consolidated Statements of Operations.
Pursuant to accounting standard Topic 350 - Intangibles - Goodwill and Other, we record as goodwill the excess of the consideration transferred over the fair values of the identifiable net assets acquired. The intangible assets that we have acquired consist of tradenames, non-compete agreements, supplier relationships, and customer relationships. A tradename has a fair value equal to the present value of the royalty income attributable to it. The royalty income attributable to a tradename represents the hypothetical cost savings that are derived from owning the tradename instead of paying royalties to license the tradename from another owner. The fair value of non-compete agreements is estimated based on an income approach since their values are representative of the current and future revenues and profit erosion protection they provide. Customer and supplier relationships are generally valued based on an excess earnings or income approach with consideration to projected cash flows.
Income Taxes
The Company operates in a number of geographic locations and is subject to foreign, U.S. federal, state, and local taxes applicable in each of the respective jurisdictions. These tax laws are complex and involve uncertainties in the application of our facts and circumstances that may be subject to interpretation. We account for income taxes under the asset and liability method, which requires the recognition of deferred tax assets and liabilities for the expected future tax consequences of events that have been included in the financial statements. Under this method, we determine deferred tax assets and liabilities on the basis of the differences between the financial statement and tax bases of assets and liabilities by using enacted tax rates in effect for the year in which the differences are expected to reverse. The effect of a change in tax rates on deferred tax assets and liabilities is recognized in income in the period that includes the enactment date.
As a part of our income tax provision, we must also evaluate the likelihood we will be able to realize our deferred tax assets which is dependent on our ability to generate sufficient taxable income in future years. Our deferred tax calculation requires management to make certain estimates about future operations. We recognize deferred tax assets to the extent that we believe that these assets are more likely than not (a likelihood of greater than 50%) to be realized. Deferred tax assets are reduced by a valuation allowance when, in the opinion of management, it is more likely than not that some portion or all of the deferred tax assets will not be realized. These estimates involve judgment. In making such a determination, we consider all available positive and negative evidence, including future reversals of existing taxable temporary differences, projected future taxable income, tax-planning strategies, and results of recent operations. Refer to Note 2, Summary of Significant Accounting Policies, and Note 12, Income Taxes, herein for more information.
Allowance for Credit Losses
The Company records trade accounts receivables at invoice amount less allowances for credit losses. These allowances reflect our estimate of the amount of our receivables we will be unable to collect based on historical write-off experience and, as applicable, current economic conditions and reasonable and supportable forecasts that affect collectability. Our estimate could change based on changing circumstances and qualitative factors not able to be fully captured in our loss forecast models, including changes in the economy or in the particular circumstances of individual customers. The aforementioned qualitative factors are subjective and require a degree of management judgment. Generally, the Company does not accrue interest on past due receivables. Certain accounts are turned over to collection agencies, while the Company places liens and pursues a variety of other collection strategies on others. The allowance for credit losses is charged with the write-off when deemed uncollectible by management. Write-offs of such receivables require management approval based on specified dollar thresholds.
Item 7A. Quantitative and Qualitative Disclosures About Market Risk.
Our exposure to market risks primarily consist of interest rate risk associated with our variable and fixed rate debt, prices of certain commodities, and foreign currency exchange rate risks. From time to time, we employ financial instruments to manage the Company's exposure to changes in interest rates, diesel and unleaded fuel, and foreign currencies. See Note 14, Fair Value of Financial Instruments, for more information.
Interest rate risk: Our earnings may be affected by changes in interest rates on the asset-based revolving line of credit ("ABL Facility") and Floor Plan Facilities. The interest rates applicable to any loans under the ABL Facility are based, at the option of the borrowers, on (i) a floating rate based on the Secured Overnight Financing Rate ("SOFR") (for loans denominated in U.S. dollars) or Canadian Dollar Offered Rate (for loans denominated in Canadian dollars) plus an initial margin of 1.75% or (ii) CBFR (for loans denominated in U.S. dollars) or the Canadian Prime Rate (for loans denominated in Canadian dollars) less an initial margin of 0.75%, in each case, where margin is adjusted under the ABL Facility based on the quarterly average excess availability under the ABL Facility. The interest rates applicable to any loans under various Floor Plan Facilities ("Floor Plan Rates") are based on a wide range of benchmark rates (including SOFR, Prime, Bloomberg Short-Term Bank Yield Index, and the Canadian Bankers' Acceptance Rate) plus an applicable margin. As of December 31, 2024, the lowest Floor Plan Rate was SOFR plus an initial margin of 2.75%, and the highest was SOFR plus a margin of 5.1145% per annum.
At December 31, 2024 and 2023, we had $182.9 million and $317.5 million, respectively, outstanding borrowings under the ABL Facility. At December 31, 2024 and 2023, we had $374.9 million and $397.5 million, respectively, outstanding borrowings under the Floor Plan Facilities. As of December 31, 2024, based upon the amount of our variable rate debt outstanding, each one percentage point increase in the interest rates applicable to our variable rate debt, when including the hedge impact of our interest rate cap, would reduce our annual pre-tax earnings by $2.6 million. The amount of variable rate indebtedness outstanding may fluctuate significantly. See Note 8, Floor Plans, and Note 9, Long-Term Debt, in our consolidated financial statements for additional information concerning the terms of our variable rate debt.
We have a fixed rate on the Senior Secured Second Lien Notes (the "Notes") of $500.0 million which are due in 2029. We do not have any exposure to changing interest rates as of December 31, 2024 on the Notes. For additional information concerning the terms of our fixed rate debt, see Note 9, Long-Term Debt.
Commodity price risk: The market prices of diesel and unleaded fuels are unpredictable and can fluctuate significantly. Because of the volume of fuel we purchase each year, a significant increase in the price of fuel could adversely affect our business and reduce our operating margins. To manage a portion of this risk, we enter into fixed price swap contracts to purchase gasoline and diesel fuel related to forecasted fuel purchases. For the purchases of unleaded and diesel fuel that we expect to purchase at market prices in the next 12 months, each $0.10 per gallon increase in the price of diesel and unleaded fuel, holding other variables constant, would not have a material impact on our pre-tax income when including the fixed price swap contracts.
Foreign currency exchange rate risk: Due to our international operations, a portion of our revenues, cost of revenues, and operating expenses are subject to foreign currency exchange rate risk. Changes in the exchange rate of the U.S. dollar versus the Canadian dollar and European currencies affect the translated value and relative level of revenues and net income that we report from one period to the next. Based upon balances and exchange rates as of December 31, 2024, holding other variables constant, we believe that a hypothetical 10% increase or decrease in all applicable foreign exchange rates would not have a material impact on our results of operations or cash flows.
Item 8. Financial Statements and Supplementary Data.
REPORT OF INDEPENDENT REGISTERED PUBLIC ACCOUNTING FIRM
To the shareholders and the Board of Directors of Alta Equipment Group Inc.
Opinion on the Financial Statements
We have audited the accompanying consolidated balance sheets of Alta Equipment Group Inc. and subsidiaries (the "Company") as of December 31, 2024 and 2023, the related consolidated statements of operations, comprehensive (loss) income, stockholders' equity, and cash flows, for the years ended December 31, 2024, and the related notes, and the schedule listed in the Index at Item 15 (collectively referred to as the "financial statements"). In our opinion, the financial statements present fairly, in all material respects, the financial position of the Company as of December 31, 2024 and 2023, and the results of its operations and its cash flows for each of the three years in the period ended December 31, 2024, in conformity with accounting principles generally accepted in the United States of America.
We have also audited, in accordance with the standards of the Public Company Accounting Oversight Board (United States) (PCAOB), the Company's internal control over financial reporting as of December 31, 2024, based on criteria established in Internal Control — Integrated Framework (2013) issued by the Committee of Sponsoring Organizations of the Treadway Commission and our report dated March 5, 2025, expressed an unqualified opinion on the Company's internal control over financial reporting.
Basis for Opinion
These financial statements are the responsibility of the Company's management. Our responsibility is to express an opinion on the Company's financial statements based on our audits. We are a public accounting firm registered with the PCAOB and are required to be independent with respect to the Company in accordance with the U.S. federal securities laws and the applicable rules and regulations of the Securities and Exchange Commission and the PCAOB.
We conducted our audits in accordance with the standards of the PCAOB. Those standards require that we plan and perform the audit to obtain reasonable assurance about whether the financial statements are free of material misstatement, whether due to error or fraud. Our audits included performing procedures to assess the risks of material misstatement of the financial statements, whether due to error or fraud, and performing procedures that respond to those risks. Such procedures included examining, on a test basis, evidence regarding the amounts and disclosures in the financial statements. Our audits also included evaluating the accounting principles used and significant estimates made by management, as well as evaluating the overall presentation of the financial statements. We believe that our audits provide a reasonable basis for our opinion.
Critical Audit Matter
The critical audit matter communicated below is a matter arising from the current-period audit of the financial statements that was communicated or required to be communicated to the audit committee and that (1) relates to accounts or disclosures that are material to the financial statements and (2) involved our especially challenging, subjective, or complex judgments. The communication of critical audit matters does not alter in any way our opinion on the financial statements, taken as a whole, and we are not, by communicating the critical audit matter below, providing a separate opinion on the critical audit matter or on the accounts or disclosures to which it relates.
Revenue Recognition — Refer to Notes 2 and 3 to the financial statements
Critical Audit Matter Description
The Company’s revenues from the sale of new and used equipment and rental equipment are recognized at the time of delivery to, or pick-up by, the customer, which is when the customer obtains control of the promised good. Revenues from the sale of parts are recognized at the time of pick-up by the customer for over-the-counter sales transactions. For parts that are shipped to a customer, revenues are recognized at the time of shipment. The Company recognizes periodic maintenance service revenues at the time such services are completed. The processing and recording of the Company’s revenue transactions involves a combination of automated and manual processes.
We identified the Company’s revenue recognition processes for new and used equipment sales, parts sales, service revenues, and rental equipment sales as a critical audit matter as the Company has a significant volume of revenue transactions throughout the year that rely on manual processes to generate accurate data to record revenue when the customer obtains control of the promised good or when services are completed. This required an increased extent of effort to audit these revenue transactions.
How the Critical Audit Matter Was Addressed in the Audit
Our audit procedures related to the Company’s revenue recognition for new and used equipment sales, parts sales, service revenues, and rental equipment sales included the following, among others:
•We obtained an understanding of the nature of the revenue recognition process through inquiry with the Company personnel responsible for revenue recognition, walkthrough of individual transactions, and review of contracts with the customers.
•We created data visualizations to evaluate trends in the transactional revenue data.
•For a sample of new and used equipment sales, parts sales, and rental equipment sales transactions, we performed detail transaction testing to evaluate the accuracy and completeness of recorded revenue by agreeing the amounts recognized to source documents and testing the mathematical accuracy of the transactions.
•For a sample of new and used equipment sales, parts sales, and rental equipment sales transactions, we performed detail transaction testing to evaluate the timing of when revenue was recorded by agreeing the timing of the amounts recognized to source documents.
•We developed an independent expectation of new and used equipment sales, parts sales, and service revenues using analytical procedures and considering relevant current and historical information and compared our expectations to the recorded revenue.
/s/ Deloitte & Touche LLP
Detroit, Michigan
March 5, 2025
We have served as the Company's auditor since 2022.
ALTA EQUIPMENT GROUP INC. AND SUBSIDIARIES
CONSOLIDATED BALANCE SHEETS
(in millions, except share and per share amounts)
| | | | | | | |
| December 31,
2024 | | | December 31,
2023 | |
ASSETS | | | | | |
Cash | $ | 13.4 | | | $ | 31.0 | |
Accounts receivable, net of allowances of $10.7 and $12.4 as of December 31, 2024 and December 31, 2023, respectively | | 199.7 | | | | 249.3 | |
Inventories, net | | 535.9 | | | | 530.7 | |
Prepaid expenses and other current assets | | 25.5 | | | | 27.0 | |
Total current assets | | 774.5 | | | | 838.0 | |
| | | | | |
NON-CURRENT ASSETS | | | | | |
Property and equipment, net | | 81.6 | | | | 73.4 | |
Rental fleet, net | | 358.8 | | | | 391.4 | |
Operating lease right-of-use assets, net | | 113.0 | | | | 110.9 | |
Goodwill | | 77.5 | | | | 76.7 | |
Other intangible assets, net | | 54.7 | | | | 66.3 | |
Other assets | | 20.3 | | | | 14.2 | |
TOTAL ASSETS | $ | 1,480.4 | | | $ | 1,570.9 | |
| | | | | |
LIABILITIES AND STOCKHOLDERS’ EQUITY | | | | | |
Floor plan payable – new equipment | $ | 293.4 | | | $ | 297.8 | |
Floor plan payable – used and rental equipment | | 81.1 | | | | 99.5 | |
Current portion of long-term debt | | 10.5 | | | | 7.7 | |
Accounts payable | | 91.5 | | | | 97.0 | |
Customer deposits | | 14.8 | | | | 17.4 | |
Accrued expenses | | 51.2 | | | | 59.7 | |
Current operating lease liabilities | | 15.1 | | | | 15.9 | |
Current deferred revenue | | 13.0 | | | | 16.2 | |
Other current liabilities | | 6.6 | | | | 23.9 | |
Total current liabilities | | 577.2 | | | | 635.1 | |
| | | | | |
NON-CURRENT LIABILITIES | | | | | |
Line of credit, net | | 179.8 | | | | 315.9 | |
Long-term debt, net of current portion | | 480.0 | | | | 312.3 | |
Finance lease obligations, net of current portion | | 35.5 | | | | 31.1 | |
Deferred revenue, net of current portion | | 4.3 | | | | 4.2 | |
Long-term operating lease liabilities, net of current portion | | 103.5 | | | | 99.6 | |
Deferred tax liabilities | | 10.8 | | | | 7.7 | |
Other liabilities | | 11.7 | | | | 15.3 | |
TOTAL LIABILITIES | | 1,402.8 | | | | 1,421.2 | |
CONTINGENCIES - NOTE 11 | | | | | |
STOCKHOLDERS’ EQUITY | | | | | |
Preferred stock, $0.0001 par value per share, 1,000,000 shares authorized, 1,200 shares issued and outstanding at both December 31, 2024 and December 31, 2023 (1,200,000 Depositary Shares representing a 1/1000th fractional interest in a share of 10% Series A Cumulative Perpetual Preferred Stock) | | — | | | | — | |
Common stock, $0.0001 par value per share, 200,000,000 shares authorized; 32,762,135 and 32,369,820 shares issued and outstanding at December 31, 2024 and December 31, 2023, respectively | | — | | | | — | |
Additional paid-in capital | | 243.5 | | | | 233.8 | |
Treasury stock at cost, 1,587,702 and 862,182 shares of common stock held at December 31, 2024 and December 31, 2023, respectively | | (11.7 | ) | | | (5.9 | ) |
Accumulated deficit | | (149.3 | ) | | | (76.4 | ) |
Accumulated other comprehensive loss | | (4.9 | ) | | | (1.8 | ) |
TOTAL STOCKHOLDERS’ EQUITY | | 77.6 | | | | 149.7 | |
TOTAL LIABILITIES AND STOCKHOLDERS’ EQUITY | $ | 1,480.4 | | | $ | 1,570.9 | |
The accompanying notes are an integral part of these consolidated financial statements.
ALTA EQUIPMENT GROUP INC. AND SUBSIDIARIES
CONSOLIDATED STATEMENTS OF OPERATIONS
(in millions, except share and per share amounts)
| | | | | | | | | | | |
| Year Ended December 31, | |
| 2024 | | | 2023 | | | 2022 | |
Revenues: | | | | | | | | |
New and used equipment sales | $ | 987.0 | | | $ | 1,025.9 | | | $ | 817.2 | |
Parts sales | | 294.4 | | | | 278.3 | | | | 234.8 | |
Service revenues | | 253.8 | | | | 241.3 | | | | 206.6 | |
Rental revenues | | 203.4 | | | | 202.4 | | | | 180.1 | |
Rental equipment sales | | 138.0 | | | | 128.9 | | | | 133.1 | |
Total revenues | | 1,876.6 | | | | 1,876.8 | | | | 1,571.8 | |
Cost of revenues: | | | | | | | | |
New and used equipment sales | | 837.9 | | | | 853.6 | | | | 683.2 | |
Parts sales | | 196.2 | | | | 183.2 | | | | 157.4 | |
Service revenues | | 105.8 | | | | 103.4 | | | | 90.7 | |
Rental revenues | | 22.5 | | | | 24.8 | | | | 22.4 | |
Rental depreciation | | 115.9 | | | | 110.1 | | | | 95.5 | |
Rental equipment sales | | 104.6 | | | | 94.5 | | | | 103.0 | |
Total cost of revenues | | 1,382.9 | | | | 1,369.6 | | | | 1,152.2 | |
Gross profit | | 493.7 | | | | 507.2 | | | | 419.6 | |
Selling, general and administrative expenses | | 446.5 | | | | 430.3 | | | | 362.3 | |
Non-rental depreciation and amortization | | 28.6 | | | | 22.5 | | | | 16.5 | |
Total operating expenses | | 475.1 | | | | 452.8 | | | | 378.8 | |
Income from operations | | 18.6 | | | | 54.4 | | | | 40.8 | |
Other (expense) income: | | | | | | | | |
Interest expense, floor plan payable – new equipment | | (12.1 | ) | | | (8.4 | ) | | | (2.7 | ) |
Interest expense – other | | (69.2 | ) | | | (48.6 | ) | | | (29.1 | ) |
Other income | | 3.1 | | | | 5.1 | | | | 1.6 | |
Loss on extinguishment of debt | | (6.7 | ) | | | — | | | | — | |
Total other expense, net | | (84.9 | ) | | | (51.9 | ) | | | (30.2 | ) |
(Loss) income before taxes | | (66.3 | ) | | | 2.5 | | | | 10.6 | |
Income tax (benefit) provision | | (4.2 | ) | | | (6.4 | ) | | | 1.3 | |
Net (loss) income | | (62.1 | ) | | | 8.9 | | | | 9.3 | |
Preferred stock dividends | | (3.0 | ) | | | (3.0 | ) | | | (3.0 | ) |
Net (loss) income available to common stockholders | $ | (65.1 | ) | | $ | 5.9 | | | $ | 6.3 | |
Basic (loss) income per share | $ | (1.96 | ) | | $ | 0.18 | | | $ | 0.20 | |
Diluted (loss) income per share | $ | (1.96 | ) | | $ | 0.18 | | | $ | 0.20 | |
Basic weighted average common shares outstanding | | 33,179,598 | | | | 32,447,754 | | | | 32,099,247 | |
Diluted weighted average common shares outstanding | | 33,179,598 | | | | 32,877,507 | | | | 32,301,663 | |
The accompanying notes are an integral part of these consolidated financial statements.
ALTA EQUIPMENT GROUP INC. AND SUBSIDIARIES
CONSOLIDATED STATEMENTS OF COMPREHENSIVE (LOSS) INCOME
(in millions)
| | | | | | | | | | | |
| Year Ended December 31, | |
| 2024 | | | 2023 | | | 2022 | |
Net (loss) income | $ | (62.1 | ) | | $ | 8.9 | | | $ | 9.3 | |
Other comprehensive (loss) income: | | | | | | | | |
Foreign currency translation adjustments | | (3.6 | ) | | | 1.6 | | | | (1.5 | ) |
Change in fair value of derivative, net of tax | | 0.5 | | | | (0.5 | ) | | | (1.4 | ) |
Total other comprehensive (loss) income (1) | | (3.1 | ) | | | 1.1 | | | | (2.9 | ) |
Comprehensive (loss) income | $ | (65.2 | ) | | $ | 10.0 | | | $ | 6.4 | |
(1) There were no material reclassifications from Accumulated other comprehensive loss reflected in Total other comprehensive (loss) income for the years ended December 31, 2024, 2023 and 2022. There were no material taxes associated with Total other comprehensive (loss) income for the years ended December 31, 2024, 2023 and 2022.
The accompanying notes are an integral part of these consolidated financial statements.
ALTA EQUIPMENT GROUP INC. AND SUBSIDIARIES
CONSOLIDATED STATEMENTS OF STOCKHOLDERS’ EQUITY
(in millions, except share and per share amounts)
| | | | | | | | | | | | | | | | | | | | | | | | | | | | | | | | | | | |
| Years Ended December 31, 2024, 2023 and 2022 | |
| Preferred Stock | | | Common Stock | | | | | | | | | | | | | | | | |
| Number
of Shares | | | Amount | | | Number of
Shares | | | Amount | | | Additional
Paid-in
Capital | | | Accumulated
Deficit | | | Treasury Stock | | | Accumulated Other Comprehensive Loss | | | Total
Stockholders'
Equity (Deficit) | |
Balance at December 31, 2021 | | 1,200,000 | | | $ | — | | | | 32,363,376 | | | $ | — | | | $ | 217.4 | | | $ | (76.8 | ) | | $ | (5.9 | ) | | $ | — | | | | 134.7 | |
Net income | | — | | | | — | | | | — | | | | — | | | | — | | | | 9.3 | | | | — | | | | — | | | | 9.3 | |
Dividends on preferred stock, $2.50 per share | | — | | | | — | | | | — | | | | — | | | | — | | | | (3.0 | ) | | | — | | | | — | | | | (3.0 | ) |
Dividends on common stock and dividend equivalent on stock-based compensation, $0.114 per share | | — | | | | — | | | | — | | | | — | | | | — | | | | (3.7 | ) | | | — | | | | — | | | | (3.7 | ) |
Stock-based compensation | | — | | | | — | | | | 90,649 | | | | — | | | | 2.7 | | | | — | | | | — | | | | — | | | | 2.7 | |
Foreign currency translation adjustments | | — | | | | — | | | | — | | | | — | | | | — | | | | — | | | | — | | | | (1.5 | ) | | | (1.5 | ) |
Change in fair value of derivative, net of tax | | — | | | | — | | | | — | | | | — | | | | — | | | | — | | | | — | | | | (1.4 | ) | | | (1.4 | ) |
Acquisition contingent consideration | | — | | | | — | | | | 212,400 | | | | — | | | | 2.7 | | | | — | | | | — | | | | — | | | | 2.7 | |
Repurchase of common stock | | — | | | | — | | | | (472,182 | ) | | | — | | | | — | | | | — | | | | — | | | | — | | | | — | |
Balance at December 31, 2022 | | 1,200,000 | | | $ | — | | | | 32,194,243 | | | $ | — | | | $ | 222.8 | | | $ | (74.2 | ) | | $ | (5.9 | ) | | $ | (2.9 | ) | | $ | 139.8 | |
Net income | | — | | | | — | | | | — | | | | — | | | | — | | | | 8.9 | | | | — | | | | — | | | | 8.9 | |
Dividends on preferred stock, $2.50 per share | | — | | | | — | | | | — | | | | — | | | | — | | | | (3.0 | ) | | | — | | | | — | | | | (3.0 | ) |
Dividends on common stock and dividend equivalent on stock-based compensation, $0.228 per share | | — | | | | — | | | | — | | | | — | | | | — | | | | (7.6 | ) | | | — | | | | — | | | | (7.6 | ) |
Impact of adoption of new accounting standard | | — | | | | — | | | | — | | | | — | | | | — | | | | (0.5 | ) | | | — | | | | — | | | | (0.5 | ) |
Stock-based compensation, including employee stock purchase plan | | — | | | | — | | | | 175,577 | | | | — | | | | 4.3 | | | | — | | | | — | | | | — | | | | 4.3 | |
Foreign currency translation adjustments | | — | | | | — | | | | — | | | | — | | | | — | | | | — | | | | — | | | | 1.6 | | | | 1.6 | |
Change in fair value of derivative, net of tax | | — | | | | — | | | | — | | | | — | | | | — | | | | — | | | | — | | | | (0.5 | ) | | | (0.5 | ) |
Acquisition contingent consideration | | — | | | | — | | | | — | | | | — | | | | 6.3 | | | | — | | | | — | | | | — | | | | 6.3 | |
Proceeds from stockholder short-swing profits | | — | | | | — | | | | — | | | | — | | | | 0.4 | | | | — | | | | — | | | | — | | | | 0.4 | |
Balance at December 31, 2023 | | 1,200,000 | | | $ | — | | | | 32,369,820 | | | $ | — | | | $ | 233.8 | | | $ | (76.4 | ) | | $ | (5.9 | ) | | $ | (1.8 | ) | | $ | 149.7 | |
Net loss | | — | | | | — | | | | — | | | | — | | | | — | | | | (62.1 | ) | | | — | | | | — | | | | (62.1 | ) |
Dividends on preferred stock, $2.50 per share | | — | | | | — | | | | — | | | | — | | | | — | | | | (3.0 | ) | | | — | | | | — | | | | (3.0 | ) |
Dividends on common stock and dividend equivalent on stock-based compensation, $0.228 per share | | — | | | | — | | | | — | | | | — | | | | — | | | | (7.8 | ) | | | — | | | | — | | | | (7.8 | ) |
Stock-based compensation, including employee stock purchase plan | | — | | | | — | | | | 614,108 | | | | — | | | | 6.7 | | | | — | | | | — | | | | — | | | | 6.7 | |
Foreign currency translation adjustments | | — | | | | — | | | | — | | | | | | | — | | | | — | | | | — | | | | (3.6 | ) | | | (3.6 | ) |
Change in fair value of derivative, net of tax | | — | | | | — | | | | — | | | | — | | | | — | | | | — | | | | — | | | | 0.5 | | | | 0.5 | |
Acquisition contingent consideration | | — | | | | — | | | | 503,727 | | | | — | | | | 3.0 | | | | — | | | | — | | | | — | | | | 3.0 | |
Repurchase of common stock | | — | | | | — | | | | (725,520 | ) | | | — | | | | — | | | | — | | | | (5.8 | ) | | | — | | | | (5.8 | ) |
Balance at December 31, 2024 | | 1,200,000 | | | $ | — | | | | 32,762,135 | | | $ | — | | | $ | 243.5 | | | $ | (149.3 | ) | | $ | (11.7 | ) | | $ | (4.9 | ) | | $ | 77.6 | |
The accompanying notes are an integral part of these consolidated financial statements.
ALTA EQUIPMENT GROUP INC. AND SUBSIDIARIES
CONSOLIDATED STATEMENTS OF CASH FLOWS
(in millions)
| | | | | | | | | | | |
| Year Ended December 31, | |
| 2024 | | | 2023 | | | 2022 | |
OPERATING ACTIVITIES | | | | | | | | |
Net (loss) income | $ | (62.1 | ) | | $ | 8.9 | | | $ | 9.3 | |
Adjustments to reconcile net (loss) income to net cash flows provided by operating activities | | | | | | | | |
Depreciation and amortization | | 144.5 | | | | 132.6 | | | | 112.0 | |
Amortization of debt discount and debt issuance costs | | 4.2 | | | | 2.0 | | | | 1.8 | |
Imputed interest | | 0.5 | | | | 1.0 | | | | 0.3 | |
(Gain) loss on sale of property and equipment | | (1.1 | ) | | | 0.2 | | | | (0.2 | ) |
Gain on sale of rental equipment | | (33.4 | ) | | | (34.4 | ) | | | (30.1 | ) |
Provision for inventory obsolescence | | 1.5 | | | | 2.2 | | | | 1.4 | |
Provision for losses on accounts receivable | | 5.7 | | | | 7.2 | | | | 5.0 | |
Loss on debt extinguishment | | 6.7 | | | | — | | | | — | |
Change in fair value of derivative instruments | | 0.8 | | | | (0.6 | ) | | | — | |
Stock-based compensation expense | | 4.8 | | | | 4.3 | | | | 2.7 | |
Gain on bargain purchase of business | | — | | | | (1.5 | ) | | | — | |
Changes in deferred income taxes | | (8.6 | ) | | | (10.1 | ) | | | (1.2 | ) |
Changes in assets and liabilities, net of acquisitions: | | | | | | | | |
Accounts receivable | | 42.7 | | | | (16.6 | ) | | | (34.7 | ) |
Inventories | | (145.3 | ) | | | (286.3 | ) | | | (272.6 | ) |
Proceeds from sale of rental equipment - rent-to-sell | | 126.1 | | | | 123.5 | | | | 125.6 | |
Prepaid expenses and other assets | | 4.3 | | | | 0.5 | | | | (4.1 | ) |
Manufacturers floor plans payable | | (7.8 | ) | | | 122.5 | | | | 77.3 | |
Accounts payable, accrued expenses, customer deposits, and other current liabilities | | (26.9 | ) | | | 7.3 | | | | 26.7 | |
Leases, deferred revenue, net of current portion and other liabilities | | 0.4 | | | | (4.3 | ) | | | (0.7 | ) |
Net cash provided by operating activities | | 57.0 | | | | 58.4 | | | | 18.5 | |
INVESTING ACTIVITIES | | | | | | | | |
Expenditures for rental equipment | | (55.1 | ) | | | (62.2 | ) | | | (63.9 | ) |
Expenditures for property and equipment | | (15.4 | ) | | | (12.4 | ) | | | (12.8 | ) |
Proceeds from sale of property and equipment | | 5.3 | | | | 0.5 | | | | 1.2 | |
Proceeds from sale of rental equipment - rent-to-rent | | 11.9 | | | | 5.4 | | | | 7.5 | |
Acquisitions of businesses, net of cash acquired | | — | | | | (45.6 | ) | | | (86.7 | ) |
Other investing activities | | (2.9 | ) | | | (3.1 | ) | | | (0.4 | ) |
Net cash used in investing activities | | (56.2 | ) | | | (117.4 | ) | | | (155.1 | ) |
FINANCING ACTIVITIES | | | | | | | | |
Expenditures for debt issuance costs | | (1.9 | ) | | | — | | | | — | |
Extinguishment of long-term debt | | (319.4 | ) | | | — | | | | — | |
Proceeds from long-term borrowings | | 974.2 | | | | 379.6 | | | | 413.2 | |
Principal payments on long-term debt and finance lease obligations | | (639.9 | ) | | | (288.3 | ) | | | (298.3 | ) |
Proceeds from non-manufacturer floor plan payable | | 120.8 | | | | 188.4 | | | | 149.9 | |
Payments on non-manufacturer floor plan payable | | (133.6 | ) | | | (179.7 | ) | | | (121.9 | ) |
Preferred stock dividends paid | | (3.0 | ) | | | (3.0 | ) | | | (3.0 | ) |
Common stock dividends declared and paid | | (7.8 | ) | | | (7.6 | ) | | | (3.7 | ) |
Repurchases of common stock | | (5.8 | ) | | | — | | | | — | |
Other financing activities | | (1.5 | ) | | | (2.1 | ) | | | 0.7 | |
Net cash (used in) provided by financing activities | | (17.9 | ) | | | 87.3 | | | | 136.9 | |
| | | | | | | | |
Effect of exchange rate changes on cash | | (0.5 | ) | | | — | | | | 0.1 | |
NET CHANGE IN CASH | | (17.6 | ) | | | 28.3 | | | | 0.4 | |
| | | | | | | | |
Cash, Beginning of year | | 31.0 | | | | 2.7 | | | | 2.3 | |
Cash, End of period | $ | 13.4 | | | $ | 31.0 | | | $ | 2.7 | |
Supplemental schedule of noncash investing and financing activities: | | | | | | | | |
Noncash asset purchases: | | | | | | | | |
Net transfer of assets from inventory to rental fleet | $ | 120.6 | | | $ | 180.2 | | | $ | 122.9 | |
Common stock issued as consideration for business acquisition | | 3.0 | | | | 6.3 | | | | 2.7 | |
Contingent and non-contingent consideration for business acquisitions | | 1.1 | | | | 2.0 | | | | 12.7 | |
Supplemental disclosures of cash flow information | | | | | | | | |
Cash paid for interest | $ | 76.4 | | | $ | 53.6 | | | $ | 28.0 | |
Cash paid for income taxes | $ | 3.7 | | | $ | 5.7 | | | $ | 1.0 | |
The accompanying notes are an integral part of these consolidated financial statements.
ALTA EQUIPMENT GROUP INC. AND SUBSIDIARIES
Notes to Consolidated Financial Statements
(Dollars in millions, except per share data, unless otherwise indicated)
NOTE 1 — ORGANIZATION AND NATURE OF OPERATIONS
Nature of Operations
Alta Equipment Group Inc. and its subsidiaries (“Alta” or the “Company”) is engaged in the sale, service, and rental of material handling, construction, and environmental processing equipment in the states of Michigan, Illinois, Indiana, Ohio, Pennsylvania, New York, Virginia, Massachusetts, Maine, New Hampshire, Vermont, Rhode Island, Connecticut, Nevada, and Florida as well as the Canadian provinces of Quebec and Ontario. Unless the context otherwise requires, the use of the terms “the Company”, “we”, “us,” and “our” in these notes to the consolidated financial statements refers to Alta Equipment Group Inc. and its consolidated subsidiaries.
Basis of Presentation
The accompanying consolidated financial statements include the consolidated accounts of the Company and its subsidiaries and have been prepared in accordance with accounting principles generally accepted in the United States of America (“U.S. GAAP”). All intercompany transactions and balances have been eliminated in the preparation of the consolidated financial statements.
Immaterial Restatement of Prior Period Financial Statements
Subsequent to the issuance of the Company’s Consolidated Financial Statements filed on Form 10-K for the period ended December 31, 2023, the Company identified a multi-year error in the presentation of its Consolidated Statements of Cash Flows. Management determined its presentation of the proceeds from the sale of rent-to-rent equipment was incorrectly presented as an operating cash flow as opposed to an investing cash flow. The effect of this error was an overstatement of net cash provided by operating activities by $7.5 million and $5.4 million for the years ended December 31, 2022, and 2023, respectively, with a corresponding overstatement of net cash used in investing activities. Management has evaluated quantitative and qualitative factors for this misstatement and has concluded it was not material to the prior periods.
The following table reflects the effects of the correction on all affected line items of the Company’s previously reported Consolidated Financial Statements presented in this Form 10-K:
| | | | | | | | | | | | | | | | | | | | | | | |
| Year Ended December 31, | |
| 2023 | | | 2022 | |
| As Previously Reported | | | Adjustment | | | As Restated | | | As Previously Reported | | | Adjustment | | | As Restated | |
OPERATING ACTIVITIES | | | | | | | | | | | | | | | | | |
Proceeds from sale of rental equipment - rent-to-sell | $ | 128.9 | | | $ | (5.4 | ) | | $ | 123.5 | | | $ | 133.1 | | | $ | (7.5 | ) | | $ | 125.6 | |
Net cash used in operating activities | | 63.8 | | | | (5.4 | ) | | | 58.4 | | | | 26.0 | | | | (7.5 | ) | | | 18.5 | |
INVESTING ACTIVITIES | | | | | | | | | | | | | | | | | |
Proceeds from sale of rental equipment - rent-to-rent | | — | | | | 5.4 | | | | 5.4 | | | | — | | | | 7.5 | | | | 7.5 | |
Net cash used in investing activities | | (122.8 | ) | | | 5.4 | | | | (117.4 | ) | | | 162.6 | | | | 7.5 | | | | (155.1 | ) |
Reclassification
The Company has separately disclosed Rental fleet, net in its Consolidated Balance Sheet as of December 31, 2023, which was previously presented within Property and equipment, net in our 2023 Annual Report on Form 10-K. We have also updated all accompanying footnotes and disclosures affected by the reclassification.
NOTE 2 — SUMMARY OF SIGNIFICANT ACCOUNTING POLICIES
Use of Estimates
The preparation of consolidated financial statements in conformity with U.S. GAAP requires management to make estimates and assumptions that affect the reported amounts of assets and liabilities and disclosure of contingent assets and liabilities at the date of the consolidated financial statements and the reported amounts of revenues and expenses during the reporting period. Estimates are based on assumptions that we believe are reasonable under the circumstances. Due to the inherent uncertainty involved with estimates, actual results may differ. Refer to Critical Accounting Policies and Estimates within Item 7 for more information on items in the consolidated financial statements we consider require significant estimation or judgment.
Inventory Valuation
Inventories are stated at the lower of cost or net realizable value. Cost is determined by specific identification for equipment and a weighted-average method for parts. Net realizable value is the estimated selling price in the ordinary course of business less reasonably predictable costs of completion, disposal, and transportation. Included in new and used inventory is equipment that is currently on short-term lease to customers. The Company mainly transfers equipment from inventory into rental fleet based on management’s determination of the highest and best use of the equipment. This inventory is carried at the cost of the equipment less any accumulated depreciation.
Property and Equipment and Rental Fleet
Property and equipment are recorded at cost and depreciated over their estimated useful lives using the straight-line method.
The rent-to-sell portion of our rental equipment is comprised of transfers from inventory to rental fleet as part of our business model to respond to existing rental fleet mix and market demand for lightly-used heavy construction equipment to ultimately be purchased out of dealer owned rental fleets. This equipment is initially purchased for sale and classified as inventory (operating activity) then subsequently transferred from Inventories, net to Rental fleet, net. The transfers are non-cash transactions disclosed in the Supplemental schedule of noncash investing and financing activities in our Consolidated Statements of Cash Flows. The rent-to-sell categories are depreciated on a percentage of rental revenues realized on the asset, or a unit of activity method of depreciation. The Company believes that the unit of activity method on these categories of equipment more appropriately matches depreciation expense to revenues versus a straight-line methodology, as asset utilization can vary month to month especially in our northern geographies where seasonality is a factor. The proceeds from the sale of rent-to-sell equipment are classified within operating activities in the Consolidated Statements of Cash Flows.
The Company's rental fleet is also comprised of equipment that is purchased and placed directly into our rental fleet where we expect to rent the asset for the majority of the equipment’s useful life, which we call rent-to-rent equipment (investing activity). Under this business model, the recovery of the asset cost is predominantly through rental income rather than through the sale of the equipment. Occasionally, the Company will sell rent-to-rent equipment when the market dictates or when the equipment no longer has utility as a rental asset (i.e. at the end of its useful life). In rent-to-rent product categories, where asset utilization is more stable, like in our Material Handling segment, we use a straight-line depreciation methodology, where estimated useful lives can range from five to ten years.
The Company capitalizes certain expenditures for equipment, leasehold improvements, and rental fleet. Expenditures for repairs, maintenance, and minor renewals are expensed as incurred. Expenditures for betterments and major renewals that significantly extend the useful life of the asset are capitalized in the period incurred. When equipment is sold or otherwise disposed of, the cost and related accumulated depreciation are removed from the Consolidated Balance Sheets, with any resulting gain or loss being reflected in income from operations.
Intangible Assets
Intangible assets with a finite life consist of customer and supplier relationships, non-compete agreements, tradenames, and internal use software and are carried at cost less accumulated amortization. The estimated useful lives of the finite-lived intangible assets are as follows:
| | |
| | Estimated
Useful Life |
Customer and supplier relationships | | 9 – 10 years |
Other intangibles | | 2 – 5 years |
Evaluation of Goodwill Impairment
Goodwill is tested for impairment annually or more frequently if an event or circumstance indicates that an impairment loss may have been incurred. Application of the goodwill impairment test requires judgment, including: the identification of reporting units; assignment of assets and liabilities to reporting units; assignment of goodwill to reporting units; and determination of the fair value of each reporting unit.
We estimate the fair value of our reporting units (which are our reportable segments) using a discounted cash flow methodology under an income approach, corroborated with the results of a market approach which analyzes the enterprise value (market capitalization plus interest-bearing liabilities) and operating metrics (e.g., earnings before interest, taxes, depreciation and amortization expenses) of companies engaged in the same or similar line of business that we deem comparable to our business and compare those metrics to those of the Company. We make judgments regarding the comparability of publicly traded companies engaged in similar businesses and base our judgments on factors such as size, growth rates, profitability, business model, and risk. We believe the combination of these valuation approaches yields the most appropriate evidence of fair value.
Inherent in our preparation of cash flow projections are assumptions and estimates derived from a review of our operating results, business plans, expected growth rates, cost of capital, and tax rates. We also make certain forecasts about future economic conditions, interest rates, and other market data. Many of the factors used in assessing fair value are outside the control of management, and these assumptions and estimates may change in future periods. Changes in assumptions or estimates could materially affect the estimate of the fair value of a reporting unit and therefore could affect the likelihood and amount of potential impairment.
Financial Accounting Standards Board ("FASB") guidance permits entities to first assess qualitative factors to determine whether it is more likely than not that the fair value of a reporting unit is less than its carrying amount as a basis for determining whether it is necessary to perform the quantitative analysis. While the Company does not believe a qualitative assessment would have triggered the required quantitative assessment, the Company bypassed the optional qualitative assessments for each reporting unit and performed quantitative assessments at October 1, 2024, 2023 and 2022. We review goodwill for impairment by comparing the fair value of each of our reporting units' net assets to their respective carrying value. If the carrying value of a reporting unit’s net assets is less than its fair value, we do not recognize an impairment. If the carrying amount of a reporting unit’s net assets is greater than its fair value, we recognize a goodwill impairment for the amount of the excess of the net assets over the fair value, not to exceed the book value of goodwill.
Our annual goodwill impairment testing conducted as of October 1, 2024, 2023 and 2022 indicated that all our reporting units had estimated fair values which exceeded their respective carrying amounts. Based on the results of the tests, there was no goodwill impairment.
Evaluation of Long-lived Asset Impairment (excluding goodwill)
Our long-lived assets principally consist of rental equipment, leases, property and equipment, and other intangible assets excluding goodwill. We review our long-lived assets for impairment whenever events or changes in circumstances indicate that the carrying amount of an asset may not be recoverable. In reviewing for impairment, we first complete a qualitative assessment at the lowest level of identifiable cash flows for our long-lived assets (excluding goodwill). If there are indicators of impairment from the qualitative assessment, a quantitative analysis is performed where the carrying value of such assets is compared to the undiscounted future pre-tax cash flows expected from the use of the assets and their eventual disposition. If such cash flows are not sufficient to support the asset’s (or asset group’s) recorded value, an impairment loss may be recognized if the estimated fair value of the asset (or asset group) is less than the respective carrying value. The determination of future cash flows as well as the estimated fair value of long-lived and intangible assets involves significant estimates and judgment on the part of management. Our estimates and assumptions may prove to be inaccurate due to factors such as changes in economic conditions, expected asset utilization levels, our business activity levels or other changing circumstances. In support of our review for indicators of impairment, we perform a review of our long-lived assets at the lowest level of identifiable cash flows to conclude whether indicators of impairment exist associated with our long-lived assets, including our rental and non-rental equipment and right-of-use assets. Based on our most recently completed qualitative assessment in the fourth quarter 2024, there were no indications of impairment associated with our long-lived assets.
Business Combinations
We allocate the fair value of purchase consideration to the tangible and intangible assets acquired and liabilities assumed, based on their estimated fair values on the acquisition date. Management develops estimates based on assumptions as part of the purchase price allocation process to value the assets acquired and liabilities assumed as of the acquisition date. These estimates are inherently uncertain and are subject to refinement when additional information is obtained during the measurement period. As a result, during the purchase price measurement period, which may be up to one year from the acquisition date, the Company may record adjustments to the assets acquired and liabilities assumed, with the corresponding offset to goodwill. We recognize a bargain purchase gain within "Other (expense) income, net" in the Consolidated Statements of Operations if the net fair value of the identifiable assets acquired and the liabilities assumed is in excess of the fair value of the total purchase consideration and any noncontrolling interests.
Revenue Recognition
Revenues are recognized when control of promised goods or services is transferred to customers in an amount that reflects the consideration the business expects to be entitled in exchange for those goods or services. Control is transferred when the customer has the ability to direct the use of and obtain the benefits from the goods and/or services. The Company’s revenues accounted for under Topic 606 - Revenues from Contracts with Customers ("Topic 606") generally have the transaction price fixed and clearly stated in the customer contracts. Substantially all the Company’s sales agreements contain performance obligations satisfied at a point in time, rather than over time, when control is transferred to the customer, generally at the time of delivery to, or pick-up by, the customer. The revenues recognized over time are primarily project-based and maintenance contract revenues where revenue is recognized as the performance obligations are satisfied over time using the cost-to-cost input method, based on contract costs incurred to date to total estimated contract costs. For contracts with multiple performance obligations, the Company allocates sales prices to each distinct performance obligation based on the observable selling price and recognizes revenues as each distinct performance obligation is met.
Payment terms vary by the type and location of the customer and the products or services offered. Generally, the time between when revenue is recognized and payment is due is not significant. The Company does not evaluate whether the selling price includes a financing interest component for contracts that are less than a year or if payment is expected to be received less than a year after the good or service has been provided. Sales and other taxes collected from customers and remitted to government authorities are accounted for on a net basis and, therefore, are excluded from revenue. Shipping and handling costs are treated as fulfillment costs and are included in cost of revenues. The Company’s revenues do not include material amounts of variable consideration under Topic 606. Contracts with customers do not generally result in significant obligations associated with returns, refunds, or warranties.
See Note 3, Revenue Recognition, for more information.
Leases
The Company's leases are accounted for under Topic 842 - Leases ("Topic 842").
The Company as Lessee:
We determine whether an arrangement is a lease at the inception of the arrangement based on the terms and conditions in the contract. A contract contains a lease if there is an identified asset, and we have the right to control the asset for a period of time in exchange for consideration.
Lease right-of-use (“ROU”) assets represent our right to use an individual asset for the lease term, and lease liabilities represent our obligation to make lease payments arising from the lease. Lease ROU assets and liabilities are recognized at the commencement date for leases with terms greater than 12 months and meet our capitalization threshold based upon the present value of the remaining future minimum lease payments over the lease term. As most of our leases do not provide the lessor’s implicit rate, we use our incremental borrowing rate (“IBR”) at the commencement date in determining the present value of future lease payments by utilizing a fully collateralized rate for a fully amortizing loan with the same term as the lease. The Company applies the portfolio approach for the IBR on our leases based upon similar lease term and payments. The lease ROU asset also includes lease payments made in advance of lease commencement and excludes lease incentives. Operating lease expense for minimum lease payments is recognized on a straight-line basis over the lease term.
The Company has lease agreements with lease and non-lease components. For real estate leases and all equipment leases excluding vehicles, these components are accounted for as a single lease component. For vehicle leases, these components are accounted for separately.
Variable lease expenses include payments based upon changes in a rate or index, such as consumer price indexes, variable payments on non-lease components related to leases that we account for as a single lease component, and charges fluctuating based on the usage of the leased asset. Short-term lease expenses include leases with terms at lease commencement of 12 months or less and no purchase option is reasonably certain to be exercised, including leases with a duration of one month or less. Low-value lease expense includes leases with terms at lease commencement of greater than 12 months but do not meet our capitalization threshold, which is consistent with our property and equipment capitalization threshold. The Company’s lease agreements do not contain any material residual value guarantees or material restrictive covenants; however, there are certain lease agreements that include guaranteed purchase obligations for lift trucks.
A ROU asset is subject to the same impairment guidance as assets categorized as property and equipment. As such, any impairment loss on ROU assets is presented in the same manner as an impairment loss recognized on other long-lived assets. The Company reviewed our lease ROU assets for impairment and determined that none of the assets were impaired during the years ended December 31, 2024, 2023 and 2022.
Operating leases are included in "Operating lease right-of-use assets, net", "Current operating lease liabilities" and "Long-term operating lease liabilities, net of current portion" on the Company’s Consolidated Balance Sheets. Finance leases are included in "Property and equipment, net", "Current portion of long-term debt", and "Finance lease obligations, net of current portion" on the Company’s Consolidated Balance Sheets.
See Note 10, Leases, related to the required lease disclosures.
The Company as Lessor:
See Note 3, Revenue Recognition, and Note 10, Leases, for more information.
Income Taxes
Alta Enterprises, LLC was historically a partnership for federal income tax purposes, with each partner being separately taxed on its share of taxable income (loss). The current income tax was calculated at the consolidated return level, (“Alta Equipment Group Inc. and Subsidiaries”), and the deferred impact of the interest in the lower tier partnership. In 2024, the Company reorganized its holding structure of Alta Enterprises, LLC effectively converting it from a partnership to a disregarded entity of Alta Equipment Group Inc. for federal income tax purposes. The reorganization will have no impact on the current and deferred income tax calculations.
The Company uses the guidance in Topic 740 - Income Taxes ("Topic 740") asset and liability method of accounting for income taxes, under which deferred tax assets and liabilities are recognized for the future tax consequences of (i) temporary differences between the financial statement carrying amounts and the tax bases of existing assets and liabilities and (ii) operating loss and tax credit carryforwards. Deferred income tax assets and liabilities are based on enacted tax rates applicable to the future period when those temporary differences are expected to be recovered or settled. The effect of a change in tax rates on deferred tax assets and liabilities is recognized in income in the period the rate change is enacted. Deferred income tax assets are subject to valuation allowance considerations to recognize only amounts that are more likely than not to be ultimately realized.
In accordance with Topic 740, we review the likelihood that we will realize the benefit of deferred tax assets and estimate whether recoverability of our deferred tax assets is “more likely than not”. In determining whether a valuation allowance is needed, on a quarterly basis we evaluate historical operating results, the existence of cumulative losses in the most recent fiscal years, expectations for future pretax operating income within the carryback or carryforward periods provided for in the tax law for each applicable tax jurisdiction, the time period over which our temporary differences will reverse and the implementation of feasible and prudent tax planning strategies. A cumulative loss in recent years is considered a significant piece of negative evidence that is difficult to overcome in assessing the need for a valuation allowance. See Note 12, Income Taxes, for more information.
Fair Value of Financial Instruments
Fair value is defined as the amount that would be received for selling an asset or paid to transfer a liability in an orderly transaction between market participants at the measurement date. Accounting standards establish a fair value hierarchy which requires an entity to maximize the use of observable inputs and minimize the use of unobservable inputs when measuring fair value. The FASB fair value measurement guidance established a fair value hierarchy that prioritizes the inputs used to measure fair value. We assess the inputs used to measure fair value using the three-tier hierarchy. The three broad levels of the fair value hierarchy are as follows:
•Level 1 — Quoted prices (unadjusted) in active markets for identical assets or liabilities
•Level 2 — Quoted prices for similar assets and liabilities in active markets or inputs that are observable for the asset or liability, either directly or indirectly
•Level 3 — Unobservable inputs for which little or no market data exists, therefore requiring a company to develop its own assumptions
In instances where the determination of the fair value measurement is based on inputs from different levels of the fair value hierarchy, the level in the fair value hierarchy within which the entire fair value measurement falls is based on the lowest level input that is significant to the fair value measurement in its entirety.
The estimated fair values of derivative financial instruments are valued using widely accepted valuation techniques including discounted cash flow analysis on the expected cash flows of each derivative and quoted market prices for similar instruments from third parties. The fair value of interest rate caps is determined using the market-standard methodology of discounting the future expected cash receipts which would occur if floating interest rates rise above the strike rate of the caps. The floating interest rates used in the calculation of projected receipts on the caps are based on the period to maturity and an expectation of future interest rates derived from observable market interest rate curves and volatilities. The inputs used in the valuation of all our derivative contracts fall within Level 2 of the fair value hierarchy.
Translation of Foreign Currency
Assets and liabilities of our foreign subsidiaries that have a functional currency other than U.S. dollar are translated into U.S. dollars using exchange rates at the balance sheet date. Revenues and expenses are translated at average exchange rates effective during the year. Foreign currency translation gains and losses are included as a component of "Accumulated other comprehensive income (loss)" ("AOCI") within the Consolidated Balance Sheets.
New Accounting Pronouncements
New Accounting Pronouncements Adopted in 2024
Segment Reporting
In the fourth quarter of 2024, we adopted ASU 2023-07, Segment Reporting (Topic 280): Improvements to Reportable Segment Disclosures. This guidance amends reportable segment disclosure requirements, primarily through enhanced disclosures about reportable segment expenses. The guidance requires additional disclosures in our Segments footnote of significant segment expenses that impact segment profit or loss regularly provided to the chief operating decision maker. See Note 17, Segments, for more information.
New Accounting Pronouncements Not Yet Adopted
In December 2023, the FASB issued ASU No. 2023-09, Income Taxes (Topic 740): Improvements to Income Tax Disclosures. This guidance requires disaggregated income tax disclosures on the rate reconciliation and income taxes paid by jurisdiction. The Company is required to adopt the guidance in the first quarter of 2025. The guidance will require additional disclosures in the Income Tax footnote but will not have a material impact on our consolidated financial statements.
In November 2024, the FASB issued ASU No. 2024-03, Income Statement - Reporting Comprehensive Income - Expense Disaggregation Disclosures (Subtopic 220-40). This guidance requires additional disclosure in the notes to the financial statements of specified information about certain statement of operations expense line items. The Company is required to adopt the guidance in the 2027 Annual Report on Form 10-K and in our interim periods during 2028, though early adoption is permitted. The Company is currently evaluating the impact of this guidance on our consolidated financial statements.
The Company believes all other recently issued accounting pronouncements from the FASB that the Company has not noted above will not have a material impact on our consolidated financial statements or do not apply to us.
NOTE 3 — REVENUE RECOGNITION
We recognize revenue in accordance with two different accounting standards: 1) Topic 606 and 2) Topic 842.
Disaggregation of Revenues
The following table summarizes the Company’s disaggregated revenues as presented in the Consolidated Statements of Operations by revenue type and the applicable accounting standard.
| | | | | | | | | | | | | | | | | | | | | | | | | | | | | | | | | | | |
| Year Ended December 31, 2024 | | | Year Ended December 31, 2023 | | | Year Ended December 31, 2022 | |
| Topic 842 | | | Topic 606 | | | Total | | | Topic 842 | | | Topic 606 | | | Total | | | Topic 840 | | | Topic 606 | | | Total | |
Revenues: | | | | | | | | | | | | | | | | | | | | | | | | | | |
New and used equipment sales | $ | — | | | $ | 987.0 | | | $ | 987.0 | | | $ | — | | | $ | 1,025.9 | | | $ | 1,025.9 | | | $ | — | | | $ | 817.2 | | | $ | 817.2 | |
Parts sales | | — | | | | 294.4 | | | | 294.4 | | | | — | | | | 278.3 | | | | 278.3 | | | | — | | | | 234.8 | | | | 234.8 | |
Service revenues | | — | | | | 253.8 | | | | 253.8 | | | | — | | | | 241.3 | | | | 241.3 | | | | — | | | | 206.6 | | | | 206.6 | |
Rental revenues | | 203.4 | | | | — | | | | 203.4 | | | | 202.4 | | | | — | | | | 202.4 | | | | 180.1 | | | | — | | | | 180.1 | |
Rental equipment sales | | — | | | | 138.0 | | | | 138.0 | | | | — | | | | 128.9 | | | | 128.9 | | | | — | | | | 133.1 | | | | 133.1 | |
Total revenues | $ | 203.4 | | | $ | 1,673.2 | | | $ | 1,876.6 | | | $ | 202.4 | | | $ | 1,674.4 | | | $ | 1,876.8 | | | $ | 180.1 | | | $ | 1,391.7 | | | $ | 1,571.8 | |
The Company believes that the disaggregation of revenues from contracts to customers as summarized above, together with the discussion below, depicts how the nature, amount, timing, and uncertainty of our revenues and cash flows are affected by economic factors. See Note 17, Segments, for further information.
Leases revenues (Topic 842)
Rental revenues: Owned equipment rentals represent revenues from renting equipment. The Company accounts for these rental contracts as operating leases. The Company recognizes revenues from equipment rentals in the period earned, regardless of the timing of billing to customers. A rental contract includes rates for daily, weekly, or monthly use, and rental revenues are earned on a daily basis as rental contracts remain outstanding. Because the rental contracts can extend across multiple reporting periods, the Company records unbilled rental revenues and deferred rental revenues at the end of each reporting period. Unbilled rental revenues are included as a component of "Accounts receivable, net" on the Consolidated Balance Sheets. Rental equipment may also be purchased outright (“Rental equipment sales”) by our customers. Rental revenues and revenues attributable to rental equipment sales are recognized in "Rental revenues" and "Rental equipment sales" on the Consolidated Statements of Operations, respectively.
Revenues from contracts with customers (Topic 606)
Accounting for the different types of revenues pursuant to Topic 606 is discussed below. The Company’s revenues under Topic 606 are primarily recognized at a point in time rather than over time.
New and used equipment sales: With the exception of bill-and-hold arrangements and project-based revenues, the Company’s revenues from the sale of new and used equipment are recognized at the time of delivery to, or pick-up by, the customer, which is when the customer obtains control of the promised good(s). Under bill-and-hold arrangements, revenues are recognized when all configuration work is complete and the equipment has been set aside for final shipment, at which point the Company has determined control has been transferred. The bill-and-hold arrangements primarily apply to sales when physical shipment of heavy equipment to the customer is prohibited by law (e.g., frost laws) or requested by the customer due to their inability to arrange freight simultaneous to the satisfaction of the performance obligations. The customer equipment sold under a bill-and-hold arrangement is physically separated from Company inventory and that equipment cannot be used by the Company or sold to another customer. Revenues recognized from bill-and-hold agreements totaled $29.4 million, $27.7 million, and $15.6 million for the years ended December 31, 2024, 2023 and 2022, respectively. The Company does not offer material rights of return.
Project-based revenues, as referred to herein, are contracts with customers where the Company provides design and build solutions related to automated equipment installation and warehouse management systems integration. These revenues are recognized as the performance obligations are satisfied over time using the cost-to-cost input method, based on contract costs incurred to date to total estimated contract costs. The Company recognizes deferred revenue with respect to project-based services. The Company recognized $71.3 million, $66.9 million and $77.5 million in project-based revenues for the years ended December 31, 2024, 2023 and 2022, respectively.
Parts sales: Revenues from the sale of parts are recognized at the time of pick-up by the customer for over-the-counter sales transactions and at the time services are completed for parts associated with periodic maintenance services. For parts that are shipped to a customer, the Company has elected to use a practical expedient of Topic 606 and treat such shipping activities as fulfillment costs, thereby recognizing revenues at the time of shipment, which is when the customer obtains control.
Service revenues: The Company records service revenues primarily from guaranteed maintenance contracts and periodic services with customers. The Company recognizes periodic maintenance service revenues at the time such services are completed. The Company recognizes guaranteed maintenance contract revenues over time based on an estimated rate at which the services are provided over the life of the contract, typically three to five years. Revenues recognized from guaranteed maintenance contracts totaled $22.2 million, $24.0 million and $21.4 million for the years ended December 31, 2024, 2023 and 2022, respectively. The Company also records service revenue from warranty contracts whereby the Company performs service on behalf of the OEM or third-party warranty provider.
Rental equipment sales: The Company also sells rental equipment from our rental fleet. These sales are recognized at the time of delivery to, or pick-up by, the customer, which is when the customer obtains control of the promised good(s). Rental equipment sales may occur at various stages in an equipment’s lifecycle, depending on customer demand and our original purchase intention for the equipment. Rent-to-rent equipment, for instance, is originally purchased directly into the rental fleet for the primary purpose of renting, as opposed to selling. Rental equipment sales of rent-to-rent equipment are therefore typically made toward the end of the useful life of the equipment. Rent-to-sell equipment, on the other hand, is originally purchased as new inventory stock, but is subsequently transferred to rental fleet and rented to customers based on rental fleet utilization levels and market conditions. Ultimately, rent-to-sell equipment tends to be purchased to serve the numerous applications of our Construction Equipment segment customers and allows the Company to create different model years of equipment at varying price points to fulfill market demand for lower hour, lightly used construction equipment. Certain rental agreements contain a rental purchase option, whereby the customer has an option to purchase the rented equipment during the term of the rental agreement. Revenues from the sale of rental equipment are recognized at the time the rental purchase option agreement has been approved and signed by both parties, as the equipment is already in the customer’s possession under the previous rental agreement, and therefore control has been transferred concurrently with the title.
Contract costs
The Company does not recognize assets associated with the incremental costs of obtaining a contract with a customer that the Company expects to recover (e.g., a sales commission). Most of the Company’s revenue is recognized at a point in time or over a period of one year or less, and the Company has used the practical expedient that allows it to recognize the incremental costs of obtaining a contract as an expense when incurred if the amortization period of the asset that the Company otherwise would have recognized is one year or less. The amount of the costs associated with the revenue recognized over a period of greater than one year is insignificant.
Receivables and contract assets and liabilities
With respect to our receivables, we believe the concentration of credit risk is limited because our customer base is comprised of a large number of geographically diverse customers.
The Company has contract assets and contract liabilities associated with project-based contracts with customers.
Contract assets are fulfilled contractual obligations prior to receivables being recognizable for project-based revenues. Contract assets as of December 31, 2024 and 2023 were $4.2 million and $4.5 million, respectively.
The deferred revenue (contract liabilities) includes the unearned portion of project-based revenues, revenues related to guaranteed maintenance service contracts for customers covering equipment previously purchased, and deferred revenues related to rental agreements. Total deferred revenue relating to project-based revenues, guaranteed maintenance contracts and equipment rental agreements as of December 31, 2024 and 2023 was $16.3 million and $18.4 million, respectively. Deferred revenue also includes the net proceeds upon sale of equipment with certain guaranteed purchase obligations. In total, deferred revenue as of December 31, 2024 and 2023 was $17.3 million and $20.4 million, respectively. The Company expects 75% of total deferred revenues balance as of December 31, 2024 to be realized within the next year, 14% in the following year, 8% in the third year and 3% thereafter. A portion of the deferred revenue is recognized based upon usage of the equipment and therefore may vary from our current expectation. For the years ended December 31, 2024 and 2023, the Company recognized revenues of $14.0 million and $13.9 million, respectively, from the prior year ending deferred revenue balance.
NOTE 4 — RELATED PARTY TRANSACTIONS
Our Chief Executive Officer ("CEO"), Chief Financial Officer, and Chief Operating Officer collectively own an indirect, non-controlling minority interest in OneH2, Inc. (“OneH2”), which they each acquired through various transactions that took place in early 2018 and prior. Our CEO is on the Board of Directors of OneH2. OneH2 is a privately held company that produces and delivers hydrogen fuel to end users and manufactures modular hydrogen plants and related equipment. The Company purchased $1.6 million, $0.4 million and $0.3 million of hydrogen fuel from OneH2 for the years ended December 31, 2024, 2023 and 2022, respectively. For the years ended December 31, 2024 and 2023, the Company paid OneH2 $0.8 million and $1.1 million, respectively, as part of the Company's total investment to date of $5.3 million to build and commercialize a hydrogen production plant for the Company which we expect to become operational in the first six months of 2025.
NOTE 5 — INVENTORIES
Inventories, net, consisted of the following:
| | | | | | | |
| December 31, | | | December 31, | |
| 2024 | | | 2023 | |
New equipment | $ | 374.0 | | | $ | 373.6 | |
Used equipment | | 62.0 | | | | 54.6 | |
Work in process | | 7.5 | | | | 8.2 | |
Parts | | 101.8 | | | | 101.9 | |
Gross inventory | | 545.3 | | | | 538.3 | |
Inventory reserves | | (9.4 | ) | | | (7.6 | ) |
Inventories, net | $ | 535.9 | | | $ | 530.7 | |
Direct labor of $0.6 million and $1.2 million incurred for open service orders were capitalized and included in work in process as of December 31, 2024 and 2023, respectively. The remaining work in process balances as of December 31, 2024 and 2023, primarily represent parts applied to open service orders. Rental depreciation expense for new and used equipment inventory under short-term leases with purchase options was $15.2 million, $12.4 million and $7.6 million for the years ended December 31, 2024, 2023 and 2022, respectively.
NOTE 6 — PROPERTY AND EQUIPMENT AND RENTAL FLEET
Property and equipment, net, consisted of the following:
| | | | | | | |
| December 31, | | | December 31, | |
| 2024 | | | 2023 | |
Land | $ | 3.0 | | | $ | 2.1 | |
Buildings, equipment, and leasehold improvements: | | | | | |
Machinery and equipment | | 9.6 | | | | 8.5 | |
Autos and trucks | | 7.3 | | | | 7.7 | |
Buildings and leasehold improvements | | 25.5 | | | | 20.8 | |
Construction in progress | | 7.0 | | | | 6.1 | |
Finance lease right-of-use assets | | 63.6 | | | | 48.4 | |
Office equipment | | 5.6 | | | | 4.9 | |
Computer equipment | | 14.4 | | | | 13.3 | |
Total costs | | 136.0 | | | | 111.8 | |
| | | | | |
Less accumulated depreciation and amortization: | | | | | |
Buildings, equipment, autos and trucks, leasehold improvements, finance leases and office and computer equipment | | (54.4 | ) | | | (38.4 | ) |
Property and equipment, net | $ | 81.6 | | | $ | 73.4 | |
Total depreciation and amortization expense on property and equipment was $18.5 million, $13.7 million, and $10.6 million for the years ended December 31, 2024, 2023 and 2022, respectively.
Rental fleet, net, consisted of the following:
| | | | | | | |
| December 31, | | | December 31, | |
| 2024 | | | 2023 | |
Rental fleet | $ | 571.2 | | | $ | 600.8 | |
Less accumulated depreciation rental fleet | | (212.4 | ) | | | (209.4 | ) |
Rental fleet, net | $ | 358.8 | | | $ | 391.4 | |
Total depreciation expense on rental fleet was $100.7 million, $97.6 million, and $87.9 million for the years ended December 31, 2024, 2023 and 2022, respectively.
NOTE 7 — GOODWILL AND OTHER INTANGIBLE ASSETS
The following table summarizes the changes in the carrying amount of goodwill in total and by reportable segment during the years ended December 31, 2024 and 2023:
| | | | | | | | | | | | | | | |
| Material
Handling | | | Construction
Equipment | | | Master Distribution | | | Total | |
Balance, December 31, 2022 | $ | 13.6 | | | $ | 38.0 | | | $ | 17.6 | | | $ | 69.2 | |
Additions | | 1.1 | | | | 5.4 | | | | — | | | | 6.5 | |
Adjustments to purchase price allocations | | 0.3 | | | | — | | | | 0.7 | | | | 1.0 | |
Balance, December 31, 2023 | $ | 15.0 | | | $ | 43.4 | | | $ | 18.3 | | | $ | 76.7 | |
Adjustments to purchase price allocations | | — | | | | 1.4 | | | | — | | | | 1.4 | |
Translation adjustments | | (0.3 | ) | | | (0.3 | ) | | | — | | | | (0.6 | ) |
Balance, December 31, 2024 | $ | 14.7 | | | $ | 44.5 | | | $ | 18.3 | | | $ | 77.5 | |
The Company reviewed our goodwill for impairment and determined that none of the goodwill was impaired during the years ended December 31, 2024, 2023 and 2022. See Note 2, Summary of Significant Accounting Policies, for more information on the impairment testing.
Other intangible assets, net consisted of the following:
| | | | | | | | | | | | | | | |
| December 31, 2024 | |
| Weighted Average Remaining Life (in years) | | | Gross carrying
amount | | | Accumulated
amortization | | | Net carrying
amount | |
Customer and supplier relationships | | 6.6 | | | $ | 72.4 | | | $ | (24.3 | ) | | $ | 48.1 | |
Other intangibles | | 3.0 | | | | 14.3 | | | | (7.7 | ) | | | 6.6 | |
Total | | 6.1 | | | $ | 86.7 | | | $ | (32.0 | ) | | $ | 54.7 | |
| | | | | | | | | | | |
| December 31, 2023 | |
| Weighted Average Remaining Life (in years) | | | Gross carrying
amount | | | Accumulated
amortization | | | Net carrying
amount | |
Customer and supplier relationships | | 7.6 | | | $ | 73.6 | | | $ | (16.8 | ) | | $ | 56.8 | |
Other intangibles | | 3.9 | | | | 14.6 | | | | (5.1 | ) | | | 9.5 | |
Total | | 7.0 | | | $ | 88.2 | | | $ | (21.9 | ) | | $ | 66.3 | |
Amortization of intangible assets was $10.1 million, $8.9 million, and $5.9 million for the years ended December 31, 2024, 2023 and 2022, respectively.
The Company reviewed our finite-lived intangible assets for impairment and determined that none of the assets were impaired during the years ended December 31, 2024, 2023 and 2022. See Note 2, Summary of Significant Accounting Policies, for more information on the impairment testing.
As of December 31, 2024, estimated amortization expense for intangible assets for each of the next five years and thereafter was as follows:
| | | |
Years ending December 31, | Amount | |
2025 | $ | 9.9 | |
2026 | | 9.7 | |
2027 | | 8.9 | |
2028 | | 8.1 | |
2029 | | 7.3 | |
Thereafter | | 10.8 | |
Total | $ | 54.7 | |
NOTE 8 — FLOOR PLANS
Floor Plan — First Lien Lender
In April 2021, the Company entered into a Floor Plan First Lien Credit Agreement ("Floor Plan Credit Agreement") by and among Alta Equipment Group, Inc. and the other credit parties named therein, and the lender JP Morgan Chase Bank, N.A., as Administrative Agent. Under the Floor Plan Credit Agreement, the Company has a first lien floor plan facility (the "First Lien Floor Plan Facility") with our first lien lenders to primarily finance new inventory. On June 5, 2024, the Floor Plan Credit Agreement was amended to extend the maturity date to June 1, 2029 and increase the maximum borrowing capacity to $90.0 million. The interest cost for the First Lien Floor Plan Facility is SOFR plus an applicable margin. The First Lien Floor Plan Facility is collateralized by substantially all assets of the Company. As of December 31, 2024 and December 31, 2023, the Company had an outstanding balance on our First Lien Floor Plan Facility of $54.7 million and $67.4 million, respectively, excluding unamortized debt issuance costs. The effective interest rate at December 31, 2024 and December 31, 2023 was 7.4% and 8.2%, respectively. The Company routinely sells equipment that is financed under the First Lien Floor Plan Facility. When this occurs the payable under the First Lien Floor Plan Facility related to the financed equipment being sold becomes due to be paid.
OEM Captive Lenders and Suppliers’ Floor Plans
The Company has floor plan financing facilities with several OEM captive lenders and suppliers (the “OEM Floor Plan Facilities”, and together with the First Lien Floor Plan Facility, collectively the “Floor Plan Facilities”) for new and used inventory and rental equipment, each with borrowing capacities ranging from $0.1 million to $160.0 million. Primarily, the Company utilizes the OEM Floor Plan Facilities for purchases of new equipment inventories. Certain OEM Floor Plan Facilities provide for up to twelve-months interest only or deferred payment periods. In addition, certain OEM Floor Plan Facilities regularly provide for interest and principal free payment terms. The Company routinely sells equipment that is financed under OEM Floor Plan Facilities. When this occurs the payable under the OEM Floor Plan Facilities related to the financed equipment being sold becomes due to be paid.
The OEM Floor Plan Facilities are secured by the equipment being financed, and contain certain operating company guarantees. The interest cost is SOFR plus an applicable margin. The effective rates, excluding the favorable effect of interest-free periods, as of December 31, 2024 ranged from 7.5% to 10.5% and 8.4% to 10.5% as of December 31, 2023. As of December 31, 2024 and 2023, the Company had an outstanding balance on the OEM Floor Plan Facilities of $320.2 million and $330.1 million, respectively.
The total aggregate amount of financing under the Floor Plan Facilities cannot exceed $495.0 million at any time, which is subject to a 10% annual increase, effective December 31st of each year, which began on December 31, 2023. The total outstanding balance under the Floor Plan Facilities as of December 31, 2024 and 2023 was $374.9 million and $397.5 million, respectively, excluding unamortized debt issuance costs. For the years ended December 31, 2024, 2023 and 2022, the Company recognized interest expense associated with new equipment financed under our Floor Plan Facilities of $12.1 million, $8.4 million, and $2.7 million, respectively. The weighted average rate, excluding the favorable effect of interest-free periods, on the Company's Floor Plan Facilities was 7.9% and 8.0% as of December 31, 2024 and 2023, respectively.
NOTE 9 — LONG-TERM DEBT
Line of Credit — First Lien Lender
In April 2021, the Company entered into a Sixth Amended and Restated ABL First Lien Credit Agreement (the “Amended and Restated ABL Credit Agreement”) by and among Alta Equipment Group Inc. and the other credit parties named therein, the lenders named therein, JP Morgan Chase Bank, N.A., as Administrative Agent, and the syndication agents and documentation agent named therein. Under the Amended and Restated ABL Credit Agreement, the Company has an ABL Facility with our first lien holder with advances on the line being supported by eligible accounts receivable, parts, and otherwise unencumbered new and used equipment inventory and rental equipment. On June 5, 2024, the Company amended the ABL Facility primarily to extend the maturity date and increase the facility size. The borrowing capacity on the ABL Facility, which expires June 1, 2029, was increased to $520.0 million, which includes a $45.0 million Canadian-denominated sublimit facility. The ABL Facility is collateralized by substantially all assets of the Company, and the interest cost is SOFR plus an applicable margin on the CB Floating Rate, depending on borrowing levels. As of December 31, 2024 and December 31, 2023, the Company had an outstanding ABL Facility balance of $182.9 million and $317.5 million, respectively, excluding unamortized debt issuance costs. The effective interest rate was 6.2% and 7.2% at December 31, 2024 and December 31, 2023, respectively.
Maximum borrowings under the Floor Plan Facilities and ABL Facility are limited to $1,015.0 million unless certain other conditions are met. The total amount outstanding as of December 31, 2024 and December 31, 2023, was $557.8 million and $715.0 million, exclusive of debt issuance and deferred financing costs of $3.5 million and $1.8 million, respectively.
Senior Secured Second Lien Notes
On June 5, 2024, the Company completed a private offering of Senior Secured Second Lien Notes (the “Notes”), for the purposes of, among other things, repayment and refinancing of a portion of the Company’s prior existing debt, reducing variable interest rate exposure, providing liquidity for general corporate purposes, and for financing of future growth initiatives. The Company sold $500.0 million of Notes at the rate of 9.000% per annum, which are due on June 1, 2029. Interest on the Notes is payable in cash on June 1 and December 1 of each year, commencing on December 1, 2024. The Notes were sold in a private placement in reliance on Rule 144A and Regulation S under the Securities Act of 1933, as amended, pursuant to a purchase agreement among the Company, the domestic subsidiaries of the Company (as guarantors), and J.P. Morgan Securities LLC, as representative of the initial purchasers.
The Notes are guaranteed by each of our existing and future domestic subsidiaries. The Notes and the guarantors thereof are secured, subject to certain exceptions and permitted liens, by second-priority liens on substantially all of our assets and the assets of the guarantors that secure on a first-priority basis all of the indebtedness under our ABL Facility and the First Lien Floor Plan Facility and certain hedging and cash management obligations, including, but not limited to, equipment, fixtures, inventory, intangibles and capital stock of our restricted subsidiaries now owned or acquired in the future by us or the guarantors.
As of December 31, 2024, outstanding borrowings under the Notes were $480.0 million, which included $20.0 million deferred financing costs and original issue discounts. The effective interest rate on the Notes, taking into account the original issue discount, is 10.1%.
Extinguishment of Debt
In the second quarter of 2024, in connection with the issuance of the Notes, the Company extinguished our previously issued Senior Secured Second Lien Notes due April 15, 2026. The Company recorded a loss on the extinguishment of $6.7 million in the line item "Loss on extinguishment of debt" in our Consolidated Statements of Operations.
The Company’s long-term debt consists of the following:
| | | | | | | |
| December 31, | | | December 31, | |
| 2024 | | | 2023 | |
Line of credit | $ | 182.9 | | | $ | 317.5 | |
Senior secured second lien notes | | 500.0 | | | | 315.0 | |
Unamortized debt issuance costs | | (4.3 | ) | | | (2.2 | ) |
Debt discount | | (18.8 | ) | | | (2.1 | ) |
Finance leases | | 46.0 | | | | 38.8 | |
Total debt and finance leases | | 705.8 | | | | 667.0 | |
Less: current maturities | | (10.5 | ) | | | (7.7 | ) |
Long-term debt and finance leases, net | $ | 695.3 | | | $ | 659.3 | |
As of December 31, 2024, the Company was in compliance with the financial covenants set forth in our debt agreements.
Long-term debt principal maturities, excluding finance leases which are disclosed in Note 10, Leases, were as follows:
| | | | |
Years ending December 31, | | Amount | |
2025 | | $ | — | |
2026 | | | — | |
2027 | | | — | |
2028 | | | — | |
2029 | | | 682.9 | |
Thereafter | | | — | |
Total | | $ | 682.9 | |
Notes Payable – Non-Contingent Consideration
The following table sets forth the Company’s non-contingent consideration liabilities measured and recorded at the present value of cash payments, using a market participant discount rate and their presentation on the Consolidated Balance Sheets related to the Company's acquisitions of Ault, Ecoverse, Peaklogix LLC, and Ginop Sales, Inc.
| | | | | | | |
| December 31, | | | December 31, | |
Location on Balance Sheet | 2024 | | | 2023 | |
Other current liabilities | $ | 2.7 | | | $ | 7.4 | |
Other liabilities | | 4.9 | | | | 6.5 | |
Total | $ | 7.6 | | | $ | 13.9 | |
See Note 14, Fair Value of Financial Instruments, and Note 15, Business Combinations, for further information.
NOTE 10 — LEASES
The Company primarily has third-party operating and finance leases for branch facilities, corporate office, and certain equipment. The Company has one operating lease with a related party. The Company’s leases have remaining lease terms that range from less than one year to leases that mature through December 2039 and contain provisions to renew the leases for additional terms of up to 20 years.
The Company leases and subleases certain lift trucks to customers under short and long-term operating lease agreements. The sublease income is included in "Rental revenues" on our Consolidated Statements of Operations. Sublease income below includes subleases of primarily facilities that are not included in Rental revenues due to being outside our normal business operations. The costs of the head lease for these subleases are included in Operating lease expense below.
At December 31, 2024 and 2023, assets recorded under finance leases, net of accumulated depreciation were $43.6 million and $37.6 million, respectively. The assets are depreciated over the lesser of their related lease terms or estimated useful lives.
The components of lease expense were as follows:
| | | | | | | | | | | |
| Year Ended December 31, | |
| 2024 | | | 2023 | | | 2022 | |
Operating lease expense | $ | 27.3 | | | $ | 27.0 | | | $ | 25.1 | |
Short-term lease expense | | 4.5 | | | | 5.0 | | | | 4.4 | |
Low-value lease expense | | 1.4 | | | | 0.9 | | | | 0.5 | |
Variable lease expense | | 10.3 | | | | 9.0 | | | | 6.6 | |
Finance lease expense: | | | | | | | | |
Amortization of right-of-use assets | | 10.3 | | | | 6.5 | | | | 4.0 | |
Interest on lease liabilities | | 3.8 | | | | 2.6 | | | | 1.0 | |
Sublease income | | (0.3 | ) | | | (0.3 | ) | | | (0.1 | ) |
Total lease expense | $ | 57.3 | | | $ | 50.7 | | | $ | 41.5 | |
Additional information related to leases is presented in the table below:
| | | | | | | | | | | |
| Year Ended December 31, | |
Supplemental Cash Flows Information | 2024 | | | 2023 | | | 2022 | |
Cash paid for amounts included in the measurement of lease liabilities: | | | | | | | | |
Operating cash flows for operating leases | $ | 26.2 | | | $ | 25.9 | | | $ | 24.2 | |
Operating cash flows for finance leases | | 3.8 | | | | 2.6 | | | | 1.0 | |
Financing cash flows for finance leases | | 9.2 | | | | 5.7 | | | | 3.6 | |
Non-cash right-of-use assets obtained in exchange for lease obligations: | | | | | | | | |
Operating leases | | 19.3 | | | | 13.9 | | | | 29.3 | |
Finance leases | | 16.3 | | | | 25.2 | | | | 11.6 | |
Weighted Average Remaining Lease Term (in years): | | | | | | | | |
Operating leases | | 8.6 | | | | 8.9 | | | | 9.3 | |
Finance leases | | 4.3 | | | | 4.7 | | | | 4.5 | |
Weighted Average Discount Rate (in %): | | | | | | | | |
Operating leases | | 10.6 | | | | 10.3 | | | | 10.0 | |
Finance leases | | 8.7 | | | | 8.5 | | | | 7.6 | |
Minimum future lease payments under non-cancellable operating and finance leases described above were as follows:
| | | | | | | |
Year ending December 31, | Operating Leases | | | Finance Leases | |
2025 | $ | 25.7 | | | $ | 13.9 | |
2026 | | 22.9 | | | | 13.1 | |
2027 | | 21.4 | | | | 11.5 | |
2028 | | 19.7 | | | | 9.6 | |
2029 | | 15.1 | | | | 5.7 | |
Thereafter | | 79.2 | | | | 0.9 | |
Total future minimum lease payments | | 184.0 | | | | 54.7 | |
Less: imputed interest | | (65.4 | ) | | | (8.7 | ) |
Total | $ | 118.6 | | | $ | 46.0 | |
| | | | | |
| | | | | |
| | | | | | | |
Balance Sheet Location | December 31, 2024 | | | December 31, 2023 | |
Current portion of long-term debt | $ | 10.5 | | | $ | 7.7 | |
Current operating lease liabilities | | 15.1 | | | | 15.9 | |
Finance lease obligations, net of current portion | | 35.5 | | | | 31.1 | |
Long-term operating lease liabilities, net of current portion | | 103.5 | | | | 99.6 | |
Total | $ | 164.6 | | | $ | 154.3 | |
As of December 31, 2024, the Company had additional leases, substantially all real estate, that have not yet commenced with undiscounted lease payments of $1.5 million. These leases are expected to commence in 2025 with lease terms up to 10 years.
The Company leases and subleases certain lift trucks to customers under long-term operating lease agreements which expire at various dates through 2029. Approximate minimum rentals receivable, none of which are recorded in our Consolidated Balance Sheets, under such leases for each of the next five years are as follows:
| | | | |
Years ending December 31, | | Amount | |
2025 | | $ | 7.3 | |
2026 | | | 5.4 | |
2027 | | | 2.5 | |
2028 | | | 0.3 | |
2029 | | | 0.1 | |
Total | | $ | 15.6 | |
Sublease income recorded in "Rental revenues" in our Consolidated Statements of Operations for the years ended December 31, 2024, 2023 and 2022 was $6.2 million, $6.2 million, and $7.0 million, respectively.
For more information on our rental revenues as a lessor, please refer to Note 3, Revenue Recognition.
See Note 11, Contingencies, for more information on certain contracts where the Company guarantees the performance of the third-party lessee.
NOTE 11 — CONTINGENCIES
Guarantees
As of December 31, 2024 and 2023, the Company was party to certain contracts in which we guarantee the performance of agreements with various third-party financial institutions. In the event of a default by a third-party, the Company would be required to pay all or a portion of the remaining unpaid obligations as specified in the contract. The estimated exposure related to these guarantees was not material as of December 31, 2024 and 2023. It is anticipated that the third parties will have the ability to repay the debt without the Company having to honor the guarantee; therefore, no amount has been accrued on the Consolidated Balance Sheets as of December 31, 2024 and 2023.
Legal Proceedings
During the years ended December 31, 2024 and 2023, various claims and lawsuits, incidental to the ordinary course of our business, were pending against the Company. In the opinion of management, after consultation with legal counsel, resolution of these matters, net of expected insurance proceeds, is not expected to have a material effect on the Company’s consolidated financial statements.
Contractual Obligations
The Company does not believe there are any off-balance sheet arrangements that have, or are reasonably likely to have, a material effect on the Company. As of December 31, 2024 and 2023 there was $12.0 million and $9.0 million, respectively, in outstanding letters of credit issued in the normal course of business. These letters of credit reduce our available borrowings under our ABL Facility.
NOTE 12 — INCOME TAXES
The income tax (benefit) provision were calculated based upon the following components of income before income taxes:
| | | | | | | | | | | | |
| | Year Ended December 31, | |
| | 2024 | | | 2023 | | | 2022 | |
U.S. (loss) income | | $ | (64.5 | ) | | $ | 0.7 | | | $ | 9.0 | |
Foreign (loss) income | | | (1.8 | ) | | | 1.8 | | | | 1.6 | |
Total (loss) income before taxes | | $ | (66.3 | ) | | $ | 2.5 | | | $ | 10.6 | |
The income tax (benefit) expense consisted of the following:
| | | | | | | | | | | | |
| | Year Ended December 31, | |
| | 2024 | | | 2023 | | | 2022 | |
Current | | | | | | | | | |
U.S. federal | | $ | 1.7 | | | $ | 0.7 | | | $ | 1.9 | |
U.S. state | | | 3.9 | | | | 1.7 | | | | 0.6 | |
Foreign | | | — | | | | 0.4 | | | | — | |
Deferred | | | | | | | | | |
U.S. federal | | | (2.1 | ) | | | (5.2 | ) | | | (0.7 | ) |
U.S. state | | | (7.5 | ) | | | (5.3 | ) | | | (0.8 | ) |
Foreign | | | (0.2 | ) | | | 1.3 | | | | 0.3 | |
Total income tax (benefit) expense | | $ | (4.2 | ) | | $ | (6.4 | ) | | $ | 1.3 | |
The reconciliation of the income tax (benefit) expense in the consolidated financial statements and the amount computed by applying the statutory U.S. federal and state related income tax rates to the pre-tax (loss) income before income taxes was as follows:
| | | | | | | | | | | | |
| | Year Ended December 31, | |
| | 2024 | | | 2023 | | | 2022 | |
Income tax (benefit) expense at statutory U.S. federal rate | | $ | (13.9 | ) | | $ | 0.5 | | | $ | 2.2 | |
Income tax (benefit) expense at statutory U.S. states rate, net | | | (2.8 | ) | | | 0.2 | | | | (0.4 | ) |
Permanent differences: | | | | | | | | | |
Foreign rate differential | | | (0.1 | ) | | | 0.1 | | | | 0.1 | |
Valuation allowance | | | 12.4 | | | | (8.8 | ) | | | 0.8 | |
Fixed asset basis adjustments | | | — | | | | — | | | | (1.6 | ) |
Other | | | 0.2 | | | | 1.6 | | | | 0.2 | |
Total income tax (benefit) expense | | $ | (4.2 | ) | | $ | (6.4 | ) | | $ | 1.3 | |
For the year ended December 31, 2024, the income tax benefit was primarily attributable to the Company's pre-tax losses partially offset by a valuation allowance against a portion of the deferred tax asset relating to U.S. disallowed interest expense carryforwards created by the provisions of the Tax Cuts and Jobs Act of 2018 ("TCJA"). During the year ended December 31, 2023, the income tax benefit was primarily attributable to the release of the valuation allowance on certain U.S. federal and state deferred tax assets.
The effective tax rate for the years ended December 31, 2024, 2023 and 2022 was 6.3%, (256.0)% and 12.3%, respectively. The effective income tax rate in 2024 and 2023 is primarily the result of the discrete items noted above. The effective tax rate in 2022 was primarily related to income tax expense associated with tax filing jurisdictions with no associated valuation allowance.
The Company intends to indefinitely reinvest the undistributed earnings of our foreign subsidiaries and expect future U.S. cash generation to be sufficient to meet future U.S. cash needs. The undistributed earnings of foreign subsidiaries and related unrecognized deferred tax liability are not material as of December 31, 2024 and 2023. If the Company determines that all or a portion of such foreign earnings are no longer indefinitely reinvested, the Company may be subject to foreign withholding taxes and U.S. state income taxes, beyond the one-time transition tax.
The components of deferred tax assets and liabilities were as follows:
| | | | | | | | |
| | Year Ended December 31, | |
| | 2024 | | | 2023 | |
Deferred Tax Assets | | | | | | |
Net operating loss carryforwards | | $ | 34.4 | | | $ | 41.3 | |
Deferred revenue | | | 0.5 | | | | 0.6 | |
Accounts receivable and inventories | | | 6.6 | | | | 6.6 | |
Accrued liabilities | | | 3.7 | | | | 4.8 | |
Lease liability | | | 39.9 | | | | 39.1 | |
Interest limitation carryforward | | | 35.6 | | | | 20.5 | |
Deferred payroll taxes and other | | | 3.6 | | | | 2.0 | |
Gross deferred tax assets | | $ | 124.3 | | | $ | 114.9 | |
Valuation allowance | | | (12.4 | ) | | | — | |
Deferred tax assets | | $ | 111.9 | | | $ | 114.9 | |
Deferred Tax Liabilities | | | | | | |
Property and equipment | | | (62.9 | ) | | | (73.5 | ) |
Goodwill & intangibles | | | (1.2 | ) | | | (2.2 | ) |
Prepaid expenses | | | (1.7 | ) | | | (1.4 | ) |
Lease right-of-use assets | | | (39.2 | ) | | | (37.6 | ) |
Gross deferred tax liabilities | | $ | (105.0 | ) | | $ | (114.7 | ) |
Deferred tax (liabilities) assets, net | | $ | 6.9 | | | $ | 0.2 | |
For the years ended December 31, 2024 and 2023, the net change in the valuation allowance was an increase of $12.4 million and decrease of $8.8 million, respectively. The valuation allowance increased in 2024 due to the aforementioned valuation allowance against a portion of the deferred tax asset relating to U.S. disallowed interest expense carryforwards. The decrease in 2023 was due to the release of the valuation allowance on certain U.S. federal and state deferred tax assets. We regularly assess the need for a valuation allowance against our deferred tax assets. In making that assessment, we consider both positive and negative evidence related to the likelihood of realization of the deferred tax assets as well as the nature of the deferred tax attribute to determine, based on the weight of available evidence, whether it is more likely than not that some or all of the deferred tax assets will not be realized. We will continue to monitor the need for a valuation allowance against our deferred tax assets on a quarterly basis. All of the factors that the Company considers in evaluating whether and when to establish or release all or a portion of the deferred tax asset valuation allowance involve significant judgment.
As of December 31, 2024 and 2023, the Company had federal net operating tax loss carryforwards of approximately $160.9 million and $194.6 million, respectively, primarily due to taking bonus depreciation. These federal net operating tax loss carryforwards may be carried forward indefinitely and are eligible to offset 80% of future taxable income. The Company also has Canadian and state net operating loss carryforwards of $2.1 million and $9.2 million, respectively, with varying carryforward expiration periods ranging from 2040 to 2045.
The Company has open tax years from 2021 through 2024 for U.S. federal and Canadian income taxes. The Company also files tax returns in numerous states for which various tax years are subject to examination and currently involved in audits. Typically states remain open for three years from filing, with the majority of the open years being 2021 to 2024.
NOTE 13 — STOCK BASED COMPENSATION
The Company’s plan is to have broad-based, long-term programs intended to attract and retain talented employees and align stockholder and employee interests. To this end, compensation for our senior leadership team includes equity awards in the form of restricted stock units ("RSUs") and performance stock units ("PSUs"). We calculate the fair value of the RSUs and PSUs at grant date based on the closing market price of our common stock at the date of grant. The compensation expense is recognized on a straight-line basis over the requisite service period of the award. The number of PSUs granted depends on the Company's achievement of target performance goals, which may range from 0% to 200% of the target award amount. The PSUs vest ratably over three years, including the one-year performance period. Upon vesting, each stock award is exchangeable for one share of the Company's common stock, with accrued dividends.
The Company recognized total stock-based compensation expense for PSUs and RSUs of $4.3 million, $4.1 million and $2.7 million for the years ended December 31, 2024, 2023 and 2022, respectively.
As of December 31, 2024, the total unrecognized compensation expense related to the non-vested portion of the Company's RSUs was $1.5 million, which is expected to be recognized over a weighted average period of 0.8 years. As of December 31, 2024, the total unrecognized compensation expense related to the non-vested portion of the Company's PSUs was $1.7 million, which is expected to be recognized over a weighted average period of 0.4 years.
The following table shows the number of stock awards that were granted, vested, cash settled, and forfeited during 2024:
| | | | | | | | | | | | | | | |
| Restricted Stock Units | | | Performance Stock Units | |
| Number of units | | | Weighted average grant date fair value | | | Number of units | | | Weighted average grant date fair value | |
Unvested units as of December 31, 2023 | | 230,574 | | | $ | 12.27 | | | | 543,422 | | | $ | 13.37 | |
Granted | | 160,016 | | | | 10.94 | | | | — | | | | — | |
Vested - issued | | (145,034 | ) | | | 10.96 | | | | (210,156 | ) | | | 12.15 | |
Vested - unissued | | (35,413 | ) | | | 10.34 | | | | — | | | | — | |
Cash settled | | (370 | ) | | | 14.38 | | | | (1,663 | ) | | | 14.11 | |
Forfeited | | (5,340 | ) | | | 13.34 | | | | (6,522 | ) | | | 14.11 | |
Unvested units as of December 31, 2024 | | 204,433 | | | $ | 12.47 | | | | 325,081 | | | $ | 14.13 | |
Employee Stock Purchase Plan
On June 8, 2023 the Company filed a Form S-8 to register 325,000 common stock shares, the total shares reserved for the ESPP. The Company then opened enrollment for the first offering period that started July 1, 2023 and continued through December 31, 2023. There are two six-month offering periods each year starting January 1 and July 1, with the purchase date on the last business day of each offering period.
Under the ESPP, eligible employees (as defined in the ESPP) can purchase the Company’s common stock through accumulated payroll deductions. Eligible employees may purchase the Company’s common stock at 85% of the lower of the fair market value of the Company’s common stock on the first or last business day of each six-month offering period. Eligible employees may contribute up to 10% of their eligible compensation. Under the ESPP, a participant may not accrue rights to purchase more than $25,000 worth of the Company’s common stock for each calendar year in which such right is outstanding.
Employees who elect to participate in the ESPP commence payroll withholdings that accumulate through the end of the respective period. In accordance with the guidance in Topic 718-50 – Compensation – Stock Compensation, the ability to purchase shares of the Company’s common stock for 85% of the lower of the price on the first or last day of the offering period (i.e. the purchase date) represents an option and, therefore, the ESPP is a compensatory plan. Accordingly, stock-based compensation expense is determined based on the option’s grant-date fair value and is recognized over the withholding period. The stock-based compensation expense related to the ESPP recognized during the years ended December 31, 2024 and 2023 was not material.
ESPP employee payroll contributions accrued as of December 31, 2024 and December 31, 2023 totaled $0.9 million in each year and are included within "Accrued expenses" in the Consolidated Balance Sheet. Cash withheld via employee payroll deductions is presented as financing activities within "Other financing activities" in the Consolidated Statement of Cash Flows.
NOTE 14 — FAIR VALUE OF FINANCIAL INSTRUMENTS
The carrying value of financial instruments reported in the accompanying Consolidated Balance Sheets for "Cash", "Accounts receivable, net", "Accounts payable", "Accrued expenses" and "Other current liabilities" approximate fair value due to the immediate or short-term nature or maturity of these financial instruments.
The following is a description of the valuation methodologies used for assets and liabilities measured at fair value on a recurring basis:
Debt Instruments
The carrying value of the Company's debt instruments vary from their fair values. The fair values were determined by reference to transacted prices and quotes for these instruments and based upon current borrowing rates with similar maturities, which are Level 2 fair value inputs. The estimated fair value, as well as the carrying value, of the Company's debt instruments are shown below:
| | | | | | | |
| December 31, 2024 | | | December 31, 2023 | |
Estimated aggregate fair value | $ | 706.4 | | | $ | 655.6 | |
Aggregate carrying value (1) | | 728.9 | | | | 671.3 | |
(1) Total debt excluding the impact of unamortized debt discount and debt issuance costs.
Contingent Consideration
The contingent consideration liability represents the fair value of the future earn-outs that the Company may be required to pay in conjunction with certain acquisitions upon the achievement of performance milestones. The earn-outs for the acquisitions are measured at fair value in each reporting period, based on Level 3 inputs, with any change to the fair value recorded in the Consolidated Statements of Operations.
The following table sets forth the Company’s contingent consideration liabilities recorded at fair value and their presentation on the Consolidated Balance Sheets:
| | | | | | | |
| Level 3 | |
Balance Sheet Location | December 31, 2024 | | | December 31, 2023 | |
Other current liabilities | $ | — | | | $ | 0.4 | |
Other liabilities | | 5.7 | | | | 4.2 | |
The following is a summary of changes to Level 3 instruments for the years ended December 31, 2024 and 2023:
| | | |
| Contingent Consideration | |
Balance, December 31, 2022 | $ | 9.8 | |
Changes in fair value | | 1.1 | |
Payments | | (1.2 | ) |
Non-contingent reclass | | (5.1 | ) |
Balance, December 31, 2023 | $ | 4.6 | |
Changes in fair value | | 1.1 | |
Balance, December 31, 2024 | $ | 5.7 | |
Derivative Financial Instruments
In the normal course of business, we are exposed to market risks associated with changes in foreign currency exchange rates, commodity prices and interest rates. To manage a portion of these inherent risks, we may purchase certain types of derivative financial instruments based on management's judgment of the trade-off between risk, opportunity, and cost. We do not hold or issue derivative financial instruments for trading or speculative purposes. The impact of hedge ineffectiveness for those derivatives where hedge accounting is applied was not significant in any of the periods presented. The Company has determined the fair value of all our derivative contracts are based on Level 2 inputs such as quoted market prices for similar instruments from third parties and inputs other than quoted prices that are observable (forward curves, implied volatility, counterparty credit risks). The Company reviews counterparty credit risks at regular intervals and has not experienced any significant credit loss as a result of counterparty nonperformance in the past.
Currency Derivative Contracts
From time to time we use foreign currency forward contracts to reduce the effects of fluctuations in exchange rates relating to foreign currencies for certain inventory purchases. The realized impact from these foreign currency forward contracts on our Consolidated Statements of Operations for the years ended December 31, 2024, 2023 and 2022 was not material.
Interest Rate Cap
In 2022, we entered into an interest rate cap to protect cash flows from the risks associated with interest payments from interest rate increases on variable rate debt. The interest rate cap is a derivative instrument designated as a cash flow hedge under Topic 815 – Derivatives and Hedging. The premiums are recognized in the Consolidated Statements of Operations when paid from the effective date through the termination date. All changes in the fair value of the interest rate cap are deferred in AOCI and subsequently recognized in earnings in the period when the derivative contract settles. The unrealized impact on earnings on the interest rate cap for the years ended December 31, 2024, 2023 and 2022 are disclosed in the Consolidated Statements of Other Comprehensive (Loss) Income.
Fuel Purchase Contracts
From time to time, we enter into fixed price swap contracts to purchase gasoline and diesel fuel to protect cash flows from the risks associated with fluctuations in fuel prices on a portion of anticipated future purchases. The fixed price swap contracts to purchase gasoline and diesel fuel are derivative instruments not designated as hedging instruments under Topic 815.
The following table summarizes the maturity dates, unit of measure and notional value for the derivative instruments as of December 31, 2024:
| | | | | |
Maturity Date of Derivatives | Currency / Unit of Measure | | Notional Value | |
Interest rate cap (December 2025) | One-month SOFR | | $ | 200.0 | |
Fuel swaps (various through February 2026) | Gallons | | | 4.0 | |
The following table sets forth the location and fair values of the Company’s derivative financial instruments on the Consolidated Balance Sheets:
| | | | | | | | | | | | | | | | | | |
| Asset Derivatives | | | Liability Derivatives | |
Derivative designated as hedge | Balance Sheet location | | December 31, 2024 | | | December 31, 2023 | | | Balance Sheet location | December 31, 2024 | | | December 31, 2023 | |
Interest rate cap - current portion | Prepaid expenses and other current assets | | $ | 0.2 | | | $ | — | | | Other current liabilities | $ | 1.6 | | | $ | 1.6 | |
Interest rate cap - long-term | Other assets | | | — | | | | 1.7 | | | Other liabilities | | — | | | | 1.6 | |
NOTE 15 — BUSINESS COMBINATIONS
The following table summarizes the net assets acquired by segment from our 2023 acquisitions:
| | | | | | | | | |
| Material Handling | | Construction | | Total | |
Cash | $ | 0.1 | | $ | 0.6 | | $ | 0.7 | |
Accounts receivable | | 0.3 | | | 7.9 | | | 8.2 | |
Inventories | | 0.8 | | | 37.6 | | | 38.4 | |
Prepaid expenses and other current assets | | — | | | 0.8 | | | 0.8 | |
Rental fleet | | 1.0 | | | 10.8 | | | 11.8 | |
Property and equipment | | 0.1 | | | 1.8 | | | 1.9 | |
Operating lease right-of-use assets | | 1.9 | | | 2.7 | | | 4.6 | |
Other intangible assets | | — | | | 13.5 | | | 13.5 | |
Goodwill | | 1.1 | | | 6.8 | | | 7.9 | |
Other assets | | — | | | 0.3 | | | 0.3 | |
Total assets | $ | 5.3 | | $ | 82.8 | | $ | 88.1 | |
| | | | | | |
Floor plan payable – new equipment | $ | — | | $ | (9.2 | ) | $ | (9.2 | ) |
Accounts payable | | (0.7 | ) | | (9.3 | ) | | (10.0 | ) |
Customer deposits | | — | | | (0.1 | ) | | (0.1 | ) |
Accrued expenses | | — | | | (3.1 | ) | | (3.1 | ) |
Current operating lease liabilities | | (0.2 | ) | | (0.4 | ) | | (0.6 | ) |
Current deferred revenue | | — | | | (0.6 | ) | | (0.6 | ) |
Long-term operating lease liabilities | | (1.7 | ) | | (2.3 | ) | | (4.0 | ) |
Deferred tax liability | | — | | | (5.4 | ) | | (5.4 | ) |
Total liabilities | $ | (2.6 | ) | $ | (30.4 | ) | $ | (33.0 | ) |
| | | | | | |
Net assets acquired | $ | 2.7 | | $ | 52.4 | | $ | 55.1 | |
| | | | | | |
Assets acquired net of cash | $ | 2.6 | | $ | 51.8 | | $ | 54.4 | |
Burris
On October 13, 2023, Alta closed its acquisition of Burris, a privately held premier distributor of market leading construction and turf equipment with three locations in Illinois. The purchase price on the asset-structured acquisition was $16.7 million in cash paid, which included $2.7 million of excess net working capital. Burris is reported within our Construction Equipment segment.
Ault
On November 1, 2023, Alta acquired the stock of Ault, a privately held Canadian crushing and screening equipment distributor with locations in Ontario and Quebec provinces for a total purchase price of $35.7 million, inclusive of a working capital true up, $27.0 million net cash at close, a $3.2 million seller note to be paid annually over three years, and $5.3 million fair value of Alta’s common stock, equating to 735,168 shares at agreed upon $13 per share, vesting annually over a five-year period. Ault is reported within our Construction Equipment segment.
In 2023, the Company also purchased the assets of M&G Materials Handling Co. and Battery Shop of New England Inc. for a combined purchase price of $2.6 million, net of cash acquired. These acquisitions, which took place in our Material Handling segment, are not material individually or in the aggregate.
These acquisitions were accounted for as business combinations. During 2024, we recorded adjustments to the purchase price allocation related to the Ault acquisition which were not significant individually or in the aggregate. These adjustments had no cash impact. The fair values of assets acquired and liabilities assumed are finalized for all our 2023 acquisitions.
NOTE 16 — UNION PENSION PLAN
The Company contributes to various multiemployer defined benefit pension plans under collective bargaining agreements that cover certain union represented employees. These multiemployer plans generally provide retirement benefits to participants based on their service to contributing employers. The benefits are paid from assets held in trust for that purpose. Plan trustees typically are responsible for determining the level of benefits to be provided to participants as well as the investment of the assets and plan administration. Trustees are appointed in equal number by employers and the unions that are parties to the relevant collective bargaining agreements.
Expense is recognized in connection with these plans as contributions are funded, in accordance with U.S. GAAP. The risks of participating in such plans are different from the risks of single-employer plans, in the following respects:
(a)Assets contributed to a multiemployer plan by one employer may be used to provide benefits to employees of other participating employers;
(b)If a participating employer ceases to contribute to the plan, the unfunded obligations of the plan may be borne by the remaining participating employers; and
(c)If the Company ceases to have a continuing obligation to contribute to the multiemployer plan in which the Company had been a contributing employer, the Company may be required to pay to the plan an amount based on the underfunded status of the plan and on the history of the Company’s participation in the plan prior to the cessation of our obligation to contribute.
The Company’s participation in multiemployer plans for the annual periods ended December 31, 2024, 2023 and 2022 is outlined in the table below. For each plan that is individually significant to the Company, the following information is provided:
•The “Pension Protection Act Zone Status” available is for plan years that ended in 2024 and 2023. The zone status is based on information provided to the Company and other participating employers by each plan and is certified by the plan’s actuary. This indicates the funded status of the plan with the status indicated by the colors of green, yellow and red with green being the most funded and red being the least funded.
•The “FIP/RP Status Pending/Implemented” column indicates whether a Funding Improvement Plan, as required under the U.S. Internal Revenue Code (the "Code") to be adopted by plans in the “yellow” zone, or a Rehabilitation Plan, as required under the Code to be adopted by plans in the “red” zone, is pending or has been implemented as of the end of the plan year.
•The “Surcharge Imposed” column indicates whether a surcharge was paid during the most recent annual period presented for the Company’s contributions to any plan in the red zone in accordance with the requirements of the Code.
•The last column lists the expiration dates of the collective bargaining agreements with the Company.
Certain plans have been aggregated in the All Other Multiemployer Pension Plans line in the following table, as the contributions to each of these plans are not individually material. None of our collective bargaining agreements require that a minimum contribution be made to these plans. There are no plans where the amount contributed by the Company represents more than 5% of the total contributions to the plan for the years ended December 31, 2024, 2023 and 2022.
Multiple Employer Pension Plans:
| | | | | | | | | | | | | | | | | | | | | | | | |
Pension Fund | | EIN | | Pension Protection Act Zone Status & Plan Year- End | | FIP/RP
Status | | Contributions of Alta Equipment Group Inc. and Subsidiaries | | | Surcharge
Imposed | | Expiration
Date of
Collective-
Bargaining
Agreement |
| | | | 2024 | | 2023 | | | | 2024 | | | 2023 | | | 2022 | | | | | |
Midwest Operating Engineers
Local Union No. 150 Pension Trust Fund | | 36-6140097 | | Green
3/31/2024 | | Green
3/31/2023 | | None | | $ | 3.0 | | | $ | 2.8 | | | $ | 2.4 | | | No | | 5/31/2027 |
Operating Engineers Local
Union No. 324 Pension Fund | | 38-1900637 | | Red
4/30/2024 | | Red
4/30/2023 | | Implemented | | | 1.7 | | | | 1.6 | | | | 1.2 | | | Yes | | 9/30/2027 |
All Other Multiemployer Pension Plans (1) | | | | | | | | | | | 1.7 | | | | 1.5 | | | | 1.2 | | | | | Various |
| | | | | | | | | | $ | 6.4 | | | $ | 5.9 | | | $ | 4.8 | | | | | |
(1) All Other Multiemployer Pension Plans includes 13 plans, none of which are individually significant when considering contributions to the plan, severity of the underfunded status, or other factors.
NOTE 17 — SEGMENTS
The Company has three operating segments which are also our reportable segments: Material Handling, Construction Equipment, and Master Distribution. All other business activities, including electric vehicles and corporate, are included in "Corporate and Other". The Company’s segments are determined based on management structure, which is organized based on types of products and services sold, as described in the following paragraphs. The operating results for each segment are reported separately to the Company’s CEO (our Chief Operating Decision Maker or "CODM") to make decisions regarding the allocation of resources, to assess the Company’s performance and to make strategic decisions. The primary profitability measurement used by the CEO to evaluate performance and allocate resources to the segments is Adjusted EBITDA. The Company's presentation of Adjusted EBITDA may not be comparable to similar measures used by other companies and is not necessarily indicative of the results of operations that would have occurred had each reportable segment been an independent, stand-alone entity during the periods presented.
The Material Handling segment is principally engaged in operations related to the sale, service, and rental of lift trucks and other material handling equipment in Michigan, Illinois, Indiana, New York (including New York City), Virginia and the New England region of the U.S. as well as Ontario and Quebec provinces of Canada.
The Construction Equipment segment is principally engaged in operations related to the sale, service, and rental of construction equipment in Michigan, Illinois, Indiana, Ohio, Pennsylvania, New York (excluding New York City), Florida and the New England region of the U.S. as well as Ontario and Quebec provinces of Canada.
The Master Distribution segment is principally engaged in large-scale equipment distribution with sub dealers throughout North America related to environmental processing equipment.
The Company retains various unallocated expense items at the general corporate level, which the Company refers to as “Corporate and Other” in the table below. Corporate and Other holds corporate debt and has minor transactional activity, including Alta e-mobility (e.g., commercial electric vehicles) revenues and costs. Corporate and Other incurs expenses associated with compensation (including stock-based compensation) of our directors, corporate officers and members of our shared-services team, consulting and legal fees related to acquisitions and capital raising activities, corporate governance and compliance related matters, certain corporate development related expenses, interest expense associated with original issue discounts and deferred financing cost related to previous capital raises, and a portion of the Company’s income tax provision. There is also intercompany elimination activity presented within Corporate and Other.
The following tables summarize key financial information by reportable segment:
| | | | | | | | | | | | | | | | | | | |
| Year Ended December 31, 2024 | |
| Material
Handling | | | Construction
Equipment | | | Master Distribution | | | Corporate and Other | | | Total | |
Revenues: | | | | | | | | | | | | | | |
New and used equipment sales | $ | 365.2 | | | $ | 574.4 | | | $ | 48.0 | | | $ | (0.6 | ) | | $ | 987.0 | |
Parts sales | | 99.6 | | | | 186.7 | | | | 8.9 | | | | (0.8 | ) | | | 294.4 | |
Service revenues | | 135.9 | | | | 117.1 | | | | 0.8 | | | | — | | | | 253.8 | |
Rental revenues | | 76.2 | | | | 125.7 | | | | 1.5 | | | | — | | | | 203.4 | |
Rental equipment sales | | 10.5 | | | | 127.5 | | | | — | | | | — | | | | 138.0 | |
Total revenues | | 687.4 | | | | 1,131.4 | | | | 59.2 | | | | (1.4 | ) | | | 1,876.6 | |
Cost of revenues: | | | | | | | | | | | | | | |
New and used equipment sales | | 300.2 | | | | 503.3 | | | | 35.9 | | | | (1.5 | ) | | | 837.9 | |
Parts sales | | 62.6 | | | | 129.5 | | | | 5.0 | | | | (0.9 | ) | | | 196.2 | |
Service revenues | | 56.2 | | | | 48.8 | | | | 0.9 | | | | (0.1 | ) | | | 105.8 | |
Rental revenues | | 6.5 | | | | 16.0 | | | | — | | | | — | | | | 22.5 | |
Rental equipment sales | | 7.6 | | | | 97.0 | | | | — | | | | — | | | | 104.6 | |
Selling, general and administrative expenses | | 184.7 | | | | 229.6 | | | | 13.0 | | | | 19.2 | | | | 446.5 | |
Other segment items(1) | | (0.5 | ) | | | 3.0 | | | | (0.3 | ) | | | (7.4 | ) | | | (5.2 | ) |
Segment adjusted EBITDA(2) | | 70.1 | | | | 104.2 | | | | 4.7 | | | | (10.7 | ) | | | 168.3 | |
Depreciation and amortization | | | | | | | | | | | | | | 144.5 | |
Interest expense | | | | | | | | | | | | | | 81.3 | |
Other(1) | | | | | | | | | | | | | | 8.8 | |
Loss before taxes | | | | | | | | | | | | | $ | (66.3 | ) |
| | | | | | | | | | | | | | |
Total assets, end of period | $ | 447.5 | | | $ | 898.1 | | | $ | 86.7 | | | $ | 48.1 | | | $ | 1,480.4 | |
Capital expenditures | | 42.5 | | | | 27.2 | | | | 0.2 | | | | 0.6 | | | | 70.5 | |
Depreciation and amortization | | 41.0 | | | | 97.9 | | | | 4.6 | | | | 1.0 | | | | 144.5 | |
Interest expense | | 24.2 | | | | 48.5 | | | | 4.5 | | | | 4.1 | | | | 81.3 | |
| | | | | | | | | | | | | | | | | | | |
| Year Ended December 31, 2023 | |
| Material
Handling | | | Construction
Equipment | | | Master Distribution | | | Corporate and Other | | | Total | |
Revenues: | | | | | | | | | | | | | | |
New and used equipment sales | $ | 367.6 | | | $ | 597.9 | | | $ | 72.5 | | | $ | (12.1 | ) | | $ | 1,025.9 | |
Parts sales | | 99.5 | | | | 170.1 | | | | 9.8 | | | | (1.1 | ) | | | 278.3 | |
Service revenues | | 132.8 | | | | 108.2 | | | | 0.3 | | | | — | | | | 241.3 | |
Rental revenues | | 76.4 | | | | 124.8 | | | | 1.2 | | | | — | | | | 202.4 | |
Rental equipment sales | | 5.2 | | | | 123.7 | | | | — | | | | — | | | | 128.9 | |
Total revenues | | 681.5 | | | | 1,124.7 | | | | 83.8 | | | | (13.2 | ) | | | 1,876.8 | |
Cost of revenues: | | | | | | | | | | | | | | |
New and used equipment sales | | 294.3 | | | | 515.5 | | | | 54.4 | | | | (10.6 | ) | | | 853.6 | |
Parts sales | | 61.8 | | | | 117.5 | | | | 5.0 | | | | (1.1 | ) | | | 183.2 | |
Service revenues | | 57.3 | | | | 45.9 | | | | 0.2 | | | | — | | | | 103.4 | |
Rental revenues | | 9.7 | | | | 15.1 | | | | — | | | | — | | | | 24.8 | |
Rental equipment sales | | 3.4 | | | | 91.1 | | | | — | | | | — | | | | 94.5 | |
Selling, general and administrative expenses | | 187.8 | | | | 211.6 | | | | 12.3 | | | | 18.6 | | | | 430.3 | |
Other segment items(1) | | 1.5 | | | | (0.6 | ) | | | (0.6 | ) | | | (4.7 | ) | | | (4.4 | ) |
Segment adjusted EBITDA(2) | | 65.7 | | | | 128.6 | | | | 12.5 | | | | (15.4 | ) | | | 191.4 | |
Depreciation and amortization | | | | | | | | | | | | | | 132.6 | |
Interest expense | | | | | | | | | | | | | | 57.0 | |
Other(1) | | | | | | | | | | | | | | (0.7 | ) |
Income before taxes | | | | | | | | | | | | | $ | 2.5 | |
| | | | | | | | | | | | | | |
Total assets, end of period | $ | 474.3 | | | $ | 947.6 | | | $ | 85.9 | | | $ | 63.1 | | | $ | 1,570.9 | |
Capital expenditures | | 45.2 | | | | 28.2 | | | | — | | | | 1.2 | | | | 74.6 | |
Depreciation and amortization | | 34.9 | | | | 92.5 | | | | 4.4 | | | | 0.8 | | | | 132.6 | |
Interest expense | | 18.1 | | | | 33.1 | | | | 3.4 | | | | 2.4 | | | | 57.0 | |
| | | | | | | | | | | | | | | | | | | |
| Year Ended December 31, 2022 | |
| Material
Handling | | | Construction
Equipment | | | Master Distribution | | | Corporate and Other | | | Total | |
Revenues: | | | | | | | | | | | | | | |
New and used equipment sales | $ | 305.2 | | | $ | 508.2 | | | $ | 5.0 | | | $ | (1.2 | ) | | $ | 817.2 | |
Parts sales | | 84.4 | | | | 149.0 | | | | 1.6 | | | | (0.2 | ) | | | 234.8 | |
Service revenues | | 112.1 | | | | 94.4 | | | | 0.1 | | | | — | | | | 206.6 | |
Rental revenues | | 63.5 | | | | 116.6 | | | | — | | | | — | | | | 180.1 | |
Rental equipment sales | | 5.5 | | | | 127.6 | | | | — | | | | — | | | | 133.1 | |
Total revenues | | 570.7 | | | | 995.8 | | | | 6.7 | | | | (1.4 | ) | | | 1,571.8 | |
Cost of revenues: | | | | | | | | | | | | | | |
New and used equipment sales | | 242.9 | | | | 436.7 | | | | 4.6 | | | | (1.0 | ) | | | 683.2 | |
Parts sales | | 52.8 | | | | 103.7 | | | | 1.0 | | | | (0.1 | ) | | | 157.4 | |
Service revenues | | 49.5 | | | | 41.2 | | | | — | | | | — | | | | 90.7 | |
Rental revenues | | 6.1 | | | | 16.3 | | | | — | | | | — | | | | 22.4 | |
Rental equipment sales | | 3.3 | | | | 99.7 | | | | — | | | | — | | | | 103.0 | |
Selling, general and administrative expenses | | 164.9 | | | | 178.8 | | | | 1.5 | | | | 17.1 | | | | 362.3 | |
Other segment items(1) | | (4.9 | ) | | | 3.9 | | | | — | | | | (4.3 | ) | | | (5.3 | ) |
Segment adjusted EBITDA(2) | | 56.1 | | | | 115.5 | | | | (0.4 | ) | | | (13.1 | ) | | | 158.1 | |
Depreciation and amortization | | | | | | | | | | | | | | 112.0 | |
Interest expense | | | | | | | | | | | | | | 31.8 | |
Other(1) | | | | | | | | | | | | | | 3.7 | |
Income before taxes | | | | | | | | | | | | | $ | 10.6 | |
| | | | | | | | | | | | | | |
Total assets, end of period | $ | 416.3 | | | $ | 775.5 | | | $ | 77.6 | | | $ | 21.2 | | | $ | 1,290.6 | |
Capital expenditures | | 38.0 | | | | 36.8 | | | | — | | | | 1.9 | | | | 76.7 | |
Depreciation and amortization | | 26.8 | | | | 84.6 | | | | 0.6 | | | | — | | | | 112.0 | |
Interest expense | | 11.7 | | | | 17.7 | | | | 0.5 | | | | 1.9 | | | | 31.8 | |
(1) Primarily includes other income (expense) and non-recurring items.
(2) See definition in Part II Item 7 under Non-GAAP Financial Measures.
NOTE 18 — EARNINGS PER SHARE
Basic earnings per share ("EPS") is calculated by dividing net income by the weighted-average number of common shares outstanding during the period and includes vested, unissued RSUs, PSUs, and ESPP shares. Diluted EPS is calculated by dividing net income by the weighted-average number of common shares outstanding, after giving effect to all potential dilutive common shares outstanding during the period. We include all common share equivalents granted under our stock-based compensation plan, including ESPP, which remain unvested, and shares used as consideration in the Ault acquisition which remain unissued ("dilutive securities"), in the number of shares outstanding for our diluted EPS calculations using the treasury method.
Basic and diluted EPS were calculated as follows:
| | | | | | | | | | | |
| Year Ended December 31, | |
| 2024 | | | 2023 | | | 2022 | |
Basic net (loss) income per share | | | | | | | | |
Net (loss) income available to common stockholders | $ | (65.1 | ) | | $ | 5.9 | | | $ | 6.3 | |
Basic weighted average common shares outstanding | | 33,179,598 | | | | 32,447,754 | | | | 32,099,247 | |
Basic net (loss) income per share of common stock | $ | (1.96 | ) | | $ | 0.18 | | | $ | 0.20 | |
Diluted (loss) income per share | | | | | | | | |
Net (loss) income available to common stockholders | $ | (65.1 | ) | | $ | 5.9 | | | $ | 6.3 | |
Basic weighted average common shares outstanding | | 33,179,598 | | | | 32,447,754 | | | | 32,099,247 | |
Effect of dilutive securities: | | | | | | | | |
Effect of dilutive securities | | — | | | | 429,753 | | | | 202,416 | |
Diluted weighted average common shares outstanding | | 33,179,598 | | | | 32,877,507 | | | | 32,301,663 | |
Diluted net (loss) income per share of common stock | $ | (1.96 | ) | | $ | 0.18 | | | $ | 0.20 | |
Approximately 918,000 securities were excluded from the calculation of diluted loss per share for the year ended December 31, 2024, because the inclusion of such securities in the calculation would have been anti-dilutive.
Item 9. Changes in and Disagreements with Accountants on Accounting and Financial Disclosure.
None.
Item 9A. Controls and Procedures.
Evaluation of Disclosure Controls and Procedures
We maintain disclosure controls and procedures (as defined in Rules 13a-15(e) or 15d-15(e) under the Exchange Act) that are designed to ensure that information required to be disclosed in the reports that we file or submit under the Exchange Act is recorded, processed, summarized, and reported within the time periods specified in the rules and forms of the SEC and to ensure that information required to be disclosed is accumulated and communicated to management, including our principal executive officer and our principal financial officer, to allow timely decisions regarding disclosure.
Our management, with the participation of the Chief Executive Officer and the Chief Financial Officer, has evaluated the effectiveness of our disclosure controls and procedures as of the end of the period covered by this Annual Report on Form 10-K. Based on this evaluation, our Chief Executive Officer and Chief Financial Officer concluded that our disclosure controls and procedures were effective as of December 31, 2024.
Management’s Annual Report on Internal Control over Financial Reporting
Management is responsible for establishing and maintaining adequate internal control over financial reporting as defined in Rules 13a-15(f) and 15d-15(f) under the Exchange Act, as amended. Our internal control over financial reporting includes controls and procedures designed to provide reasonable assurance regarding the reliability of financial reporting and the preparation of financial statements for external reporting purposes in accordance with U.S. GAAP. Because of its inherent limitations, internal control over financial reporting may not prevent or detect misstatements.
The Company’s management conducted an evaluation of the effectiveness of our internal control over financial reporting as of December 31, 2024, based on the criteria established in the Internal Control – Integrated Framework (2013) issued by the Committee of Sponsoring Organizations of the Treadway Commission (COSO). Based on this evaluation, the Company’s management concluded that our internal control over financial reporting was effective as of the end of the fiscal year covered by this Annual Report on Form 10-K.
The Company’s independent registered public accounting firm, Deloitte & Touche LLP, who audited the consolidated financial statements as of and for the year ended December 31, 2024 included in this Annual Report on Form 10-K has also audited the Company’s internal control over financial reporting as of December 31, 2024. Deloitte & Touche LLP’s report is included herein.
Changes in Internal Control over Financial Reporting
There were no changes in our internal control over financial reporting identified in connection with the evaluation required by Rule 13a-15(d) and 15d-15(d) of the Exchange Act that occurred during the fourth quarter of fiscal 2024 that have materially affected, or are reasonably likely to materially affect, our internal control over financial reporting.
Report of Independent Registered Public Accounting Firm
To the shareholders and the Board of Directors of Alta Equipment Group Inc.
Opinion on Internal Control over Financial Reporting
We have audited the internal control over financial reporting of Alta Equipment Group Inc. and subsidiaries (the "Company") as of December 31, 2024, based on criteria established in Internal Control — Integrated Framework (2013) issued by the Committee of Sponsoring Organizations of the Treadway Commission (COSO). In our opinion, the Company maintained, in all material respects, effective internal control over financial reporting as of December 31, 2024, based on criteria established in Internal Control — Integrated Framework (2013) issued by COSO.
We have also audited, in accordance with the standards of the Public Company Accounting Oversight Board (United States) (PCAOB), the consolidated financial statements as of and for the year ended December 31, 2024, of the Company and our report dated March 5, 2025, expressed an unqualified opinion on those financial statements.
Basis for Opinion
The Company's management is responsible for maintaining effective internal control over financial reporting and for its assessment of the effectiveness of internal control over financial reporting, included in the accompanying Management's Annual Report on Internal Control over Financial Reporting. Our responsibility is to express an opinion on the Company's internal control over financial reporting based on our audit. We are a public accounting firm registered with the PCAOB and are required to be independent with respect to the Company in accordance with the U.S. federal securities laws and the applicable rules and regulations of the Securities and Exchange Commission and the PCAOB.
We conducted our audit in accordance with the standards of the PCAOB. Those standards require that we plan and perform the audit to obtain reasonable assurance about whether effective internal control over financial reporting was maintained in all material respects. Our audit included obtaining an understanding of internal control over financial reporting, assessing the risk that a material weakness exists, testing and evaluating the design and operating effectiveness of internal control based on the assessed risk, and performing such other procedures as we considered necessary in the circumstances. We believe that our audit provides a reasonable basis for our opinion.
Definition and Limitations of Internal Control over Financial Reporting
A company's internal control over financial reporting is a process designed to provide reasonable assurance regarding the reliability of financial reporting and the preparation of financial statements for external purposes in accordance with generally accepted accounting principles. A company's internal control over financial reporting includes those policies and procedures that (1) pertain to the maintenance of records that, in reasonable detail, accurately and fairly reflect the transactions and dispositions of the assets of the company; (2) provide reasonable assurance that transactions are recorded as necessary to permit preparation of financial statements in accordance with generally accepted accounting principles, and that receipts and expenditures of the company are being made only in accordance with authorizations of management and directors of the company; and (3) provide reasonable assurance regarding prevention or timely detection of unauthorized acquisition, use, or disposition of the company's assets that could have a material effect on the financial statements.
Because of its inherent limitations, internal control over financial reporting may not prevent or detect misstatements. Also, projections of any evaluation of effectiveness to future periods are subject to the risk that controls may become inadequate because of changes in conditions, or that the degree of compliance with the policies or procedures may deteriorate.
/s/ Deloitte & Touche LLP
Detroit, Michigan
March 5, 2025
Item 9B. Other Information.
None.
Item 9C. Disclosure Regarding Foreign Jurisdictions that Prevent Inspections.
None.
PART III
Item 10. Directors, Executive Officers and Corporate Governance.
The information required by this Item is incorporated by reference to the applicable information in our definitive proxy statement, which will be filed no later than 120 days after the close of the fiscal year covered by this annual report.
Alta has adopted Standards of Code of Business Conduct and Ethics that apply to all employees, including executive officers, and to directors. Our Code of Business Conduct and Ethics and Corporate Governance Guidelines are available on the Governance Documents portion of the Company’s website at https://investors.altg.com/governance/governance-documents/. If the Company ever were to amend or waive any provision of its Code of Business Conduct and Ethics that applies to the Company’s principal executive officer, principal financial officer, principal accounting officer or any person performing similar functions, the Company intends to satisfy its disclosure obligations, if any, with respect to any such waiver or amendment by posting such information on its website set forth above rather than by filing a Current Report on Form 8-K.
Item 11. Executive Compensation.
The information required by this Item is incorporated by reference to the applicable information in our definitive proxy statement, which will be filed no later than 120 days after the close of the fiscal year covered by this annual report.
Item 12. Security Ownership of Certain Beneficial Owners and Management and Related Stockholder Matters.
The information required by this Item is incorporated by reference to the applicable information in our definitive proxy statement, which will be filed no later than 120 days after the close of the fiscal year covered by this annual report.
Item 13. Certain Relationships and Related Transactions, and Director Independence.
The information required by this Item is incorporated by reference to the applicable information in our definitive proxy statement, which will be filed no later than 120 days after the close of the fiscal year covered by this annual report.
Item 14. Principal Accountant Fees and Services.
The information required by this Item is incorporated by reference to the applicable information in our definitive proxy statement, which will be filed no later than 120 days after the close of the fiscal year covered by this annual report.
PART IV
Item 15. Exhibits, Financial Statement Schedules.
(a) Documents filed as part of this Annual Report on Form 10-K
(2)Financial Statement Schedule
Schedule II - Valuation and Qualifying Accounts for the Years Ended December 31, 2024, 2023 and 2022:
| | | | | | | | | | | | | | | | | | | | |
| | | | | Changes | | | | |
| | Balance at Beginning of Period | | | Charged to Expense | | | Other (1)(2) | | | Deductions from Reserves | | | Balance at End of Period | |
Receivables allowances: | | | | | | | | | | | | | | | |
Year ended December 31, 2024 | | $ | 12.4 | | | $ | 5.8 | | | $ | — | | | $ | (7.5 | ) | | $ | 10.7 | |
Year ended December 31, 2023 | | | 13.0 | | | | 7.2 | | | | 0.5 | | | | (8.3 | ) | | | 12.4 | |
Year ended December 31, 2022 | | | 10.7 | | | | 5.0 | | | | — | | | | (2.7 | ) | | | 13.0 | |
| | | | | | | | | | | | | | | |
Tax valuation allowances: | | | | | | | | | | | | | | | |
Year ended December 31, 2024 | | $ | — | | | $ | 12.4 | | | $ | — | | | $ | — | | | $ | 12.4 | |
Year ended December 31, 2023 | | | 8.8 | | | | (8.4 | ) | | | (0.4 | ) | | | — | | | | — | |
Year ended December 31, 2022 | | | 7.6 | | | | 0.8 | | | | 0.4 | | | | — | | | | 8.8 | |
(1) Other for receivables includes changes associated with adoption of Current Expected Credit Loss model as of January 1, 2023.
(2) Other for tax valuation allowance includes changes associated with change in valuation allowance from OCI and prior year adjustments
Exhibit Index
| | |
Exhibit Number |
| Description |
|
|
|
2.1 | | Merger Agreement, dated as of December 12, 2019, by and among B. Riley Principal Merger Corp., BR Canyon Merger Sub Corp., Alta Equipment Holdings, Inc. and Ryan Greenawalt (incorporated by reference to Exhibit 2.1 of the Current Report on Form 8-K (File No. 001-38864) filed by the Company on December 13, 2019). |
3.1 | | Third Amended and Restated Certificate of Incorporation (incorporated by reference to Exhibit 3.1 of the Form 8-A (File No. 001-38864) filed by the Company on February 14, 2020). |
3.2 | | Amended and Restated Bylaws (incorporated by reference to Exhibit 3.2 of the Form 10-Q (File No. 001-38864) filed by the Company on November 12, 2024). |
3.3 | | Certificate of Designation for 10% Series A Cumulative Perpetual Preferred Stock of Alta Equipment Group Inc. (incorporated by reference to Exhibit 3.3 of the Current Report on Form 8-K (File No. 001-38864) filed by the Company on December 22, 2020) |
| | |
4.1 |
| Specimen Common Stock Certificate (incorporated by reference to Exhibit 4.1 of the Form 8-A (File No. 001- 38864) filed by the Company on February 14, 2020). |
4.2 |
| Specimen Warrant Certificate (incorporated by reference to Exhibit 4.2 of the Form 8-A (File No. 001-38864) filed by the Company on February 14, 2020). |
4.3 |
| Warrant Agreement, dated April 8, 2019, between the B. Riley Principal Merger Corp. and Continental Stock Transfer & Trust Company, as warrant agent (incorporated by reference to Exhibit 4.1 of the Current Report on Form 8-K (File No. 001-38864) filed by the Company on April 11, 2019). |
4.4 | | Deposit Agreement, dated December 22, 2020, among Alta Equipment Group Inc., Continental Stock Transfer & Trust Company, as Depositary, and the holders of depositary receipts, with respect to Alta Equipment Group’s 10% Series A Cumulative Perpetual Preferred Stock (incorporated by reference to Exhibit 4.4 of the Current Report on Form 8-K (File No. 001-38864) filed by the Company on December 22, 2020). |
4.5 | | Form of Specimen Certificate representing the 10% Series A Cumulative Perpetual Preferred Stock, par value $0.0001 per share, of Alta Equipment Group Inc. (incorporated by reference to Exhibit 4.5 of the Current Report on Form 8-K (File No. 001-38864) filed by the Company on December 22, 2020). |
4.6 | | Form of Depositary Receipt (included as Exhibit A to Exhibit 4.4) (incorporated by reference to Exhibit 4.6 of the Current Report on Form 8-K (File No. 001-38864) filed by the Company on December 22, 2020). |
4.7 | | Indenture, dated June 5, 2024, among the Company, the Guarantors therein and Wilmington Trust, National Association, as trustee and collateral agent (incorporated by reference to Exhibit 4.1 of the Current Report on Form 8-K (File No. 001-38864) filed by the Company on June 6, 2024). |
4.8 | | Form of 9.000% Senior Secured Second Lien Notes due 2029 (incorporated by reference to Exhibit 4.2 of the Current Report on Form 8-K (File No. 001-38864) filed by the Company on June 6, 2024). |
4.9 | | Registration Rights Agreement, dated April 8, 2019, by and among the Company, B. Riley Principal Sponsor Co., LLC and the Company’s independent directors (incorporated by reference to Exhibit 10.3 of the Current Report on Form 8-K (File No. 001-38864) filed by the Company on April 11, 2019). |
4.10 | | Registration Rights Agreement, dated February 14, 2020, by and among the Company and Ryan Greenawalt, Robert Chiles, Anthony Colucci, Craig Brubaker, Alan Hammersley, Richard Papalia, Paul Ivankovics and Jeremy Cionca (incorporated by reference to Exhibit 10.2 of the Form 8-A (File No. 001- 38864) filed by the Company on February 14, 2020). |
10.1 |
| Sixth Amendment to Sixth Amended and Restated ABL First Lien Credit Agreement, dated June 5, 2024, among the Company, the guarantors party thereto, the lenders party thereto, and JPMorgan Chase Bank, N.A., as Administrative Agent (incorporated by reference to Exhibit 10.2 of the Current Report on Form 8-K (File No. 001-38864) filed by the Company on June 6, 2024). |
10.2 | | Seventh Amendment to Sixth Amended and Restated Floor Plan First Lien Credit Agreement among the Company, the lenders party thereto, and JPMorgan Chase Bank, N.A., as Administrative Agent (incorporated by reference to Exhibit 10.3 of the Current Report on Form 8-K (File No. 001-38864) filed by the Company on June 6, 2024). |
10.3 | | Intercreditor Agreement, dated June 5, 2024, between JPMORGAN CHASE BANK, N.A., as Administrative Agent for the ABL First Lien Secured Parties, JPMorgan Chase Bank, N.A., as Administrative Agent for the Floor Plan First Lien Secured Parties, WILMINGTON TRUST, NATIONAL ASSOCIATION, as collateral agent for the Second Lien Secured Parties, and acknowledged by Alta Equipment Group Inc., Alta Equipment Holdings, Inc., Alta Enterprises, LLC, Alta Construction Equipment Illinois, LLC, Alta Heavy Equipment Services, LLC, Alta Industrial Equipment Michigan, LLC, Alta Construction Equipment, L.L.C., Alta Industrial Equipment Company, L.L.C., NITCO, LLC, Alta Construction Equipment Florida, LLC, Alta Industrial Equipment New York, LLC, Alta Construction Equipment New York, LLC, PeakLogix, LLC, Alta Construction Equipment Ohio, LLC, Alta Material Handling New York State, LLC, Alta Mine Services, LLC, Alta Kubota Michigan, LLC, Alta Construction Equipment New England, LLC, Alta Electric Vehicles Holding, LLC, Alta Electric Vehicles, LLC, Ginop Sales, Inc., A Alta Electric Vehicles South West, LLC, Alta Equipment Canada Holdings, Inc., Ecoverse, LLC, Alta Equipment Distribution, LLC, and Alta Construction Equipment Pennsylvania, LLC (incorporated by reference to Exhibit 10.1 of the Current Report on Form 8-K (File No. 001-38864) filed by the Company on June 6, 2024). |
10.4 | | Letter Agreement, dated April 8, 2019, by and among the Company, its officers, its directors and B. Riley Principal Sponsor Co., LLC (incorporated by reference to Exhibit 10.1 of the Current Report on Form 8-K (File No. 001-38864) filed by the Company on April 11, 2019). |
10.5 | | Forward Purchase Agreement, dated April 8, 2019, by and between the Company and B. Riley Principal Investments, LLC (incorporated by reference to Exhibit 10.5 of the Current Report on Form 8-K (File No. 001-38864) filed by the Company on April 11, 2019). |
10.6 | | Form of Securities Purchase Agreement (incorporated by reference to Exhibit 10.6 of the Current Report on Form 8-K (File No. 001-38864) filed by the Company on February 14, 2020). |
| | |
10.7 | | Amendment to Subscription Agreement, dated February 12, 2020, by and between the Company and B. Riley Principal Investments, LLC (incorporated by reference to Exhibit 10.7 of the Current Report on Form 8-K (File No. 001-38864) filed by the Company on February 14, 2020). |
10.8 | | Alta Equipment Group Inc. 2020 Omnibus Incentive Plan (incorporated by reference to Annex C to the Definitive Proxy Statement filed by the Company on January 23, 2020). |
10.9 | | Registration Side Letter — Howell Share Consideration (incorporated by reference to Exhibit 10.12 of the Registration Statement on Form S-1 (File No. 001-38864) filed by the Company on October 26, 2020). |
10.10 | | Underwriting Agreement, dated December 17, 2020, by and among Alta Equipment Group Inc. and B. Riley FBR, Inc., as representative of the several underwriters named therein (incorporated by reference to Exhibit 1.1 of the Current Report on Form 8-K (File No. 001-38864) filed by the Company on December 22, 2020). |
10.11 | | Form of Restricted Stock Unit Agreement (Employee) (incorporated by reference to Exhibit 10.11 on Form 10-Q (File No. 001-38864) filed by the Company on August 9, 2022) |
10.12 | | Form of Restricted Stock Unit Agreement (Non-Employee Director) (incorporated by reference to Exhibit 10.11 on Form 10-Q (File No. 001-38864) filed by the Company on August 9, 2022) |
10.13 | | Form of Performance Stock Unit Agreement (incorporated by reference to Exhibit 10.11 on Form 10-Q (File No. 001-38864) filed by the Company on August 9, 2022) |
10.14 | | Form of 2022 Restricted Stock Unit Agreement (Employee) (incorporated by reference to Exhibit 10.14 on Form 10-K (File No. 001-38864) filed by the Company on March 9, 2023). |
10.15 | | Company 2022 Employee Stock Purchase Plan (incorporated by reference to Exhibit 99.1 on Form S-8 (File No. 001-38864) filed by the Company on June 8, 2023). |
19.1* | | Policy Regarding Insider Trading and Dissemination of Inside Information |
21.1* | | Subsidiaries of the Company. |
22.1* | | Indenture Guarantors of the Company |
23.1* | | Consent of Deloitte & Touche LLP. |
24.1 | | Powers of Attorney (included on the signature page of this Annual Report on Form 10-K). |
31.1* | | Certification of Principal Executive Officer Pursuant to Rules 13a-14(a) and 15d-14(a) under the Securities Exchange Act of 1934, as Adopted Pursuant to Section 302 of the Sarbanes-Oxley Act of 2002. |
31.2* | | Certification of Principal Financial Officer Pursuant to Rules 13a-14(a) and 15d-14(a) under the Securities Exchange Act of 1934, as Adopted Pursuant to Section 302 of the Sarbanes-Oxley Act of 2002. |
32.1* | | Certification of Principal Executive Officer Pursuant to 18 U.S.C. Section 1350, as Adopted Pursuant to Section 906 of the Sarbanes-Oxley Act of 2002. |
32.2* | | Certification of Principal Financial Officer Pursuant to 18 U.S.C. Section 1350, as Adopted Pursuant to Section 906 of the Sarbanes-Oxley Act of 2002. |
97.1 | | Clawback Policy |
101.INS |
| Inline XBRL Instance Document |
101.SCH | | Inline XBRL Taxonomy Extension Schema Document |
104 | | Cover Page Interactive Data File (embedded within the Inline XBRL document) |
* Filed herewith.
Item 16. Form 10-K Summary
None.
SIGNATURES
Pursuant to the requirements of Section 13 or 15(d) of the Securities Exchange Act of 1934, as amended, the Registrant has duly caused this Report to be signed on its behalf by the undersigned, thereunto duly authorized.
| | | |
|
| ALTA EQUIPMENT GROUP INC. |
|
|
|
|
Date: March 5, 2025 |
| By: | /s/ Ryan Greenawalt |
|
|
| Ryan Greenawalt |
|
|
| Chief Executive Officer and Director |
Power of Attorney
KNOW ALL PERSONS BY THESE PRESENTS, that each person whose signature appears below constitutes and appoints Ryan Greenawalt and Anthony Colucci, jointly and severally, their attorneys-in-fact, each with the power of substitution, for him or her in any and all capacities, to sign any amendments to this Annual Report on Form 10-K, and to file the same, with exhibits thereto and other documents in connection therewith, with the Securities and Exchange Commission, hereby ratifying and confirming all that each of said attorneys-in-fact, or their substitute or substitutes, may do or cause to be done by virtue hereof.
Pursuant to the requirements of the Securities Exchange Act of 1934, as amended, this Report has been signed below by the following persons on behalf of the Registrant in the capacities and on the dates indicated.
| | | | |
Name | | Title | | Date |
| | | | |
/s/ Ryan Greenawalt | | Chief Executive Officer and Director | | March 5, 2025 |
Ryan Greenawalt | | (Principal Executive Officer) | | |
| | | | |
/s/ Anthony J. Colucci | | Chief Financial Officer | | March 5, 2025 |
Anthony J. Colucci | | (Principal Financial Officer and Principal Accounting Officer) | | |
| | | | |
/s/ Sidhartha Nair | | Director | | March 5, 2025 |
Sidhartha Nair | | | | |
| | | | |
/s/ Daniel Shribman | | Director | | March 5, 2025 |
Daniel Shribman | | | | |
| | | | |
/s/ Andrew Studdert | | Director | | March 5, 2025 |
Andrew Studdert | | | | |
| | | | |
/s/ Katherine White | | Director | | March 5, 2025 |
Katherine White | | | | |
| | | | |
/s/ Colin Wilson | | Director | | March 5, 2025 |
Colin Wilson | | | | |