Exhibit 99.2
FY 2019 Earnings Presentation March 25, 2020
FY 2019 Earnings Presentation | 2 II. CEO Overview III. CFO Overview IV. Appendices I. Introduction
FY 2019 Earnings Presentation | 3 Legal Disclaimers Forward - Looking Information This presentation includes “forward - looking statements” within the meaning of the “safe harbor” provisions of the Private Securities Litigation Reform Act of 1996 . Alta’s actual results may differ from their expectations, estimates and projections and consequently, you should not rely on these forward - looking statements as predictions of future events . Words such as “expect,” “estimate,” “project,” “budget,” “forecast,” “anticipate,” “intend,” “plan,” “may,” “will,” “could,” “should,” “believes,” “predicts,” “potential,” “continue,” and similar expressions are intended to identify such forward - looking statements . These forward - looking statements involve significant risks and uncertainties that could cause the actual results to differ materially from the expected results . Most of these factors are outside Alta’s control and are difficult to predict . Factors that may cause such differences include, but are not limited to : changes in applicable laws or regulations ; the possibility that Alta may be adversely affected by other economic, business, and/or competitive factors ; demand for Alta products and services ; Alta’s business strategy ; Alta’s financial strategy, operating cash flows, liquidity and capital required for Alta’s business ; Alta’s future revenue, income and operating performance ; the termination of relationships with major customers ; laws and regulations, including environmental regulations, that may increase Alta’s costs, limit the demand for its products and services or restrict its operations ; risks associated with the expansion of our business or our ability to integrate acquisitions ; disruptions in the political, regulatory, economic and social conditions domestically or internationally ; major public health issues, such as an outbreak of a pandemic or epidemic (such as the novel coronavirus COVID - 19 ), which could cause disruptions in our operations, supply chain, or workforce ; a failure of Alta’s information technology infrastructure or any significant breach of security ; potential uninsured claims and litigation against us ; Alta’s dependence on the continuing services of certain of Alta’s key managers and employees ; plans, objectives, expectations and intentions that are not historical ; and other risks and uncertainties identified in this presentation or indicated from time to time in the section entitled “Risk Factors” in Alta’s annual report on Form 10 - K and other filings with the U . S . Securities and Exchange Commission (the “SEC”) . Alta cautions that the foregoing list of factors is not exclusive and readers should not place undue reliance upon any forward - looking statements, which speak only as of the date made . Alta does not undertake or accept any obligation or undertaking to release publicly any updates or revisions to any forward - looking statements to reflect any change in its expectations or any change in events, conditions or circumstances on which any such statement is based . Non - GAAP Financial Measures This presentation includes non - GAAP financial measures, including Adjusted EBITDA, Economic EBIT, and free cash flow . Alta believes that these non - GAAP measures are useful to investors for two principal reasons . First, Alta believes these measures may assist investors in comparing performance over various reporting periods on a consistent basis by removing from operating results the impact of items that do not reflect core operating performance . Second, these measures are used by Alta’s management to assess its performance and may (subject to the limitations described below) enable investors to compare the performance of Alta to its competition . Alta believes that the use of these non - GAAP financial measures provides an additional tool for investors to use in evaluating ongoing operating results and trends . These non - GAAP measures should not be considered in isolation from, or as an alternative to, financial measures determined in accordance with GAAP . Other companies may calculate Adjusted EBITDA and free cash flow and other non - GAAP financial measures differently, and therefore Alta’s non - GAAP financial measures may not be directly comparable to similarly titled measures of other companies .
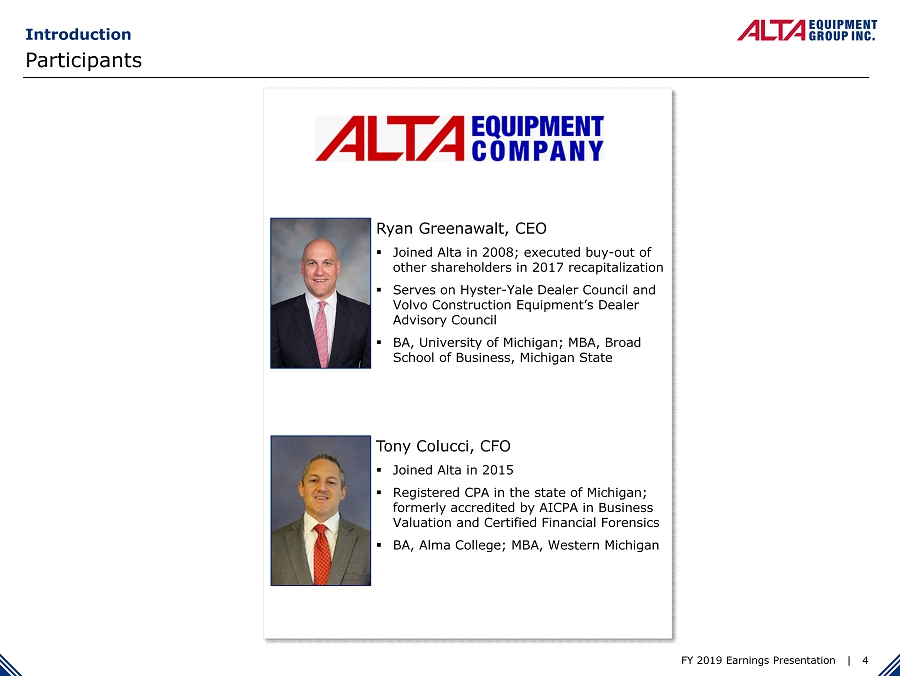
FY 2019 Earnings Presentation | 4 Participants Introduction Ryan Greenawalt, CEO ▪ Joined Alta in 2008; executed buy - out of other shareholders in 2017 recapitalization ▪ Serves on Hyster - Yale Dealer Council and Volvo Construction Equipment’s Dealer Advisory Council ▪ BA, University of Michigan; MBA, Broad School of Business, Michigan State Tony Colucci, CFO ▪ Joined Alta in 2015 ▪ Registered CPA in the state of Michigan; formerly accredited by AICPA in Business Valuation and Certified Financial Forensics ▪ BA, Alma College; MBA, Western Michigan
FY 2019 Earnings Presentation | 5 II. CEO Overview III. CFO Overview IV. Appendices I. Introduction
FY 2019 Earnings Presentation | 6 Recent Operating Highlights Support Growth Strategy CEO Overview Partner of Choice in a Consolidating Equipment Dealer Market – Strategic Acquisitions Scales Operations ▪ NITCO (5/1/19) – Geographic expansion to New England; designated as preferred further consolidator by Hyster - Yale ▪ Liftech (2/14/20) – Increased Industrial market presence in Upstate New York and Vermont ▪ Flagler (2/14/20) – Established Construction Equipment (“CE”) operations in Florida market; large opportunity to add technicians Business Combination with B. Riley Principal Merger Corp. (2/14/20) ▪ Began trading on NYSE as stand - alone entity under “ALTG” (2/18/20) ▪ Improved liquidity, restructured debt and raised capital provides financial flexibility FY 2019 Financial Highlights ▪ Reported net revenue growth of 35% to $557MM, Adj. EBITDA up 37% to $74.0MM and PF Adj. EBITDA of $94.4MM in FY 2019 ▪ Pro Forma for 12 months of NITCO contribution, achieved net revenue of approx. $603 million

FY 2019 Earnings Presentation | 7 Recent Operating Highlights Support Growth Strategy (cont.) CEO Overview Drive Aftermarket Parts Sales & Services Business ▪ Significantly increased field population to total fleet generates solid recurring revenue base ▪ Skilled labor workforce represents nearly half of our 1,700 employees in 43 locations across 10 states ▪ Parts sales and Service revenue streams grew 35% and 51%, respectively in FY 2019 Well Positioned to Drive Long Term Growth ▪ Well capitalized to drive value through accretive acquisitions ▪ Track record of stable performance in down market cycles ▪ Business contingency plans in place for evolving macro environment
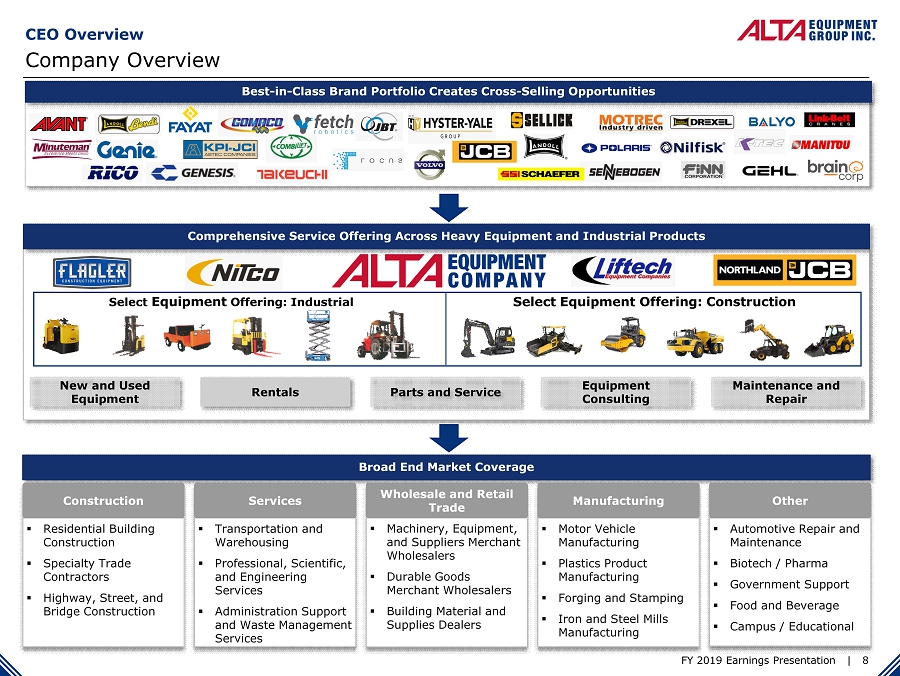
FY 2019 Earnings Presentation | 8 Company Overview Broad End Market Coverage ▪ Residential Building Construction ▪ Specialty Trade Contractors ▪ Highway, Street, and Bridge Construction Construction ▪ Transportation and Warehousing ▪ Professional, Scientific, and Engineering Services ▪ Administration Support and Waste Management Services Services ▪ Automotive Repair and Maintenance ▪ Biotech / Pharma ▪ Government Support ▪ Food and Beverage ▪ Campus / Educational Other ▪ Motor Vehicle Manufacturing ▪ Plastics Product Manufacturing ▪ Forging and Stamping ▪ Iron and Steel Mills Manufacturing Manufacturing ▪ Machinery, Equipment, and Suppliers Merchant Wholesalers ▪ Durable Goods Merchant Wholesalers ▪ Building Material and Supplies Dealers Wholesale and Retail Trade Comprehensive Service Offering Across Heavy Equipment and Industrial Products New and Used Equipment Rentals Parts and Service Equipment Consulting Maintenance and Repair Select Equipment Offering: Industrial Select Equipment Offering: Construction Best - in - Class Brand Portfolio Creates Cross - Selling Opportunities CEO Overview
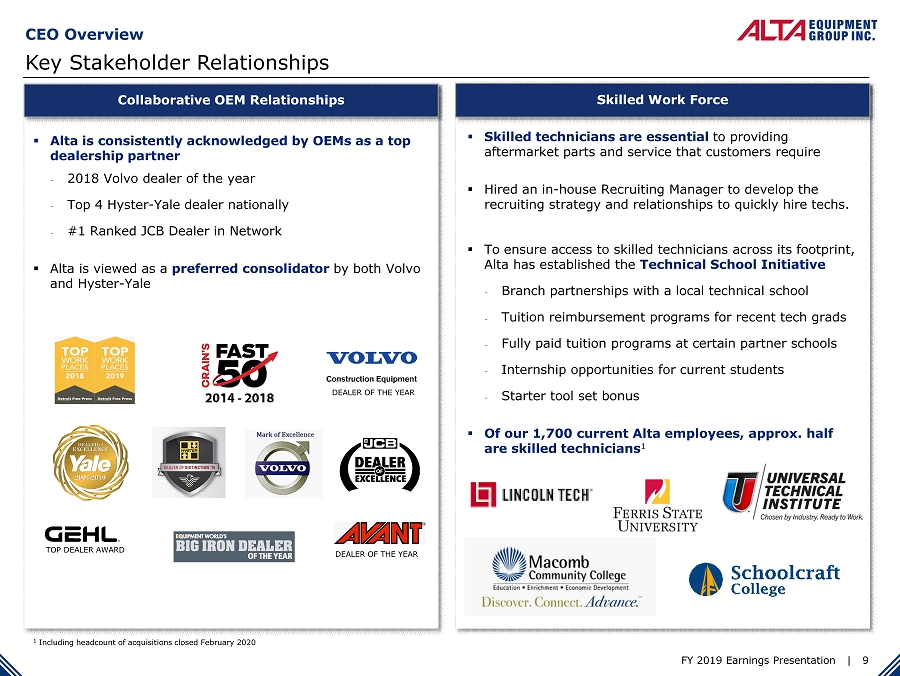
FY 2019 Earnings Presentation | 9 Key Stakeholder Relationships Skilled Work Force ▪ Alta is consistently acknowledged by OEMs as a top dealership partner - 2018 Volvo dealer of the year - Top 4 Hyster - Yale dealer nationally - #1 Ranked JCB Dealer in Network ▪ Alta is viewed as a preferred consolidator by both Volvo and Hyster - Yale Collaborative OEM Relationships CEO Overview ▪ Skilled technicians are essential to providing aftermarket parts and service that customers require ▪ Hired an in - house Recruiting Manager to develop the recruiting strategy and relationships to quickly hire techs. ▪ To ensure access to skilled technicians across its footprint, Alta has established the Technical School Initiative - Branch partnerships with a local technical school - Tuition reimbursement programs for recent tech grads - Fully paid tuition programs at certain partner schools - Internship opportunities for current students - Starter tool set bonus ▪ Of our 1,700 current Alta employees, approx. half are skilled technicians 1 1 Including headcount of acquisitions closed February 2020 DEALER OF THE YEAR TOP DEALER AWARD DEALER OF THE YEAR
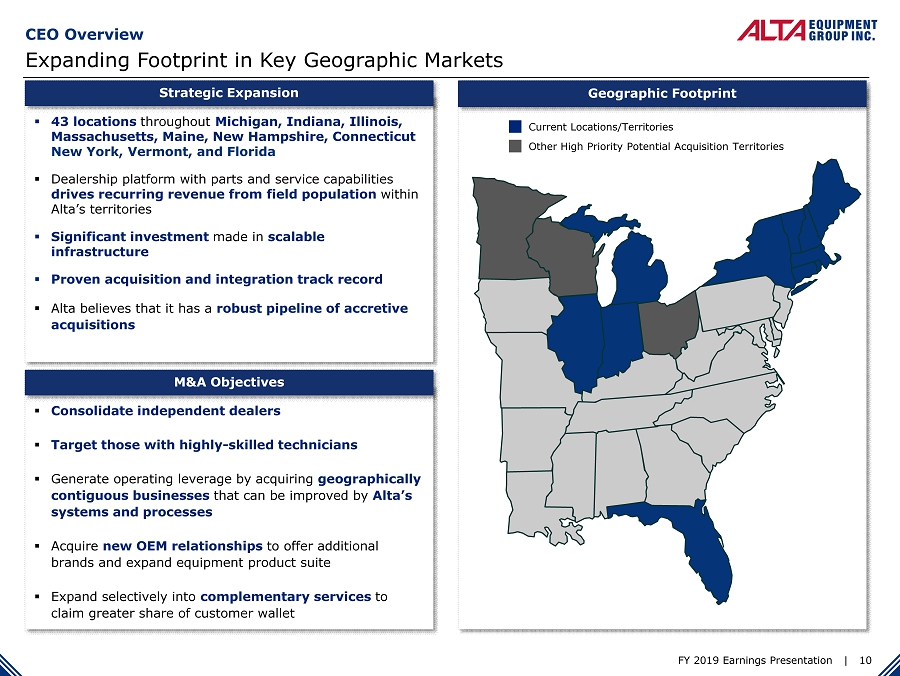
FY 2019 Earnings Presentation | 10 Expanding Footprint in Key Geographic Markets Geographic Footprint ▪ 43 locations throughout Michigan, Indiana, Illinois, Massachusetts, Maine, New Hampshire, Connecticut New York, Vermont, and Florida ▪ Dealership platform with parts and service capabilities drives recurring revenue from field population within Alta’s territories ▪ Significant investment made in scalable infrastructure ▪ Proven acquisition and integration track record ▪ Alta believes that it has a robust pipeline of accretive acquisitions Strategic Expansion Current Locations/Territories Other High Priority Potential Acquisition Territories ▪ Consolidate independent dealers ▪ Target those with highly - skilled technicians ▪ Generate operating leverage by acquiring geographically contiguous businesses that can be improved by Alta’s systems and processes ▪ Acquire new OEM relationships to offer additional brands and expand equipment product suite ▪ Expand selectively into complementary services to claim greater share of customer wallet M&A Objectives CEO Overview
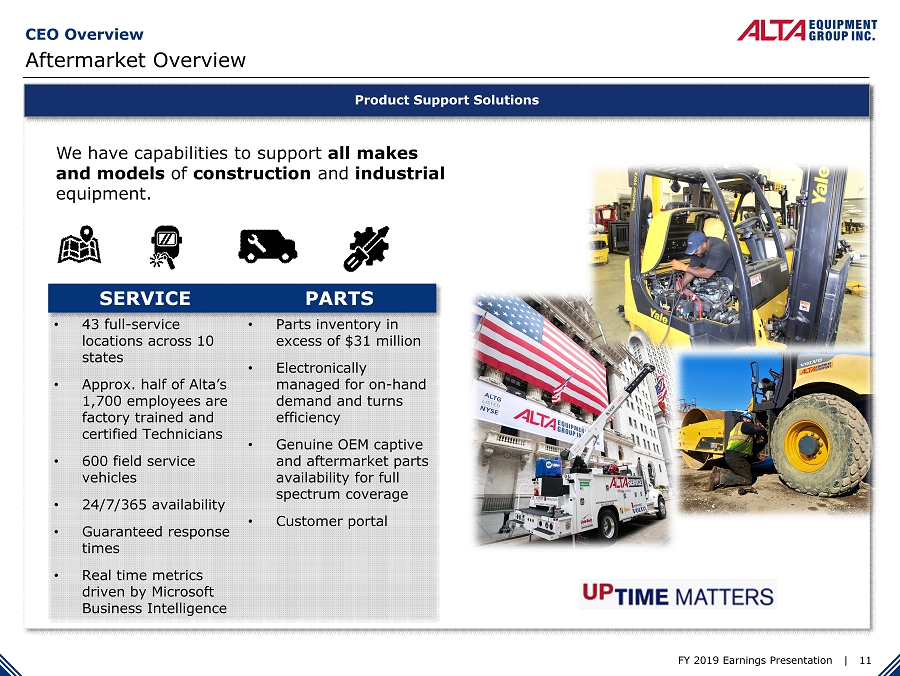
FY 2019 Earnings Presentation | 11 Aftermarket Overview CEO Overview Product Support Solutions SERVICE PARTS • 43 full - service locations across 10 states • Approx. half of Alta’s 1,700 employees are factory trained and certified Technicians • 600 field service vehicles • 24/7/365 availability • Guaranteed response times • Real time metrics driven by Microsoft Business Intelligence • Parts inventory in excess of $31 million • Electronically managed for on - hand demand and turns efficiency • Genuine OEM captive and aftermarket parts availability for full spectrum coverage • Customer portal We have capabilities to support all makes and models of construction and industrial equipment.
FY 2019 Earnings Presentation | 12 II. CEO Overview III. CFO Overview IV. Appendices I. Introduction
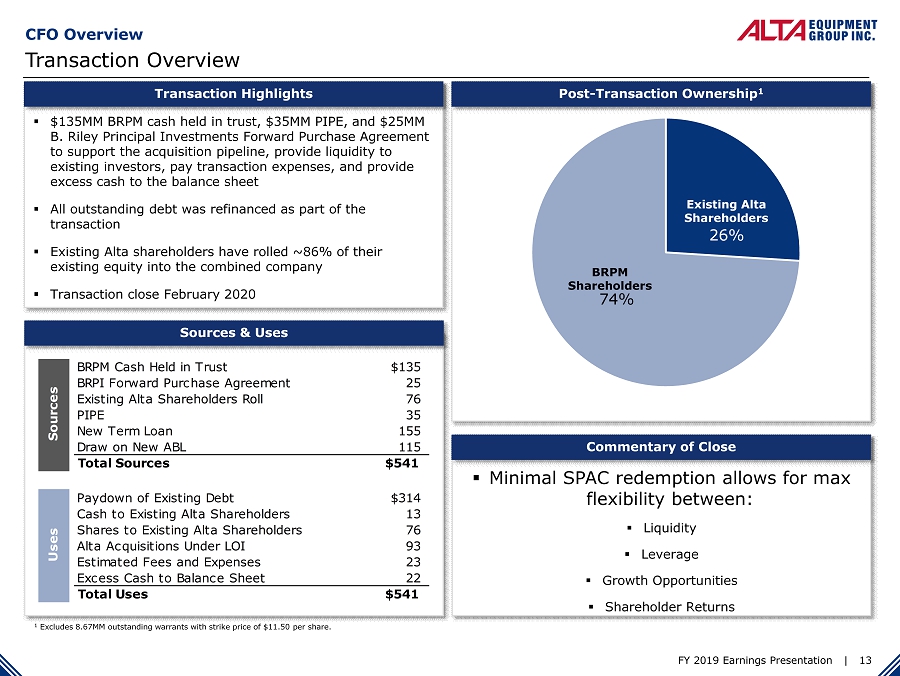
FY 2019 Earnings Presentation | 13 CFO Overview Transaction Overview ▪ $135MM BRPM cash held in trust, $35MM PIPE, and $25MM B. Riley Principal Investments Forward Purchase Agreement to support the acquisition pipeline, provide liquidity to existing investors, pay transaction expenses, and provide excess cash to the balance sheet ▪ All outstanding debt was refinanced as part of the transaction ▪ Existing Alta shareholders have rolled ~86% of their existing equity into the combined company ▪ Transaction close February 2020 Transaction Highlights Post - Transaction Ownership 1 Sources & Uses ▪ Minimal SPAC redemption allows for max flexibility between: ▪ Liquidity ▪ Leverage ▪ Growth Opportunities ▪ Shareholder Returns Commentary of Close 26% 74% 1 Excludes 8.67MM outstanding warrants with strike price of $11.50 per share. Existing Alta Shareholders BRPM Shareholders BRPM Cash Held in Trust $135 BRPI Forward Purchase Agreement 25 Existing Alta Shareholders Roll 76 PIPE 35 New Term Loan 155 Draw on New ABL 115 Total Sources $541 Paydown of Existing Debt $314 Cash to Existing Alta Shareholders 13 Shares to Existing Alta Shareholders 76 Alta Acquisitions Under LOI 93 Estimated Fees and Expenses 23 Excess Cash to Balance Sheet 22 Total Uses $541 Sources Uses
FY 2019 Earnings Presentation | 14 CFO Overview 2019 Financial Summary 2019 Summary ▪ Organic revenue growth in both sales and product support departments across all geographic APR’s, including NITCO region ▪ Total Revenues increased by 35.0%, or $144.4 million, to $557.4 million ▪ Including 12 months of NITCO contribution, net revenue was approximately $603 million ▪ Gross Profit increased 38.1%, or $42.0 million with +0.6% in overall margin, to $152.1 million ▪ 2019 Adjusted EBITDA of $74.0 million; adjusting for a full year of NITCO activity (acquired May 2019), and removing for certain one - time and non - cash charges in relation to acquisitions and public company readiness projects Segment Performance ▪ Industrial segment remains highly cash flow generative as it benefits from a mature field population ▪ $29 million of Economic EBIT 1 in 2019, 78% of Industrial Adjusted EBITDA ▪ >60% of Gross Profit generated from product support departments ▪ Construction segment growth and maturation ▪ Year - over - year ~33% growth in product support revenue ▪ Year - over - year ~28% growth in rental revenue yielding better dollar utilization 2019 M&A ▪ NITCO Acquisition ▪ ~$66 million purchase price (includes ~$25 in New floor plan inventory) ▪ 2018 Revenue and Adjusted EBITDA of $126 million and $15 million, respectively Financial Summary 1 Economic EBIT is a non - GAAP measure management defines as Adj. EBITDA less gains from rental equipment sales less net maintenan ce capital expenditure
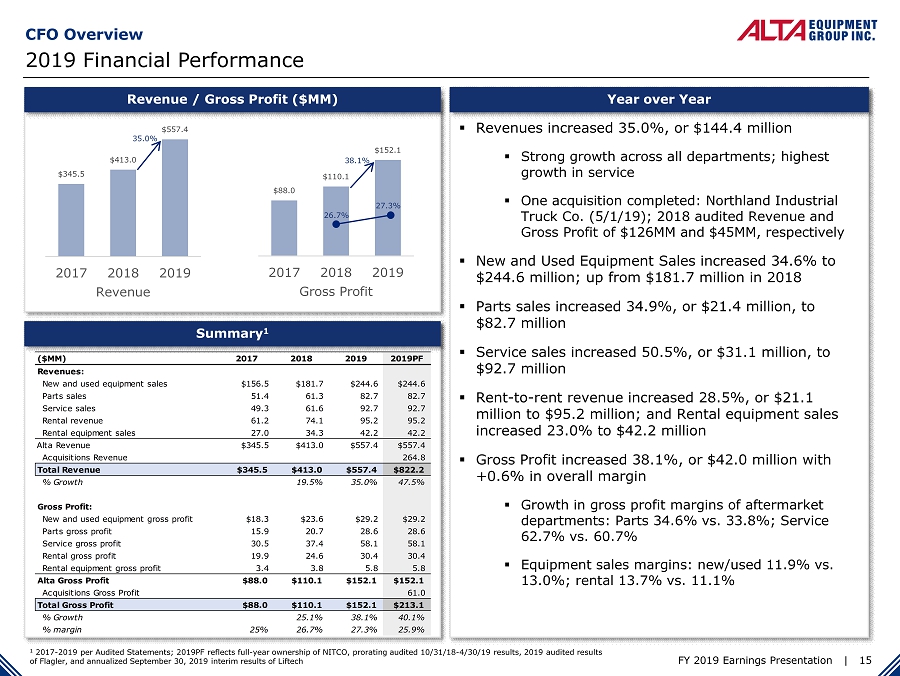
FY 2019 Earnings Presentation | 15 CFO Overview 2019 Financial Performance ▪ Revenues increased 35.0%, or $144.4 million ▪ Strong growth across all departments; highest growth in service ▪ One acquisition completed: Northland Industrial Truck Co. (5/1/19); 2018 audited Revenue and Gross Profit of $126MM and $45MM, respectively ▪ New and Used Equipment Sales increased 34.6% to $244.6 million; up from $181.7 million in 2018 ▪ Parts sales increased 34.9%, or $21.4 million, to $82.7 million ▪ Service sales increased 50.5%, or $31.1 million, to $92.7 million ▪ Rent - to - rent revenue increased 28.5%, or $21.1 million to $95.2 million; and Rental equipment sales increased 23.0% to $42.2 million ▪ Gross Profit increased 38.1%, or $42.0 million with +0.6% in overall margin ▪ Growth in gross profit margins of aftermarket departments: Parts 34.6% vs. 33.8%; Service 62.7% vs. 60.7% ▪ Equipment sales margins: new/used 11.9% vs. 13.0%; rental 13.7% vs. 11.1% Year over Year 1 2017 - 2019 per Audited Statements; 2019PF reflects full - year ownership of NITCO, prorating audited 10/31/18 - 4/30/19 results, 201 9 audited results of Flagler, and annualized September 30, 2019 interim results of Liftech Summary 1 Revenue / Gross Profit ($MM) $345.5 $413.0 $557.4 2017 2018 2019 Revenue $88.0 $110.1 $152.1 2017 2018 2019 Gross Profit 38.1% 26.7% 27.3% 35.0% ($MM) 2017 2018 2019 2019PF Revenues: New and used equipment sales $156.5 $181.7 $244.6 $244.6 Parts sales 51.4 61.3 82.7 82.7 Service sales 49.3 61.6 92.7 92.7 Rental revenue 61.2 74.1 95.2 95.2 Rental equipment sales 27.0 34.3 42.2 42.2 Alta Revenue $345.5 $413.0 $557.4 $557.4 Acquisitions Revenue 264.8 Total Revenue $345.5 $413.0 $557.4 $822.2 % Growth 19.5% 35.0% 47.5% Gross Profit: New and used equipment gross profit $18.3 $23.6 $29.2 $29.2 Parts gross profit 15.9 20.7 28.6 28.6 Service gross profit 30.5 37.4 58.1 58.1 Rental gross profit 19.9 24.6 30.4 30.4 Rental equipment gross profit 3.4 3.8 5.8 5.8 Alta Gross Profit $88.0 $110.1 $152.1 $152.1 Acquisitions Gross Profit 61.0 Total Gross Profit $88.0 $110.1 $152.1 $213.1 % Growth 25.1% 38.1% 40.1% % margin 25% 26.7% 27.3% 25.9%
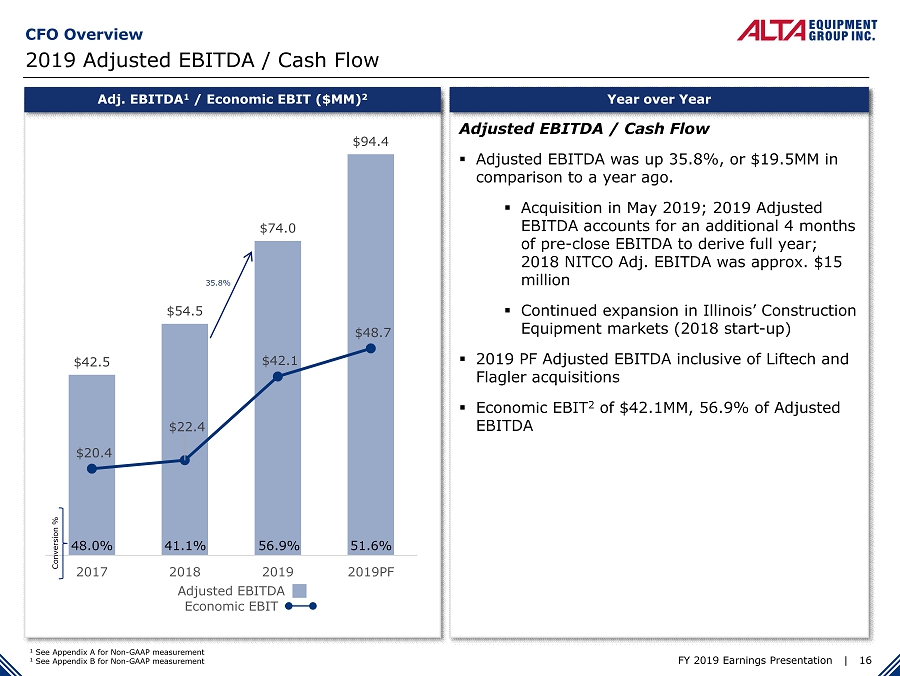
FY 2019 Earnings Presentation | 16 CFO Overview 2019 Adjusted EBITDA / Cash Flow Adjusted EBITDA / Cash Flow ▪ Adjusted EBITDA was up 35.8%, or $19.5MM in comparison to a year ago. ▪ Acquisition in May 2019; 2019 Adjusted EBITDA accounts for an additional 4 months of pre - close EBITDA to derive full year; 2018 NITCO Adj. EBITDA was approx. $15 million ▪ Continued expansion in Illinois’ Construction Equipment markets (2018 start - up) ▪ 2019 PF Adjusted EBITDA inclusive of Liftech and Flagler acquisitions ▪ Economic EBIT 2 of $42.1MM, 56.9% of Adjusted EBITDA Year over Year 1 See Appendix A for Non - GAAP measurement 1 See Appendix B for Non - GAAP measurement Adj. EBITDA 1 / Economic EBIT ($MM) 2 $42.5 $54.5 $74.0 $94.4 $20.4 $22.4 $42.1 $48.7 2017 2018 2019 2019PF Adjusted EBITDA Economic EBIT 35.8% 48.0% 41.1% 56.9% 51.6% Conversion %
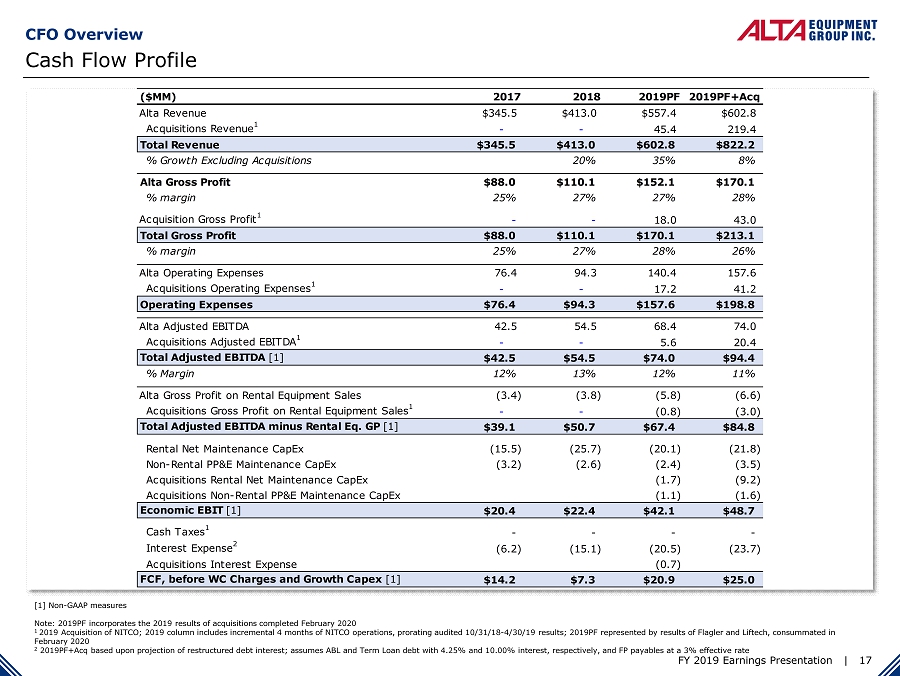
FY 2019 Earnings Presentation | 17 Cash Flow Profile CFO Overview [1] Non - GAAP measures Note: 2019PF incorporates the 2019 results of acquisitions completed February 2020 1 2019 Acquisition of NITCO; 2019 column includes incremental 4 months of NITCO operations, prorating audited 10/31/18 - 4/30/19 res ults; 2019PF represented by results of Flagler and Liftech, consummated in February 2020 2 2019PF+Acq based upon projection of restructured debt interest; assumes ABL and Term Loan debt with 4.25% and 10.00% interest , respectively, and FP payables at a 3% effective rate ($MM) 2017 2018 2019PF 2019PF+Acq Alta Revenue $345.5 $413.0 $557.4 $602.8 Acquisitions Revenue 1 - - 45.4 219.4 Total Revenue $345.5 $413.0 $602.8 $822.2 % Growth Excluding Acquisitions 20% 35% 8% Alta Gross Profit $88.0 $110.1 $152.1 $170.1 % margin 25% 27% 27% 28% Acquisition Gross Profit 1 - - 18.0 43.0 Total Gross Profit $88.0 $110.1 $170.1 $213.1 % margin 25% 27% 28% 26% Alta Operating Expenses 76.4 94.3 140.4 157.6 Acquisitions Operating Expenses 1 - - 17.2 41.2 Operating Expenses $76.4 $94.3 $157.6 $198.8 Alta Adjusted EBITDA 42.5 54.5 68.4 74.0 Acquisitions Adjusted EBITDA 1 - - 5.6 20.4 Total Adjusted EBITDA [1] $42.5 $54.5 $74.0 $94.4 % Margin 12% 13% 12% 11% Alta Gross Profit on Rental Equipment Sales (3.4) (3.8) (5.8) (6.6) Acquisitions Gross Profit on Rental Equipment Sales 1 - - (0.8) (3.0) Total Adjusted EBITDA minus Rental Eq. GP [1] $39.1 $50.7 $67.4 $84.8 Rental Net Maintenance CapEx (15.5) (25.7) (20.1) (21.8) Non-Rental PP&E Maintenance CapEx (3.2) (2.6) (2.4) (3.5) Acquisitions Rental Net Maintenance CapEx (1.7) (9.2) Acquisitions Non-Rental PP&E Maintenance CapEx (1.1) (1.6) Economic EBIT [1] $20.4 $22.4 $42.1 $48.7 Cash Taxes 1 - - - - Interest Expense 2 (6.2) (15.1) (20.5) (23.7) Acquisitions Interest Expense (0.7) FCF, before WC Charges and Growth Capex [1] $14.2 $7.3 $20.9 $25.0
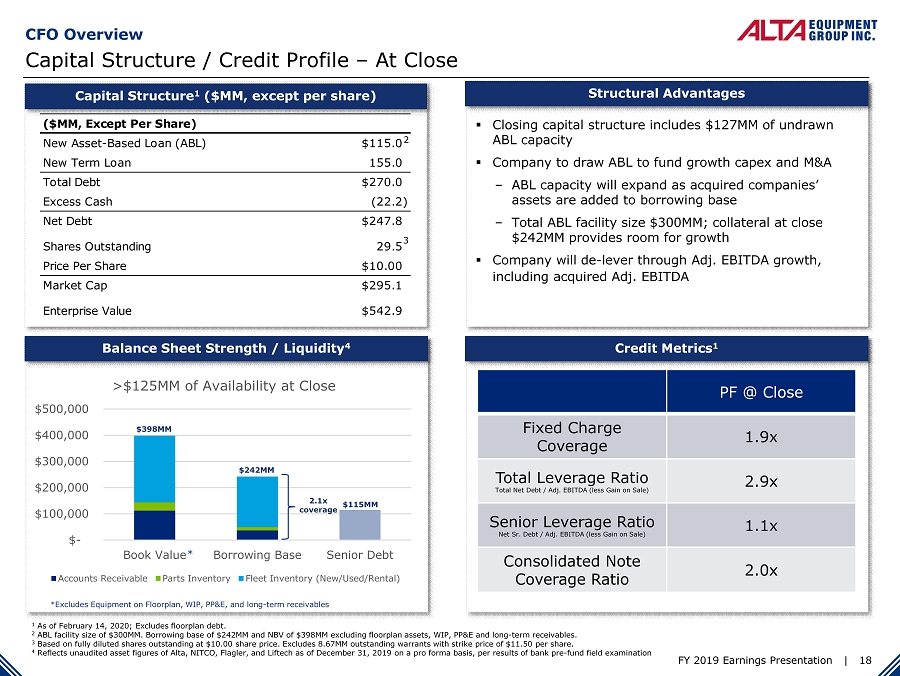
FY 2019 Earnings Presentation | 18 Capital Structure / Credit Profile – At Close CFO Overview Capital Structure 1 ($MM, except per share) ▪ Closing capital structure includes $127MM of undrawn ABL capacity ▪ Company to draw ABL to fund growth capex and M&A ‒ ABL capacity will expand as acquired companies’ assets are added to borrowing base ‒ Total ABL facility size $300MM; collateral at close $242MM provides room for growth ▪ Company will de - lever through Adj. EBITDA growth, including acquired Adj. EBITDA Structural Advantages Credit Metrics 1 Balance Sheet Strength / Liquidity 4 1 As of February 14, 2020; Excludes floorplan debt. 2 ABL facility size of $300MM. Borrowing base of $242MM and NBV of $398MM excluding floorplan assets, WIP, PP&E and long - term rec eivables. 3 Based on fully diluted shares outstanding at $10.00 share price. Excludes 8.67MM outstanding warrants with strike price of $1 1. 50 per share. 4 Reflects unaudited asset figures of Alta, NITCO, Flagler, and Liftech as of December 31, 2019 on a pro forma basis, per resul ts of bank pre - fund field examination 3 2 PF @ Close Fixed Charge Coverage 1.9x Total Leverage Ratio Total Net Debt / Adj. EBITDA (less Gain on Sale) 2.9x Senior Leverage Ratio Net Sr. Debt / Adj. EBITDA (less Gain on Sale) 1.1x Consolidated Note Coverage Ratio 2.0x $- $100,000 $200,000 $300,000 $400,000 $500,000 Book Value Borrowing Base Senior Debt >$125MM of Availability at Close Accounts Receivable Parts Inventory Fleet Inventory (New/Used/Rental) $398MM $242MM $115MM 2.1x coverage *Excludes Equipment on Floorplan, WIP, PP&E, and long - term receivables * ($MM, Except Per Share) New Asset-Based Loan (ABL) $115.0 New Term Loan 155.0 Total Debt $270.0 Excess Cash (22.2) Net Debt $247.8 Shares Outstanding 29.5 Price Per Share $10.00 Market Cap $295.1 Enterprise Value $542.9
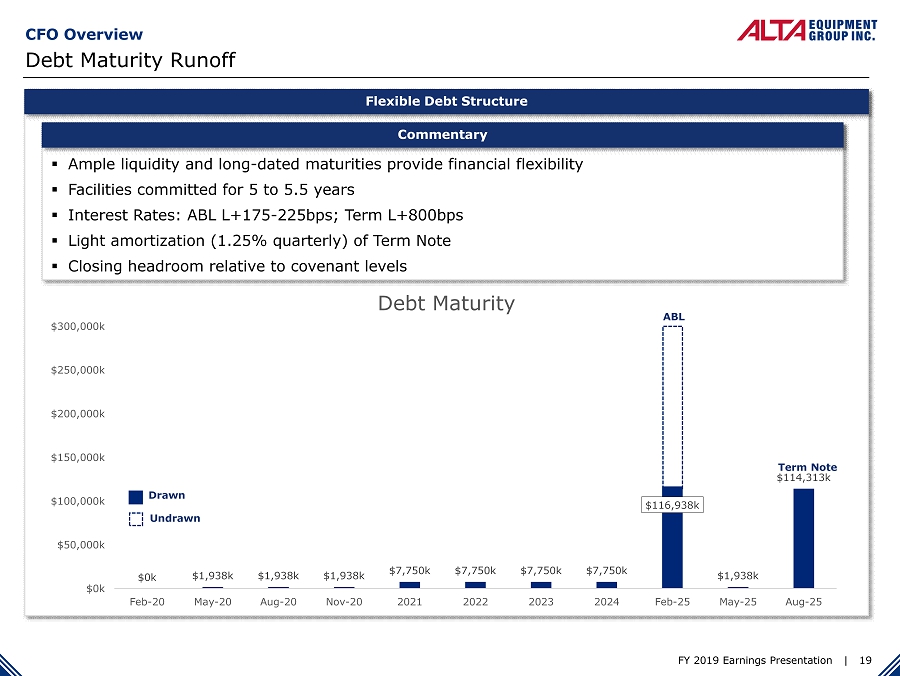
FY 2019 Earnings Presentation | 19 CFO Overview Debt Maturity Runoff Flexible Debt Structure ▪ Ample liquidity and long - dated maturities provide financial flexibility ▪ Facilities committed for 5 to 5.5 years ▪ Interest Rates: ABL L+175 - 225bps; Term L+800bps ▪ Light amortization (1.25% quarterly) of Term Note ▪ Closing headroom relative to covenant levels Commentary $0k $1,938k $1,938k $1,938k $7,750k $7,750k $7,750k $7,750k $116,938k $1,938k $114,313k $0k $50,000k $100,000k $150,000k $200,000k $250,000k $300,000k Feb-20 May-20 Aug-20 Nov-20 2021 2022 2023 2024 Feb-25 May-25 Aug-25 Debt Maturity Drawn Undrawn ABL Term Note
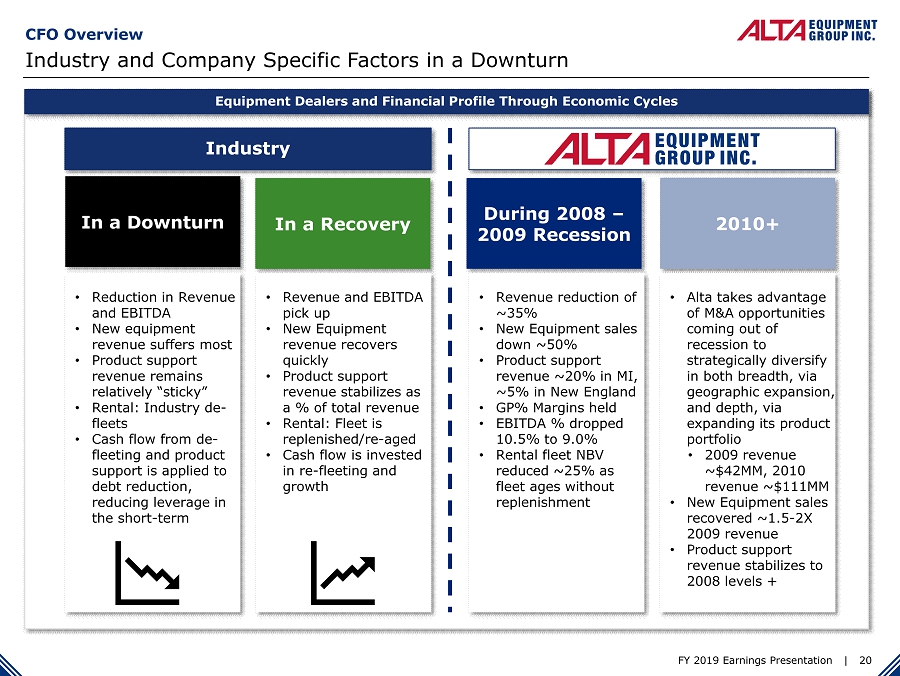
FY 2019 Earnings Presentation | 20 Industry and Company Specific Factors in a Downturn CFO Overview Equipment Dealers and Financial Profile Through Economic Cycles In a Downturn In a Recovery During 2008 – 2009 Recession 2010+ • Reduction in Revenue and EBITDA • New equipment revenue suffers most • Product support revenue remains relatively “sticky” • Rental: Industry de - fleets • Cash flow from de - fleeting and product support is applied to debt reduction, reducing leverage in the short - term • Revenue and EBITDA pick up • New Equipment revenue recovers quickly • Product support revenue stabilizes as a % of total revenue • Rental: Fleet is replenished/re - aged • Cash flow is invested in re - fleeting and growth • Revenue reduction of ~35% • New Equipment sales down ~50% • Product support revenue ~20% in MI, ~5% in New England • GP% Margins held • EBITDA % dropped 10.5% to 9.0% • Rental fleet NBV reduced ~25% as fleet ages without replenishment • Alta takes advantage of M&A opportunities coming out of recession to strategically diversify in both breadth, via geographic expansion, and depth, via expanding its product portfolio • 2009 revenue ~$42MM, 2010 revenue ~$111MM • New Equipment sales recovered ~1.5 - 2X 2009 revenue • Product support revenue stabilizes to 2008 levels + Industry Industry

FY 2019 Earnings Presentation | 21 Capital Allocation CFO Overview Long Term Capital Allocation Strategy ▪ Target leverage range 2.5x - 3.5x ▪ Net leverage of 2.9x at close ▪ Credit ratings of BB - by Egan Jones ▪ No significant debt maturities until 2025 ▪ Continued organic investments to support growth and boost productivity / efficiency ▪ Add branches strategically to enhance customer service capabilities ▪ Growth in rental fleet to enhance installed base and eventual aftermarket yield ▪ Prioritize strategic opportunities to grow the Alta footprint into dense population centers with major OEMs ▪ Be opportunistic regarding synergistic in - fill deals and M&A partners that enhance Alta’s service offerings ▪ Long term objective is to pay a consistent dividend ▪ Recently announced stock buyback program is currently halted Leverage Utilization Merger & Acquisition Strategy Organic Operations Returns to Stockholders NYSE:ALTG
FY 2019 Earnings Presentation | 22 II. CEO Overview III. CFO Overview IV. Appendices I. Introduction
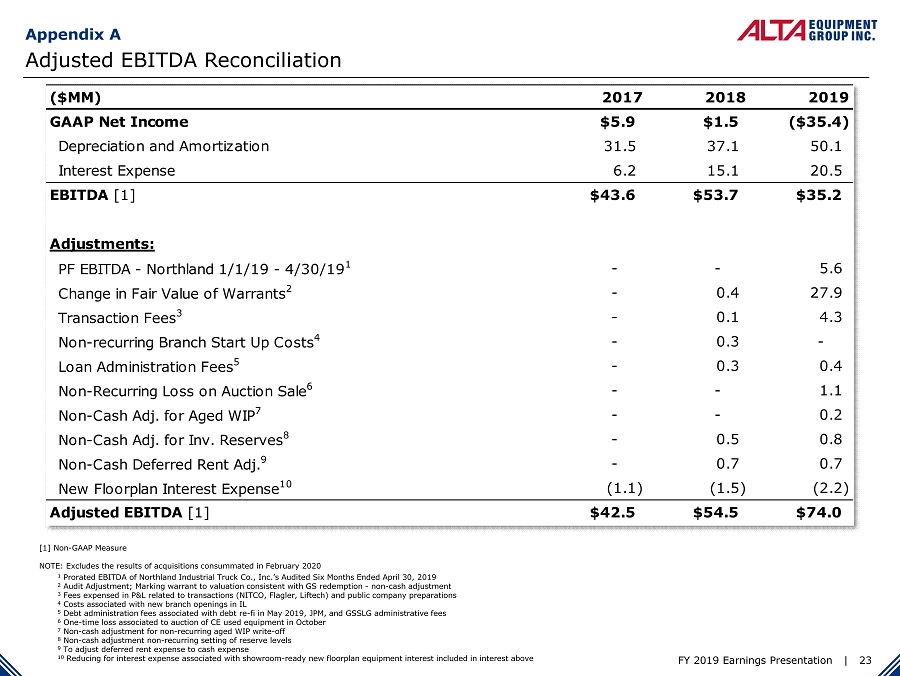
FY 2019 Earnings Presentation | 23 Adjusted EBITDA Reconciliation Appendix A [1] Non - GAAP Measure NOTE: Excludes the results of acquisitions consummated in February 2020 1 Prorated EBITDA of Northland Industrial Truck Co., Inc.’s Audited Six Months Ended April 30, 2019 2 Audit Adjustment; Marking warrant to valuation consistent with GS redemption - non - cash adjustment 3 Fees expensed in P&L related to transactions (NITCO, Flagler, Liftech) and public company preparations 4 Costs associated with new branch openings in IL 5 Debt administration fees associated with debt re - fi in May 2019, JPM, and GSSLG administrative fees 6 One - time loss associated to auction of CE used equipment in October 7 Non - cash adjustment for non - recurring aged WIP write - off 8 Non - cash adjustment non - recurring setting of reserve levels 9 To adjust deferred rent expense to cash expense 10 Reducing for interest expense associated with showroom - ready new floorplan equipment interest included in interest above ($MM) 2017 2018 2019 GAAP Net Income $5.9 $1.5 ($35.4) Depreciation and Amortization 31.5 37.1 50.1 Interest Expense 6.2 15.1 20.5 EBITDA [1] $43.6 $53.7 $35.2 Adjustments: PF EBITDA - Northland 1/1/19 - 4/30/19 1 - - 5.6 Change in Fair Value of Warrants 2 - 0.4 27.9 Transaction Fees 3 - 0.1 4.3 Non-recurring Branch Start Up Costs 4 - 0.3 - Loan Administration Fees 5 - 0.3 0.4 Non-Recurring Loss on Auction Sale 6 - - 1.1 Non-Cash Adj. for Aged WIP 7 - - 0.2 Non-Cash Adj. for Inv. Reserves 8 - 0.5 0.8 Non-Cash Deferred Rent Adj. 9 - 0.7 0.7 New Floorplan Interest Expense 10 (1.1) (1.5) (2.2) Adjusted EBITDA [1] $42.5 $54.5 $74.0
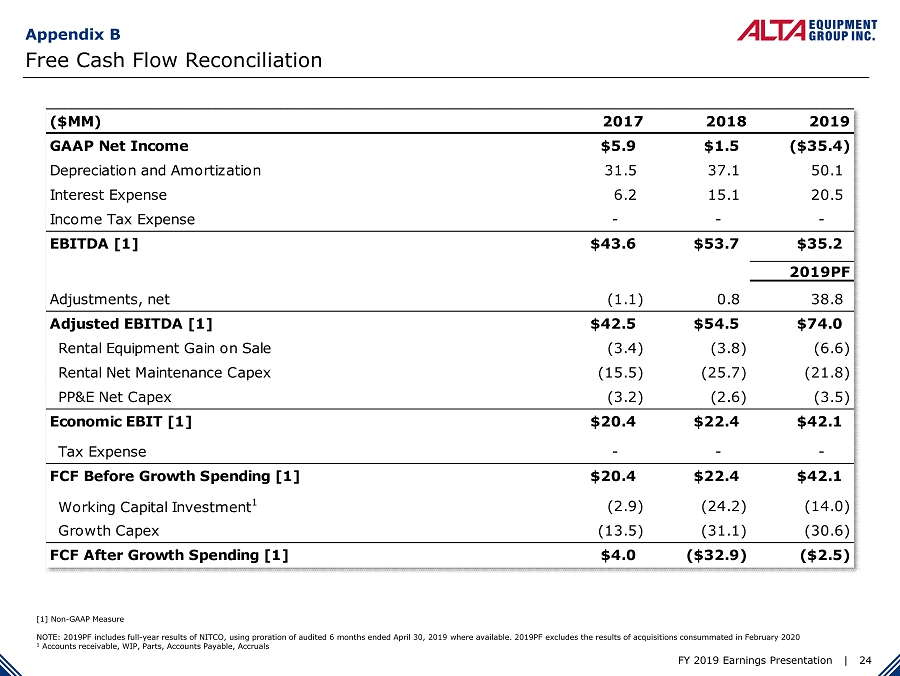
FY 2019 Earnings Presentation | 24 Free Cash Flow Reconciliation Appendix B [1] Non - GAAP Measure NOTE: 2019PF includes full - year results of NITCO, using proration of audited 6 months ended April 30, 2019 where available. 2019 PF excludes the results of acquisitions consummated in February 2020 1 Accounts receivable, WIP, Parts, Accounts Payable, Accruals ($MM) 2017 2018 2019 GAAP Net Income $5.9 $1.5 ($35.4) Depreciation and Amortization 31.5 37.1 50.1 Interest Expense 6.2 15.1 20.5 Income Tax Expense - - - EBITDA [1] $43.6 $53.7 $35.2 2019PF Adjustments, net (1.1) 0.8 38.8 Adjusted EBITDA [1] $42.5 $54.5 $74.0 Rental Equipment Gain on Sale (3.4) (3.8) (6.6) Rental Net Maintenance Capex (15.5) (25.7) (21.8) PP&E Net Capex (3.2) (2.6) (3.5) Economic EBIT [1] $20.4 $22.4 $42.1 Tax Expense - - - FCF Before Growth Spending [1] $20.4 $22.4 $42.1 Working Capital Investment 1 (2.9) (24.2) (14.0) Growth Capex (13.5) (31.1) (30.6) FCF After Growth Spending [1] $4.0 ($32.9) ($2.5)
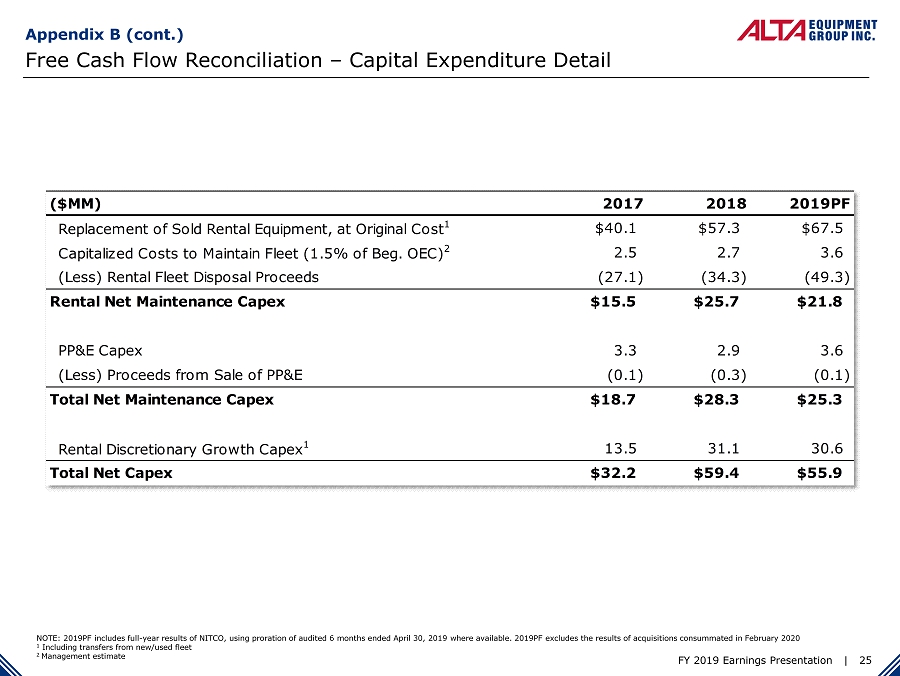
FY 2019 Earnings Presentation | 25 Free Cash Flow Reconciliation – Capital Expenditure Detail Appendix B (cont.) NOTE: 2019PF includes full - year results of NITCO, using proration of audited 6 months ended April 30, 2019 where available. 2019 PF excludes the results of acquisitions consummated in February 2020 1 Including transfers from new/used fleet 2 Management estimate ($MM) 2017 2018 2019PF Replacement of Sold Rental Equipment, at Original Cost 1 $40.1 $57.3 $67.5 Capitalized Costs to Maintain Fleet (1.5% of Beg. OEC) 2 2.5 2.7 3.6 (Less) Rental Fleet Disposal Proceeds (27.1) (34.3) (49.3) Rental Net Maintenance Capex $15.5 $25.7 $21.8 PP&E Capex 3.3 2.9 3.6 (Less) Proceeds from Sale of PP&E (0.1) (0.3) (0.1) Total Net Maintenance Capex $18.7 $28.3 $25.3 Rental Discretionary Growth Capex 1 13.5 31.1 30.6 Total Net Capex $32.2 $59.4 $55.9