| SPECIAL COMMITTEE DISCUSSION MATERIALS CONFIDENTIAL 12 JUNE 2023 Project Sapphire |
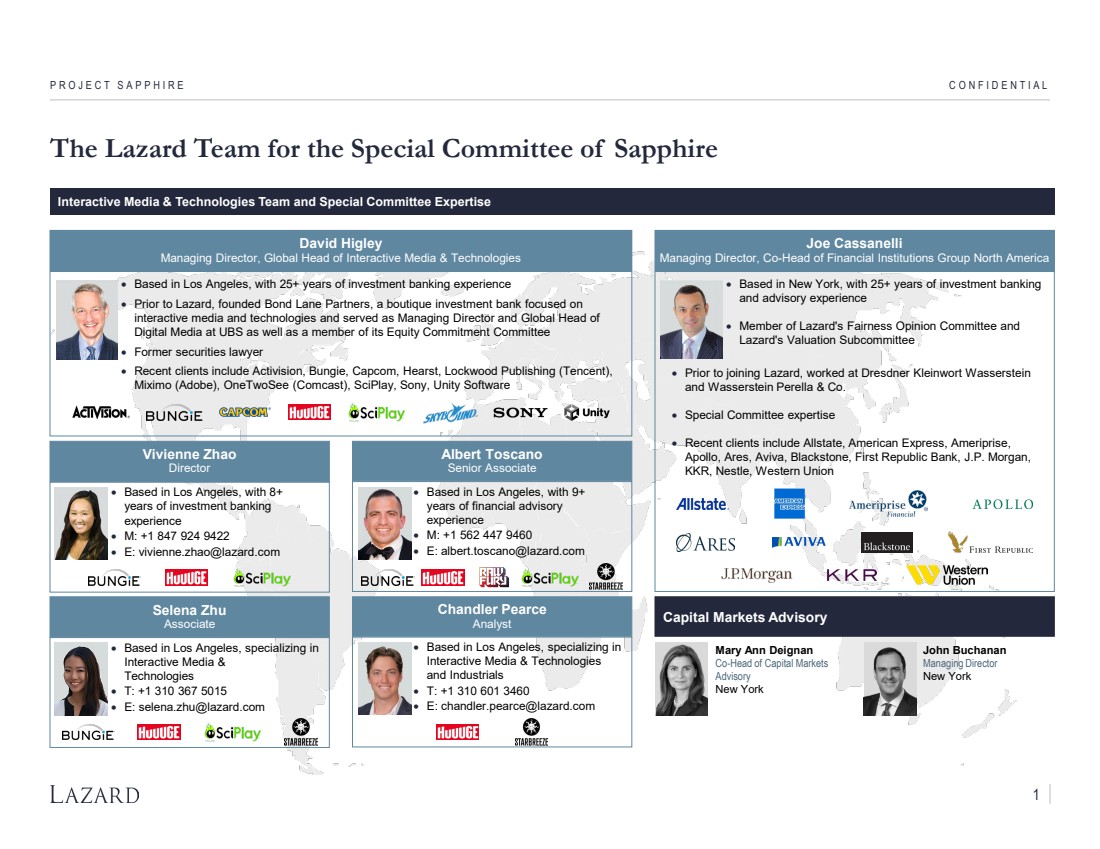
| PROJECT SAPPHIRE CONFIDENTIAL The Lazard Team for the Special Committee of Sapphire Interactive Media & Technologies Team and Special Committee Expertise David Higley Managing Director, Global Head of Interactive Media & Technologies • Based in Los Angeles, with 25+ years of investment banking experience • Prior to Lazard, founded Bond Lane Partners, a boutique investment bank focused on interactive media and technologies and served as Managing Director and Global Head of Digital Media at UBS as well as a member of its Equity Commitment Committee • Former securities lawyer • Recent clients include Activision, Bungie, Capcom, Hearst, Lockwood Publishing (Tencent), Miximo (Adobe), OneTwoSee (Comcast), SciPlay, Sony, Unity Software Vivienne Zhao Director • Based in Los Angeles, with 8+ years of investment banking experience • M: +1 847 924 9422 • E: vivienne.zhao@lazard.com • Based in Los Angeles, with 9+ years of financial advisory experience • M: +1 562 447 9460 • E: albert.toscano@lazard.com Albert Toscano Senior Associate Selena Zhu Associate • Based in Los Angeles, specializing in Interactive Media & Technologies • T: +1 310 367 5015 • E: selena.zhu@lazard.com • Based in Los Angeles, specializing in Interactive Media & Technologies and Industrials • T: +1 310 601 3460 • E: chandler.pearce@lazard.com Chandler Pearce Analyst Joe Cassanelli Managing Director, Co-Head of Financial Institutions Group North America • Based in New York, with 25+ years of investment banking and advisory experience • Member of Lazard's Fairness Opinion Committee and Lazard's Valuation Subcommittee • Prior to joining Lazard, worked at Dresdner Kleinwort Wasserstein and Wasserstein Perella & Co. • Special Committee expertise • Recent clients include Allstate, American Express, Ameriprise, Apollo, Ares, Aviva, Blackstone, First Republic Bank, J.P. Morgan, KKR, Nestle, Western Union Capital Markets Advisory Mary Ann Deignan Co-Head of Capital Markets Advisory New York John Buchanan Managing Director New York 1 |
| CONFIDENTIAL Situation Update PROJECT SAPPHIRE |
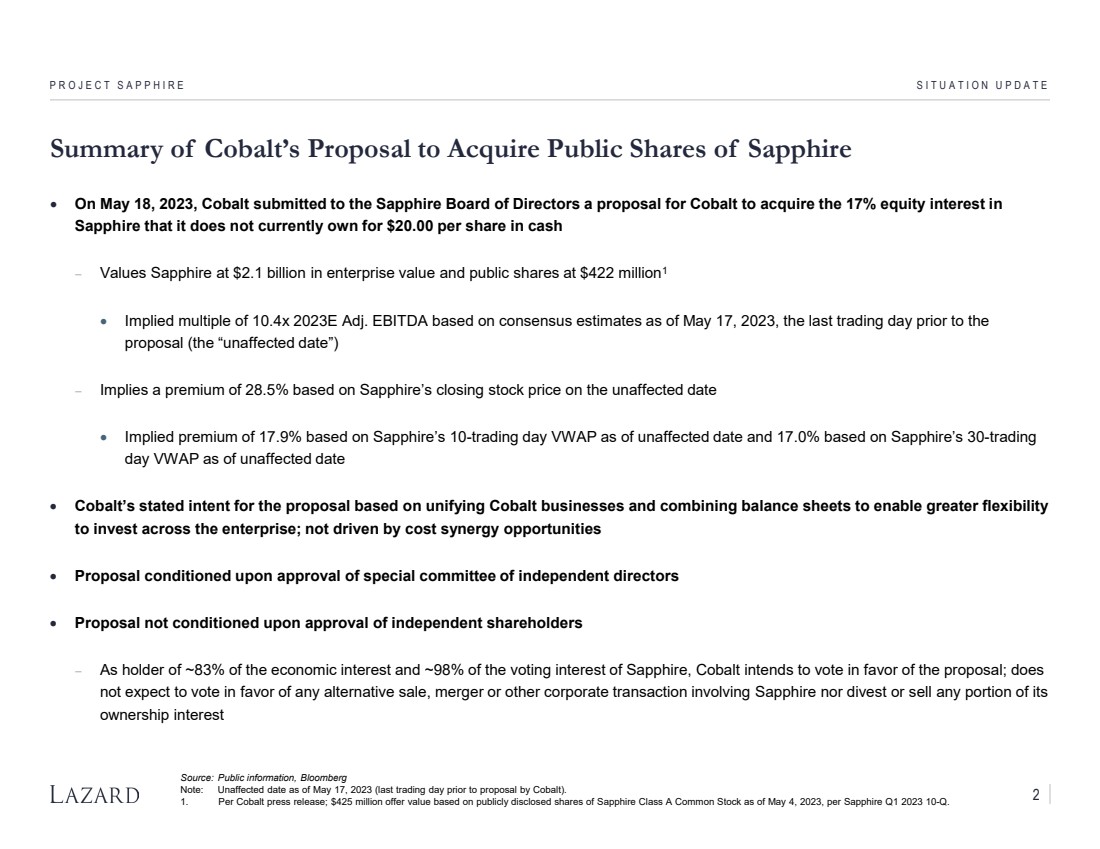
| Summary of Cobalt’s Proposal to Acquire Public Shares of Sapphire PROJECT SAPPHIRE SITUATION UPDATE • On May 18, 2023, Cobalt submitted to the Sapphire Board of Directors a proposal for Cobalt to acquire the 17% equity interest in Sapphire that it does not currently own for $20.00 per share in cash − Values Sapphire at $2.1 billion in enterprise value and public shares at $422 million1 • Implied multiple of 10.4x 2023E Adj. EBITDA based on consensus estimates as of May 17, 2023, the last trading day prior to the proposal (the “unaffected date”) − Implies a premium of 28.5% based on Sapphire’s closing stock price on the unaffected date • Implied premium of 17.9% based on Sapphire’s 10-trading day VWAP as of unaffected date and 17.0% based on Sapphire’s 30-trading day VWAP as of unaffected date • Cobalt’s stated intent for the proposal based on unifying Cobalt businesses and combining balance sheets to enable greater flexibility to invest across the enterprise; not driven by cost synergy opportunities • Proposal conditioned upon approval of special committee of independent directors • Proposal not conditioned upon approval of independent shareholders − As holder of ~83% of the economic interest and ~98% of the voting interest of Sapphire, Cobalt intends to vote in favor of the proposal; does not expect to vote in favor of any alternative sale, merger or other corporate transaction involving Sapphire nor divest or sell any portion of its ownership interest Source: Public information, Bloomberg Note: Unaffected date as of May 17, 2023 (last trading day prior to proposal by Cobalt). 1. Per Cobalt press release; $425 million offer value based on publicly disclosed shares of Sapphire Class A Common Stock as of May 4, 2023, per Sapphire Q1 2023 10-Q. 2 |
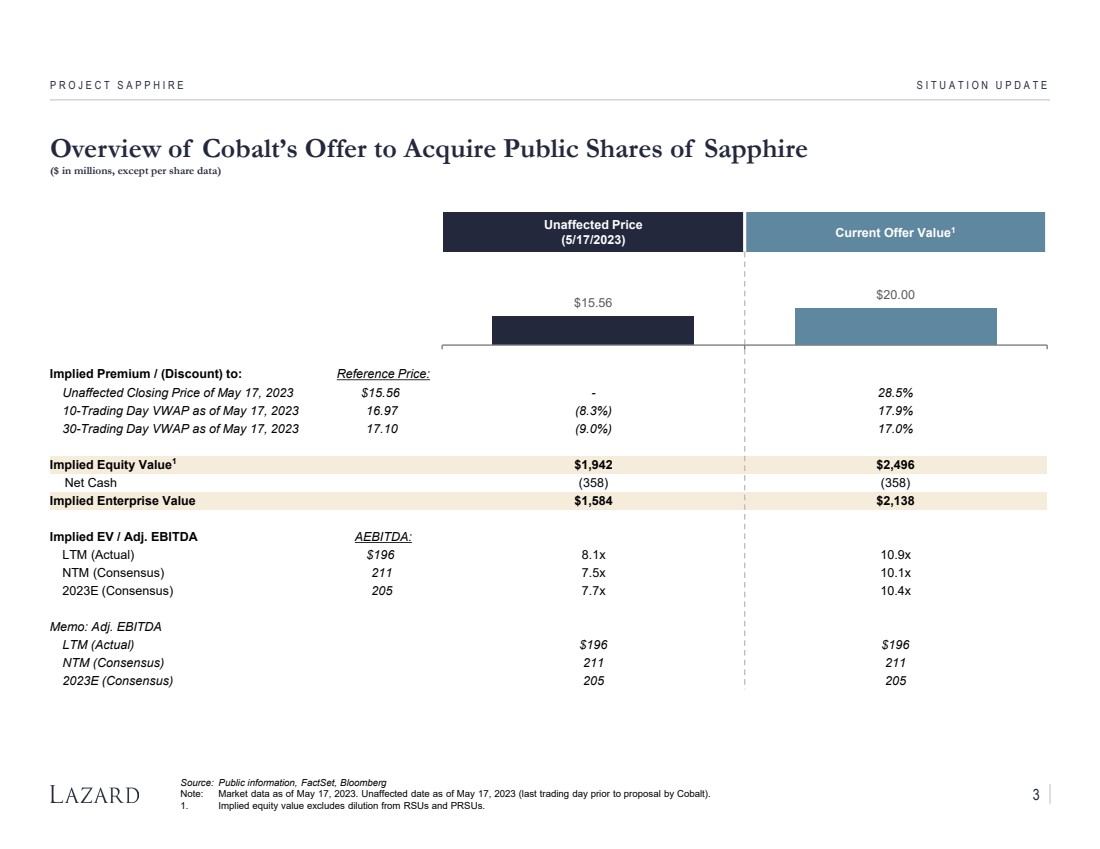
| Overview of Cobalt’s Offer to Acquire Public Shares of Sapphire ($ in millions, except per share data) PROJECT SAPPHIRE SITUATION UPDATE Source: Public information, FactSet, Bloomberg Note: Market data as of May 17, 2023. Unaffected date as of May 17, 2023 (last trading day prior to proposal by Cobalt). 1. Implied equity value excludes dilution from RSUs and PRSUs. Unaffected Price (5/17/2023) Current Offer Value1 Implied Premium / (Discount) to: Reference Price: Unaffected Closing Price of May 17, 2023 $15.56 - 28.5% 10-Trading Day VWAP as of May 17, 2023 16.97 (8.3%) 17.9% 30-Trading Day VWAP as of May 17, 2023 17.10 (9.0%) 17.0% Implied Equity Value1 $1,942 $2,496 Net Cash (358) (358) Implied Enterprise Value $1,584 $2,138 Implied EV / Adj. EBITDA AEBITDA: LTM (Actual) $196 8.1x 10.9x NTM (Consensus) 211 7.5x 10.1x 2023E (Consensus) 205 7.7x 10.4x Memo: Adj. EBITDA LTM (Actual) $196 $196 NTM (Consensus) 211 211 2023E (Consensus) 205 205 $15.56 $20.00 3 |
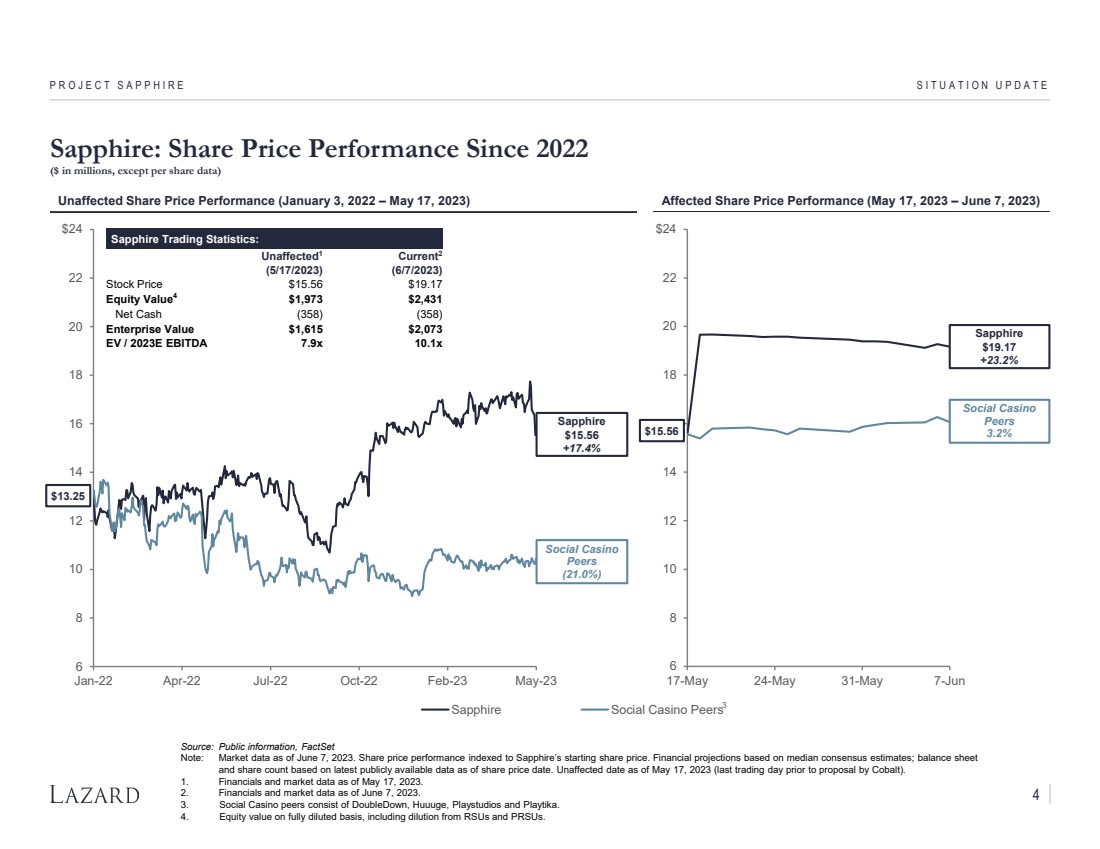
| 6 8 10 12 14 16 18 20 22 $24 Jan-22 Apr-22 Jul-22 Oct-22 Feb-23 May-23 Sapphire Social Casino Peers PROJECT SAPPHIRE SITUATION UPDATE Sapphire Trading Statistics: Unaffected1 (5/17/2023) Current2 (6/7/2023) Stock Price $15.56 $19.17 Equity Value4 $1,973 $2,431 Net Cash (358) (358) Enterprise Value $1,615 $2,073 EV / 2023E EBITDA 7.9x 10.1x Unaffected Share Price Performance (January 3, 2022 – May 17, 2023) 3 Sapphire $15.56 +17.4% Social Casino Peers (21.0%) Source: Public information, FactSet Note: Market data as of June 7, 2023. Share price performance indexed to Sapphire’s starting share price. Financial projections based on median consensus estimates; balance sheet and share count based on latest publicly available data as of share price date. Unaffected date as of May 17, 2023 (last trading day prior to proposal by Cobalt). 1. Financials and market data as of May 17, 2023. 2. Financials and market data as of June 7, 2023. 3. Social Casino peers consist of DoubleDown, Huuuge, Playstudios and Playtika. 4. Equity value on fully diluted basis, including dilution from RSUs and PRSUs. Sapphire: Share Price Performance Since 2022 ($ in millions, except per share data) 6 8 10 12 14 16 18 20 22 $24 17-May 24-May 31-May 7-Jun Affected Share Price Performance (May 17, 2023 – June 7, 2023) $15.56 $13.25 Sapphire $19.17 +23.2% Social Casino Peers 3.2% 4 |
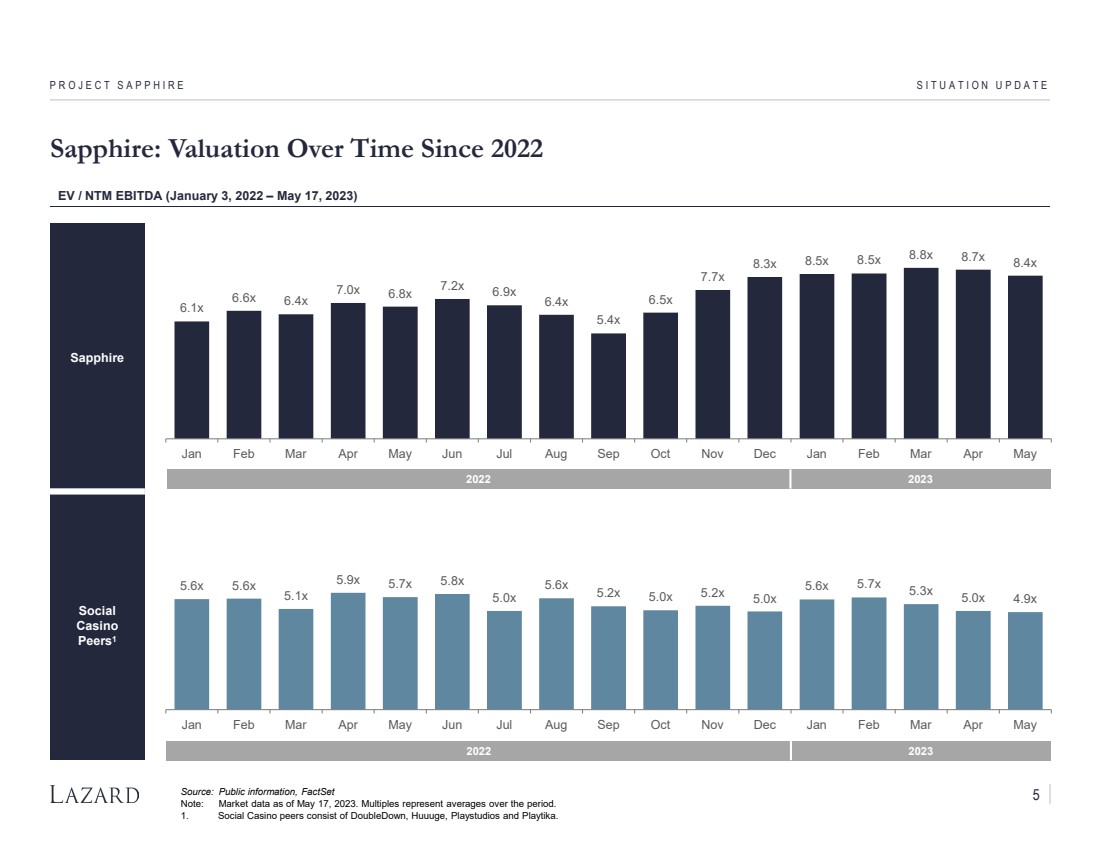
| Sapphire Social Casino Peers1 6.1x 6.6x 6.4x 7.0x 6.8x 7.2x 6.9x 6.4x 5.4x 6.5x 7.7x 8.3x 8.5x 8.5x 8.8x 8.7x 8.4x Jan Feb Mar Apr May Jun Jul Aug Sep Oct Nov Dec Jan Feb Mar Apr May 5.6x 5.6x 5.1x 5.9x 5.7x 5.8x 5.0x 5.6x 5.2x 5.0x 5.2x 5.0x 5.6x 5.7x 5.3x 5.0x 4.9x Jan Feb Mar Apr May Jun Jul Aug Sep Oct Nov Dec Jan Feb Mar Apr May Sapphire: Valuation Over Time Since 2022 PROJECT SAPPHIRE SITUATION UPDATE EV / NTM EBITDA (January 3, 2022 – May 17, 2023) Source: Public information, FactSet Note: Market data as of May 17, 2023. Multiples represent averages over the period. 1. Social Casino peers consist of DoubleDown, Huuuge, Playstudios and Playtika. 2022 2023 2022 2023 5 |
| CONFIDENTIAL Preliminary Financial Analysis PROJECT SAPPHIRE |
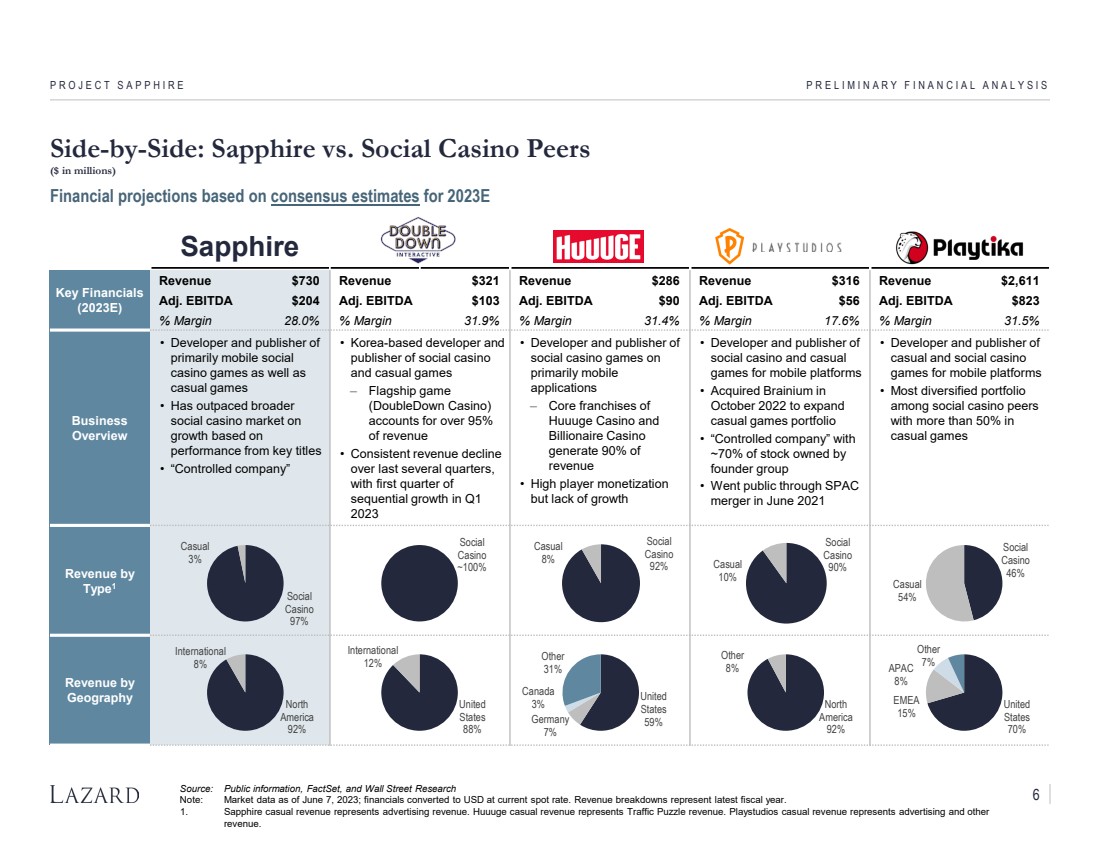
| Sapphire Key Financials (2023E) Revenue $730 Revenue $321 Revenue $286 Revenue $316 Revenue $2,611 Adj. EBITDA $204 Adj. EBITDA $103 Adj. EBITDA $90 Adj. EBITDA $56 Adj. EBITDA $823 % Margin 28.0% % Margin 31.9% % Margin 31.4% % Margin 17.6% % Margin 31.5% Business Overview • Developer and publisher of primarily mobile social casino games as well as casual games • Has outpaced broader social casino market on growth based on performance from key titles • “Controlled company” • Korea-based developer and publisher of social casino and casual games ‒ Flagship game (DoubleDown Casino) accounts for over 95% of revenue • Consistent revenue decline over last several quarters, with first quarter of sequential growth in Q1 2023 • Developer and publisher of social casino games on primarily mobile applications ‒ Core franchises of Huuuge Casino and Billionaire Casino generate 90% of revenue • High player monetization but lack of growth • Developer and publisher of social casino and casual games for mobile platforms • Acquired Brainium in October 2022 to expand casual games portfolio • “Controlled company” with ~70% of stock owned by founder group • Went public through SPAC merger in June 2021 • Developer and publisher of casual and social casino games for mobile platforms • Most diversified portfolio among social casino peers with more than 50% in casual games Revenue by Type1 Revenue by Geography Side-by-Side: Sapphire vs. Social Casino Peers ($ in millions) PROJECT SAPPHIRE PRELIMINARY FINANCIAL ANALYSIS Source: Public information, FactSet, and Wall Street Research Note: Market data as of June 7, 2023; financials converted to USD at current spot rate. Revenue breakdowns represent latest fiscal year. 1. Sapphire casual revenue represents advertising revenue. Huuuge casual revenue represents Traffic Puzzle revenue. Playstudios casual revenue represents advertising and other revenue. Financial projections based on consensus estimates for 2023E North America 92% International 8% Social Casino 97% Casual 3% United States Germany 59% 7% Canada 3% Other 31% Social Casino 92% Casual 8% North America 92% Other 8% Social Casino Casual 90% 10% United States 70% EMEA 15% APAC 8% Other 7% Social Casino 46% Casual 54% United States 88% International 12% Social Casino ~100% 6 |
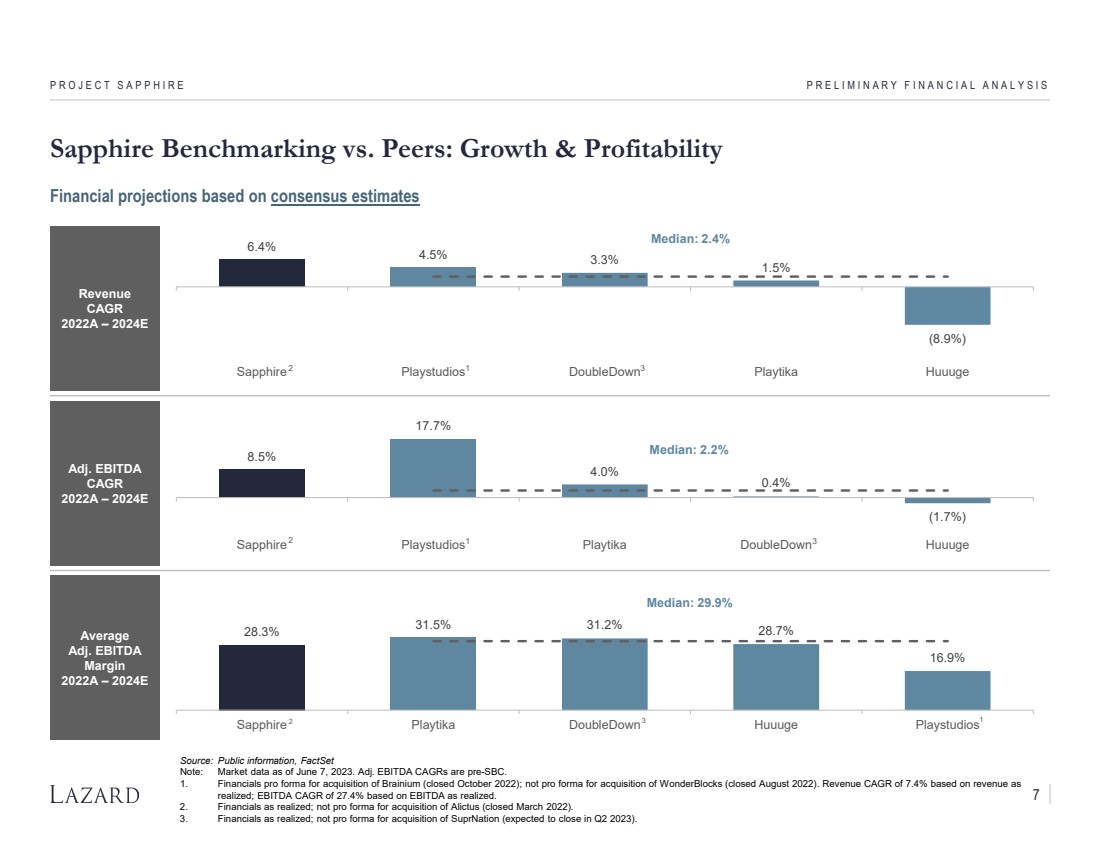
| Revenue CAGR 2022A – 2024E Adj. EBITDA CAGR 2022A – 2024E Average Adj. EBITDA Margin 2022A – 2024E 6.4% 4.5% 3.3% 1.5% (8.9%) Median: 2.4% Sapphire Playstudios DoubleDown Playtika Huuuge Sapphire Benchmarking vs. Peers: Growth & Profitability PROJECT SAPPHIRE PRELIMINARY FINANCIAL ANALYSIS Source: Public information, FactSet Note: Market data as of June 7, 2023. Adj. EBITDA CAGRs are pre-SBC. 1. Financials pro forma for acquisition of Brainium (closed October 2022); not pro forma for acquisition of WonderBlocks (closed August 2022). Revenue CAGR of 7.4% based on revenue as realized; EBITDA CAGR of 27.4% based on EBITDA as realized. 2. Financials as realized; not pro forma for acquisition of Alictus (closed March 2022). 3. Financials as realized; not pro forma for acquisition of SuprNation (expected to close in Q2 2023). Financial projections based on consensus estimates 2 1 3 7 8.5% 17.7% 4.0% 0.4% (1.7%) Median: 2.2% Sapphire Playstudios Playtika DoubleDown Huuuge 2 1 3 28.3% 31.5% 31.2% 28.7% 16.9% Median: 29.9% Sapphire Playtika DoubleDown Huuuge Playstudios 2 3 1 |
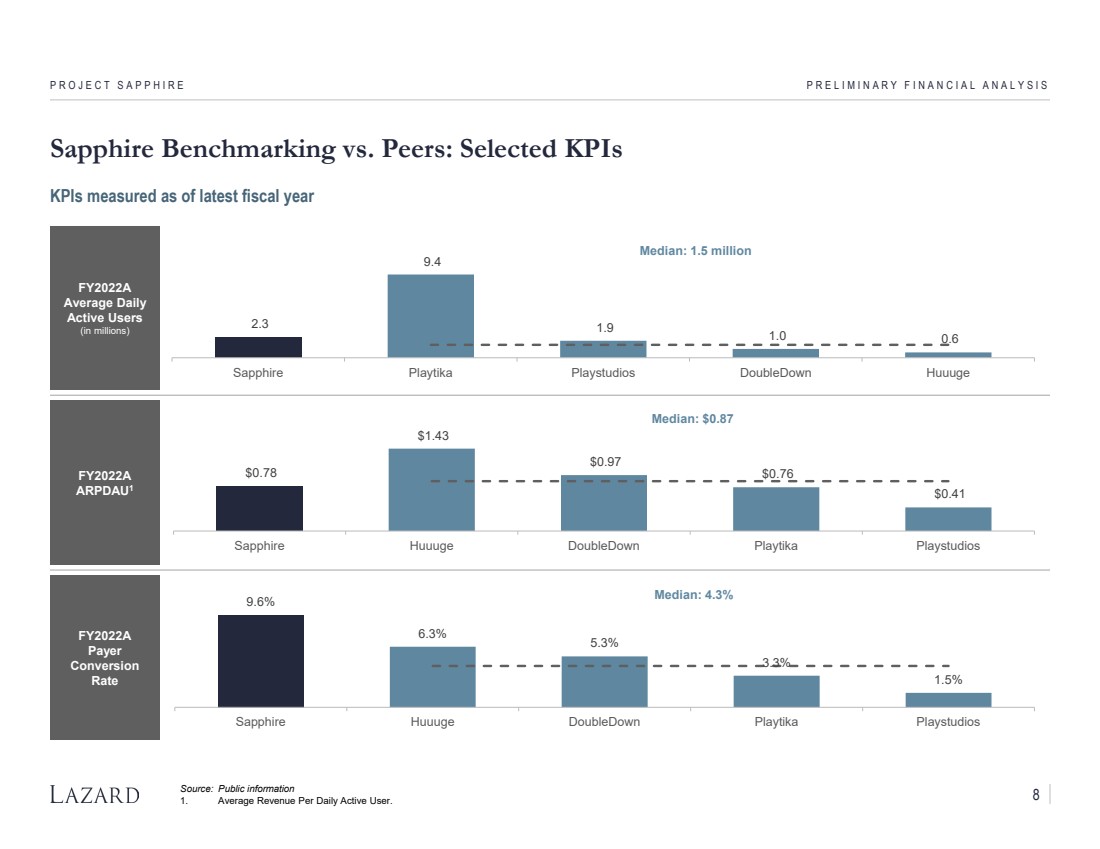
| Social Casino Peers FY2022A Average Daily Active Users (in millions) FY2022A ARPDAU1 FY2022A Payer Conversion Rate 9.6% 6.3% 5.3% 3.3% 1.5% Median: 4.3% Sapphire Huuuge DoubleDown Playtika Playstudios $0.78 $1.43 $0.97 $0.76 $0.41 Median: $0.87 Sapphire Huuuge DoubleDown Playtika Playstudios Sapphire Benchmarking vs. Peers: Selected KPIs PROJECT SAPPHIRE PRELIMINARY FINANCIAL ANALYSIS Source: Public information 1. Average Revenue Per Daily Active User. 2.3 9.4 1.9 1.0 0.6 Median: 1.5 million Sapphire Playtika Playstudios DoubleDown Huuuge KPIs measured as of latest fiscal year 8 |
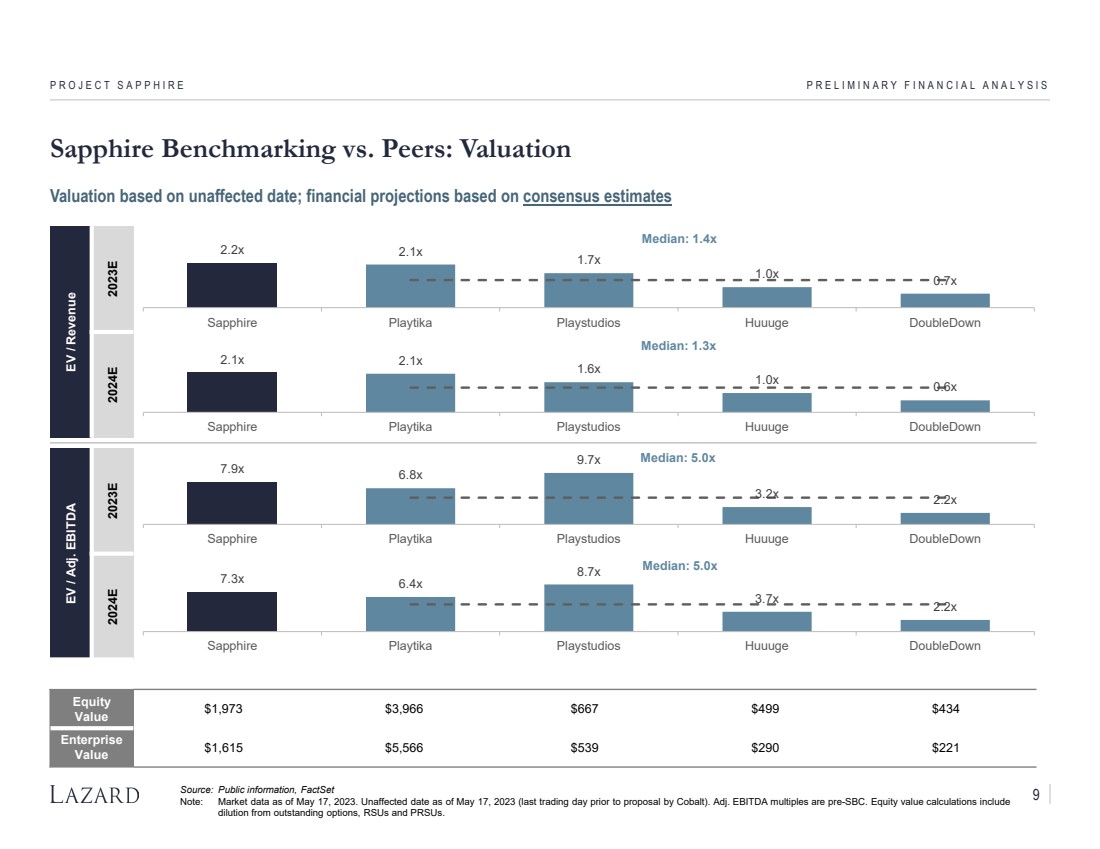
| Social Casino Peers EV / Revenue 2023E 2024E EV / Adj. EBITDA 2023E 2024E Equity Value $1,973 $3,966 $667 $499 $434 Enterprise Value $1,615 $5,566 $539 $290 $221 2.1x 2.1x 1.6x 1.0x 0.6x Median: 1.3x Sapphire Playtika Playstudios Huuuge DoubleDown 7.3x 6.4x 8.7x 3.7x 2.2x Median: 5.0x Sapphire Playtika Playstudios Huuuge DoubleDown 7.9x 6.8x 9.7x 3.2x 2.2x Median: 5.0x Sapphire Playtika Playstudios Huuuge DoubleDown Sapphire Benchmarking vs. Peers: Valuation PROJECT SAPPHIRE PRELIMINARY FINANCIAL ANALYSIS Source: Public information, FactSet Note: Market data as of May 17, 2023. Unaffected date as of May 17, 2023 (last trading day prior to proposal by Cobalt). Adj. EBITDA multiples are pre-SBC. Equity value calculations include dilution from outstanding options, RSUs and PRSUs. 2.2x 2.1x 1.7x 1.0x 0.7x Median: 1.4x Sapphire Playtika Playstudios Huuuge DoubleDown Valuation based on unaffected date; financial projections based on consensus estimates 9 |
| CONFIDENTIAL Key Process Workstreams PROJECT SAPPHIRE |
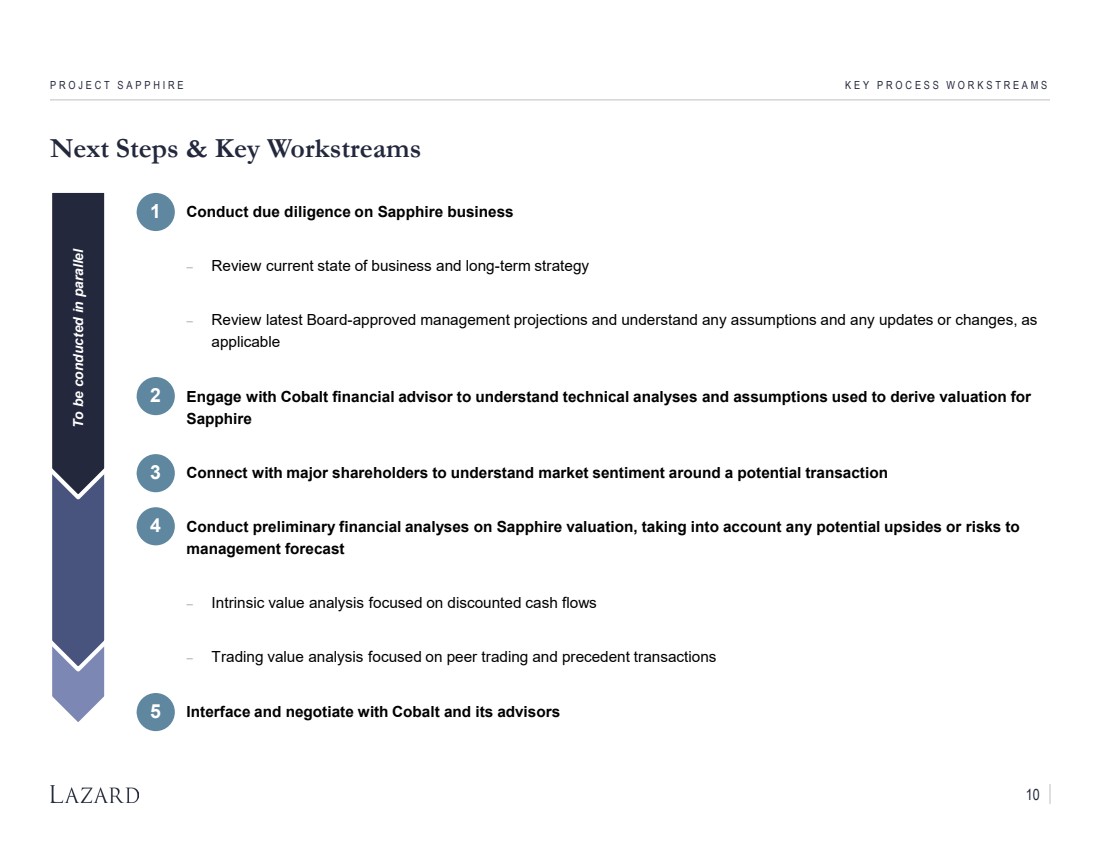
| Next Steps & Key Workstreams • Conduct due diligence on Sapphire business − Review current state of business and long-term strategy − Review latest Board-approved management projections and understand any assumptions and any updates or changes, as applicable • Engage with Cobalt financial advisor to understand technical analyses and assumptions used to derive valuation for Sapphire • Connect with major shareholders to understand market sentiment around a potential transaction • Conduct preliminary financial analyses on Sapphire valuation, taking into account any potential upsides or risks to management forecast − Intrinsic value analysis focused on discounted cash flows − Trading value analysis focused on peer trading and precedent transactions • Interface and negotiate with Cobalt and its advisors PROJECT SAPPHIRE KEY PROCESS WORKSTREAMS 1 2 3 4 5 To be conducted in parallel 10 |
| CONFIDENTIAL Appendix PROJECT SAPPHIRE |
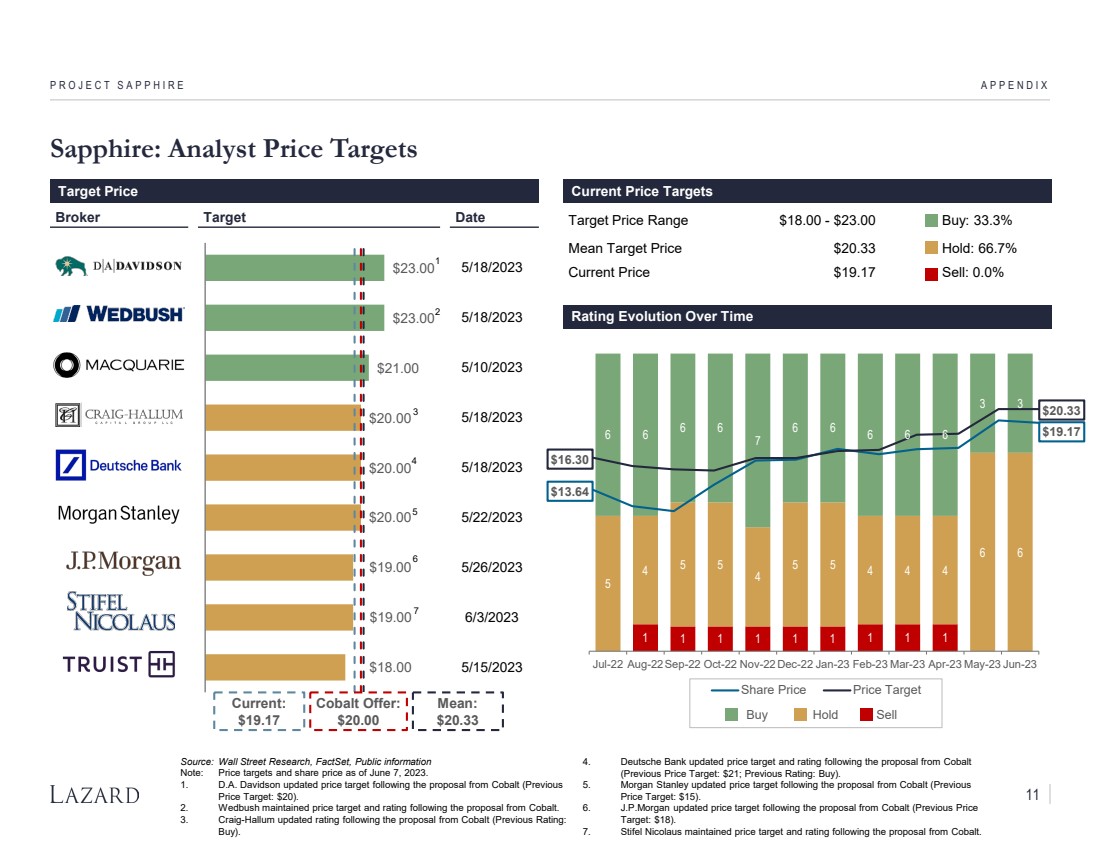
| $23.00 $23.00 $21.00 $20.00 $20.00 $20.00 $19.00 $19.00 $18.00 Sapphire: Analyst Price Targets PROJECT SAPPHIRE APPENDIX Target Price Range $18.00 - $23.00 Buy: 33.3% Mean Target Price $20.33 Hold: 66.7% Current Price $19.17 Sell: 0.0% Broker Target Date Target Price Current Price Targets Rating Evolution Over Time Current: $19.17 Mean: $20.33 1 1 1 1 1 1 1 1 1 5 4 5 5 4 5 5 4 4 4 6 6 6 6 6 6 7 6 6 6 6 6 3 3 Jul-22 Aug-22Sep-22 Oct-22 Nov-22Dec-22 Jan-23 Feb-23 Mar-23 Apr-23 May-23 Jun-23 Share Price Price Target Buy Hold Sell $16.30 $13.64 $20.33 $19.17 5/18/2023 5/18/2023 5/10/2023 5/18/2023 5/18/2023 5/22/2023 5/26/2023 6/3/2023 5/15/2023 Source: Wall Street Research, FactSet, Public information Note: Price targets and share price as of June 7, 2023. 1. D.A. Davidson updated price target following the proposal from Cobalt (Previous Price Target: $20). 2. Wedbush maintained price target and rating following the proposal from Cobalt. 3. Craig-Hallum updated rating following the proposal from Cobalt (Previous Rating: Buy). 4. Deutsche Bank updated price target and rating following the proposal from Cobalt (Previous Price Target: $21; Previous Rating: Buy). 5. Morgan Stanley updated price target following the proposal from Cobalt (Previous Price Target: $15). 6. J.P.Morgan updated price target following the proposal from Cobalt (Previous Price Target: $18). 7. Stifel Nicolaus maintained price target and rating following the proposal from Cobalt. Cobalt Offer: $20.00 1 3 4 5 2 6 7 11 |
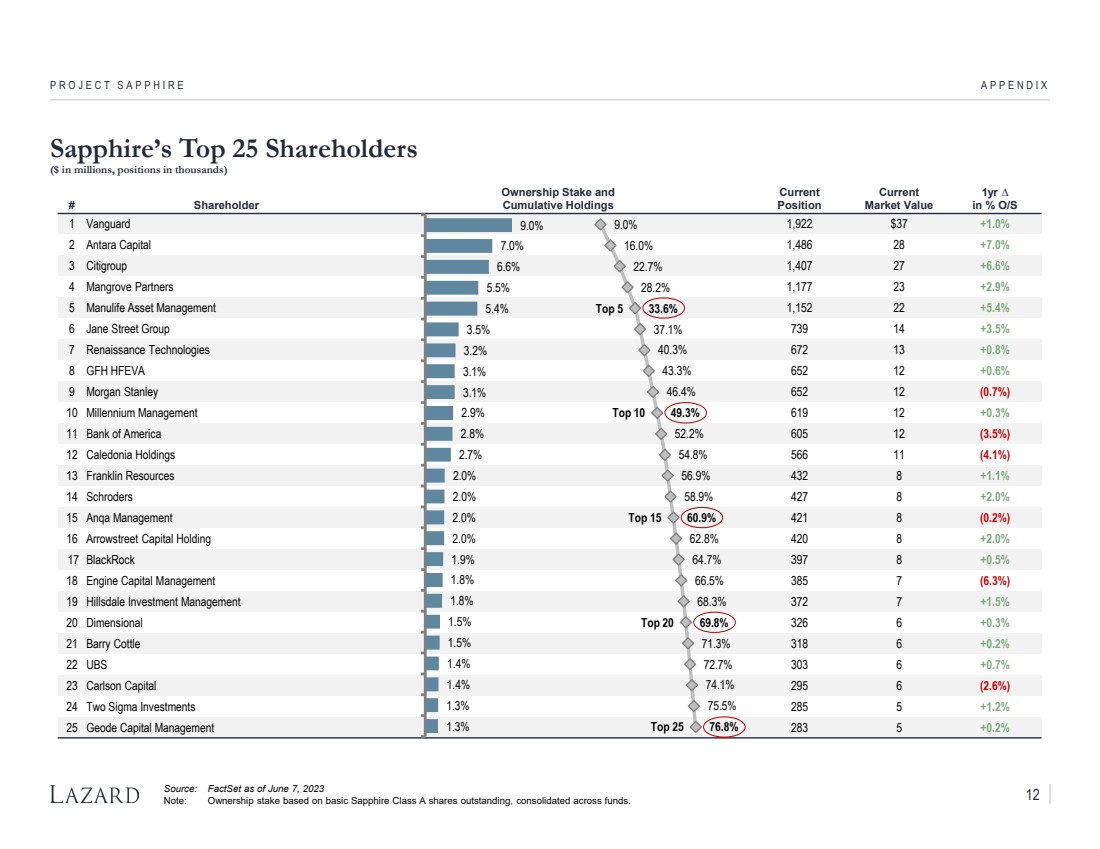
| APPENDIX Sapphire’s Top 25 Shareholders ($ in millions, positions in thousands) Source: FactSet as of June 7, 2023 Note: Ownership stake based on basic Sapphire Class A shares outstanding, consolidated across funds. PROJECT SAPPHIRE # Shareholder Ownership Stake and Cumulative Holdings Current Position Current Market Value 1yr ∆ in % O/S 1 Vanguard 1,922 $37 +1.0% 2 Antara Capital 1,486 28 +7.0% 3 Citigroup 1,407 27 +6.6% 4 Mangrove Partners 1,177 23 +2.9% 5 Manulife Asset Management 1,152 22 +5.4% 6 Jane Street Group 739 14 +3.5% 7 Renaissance Technologies 672 13 +0.8% 8 GFH HFEVA 652 12 +0.6% 9 Morgan Stanley 652 12 (0.7%) 10 Millennium Management 619 12 +0.3% 11 Bank of America 605 12 (3.5%) 12 Caledonia Holdings 566 11 (4.1%) 13 Franklin Resources 432 8 +1.1% 14 Schroders 427 8 +2.0% 15 Anqa Management 421 8 (0.2%) 16 Arrowstreet Capital Holding 420 8 +2.0% 17 BlackRock 397 8 +0.5% 18 Engine Capital Management 385 7 (6.3%) 19 Hillsdale Investment Management 372 7 +1.5% 20 Dimensional 326 6 +0.3% 21 Barry Cottle 318 6 +0.2% 22 UBS 303 6 +0.7% 23 Carlson Capital 295 6 (2.6%) 24 Two Sigma Investments 285 5 +1.2% 25 Geode Capital Management 283 5 +0.2% 9.0% 7.0% 6.6% 5.5% 5.4% 3.5% 3.2% 3.1% 3.1% 2.9% 2.8% 2.7% 2.0% 2.0% 2.0% 2.0% 1.9% 1.8% 1.8% 1.5% 1.5% 1.4% 1.4% 1.3% 1.3% 9.0% 16.0% 22.7% 28.2% 33.6% 37.1% 40.3% 43.3% 46.4% 49.3% 52.2% 54.8% 56.9% 58.9% 60.9% 62.8% 64.7% 66.5% 68.3% 69.8% 71.3% 72.7% 74.1% 75.5% 76.8% Top 5 Top 10 Top 15 Top 20 Top 25 12 |