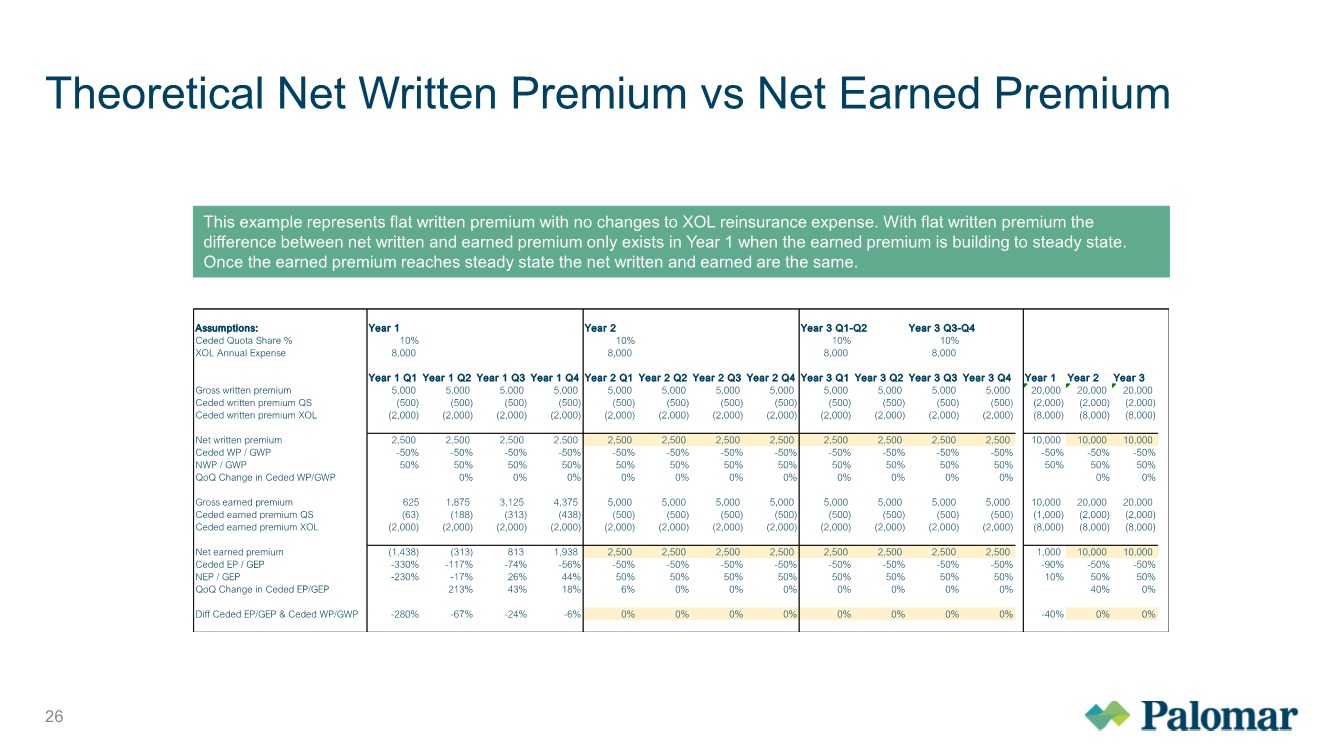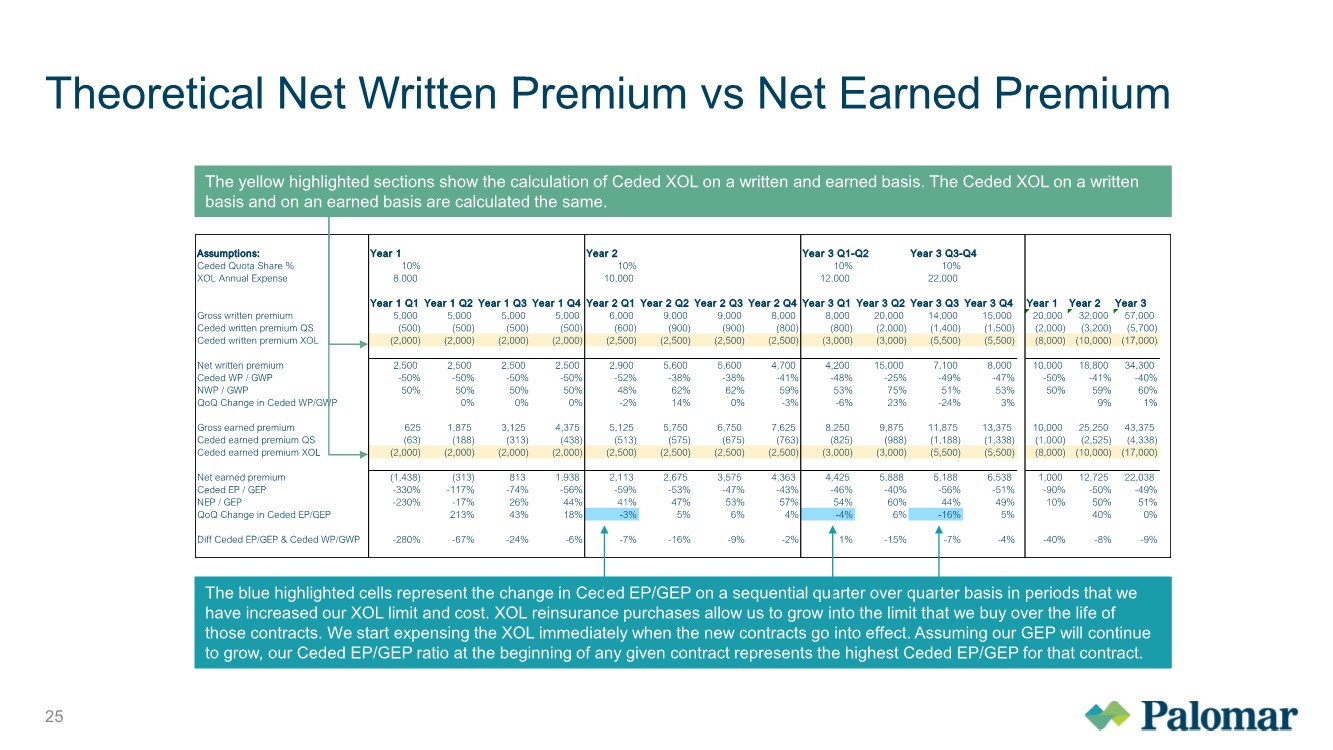
| Theoretical Net Written Premium vs Net Earned Premium 25 Assumptions: Year 1 Year 2 Year 3 Q1-Q2 Year 3 Q3-Q4 Ceded Quota Share % 10% 10% 10% 10% XOL Annual Expense 8,000 10,000 12,000 22,000 Year 1 Q1 Year 1 Q2 Year 1 Q3 Year 1 Q4 Year 2 Q1 Year 2 Q2 Year 2 Q3 Year 2 Q4 Year 3 Q1 Year 3 Q2 Year 3 Q3 Year 3 Q4 Year 1 Year 2 Year 3 Gross written premium 5,000 5,000 5,000 5,000 6,000 9,000 9,000 8,000 8,000 20,000 14,000 15,000 20,000 32,000 57,000 Ceded written premium QS (500) (500) (500) (500) (600) (900) (900) (800) (800) (2,000) (1,400) (1,500) (2,000) (3,200) (5,700) Ceded written premium XOL (2,000) (2,000) (2,000) (2,000) (2,500) (2,500) (2,500) (2,500) (3,000) (3,000) (5,500) (5,500) (8,000) (10,000) (17,000) Net written premium 2,500 2,500 2,500 2,500 2,900 5,600 5,600 4,700 4,200 15,000 7,100 8,000 10,000 18,800 34,300 Ceded WP / GWP -50% -50% -50% -50% -52% -38% -38% -41% -48% -25% -49% -47% -50% -41% -40% NWP / GWP 50% 50% 50% 50% 48% 62% 62% 59% 53% 75% 51% 53% 50% 59% 60% QoQ Change in Ceded WP/GWP 0% 0% 0% -2% 14% 0% -3% -6% 23% -24% 3% 9% 1% Gross earned premium 625 1,875 3,125 4,375 5,125 5,750 6,750 7,625 8,250 9,875 11,875 13,375 10,000 25,250 43,375 Ceded earned premium QS (63) (188) (313) (438) (513) (575) (675) (763) (825) (988) (1,188) (1,338) (1,000) (2,525) (4,338) Ceded earned premium XOL (2,000) (2,000) (2,000) (2,000) (2,500) (2,500) (2,500) (2,500) (3,000) (3,000) (5,500) (5,500) (8,000) (10,000) (17,000) Net earned premium (1,438) (313) 813 1,938 2,113 2,675 3,575 4,363 4,425 5,888 5,188 6,538 1,000 12,725 22,038 Ceded EP / GEP -330% -117% -74% -56% -59% -53% -47% -43% -46% -40% -56% -51% -90% -50% -49% NEP / GEP -230% -17% 26% 44% 41% 47% 53% 57% 54% 60% 44% 49% 10% 50% 51% QoQ Change in Ceded EP/GEP 213% 43% 18% -3% 5% 6% 4% -4% 6% -16% 5% 40% 0% Diff Ceded EP/GEP & Ceded WP/GWP -280% -67% -24% -6% -7% -16% -9% -2% 1% -15% -7% -4% -40% -8% -9% The blue highlighted cells represent the change in Ceded EP/GEP on a sequential quarter over quarter basis in periods that we have increased our XOL limit and cost. XOL reinsurance purchases allow us to grow into the limit that we buy over the life of those contracts. We start expensing the XOL immediately when the new contracts go into effect. Assuming our GEP will continue to grow, our Ceded EP/GEP ratio at the beginning of any given contract represents the highest Ceded EP/GEP for that contract. The yellow highlighted sections show the calculation of Ceded XOL on a written and earned basis. The Ceded XOL on a written basis and on an earned basis are calculated the same. |