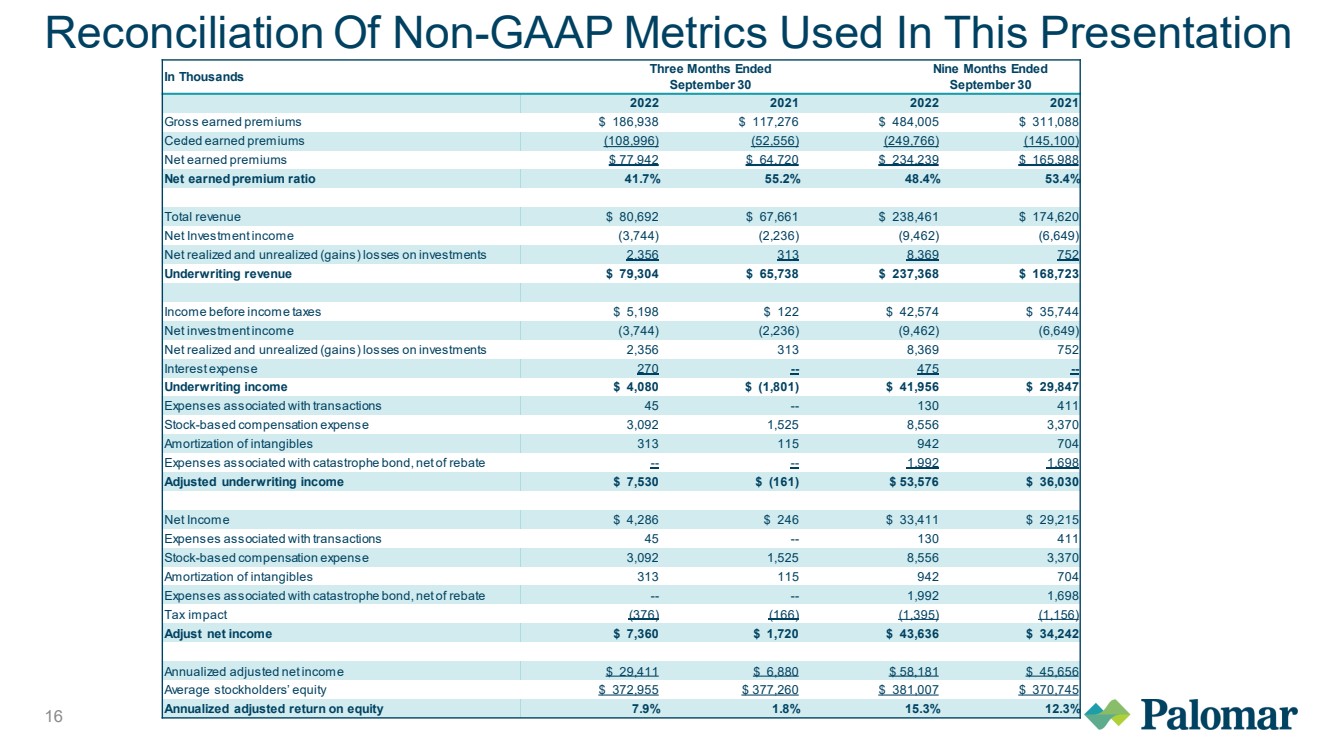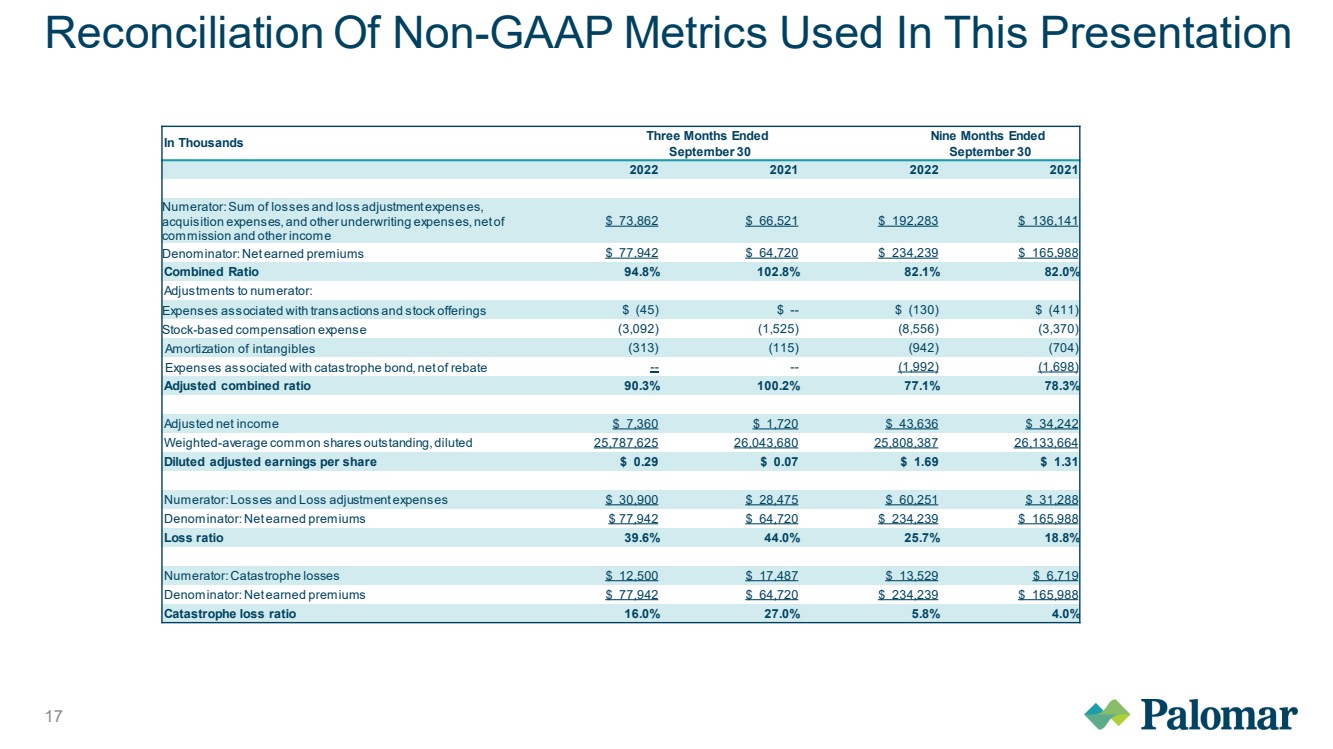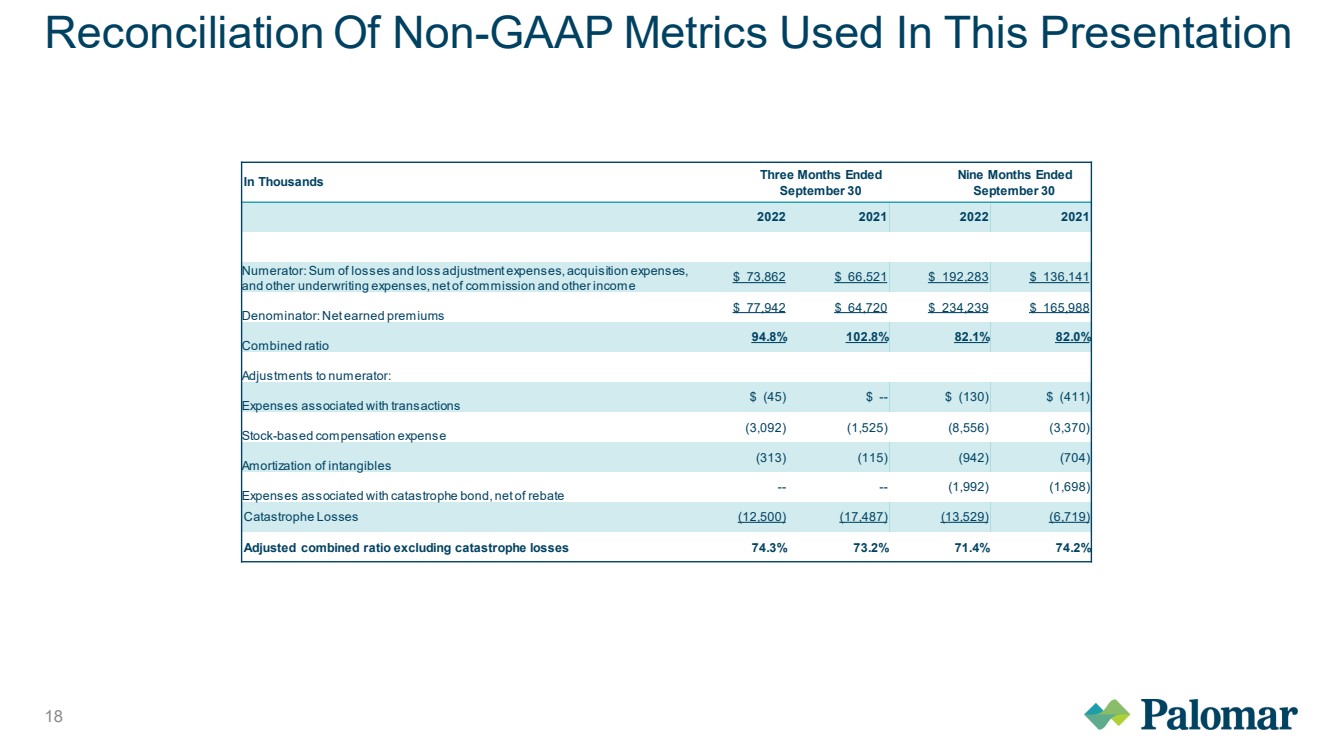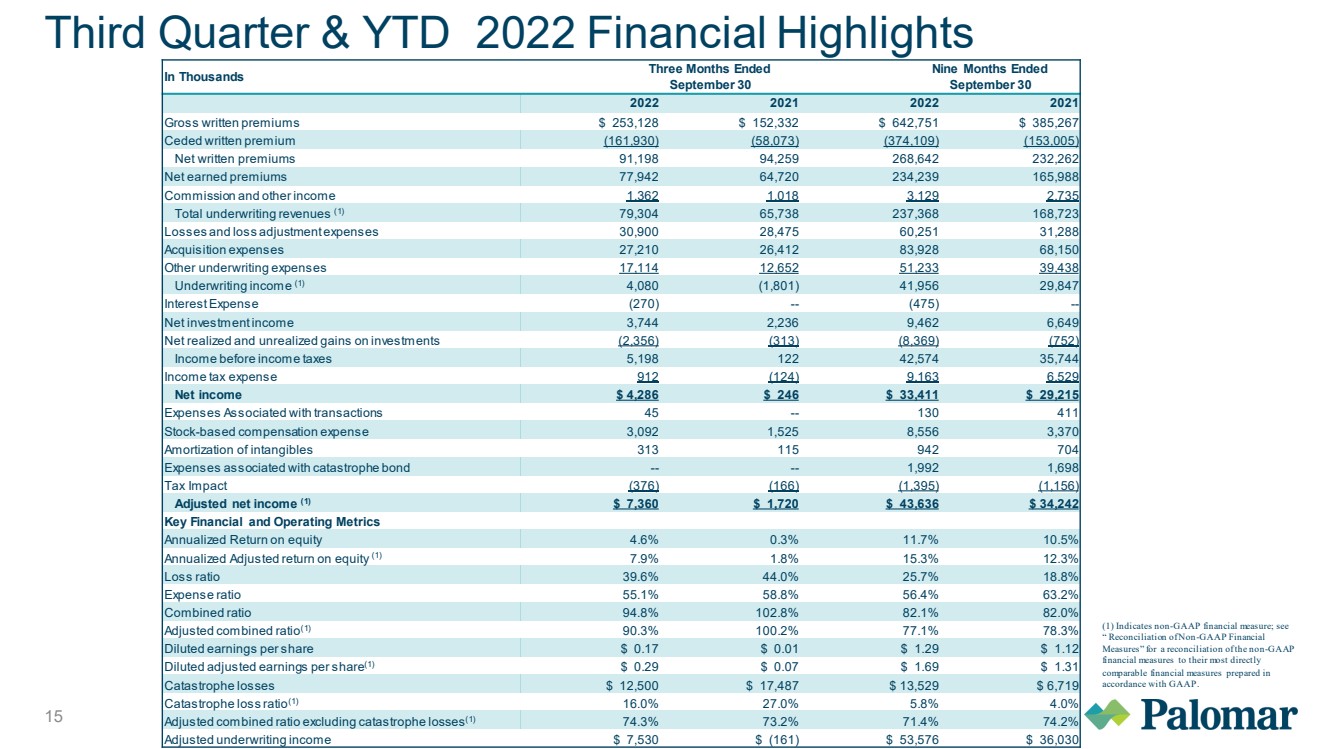
| 15 Third Quarter & YTD 2022 Financial Highlights In Thousands Three Months Ended September 30 Nine Months Ended September 30 2022 2021 2022 2021 Gross written premiums $ 253,128 $ 152,332 $ 642,751 $ 385,267 Ceded written premium (161,930) (58,073) (374,109) (153,005) Net written premiums 91,198 94,259 268,642 232,262 Net earned premiums 77,942 64,720 234,239 165,988 Commission and other income 1,362 1,018 3,129 2,735 Total underwriting revenues (1) 79,304 65,738 237,368 168,723 Losses and loss adjustment expenses 30,900 28,475 60,251 31,288 Acquisition expenses 27,210 26,412 83,928 68,150 Other underwriting expenses 17,114 12,652 51,233 39,438 Underwriting income (1) 4,080 (1,801) 41,956 29,847 Interest Expense (270) -- (475) -- Net investment income 3,744 2,236 9,462 6,649 Net realized and unrealized gains on investments (2,356) (313) (8,369) (752) Income before income taxes 5,198 122 42,574 35,744 Income tax expense 912 (124) 9,163 6,529 Net income $ 4,286 $ 246 $ 33,411 $ 29,215 Expenses Associated with transactions 45 -- 130 411 Stock - based compensation expense 3,092 1,525 8,556 3,370 Amortization of intangibles 313 115 942 704 Expenses associated with catastrophe bond -- -- 1,992 1,698 Tax Impact (376) (166) (1,395) (1,156) Adjusted net income (1) $ 7,360 $ 1,720 $ 43,636 $ 34,242 Key Financial and Operating Metrics Annualized Return on equity 4.6% 0.3% 11.7% 10.5% Annualized Adjusted return on equity (1) 7.9% 1.8% 15.3% 12.3% Loss ratio 39.6% 44.0% 25.7% 18.8% Expense ratio 55.1% 58.8% 56.4% 63.2% Combined ratio 94.8% 102.8% 82.1% 82.0% Adjusted combined ratio (1) 90.3% 100.2% 77.1% 78.3% Diluted earnings per share $ 0.17 $ 0.01 $ 1.29 $ 1.12 Diluted adjusted earnings per share (1) $ 0.29 $ 0.07 $ 1.69 $ 1.31 Catastrophe losses $ 12,500 $ 17,487 $ 13,529 $ 6,719 Catastrophe loss ratio (1) 16.0% 27.0% 5.8% 4.0% Adjusted combined ratio excluding catastrophe losses (1) 74.3% 73.2% 71.4% 74.2% Adjusted underwriting income $ 7,530 $ (161) $ 53,576 $ 36,030 (1) Indicates non - GAAP financial measure; see “Reconciliation of Non - GAAP Financial Measures” for a reconciliation of the non - GAAP financial measures to their most directly comparable financial measures prepared in accordance with GAAP. |