Irvine, California 92618
Share class | Costs of a $10,000 investment | Costs paid as a percentage of a $10,000 investment |
Class A | $39 | 0.77%* |
Fund net assets (in millions) | $14,914 |
Total number of portfolio holdings | 2,022 |
Portfolio turnover rate | 41% |
Share class | Costs of a $10,000 investment | Costs paid as a percentage of a $10,000 investment |
Class C | $74 | 1.47%* |
Fund net assets (in millions) | $14,914 |
Total number of portfolio holdings | 2,022 |
Portfolio turnover rate | 41% |
Share class | Costs of a $10,000 investment | Costs paid as a percentage of a $10,000 investment |
Class T | $22 | 0.44%* |
Fund net assets (in millions) | $14,914 |
Total number of portfolio holdings | 2,022 |
Portfolio turnover rate | 41% |
Share class | Costs of a $10,000 investment | Costs paid as a percentage of a $10,000 investment |
Class F-1 | $38 | 0.75%* |
Fund net assets (in millions) | $14,914 |
Total number of portfolio holdings | 2,022 |
Portfolio turnover rate | 41% |
Share class | Costs of a $10,000 investment | Costs paid as a percentage of a $10,000 investment |
Class F-2 | $24 | 0.48%* |
Fund net assets (in millions) | $14,914 |
Total number of portfolio holdings | 2,022 |
Portfolio turnover rate | 41% |
Share class | Costs of a $10,000 investment | Costs paid as a percentage of a $10,000 investment |
Class F-3 | $19 | 0.38%* |
Fund net assets (in millions) | $14,914 |
Total number of portfolio holdings | 2,022 |
Portfolio turnover rate | 41% |
Share class | Costs of a $10,000 investment | Costs paid as a percentage of a $10,000 investment |
Class 529-A | $39 | 0.77%* |
Fund net assets (in millions) | $14,914 |
Total number of portfolio holdings | 2,022 |
Portfolio turnover rate | 41% |
Share class | Costs of a $10,000 investment | Costs paid as a percentage of a $10,000 investment |
Class 529-C | $75 | 1.49%* |
Fund net assets (in millions) | $14,914 |
Total number of portfolio holdings | 2,022 |
Portfolio turnover rate | 41% |
Share class | Costs of a $10,000 investment | Costs paid as a percentage of a $10,000 investment |
Class 529-E | $47 | 0.94%* |
Fund net assets (in millions) | $14,914 |
Total number of portfolio holdings | 2,022 |
Portfolio turnover rate | 41% |
Share class | Costs of a $10,000 investment | Costs paid as a percentage of a $10,000 investment |
Class 529-T | $24 | 0.48%* |
Fund net assets (in millions ) | $14,914 |
Total number of portfolio holdings | 2,022 |
Portfolio turnover rate | 41% |
Share class | Costs of a $10,000 investment | Costs paid as a percentage of a $10,000 investment |
Class 529-F-1 | $28 | 0.55%* |
Fund net assets (in millions) | $14,914 |
Total number of portfolio holdings | 2,022 |
Portfolio turnover rate | 41% |
Share class | Costs of a $10,000 investment | Costs paid as a percentage of a $10,000 investment |
Class 529-F-2 | $24 | 0.47%* |
Fund net assets (in millions) | $14,914 |
Total number of portfolio holdings | 2,022 |
Portfolio turnover rate | 41% |
Share class | Costs of a $10,000 investment | Costs paid as a percentage of a $10,000 investment |
Class 529-F-3 | $23 | 0.45%* |
Fund net assets (in millions) | $14,914 |
Total number of portfolio holdings | 2,022 |
Portfolio turnover rate | 41% |
Share class | Costs of a $10,000 investment | Costs paid as a percentage of a $10,000 investment |
Class R-1 | $65 | 1.29%* |
Fund net assets (in millions) | $14,914 |
Total number of portfolio holdings | 2,022 |
Portfolio turnover rate | 41% |
Share class | Costs of a $10,000 investment | Costs paid as a percentage of a $10,000 investment |
Class R-2 | $66 | 1.31%* |
Fund net assets (in millions) | $14,914 |
Total number of portfolio holdings | 2,022 |
Portfolio turnover rate | 41% |
Share class | Costs of a $10,000 investment | Costs paid as a percentage of a $10,000 investment |
Class R-2E | $34 | 0.67%* |
Fund net assets (in millions) | $14,914 |
Total number of portfolio holdings | 2,022 |
Portfolio turnover rate | 41% |
Share class | Costs of a $10,000 investment | Costs paid as a percentage of a $10,000 investment |
Class R-3 | $50 | 0.99%* |
Fund net assets (in millions) | $14,914 |
Total number of portfolio holdings | 2,022 |
Portfolio turnover rate | 41% |
Share class | Costs of a $10,000 investment | Costs paid as a percentage of a $10,000 investment |
Class R-4 | $37 | 0.73%* |
Fund net assets (in millions ) | $14,914 |
Total number of portfolio holdings | 2,022 |
Portfolio turnover rate | 41% |
Share class | Costs of a $10,000 investment | Costs paid as a percentage of a $10,000 investment |
Class R-5E | $27 | 0.54%* |
Fund net assets (in millions) | $14,914 |
Total number of portfolio holdings | 2,022 |
Portfolio turnover rate | 41% |
Share class | Costs of a $10,000 investment | Costs paid as a percentage of a $10,000 investment |
Class R-5 | $21 | 0.41%* |
Fund net assets (in millions) | $14,914 |
Total number of portfolio holdings | 2,022 |
Portfolio turnover rate | 41% |
Share class | Costs of a $10,000 investment | Costs paid as a percentage of a $10,000 investment |
Class R-6 | $19 | 0.38%* |
Fund net assets (in millions) | $14,914 |
Total number of portfolio holdings | 2,022 |
Portfolio turnover rate | 41% |
ITEM 2 - Code of Ethics
Not applicable for filing of semi-annual reports to shareholders.
ITEM 3 - Audit Committee Financial Expert
Not applicable for filing of semi-annual reports to shareholders.
ITEM 4 - Principal Accountant Fees and Services
Not applicable for filing of semi-annual reports to shareholders.
ITEM 5 - Audit Committee of Listed Registrants
Not applicable to this Registrant, insofar as the Registrant is not a listed issuer as defined in Rule 10A-3 under the Securities Exchange Act of 1934.
ITEM 6 - Investments
The schedule of investments is included as part of the material filed under Item 7 of this Form.
ITEM 7 - Financial Statements and Financial Highlights for Open-End Management Investment Companies
N-CSR Items 7-11
Bonds, notes & other debt instruments 95.68% | Principal amount (000) | Value (000) | ||
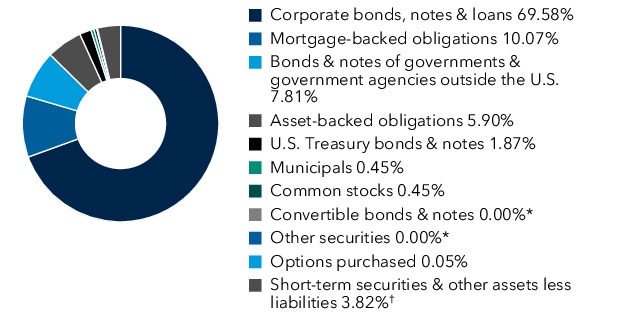
Corporate bonds, notes & loans 69.58% | ||||
Financials 13.29% | ||||
AG Issuer, LLC 6.25% 3/1/20281 | USD21,575 | $21,124 | ||
AG TTMT Escrow Issuer, LLC 8.625% 9/30/20271 | 16,440 | 17,061 | ||
Alliant Holdings Intermediate, LLC 4.25% 10/15/20271 | 10,350 | 9,702 | ||
Alliant Holdings Intermediate, LLC 6.75% 10/15/20271 | 18,918 | 18,677 | ||
Alliant Holdings Intermediate, LLC 5.875% 11/1/20291 | 12,025 | 11,264 | ||
Alliant Holdings Intermediate, LLC 7.00% 1/15/20311 | 2,510 | 2,538 | ||
Alpha Bank SA 4.25% 2/13/2030 (5-year EUR Mid-Swap + 4.504% on 2/13/2025)2 | EUR20,954 | 22,362 | ||
Alpha Bank SA 5.50% 6/11/2031 (5-year EUR Mid-Swap + 5.823% on 6/11/2026)2 | 3,046 | 3,244 | ||
American Express Co. 5.098% 2/16/2028 (USD-SOFR + 1.00% on 2/16/2027)2 | USD3,275 | 3,261 | ||
American Express Co. 5.532% 4/25/2030 (USD-SOFR + 1.09% on 4/25/2029)2 | 13,850 | 14,013 | ||
American International Group, Inc. 5.125% 3/27/2033 | 9,222 | 9,089 | ||
AmWINS Group, Inc. 6.375% 2/15/20291 | 11,120 | 11,157 | ||
AmWINS Group, Inc. 4.875% 6/30/20291 | 20,615 | 19,206 | ||
Aon Corp. 5.35% 2/28/2033 | 6,127 | 6,089 | ||
Aon North America, Inc. 5.15% 3/1/2029 | 1,450 | 1,447 | ||
Aon North America, Inc. 5.30% 3/1/2031 | 1,075 | 1,072 | ||
Aon North America, Inc. 5.45% 3/1/2034 | 15,055 | 14,995 | ||
Aon North America, Inc. 5.75% 3/1/2054 | 2,350 | 2,300 | ||
Aretec Group, Inc. 7.50% 4/1/20291 | 25,184 | 24,298 | ||
Aretec Group, Inc. 10.00% 8/15/20301 | 11,095 | 12,081 | ||
AssuredPartners, Inc. 5.625% 1/15/20291 | 11,273 | 10,555 | ||
Baldwin Insurance Group Holdings, LLC 7.125% 5/15/20311 | 3,185 | 3,225 | ||
Banco BTG Pactual SA 6.25% 4/8/20291 | 4,043 | 4,066 | ||
Bangkok Bank Public Co., Ltd. 4.45% 9/19/2028 | 200 | 194 | ||
Bangkok Bank Public Co., Ltd. 3.733% 9/25/2034 (5-year UST Yield Curve Rate T Note Constant Maturity + 1.90% on 9/25/2029)2 | 23,400 | 20,750 | ||
Bangkok Bank Public Co., Ltd. 3.466% 9/23/2036 (5-year UST Yield Curve Rate T Note Constant Maturity + 2.15% on 9/23/2031)2 | 13,600 | 11,329 | ||
Bank of America Corp. 4.948% 7/22/2028 (USD-SOFR + 2.04% on 7/22/2027)2 | 20,774 | 20,612 | ||
Bank of America Corp. 5.288% 4/25/2034 (USD-SOFR + 1.91% on 4/25/2033)2 | 3,490 | 3,455 | ||
Bank of America Corp. 5.872% 9/15/2034 (USD-SOFR + 1.84% on 9/15/2033)2 | 7,566 | 7,786 | ||
Bank of America Corp. 5.468% 1/23/2035 (3-month USD CME Term SOFR + 1.65% on 1/23/2034)2 | 21,176 | 21,162 | ||
Bank of East Asia, Ltd. 5.825% junior subordinated perpetual bonds (5-year UST Yield Curve Rate T Note Constant Maturity + 5.527% on 10/21/2025)2 | 4,610 | 4,520 | ||
Bank of New York Mellon Corp. 4.975% 3/14/2030 (USD-SOFR + 1.085% on 3/14/2029)2 | 723 | 719 | ||
Bank of New York Mellon Corp. 5.188% 3/14/2035 (USD-SOFR + 1.418% on 3/14/2034)2 | 10,477 | 10,345 | ||
BBVA Bancomer SA 5.875% 9/13/2034 (5-year UST Yield Curve Rate T Note Constant Maturity + 4.308% on 9/13/2029)2 | 17,200 | 15,958 | ||
BBVA Bancomer SA 8.45% 6/29/2038 (5-year UST Yield Curve Rate T Note Constant Maturity + 4.661% on 6/29/2033)2 | 9,733 | 10,038 | ||
BBVA Bancomer SA 8.45% 6/29/2038 (5-year UST Yield Curve Rate T Note Constant Maturity + 4.661% on 6/29/2033)1,2 | 13,815 | 14,248 | ||
BBVA Bancomer, SA 8.125% 1/8/2039 (5-year UST Yield Curve Rate T Note Constant Maturity + 4.214% on 1/8/2034)1,2 | 4,267 | 4,324 | ||
BlackRock Funding, Inc. 4.70% 3/14/2029 | 501 | 499 | ||
BlackRock Funding, Inc. 5.00% 3/14/2034 | 11,700 | 11,614 | ||
BlackRock Funding, Inc. 5.25% 3/14/2054 | 19,536 | 18,893 | ||
Block, Inc. 2.75% 6/1/2026 | 5,105 | 4,826 | ||
Block, Inc. 3.50% 6/1/2031 | 2,323 | 2,006 | ||
Block, Inc. 6.50% 5/15/20321 | 22,500 | 22,829 | ||
Blue Owl Credit Income Corp. 4.70% 2/8/2027 | 2,171 | 2,067 | ||
BNP Paribas SA 2.159% 9/15/2029 (USD-SOFR + 1.218% on 9/15/2028)1,2 | 283 | 247 | ||
Boost Newco Borrower, LLC 7.50% 1/15/20311 | 19,050 | 19,877 | ||
BPCE SA 2.277% 1/20/2032 (USD-SOFR + 1.312% on 1/20/2031)1,2 | 20,870 | 16,853 | ||
BPCE SA 5.936% 5/30/2035 (USD-SOFR + 1.85% on 5/30/2034)1,2 | 13,366 | 13,319 | ||
Bread Financial Holdings, Inc. 9.75% 3/15/20291 | 9,445 | 9,932 | ||
CaixaBank, SA 6.84% 9/13/2034 (USD-SOFR + 2.77% on 9/13/2033)1,2 | 19,125 | 20,208 | ||
CaixaBank, SA 6.037% 6/15/2035 (USD-SOFR + 2.26% on 9/15/2034)1,2 | 13,750 | 13,788 | ||
Capital One Financial Corp. 5.468% 2/1/2029 (USD-SOFR + 2.08% on 2/1/2028)2 | 4,758 | 4,738 | ||
Capital One Financial Corp. 5.70% 2/1/2030 (USD-SOFR + 1.905% on 2/1/2029)2 | 20,398 | 20,500 |
1 | American Funds Multi-Sector Income Fund |
Bonds, notes & other debt instruments (continued) | Principal amount (000) | Value (000) | ||
Corporate bonds, notes & loans (continued) | ||||
Financials (continued) | ||||
Capital One Financial Corp. 6.377% 6/8/2034 (USD-SOFR + 2.86% on 6/8/2033)2 | USD16,575 | $17,015 | ||
Capital One Financial Corp. 6.051% 2/1/2035 (USD-SOFR + 2.26% on 2/1/2034)2 | 55,143 | 55,492 | ||
Charles Schwab Corp. (The) 5.853% 5/19/2034 (USD-SOFR + 2.50% on 5/19/2033)2 | 4,306 | 4,392 | ||
China Ping An Insurance Overseas (Holdings), Ltd. 2.85% 8/12/2031 | 1,700 | 1,414 | ||
Chubb INA Holdings, LLC 5.00% 3/15/2034 | 22,949 | 22,732 | ||
Citigroup, Inc. 5.174% 2/13/2030 (USD-SOFR + 1.364% on 2/13/2029)2 | 14,425 | 14,344 | ||
Citigroup, Inc. 3.057% 1/25/2033 (USD-SOFR + 1.351% on 1/25/2032)2 | 5,053 | 4,294 | ||
Citigroup, Inc. 3.785% 3/17/2033 (USD-SOFR + 1.939% on 3/17/2032)2 | 10,940 | 9,751 | ||
Citigroup, Inc. 6.27% 11/17/2033 (USD-SOFR + 2.338% on 11/17/2032)2 | 9,917 | 10,391 | ||
Citigroup, Inc. 6.174% 5/25/2034 (USD-SOFR + 2.661% on 5/25/2033)2 | 9,225 | 9,387 | ||
Citigroup, Inc. 5.449% 6/11/2035 (USD-SOFR + 1.447% on 6/11/2034)2 | 1,000 | 993 | ||
CMB International Leasing Management, Ltd. 2.75% 8/12/2030 | 5,505 | 4,826 | ||
Coinbase Global, Inc. 3.375% 10/1/20281 | 15,303 | 13,135 | ||
Coinbase Global, Inc. 3.625% 10/1/20311 | 15,070 | 12,097 | ||
Compass Group Diversified Holdings, LLC 5.25% 4/15/20291 | 29,385 | 27,898 | ||
Compass Group Diversified Holdings, LLC 5.00% 1/15/20321 | 11,605 | 10,512 | ||
Corebridge Financial, Inc. 3.90% 4/5/2032 | 7,009 | 6,276 | ||
Corebridge Financial, Inc. 4.35% 4/5/2042 | 1,622 | 1,338 | ||
Corebridge Financial, Inc. 4.40% 4/5/2052 | 8,947 | 7,042 | ||
Deutsche Bank AG 6.72% 1/18/2029 (USD-SOFR + 3.18% on 1/18/2028)2 | 2,245 | 2,318 | ||
Deutsche Bank AG 6.819% 11/20/2029 (USD-SOFR + 2.51% on 11/20/2028)2 | 5,555 | 5,779 | ||
Fifth Third Bancorp 6.339% 7/27/2029 (USD-SOFR + 2.34% on 7/27/2028)2 | 2,575 | 2,640 | ||
Fifth Third Bancorp 5.631% 1/29/2032 (USD-SOFR + 1.84% on 1/29/2031)2 | 4,911 | 4,870 | ||
Five Corners Funding Trust III 5.791% 2/15/20331 | 5,520 | 5,617 | ||
Goldman Sachs Group, Inc. 6.484% 10/24/2029 (USD-SOFR + 1.77% on 10/24/2028)2 | 9,987 | 10,429 | ||
Goldman Sachs Group, Inc. 5.727% 4/25/2030 (USD-SOFR + 1.265% on 4/25/2029)2 | 16,374 | 16,668 | ||
Goldman Sachs Group, Inc. 1.992% 1/27/2032 (USD-SOFR + 1.09% on 1/27/2031)2 | 6,831 | 5,546 | ||
Goldman Sachs Group, Inc. 2.615% 4/22/2032 (USD-SOFR + 1.281% on 4/22/2031)2 | 3,191 | 2,684 | ||
Goldman Sachs Group, Inc. 2.65% 10/21/2032 (USD-SOFR + 1.264% on 10/21/2031)2 | 12,517 | 10,411 | ||
Goldman Sachs Group, Inc. 3.102% 2/24/2033 (USD-SOFR + 1.41% on 2/24/2032)2 | 21,380 | 18,267 | ||
Goldman Sachs Group, Inc. 5.851% 4/25/2035 (USD-SOFR + 1.552% on 4/25/2034)2 | 31,010 | 31,777 | ||
Goldman Sachs Group, Inc. 2.908% 7/21/2042 (USD-SOFR + 1.40% on 7/21/2041)2 | 1,493 | 1,049 | ||
Goldman Sachs Group, Inc. 3.436% 2/24/2043 (USD-SOFR + 1.632% on 2/24/2042)2 | 686 | 518 | ||
GTCR (AP) Finance, Inc. 8.00% 5/15/20271 | 9,122 | 9,150 | ||
HDFC Bank, Ltd. 3.70% junior subordinated perpetual bonds (5-Year UST Yield Curve Rate T Note Constant Maturity + 2.925% on 2/25/2027)1,2 | 2,000 | 1,858 | ||
Hightower Holding, LLC 6.75% 4/15/20291 | 12,115 | 11,347 | ||
Howden UK Refinance PLC 7.25% 2/15/20311 | 26,375 | 26,198 | ||
Howden UK Refinance 2 PLC 8.125% 2/15/20321 | 25,785 | 25,639 | ||
HSBC Holdings PLC 7.399% 11/13/2034 (USD-SOFR + 3.02% on 11/13/2033)2 | 9,260 | 10,034 | ||
HSBC Holdings PLC 5.719% 3/4/2035 (USD-SOFR + 1.78% on 3/4/2034)2 | 738 | 742 | ||
HSBC Holdings PLC 6.332% 3/9/2044 (USD-SOFR + 2.65% on 3/9/2043)2 | 31,573 | 33,050 | ||
HUB International, Ltd. 5.625% 12/1/20291 | 12,508 | 11,841 | ||
HUB International, Ltd. 7.25% 6/15/20301 | 26,381 | 27,063 | ||
HUB International, Ltd. 7.375% 1/31/20321 | 12,035 | 12,212 | ||
HUB International, Ltd., Term Loan B, (3-month USD CME Term SOFR + 3.25%) 8.575% 6/20/20303,4 | 4,100 | 4,113 | ||
Huntington Bancshares, Inc. 6.208% 8/21/2029 (USD-SOFR + 2.02% on 8/21/2028)2 | 2,900 | 2,962 | ||
Intercontinental Exchange, Inc. 5.25% 6/15/2031 | 4,069 | 4,097 | ||
Iron Mountain Information Management Services, Inc. 5.00% 7/15/20321 | 17,645 | 16,133 | ||
JPMorgan Chase & Co. 1.04% 2/4/2027 (USD-SOFR + 0.695% on 2/4/2026)2 | 5,350 | 4,985 | ||
JPMorgan Chase & Co. 5.571% 4/22/2028 (USD-SOFR + 0.93% on 4/22/2027)2 | 8,005 | 8,072 | ||
JPMorgan Chase & Co. 5.581% 4/22/2030 (USD-SOFR + 1.16% on 4/22/2029)2 | 22,755 | 23,121 | ||
JPMorgan Chase & Co. 1.953% 2/4/2032 (USD-SOFR + 1.065% on 2/4/2031)2 | 2,656 | 2,161 | ||
JPMorgan Chase & Co. 5.336% 1/23/2035 (USD-SOFR + 1.62% on 1/23/2034)2 | 1,700 | 1,691 | ||
JPMorgan Chase & Co. 5.766% 4/22/2035 (USD-SOFR + 1.49% on 4/22/2034)2 | 48,850 | 50,139 | ||
Kasikornbank PCL (Hong Kong Branch) 3.343% 10/2/2031 (5-year UST Yield Curve Rate T Note Constant Maturity + 1.70% on 10/2/2026)2 | 29,100 | 27,169 | ||
Korea Exchange Bank 3.25% 3/30/20271 | 4,110 | 3,916 | ||
Korea Exchange Bank 3.25% 3/30/2027 | 3,890 | 3,707 | ||
Ladder Capital Finance Holdings LLP 7.00% 7/15/20311 | 7,470 | 7,541 | ||
LPL Holdings, Inc. 4.625% 11/15/20271 | 3,009 | 2,913 | ||
LPL Holdings, Inc. 4.00% 3/15/20291 | 13,325 | 12,427 | ||
LPL Holdings, Inc. 4.375% 5/15/20311 | 5,945 | 5,458 | ||
Mastercard, Inc. 4.875% 5/9/2034 | 8,031 | 7,943 | ||
Morgan Stanley 5.123% 2/1/2029 (USD-SOFR + 1.73% on 2/1/2028)2 | 485 | 483 |
American Funds Multi-Sector Income Fund | 2 |
Bonds, notes & other debt instruments (continued) | Principal amount (000) | Value (000) | ||
Corporate bonds, notes & loans (continued) | ||||
Financials (continued) | ||||
Morgan Stanley 5.164% 4/20/2029 (USD-SOFR + 1.59% on 4/20/2028)2 | USD8,976 | $8,949 | ||
Morgan Stanley 5.173% 1/16/2030 (USD-SOFR + 1.45% on 1/16/2029)2 | 4,030 | 4,021 | ||
Morgan Stanley 5.656% 4/18/2030 (USD-SOFR + 1.26% on 4/18/2029)2 | 18,346 | 18,661 | ||
Morgan Stanley 1.794% 2/13/2032 (USD-SOFR + 1.034% on 2/13/2031)2 | 2,804 | 2,251 | ||
Morgan Stanley 5.25% 4/21/2034 (USD-SOFR + 1.87% on 4/21/2033)2 | 5,736 | 5,649 | ||
Morgan Stanley 5.424% 7/21/2034 (USD-SOFR + 1.88% on 7/21/2033)2 | 30,677 | 30,533 | ||
Morgan Stanley 6.627% 11/1/2034 (USD-SOFR + 2.05% on 11/1/2033)2 | 5,787 | 6,252 | ||
Morgan Stanley 5.831% 4/19/2035 (USD-SOFR + 1.58% on 4/19/2034)2 | 49,312 | 50,567 | ||
Morgan Stanley 5.942% 2/7/2039 (5-year UST Yield Curve Rate T Note Constant Maturity + 1.80% on 2/7/2039)2 | 6,416 | 6,349 | ||
Nasdaq, Inc. 5.55% 2/15/2034 | 6,000 | 6,011 | ||
Nasdaq, Inc. 5.95% 8/15/2053 | 8,000 | 8,092 | ||
Nasdaq, Inc. 6.10% 6/28/2063 | 5,000 | 5,092 | ||
Navient Corp. 5.00% 3/15/2027 | 9,220 | 8,811 | ||
Navient Corp. 4.875% 3/15/2028 | 5,190 | 4,769 | ||
Navient Corp. 5.50% 3/15/2029 | 3,330 | 3,043 | ||
Navient Corp. 9.375% 7/25/2030 | 14,000 | 14,735 | ||
Navient Corp. 11.50% 3/15/2031 | 12,580 | 13,870 | ||
Navient Corp. 5.625% 8/1/2033 | 26,875 | 21,477 | ||
New York Life Global Funding 4.90% 6/13/20281 | 4,990 | 4,969 | ||
New York Life Global Funding 4.55% 1/28/20331 | 4,621 | 4,397 | ||
Northwestern Mutual Life Insurance Co. (The) 4.90% 6/12/20281 | 1,990 | 1,978 | ||
OneMain Finance Corp. 7.125% 3/15/2026 | 1,385 | 1,408 | ||
OneMain Finance Corp. 7.50% 5/15/2031 | 26,135 | 26,468 | ||
Osaic Holdings, Inc. 10.75% 8/1/20271 | 7,171 | 7,389 | ||
Osaic Holdings, Inc., Term Loan B3, (3-month USD CME Term SOFR + 4.00%) 9.344% 8/17/20283,4 | 6,444 | 6,471 | ||
Owl Rock Capital Corp. 3.75% 7/22/2025 | 1,063 | 1,037 | ||
Oxford Finance, LLC 6.375% 2/1/20271 | 7,076 | 6,822 | ||
Piraeus Bank SA 5.00% 4/16/2030 (1-year EUR-ICE Swap EURIBOR + 2.245% on 4/16/2029)2 | EUR15,000 | 16,026 | ||
PNC Financial Services Group, Inc. 5.939% 8/18/2034 (USD-SOFR + 1.946% on 8/18/2033)2 | USD16,543 | 16,966 | ||
PNC Financial Services Group, Inc. 6.875% 10/20/2034 (USD-SOFR + 2.284% on 10/20/2033)2 | 46,829 | 51,061 | ||
PNC Financial Services Group, Inc. 5.676% 1/22/2035 (USD-SOFR + 1.902% on 1/22/2034)2 | 5,850 | 5,884 | ||
Power Finance Corp., Ltd. 6.15% 12/6/2028 | 1,200 | 1,230 | ||
Power Finance Corp., Ltd. 4.50% 6/18/2029 | 3,300 | 3,159 | ||
Power Finance Corp., Ltd. 3.90% 9/16/2029 | 2,700 | 2,503 | ||
PT Bank Negara Indonesia (Persero) Tbk 4.30% junior subordinated perpetual bonds (5-year UST Yield Curve Rate T Note Constant Maturity + 3.466% on 3/24/2027)2 | 12,800 | 11,894 | ||
Rede D’Or Finance SARL 4.50% 1/22/20301 | 1,938 | 1,750 | ||
Ryan Specialty Group, LLC 4.375% 2/1/20301 | 15,145 | 14,046 | ||
State Street Corp. 4.821% 1/26/2034 (USD-SOFR + 1.567% on 1/26/2033)2 | 2,000 | 1,934 | ||
State Street Corp. 5.159% 5/18/2034 (USD-SOFR + 1.89% on 5/18/2033)2 | 7,062 | 6,982 | ||
SVB Financial Group 4.70% junior subordinated perpetual bonds (5-year UST Yield Curve Rate T Note Constant Maturity + 3.064% on 11/15/2031)2,5 | 3,843 | 19 | ||
Synchrony Financial 2.875% 10/28/2031 | 15,000 | 12,036 | ||
Synchrony Financial 7.25% 2/2/2033 | 15,000 | 14,924 | ||
Truist Financial Corp. 5.867% 6/8/2034 (USD-SOFR + 2.361% on 6/8/2033)2 | 27,931 | 28,157 | ||
Truist Financial Corp. 5.711% 1/24/2035 (USD-SOFR + 1.922% on 1/24/2034)2 | 16,651 | 16,586 | ||
Truist Insurance Holdings, LLC, Term Loan, (1-month USD CME Term SOFR + 4.75%) 10.073% 3/8/20323,4 | 33,610 | 34,352 | ||
U.S. Bancorp 4.839% 2/1/2034 (USD-SOFR + 1.60% on 2/1/2033)2 | 697 | 661 | ||
U.S. Bancorp 5.836% 6/12/2034 (USD-SOFR + 2.26% on 6/10/2033)2 | 5,143 | 5,217 | ||
U.S. Bancorp 5.678% 1/23/2035 (USD-SOFR + 1.86% on 1/23/2034)2 | 14,575 | 14,637 | ||
UBS Group AG 4.194% 4/1/2031 (USD-SOFR + 3.73% on 4/1/2030)1,2 | 13,027 | 12,165 | ||
UBS Group AG 3.091% 5/14/2032 (USD-SOFR + 1.73% on 5/14/2031)1,2 | 22,025 | 18,796 | ||
UBS Group AG 5.699% 2/8/2035 (1-year UST Yield Curve Rate T Note Constant Maturity + 1.77% on 2/8/2034)1,2 | 17,095 | 17,085 | ||
USI, Inc. 7.50% 1/15/20321 | 6,050 | 6,152 | ||
Wells Fargo & Co. 5.707% 4/22/2028 (USD-SOFR + 1.07% on 4/22/2027)2 | 4,475 | 4,515 | ||
Wells Fargo & Co. 2.393% 6/2/2028 (USD-SOFR + 2.10% on 6/2/2027)2 | 250 | 230 | ||
Wells Fargo & Co. 4.478% 4/4/2031 (USD-SOFR + 4.032% on 4/4/2030)2 | 39,700 | 38,022 | ||
Wells Fargo & Co. 5.389% 4/24/2034 (USD-SOFR + 2.02% on 4/24/2033)2 | 15,870 | 15,695 | ||
Wells Fargo & Co. 5.557% 7/25/2034 (USD-SOFR + 1.99% on 7/25/2033)2 | 22,725 | 22,717 |
3 | American Funds Multi-Sector Income Fund |
Bonds, notes & other debt instruments (continued) | Principal amount (000) | Value (000) | ||
Corporate bonds, notes & loans (continued) | ||||
Financials (continued) | ||||
Wells Fargo & Co. 6.491% 10/23/2034 (USD-SOFR + 2.06% on 10/23/2033)2 | USD12,684 | $13,527 | ||
Wells Fargo & Co. 4.611% 4/25/2053 (USD-SOFR + 2.13% on 4/25/2052)2 | 3,649 | 3,121 | ||
Xiaomi Best Time International, Ltd. 2.875% 7/14/2031 | 3,500 | 2,928 | ||
Xiaomi Best Time International, Ltd. 2.875% 7/14/20311 | 1,805 | 1,510 | ||
Xiaomi Best Time International, Ltd. 4.10% 7/14/20511 | 1,120 | 803 | ||
XP Inc. 6.75% 7/2/20291 | 4,450 | 4,422 | ||
1,982,312 | ||||
Energy 10.85% | ||||
3R Lux SARL 9.75% 2/5/20311 | 12,851 | 13,497 | ||
AI Candelaria (Spain), SLU 5.75% 6/15/20331 | 2,135 | 1,729 | ||
Apache Corp. 4.625% 11/15/2025 | 985 | 973 | ||
Apache Corp. 4.25% 1/15/2030 | 4,000 | 3,735 | ||
Apache Corp. 5.10% 9/1/2040 | 6,770 | 5,782 | ||
Apache Corp. 5.25% 2/1/2042 | 4,450 | 3,847 | ||
Ascent Resources Utica Holdings, LLC 7.00% 11/1/20261 | 5,155 | 5,164 | ||
Ascent Resources Utica Holdings, LLC 8.25% 12/31/20281 | 5,077 | 5,206 | ||
Ascent Resources Utica Holdings, LLC 5.875% 6/30/20291 | 1,925 | 1,883 | ||
Baytex Energy Corp. 8.50% 4/30/20301 | 2,060 | 2,156 | ||
Baytex Energy Corp. 7.375% 3/15/20321 | 15,760 | 16,027 | ||
BIP-V Chinook Holdco, LLC 5.50% 6/15/20311 | 13,735 | 13,030 | ||
Blue Racer Midstream, LLC 7.00% 7/15/20291 | 7,270 | 7,408 | ||
Blue Racer Midstream, LLC 7.25% 7/15/20321 | 5,395 | 5,550 | ||
Borr IHC, Ltd. 10.00% 11/15/20281 | 32,964 | 34,551 | ||
Borr IHC, Ltd. 10.375% 11/15/20301 | 12,197 | 12,786 | ||
BP Capital Markets America, Inc. 4.893% 9/11/2033 | 21,757 | 21,167 | ||
BP Capital Markets America, Inc. 5.227% 11/17/2034 | 1,725 | 1,713 | ||
California Resources Corp. 7.125% 2/1/20261 | 12,000 | 12,037 | ||
Cenovus Energy, Inc. 5.375% 7/15/2025 | 172 | 170 | ||
Cheniere Energy Partners, LP 4.00% 3/1/2031 | 1,340 | 1,219 | ||
Cheniere Energy Partners, LP 5.95% 6/30/2033 | 25,000 | 25,364 | ||
Chesapeake Energy Corp. 5.50% 2/1/20261 | 3,110 | 3,084 | ||
Chesapeake Energy Corp. 5.875% 2/1/20291 | 17,180 | 17,019 | ||
Chesapeake Energy Corp. 6.75% 4/15/20291 | 1,280 | 1,284 | ||
Chevron Corp. 2.236% 5/11/2030 | 5,035 | 4,360 | ||
Chevron Corp. 3.078% 5/11/2050 | 5,214 | 3,562 | ||
CITGO Petroleum Corp. 8.375% 1/15/20291 | 8,040 | 8,294 | ||
Civitas Resources, Inc. 5.00% 10/15/20261 | 12,815 | 12,487 | ||
Civitas Resources, Inc. 8.375% 7/1/20281 | 15,000 | 15,736 | ||
Civitas Resources, Inc. 8.625% 11/1/20301 | 4,200 | 4,507 | ||
Civitas Resources, Inc. 8.75% 7/1/20311 | 25,040 | 26,848 | ||
CNX Resources Corp. 6.00% 1/15/20291 | 8,304 | 8,133 | ||
CNX Resources Corp. 7.375% 1/15/20311 | 5,085 | 5,205 | ||
CNX Resources Corp. 7.25% 3/1/20321 | 15,055 | 15,366 | ||
Comstock Resources, Inc. 6.75% 3/1/20291 | 10,215 | 9,907 | ||
Comstock Resources, Inc. 5.875% 1/15/20301 | 19,635 | 18,284 | ||
ConocoPhillips Co. 5.05% 9/15/2033 | 1,000 | 992 | ||
ConocoPhillips Co. 3.80% 3/15/2052 | 1,311 | 979 | ||
ConocoPhillips Co. 5.30% 5/15/2053 | 4,612 | 4,382 | ||
ConocoPhillips Co. 5.55% 3/15/2054 | 4,790 | 4,717 | ||
Cosan Luxembourg SA 7.50% 6/27/20301 | 4,000 | 4,100 | ||
Crescent Energy Finance, LLC 9.25% 2/15/20281 | 31,295 | 33,096 | ||
Crescent Energy Finance, LLC 7.625% 4/1/20321 | 14,375 | 14,661 | ||
Crescent Energy Finance, LLC 7.375% 1/15/20331 | 11,235 | 11,266 | ||
Diamondback Energy, Inc. 5.15% 1/30/2030 | 6,613 | 6,587 | ||
Diamondback Energy, Inc. 5.40% 4/18/2034 | 23,845 | 23,617 | ||
Diamondback Energy, Inc. 5.75% 4/18/2054 | 11,179 | 10,845 | ||
Diamondback Energy, Inc. 5.90% 4/18/2064 | 7,169 | 6,925 | ||
DT Midstream, Inc. 4.125% 6/15/20291 | 1,755 | 1,623 | ||
DT Midstream, Inc. 4.375% 6/15/20311 | 10,350 | 9,434 | ||
Ecopetrol SA 6.875% 4/29/2030 | 5,990 | 5,757 | ||
Ecopetrol SA 4.625% 11/2/2031 | 250 | 205 | ||
Ecopetrol SA 8.875% 1/13/2033 | 25,585 | 26,439 | ||
Ecopetrol SA 8.375% 1/19/2036 | 9,145 | 8,988 | ||
EIG Pearl Holdings SARL 3.545% 8/31/2036 | 11,700 | 10,059 | ||
Enbridge, Inc. 6.70% 11/15/2053 | 3,580 | 3,912 | ||
Encino Acquisition Partners Holdings, LLC 8.50% 5/1/20281 | 540 | 551 |
American Funds Multi-Sector Income Fund | 4 |
Bonds, notes & other debt instruments (continued) | Principal amount (000) | Value (000) | ||
Corporate bonds, notes & loans (continued) | ||||
Energy (continued) | ||||
Encino Acquisition Partners Holdings, LLC 8.75% 5/1/20311 | USD10,535 | $10,993 | ||
Energean Israel Finance, Ltd. 5.875% 3/30/20311 | 930 | 790 | ||
Energy Transfer, LP 6.00% 2/1/20291 | 1,165 | 1,174 | ||
Energy Transfer, LP 7.375% 2/1/20311 | 291 | 304 | ||
Energy Transfer, LP 5.60% 9/1/2034 | 14,579 | 14,492 | ||
Energy Transfer, LP 5.95% 5/15/2054 | 13,000 | 12,667 | ||
Energy Transfer, LP 6.05% 9/1/2054 | 7,896 | 7,791 | ||
Eni SpA 5.50% 5/15/20341 | 22,628 | 22,428 | ||
Eni SpA 5.95% 5/15/20541 | 28,437 | 27,949 | ||
EQM Midstream Partners, LP 6.00% 7/1/20251 | 2,025 | 2,027 | ||
EQM Midstream Partners, LP 7.50% 6/1/20271 | 232 | 237 | ||
EQM Midstream Partners, LP 6.50% 7/1/20271 | 8,175 | 8,269 | ||
EQM Midstream Partners, LP 4.50% 1/15/20291 | 8,195 | 7,740 | ||
EQM Midstream Partners, LP 6.375% 4/1/20291 | 3,175 | 3,209 | ||
EQM Midstream Partners, LP 7.50% 6/1/20301 | 5,167 | 5,517 | ||
EQM Midstream Partners, LP 4.75% 1/15/20311 | 9,671 | 9,049 | ||
EQM Midstream Partners, LP 6.50% 7/15/2048 | 1,150 | 1,162 | ||
EQT Corp. 3.625% 5/15/20311 | 1,554 | 1,372 | ||
Exxon Mobil Corp. 2.61% 10/15/2030 | 23,075 | 20,256 | ||
Exxon Mobil Corp. 3.452% 4/15/2051 | 750 | 542 | ||
FORESEA Holding SA 7.50% 6/15/2030 | 3,680 | 3,431 | ||
Galaxy Pipeline Assets Bidco, Ltd. 2.94% 9/30/2040 | 11,814 | 9,466 | ||
Genesis Energy, LP 8.00% 1/15/2027 | 12,251 | 12,537 | ||
Genesis Energy, LP 8.25% 1/15/2029 | 5,895 | 6,091 | ||
Genesis Energy, LP 8.875% 4/15/2030 | 6,849 | 7,211 | ||
Genesis Energy, LP 7.875% 5/15/2032 | 4,890 | 4,940 | ||
GeoPark, Ltd. 5.50% 1/17/2027 | 14,090 | 12,821 | ||
Global Partners, LP 8.25% 1/15/20321 | 4,465 | 4,593 | ||
Guara Norte SARL 5.198% 6/15/2034 | 4,089 | 3,772 | ||
Guara Norte SARL 5.198% 6/15/20341 | 1,573 | 1,451 | ||
Harvest Midstream I, LP 7.50% 9/1/20281 | 11,290 | 11,480 | ||
Harvest Midstream I, LP 7.50% 5/15/20321 | 4,610 | 4,686 | ||
Hilcorp Energy I, LP 5.75% 2/1/20291 | 5,380 | 5,210 | ||
Hilcorp Energy I, LP 6.00% 4/15/20301 | 7,441 | 7,193 | ||
Hilcorp Energy I, LP 6.00% 2/1/20311 | 6,220 | 5,960 | ||
Hilcorp Energy I, LP 6.25% 4/15/20321 | 8,180 | 7,873 | ||
Hilcorp Energy I, LP 8.375% 11/1/20331 | 12,860 | 13,715 | ||
Kinder Morgan, Inc. 4.80% 2/1/2033 | 20,000 | 18,965 | ||
Kinder Morgan, Inc. 5.20% 6/1/2033 | 4,198 | 4,076 | ||
Kinder Morgan, Inc. 5.40% 2/1/2034 | 25,186 | 24,810 | ||
Kinder Morgan, Inc. 5.20% 3/1/2048 | 15 | 13 | ||
Kinder Morgan, Inc. 3.25% 8/1/2050 | 669 | 427 | ||
Kinder Morgan, Inc. 5.45% 8/1/2052 | 6,191 | 5,700 | ||
Kinetik Holdings, LP 6.625% 12/15/20281 | 10,245 | 10,416 | ||
Kodiak Gas Services, LLC 7.25% 2/15/20291 | 3,925 | 4,027 | ||
Leviathan Bond, Ltd. 6.75% 6/30/20301 | 5,870 | 5,253 | ||
MEG Energy Corp. 5.875% 2/1/20291 | 3,030 | 2,950 | ||
Mesquite Energy, Inc. 7.25% 2/15/20231,5 | 27 | 1 | ||
Modec Finance BV 7.84% 7/15/20266,7 | 9,000 | 9,049 | ||
MPLX, LP 4.95% 9/1/2032 | 15,613 | 14,945 | ||
MPLX, LP 4.70% 4/15/2048 | 5,900 | 4,858 | ||
MPLX, LP 4.95% 3/14/2052 | 10,000 | 8,484 | ||
Murphy Oil Corp. 5.875% 12/1/2027 | 2,567 | 2,566 | ||
MV24 Capital BV 6.748% 6/1/2034 | 6,671 | 6,378 | ||
Nabors Industries, Inc. 7.375% 5/15/20271 | 6,230 | 6,342 | ||
Nabors Industries, Inc. 9.125% 1/31/20301 | 16,395 | 16,998 | ||
New Fortress Energy, Inc. 6.75% 9/15/20251 | 4,982 | 4,840 | ||
New Fortress Energy, Inc. 6.50% 9/30/20261 | 39,100 | 36,003 | ||
New Fortress Energy, Inc. 8.75% 3/15/20291 | 40,750 | 37,233 | ||
New Fortress Energy, Inc., Term Loan, (3-month USD CME Term SOFR + 5.00%) 10.33% 10/30/20283,4 | 930 | 907 | ||
NGL Energy Operating, LLC 8.125% 2/15/20291 | 13,620 | 13,888 | ||
NGL Energy Operating, LLC 8.375% 2/15/20321 | 14,275 | 14,506 | ||
Noble Finance II, LLC 8.00% 4/15/20301 | 2,800 | 2,916 | ||
Northern Oil and Gas, Inc. 8.125% 3/1/20281 | 15,385 | 15,570 | ||
Northern Oil and Gas, Inc. 8.75% 6/15/20311 | 9,305 | 9,775 | ||
Occidental Petroleum Corp. 6.625% 9/1/2030 | 2,473 | 2,595 |
5 | American Funds Multi-Sector Income Fund |
Bonds, notes & other debt instruments (continued) | Principal amount (000) | Value (000) | ||
Corporate bonds, notes & loans (continued) | ||||
Energy (continued) | ||||
Occidental Petroleum Corp. 6.125% 1/1/2031 | USD664 | $680 | ||
Occidental Petroleum Corp. 4.40% 8/15/2049 | 1,972 | 1,474 | ||
Oleoducto Central SA 4.00% 7/14/20271 | 5,210 | 4,833 | ||
Oleoducto Central SA 4.00% 7/14/2027 | 1,250 | 1,160 | ||
ONEOK, Inc. 6.05% 9/1/2033 | 8,318 | 8,568 | ||
ONEOK, Inc. 4.45% 9/1/2049 | 1,600 | 1,259 | ||
ONEOK, Inc. 3.95% 3/1/2050 | 1,000 | 726 | ||
ONEOK, Inc. 4.50% 3/15/2050 | 1,500 | 1,188 | ||
Permian Resources Operating, LLC 8.00% 4/15/20271 | 4,090 | 4,186 | ||
Permian Resources Operating, LLC 5.875% 7/1/20291 | 11,000 | 10,838 | ||
Permian Resources Operating, LLC 9.875% 7/15/20311 | 10,930 | 12,108 | ||
Permian Resources Operating, LLC 7.00% 1/15/20321 | 8,165 | 8,393 | ||
Petrobras Global Finance BV 7.375% 1/17/2027 | 1,600 | 1,653 | ||
Petroleos Mexicanos 6.875% 10/16/2025 | 6,250 | 6,232 | ||
Petroleos Mexicanos 4.50% 1/23/2026 | 5,084 | 4,841 | ||
Petroleos Mexicanos 6.875% 8/4/2026 | 7,711 | 7,556 | ||
Petroleos Mexicanos 6.49% 1/23/2027 | 6,932 | 6,659 | ||
Petroleos Mexicanos 6.50% 3/13/2027 | 12,080 | 11,518 | ||
Petroleos Mexicanos 8.75% 6/2/2029 | 5,791 | 5,692 | ||
Petroleos Mexicanos 5.95% 1/28/2031 | 8,570 | 6,912 | ||
Petroleos Mexicanos 6.70% 2/16/2032 | 13,886 | 11,635 | ||
Petroleos Mexicanos 10.00% 2/7/2033 | 22,000 | 22,094 | ||
Petroleos Mexicanos 6.95% 1/28/2060 | 12,540 | 8,304 | ||
PTTEP Treasury Center Co., Ltd. 2.993% 1/15/2030 | 1,474 | 1,319 | ||
Raizen Fuels Finance SA 6.45% 3/5/20341 | 3,980 | 4,045 | ||
Raizen Fuels Finance SA 6.95% 3/5/20541 | 2,740 | 2,789 | ||
Range Resources Corp. 4.875% 5/15/2025 | 5,110 | 5,082 | ||
Range Resources Corp. 8.25% 1/15/2029 | 5,290 | 5,486 | ||
Range Resources Corp. 4.75% 2/15/20301 | 4,745 | 4,455 | ||
Saturn Oil & Gas, Inc. 9.625% 6/15/20291 | 12,120 | 12,243 | ||
Seadrill Finance, Ltd. 8.375% 8/1/20301 | 5,395 | 5,643 | ||
Shell International Finance BV 2.75% 4/6/2030 | 6,441 | 5,746 | ||
Shell International Finance BV 3.25% 4/6/2050 | 24 | 17 | ||
Shell International Finance BV 3.00% 11/26/2051 | 15,178 | 9,947 | ||
SM Energy Co. 6.50% 7/15/2028 | 590 | 585 | ||
Southwestern Energy Co. 5.70% 1/23/20252 | 2,825 | 2,823 | ||
Southwestern Energy Co. 8.375% 9/15/2028 | 9,335 | 9,659 | ||
Southwestern Energy Co. 5.375% 3/15/2030 | 1,975 | 1,909 | ||
Southwestern Energy Co. 4.75% 2/1/2032 | 2,145 | 1,975 | ||
Suburban Propane Partners, LP 5.00% 6/1/20311 | 4,980 | 4,489 | ||
Sunoco, LP 6.00% 4/15/2027 | 5,165 | 5,162 | ||
Sunoco, LP 7.00% 5/1/20291 | 15,410 | 15,804 | ||
Sunoco, LP 4.50% 5/15/2029 | 7,331 | 6,862 | ||
Sunoco, LP 4.50% 4/30/2030 | 430 | 398 | ||
Sunoco, LP 7.25% 5/1/20321 | 10,155 | 10,511 | ||
Superior Plus, LP 4.50% 3/15/20291 | 4,853 | 4,458 | ||
Talos Production, Inc. 9.00% 2/1/20291 | 6,850 | 7,195 | ||
Talos Production, Inc. 9.375% 2/1/20311 | 5,655 | 5,974 | ||
Targa Resources Partners, LP 4.875% 2/1/2031 | 774 | 739 | ||
TotalEnergies Capital International SA 3.127% 5/29/2050 | 12,551 | 8,469 | ||
TotalEnergies Capital SA 5.15% 4/5/2034 | 1,656 | 1,657 | ||
Transocean Aquila, Ltd. 8.00% 9/30/20281 | 5,875 | 5,974 | ||
Transocean Poseidon, Ltd. 6.875% 2/1/20271 | 7,173 | 7,170 | ||
Transocean Titan Financing, Ltd. 8.375% 2/1/20281 | 11,101 | 11,468 | ||
Transocean, Inc. 8.00% 2/1/20271 | 4,291 | 4,280 | ||
Transocean, Inc. 8.25% 5/15/20291 | 14,100 | 14,145 | ||
Transocean, Inc. 8.75% 2/15/20301 | 22,610 | 23,756 | ||
Transocean, Inc. 7.50% 4/15/2031 | 4,400 | 4,131 | ||
Transocean, Inc. 8.50% 5/15/20311 | 12,090 | 12,105 | ||
Transocean, Inc. 6.80% 3/15/2038 | 7,850 | 6,518 | ||
USA Compression Partners, LP 7.125% 3/15/20291 | 10,730 | 10,821 | ||
Vallourec SA 7.50% 4/15/20321 | 17,685 | 18,335 | ||
Venture Global Calcasieu Pass, LLC 3.875% 8/15/20291 | 12,680 | 11,556 | ||
Venture Global Calcasieu Pass, LLC 6.25% 1/15/20301 | 5,824 | 5,914 | ||
Venture Global Calcasieu Pass, LLC 4.125% 8/15/20311 | 17,220 | 15,464 | ||
Venture Global LNG, Inc. 8.125% 6/1/20281 | 10,000 | 10,310 | ||
Venture Global LNG, Inc. 8.375% 6/1/20311 | 6,190 | 6,425 |
American Funds Multi-Sector Income Fund | 6 |
Bonds, notes & other debt instruments (continued) | Principal amount (000) | Value (000) | ||
Corporate bonds, notes & loans (continued) | ||||
Energy (continued) | ||||
Vital Energy, Inc. 7.875% 4/15/20321 | USD18,545 | $18,866 | ||
Williams Companies, Inc. 2.60% 3/15/2031 | 9,000 | 7,606 | ||
Williams Companies, Inc. 4.65% 8/15/2032 | 5,276 | 5,014 | ||
Williams Companies, Inc. 5.15% 3/15/2034 | 22,363 | 21,827 | ||
1,618,729 | ||||
Health care 8.96% | ||||
AbbVie, Inc. 4.80% 3/15/2029 | 23,150 | 23,065 | ||
AbbVie, Inc. 3.20% 11/21/2029 | 8,050 | 7,389 | ||
AbbVie, Inc. 5.05% 3/15/2034 | 77,443 | 77,245 | ||
AbbVie, Inc. 5.35% 3/15/2044 | 1,175 | 1,162 | ||
AbbVie, Inc. 5.40% 3/15/2054 | 26,205 | 25,931 | ||
AbbVie, Inc. 5.50% 3/15/2064 | 3,125 | 3,087 | ||
AdaptHealth, LLC 6.125% 8/1/20281 | 3,875 | 3,703 | ||
AdaptHealth, LLC 4.625% 8/1/20291 | 11,155 | 9,678 | ||
AdaptHealth, LLC 5.125% 3/1/20301 | 16,259 | 14,238 | ||
Amgen, Inc. 5.15% 3/2/2028 | 21,120 | 21,121 | ||
Amgen, Inc. 5.25% 3/2/2030 | 29,132 | 29,355 | ||
Amgen, Inc. 4.20% 3/1/2033 | 14,000 | 12,977 | ||
Amgen, Inc. 5.25% 3/2/2033 | 34,651 | 34,567 | ||
Amgen, Inc. 5.60% 3/2/2043 | 3,740 | 3,688 | ||
Amgen, Inc. 3.00% 1/15/2052 | 100 | 66 | ||
Amgen, Inc. 4.875% 3/1/2053 | 5,675 | 5,001 | ||
Amgen, Inc. 5.65% 3/2/2053 | 14,273 | 14,066 | ||
Amgen, Inc. 5.75% 3/2/2063 | 21,310 | 20,887 | ||
AstraZeneca Finance, LLC 1.75% 5/28/2028 | 5,266 | 4,672 | ||
AstraZeneca Finance, LLC 4.85% 2/26/2029 | 13,630 | 13,606 | ||
AstraZeneca Finance, LLC 4.90% 3/3/2030 | 7,332 | 7,364 | ||
AstraZeneca Finance, LLC 4.90% 2/26/2031 | 9,580 | 9,559 | ||
AstraZeneca Finance, LLC 5.00% 2/26/2034 | 16,050 | 15,967 | ||
AthenaHealth Group, Inc. 6.50% 2/15/20301 | 3,125 | 2,880 | ||
Avantor Funding, Inc. 4.625% 7/15/20281 | 5,615 | 5,348 | ||
Avantor Funding, Inc. 3.875% 11/1/20291 | 12,915 | 11,755 | ||
Bausch Health Americas, Inc. 9.25% 4/1/20261 | 2,930 | 2,658 | ||
Bausch Health Americas, Inc. 8.50% 1/31/20271 | 8,415 | 5,862 | ||
Bausch Health Companies, Inc. 5.50% 11/1/20251 | 13,705 | 12,779 | ||
Bausch Health Companies, Inc. 9.00% 12/15/20251 | 10,076 | 9,139 | ||
Bausch Health Companies, Inc. 5.75% 8/15/20271 | 200 | 160 | ||
Bausch Health Companies, Inc. 5.00% 2/15/20291 | 14,000 | 6,795 | ||
Bausch Health Companies, Inc. 5.25% 1/30/20301 | 1,220 | 573 | ||
Bausch Health Companies, Inc. 5.25% 2/15/20311 | 15,464 | 7,250 | ||
Baxter International, Inc. 1.915% 2/1/2027 | 2,150 | 1,971 | ||
Baxter International, Inc. 2.272% 12/1/2028 | 11,125 | 9,808 | ||
Baxter International, Inc. 2.539% 2/1/2032 | 27,032 | 22,182 | ||
Baxter International, Inc. 3.132% 12/1/2051 | 8,657 | 5,431 | ||
Bayer US Finance, LLC 6.50% 11/21/20331 | 18,563 | 18,997 | ||
Bayer US Finance, LLC 6.875% 11/21/20531 | 3,181 | 3,270 | ||
Becton, Dickinson and Co. 4.874% 2/8/2029 | 1,350 | 1,340 | ||
Becton, Dickinson and Co. 5.081% 6/7/2029 | 8,215 | 8,209 | ||
Becton, Dickinson and Co. 5.11% 2/8/2034 | 850 | 838 | ||
Bristol-Myers Squibb Co. 4.90% 2/22/2029 | 5,355 | 5,346 | ||
Bristol-Myers Squibb Co. 5.10% 2/22/2031 | 3,850 | 3,866 | ||
Bristol-Myers Squibb Co. 5.20% 2/22/2034 | 72,450 | 72,329 | ||
Bristol-Myers Squibb Co. 5.50% 2/22/2044 | 5,300 | 5,245 | ||
Bristol-Myers Squibb Co. 6.25% 11/15/2053 | 1,690 | 1,816 | ||
Bristol-Myers Squibb Co. 5.55% 2/22/2054 | 19,926 | 19,659 | ||
Bristol-Myers Squibb Co. 6.40% 11/15/2063 | 3,370 | 3,662 | ||
Bristol-Myers Squibb Co. 5.65% 2/22/2064 | 4,250 | 4,155 | ||
Catalent Pharma Solutions, Inc. 5.00% 7/15/20271 | 4,785 | 4,696 | ||
Catalent Pharma Solutions, Inc., Term Loan B4, (3-month USD CME Term SOFR + 3.00%) 8.344% 2/22/20283,4 | 3,485 | 3,492 | ||
Cencora, Inc. 2.80% 5/15/2030 | 2,607 | 2,300 | ||
Cencora, Inc. 2.70% 3/15/2031 | 2,423 | 2,069 | ||
Centene Corp. 2.45% 7/15/2028 | 20,947 | 18,614 | ||
Centene Corp. 4.625% 12/15/2029 | 14,515 | 13,739 | ||
Centene Corp. 3.375% 2/15/2030 | 644 | 572 | ||
Centene Corp. 3.00% 10/15/2030 | 610 | 522 |
7 | American Funds Multi-Sector Income Fund |
Bonds, notes & other debt instruments (continued) | Principal amount (000) | Value (000) | ||
Corporate bonds, notes & loans (continued) | ||||
Health care (continued) | ||||
Centene Corp. 2.50% 3/1/2031 | USD5,104 | $4,193 | ||
Centene Corp. 2.625% 8/1/2031 | 4,440 | 3,651 | ||
Charles River Laboratories International, Inc. 4.25% 5/1/20281 | 3,618 | 3,422 | ||
Charles River Laboratories International, Inc. 3.75% 3/15/20291 | 5,730 | 5,236 | ||
Charles River Laboratories International, Inc. 4.00% 3/15/20311 | 2,340 | 2,090 | ||
CHS / Community Health Systems, Inc. 5.625% 3/15/20271 | 12,740 | 11,875 | ||
CHS / Community Health Systems, Inc. 6.875% 4/15/20291 | 1,200 | 919 | ||
Cigna Group (The) 5.25% 2/15/2034 | 7,915 | 7,809 | ||
Concentra Escrow Issuer Corp. 6.875% 7/15/20321 | 3,010 | 3,053 | ||
CVS Health Corp. 5.40% 6/1/2029 | 1,525 | 1,527 | ||
CVS Health Corp. 1.75% 8/21/2030 | 3,625 | 2,948 | ||
CVS Health Corp. 5.55% 6/1/2031 | 862 | 863 | ||
CVS Health Corp. 5.25% 2/21/2033 | 1,500 | 1,465 | ||
CVS Health Corp. 5.70% 6/1/2034 | 30,420 | 30,349 | ||
CVS Health Corp. 6.00% 6/1/2044 | 20,000 | 19,612 | ||
CVS Health Corp. 5.625% 2/21/2053 | 2,470 | 2,295 | ||
CVS Health Corp. 5.875% 6/1/2053 | 4,934 | 4,731 | ||
CVS Health Corp. 6.05% 6/1/2054 | 20,500 | 20,119 | ||
CVS Health Corp. 6.00% 6/1/2063 | 2,344 | 2,247 | ||
Elevance Health, Inc. 5.375% 6/15/2034 | 15,000 | 15,077 | ||
Endo Finance Holdings, Inc. 8.50% 4/15/20311 | 19,845 | 20,504 | ||
Endo International PLC, Term Loan B, (3-month USD CME Term SOFR + 4.50%) 9.826% 4/23/20313,4 | 23,135 | 23,113 | ||
Fortrea Holdings, Inc. 7.50% 7/1/20301 | 6,790 | 6,755 | ||
Fortrea Holdings, Inc., Term Loan B, (3-month USD CME Term SOFR + 3.75%) 9.094% 7/1/20303,4 | 424 | 425 | ||
GE HealthCare Technologies, Inc. 5.857% 3/15/2030 | 2,710 | 2,786 | ||
Gilead Sciences, Inc. 5.25% 10/15/2033 | 7,361 | 7,418 | ||
Gilead Sciences, Inc. 2.80% 10/1/2050 | 225 | 141 | ||
Gilead Sciences, Inc. 5.55% 10/15/2053 | 4,070 | 4,067 | ||
Grifols, SA 7.50% 5/1/20306 | EUR24,665 | 26,415 | ||
HCA, Inc. 5.625% 9/1/2028 | USD4,360 | 4,400 | ||
HCA, Inc. 5.875% 2/1/2029 | 2,870 | 2,923 | ||
HCA, Inc. 5.45% 4/1/2031 | 1,985 | 1,984 | ||
HCA, Inc. 2.375% 7/15/2031 | 10,953 | 8,997 | ||
Humana, Inc. 5.375% 4/15/2031 | 855 | 851 | ||
Humana, Inc. 5.75% 4/15/2054 | 5,109 | 4,927 | ||
IQVIA, Inc. 5.00% 10/15/20261 | 8,105 | 7,959 | ||
IQVIA, Inc. 6.50% 5/15/20301 | 4,305 | 4,373 | ||
Johnson & Johnson 4.80% 6/1/2029 | 1,750 | 1,764 | ||
Johnson & Johnson 4.90% 6/1/2031 | 16,870 | 17,041 | ||
Johnson & Johnson 4.95% 6/1/2034 | 11,125 | 11,259 | ||
Johnson & Johnson 5.25% 6/1/2054 | 2,260 | 2,271 | ||
Medline Borrower, LP 3.875% 4/1/20291 | 1,560 | 1,438 | ||
Medline Borrower, LP 6.25% 4/1/20291 | 9,598 | 9,719 | ||
Medline Borrower, LP 5.25% 10/1/20291 | 16,310 | 15,578 | ||
Medline Borrower, LP, Term Loan B, (3-month USD CME Term SOFR + 2.75%) 8.094% 10/23/20283,4 | 2,413 | 2,422 | ||
Molina Healthcare, Inc. 3.875% 11/15/20301 | 10,000 | 8,897 | ||
Molina Healthcare, Inc. 3.875% 5/15/20321 | 22,000 | 19,083 | ||
Owens & Minor, Inc. 4.50% 3/31/20291 | 1,600 | 1,381 | ||
Owens & Minor, Inc. 6.625% 4/1/20301 | 14,927 | 13,586 | ||
Pfizer Investment Enterprises Pte., Ltd. 4.45% 5/19/2028 | 383 | 376 | ||
Pfizer Investment Enterprises Pte., Ltd. 4.75% 5/19/2033 | 47,373 | 46,179 | ||
Pfizer Investment Enterprises Pte., Ltd. 5.11% 5/19/2043 | 10,300 | 9,799 | ||
Pfizer Investment Enterprises Pte., Ltd. 5.30% 5/19/2053 | 10,882 | 10,503 | ||
Radiology Partners, Inc. 3.50% PIK and 4.28% Cash 1/31/20291,8 | 26,839 | 25,195 | ||
Radiology Partners, Inc. 9.78% PIK 2/15/20301,8 | 15,007 | 12,024 | ||
Radiology Partners, Inc., Term Loan B, (3-month USD CME Term SOFR + 5.00%) 1.50% PIK and 9.08% Cash 1/31/20293,4,8 | 5,745 | 5,465 | ||
Rede D’Or Finance SARL 4.95% 1/17/2028 | 590 | 560 | ||
Rede D’Or Finance SARL 4.50% 1/22/2030 | 2,590 | 2,339 | ||
Roche Holdings, Inc. 2.076% 12/13/20311 | 231 | 189 | ||
Roche Holdings, Inc. 5.593% 11/13/20331 | 6,588 | 6,835 | ||
Roche Holdings, Inc. 4.985% 3/8/20341 | 14,825 | 14,707 | ||
Roche Holdings, Inc. 5.218% 3/8/20541 | 1,856 | 1,827 |
American Funds Multi-Sector Income Fund | 8 |
Bonds, notes & other debt instruments (continued) | Principal amount (000) | Value (000) | ||
Corporate bonds, notes & loans (continued) | ||||
Health care (continued) | ||||
Solventum Corp. 5.60% 3/23/20341 | USD7,900 | $7,762 | ||
Sterigenics-Nordion Holdings, LLC 7.375% 6/1/20311 | 12,185 | 12,218 | ||
Summa Health 3.511% 11/15/2051 | 995 | 726 | ||
Surgery Center Holdings, Inc. 7.25% 4/15/20321 | 7,395 | 7,479 | ||
Team Health Holdings, Inc., Term Loan B, (3-month USD CME Term SOFR + 5.25%) 10.58% 3/2/20273,4 | 789 | 735 | ||
Tenet Healthcare Corp. 6.25% 2/1/2027 | 440 | 440 | ||
Tenet Healthcare Corp. 6.125% 10/1/2028 | 7,730 | 7,697 | ||
Tenet Healthcare Corp. 4.25% 6/1/2029 | 1,870 | 1,743 | ||
Tenet Healthcare Corp. 6.75% 5/15/2031 | 8,780 | 8,919 | ||
Teva Pharmaceutical Finance Netherlands III BV 4.75% 5/9/2027 | 9,075 | 8,757 | ||
Teva Pharmaceutical Finance Netherlands III BV 6.75% 3/1/2028 | 28,260 | 28,955 | ||
Teva Pharmaceutical Finance Netherlands III BV 5.125% 5/9/2029 | 29,085 | 28,004 | ||
Teva Pharmaceutical Finance Netherlands III BV 7.875% 9/15/2029 | 8,340 | 8,968 | ||
Teva Pharmaceutical Finance Netherlands III BV 8.125% 9/15/2031 | 21,281 | 23,688 | ||
Teva Pharmaceutical Finance Netherlands III BV 4.10% 10/1/2046 | 12,000 | 8,394 | ||
UnitedHealth Group, Inc. 4.70% 4/15/2029 | 1,425 | 1,414 | ||
UnitedHealth Group, Inc. 4.90% 4/15/2031 | 1,100 | 1,090 | ||
UnitedHealth Group, Inc. 5.00% 4/15/2034 | 825 | 815 | ||
UnitedHealth Group, Inc. 2.90% 5/15/2050 | 10,868 | 7,055 | ||
UnitedHealth Group, Inc. 3.25% 5/15/2051 | 221 | 152 | ||
UnitedHealth Group, Inc. 4.75% 5/15/2052 | 1,210 | 1,072 | ||
UnitedHealth Group, Inc. 4.95% 5/15/2062 | 159 | 142 | ||
UnitedHealth Group, Inc. 6.05% 2/15/2063 | 124 | 131 | ||
1,336,033 | ||||
Consumer discretionary 6.56% | ||||
Advance Auto Parts, Inc. 1.75% 10/1/2027 | 3,295 | 2,884 | ||
Advance Auto Parts, Inc. 5.95% 3/9/2028 | 1,848 | 1,834 | ||
Advance Auto Parts, Inc. 3.90% 4/15/2030 | 16,277 | 14,720 | ||
Advance Auto Parts, Inc. 3.50% 3/15/2032 | 20,772 | 17,659 | ||
Aimbridge Acquisition Co., Inc., Term Loan B, (3-month USD CME Term SOFR + 3.75%) 9.208% 2/2/20263,4 | 16,269 | 15,919 | ||
Alibaba Group Holding, Ltd. 2.125% 2/9/2031 | 7,500 | 6,200 | ||
Allied Universal Holdco, LLC 9.75% 7/15/20271 | 12,580 | 12,516 | ||
Allied Universal Holdco, LLC 4.625% 6/1/20281 | 12,760 | 11,653 | ||
Allied Universal Holdco, LLC 6.00% 6/1/20291 | 1,810 | 1,586 | ||
Allwyn Entertainment Financing (UK) PLC 7.875% 4/30/20291 | 17,277 | 17,862 | ||
Amazon.com, Inc. 4.70% 12/1/2032 | 3,000 | 2,975 | ||
Amazon.com, Inc. 3.95% 4/13/2052 | 1,750 | 1,408 | ||
Arcos Dorados BV 6.125% 5/27/20291 | 2,000 | 1,960 | ||
Arcos Dorados BV 6.125% 5/27/2029 | 460 | 451 | ||
Arcos Dorados Holdings, Inc. 5.875% 4/4/2027 | 2,440 | 2,389 | ||
Asbury Automotive Group, Inc. 4.625% 11/15/20291 | 13,675 | 12,655 | ||
Asbury Automotive Group, Inc. 5.00% 2/15/20321 | 2,325 | 2,108 | ||
Atlas LuxCo 4 SARL 4.625% 6/1/20281 | 10,000 | 9,122 | ||
AutoNation, Inc. 3.85% 3/1/2032 | 8,000 | 7,109 | ||
Bath & Body Works, Inc. 6.625% 10/1/20301 | 2,010 | 2,018 | ||
Bath & Body Works, Inc. 6.875% 11/1/2035 | 12,922 | 13,045 | ||
Bath & Body Works, Inc. 6.75% 7/1/2036 | 7,055 | 7,031 | ||
Boyd Gaming Corp. 4.75% 12/1/2027 | 11,120 | 10,724 | ||
Boyd Gaming Corp. 4.75% 6/15/20311 | 3,500 | 3,174 | ||
Boyne USA, Inc. 4.75% 5/15/20291 | 16,545 | 15,449 | ||
Caesars Entertainment, Inc. 4.625% 10/15/20291 | 21,999 | 20,184 | ||
Caesars Entertainment, Inc. 7.00% 2/15/20301 | 17,650 | 18,044 | ||
Caesars Entertainment, Inc. 6.50% 2/15/20321 | 9,245 | 9,296 | ||
Carnival Corp. 5.75% 3/1/20271 | 19,000 | 18,782 | ||
Carnival Corp. 4.00% 8/1/20281 | 3,500 | 3,289 | ||
Carnival Corp. 6.00% 5/1/20291 | 28,585 | 28,255 | ||
Carnival Corp. 7.00% 8/15/20291 | 10,920 | 11,326 | ||
Carnival Corp. 10.50% 6/1/20301 | 6,625 | 7,202 | ||
Clarios Global, LP 6.75% 5/15/20251 | 180 | 180 | ||
Clarios Global, LP 6.25% 5/15/20261 | 140 | 140 | ||
Clarios Global, LP 8.50% 5/15/20271 | 6,010 | 6,055 | ||
Cougar JV Subsidiary, LLC 8.00% 5/15/20321 | 13,560 | 14,033 | ||
Daimler Trucks Finance North America, LLC 5.375% 6/25/20341 | 7,779 | 7,693 | ||
Fertitta Entertainment, LLC 4.625% 1/15/20291 | 7,663 | 6,984 |
9 | American Funds Multi-Sector Income Fund |
Bonds, notes & other debt instruments (continued) | Principal amount (000) | Value (000) | ||
Corporate bonds, notes & loans (continued) | ||||
Consumer discretionary (continued) | ||||
Fertitta Entertainment, LLC 6.75% 1/15/20301 | USD424 | $373 | ||
First Student Bidco, Inc. 4.00% 7/31/20291 | 15,250 | 13,755 | ||
First Student Bidco, Inc., Term Loan B, (3-month USD CME Term SOFR + 3.00%) 8.596% 7/21/20283,4 | 465 | 466 | ||
First Student Bidco, Inc., Term Loan C, (3-month USD CME Term SOFR + 3.00%) 8.596% 7/21/20283,4 | 141 | 142 | ||
Ford Motor Co. 6.10% 8/19/2032 | 22,570 | 22,553 | ||
Ford Motor Co. 4.75% 1/15/2043 | 4,993 | 4,041 | ||
Ford Motor Co. 5.291% 12/8/2046 | 9,007 | 7,889 | ||
Ford Motor Credit Co., LLC 5.125% 6/16/2025 | 2,920 | 2,899 | ||
Ford Motor Credit Co., LLC 2.70% 8/10/2026 | 1,000 | 940 | ||
Ford Motor Credit Co., LLC 5.85% 5/17/2027 | 2,500 | 2,501 | ||
Ford Motor Credit Co., LLC 4.95% 5/28/2027 | 11,820 | 11,543 | ||
Ford Motor Credit Co., LLC 3.815% 11/2/2027 | 14,750 | 13,844 | ||
Ford Motor Credit Co., LLC 6.798% 11/7/2028 | 2,683 | 2,773 | ||
Ford Motor Credit Co., LLC 7.20% 6/10/2030 | 5,305 | 5,583 | ||
Ford Motor Credit Co., LLC 4.00% 11/13/2030 | 1,720 | 1,536 | ||
Ford Motor Credit Co., LLC 7.122% 11/7/2033 | 9,001 | 9,517 | ||
Ford Motor Credit Co., LLC 6.125% 3/8/2034 | 6,648 | 6,580 | ||
Ford Otomotiv Sanayi AS 7.125% 4/25/20291 | 11,465 | 11,589 | ||
Grand Canyon University 4.375% 10/1/2026 | 6,750 | 6,733 | ||
Hanesbrands, Inc. 4.875% 5/15/20261 | 425 | 416 | ||
Hanesbrands, Inc. 9.00% 2/15/20311 | 38,129 | 39,982 | ||
Hanesbrands, Inc., Term Loan B, (3-month USD CME Term SOFR + 3.75%) 9.094% 3/8/20303,4 | 11,683 | 11,732 | ||
Harley-Davidson Financial Services, Inc. 5.95% 6/11/20291 | 15,608 | 15,579 | ||
Hilton Grand Vacations Borrower, LLC 5.00% 6/1/20291 | 470 | 439 | ||
Home Depot, Inc. 4.75% 6/25/2029 | 14,385 | 14,305 | ||
Home Depot, Inc. 1.375% 3/15/2031 | 2,291 | 1,826 | ||
Home Depot, Inc. 4.85% 6/25/2031 | 10,732 | 10,651 | ||
Home Depot, Inc. 4.95% 6/25/2034 | 4,372 | 4,328 | ||
Home Depot, Inc. 3.125% 12/15/2049 | 135 | 92 | ||
Home Depot, Inc. 5.30% 6/25/2054 | 3,362 | 3,285 | ||
Home Depot, Inc. 5.40% 6/25/2064 | 11,102 | 10,829 | ||
Hyundai Capital America 5.30% 6/24/20291 | 7,977 | 7,936 | ||
International Game Technology PLC 6.50% 2/15/20251 | 200 | 200 | ||
International Game Technology PLC 4.125% 4/15/20261 | 565 | 550 | ||
International Game Technology PLC 5.25% 1/15/20291 | 1,670 | 1,617 | ||
LCM Investments Holdings II, LLC 4.875% 5/1/20291 | 12,243 | 11,462 | ||
LCM Investments Holdings II, LLC 8.25% 8/1/20311 | 12,740 | 13,305 | ||
Levi Strauss & Co. 3.50% 3/1/20311 | 9,775 | 8,466 | ||
Light and Wonder International, Inc. 7.00% 5/15/20281 | 5,555 | 5,587 | ||
Light and Wonder International, Inc. 7.25% 11/15/20291 | 7,580 | 7,747 | ||
Light and Wonder International, Inc. 7.50% 9/1/20311 | 5,365 | 5,548 | ||
Lithia Motors, Inc. 3.875% 6/1/20291 | 5,345 | 4,806 | ||
Lithia Motors, Inc. 4.375% 1/15/20311 | 250 | 223 | ||
Macy’s Retail Holdings, LLC 6.125% 3/15/20321 | 960 | 918 | ||
Marriott Ownership Resorts, Inc. 4.50% 6/15/20291 | 7,540 | 6,935 | ||
McDonald’s Corp. 5.00% 5/17/2029 | 5,953 | 5,949 | ||
McDonald’s Corp. 3.60% 7/1/2030 | 1,084 | 1,004 | ||
McDonald’s Corp. 4.95% 8/14/2033 | 2,000 | 1,971 | ||
McDonald’s Corp. 5.20% 5/17/2034 | 5,668 | 5,693 | ||
McDonald’s Corp. 5.15% 9/9/2052 | 3,605 | 3,328 | ||
Melco Resorts Finance, Ltd. 7.625% 4/17/20321 | 4,400 | 4,370 | ||
MercadoLibre, Inc. 2.375% 1/14/2026 | 1,200 | 1,139 | ||
MercadoLibre, Inc. 3.125% 1/14/2031 | 3,525 | 2,990 | ||
NCL Corp., Ltd. 5.875% 2/15/20271 | 2,280 | 2,252 | ||
NCL Corp., Ltd. 7.75% 2/15/20291 | 2,925 | 3,043 | ||
NCL Finance, Ltd. 6.125% 3/15/20281 | 2,500 | 2,471 | ||
Neiman Marcus Group, Ltd., LLC 7.125% 4/1/20261 | 8,120 | 8,029 | ||
Party City Holdings, Inc. 0% 10/12/20286 | 50 | — 9 | ||
Party City Holdings, Inc. 12.00% PIK 1/11/20291,8 | 7,384 | 7,132 | ||
RHP Hotel Properties, LP 7.25% 7/15/20281 | 5,464 | 5,654 | ||
RHP Hotel Properties, LP 4.50% 2/15/20291 | 8,425 | 7,908 | ||
Royal Caribbean Cruises, Ltd. 4.25% 7/1/20261 | 12,260 | 11,874 | ||
Royal Caribbean Cruises, Ltd. 3.70% 3/15/2028 | 11,780 | 11,017 | ||
Royal Caribbean Cruises, Ltd. 5.50% 4/1/20281 | 14,800 | 14,621 |
American Funds Multi-Sector Income Fund | 10 |
Bonds, notes & other debt instruments (continued) | Principal amount (000) | Value (000) | ||
Corporate bonds, notes & loans (continued) | ||||
Consumer discretionary (continued) | ||||
Royal Caribbean Cruises, Ltd. 8.25% 1/15/20291 | USD20,090 | $21,226 | ||
Royal Caribbean Cruises, Ltd. 9.25% 1/15/20291 | 770 | 823 | ||
Royal Caribbean Cruises, Ltd. 7.25% 1/15/20301 | 3,784 | 3,920 | ||
Royal Caribbean Cruises, Ltd. 6.25% 3/15/20321 | 2,235 | 2,255 | ||
Sally Holdings, LLC 6.75% 3/1/2032 | 7,614 | 7,529 | ||
Sands China, Ltd. 4.375% 6/18/2030 | 6,700 | 6,177 | ||
Scientific Games Holdings, LP 6.625% 3/1/20301 | 7,930 | 7,736 | ||
Scientific Games Holdings, LP, Term Loan, (3-month USD CME Term SOFR + 3.00%) 8.306% 4/4/20293,4 | 8,925 | 8,920 | ||
Sonic Automotive, Inc. 4.625% 11/15/20291 | 19,340 | 17,477 | ||
Sonic Automotive, Inc. 4.875% 11/15/20311 | 26,185 | 23,074 | ||
Station Casinos, LLC 6.625% 3/15/20321 | 5,565 | 5,542 | ||
Studio City Finance, Ltd. 5.00% 1/15/2029 | 3,540 | 3,119 | ||
Tapestry, Inc. 7.85% 11/27/2033 | 8,782 | 9,254 | ||
Toyota Motor Credit Corp. 1.90% 1/13/2027 | 5,470 | 5,061 | ||
Universal Entertainment Corp. 8.75% 12/11/20241 | 13,943 | 15,021 | ||
Vail Resorts, Inc. 6.50% 5/15/20321 | 6,070 | 6,146 | ||
Valvoline, Inc. 3.625% 6/15/20311 | 9,120 | 7,869 | ||
Wand NewCo 3, Inc. 7.625% 1/30/20321 | 5,205 | 5,380 | ||
Wand NewCo 3, Inc., Term Loan B, (3-month USD CME Term SOFR + 3.75%) 9.094% 1/30/20313,4 | 6,135 | 6,182 | ||
WASH Multifamily Acquisition, Inc. 5.75% 4/15/20261 | 22,715 | 22,227 | ||
Wyndham Hotels & Resorts, Inc. 4.375% 8/15/20281 | 13,385 | 12,487 | ||
Wynn Resorts Finance, LLC 5.125% 10/1/20291 | 1,544 | 1,469 | ||
Wynn Resorts Finance, LLC 7.125% 2/15/20311 | 18,104 | 18,785 | ||
978,059 | ||||
Industrials 5.77% | ||||
AAR Escrow Issuer, LLC 6.75% 3/15/20291 | 4,519 | 4,611 | ||
ADT Security Corp. 4.125% 8/1/20291 | 2,230 | 2,058 | ||
Ambipar Lux SARL 9.875% 2/6/20311 | 8,215 | 7,972 | ||
American Airlines, Inc. 8.50% 5/15/20291 | 7,800 | 8,109 | ||
Apple Bidco, LLC, Term Loan, (3-month USD CME Term SOFR + 2.75%) 8.208% 9/22/20283,4 | 3,900 | 3,906 | ||
Avis Budget Car Rental, LLC 4.75% 4/1/20281 | 1,880 | 1,727 | ||
Avis Budget Car Rental, LLC 5.375% 3/1/20291 | 2,130 | 1,951 | ||
Avis Budget Car Rental, LLC 8.00% 2/15/20311 | 315 | 312 | ||
BAE Systems PLC 5.30% 3/26/20341 | 14,822 | 14,692 | ||
BOC Aviation, Ltd. 3.00% 9/11/2029 | 2,579 | 2,317 | ||
BOC Aviation, Ltd. 2.625% 9/17/2030 | 1,121 | 966 | ||
Boeing Co. 2.75% 2/1/2026 | 500 | 475 | ||
Boeing Co. 2.196% 2/4/2026 | 25 | 24 | ||
Boeing Co. 3.25% 2/1/2028 | 1,078 | 988 | ||
Boeing Co. 5.15% 5/1/2030 | 24,076 | 23,127 | ||
Boeing Co. 3.625% 2/1/2031 | 4,143 | 3,628 | ||
Boeing Co. 6.388% 5/1/20311 | 23,298 | 23,728 | ||
Boeing Co. 6.528% 5/1/20341 | 11,407 | 11,685 | ||
Boeing Co. 3.50% 3/1/2039 | 7,463 | 5,319 | ||
Boeing Co. 5.705% 5/1/2040 | 5,363 | 4,947 | ||
Boeing Co. 5.805% 5/1/2050 | 2,858 | 2,578 | ||
Boeing Co. 6.858% 5/1/20541 | 15,936 | 16,366 | ||
Boeing Co. 5.93% 5/1/2060 | 10,000 | 8,947 | ||
Bombardier, Inc. 7.125% 6/15/20261 | 2,482 | 2,520 | ||
Bombardier, Inc. 7.875% 4/15/20271 | 3,444 | 3,455 | ||
Bombardier, Inc. 6.00% 2/15/20281 | 4,685 | 4,636 | ||
Bombardier, Inc. 8.75% 11/15/20301 | 11,920 | 12,898 | ||
Burlington Northern Santa Fe, LLC 3.55% 2/15/2050 | 750 | 552 | ||
Burlington Northern Santa Fe, LLC 3.30% 9/15/2051 | 479 | 334 | ||
Burlington Northern Santa Fe, LLC 2.875% 6/15/2052 | 3,710 | 2,346 | ||
Burlington Northern Santa Fe, LLC 5.20% 4/15/2054 | 9,990 | 9,578 | ||
Burlington Northern Santa Fe, LLC 5.50% 3/15/2055 | 6,706 | 6,723 | ||
Canadian National Railway Co. 6.125% 11/1/2053 | 1,276 | 1,412 | ||
Canadian Pacific Railway Co. 1.75% 12/2/2026 | 435 | 401 | ||
Canadian Pacific Railway Co. 3.10% 12/2/2051 | 19,127 | 12,715 | ||
Carrier Global Corp. 2.722% 2/15/2030 | 500 | 442 | ||
Carrier Global Corp. 2.70% 2/15/2031 | 500 | 430 | ||
Carrier Global Corp. 5.90% 3/15/2034 | 1,763 | 1,841 |
11 | American Funds Multi-Sector Income Fund |
Bonds, notes & other debt instruments (continued) | Principal amount (000) | Value (000) | ||
Corporate bonds, notes & loans (continued) | ||||
Industrials (continued) | ||||
Carrier Global Corp. 3.577% 4/5/2050 | USD1,955 | $1,424 | ||
Carrier Global Corp. 6.20% 3/15/2054 | 10,861 | 11,639 | ||
Clarivate Science Holdings Corp. 3.875% 7/1/20281 | 4,000 | 3,720 | ||
Clarivate Science Holdings Corp. 4.875% 7/1/20291 | 5,600 | 5,203 | ||
Clean Harbors, Inc. 6.375% 2/1/20311 | 5,635 | 5,655 | ||
CoreLogic, Inc. 4.50% 5/1/20281 | 5,502 | 4,999 | ||
CoreLogic, Inc., Term Loan, (3-month USD CME Term SOFR + 3.50%) 8.958% 6/2/20283,4 | 10,073 | 9,916 | ||
CoreLogic, Inc., Term Loan, (3-month USD CME Term SOFR + 6.50%) 11.958% 6/4/20293,4 | 4,225 | 4,146 | ||
Cornerstone Building Brands, Inc., Term Loan B, (3-month USD CME Term SOFR + 3.25%) 8.679% 4/12/20283,4 | 142 | 139 | ||
CSX Corp. 4.10% 11/15/2032 | 4,479 | 4,185 | ||
CSX Corp. 5.20% 11/15/2033 | 3,166 | 3,175 | ||
CSX Corp. 4.50% 3/15/2049 | 25 | 21 | ||
CSX Corp. 2.50% 5/15/2051 | 4,765 | 2,818 | ||
Dun & Bradstreet Corp. (The) 5.00% 12/15/20291 | 14,963 | 13,909 | ||
Empresa de Transporte de Pasajeros Metro SA 4.70% 5/7/20501 | 400 | 328 | ||
Enviri Corp. 5.75% 7/31/20271 | 5,874 | 5,589 | ||
EquipmentShare.com, Inc. 9.00% 5/15/20281 | 3,275 | 3,384 | ||
EquipmentShare.com, Inc. 8.625% 5/15/20321 | 20,910 | 21,708 | ||
General Dynamics Corp. 1.15% 6/1/2026 | 4,600 | 4,278 | ||
General Dynamics Corp. 3.625% 4/1/2030 | 5,230 | 4,905 | ||
Herc Holdings, Inc. 6.625% 6/15/20291 | 14,355 | 14,567 | ||
Hertz Corp. (The) 4.625% 12/1/20261 | 7,885 | 5,729 | ||
Hertz Corp. (The) 12.625% 7/15/20291 | 4,870 | 5,040 | ||
Hertz Corp. (The), Term Loan B-EXIT, (3-month USD CME Term SOFR + 3.25%) 8.859% 6/30/20283,4 | 4,631 | 4,200 | ||
Hertz Corp. (The), Term Loan C-EXIT, (3-month USD CME Term SOFR + 3.25%) 8.859% 6/30/20283,4 | 894 | 807 | ||
Hidrovias International Finance SARL 4.95% 2/8/2031 | 4,800 | 4,059 | ||
Honeywell International, Inc. 4.875% 9/1/2029 | 1,275 | 1,277 | ||
Honeywell International, Inc. 4.95% 9/1/2031 | 1,000 | 1,001 | ||
Honeywell International, Inc. 5.00% 3/1/2035 | 12,490 | 12,388 | ||
Honeywell International, Inc. 5.25% 3/1/2054 | 2,500 | 2,428 | ||
Honeywell International, Inc. 5.35% 3/1/2064 | 375 | 364 | ||
Howmet Aerospace, Inc. 6.875% 5/1/2025 | 1,085 | 1,094 | ||
Hutchison Whampoa International, Ltd. 7.45% 11/24/2033 | 4,040 | 4,632 | ||
Icahn Enterprises, LP 6.25% 5/15/2026 | 10,064 | 9,993 | ||
Icahn Enterprises, LP 5.25% 5/15/2027 | 16,420 | 15,427 | ||
Icahn Enterprises, LP 9.75% 1/15/20291 | 16,715 | 17,338 | ||
Ingersoll-Rand, Inc. 5.176% 6/15/2029 | 758 | 758 | ||
Ingersoll-Rand, Inc. 5.314% 6/15/2031 | 8,579 | 8,628 | ||
Ingersoll-Rand, Inc. 5.45% 6/15/2034 | 7,894 | 7,966 | ||
IRB Infrastructure Developers, Ltd. 7.11% 3/11/20321 | 11,295 | 11,295 | ||
Lima Metro Line 2 Finance, Ltd. 5.875% 7/5/20341 | 3,905 | 3,849 | ||
Lima Metro Line 2 Finance, Ltd. 5.875% 7/5/2034 | 3,433 | 3,384 | ||
Lockheed Martin Corp. 4.50% 2/15/2029 | 5,343 | 5,263 | ||
Lockheed Martin Corp. 1.85% 6/15/2030 | 2,497 | 2,105 | ||
Lockheed Martin Corp. 3.90% 6/15/2032 | 2,230 | 2,081 | ||
Lockheed Martin Corp. 5.25% 1/15/2033 | 6,045 | 6,148 | ||
Lockheed Martin Corp. 4.75% 2/15/2034 | 182 | 177 | ||
Lockheed Martin Corp. 4.80% 8/15/2034 | 18,662 | 18,231 | ||
Lockheed Martin Corp. 5.20% 2/15/2064 | 1,312 | 1,242 | ||
Mexico City Airport Trust 4.25% 10/31/2026 | 5,400 | 5,221 | ||
Mexico City Airport Trust 3.875% 4/30/2028 | 5,000 | 4,723 | ||
Mileage Plus Holdings, LLC 6.50% 6/20/20271 | 7,953 | 7,975 | ||
Miter Brands Acquisition Holdco, Inc. 6.75% 4/1/20321 | 5,340 | 5,381 | ||
NESCO Holdings II, Inc. 5.50% 4/15/20291 | 9,480 | 8,791 | ||
Norfolk Southern Corp. 5.05% 8/1/2030 | 2,788 | 2,785 | ||
Norfolk Southern Corp. 4.45% 3/1/2033 | 1,343 | 1,268 | ||
Norfolk Southern Corp. 5.35% 8/1/2054 | 19,390 | 18,506 | ||
Northrop Grumman Corp. 4.70% 3/15/2033 | 16,114 | 15,554 | ||
Northrop Grumman Corp. 4.90% 6/1/2034 | 4,445 | 4,324 | ||
Northrop Grumman Corp. 5.20% 6/1/2054 | 475 | 445 | ||
OCP SA 3.75% 6/23/2031 | 7,600 | 6,567 | ||
PM General Purchaser, LLC 9.50% 10/1/20281 | 6,950 | 7,107 |
American Funds Multi-Sector Income Fund | 12 |
Bonds, notes & other debt instruments (continued) | Principal amount (000) | Value (000) | ||
Corporate bonds, notes & loans (continued) | ||||
Industrials (continued) | ||||
Regal Rexnord Corp. 6.30% 2/15/2030 | USD20,000 | $20,456 | ||
Regal Rexnord Corp. 6.40% 4/15/2033 | 20,000 | 20,476 | ||
Republic Services, Inc. 1.45% 2/15/2031 | 6,195 | 4,916 | ||
Republic Services, Inc. 5.00% 12/15/2033 | 3,000 | 2,938 | ||
Republic Services, Inc. 5.20% 11/15/2034 | 13,325 | 13,234 | ||
Reworld Holding Corp. 4.875% 12/1/20291 | 19,406 | 17,732 | ||
Ritchie Bros. Holdings, Inc. 6.75% 3/15/20281 | 1,001 | 1,020 | ||
Ritchie Bros. Holdings, Inc. 7.75% 3/15/20311 | 1,876 | 1,962 | ||
RTX Corp. 5.15% 2/27/2033 | 5,000 | 4,950 | ||
RTX Corp. 6.10% 3/15/2034 | 8,532 | 8,985 | ||
RTX Corp. 6.40% 3/15/2054 | 3,120 | 3,404 | ||
Sensata Technologies BV 4.00% 4/15/20291 | 13,995 | 12,861 | ||
Sensata Technologies, Inc. 3.75% 2/15/20311 | 380 | 331 | ||
SkyMiles IP, Ltd. 4.75% 10/20/20281 | 770 | 750 | ||
SkyMiles IP, Ltd., Term Loan, (3-month USD CME Term SOFR + 3.75%) 9.075% 10/20/20273,4 | 322 | 330 | ||
Spirit AeroSystems, Inc. 4.60% 6/15/2028 | 18,300 | 17,158 | ||
Spirit AeroSystems, Inc. 9.375% 11/30/20291 | 7,444 | 8,024 | ||
Spirit AeroSystems, Inc. 9.75% 11/15/20301 | 10,110 | 11,165 | ||
Spirit AeroSystems, Inc., Term Loan, (3-month CME Term SOFR + 4.25%) 9.58% 1/15/20273,4 | 393 | 396 | ||
TransDigm, Inc. 5.50% 11/15/2027 | 3,400 | 3,342 | ||
TransDigm, Inc. 6.75% 8/15/20281 | 9,080 | 9,202 | ||
TransDigm, Inc. 4.625% 1/15/2029 | 12,015 | 11,221 | ||
TransDigm, Inc. 6.375% 3/1/20291 | 6,340 | 6,380 | ||
TransDigm, Inc. 4.875% 5/1/2029 | 1,990 | 1,866 | ||
TransDigm, Inc. 6.625% 3/1/20321 | 8,150 | 8,242 | ||
Triumph Group, Inc. 9.00% 3/15/20281 | 4,941 | 5,186 | ||
Uber Technologies, Inc. 8.00% 11/1/20261 | 13,360 | 13,491 | ||
Union Pacific Corp. 2.80% 2/14/2032 | 13,200 | 11,395 | ||
Union Pacific Corp. 4.30% 3/1/2049 | 75 | 63 | ||
Union Pacific Corp. 3.25% 2/5/2050 | 13 | 9 | ||
Union Pacific Corp. 2.95% 3/10/2052 | 8,965 | 5,775 | ||
Union Pacific Corp. 4.95% 5/15/2053 | 1,000 | 933 | ||
United Airlines, Inc. 4.375% 4/15/20261 | 1,620 | 1,567 | ||
United Airlines, Inc. 4.625% 4/15/20291 | 1,315 | 1,226 | ||
United Rentals (North America), Inc. 5.25% 1/15/2030 | 5,300 | 5,141 | ||
United Rentals (North America), Inc. 3.75% 1/15/2032 | 4,600 | 4,007 | ||
United Rentals (North America), Inc. 6.125% 3/15/20341 | 6,130 | 6,115 | ||
Waste Management, Inc. 4.625% 2/15/2030 | 10,000 | 9,843 | ||
Waste Management, Inc. 4.625% 2/15/2033 | 5,500 | 5,315 | ||
WESCO Distribution, Inc. 7.25% 6/15/20281 | 6,985 | 7,117 | ||
WESCO Distribution, Inc. 6.625% 3/15/20321 | 10,095 | 10,214 | ||
860,713 | ||||
Communication services 4.76% | ||||
Altice France Holding SA 10.50% 5/15/20271 | 1,520 | 608 | ||
Altice France SA 5.125% 7/15/20291 | 14,433 | 9,514 | ||
Altice France SA 5.50% 10/15/20291 | 3,500 | 2,312 | ||
América Móvil, SAB de CV 4.70% 7/21/2032 | 10,000 | 9,635 | ||
AT&T, Inc. 2.25% 2/1/2032 | 500 | 406 | ||
AT&T, Inc. 5.40% 2/15/2034 | 7,000 | 7,003 | ||
AT&T, Inc. 3.55% 9/15/2055 | 15,245 | 10,287 | ||
Axiata SPV5 (Labuan), Ltd. 3.064% 8/19/2050 | 6,300 | 4,187 | ||
CCO Holdings, LLC 5.00% 2/1/20281 | 4,885 | 4,571 | ||
CCO Holdings, LLC 6.375% 9/1/20291 | 8,275 | 7,872 | ||
CCO Holdings, LLC 4.75% 3/1/20301 | 14,300 | 12,395 | ||
CCO Holdings, LLC 4.50% 8/15/20301 | 7,111 | 6,025 | ||
CCO Holdings, LLC 4.25% 2/1/20311 | 9,700 | 7,927 | ||
CCO Holdings, LLC 4.75% 2/1/20321 | 8,000 | 6,558 | ||
CCO Holdings, LLC 4.50% 5/1/2032 | 2,445 | 1,971 | ||
CCO Holdings, LLC 4.50% 6/1/20331 | 26,420 | 20,816 | ||
CCO Holdings, LLC 4.25% 1/15/20341 | 27,820 | 21,140 | ||
Charter Communications Operating, LLC 6.10% 6/1/2029 | 822 | 825 | ||
Charter Communications Operating, LLC 2.30% 2/1/2032 | 6,600 | 5,093 | ||
Charter Communications Operating, LLC 4.40% 4/1/2033 | 11,365 | 10,025 | ||
Charter Communications Operating, LLC 6.65% 2/1/2034 | 10,000 | 10,107 |
13 | American Funds Multi-Sector Income Fund |
Bonds, notes & other debt instruments (continued) | Principal amount (000) | Value (000) | ||
Corporate bonds, notes & loans (continued) | ||||
Communication services (continued) | ||||
Charter Communications Operating, LLC 3.70% 4/1/2051 | USD47,750 | $29,064 | ||
Charter Communications Operating, LLC 3.90% 6/1/2052 | 710 | 446 | ||
Charter Communications Operating, LLC 5.25% 4/1/2053 | 18,330 | 14,395 | ||
Comcast Corp. 5.10% 6/1/2029 | 3,175 | 3,194 | ||
Comcast Corp. 4.80% 5/15/2033 | 3,744 | 3,646 | ||
Comcast Corp. 5.30% 6/1/2034 | 37,095 | 37,202 | ||
Comcast Corp. 2.887% 11/1/2051 | 1,555 | 971 | ||
Comcast Corp. 5.35% 5/15/2053 | 850 | 815 | ||
Comcast Corp. 5.65% 6/1/2054 | 9,792 | 9,782 | ||
Connect Finco SARL 6.75% 10/1/20261 | 17,086 | 16,505 | ||
Consolidated Communications, Inc. 5.00% 10/1/20281 | 1,400 | 1,159 | ||
Diamond Sports Group, LLC 6.625% 8/15/20271,5 | 3,175 | 66 | ||
Diamond Sports Group, LLC, Term Loan, 5.00% 12/2/20243,8 | 178 | 253 | ||
DIRECTV Financing, LLC 5.875% 8/15/20271 | 12,385 | 11,660 | ||
DIRECTV Financing, LLC, Term Loan, (3-month USD CME Term SOFR + 5.00%) 10.458% 8/2/20273,4 | 1,711 | 1,718 | ||
DISH DBS Corp. 5.875% 11/15/2024 | 42,275 | 40,177 | ||
DISH DBS Corp. 7.75% 7/1/2026 | 5,975 | 3,715 | ||
DISH Network Corp. 11.75% 11/15/20271 | 20,200 | 19,825 | ||
Embarq Corp. 7.995% 6/1/2036 | 1,955 | 257 | ||
Frontier Communications Holdings, LLC 6.75% 5/1/20291 | 23,417 | 21,503 | ||
Frontier Communications Holdings, LLC 5.875% 11/1/2029 | 11,709 | 10,213 | ||
Frontier Communications Holdings, LLC 6.00% 1/15/20301 | 9,075 | 7,908 | ||
Gray Television, Inc. 7.00% 5/15/20271 | 3,871 | 3,568 | ||
Gray Television, Inc. 10.50% 7/15/20291 | 26,320 | 26,487 | ||
Gray Television, Inc. 4.75% 10/15/20301 | 7,680 | 4,616 | ||
Gray Television, Inc. 5.375% 11/15/20311 | 20,795 | 11,805 | ||
Gray Television, Inc., Term Loan B, (1-month USD CME Term SOFR + 5.25%) 10.57% 5/23/20293,4 | 6,720 | 6,397 | ||
Ligado Networks, LLC 15.50% PIK 11/1/20231,5,8 | 2,000 | 295 | ||
Meta Platforms, Inc. 4.45% 8/15/2052 | 40,000 | 34,508 | ||
Midas OpCo Holdings, LLC 5.625% 8/15/20291 | 6,603 | 6,104 | ||
Netflix, Inc. 5.375% 11/15/20291 | 5,947 | 6,007 | ||
Netflix, Inc. 4.875% 6/15/20301 | 237 | 233 | ||
News Corp. 3.875% 5/15/20291 | 17,947 | 16,536 | ||
Nexstar Media, Inc. 4.75% 11/1/20281 | 13,800 | 12,282 | ||
PLDT, Inc. 2.50% 1/23/2031 | 5,500 | 4,625 | ||
SBA Tower Trust 1.631% 11/15/20261 | 4,000 | 3,636 | ||
Scripps Escrow II, Inc. 3.875% 1/15/20291 | 1,500 | 1,046 | ||
Sirius XM Radio, Inc. 3.125% 9/1/20261 | 2,310 | 2,175 | ||
Sirius XM Radio, Inc. 4.00% 7/15/20281 | 10,305 | 9,318 | ||
Sirius XM Radio, Inc. 4.125% 7/1/20301 | 17,005 | 14,538 | ||
Sirius XM Radio, Inc. 3.875% 9/1/20311 | 31,215 | 25,505 | ||
Tencent Holdings, Ltd. 3.975% 4/11/2029 | 2,400 | 2,282 | ||
Tencent Holdings, Ltd. 3.68% 4/22/2041 | 593 | 462 | ||
Tencent Holdings, Ltd. 3.24% 6/3/2050 | 5,584 | 3,659 | ||
Tencent Holdings, Ltd. 3.24% 6/3/20501 | 1,400 | 917 | ||
Tencent Holdings, Ltd. 3.84% 4/22/2051 | 6,423 | 4,683 | ||
T-Mobile USA, Inc. 4.85% 1/15/2029 | 4,000 | 3,951 | ||
T-Mobile USA, Inc. 3.875% 4/15/2030 | 300 | 281 | ||
T-Mobile USA, Inc. 2.55% 2/15/2031 | 20,748 | 17,618 | ||
T-Mobile USA, Inc. 5.15% 4/15/2034 | 1,450 | 1,426 | ||
T-Mobile USA, Inc. 3.40% 10/15/2052 | 1,160 | 793 | ||
Univision Communications, Inc. 8.00% 8/15/20281 | 4,620 | 4,510 | ||
Univision Communications, Inc. 4.50% 5/1/20291 | 45,709 | 38,463 | ||
Univision Communications, Inc. 7.375% 6/30/20301 | 19,796 | 18,429 | ||
Univision Communications, Inc. 8.50% 7/31/20311 | 14,750 | 14,339 | ||
Verizon Communications, Inc. 1.75% 1/20/2031 | 10,984 | 8,892 | ||
Verizon Communications, Inc. 2.55% 3/21/2031 | 853 | 725 | ||
Verizon Communications, Inc. 2.355% 3/15/2032 | 1,125 | 920 | ||
Virgin Media Secured Finance PLC 4.50% 8/15/20301 | 765 | 649 | ||
VMED O2 UK Financing I PLC 4.25% 1/31/20311 | 610 | 507 | ||
WarnerMedia Holdings, Inc. 5.141% 3/15/2052 | 725 | 565 | ||
WMG Acquisition Corp. 3.75% 12/1/20291 | 1,535 | 1,393 | ||
WMG Acquisition Corp. 3.875% 7/15/20301 | 745 | 666 | ||
Ziggo BV 4.875% 1/15/20301 | 730 | 650 | ||
710,212 |
American Funds Multi-Sector Income Fund | 14 |
Bonds, notes & other debt instruments (continued) | Principal amount (000) | Value (000) | ||
Corporate bonds, notes & loans (continued) | ||||
Materials 4.75% | ||||
Alliance Resource Operating Partners, LP 8.625% 6/15/20291 | USD14,169 | $14,552 | ||
Alpek, SAB de CV 3.25% 2/25/2031 | 8,300 | 7,006 | ||
Alpek, SAB de CV 3.25% 2/25/20311 | 1,100 | 929 | ||
ArcelorMittal SA 4.25% 7/16/2029 | 722 | 691 | ||
ARD Finance SA 6.50% Cash 6/30/20271,8 | 7,753 | 1,973 | ||
Ardagh Metal Packaging Finance PLC 4.00% 9/1/20291 | 32,320 | 27,387 | ||
ATI, Inc. 4.875% 10/1/2029 | 12,345 | 11,556 | ||
ATI, Inc. 7.25% 8/15/2030 | 4,275 | 4,419 | ||
ATI, Inc. 5.125% 10/1/2031 | 6,210 | 5,747 | ||
Axalta Coating Systems Dutch Holding B BV 7.25% 2/15/20311 | 4,175 | 4,341 | ||
Axalta Coating Systems, LLC 4.75% 6/15/20271 | 11,005 | 10,711 | ||
BHP Billiton Finance (USA), Ltd. 4.90% 2/28/2033 | 3,102 | 3,043 | ||
BHP Billiton Finance (USA), Ltd. 5.25% 9/8/2033 | 15,331 | 15,348 | ||
BHP Billiton Finance (USA), Ltd. 5.50% 9/8/2053 | 7,924 | 7,870 | ||
Braskem Idesa SAPI 7.45% 11/15/2029 | 4,900 | 3,993 | ||
Braskem Idesa SAPI 7.45% 11/15/20291 | 2,150 | 1,752 | ||
Braskem Idesa SAPI 6.99% 2/20/2032 | 29,775 | 22,609 | ||
Braskem Idesa SAPI 6.99% 2/20/20321 | 5,880 | 4,465 | ||
Braskem Netherlands Finance BV 4.50% 1/10/2028 | 8,742 | 7,966 | ||
Braskem Netherlands Finance BV 4.50% 1/31/20301 | 1,170 | 990 | ||
Braskem Netherlands Finance BV 4.50% 1/31/2030 | 850 | 719 | ||
Braskem Netherlands Finance BV 8.50% 1/12/20311 | 9,551 | 9,763 | ||
Braskem Netherlands Finance BV 8.50% 1/12/2031 | 5,258 | 5,375 | ||
Braskem Netherlands Finance BV 7.25% 2/13/20331 | 9,535 | 8,996 | ||
Braskem Netherlands Finance BV 7.25% 2/13/2033 | 8,200 | 7,737 | ||
Braskem Netherlands Finance BV 5.875% 1/31/20501 | 400 | 296 | ||
CAN-PACK Spolka Akcyjna 3.875% 11/15/20291 | 265 | 238 | ||
Celanese US Holdings, LLC 6.35% 11/15/2028 | 10,129 | 10,412 | ||
Celanese US Holdings, LLC 6.379% 7/15/2032 | 15,286 | 15,718 | ||
Celanese US Holdings, LLC 6.70% 11/15/2033 | 5,138 | 5,402 | ||
Cleveland-Cliffs, Inc. 5.875% 6/1/2027 | 630 | 626 | ||
Cleveland-Cliffs, Inc. 4.625% 3/1/20291 | 405 | 384 | ||
Cleveland-Cliffs, Inc. 4.875% 3/1/20311 | 387 | 343 | ||
Cleveland-Cliffs, Inc. 7.00% 3/15/20321 | 1,386 | 1,372 | ||
Consolidated Energy Finance SA 6.50% 5/15/20261 | 1,565 | 1,515 | ||
Consolidated Energy Finance SA 12.00% 2/15/20311 | 28,295 | 29,219 | ||
CSN Resources SA 8.875% 12/5/20301 | 14,500 | 14,416 | ||
CSN Resources SA 8.875% 12/5/2030 | 1,693 | 1,683 | ||
CVR Partners, LP 6.125% 6/15/20281 | 2,015 | 1,938 | ||
Dow Chemical Co. (The) 5.15% 2/15/2034 | 2,922 | 2,859 | ||
Dow Chemical Co. (The) 5.55% 11/30/2048 | 2,632 | 2,499 | ||
Dow Chemical Co. (The) 6.90% 5/15/2053 | 1,149 | 1,278 | ||
Dow Chemical Co. (The) 5.60% 2/15/2054 | 12,049 | 11,599 | ||
Eastman Chemical Co. 5.625% 2/20/2034 | 7,766 | 7,722 | ||
EIDP, Inc. 4.80% 5/15/2033 | 15,576 | 15,032 | ||
Element Solutions, Inc. 3.875% 9/1/20281 | 11,735 | 10,795 | ||
First Quantum Minerals, Ltd. 6.875% 10/15/20271 | 21,829 | 21,350 | ||
First Quantum Minerals, Ltd. 9.375% 3/1/20291 | 30,075 | 31,462 | ||
Freeport-McMoRan, Inc. 4.25% 3/1/2030 | 153 | 145 | ||
Freeport-McMoRan, Inc. 5.45% 3/15/2043 | 183 | 174 | ||
Fresnillo PLC 4.25% 10/2/20501 | 1,100 | 811 | ||
FXI Holdings, Inc. 12.25% 11/15/20261 | 24,788 | 24,624 | ||
FXI Holdings, Inc. 12.25% 11/15/20261 | 7,050 | 7,017 | ||
International Flavors & Fragrances, Inc. 3.468% 12/1/20501 | 20,621 | 13,550 | ||
LABL, Inc. 6.75% 7/15/20261 | 430 | 425 | ||
LABL, Inc. 10.50% 7/15/20271 | 280 | 274 | ||
LABL, Inc. 5.875% 11/1/20281 | 1,540 | 1,407 | ||
LABL, Inc. 9.50% 11/1/20281 | 11,405 | 11,509 | ||
LSB Industries, Inc. 6.25% 10/15/20281 | 15,000 | 14,484 | ||
LYB International Finance III, LLC 3.625% 4/1/2051 | 1,091 | 751 | ||
Methanex Corp. 5.125% 10/15/2027 | 2,650 | 2,558 | ||
Methanex Corp. 5.25% 12/15/2029 | 760 | 734 | ||
Mineral Resources, Ltd. 8.125% 5/1/20271 | 2,950 | 2,976 | ||
Mineral Resources, Ltd. 8.00% 11/1/20271 | 2,000 | 2,048 | ||
Mineral Resources, Ltd. 9.25% 10/1/20281 | 9,296 | 9,768 | ||
Mineral Resources, Ltd. 8.50% 5/1/20301 | 1,116 | 1,157 | ||
NOVA Chemicals Corp. 5.25% 6/1/20271 | 8,480 | 8,121 |
15 | American Funds Multi-Sector Income Fund |
Bonds, notes & other debt instruments (continued) | Principal amount (000) | Value (000) | ||
Corporate bonds, notes & loans (continued) | ||||
Materials (continued) | ||||
NOVA Chemicals Corp. 4.25% 5/15/20291 | USD8,795 | $7,763 | ||
NOVA Chemicals Corp. 9.00% 2/15/20301 | 14,410 | 15,221 | ||
Novelis Corp. 3.25% 11/15/20261 | 1,190 | 1,121 | ||
Novelis Corp. 4.75% 1/30/20301 | 6,326 | 5,875 | ||
Novelis Corp. 3.875% 8/15/20311 | 7,021 | 6,085 | ||
OCI NV 6.70% 3/16/20331 | 22,616 | 22,334 | ||
Owens-Brockway Glass Container, Inc. 7.375% 6/1/20321 | 11,455 | 11,483 | ||
Sasol Financing USA, LLC 8.75% 5/3/20291 | 22,000 | 22,395 | ||
Sasol Financing USA, LLC 8.75% 5/3/20297 | 9,000 | 9,162 | ||
Sasol Financing USA, LLC 5.50% 3/18/2031 | 20,300 | 17,136 | ||
SCIH Salt Holdings, Inc. 4.875% 5/1/20281 | 9,870 | 9,192 | ||
SCIH Salt Holdings, Inc. 6.625% 5/1/20291 | 13,505 | 12,718 | ||
Sealed Air Corp. 4.00% 12/1/20271 | 11,364 | 10,696 | ||
Sealed Air Corp. 6.125% 2/1/20281 | 11,690 | 11,673 | ||
Stillwater Mining Co. 4.00% 11/16/20267 | 13,060 | 11,950 | ||
Stillwater Mining Co. 4.50% 11/16/20297 | 7,510 | 6,122 | ||
Summit Materials, LLC 6.50% 3/15/20271 | 270 | 271 | ||
Summit Materials, LLC 5.25% 1/15/20291 | 9,355 | 9,029 | ||
Summit Materials, LLC 7.25% 1/15/20311 | 7,293 | 7,561 | ||
Trivium Packaging Finance BV 8.50% 8/15/20271 | 21,128 | 20,992 | ||
Vale Overseas Ltd. 6.40% 6/28/2054 | 5,931 | 5,870 | ||
Venator Material, LLC, Term Loan, (3-month USD CME Term SOFR + 2.00%) 8.00% PIK and 7.31% Cash 1/16/20263,4,8 | 843 | 851 | ||
Venator Material, LLC, Term Loan, (USD-SOFR + 10.00%) 8.00% PIK and 7.33% Cash 10/10/20283,4,8 | 1,771 | 1,765 | ||
707,894 | ||||
Utilities 4.05% | ||||
Aegea Finance SARL 9.00% 1/20/20311 | 19,530 | 20,325 | ||
AEP Transmission Co., LLC 5.15% 4/1/2034 | 1,725 | 1,687 | ||
AEP Transmission Co., LLC 2.75% 8/15/2051 | 2,476 | 1,485 | ||
AES Panama Generation Holdings, SRL 4.375% 5/31/2030 | 3,757 | 3,270 | ||
AES Panama Generation Holdings, SRL 4.375% 5/31/20301 | 844 | 735 | ||
Alabama Power Co. 3.94% 9/1/2032 | 7,500 | 6,897 | ||
Alabama Power Co. 5.85% 11/15/2033 | 3,100 | 3,228 | ||
Alfa Desarrollo SpA 4.55% 9/27/20511 | 7,095 | 5,333 | ||
Alliant Energy Finance, LLC 3.60% 3/1/20321 | 2,125 | 1,851 | ||
American Electric Power Co., Inc. 1.00% 11/1/2025 | 25 | 23 | ||
Baltimore Gas and Electric Co. 5.30% 6/1/2034 | 3,675 | 3,656 | ||
Cleveland Electric Illuminating Co. (The) 4.55% 11/15/20301 | 205 | 194 | ||
Connecticut Light and Power Co. (The) 2.05% 7/1/2031 | 175 | 143 | ||
Consolidated Edison Company of New York, Inc. 5.375% 5/15/2034 | 2,000 | 2,011 | ||
Consolidated Edison Company of New York, Inc. 5.70% 5/15/2054 | 1,000 | 998 | ||
Constellation Energy Generation, LLC 6.125% 1/15/2034 | 1,700 | 1,773 | ||
Constellation Energy Generation, LLC 5.75% 3/15/2054 | 975 | 946 | ||
Consumers Energy Co. 3.80% 11/15/2028 | 2,000 | 1,911 | ||
Consumers Energy Co. 4.60% 5/30/2029 | 1,625 | 1,600 | ||
Consumers Energy Co. 3.60% 8/15/2032 | 7,969 | 7,167 | ||
Consumers Energy Co. 4.625% 5/15/2033 | 18,690 | 17,906 | ||
DPL, Inc. 4.125% 7/1/2025 | 7,600 | 7,470 | ||
DTE Electric Co. 5.20% 3/1/2034 | 1,800 | 1,796 | ||
DTE Electric Co. 3.65% 3/1/2052 | 100 | 74 | ||
Duke Energy Carolinas, LLC 5.35% 1/15/2053 | 4,980 | 4,735 | ||
Duke Energy Corp. 4.85% 1/5/2029 | 3,425 | 3,383 | ||
Duke Energy Corp. 5.75% 9/15/2033 | 4,000 | 4,065 | ||
Duke Energy Corp. 5.45% 6/15/2034 | 2,825 | 2,793 | ||
Duke Energy Corp. 6.10% 9/15/2053 | 4,000 | 4,064 | ||
Duke Energy Florida, LLC 1.75% 6/15/2030 | 74 | 61 | ||
Duke Energy Florida, LLC 5.95% 11/15/2052 | 2,025 | 2,064 | ||
Duke Energy Progress, LLC 2.00% 8/15/2031 | 2,925 | 2,391 | ||
Duke Energy Progress, LLC 2.50% 8/15/2050 | 1,099 | 634 | ||
Edison International 4.125% 3/15/2028 | 7,492 | 7,161 | ||
Edison International 5.25% 11/15/2028 | 25 | 25 | ||
Edison International 5.45% 6/15/2029 | 2,025 | 2,025 | ||
Edison International 6.95% 11/15/2029 | 3,200 | 3,404 | ||
Edison International 5.00% junior subordinated perpetual bonds (5-year UST Yield Curve Rate T Note Constant Maturity + 3.901% on 3/15/2027)2 | 4,000 | 3,815 |
American Funds Multi-Sector Income Fund | 16 |
Bonds, notes & other debt instruments (continued) | Principal amount (000) | Value (000) | ||
Corporate bonds, notes & loans (continued) | ||||
Utilities (continued) | ||||
Electricité de France SA 9.125% junior subordinated perpetual bonds (5-year UST Yield Curve Rate T Note Constant Maturity + 5.411% on 6/15/2033)1,2 | USD14,000 | $15,261 | ||
Empresas Publicas de Medellin ESP 4.25% 7/18/20291 | 500 | 431 | ||
Empresas Publicas de Medellin ESP 4.25% 7/18/2029 | 200 | 173 | ||
Empresas Publicas de Medellin ESP 4.375% 2/15/20311 | 950 | 786 | ||
Enfragen Energia Sur SA 5.375% 12/30/2030 | 6,300 | 5,263 | ||
ENN Clean Energy International Investment, Ltd. 3.375% 5/12/20261 | 3,670 | 3,500 | ||
Entergy Corp. 2.40% 6/15/2031 | 543 | 449 | ||
Entergy Louisiana, LLC 5.35% 3/15/2034 | 4,720 | 4,687 | ||
Entergy Louisiana, LLC 5.70% 3/15/2054 | 2,580 | 2,542 | ||
Eskom Holdings SOC, Ltd. 8.45% 8/10/2028 | 6,500 | 6,549 | ||
Eversource Energy 1.65% 8/15/2030 | 4,026 | 3,249 | ||
Eversource Energy 5.50% 1/1/2034 | 12,300 | 12,074 | ||
FirstEnergy Corp. 2.65% 3/1/2030 | 25,851 | 22,490 | ||
FirstEnergy Corp. 2.25% 9/1/2030 | 3,743 | 3,137 | ||
FirstEnergy Transmission, LLC 4.35% 1/15/20251 | 4,000 | 3,963 | ||
Florida Power & Light Co. 5.15% 6/15/2029 | 1,550 | 1,563 | ||
Florida Power & Light Co. 5.10% 4/1/2033 | 3,261 | 3,247 | ||
Florida Power & Light Co. 5.30% 6/15/2034 | 10,380 | 10,466 | ||
Florida Power & Light Co. 5.60% 6/15/2054 | 975 | 986 | ||
Georgia Power Co. 5.004% 2/23/2027 | 2,135 | 2,129 | ||
Georgia Power Co. 4.95% 5/17/2033 | 11,325 | 11,049 | ||
Georgia Power Co. 5.25% 3/15/2034 | 4,475 | 4,463 | ||
Greenko Dutch BV 3.85% 3/29/20261 | 3,902 | 3,686 | ||
Instituto Costarricense de Electricidad 6.75% 10/7/2031 | 4,900 | 4,907 | ||
Investment Energy Resources, Ltd. 6.25% 4/26/20291 | 350 | 330 | ||
Jersey Central Power & Light Co. 4.30% 1/15/20261 | 50 | 49 | ||
Jersey Central Power & Light Co. 2.75% 3/1/20321 | 4,202 | 3,475 | ||
Light Servicos de Eletricidade SA 4.375% 6/18/20265 | 9,800 | 4,786 | ||
Mid-Atlantic Interstate Transmission, LLC 4.10% 5/15/20281 | 834 | 802 | ||
Minejesa Capital BV 4.625% 8/10/2030 | 3,719 | 3,575 | ||
MIWD Holdco II, LLC, Term Loan B, (3-month USD CME Term SOFR + 3.50%) 8.844% 3/28/20313,4 | 4,820 | 4,856 | ||
MVM Energetika Zartkoruen Mukodo Reszvenytarsasag 7.50% 6/9/2028 | 2,185 | 2,276 | ||
NextEra Energy Capital Holdings, Inc. 4.90% 3/15/2029 | 2,000 | 1,980 | ||
Northern States Power Co. 3.20% 4/1/2052 | 1,000 | 667 | ||
Pacific Gas and Electric Co. 2.95% 3/1/2026 | 258 | 247 | ||
Pacific Gas and Electric Co. 2.10% 8/1/2027 | 17,728 | 16,003 | ||
Pacific Gas and Electric Co. 3.00% 6/15/2028 | 1,124 | 1,028 | ||
Pacific Gas and Electric Co. 4.65% 8/1/2028 | 125 | 121 | ||
Pacific Gas and Electric Co. 4.55% 7/1/2030 | 18,419 | 17,464 | ||
Pacific Gas and Electric Co. 2.50% 2/1/2031 | 16,588 | 13,682 | ||
Pacific Gas and Electric Co. 3.25% 6/1/2031 | 4,432 | 3,813 | ||
Pacific Gas and Electric Co. 4.40% 3/1/2032 | 5,564 | 5,092 | ||
Pacific Gas and Electric Co. 6.15% 1/15/2033 | 1,888 | 1,919 | ||
Pacific Gas and Electric Co. 6.40% 6/15/2033 | 17,580 | 18,170 | ||
Pacific Gas and Electric Co. 3.30% 8/1/2040 | 920 | 656 | ||
Pacific Gas and Electric Co. 4.95% 7/1/2050 | 4,845 | 4,007 | ||
Pacific Gas and Electric Co. 3.50% 8/1/2050 | 9,135 | 5,970 | ||
Pacific Gas and Electric Co. 6.70% 4/1/2053 | 86 | 90 | ||
PacifiCorp 5.30% 2/15/2031 | 6,225 | 6,207 | ||
PacifiCorp 5.45% 2/15/2034 | 9,900 | 9,784 | ||
PacifiCorp 3.30% 3/15/2051 | 2,075 | 1,343 | ||
PacifiCorp 2.90% 6/15/2052 | 1,249 | 737 | ||
PacifiCorp 5.35% 12/1/2053 | 15,509 | 14,085 | ||
PacifiCorp 5.50% 5/15/2054 | 20,156 | 18,741 | ||
PacifiCorp 5.80% 1/15/2055 | 11,085 | 10,743 | ||
PG&E Corp. 5.00% 7/1/2028 | 1,610 | 1,551 | ||
PG&E Corp. 5.25% 7/1/2030 | 21,900 | 20,932 | ||
Public Service Company of Colorado 1.90% 1/15/2031 | 2,829 | 2,303 | ||
Public Service Company of Colorado 1.875% 6/15/2031 | 6,542 | 5,237 | ||
Public Service Company of Colorado 5.35% 5/15/2034 | 3,600 | 3,571 | ||
Public Service Company of Colorado 4.10% 6/15/2048 | 400 | 306 | ||
Public Service Company of Colorado 3.20% 3/1/2050 | 900 | 593 | ||
Public Service Company of Colorado 2.70% 1/15/2051 | 1,025 | 606 | ||
Public Service Company of Colorado 5.25% 4/1/2053 | 4,215 | 3,856 | ||
Public Service Company of Colorado 5.75% 5/15/2054 | 636 | 629 |
17 | American Funds Multi-Sector Income Fund |
Bonds, notes & other debt instruments (continued) | Principal amount (000) | Value (000) | ||
Corporate bonds, notes & loans (continued) | ||||
Utilities (continued) | ||||
Public Service Electric and Gas Co. 3.10% 3/15/2032 | USD1,825 | $1,594 | ||
Public Service Electric and Gas Co. 3.00% 3/1/2051 | 950 | 623 | ||
Southern California Edison Co. 0.975% 8/1/2024 | 2,240 | 2,230 | ||
Southern California Edison Co. 4.70% 6/1/2027 | 16,176 | 15,956 | ||
Southern California Edison Co. 3.65% 3/1/2028 | 209 | 198 | ||
Southern California Edison Co. 5.65% 10/1/2028 | 6,645 | 6,762 | ||
Southern California Edison Co. 4.20% 3/1/2029 | 3,200 | 3,064 | ||
Southern California Edison Co. 2.85% 8/1/2029 | 1,280 | 1,150 | ||
Southern California Edison Co. 2.50% 6/1/2031 | 10,829 | 9,095 | ||
Southern California Edison Co. 5.45% 6/1/2031 | 4,825 | 4,861 | ||
Southern California Edison Co. 2.75% 2/1/2032 | 3,400 | 2,870 | ||
Southern California Edison Co. 5.20% 6/1/2034 | 15,624 | 15,262 | ||
Southern California Edison Co. 3.60% 2/1/2045 | 1,000 | 732 | ||
Southern California Edison Co. 3.65% 2/1/2050 | 5,724 | 4,073 | ||
Southern California Edison Co. 3.45% 2/1/2052 | 239 | 162 | ||
Southwestern Electric Power Co. 3.25% 11/1/2051 | 3,775 | 2,386 | ||
Southwestern Public Service Co. 6.00% 6/1/2054 | 3,575 | 3,568 | ||
State Grid Overseas Investment (2013), Ltd. 4.375% 5/22/2043 | 2,800 | 2,560 | ||
State Grid Overseas Investment (2014), Ltd. 4.85% 5/7/2044 | 2,000 | 1,941 | ||
Talen Energy Supply, LLC 8.625% 6/1/20301 | 16,668 | 17,785 | ||
Talen Energy Supply, LLC, Term Loan B, (3-month USD CME Term SOFR + 3.50%) 8.827% 5/17/20303,4 | 4,410 | 4,453 | ||
Union Electric Co. 2.625% 3/15/2051 | 1,880 | 1,123 | ||
Virginia Electric & Power 2.30% 11/15/2031 | 1,250 | 1,031 | ||
Wisconsin Power and Light Co. 1.95% 9/16/2031 | 2,240 | 1,792 | ||
Xcel Energy, Inc. 3.35% 12/1/2026 | 1,130 | 1,079 | ||
Xcel Energy, Inc. 1.75% 3/15/2027 | 578 | 526 | ||
Xcel Energy, Inc. 2.35% 11/15/2031 | 1,660 | 1,344 | ||
Xcel Energy, Inc. 4.60% 6/1/2032 | 1,750 | 1,637 | ||
Xcel Energy, Inc. 5.45% 8/15/2033 | 19,509 | 19,177 | ||
Xcel Energy, Inc. 3.50% 12/1/2049 | 3,874 | 2,627 | ||
604,092 | ||||
Real estate 3.93% | ||||
American Tower Corp. 2.95% 1/15/2051 | 15,000 | 9,392 | ||
Anywhere Real Estate Group, LLC 5.75% 1/15/20291 | 5,585 | 3,443 | ||
Anywhere Real Estate Group, LLC 5.25% 4/15/20301 | 11,770 | 7,037 | ||
Boston Properties, LP 2.55% 4/1/2032 | 3,980 | 3,105 | ||
Boston Properties, LP 2.45% 10/1/2033 | 5,420 | 4,018 | ||
Boston Properties, LP 6.50% 1/15/2034 | 20,469 | 20,833 | ||
Brandywine Operating Partnership, LP 8.875% 4/12/2029 | 9,610 | 10,020 | ||
Brookfield Property REIT, Inc. 5.75% 5/15/20261 | 8,480 | 8,313 | ||
Brookfield Property REIT, Inc. 4.50% 4/1/20271 | 3,780 | 3,521 | ||
COPT Defense Properties, LP 2.75% 4/15/2031 | 10,000 | 8,275 | ||
Corp. Inmobiliaria Vesta, SAB de CV 3.625% 5/13/20311 | 3,240 | 2,732 | ||
Crown Castle, Inc. 5.00% 1/11/2028 | 6,796 | 6,716 | ||
Crown Castle, Inc. 5.80% 3/1/2034 | 19,842 | 20,054 | ||
Equinix Europe 2 Financing Corp., LLC 5.50% 6/15/2034 | 3,150 | 3,146 | ||
Equinix, Inc. 1.45% 5/15/2026 | 1,560 | 1,449 | ||
Equinix, Inc. 2.90% 11/18/2026 | 68 | 64 | ||
Equinix, Inc. 1.55% 3/15/2028 | 105 | 92 | ||
Equinix, Inc. 3.20% 11/18/2029 | 75 | 68 | ||
Equinix, Inc. 2.15% 7/15/2030 | 15,210 | 12,759 | ||
Equinix, Inc. 3.40% 2/15/2052 | 819 | 562 | ||
FibraSOMA 4.375% 7/22/20311 | 3,933 | 3,149 | ||
Highwoods Realty, LP 7.65% 2/1/2034 | 28,250 | 30,420 | ||
Howard Hughes Corp. (The) 5.375% 8/1/20281 | 2,931 | 2,789 | ||
Howard Hughes Corp. (The) 4.125% 2/1/20291 | 10,170 | 9,106 | ||
Howard Hughes Corp. (The) 4.375% 2/1/20311 | 12,265 | 10,572 | ||
Hudson Pacific Properties, LP 4.65% 4/1/2029 | 5,750 | 4,435 | ||
Hudson Pacific Properties, LP 3.25% 1/15/2030 | 18,550 | 12,834 | ||
Iron Mountain, Inc. 5.25% 3/15/20281 | 2,185 | 2,116 | ||
Iron Mountain, Inc. 5.00% 7/15/20281 | 2,224 | 2,132 | ||
Iron Mountain, Inc. 5.25% 7/15/20301 | 4,555 | 4,333 | ||
Iron Mountain, Inc. 4.50% 2/15/20311 | 2,385 | 2,155 | ||
Kennedy-Wilson, Inc. 4.75% 3/1/2029 | 28,655 | 24,542 | ||
Kennedy-Wilson, Inc. 4.75% 2/1/2030 | 37,650 | 31,288 |
American Funds Multi-Sector Income Fund | 18 |
Bonds, notes & other debt instruments (continued) | Principal amount (000) | Value (000) | ||
Corporate bonds, notes & loans (continued) | ||||
Real estate (continued) | ||||
Kennedy-Wilson, Inc. 5.00% 3/1/2031 | USD34,675 | $28,387 | ||
Kilroy Realty, LP 2.50% 11/15/2032 | 2,724 | 2,043 | ||
Kilroy Realty, LP 2.65% 11/15/2033 | 7,563 | 5,559 | ||
Kilroy Realty, LP 6.25% 1/15/2036 | 17,671 | 16,787 | ||
Ladder Capital Finance Holdings LLP 4.75% 6/15/20291 | 21,884 | 20,232 | ||
MPT Operating Partnership, LP 5.25% 8/1/2026 | 7,000 | 6,367 | ||
MPT Operating Partnership, LP 5.00% 10/15/2027 | 17,001 | 14,057 | ||
MPT Operating Partnership, LP 3.50% 3/15/2031 | 32,215 | 21,029 | ||
Park Intermediate Holdings, LLC 5.875% 10/1/20281 | 9,000 | 8,877 | ||
Park Intermediate Holdings, LLC 4.875% 5/15/20291 | 11,160 | 10,476 | ||
Prologis, LP 4.75% 6/15/2033 | 3,870 | 3,733 | ||
Prologis, LP 5.125% 1/15/2034 | 5,490 | 5,428 | ||
Prologis, LP 5.00% 3/15/2034 | 12,135 | 11,873 | ||
Prologis, LP 5.25% 3/15/2054 | 2,320 | 2,194 | ||
Public Storage Operating Co. 1.95% 11/9/2028 | 417 | 368 | ||
Public Storage Operating Co. 2.25% 11/9/2031 | 8,155 | 6,736 | ||
Public Storage Operating Co. 5.35% 8/1/2053 | 8,552 | 8,257 | ||
Service Properties Trust 4.75% 10/1/2026 | 21,745 | 20,394 | ||
Service Properties Trust 4.95% 2/15/2027 | 9,285 | 8,445 | ||
Service Properties Trust 3.95% 1/15/2028 | 26,470 | 22,197 | ||
Service Properties Trust 8.375% 6/15/2029 | 7,830 | 7,704 | ||
Service Properties Trust 4.95% 10/1/2029 | 23,560 | 17,897 | ||
Service Properties Trust 4.375% 2/15/2030 | 20,014 | 14,157 | ||
Service Properties Trust 8.625% 11/15/20311 | 12,100 | 12,624 | ||
Sun Communities Operating, LP 2.70% 7/15/2031 | 1,000 | 826 | ||
Sun Communities Operating, LP 4.20% 4/15/2032 | 14,413 | 12,931 | ||
VICI Properties, LP 4.625% 6/15/20251 | 766 | 757 | ||
VICI Properties, LP 4.75% 2/15/2028 | 876 | 856 | ||
VICI Properties, LP 3.875% 2/15/20291 | 708 | 655 | ||
VICI Properties, LP 4.95% 2/15/2030 | 14,510 | 14,009 | ||
VICI Properties, LP 4.125% 8/15/20301 | 192 | 175 | ||
VICI Properties, LP 5.125% 5/15/2032 | 6,694 | 6,382 | ||
VICI Properties, LP 5.625% 5/15/2052 | 1,537 | 1,385 | ||
Vornado Realty, LP 2.15% 6/1/2026 | 4,672 | 4,311 | ||
XHR, LP 4.875% 6/1/20291 | 2,120 | 1,989 | ||
585,567 | ||||
Consumer staples 3.69% | ||||
7-Eleven, Inc. 0.95% 2/10/20261 | 255 | 238 | ||
7-Eleven, Inc. 1.30% 2/10/20281 | 149 | 130 | ||
7-Eleven, Inc. 1.80% 2/10/20311 | 13,213 | 10,588 | ||
7-Eleven, Inc. 2.50% 2/10/20411 | 900 | 588 | ||
7-Eleven, Inc. 2.80% 2/10/20511 | 10,815 | 6,453 | ||
Albertsons Companies, Inc. 3.50% 3/15/20291 | 3,185 | 2,868 | ||
Altria Group, Inc. 3.70% 2/4/2051 | 3,567 | 2,413 | ||
Anheuser-Busch Companies, LLC 4.90% 2/1/2046 | 90 | 83 | ||
Anheuser-Busch InBev Worldwide, Inc. 5.00% 6/15/2034 | 3,325 | 3,301 | ||
Anheuser-Busch InBev Worldwide, Inc. 4.60% 4/15/2048 | 1,603 | 1,419 | ||
Anheuser-Busch InBev Worldwide, Inc. 4.439% 10/6/2048 | 180 | 154 | ||
Anheuser-Busch InBev Worldwide, Inc. 5.55% 1/23/2049 | 1,100 | 1,109 | ||
B&G Foods, Inc. 5.25% 4/1/2025 | 1,352 | 1,348 | ||
B&G Foods, Inc. 5.25% 9/15/2027 | 6,105 | 5,662 | ||
B&G Foods, Inc. 8.00% 9/15/20281 | 9,125 | 9,284 | ||
BAT Capital Corp. 5.834% 2/20/2031 | 1,084 | 1,100 | ||
BAT Capital Corp. 2.726% 3/25/2031 | 2,750 | 2,320 | ||
BAT Capital Corp. 6.421% 8/2/2033 | 5,578 | 5,834 | ||
BAT Capital Corp. 6.00% 2/20/2034 | 10,000 | 10,121 | ||
BAT Capital Corp. 5.65% 3/16/2052 | 2,375 | 2,123 | ||
BAT Capital Corp. 7.081% 8/2/2053 | 32,423 | 34,502 | ||
Campbell Soup Co. 5.20% 3/21/2029 | 1,925 | 1,927 | ||
Campbell Soup Co. 5.40% 3/21/2034 | 14,058 | 13,971 | ||
Central Garden & Pet Co. 4.125% 10/15/2030 | 3,600 | 3,212 | ||
Central Garden & Pet Co. 4.125% 4/30/20311 | 18,275 | 16,135 | ||
Coca-Cola Co. 5.00% 5/13/2034 | 9,775 | 9,812 | ||
Coca-Cola Co. 5.30% 5/13/2054 | 900 | 894 | ||
Coca-Cola Consolidated, Inc. 5.45% 6/1/2034 | 17,146 | 17,308 | ||
Conagra Brands, Inc. 1.375% 11/1/2027 | 5,125 | 4,517 |
19 | American Funds Multi-Sector Income Fund |
Bonds, notes & other debt instruments (continued) | Principal amount (000) | Value (000) | ||
Corporate bonds, notes & loans (continued) | ||||
Consumer staples (continued) | ||||
Conagra Brands, Inc. 5.30% 11/1/2038 | USD2 | $2 | ||
Constellation Brands, Inc. 2.875% 5/1/2030 | 1,040 | 918 | ||
Constellation Brands, Inc. 2.25% 8/1/2031 | 20,750 | 17,040 | ||
Constellation Brands, Inc. 4.75% 5/9/2032 | 2,834 | 2,726 | ||
Constellation Brands, Inc. 4.90% 5/1/2033 | 1,657 | 1,601 | ||
Coty, Inc. 6.625% 7/15/20301 | 8,115 | 8,242 | ||
Darling Ingredients, Inc. 6.00% 6/15/20301 | 16,970 | 16,697 | ||
Energizer Holdings, Inc. 4.375% 3/31/20291 | 3,840 | 3,478 | ||
Fiesta Purchaser, Inc. 7.875% 3/1/20311 | 6,530 | 6,753 | ||
Fiesta Purchaser, Inc., Term Loan B, (3-month USD CME Term SOFR + 4.00%) 9.344% 2/12/20313,4 | 3,080 | 3,107 | ||
Imperial Brands Finance PLC 5.875% 7/1/20341 | 25,000 | 24,516 | ||
Indofood CBP Sukses Makmur Tbk PT 4.745% 6/9/2051 | 5,934 | 4,929 | ||
Ingles Markets, Inc. 4.00% 6/15/20311 | 11,345 | 9,875 | ||
InRetail Consumer 3.25% 3/22/20281 | 1,100 | 995 | ||
J. M. Smucker Co. (The) 6.20% 11/15/2033 | 4,956 | 5,207 | ||
J. M. Smucker Co. (The) 6.50% 11/15/2043 | 1,812 | 1,909 | ||
J. M. Smucker Co. (The) 6.50% 11/15/2053 | 4,877 | 5,246 | ||
Kronos Acquisition Holdings, Inc. 5.00% 12/31/20261 | 5,360 | 5,489 | ||
Kronos Acquisition Holdings, Inc. 7.00% 12/31/20271 | 10,166 | 10,520 | ||
Kronos Acquisition Holdings, Inc. 10.75% 6/30/20321 | 10,000 | 9,603 | ||
Lamb Weston Holdings, Inc. 4.125% 1/31/20301 | 7,985 | 7,256 | ||
MARB BondCo PLC 3.95% 1/29/2031 | 21,365 | 17,773 | ||
MARB BondCo PLC 3.95% 1/29/20311 | 2,577 | 2,144 | ||
Minerva Luxembourg SA 8.875% 9/13/20331 | 12,895 | 13,326 | ||
Minerva Luxembourg SA 8.875% 9/13/2033 | 6,000 | 6,200 | ||
Natura &Co Luxembourg Holdings SARL 4.125% 5/3/20281 | 3,800 | 3,478 | ||
Natura &Co Luxembourg Holdings SARL 4.125% 5/3/2028 | 2,400 | 2,197 | ||
NBM US Holdings, Inc. 6.625% 8/6/20297 | 500 | 494 | ||
PepsiCo Singapore Financing I Pte., Ltd. 4.70% 2/16/2034 | 2,000 | 1,951 | ||
PepsiCo, Inc. 1.625% 5/1/2030 | 6 | 5 | ||
PepsiCo, Inc. 1.40% 2/25/2031 | 34 | 27 | ||
PepsiCo, Inc. 1.95% 10/21/2031 | 21,349 | 17,543 | ||
Performance Food Group, Inc. 5.50% 10/15/20271 | 4,105 | 4,019 | ||
Performance Food Group, Inc. 4.25% 8/1/20291 | 8,162 | 7,436 | ||
Philip Morris International, Inc. 5.125% 2/13/2031 | 728 | 720 | ||
Philip Morris International, Inc. 5.75% 11/17/2032 | 8,756 | 8,944 | ||
Philip Morris International, Inc. 5.375% 2/15/2033 | 31,210 | 31,006 | ||
Philip Morris International, Inc. 5.625% 9/7/2033 | 15,600 | 15,743 | ||
Philip Morris International, Inc. 5.25% 2/13/2034 | 15,104 | 14,824 | ||
Post Holdings, Inc. 5.625% 1/15/20281 | 7,370 | 7,262 | ||
Post Holdings, Inc. 5.50% 12/15/20291 | 3,355 | 3,239 | ||
Post Holdings, Inc. 4.625% 4/15/20301 | 12,811 | 11,780 | ||
Post Holdings, Inc. 6.25% 2/15/20321 | 8,143 | 8,164 | ||
Prestige Brands, Inc. 5.125% 1/15/20281 | 5,345 | 5,203 | ||
Prestige Brands, Inc. 3.75% 4/1/20311 | 5,985 | 5,214 | ||
Simmons Foods, Inc. 4.625% 3/1/20291 | 7,300 | 6,426 | ||
TreeHouse Foods, Inc. 4.00% 9/1/2028 | 20,180 | 18,145 | ||
United Natural Foods, Inc. 6.75% 10/15/20281 | 1,359 | 1,228 | ||
US Foods, Inc. 4.625% 6/1/20301 | 8,185 | 7,609 | ||
Walmart, Inc. 4.10% 4/15/2033 | 10,634 | 10,135 | ||
Walmart, Inc. 4.50% 4/15/2053 | 3,500 | 3,100 | ||
550,858 | ||||
Information technology 2.97% | ||||
Analog Devices, Inc. 5.05% 4/1/2034 | 2,329 | 2,321 | ||
Analog Devices, Inc. 2.95% 10/1/2051 | 3,709 | 2,430 | ||
Analog Devices, Inc. 5.30% 4/1/2054 | 1,074 | 1,049 | ||
Booz Allen Hamilton, Inc. 3.875% 9/1/20281 | 734 | 692 | ||
Booz Allen Hamilton, Inc. 4.00% 7/1/20291 | 586 | 549 | ||
Broadcom Corp. 3.875% 1/15/2027 | 53 | 51 | ||
Broadcom, Inc. 4.15% 11/15/2030 | 24 | 23 | ||
Broadcom, Inc. 4.15% 4/15/20321 | 7 | 7 | ||
Broadcom, Inc. 3.419% 4/15/20331 | 8,660 | 7,469 | ||
Broadcom, Inc. 3.469% 4/15/20341 | 18,602 | 15,864 | ||
Cisco Systems, Inc. 4.85% 2/26/2029 | 19,614 | 19,616 | ||
Cisco Systems, Inc. 4.95% 2/26/2031 | 18,659 | 18,649 |
American Funds Multi-Sector Income Fund | 20 |
Bonds, notes & other debt instruments (continued) | Principal amount (000) | Value (000) | ||
Corporate bonds, notes & loans (continued) | ||||
Information technology (continued) | ||||
Cisco Systems, Inc. 5.05% 2/26/2034 | USD34,290 | $34,277 | ||
Cisco Systems, Inc. 5.30% 2/26/2054 | 140 | 137 | ||
Cloud Software Group, Inc. 6.50% 3/31/20291 | 8,650 | 8,313 | ||
Cloud Software Group, Inc. 9.00% 9/30/20291 | 35,520 | 34,490 | ||
Cloud Software Group, Inc. 8.25% 6/30/20321 | 14,625 | 14,916 | ||
Cloud Software Group, Inc., Term Loan, (3-month USD CME Term SOFR + 4.00%) 9.335% 3/30/20293,4 | 24,736 | 24,746 | ||
CommScope Technologies, LLC 6.00% 6/15/20251 | 15,377 | 12,548 | ||
CommScope, Inc. 6.00% 3/1/20261 | 10,640 | 9,350 | ||
CommScope, Inc. 8.25% 3/1/20271 | 5,781 | 2,749 | ||
CommScope, Inc. 7.125% 7/1/20281 | 3,603 | 1,497 | ||
CommScope, Inc. 4.75% 9/1/20291 | 7,000 | 4,864 | ||
CommScope, Inc., Term Loan B, (3-month USD CME Term SOFR + 3.25%) 8.708% 4/6/20263,4 | 3,894 | 3,517 | ||
Diebold Nixdorf, Inc., Term Loan, (3-month USD CME Term SOFR + 7.50%) 12.826% 8/11/20281,3,4 | 16,087 | 16,667 | ||
Finastra USA, Inc., Term Loan B, (3-month USD CME Term SOFR + 7.25%) 12.459% 9/13/20293,4,7 | 16,469 | 16,551 | ||
Finastra USA, Inc., Term Loan, (3-month USD CME Term SOFR + 7.25%) 12.581% 9/13/20293,4,7 | 181 | 182 | ||
Gartner, Inc. 4.50% 7/1/20281 | 3,270 | 3,154 | ||
Gartner, Inc. 3.625% 6/15/20291 | 5,330 | 4,886 | ||
Gartner, Inc. 3.75% 10/1/20301 | 7,790 | 6,993 | ||
Helios Software Holdings, Inc. 8.75% 5/1/20291 | 34,700 | 35,366 | ||
Hughes Satellite Systems Corp. 6.625% 8/1/2026 | 1,441 | 671 | ||
Intel Corp. 5.15% 2/21/2034 | 10,105 | 9,983 | ||
Intel Corp. 5.60% 2/21/2054 | 5,792 | 5,616 | ||
ION Trading Technologies SARL 9.50% 5/30/20291 | 17,950 | 18,299 | ||
Microchip Technology, Inc. 5.05% 3/15/2029 | 15,325 | 15,206 | ||
MicroStrategy, Inc. 6.125% 6/15/20281 | 1,190 | 1,155 | ||
NCR Atleos Corp. 9.50% 4/1/20291 | 23,329 | 25,234 | ||
ServiceNow, Inc. 1.40% 9/1/2030 | 8,917 | 7,243 | ||
Texas Instruments, Inc. 4.60% 2/8/2029 | 2,700 | 2,686 | ||
Texas Instruments, Inc. 4.85% 2/8/2034 | 11,471 | 11,372 | ||
UKG, Inc. 6.875% 2/1/20311 | 31,100 | 31,512 | ||
Unisys Corp. 6.875% 11/1/20271 | 535 | 470 | ||
Wolfspeed, Inc. 9.875% 6/23/2030 (10.875% on 6/23/2026)2,6,7 | 10,655 | 10,369 | ||
443,739 | ||||
Total corporate bonds, notes & loans | 10,378,208 | |||
Mortgage-backed obligations 10.07% | ||||
Commercial mortgage-backed securities 8.59% | ||||
3650R Commercial Mortgage Trust, Series 2022-PF2, Class B, 5.466% 11/15/20554,10 | 12,673 | 11,808 | ||
Arbor Multi Family Mortgage Securities Trust, Series 2020-MF1, Class B, 3.718% 5/15/20534,10 | 500 | 443 | ||
Banc of America Commercial Mortgage, Inc., Series 2016-UB10, Class C, 4.985% 7/15/20494,10 | 3,560 | 3,361 | ||
Banc of America Commercial Mortgage, Inc., Series 2017-BNK3, Class A4, 3.574% 2/15/205010 | 10 | 10 | ||
Bank Commercial Mortgage Trust, Series 2023-5YR2, Class AS, 7.379% 6/15/20284,10 | 9,699 | 10,159 | ||
Bank Commercial Mortgage Trust, Series 2023-5YR2, Class C, 7.403% 7/15/20284,10 | 5,948 | 6,073 | ||
Bank Commercial Mortgage Trust, Series 2022-BNK44, Class B, 5.936% 11/15/20324,10 | 8,333 | 8,177 | ||
Bank Commercial Mortgage Trust, Series 2022-BNK44, Class C, 5.936% 11/15/20324,10 | 7,500 | 7,115 | ||
Bank Commercial Mortgage Trust, Series 2019-BN23, Class C, 3.622% 12/15/20524,10 | 6,986 | 5,732 | ||
Bank Commercial Mortgage Trust, Series 2017-BNK9, Class A4, 3.538% 11/15/205410 | 10 | 9 | ||
Bank Commercial Mortgage Trust, Series 2022-BNK43, Class B, 5.326% 8/15/20554,10 | 5,250 | 4,751 | ||
Bank Commercial Mortgage Trust, Series 2023-BNK45, Class B, 6.148% 2/15/20564,10 | 5,618 | 5,650 | ||
Bank Commercial Mortgage Trust, Series 2023-BNK45, Class C, 6.488% 2/15/20564,10 | 1,535 | 1,522 | ||
Bank Commercial Mortgage Trust, Series 2023-5YR1, Class B, 6.624% 3/15/20564,10 | 13,148 | 12,893 | ||
Bank Commercial Mortgage Trust, Series 2023-BNK46, Class B, 6.999% 8/15/20564,10 | 7,654 | 8,061 | ||
Bank Commercial Mortgage Trust, Series 2023-BNK46, Class C, 6.999% 8/15/20564,10 | 6,801 | 7,047 | ||
Bank Commercial Mortgage Trust, Series 2023-5YR3, Class C, 7.559% 9/15/20564,10 | 12,718 | 13,131 | ||
Bank Commercial Mortgage Trust, Series 2023-5YR4, Class C, 7.858% 12/15/20564,10 | 7,419 | 7,794 | ||
Bank Commercial Mortgage Trust, Series 2023-5YR4, Class B, 7.858% 12/15/20564,10 | 6,574 | 6,945 | ||
Bank Commercial Mortgage Trust, Series 2024-5YR6, Class C, 7.199% 5/15/20574,10 | 3,921 | 3,997 | ||
Bank Commercial Mortgage Trust, Series 2017-BNK7, Class C, 4.142% 9/15/20604,10 | 2,522 | 2,109 |
21 | American Funds Multi-Sector Income Fund |
Bonds, notes & other debt instruments (continued) | Principal amount (000) | Value (000) | ||
Mortgage-backed obligations (continued) | ||||
Commercial mortgage-backed securities (continued) | ||||
Bank Commercial Mortgage Trust, Series 2019-BN19, Class B, 3.647% 8/15/206110 | USD4,000 | $3,257 | ||
Bank Commercial Mortgage Trust, Series 2019-BN18, Class C, 4.357% 5/15/20624,10 | 2,000 | 1,518 | ||
Bank Commercial Mortgage Trust, Series 2019-BN20, Class B, 3.395% 9/15/20624,10 | 3,865 | 3,232 | ||
Bank Commercial Mortgage Trust, Series 2020-BN25, Class C, 3.467% 1/15/20634,10 | 6,257 | 4,802 | ||
Bank Commercial Mortgage Trust, Series 2020-BN26, Class C, 3.414% 3/15/20634,10 | 9,265 | 7,443 | ||
Bank of America Merrill Lynch Large Loan, Inc., Series 2015-200P, Class B, 3.49% 4/14/20331,10 | 3,000 | 2,891 | ||
Bank of America Merrill Lynch Large Loan, Inc., Series 2015-200P, Class C, 3.716% 4/14/20331,4,10 | 2,000 | 1,923 | ||
Barclays Commercial Mortgage Securities, LLC, Series 2018-TALL, Class A, ((1-month USD CME Term SOFR + 0.047%) + 0.872%) 6.248% 3/15/20371,4,10 | 3,396 | 3,215 | ||
Barclays Commercial Mortgage Securities, LLC, Series 2022-C17, Class B, 4.889% 9/15/20554,10 | 11,003 | 10,194 | ||
Barclays Commercial Mortgage Securities, LLC, Series 2022-C18, Class C, 6.348% 12/15/20554,10 | 12,328 | 11,862 | ||
Barclays Commercial Mortgage Securities, LLC, Series 2023-C19, Class AS, 6.07% 4/15/20564,10 | 14,763 | 14,938 | ||
Barclays Commercial Mortgage Securities, LLC, Series 2023-C19, Class B, 6.545% 4/15/20564,10 | 1,954 | 1,986 | ||
Barclays Commercial Mortgage Securities, LLC, Series 2023-C19, Class C, 6.597% 4/15/20564,10 | 6,078 | 6,008 | ||
Barclays Commercial Mortgage Securities, LLC, Series 2023-C20, Class B, 6.167% 7/15/20564,10 | 19,000 | 19,311 | ||
Barclays Commercial Mortgage Securities, LLC, Series 2023-C20, Class C, 6.828% 7/15/20564,10 | 6,586 | 6,450 | ||
Barclays Commercial Mortgage Securities, LLC, Series 2023-C22, Class C, 7.363% 11/15/20564,10 | 2,283 | 2,426 | ||
Barclays Commercial Mortgage Securities, LLC, Series 2023-5C23, Class B, 7.703% 12/15/20564,10 | 9,755 | 10,313 | ||
Barclays Commercial Mortgage Securities, LLC, Series 2023-5C23, Class C, 7.703% 12/15/20564,10 | 3,395 | 3,521 | ||
Barclays Commercial Mortgage Securities, LLC, Series 2024-C24, Class C, 6.00% 2/15/205710 | 759 | 742 | ||
Barclays Commercial Mortgage Securities, LLC, Series 2024-C26, Class C, 6.00% 5/15/20574,10 | 1,617 | 1,583 | ||
Barclays Commercial Mortgage Securities, LLC, Series 24-5C27, Class B, 6.70% 7/15/20574,10 | 6,536 | 6,733 | ||
Barclays Commercial Mortgage Securities, LLC, Series 24-5C27, Class C, 6.70% 7/15/20574,10 | 3,933 | 3,971 | ||
Benchmark Mortgage Trust, Series 2024-V7, Class AS, 6.533% 6/15/202910 | 12,887 | 13,338 | ||
Benchmark Mortgage Trust, Series 2018-B2, Class A4, 3.615% 2/15/205110 | 25 | 24 | ||
Benchmark Mortgage Trust, Series 2018-B2, Class B, 4.425% 2/15/20514,10 | 3,000 | 2,654 | ||
Benchmark Mortgage Trust, Series 2018-B3, Class A5, 4.025% 4/10/205110 | 10 | 9 | ||
Benchmark Mortgage Trust, Series 2018-B3, Class B, 4.295% 4/10/20514,10 | 1,445 | 1,263 | ||
Benchmark Mortgage Trust, Series 2018-B4, Class A5, 4.121% 7/15/20514,10 | 10 | 10 | ||
Benchmark Mortgage Trust, Series 2021-B25, Class B, 2.635% 4/15/205410 | 5,500 | 4,172 | ||
Benchmark Mortgage Trust, Series 2021-B28, Class B, 2.244% 8/15/20544,10 | 7,500 | 5,792 | ||
Benchmark Mortgage Trust, Series 2022-B34, Class A5, 3.786% 4/15/20554,10 | 7,000 | 6,161 | ||
Benchmark Mortgage Trust, Series 2022-B35, Class C, 4.592% 5/15/20554,10 | 12,266 | 9,654 | ||
Benchmark Mortgage Trust, Series 2022-B35, Class B, 4.592% 5/15/20554,10 | 2,000 | 1,655 | ||
Benchmark Mortgage Trust, Series 2023-V2, Class B, 6.995% 5/15/20554,10 | 11,487 | 11,755 | ||
Benchmark Mortgage Trust, Series 2023-V2, Class C, 6.995% 5/15/20554,10 | 9,404 | 9,530 | ||
Benchmark Mortgage Trust, Series 2022-B36, Class B, 4.87% 7/15/20554,10 | 7,500 | 6,628 | ||
Benchmark Mortgage Trust, Series 2023-B38, Class AM, 6.121% 4/15/20564,10 | 22,618 | 23,281 | ||
Benchmark Mortgage Trust, Series 2023-B38, Class B, 6.245% 4/15/20564,10 | 10,487 | 10,530 | ||
Benchmark Mortgage Trust, Series 2023-B38, Class C, 6.245% 4/15/20564,10 | 6,492 | 5,749 | ||
Benchmark Mortgage Trust, Series 2023-V3, Class B, 6.924% 7/15/205610 | 6,493 | 6,644 | ||
Benchmark Mortgage Trust, Series 2023-V3, Class C, 7.412% 7/15/20564,10 | 8,813 | 8,949 | ||
Benchmark Mortgage Trust, Series 2023-V4, Class C, 7.709% 11/15/20564,10 | 7,698 | 7,963 | ||
Benchmark Mortgage Trust, Series 2023-V4, Class B, 7.709% 11/15/20564,10 | 5,821 | 6,138 | ||
Benchmark Mortgage Trust, Series 2023-B40, Class B, 6.581% 12/15/20564,10 | 7,144 | 7,391 | ||
Benchmark Mortgage Trust, Series 2023-B40, Class C, 7.661% 12/15/20564,10 | 2,900 | 3,063 | ||
Benchmark Mortgage Trust, Series 2024-V5, Class B, 6.059% 1/10/205710 | 1,802 | 1,799 | ||
Benchmark Mortgage Trust, Series 2024-V5, Class AM, 6.417% 1/10/205710 | 4,705 | 4,835 | ||
Benchmark Mortgage Trust, Series 2024-V5, Class C, 7.205% 1/10/20574,10 | 1,155 | 1,176 | ||
Benchmark Mortgage Trust, Series 2019-B13, Class A4, 2.952% 8/15/205710 | 20 | 18 |
American Funds Multi-Sector Income Fund | 22 |
Bonds, notes & other debt instruments (continued) | Principal amount (000) | Value (000) | ||
Mortgage-backed obligations (continued) | ||||
Commercial mortgage-backed securities (continued) | ||||
BLP Commercial Mortgage Trust, Series 2024-IND2, Class D, (1-month USD CME Term SOFR + 2.59%) 7.907% 3/15/20411,4,10 | USD6,742 | $6,701 | ||
BMO Mortgage Trust, Series 2023-C4, Class B, 5.591% 2/15/20564,10 | 3,081 | 3,050 | ||
BMO Mortgage Trust, Series 2023-C5, Class B, 6.697% 6/15/20564,10 | 6,244 | 6,494 | ||
BMO Mortgage Trust, Series 2023-C5, Class C, 6.847% 6/15/20564,10 | 2,161 | 2,211 | ||
BMO Mortgage Trust, Series 2023-5C1, Class B, 6.96% 8/15/20564,10 | 10,516 | 10,794 | ||
BMO Mortgage Trust, Series 2023-5C1, Class C, 7.355% 8/15/20564,10 | 4,437 | 4,502 | ||
BMO Mortgage Trust, Series 2023-C6, Class B, 6.636% 9/15/20564,10 | 3,625 | 3,791 | ||
BMO Mortgage Trust, Series 2023-5C2, Class C, 7.485% 11/15/20564,10 | 2,982 | 3,096 | ||
BMO Mortgage Trust, Series 2023-C7, Class C, 7.36% 12/15/20564,10 | 2,790 | 2,939 | ||
BMO Mortgage Trust, Series 2024-5C3, Class D, 4.00% 2/15/20571,10 | 666 | 557 | ||
BMO Mortgage Trust, Series 2024-5C3, Class AS, 6.286% 2/15/20574,10 | 3,718 | 3,802 | ||
BMO Mortgage Trust, Series 2024-5C3, Class B, 6.557% 2/15/20574,10 | 2,453 | 2,496 | ||
BMO Mortgage Trust, Series 2024-5C3, Class C, 7.088% 2/15/20574,10 | 2,370 | 2,400 | ||
BMO Mortgage Trust, Series 2024-5C4, Class C, 7.254% 5/15/20574,10 | 9,404 | 9,593 | ||
BMO Mortgage Trust, Series 2024-C9, Class B, 6.56% 7/15/20574,10 | 6,165 | 6,350 | ||
BMO Mortgage Trust, Series 2024-C9, Class C, 6.60% 7/15/20574,10 | 9,528 | 9,528 | ||
BMP Trust, Series 2024-MF23, Class E, (1-month USD CME Term SOFR + 3.389%) 8.718% 6/15/20411,4,10 | 10,032 | 9,992 | ||
BOCA Commercial Mortgage Trust, Series 2022-BOCA, Class B, (1-month USD CME Term SOFR + 2.319%) 7.648% 5/15/20391,4,10 | 2,694 | 2,692 | ||
BX Trust, Series 2022-CSMO, Class B, (1-month USD CME Term SOFR + 3.141%) 8.47% 6/15/20271,4,10 | 10,000 | 10,041 | ||
BX Trust, Series 24-VLT4, Class E, (1-month USD CME Term SOFR + 2.889%) 8.209% 7/15/20291,4,10 | 9,513 | 9,494 | ||
BX Trust, Series 2021-MFM1, Class B, (1-month USD CME Term SOFR + 1.064%) 6.393% 1/15/20341,4,10 | 3,065 | 3,029 | ||
BX Trust, Series 2024-KING, Class C, (1-month USD CME Term SOFR + 1.94%) 7.269% 5/15/20341,4,10 | 8,092 | 8,118 | ||
BX Trust, Series 2024-KING, Class D, (1-month USD CME Term SOFR + 2.49%) 7.79% 5/15/20341,4,10 | 7,500 | 7,505 | ||
BX Trust, Series 2021-SDMF, Class B, (1-month USD CME Term SOFR + 0.852%) 6.181% 9/15/20341,4,10 | 2,878 | 2,818 | ||
BX Trust, Series 2021-SDMF, Class C, (1-month USD CME Term SOFR + 1.002%) 6.331% 9/15/20341,4,10 | 2,014 | 1,969 | ||
BX Trust, Series 2021-SDMF, Class D, (1-month USD CME Term SOFR + 1.501%) 6.83% 9/15/20341,4,10 | 1,919 | 1,867 | ||
BX Trust, Series 2021-SDMF, Class E, (1-month USD CME Term SOFR + 1.701%) 7.03% 9/15/20341,4,10 | 1,390 | 1,351 | ||
BX Trust, Series 2021-VOLT, Class A, (1-month USD CME Term SOFR + 0.814%) 6.143% 9/15/20361,4,10 | 1,733 | 1,713 | ||
BX Trust, Series 2021-VOLT, Class B, (1-month USD CME Term SOFR + 1.064%) 6.393% 9/15/20361,4,10 | 2,696 | 2,659 | ||
BX Trust, Series 2021-VOLT, Class D, (1-month USD CME Term SOFR + 1.764%) 7.093% 9/15/20361,4,10 | 4,410 | 4,348 | ||
BX Trust, Series 2021-VOLT, Class E, (1-month USD CME Term SOFR + 2.114%) 7.443% 9/15/20361,4,10 | 7,510 | 7,421 | ||
BX Trust, Series 2021-ARIA, Class A, (1-month USD CME Term SOFR + 1.014%) 6.342% 10/15/20361,4,10 | 1,992 | 1,969 | ||
BX Trust, Series 2021-ARIA, Class B, (1-month USD CME Term SOFR + 1.411%) 6.74% 10/15/20361,4,10 | 10,749 | 10,606 | ||
BX Trust, Series 2021-ARIA, Class C, (1-month USD CME Term SOFR + 1.76%) 7.089% 10/15/20361,4,10 | 1,992 | 1,960 | ||
BX Trust, Series 2021-ARIA, Class D, (1-month USD CME Term SOFR + 2.01%) 7.339% 10/15/20361,4,10 | 2,810 | 2,761 | ||
BX Trust, Series 2022-IND, Class D, (1-month USD CME Term SOFR + 2.839%) 8.168% 4/15/20371,4,10 | 583 | 582 | ||
BX Trust, Series 2021-SOAR, Class B, (1-month USD CME Term SOFR + 0.984%) 6.313% 6/15/20381,4,10 | 716 | 707 | ||
BX Trust, Series 2021-SOAR, Class C, (1-month USD CME Term SOFR + 1.214%) 6.543% 6/15/20381,4,10 | 646 | 638 | ||
BX Trust, Series 2021-SOAR, Class D, (1-month USD CME Term SOFR + 1.514%) 6.843% 6/15/20381,4,10 | 8,179 | 8,080 | ||
BX Trust, Series 2021-ACNT, Class B, (1-month USD CME Term SOFR + 1.364%) 6.693% 11/15/20381,4,10 | 11,495 | 11,371 | ||
BX Trust, Series 2021-ACNT, Class C, (1-month USD CME Term SOFR + 1.614%) 6.943% 11/15/20381,4,10 | 1,851 | 1,826 |
23 | American Funds Multi-Sector Income Fund |
Bonds, notes & other debt instruments (continued) | Principal amount (000) | Value (000) | ||
Mortgage-backed obligations (continued) | ||||
Commercial mortgage-backed securities (continued) | ||||
BX Trust, Series 2021-ACNT, Class D, (1-month USD CME Term SOFR + 1.964%) 7.293% 11/15/20381,4,10 | USD2,813 | $2,778 | ||
BX Trust, Series 2021-ACNT, Class E, (1-month USD CME Term SOFR + 2.311%) 7.64% 11/15/20381,4,10 | 1,372 | 1,356 | ||
BX Trust, Series 2022-AHP, Class B, (1-month USD CME Term SOFR + 1.84%) 7.169% 2/15/20391,4,10 | 3,000 | 2,957 | ||
BX Trust, Series 2022-LP2, Class D, (1-month USD CME Term SOFR + 1.961%) 7.29% 2/15/20391,4,10 | 2,372 | 2,340 | ||
BX Trust, Series 2022-AHP, Class C, (1-month USD CME Term SOFR + 2.09%) 7.419% 2/15/20391,4,10 | 4,000 | 3,912 | ||
BX Trust, Series 2022-PSB, Class B, (1-month USD CME Term SOFR + 2.949%) 8.278% 8/15/20391,4,10 | 8,941 | 8,939 | ||
BX Trust, Series 2022-PSB, Class C, (1-month USD CME Term SOFR + 3.697%) 9.026% 8/15/20391,4,10 | 7,759 | 7,766 | ||
BX Trust, Series 2022-PSB, Class D, (1-month USD CME Term SOFR + 4.693%) 10.022% 8/15/20391,4,10 | 7,633 | 7,640 | ||
BX Trust, Series 2022-GPA, Class B, (1-month USD CME Term SOFR + 2.664%) 7.989% 10/15/20391,4,10 | 7,744 | 7,762 | ||
BX Trust, Series 2022-GPA, Class C, (1-month USD CME Term SOFR + 3.213%) 8.539% 10/15/20391,4,10 | 14,650 | 14,700 | ||
BX Trust, Series 2022-GPA, Class D, (1-month USD CME Term SOFR + 4.061%) 9.389% 10/15/20391,4,10 | 1,828 | 1,836 | ||
BX Trust, Series 2019-OC11, Class C, 3.856% 12/9/20411,10 | 1,090 | 971 | ||
BX Trust, Series 2019-OC11, Class D, 4.075% 12/9/20411,4,10 | 2,326 | 2,062 | ||
BX Trust, Series 2020-VIV2, Class C, 3.66% 3/9/20441,4,10 | 5,150 | 4,489 | ||
BX Trust, Series 2020-VIV3, Class B, 3.662% 3/9/20441,4,10 | 4,948 | 4,376 | ||
BXSC Commercial Mortgage Trust, Series 2022-WSS, Class B, (1-month USD CME Term SOFR + 2.092%) 7.421% 3/15/20351,4,10 | 13,740 | 13,652 | ||
BXSC Commercial Mortgage Trust, Series 2022-WSS, Class D, (1-month USD CME Term SOFR + 3.188%) 8.517% 3/15/20351,4,10 | 2,485 | 2,450 | ||
CD Commercial Mortgage Trust, Series 2017-CD6, Class A5, 3.456% 11/13/205010 | 10 | 9 | ||
CENT Trust 2023-CITY, Series 2023-CITY, Class B, (1-month USD CME Term SOFR + 3.15%) 8.479% 9/15/20281,4,10 | 11,978 | 12,069 | ||
Citigroup Commercial Mortgage Trust, Series 2023-PRM3, Class D, 6.572% 7/10/20281,4,10 | 13,008 | 12,481 | ||
Citigroup Commercial Mortgage Trust, Series 2023-SMRT, Class D, 6.048% 10/12/20401,4,10 | 28,218 | 27,313 | ||
Citigroup Commercial Mortgage Trust, Series 2023-SMRT, Class C, 6.048% 10/12/20401,4,10 | 2,450 | 2,411 | ||
Citigroup Commercial Mortgage Trust, Series 2014-GC21, Class B, 4.328% 5/10/20474,10 | 1,790 | 1,710 | ||
Citigroup Commercial Mortgage Trust, Series 2014-GC25, Class AS, 4.017% 10/10/204710 | 438 | 436 | ||
Citigroup Commercial Mortgage Trust, Series 2014-GC25, Class B, 4.345% 10/10/20474,10 | 3,964 | 3,899 | ||
Citigroup Commercial Mortgage Trust, Series 2015-GC27, Class B, 3.772% 2/10/204810 | 7,892 | 7,734 | ||
Citigroup Commercial Mortgage Trust, Series 2015-GC27, Class C, 4.566% 2/10/20484,10 | 3,656 | 3,500 | ||
Citigroup Commercial Mortgage Trust, Series 2015-GC29, Class C, 4.274% 4/10/20484,10 | 2,660 | 2,514 | ||
Citigroup Commercial Mortgage Trust, Series 2020-GC46, Class B, 3.15% 2/15/20534,10 | 1,835 | 1,553 | ||
Citigroup Commercial Mortgage Trust, Series 2022-GC48, Class C, 5.037% 5/15/20544,10 | 3,000 | 2,597 | ||
Citigroup Commercial Mortgage Trust, Series 2015-GC33, Class A3, 3.515% 9/10/205810 | 290 | 285 | ||
Commercial Mortgage Trust, Series 2020-CX, Class D, 2.773% 11/10/20461,4,10 | 6,000 | 4,575 | ||
Commercial Mortgage Trust, Series 2014-UBS4, Class B, 4.701% 3/10/204710 | 162 | 155 | ||
Commercial Mortgage Trust, Series 2014-CR16, Class C, 5.053% 4/10/20474,10 | 460 | 430 | ||
Commercial Mortgage Trust, Series 2014-CR18, Class B, 4.456% 7/15/20474,10 | 381 | 376 | ||
Commercial Mortgage Trust, Series 2014-UBS4, Class AM, 3.968% 8/10/204710 | 108 | 103 | ||
Commercial Mortgage Trust, Series 2014-CR19, Class AM, 4.08% 8/10/204710 | 99 | 99 | ||
Commercial Mortgage Trust, Series 2014-LC17, Class B, 4.49% 10/10/20474,10 | 950 | 938 | ||
Commercial Mortgage Trust, Series 2014-UBS6, Class C, 4.581% 12/10/20474,10 | 605 | 545 | ||
Commercial Mortgage Trust, Series 2015-CR26, Class B, 4.613% 10/10/20484,10 | 8,035 | 7,620 | ||
Commercial Mortgage Trust, Series 2015-CCRE-26, Class C, 4.613% 10/10/20484,10 | 860 | 773 |
American Funds Multi-Sector Income Fund | 24 |
Bonds, notes & other debt instruments (continued) | Principal amount (000) | Value (000) | ||
Mortgage-backed obligations (continued) | ||||
Commercial mortgage-backed securities (continued) | ||||
Commercial Mortgage Trust, Series 2016-COR1, Class A4, 3.091% 10/10/204910 | USD25 | $23 | ||
Commercial Mortgage Trust, Series 2015-PC1, Class AM, 4.29% 7/10/20504,10 | 250 | 243 | ||
DATA 2023-CNTR Mortgage Trust, Series 2023-CNTR, Class C, 5.919% 8/12/20431,4,10 | 2,000 | 1,790 | ||
DATA 2023-CNTR Mortgage Trust, Series 2023-CNTR, Class D, 5.919% 8/12/20431,4,10 | 19,597 | 16,646 | ||
DC Commercial Mortgage Trust, Series 2023-DC, Class D, 7.379% 9/10/20401,4,10 | 22,681 | 22,578 | ||
DC Commercial Mortgage Trust, Series 2023-DC, Class C, 7.379% 9/10/20401,4,10 | 4,080 | 4,175 | ||
ELM Trust 2024, Series 2024-ELM, Class D10, 6.626% 6/10/20391,4,10 | 2,040 | 2,044 | ||
ELM Trust 2024, Series 2024-ELM, Class D15, 6.674% 6/10/20391,4,10 | 1,834 | 1,838 | ||
Extended Stay America Trust, Series 2021-ESH, Class B, (1-month USD CME Term SOFR + 1.494%) 6.823% 7/15/20381,4,10 | 348 | 347 | ||
Extended Stay America Trust, Series 2021-ESH, Class C, (1-month USD CME Term SOFR + 1.814%) 7.143% 7/15/20381,4,10 | 2,180 | 2,176 | ||
Extended Stay America Trust, Series 2021-ESH, Class D, (1-month USD CME Term SOFR + 2.364%) 7.693% 7/15/20381,4,10 | 7,899 | 7,903 | ||
FIVE Mortgage Trust, Series 2023-V1, Class B, 6.507% 2/10/20564,10 | 7,432 | 7,412 | ||
FIVE Mortgage Trust, Series 2023-V1, Class C, 6.507% 2/10/20564,10 | 2,917 | 2,848 | ||
Fontainebleau Miami Beach Trust, CMO, Series 2019-FBLU, Class C, 3.75% 12/10/20361,10 | 500 | 491 | ||
Fontainebleau Miami Beach Trust, CMO, Series 2019-FBLU, Class D, 4.095% 12/10/20361,4,10 | 5,455 | 5,322 | ||
FS Commercial Trust, Series 2023-4SZN, Class C, 8.392% 11/10/20391,4,10 | 9,193 | 9,524 | ||
FS Commerical Mortgage Trust, Series 2023-4SZN, Class D, 9.383% 11/10/20391,4,10 | 6,000 | 6,242 | ||
Great Wolf Trust, Series 2024-WOLF, Class C, (1-month USD CME Term SOFR + 2.391%) 7.72% 3/15/20391,4,10 | 9,249 | 9,262 | ||
Great Wolf Trust, Series 2024-WOLF, Class D, (1-month USD CME Term SOFR + 2.89%) 8.219% 3/15/20391,4,10 | 7,434 | 7,455 | ||
GS Mortgage Securities Trust, Series 2024-70P, Class B, 5.887% 3/10/20411,4,10 | 7,337 | 7,190 | ||
GS Mortgage Securities Trust, Series 2024-70P, Class C, 6.287% 3/10/20411,4,10 | 9,423 | 9,221 | ||
GS Mortgage Securities Trust, Series 2024-70P, Class D, 7.531% 3/10/20411,4,10 | 13,520 | 13,302 | ||
GS Mortgage Securities Trust, Series 2020-GS1, Class A2, 3.47% 11/10/204810 | 200 | 194 | ||
GS Mortgage Securities Trust, Series 2018-GS10, Class AS, 4.384% 7/10/20514,10 | 4,000 | 3,663 | ||
GS Mortgage Securities Trust, Series 2019-GC40, Class C, 3.946% 7/10/205210 | 3,364 | 2,698 | ||
Hawaii Hotel Trust, Series 2019-MAUI, Class E, (1-month USD CME Term SOFR + 2.207%) 7.786% 5/15/20381,4,10 | 4,000 | 3,985 | ||
Hilton USA Trust, Series 2024-ORL, Class B, (1-month USD CME Term SOFR + 1.941%) 7.27% 5/15/20371,4,10 | 10,000 | 10,012 | ||
Hilton USA Trust, Series 2024-ORL, Class C, (1-month USD CME Term SOFR + 2.44%) 7.769% 5/15/20371,4,10 | 6,639 | 6,639 | ||
Hilton USA Trust, Series 2016-HHV, Class D, 4.194% 11/5/20381,10 | 1,230 | 1,163 | ||
HTL Commercial Mortgage Trust, Series 2024-T53, Class C, 7.324% 5/10/20391,4,10 | 3,152 | 3,167 | ||
HTL Commercial Mortgage Trust, Series 2024-T53, Class D, 8.471% 5/10/20391,4,10 | 3,846 | 3,885 | ||
INTOWN Mortgage Trust, Series 2022-STAY, Class B, (1-month USD CME Term SOFR + 3.286%) 8.615% 8/15/20371,4,10 | 7,882 | 7,914 | ||
INTOWN Mortgage Trust, Series 2022-STAY, Class C, (1-month USD CME Term SOFR + 3.685%) 9.014% 8/15/20371,4,10 | 3,120 | 3,135 | ||
JPMorgan Chase Commercial Mortgage Securities Trust, Series 2022-OPO, Class C, 3.377% 1/5/20391,10 | 1,750 | 1,466 | ||
JPMorgan Chase Commercial Mortgage Securities Trust, Series 2022-OPO, Class C, 3.565% 1/5/20391,4,10 | 437 | 353 | ||
LSTAR Commercial Mortgage Trust, Series 2017-5, Class C, 4.823% 3/10/20501,4,10 | 1,725 | 1,481 | ||
LUXE Commercial Mortgage Trust, Series 2021-TRIP, Class B, (1-month USD CME Term SOFR + 1.514%) 6.85% 10/15/20381,4,10 | 795 | 793 | ||
LUXE Commercial Mortgage Trust, Series 21-TRIP, Class C, (1-month USD CME Term SOFR + 1.864%) 7.20% 10/15/20381,4,10 | 5,000 | 4,974 | ||
MHC Commercial Mortgage Trust, CMO, Series 2021-MHC, Class A, (1-month USD CME Term SOFR + 0.915%) 6.244% 4/15/20381,4,10 | 1,287 | 1,277 | ||
Morgan Stanley Bank of America Merrill Lynch Trust, Series 2014-C18, Class AS, 4.11% 10/15/20474,10 | 1,189 | 1,180 | ||
Morgan Stanley Bank of America Merrill Lynch Trust, Series 2015-C20, Class B, 4.16% 2/15/204810 | 18,113 | 17,656 | ||
Morgan Stanley Bank of America Merrill Lynch Trust, Series 2015-C22, Class AS, 3.561% 4/15/204810 | 2,311 | 2,247 | ||
Morgan Stanley Bank of America Merrill Lynch Trust, Series 2015-C24, Class AS, 4.036% 5/15/20484,10 | 3,586 | 3,392 | ||
Morgan Stanley Bank of America Merrill Lynch Trust, Series 2015-C25, Class B, 4.668% 10/15/20484,10 | 74 | 70 | ||
Morgan Stanley Capital I Trust, Series 2017-H1, Class A5, 3.53% 6/15/205010 | 45 | 42 |
25 | American Funds Multi-Sector Income Fund |
Bonds, notes & other debt instruments (continued) | Principal amount (000) | Value (000) | ||
Mortgage-backed obligations (continued) | ||||
Commercial mortgage-backed securities (continued) | ||||
Morgan Stanley Capital I Trust, Series 2019-L3, Class B, 3.771% 11/15/20524,10 | USD5,300 | $4,663 | ||
MSWF Commercial Mortgage Trust, Series 2023-1, Class B, 6.906% 5/15/20334,10 | 4,566 | 4,873 | ||
MSWF Commercial Mortgage Trust, Series 2023-1, Class C, 6.906% 5/15/20334,10 | 4,606 | 4,754 | ||
MSWF Commercial Mortgage Trust, Series 2023-2, Class B, 7.11% 12/15/20564,10 | 13,301 | 14,163 | ||
MSWF Commercial Mortgage Trust, Series 2023-2, Class C, 7.252% 12/15/20564,10 | 2,549 | 2,655 | ||
Multifamily Connecticut Avenue Securities, Series 2019-1, Class M10, (30-day Average USD-SOFR + 3.364%) 8.70% 10/15/20491,4,10 | 1,297 | 1,300 | ||
Multifamily Connecticut Avenue Securities, Series 2020-1, Class M10, (30-day Average USD-SOFR + 3.864%) 9.20% 3/25/20501,4,10 | 8,687 | 8,738 | ||
Multifamily Connecticut Avenue Securities, Series 2023-01, Class M7, (30-day Average USD-SOFR + 4.00%) 9.335% 11/25/20531,4,10 | 9,288 | 9,654 | ||
Multifamily Connecticut Avenue Securities, Series 2023-01, Class M10, (30-day Average USD-SOFR + 6.50%) 11.835% 11/25/20531,4,10 | 26,635 | 29,907 | ||
Multifamily Structured Credit Risk, Series 21-MN1, Class M2, (30-day Average USD-SOFR + 3.75%) 9.085% 1/25/20511,4,10 | 2,730 | 2,758 | ||
Multifamily Structured Credit Risk, Series 21-MN3, Class M2, 9.335% 11/25/20511,4,10 | 3,500 | 3,555 | ||
One Market Plaza Trust, Series 2017-1MKT, Class A, 3.614% 2/10/20321,10 | 3,558 | 3,188 | ||
One Market Plaza Trust, Series 2017-1MKT, Class C, 4.016% 2/10/20321,10 | 3,000 | 2,571 | ||
ORL Trust, Series 2023-GLKS, Class C, (1-month USD CME Term SOFR + 3.651%) 8.98% 10/19/20361,4,10 | 10,811 | 10,838 | ||
ORL Trust, Series 2023-GLKS, Class D, (1-month USD CME Term SOFR + 4.301%) 9.63% 10/19/20361,4,10 | 18,716 | 18,840 | ||
SDR Commercial Mortgage Trust, Series 2024-DSNY, Class B, (1-month USD CME Term SOFR + 1.741%) 7.07% 5/15/20391,4,10 | 6,070 | 6,051 | ||
SFO Commerical Mortgage Trust, Series 2021-555, Class A, (1-month USD CME Term SOFR + 1.264%) 6.593% 5/15/2038 (1-month USD CME Term SOFR + 1.514% on 5/15/2026)1,2,10 | 2,350 | 2,228 | ||
SFO Commerical Mortgage Trust, Series 2021-555, Class B, (1-month USD CME Term SOFR + 1.614%) 6.943% 5/15/20381,4,10 | 1,834 | 1,693 | ||
SFO Commercial Mortgage Trust, Series 2021-555, Class C, (1-month USD CME Term SOFR + 1.914%) 7.243% 5/15/20381,4,10 | 3,000 | 2,740 | ||
SREIT Trust, Series 2021-FLWR, Class A, (1-month USD CME Term SOFR + 0.691%) 6.02% 7/15/20361,4,10 | 1,558 | 1,539 | ||
SREIT Trust, Series 2021-FLWR, Class B, (1-month USD CME Term SOFR + 1.04%) 6.369% 7/15/20361,4,10 | 8,000 | 7,882 | ||
SREIT Trust, Series 2021-MFP, Class A, (1-month USD CME Term SOFR + 0.845%) 6.174% 11/15/20381,4,10 | 1,380 | 1,368 | ||
SREIT Trust, Series 2021-MFP, Class B, (1-month USD CME Term SOFR + 1.194%) 6.523% 11/15/20381,4,10 | 1,478 | 1,458 | ||
SREIT Trust, Series 2021-MFP, Class C, (1-month USD CME Term SOFR + 1.443%) 6.772% 11/15/20381,4,10 | 1,987 | 1,960 | ||
SREIT Trust, Series 2021-MFP, Class D, (1-month USD CME Term SOFR + 1.693%) 7.022% 11/15/20381,4,10 | 2,392 | 2,359 | ||
StorageMart Commercial Mortgage Trust, Series 2022-MINI, Class D, (1-month USD CME Term SOFR + 1.95%) 7.279% 1/15/20391,4,10 | 15,908 | 15,614 | ||
StorageMart Commercial Mortgage Trust, Series 2022-MINI, Class E, (1-month USD CME Term SOFR + 2.70%) 8.029% 1/15/20391,4,10 | 10,693 | 10,463 | ||
UBS Commercial Mortgage Trust, Series 2017-C3, Class C, 4.53% 8/15/20504,10 | 3,165 | 2,898 | ||
Wells Fargo Commercial Mortgage Trust, Series 2015-NXS1, Class C, 3.848% 5/15/20484,10 | 1,000 | 941 | ||
Wells Fargo Commercial Mortgage Trust, Series 2015-C28, Class AS, 3.872% 5/15/20484,10 | 3,115 | 3,032 | ||
Wells Fargo Commercial Mortgage Trust, Series 2015-C29, Class AS, 4.013% 6/15/20484,10 | 7,439 | 7,242 | ||
Wells Fargo Commercial Mortgage Trust, Series 2016-C35, Class C, 4.176% 7/15/20484,10 | 6,363 | 5,942 | ||
Wells Fargo Commercial Mortgage Trust, Series 2016-C34, Class A4, 3.096% 6/15/204910 | 25 | 24 | ||
Wells Fargo Commercial Mortgage Trust, Series 2017-C40, Class C, 4.445% 10/15/20504,10 | 5,079 | 4,535 | ||
Wells Fargo Commercial Mortgage Trust, Series 2018-C46, Class B, 4.633% 8/15/205110 | 2,903 | 2,640 | ||
Wells Fargo Commercial Mortgage Trust, Series 2019-C54, Class C, 3.81% 12/15/205210 | 2,000 | 1,634 | ||
Wells Fargo Commercial Mortgage Trust, Series 2015-NXS3, Class D, 3.153% 9/15/20571,10 | 3,561 | 3,255 |
American Funds Multi-Sector Income Fund | 26 |
Bonds, notes & other debt instruments (continued) | Principal amount (000) | Value (000) | ||
Mortgage-backed obligations (continued) | ||||
Commercial mortgage-backed securities (continued) | ||||
Wells Fargo Commercial Mortgage Trust, Series 2015-NXS3, Class B, 4.646% 9/17/20574,10 | USD4,100 | $3,963 | ||
Wells Fargo Commercial Mortgage Trust, Series 2015-LC22, Class B, 4.692% 9/15/20584,10 | 6,750 | 6,545 | ||
Wells Fargo Commercial Mortgage Trust, Series 2015-LC22, Class C, 4.692% 9/15/20584,10 | 110 | 106 | ||
Wells Fargo Commercial Mortgage Trust, Series 2016-NXS5, Class B, 5.109% 1/15/20594,10 | 5,760 | 5,443 | ||
WF-RBS Commercial Mortgage Trust, Series 2014-C22, Class AS, 4.069% 9/15/20574,10 | 3,560 | 3,297 | ||
WMRK Commercial Mortgage Trust, Series 2022-WMRK, Class A, (1-month USD CME Term SOFR + 2.789%) 8.118% 11/15/20271,4,10 | 15,228 | 15,283 | ||
WSTN Trust, Series 2023-MAUI, Class B, 7.263% 7/5/20371,4,10 | 10,388 | 10,363 | ||
WSTN Trust, Series 2023-MAUI, Class C, 7.958% 7/5/20371,4,10 | 4,602 | 4,557 | ||
WSTN Trust, Series 2023-MAUI, Class D, 8.748% 7/5/20371,4,10 | 8,993 | 8,923 | ||
1,281,072 | ||||
Collateralized mortgage-backed obligations (privately originated) 1.48% | ||||
BINOM Securitization Trust, Series 2022-RPL1, Class A1, 3.00% 2/25/20611,4,10 | 952 | 863 | ||
BRAVO Residential Funding Trust, Series 2020-RPL2, Class A1, 2.00% 5/25/20591,4,10 | 154 | 140 | ||
BRAVO Residential Funding Trust, Series 2022-RPL1, Class A1, 2.75% 9/25/20611,10 | 1,440 | 1,286 | ||
BRAVO Residential Funding Trust, Series 2022-R1, Class A, 3.125% 1/29/2070 (6.125% on 1/29/2025)1,2,10 | 10,901 | 10,276 | ||
Cascade Funding Mortgage Trust, Series 2023-HB12, Class M1, 4.25% 4/25/20331,4,10 | 6,729 | 6,408 | ||
Cascade Funding Mortgage Trust, Series 2023-HB12, Class A, 4.25% 4/25/20331,4,10 | 1,460 | 1,433 | ||
Cascade Funding Mortgage Trust, Series 2018-RM2, Class B, 4.00% 10/25/20681,4,10 | 1,060 | 1,005 | ||
Cascade Funding Mortgage Trust, Series 2018-RM2, Class C, 4.00% 10/25/20681,4,10 | 779 | 704 | ||
Cascade Funding Mortgage Trust, Series 2018-RM2, Class D, 4.00% 10/25/20681,4,10 | 779 | 678 | ||
Cascade Funding Mortgage Trust, Series 2018-RM2, Class A, 4.00% 10/25/20681,4,10 | 540 | 536 | ||
Cascade MH Asset Trust, Series 2022-MH1, Class A, 4.25% 8/25/2054 (5.25% on 11/25/2027)1,2,10 | 14,383 | 13,105 | ||
CFCRE Commercial Mortgage Trust, Series 2016-C7, Class A2, 3.585% 12/10/205410 | 176 | 168 | ||
Credit Suisse Mortgage Trust, Series 2020-NET, Class A, 2.257% 8/15/20371,10 | 100 | 94 | ||
Credit Suisse Mortgage Trust, Series 2020-NET, Class B, 2.816% 8/15/20371,10 | 2,200 | 2,074 | ||
FARM Mortgage Trust, Series 2024-1, Class B, 5.121% 10/1/20531,4,10 | 5,028 | 4,096 | ||
Freddie Mac Structured Agency Credit Risk Debt Notes, Series 2022-DNA4, Class M1B, (30-day Average USD-SOFR + 3.35%) 8.685% 5/25/20421,4,10 | 1,400 | 1,472 | ||
Freddie Mac Structured Agency Credit Risk Debt Notes, Series 2022-DNA6, Class M1A, (30-day Average USD-SOFR + 2.15%) 7.485% 9/25/20421,4,10 | 371 | 376 | ||
Freddie Mac Structured Agency Credit Risk Debt Notes, Series 2022-DNA6, Class M1B, (30-day Average USD-SOFR + 3.70%) 9.035% 9/25/20421,4,10 | 1,460 | 1,556 | ||
Freddie Mac Structured Agency Credit Risk Debt Notes, Series 2019-DNA3, Class B2, (30-day Average USD-SOFR + 8.264%) 13.60% 7/25/20491,4,10 | 6,325 | 7,336 | ||
Freddie Mac Structured Agency Credit Risk Debt Notes, Series 2019-HQA3, Class B2, (30-day Average USD-SOFR + 7.614%) 12.95% 9/25/20491,4,10 | 1,250 | 1,416 | ||
Freddie Mac Structured Agency Credit Risk Debt Notes, Series 2020-DNA2, Class B2, (30-day Average USD-SOFR + 4.914%) 10.25% 2/25/20501,4,10 | 10,867 | 11,666 | ||
Freddie Mac Structured Agency Credit Risk Debt Notes, Series 2020-DNA3, Class B2, (30-day Average USD-SOFR + 9.464%) 14.80% 6/25/20501,4,10 | 11,960 | 15,692 | ||
Freddie Mac Structured Agency Credit Risk Debt Notes, Series 2020-HQA3, Class B2, (30-day Average USD-SOFR + 10.114%) 15.45% 7/25/20501,4,10 | 4,000 | 5,423 | ||
Freddie Mac Structured Agency Credit Risk Debt Notes, Series 2020-DNA4, Class B1, (30-day Average USD-SOFR + 6.114%) 11.45% 8/25/20501,4,10 | 1,937 | 2,228 | ||
Freddie Mac Structured Agency Credit Risk Debt Notes, Series 2020-DNA4, Class B2, (30-day Average USD-SOFR + 10.114%) 15.45% 8/25/20501,4,10 | 23,335 | 31,703 | ||
Freddie Mac Structured Agency Credit Risk Debt Notes, Series 2020-DNA5, Class B2, (30-day Average USD-SOFR + 11.50%) 16.827% 10/25/20501,4,10 | 9,673 | 13,494 | ||
Freddie Mac Structured Agency Credit Risk Debt Notes, Series 2020-DNA6, Class B2, (30-day Average USD-SOFR + 5.65%) 10.985% 12/25/20501,4,10 | 6,575 | 7,484 | ||
JP Morgan Mortgage Trust, Series 2024-CES1, Class A3, 6.397% 6/25/2054 (7.397% on 3/1/2028)1,2,10 | 2,010 | 2,009 | ||
JP Morgan Mortgage Trust, Series 2024-CES1, Class M1, 6.596% 6/25/2054 (7.596% on 3/1/2028)1,2,10 | 1,628 | 1,621 | ||
Legacy Mortgage Asset Trust, Series 2020-GS4, Class A1, 6.25% 2/25/20601,10 | 180 | 180 | ||
Legacy Mortgage Asset Trust, Series 2020-GS3, Class A1, 7.25% 5/25/20601,10 | 1,312 | 1,331 |
27 | American Funds Multi-Sector Income Fund |
Bonds, notes & other debt instruments (continued) | Principal amount (000) | Value (000) | ||
Mortgage-backed obligations (continued) | ||||
Collateralized mortgage-backed obligations (privately originated) (continued) | ||||
Legacy Mortgage Asset Trust, Series 2022-GS1, Class A1, 4.00% 2/25/2061 (7.00% on 4/25/2025)1,2,10 | USD9,772 | $9,549 | ||
Legacy Mortgage Asset Trust, Series 2021-GS2, Class A1, 4.75% 4/25/2061 (5.75% on 4/25/2025)1,2,10 | 709 | 696 | ||
Legacy Mortgage Asset Trust, Series 2021-GS5, Class A1, 2.25% 7/25/2067 (5.25% on 11/25/2024)1,2,10 | 2,185 | 2,129 | ||
New Residential Mortgage Loan Trust, Series 2018-1A, Class A1A, 4.00% 12/25/20571,4,10 | 36 | 34 | ||
Progress Residential Trust, Series 2020-SFR2, Class A, 2.078% 6/18/20371,10 | 100 | 99 | ||
Progress Residential Trust, Series 2024-SFR1, Class E1, 3.85% 2/17/20411,10 | 5,658 | 5,023 | ||
Progress Residential Trust, Series 2024-SFR1, Class E2, 3.85% 2/17/20411,10 | 5,689 | 4,924 | ||
Progress Residential Trust, Series 2024-SFR2, Class E1, 3.40% 4/17/20411,4,10 | 3,064 | 2,668 | ||
Progress Residential Trust, Series 2024-SFR2, Class E2, 3.65% 4/17/20411,4,10 | 2,568 | 2,215 | ||
Progress Residential Trust, Series 2024-SFR3, Class E1, 4.00% 6/17/20411,10 | 6,913 | 6,155 | ||
Progress Residential Trust, Series 2024-SFR3, Class E2, 4.00% 6/17/20411,10 | 2,266 | 1,981 | ||
Reverse Mortgage Investment Trust, Series 2021-HB1, Class A, 1.259% 11/25/20311,4,10 | 152 | 149 | ||
Towd Point Mortgage Trust, Series 2017-2, Class B2, 4.183% 4/25/20571,4,10 | 2,400 | 2,169 | ||
Towd Point Mortgage Trust, Series 2018-1, Class A2, 3.25% 1/25/20581,4,10 | 2,477 | 2,335 | ||
Towd Point Mortgage Trust, Series 2019-4, Class M1B, 3.00% 10/25/20591,4,10 | 3,000 | 2,486 | ||
Treehouse Park Improvement Association No.1 9.75% 12/1/20331,6 | 22,184 | 21,685 | ||
Tricon Residential Trust, Series 2023-SFR1, Class C, 5.10% 7/17/20401,10 | 904 | 870 | ||
Tricon Residential Trust, Series 2023-SFR1, Class E, 7.977% 7/17/20401,10 | 1,087 | 1,098 | ||
VM Fund I, LLC 8.625% 1/15/20281,6 | 6,661 | 6,561 | ||
220,679 | ||||
Total mortgage-backed obligations | 1,501,751 | |||
Bonds & notes of governments & government agencies outside the U.S. 7.81% | ||||
Abu Dhabi (Emirate of) 2.50% 9/30/20291 | 15,000 | 13,434 | ||
Abu Dhabi (Emirate of) 1.70% 3/2/20311 | 12,800 | 10,570 | ||
Abu Dhabi (Emirate of) 3.875% 4/16/2050 | 22,300 | 17,780 | ||
Albania (Republic of) 5.90% 6/9/2028 | EUR4,300 | 4,751 | ||
Angola (Republic of) 8.25% 5/9/2028 | USD2,500 | 2,355 | ||
Angola (Republic of) 8.00% 11/26/2029 | 25,240 | 22,756 | ||
Angola (Republic of) 8.75% 4/14/2032 | 24,100 | 21,389 | ||
Argentine Republic 1.00% 7/9/2029 | 5,233 | 3,009 | ||
Argentine Republic 0.75% 7/9/2030 (1.75% on 7/9/2027)2 | 40,175 | 22,719 | ||
Argentine Republic 3.625% 7/9/2035 (4.125% on 7/9/2024)2 | 67,216 | 28,317 | ||
Brazil (Federative Republic of) 4.75% 1/14/2050 | 12,300 | 8,851 | ||
Chile (Republic of) 3.10% 5/7/2041 | 10,835 | 7,954 | ||
Colombia (Republic of) 4.50% 3/15/2029 | 300 | 274 | ||
Colombia (Republic of) 3.00% 1/30/2030 | 5,111 | 4,192 | ||
Colombia (Republic of) 3.25% 4/22/2032 | 10,720 | 8,235 | ||
Colombia (Republic of) 8.00% 4/20/2033 | 16,970 | 17,601 | ||
Colombia (Republic of) 7.50% 2/2/2034 | 10,925 | 10,961 | ||
Colombia (Republic of) 8.00% 11/14/2035 | 10,805 | 11,135 | ||
Colombia (Republic of) 7.375% 9/18/2037 | 300 | 292 | ||
Colombia (Republic of) 5.625% 2/26/2044 | 902 | 694 | ||
Colombia (Republic of) 5.00% 6/15/2045 | 11,144 | 7,861 | ||
Colombia (Republic of) 5.20% 5/15/2049 | 200 | 141 | ||
Colombia (Republic of) 4.125% 5/15/2051 | 400 | 241 | ||
Costa Rica (Republic of) 6.125% 2/19/2031 | 4,228 | 4,260 | ||
Costa Rica (Republic of) 6.125% 2/19/20311 | 1,700 | 1,713 | ||
Costa Rica (Republic of) 7.00% 4/4/2044 | 1,200 | 1,233 | ||
Dominican Republic 5.50% 1/27/2025 | 1,400 | 1,400 | ||
Dominican Republic 6.875% 1/29/2026 | 1,000 | 1,012 | ||
Dominican Republic 5.95% 1/25/2027 | 1,650 | 1,639 | ||
Dominican Republic 5.50% 2/22/2029 | 2,757 | 2,670 | ||
Dominican Republic 4.50% 1/30/2030 | 8,243 | 7,512 | ||
Dominican Republic 4.50% 1/30/20301 | 5,789 | 5,275 | ||
Dominican Republic 7.05% 2/3/20311 | 1,850 | 1,905 | ||
Dominican Republic 6.00% 2/22/2033 | 5,120 | 4,967 | ||
Dominican Republic 6.00% 2/22/20331 | 1,285 | 1,247 | ||
Dominican Republic 5.30% 1/21/2041 | 1,276 | 1,086 | ||
Dominican Republic 5.30% 1/21/20411 | 412 | 351 | ||
Dominican Republic 5.875% 1/30/2060 | 21,900 | 18,635 |
American Funds Multi-Sector Income Fund | 28 |
Bonds, notes & other debt instruments (continued) | Principal amount (000) | Value (000) | ||
Bonds & notes of governments & government agencies outside the U.S. (continued) | ||||
Dominican Republic 5.875% 1/30/20601 | USD1,700 | $1,447 | ||
Egypt (Arab Republic of) 5.80% 9/30/2027 | 2,920 | 2,635 | ||
Egypt (Arab Republic of) 7.60% 3/1/2029 | 1,075 | 977 | ||
Egypt (Arab Republic of) 5.875% 2/16/2031 | 14,025 | 10,917 | ||
Egypt (Arab Republic of) 5.875% 2/16/20311 | 4,380 | 3,409 | ||
Egypt (Arab Republic of) 7.625% 5/29/20321 | 2,100 | 1,718 | ||
Egypt (Arab Republic of) 7.625% 5/29/2032 | 1,500 | 1,227 | ||
Egypt (Arab Republic of) 8.50% 1/31/2047 | 1,805 | 1,342 | ||
Egypt (Arab Republic of) 7.903% 2/21/2048 | 940 | 663 | ||
Egypt (Arab Republic of) 8.70% 3/1/2049 | 2,810 | 2,119 | ||
Egypt (Arab Republic of) 8.75% 9/30/2051 | 7,500 | 5,666 | ||
Egypt (Arab Republic of) 8.15% 11/20/2059 | 13,605 | 9,724 | ||
Egypt (Arab Republic of) 7.50% 2/16/2061 | 24,820 | 16,695 | ||
Ethiopia (Federal Democratic Republic of) 6.625% 12/11/20245 | 4,900 | 3,552 | ||
Export-Import Bank of India 3.25% 1/15/2030 | 14,100 | 12,719 | ||
Gabonese Republic 6.95% 6/16/2025 | 7,400 | 6,801 | ||
Gabonese Republic 7.00% 11/24/20311 | 6,000 | 4,530 | ||
Gabonese Republic 7.00% 11/24/2031 | 2,200 | 1,661 | ||
Georgia (Republic of) 2.75% 4/22/20261 | 2,880 | 2,648 | ||
Georgia (Republic of) 2.75% 4/22/2026 | 2,667 | 2,453 | ||
Ghana (Republic of) 7.75% 4/7/20291,5 | 3,600 | 1,844 | ||
Ghana (Republic of) 8.125% 3/26/20325 | 15,400 | 7,942 | ||
Ghana (Republic of) 8.125% 3/26/20321,5 | 1,500 | 774 | ||
Honduras (Republic of) 6.25% 1/19/2027 | 17,060 | 16,227 | ||
Honduras (Republic of) 5.625% 6/24/2030 | 24,048 | 20,561 | ||
Honduras (Republic of) 5.625% 6/24/20301 | 6,175 | 5,280 | ||
Hungary (Republic of) 6.25% 9/22/20321 | 4,500 | 4,648 | ||
Indonesia (Republic of) 6.625% 2/17/2037 | 20,300 | 22,686 | ||
Indonesia (Republic of) 4.625% 4/15/2043 | 5,800 | 5,282 | ||
Indonesia (Republic of) 6.75% 1/15/2044 | 575 | 660 | ||
Indonesia (Republic of) 5.125% 1/15/2045 | 1,515 | 1,476 | ||
Jordan (Hashemite Kingdom of) 5.75% 1/31/20271 | 10,100 | 9,625 | ||
Jordan (Hashemite Kingdom of) 5.85% 7/7/20301 | 2,100 | 1,885 | ||
Kazakhstan (Republic of) 4.875% 10/14/2044 | 3,200 | 3,108 | ||
Kenya (Republic of) 7.25% 2/28/2028 | 13,400 | 12,203 | ||
Kenya (Republic of) 8.00% 5/22/2032 | 2,000 | 1,742 | ||
Kenya (Republic of) 8.25% 2/28/2048 | 200 | 156 | ||
MFB Magyar Fejlesztesi Bank Zartkoruen Mukodo Reszvenytarsasag 6.50% 6/29/2028 | 9,000 | 9,167 | ||
MIC Capital Management (RSC) Seven, Ltd. 5.084% 5/22/20531 | 1,070 | 1,012 | ||
Mongolia (State of) 7.875% 6/5/2029 | 6,662 | 6,821 | ||
Mongolia (State of) 4.45% 7/7/2031 | 3,290 | 2,778 | ||
Morocco (Kingdom of) 5.95% 3/8/2028 | 6,100 | 6,122 | ||
Mozambique (Republic of) 9.00% 9/15/2031 | 21,360 | 17,735 | ||
Nigeria (Republic of) 7.875% 2/16/2032 | 42,940 | 37,185 | ||
Nigeria (Republic of) 8.25% 9/28/20511 | 15,000 | 11,525 | ||
Oman (Sultanate of) 6.75% 10/28/2027 | 7,350 | 7,598 | ||
Oman (Sultanate of) 5.625% 1/17/2028 | 11,100 | 11,104 | ||
Pakistan (Islamic Republic of) 6.875% 12/5/2027 | 1,650 | 1,430 | ||
Panama (Republic of) 7.125% 1/29/2026 | 200 | 203 | ||
Panama (Republic of) 3.16% 1/23/2030 | 400 | 338 | ||
Panama (Republic of) 7.50% 3/1/2031 | 4,410 | 4,620 | ||
Panama (Republic of) 2.252% 9/29/2032 | 16,300 | 11,749 | ||
Panama (Republic of) 6.875% 1/31/2036 | 22,190 | 21,724 | ||
Panama (Republic of) 8.00% 3/1/2038 | 6,580 | 6,945 | ||
Panama (Republic of) 4.50% 4/16/2050 | 17,000 | 11,470 | ||
Panama (Republic of) 4.30% 4/29/2053 | 2,800 | 1,803 | ||
Panama (Republic of) 6.853% 3/28/2054 | 9,000 | 8,262 | ||
Panama (Republic of) 4.50% 4/1/2056 | 10,000 | 6,497 | ||
Panama (Republic of) 7.875% 3/1/2057 | 1,800 | 1,878 | ||
Panama (Republic of) 3.87% 7/23/2060 | 12,550 | 7,187 | ||
Panama (Republic of) 4.50% 1/19/2063 | 14,545 | 9,333 | ||
Paraguay (Republic of) 4.95% 4/28/2031 | 8,000 | 7,668 | ||
Paraguay (Republic of) 2.739% 1/29/2033 | 7,000 | 5,667 | ||
Paraguay (Republic of) 6.00% 2/9/20361 | 3,874 | 3,903 | ||
Peru (Republic of) 2.783% 1/23/2031 | 1,200 | 1,033 | ||
Peru (Republic of) 3.00% 1/15/2034 | 17,390 | 14,143 | ||
Peru (Republic of) 6.55% 3/14/2037 | 9,500 | 10,174 |
29 | American Funds Multi-Sector Income Fund |
Bonds, notes & other debt instruments (continued) | Principal amount (000) | Value (000) | ||
Bonds & notes of governments & government agencies outside the U.S. (continued) | ||||
Peru (Republic of) 3.55% 3/10/2051 | USD1,200 | $849 | ||
Peru (Republic of) 2.78% 12/1/2060 | 18,649 | 10,491 | ||
Peru (Republic of) 3.23% 7/28/2121 | 1,400 | 798 | ||
PETRONAS Capital, Ltd. 3.50% 4/21/2030 | 9,700 | 8,915 | ||
PETRONAS Capital, Ltd. 3.50% 4/21/20301 | 1,300 | 1,195 | ||
PETRONAS Capital, Ltd. 4.55% 4/21/20501 | 800 | 694 | ||
Philippines (Republic of) 3.00% 2/1/2028 | 8,300 | 7,737 | ||
Philippines (Republic of) 1.648% 6/10/2031 | 1,200 | 955 | ||
Philippines (Republic of) 3.95% 1/20/2040 | 9,200 | 7,829 | ||
Philippines (Republic of) 3.70% 2/2/2042 | 2,500 | 2,026 | ||
Philippines (Republic of) 3.20% 7/6/2046 | 4,800 | 3,445 | ||
Philippines (Republic of) 4.20% 3/29/2047 | 4,000 | 3,345 | ||
Poland (Republic of) 4.875% 10/4/2033 | 12,905 | 12,606 | ||
Qatar (State of) 3.75% 4/16/20301 | 17,100 | 16,292 | ||
Qatar (State of) 4.625% 6/2/2046 | 1,500 | 1,376 | ||
Qatar (State of) 5.103% 4/23/2048 | 1,600 | 1,560 | ||
Qatar (State of) 4.817% 3/14/2049 | 13,600 | 12,738 | ||
Qatar (State of) 4.40% 4/16/20501 | 7,600 | 6,660 | ||
Republika Srpska 4.75% 4/27/2026 | EUR835 | 860 | ||
Romania 5.375% 3/22/2031 | 18,105 | 19,276 | ||
Romania 2.00% 1/28/2032 | 7,500 | 6,286 | ||
Romania 2.00% 1/28/2032 | 3,300 | 2,766 | ||
Romania 2.00% 4/14/2033 | 2,720 | 2,190 | ||
Romania 6.375% 1/30/20341 | USD12,694 | 12,844 | ||
Romania 3.50% 4/3/2034 | EUR30 | 27 | ||
Romania 5.125% 6/15/2048 | USD2,900 | 2,421 | ||
Romania 5.125% 6/15/20481 | 300 | 250 | ||
Saudi Arabia (Kingdom of) 5.00% 1/16/2034 | 10,800 | 10,617 | ||
Saudi Arabia (Kingdom of) 5.00% 1/18/20531 | 14,700 | 12,971 | ||
Saudi Arabia (Kingdom of) 5.75% 1/16/2054 | 33,600 | 32,827 | ||
Senegal (Republic of) 4.75% 3/13/2028 | EUR4,500 | 4,463 | ||
Senegal (Republic of) 4.75% 3/13/2028 | 1,500 | 1,488 | ||
Senegal (Republic of) 5.375% 6/8/2037 | 680 | 532 | ||
Senegal (Republic of) 6.75% 3/13/2048 | USD34,700 | 25,136 | ||
South Africa (Republic of) 4.30% 10/12/2028 | 10,910 | 10,023 | ||
South Africa (Republic of) 5.875% 4/20/2032 | 10,600 | 9,852 | ||
South Africa (Republic of) 6.25% 3/8/2041 | 4,805 | 4,110 | ||
South Africa (Republic of) 5.00% 10/12/2046 | 7,500 | 5,302 | ||
South Africa (Republic of) 5.65% 9/27/2047 | 10,625 | 8,047 | ||
South Africa (Republic of) 6.30% 6/22/2048 | 12,200 | 9,959 | ||
South Africa (Republic of) 5.75% 9/30/2049 | 8,740 | 6,614 | ||
Sri Lanka (Democratic Socialist Republic of) 7.55% 3/28/20305 | 14,029 | 8,148 | ||
Turkey (Republic of) 7.625% 4/26/2029 | 2,450 | 2,505 | ||
Turkey (Republic of) 5.875% 6/26/2031 | 30,250 | 27,892 | ||
Turkey (Republic of) 6.50% 9/20/2033 | 2,000 | 1,883 | ||
Turkey (Republic of) 6.00% 1/14/2041 | 16,200 | 13,486 | ||
Turkey (Republic of) 4.875% 4/16/2043 | 16,700 | 11,853 | ||
Ukraine 7.75% 9/1/20295 | 200 | 62 | ||
United Mexican States 3.75% 1/11/2028 | 200 | 190 | ||
United Mexican States 4.50% 4/22/2029 | 18,100 | 17,365 | ||
United Mexican States 2.659% 5/24/2031 | 649 | 534 | ||
United Mexican States 4.75% 4/27/2032 | 18,520 | 17,138 | ||
United Mexican States 6.00% 5/7/2036 | 9,710 | 9,478 | ||
United Mexican States 6.05% 1/11/2040 | 13,600 | 13,177 | ||
United Mexican States 4.75% 3/8/2044 | 200 | 161 | ||
United Mexican States 5.00% 4/27/2051 | 1,200 | 964 | ||
United Mexican States 6.338% 5/4/2053 | 8,095 | 7,653 | ||
United Mexican States 6.40% 5/7/2054 | 5,000 | 4,773 | ||
United Mexican States 3.75% 4/19/2071 | 4,770 | 2,878 | ||
1,165,005 |
American Funds Multi-Sector Income Fund | 30 |
Bonds, notes & other debt instruments (continued) | Principal amount (000) | Value (000) | ||
Asset-backed obligations 5.90% | ||||
AB BSL CLO 2, Ltd., Series 2021-2, Class D, (3-month USD CME Term SOFR + 3.612%) 8.94% 4/15/20341,4,10 | USD2,500 | $2,520 | ||
Affirm, Inc., Series 2023-B, Class D, 8.78% 9/15/20281,10 | 2,055 | 2,098 | ||
Affirm, Inc., Series 2023-B, Class E, 11.32% 9/15/20281,10 | 2,553 | 2,639 | ||
American Credit Acceptance Receivables Trust, Series 2022-1, Class D, 2.46% 3/13/20281,10 | 2,000 | 1,963 | ||
American Credit Acceptance Receivables Trust, Series 2022-3, Class D, 5.83% 10/13/20281,10 | 1,663 | 1,659 | ||
American Credit Acceptance Receivables Trust, Series 2023-2, Class D, 6.47% 8/13/20291,10 | 14,180 | 14,240 | ||
ARES CLO, Ltd., Series 2013-2, Class DR2, (3-month USD CME Term SOFR + 3.511%) 8.836% 10/28/20341,4,10 | 3,000 | 3,005 | ||
Avis Budget Rental Car Funding (AESOP), LLC, Series 2020-1A, Class D, 3.34% 8/20/20261,10 | 10,000 | 9,608 | ||
Avis Budget Rental Car Funding (AESOP), LLC, Series 2020-2A, Class B, 2.96% 2/20/20271,10 | 100 | 96 | ||
Avis Budget Rental Car Funding (AESOP), LLC, Series 2021-1A, Class B, 1.63% 8/20/20271,10 | 1,062 | 980 | ||
Avis Budget Rental Car Funding (AESOP), LLC, Series 2021-1A, Class C, 2.13% 8/20/20271,10 | 551 | 508 | ||
Avis Budget Rental Car Funding (AESOP), LLC, Series 2021-1A, Class D, 3.71% 8/20/20271,10 | 8,000 | 7,266 | ||
Avis Budget Rental Car Funding (AESOP), LLC, Series 2023-3A, Class B, 6.12% 2/22/20281,10 | 3,841 | 3,864 | ||
Avis Budget Rental Car Funding (AESOP), LLC, Series 2023-3A, Class C, 7.05% 2/22/20281,10 | 9,363 | 9,503 | ||
Babson CLO, Ltd., Series 2021-1, Class D, (3-month USD CME Term SOFR + 3.162%) 8.485% 4/25/20341,4,10 | 4,500 | 4,447 | ||
Bankers Healthcare Group Securitization Trust, Series 2020-A, Class B, 3.59% 9/17/20311,10 | 278 | 273 | ||
Bankers Healthcare Group Securitization Trust, Series 2020-A, Class C, 5.17% 9/17/20311,10 | 300 | 294 | ||
Bankers Healthcare Group Securitization Trust, Series 2021-A, Class B, 2.79% 11/17/20331,10 | 4,733 | 4,351 | ||
Bankers Healthcare Group Securitization Trust, Series 2021-A, Class C, 3.69% 11/17/20331,10 | 1,420 | 1,175 | ||
Blackbird Capital II Aircraft Lease, Ltd. / Blackbird Capital II Aircraft Lease US, LLC, Series 2021-1, Class A, 2.443% 7/15/20461,10 | 1,947 | 1,745 | ||
Blackbird Capital II Aircraft Lease, Ltd. / Blackbird Capital II Aircraft Lease US, LLC, Series 2021-1, Class B, 3.446% 7/15/20461,10 | 591 | 527 | ||
Bridgecrest Lending Auto Securitization Trust, Series 2024-1, Class C, 5.65% 4/16/202910 | 3,699 | 3,688 | ||
Bridgecrest Lending Auto Securitization Trust, Series 2024-1, Class D, 6.03% 11/15/202910 | 7,182 | 7,197 | ||
Carvana Auto Receivables Trust, Series 2021-N4, Class C, 1.72% 9/11/202810 | 148 | 139 | ||
Castlelake Aircraft Securitization Trust, Series 2021-1, Class A, 2.868% 5/11/20371,10 | 2,336 | 2,086 | ||
Castlelake Aircraft Securitization Trust, Series 2017-1R, Class A, 2.741% 8/15/20411,10 | 251 | 235 | ||
CF Hippolyta, LLC, Series 2020-1, Class A2, 1.99% 7/15/20601,10 | 310 | 270 | ||
CF Hippolyta, LLC, Series 2021-1, Class A1, 1.53% 3/15/20611,10 | 94 | 86 | ||
CF Hippolyta, LLC, Series 2022-1, Class A1, 5.97% 8/15/20621,10 | 14,456 | 14,253 | ||
CFG Investments, Ltd., Series 2023-1, Class A, 8.56% 7/25/20341,10 | 10,706 | 10,756 | ||
CLI Funding V, LLC, Series 2020-2A, Class B, 3.56% 9/15/20451,10 | 173 | 158 | ||
CLI Funding VI, LLC, Series 2020-1A, Class B, 3.62% 9/18/20451,10 | 224 | 205 | ||
CPS Auto Trust, Series 2024-C, Class E, 8.04% 3/15/20321,10 | 15,225 | 15,263 | ||
CPS Auto Receivables Trust, Series 2022-B, Class D, 5.19% 8/15/20281,10 | 6,000 | 5,921 | ||
CPS Auto Receivables Trust, Series 2024-A, Class C, 5.74% 4/15/20301,10 | 1,176 | 1,176 | ||
CPS Auto Receivables Trust, Series 2024-A, Class D, 6.13% 4/15/20301,10 | 589 | 592 | ||
CPS Auto Receivables Trust, Series 2022-C, Class D, 6.45% 4/15/20301,10 | 3,377 | 3,393 | ||
CPS Auto Receivables Trust, Series 2022-D, Class E, 12.12% 6/17/20301,10 | 8,000 | 8,815 | ||
CPS Auto Trust, Series 2024-A, Class E, 8.42% 8/15/20311,10 | 3,100 | 3,172 | ||
Credit Acceptance Auto Loan Trust, Series 2022-1A, Class C, 5.70% 10/15/20321,10 | 6,000 | 5,943 | ||
Credit Acceptance Auto Loan Trust, Series 2022-1A, Class D, 6.63% 12/15/20321,10 | 8,000 | 7,882 | ||
Credit Acceptance Auto Loan Trust, Series 2023-1, Class C, 7.71% 7/15/20331,10 | 10,000 | 10,311 | ||
Credit Acceptance Auto Loan Trust, Series 2023-3, Class B, 7.09% 10/17/20331,10 | 3,920 | 4,019 | ||
Credit Acceptance Auto Loan Trust, Series 2023-3, Class C, 7.62% 12/15/20331,10 | 4,519 | 4,671 | ||
Crossroads Asset Trust, Series 2024-A, Class A2, 5.90% 8/20/20301,10 | 1,449 | 1,453 | ||
DLLAD, LLC, Series 2024-1, Class A3, 5.30% 7/20/20291,10 | 2,454 | 2,466 |
31 | American Funds Multi-Sector Income Fund |
Bonds, notes & other debt instruments (continued) | Principal amount (000) | Value (000) | ||
Asset-backed obligations (continued) | ||||
DLLAD, LLC, Series 2024-1, Class A4, 5.38% 9/22/20311,10 | USD2,411 | $2,431 | ||
Drive Auto Receivables Trust, Series 2020-2, Class D, 3.05% 5/15/202810 | 84 | 84 | ||
DriveTime Auto Owner Trust, Series 2020-2A, Class D, 4.73% 3/16/20261,10 | 309 | 309 | ||
DriveTime Auto Owner Trust, Series 2021-1, Class C, 0.84% 10/15/20261,10 | 5 | 5 | ||
DriveTime Auto Owner Trust, Series 2021-1A, Class D, 1.16% 11/16/20261,10 | 100 | 98 | ||
DriveTime Auto Owner Trust, Series 2021-2A, Class C, 1.10% 2/16/20271,10 | 78 | 78 | ||
DriveTime Auto Owner Trust, Series 2021-2A, Class D, 1.50% 2/16/20271,10 | 277 | 270 | ||
DriveTime Auto Owner Trust, Series 2023-3, Class C, 6.40% 5/15/20291,10 | 9,464 | 9,540 | ||
DriveTime Auto Owner Trust, Series 2023-3, Class D, 7.12% 5/15/20291,10 | 9,784 | 10,020 | ||
EDvestinU Private Education Loan, LLC, Series 2021-A, Class A, 1.80% 11/25/20451,10 | 111 | 99 | ||
Exeter Automobile Receivables Trust, Series 2020-2, Class D, 4.73% 4/15/20261,10 | 10 | 10 | ||
Exeter Automobile Receivables Trust, Series 2022-2A, Class D, 4.56% 7/17/202810 | 106 | 104 | ||
Exeter Automobile Receivables Trust, Series 2023-1, Class E, 12.07% 9/16/20301,10 | 9,863 | 10,961 | ||
Exeter Automobile Receivables Trust, Series 2023-2, Class E, 9.75% 11/15/20301,10 | 4,243 | 4,471 | ||
Exeter Automobile Receivables Trust, Series 2023-3, Class E, 9.98% 1/15/20311,10 | 12,466 | 13,282 | ||
Exeter Automobile Receivables Trust, Series 2023-4, Class E, 9.57% 2/18/20311,10 | 18,459 | 19,276 | ||
Exeter Automobile Receivables Trust, Series 2023-5, Class E, 9.58% 6/16/20311,10 | 29,214 | 30,876 | ||
Exeter Automobile Receivables Trust, Series 2024-1, Class E, 7.89% 8/15/20311,10 | 10,258 | 10,339 | ||
Exeter Automobile Receivables Trust, Series 2024-3, Class E, 7.84% 10/15/20311,10 | 5,000 | 5,030 | ||
Exeter Automobile Receivables Trust, Series 2024-2A, Class E, 7.98% 10/15/20311,10 | 9,081 | 9,175 | ||
First Investors Auto Owner Trust, Series 2021-1A, Class D, 1.62% 3/15/20271,10 | 300 | 290 | ||
Fortress Credit BSL, Ltd., CLO, Series 2023-1, Class B1, (3-month USD CME Term SOFR + 3.00%) 8.326% 4/23/20361,4,10 | 13,282 | 13,450 | ||
GCI Funding I, LLC, Series 2020-1, Class B, 3.81% 10/18/20451,10 | 90 | 81 | ||
GCI Funding I, LLC, Series 2021-1, Class B, 3.04% 6/18/20461,10 | 2,197 | 1,830 | ||
Generate CLO, Ltd., Series 2023-12, Class D, (3-month USD CME Term SOFR + 5.25%) 10.575% 7/20/20361,4,10 | 2,000 | 2,055 | ||
Global SC Finance SRL, Series 2021-1A, Class B, 2.76% 4/17/20411,10 | 1,334 | 1,187 | ||
Global SC Finance V SRL, Series 2019-1A, Class B, 4.81% 9/17/20391,10 | 258 | 245 | ||
Global SC Finance V SRL, Series 2020-1A, Class B, 3.55% 10/17/20401,10 | 291 | 271 | ||
Global SC Finance VII SRL, Series 2021-2A, Class B, 2.49% 8/17/20411,10 | 551 | 488 | ||
GLS Auto Receivables Trust, Series 2023-3, Class C, 6.01% 5/15/20291,10 | 3,017 | 3,024 | ||
GLS Auto Receivables Trust, Series 2023-3, Class D, 6.44% 5/15/20291,10 | 2,728 | 2,753 | ||
GLS Auto Receivables Trust, Series 2023-3, Class E, 9.27% 8/15/20301,10 | 3,100 | 3,242 | ||
GLS Auto Receivables Trust, Series 2023-4, Class E, 9.72% 8/15/20301,10 | 6,660 | 7,084 | ||
GLS Auto Receivables Trust, Series 2024-1, Class E, 7.94% 10/15/20301,10 | 9,318 | 9,379 | ||
GLS Auto Receivables Trust, Series 2024-2, Class E, 7.98% 5/15/20311,10 | 2,400 | 2,426 | ||
GSAMP Trust, Series 2005-SD2, Class M3, (1-month USD CME Term SOFR + 1.464%) 6.81% 4/25/20351,4,10 | 269 | 266 | ||
Hertz Vehicle Financing III, LLC, Series 2021-A, Class B, 9.44% 6/25/20251,6,10 | 10,827 | 10,827 | ||
Hertz Vehicle Financing III, LLC, Series 2023-1, Class 1D, 9.13% 6/25/20271,10 | 2,688 | 2,684 | ||
Hertz Vehicle Financing III, LLC, Series 2021-2A, Class C, 2.52% 12/27/20271,10 | 826 | 750 | ||
Hertz Vehicle Financing III, LLC, Series 2023-3, Class B, 6.53% 2/25/20281,10 | 6,769 | 6,802 | ||
Hertz Vehicle Financing III, LLC, Series 2023-3, Class C, 7.26% 2/25/20281,10 | 10,000 | 10,085 | ||
Hertz Vehicle Financing III, LLC, Series 2022-2, Class D, 5.16% 6/26/20281,10 | 9,556 | 8,581 | ||
Hertz Vehicle Financing III, LLC, Series 2023-4, Class B, 6.73% 3/25/20301,10 | 7,762 | 7,941 | ||
Hertz Vehicle Financing III, LLC, Series 2023-4, Class C, 7.51% 3/25/20301,10 | 4,937 | 5,088 | ||
Hertz Vehicle Financing, LLC, Series 2021-1, Class D, 3.98% 12/26/20251,10 | 2,750 | 2,714 | ||
Hertz Vehicle Financing, LLC, Series 2021-2, Class D, 4.34% 12/27/20271,10 | 27,490 | 24,611 | ||
KKR Financial CLO, Ltd., Series 40, Class CR, (3-month USD CME Term SOFR + 2.20%) 7.543% 10/20/20341,4,10 | 3,000 | 3,009 | ||
LAD Auto Receivables Trust, Series 2021-1A, Class B, 1.94% 11/16/20261,10 | 751 | 742 | ||
LAD Auto Receivables Trust, Series 2023-1, Class C, 6.18% 12/15/20271,10 | 3,556 | 3,574 | ||
LAD Auto Receivables Trust, Series 2023-2, Class D, 6.30% 2/15/20311,10 | 958 | 958 | ||
Marble Point CLO, Ltd., Series 2020-1, Class D, (3-month USD CME Term SOFR + 4.012%) 9.336% 4/20/20331,4,10 | 3,829 | 3,753 | ||
Marble Point CLO, Ltd., Series 2019-2, Class D1R, (3-month USD CME Term SOFR + 3.662%) 8.988% 11/16/20341,4,10 | 2,000 | 1,986 | ||
Mission Lane Credit Card Master Trust, Series 2022-B, Class A1, 8.25% 1/15/20286,7,10 | 20,015 | 20,001 | ||
Mission Lane Credit Card Master Trust, Series 2022-B, Class A2, 8.73% 1/15/20286,7,10 | 3,200 | 3,197 | ||
Mission Lane Credit Card Master Trust, Series 2022-B, Class B, 10.42% 1/15/20286,7,10 | 13,940 | 14,057 | ||
Mission Lane Credit Card Master Trust, Series 2022-B, Class C, 12.09% 1/15/20286,7,10 | 10,745 | 10,831 | ||
Mission Lane Credit Card Master Trust, Series 2022-B, Class D, 14.45% 1/15/20286,7,10 | 5,000 | 5,040 | ||
Mission Lane Credit Card Master Trust, Series 2023-A, Class B, 8.15% 7/17/20281,10 | 5,122 | 5,161 | ||
Mission Lane Credit Card Master Trust, Series 2023-A, Class C, 10.03% 7/17/20281,10 | 17,200 | 17,469 |
American Funds Multi-Sector Income Fund | 32 |
Bonds, notes & other debt instruments (continued) | Principal amount (000) | Value (000) | ||
Asset-backed obligations (continued) | ||||
Mission Lane Credit Card Master Trust, Series 2023-A, Class E, 15.73% 7/17/20281,10 | USD6,240 | $6,270 | ||
Mission Lane Credit Card Master Trust, Series 2023-B, Class D, 11.97% 11/15/20281,10 | 16,499 | 16,585 | ||
Mission Lane Credit Card Master Trust, Series 2023-B, Class E, 15.56% 11/15/20281,10 | 15,142 | 15,184 | ||
Mission Lane Credit Card Master Trust, Series 2024-A, Class B, 6.59% 8/15/20291,10 | 1,597 | 1,596 | ||
Mission Lane Credit Card Master Trust, Series 2024-A, Class D, 10.12% 8/15/20291,10 | 5,435 | 5,436 | ||
Mission Lane Credit Card Master Trust, Series 2024-A, Class E, 13.69% 8/15/20291,10 | 5,700 | 5,696 | ||
Navigator Aircraft ABS, Ltd., Series 2021-1, Class A, 2.771% 11/15/20461,10 | 3,359 | 3,025 | ||
Navigator Aircraft ABS, Ltd., Series 2021-1, Class B, 3.571% 11/15/20461,10 | 764 | 687 | ||
Nelnet Student Loan Trust, Series 2021-CA, Class D, 4.44% 4/20/20621,10 | 1,889 | 1,525 | ||
New Economy Assets Phase 1 Issuer, LLC, Series 2021-1, Class A1, 1.91% 10/20/20611,10 | 4,050 | 3,613 | ||
OnDeck Asset Securitization Trust, LLC, Series 2023-1A, Class B, 8.25% 8/19/20301,10 | 15,283 | 15,682 | ||
OnDeck Asset Securitization Trust, LLC, Series 2024-1, Class B, 7.15% 6/17/20311,10 | 908 | 916 | ||
OnDeck Asset Securitization Trust, LLC, Series 2024-1, Class C, 8.99% 6/17/20311,10 | 1,578 | 1,605 | ||
Oportun Funding, LLC, Series 2021-B, Class C, 3.65% 5/8/20311,10 | 2,365 | 2,269 | ||
Oportun Funding, LLC, Series 2021-B, Class D, 5.41% 5/8/20311,10 | 937 | 869 | ||
Orion CLO, Ltd., Series 2023-1, Class C, (3-month USD CME Term SOFR + 3.25%) 8.574% 10/25/20361,4,10 | 5,133 | 5,149 | ||
Orion CLO, Ltd., Series 2023-1, Class D, (3-month USD CME Term SOFR + 5.15%) 10.474% 10/25/20361,4,10 | 4,162 | 4,275 | ||
Palmer Square Loan Funding, CLO, Series 2023-1, Class C, (3-month USD CME Term SOFR + 4.75%) 10.075% 7/20/20311,4,10 | 9,728 | 9,740 | ||
Prestige Auto Receivables Trust, Series 2023-1, Class D, 6.33% 4/16/20291,10 | 5,191 | 5,181 | ||
Prestige Auto Receivables Trust, Series 2023-2, Class E, 9.90% 11/15/20301,10 | 10,170 | 10,557 | ||
Prestige Auto Receivables Trust, Series 2024-1, Class E, 7.94% 4/15/20311,10 | 2,050 | 2,050 | ||
Rad CLO, Ltd., Series 2020-7, Class CR, (3-month USD CME Term SOFR + 2.60%) 7.917% 4/17/20361,4,10 | 13,000 | 13,030 | ||
Rad CLO, Ltd., Series 2023-20, Class D, (3-month USD CME Term SOFR + 5.00%) 10.327% 7/20/20361,4,10 | 10,880 | 11,156 | ||
Research-Driven Pagaya Motor Asset Trust I, Series 2022-3, Class A, 5.38% 11/25/20301,10 | 4,670 | 4,646 | ||
Research-Driven Pagaya Motor Asset Trust I, Series 2022-3, Class B, 6.58% 11/25/20301,10 | 13,829 | 13,686 | ||
Santander Drive Auto Receivables Trust, Series 2022-5, Class B, 4.43% 3/15/202710 | 2,589 | 2,574 | ||
Santander Drive Auto Receivables Trust, Series 2022-7, Class B, 5.95% 1/17/202810 | 1,100 | 1,102 | ||
Santander Drive Auto Receivables Trust, Series 2022-5, Class C, 4.74% 10/15/202810 | 2,418 | 2,392 | ||
SMB Private Education Loan Trust, Series 2023-C, Class A1A, 5.67% 11/15/20521,10 | 7,030 | 7,104 | ||
SMB Private Education Loan Trust, Series 2021-A, Class APT2, 1.07% 1/15/20531,10 | 260 | 230 | ||
SMB Private Education Loan Trust, Series 2021-A, Class D2, 3.86% 1/15/20531,10 | 5,111 | 4,409 | ||
SMB Private Education Loan Trust, Series 2021-A, Class D1, 3.86% 1/15/20531,10 | 4,078 | 3,518 | ||
SMB Private Education Loan Trust, Series 2023-D, Class D, 8.87% 9/15/20531,10 | 10,954 | 11,570 | ||
SMB Private Education Loan Trust, Series 2022-A, Class D, 4.75% 11/16/20541,10 | 1,925 | 1,809 | ||
SMB Private Education Loan Trust, Series 2022-B, Class D, 5.95% 2/16/20551,10 | 12,650 | 12,082 | ||
SMB Private Education Loan Trust, Series 2024-A, Class D, 8.22% 3/15/20561,10 | 30,596 | 31,373 | ||
SMB Private Education Loan Trust, Series 2023-B, Class D, 7.56% 10/16/20561,10 | 21,000 | 20,978 | ||
SMB Private Education Loan Trust, Series 2022-D, Class D, 7.23% 10/15/20581,10 | 12,789 | 12,722 | ||
SOLRR Aircraft Aviation Holding, Ltd., Series 2021-1, Class A, 2.636% 10/15/20461,10 | 2,456 | 2,199 | ||
SPRITE, Ltd., Series 2021-1, Class A, 3.75% 11/15/20461,10 | 1,263 | 1,184 | ||
Stellar Jay Ireland DAC, Series 2021-1, Class A, 3.967% 10/15/20411,10 | 1,349 | 1,246 | ||
Stonepeak Infrastructure Partners, Series 2021-1A, Class AA, 2.301% 2/28/20331,10 | 882 | 819 | ||
Stonepeak Infrastructure Partners, Series 2021-1A, Class B, 3.821% 2/28/20331,10 | 846 | 767 | ||
SuttonPark Structured Settlements, Series 2021-1, Class A, 1.95% 9/15/20751,10 | 2,006 | 1,895 | ||
TAL Advantage V, LLC, Series 2020-1, Class B, 3.29% 9/20/20451,10 | 2,061 | 1,899 | ||
Textainer Marine Containers, Ltd., Series 2020-2A, Class B, 3.34% 9/20/20451,10 | 309 | 284 | ||
Textainer Marine Containers, Ltd., Series 2021-1, Class B, 2.52% 2/20/20461,10 | 270 | 238 | ||
TIF Funding II, LLC, Series 2020-1A, Class B, 3.82% 8/20/20451,10 | 978 | 903 | ||
TIF Funding II, LLC, Series 2021-1A, Class B, 2.54% 2/20/20461,10 | 1,602 | 1,394 | ||
Triton Container Finance VIII, LLC, Series 2020-1, Class B, 3.74% 9/20/20451,10 | 300 | 274 | ||
Triton Container Finance VIII, LLC, Series 2021-1A, Class B, 2.58% 3/20/20461,10 | 2,631 | 2,300 | ||
United Auto Credit Securitization Trust, Series 2024-1, Class D, 8.30% 11/12/20291,10 | 11,000 | 11,114 | ||
Vibrant CLO, Ltd., Series 2021-12, Class BR, (3-month USD CME Term SOFR + 2.50%) 7.786% 4/20/20341,4,10 | 6,268 | 6,278 | ||
Vibrant CLO, Ltd., Series 2021-12, Class C1R, (3-month USD CME Term SOFR + 3.75%) 9.236% 4/20/20341,4,10 | 6,641 | 6,661 |
33 | American Funds Multi-Sector Income Fund |
Bonds, notes & other debt instruments (continued) | Principal amount (000) | Value (000) | ||
Asset-backed obligations (continued) | ||||
Westlake Automobile Receivables Trust, Series 2023-3, Class C, 6.02% 9/15/20281,10 | USD11,932 | $11,972 | ||
Westlake Automobile Receivables Trust, Series 2023-2, Class D, 7.01% 11/15/20281,10 | 17,928 | 18,187 | ||
Westlake Automobile Receivables Trust, Series 2023-3, Class D, 6.47% 3/15/20291,10 | 6,642 | 6,696 | ||
879,902 | ||||
U.S. Treasury bonds & notes 1.87% | ||||
U.S. Treasury 1.87% | ||||
U.S. Treasury 4.625% 6/30/2025 | 756 | 752 | ||
U.S. Treasury 4.625% 6/30/2026 | 15,569 | 15,539 | ||
U.S. Treasury 4.375% 8/15/2026 | 2,412 | 2,396 | ||
U.S. Treasury 4.625% 11/15/2026 | 534 | 534 | ||
U.S. Treasury 4.625% 6/15/2027 | 19,798 | 19,853 | ||
U.S. Treasury 3.625% 3/31/2028 | 15 | 14 | ||
U.S. Treasury 4.00% 1/31/2029 | 10,432 | 10,270 | ||
U.S. Treasury 4.25% 2/28/2029 | 1,466 | 1,459 | ||
U.S. Treasury 4.50% 5/31/2029 | 2,166 | 2,181 | ||
U.S. Treasury 4.25% 6/30/2029 | 74,600 | 74,262 | ||
U.S. Treasury 4.625% 5/31/2031 | 2,165 | 2,200 | ||
U.S. Treasury 4.125% 11/15/2032 | 2 | 2 | ||
U.S. Treasury 4.00% 2/15/2034 | 1,290 | 1,252 | ||
U.S. Treasury 4.375% 5/15/2034 | 42,763 | 42,780 | ||
U.S. Treasury 4.25% 5/15/2039 | 1,333 | 1,303 | ||
U.S. Treasury 4.625% 5/15/204411 | 53,632 | 53,530 | ||
U.S. Treasury 4.00% 11/15/2052 | 2,477 | 2,257 | ||
U.S. Treasury 4.75% 11/15/2053 | 1,898 | 1,963 | ||
U.S. Treasury 4.25% 2/15/205411 | 48,201 | 45,918 | ||
Total U.S. Treasury bonds & notes | 278,465 | |||
Municipals 0.45% | ||||
California 0.07% | ||||
Golden State Tobacco Securitization Corp., Enhanced Tobacco Settlement Asset-Backed Bonds, Series 2021-A-1, 3.487% 6/1/2036 | 1,490 | 1,215 | ||
Golden State Tobacco Securitization Corp., Enhanced Tobacco Settlement Asset-Backed Bonds, Series 2021-A-1, 3.714% 6/1/2041 | 2,235 | 1,712 | ||
City of Rancho Mirage, Community Facs. Dist. No. 5 (Improvement Area No. 1), Special Tax Bonds, Series 2024-B, 7.25% 9/1/2039 | 6,975 | 6,979 | ||
9,906 | ||||
Florida 0.00% | ||||
County of Broward, Airport System Rev. Ref. Bonds, Series 2019-C, 3.477% 10/1/2043 | 75 | 62 | ||
Illinois 0.03% | ||||
City of Chicago, Board of Education, Unlimited Tax G.O. Rev. Ref. Bonds (Dedicated Rev.), Series 2018-A, 5.00% 12/1/2034 | 150 | 155 | ||
City of Chicago, Board of Education, Unlimited Tax G.O. Rev. Ref. Bonds (Dedicated Rev.), Series 2022-A, 4.00% 12/1/2047 | 4,020 | 3,535 | ||
G.O. Bonds, Pension Funding, Series 2003, 5.10% 6/1/2033 | 85 | 83 | ||
Metropolitan Pier and Exposition Auth., McCormick Place Expansion Project Rev. Ref. Bonds, Capital Appreciation Bonds, Series 2017-A, Assured Guaranty Municipal insured, 0% 12/15/2056 | 1,810 | 372 | ||
4,145 | ||||
Kansas 0.00% | ||||
City of Manhattan, Health Care Facs. Rev. Bonds (Meadowlark Hills), Series 2021-B, 2.44% 6/1/2025 | 395 | 384 | ||
Ohio 0.04% | ||||
Cleveland-Cuyahoga Port Auth., Federal Lease Rev. Bonds (VA Cleveland Health Care Center Project), Series 2021, 4.425% 5/1/2031 | 6,255 | 5,492 | ||
Puerto Rico 0.22% | ||||
Electric Power Auth., Power Rev. Bonds, Series 2007-TT, 5.00% 7/1/20175 | 60 | 30 | ||
Electric Power Auth., Power Rev. Bonds, Series 2010-ZZ, 4.25% 7/1/20185 | 145 | 73 | ||
Electric Power Auth., Power Rev. Bonds, Series 2010-ZZ, 5.00% 7/1/20185 | 700 | 351 |
American Funds Multi-Sector Income Fund | 34 |
Bonds, notes & other debt instruments (continued) | Principal amount (000) | Value (000) | ||
Municipals (continued) | ||||
Puerto Rico (continued) | ||||
Electric Power Auth., Power Rev. Bonds, Series 2003-NN, 5.50% 7/1/20205 | USD90 | $45 | ||
Electric Power Auth., Power Rev. Bonds, Series 2007-TT, 5.00% 7/1/20215 | 1,415 | 709 | ||
Electric Power Auth., Power Rev. Bonds, Series 2010-AAA, 5.25% 7/1/20215 | 2,000 | 1,003 | ||
Electric Power Auth., Power Rev. Bonds, Series 2007-TT, 5.00% 7/1/20235 | 140 | 70 | ||
Electric Power Auth., Power Rev. Bonds, Series 2010-DDD, 5.00% 7/1/20235 | 1,595 | 799 | ||
Electric Power Auth., Power Rev. Bonds, Series 2010-CCC, 5.00% 7/1/20245 | 550 | 276 | ||
Electric Power Auth., Power Rev. Bonds, Series 2010-XX, 4.625% 7/1/20255 | 65 | 33 | ||
Electric Power Auth., Power Rev. Bonds, Series 2010-XX, 4.75% 7/1/20265 | 80 | 40 | ||
Electric Power Auth., Power Rev. Bonds, Series 2010-ZZ, 5.00% 7/1/20265 | 45 | 23 | ||
Electric Power Auth., Power Rev. Bonds, Series 2010-CCC, 5.25% 7/1/2026 | 155 | 78 | ||
Electric Power Auth., Power Rev. Bonds, Series 2010-ZZ, 5.25% 7/1/20265 | 2,975 | 1,499 | ||
Electric Power Auth., Power Rev. Bonds, Series 2010-ZZ, 4.75% 7/1/20275 | 485 | 244 | ||
Electric Power Auth., Power Rev. Bonds, Series 2010-CCC, 4.80% 7/1/20285 | 1,680 | 846 | ||
Electric Power Auth., Power Rev. Bonds, Series 2008-WW, 5.00% 7/1/20285 | 460 | 232 | ||
Electric Power Auth., Power Rev. Bonds, Series 2007-TT, 5.00% 7/1/20325 | 1,240 | 625 | ||
Electric Power Auth., Power Rev. Bonds, Series 2008-WW, 5.25% 7/1/20335 | 4,560 | 2,297 | ||
Electric Power Auth., Power Rev. Bonds, Series 2013-A, 6.75% 7/1/20365 | 455 | 229 | ||
Electric Power Auth., Power Rev. Bonds, Series 2007-TT, 5.00% 7/1/20375 | 415 | 209 | ||
Electric Power Auth., Power Rev. Bonds, Series 2010-XX, 5.25% 7/1/20405 | 2,595 | 1,307 | ||
Electric Power Auth., Power Rev. Bonds, Series 2012-A, 5.00% 7/1/20425 | 1,700 | 856 | ||
Electric Power Auth., Power Rev. Ref. Bonds, Series 2007-UU, Assured Guaranty Municipal insured, 3.469% 7/1/20172,5 | 2,315 | 1,160 | ||
Electric Power Auth., Power Rev. Ref. Bonds, Series 2010-DDD, 3.625% 7/1/20215 | 20 | 10 | ||
Electric Power Auth., Power Rev. Ref. Bonds, Series 2010-DDD, 5.00% 7/1/20215 | 520 | 261 | ||
Electric Power Auth., Power Rev. Ref. Bonds, Series 2010-DDD, 5.00% 7/1/20225 | 4,865 | 2,439 | ||
Electric Power Auth., Power Rev. Ref. Bonds, Series 2008-WW, 5.50% 7/1/20385 | 1,000 | 504 | ||
G.O. Restructured Bonds, Series 2022-A-1, 5.375% 7/1/2025 | 977 | 986 | ||
G.O. Restructured Bonds, Series 2022-A-1, 5.625% 7/1/2027 | 968 | 1,011 | ||
G.O. Restructured Bonds, Series 2022-A-1, 5.625% 7/1/2029 | 953 | 1,023 | ||
G.O. Restructured Bonds, Series 2022-A-1, 5.75% 7/1/2031 | 925 | 1,029 | ||
G.O. Restructured Bonds, Series 2022-A-1, 4.00% 7/1/2033 | 877 | 881 | ||
G.O. Restructured Bonds, Series 2022-A-1, 4.00% 7/1/2035 | 789 | 776 | ||
G.O. Restructured Bonds, Series 2022-A-1, 4.00% 7/1/2037 | 677 | 653 | ||
G.O. Restructured Bonds, Series 2022-A-1, 4.00% 7/1/2041 | 920 | 861 | ||
G.O. Restructured Bonds, Series 2022-A-1, 4.00% 7/1/2046 | 957 | 869 | ||
G.O. Restructured Bonds, Capital Appreciation Bonds, Series 2022-A-1, 0% 7/1/2024 | 143 | 143 | ||
G.O. Restructured Bonds, Capital Appreciation Bonds, Series 2022-A-1, 0% 7/1/2033 | 1,129 | 755 | ||
G.O. Taxable Bonds, Series 2022, 0% 11/1/20434 | 3,878 | 2,380 | ||
Sales Tax Fncg. Corp., Sales Tax Rev. Restructured Bonds, Capital Appreciation Bonds, Series 2018-A-1, 0% 7/1/2046 | 14,745 | 4,768 | ||
32,383 | ||||
Texas 0.08% | ||||
Brazoria County Industrial Dev. Corp., Solid Waste Disposal Facs. Rev. Bonds (Aleon Renewable Metals, LLC Project), Series 2023, AMT, 12.00% 6/1/20431 | 12,500 | 12,654 | ||
Washington 0.01% | ||||
Econ. Dev. Fin. Auth., Environmental Facs. Rev. Bonds (North Pacific Paper Co. Recycling Project), Series 2020-B, 9.00% 12/1/20361 | 1,915 | 1,967 | ||
Total municipals | 66,993 | |||
Total bonds, notes & other debt instruments (cost: $14,240,585,000) | 14,270,324 | |||
Convertible bonds & notes 0.00% | ||||
Communication services 0.00% | ||||
DISH Network Corp., convertible notes, 3.375% 8/15/2026 | 1,078 | 674 | ||
Total convertible bonds & notes (cost: $664,000) | 674 | |||
Common stocks 0.45% | Shares | |||
Utilities 0.13% | ||||
Talen Energy Corp.12 | 176,882 | 19,637 | ||
35 | American Funds Multi-Sector Income Fund |
Common stocks (continued) | Shares | Value (000) | ||
Information technology 0.11% | ||||
Diebold Nixdorf, Inc.12 | 432,997 | $16,662 | ||
Energy 0.07% | ||||
Chesapeake Energy Corp. | 75,595 | 6,213 | ||
FORESEA Holding SA, Class C, nonvoting shares12 | 100,536 | 2,513 | ||
FORESEA Holding SA, Class B12 | 12,196 | 305 | ||
Exxon Mobil Corp. | 12,699 | 1,462 | ||
Mesquite Energy, Inc.6,12 | 126 | 7 | ||
10,500 | ||||
Consumer discretionary 0.05% | ||||
Party City Holdco, Inc.6,12 | 394,088 | 6,865 | ||
Party City Holdco, Inc.1,6,12 | 3,934 | 69 | ||
NMG Parent, LLC12 | 309 | 35 | ||
MYT Holding Co., Class B12 | 8,984 | 1 | ||
6,970 | ||||
Materials 0.05% | ||||
Venator Materials PLC6,12 | 9,406 | 6,636 | ||
Health care 0.02% | ||||
Endo, Inc.12 | 89,172 | 2,508 | ||
Endo, Inc.1,12 | 32,468 | 913 | ||
Endo, Inc. GUC 6.00% Escrow6,12 | 1,250,000 | — 9 | ||
Endo, Inc., 1L 7.50% Escrow6,12 | 4,600,000 | — 9 | ||
Endo, Inc., 2L 9.50% Escrow6,12 | 705,000 | — 9 | ||
Endo, Inc., 1L 6.125% Escrow6,12 | 3,610,000 | — 9 | ||
3,421 | ||||
Real estate 0.02% | ||||
WeWork, Inc.6,12 | 274,322 | 2,749 | ||
Communication services 0.00% | ||||
Intelsat SA | 1 | — 9 | ||
Total common stocks (cost: $61,489,000) | 66,575 | |||
Preferred securities 0.00% | ||||
Industrials 0.00% | ||||
ACR III LSC Holdings, LLC, Series B, preferred shares1,6,12 | 5 | 8 | ||
Total preferred securities (cost: $5,000) | 8 | |||
Rights & warrants 0.00% | ||||
Consumer discretionary 0.00% | ||||
NMG Parent, LLC, warrants, expire 9/24/202712 | 374 | 4 | ||
Total rights & warrants (cost: $2,000) | 4 | |||
Short-term securities 2.84% | ||||
Money market investments 2.84% | ||||
Capital Group Central Cash Fund 5.37%13,14 | 4,228,517 | 422,852 | ||
Total short-term securities (cost: $422,815,000) | 422,852 |
American Funds Multi-Sector Income Fund | 36 |
Options purchased (equity style) 0.05% | Value (000) | |||
Options purchased (equity style)* | $7,417 | |||
Total options purchased (equity style) (cost: $11,848,000) | 7,417 | |||
Total investment securities 99.02% (cost: $14,737,408,000) | 14,767,854 | |||
Total options written† (0.02)% (premium received: $9,284,000) | (2,683 ) | |||
Other assets less liabilities 1.00% | 149,073 | |||
Net assets 100.00% | $14,914,244 |
Description | Number of contracts | Expiration date | Exercise price | Notional amount (000) | Value at 6/30/2024 (000) |
Put | |||||
3 Month SOFR Futures Option | 8,416 | 12/13/2024 | USD94.37 | USD2,104,000 | $105 |
3 Month SOFR Futures Option | 16,833 | 12/13/2024 | 94.44 | 4,208,250 | 316 |
3 Month SOFR Futures Option | 16,833 | 12/13/2024 | 94.94 | 4,208,250 | 3,367 |
3 Month SOFR Futures Option | 8,416 | 12/13/2024 | 95.12 | 2,104,000 | 3,629 |
$7,417 |
Description | Number of contracts | Expiration date | Exercise price | Notional amount (000) | Value at 6/30/2024 (000) |
Put | |||||
3 Month SOFR Futures Option | 8,416 | 12/13/2024 | USD94.63 | USD2,104,000 | $(210 ) |
3 Month SOFR Futures Option | 33,665 | 12/13/2024 | 94.69 | 8,416,250 | (1,263 ) |
3 Month SOFR Futures Option | 8,416 | 12/13/2024 | 94.87 | 2,104,000 | (1,210 ) |
$(2,683 ) |
Contracts | Type | Number of contracts | Expiration date | Notional amount (000) | Value and unrealized appreciation (depreciation) at 6/30/2024 (000) |
30 Day Federal Funds Futures | Long | 3,268 | 9/3/2024 | USD1,289,534 | $(632 ) |
2 Year U.S. Treasury Note Futures | Long | 5,903 | 10/3/2024 | 1,205,503 | 2,464 |
5 Year U.S. Treasury Note Futures | Long | 6,898 | 10/3/2024 | 735,176 | 4,256 |
10 Year Euro-Bund Futures | Short | 202 | 9/10/2024 | (28,474 ) | (349 ) |
10 Year U.S. Treasury Note Futures | Short | 25 | 9/30/2024 | (2,750 ) | 6 |
10 Year Ultra U.S. Treasury Note Futures | Short | 14,517 | 9/30/2024 | (1,648,133 ) | (11,397 ) |
20 Year U.S. Treasury Bond Futures | Long | 3,400 | 9/30/2024 | 402,263 | 4,658 |
30 Year Ultra U.S. Treasury Bond Futures | Short | 1,038 | 9/30/2024 | (130,107 ) | (2,111 ) |
$(3,105 ) |
37 | American Funds Multi-Sector Income Fund |
Contract amount | Counterparty | Settlement date | Unrealized appreciation (depreciation) at 6/30/2024 (000) | |||
Currency purchased (000) | Currency sold (000) | |||||
USD | 16,204 | EUR | 15,000 | BNP Paribas | 7/22/2024 | $121 |
USD | 50,641 | EUR | 47,143 | Citibank | 7/24/2024 | 89 |
USD | 41,889 | EUR | 39,156 | Morgan Stanley | 7/25/2024 | (100 ) |
$110 |
Reference index | Financing rate paid | Payment frequency | Expiration date | Notional amount (000) | Value at 6/30/2024 (000) | Upfront premium paid (received) (000) | Unrealized appreciation (depreciation) at 6/30/2024 (000) |
CDX.NA.IG.42 | 1.00% | Quarterly | 6/20/2029 | USD1 | $— 9 | $— 9 | $— 9 |
Reference index | Financing rate received | Payment frequency | Expiration date | Notional amount15 (000) | Value at 6/30/202416 (000) | Upfront premium paid (received) (000) | Unrealized appreciation (depreciation) at 6/30/2024 (000) |
CDX.NA.HY.42 | 5.00% | Quarterly | 6/20/2029 | USD96,800 | $6,072 | $6,501 | $(429 ) |
Value at 1/1/2024 (000) | Additions (000) | Reductions (000) | Net realized gain (loss) (000) | Net unrealized appreciation (depreciation) (000) | Value at 6/30/2024 (000) | Dividend or interest income (000) | |
Short-term securities 2.84% | |||||||
Money market investments 2.84% | |||||||
Capital Group Central Cash Fund 5.37% 13 | $284,321 | $2,130,738 | $1,992,343 | $57 | $79 | $422,852 | $12,003 |
Acquisition date(s) | Cost (000) | Value (000) | Percent of net assets | |
Mission Lane Credit Card Master Trust, Series 2022-B, Class A1, 8.25% 1/15/20286,10 | 12/6/2022 | $20,014 | $20,001 | .14 % |
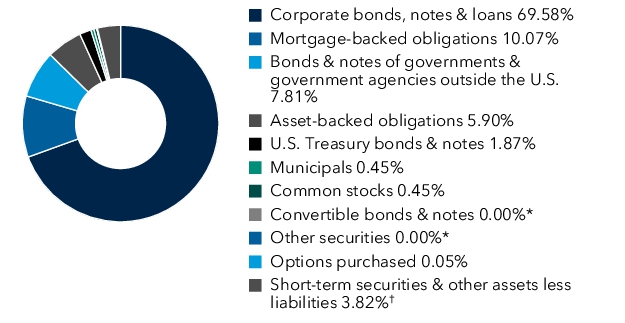
Mission Lane Credit Card Master Trust, Series 2022-B, Class B, 10.42% 1/15/20286,10 | 12/6/2022-4/23/2024 | 13,953 | 14,057 | .10 |
Mission Lane Credit Card Master Trust, Series 2022-B, Class C, 12.09% 1/15/20286,10 | 12/6/2022 | 10,745 | 10,831 | .07 |
Mission Lane Credit Card Master Trust, Series 2022-B, Class D, 14.45% 1/15/20286,10 | 12/6/2022-1/5/2024 | 5,009 | 5,040 | .03 |
Mission Lane Credit Card Master Trust, Series 2022-B, Class A2, 8.73% 1/15/20286,10 | 12/6/2022 | 3,200 | 3,197 | .02 |
Stillwater Mining Co. 4.00% 11/16/2026 | 2/8/2024-6/24/2024 | 11,967 | 11,950 | .08 |
Stillwater Mining Co. 4.50% 11/16/2029 | 1/26/2024-6/18/2024 | 6,101 | 6,122 | .04 |
American Funds Multi-Sector Income Fund | 38 |
Acquisition date(s) | Cost (000) | Value (000) | Percent of net assets | |
Finastra USA, Inc., Term Loan B, (3-month USD CME Term SOFR + 7.25%) 12.459% 9/13/20293,4 | 9/13/2023 - 5/31/2024 | $16,167 | $16,551 | .11 % |
Finastra USA, Inc., Term Loan, (3-month USD CME Term SOFR + 7.25%) 12.581% 9/13/20293,4 | 9/13/2023-6/28/2024 | 181 | 182 | .00 17 |
Wolfspeed, Inc. 9.875% 6/23/2030 (10.875% on 6/23/2026)2,6 | 6/23/2023 | 10,360 | 10,369 | .07 |
Sasol Financing USA, LLC 8.75% 5/3/2029 | 4/9/2024-4/15/2024 | 9,198 | 9,162 | .06 |
Modec Finance BV 7.84% 7/15/20266 | 7/28/2023 | 9,000 | 9,049 | .06 |
NBM US Holdings, Inc. 6.625% 8/6/2029 | 9/22/2020 | 517 | 494 | .00 17 |
Total | $116,412 | $117,005 | .78 % |
1 | Acquired in a transaction exempt from registration under Rule 144A or, for commercial paper, Section 4(a)(2) of the Securities Act of 1933. May be resold in the U.S. in transactions exempt from registration, normally to qualified institutional buyers. The total value of all such securities was $6,404,278,000, which represented 42.94% of the net assets of the fund. |
2 | Step bond; coupon rate may change at a later date. |
3 | Loan participations and assignments; may be subject to legal or contractual restrictions on resale. The total value of all such loans was $233,759,000, which represented 1.57% of the net assets of the fund. |
4 | Coupon rate may change periodically. Reference rate and spread are as of the most recent information available. Some coupon rates are determined by the issuer or agent based on current market conditions; therefore, the reference rate and spread are not available. |
5 | Scheduled interest and/or principal payment was not received. |
6 | Value determined using significant unobservable inputs. |
7 | Restricted security, other than Rule 144A securities or commercial paper issued pursuant to Section 4(a)(2) of the Securities Act of 1933. The total value of all such restricted securities was $117,005,000, which represented .78% of the net assets of the fund. |
8 | Payment in kind; the issuer has the option of paying additional securities in lieu of cash. Payment methods and rates are as of the most recent payment when available. |
9 | Amount less than one thousand. |
10 | Principal payments may be made periodically. Therefore, the effective maturity date may be earlier than the stated maturity date. |
11 | All or a portion of this security was pledged as collateral. The total value of pledged collateral was $20,037,000, which represented .13% of the net assets of the fund. |
12 | Security did not produce income during the last 12 months. |
13 | Rate represents the seven-day yield at 6/30/2024. |
14 | Part of the same “group of investment companies“ as the fund as defined under the Investment Company Act of 1940, as amended. |
15 | The maximum potential amount the fund may pay as a protection seller should a credit event occur. |
16 | The prices and resulting values for credit default swap indices serve as an indicator of the current status of the payment/performance risk. As the value of a sell protection credit default swap increases or decreases, when compared to the notional amount of the swap, the payment/performance risk may decrease or increase, respectively. |
17 | Amount less than .01%. |
Key to abbreviation(s) |
AMT = Alternative Minimum Tax |
Auth. = Authority |
CLO = Collateralized Loan Obligations |
CME = CME Group |
CMO = Collateralized Mortgage Obligations |
DAC = Designated Activity Company |
Dev. = Development |
Dist. = District |
Econ. = Economic |
EUR = Euros |
EURIBOR = Euro Interbank Offered Rate |
Facs. = Facilities |
Fin. = Finance |
Fncg. = Financing |
G.O. = General Obligation |
ICE = Intercontinental Exchange, Inc. |
PIK = Payment In Kind |
Ref. = Refunding |
REIT = Real Estate Investment Trust |
Rev. = Revenue |
RSC = Restricted Scope Company |
SOFR = Secured Overnight Financing Rate |
USD = U.S. dollars |
39 | American Funds Multi-Sector Income Fund |
Assets: | ||
Investment securities, at value: | ||
Unaffiliated issuers (cost: $14,314,593) | $14,345,002 | |
Affiliated issuers (cost: $422,815) | 422,852 | $14,767,854 |
Cash | 3,585 | |
Cash collateral pledged for futures contracts | 16,273 | |
Unrealized appreciation on open forward currency contracts | 210 | |
Unrealized appreciation on unfunded commitments* | 8 | |
Receivables for: | ||
Sales of investments | 96,611 | |
Sales of fund’s shares | 23,784 | |
Dividends and interest | 203,278 | |
Variation margin on futures contracts | 8,874 | |
Variation margin on centrally cleared swap contracts | 40 | 332,587 |
15,120,517 | ||
Liabilities: | ||
Unrealized depreciation on open forward currency contracts | 100 | |
Options written, at value (premium received: $9,284) | 2,683 | |
Payables for: | ||
Purchases of investments | 183,657 | |
Repurchases of fund’s shares | 10,132 | |
Dividends on fund’s shares | 507 | |
Investment advisory services | 4,025 | |
Services provided by related parties | 761 | |
Trustees’ deferred compensation | 27 | |
Variation margin on futures contracts | 4,278 | |
Variation margin on centrally cleared swap contracts | 71 | |
Other | 32 | 203,490 |
Commitments and contingencies* | ||
Net assets at June 30, 2024 | $14,914,244 | |
Net assets consist of: | ||
Capital paid in on shares of beneficial interest | $15,195,602 | |
Total distributable earnings (accumulated loss) | (281,358 ) | |
Net assets at June 30, 2024 | $14,914,244 |
American Funds Multi-Sector Income Fund | 40 |
(dollars and shares in thousands, except per-share amounts)
unlimited shares authorized (1,608,636 total shares outstanding)
Net assets | Shares outstanding | Net asset value per share | |
Class A | $934,066 | 100,747 | $9.27 |
Class C | 35,197 | 3,796 | 9.27 |
Class T | 24 | 3 | 9.27 |
Class F-1 | 20,060 | 2,164 | 9.27 |
Class F-2 | 3,070,389 | 331,169 | 9.27 |
Class F-3 | 795,382 | 85,789 | 9.27 |
Class 529-A | 21,543 | 2,324 | 9.27 |
Class 529-C | 1,563 | 168 | 9.27 |
Class 529-E | 804 | 87 | 9.27 |
Class 529-T | 30 | 3 | 9.27 |
Class 529-F-1 | 30 | 3 | 9.27 |
Class 529-F-2 | 10,297 | 1,111 | 9.27 |
Class 529-F-3 | 11 | 1 | 9.27 |
Class R-1 | 250 | 27 | 9.27 |
Class R-2 | 1,454 | 157 | 9.27 |
Class R-2E | 43 | 5 | 9.27 |
Class R-3 | 2,768 | 299 | 9.27 |
Class R-4 | 1,506 | 162 | 9.27 |
Class R-5E | 888 | 96 | 9.27 |
Class R-5 | 707 | 76 | 9.27 |
Class R-6 | 10,017,232 | 1,080,449 | 9.27 |
41 | American Funds Multi-Sector Income Fund |
Investment income: | ||
Income: | ||
Interest from unaffiliated issuers | $468,140 | |
Dividends (includes $12,003 from affiliates) | 12,125 | $480,265 |
Fees and expenses*: | ||
Investment advisory services | 23,250 | |
Distribution services | 1,440 | |
Transfer agent services | 1,844 | |
Administrative services | 2,101 | |
529 plan services | 8 | |
Reports to shareholders | 142 | |
Registration statement and prospectus | 845 | |
Trustees’ compensation | 26 | |
Auditing and legal | 80 | |
Custodian | 75 | |
Other | 27 | 29,838 |
Net investment income | 450,427 | |
Net realized gain (loss) and unrealized appreciation (depreciation): | ||
Net realized gain (loss) on: | ||
Investments: | ||
Unaffiliated issuers | 928 | |
Affiliated issuers | 57 | |
Futures contracts | 2,435 | |
Forward currency contracts | 1,560 | |
Swap contracts | (2,321 ) | |
Currency transactions | 15 | 2,674 |
Net unrealized appreciation (depreciation) on: | ||
Investments: | ||
Unaffiliated issuers | (93,297 ) | |
Affiliated issuers | 79 | |
Options written | 6,601 | |
Futures contracts | 16,964 | |
Forward currency contracts | 1,079 | |
Swap contracts | (436 ) | |
Currency translations | (76 ) | (69,086 ) |
Net realized gain (loss) and unrealized appreciation (depreciation) | (66,412 ) | |
Net increase (decrease) in net assets resulting from operations | $384,015 |
American Funds Multi-Sector Income Fund | 42 |
Six months ended June 30, | Year ended December 31, | |
2024* | 2023 | |
Operations: | ||
Net investment income | $450,427 | $683,830 |
Net realized gain (loss) | 2,674 | (204,893 ) |
Net unrealized appreciation (depreciation) | (69,086 ) | 719,086 |
Net increase (decrease) in net assets resulting from operations | 384,015 | 1,198,023 |
Distributions paid or accrued to shareholders | (450,449 ) | (702,734 ) |
Net capital share transactions | 1,705,952 | 3,610,326 |
Total increase (decrease) in net assets | 1,639,518 | 4,105,615 |
Net assets: | ||
Beginning of period | 13,274,726 | 9,169,111 |
End of period | $14,914,244 | $13,274,726 |
43 | American Funds Multi-Sector Income Fund |
Share class | Initial sales charge | Contingent deferred sales charge upon redemption | Conversion feature |
Class A | Up to 3.75% | None (except 0.75% for certain redemptions within 18 months of purchase without an initial sales charge) | None |
Class 529-A | Up to 3.50% | None (except 1.00% for certain redemptions within 18 months of purchase without an initial sales charge) | None |
Classes C and 529-C | None | 1.00% for redemptions within one year of purchase | Class C converts to Class A after eight years and Class 529-C converts to Class 529-A after five years |
Class 529-E | None | None | None |
Classes T and 529-T* | Up to 2.50% | None | None |
Classes F-1, F-2, F-3, 529-F-1, 529-F-2 and 529-F-3 | None | None | None |
Classes R-1, R-2, R-2E, R-3, R-4, R-5E, R-5 and R-6 | None | None | None |
American Funds Multi-Sector Income Fund | 44 |
Fixed-income class | Examples of standard inputs |
All | Benchmark yields, transactions, bids, offers, quotations from dealers and trading systems, new issues, spreads and other relationships observed in the markets among comparable securities; and proprietary pricing models such as yield measures calculated using factors such as cash flows, financial or collateral performance and other reference data (collectively referred to as “standard inputs”) |
Corporate bonds, notes & loans; convertible securities | Standard inputs and underlying equity of the issuer |
Bonds & notes of governments & government agencies | Standard inputs and interest rate volatilities |
Mortgage-backed; asset-backed obligations | Standard inputs and cash flows, prepayment information, default rates, delinquency and loss assumptions, collateral characteristics, credit enhancements and specific deal information |
Municipal securities | Standard inputs and, for certain distressed securities, cash flows or liquidation values using a net present value calculation based on inputs that include, but are not limited to, financial statements and debt contracts |
45 | American Funds Multi-Sector Income Fund |
Investment securities | ||||
Level 1 | Level 2 | Level 3 | Total | |
Assets: | ||||
Bonds, notes & other debt instruments: | ||||
Corporate bonds, notes & loans | $— | $10,332,375 | $45,833 | $10,378,208 |
Mortgage-backed obligations | — | 1,473,505 | 28,246 | 1,501,751 |
Bonds & notes of governments & government agencies outside the U.S. | — | 1,165,005 | — | 1,165,005 |
Asset-backed obligations | — | 815,949 | 63,953 | 879,902 |
U.S. Treasury bonds & notes | — | 278,465 | — | 278,465 |
Municipals | — | 66,993 | — | 66,993 |
Convertible bonds & notes | — | 674 | — | 674 |
Common stocks | 43,974 | 6,275 | 16,326 | 66,575 |
Preferred securities | — | — | 8 | 8 |
Rights & warrants | — | 4 | — | 4 |
Short-term securities | 422,852 | — | — | 422,852 |
Options purchased on futures (equity style) | 7,417 | — | — | 7,417 |
Total | $474,243 | $14,139,245 | $154,366 | $14,767,854 |
American Funds Multi-Sector Income Fund | 46 |
Other investments1 | ||||
Level 1 | Level 2 | Level 3 | Total | |
Assets: | ||||
Unrealized appreciation on futures contracts | $11,384 | $— | $— | $11,384 |
Unrealized appreciation on open forward currency contracts | — | 210 | — | 210 |
Unrealized appreciation on centrally cleared credit default swaps | — | — 2 | — | — 2 |
Liabilities: | ||||
Value of options written | (2,683 ) | — | — | (2,683 ) |
Unrealized depreciation on futures contracts | (14,489 ) | — | — | (14,489 ) |
Unrealized depreciation on open forward currency contracts | — | (100 ) | — | (100 ) |
Unrealized depreciation on centrally cleared credit default swaps | — | (429 ) | — | (429 ) |
Total | $(5,788 ) | $(319 ) | $— | $(6,107 ) |
Beginning value at 1/1/2024 | Transfers into Level 33 | Purchases | Sales | Net realized gain4 | Unrealized depreciation4 | Transfers out of Level 33 | Ending value at 6/30/2024 | |
Investment securities | $ 124,655 | $ — | $32,803 | $ (1,168 ) | $19 | $ (1,936 ) | $ (7 ) | $154,366 |
Net unrealized depreciation during the period on Level 3 investment securities held at June 30, 2024 | $ (2,250 ) |
47 | American Funds Multi-Sector Income Fund |
Value at 6/30/2024 | Valuation techniques | Unobservable inputs | Range (if applicable) | Weighted average* | Impact to valuation from an increase in input† | |
Bonds, notes & other debt instruments | $138,032 | Market comparables | Yield | 7.6% - 13.7% | 9.8% | Decrease |
Transaction | Transaction price | Not applicable | Not applicable | Not applicable | ||
Net adjustment (decrease) based on movement of market comparables | 0.5% | 0.5% | Decrease | |||
Discount to transaction price | 1.5% | 1.5% | Decrease | |||
Estimated recovery value | De minimis | Not applicable | Not applicable | Not applicable | ||
Common stocks | $16,326 | Market comparables | EV/EBITDA multiple | 5.7x - 6.4x | 6.1x | Increase |
Discount to EV/EBITDA multiple | 13.0% | 13.0% | Decrease | |||
DLOM | 14.0% - 16.0% | 15.0% | Decrease | |||
Estimated recovery value | De minimis | Not applicable | Not applicable | Not applicable | ||
Transaction | Transaction price | Not applicable | Not applicable | Not applicable | ||
Estimated recovery value | Expected proceeds | Not applicable | Not applicable | Not applicable | ||
Discount for uncertainty | 20.0% | 20.0% | Decrease | |||
Preferred securities | $8 | Market comparables | EV/EBITDA multiple | 4.5x | 4.5x | Increase |
DLOM | 15.0% | 15.0% | Decrease | |||
$154,366 |
Key to abbreviations |
DLOM = Discount for lack of marketability |
EBITDA = Earnings before interest, taxes, depreciation and amortization |
EV = Enterprise value |
American Funds Multi-Sector Income Fund | 48 |
49 | American Funds Multi-Sector Income Fund |
American Funds Multi-Sector Income Fund | 50 |
of the option the right to buy or sell a position in a futures contract from or to the writer of the option, at a specified price on or before the specified expiration date. The average month-end notional amount of options on futures while held was $19,320,950,000.
51 | American Funds Multi-Sector Income Fund |
American Funds Multi-Sector Income Fund | 52 |
Assets | Liabilities | ||||
Contracts | Risk type | Location on statement of assets and liabilities | Value | Location on statement of assets and liabilities | Value |
Options purchased (equity style) | Interest | Investment securities | $7,417 | Investment securities | $— |
Options written (equity style) | Interest | Options written, at value | — | Options written, at value | 2,683 |
Futures | Interest | Unrealized appreciation* | 11,384 | Unrealized depreciation* | 14,489 |
Forward currency | Currency | Unrealized appreciation on open forward currency contracts | 210 | Unrealized depreciation on open forward currency contracts | 100 |
Swap (centrally cleared) | Credit | Unrealized appreciation* | — † | Unrealized depreciation* | 429 |
$19,011 | $17,701 |
Net realized gain (loss) | Net unrealized appreciation (depreciation) | ||||
Contracts | Risk type | Location on statement of operations | Value | Location on statement of operations | Value |
Options purchased (equity style) | Interest | Net realized gain (loss) on investments | $— | Net unrealized appreciation (depreciation) on investments | $(4,431 ) |
Options written (equity style) | Interest | Net realized gain (loss) on options written | — | Net unrealized appreciation (depreciation) on options written | 6,601 |
Futures | Interest | Net realized gain (loss) on futures contracts | 2,435 | Net unrealized appreciation (depreciation) on futures contracts | 16,964 |
Forward currency | Currency | Net realized gain (loss) on forward currency contracts | 1,560 | Net unrealized appreciation (depreciation) on forward currency contracts | 1,079 |
Swap | Credit | Net realized gain (loss) on swap contracts | (2,321 ) | Net unrealized appreciation (depreciation) on swap contracts | (436 ) |
$1,674 | $19,777 |
53 | American Funds Multi-Sector Income Fund |
Counterparty | Gross amounts recognized in the statement of assets and liabilities | Gross amounts not offset in the statement of assets and liabilities and subject to a master netting agreement | Net amount | ||
Available to offset | Non-cash collateral* | Cash collateral* | |||
Assets: | |||||
BNP Paribas | $121 | $ — | $ — | $ — | $121 |
Citibank | 89 | — | — | — | 89 |
Total | $210 | $ — | $ — | $ — | $210 |
Liabilities: | |||||
Morgan Stanley | $100 | $ — | $ — | $ — | $100 |
Total | $100 | $ — | $ — | $ — | $100 |
American Funds Multi-Sector Income Fund | 54 |
Undistributed ordinary income | $33,712 |
Capital loss carryforward* | (353,125 ) |
Gross unrealized appreciation on investments | $322,376 |
Gross unrealized depreciation on investments | (290,455 ) |
Net unrealized appreciation (depreciation) on investments | 31,921 |
Cost of investments | 14,723,325 |
Six months ended June 30, | Year ended December 31, | |
Share class | 2024 | 2023 |
Class A | $24,835 | $37,526 |
Class C | 812 | 1,152 |
Class T | 1 | 1 |
Class F-1 | 541 | 986 |
Class F-2 | 88,926 | 127,031 |
Class F-3 | 23,729 | 35,397 |
Class 529-A | 550 | 752 |
Class 529-C | 32 | 45 |
Class 529-E | 17 | 17 |
Class 529-T | 1 | 2 |
Class 529-F-1 | 1 | 2 |
Class 529-F-2 | 252 | 284 |
Class 529-F-3 | — † | 1 |
Class R-1 | 4 | 5 |
Class R-2 | 37 | 59 |
Class R-2E | 1 | 1 |
Class R-3 | 75 | 108 |
Class R-4 | 45 | 70 |
Class R-5E | 24 | 28 |
Class R-5 | 20 | 17 |
Class R-6 | 310,546 | 499,250 |
Total | $450,449 | $702,734 |
55 | American Funds Multi-Sector Income Fund |
Share class | Currently approved limits | Plan limits |
Class A | 0.30 % | 0.30 % |
Class 529-A | 0.30 | 0.50 |
Classes C, 529-C and R-1 | 1.00 | 1.00 |
Class R-2 | 0.75 | 1.00 |
Class R-2E | 0.60 | 0.85 |
Classes 529-E and R-3 | 0.50 | 0.75 |
Classes T, F-1, 529-T, 529-F-1 and R-4 | 0.25 | 0.50 |
American Funds Multi-Sector Income Fund | 56 |
Share class | Distribution services | Transfer agent services | Administrative services | 529 plan services |
Class A | $1,223 | $358 | $122 | Not applicable |
Class C | 151 | 13 | 5 | Not applicable |
Class T | — | — * | — * | Not applicable |
Class F-1 | 22 | 11 | 3 | Not applicable |
Class F-2 | Not applicable | 1,437 | 419 | Not applicable |
Class F-3 | Not applicable | — * | 110 | Not applicable |
Class 529-A | 23 | 7 | 3 | $5 |
Class 529-C | 6 | 1 | — * | 1 |
Class 529-E | 1 | — * | — * | — * |
Class 529-T | — | — * | — * | — * |
Class 529-F-1 | — | — * | — * | — * |
Class 529-F-2 | Not applicable | 1 | 1 | 2 |
Class 529-F-3 | Not applicable | — | — * | — * |
Class R-1 | 1 | — * | — * | Not applicable |
Class R-2 | 5 | 1 | — * | Not applicable |
Class R-2E | — * | — * | — * | Not applicable |
Class R-3 | 6 | 1 | — * | Not applicable |
Class R-4 | 2 | 1 | — * | Not applicable |
Class R-5E | Not applicable | 1 | — * | Not applicable |
Class R-5 | Not applicable | — * | — * | Not applicable |
Class R-6 | Not applicable | 12 | 1,438 | Not applicable |
Total class-specific expenses | $1,440 | $1,844 | $2,101 | $8 |
57 | American Funds Multi-Sector Income Fund |
Sales* | Reinvestments of distributions | Repurchases* | Net increase (decrease) | |||||
Share class | Amount | Shares | Amount | Shares | Amount | Shares | Amount | Shares |
Six months ended June 30, 2024 | ||||||||
Class A | $266,185 | 28,732 | $24,329 | 2,627 | $(68,385 ) | (7,386 ) | $222,129 | 23,973 |
Class C | 12,084 | 1,304 | 802 | 87 | (3,311 ) | (358 ) | 9,575 | 1,033 |
Class T | — | — | — | — | — | — | — | — |
Class F-1 | 8,247 | 890 | 535 | 58 | (5,461 ) | (590 ) | 3,321 | 358 |
Class F-2 | 737,778 | 79,673 | 87,432 | 9,441 | (372,983 ) | (40,289 ) | 452,227 | 48,825 |
Class F-3 | 166,800 | 18,007 | 23,228 | 2,508 | (73,617 ) | (7,950 ) | 116,411 | 12,565 |
Class 529-A | 7,737 | 835 | 548 | 60 | (2,425 ) | (262 ) | 5,860 | 633 |
Class 529-C | 885 | 95 | 32 | 3 | (382 ) | (41 ) | 535 | 57 |
Class 529-E | 485 | 52 | 16 | 2 | (13 ) | (1 ) | 488 | 53 |
Class 529-T | — | — | 1 | — † | — | — | 1 | — † |
Class 529-F-1 | — | — | 1 | — † | — | — | 1 | — † |
Class 529-F-2 | 4,180 | 451 | 252 | 27 | (393 ) | (42 ) | 4,039 | 436 |
Class 529-F-3 | — | — | — † | — † | — | — | — † | — † |
Class R-1 | 158 | 17 | 4 | — † | (26 ) | (2 ) | 136 | 15 |
Class R-2 | 332 | 36 | 37 | 4 | (138 ) | (15 ) | 231 | 25 |
Class R-2E | 48 | 5 | — † | — † | (33 ) | (3 ) | 15 | 2 |
Class R-3 | 541 | 59 | 75 | 8 | (110 ) | (12 ) | 506 | 55 |
Class R-4 | 188 | 20 | 45 | 5 | (101 ) | (11 ) | 132 | 14 |
Class R-5E | 324 | 35 | 23 | 3 | (340 ) | (37 ) | 7 | 1 |
Class R-5 | 152 | 16 | 19 | 2 | — † | — † | 171 | 18 |
Class R-6 | 847,033 | 91,299 | 310,223 | 33,497 | (267,089 ) | (28,820 ) | 890,167 | 95,976 |
Total net increase (decrease) | $2,053,157 | 221,526 | $447,602 | 48,332 | $(794,807 ) | (85,819 ) | $1,705,952 | 184,039 |
American Funds Multi-Sector Income Fund | 58 |
Sales* | Reinvestments of distributions | Repurchases* | Net increase (decrease) | |||||
Share class | Amount | Shares | Amount | Shares | Amount | Shares | Amount | Shares |
Year ended December 31, 2023 | ||||||||
Class A | $290,295 | 32,222 | $36,881 | 4,092 | $(257,994 ) | (28,703 ) | $69,182 | 7,611 |
Class C | 16,507 | 1,829 | 1,138 | 126 | (9,523 ) | (1,057 ) | 8,122 | 898 |
Class T | — | — | — | — | — | — | — | — |
Class F-1 | 7,432 | 826 | 980 | 108 | (7,578 ) | (844 ) | 834 | 90 |
Class F-2 | 1,334,656 | 148,423 | 124,929 | 13,875 | (453,325 ) | (50,477 ) | 1,006,260 | 111,821 |
Class F-3 | 298,504 | 33,114 | 34,523 | 3,834 | (118,393 ) | (13,191 ) | 214,634 | 23,757 |
Class 529-A | 7,537 | 834 | 749 | 83 | (3,213 ) | (356 ) | 5,073 | 561 |
Class 529-C | 558 | 62 | 44 | 5 | (285 ) | (32 ) | 317 | 35 |
Class 529-E | 269 | 30 | 16 | 2 | (177 ) | (20 ) | 108 | 12 |
Class 529-T | — | — | 2 | — † | — | — | 2 | — † |
Class 529-F-1 | — | — | 2 | — † | — | — | 2 | — † |
Class 529-F-2 | 3,126 | 347 | 283 | 32 | (707 ) | (78 ) | 2,702 | 301 |
Class 529-F-3 | — | — | 1 | — † | — | — | 1 | — † |
Class R-1 | 69 | 8 | 4 | — † | (41 ) | (5 ) | 32 | 3 |
Class R-2 | 830 | 92 | 59 | 7 | (533 ) | (59 ) | 356 | 40 |
Class R-2E | 3 | — † | — † | — † | — | — | 3 | — † |
Class R-3 | 1,675 | 184 | 107 | 12 | (646 ) | (71 ) | 1,136 | 125 |
Class R-4 | 387 | 43 | 70 | 8 | (332 ) | (37 ) | 125 | 14 |
Class R-5E | 771 | 84 | 26 | 3 | (215 ) | (24 ) | 582 | 63 |
Class R-5 | 323 | 36 | 15 | 2 | (17 ) | (2 ) | 321 | 36 |
Class R-6 | 2,077,017 | 229,891 | 498,625 | 55,366 | (275,108 ) | (30,869 ) | 2,300,534 | 254,388 |
Total net increase (decrease) | $4,039,959 | 448,025 | $698,454 | 77,555 | $(1,128,087 ) | (125,825 ) | $3,610,326 | 399,755 |
if any, of $5,202,529,000 and $3,679,483,000, respectively, during the six months ended June 30, 2024.
59 | American Funds Multi-Sector Income Fund |
Income (loss) from investment operations1 | Dividends and distributions | ||||||||||||
Year ended | Net asset value, beginning of year | Net investment income (loss) | Net gains (losses) on securities (both realized and unrealized) | Total from investment operations | Dividends (from net investment income) | Distributions (from capital gains) | Total dividends and distributions | Net asset value, end of year | Total return2,3 | Net assets, end of year (in millions) | Ratio of expenses to average net assets before waivers/ reimburse- ments4 | Ratio of expenses to average net assets after waivers/ reimburse- ments3,4 | Ratio of net income (loss) to average net assets3 |
Class A: | |||||||||||||
6/30/20245,6 | $9.32 | $.28 | $(.05 ) | $.23 | $(.28 ) | $— | $(.28 ) | $9.27 | 2.51 %7 | $934 | .77 %8 | .77 %8 | 6.09 %8 |
12/31/2023 | 8.95 | .53 | .38 | .91 | (.54 ) | — | (.54 ) | 9.32 | 10.58 | 716 | .77 | .77 | 5.86 |
12/31/2022 | 10.63 | .42 | (1.70 ) | (1.28 ) | (.40 ) | — 9 | (.40 ) | 8.95 | (12.05 ) | 619 | .79 | .78 | 4.44 |
12/31/2021 | 10.81 | .36 | (.11 ) | .25 | (.36 ) | (.07 ) | (.43 ) | 10.63 | 2.38 | 680 | .84 | .83 | 3.34 |
12/31/2020 | 10.32 | .41 | .68 | 1.09 | (.43 ) | (.17 ) | (.60 ) | 10.81 | 11.07 | 356 | 1.09 | .85 | 3.96 |
12/31/20195,10 | 10.00 | .37 | .40 | .77 | (.35 ) | (.10 ) | (.45 ) | 10.32 | 7.76 7,11 | 52 | .60 8,11 | .53 8,11 | 4.61 8,11 |
Class C: | |||||||||||||
6/30/20245,6 | 9.32 | .25 | (.05 ) | .20 | (.25 ) | — | (.25 ) | 9.27 | 2.16 7 | 35 | 1.47 8 | 1.47 8 | 5.39 8 |
12/31/2023 | 8.95 | .47 | .38 | .85 | (.48 ) | — | (.48 ) | 9.32 | 9.81 | 26 | 1.47 | 1.47 | 5.17 |
12/31/2022 | 10.63 | .35 | (1.69 ) | (1.34 ) | (.34 ) | — 9 | (.34 ) | 8.95 | (12.67 ) | 17 | 1.49 | 1.49 | 3.70 |
12/31/2021 | 10.81 | .28 | (.10 ) | .18 | (.29 ) | (.07 ) | (.36 ) | 10.63 | 1.67 | 24 | 1.54 | 1.53 | 2.63 |
12/31/20205,12 | 9.67 | .22 | 1.20 | 1.42 | (.24 ) | (.04 ) | (.28 ) | 10.81 | 14.78 7 | 10 | 1.67 8 | 1.55 8 | 3.12 8 |
Class T: | |||||||||||||
6/30/20245,6 | 9.32 | .30 | (.05 ) | .25 | (.30 ) | — | (.30 ) | 9.27 | 2.68 7,11 | — 13 | .44 8,11 | .44 8,11 | 6.42 8,11 |
12/31/2023 | 8.95 | .56 | .38 | .94 | (.57 ) | — | (.57 ) | 9.32 | 10.97 11 | — 13 | .41 11 | .41 11 | 6.22 11 |
12/31/2022 | 10.63 | .45 | (1.70 ) | (1.25 ) | (.43 ) | — 9 | (.43 ) | 8.95 | (11.79 )11 | — 13 | .48 11 | .48 11 | 4.74 11 |
12/31/2021 | 10.81 | .39 | (.11 ) | .28 | (.39 ) | (.07 ) | (.46 ) | 10.63 | 2.63 11 | — 13 | .59 11 | .59 11 | 3.61 11 |
12/31/20205,12 | 9.67 | .29 | 1.19 | 1.48 | (.30 ) | (.04 ) | (.34 ) | 10.81 | 15.45 7,11 | — 13 | .94 8,11 | .62 8,11 | 4.22 8,11 |
Class F-1: | |||||||||||||
6/30/20245,6 | 9.32 | .28 | (.05 ) | .23 | (.28 ) | — | (.28 ) | 9.27 | 2.52 7 | 20 | .75 8 | .75 8 | 6.11 8 |
12/31/2023 | 8.95 | .53 | .38 | .91 | (.54 ) | — | (.54 ) | 9.32 | 10.60 | 17 | .75 | .75 | 5.88 |
12/31/2022 | 10.63 | .42 | (1.70 ) | (1.28 ) | (.40 ) | — 9 | (.40 ) | 8.95 | (12.06 ) | 15 | .79 | .79 | 4.45 |
12/31/2021 | 10.81 | .36 | (.11 ) | .25 | (.36 ) | (.07 ) | (.43 ) | 10.63 | 2.37 | 15 | .85 | .85 | 3.33 |
12/31/20205,12 | 9.67 | .27 | 1.19 | 1.46 | (.28 ) | (.04 ) | (.32 ) | 10.81 | 15.26 7 | 7 | 1.09 8 | .88 8 | 3.84 8 |
Class F-2: | |||||||||||||
6/30/20245,6 | 9.32 | .29 | (.05 ) | .24 | (.29 ) | — | (.29 ) | 9.27 | 2.66 7 | 3,070 | .48 8 | .48 8 | 6.38 8 |
12/31/2023 | 8.95 | .56 | .38 | .94 | (.57 ) | — | (.57 ) | 9.32 | 10.89 | 2,631 | .48 | .48 | 6.19 |
12/31/2022 | 10.63 | .46 | (1.71 ) | (1.25 ) | (.43 ) | — 9 | (.43 ) | 8.95 | (11.81 ) | 1,526 | .50 | .50 | 4.90 |
12/31/2021 | 10.81 | .38 | (.10 ) | .28 | (.39 ) | (.07 ) | (.46 ) | 10.63 | 2.66 | 804 | .56 | .56 | 3.55 |
12/31/2020 | 10.32 | .44 | .67 | 1.11 | (.45 ) | (.17 ) | (.62 ) | 10.81 | 11.26 | 119 | .78 | .59 | 4.13 |
12/31/20195,10 | 10.00 | .36 | .40 | .76 | (.34 ) | (.10 ) | (.44 ) | 10.32 | 7.75 7,11 | — 13 | .62 8,11 | .54 8,11 | 4.59 8,11 |
Class F-3: | |||||||||||||
6/30/20245,6 | 9.32 | .30 | (.05 ) | .25 | (.30 ) | — | (.30 ) | 9.27 | 2.71 7 | 795 | .38 8 | .38 8 | 6.48 8 |
12/31/2023 | 8.95 | .57 | .38 | .95 | (.58 ) | — | (.58 ) | 9.32 | 11.01 | 682 | .38 | .38 | 6.29 |
12/31/2022 | 10.63 | .46 | (1.70 ) | (1.24 ) | (.44 ) | — 9 | (.44 ) | 8.95 | (11.72 ) | 443 | .41 | .40 | 4.92 |
12/31/2021 | 10.81 | .39 | (.10 ) | .29 | (.40 ) | (.07 ) | (.47 ) | 10.63 | 2.73 | 297 | .49 | .48 | 3.64 |
12/31/2020 | 10.32 | .44 | .68 | 1.12 | (.46 ) | (.17 ) | (.63 ) | 10.81 | 11.32 | 55 | .73 | .53 | 4.18 |
12/31/20195,10 | 10.00 | .36 | .40 | .76 | (.34 ) | (.10 ) | (.44 ) | 10.32 | 7.72 7,11 | — 13 | .64 8,11 | .57 8,11 | 4.57 8,11 |
Class 529-A: | |||||||||||||
6/30/20245,6 | 9.32 | .28 | (.05 ) | .23 | (.28 ) | — | (.28 ) | 9.27 | 2.51 7 | 22 | .77 8 | .77 8 | 6.09 8 |
12/31/2023 | 8.95 | .53 | .38 | .91 | (.54 ) | — | (.54 ) | 9.32 | 10.59 | 16 | .76 | .76 | 5.90 |
12/31/2022 | 10.63 | .42 | (1.69 ) | (1.27 ) | (.41 ) | — 9 | (.41 ) | 8.95 | (12.03 ) | 10 | .76 | .75 | 4.50 |
12/31/2021 | 10.81 | .36 | (.10 ) | .26 | (.37 ) | (.07 ) | (.44 ) | 10.63 | 2.43 | 10 | .81 | .80 | 3.35 |
12/31/20205,12 | 9.67 | .27 | 1.19 | 1.46 | (.28 ) | (.04 ) | (.32 ) | 10.81 | 15.23 7 | 3 | 1.05 8 | .92 8 | 3.78 8 |
American Funds Multi-Sector Income Fund | 60 |
Income (loss) from investment operations1 | Dividends and distributions | ||||||||||||
Year ended | Net asset value, beginning of year | Net investment income (loss) | Net gains (losses) on securities (both realized and unrealized) | Total from investment operations | Dividends (from net investment income) | Distributions (from capital gains) | Total dividends and distributions | Net asset value, end of year | Total return2,3 | Net assets, end of year (in millions) | Ratio of expenses to average net assets before waivers/ reimburse- ments4 | Ratio of expenses to average net assets after waivers/ reimburse- ments3,4 | Ratio of net income (loss) to average net assets3 |
Class 529-C: | |||||||||||||
6/30/20245,6 | $9.32 | $.25 | $(.05 ) | $.20 | $(.25 ) | $— | $(.25 ) | $9.27 | 2.14 %7 | $2 | 1.49 %8 | 1.49 %8 | 5.37 %8 |
12/31/2023 | 8.95 | .47 | .38 | .85 | (.48 ) | — | (.48 ) | 9.32 | 9.79 | 1 | 1.49 | 1.49 | 5.17 |
12/31/2022 | 10.63 | .35 | (1.69 ) | (1.34 ) | (.34 ) | — 9 | (.34 ) | 8.95 | (12.68 ) | 1 | 1.49 | 1.49 | 3.75 |
12/31/2021 | 10.81 | .28 | (.11 ) | .17 | (.28 ) | (.07 ) | (.35 ) | 10.63 | 1.65 | 1 | 1.54 | 1.54 | 2.61 |
12/31/20205,12 | 9.67 | .24 | 1.20 | 1.44 | (.26 ) | (.04 ) | (.30 ) | 10.81 | 14.97 7,11 | — 13 | 1.58 8,11 | 1.39 8,11 | 3.36 8,11 |
Class 529-E: | |||||||||||||
6/30/20245,6 | 9.32 | .27 | (.05 ) | .22 | (.27 ) | — | (.27 ) | 9.27 | 2.42 7 | 1 | .94 8 | .94 8 | 5.92 8 |
12/31/2023 | 8.95 | .52 | .38 | .90 | (.53 ) | — | (.53 ) | 9.32 | 10.42 | — 13 | .92 | .92 | 5.77 |
12/31/2022 | 10.63 | .41 | (1.70 ) | (1.29 ) | (.39 ) | — 9 | (.39 ) | 8.95 | (12.18 )11 | — 13 | .93 11 | .92 11 | 4.29 11 |
12/31/2021 | 10.81 | .34 | (.10 ) | .24 | (.35 ) | (.07 ) | (.42 ) | 10.63 | 2.25 11 | — 13 | .98 11 | .97 11 | 3.18 11 |
12/31/20205,12 | 9.67 | .28 | 1.19 | 1.47 | (.29 ) | (.04 ) | (.33 ) | 10.81 | 15.38 7,11 | — 13 | .99 8,11 | .75 8,11 | 4.03 8,11 |
Class 529-T: | |||||||||||||
6/30/20245,6 | 9.32 | .29 | (.05 ) | .24 | (.29 ) | — | (.29 ) | 9.27 | 2.66 7,11 | — 13 | .48 8,11 | .48 8,11 | 6.37 8,11 |
12/31/2023 | 8.95 | .56 | .38 | .94 | (.57 ) | — | (.57 ) | 9.32 | 10.92 11 | — 13 | .46 11 | .46 11 | 6.18 11 |
12/31/2022 | 10.63 | .44 | (1.69 ) | (1.25 ) | (.43 ) | — 9 | (.43 ) | 8.95 | (11.82 )11 | — 13 | .53 11 | .52 11 | 4.71 11 |
12/31/2021 | 10.81 | .38 | (.11 ) | .27 | (.38 ) | (.07 ) | (.45 ) | 10.63 | 2.57 11 | — 13 | .65 11 | .65 11 | 3.55 11 |
12/31/20205,12 | 9.67 | .29 | 1.19 | 1.48 | (.30 ) | (.04 ) | (.34 ) | 10.81 | 15.40 7,11 | — 13 | 1.00 8,11 | .68 8,11 | 4.15 8,11 |
Class 529-F-1: | |||||||||||||
6/30/20245,6 | 9.32 | .29 | (.05 ) | .24 | (.29 ) | — | (.29 ) | 9.27 | 2.62 7,11 | — 13 | .55 8,11 | .55 8,11 | 6.31 8,11 |
12/31/2023 | 8.95 | .55 | .38 | .93 | (.56 ) | — | (.56 ) | 9.32 | 10.82 11 | — 13 | .55 11 | .55 11 | 6.08 11 |
12/31/2022 | 10.63 | .44 | (1.70 ) | (1.26 ) | (.42 ) | — 9 | (.42 ) | 8.95 | (11.88 )11 | — 13 | .60 11 | .59 11 | 4.64 11 |
12/31/2021 | 10.81 | .38 | (.11 ) | .27 | (.38 ) | (.07 ) | (.45 ) | 10.63 | 2.57 11 | — 13 | .66 11 | .65 11 | 3.54 11 |
12/31/20205,12 | 9.67 | .30 | 1.18 | 1.48 | (.30 ) | (.04 ) | (.34 ) | 10.81 | 15.43 7,11 | — 13 | .82 8,11 | .59 8,11 | 4.29 8,11 |
Class 529-F-2: | |||||||||||||
6/30/20245,6 | 9.32 | .29 | (.05 ) | .24 | (.29 ) | — | (.29 ) | 9.27 | 2.66 7 | 10 | .47 8 | .47 8 | 6.39 8 |
12/31/2023 | 8.95 | .56 | .38 | .94 | (.57 ) | — | (.57 ) | 9.32 | 10.93 | 6 | .45 | .45 | 6.22 |
12/31/2022 | 10.63 | .45 | (1.70 ) | (1.25 ) | (.43 ) | — 9 | (.43 ) | 8.95 | (11.81 ) | 3 | .51 | .50 | 4.75 |
12/31/2021 | 10.81 | .38 | (.11 ) | .27 | (.38 ) | (.07 ) | (.45 ) | 10.63 | 2.59 | 3 | .63 | .63 | 3.55 |
12/31/20205,14 | 10.41 | .07 | .45 | .52 | (.08 ) | (.04 ) | (.12 ) | 10.81 | 4.96 7 | 2 | .12 7 | .11 7 | .65 7 |
Class 529-F-3: | |||||||||||||
6/30/20245,6 | 9.32 | .29 | (.05 ) | .24 | (.29 ) | — | (.29 ) | 9.27 | 2.67 7 | — 13 | .45 8 | .45 8 | 6.40 8 |
12/31/2023 | 8.95 | .56 | .38 | .94 | (.57 ) | — | (.57 ) | 9.32 | 10.92 | — 13 | .45 | .45 | 6.18 |
12/31/2022 | 10.63 | .45 | (1.70 ) | (1.25 ) | (.43 ) | — 9 | (.43 ) | 8.95 | (11.79 ) | — 13 | .49 | .49 | 4.74 |
12/31/2021 | 10.81 | .39 | (.11 ) | .28 | (.39 ) | (.07 ) | (.46 ) | 10.63 | 2.67 | — 13 | .59 | .57 | 3.64 |
12/31/20205,14 | 10.41 | .07 | .45 | .52 | (.08 ) | (.04 ) | (.12 ) | 10.81 | 4.97 7 | — 13 | .14 7 | .10 7 | .66 7 |
Class R-1: | |||||||||||||
6/30/20245,6 | 9.32 | .26 | (.05 ) | .21 | (.26 ) | — | (.26 ) | 9.27 | 2.25 7,11 | — 13 | 1.29 8,11 | 1.29 8,11 | 5.62 8,11 |
12/31/2023 | 8.95 | .49 | .38 | .87 | (.50 ) | — | (.50 ) | 9.32 | 10.10 11 | — 13 | 1.21 11 | 1.21 11 | 5.47 11 |
12/31/2022 | 10.63 | .39 | (1.70 ) | (1.31 ) | (.37 ) | — 9 | (.37 ) | 8.95 | (12.34 )11 | — 13 | 1.11 11 | 1.11 11 | 4.14 11 |
12/31/2021 | 10.81 | .31 | (.10 ) | .21 | (.32 ) | (.07 ) | (.39 ) | 10.63 | 1.97 11 | — 13 | 1.29 11 | 1.28 11 | 2.90 11 |
12/31/20205,12 | 9.67 | .25 | 1.20 | 1.45 | (.27 ) | (.04 ) | (.31 ) | 10.81 | 15.12 7,11 | — 13 | 1.35 8,11 | 1.14 8,11 | 3.62 8,11 |
61 | American Funds Multi-Sector Income Fund |
Income (loss) from investment operations1 | Dividends and distributions | ||||||||||||
Year ended | Net asset value, beginning of year | Net investment income (loss) | Net gains (losses) on securities (both realized and unrealized) | Total from investment operations | Dividends (from net investment income) | Distributions (from capital gains) | Total dividends and distributions | Net asset value, end of year | Total return2,3 | Net assets, end of year (in millions) | Ratio of expenses to average net assets before waivers/ reimburse- ments4 | Ratio of expenses to average net assets after waivers/ reimburse- ments3,4 | Ratio of net income (loss) to average net assets3 |
Class R-2: | |||||||||||||
6/30/20245,6 | $9.32 | $.26 | $(.05 ) | $.21 | $(.26 ) | $— | $(.26 ) | $9.27 | 2.24 %7 | $1 | 1.31 %8 | 1.31 %8 | 5.55 %8 |
12/31/2023 | 8.95 | .48 | .38 | .86 | (.49 ) | — | (.49 ) | 9.32 | 9.91 | 1 | 1.37 | 1.37 | 5.31 |
12/31/2022 | 10.63 | .37 | (1.70 ) | (1.33 ) | (.35 ) | — 9 | (.35 ) | 8.95 | (12.55 ) | 1 | 1.34 | 1.34 | 3.85 |
12/31/2021 | 10.81 | .30 | (.10 ) | .20 | (.31 ) | (.07 ) | (.38 ) | 10.63 | 1.87 | 1 | 1.31 | 1.31 | 2.82 |
12/31/20205,12 | 9.67 | .26 | 1.19 | 1.45 | (.27 ) | (.04 ) | (.31 ) | 10.81 | 15.15 7,11 | — 13 | 1.30 8,11 | 1.09 8,11 | 3.67 8,11 |
Class R-2E: | |||||||||||||
6/30/20245,6 | 9.32 | .29 | (.05 ) | .24 | (.29 ) | — | (.29 ) | 9.27 | 2.57 7,11 | — 13 | .67 8,11 | .67 8,11 | 6.21 8,11 |
12/31/2023 | 8.95 | .56 | .38 | .94 | (.57 ) | — | (.57 ) | 9.32 | 10.94 11 | — 13 | .44 11 | .44 11 | 6.20 11 |
12/31/2022 | 10.63 | .44 | (1.69 ) | (1.25 ) | (.43 ) | — 9 | (.43 ) | 8.95 | (11.79 )11 | — 13 | .50 11 | .49 11 | 4.68 11 |
12/31/2021 | 10.81 | .39 | (.11 ) | .28 | (.39 ) | (.07 ) | (.46 ) | 10.63 | 2.69 11 | — 13 | .54 11 | .54 11 | 3.66 11 |
12/31/20205,12 | 9.67 | .29 | 1.19 | 1.48 | (.30 ) | (.04 ) | (.34 ) | 10.81 | 15.44 7,11 | — 13 | .95 8,11 | .63 8,11 | 4.21 8,11 |
Class R-3: | |||||||||||||
6/30/20245,6 | 9.32 | .27 | (.05 ) | .22 | (.27 ) | — | (.27 ) | 9.27 | 2.40 7 | 3 | .99 8 | .99 8 | 5.87 8 |
12/31/2023 | 8.95 | .51 | .38 | .89 | (.52 ) | — | (.52 ) | 9.32 | 10.31 | 2 | 1.00 | 1.00 | 5.68 |
12/31/2022 | 10.63 | .39 | (1.69 ) | (1.30 ) | (.38 ) | — 9 | (.38 ) | 8.95 | (12.30 ) | 1 | 1.06 | 1.06 | 4.14 |
12/31/2021 | 10.81 | .33 | (.10 ) | .23 | (.34 ) | (.07 ) | (.41 ) | 10.63 | 2.15 | 1 | 1.07 | 1.07 | 3.11 |
12/31/20205,12 | 9.67 | .26 | 1.20 | 1.46 | (.28 ) | (.04 ) | (.32 ) | 10.81 | 15.24 7 | — 13 | 1.11 8 | .99 8 | 3.73 8 |
Class R-4: | |||||||||||||
6/30/20245,6 | 9.32 | .28 | (.05 ) | .23 | (.28 ) | — | (.28 ) | 9.27 | 2.53 7 | 2 | .73 8 | .73 8 | 6.13 8 |
12/31/2023 | 8.95 | .53 | .39 | .92 | (.55 ) | — | (.55 ) | 9.32 | 10.62 | 1 | .73 | .73 | 5.92 |
12/31/2022 | 10.63 | .42 | (1.69 ) | (1.27 ) | (.41 ) | — 9 | (.41 ) | 8.95 | (12.02 ) | 1 | .75 | .75 | 4.34 |
12/31/2021 | 10.81 | .37 | (.11 ) | .26 | (.37 ) | (.07 ) | (.44 ) | 10.63 | 2.44 | 2 | .78 | .77 | 3.44 |
12/31/20205,12 | 9.67 | .26 | 1.21 | 1.47 | (.29 ) | (.04 ) | (.33 ) | 10.81 | 15.38 7 | 2 | .85 8 | .78 8 | 3.69 8 |
Class R-5E: | |||||||||||||
6/30/20245,6 | 9.32 | .29 | (.05 ) | .24 | (.29 ) | — | (.29 ) | 9.27 | 2.63 7 | 1 | .54 8 | .54 8 | 6.31 8 |
12/31/2023 | 8.95 | .55 | .38 | .93 | (.56 ) | — | (.56 ) | 9.32 | 10.83 | 1 | .54 | .54 | 6.13 |
12/31/2022 | 10.63 | .43 | (1.69 ) | (1.26 ) | (.42 ) | — 9 | (.42 ) | 8.95 | (11.88 ) | — 13 | .59 | .59 | 4.49 |
12/31/2021 | 10.81 | .38 | (.11 ) | .27 | (.38 ) | (.07 ) | (.45 ) | 10.63 | 2.60 | 1 | .63 | .63 | 3.56 |
12/31/20205,12 | 9.67 | .29 | 1.19 | 1.48 | (.30 ) | (.04 ) | (.34 ) | 10.81 | 15.45 7 | — 13 | .76 8 | .59 8 | 4.17 8 |
Class R-5: | |||||||||||||
6/30/20245,6 | 9.32 | .30 | (.05 ) | .25 | (.30 ) | — | (.30 ) | 9.27 | 2.69 7 | 1 | .41 8 | .41 8 | 6.45 8 |
12/31/2023 | 8.95 | .56 | .39 | .95 | (.58 ) | — | (.58 ) | 9.32 | 10.99 | 1 | .39 | .39 | 6.25 |
12/31/2022 | 10.63 | .44 | (1.68 ) | (1.24 ) | (.44 ) | — 9 | (.44 ) | 8.95 | (11.77 ) | — 13 | .48 | .48 | 4.58 |
12/31/2021 | 10.81 | .39 | (.11 ) | .28 | (.39 ) | (.07 ) | (.46 ) | 10.63 | 2.69 | — 13 | .51 | .51 | 3.64 |
12/31/20205,12 | 9.67 | .30 | 1.19 | 1.49 | (.31 ) | (.04 ) | (.35 ) | 10.81 | 15.50 7 | — 13 | .82 8 | .53 8 | 4.23 8 |
Class R-6: | |||||||||||||
6/30/20245,6 | 9.32 | .30 | (.05 ) | .25 | (.30 ) | — | (.30 ) | 9.27 | 2.71 7 | 10,017 | .38 8 | .38 8 | 6.48 8 |
12/31/2023 | 8.95 | .56 | .39 | .95 | (.58 ) | — | (.58 ) | 9.32 | 11.01 | 9,174 | .38 | .38 | 6.29 |
12/31/2022 | 10.63 | .48 | (1.72 ) | (1.24 ) | (.44 ) | — 9 | (.44 ) | 8.95 | (11.72 ) | 6,532 | .39 | .39 | 5.21 |
12/31/2021 | 10.81 | .39 | (.10 ) | .29 | (.40 ) | (.07 ) | (.47 ) | 10.63 | 2.74 | 1,457 | .47 | .47 | 3.61 |
12/31/2020 | 10.32 | .44 | .68 | 1.12 | (.46 ) | (.17 ) | (.63 ) | 10.81 | 11.32 | 1 | .69 | .52 | 4.17 |
12/31/20195,10 | 10.00 | .36 | .40 | .76 | (.34 ) | (.10 ) | (.44 ) | 10.32 | 7.72 7,11 | — 13 | .64 8,11 | .56 8,11 | 4.57 8,11 |
American Funds Multi-Sector Income Fund | 62 |
Six months ended June 30, 20245,6,7 | Year ended December 31, | For the period ended December 31, 20195, 10 | ||||
2023 | 2022 | 2021 | 2020 | |||
Portfolio turnover rate for all share classes15 | 41 % | 62 % | 40 % | 36 % | 73 % | 115 % |
1 | Based on average shares outstanding. |
2 | Total returns exclude any applicable sales charges, including contingent deferred sales charges. |
3 | This column reflects the impact, if any, of certain waivers/reimbursements from CRMC and/or AFS. During one of the years shown, CRMC waived a portion of investment advisory services fees. In addition, during one of the years shown, AFS waived a portion of transfer agent services fees for Class F-3 shares. In addition, during some of the years shown, CRMC reimbursed a portion of transfer agent services fees for certain share classes and/or reimbursed a portion of miscellaneous fees and expenses. |
4 | Ratios do not include expenses of any Central Funds. The fund indirectly bears its proportionate share of the expenses of any Central Funds. |
5 | Based on operations for a period that is less than a full year. |
6 | Unaudited. |
7 | Not annualized. |
8 | Annualized. |
9 | Amount less than $.01. |
10 | For the period March 22, 2019, commencement of operations, through December 31, 2019. |
11 | All or a significant portion of assets in this class consisted of seed capital invested by CRMC and/or its affiliates. Fees for distribution services are not charged or accrued on these seed capital assets. If such fees were paid by the fund on seed capital assets, fund expenses would have been higher and net income and total return would have been lower. |
12 | This share class began investment operations on May 1, 2020. |
13 | Amount less than $1 million. |
14 | Class 529-F-2 and 529-F-3 shares began investment operations on October 30, 2020. |
15 | Rate does not include the fund’s portfolio activity with respect to any Central Funds. |
63 | American Funds Multi-Sector Income Fund |
American Funds Multi-Sector Income Fund | 64 |
65 | American Funds Multi-Sector Income Fund |
American Funds Multi-Sector Income Fund | 66 |
ITEM 8 - Changes in and Disagreements with Accountants for Open-End Management Investment Companies
Not applicable
ITEM 9 - Proxy Disclosures for Open-End Management Investment Companies
Not applicable
ITEM 10 - Remuneration Paid to Directors, Officers, and Others of Open-End Management Investment Companies
The information is included as part of the material filed under Item 7 of this Form.
ITEM 11 - Statement Regarding Basis for Approval of Investment Advisory Contract
The information is included as part of the material filed under Item 7 of this Form.
ITEM 12 - Disclosure of Proxy Voting Policies and Procedures for Closed-End Management Investment Companies
Not applicable to this Registrant, insofar as the Registrant is not a closed-end management investment company.
ITEM 13 - Portfolio Managers of Closed-End Management Investment Companies
Not applicable to this Registrant, insofar as the Registrant is not a closed-end management investment company.
ITEM 14 - Purchases of Equity Securities by Closed-End Management Investment Company and Affiliated Purchasers
Not applicable to this Registrant, insofar as the Registrant is not a closed-end management investment company.
ITEM 15 - Submission of Matters to a Vote of Security Holders
There have been no material changes to the procedures by which shareholders may recommend nominees to the Registrant’s board of trustees since the Registrant last submitted a proxy statement to its shareholders. The procedures are as follows. The Registrant has a nominating and governance committee comprised solely of persons who are not considered ‘‘interested persons’’ of the Registrant within the meaning of the Investment Company Act of 1940, as amended. The committee periodically reviews such issues as the board’s composition, responsibilities, committees, compensation and other relevant issues, and recommends any appropriate changes to the full board of trustees. While the committee normally is able to identify from its own resources an ample number of qualified candidates, it will consider shareholder suggestions of persons to be considered as nominees to fill future vacancies on the board. Such suggestions must be sent in writing to the nominating and governance committee of the Registrant, c/o the Registrant’s Secretary, and must be accompanied by complete biographical and occupational data on the prospective nominee, along with a written consent of the prospective nominee for consideration of his or her name by the nominating and governance committee.
ITEM 16 - Controls and Procedures
(a) The Registrant’s Principal Executive Officer and Principal Financial Officer have concluded, based on their evaluation of the Registrant’s disclosure controls and procedures (as such term is defined in Rule 30a-3 under the Investment Company Act of 1940), that such controls and procedures are adequate and reasonably designed to achieve the purposes described in paragraph (c) of such rule.
(b) There were no changes in the Registrant’s internal controls over financial reporting (as defined in Rule 30a-3(d) under the Investment Company Act of 1940) that occurred during the Registrant’s semi-annual period covered by this report that has materially affected, or is reasonably likely to materially affect, the Registrant’s internal control over financial reporting.
ITEM 17 - Disclosure of Securities Lending Activities for Closed-End Management Investment Companies
Not applicable to this Registrant, insofar as the Registrant is not a closed-end management investment company.
ITEM 18 - Recovery of Erroneously Awarded Compensation
Not applicable
SIGNATURES
Pursuant to the requirements of the Securities Exchange Act of 1934 and the Investment Company Act of 1940, the Registrant has duly caused this report to be signed on its behalf by the undersigned, thereunto duly authorized.
American Funds Multi-Sector Income Fund
By /s/ Kristine M. Nishiyama
Kristine M. Nishiyama,
Principal Executive Officer
Date: August 30, 2024
Pursuant to the requirements of the Securities Exchange Act of 1934 and the Investment Company Act of 1940, this report has been signed below by the following persons on behalf of the Registrant and in the capacities and on the dates indicated.
By /s/ Kristine M. Nishiyama
Kristine M. Nishiyama,
Principal Executive Officer
Date: August 30, 2024
By /s/ Becky L. Park
Becky L. Park, Treasurer and
Principal Financial Officer
Date: August 30, 2024