UNITED STATES
SECURITIES AND EXCHANGE COMMISSION
Washington, D.C. 20549
FORM N-CSR
Certified Shareholder Report of
Registered Management Investment Companies
Investment Company Act File Number: 811-23409
American Funds Multi-Sector Income Fund
(Exact Name of Registrant as Specified in Charter)
6455 Irvine Center Drive
Irvine, California 92618
(Address of Principal Executive Offices)
Registrant's telephone number, including area code: (949) 975-5000
Date of fiscal year end: December 31
Date of reporting period: June 30, 2019
Brian C. Janssen
American Funds Multi-Sector Income Fund
6455 Irvine Center Drive
Irvine, California 92618
(Name and Address of Agent for Service)
ITEM 1 – Reports to Stockholders
American Funds Multi-Sector
Income FundSM |  |
| |
First report to investors
for the period ended
June 30, 2019 |

Pursuing
consistent and
diversified income
Beginning January 1, 2021, as permitted by regulations adopted by the U.S. Securities and Exchange Commission, we intend to no longer mail paper copies of the fund’s shareholder reports, unless specifically requested from American Funds or your financial intermediary, such as a broker-dealer or bank. Instead, the reports will be made available on the American Funds website (americanfunds.com); you will be notified by mail and provided with a website link to access the report each time a report is posted. If you have already elected to receive shareholder reports electronically, you will not be affected by this change and do not need to take any action. If you prefer to receive shareholder reports and other communications electronically, you may update your mailing preferences with your financial intermediary, or enroll in e-delivery at americanfunds.com (for accounts held directly with the fund).
You may elect to receive paper copies of all future reports free of charge. If you invest through a financial intermediary, you may contact your financial intermediary to request that you continue to receive paper copies of your shareholder reports. If you invest directly with the fund, you may inform American Funds that you wish to continue receiving paper copies of your shareholder reports by contacting us at (800) 421-4225. Your election to receive paper reports will apply to all funds held with American Funds or through your financial intermediary.
American Funds Multi-Sector Income Fund seeks to provide a high level of current income. Its secondary investment objective is capital appreciation.
This fund is one of more than 40 offered by Capital Group, home of American Funds, one of the nation’s largest mutual fund families. For more than 85 years, Capital Group has invested with a long-term focus based on thorough research and attention to risk.
Fund results shown in this report, unless otherwise indicated, are for Class A shares at net asset value. If a sales charge (maximum 3.75%) had been deducted, the results would have been lower. Results are for past periods and are not predictive of results for future periods. Current and future results may be lower or higher than those shown. Share prices and returns will vary, so investors may lose money. Investing for short periods makes losses more likely. For current information and month-end results, visit americanfunds.com.
Here is the average annual total return on a $1,000 investment with all distributions reinvested for the period ended June 30, 2019:
| Class A shares | | Lifetime
(Since 3/22/2019) |
| | | | | |
| Reflecting 3.75% maximum sales charge | | | 0.13% | |
For other share class results, visit americanfunds.com and americanfundsretirement.com.
The total annual fund operating expense ratio was 0.89% for Class A shares as of the prospectus dated March 22, 2019.
Investment results assume all distributions are reinvested and reflect applicable fees and expenses. When applicable, investment results reflect fee waivers, without which results would have been lower. Visit americanfunds.com for more information.
The fund’s 30-day yield for Class A shares as of July 31, 2019, reflecting the 3.75% maximum sales charge and calculated in accordance with the U.S. Securities and Exchange Commission formula, was 4.80%.
Investing outside the United States may be subject to risks, such as currency fluctuations, periods of illiquidity and price volatility. These risks may be heightened in connection with investments in developing countries. The return of principal for bond funds and for funds with significant underlying bond holdings is not guaranteed. Fund shares are subject to the same interest rate, inflation and credit risks associated with the underlying bond holdings. Investments in mortgage-related securities involve additional risks, such as prepayment risk, as more fully described in the prospectus. Lower rated bonds are subject to greater fluctuations in value and risk of loss of income and principal than higher rated bonds. The use of derivatives involves a variety of risks, which may be different from, or greater than, the risks associated with investing in traditional cash securities, such as stocks and bonds. Refer to the fund prospectus and the Risk Factors section of this report for more information on these and other risks associated with investing in the fund.
Investments are not FDIC-insured, nor are they deposits of or guaranteed by a bank or any other entity, so they may lose value.
| Investment portfolio June 30, 2019 | unaudited |
| | |
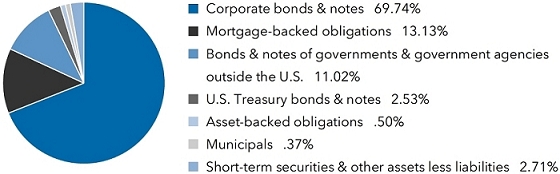
| Portfolio by type of security | Percent of net assets |
| Portfolio quality summary* | | Percent of
net assets |
| U.S. Treasury and agency† | | | 2.53 | % |
| AAA/Aaa | | | 2.66 | |
| AA/Aa | | | 5.86 | |
| A/A | | | 17.35 | |
| BBB/Baa | | | 18.36 | |
| Below investment grade | | | 50.53 | |
| Short-term securities & other assets less liabilities | | | 2.71 | |
| * | Bond ratings, which typically range from AAA/Aaa (highest) to D (lowest), are assigned by credit rating agencies such as Standard & Poor’s, Moody’s and/or Fitch as an indication of an issuer’s creditworthiness. In assigning a credit rating to a security, the fund looks specifically to the ratings assigned to the issuer of the security by Standard & Poor’s, Moody’s and/or Fitch. If agency ratings differ, the security will be considered to have received the highest of those ratings, consistent with the fund’s investment policies. |
| † | These securities are guaranteed by the full faith and credit of the U.S. government. |
| Bonds, notes & other debt instruments 97.29% | | Principal amount
(000) | | | Value
(000) | |
| Corporate bonds & notes 69.74% | | | | | | | | |
| Industrials 8.17% | | | | | | | | |
| Allison Transmission Holdings, Inc. 5.00% 20241 | | $ | 50 | | | $ | 51 | |
| Allison Transmission Holdings, Inc. 5.875% 20291 | | | 120 | | | | 127 | |
| ARAMARK Corp. 5.125% 2024 | | | 90 | | | | 93 | |
| Ashtead Group PLC 4.125% 20251 | | | 200 | | | | 203 | |
| Associated Materials, LLC 9.00% 20241 | | | 158 | | | | 150 | |
| Avolon Holdings Funding Ltd. 3.95% 20241 | | | 178 | | | | 183 | |
| Avolon Holdings Funding Ltd. 4.375% 20261 | | | 125 | | | | 129 | |
| Beacon Roofing Supply, Inc. 4.875% 20251 | | | 220 | | | | 219 | |
| Boeing Co. 2.70% 2022 | | | 130 | | | | 132 | |
| Boeing Co. 3.10% 2026 | | | 84 | | | | 87 | |
| Boeing Co. 3.20% 2029 | | | 35 | | | | 36 | |
| Boeing Co. 3.60% 2034 | | | 80 | | | | 84 | |
| Boeing Co. 3.90% 2049 | | | 80 | | | | 84 | |
| CSX Corp. 4.50% 2049 | | | 25 | | | | 28 | |
| Dun & Bradstreet Corp. 6.875% 20261 | | | 175 | | | | 185 | |
| Dun & Bradstreet Corp. 10.25% 20271 | | | 195 | | | | 208 | |
| Harsco Corp. 5.75% 20271 | | | 20 | | | | 21 | |
| JELD-WEN Holding, Inc. 4.875% 20271 | | | 65 | | | | 63 | |
| KAR Auction Services, Inc. 5.125% 20251 | | | 55 | | | | 56 | |
| Kratos Defense & Security Solutions, Inc. 6.50% 20251 | | | 225 | | | | 242 | |
| LABL Escrow Issuer, LLC 6.75% 20261 | | | 100 | | | | 101 | |
| LABL Escrow Issuer, LLC 10.50% 20271 | | | 45 | | | | 45 | |
| LSC Communications, Inc. 8.75% 20231 | | | 50 | | | | 48 | |
| Mexican Government 5.50% 2047 | | | 200 | | | | 200 | |
| Pisces Parent LLC 8.00% 20261 | | | 200 | | | | 195 | |
| Pisces Parent LLC, Term Loan B, (3-month USD-LIBOR + 3.75%) 6.354% 20252,3 | | | 149 | | | | 146 | |
| PrimeSource Building Products Inc. 9.00% 20231 | | | 225 | | | | 211 | |
| Rexnord Corp. 4.875% 20251 | | | 100 | | | | 102 | |
| Sensata Technologies Holding BV 4.875% 20231 | | | 25 | | | | 26 | |
| Uber Technologies, Inc. 8.00% 20261 | | | 185 | | | | 198 | |
| Union Pacific Corp. 4.30% 2049 | | | 75 | | | | 83 | |
| United Parcel Service, Inc. 4.25% 2049 | | | 20 | | | | 22 | |
| American Funds Multi-Sector Income Fund | 1 |
| Bonds, notes & other debt instruments (continued) | | Principal amount
(000) | | | Value
(000) | |
| Corporate bonds & notes (continued) | | | | | | |
| Industrials (continued) | | | | | | |
| United Rentals, Inc. 4.625% 2025 | | $ | 65 | | | $ | 66 | |
| Virgin Australia Holdings Ltd. 7.875% 20211 | | | 100 | | | | 103 | |
| Westinghouse Air Brake Technologies Corp. 4.40% 20244 | | | 258 | | | | 273 | |
| | | | | | | | 4,200 | |
| | | | | | | | | |
| Energy 8.14% | | | | | | | | |
| Apache Corp. 4.25% 2030 | | | 30 | | | | 31 | |
| Apache Corp. 5.35% 2049 | | | 125 | | | | 132 | |
| Ascent Resources - Utica LLC 7.00% 20261 | | | 50 | | | | 46 | |
| Baker Hughes, a GE Co. 3.337% 2027 | | | 35 | | | | 35 | |
| Berry Petroleum Corp. 7.00% 20261 | | | 30 | | | | 29 | |
| BP Capital Markets PLC 4.234% 2028 | | | 95 | | | | 106 | |
| California Resources Corp., Term Loan B, (3-month USD-LIBOR + 4.75%) 7.152% 20222,3 | | | 35 | | | | 33 | |
| Canadian Natural Resources Ltd. 4.95% 2047 | | | 65 | | | | 74 | |
| Cenovus Energy Inc. 3.80% 2023 | | | 30 | | | | 31 | |
| Cenovus Energy Inc. 4.25% 2027 | | | 135 | | | | 140 | |
| Cenovus Energy Inc. 5.40% 2047 | | | 35 | | | | 38 | |
| Centennial Resource Production, LLC 6.875% 20271 | | | 30 | | | | 30 | |
| Cheniere Energy, Inc. 7.00% 2024 | | | 100 | | | | 115 | |
| Chesapeake Energy Corp. 8.00% 2025 | | | 30 | | | | 28 | |
| Denbury Resources Inc. 9.00% 20211 | | | 60 | | | | 59 | |
| Diamond Offshore Drilling, Inc. 7.875% 2025 | | | 30 | | | | 29 | |
| Enbridge Energy Partners, LP 7.375% 2045 | | | 40 | | | | 59 | |
| Energy Transfer Partners, LP 6.125% 2045 | | | 20 | | | | 23 | |
| Energy Transfer Partners, LP 5.30% 2047 | | | 35 | | | | 37 | |
| Energy Transfer Partners, LP 6.00% 2048 | | | 80 | | | | 91 | |
| Energy Transfer Partners, LP 6.25% 2049 | | | 60 | | | | 71 | |
| Ensco PLC 7.75% 2026 | | | 30 | | | | 23 | |
| Enterprise Products Operating LLC 4.20% 2050 | | | 40 | | | | 41 | |
| Equinor ASA 3.625% 2028 | | | 35 | | | | 38 | |
| Jagged Peak Energy LLC 5.875% 2026 | | | 15 | | | | 15 | |
| Matador Resources Co. 5.875% 2026 | | | 75 | | | | 76 | |
| Nabors Industries Inc. 5.75% 2025 | | | 50 | | | | 45 | |
| NGL Energy Partners LP 7.50% 2023 | | | 25 | | | | 26 | |
| NuStar Logistics, LP 6.00% 2026 | | | 80 | | | | 83 | |
| Oasis Petroleum Inc. 6.25% 20261 | | | 185 | | | | 180 | |
| Peabody Energy Corp. 6.00% 20221 | | | 50 | | | | 51 | |
| Petrobras Global Finance Co. 6.125% 2022 | | | 80 | | | | 86 | |
| Petrobras Global Finance Co. 5.75% 2029 | | | 200 | | | | 209 | |
| Petróleos Mexicanos 3.50% 2023 | | | 150 | | | | 143 | |
| Petróleos Mexicanos 5.35% 2028 | | | 150 | | | | 137 | |
| Petróleos Mexicanos 6.50% 2029 | | | 125 | | | | 121 | |
| Petróleos Mexicanos 5.625% 2046 | | | 50 | | | | 41 | |
| QEP Resources, Inc. 5.25% 2023 | | | 20 | | | | 19 | |
| QEP Resources, Inc. 5.625% 2026 | | | 235 | | | | 222 | |
| Range Resources Corp. 5.00% 2023 | | | 75 | | | | 71 | |
| Range Resources Corp. 4.875% 2025 | | | 150 | | | | 132 | |
| Sanchez Energy Corp. 7.25% 20231 | | | 30 | | | | 23 | |
| Seven Generations Energy Ltd. 5.375% 20251 | | | 50 | | | | 48 | |
| SM Energy Co. 6.125% 2022 | | | 60 | | | | 60 | |
| SM Energy Co. 5.625% 2025 | | | 30 | | | | 27 | |
| SM Energy Co. 6.625% 2027 | | | 175 | | | | 163 | |
| Southwestern Energy Co. 7.50% 2026 | | | 50 | | | | 48 | |
| Sunoco LP 4.875% 2023 | | | 45 | | | | 46 | |
| Sunoco LP 6.00% 20271 | | | 40 | | | | 42 | |
| Targa Resources Partners LP 6.50% 20271 | | | 15 | | | | 16 | |
| Targa Resources Partners LP 6.875% 20291 | | | 15 | | | | 17 | |
| Teekay Corp. 9.25% 20221 | | | 80 | | | | 81 | |
| Total Capital International 3.455% 2029 | | | 75 | | | | 80 | |
| TransCanada PipeLines Ltd. 4.25% 2028 | | | 75 | | | | 81 | |
| Transocean Guardian Ltd. 5.875% 20241 | | | 38 | | | | 39 | |
| Transocean Inc. 8.375% 20214 | | | 80 | | | | 85 | |
| Transocean Inc. 9.00% 20231 | | | 50 | | | | 53 | |
| Transocean Inc. 6.125% 20251 | | | 38 | | | | 39 | |
| Transocean Poseidon Ltd. 6.875% 20271 | | | 40 | | | | 42 | |
| Whiting Petroleum Corp. 6.625% 2026 | | | 205 | | | | 199 | |
| | | | | | | | 4,185 | |
| 2 | American Funds Multi-Sector Income Fund |
| Bonds, notes & other debt instruments(continued) | | Principal amount
(000) | | | Value
(000) | |
| Corporate bonds & notes (continued) | | | | | | |
| Consumer discretionary 8.06% | | | | | | |
| Adient US LLC 7.00% 20261 | | $ | 60 | | | $ | 62 | |
| Allied Universal Holdco LLC 6.625% 20261 | | | 30 | | | | 31 | |
| Allied Universal Holdco LLC 9.75% 20271 | | | 135 | | | | 135 | |
| Bayerische Motoren Werke AG 2.95% 20221 | | | 200 | | | | 203 | |
| Bayerische Motoren Werke AG 3.15% 20241 | | | 35 | | | | 36 | |
| Cedar Fair, LP 5.25% 20291 | | | 10 | | | | 10 | |
| Churchill Downs Inc. 4.75% 20281 | | | 75 | | | | 76 | |
| Cirsa Gaming Corp. SA 7.875% 20231 | | | 300 | | | | 319 | |
| Fertitta Entertainment, Inc. 8.75% 20251 | | | 200 | | | | 210 | |
| General Motors Co. 5.20% 2045 | | | 75 | | | | 72 | |
| General Motors Co. 5.95% 2049 | | | 35 | | | | 37 | |
| Goodyear Tire & Rubber Co. 5.125% 2023 | | | 40 | | | | 41 | |
| Goodyear Tire & Rubber Co. 4.875% 2027 | | | 10 | | | | 10 | |
| Hanesbrands Inc. 4.875% 20261 | | | 125 | | | | 130 | |
| Hilton Worldwide Holdings Inc. 4.875% 20301 | | | 65 | | | | 67 | |
| Home Depot, Inc. 4.50% 2048 | | | 20 | | | | 24 | |
| Levi Strauss & Co. 5.00% 2025 | | | 75 | | | | 78 | |
| Lowe’s Companies, Inc. 3.65% 2029 | | | 40 | | | | 42 | |
| Lowe’s Companies, Inc. 4.55% 2049 | | | 10 | | | | 11 | |
| Merlin Entertainment 5.75% 20261 | | | 200 | | | | 211 | |
| MGM Resorts International 7.75% 2022 | | | 25 | | | | 28 | |
| MGM Resorts International 6.00% 2023 | | | 85 | | | | 92 | |
| MGM Resorts International 5.50% 2027 | | | 85 | | | | 89 | |
| Neiman Marcus Group Ltd. LLC 8.00% 20241 | | | 90 | | | | 37 | |
| Neiman Marcus Group Ltd. LLC 14.00% 20241,5 | | | 65 | | | | 54 | |
| Neiman Marcus Group Ltd. LLC, Term Loan B, (3-month USD-LIBOR + 6.00%) 8.421% 20232,3,5,6 | | | 55 | | | | 47 | |
| Panther BF Aggregator 2, LP 8.50% 20271 | | | 80 | | | | 83 | |
| PetSmart, Inc. 7.125% 20231 | | | 150 | | | | 141 | |
| PetSmart, Inc. 5.875% 20251 | | | 75 | | | | 73 | |
| PetSmart, Inc. 8.875% 20251 | | | 150 | | | | 145 | |
| Sally Holdings LLC and Sally Capital Inc. 5.625% 2025 | | | 100 | | | | 98 | |
| Sands China Ltd. 4.60% 2023 | | | 200 | | | | 210 | |
| Scientific Games Corp. 8.25% 20261 | | | 225 | | | | 237 | |
| Six Flags Entertainment Corp. 4.875% 20241 | | | 150 | | | | 153 | |
| Sotheby’s 4.875% 20251 | | | 150 | | | | 153 | |
| Staples, Inc. 7.50% 20261 | | | 150 | | | | 149 | |
| Twin River Worldwide Holdings, Inc. 6.75% 20271 | | | 40 | | | | 42 | |
| Volkswagen Group of America Finance, LLC 4.75% 20281 | | | 200 | | | | 218 | |
| William Carter Co. 5.625% 20271 | | | 40 | | | | 42 | |
| Wyndham Worldwide Corp. 5.375% 20261 | | | 50 | | | | 53 | |
| Wynn Las Vegas, LLC and Wynn Capital Corp. 4.25% 20231 | | | 75 | | | | 75 | |
| Wynn Las Vegas, LLC and Wynn Capital Corp. 5.25% 20271 | | | 120 | | | | 121 | |
| | | | | | | | 4,145 | |
| | | | | | | | | |
| Financials 7.66% | | | | | | | | |
| Alliant Holdings Intermediate LLC 8.25% 20231 | | | 40 | | | | 41 | |
| Allstate Corp. 3.85% 2049 | | | 20 | | | | 21 | |
| Ally Financial Inc. 8.00% 2031 | | | 70 | | | | 93 | |
| AssuredPartners, Inc. 8.00% 20271 | | | 75 | | | | 76 | |
| Bank of America Corp. 3.458% 2025 (3-month USD-LIBOR + 0.97% on 3/15/2024)4 | | | 275 | | | | 285 | |
| Bank of America Corp. 3.974% 2030 | | | 100 | | | | 107 | |
| Bank of Montreal 2.50% 2024 | | | 110 | | | | 110 | |
| CIT Group Inc. 4.125% 2021 | | | 50 | | | | 51 | |
| Citigroup Inc. 3.98% 2030 (3-month USD-LIBOR + 1.023% on 3/20/2029)4 | | | 110 | | | | 118 | |
| Compass Diversified Holdings 8.00% 20261 | | | 75 | | | | 78 | |
| Danske Bank AS 3.875% 20231 | | | 300 | | | | 306 | |
| Fairstone Financial Inc. 7.875% 20241 | | | 72 | | | | 74 | |
| FS Energy and Power Fund 7.50% 20231 | | | 230 | | | | 234 | |
| Goldman Sachs Group, Inc. 2.55% 2019 | | | 125 | | | | 125 | |
| HSBC Holdings PLC 3.973% 2030 (3-month USD-LIBOR + 1.61% on 5/22/2029)4 | | | 200 | | | | 209 | |
| HUB International Ltd. 7.00% 20261 | | | 180 | | | | 183 | |
| JPMorgan Chase & Co. (3-month USD-LIBOR + 0.59%) 2.933% 20193 | | | 400 | | | | 400 | |
| JPMorgan Chase & Co. 3.702% 2030 (3-month USD-LIBOR + 1.16% on 5/6/2029)4 | | | 160 | | | | 169 | |
| Marsh & McLennan Companies, Inc. 4.375% 2029 | | | 95 | | | | 105 | |
| Metropolitan Life Global Funding I 2.40% 20211 | | | 150 | | | | 150 | |
| Solenis International, LP, Term Loan, (3-month USD-LIBOR + 4.00%) 6.33% 20252,3 | | | 80 | | | | 79 | |
| American Funds Multi-Sector Income Fund | 3 |
| Bonds, notes & other debt instruments (continued) | | Principal amount
(000) | | | Value
(000) | |
| Corporate bonds & notes (continued) | | | | | | |
| Financials (continued) | | | | | | |
| Toronto-Dominion Bank 2.65% 2024 | | $ | 50 | | | $ | 50 | |
| Travelers Companies, Inc. 4.10% 2049 | | | 20 | | | | 23 | |
| UniCredit SpA 4.625% 20271 | | | 250 | | | | 253 | |
| Wells Fargo & Co. 2.15% 2020 | | | 600 | | | | 600 | |
| | | | | | | | 3,940 | |
| | | | | | | | | |
| Health care 7.00% | | | | | | | | |
| AbbVie Inc. 4.45% 2046 | | | 95 | | | | 93 | |
| AstraZeneca PLC 3.375% 2025 | | | 110 | | | | 115 | |
| Auris Luxembourg III SARL, Term Loan, (3-month USD-LIBOR + 3.75%) 6.152% 20262,3 | | | 50 | | | | 50 | |
| Becton, Dickinson and Co. 3.70% 2027 | | | 33 | | | | 34 | |
| Boston Scientific Corp. 3.75% 2026 | | | 45 | | | | 48 | |
| Boston Scientific Corp. 4.70% 2049 | | | 5 | | | | 6 | |
| Bristol-Myers Squibb Co. 4.125% 20391 | | | 116 | | | | 126 | |
| Catalent Pharma Solutions Inc. 5.00% 20271 | | | 10 | | | | 10 | |
| Charles River Laboratories International, Inc. 5.50% 20261 | | | 45 | | | | 47 | |
| Cigna Corp. 4.375% 20281 | | | 150 | | | | 162 | |
| Cigna Corp. 4.80% 20381 | | | 60 | | | | 65 | |
| Cigna Corp. 4.90% 20481 | | | 75 | | | | 82 | |
| CVS Health Corp. 4.30% 2028 | | | 50 | | | | 53 | |
| CVS Health Corp. 4.78% 2038 | | | 80 | | | | 84 | |
| Eagle Holding Co. II LLC 7.625% 20221,5 | | | 25 | | | | 25 | |
| Eagle Holding Co. II LLC 7.75% 20221,5 | | | 80 | | | | 81 | |
| HCA Inc. 5.875% 2023 | | | 75 | | | | 82 | |
| HCA Inc. 5.375% 2026 | | | 75 | | | | 81 | |
| HCA Inc. 4.125% 2029 | | | 15 | | | | 15 | |
| HCA Inc. 5.25% 2049 | | | 45 | | | | 47 | |
| inVentiv Health, Inc. 7.50% 20241 | | | 50 | | | | 53 | |
| Jaguar Holding Co. 6.375% 20231 | | | 60 | | | | 62 | |
| Kinetic Concepts, Inc. 12.50% 20211 | | | 160 | | | | 177 | |
| Merck & Co., Inc. 3.40% 2029 | | | 30 | | | | 32 | |
| Molina Healthcare, Inc. 5.375% 2022 | | | 100 | | | | 104 | |
| NVA Holdings Inc. 6.875% 20261 | | | 75 | | | | 79 | |
| Par Pharmaceutical Companies Inc. 7.50% 20271 | | | 30 | | | | 30 | |
| PAREXEL International Corp. 6.375% 20251 | | | 100 | | | | 93 | |
| Pfizer Inc. 3.45% 2029 | | | 40 | | | | 42 | |
| Pfizer Inc. 4.00% 2049 | | | 10 | | | | 11 | |
| Prestige Brands International Inc. 6.375% 20241 | | | 30 | | | | 32 | |
| Quintiles Transnational Corp. 4.875% 20231 | | | 80 | | | | 82 | |
| Sotera Health Topco, Inc. 8.125% 20211,5 | | | 20 | | | | 20 | |
| Sterigenics-Nordion Holdings, LLC 6.50% 20231 | | | 35 | | | | 36 | |
| Surgery Center Holdings 10.00% 20271 | | | 35 | | | | 35 | |
| Takeda Pharmaceutical Co., Ltd. 5.00% 20281 | | | 280 | | | | 317 | |
| Tenet Healthcare Corp. 4.50% 2021 | | | 25 | | | | 25 | |
| Tenet Healthcare Corp. 4.625% 2024 | | | 50 | | | | 51 | |
| Teva Pharmaceutical Finance Co. BV 3.15% 2026 | | | 475 | | | | 371 | |
| Teva Pharmaceutical Finance Co. BV 6.75% 2028 | | | 200 | | | | 185 | |
| UnitedHealth Group Inc. 4.45% 2048 | | | 15 | | | | 17 | |
| Valeant Pharmaceuticals International, Inc. 6.125% 20251 | | | 155 | | | | 158 | |
| Valeant Pharmaceuticals International, Inc. 9.00% 20251 | | | 100 | | | | 112 | |
| Valeant Pharmaceuticals International, Inc. 9.25% 20261 | | | 75 | | | | 84 | |
| Valeant Pharmaceuticals International, Inc. 8.50% 20271 | | | 75 | | | | 83 | |
| Vizient Inc. 6.25% 20271 | | | 5 | | | | 5 | |
| | | | | | | | 3,602 | |
| | | | | | | | | |
| Materials 6.85% | | | | | | | | |
| AK Steel Holding Corp. 7.50% 2023 | | | 50 | | | | 51 | |
| Axalta Coating Systems LLC 4.875% 20241 | | | 150 | | | | 155 | |
| Ball Corp. 5.00% 2022 | | | 70 | | | | 74 | |
| Berry Global Escrow Corp. 4.875% 20261 | | | 100 | | | | 102 | |
| BWAY Parent Co., Inc. 5.50% 20241 | | | 75 | | | | 75 | |
| Chemours Co. 5.375% 2027 | | | 100 | | | | 96 | |
| Cleveland-Cliffs Inc. 4.875% 20241 | | | 55 | | | | 56 | |
| Cleveland-Cliffs Inc. 5.875% 20271 | | | 40 | | | | 39 | |
| CVR Partners, LP 9.25% 20231 | | | 100 | | | | 105 | |
| Cydsa, S.A.B. de C.V. 6.25% 2027 | | | 200 | | | | 201 | |
| Dow Chemical Co. 4.80% 20491 | | | 140 | | | | 151 | |
| 4 | American Funds Multi-Sector Income Fund |
| Bonds, notes & other debt instruments (continued) | | Principal amount
(000) | | | Value
(000) | |
| Corporate bonds & notes (continued) | | | | | | |
| Materials (continued) | | | | | | |
| DowDuPont Inc. 5.419% 2048 | | $ | 25 | | | $ | 31 | |
| First Quantum Minerals Ltd. 7.50% 20251 | | | 520 | | | | 497 | |
| Freeport-McMoRan Inc. 3.55% 2022 | | | 85 | | | | 85 | |
| Freeport-McMoRan Inc. 3.875% 2023 | | | 55 | | | | 55 | |
| FXI Holdings, Inc. 7.875% 20241 | | | 275 | | | | 257 | |
| Greif, Inc. 6.50% 20271 | | | 25 | | | | 26 | |
| H.I.G. Capital, LLC 6.75% 20241 | | | 30 | | | | 28 | |
| Hexion Inc. 10.00% 20207 | | | 90 | | | | 71 | |
| Hexion Inc. 10.375% 20221 | | | 95 | | | | 73 | |
| Hexion Inc. 7.875% 20271 | | | 95 | | | | 96 | |
| Hexion Inc., Term Loan, (3-month USD-LIBOR + 2.75%) 5.08% 20202,3 | | | 30 | | | | 30 | |
| INEOS Group Holdings SA 5.625% 20241 | | | 200 | | | | 205 | |
| LSB Industries, Inc. 9.625% 20231 | | | 155 | | | | 159 | |
| Mineral Resources Ltd. 8.125% 20271 | | | 50 | | | | 52 | |
| Owens-Illinois, Inc. 5.875% 20231 | | | 120 | | | | 130 | |
| Platform Specialty Products Corp. 5.875% 20251 | | | 35 | | | | 37 | |
| Reynolds Group Inc. 7.00% 20241 | | | 75 | | | | 78 | |
| Sealed Air Corp. 5.25% 20231 | | | 25 | | | | 26 | |
| Sherwin-Williams Co. 4.50% 2047 | | | 30 | | | | 32 | |
| Starfruit US Holdco LLC 8.00% 20261 | | | 150 | | | | 155 | |
| Summit Materials, Inc. 6.125% 2023 | | | 20 | | | | 20 | |
| Summit Materials, Inc. 6.50% 20271 | | | 50 | | | | 52 | |
| Tronox Ltd. 5.75% 20251 | | | 30 | | | | 29 | |
| Tronox Ltd. 6.50% 20261 | | | 120 | | | | 119 | |
| Venator Materials Corp. 5.75% 20251 | | | 80 | | | | 74 | |
| | | | | | | | 3,522 | |
| | | | | | | | | |
| Communication services 6.59% | | | | | | | | |
| AT&T Inc. 4.35% 2029 | | | 115 | | | | 123 | |
| CBS Corp. 7.25% 20241 | | | 25 | | | | 26 | |
| CCO Holdings LLC and CCO Holdings Capital Corp. 5.50% 20261 | | | 100 | | | | 105 | |
| CCO Holdings LLC and CCO Holdings Capital Corp. 5.00% 20281 | | | 200 | | | | 205 | |
| CCO Holdings LLC and CCO Holdings Capital Corp. 5.375% 20291 | | | 100 | | | | 103 | |
| CCO Holdings LLC and CCO Holdings Capital Corp. 5.75% 2048 | | | 93 | | | | 103 | |
| CCO Holdings LLC and CCO Holdings Capital Corp. 5.125% 2049 | | | 38 | | | | 39 | |
| Cinemark USA, Inc. 4.875% 2023 | | | 50 | | | | 51 | |
| Clear Channel Worldwide Holdings, Inc. 9.25% 20241 | | | 100 | | | | 109 | |
| Comcast Corp. 4.15% 2028 | | | 20 | | | | 22 | |
| Comcast Corp. 4.00% 2048 | | | 45 | | | | 48 | |
| Cumulus Media New Holdings Inc., 6.75% 20261 | | | 35 | | | | 35 | |
| Cumulus Media New Holdings Inc., Term Loan, (3-month USD-LIBOR + 4.50%) 6.91% 20222,3 | | | 25 | | | | 25 | |
| Entercom Media Corp. 6.50% 20271 | | | 5 | | | | 5 | |
| Frontier Communications Corp. 10.50% 2022 | | | 175 | | | | 119 | |
| Frontier Communications Corp. 8.50% 20261 | | | 100 | | | | 97 | |
| Frontier Communications Corp. 8.00% 20271 | | | 50 | | | | 52 | |
| Gray Television, Inc. 7.00% 20271 | | | 40 | | | | 44 | |
| Inmarsat PLC 4.875% 20221 | | | 125 | | | | 126 | |
| Intelsat Jackson Holding Co. 5.50% 2023 | | | 110 | | | | 101 | |
| Intelsat Jackson Holding Co. 6.625% 20242 | | | 35 | | | | 35 | |
| Intelsat Jackson Holding Co. 8.50% 20241 | | | 45 | | | | 45 | |
| Live Nation Entertainment, Inc. 4.875% 20241 | | | 50 | | | | 52 | |
| Live Nation Entertainment, Inc. 5.625% 20261 | | | 35 | | | | 37 | |
| MDC Partners Inc. 6.50% 20241 | | | 235 | | | | 217 | |
| Meredith Corp. 6.875% 2026 | | | 125 | | | | 133 | |
| Nexstar Escrow Corp. 5.625% 20271 | | | 85 | | | | 87 | |
| OUTFRONT Media Cap LLC 5.00% 20271 | | | 25 | | | | 26 | |
| Sirius XM Radio Inc. 4.625% 20231 | | | 75 | | | | 76 | |
| Sirius XM Radio Inc. 4.625% 20241 | | | 10 | | | | 10 | |
| Sirius XM Radio Inc. 5.50% 20291 | | | 65 | | | | 67 | |
| Sprint Corp. 7.25% 2021 | | | 225 | | | | 240 | |
| Sprint Corp. 6.875% 2028 | | | 275 | | | | 285 | |
| T-Mobile US, Inc. 4.00% 2022 | | | 50 | | | | 51 | |
| T-Mobile US, Inc. 6.375% 2025 | | | 25 | | | | 26 | |
| Univision Communications Inc. 5.125% 20231 | | | 100 | | | | 98 | |
| Univision Communications Inc. 5.125% 20251 | | | 100 | | | | 96 | |
| Verizon Communications Inc. 4.016% 20291 | | | 20 | | | | 22 | |
| American Funds Multi-Sector Income Fund | 5 |
| Bonds, notes & other debt instruments (continued) | | Principal amount
(000) | | | Value
(000) | |
| Corporate bonds & notes (continued) | | | | | | |
| Communication services (continued) | | | | | | |
| Verizon Communications Inc. 4.862% 2046 | | $ | 20 | | | $ | 23 | |
| Vodafone Group PLC 5.25% 2048 | | | 88 | | | | 97 | |
| Warner Music Group 5.00% 20231 | | | 75 | | | | 77 | |
| Warner Music Group 5.50% 20261 | | | 50 | | | | 52 | |
| | | | | | | | 3,390 | |
| | | | | | | | | |
| Utilities 5.63% | | | | | | | | |
| AEP Transmission Co. LLC 3.80% 2049 | | | 20 | | | | 21 | |
| AES Corp. 4.875% 2023 | | | 20 | | | | 20 | |
| AES Corp. 6.00% 2026 | | | 130 | | | | 139 | |
| American Electric Power Co., Inc. 3.65% 2021 | | | 140 | | | | 144 | |
| American Electric Power Co., Inc. 4.30% 2028 | | | 240 | | | | 263 | |
| Calpine Corp. 5.375% 2023 | | | 25 | | | | 25 | |
| Calpine Corp. 5.875% 20241 | | | 75 | | | | 77 | |
| CenterPoint Energy, Inc. 3.85% 2024 | | | 65 | | | | 68 | |
| Consolidated Edison Co. of New York, Inc. 4.65% 2048 | | | 25 | | | | 29 | |
| Consolidated Edison Co. of New York, Inc. 4.125% 2049 | | | 20 | | | | 22 | |
| Dominion Resources, Inc. 3.071% 20244 | | | 100 | | | | 101 | |
| DTE Energy Co. 3.95% 2049 | | | 20 | | | | 22 | |
| Emera US Finance LP 4.75% 2046 | | | 35 | | | | 38 | |
| Entergy Corp. 2.95% 2026 | | | 65 | | | | 65 | |
| FirstEnergy Corp. 3.90% 2027 | | | 85 | | | | 89 | |
| Jersey Central Power & Light Co. 4.30% 20261 | | | 50 | | | | 54 | |
| Mississippi Power Co. 3.95% 2028 | | | 150 | | | | 158 | |
| NGL Energy Partners LP 7.50% 20261 | | | 150 | | | | 157 | |
| NiSource Finance Corp. 2.65% 2022 | | | 10 | | | | 10 | |
| NRG Energy, Inc. 7.25% 2026 | | | 35 | | | | 39 | |
| Pacific Gas and Electric Co. 2.45% 20227 | | | 60 | | | | 58 | |
| Pacific Gas and Electric Co. 4.65% 20281,7 | | | 125 | | | | 128 | |
| Pacific Gas and Electric Co. 3.95% 20477 | | | 125 | | | | 113 | |
| Public Service Electric and Gas Co. 3.20% 2029 | | | 30 | | | | 31 | |
| Public Service Electric and Gas Co. 3.85% 2049 | | | 15 | | | | 16 | |
| Public Service Enterprise Group Inc. 2.875% 2024 | | | 25 | | | | 25 | |
| San Diego Gas & Electric Co. 4.15% 2048 | | | 25 | | | | 26 | |
| SCANA Corp. 6.25% 2020 | | | 30 | | | | 31 | |
| South Carolina Electric & Gas Co. 4.60% 2043 | | | 80 | | | | 91 | |
| Southern California Edison Co. 3.50% 2023 | | | 243 | | | | 250 | |
| Southern California Edison Co. 4.00% 2047 | | | 24 | | | | 24 | |
| Southern California Edison Co., Series C, 4.125% 2048 | | | 163 | | | | 164 | |
| State Grid Overseas Investment Ltd. 3.50% 20271 | | | 200 | | | | 207 | |
| Talen Energy Corp. 10.50% 20261 | | | 25 | | | | 25 | |
| Talen Energy Corp. 7.25% 20271 | | | 50 | | | | 51 | |
| Tampa Electric Co. 4.45% 2049 | | | 20 | | | | 22 | |
| Vistra Energy Corp. 7.625% 2024 | | | 90 | | | | 95 | |
| | | | | | | | 2,898 | |
| | | | | | | | | |
| Information technology 5.46% | | | | | | | | |
| Almonde Inc., Term Loan, (3-month USD-LIBOR + 7.25%) 9.652% 20252,3 | | | 140 | | | | 139 | |
| Applied Systems, Inc., Term Loan, (3-month USD-LIBOR + 7.00%) 9.33% 20252,3 | | | 25 | | | | 25 | |
| Banff Merger Sub Inc. 9.75% 20261 | | | 75 | | | | 66 | |
| Blackboard Inc., Term Loan B4, (3-month USD-LIBOR + 5.00%) 7.496% 20212,3 | | | 65 | | | | 65 | |
| Broadcom Inc. 4.75% 20291 | | | 490 | | | | 503 | |
| Broadcom Ltd. 3.875% 2027 | | | 110 | | | | 108 | |
| Broadcom Ltd. 3.50% 2028 | | | 30 | | | | 29 | |
| Camelot Finance SA 7.875% 20241 | | | 110 | | | | 116 | |
| CDK Global Inc. 5.25% 20291 | | | 30 | | | | 31 | |
| Diebold Nixdorf AG, Term Loan A1, (3-month USD-LIBOR + 9.25%) 11.688% 20222,3 | | | 50 | | | | 53 | |
| Diebold, Inc. 8.50% 2024 | | | 125 | | | | 111 | |
| Fidelity National Information Services, Inc. 3.75% 2029 | | | 65 | | | | 69 | |
| Financial & Risk US Holdings, Inc. 6.25% 20261 | | | 105 | | | | 108 | |
| Financial & Risk US Holdings, Inc. 8.25% 20261 | | | 150 | | | | 155 | |
| Fiserv, Inc. 3.20% 2026 | | | 55 | | | | 56 | |
| Fiserv, Inc. 3.50% 2029 | | | 220 | | | | 226 | |
| Fiserv, Inc. 4.40% 2049 | | | 25 | | | | 26 | |
| Genesys Telecommunications Laboratories, Inc. 10.00% 20241 | | | 75 | | | | 82 | |
| Go Daddy Operating Co. 5.25% 20271 | | | 25 | | | | 26 | |
| Infor (US), Inc. 6.50% 2022 | | | 160 | | | | 163 | |
| 6 | American Funds Multi-Sector Income Fund |
| Bonds, notes & other debt instruments (continued) | | Principal amount
(000) | | | Value
(000) | |
| Corporate bonds & notes (continued) | | | | | | |
| Information technology (continued) | | | | | | |
| International Business Machines Corp. 3.00% 2024 | | $ | 110 | | | $ | 113 | |
| International Business Machines Corp. 3.50% 2029 | | | 150 | | | | 157 | |
| Kronos Inc., Term Loan B, (3-month USD-LIBOR + 8.25%) 10.829% 20242,3 | | | 175 | | | | 181 | |
| Solera Holdings, Inc. 10.50% 20241 | | | 50 | | | | 54 | |
| Tempo Acquisition LLC 6.75% 20251 | | | 60 | | | | 62 | |
| Unisys Corp. 10.75% 20221 | | | 55 | | | | 61 | |
| Veritas US Inc., Term Loan B, (3-month USD-LIBOR + 4.50%) 6.902% 20232,3 | | | 25 | | | | 23 | |
| | | | | | | | 2,808 | |
| | | | | | | | | |
| Consumer staples 4.56% | | | | | | | | |
| Altria Group, Inc. 5.95% 2049 | | | 245 | | | | 279 | |
| Anheuser-Busch Co./InBev Worldwide 4.90% 2046 | | | 90 | | | | 100 | |
| B&G Foods, Inc. 5.25% 2025 | | | 125 | | | | 127 | |
| British American Tobacco PLC 3.222% 2024 | | | 105 | | | | 106 | |
| British American Tobacco PLC 3.557% 2027 | | | 55 | | | | 55 | |
| British American Tobacco PLC 4.39% 2037 | | | 15 | | | | 14 | |
| British American Tobacco PLC 4.54% 2047 | | | 225 | | | | 209 | |
| Conagra Brands, Inc. 5.40% 2048 | | | 105 | | | | 115 | |
| Cott Beverages Inc. 5.50% 20251 | | | 50 | | | | 51 | |
| Darling Ingredients Inc. 5.25% 20271 | | | 125 | | | | 131 | |
| Energizer Holdings, Inc. 7.75% 20271 | | | 100 | | | | 109 | |
| Energizer SpinCo Inc. 5.50% 20251 | | | 25 | | | | 25 | |
| First Quality Enterprises, Inc. 5.00% 20251 | | | 120 | | | | 121 | |
| First Quality Finance Co., Inc. 4.625% 20211 | | | 10 | | | | 10 | |
| Keurig Dr Pepper Inc. 4.057% 2023 | | | 210 | | | | 221 | |
| Keurig Dr Pepper Inc. 4.417% 2025 | | | 20 | | | | 22 | |
| Keurig Dr Pepper Inc. 5.085% 2048 | | | 20 | | | | 22 | |
| Molson Coors Brewing Co. 4.20% 2046 | | | 20 | | | | 19 | |
| Philip Morris International Inc. 3.375% 2029 | | | 235 | | | | 242 | |
| Post Holdings, Inc. 5.00% 20261 | | | 75 | | | | 76 | |
| Post Holdings, Inc. 5.50% 20291 | | | 60 | | | | 61 | |
| Prestige Brands International Inc. 5.375% 20211 | | | 35 | | | | 35 | |
| Wal-Mart Stores, Inc. 2.85% 2024 | | | 190 | | | | 196 | |
| | | | | | | | 2,346 | |
| | | | | | | | | |
| Real estate 1.62% | | | | | | | | |
| American Campus Communities, Inc. 3.30% 2026 | | | 38 | | | | 38 | |
| Brookfield Property REIT Inc. 5.75% 20261 | | | 95 | | | | 98 | |
| Howard Hughes Corp. 5.375% 20251 | | | 150 | | | | 156 | |
| Iron Mountain Inc. 5.75% 2024 | | | 60 | | | | 61 | |
| Iron Mountain Inc. 5.25% 20281 | | | 100 | | | | 101 | |
| Medical Properties Trust, Inc. 5.00% 2027 | | | 50 | | | | 52 | |
| Realogy Corp. 4.875% 20231 | | | 30 | | | | 27 | |
| Realogy Corp. 9.375% 20271 | | | 170 | | | | 150 | |
| SBA Communications Corp. 4.00% 2022 | | | 100 | | | | 102 | �� |
| Westfield Corp. Ltd. 3.50% 20291 | | | 50 | | | | 50 | |
| | | | | | | | 835 | |
| | | | | | | | | |
| Total corporate bonds & notes | | | | | | | 35,871 | |
| | | | | | | | | |
| Mortgage-backed obligations 13.13% | | | | | | | | |
| Commercial mortgage-backed securities 8.90% | | | | | | | | |
| Citigroup Commercial Mortgage Trust, Series 2013-CG11, Class B, 3.732% 20463,8 | | | 95 | | | | 97 | |
| Citigroup Commercial Mortgage Trust, Series 2013-GC15, Class D, 5.389% 20461,3,8 | | | 250 | | | | 263 | |
| Citigroup Commercial Mortgage Trust, Series 2014-CG19, Class B, 4.805% 20473,8 | | | 230 | | | | 249 | |
| Commercial Mortgage Trust, Series 2013-LC6, Class D, 4.404% 20461,3,8 | | | 113 | | | | 116 | |
| Commercial Mortgage Trust, Series 2013-CR10, Class D, 4.952% 20461,3,8 | | | 200 | | | | 203 | |
| Commercial Mortgage Trust, Series 2014-UBS2, Class AM, 4.048% 20478 | | | 100 | | | | 105 | |
| Commercial Mortgage Trust, Series 2014-CR19, Class C, 4.895% 20473,8 | | | 300 | | | | 317 | |
| GS Mortgage Securities Corp. II, Series 2012-GCJ7, Class B, 4.74% 20458 | | | 350 | | | | 366 | |
| GS Mortgage Securities Corp., Series 2013-GC14, Class D, 4.907% 20461,3,8 | | | 370 | | | | 377 | |
| J.P. Morgan Chase Commercial Mortgage Securities Trust, Series 2013-LC11, Class D, 4.307% 20463,8 | | | 435 | | | | 393 | |
| JPMBB Commercial Mortgage Securities Trust, Series 2013-C14, Class C, 4.713% 20463,8 | | | 230 | | | | 242 | |
| JPMBB Commercial Mortgage Securities Trust, Series 2014-C19, Class D, 4.697% 20471,3,8 | | | 141 | | | | 143 | |
| JPMBB Commercial Mortgage Securities Trust, Series 2015-C31, Class C, 4.771% 20483,8 | | | 150 | | | | 159 | |
| Morgan Stanley Bank of America Merrill Lynch Trust, Series 2013-C7, Class C, 4.253% 20463,8 | | | 100 | | | | 103 | |
| American Funds Multi-Sector Income Fund | 7 |
| Bonds, notes & other debt instruments (continued) | | Principal amount
(000) | | | Value
(000) | |
| Mortgage-backed obligations (continued) | | | | | | |
| Commercial mortgage-backed securities (continued) | | | | | | |
| Morgan Stanley Bank of America Merrill Lynch Trust, Series 2013-C7, Class D, 4.369% 20461,3,8 | | $ | 400 | | | $ | 389 | |
| Morgan Stanley Bank of America Merrill Lynch Trust, Series 2013-C11, Class AS, 4.499% 20463,8 | | | 40 | | | | 43 | |
| Morgan Stanley Bank of America Merrill Lynch Trust, Series 2014-C15, Class B, 4.565% 20473,8 | | | 100 | | | | 107 | |
| Wells Fargo Commercial Mortgage Trust, Series 2012-LC5, Class C, 4.693% 20453,8 | | | 20 | | | | 21 | |
| Wells Fargo Commercial Mortgage Trust, Series 2012-LC5, Class D, 4.919% 20451,3,8 | | | 44 | | | | 45 | |
| WF-RBS Commercial Mortgage Trust, Series 2013-C13, Class D, 4.27% 20451,3,8 | | | 40 | | | | 40 | |
| WF-RBS Commercial Mortgage Trust, Series 2013-C11, Class C, 4.351% 20453,8 | | | 240 | | | | 245 | |
| WF-RBS Commercial Mortgage Trust, Series 2012-C6, Class B, 4.697% 20458 | | | 40 | | | | 42 | |
| WF-RBS Commercial Mortgage Trust, Series 2012-C7, Class C, 4.97% 20453,8 | | | 300 | | | | 307 | |
| WF-RBS Commercial Mortgage Trust, Series 2013-C14, Class B, 3.841% 20463,8 | | | 198 | | | | 204 | |
| | | | | | | | 4,576 | |
| | | | | | | | | |
| Collateralized mortgage-backed obligations (privately originated) 3.11% | | | | | | | |
| Cascade Funding Mortgage Trust, Series 2018-RM2, Class A, 4.00% 20681,3,8 | | | 93 | | | | 95 | |
| Commercial Mortgage Trust, Series 2012-CR3, Class C, 4.584% 20451,3,8 | | | 300 | | | | 305 | |
| Commercial Mortgage Trust, Series 2013-CR7, Class C, 4.209% 20461,3,8 | | | 177 | | | | 175 | |
| Commercial Mortgage Trust, Series 2013-LC13, Class B, 5.009% 20461,3,8 | | | 200 | | | | 216 | |
| Finance of America Structured Securities Trust, Series 2019-JR2, Class A1, 2.00% 20691,6,8 | | | 370 | | | | 374 | |
| Finance of America Structured Securities Trust, Series 2019-JR1, Class A, 2.00% 20691,8 | | | 139 | | | | 146 | |
| Homeward Opportunities Fund Trust, Series 2019-01, Class A3, 3.606% 20591,3,8 | | | 285 | | | | 289 | |
| | | | | | | | 1,600 | |
| | | | | | | | | |
| Federal agency mortgage-backed obligations 1.12% | | | | | | | | |
| Commercial Mortgage Trust, Series 2013-CR12, Class B, 4.762% 20463,8 | | | 210 | | | | 220 | |
| Commercial Mortgage Trust, Series 2014-UBS4, Class AM, 3.968% 20478 | | | 68 | | | | 72 | |
| WF-RBS Commercial Mortgage Trust, Series 2012-C8, Class B, 4.311% 20458 | | | 275 | | | | 287 | |
| | | | | | | | 579 | |
| | | | | | | | | |
| Total mortgage-backed obligations | | | | | | | 6,755 | |
| | | | | | | | | |
| Bonds & notes of governments & government agencies outside the U.S. 11.02% | | | | | |
| Argentine Republic 5.625% 2022 | | | 400 | | | | 338 | |
| Argentine Republic 6.875% 2027 | | | 200 | | | | 161 | |
| Bahrain (Kingdom of) 6.125% 2022 | | | 250 | | | | 263 | |
| Cameroon (Republic of) 9.50% 2025 | | | 200 | | | | 218 | |
| Costa Rica (Republic of) 4.375% 2025 | | | 200 | | | | 192 | |
| Dominican Republic 5.95% 2027 | | | 250 | | | | 270 | |
| Egypt (Arab Republic of) 7.50% 2027 | | | 250 | | | | 267 | |
| Ghana (Republic of) 8.125% 20321 | | | 200 | | | | 204 | |
| Greece (Hellenic Republic of) 3.75% 2028 | | € | 200 | | | | 253 | |
| Kazakhstan (Republic of) 4.875% 2044 | | $ | 200 | | | | 231 | |
| Kenya (Republic of) 7.25% 2028 | | | 200 | | | | 208 | |
| Oman (Sultanate of) 5.375% 20271 | | | 200 | | | | 188 | |
| Pakistan (Islamic Republic of) 8.25% 2024 | | | 400 | | | | 438 | |
| Poland (Republic of) 3.25% 2026 | | | 250 | | | | 265 | |
| Qatar (State of) 3.375% 20241 | | | 200 | | | | 207 | |
| Romania 3.50% 2034 | | € | 30 | | | | 38 | |
| Romania 5.125% 2048 | | $ | 100 | | | | 112 | |
| Russian Federation 4.375% 2029 | | | 400 | | | | 415 | |
| South Africa (Republic of) 5.875% 2030 | | | 200 | | | | 217 | |
| Turkey (Republic of) 7.375% 2025 | | | 400 | | | | 414 | |
| Turkey (Republic of) 6.875% 2036 | | | 60 | | | | 58 | |
| Ukraine Government 7.75% 2020 | | | 100 | | | | 103 | |
| Ukraine Government 7.75% 2026 | | | 200 | | | | 207 | |
| Ukraine Government 0% 20401 | | | 80 | | | | 58 | |
| United Mexican States 4.50% 2029 | | | 200 | | | | 215 | |
| United Mexican States 6.75% 2034 | | | 100 | | | | 128 | |
| | | | | | | | 5,668 | |
| 8 | American Funds Multi-Sector Income Fund |
| Bonds, notes & other debt instruments (continued) | | Principal amount
(000) | | | Value
(000) | |
| U.S. Treasury bonds & notes 2.53% | | | | | | |
| U.S. Treasury 2.53% | | | | | | |
| U.S. Treasury 2.00% 20249 | | $ | 483 | | | $ | 489 | |
| U.S. Treasury 2.375% 20299 | | | 645 | | | | 666 | |
| U.S. Treasury 3.00% 20499 | | | 132 | | | | 145 | |
| | | | | | | | 1,300 | |
| | | | | | | | | |
| Asset-backed obligations 0.50% | | | | | | | | |
| Legacy Mortgage Asset Trust, Series 2019-GS2, Class A1, 3.75% 20591,3,8 | | | 254 | | | | 256 | |
| | | | | | | | | |
| Municipals 0.37% | | | | | | | | |
| Illinois 0.19% | | | | | | | | |
| G.O. Bonds, Pension Funding, Series 2003, 5.10% 2033 | | | 90 | | | | 95 | |
| | | | | | | | | |
| South Carolina 0.18% | | | | | | | | |
| Public Service Auth., Rev. Obligations (Santee Cooper), Series 2015-E, 5.25% 2055 | | | 30 | | | | 34 | |
| Public Service Auth., Rev. Ref. Obligations (Santee Cooper), Series 2016-C, 5.00% 2035 | | | 50 | | | | 59 | |
| | | | | | | | 93 | |
| | | | | | | | | |
| Total municipals | | | | | | | 188 | |
| | | | | | | | | |
| Total bonds, notes & other debt instruments (cost: $48,769,000) | | | | | | | 50,038 | |
| | | | | | | | | |
| Short-term securities 1.26% | | | Shares | | | | | |
| Money market investments 1.26% | | | | | | | | |
| Capital Group Central Cash Fund | | | 6,490 | | | | 649 | |
| | | | | | | | | |
| Total short-term securities (cost: $649,000) | | | | | | | 649 | |
| Total investment securities 98.55% (cost: $49,418,000) | | | | | | | 50,687 | |
| Other assets less liabilities 1.45% | | | | | | | 746 | |
| | | | | | | | | |
| Net assets 100.00% | | | | | | $ | 51,433 | |
Futures contracts
| | | | | Number of | | | | Notional
amount | 10 | | Value at
6/30/2019 | 11 | | Unrealized
appreciation
(depreciation)
at 6/30/2019 | |
| Contracts | | Type | | contracts | | Expiration | | (000) | | | (000) | | | (000) | |
| 2 Year U.S. Treasury Note Futures | | Long | | 129 | | October 2019 | | $ | 25,800 | | | $ | 27,758 | | | | $ | 131 | |
| 5 Year U.S. Treasury Note Futures | | Long | | 16 | | October 2019 | | | 1,600 | | | | 1,890 | | | | | 19 | |
| 10 Year U.S. Treasury Note Futures | | Long | | 5 | | September 2019 | | | 500 | | | | 640 | | | | | 2 | |
| 10 Year Ultra U.S. Treasury Note Futures | | Short | | 85 | | September 2019 | | | (8,500 | ) | | | (11,741 | ) | | | | (310 | ) |
| 20 Year U.S. Treasury Bond Futures | | Long | | 6 | | September 2019 | | | 600 | | | | 934 | | | | | 25 | |
| | | | | | | | | | | | | | | | | | $ | (133 | ) |
Forward currency contracts
| Contract amount | | | | | | Unrealized
appreciation | |
Purchases
(000) | | | Sales
(000) | | Counterparty | | Settlement
date | | at 6/30/2019
(000) | |
| USD17 | | | EUR15 | | JPMorgan Chase | | 7/15/2019 | | — | 12 |
| American Funds Multi-Sector Income Fund | 9 |
Swap contracts
Credit default swaps
Centrally cleared credit default swaps on credit indices — buy protection
| Receive | | Pay/
Payment frequency | | Expiration
date | | Notional
(000) | | | Value at
6/30/2019
(000) | | | Upfront
payments
(000) | | | | Unrealized
depreciation
at 6/30/2019
(000) | |
| CDX.NA.HY.32 | | 5.00%/Quarterly | | 6/20/2024 | | $ | 1,250 | | | $ | (95 | ) | | $ | (59 | ) | | | $ | (36 | ) |
| 1 | Acquired in a transaction exempt from registration under Rule 144A of the Securities Act of 1933. May be resold in the U.S. in transactions exempt from registration, normally to qualified institutional buyers. The total value of all such securities was $22,276,000, which represented 43.31% of the net assets of the fund. |
| 2 | Loan participations and assignments; may be subject to legal or contractual restrictions on resale. The total value of all such loans was $931,000, which represented 1.81% of the net assets of the fund. |
| 3 | Coupon rate may change periodically. |
| 4 | Step bond; coupon rate may change at a later date. |
| 5 | Payment in kind; the issuer has the option of paying additional securities in lieu of cash. Most recent payment was 100% cash unless otherwise noted. |
| 6 | Valued under fair value procedures adopted by authority of the board of trustees. The total value of all such securities was $421,000, which represented .82% of the net assets of the fund. |
| 7 | Scheduled interest and/or principal payment was not received. |
| 8 | Principal payments may be made periodically. Therefore, the effective maturity date may be earlier than the stated maturity date. |
| 9 | All or a portion of this security was pledged as collateral. The total value of pledged collateral was $118,000, which represented .23% of the net assets of the fund. |
| 10 | Notional amount is calculated based on the number of contracts and notional contract size. |
| 11 | Value is calculated based on the notional amount and current market price. |
| 12 | Amount less than one thousand. |
Key to abbreviations and symbols
Auth. = Authority
EUR/€ = Euros
G.O. = General Obligation
LIBOR = London Interbank Offered Rate
Ref. = Refunding
Rev. = Revenue
USD/$ = U.S. dollars
See notes to financial statements.
| 10 | American Funds Multi-Sector Income Fund |
Financial statements
| Statement of assets and liabilities | unaudited |
| at June 30, 2019 | (dollars in thousands) |
| Assets: | | | | | | | | |
| Investment securities in unaffiliated issuers, at value (cost: $49,418) | | | | | | $ | 50,687 | |
| Cash | | | | | | | 58 | |
| Receivables for: | | | | | | | | |
| Sales of investments | | $ | 1,562 | | | | | |
| Dividends and interest | | | 577 | | | | | |
| Other | | | — | * | | | 2,139 | |
| | | | | | | | 52,884 | |
| Liabilities: | | | | | | | | |
| Unrealized depreciation on open forward currency contracts | | | | | | | — | * |
| Payables for: | | | | | | | | |
| Purchases of investments | | | 1,224 | | | | | |
| Dividends on fund’s shares | | | 185 | | | | | |
| Investment advisory services | | | 18 | | | | | |
| Services provided by related parties | | | 14 | | | | | |
| Variation margin on futures contracts | | | 8 | | | | | |
| Variation margin on swap contracts | | | 2 | | | | | |
| Other | | | — | * | | | 1,451 | |
| Net assets at June 30, 2019 | | | | | | $ | 51,433 | |
| | | | | | | | | |
| Net assets consist of: | | | | | | | | |
| Capital paid in on shares of beneficial interest | | | | | | $ | 50,000 | |
| Total distributable earnings | | | | | | | 1,433 | |
| Net assets at June 30, 2019 | | | | | | $ | 51,433 | |
(dollars and shares in thousands, except per-share amounts)
Shares of beneficial interest issued and outstanding (no stated par value) —
unlimited shares authorized (5,000 total shares outstanding)
| | | | | | Shares | | | Net asset value | |
| | | Net assets | | | outstanding | | | per share | |
| Class A | | $ | 51,355 | | | | 4,993 | | | $ | 10.29 | |
| Class F2 | | | 26 | | | | 2 | | | | 10.29 | |
| Class F3 | | | 26 | | | | 2 | | | | 10.29 | |
| Class R6 | | | 26 | | | | 3 | | | | 10.29 | |
| * | Amount less than one thousand. |
See notes to financial statements.
| American Funds Multi-Sector Income Fund | 11 |
| Statement of operations | unaudited |
| for the period March 22, 2019* to June 30, 2019 | (dollars in thousands) |
| Investment income: | | | | | | | | |
| Income: | | | | | | | | |
| Interest | | $ | 676 | | | | | |
| Dividends | | | 28 | | | $ | 704 | |
| Fees and expenses†: | | | | | | | | |
| Investment advisory services | | | 61 | | | | | |
| Transfer agent services | | | 13 | | | | | |
| Administrative services | | | 1 | | | | | |
| Registration statement and prospectus | | | 12 | | | | | |
| Auditing and legal | | | 14 | | | | | |
| Custodian | | | 2 | | | | | |
| Other | | | 1 | | | | | |
| Total fees and expenses before reimbursements | | | 104 | | | | | |
| Less miscellaneous fee reimbursements | | | 6 | | | | | |
| Total fees and expenses after reimbursements | | | | | | | 98 | |
| Net investment income | | | | | | | 606 | |
| | | | | | | | | |
| Net realized gain and unrealized appreciation: | | | | | | | | |
| Net realized gain (loss) on: | | | | | | | | |
| Investments in unaffiliated issuers | | | 231 | | | | | |
| Futures contracts | | | 57 | | | | | |
| Swap contracts | | | (5 | ) | | | | |
| Currency transactions | | | 1 | | | | 284 | |
| Net unrealized appreciation (depreciation) on: | | | | | | | | |
| Investments in unaffiliated issuers | | | 1,269 | | | | | |
| Futures contracts | | | (133 | ) | | | | |
| Swap contracts | | | (36 | ) | | | 1,100 | |
| Net realized gain and unrealized appreciation | | | | | | | 1,384 | |
| | | | | | | | | |
| Net increase in net assets resulting from operations | | | | | | $ | 1,990 | |
| * | Commencement of operations. |
| † | Additional information related to class-specific fees and expenses is included in the notes to financial statements. |
Statement of changes in net assets
| for the period March 22, 2019* to June 30, 2019† | (dollars in thousands) |
| Operations: | | | | |
| Net investment income | | $ | 606 | |
| Net realized gain | | | 284 | |
| Net unrealized appreciation | | | 1,100 | |
| Net increase in net assets resulting from operations | | | 1,990 | |
| | | | | |
| Distributions paid or accrued to shareholders | | | (557 | ) |
| | | | | |
| Net capital share transactions | | | 50,000 | |
| | | | | |
| Total increase in net assets | | | 51,433 | |
| | | | | |
| Net assets: | | | | |
| Beginning of period | | | — | |
| End of period | | $ | 51,433 | |
| * | Commencement of operations. |
| † | Unaudited. |
See notes to financial statements.
| 12 | American Funds Multi-Sector Income Fund |
| Notes to financial statements | unaudited |
1. Organization
American Funds Multi-Sector Income Fund (the “fund”) is registered under the Investment Company Act of 1940 as an open-end, diversified management investment company. The fund seeks to provide a high level of current income.
2. Significant accounting policies
The fund is an investment company that applies the accounting and reporting guidance issued in Topic 946 by the U.S. Financial Accounting Standards Board. The fund’s financial statements have been prepared to comply with U.S. generally accepted accounting principles (“U.S. GAAP”). These principles require the fund’s investment adviser to make estimates and assumptions that affect reported amounts and disclosures. Actual results could differ from those estimates. Subsequent events, if any, have been evaluated through the date of issuance in the preparation of the financial statements. The fund follows the significant accounting policies described in this section, as well as the valuation policies described in the next section on valuation.
Security transactions and related investment income— Security transactions are recorded by the fund as of the date the trades are executed with brokers. Realized gains and losses from security transactions are determined based on the specific identified cost of the securities. In the event a security is purchased with a delayed payment date, the fund will segregate liquid assets sufficient to meet its payment obligations. Dividend income is recognized on the ex-dividend date and interest income is recognized on an accrual basis. Market discounts, premiums and original issue discounts on fixed-income securities are amortized daily over the expected life of the security.
Class allocations— Income, fees and expenses (other than class-specific fees and expenses) are allocated daily among the various share classes based on the relative value of their settled shares. Realized and unrealized gains and losses are allocated daily among the various share classes based on their relative net assets. Class-specific fees and expenses, such as distribution, transfer agent and administrative services, are charged directly to the respective share class.
Distributions paid or accrued to shareholders— Income dividends are declared daily after the determination of the fund’s net investment income and are paid to shareholders monthly. Capital gain distributions are recorded on the ex-dividend date.
Currency translation— Assets and liabilities, including investment securities, denominated in currencies other than U.S. dollars are translated into U.S. dollars at the exchange rates supplied by one or more pricing vendors on the valuation date. Purchases and sales of investment securities and income and expenses are translated into U.S. dollars at the exchange rates on the dates of such transactions. The effects of changes in exchange rates on investment securities are included with the net realized gain or loss and net unrealized appreciation or depreciation on investments in the fund’s statement of operations. The realized gain or loss and unrealized appreciation or depreciation resulting from all other transactions denominated in currencies other than U.S. dollars are disclosed separately.
3. Valuation
Capital Research and Management Company (“CRMC”), the fund’s investment adviser, values the fund’s investments at fair value as defined by U.S. GAAP. The net asset value of each share class of the fund is generally determined as of approximately 4:00 p.m. New York time each day the New York Stock Exchange is open.
Methods and inputs— The fund’s investment adviser uses the following methods and inputs to establish the fair value of the fund’s assets and liabilities. Use of particular methods and inputs may vary over time based on availability and relevance as market and economic conditions evolve.
Fixed-income securities, including short-term securities, are generally valued at prices obtained from one or more pricing vendors. Vendors value such securities based on one or more of the inputs described in the following table. The table provides examples of inputs
| American Funds Multi-Sector Income Fund | 13 |
that are commonly relevant for valuing particular classes of fixed-income securities in which the fund is authorized to invest. However, these classifications are not exclusive, and any of the inputs may be used to value any other class of fixed-income security.
| Fixed-income class | | Examples of standard inputs |
| All | | Benchmark yields, transactions, bids, offers, quotations from dealers and trading systems, new issues, spreads and other relationships observed in the markets among comparable securities; and proprietary pricing models such as yield measures calculated using factors such as cash flows, financial or collateral performance and other reference data (collectively referred to as “standard inputs”) |
| Corporate bonds & notes; convertible securities | | Standard inputs and underlying equity of the issuer |
| Bonds & notes of governments & government agencies | | Standard inputs and interest rate volatilities |
| Mortgage-backed; asset-backed obligations | | Standard inputs and cash flows, prepayment information, default rates, delinquency and loss assumptions, collateral characteristics, credit enhancements and specific deal information |
| Municipal securities | | Standard inputs and, for certain distressed securities, cash flows or liquidation values using a net present value calculation based on inputs that include, but are not limited to, financial statements and debt contracts |
When the fund’s investment adviser deems it appropriate to do so (such as when vendor prices are unavailable or deemed to be not representative), fixed-income securities will be valued in good faith at the mean quoted bid and ask prices that are reasonably and timely available (or bid prices, if ask prices are not available) or at prices for securities of comparable maturity, quality and type.
Securities with both fixed-income and equity characteristics, or equity securities traded principally among fixed-income dealers, are generally valued in the manner described for either equity or fixed-income securities, depending on which method is deemed most appropriate by the fund’s investment adviser. The Capital Group Central Cash Fund (“CCF”) is valued based upon a floating net asset value, which fluctuates with changes in the value of CCF’s portfolio securities. The underlying securities are valued based on the policies and procedures in CCF’s statement of additional information. Exchange-traded futures are generally valued at the official settlement price of the exchange or market on which such instruments are traded, as of the close of business on the day the futures are being valued. Forward currency contracts are valued at the mean of representative quoted bid and ask prices, generally based on prices supplied by one or more pricing vendors. Interest rate swaps and credit default swaps are generally valued by pricing vendors based on market inputs that include the index and term of index, reset frequency, payer/receiver, currency and pay frequency.
Securities and other assets for which representative market quotations are not readily available or are considered unreliable by the fund’s investment adviser are fair valued as determined in good faith under fair valuation guidelines adopted by authority of the fund’s board of trustees as further described. The investment adviser follows fair valuation guidelines, consistent with U.S. Securities and Exchange Commission rules and guidance, to consider relevant principles and factors when making fair value determinations. The investment adviser considers relevant indications of value that are reasonably and timely available to it in determining the fair value to be assigned to a particular security, such as the type and cost of the security; contractual or legal restrictions on resale of the security; relevant financial or business developments of the issuer; actively traded similar or related securities; conversion or exchange rights on the security; related corporate actions; significant events occurring after the close of trading in the security; and changes in overall market conditions. In addition, the closing prices of equity securities that trade in markets outside U.S. time zones may be adjusted to reflect significant events that occur after the close of local trading but before the net asset value of each share class of the fund is determined. Fair valuations and valuations of investments that are not actively trading involve judgment and may differ materially from valuations that would have been used had greater market activity occurred.
Processes and structure— The fund’s board of trustees has delegated authority to the fund’s investment adviser to make fair value determinations, subject to board oversight. The investment adviser has established a Joint Fair Valuation Committee (the “Fair Valuation Committee”) to administer, implement and oversee the fair valuation process, and to make fair value decisions. The Fair Valuation Committee regularly reviews its own fair value decisions, as well as decisions made under its standing instructions to the investment adviser’s valuation teams. The Fair Valuation Committee reviews changes in fair value measurements from period to period and may, as deemed appropriate, update the fair valuation guidelines to better reflect the results of back testing and address new or evolving issues. The Fair Valuation Committee reports any changes to the fair valuation guidelines to the board of trustees. The fund’s board and audit committee also regularly review reports that describe fair value determinations and methods.
The fund’s investment adviser has also established a Fixed-Income Pricing Review Group to administer and oversee the fixed-income valuation process, including the use of fixed-income pricing vendors. This group regularly reviews pricing vendor information and market
| 14 | American Funds Multi-Sector Income Fund |
data. Pricing decisions, processes and controls over security valuation are also subject to additional internal reviews, including an annual control self-evaluation program facilitated by the investment adviser’s compliance group.
Classifications— The fund’s investment adviser classifies the fund’s assets and liabilities into three levels based on the inputs used to value the assets or liabilities. Level 1 values are based on quoted prices in active markets for identical securities. Level 2 values are based on significant observable market inputs, such as quoted prices for similar securities and quoted prices in inactive markets. Certain securities trading outside the U.S. may transfer between Level 1 and Level 2 due to valuation adjustments resulting from significant market movements following the close of local trading. Level 3 values are based on significant unobservable inputs that reflect the investment adviser’s determination of assumptions that market participants might reasonably use in valuing the securities. The valuation levels are not necessarily an indication of the risk or liquidity associated with the underlying investment. For example, U.S. government securities are reflected as Level 2 because the inputs used to determine fair value may not always be quoted prices in an active market. The following tables present the fund’s valuation levels as of June 30, 2019 (dollars in thousands):
| | | Investment securities | |
| | | Level 1 | | | Level 2 | | | Level 3 | | | Total | |
| Assets: | | | | | | | | | | | | | | | | |
| Bonds, notes & other debt instruments: | | | | | | | | | | | | | | | | |
| Corporate bonds & notes | | $ | — | | | $ | 35,871 | | | $ | — | | | $ | 35,871 | |
| Mortgage-backed obligations | | | — | | | | 6,755 | | | | — | | | | 6,755 | |
| Bonds & notes of governments & government agencies outside the U.S. | | | — | | | | 5,668 | | | | — | | | | 5,668 | |
| U.S. Treasury bonds & notes | | | — | | | | 1,300 | | | | — | | | | 1,300 | |
| Asset-backed obligations | | | — | | | | 256 | | | | — | | | | 256 | |
| Municipals | | | — | | | | 188 | | | | — | | | | 188 | |
| Short-term securities | | | 649 | | | | — | | | | — | | | | 649 | |
| Total | | $ | 649 | | | $ | 50,038 | | | $ | — | | | $ | 50,687 | |
| | | Other investments* | |
| | | Level 1 | | | Level 2 | | | Level 3 | | | Total | |
| Assets: | | | | | | | | | | | | | | | | |
| Unrealized appreciation on futures contracts | | $ | 177 | | | $ | — | | | $ | — | | | $ | 177 | |
| Liabilities: | | | | | | | | | | | | | | | | |
| Unrealized depreciation on futures contracts | | | (310 | ) | | | — | | | | — | | | | (310 | ) |
| Unrealized depreciation on open forward currency contracts | | | — | | | | — | † | | | — | | | | — | † |
| Unrealized depreciation on credit default swaps | | | — | | | | (36 | ) | | | — | | | | (36 | ) |
| Total | | $ | (133 | ) | | $ | (36 | ) | | $ | — | | | $ | (169 | ) |
| * | Futures contract, forward currency contracts and credit default swaps are not included in the investment portfolio. |
| † | Amount less than one thousand. |
4. Risk factors
Investing in the fund may involve certain risks including, but not limited to, those described below.
Market conditions— The prices of, and the income generated by, the securities held by the fund may decline – sometimes rapidly or unpredictably – due to various factors, including events or conditions affecting the general economy or particular industries; overall market changes; local, regional or global political, social or economic instability; governmental, governmental agency or central bank responses to economic conditions; and currency exchange rate, interest rate and commodity price fluctuations.
Issuer risks— The prices of, and the income generated by, securities held by the fund may decline in response to various factors directly related to the issuers of such securities, including reduced demand for an issuer’s goods or services, poor management performance, major litigation against the issuer, changes in government regulations affecting the issuer or its competitive environment and strategic initiatives such as mergers, acquisitions or dispositions and the market response to any such initiatives.
Investing in debt instruments— The prices of, and the income generated by, bonds and other debt securities held by the fund may be affected by changing interest rates and by changes in the effective maturities and credit ratings of these securities.
| American Funds Multi-Sector Income Fund | 15 |
Rising interest rates will generally cause the prices of bonds and other debt securities to fall. A general rise in interest rates may cause investors to sell debt securities on a large scale, which could also adversely affect the price and liquidity of debt securities and could also result in increased redemptions from the fund. Falling interest rates may cause an issuer to redeem, call or refinance a debt security before its stated maturity, which may result in the fund failing to recoup the full amount of its initial investment and having to reinvest the proceeds in lower yielding securities. Longer maturity debt securities generally have greater sensitivity to changes in interest rates and may be subject to greater price fluctuations than shorter maturity debt securities.
Bonds and other debt securities are also subject to credit risk, which is the possibility that the credit strength of an issuer or guarantor will weaken or be perceived to be weaker, and/or an issuer of a debt security will fail to make timely payments of principal or interest and the security will go into default. A downgrade or default affecting any of the fund’s securities could cause the value of the fund’s shares to decrease. Lower quality debt securities generally have higher rates of interest and may be subject to greater price fluctuations than higher quality debt securities. Credit risk is gauged, in part, by the credit ratings of the debt securities in which the fund invests. However, ratings are only the opinions of the rating agencies issuing them and are not guarantees as to credit quality or an evaluation of market risk. The fund’s investment adviser relies on its own credit analysts to research issuers and issues in seeking to assess credit and default risks.
Investing in lower rated debt instruments— Lower rated bonds and other lower rated debt securities generally have higher rates of interest and involve greater risk of default or price declines due to changes in the issuer’s creditworthiness than those of higher quality debt securities. The market prices of these securities may fluctuate more than the prices of higher quality debt securities and may decline significantly in periods of general economic difficulty. These risks may be increased with respect to investments in junk bonds.
Investing outside the U.S.— Securities of issuers domiciled outside the U.S., or with significant operations or revenues outside the U.S., may lose value because of adverse political, social, economic or market developments (including social instability, regional conflicts, terrorism and war) in the countries or regions in which the issuers operate or generate revenue. These securities may also lose value due to changes in foreign currency exchange rates against the U.S. dollar and/or currencies of other countries. Issuers of these securities may be more susceptible to actions of foreign governments, such as nationalization, currency blockage or the imposition of price controls or punitive taxes, each of which could adversely impact the value of these securities. Securities markets in certain countries may be more volatile and/or less liquid than those in the United States. Investments outside the U.S. may also be subject to different accounting practices and different regulatory, legal and reporting standards and practices, and may be more difficult to value, than those in the United States. In addition, the value of investments outside the U.S. may be reduced by foreign taxes, including foreign withholding taxes on interest and dividends. Further, there may be increased risks of delayed settlement of securities purchased or sold by the fund. The risks of investing outside the U.S. may be heightened in connection with investments in emerging markets.
Investing in emerging markets— Investing in emerging markets may involve risks in addition to and greater than those generally associated with investing in the securities markets of developed countries. For instance, emerging market countries may have less developed legal and accounting systems than those in developed countries. The governments of these countries may be less stable and more likely to impose capital controls, nationalize a company or industry, place restrictions on foreign ownership and on withdrawing sale proceeds of securities from the country, and/or impose punitive taxes that could adversely affect the prices of securities. In addition, the economies of these countries may be dependent on relatively few industries that are more susceptible to local and global changes. Securities markets in these countries can also be relatively small and have substantially lower trading volumes. As a result, securities issued in these countries may be more volatile and less liquid, and may be more difficult to value, than securities issued in countries with more developed economies and/or markets. Less certainty with respect to security valuations may lead to additional challenges and risks in calculating the fund’s net asset value. Additionally, emerging markets are more likely to experience problems with the clearing and settling of trades and the holding of securities by banks, agents and depositories that are less established than those in developed countries.
Investing in mortgage-related and other asset-backed securities— Mortgage-related securities, such as mortgage-backed securities, and other asset-backed securities, include debt obligations that represent interests in pools of mortgages or other income-bearing assets, such as consumer loans or receivables. Such securities often involve risks that are different from or more acute than the risks associated with investing in other types of debt securities. Mortgage-backed and other asset-backed securities are subject to changes in the payment patterns of borrowers of the underlying debt, potentially increasing the volatility of the securities and the fund’s net asset value. When interest rates fall, borrowers are more likely to refinance or prepay their debt before its stated maturity. This may result in the fund having to reinvest the proceeds in lower yielding securities, effectively reducing the fund’s income. Conversely, if interest rates rise and borrowers repay their debt more slowly than expected, the time in which the mortgage-backed and other asset-backed securities are paid off could be extended, reducing the fund’s cash available for reinvestment in higher yielding securities. Mortgage-backed securities are also subject to the risk that underlying borrowers will be unable to meet their obligations and the value of property that secures the
| 16 | American Funds Multi-Sector Income Fund |
mortgages may decline in value and be insufficient, upon foreclosure, to repay the associated loans. Investments in asset-backed securities are subject to similar risks.
Investing in derivatives— The use of derivatives involves a variety of risks, which may be different from, or greater than, the risks associated with investing in traditional securities, such as stocks and bonds. Changes in the value of a derivative may not correlate perfectly with, and may be more sensitive to market events than, the underlying asset, rate or index, and a derivative instrument may expose the fund to losses in excess of its initial investment. Derivatives may be difficult to value, difficult for the fund to buy or sell at an opportune time or price and difficult to terminate or otherwise offset. The fund’s use of derivatives may result in losses to the fund, and investing in derivatives may reduce the fund’s returns and increase the fund’s price volatility. The fund’s counterparty to a derivative transaction (including, if applicable, the fund’s clearing broker, the derivatives exchange or the clearinghouse) may be unable or unwilling to honor its financial obligations in respect of the transaction.
Currency— The prices of, and the income generated by, many debt securities held by the fund may also be affected by changes in relative currency values. If the U.S. dollar appreciates against foreign currencies, the value in U.S. dollars of the fund’s securities denominated in such currencies would generally fall and vice versa. U.S. dollar-denominated securities of foreign issuers may also be affected by changes in relative currency values.
Liquidity risk— Certain fund holdings may be or become difficult or impossible to sell, particularly during times of market turmoil. Illiquidity may result from the lack of an active market for a holding, legal or contractual restrictions on resale, or the reduced number and capacity of market participants to make a market in such holding. Market prices for less liquid or illiquid holdings may be volatile, and reduced liquidity may have an adverse impact on the market price of such holdings. Additionally, the sale of less liquid or illiquid holdings may involve substantial delays (including delays in settlement) and additional costs and the fund may be unable to sell such holdings when necessary to meet its liquidity needs or may be forced to sell at a loss.
Management— The investment adviser to the fund actively manages the fund’s investments. Consequently, the fund is subject to the risk that the methods and analyses, including models, tools and data, employed by the investment adviser in this process may be flawed or incorrect and may not produce the desired results. This could cause the fund to lose value or its investment results to lag relevant benchmarks or other funds with similar objectives.
5. Certain investment techniques
Futures contracts— The fund has entered into futures contracts, which provide for the future sale by one party and purchase by another party of a specified amount of a specific financial instrument for a specified price, date, time and place designated at the time the contract is made. Futures contracts are used to strategically manage the fund’s interest rate sensitivity by increasing or decreasing the duration of the fund or a portion of the fund’s portfolio.
Upon entering into futures contracts, and to maintain the fund’s open positions in futures contracts, the fund is required to deposit with a futures broker, known as a futures commission merchant (“FCM”), in a segregated account in the name of the FCM an amount of cash, U.S. government securities or other liquid securities, known as initial margin. The margin required for a particular futures contract is set by the exchange on which the contract is traded to serve as collateral, and may be significantly modified from time to time by the exchange during the term of the contract. Securities deposited as initial margin, if any, are disclosed in the investment portfolio and cash deposited as initial margin, if any, is reflected as restricted cash pledged for futures contracts in the fund’s statement of assets and liabilities.
On a daily basis, the fund pays or receives variation margin based on the increase or decrease in the value of the futures contracts and records variation margin on futures contracts in the statement of assets and liabilities. In addition, the fund segregates liquid assets equivalent to the fund’s outstanding obligations under the contract in excess of the initial margin and variation margin, if any. Futures contracts may involve a risk of loss in excess of the variation margin shown on the fund’s statement of assets and liabilities. The fund records realized gains or losses at the time the futures contract is closed or expires. Net realized gains or losses and net unrealized appreciation or depreciation from futures contracts are recorded in the fund’s statement of operations. The average month-end notional amount of futures contracts while held was $32,950,000.
Forward currency contracts— The fund has entered into forward currency contracts, which represent agreements to exchange currencies on specific future dates at predetermined rates. The fund’s investment adviser uses forward currency contracts to manage the fund’s exposure to changes in exchange rates. Upon entering into these contracts, risks may arise from the potential inability of counterparties to meet the terms of their contracts and from possible movements in exchange rates.
| American Funds Multi-Sector Income Fund | 17 |
On a daily basis, the fund’s investment adviser values forward currency contracts and records unrealized appreciation or depreciation for open forward currency contracts in the fund’s statement of assets and liabilities. Realized gains or losses are recorded at the time the forward currency contract is closed or offset by another contract with the same broker for the same settlement date and currency.
Closed forward currency contracts that have not reached their settlement date are included in the respective receivables or payables for closed forward currency contracts in the fund’s statement of assets and liabilities. Net realized gains or losses from closed forward currency contracts and net unrealized appreciation or depreciation from open forward currency contracts are recorded in the fund’s statement of operations. The average month-end notional amount of open forward currency contracts while held was $17,000.
Interest rate swaps— The fund has entered into interest rate swap contracts, which are agreements to exchange one stream of future interest payments for another based on a specified notional amount. Typically, interest rate swaps exchange a fixed interest rate for a payment that floats relative to a benchmark or vice versa. The fund’s investment adviser uses interest rate swaps to seek to manage the interest rate sensitivity of the fund by increasing or decreasing the duration of the fund or a portion of the fund’s portfolio. Risks may arise as a result of the fund’s investment adviser incorrectly anticipating changes in interest rates, increased volatility, reduced liquidity and the potential inability of counterparties to meet the terms of their agreements.
Upon entering into an interest rate swap contract, the fund is required to deposit cash, U.S. government securities or other liquid securities, which is known as initial margin. Generally, the initial margin required for a particular interest rate swap is set and held as collateral by the clearinghouse on which the contract is cleared. The amount of initial margin required may be significantly modified from time to time by the clearinghouse during the term of the contract.
On a daily basis, the fund’s investment adviser records daily interest accruals related to the exchange of future payments as a receivable and payable in the fund’s statement of assets and liabilities. The fund also pays or receives a variation margin based on the increase or decrease in the value of the interest rate swaps, including accrued interest, and records variation margin on interest rate swaps in the statement of assets and liabilities. The fund records realized gains and losses on both the net accrued interest and any gain or loss recognized at the time the interest rate swap is closed or expires. Net realized gains or losses, as well as any net unrealized appreciation or depreciation, from interest rate swaps are recorded in the fund’s statement of operations. As of June 30, 2019, the fund did not have any interest rate swaps.
Credit default swap indices— The fund has entered into centrally cleared credit default swap agreements on credit indices (“CDSI”) that involve one party (the protection buyer) making a stream of payments to another party (the protection seller) in exchange for the right to receive a specified return upon the occurrence of a credit event, such as a default or restructuring, with respect to any of the underlying issuers (reference obligations) in the referenced index. The fund’s investment adviser uses credit default swaps to assume exposure to a diversified portfolio of credits or to hedge against existing credit risks.
CDSI are portfolios of credit instruments or exposures designed to be representative of some part of the credit market, such as the high-yield or investment-grade credit market. CDSI are generally traded using standardized terms, including a fixed spread and standard maturity dates, and reference all the names in the index. If there is a credit event, it is settled based on that name’s weight in the index. The composition of the underlying issuers or obligations within a particular index may change periodically, usually every six months. A specified credit event may affect all or individual underlying reference obligations included in the index, and will be settled based upon the relative weighting of the affected obligation(s) within the index. The value of each CDSI can be used as a measure of the current payment/performance risk of the CDSI and represents the likelihood of an expected liability or profit should the notional amount of the CDSI be closed or sold as of the period end. An increasing value, as compared to the notional amount of the CDSI, represents a deterioration of the referenced indices’ credit soundness and a greater likelihood of risk of default or other credit event occurring as defined under the terms of the agreement. When the fund provides sell protection, its maximum exposure is the notional amount of the credit default swap agreement.
Upon entering into a centrally cleared CDSI contract, the fund is required to deposit with a derivatives clearing member (“DCM”) in a segregated account in the name of the DCM an amount of cash, U.S. government securities or other liquid securities, which is known as initial margin. Generally, the initial margin required for a particular credit default swap is set and held as collateral by the clearinghouse on which the contract is cleared. The amount of initial margin required may be significantly modified from time to time by the clearinghouse during the term of the contract. Securities deposited as initial margin are designated on the investment portfolio.
On a daily basis, interest accruals related to the exchange of future payments are recorded as a receivable and payable in the fund’s statement of assets and liabilities. The fund also pays or receives a variation margin based on the increase or decrease in the value of the CDSI, and records variation margin in the statement of assets and liabilities. The fund records realized gains and losses on both the net accrued interest and any gain or loss recognized at the time the swap is closed or expires. Net realized gains or losses, as well as any net
| 18 | American Funds Multi-Sector Income Fund |
unrealized appreciation or depreciation, from credit default swaps are recorded in the fund’s statement of operations. The average month-end notional amount of credit default swaps while held was $4,969,000.
The following tables identify the location and fair value amounts on the fund’s statement of assets and liabilities and the effect on the fund’s statement of operations resulting from the fund’s use of futures contracts, interest rate swaps and credit default swaps as of, or for the six months ended, June 30, 2019 (dollars in thousands):
| | | | | Assets | | | Liabilities | |
| | | | | Location on statement of | | | | | Location on statement of | | | |
| Contracts | | Risk type | | assets and liabilities | | Value | | | assets and liabilities | | Value | |
| Futures | | Interest | | Unrealized appreciation* | | $ | 177 | | | Unrealized depreciation* | | $ | 310 | |
| Forward currency | | Currency | | Unrealized appreciation on open forward currency contracts | | | — | | | Unrealized depreciation on open forward currency contracts | | | — | |
| Swap | | Credit | | Unrealized appreciation* | | | — | | | Unrealized depreciation* | | | 36 | |
| | | | | | | $ | 177 | | | | | $ | 346 | |
| | | | | Net realized gain (loss) | | | Net unrealized depreciation | |
| | | | | Location on statement of | | | | | Location on statement of | | | |
| Contracts | | Risk type | | operations | | Value | | | operations | | Value | |
| Futures | | Interest | | Net realized gain on futures contracts | | $ | 57 | | | Net unrealized depreciation on futures contracts | | $ | (133 | ) |
| Swap | | Interest | | Net realized loss on swap contracts | | | (12 | ) | | Net unrealized appreciation on swap contracts | | | — | |
| Swap | | Credit | | Net realized gain on swap contracts | | | 7 | | | Net unrealized depreciation on swap contracts | | | (36 | ) |
| | | | | | | $ | 52 | | | | | $ | (169 | ) |
| * | Includes cumulative appreciation/depreciation on futures contracts, interest rate swaps and credit default swaps as reported in the applicable tables following the fund’s investment portfolio. Only current day’s variation margin is reported within the statement of assets and liabilities. |
Collateral— The fund participates in a collateral program that calls for the fund to either receive or pledge highly liquid assets, such as cash or U.S. government securities, as collateral due to its use of futures contracts, forward currency contracts, interest rate swaps and credit default swaps. For futures contracts, interest rate swaps and credit default swaps, the program calls for the fund to pledge collateral for initial and variation margin by contract. For forward currency contracts, the program calls for the fund to either receive or pledge collateral based on the net gain or loss on unsettled forward currency contracts by counterparty. The purpose of the collateral is to cover potential losses that could occur in the event that either party cannot meet its contractual obligation. Non-cash collateral pledged by the fund, if any, is disclosed in the fund’s investment portfolio, and cash collateral pledged by the fund, if any, is held in a segregated account with the fund’s custodian, which is reflected as pledged cash in the fund’s statement of assets and liabilities.
6. Taxation and distributions
Federal income taxation— The fund complies with the requirements under Subchapter M of the Internal Revenue Code applicable to mutual funds and intends to distribute substantially all of its net taxable income and net capital gains each year. The fund is not subject to income taxes to the extent such distributions are made. Therefore, no federal income tax provision is required.
As of and during the period ended June 30, 2019, the fund did not have a liability for any unrecognized tax benefits. The fund recognizes interest and penalties, if any, related to unrecognized tax benefits as income tax expense in the statement of operations. During the period, the fund did not incur any significant interest or penalties.
The fund’s tax returns are not subject to examination by federal, state and, if applicable, non-U.S. tax authorities after the expiration of each jurisdiction’s statute of limitations, which is generally three years after the date of filing but can be extended in certain jurisdictions.
Non-U.S. taxation— Dividend and interest income are recorded net of non-U.S. taxes paid. The fund may file withholding tax reclaims in certain jurisdictions to recover a portion of amounts previously withheld. These reclaims are recorded when the amount is known and there are no significant uncertainties on collectability. Gains realized by the fund on the sale of securities in certain countries, if any, may be subject to non-U.S. taxes. If applicable, the fund records an estimated deferred tax liability based on unrealized gains to provide for potential non-U.S. taxes payable upon the sale of these securities.
| American Funds Multi-Sector Income Fund | 19 |
Distributions— Distributions paid to shareholders are based on net investment income and net realized gains determined on a tax basis, which may differ from net investment income and net realized gains for financial reporting purposes. These differences are due primarily to different treatment for items such as currency gains and losses; short-term capital gains and losses; cost of investments sold and income on certain investments. The fiscal year in which amounts are distributed may differ from the year in which the net investment income and net realized gains are recorded by the fund for financial reporting purposes.
As of June 30, 2019, the tax basis unrealized appreciation (depreciation) and cost of investments were as follows (dollars in thousands):
| Gross unrealized appreciation on investments | | $ | 1,617 | |
| Gross unrealized depreciation on investments | | | (517 | ) |
| Net unrealized appreciation on investments | | | 1,100 | |
| Cost of investments | | | 49,477 | |
Tax-basis distributions paid or accrued to shareholders from ordinary income were as follows (dollars in thousands):
| Share class | | For the period March 22, 2019*
to June 30, 2019 | |
| Class A | | | $ | 556 | |
| Class F2 | | | | 1 | |
| Class F3 | | | | — | † |
| Class R6 | | | | — | † |
| Total | | | $ | 557 | |
| * | Commencement of operations. |
| † | Amount less than one thousand. |
7. Fees and transactions with related parties
CRMC, the fund’s investment adviser, is the parent company of American Funds Distributors,® Inc. (“AFD”), the principal underwriter of the fund’s shares, and American Funds Service Company® (“AFS”), the fund’s transfer agent. CRMC, AFD and AFS are considered related parties to the fund.
Investment advisory services— The fund has an investment advisory and service agreement with CRMC that provides for monthly fees accrued daily. These fees are based on a series of decreasing annual rates beginning with 0.440% on the first $1.5 billion of daily net assets and decreasing to 0.390% on such assets in excess of $1.5 billion. For the period ended June 30, 2019, the investment advisory services fee was $61,000, which was equivalent to an annualized rate of 0.440% of average daily net assets.
Miscellaneous fee reimbursements— CRMC has agreed to reimburse a portion of miscellaneous fees and expenses of the fund during its startup period. This reimbursement may be adjusted or discontinued by CRMC, subject to any restrictions in the fund’s prospectus. For the six months ended June 30, 2019, total fees and expenses reimbursed by CRMC were $6,000. Fees and expenses in the statement of operations are presented gross of any reimbursements from CRMC.
Class-specific fees and expenses— Expenses that are specific to individual share classes are accrued directly to the respective share class. The principal class-specific fees and expenses are further described below:
Distribution services— The fund has a plan of distribution for Class A. Under the plan, the board of trustees approves certain categories of expenses that are used to finance activities primarily intended to sell fund shares and service existing accounts. The plan provides for payments, based on an annualized percentage of average daily net assets. For Class A, the currently approved limit and plan limit is 0.30%. Class A may use up to 0.30% of average daily net assets to pay service fees, or to compensate AFD for paying service fees, to firms that have entered into agreements with AFD to provide certain shareholder services. The remaining amounts available to be paid under the plan are paid to dealers to compensate them for their sales activities.
For Class A, distribution-related expenses include the reimbursement of dealer and wholesaler commissions paid by AFD for certain shares sold without a sales charge. The share class reimburses AFD for amounts billed within the prior 15 months but only to the extent that the overall annual expense limits are not exceeded. As of June 30, 2019, there were no unreimbursed expenses subject to reimbursement for Class A.
| 20 | American Funds Multi-Sector Income Fund |
Transfer agent services— The fund has a shareholder services agreement with AFS under which the fund compensates AFS for providing transfer agent services to each of the fund’s share classes. These services include recordkeeping, shareholder communications and transaction processing. In addition, the fund reimburses AFS for amounts paid to third parties for performing transfer agent services on behalf of fund shareholders.
Administrative services— The fund has an administrative services agreement with CRMC under which the fund compensates CRMC for providing administrative services to all share classes. Administrative services are provided by CRMC and its affiliates to help assist third parties providing non-distribution services to fund shareholders. These services include providing in depth information on the fund and market developments that impact fund investments. Administrative services also include, but are not limited to, coordinating, monitoring and overseeing third parties that provide services to fund shareholders. The agreement provides the fund the ability to charge an administrative services fee at the annual rate of 0.05% of the daily net assets attributable to each share class of the fund. Currently Class A shares pay an administrative services fee at the annual rate of 0.01% of daily net assets and all other share classes pay a fee at the annual rate of 0.05% of their respective daily net assets. The fund’s board of trustees authorized effective July 1, 2019, an administrative services fee at the annual rate of 0.03% of the daily net assets attributable to each share class of the fund (which could increase as noted above) for CRMC’s provision of administrative services.
For the period ended June 30, 2019, class-specific expenses under the agreements were as follows (dollars in thousands):
| | | Distribution | | Transfer agent | | | Administrative | |
| Share class | | services | | services | | | services | |
| Class A | | | $— | | | $13 | | | | $1 | |
| Class F2 | | | Not applicable | | | — | | | | — | |
| Class F3 | | | Not applicable | | | — | * | | | — | * |
| Class R6 | | | Not applicable | | | — | * | | | — | * |
| Total class-specific expenses | | | $— | | | $13 | | | | $1 | |
| * | Amount less than one thousand. |
Trustees’ deferred compensation— Trustees who are unaffiliated with CRMC may elect to defer the cash payment of part or all of their compensation. These deferred amounts, which remain as liabilities of the fund, are treated as if invested in shares of the fund or other American Funds. These amounts represent general, unsecured liabilities of the fund and vary according to the total returns of the selected funds. Trustees’ compensation in the fund’s statement of operations reflects the current fees (either paid in cash or deferred).
Affiliated officers and trustees— Officers and certain trustees of the fund are or may be considered to be affiliated with CRMC, AFD and AFS. No affiliated officers or trustees received any compensation directly from the fund.
Investment in CCF— The fund holds shares of CCF, an institutional prime money market fund managed by CRMC. CCF invests in high-quality, short-term money market instruments. CCF is used as the primary investment vehicle for the fund’s short-term investments. CCF shares are only available for purchase by CRMC, its affiliates, and other funds managed by CRMC and are not available to the public. CRMC does not receive an investment advisory services fee from CCF.
Security transactions with related funds— The fund may purchase securities from, or sell securities to, other funds managed by CRMC (or funds managed by certain affiliates of CRMC) under procedures adopted by the fund’s board of trustees. The funds involved in such transactions are considered related by virtue of having a common investment adviser (or affiliated investment advisers), common trustees and/or common officers. When such transactions occur, each transaction is executed at the current market price of the security and no brokerage commissions or fees are paid in accordance with Rule 17a-7 of the 1940 Act.
| American Funds Multi-Sector Income Fund | 21 |
8. Capital share transactions
Capital share transactions in the fund were as follows (dollars and shares in thousands):
| | | Sales | | | Reinvestments of
distributions | | | Repurchases | | | Net increase | |
| Share class | | Amount | | | Shares | | | Amount | | | Shares | | | Amount | | | Shares | | | Amount | | | Shares | |
| | | | | | | | | | | | | | | | | | | | | | | | | |
| For the period March 22, 2019* to June 30, 2019 | | | | | | | | | | | | | | | | |
| | | | | | | | | | | | | | | | | | | | | | | | | |
| Class A | | $ | 49,925 | | | | 4,993 | | | $ | — | | | | — | | | $ | — | | | | — | | | $ | 49,925 | | | | 4,993 | |
| Class F2 | | | 25 | | | | 2 | | | | — | | | | — | | | | — | | | | — | | | | 25 | | | | 2 | |
| Class F3 | | | 25 | | | | 2 | | | | — | | | | — | | | | — | | | | — | | | | 25 | | | | 2 | |
| Class R6 | | | 25 | | | | 3 | | | | — | | | | — | | | | — | | | | — | | | | 25 | | | | 3 | |
| Total net increase | | $ | 50,000 | | | 5,000 | | | $ | — | | | | — | | | $ | — | | | | — | | | $ | 50,000 | | | | 5,000 | |
| * | Commencement of operations. |
9. Investment transactions
The fund made purchases and sales of investment securities, excluding short-term securities and U.S. government obligations, if any, of $7,594,000 and $8,954,000, respectively, during the period March 22, 2019 to June 30, 2019.
| 22 | American Funds Multi-Sector Income Fund |
Financial highlights
| | | | | | Income from investment operations1 | | | | | | | | | | | | | | | | | | | | | | |
| Period ended | | Net asset
value,
beginning
of period | | | Net
investment
income | | | Net gains on
securities (both
realized and
unrealized) | | | Total from
investment
operations | | | Dividends
(from net
investment
income) | | | Net asset
value, end
of period | | | Total
return2,3 | | | Net assets,
end of period
(in thousands) | | | Ratio of
expenses
to average net
assets before
reimbursements/
waivers | | | Ratio of
expenses
to average net
assets after
reimbursements/
waivers2 | | | Ratio of
net income
to average
net assets2 | |
| Class A: | | | | | | | | | | | | | | | | | | | | | | | | | | | | | | | | | | | | | | | | | | | | |
| 6/30/20194,5,6 | | $ | 10.00 | | | $ | .12 | | | $ | .28 | | | $ | .40 | | | $ | (.11 | ) | | $ | 10.29 | | | | 4.03 | %7 | | $ | 51,356 | | | | .21 | %7 | | | .19 | %7 | | | 1.20 | %7 |
| Class F2: | | | | | | | | | | | | | | | | | | | | | | | | | | | | | | | | | | | | | | | | | | | | |
| 6/30/20194,5,6 | | | 10.00 | | | | .12 | | | | .28 | | | | .40 | | | | (.11 | ) | | | 10.29 | | | | 4.03 | 7 | | | 26 | | | | .21 | 7 | | | .20 | 7 | | | 1.19 | 7 |
| Class F3: | | | | | | | | | | | | | | | | | | | | | | | | | | | | | | | | | | | | | | | | | | | | |
| 6/30/20194,5,6 | | | 10.00 | | | | .12 | | | | .28 | | | | .40 | | | | (.11 | ) | | | 10.29 | | | | 4.03 | 7 | | | 26 | | | | .21 | 7 | | | .20 | 7 | | | 1.19 | 7 |
| Class R6: | | | | | | | | | | | | | | | | | | | | | | | | | | | | | | | | | | | | | | | | | | | | |
| 6/30/20194,5,6 | | | 10.00 | | | | .12 | | | | .28 | | | | .40 | | | | (.11 | ) | | | 10.29 | | | | 4.03 | 7 | | | 26 | | | | .21 | 7 | | | .20 | 7 | | | 1.19 | 7 |
| | | For the period | |
| | | 3/22/2019 to 6/30/20194,5,7 | |
| Portfolio turnover rate for all share classes | | 159% | |
| 1 | Based on average shares outstanding. |
| 2 | This column reflects the impact, if any, of certain reimbursements from CRMC. During the periods shown, CRMC reimbursed a portion of miscellaneous fees and expenses. |
| 3 | Total returns exclude any applicable sales charges, including contingent deferred sales charges. |
| 4 | Based on operations for a period that is less than a full year. |
| 5 | For the period March 22, 2019, commencement of operations, through June 30, 2019. |
| 6 | Unaudited. |
| 7 | Not annualized. |
See notes to financial statements.
| American Funds Multi-Sector Income Fund | 23 |
As a fund shareholder, you incur two types of costs: (1) transaction costs, such as initial sales charges on purchase payments and contingent deferred sales charges on redemptions (loads), and (2) ongoing costs, including management fees, distribution and service (12b-1) fees, and other expenses. This example is intended to help you understand your ongoing costs (in dollars) of investing in the fund so you can compare these costs with the ongoing costs of investing in other mutual funds. The example is based on an investment of $1,000 invested at the beginning of the period and held for the entire period.
Actual expenses:
The first line of each share class in the table on the following page provides information about actual account values and actual expenses. You may use the information in this line, together with the amount you invested, to estimate the expenses that you paid over the period. Simply divide your account value by $1,000 (for example, an $8,600 account value divided by $1,000 = 8.6), then multiply the result by the number in the first line under the heading titled “Expenses paid during period” to estimate the expenses you paid on your account during this period.
Hypothetical example for comparison purposes:
The second line of each share class in the table on the following page provides information about hypothetical account values and hypothetical expenses based on the actual expense ratio for the share class and an assumed rate of return of 5.00% per year before expenses, which is not the actual return of the share class. The hypothetical account values and expenses may not be used to estimate the actual ending account balance or expenses you paid for the period. You may use this information to compare the ongoing costs of investing in the fund and other funds. To do so, compare this 5.00% hypothetical example with the 5.00% hypothetical examples that appear in the shareholder reports of the other funds.
Notes:
Retirement plan participants may be subject to certain fees charged by the plan sponsor, and Class F-2 and F-3 shareholders may be subject to fees charged by financial intermediaries, typically ranging from 0.75% to 1.50% of assets annually depending on services offered. You can estimate the impact of these fees by adding the amount of the fees to the total estimated expenses you paid on your account during the period as calculated above. In addition, your ending account value would be lower by the amount of these fees.
Note that the expenses shown in the table on the following page are meant to highlight your ongoing costs only and do not reflect any transactional costs, such as sales charges (loads). Therefore, the second line of each share class in the table is useful in comparing ongoing costs only and will not help you determine the relative total costs of owning different funds. In addition, if these transactional costs were included, your costs would have been higher.
| | | Beginning | | | Ending
account value | | | Expenses paid | | | Annualized | |
| | | account value | | | 6/30/2019 | | | during period* | | | expense ratio† | |
| Class A – actual return | | $ | 1,000.00 | | | $ | 1,040.32 | | | $ | 1.98 | | | | .71 | % |
| Class A – assumed 5% return | | | 1,000.00 | | | | 1,021.27 | | | | 3.56 | | | | .71 | |
| Class F2 – actual return | | | 1,000.00 | | | | 1,040.29 | | | | 2.04 | | | | .73 | |
| Class F2 – assumed 5% return | | | 1,000.00 | | | | 1,021.17 | | | | 3.66 | | | | .73 | |
| Class F3 – actual return | | | 1,000.00 | | | | 1,040.27 | | | | 2.04 | | | | .73 | |
| Class F3 – assumed 5% return | | | 1,000.00 | | | | 1,021.17 | | | | 3.66 | | | | .73 | |
| Class R6 – actual return | | | 1,000.00 | | | | 1,040.27 | | | | 2.04 | | | | .73 | |
| Class R6 – assumed 5% return | | | 1,000.00 | | | | 1,021.17 | | | | 3.66 | | | | .73 | |
| * | The “expenses paid during period” are equal to the “annualized expense ratio,” multiplied by the average account value over the period, multiplied by the number of days in the period, and divided by 365 (to reflect the one-half year period). |
| † | The period for the “annualized expense ratio,” and the “actual return” line is based on the number of days from March 22, 2019 (commencement of operations), through June 30, 2019. The “assumed 5% return” line is based on 182 days. |
| 24 | American Funds Multi-Sector Income Fund |
Approval of Investment Advisory and Service Agreement
American Funds Multi-Sector Income Fund’s board has approved the fund’s Investment Advisory and Service Agreement (the “agreement”) with Capital Research and Management Company (“CRMC”) for an initial term through April 30, 2020. The board determined in the exercise of their business judgment that approving the agreement was in the best interests of the fund and its shareholders.
In reaching this decision, the board took into account information furnished to them throughout the year and otherwise provided to them, as well as information prepared specifically in connection with their review of the agreement, and were advised by their independent counsel with respect to the matters considered. The board considered the following factors, among others, but did not identify any single issue or particular piece of information that, in isolation, was the controlling factor, and each board and committee member did not necessarily attribute the same weight to each factor.
1. Nature, extent and quality of services
The board considered the depth and quality of CRMC’s investment management process, including its global research capabilities; the experience, capability and integrity of its senior management and other personnel; the low turnover rates of its key personnel; the overall financial strength and stability of CRMC and the Capital Group organization; the resources and systems CRMC devotes to investment management (the manner in which the Fund’s assets are managed, including liquidity management), compliance, trading, portfolio accounting and other services; and the ongoing evolution of CRMC’s organizational structure designed to maintain and strengthen these qualities. The board also considered the nature, extent and quality of administrative, compliance and shareholder services provided by CRMC to the fund under the agreement and other agreements, as well as the benefits to fund shareholders from investing in a fund that is part of a large family of funds. The board concluded that the nature, extent and quality of the services to be provided by CRMC should benefit the fund and its shareholders.
2. Investment results
The board considered the manner in which CRMC proposed to manage the fund in light of its objectives of providing a high level of current income and capital appreciation. It also considered the proposed investment policies and restrictions on the fund, and CRMC’s experience in managing similar funds. The board concluded that CRMC’s record indicated that its management should benefit the fund and its shareholders.
3. Advisory fees and total expenses
The board reviewed the proposed advisory fee schedule of the fund compared to those of other relevant funds and noted CRMC’s agreement to establish the initial rate assuming fund assets of a reasonable size. The board concluded that the fund’s cost structure was fair and reasonable in relation to the services that CRMC proposed to provide, and that the fund’s shareholders would receive reasonable value in return for the advisory fees and other amounts paid to CRMC by the fund.
| American Funds Multi-Sector Income Fund | 25 |
4. Ancillary benefits
The board considered a variety of other benefits that CRMC and its affiliates receive as a result of CRMC’s relationship with the fund and other American Funds, including fees for administrative services provided to certain share classes; fees paid to CRMC’s affiliated transfer agent; sales charges and distribution fees received and retained by the fund’s principal underwriter, an affiliate of CRMC; and possible ancillary benefits to CRMC and its institutional management affiliates in managing other investment vehicles. The board reviewed CRMC’s portfolio trading practices, noting that through December 31, 2018, CRMC benefited from research obtained with commissions from portfolio transactions made on behalf of the fund and since that time has undertaken to bear the cost of obtaining such research. The board took these ancillary benefits into account in evaluating the reasonableness of the advisory fees and other amounts proposed to be paid to CRMC by the fund.
5. Adviser financial information
The board reviewed information regarding CRMC’s costs of providing services to the American Funds, including personnel, systems and resources of investment, compliance, trading, accounting and other administrative operations. It considered CRMC’s costs and related cost allocation methodology as well as its track record of investing in technology, infrastructure and staff to maintain and expand services and capabilities, respond to industry and regulatory developments, and attract and retain qualified personnel. The board noted information regarding the compensation structure for CRMC’s investment professionals. It reviewed information on the profitability of the investment adviser and its affiliates. The board also compared CRMC’s profitability and compensation data to the reported results and data of several large, publicly held investment management companies. The board noted the competitiveness and cyclicality of both the mutual fund industry and the capital markets, and the importance in that environment of CRMC’s long-term profitability for maintaining its independence, company culture and management continuity. The board further considered the breakpoint discounts in the fund’s advisory fee structure and CRMC’s sharing of potential economies of scale, or efficiencies, through breakpoints and other fee reductions and costs voluntarily absorbed. The board concluded that the fund’s advisory fee structure reflected a reasonable sharing of benefits between CRMC and the fund’s shareholders.
| 26 | American Funds Multi-Sector Income Fund |
Office of the fund
6455 Irvine Center Drive
Irvine, CA 92618-4518
Investment adviser
Capital Research and
Management Company
333 South Hope Street
Los Angeles, CA 90071-1406
Transfer agent for shareholder accounts
American Funds Service Company
(Write to the address near you.)
P.O. Box 6007
Indianapolis, IN 46206-6007
P.O. Box 2280
Norfolk, VA 23501-2280
Custodian of assets
State Street Bank and Trust Company
One Lincoln Street
Boston, MA 02111
Counsel
Morgan, Lewis & Bockius LLP
One Federal Street
Boston, MA 02110-1726
Independent registered public accounting firm
Deloitte & Touche LLP
695 Town Center Drive
Suite 1000
Costa Mesa, CA 92626-7188
Principal underwriter
American Funds Distributors, Inc.
333 South Hope Street
Los Angeles, CA 90071-1406
Investors should carefully consider investment objectives, risks, charges and expenses. This and other important information is contained in the fund prospectus and summary prospectus, which can be obtained from your financial professional and should be read carefully before investing. You may also call American Funds Service Company (AFS) at (800) 421-4225 or visit the American Funds website at americanfunds.com.
“American Funds Proxy Voting Procedures and Principles” — which describes how we vote proxies relating to portfolio securities — is available on the American Funds website or upon request by calling AFS. The fund files its proxy voting record with the U.S. Securities and Exchange Commission (SEC) for the 12 months ended June 30 by August 31. The proxy voting record is available free of charge on the SEC website at sec.gov and on the American Funds website.
American Funds Multi-Sector Income Fund files a complete list of its portfolio holdings with the SEC for the first and third quarters of each fiscal year on Form N-PORT-EX. This filing is available free of charge on the SEC website. Additionally, the list of portfolio holdings is available by calling AFS.
This report is for the information of shareholders of American Funds Multi-Sector Income Fund, but it also may be used as sales literature when preceded or accompanied by the current prospectus or summary prospectus, which gives details about charges, expenses, investment objectives and operating policies of the fund. If used as sales material after September 30, 2019, this report must be accompanied by an American Funds statistical update for the most recently completed calendar quarter.
American Funds Distributors, Inc., member FINRA.
The Capital Advantage®
Since 1931, Capital Group, home of American Funds, has helped investors pursue long-term investment success. Our consistent approach — in combination with The Capital SystemSM— has resulted in superior outcomes.
| | Aligned with investor success |
| | We base our decisions on a long-term perspective, which we believe aligns our goals with the interests of our clients. Our portfolio managers average 27 years of investment experience, including 20 years at our company, reflecting a career commitment to our long-term approach.1 |
| | |
| | The Capital System |
| | The Capital System combines individual accountability with teamwork. Funds using The Capital System are divided into portions that are managed independently by investment professionals with diverse backgrounds, ages and investment approaches. An extensive global research effort is the backbone of our system. |
| | |
| | American Funds’ superior outcomes |
| | Equity funds have beaten their Lipper peer indexes in 92% of 10-year periods and 99% of 20-year periods.2Fixed income funds have helped investors achieve diversification through attention to correlation between bonds and equities.3Fund management fees have been among the lowest in the industry.4 |
| | 1 | Portfolio manager experience as of December 31, 2018. |
| | 2 | Based on Class F-2 share results for rolling periods through December 31, 2018. Periods covered are the shorter of the fund’s lifetime or since the comparable Lipper index inception date (except Capital Income Builder and SMALLCAP World Fund, for which the Lipper average was used). Expenses differ for each share class, so results will vary. |
| | 3 | Based on Class F-2 share results, as of December 31, 2018. Fourteen of our 15 American Funds fixed income funds that have been in existence for the three-year period showed a three-year correlation below 0.2. Standard & Poor’s 500 Composite Index was used as an equity market proxy. Correlation based on monthly total returns. Correlation is a statistical measure of how two securities move in relation to each other. A correlation ranges from –1 to 1. A positive correlation close to 1 implies that as one security moves, either up or down, the other security will move in “lockstep,” in the same direction. A negative correlation close to –1 indicates that the securities have moved in the opposite direction. |
| | 4 | On average, our management fees were in the lowest quintile 70% of the time, based on the 20-year period ended December 31, 2018, versus comparable Lipper categories, excluding funds of funds. |
Class F-2 shares were first offered on August 1, 2008. Class F-2 share results prior to the date of first sale are hypothetical based on Class A share results without a sales charge, adjusted for typical estimated expenses. Results for certain funds with an inception date after August 1, 2008, also include hypothetical returns because those funds’ Class F-2 shares sold after the funds’ date of first offering. Please see americanfunds.com for more information on specific expense adjustments and the actual dates of first sale.
All Capital Group trademarks mentioned are owned by The Capital Group Companies, Inc., an affiliated company or fund. All other company and product names mentioned are the property of their respective companies.

ITEM 2 – Code of Ethics
Not applicable for filing of semi-annual reports to shareholders.
ITEM 3 – Audit Committee Financial Expert
Not applicable for filing of semi-annual reports to shareholders.
ITEM 4 – Principal Accountant Fees and Services
Not applicable for filing of semi-annual reports to shareholders.
ITEM 5 – Audit Committee of Listed Registrants
Not applicable to this Registrant, insofar as the Registrant is not a listed issuer as defined in Rule 10A-3 under the Securities Exchange Act of 1934.
ITEM 6 – Schedule of Investments
Not applicable, insofar as the schedule is included as part of the report to shareholders filed under Item 1 of this Form.
ITEM 7 – Disclosure of Proxy Voting Policies and Procedures for Closed-End Management Investment Companies
Not applicable to this Registrant, insofar as the Registrant is not a closed-end management investment company.
ITEM 8 – Portfolio Managers of Closed-End Management Investment Companies
Not applicable to this Registrant, insofar as the Registrant is not a closed-end management investment company.
ITEM 9 – Purchases of Equity Securities by Closed-End Management Investment Company and Affiliated Purchasers
Not applicable to this Registrant, insofar as the Registrant is not a closed-end management investment company.
ITEM 10 – Submission of Matters to a Vote of Security Holders
There have been no material changes to the procedures by which shareholders may recommend nominees to the Registrant’s board of trustees since the Registrant last submitted a proxy statement to its shareholders. The procedures are as follows. The Registrant has a nominating and governance committee comprised solely of persons who are not considered ‘‘interested persons’’ of the Registrant within the meaning of the Investment Company Act of 1940, as amended. The committee periodically reviews such issues as the board’s composition, responsibilities, committees, compensation and other relevant issues, and recommends any appropriate changes to the full board of trustees. While the committee normally is able to identify from its own resources an ample number of qualified candidates, it will consider shareholder suggestions of persons to be considered as nominees to fill future vacancies on the board. Such suggestions must be sent in writing to the nominating and governance committee of the Registrant, c/o the Registrant’s Secretary, and must be accompanied by complete biographical and occupational data on the prospective nominee, along with a written consent of the prospective nominee for consideration of his or her name by the nominating and governance committee.
ITEM 11 – Controls and Procedures
| (a) | The Registrant’s Principal Executive Officer and Principal Financial Officer have concluded, based on their evaluation of the Registrant’s disclosure controls and procedures (as such term is defined in Rule 30a-3 under the Investment Company Act of 1940), that such controls and procedures are adequate and reasonably designed to achieve the purposes described in paragraph (c) of such rule. |
| | |
| (b) | There were no changes in the Registrant’s internal controls over financial reporting (as defined in Rule 30a-3(d) under the Investment Company Act of 1940) that occurred during the Registrant’s semi-annual period covered by this report that has materially affected, or is reasonably likely to materially affect, the Registrant’s internal control over financial reporting. |
ITEM 12 – Exhibits
| (a)(1) | Not applicable for filing of semi-annual reports to shareholders. |
| | |
| (a)(2) | The certifications required by Rule 30a-2 of the Investment Company Act of 1940 and Sections 302 and 906 of the Sarbanes-Oxley Act of 2002 are attached as exhibits hereto. |
SIGNATURES
Pursuant to the requirements of the Securities Exchange Act of 1934 and the Investment Company Act of 1940, the Registrant has duly caused this report to be signed on its behalf by the undersigned, thereunto duly authorized.
| | AMERICAN FUNDS MULTI-SECTOR INCOME FUND |
| | |
| | By__/s/ Kristine M. Nishiyama____________________ |
| | Kristine M. Nishiyama, Executive Vice President and Principal Executive Officer |
| | |
| | Date: August 30, 2019 |
Pursuant to the requirements of the Securities Exchange Act of 1934 and the Investment Company Act of 1940, this report has been signed below by the following persons on behalf of the Registrant and in the capacities and on the dates indicated.
| By__/s/ Kristine M. Nishiyama_________________ |
Kristine M. Nishiyama, Executive Vice President and Principal Executive Officer |
| |
| Date: August 30, 2019 |
| By ___/s/ Brian C. Janssen __________ |
Brian C. Janssen, Treasurer and Principal Financial Officer |
| |
| Date: August 30, 2019 |