Exhibit 99.1
Diamond S Shipping Inc. Company Introduction September 2019 DSSI LISTED NYSE

2 Disclaimer and Forward - Looking Statements Matters discussed in this presentation may constitute forward-looking statements. Forward-looking statements include statemen ts concerning plans, objectives, goals, strategies, future events or performance, and underlying assumptions. Although management believes tha t these assumptions were reasonable when made, because these assumptions are inherently subject to significant uncertainties and cont ing encies which are difficult or impossible to predict and are beyond the Company’s control, there can be no assurance that the Company wi ll achieve or accomplish these expectations, beliefs or projections. Some factors that, in the Company’s view, could cause actual results or conditions to differ materially from those discussed in the forward-looking statements include: the cyclicality of the tanker industry; changes in economic and competitive conditions af fec ting the Company’s business, including market fluctuations in charter rates; risks related to an oversupply of tanker vessels; changes in fuel prices, including as a result of the imposition of sulfur oxide emissions limits in 2020 under new regulations adopted by the IMO (fo r t hose vessels that are not retrofitted with scrubbers); decreases in the market values of tanker vessels; risks related to the management o f t he Company’s growth strategy, counterparty risks and customer relations with key customers; the Company’s ability to meet obligations unde r t ime charter agreements; dependence on third - party managers and a limited number of customers; the Company’s liquidity, level of indebtedness , operating expenses, capital expenditures and financing; the Company’s interest rate swap agreements and credit facilities; ri sk of loss, including potential liability from future litigation and potential costs due to environmental damage, vessel collisions and b usi ness interruption; risks related to war, terrorism and piracy; risks related to the acquisition, modification and operation of vessels; future s upp ly of, and demand for, refined products and crude oil, including relating to seasonality; risks related to the Company’s insurance, including a deq uacy of coverage and increased premium payments; risks related to tax rules applicable to the Company; the Company’s ability to clear the oil maj ors’ risk assessment processes; future refined product and crude oil prices and production; the carrying values of the Company’s vessel s a nd the potential for any asset impairments; the Company’s ability to maximize the use of its vessels, including the redeployment or dis position of vessels no longer under long - term time charter; the Company’s continued ability to enter into long - term, fixed - rate time charter s with its charterers and to re - charter its vessels as their existing charters expire at attractive rates; failure to realize the anticipat ed benefits of the recent merger including as a result of integrating the businesses; failure to maintain effective internal control over financ ial reporting; the Company’s ability to implement its business strategy and manage planned growth; and other risks and uncertainties disclosed i n t he Company’s reports filed from time to time with the Securities and Exchange Commission (“SEC”) under the Securities Exchange A ct of 1934. Please see the Company's filings with the SEC for a more complete discussion of certain of these and other risks and uncertai nti es. The Company undertakes no obligation, and specifically declines any obligation, except as required by law, to publicly update or revise any forward-looking statements, whether as a result of new information, future events or otherwise.
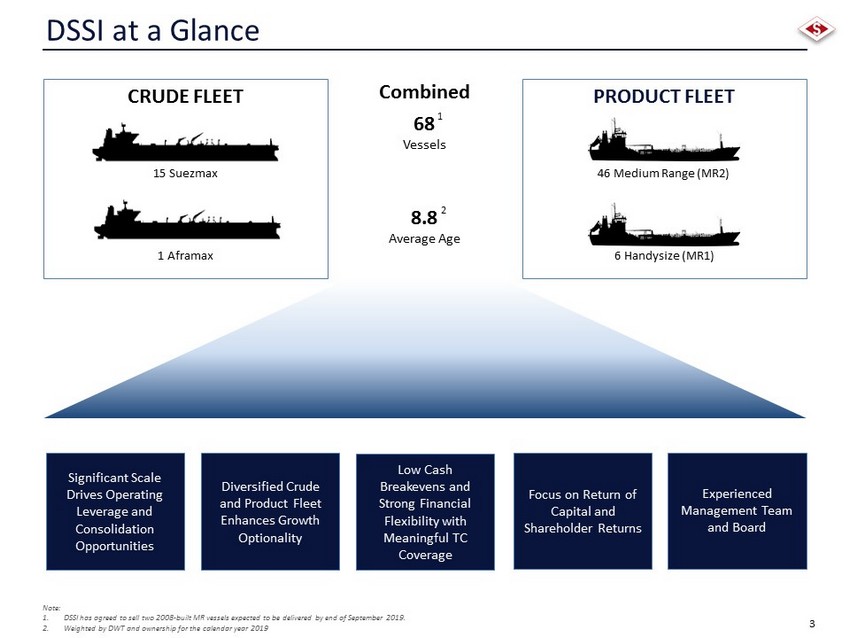
3 Significant Scale Drives Operating Leverage and Consolidation Opportunities Diversified Crude and Product Fleet Enhances Growth Optionality DSSI at a Glance Low Cash Breakevens and Strong Financial Flexibility with Meaningful TC Coverage CRUDE FLEET PRODUCT FLEET 15 Suezmax 1 Aframax 6 Handysize (MR1) 46 Medium Range (MR2) Combined 68 Vessels 8.8 Average Age 2 Experienced Management Team and Board Note: 1. DSSI has agreed to sell two 2008 - built MR vessels expected to be delivered by end of September 2019. 2. Weighted by DWT and ownership for the calendar year 2019 1 Focus on Return of Capital and Shareholder Returns
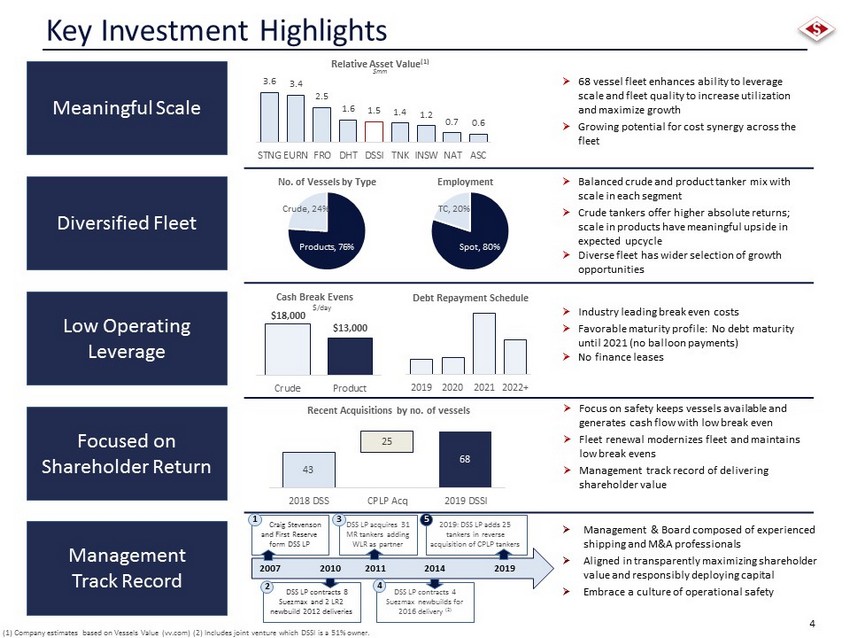
4 Key Investment Highlights Meaningful Scale Diversified Fleet Low Operating Leverage Focused on Shareholder Return Management Track Record 3.6 3.4 2.5 1.6 1.5 1.4 1.2 0.7 0.6 STNG EURN FRO DHT DSSI TNK INSW NAT ASC Products , 76% Crude , 24% No. of Vessels by Type Spot , 80% TC , 20% Employment 2019 2020 2021 2022+ Debt Repayment Schedule 43 68 25 2018 DSS CPLP Acq 2019 DSSI Recent Acquisitions by no. of vessels » 68 vessel fleet enhances ability to leverage scale and fleet quality to increase utilization and maximize growth » Growing potential for cost synergy across the fleet » Industry leading break even costs » Favorable maturity profile: No debt maturity until 2021 (no balloon payments) » No finance leases » Balanced crude and product tanker mix with scale in each segment » Crude tankers offer higher absolute returns; scale in products have meaningful upside in expected upcycle » Diverse fleet has wider selection of growth opportunities » Focus on safety keeps vessels available and generates cash flow with low break even » Fleet renewal modernizes fleet and maintains low break evens » Management track record of delivering shareholder value » Management & Board composed of experienced shipping and M&A professionals » Aligned in transparently maximizing shareholder value and responsibly deploying capital » Embrace a culture of operational safety $18,000 $13,000 Crude Product Cash Break Evens Relative Asset Value (1) $mm (1) Company estimates based on Vessels Value (vv.com) (2) Includes joint venture which DSSI is a 51% owner. $/day 2007 Craig Stevenson and First Reserve form DSS LP 1 2010 DSS LP contracts 8 Suezmax and 2 LR2 newbuild 2012 deliveries 2 2011 DSS LP acquires 31 MR tankers adding WLR as partner 3 2014 DSS LP contracts 4 Suezmax newbuilds for 2016 delivery (2) 4 2019: DSS LP adds 25 tankers in reverse acquisition of CPLP tankers 5 2019

5 Board and Management Team Management Team Board of Directors » Craig H. Stevenson, Jr., CEO and Director of DSSI Over 40 years of experience in the shipping industry Former CEO and Chairman of OMI Corporation 1998 - 2007 » Kevin M. Kilcullen, CFO Joined DSSI in April 2019 Former CFO of Team Tankers International Ltd 2016 - 2019 Former CFO Principal Maritime 2012 - 2015 Jefferies Capital Partners, private equity investment 2001 - 2012 » Sanjay Sukhrani, COO Nearly 30 years experience in the shipping industry COO at DSS since 2009 Former General Manager of Gemini tankers 2007 - 2009 Multiple positions within OMI Corporation 2001 - 2007 Sailed for 17 years on tankers, bulk carriers and container vessels » Michael G. Fogarty, SVP Commercial Head of Commercial at DSS since 2011 Chartering Manager at Gemini Tankers 2004 - 2011 Chartering and operations positions at OMI 1993 - 2004 Chartering/ops American Trading and Transportation 1991 - 1993 Sailed on oil tankers and articulated tug boats and oil tank barges » Nadim Z. Qureshi, Chairman Managing Partner at Invesco Private Capital, Inc Former Director of Nexeo Solutions, Inc.2016 - 2017 Former Partner at Quinpario Partners LLC 2012 - 2015 Former SVP at Solutia Inc. 2005 - 2012 Expertise in transformative M&A » Craig H. Stevenson, Jr., CEO and Director Led successful sale of OMI Corporation to Teekay Shipping and Torm for $2.2 billion » Gerasimos (Jerry) G. Kalogiratos, Director CEO of CPLP GP 2015 - present Former CFO of CPLP GP 2015 - 2018 Director of CPLP since 2014 » Gerasimos (Gerry) Ventouris , Director COO of CPLP GP 2015 - present CCO of CSM 2003 - present » Harold (Hal) L. Malone III, Director Head of Transportation at Invesco Private Capital, Inc. Also Director of Navigator Holdings Ltd. and Nautical Bulk Holdings, Ltd. Former Managing Director at Jefferies, maritime group 18 years of investment banking » Alexandra Kate Blankenship, Director Over 25 years shipping industry experience in accounting/finance Former Director of Seadrill Ltd., Ship Finance International Ltd., Frontline Ltd., Avance Gas Holding Ltd., Archer Ltd., Golar LNG Ltd., Golden Ocean Group Ltd. and North Atlantic Drilling Ltd. » Bart H. Veldhuizen, Director Over 25 years shipping industry experience Director at Eagle Bulk Shipping Former Director of Seadrill Partners LLC and Golar LNG Partners LP Former board of managing directors of DVB Bank SE

6 - 100 200 300 400 500 600 Aug 2001 Aug 2002 Aug 2003 Aug 2004 Aug 2005 Aug 2006 Management Track Record 149 116 187 178 202 323 565 652 719 31 26 104 115 83 173 337 321 297 1998 1999 2000 2001 2002 2003 2004 2005 2006 Revenue EBITDA » Under Craig Stevenson’s leadership from 1998 to 2007, OMI achieved a 22% revenue CAGR and a 33% EBITDA CAGR » OMI executed a successful vessel acquisition and commercial strategy during this period, growing the fleet from 20 to 37 vessels while reducing the average fleet age from 13 to 4 years of age. » Acquired 16 modern Suezmax and 37 product carriers during this period » OMI also successfully launched 4 commercial pools (Suezmax, MR, Ice Class Handy, and Panamax) » OMI chartered in a total of 9 Suezmax and product tankers » Actively traded FFAs and STC’s » OMI under Stevenson outperformed its peers by 150% from August 2001 to March 2007 (+200% including ultimate sale value) » Management sold the company at the top of the market in March 2007 for $ 2.2B , representing: » 8.1x EBITDA and ~120% Price to NAV valuation » During Stevenson’s tenure, OMI’s market cap grew from ~$100M to ~$ 1.4B Announcement of acquisition of OMI OMI (rebased share price) Peers (FRO,GMR,VLCC.F,NAT,TK,OSG) Before After 302% 419% 149% 178% Share Performance Around Sale Announcement Mar 2007

Market Overview
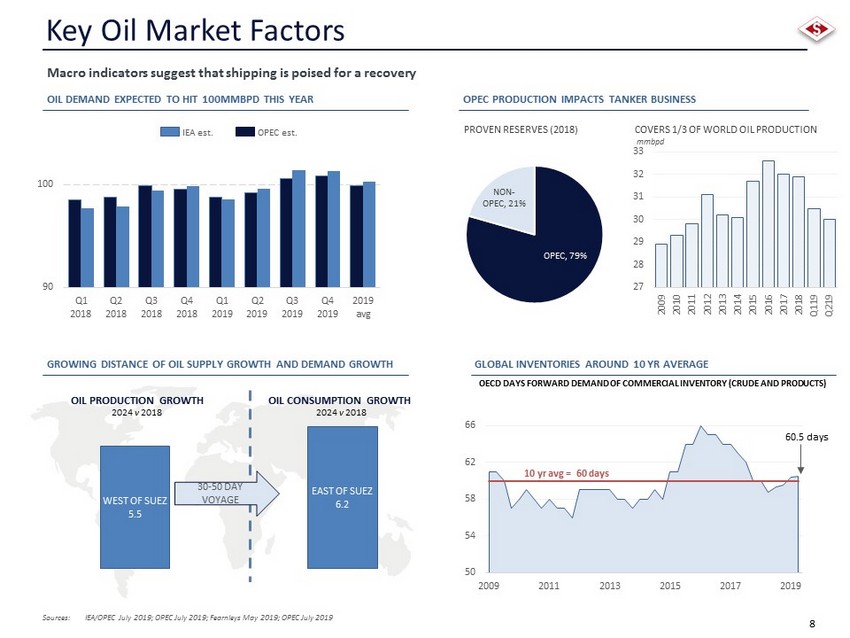
8 GROWING DISTANCE OF OIL SUPPLY GROWTH AND DEMAND GROWTH Key Oil Market Factors OPEC PRODUCTION IMPACTS TANKER BUSINESS 90 100 Q1 2018 Q2 2018 Q3 2018 Q4 2018 Q1 2019 Q2 2019 Q3 2019 Q4 2019 2019 avg IEA est. OPEC est. mmbpd 50 54 58 62 66 2009 2011 2013 2015 2017 2019 60.5 days Sources: IEA/OPEC July 2019; OPEC July 2019; Fearnleys May 2019; OPEC July 2019 OPEC , 79% NON - OPEC, 21% PROVEN RESERVES (2018) COVERS 1/3 OF WORLD OIL PRODUCTION Macro indicators suggest that shipping is poised for a recovery OIL DEMAND EXPECTED TO HIT 100MMBPD THIS YEAR GLOBAL INVENTORIES AROUND 10 YR AVERAGE OECD DAYS FORWARD DEMAND OF COMMERCIAL INVENTORY (CRUDE AND PRODUCTS) OIL PRODUCTION GROWTH WEST OF SUEZ 5.5 EAST OF SUEZ 6.2 OIL CONSUMPTION GROWTH 30 - 50 DAY VOYAGE 2024 v 2018 2024 v 2018 27 28 29 30 31 32 33 2009 2010 2011 2012 2013 2014 2015 2016 2017 2018 Q119 Q219 10 yr avg = 60 days

9 5 15 25 35 45 55 5 yrs 10 yrs 15 yrs 20 yrs Suezmax Crude Carrier Overview PRODUCTION GROWTH CREATES OPPORTUNITY FOR EXPORTS NEWBUILD PARITY Suezmaxes are well - positioned to benefit from the strengthening crude oil market fundamentals due to the growing distance between production growth and oil demand growth. LOW ORDERBOOK < SCRAPPING CANDIDATES 26% 33% 19% 17% 5% 9% 0-4 5-9 10-14 15-19 20+ GROUPED AGE OF FLEET ( yrs ) OPEC SURPLUS CAPACITY NEWBUILD DEPRECIATION LINE CURRENT VALUES SIGNIFICANT VALUE IN OLDER VESSELS Source: Clarkson Research, August 2019 Source: vv.com, VV matrix, July 2019 Source: EIA, August 2019 On order 0.0 0.9 1.8 2.7 3.6 5.0 7.0 9.0 11.0 13.0 2012 2013 2014 2015 2016 2017 2018 2019 2020 MMBPD MMBPD U.S. CRUDE OIL PRODUCTION (LH) EIA FORECAST PRODUCTION (LH) U.S. EXPORTS (RH) 0.00 1.00 2.00 3.00 4.00 2009 2010 2011 2012 2013 2014 2015 2016 2017 2018 2019 2020 SURPLUS COULD BE USED FOR EXPORT $mm mbpd Diff to St. Line at 10 yrs 2019 72% 2007 136%
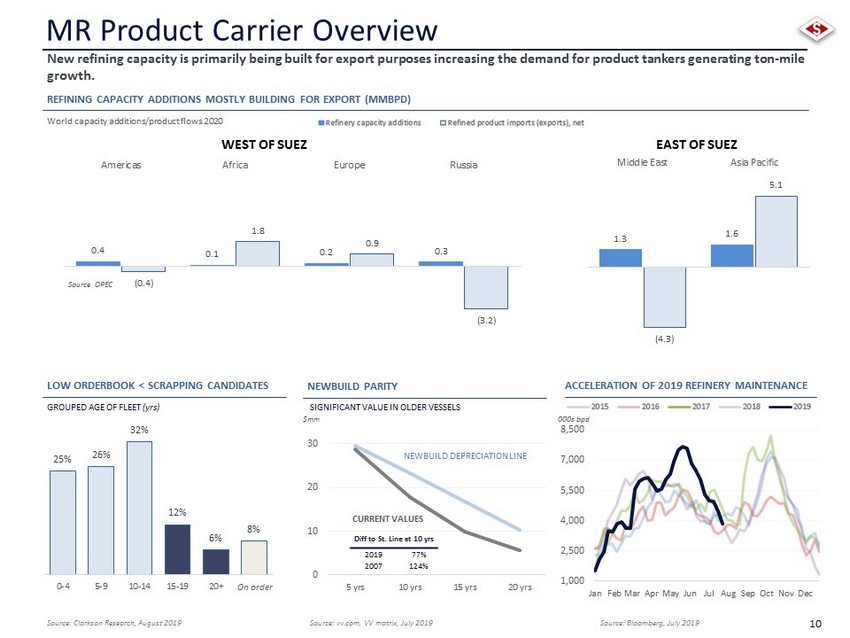
10 MR Product Carrier Overview REFINING CAPACITY ADDITIONS MOSTLY BUILDING FOR EXPORT (MMBPD) Source OPEC World capacity additions/product flows 2020 New refining capacity is primarily being built for export purposes increasing the demand for product tankers generating ton - mile growth. EAST OF SUEZ WEST OF SUEZ 0.4 0.1 0.2 0.3 (0.4) 1.8 0.9 (3.2) Americas Africa Europe Russia 1.3 1.6 (4.3) 5.1 Middle East Asia Pacific Source: Clarkson Research, August 2019 Source: Bloomberg, July 2019 0 10 20 30 5 yrs 10 yrs 15 yrs 20 yrs NEWBUILD PARITY LOW ORDERBOOK < SCRAPPING CANDIDATES 25% 26% 32% 12% 6% 8% 0-4 5-9 10-14 15-19 20+ GROUPED AGE OF FLEET ( yrs ) ACCELERATION OF 2019 REFINERY MAINTENANCE NEWBUILD DEPRECIATION LINE CURRENT VALUES SIGNIFICANT VALUE IN OLDER VESSELS On order 1,000 2,500 4,000 5,500 7,000 8,500 Jan Feb Mar Apr May Jun Jul Aug Sep Oct Nov Dec $mm 000s bpd Source: vv.com, VV matrix, July 2019 Diff to St. Line at 10 yrs 2019 77% 2007 124%
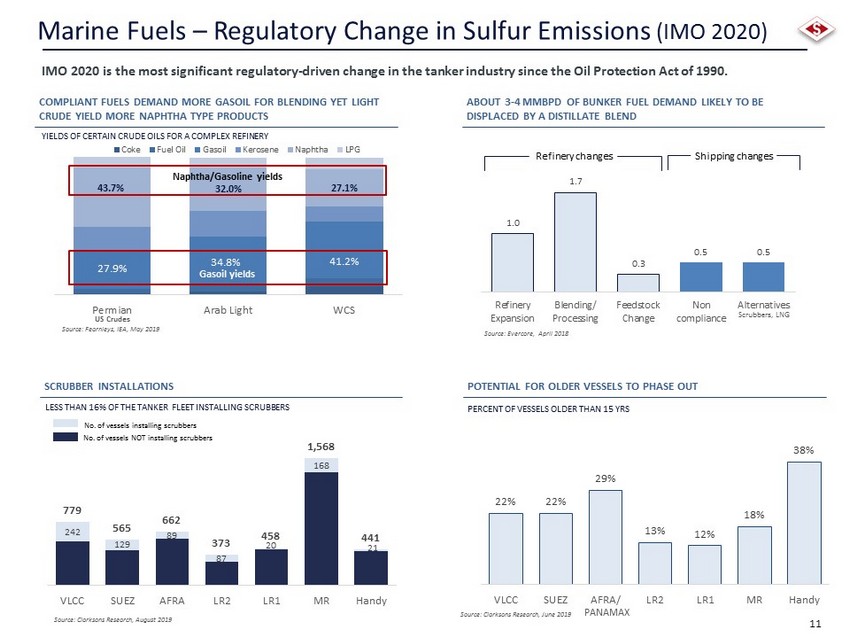
11 27.9% 34.8% 41.2% 43.7% 32.0% 27.1% Permian Arab Light WCS Coke Fuel Oil Gasoil Kerosene Naphtha LPG Marine Fuels – Regulatory Change in Sulfur Emissions (IMO 2020) IMO 2020 is the most significant regulatory - driven change in the tanker industry since the Oil Protection Act of 1990. 1.0 1.7 0.3 0.5 0.5 Refinery Expansion Blending/ Processing Feedstock Change Non compliance Alternatives Scrubbers, LNG Source: Evercore, April 2018 Refinery changes Shipping changes Source: Fearnleys , IEA, May 2019 Source: Clarksons Research, June 2019 22% 22% 29% 13% 12% 18% 38% VLCC SUEZ AFRA/ LR2 LR1 MR Handy POTENTIAL FOR OLDER VESSELS TO PHASE OUT PERCENT OF VESSELS OLDER THAN 15 YRS ABOUT 3 - 4 MMBPD OF BUNKER FUEL DEMAND LIKELY TO BE DISPLACED BY A DISTILLATE BLEND COMPLIANT FUELS DEMAND MORE GASOIL FOR BLENDING YET LIGHT CRUDE YIELD MORE NAPHTHA TYPE PRODUCTS SCRUBBER INSTALLATIONS 242 129 89 87 20 168 21 779 565 662 373 458 1,568 441 VLCC SUEZ AFRA LR2 LR1 MR Handy LESS THAN 16% OF THE TANKER FLEET INSTALLING SCRUBBERS Source: Clarksons Research, August 2019 No. of vessels installing scrubbers No. of vessels NOT installing scrubbers PANAMAX YIELDS OF CERTAIN CRUDE OILS FOR A COMPLEX REFINERY US Crudes Naphtha/Gasoline yields Gasoil yields

12 7% 8% 7% 9% 6% 3% 6% 5% 5% 5% 6% 3% 6% 4% 4% 3% 5% 3% 6% 4% 4% 3% 3% 3% 5% 4% 3% 3% 3% 2% 5% 3% 3% 3% 3% 2% 4% 3% 3% 3% 3% 2% 3% 3% 3% 3% 2% 2% 2% 3% 2% 2% 2% 2% 2% 2% 2% 2% 2% 1% 46% 38% 37% 37% 36% 22% VLCC SUEZ AFRA LR2 PAN/LR1 MR/Handy Highly Fragmented Market 355 217 243 166 448 779 565 662 458 2,009 VLCC SUEZ AFRA PAN/LR1 MR/Handy Source: Clarksons Research, Aug 2019 779 565 662 373 458 2009 VLCC SUEZ Afra LR2 PAN/LR1 MR/Handy U.S. PUBLICLY LISTED VESSEL OWNER/OPERATORS TOP 10 OWNERS INDIVIDUAL BY SHIP COUNT TOP 10 OWNERSHIP SHARE BY SHIP COUNT TOTAL FLEET OWNERSHIP ACROSS ALL TANKERS No. vessels in fleet No. vessels U.S. Publicly Listed (owner/operator) 15% % Approximate percent of U.S. Publicly Listed to fleet 16% 18% 20% 12% 12% No. vessels owned by top 10 owners No. vessels in fleet ### No individual owner has 10% market share in any tanker class. Others 352.37 m dwt Next 11 - 20 79.15 m dwt Top 10 142.78 m dwt The top multi - class shipowners consistent of less than 25% of the global fleet. Substantial opportunity to consolidate based on current tanker market landscape.

Financial Overview

14 Assets $mm Liabilities & Equity $mm Cash and cash equivalents $64.1 Current portion of debt $126.0 Other current assets 109.0 Other current liabilities 48.5 Current assets 173.1 Current liabilities 174.5 Restricted cash 5.4 Long - term debt 802.6 Vessels, net 1,951.9 Derivative liabilities 1.6 Deferred drydocking 36.2 Equity 1,167.7 Other noncurrent 15.5 Noncontrolling interest 35.7 Total Assets 2,182.1 Total Liabilities & Equity 2,182.1 Balance Sheet, Operating Leverage and Liquidity CONDENSED BALANCE SHEET CASH & LIQUIDITY Note: Data as of June 30, 2019 except cash break even – see note 3. 1. This facility relates to a joint venture, in which Diamond S is a 51% owner. 2. Net debt - to - value is based on broker estimates in conjunction with debt compliance. 3. Cash breakeven is an average estimate in 2019 and includes daily vessel expenses, general & administrative expenses and debt ser vice. 4. Debt service costs are based on forward LIBOR curve and mandatory repayments on existing debt. OTHER STATISTICS Name # Collateral Vessels Outstanding 6/30 Margin Quarterly Repayment Maturity Date 235mm Facility 8 $184.5 275 bps $4.2 2021 75mm Facility 2 59.4 220 bps 1.3 2023 66mm Facility (1) 2 54.0 325 bps 1.1 2021 460mm Facility 28 293.0 280 bps 11.1 2021 360mm Facility 28 350.0 265 bps 13.8 2024 Deferred Fees (12.3) Total 68 $928.6 $31.5 DEBT SCHEDULE $69.5 $55.4 $10.8 $24.9 CASH & RESTRICTED CASH UNDRAWN REVOVLING CREDIT CAPACITY LIQUIDITY $mm Bank required minimum cash Excess Cash 50% 2019 DAILY CASH BREAKEVENS (3) NET DEBT TO VALUE 7,600 6,900 1,000 1,000 9,400 5,100 18,000 13,000 Crude Product OPEX G&A Debt Service (4) (2) $mm $mm

15 14.6 23.7 29.2 47.5 43.8 71.2 0.99 1.97 2.96 0 1 2 3 4 5 0.0 10.0 20.0 30.0 40.0 50.0 60.0 70.0 80.0 1,000 5,000 EPS 2,000 10,000 EPS 3,000 15,000 EPS P&L Statistics CONDENSED INCOME STATEMENT SENSITIVITY RELATIVE TCE RATES For the Six Months Ended, June 30 2019 2018 Voyage Revenue $252.0 183.0 Voyage Expenses 107.5 91.5 Net Revenues 144.5 91.5 Vessel Expenses 67.2 56.1 Depreciation & Amortization 51.2 44.1 General & Administrative 13.6 8.3 Operating Income $ 12.5 ($17.0) Interest expense, net 21.9 17.0 Net loss (9.4) ($34.0) Less: net income (loss) attrib. to noncontrolling 0.1 (0.7) Net loss attributable to DSSI (9.5) (33.3) Net loss per share – basic (0.28) (1.23) Basic shares outstanding 33.7 27.2 Daily Statistics (3 mos ended June 30, 2019) Crude Fleet Products Fleet Daily TCE earnings $16,200 $13,118 Daily OPEX 7,196 6,677 Daily cash G&A 1,045 1,045 TCE less OPEX less cash G&A $ 7,960 $ 5,396 $mm, expect per share data USD per day If rates increase by below per day, net income increases by USD mm Crude Fleet Products Fleet 5,000 15,000 25,000 35,000 45,000 Jan Feb Mar Apr May Jun Jul Aug Sept Oct Nov Dec 2020 Consensus Range 2019 Rates 2018 Rates 5,000 9,250 13,500 17,750 22,000 Jan Feb Mar Apr May Jun Jul Aug Sept Oct Nov Dec 2020 Consensus Range 2019 Rates 2018 Rates Suezmax Rates MR Rates USD/day USD/day Earnings per share impact (1) (1) The following are non - GAAP financial measures. Please refer to our website, www.diamondsshipping.com , for additional disclosures.
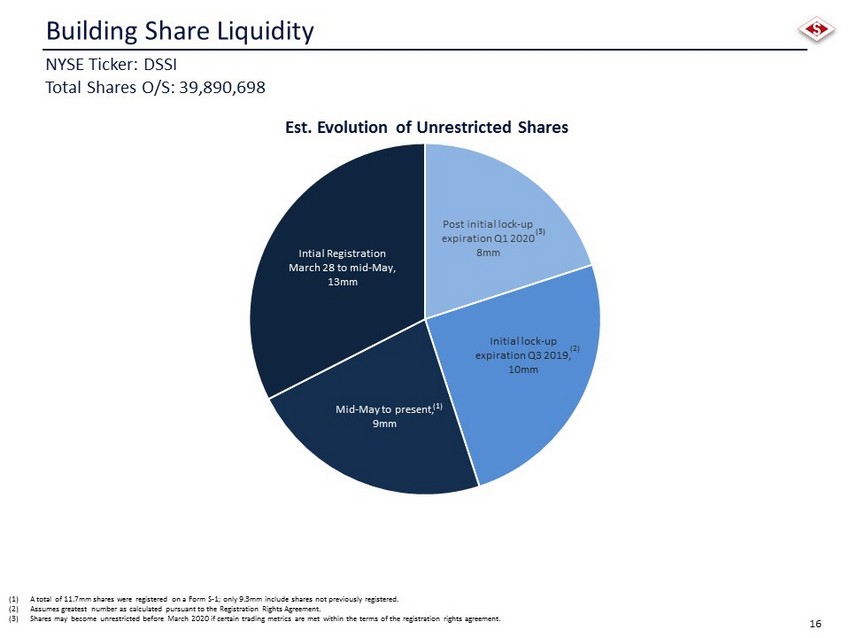
16 Building Share Liquidity NYSE Ticker: DSSI Total Shares O/S: 39,890,698 (1) A total of 11.7mm shares were registered on a Form S - 1; only 9.3mm include shares not previously registered. (2) Assumes greatest number as calculated pursuant to the Registration Rights Agreement. (3) Shares may become unrestricted before March 2020 if certain trading metrics are met within the terms of the registration righ ts agreement. Post initial lock - up expiration Q1 2020 8mm Initial lock - up expiration Q3 2019 , 10mm Mid - May to present , 9mm Intial Registration March 28 to mid - May , 13mm (1) (2) (3) Est. Evolution of Unrestricted Shares

17 Q&A

18 Appendix

19 Fleet List PRODUCT FLEET CRUDE FLEET Aframax Vessel Name Built DWT 1Aristaios 2017 113,689 Suezmax Vessel Name Built DWT 2Miltiadis M II 2006 162,397 3Aias 2008 150,393 4Amoureux 2008 149,993 5Brazos 2012 158,537 6Colorado 2012 158,615 7Frio 2012 159,000 8Pecos 2012 158,465 9Red 2012 159,068 10Rio Grande 2012 159,056 11Sabine 2012 158,493 12San Saba 2012 159,018 13Loire 2016 157,463 14Namsen 2016 157,543 15San Jacinto 2016 158,658 16Trinity 2016 158,734 MR (cont'd) Vessel Name Built DWT 51 Atlantic Mirage 2009 51,476 52 Atlantic Muse 2009 51,498 53 Atlantic Pisces 2009 49,999 54 Atlantic Polaris 2009 49,999 55 Ayrton II 2009 51,260 56 Pacific Jewel 2009 48,012 57 Alpine Maya 2010 51,501 58 Alpine Melina 2010 51,483 59 Active 2015 50,136 60 Amadeus 2015 50,108 61 Amor 2015 49,999 62 Anikitos 2016 50,082 Handysize Vessel Name Built DWT 63 Agisilaos 2006 36,760 64 Aktoras 2006 36,759 65 Alkiviadis 2006 36,721 66 Arionas 2006 36,725 67 Atlantas II 2006 36,760 68 Aiolos 2007 36,725 MR Vessel Name Built DWT 17 Assos 2006 47,872 18 Akeraios 2007 47,781 19 Anemos I 2007 47,782 20 Apostolos 2007 47,782 21 Atlantic Breeze 2007 49,999 22 Atlantic Frontier 2007 49,999 23 Atrotos 2007 47,786 24 Avax 2007 47,834 25 Axios 2007 47,872 26 Citron 2007 49,999 27 Alexandros II 2008 51,258 28 Alpine Madeleine 2008 49,999 29 Alpine Mathilde 2008 49,999 30 Alpine Mia 2008 49,999 31 Aris II 2008 51,218 32 Aristotelis II 2008 51,226 33 Atlantic Aquarius 2008 49,999 34 Atlantic Gemini 2008 49,999 35 Atlantic Grace 2008 49,999 36 Atlantic Leo 2008 49,999 37 Atlantic Lily 2008 49,999 38 Atlantic Olive 2008 49,999 39 Atlantic Rose 2008 49,999 40 Atlantic Star 2008 49,999 41 Atlantic Titan 2008 49,999 42 Citrus 2008 49,995 43 High Jupiter 2008 51,603 44 High Mars 2008 51,542 45 High Mercury 2008 51,501 46 High Saturn 2008 51,527 47 Adriatic Wave 2009 51,549 48 Aegean Wave 2009 51,510 49 Alpine Moment 2009 49,999 50 Alpine Mystery 2009 49,999 A complete listing of the DSSI fleet can be found at www.diamondsshipping.com. (1) DSSI has agreed to sell these vessels as part of its fleet renewal initiatives. (1) (1)