Exhibit 99.1

Analyst Day August 2020 PRIVILEGED & CONFIDENTIAL

2 Safe Harbor This investor presentation (“Investor Presentation”) is for informational purposes only and does not constitute an offer to sell, a solicitation of an offer to buy, or a recommendation to purchase any equity, debt or other financial instruments of Shift Technologies, Inc. or Insurance Acquisition Corp. or any of Shift Technologies, Inc.’s or Insurance Acquisition Corp.’s affiliates’ securities (as such term is defined under the U.S. Federal Securities Law). This Investor Presentation has been prepared to assist interested parties in making their own evaluation with respect to the proposed business combination, as contemplated in the Agreement and Plan of Merger (collectively, the “Business Combination”), of Shift Technologies, Inc. and Insurance Acquisition Corp. and for no other purpose. The information contained herein does not purport to be all - inclusive. The data contained herein is derived from various internal and external sources. No representation is made as to the reasonableness of the assumptions made within or the accuracy or completeness of any projections, modeling or back - testing or any other information contained herein. All levels, prices and spreads are historical and do not represent current market levels, prices or spreads, some or all of which may have been changed since the issuance of this document. Any data on past performance, modeling or back - testing contained herein is not an indication as to future performance. Shift Technologies, Inc. and Insurance Acquisition Corp. assume no obligation to update the information in this Investor Presentation. Use of Projections This Presentation contains financial forecasts with respect to Shift Technologies, Inc. Neither Insurance Acquisition Corp.’s independent auditors, nor the independent registered public accounting firm of Shift Technologies, Inc., audited, reviewed, compiled, or performed any procedures with respect to the projections for the purpose of their inclusion in this Presentation, and accordingly, neither of them expressed an opinion or provided any other form of assurance with respect thereto for the purpose of this Presentation. These projections should not be relied upon as being necessarily indicative of future results. Forward Looking Statements This Investor Presentation includes “forward looking statements” within the meaning of the “safe harbor” provisions of the United States Private Securities Litigation Reform Act of 1995. Forward - looking statements may be identified by the use of words such as “forecast,” “intend,” “seek,” “target,” “anticipate,” “believe,” “expect,” “estimate,” “plan,” “outlook,” and “project” and other similar expressions that predict or indicate future events or trends or that are not statements of historical matters. Such forward looking statements include estimated and projected financial information. Such forward looking statements with respect to revenues, earnings, performance, strategies, prospects and other aspects of the businesses of Insurance Acquisition Corp., Shift Technologies, Inc. or the combined company after completion of the Business Combination are based on current expectations that are subject to risks and uncertainties. A number of factors could cause actual results or outcomes to differ materially from those indicated by such forward looking statements. These factors include, but are not limited to: (1) the occurrence of any event, change or other circumstances that could give rise to the termination of the Agreement and Plan of Merger and the proposed business combination contemplated thereby; (2) the inability to complete the transactions contemplated by the Agreement and Plan of Merger due to the failure to obtain approval of the stockholders of Insurance Acquisition Corp. or other conditions to closing in the Agreement and Plan of Merger; (3) the ability to meet Nasdaq’s listing standards following the consummation of the transactions contemplated by the Agreement and Plan of Merger; (4) the risk that the proposed transaction disrupts current plans and operations of Shift Technologies, Inc. as a result of the announcement and consummation of the transactions described herein; (5) the ability to recognize the anticipated benefits of the proposed Business Combination, which may be affected by, among other things, competition, the ability of the combined company to grow and manage growth profitably, maintain relationships with customers and suppliers and retain its management and key employees; (6) costs related to the proposed Business Combination; (7) changes in applicable laws or regulations; (8) the possibility that Shift Technologies, Inc. may be adversely affected by other economic, business, and/or competitive factors; (9) the operational and financial outlook for Shift Technologies, Inc.; (10) the ability for Shift Technologies, Inc. to execute its growth strategy; and (11) other risks and uncertainties indicated from time to time in other documents filed or to be filed with the Securities and Exchange Commission (“SEC”) by Insurance Acquisition Corp. You are cautioned not to place undue reliance upon any forward - looking statements, which speak only as of the date made. Insurance Acquisition Corp. and Shift Technologies, Inc. undertake no commitment to update or revise the forward - looking statements, whether as a result of new information, future events or otherwise, except as may be required by law. Industry and Market Data In this Presentation, Shift Technologies, Inc . relies on and refers to information and statistics regarding market share in the sector in which it competes and other industry data . Shift Technologies, Inc . obtained this information and statistics from third - party sources . Shift Technologies, Inc . has supplemented this information where necessary with information from discussions with Shift Technologies, Inc . customers and its own internal estimates, taking into account publicly available information about other industry participants and Shift Technologies, Inc . ’s management’s best view as to information that is not publicly available . Use of Non - GAAP Financial Measures This presentation includes certain non - GAAP financial measures that are not prepared in accordance with accounting principles generally accepted in the United States (“GAAP”) and that may be different from non - GAAP financial measures used by other companies. Insurance Acquisition Corp. and Shift Technologies, Inc. believe that the use of these non - GAAP financial measures provides an additional tool for investors to use in evaluating ongoing operating results and trends of Shift Technologies, Inc. These non - GAAP measures should not be considered in isolation from, or as an alternative to, financial measures determined in accordance with GAAP. See the footnotes on the slides where these measures are discussed and page 57 of this Presentation for a description of these non - GAAP financial measures and reconciliations of such non - GAAP financial measures to the most comparable GAAP numbers. Additionally, to the extent that forward - looking non - GAAP financial measures are provided, they are presented on a non - GAAP basis without reconciliations of such forward - looking non - GAAP measures due to the inherent difficulty in forecasting and quantifying certain amounts that are necessary for such reconciliation. Additional Information About the Transaction and Where to Find It The Company has filed with the SEC a Registration Statement on Form S - 4, which includes a preliminary proxy statement/prospectus in connection with the Merger and will mail a definitive proxy statement/prospectus and other relevant documents to its stockholders. The Company’s stockholders and other interested persons are advised to read the preliminary proxy statement/prospectus, and amendments thereto, and to read, when available, the definitive proxy statement/prospectus in connection with the Company’s solicitation of proxies for its stockholders’ meeting to be held to approve the Merger because the proxy statement/prospectus contains important information about the Company, Shift and the Merger. The definitive proxy statement/prospectus will be mailed to stockholders of the Company as of a record date to be established for voting on the Merger. Stockholders will also be able to obtain copies of the Registration Statement on Form S - 4 and the definitive proxy statement/prospectus, without charge, once available, at the SEC’s website at www.sec.gov or by directing a request to: Insurance Acquisition Corp., 2929 Arch Street, Suite 1703, Philadelphia, PA 19104, Attn: Joseph Pooler. Participants in Solicitation The Company, Shift and certain of their respective directors and officers may be deemed participants in the solicitation of proxies of the Company’s stockholders with respect to the approval of the Merger. Information regarding the Company’s directors and officers and a description of their interests in the Company is contained in the preliminary proxy statement/prospectus for the Merger. Additional information regarding the participants in the proxy solicitation, including Shift’s directors and officers, and a description of their direct and indirect interests, by security holdings or otherwise, is included in the preliminary proxy statement/prospectus for the Merger and will be included in the definitive proxy statement/prospectus for the Merger when available. Each of these documents is, or will be, available at the SEC’s website or by directing a request to the Company as described above under “Additional Information About the Transaction and Where to Find It.” In connection with the Merger, at any time prior to the special meeting to approve the Merger, certain existing Company stockholders, which may include certain of the Company’s officers, directors and other affiliates, may enter into transactions with stockholders and other persons with respect to the Company’s securities to provide such investors or other persons with incentives in connection with the approval and consummation of the Merger. While the exact nature of such incentives has not yet been determined, they might include, without limitation, arrangements to purchase shares from or sell shares to such investors and persons at nominal prices or prices other than fair market value. These stockholders will only effect such transactions when they are not then aware of any material nonpublic information regarding the Company, Shift or their respective securities.

Today’s Agenda 3

Welcome & Introduction Co - CEOs George Arison & Toby Russell

Introduction to Shift https://vimeo.com/449782800/a3a63a1c20

6 Platform Delivers a Comprehensive and Seamless Car Ownership Experience 5. Selling 1. Research & Discovery 2. Test Drive 4. Ownership 3. Purchase CAR OWNERSHIP CYCLE Denotes future opportunity Denotes future opportunity Shift’s mission is to make car purchase and ownership simple.
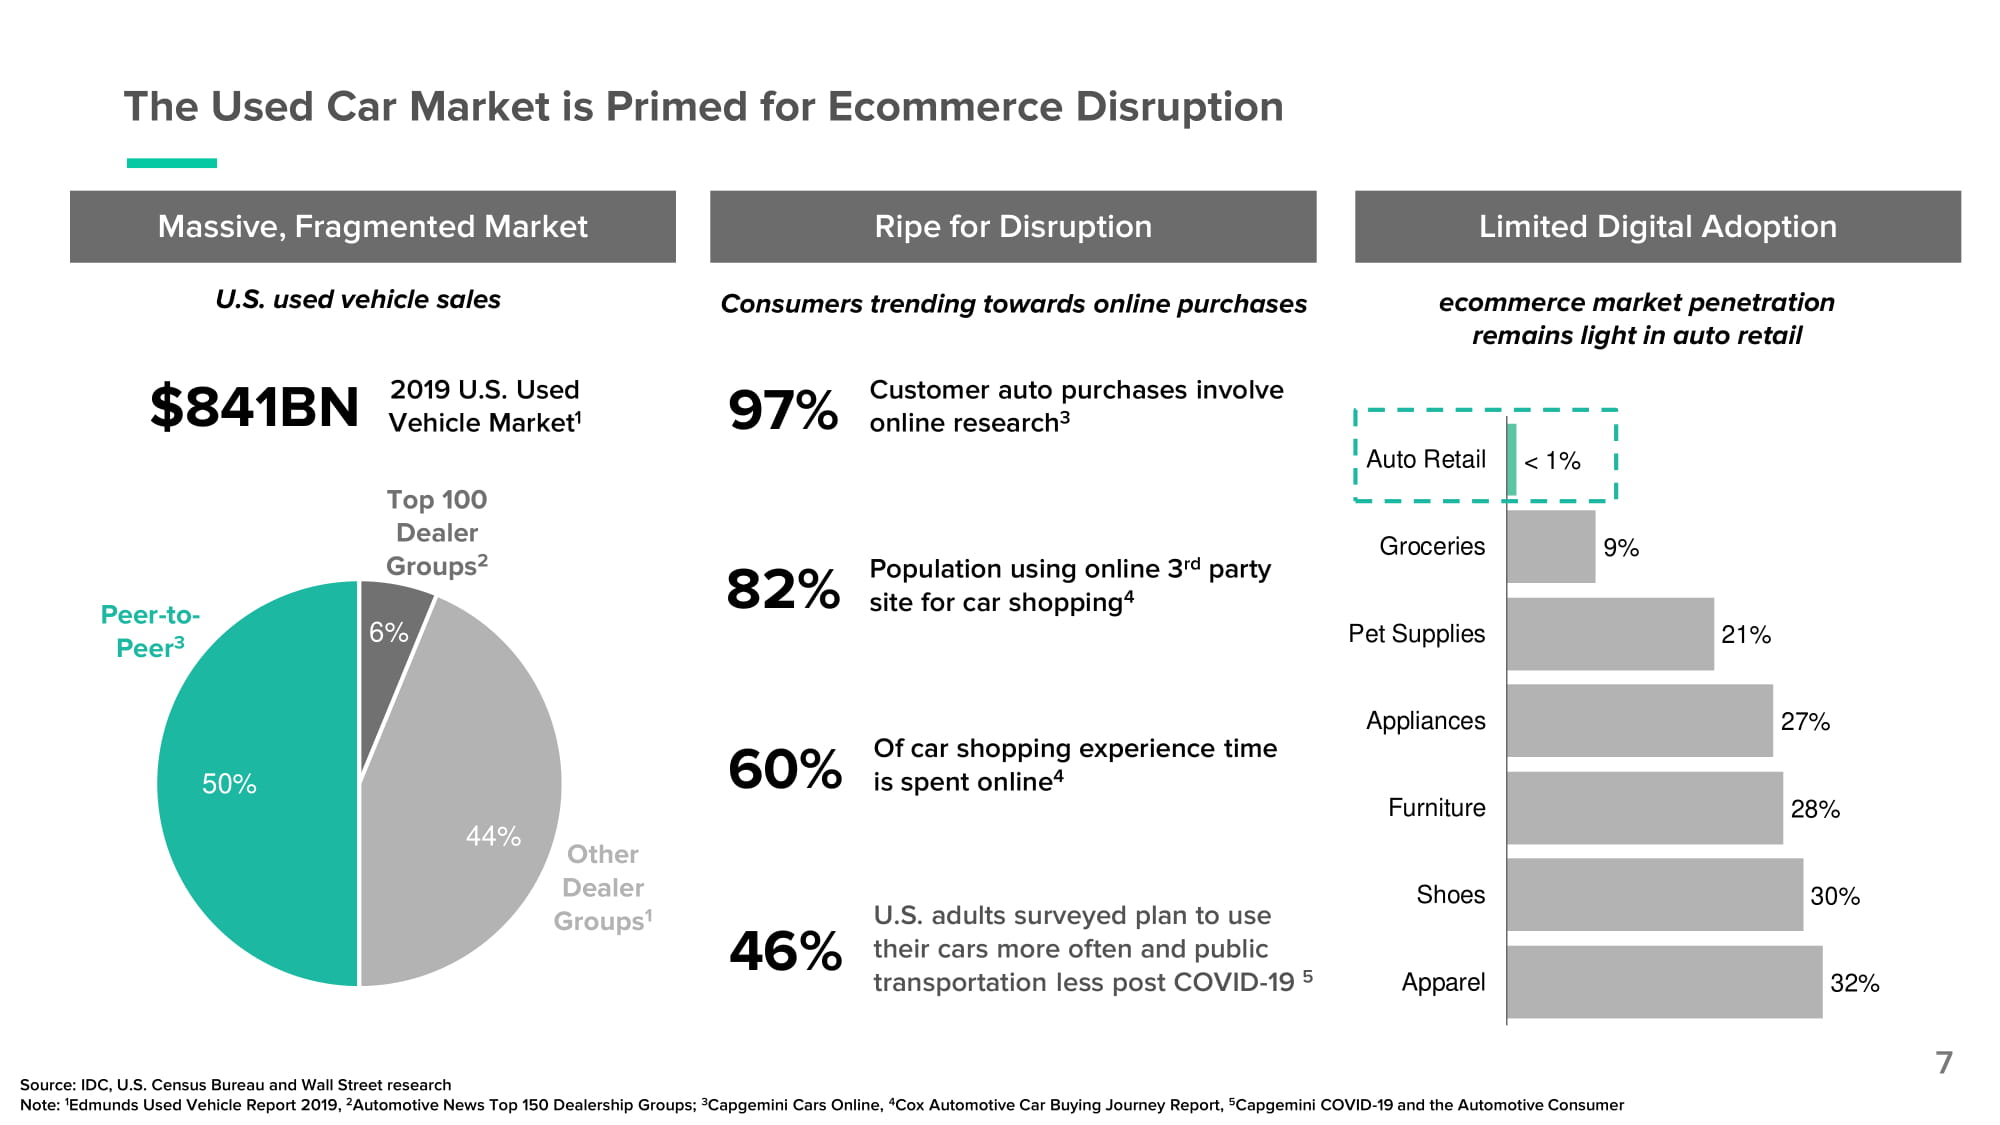
32% 30% 28% 27% 21% 9% Ap p arel Sh o es Furniture Ap p lian c es Pet Supplies Gr o c er i es Auto Retail < 1% The Used Car Market is Primed for Ecommerce Disruption Source: IDC, U.S. Census Bureau and Wall Street research Note: 1 Edmunds Used Vehicle Report 2019, 2 Automotive News Top 150 Dealership Groups; 3 Capgemini Cars Online, 4 Cox Automotive Car Buying Journey Report, 5 Capgemini COVID - 19 and the Automotive Consumer Massive, Fragmented Market Limited Digital Adoption ecommerce market penetration remains light in auto retail U.S. used vehicle sales Ripe for Disruption Population using online 3 rd party site for car shopping 4 82% Customer auto purchases involve online research 3 97% Consumers trending towards online purchases Of car shopping experience time is spent online 4 60% U.S. adults surveyed plan to use their cars more often and public transportation less post COVID - 19 5 46% 7 Peer - to - Peer 3 Other Dealer Gr o u p s 1 Top 100 Dealer Grou p s 2 6% 4 4 % 5 0 % 2019 U.S. Used Vehicle Market 1 $8 4 1BN
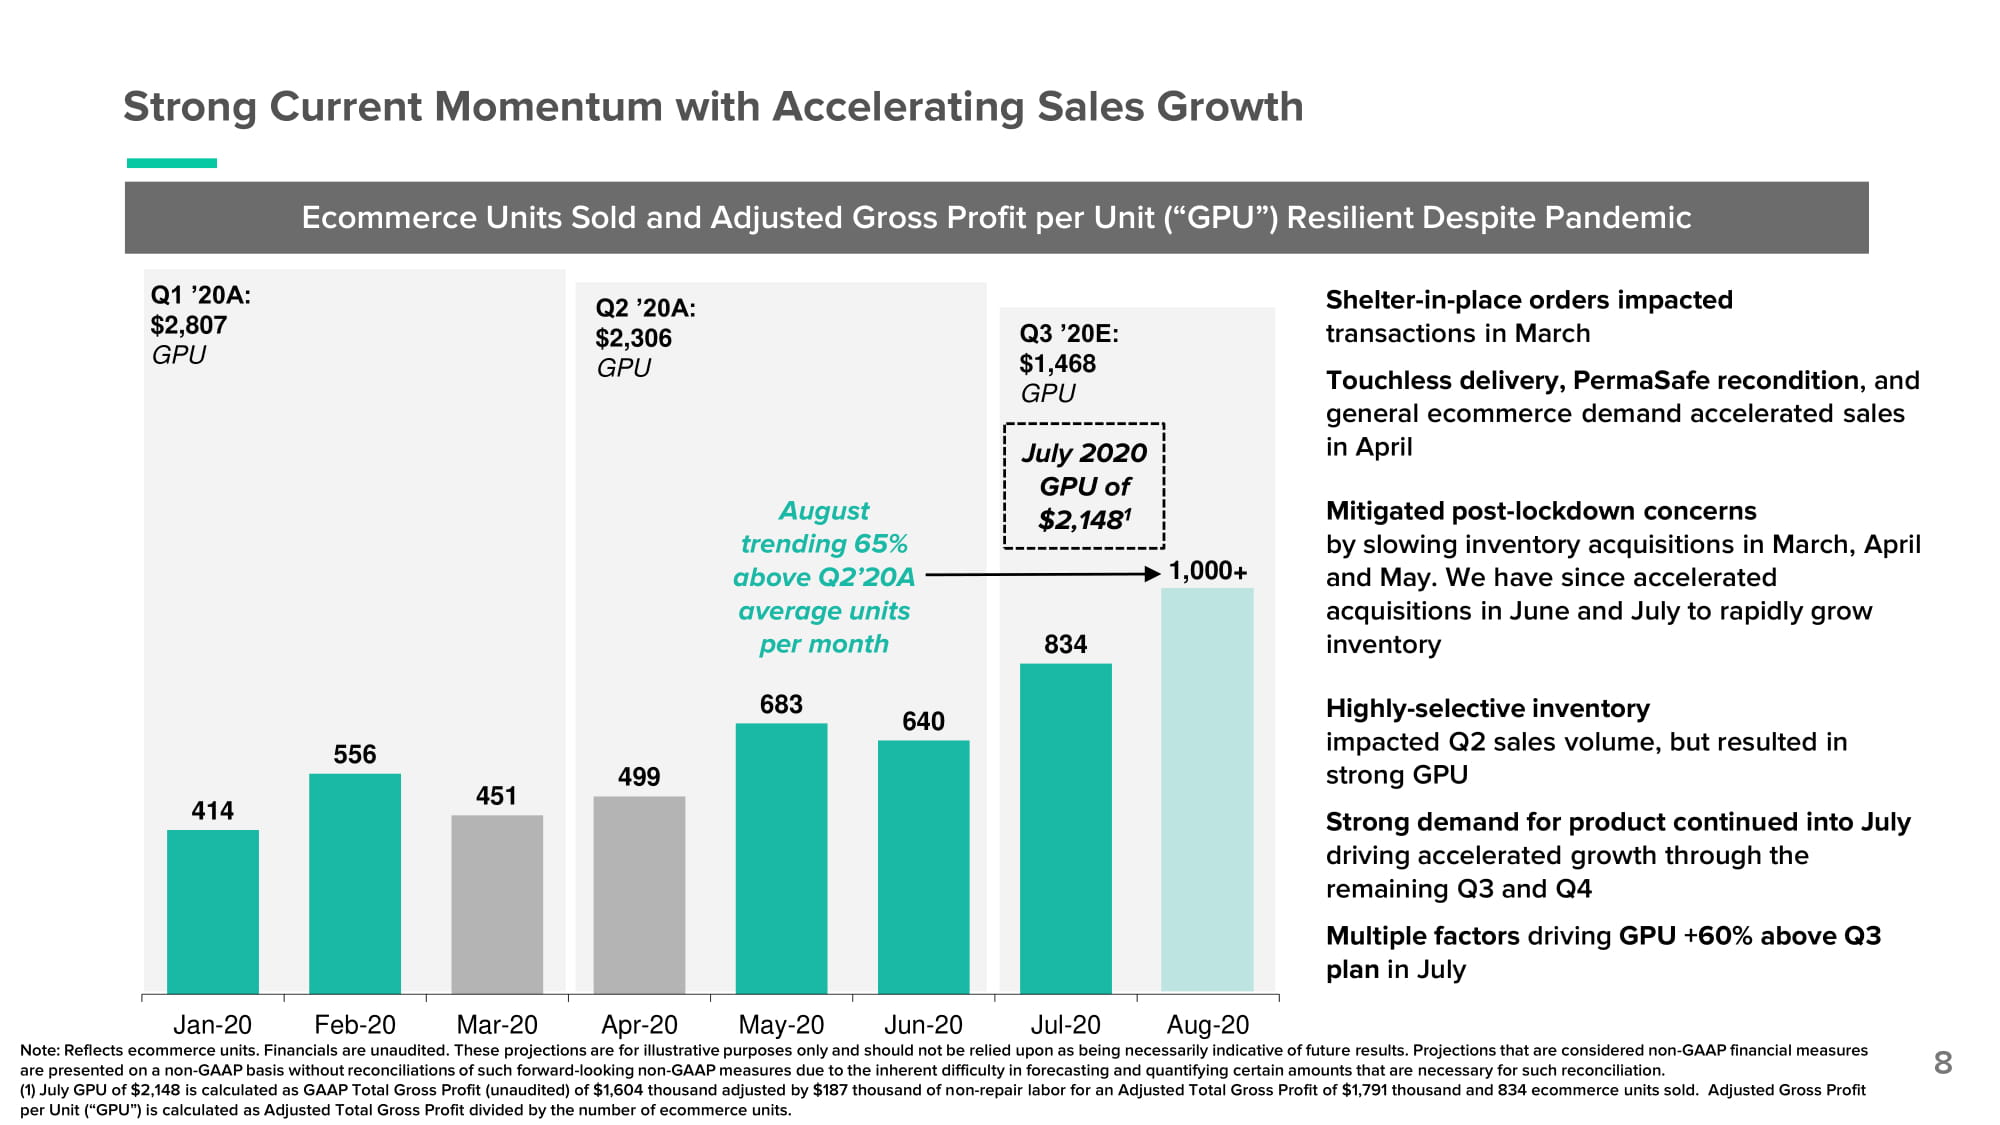
Strong Current Momentum with Accelerating Sales Growth 8 Ecommerce Units Sold and Adjusted Gross Profit per Unit (“GPU”) Resilient Despite Pandemic Jan - 20 Feb - 20 Mar - 20 Apr - 20 May - 20 Jun - 20 Jul - 20 Aug - 20E Note: Reflects ecommerce units. Financials are unaudited. These projections are for illustrative purposes only and should not be relied upon as being necessarily indicative of future results. Projections that are considered non - GAAP financial measures are presented on a non - GAAP basis without reconciliations of such forward - looking non - GAAP measures due to the inherent difficulty in forecasting and quantifying certain amounts that are necessary for such reconciliation. (1) July GPU of $2,148 is calculated as GAAP Total Gross Profit (unaudited) of $1,604 thousand adjusted by $187 thousand of non - repair labor for an Adjusted Total Gross Profit of $1,791 thousand and 834 ecommerce units sold. Adjusted Gross Profit per Unit (“GPU”) is calculated as Adjusted Total Gross Profit divided by the number of ecommerce units. Q1 ’20A: $2,807 GPU Q2 ’20A: $2,306 GPU July 2020 GPU of $2,148 1 August trending ~50% above Q2’20A average units per month Q3 ’20E: $1,468 GPU Shelter - in - place orders impacted transactions in March Touchless delivery, PermaSafe recondition, and general ecommerce demand accelerated sales in April Mitigated post - lockdown concerns by slowing inventory acquisitions in March, April and May. We have since accelerated acquisitions in June and July to rapidly grow inventory Highly - selective inventory impacted Q2 sales volume, but resulted in strong GPU Strong demand for product continued into July driving accelerated growth through the remaining Q3 and Q4 Multiple factors driving GPU +60% above Q3 plan in July 414 556 451 499 683 640 834 900+

Today’s Presenters George Arison Toby Russell Co - CEOs SVP of Engineering COO Sean Foy Karan Gupta Tracy Lessin 9 VP of Marketing VP of Strategy & Finance Henry Bird C FO Cindy Hanford

Operations Deep Dive COO Sean Foy
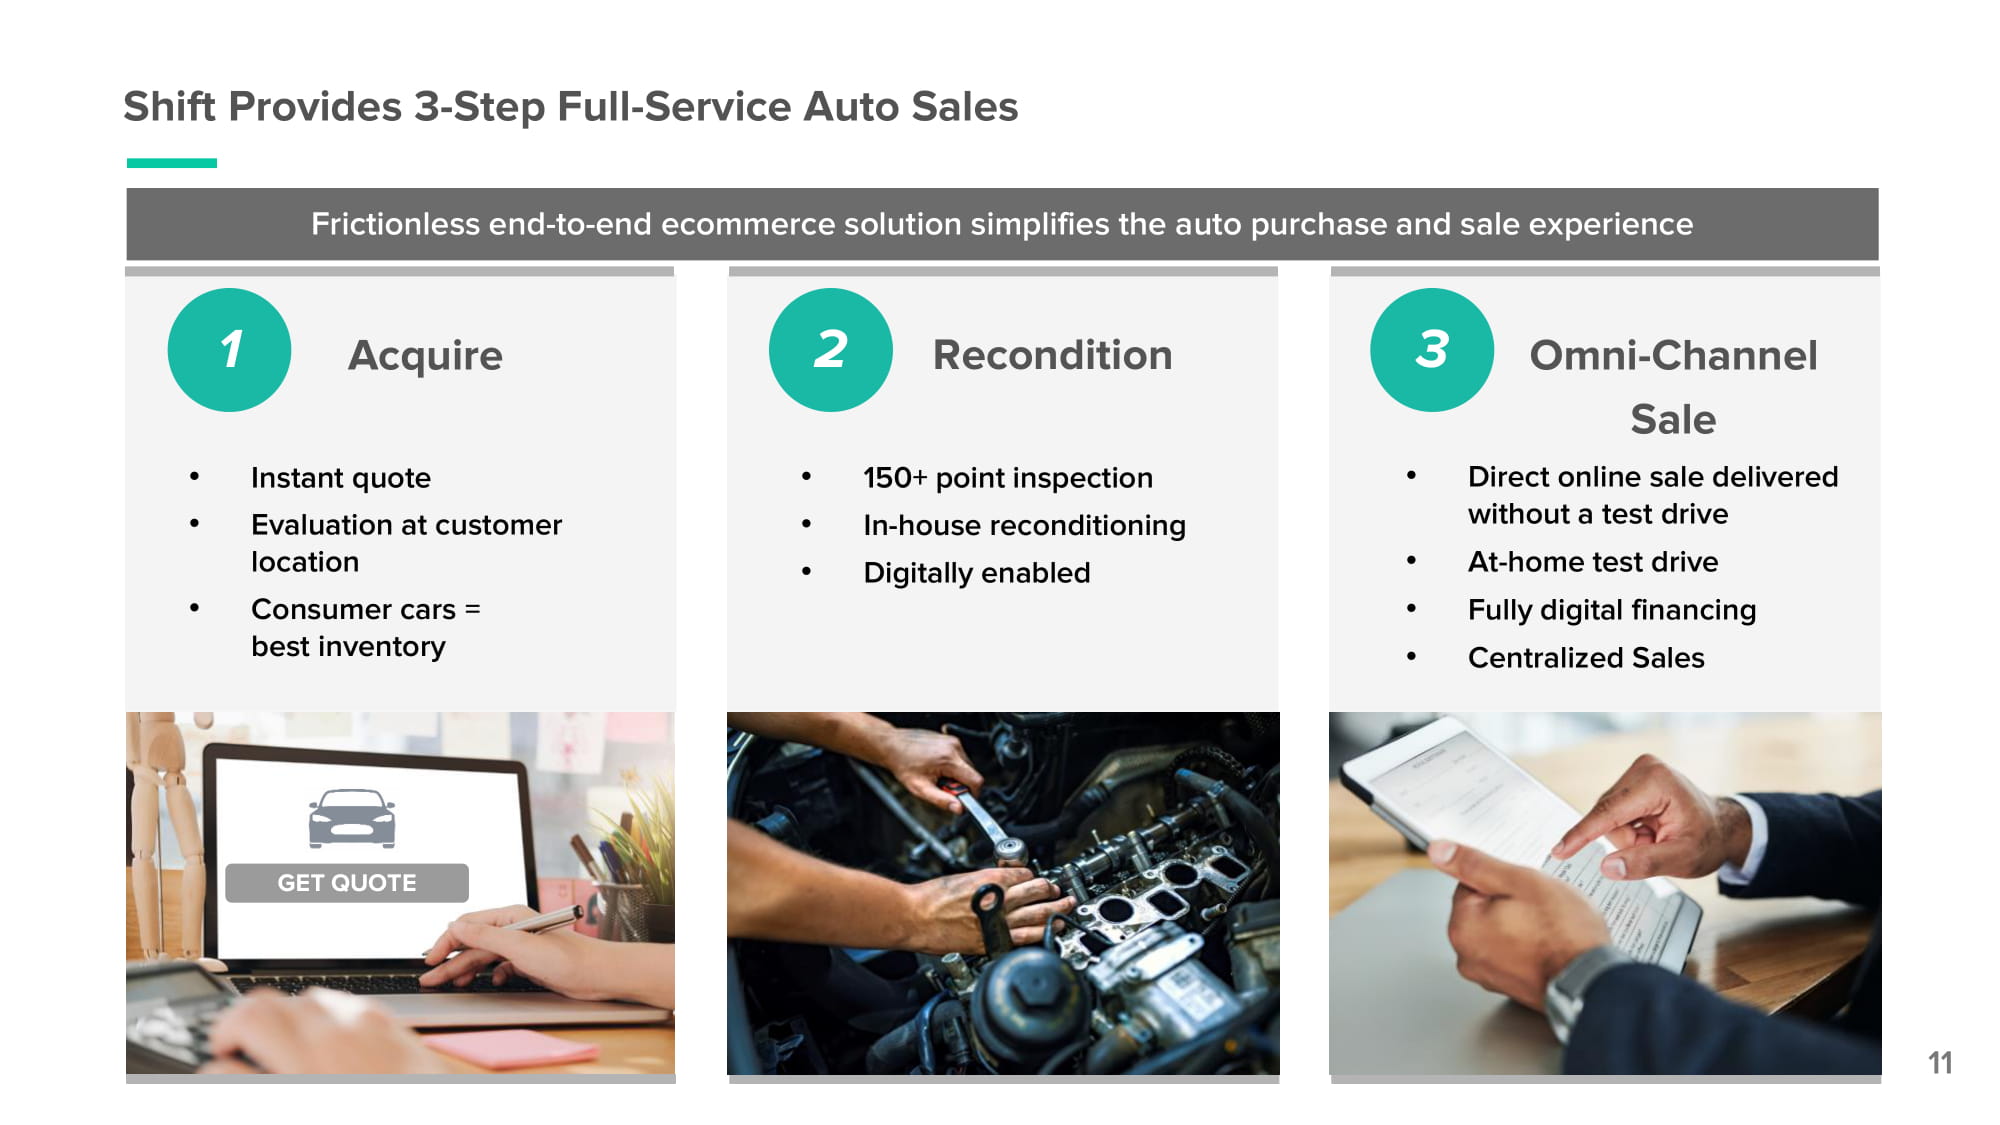
Shift Provides 3 - Step Full - Service Auto Sales Acquire Recondition 1 2 3 Omni - Channel Sale • Direct online sale delivered without a test drive • At - home test drive • Fully digital financing • Centralized Sales • Instant quote • Evaluation at customer location • Consumer cars = best inventory • 150+ point inspection • In - house reconditioning • Digitally enabled 11 GET QUOTE Frictionless end - to - end ecommerce solution simplifies the auto purchase and sale experience

Seller Experience https://vimeo.com/452078695/8fdeb9cc6a
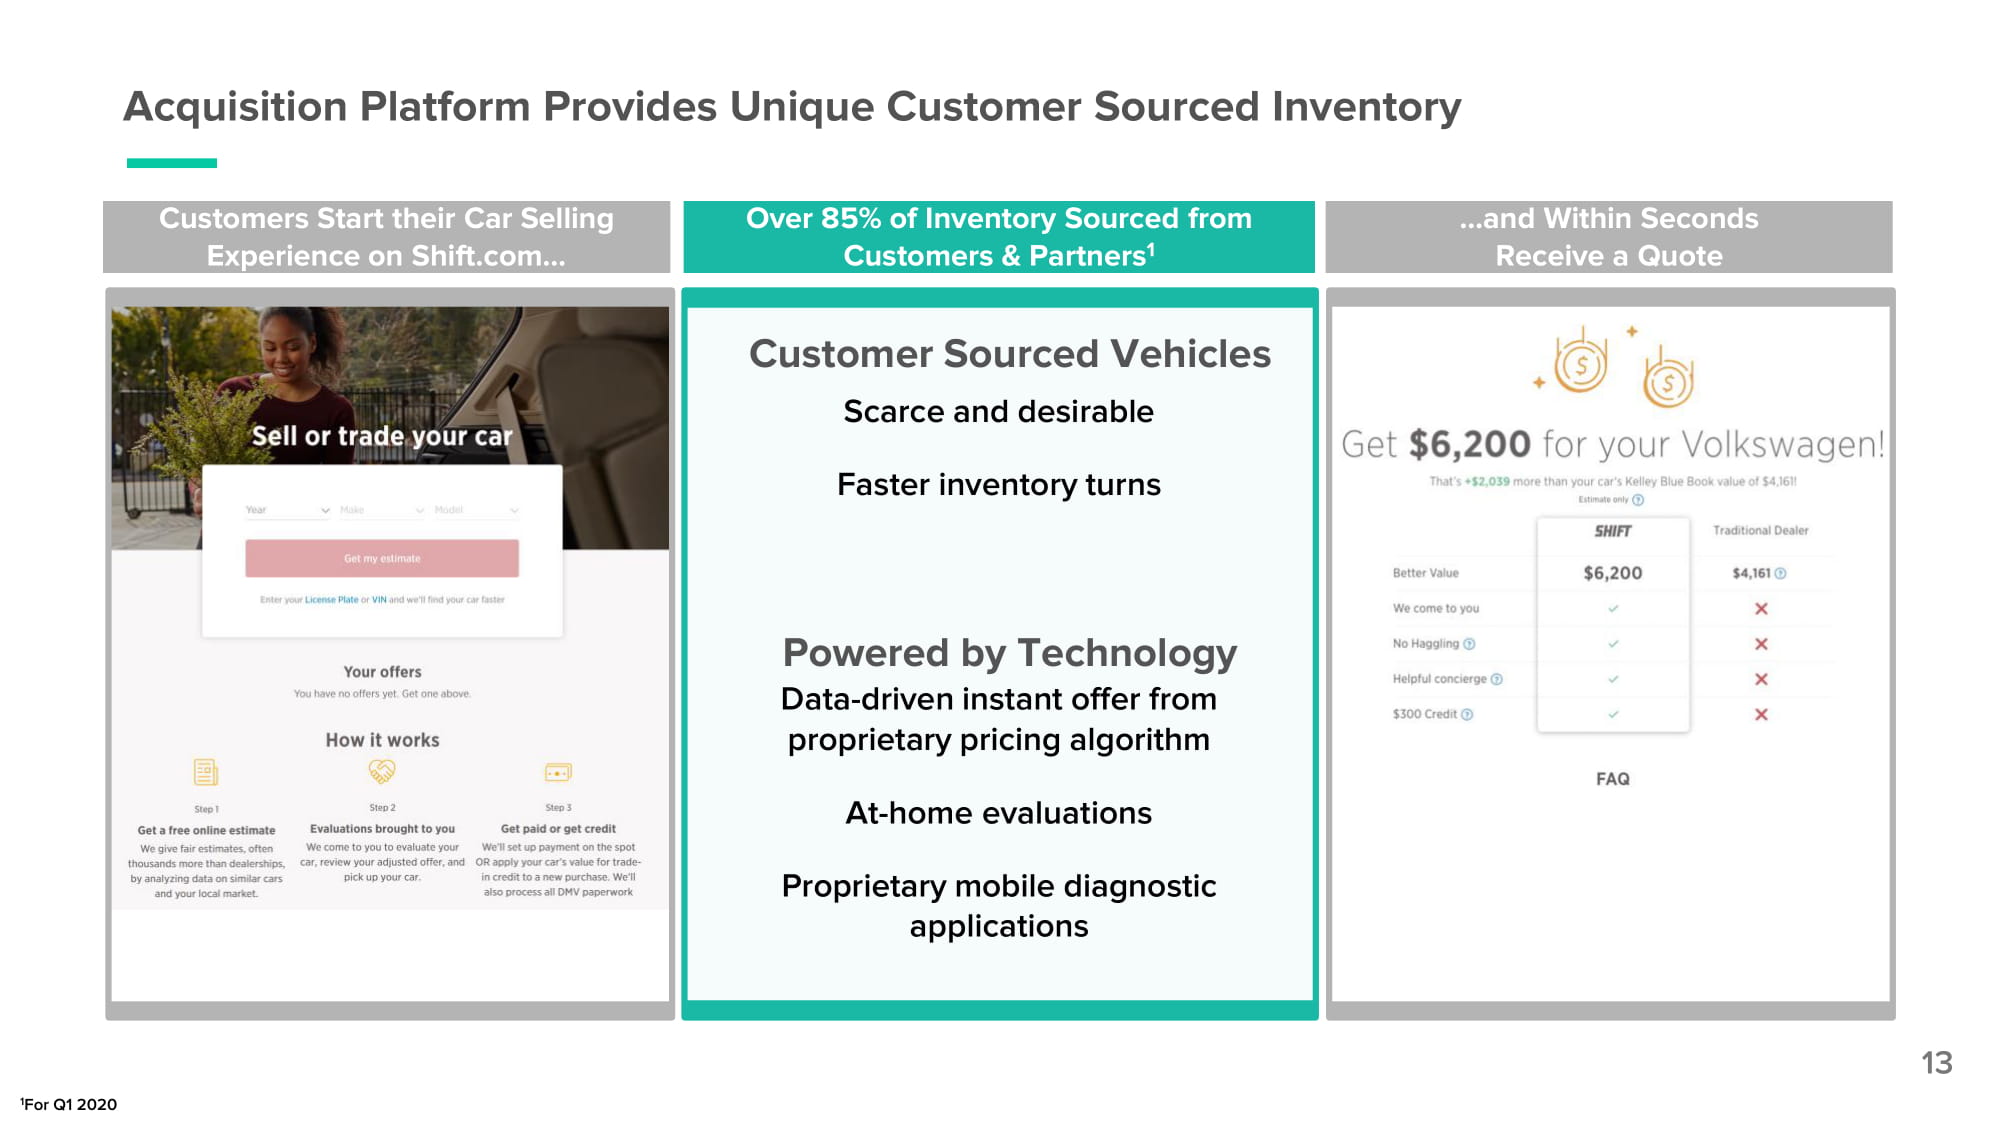
Acquisition Platform Provides Unique Customer Sourced Inventory 13 Customers Start their Car Selling Experience on Shift.com… Over 85% of Inventory Sourced from Customers & Partners 1 …and Within Seconds Receive a Quote Customer Sourced Vehicles Scarce and desirable Faster inventory turns Powered by Technology Data - driven instant offer from proprietary pricing algorithm At - home evaluations Proprietary mobile diagnostic applications 1 For Q1 2020

Reconditioning https://vimeo.com/452100592/d60c8cb45d
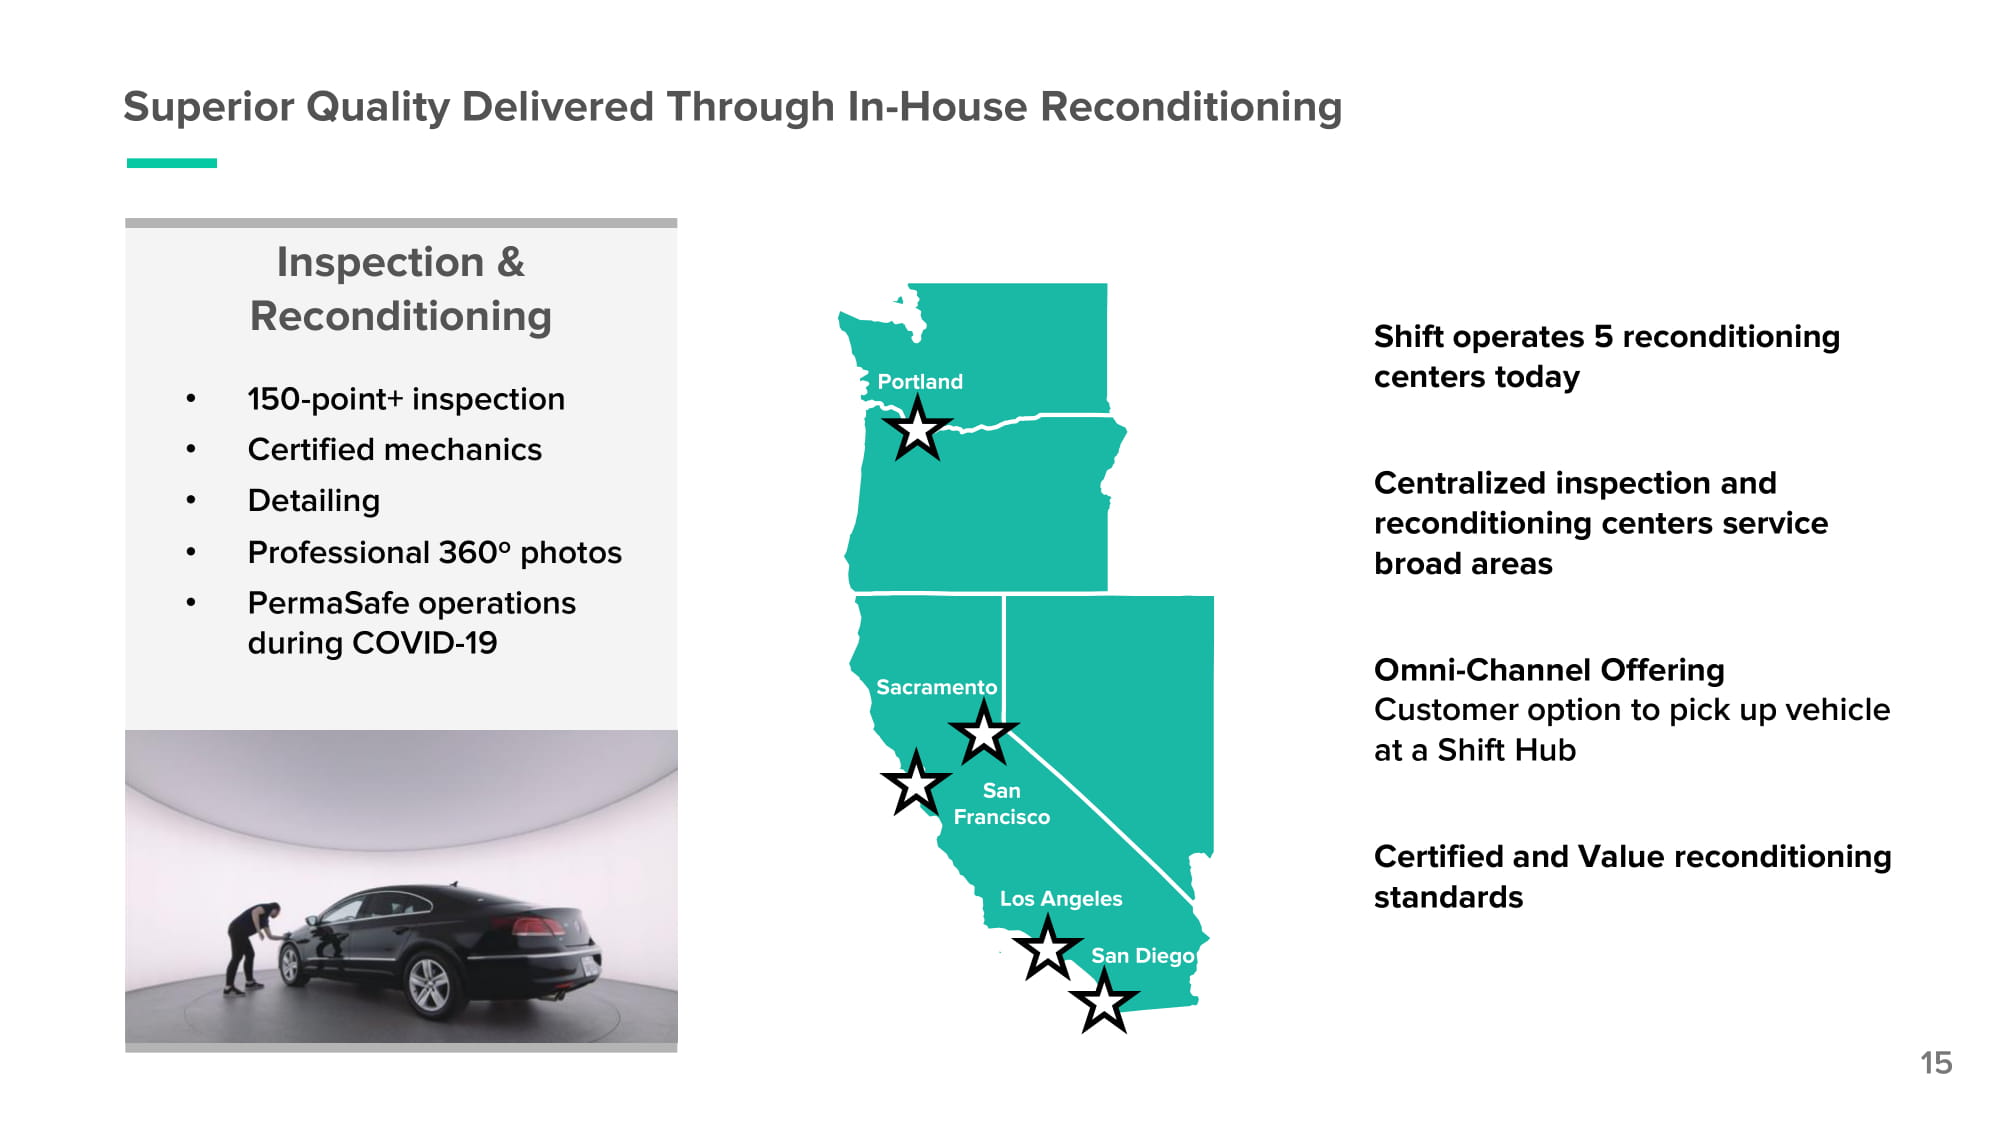
Superior Quality Delivered Through In - House Reconditioning Inspection & R e c o ndi tioni ng • 150 - point+ inspection • Certified mechanics • Detailing • Professional 360 o photos • PermaSafe operations during COVID - 19 15 Shift operates 5 reconditioning centers today Centralized inspection and reconditioning centers service broad areas Omni - Channel Offering Customer option to pick up vehicle at a Shift Hub Certified and Value reconditioning standards P o rt l a n d San F ra n c is c o S ac ra ment o Los Angeles San Diego
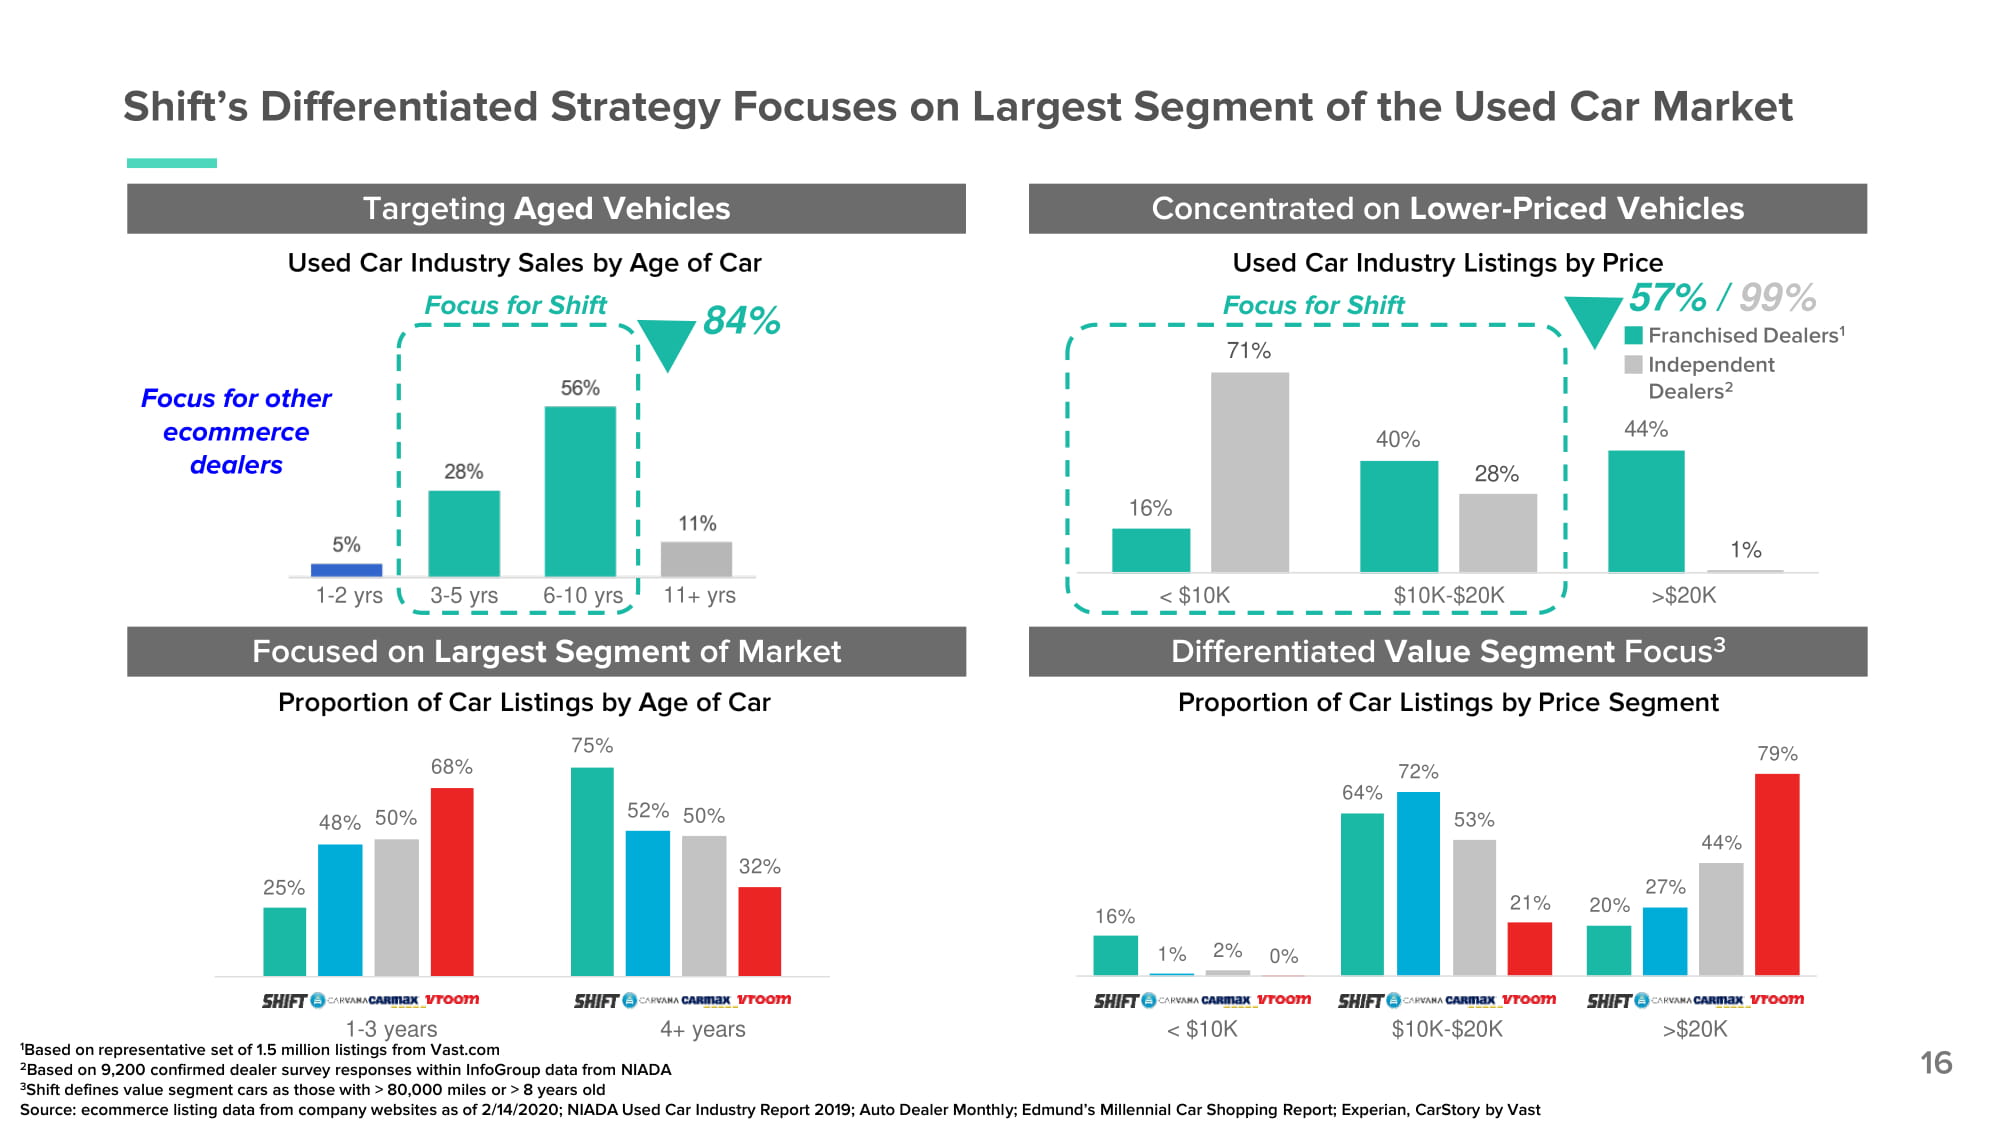
Shift’s Differentiated Strategy Focuses on Largest Segment of the Used Car Market 16 1 Based on representative set of 1.5 million listings from Vast.com 2 Based on 9,200 confirmed dealer survey responses within InfoGroup data from NIADA 3 Shift defines value segment cars as those with > 80,000 miles or > 8 years old Source: ecommerce listing data from company websites as of 2/14/2020; NIADA Used Car Industry Report 2019; Auto Dealer Monthly; Edmund’s Millennial Car Shopping Report; Experian, CarStory by Vast 1 - 3 years 4+ years < $10K $10K - $20K > $20 K 16 % 40 % 28 % 1 % Used Car Industry Listings by Price Dealers 2 44% Focus for Shift 71% Proportion of Car Listings by Price Segment 57% / 99% Franchised Dealers 1 Independent < $10 K $10 K - $20 K > $20 K Concentrated on Lower - Priced Vehicles Differentiated Value Segment Focus 3 16 % 64 % 20 % 1 % 72 % 27 % 2 % 53 % 44 % 0 % 21 % 79 % Targeting Aged Vehicles Focused on Largest Segment of Market 25 % 48% 50% 52% 50% 68 % 32 % Proportion of Car Listings by Age of Car 75% 84% Focus for other ecommerce dealers Focus for Shift 1 - 2 yrs 3 - 5 yrs 6 - 10 yrs 11+ yrs Used Car Industry Sales by Age of Car

Test Drive Experience https://vimeo.com/452089390/0f15225c6f
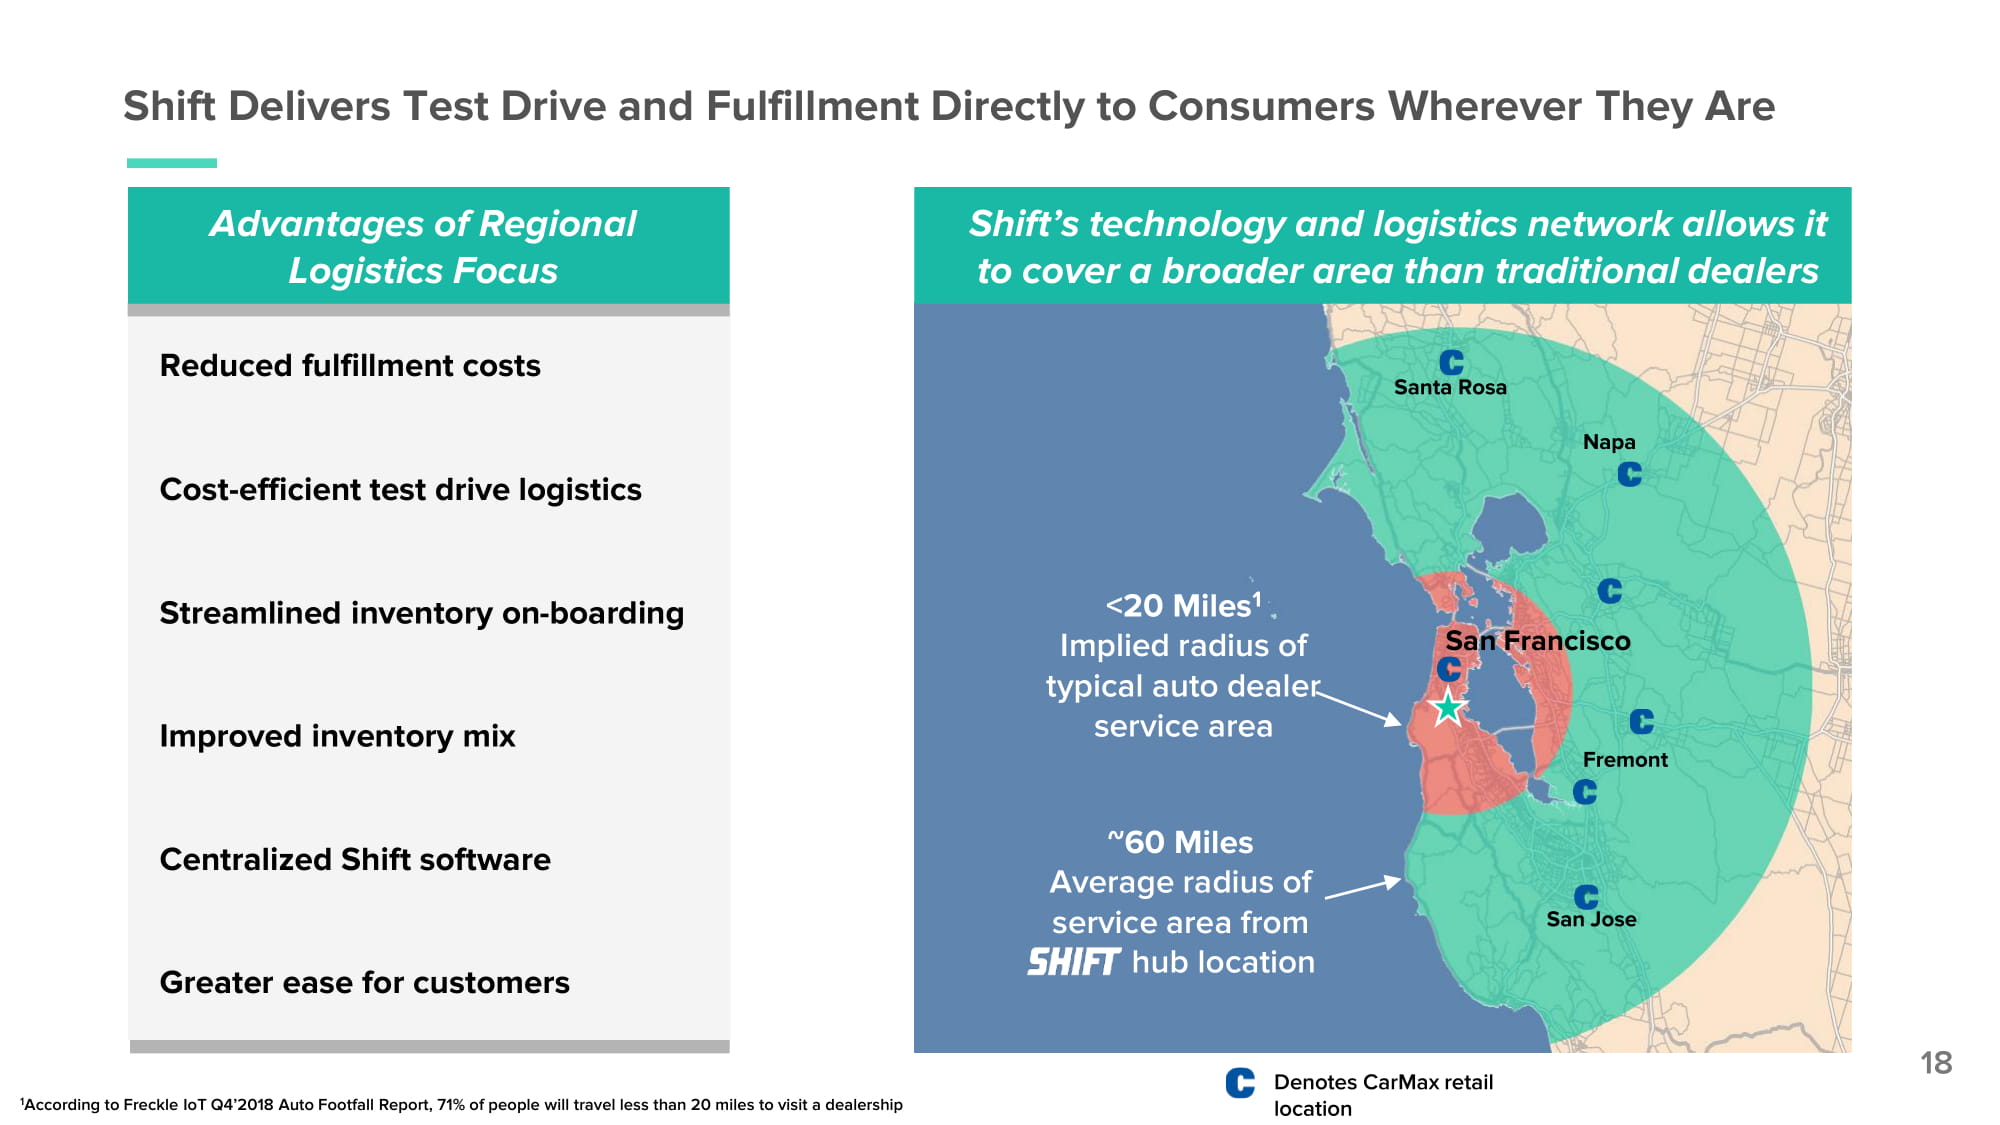
Shift Delivers Test Drive and Fulfillment Directly to Consumers Wherever They Are 18 1 According to Freckle IoT Q4’2018 Auto Footfall Report, 71% of people will travel less than 20 miles to visit a dealership Shift’s technology and logistics network allows it to cover a broader area than traditional dealers Denotes CarMax retail location <20 Miles 1 Implied radius of typical auto dealer service area San Francisco F re m o n t Santa Rosa N a pa San Jose Reduced fulfillment costs Cost - efficient test drive logistics Streamlined inventory on - boarding Improved inventory mix Centralized Shift software Greater ease for customers ~60 Miles Average radius of service area from hub location Advantages of Regional Logistics Focus

Consistently Evaluating and Improving our Operational Practices 19 Note: These projections are for illustrative purposes only and should not be relied upon as being necessarily indicative of future results. Metrics that are considered non - GAAP financial measures are presented on a non - GAAP basis without reconciliations of such forward - looking non - GAAP measures due to the inherent difficulty in forecasting and quantifying certain amounts that are necessary for such reconciliation. All historical annual GAAP financials shown are audited; quarterly, non - GAAP financials and projections are unaudited. 1 Shift defines Value segment cars as those with > 80,000 miles or > 8 years old 2 Year - to - date as of 6/30/2020 3 Based on May 2020 other adjusted gross profit per unit average of $850 All Operational Improvements Driven and Supported by Investment in Tech Platform High Quality Inventory Management Sales Improvements Wh o lesa le Units % Value as a % of Units Sold 1 Decrease in wholesale units as a percentage of total units in Q2 2020A compared to FY 2019A 19% 29% Less Value Car Depreciation Of ecommerce units in YTD 2 2020A were Value Cars Less depreciation of Value Cars as compared to Core Cars 50% Other Adjusted Gross Profit per Unit Increase in other adjusted gross profit per unit in May over 2019 average 3 8 4 % “Speed to Lead" Customers buy from first sales representative they interact with 60% - 80%
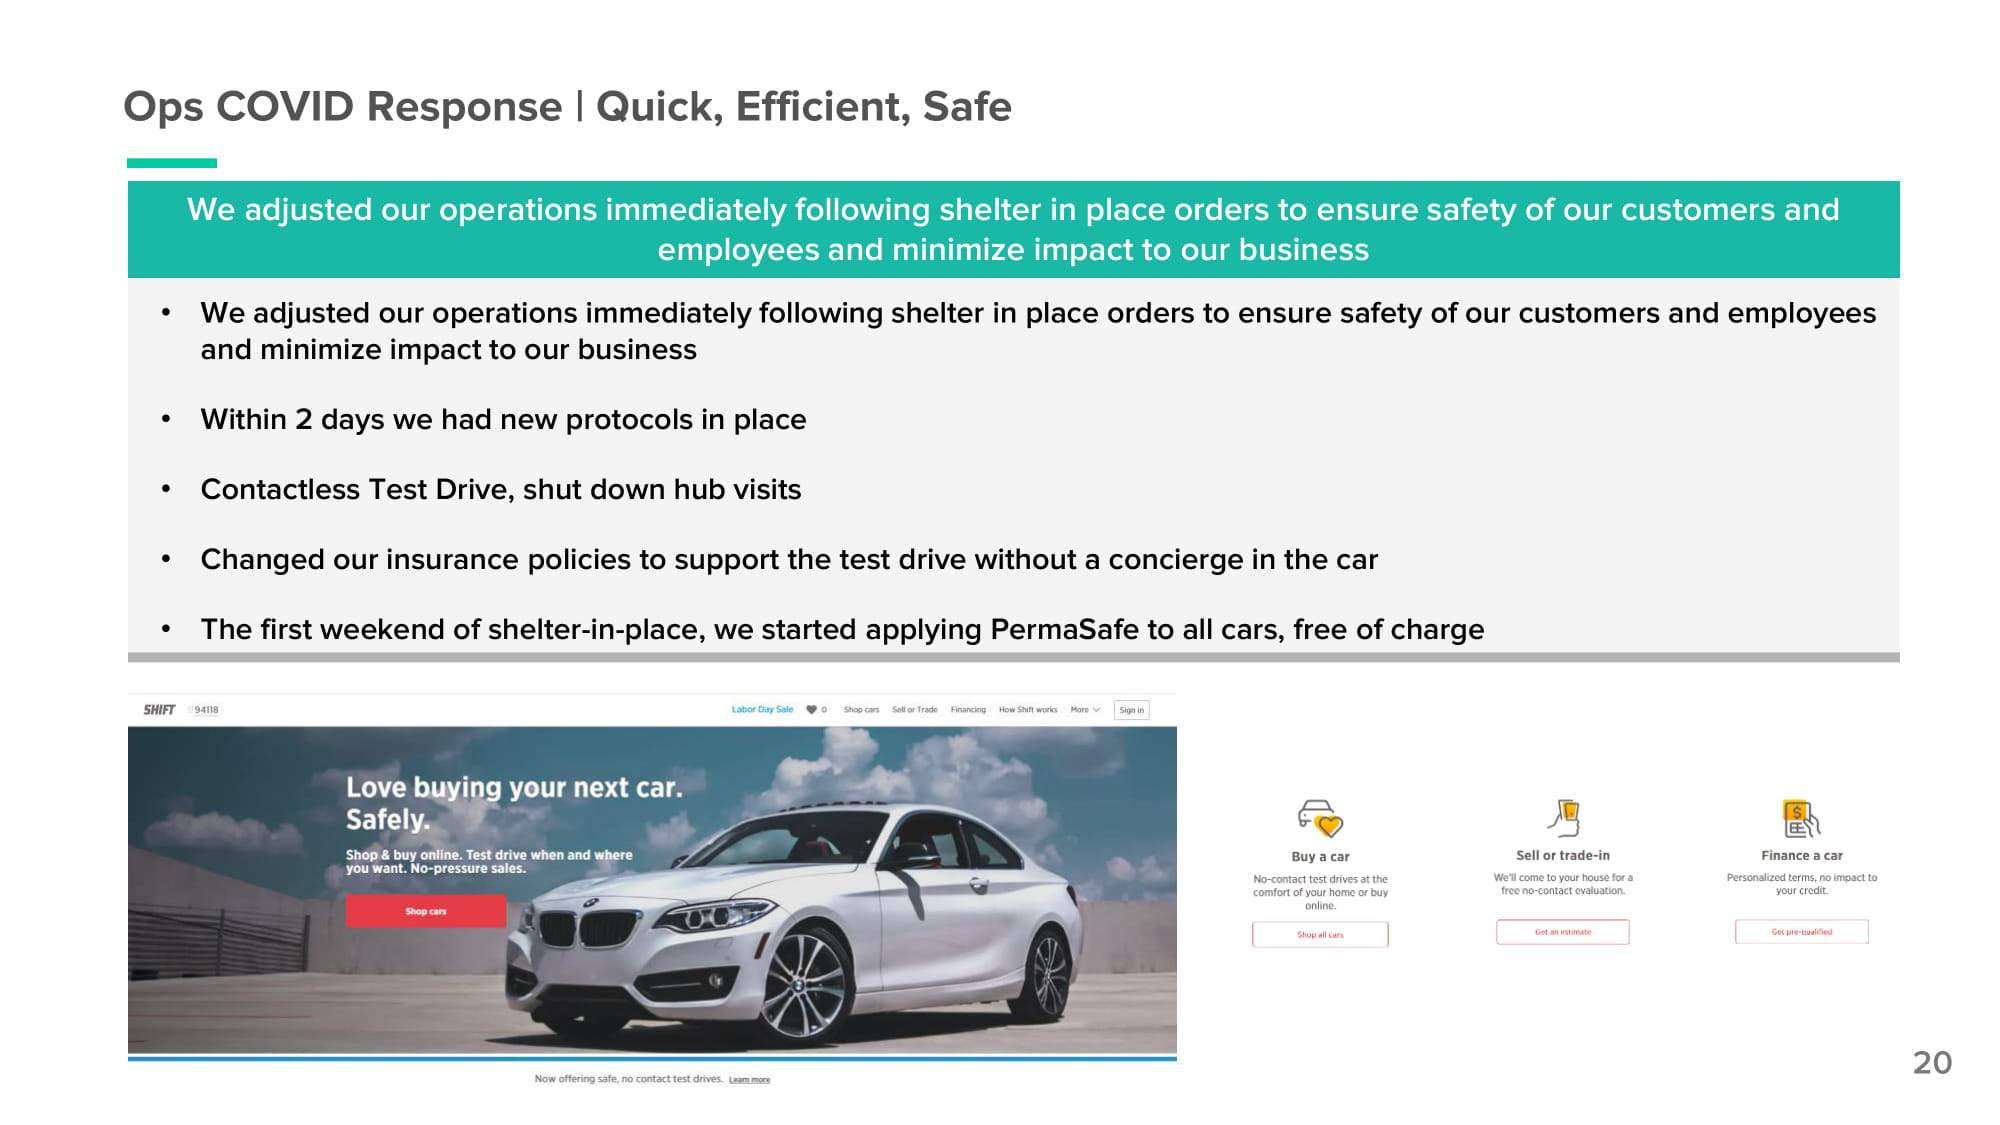
We adjusted our operations immediately following shelter in place orders to ensure safety of our customers and employees and minimize impact to our business • We adjusted our operations immediately following shelter in place orders to ensure safety of our customers and employees and minimize impact to our business • Within 2 days we had new protocols in place • Contactless Test Drive, shut down hub visits • Changed our insurance policies to support the test drive without a concierge in the car • The first weekend of shelter - in - place, we started applying PermaSafe to all cars, free of charge Ops COVID Response | Quick, Efficient, Safe 20

Operational Highlights Customer sourced vehicles results in a scarce and desirable full - spectrum inventory In - house reconditioning allows us to sell full - spectrum inventory with control over price and timing Omni - channel fulfillment with patented at - home Test Drive logistics system Constant self - evaluation and optimization of processes drives better unit economics Tech powers each step providing significant operating leverage 21

Technology Platform SVP of Engineering Karan Gupta

San Francisco Washington, DC Calg a r y Buenos Aires ...organized by business function. 50+ Engineers, Product Managers, Designers, and Data Scientists in San Francisco, Washington DC, Calgary and Buenos Aires... Sourcing talent from industry leaders: A World - Class Tech Team is our Backbone... 23
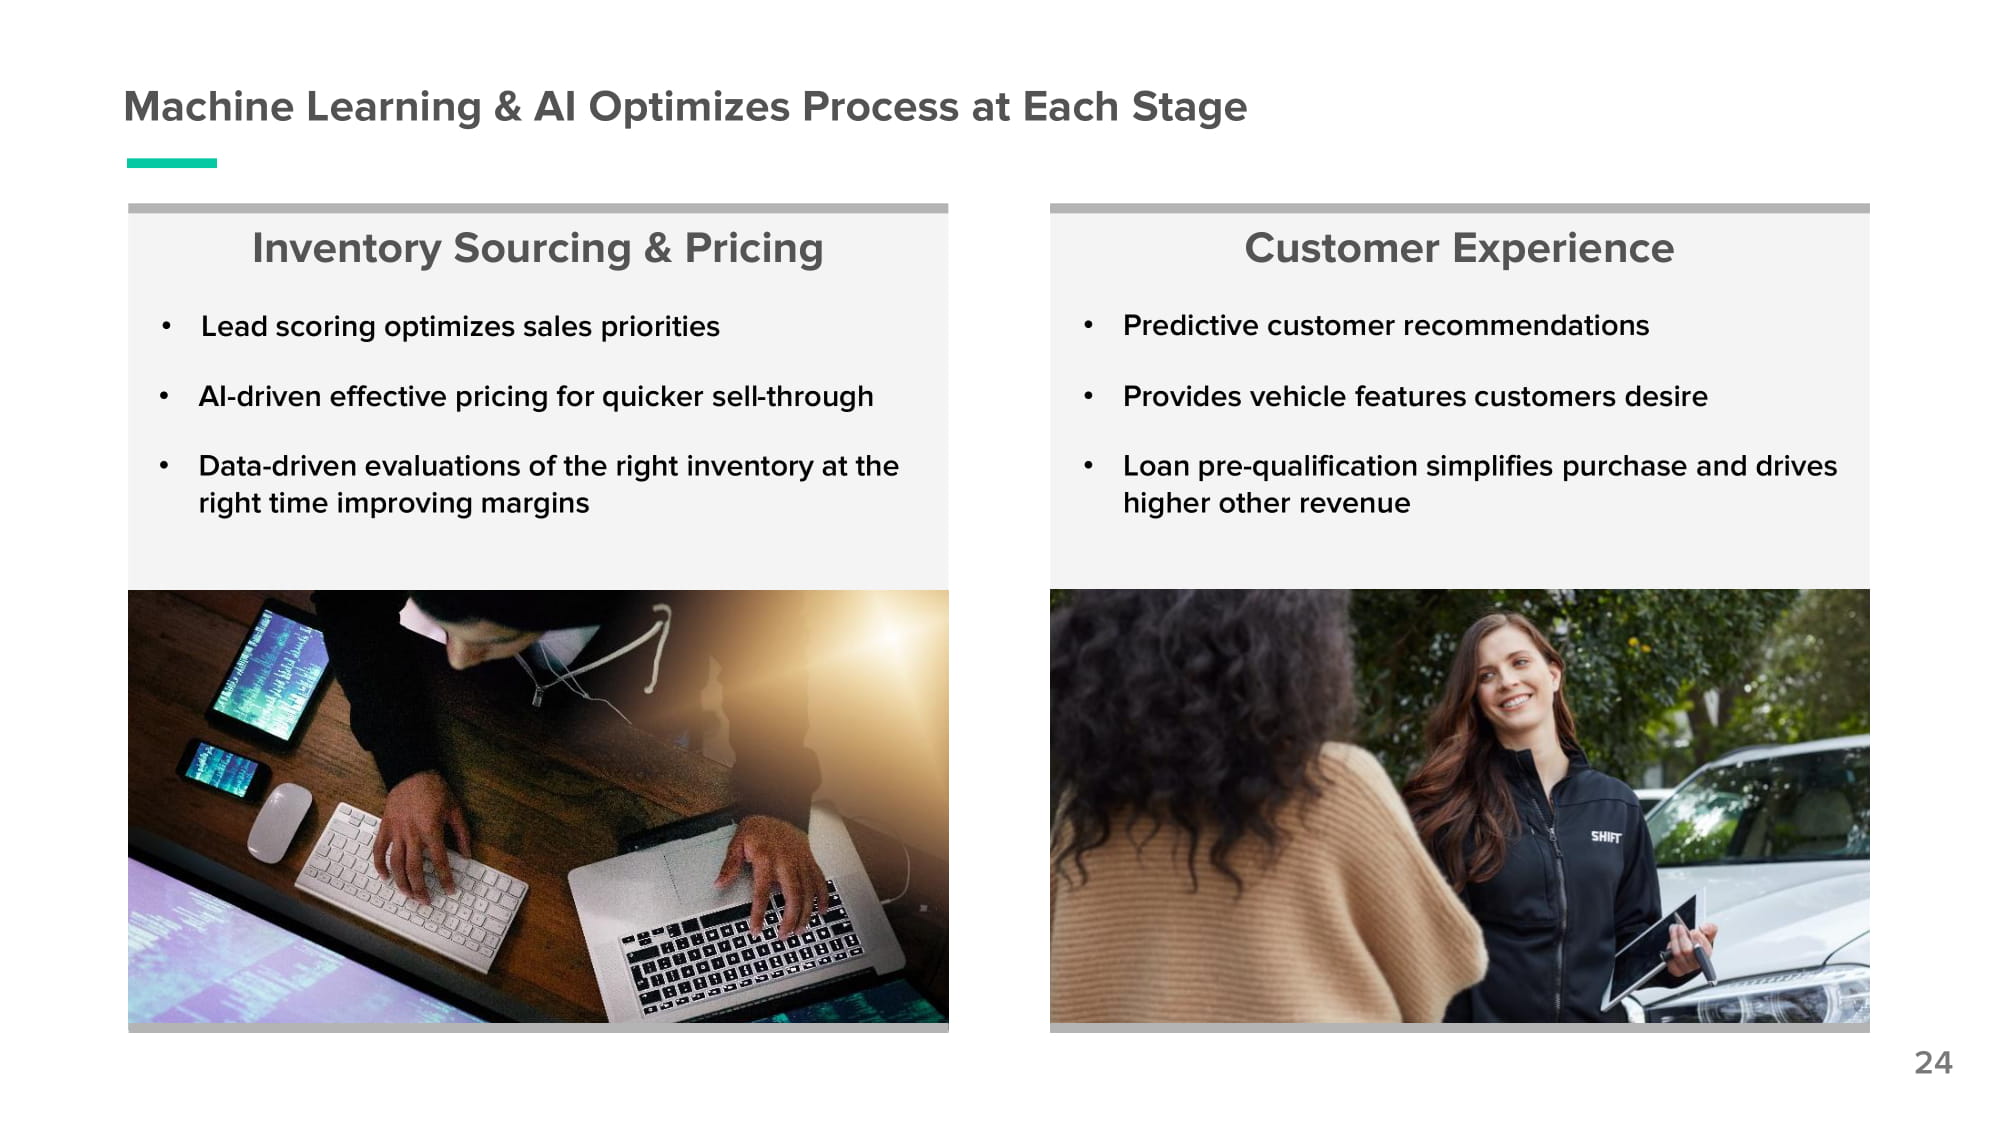
Inventory Sourcing & Pricing • Lead scoring optimizes sales priorities • AI - driven effective pricing for quicker sell - through • Data - driven evaluations of the right inventory at the right time improving margins Customer Experience • Predictive customer recommendations • Provides vehicle features customers desire • Loan pre - qualification simplifies purchase and drives higher other revenue Machine Learning & AI Optimizes Process at Each Stage 24
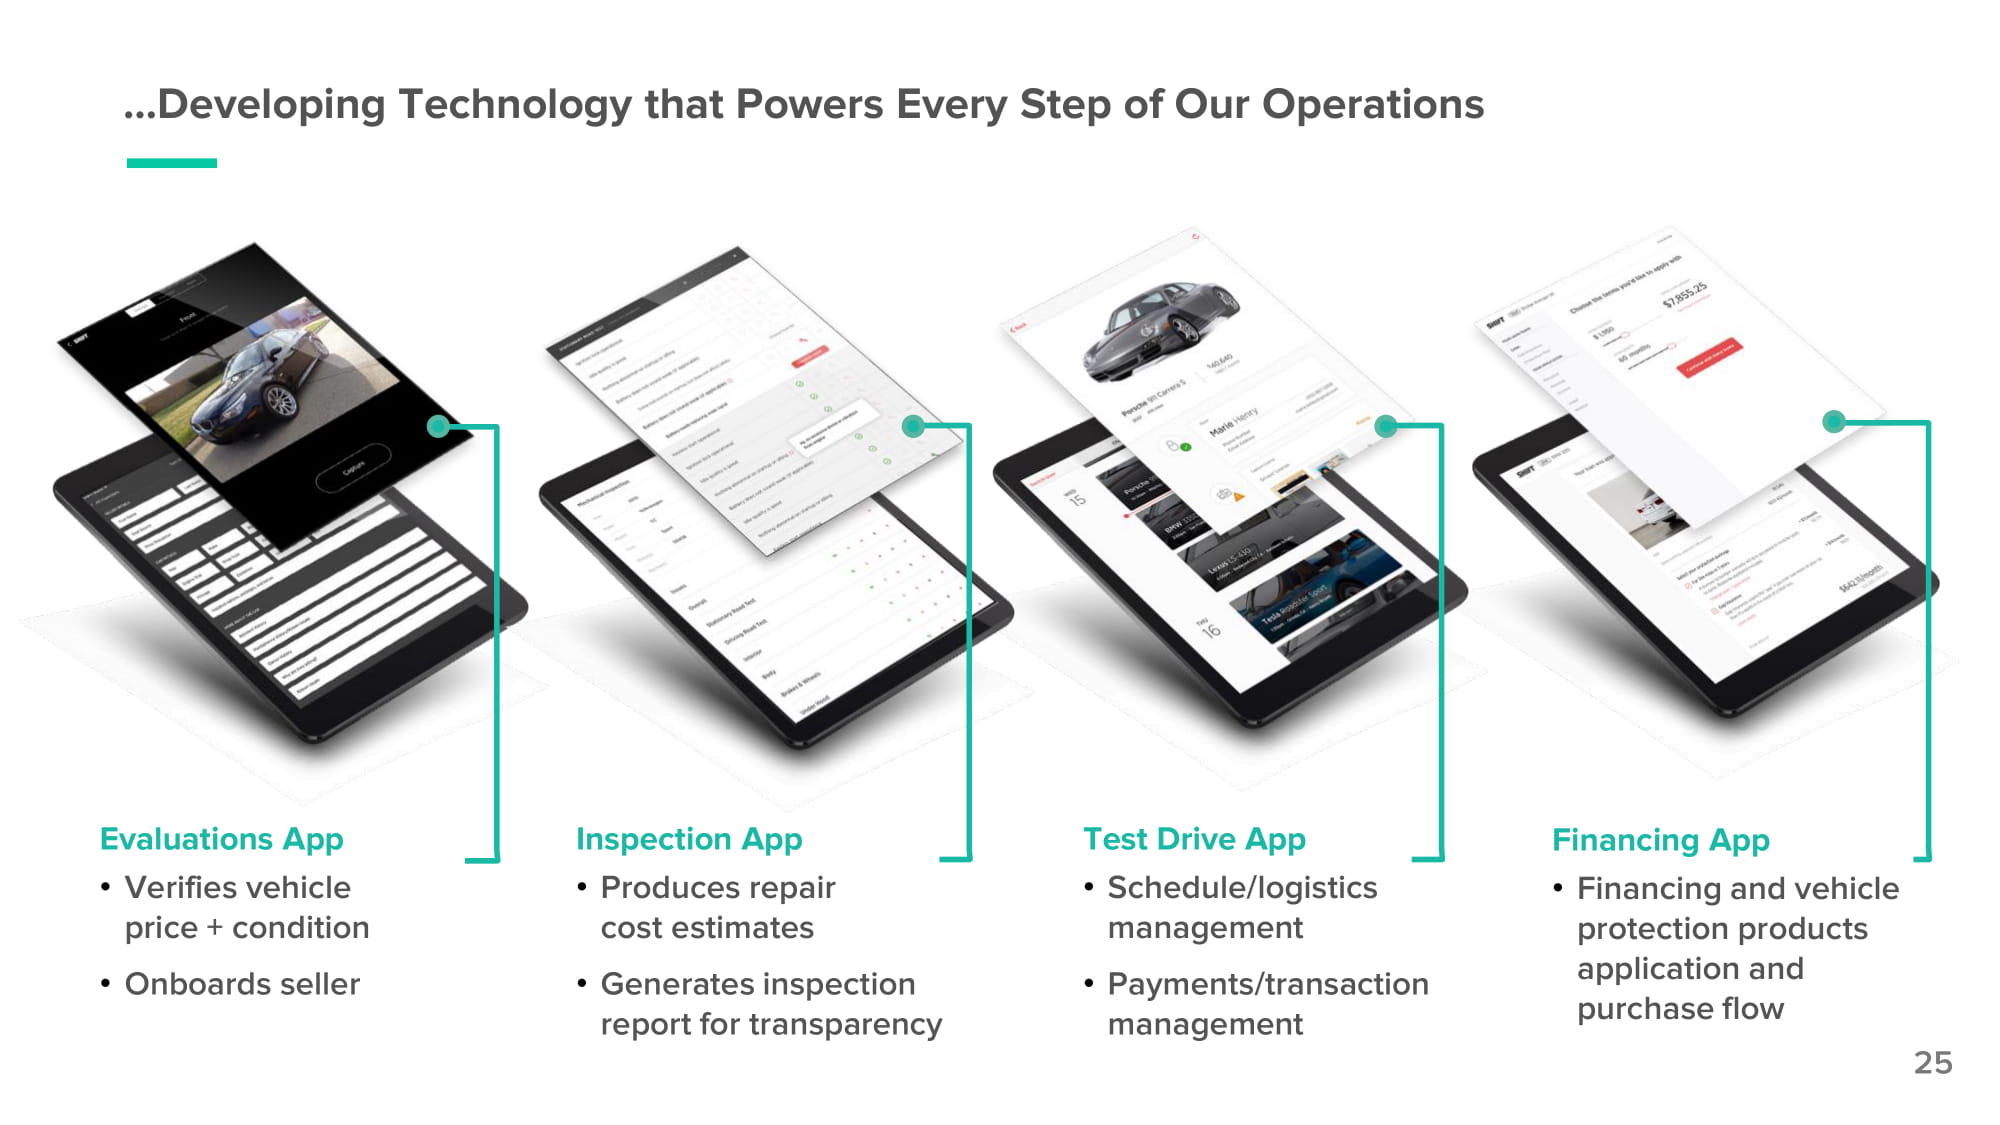
Test Drive App • S ch e dule / l o gis tics management • Payments/transaction management Inspection App • Produces repair cost estimates • Generates inspection report for transparency Evaluations App • Verifies vehicle price + condition • Onboards seller Financing App • Financing and vehicle protection products application and purchase flow …Developing Technology that Powers Every Step of Our Operations 25
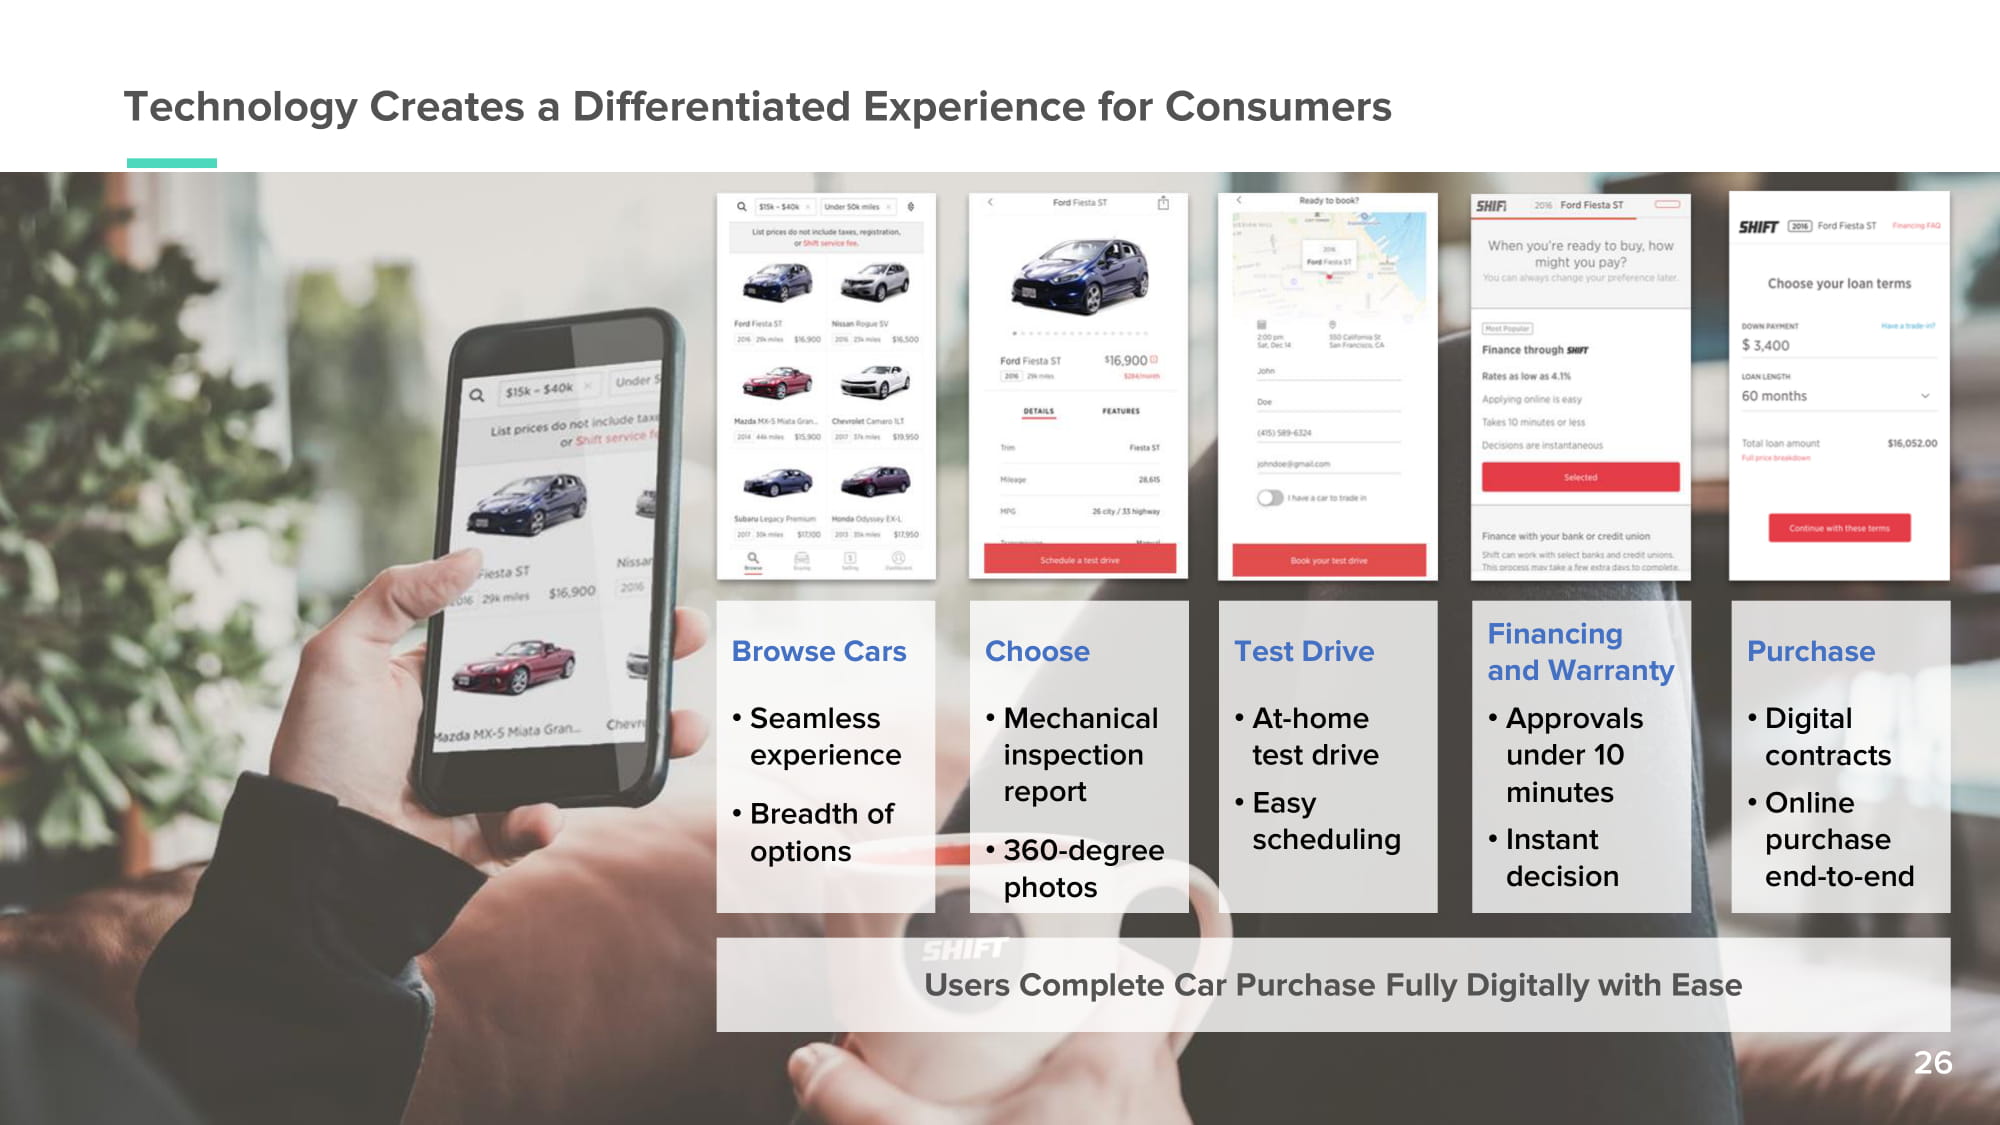
Browse Cars • Seamless experience • Breadth of options Choose • Mech a n i cal inspection report • 360 - d egree photos Test Drive • At - home test drive • Easy schedul i ng Financing and Warranty • Approv als under 10 minutes • Instant d eci s ion Purchase • Digital contracts • Online purchase end - t o - end Technology Creates a Differentiated Experience for Consumers 26 Users Complete Car Purchase Fully Digitally with Ease
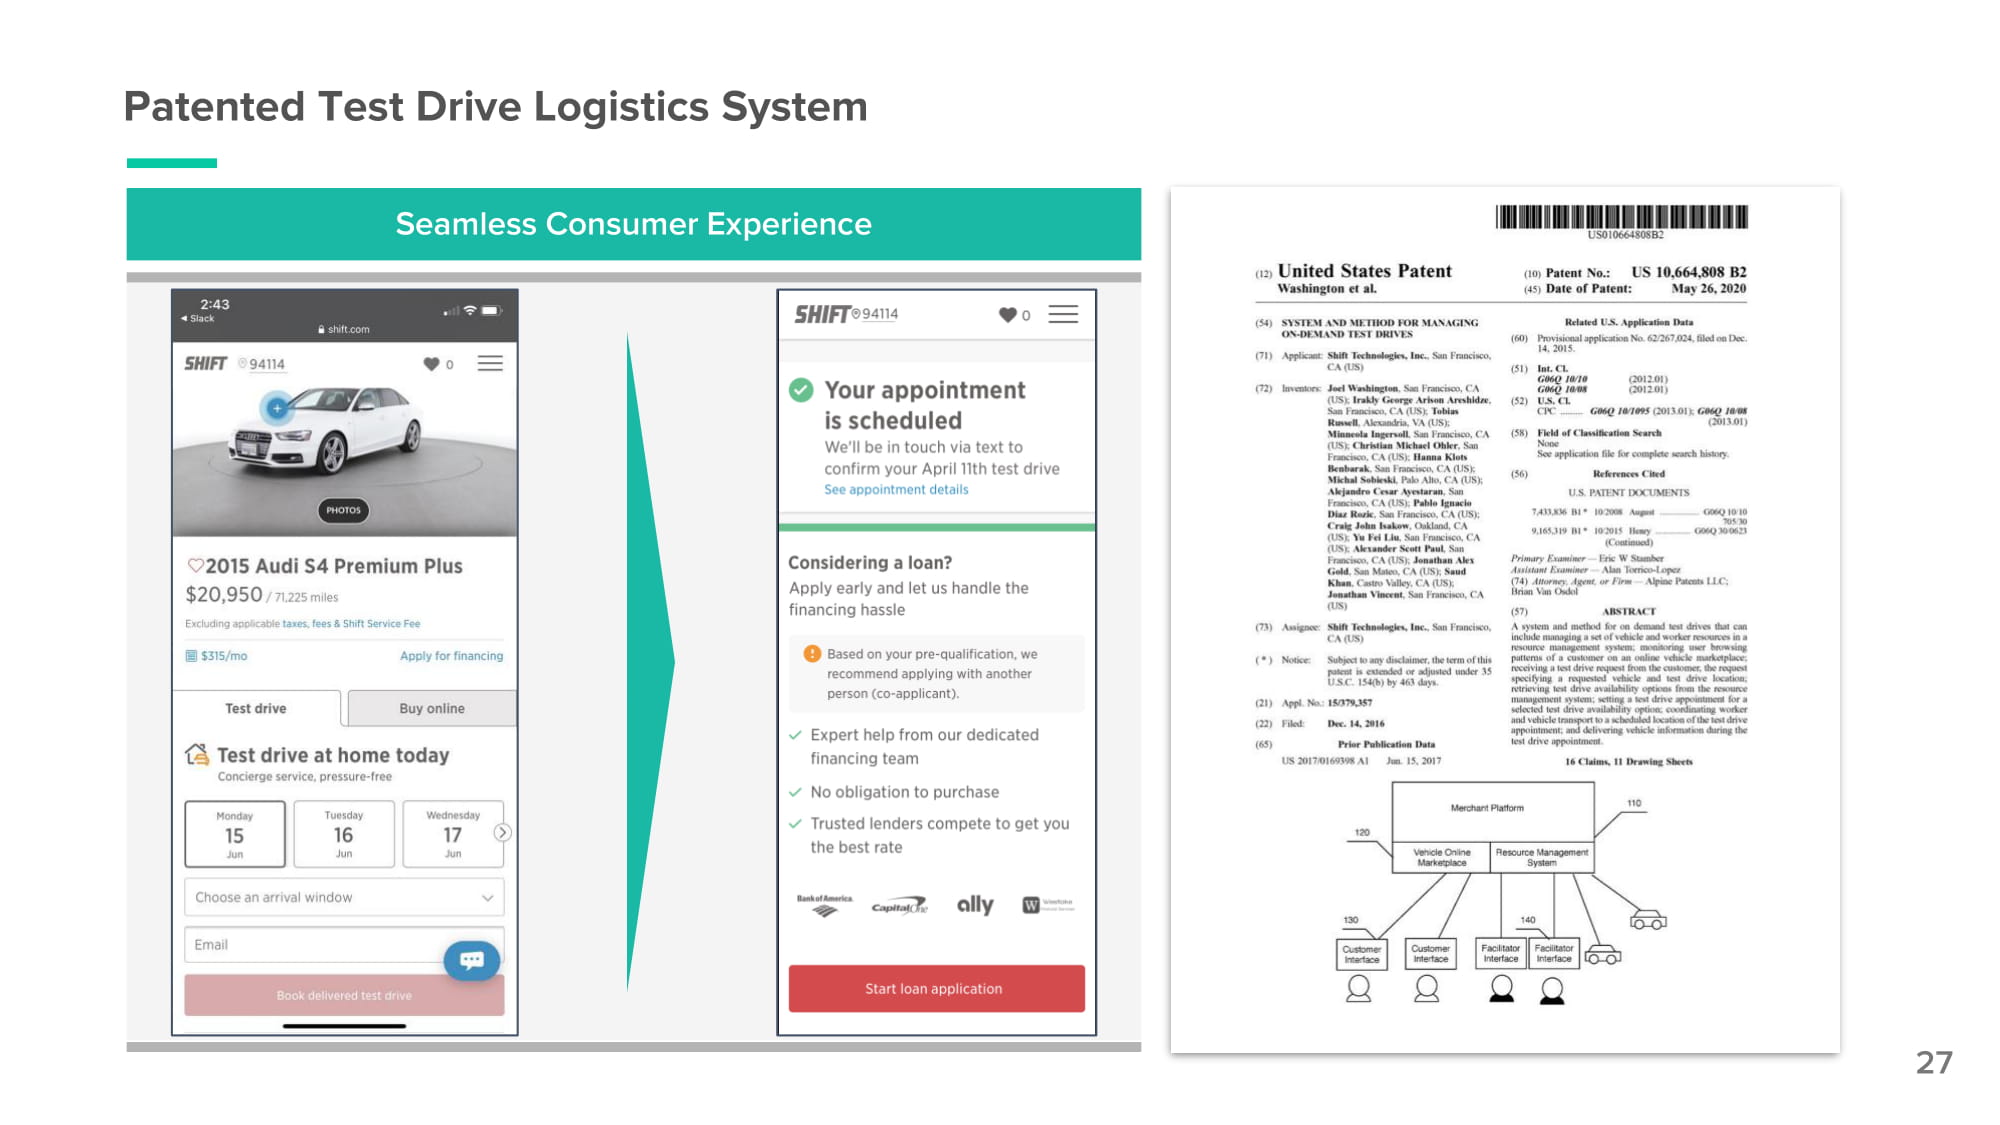
Patented Test Drive Logistics System Seamless Consumer Experience 27

Seamless Online Financing Pre - Qualification... 28 Online pre - qualification has meaningfully improved our end - of - funnel conversion for customers seeking financing

…Allows Customers to Shop Based on What They can Afford Customers can tailor their pre - qualification terms based on desired down payment, monthly payment, and loan length. Prices are listed by monthly payment, based on the customer’s pre - qualification terms 29
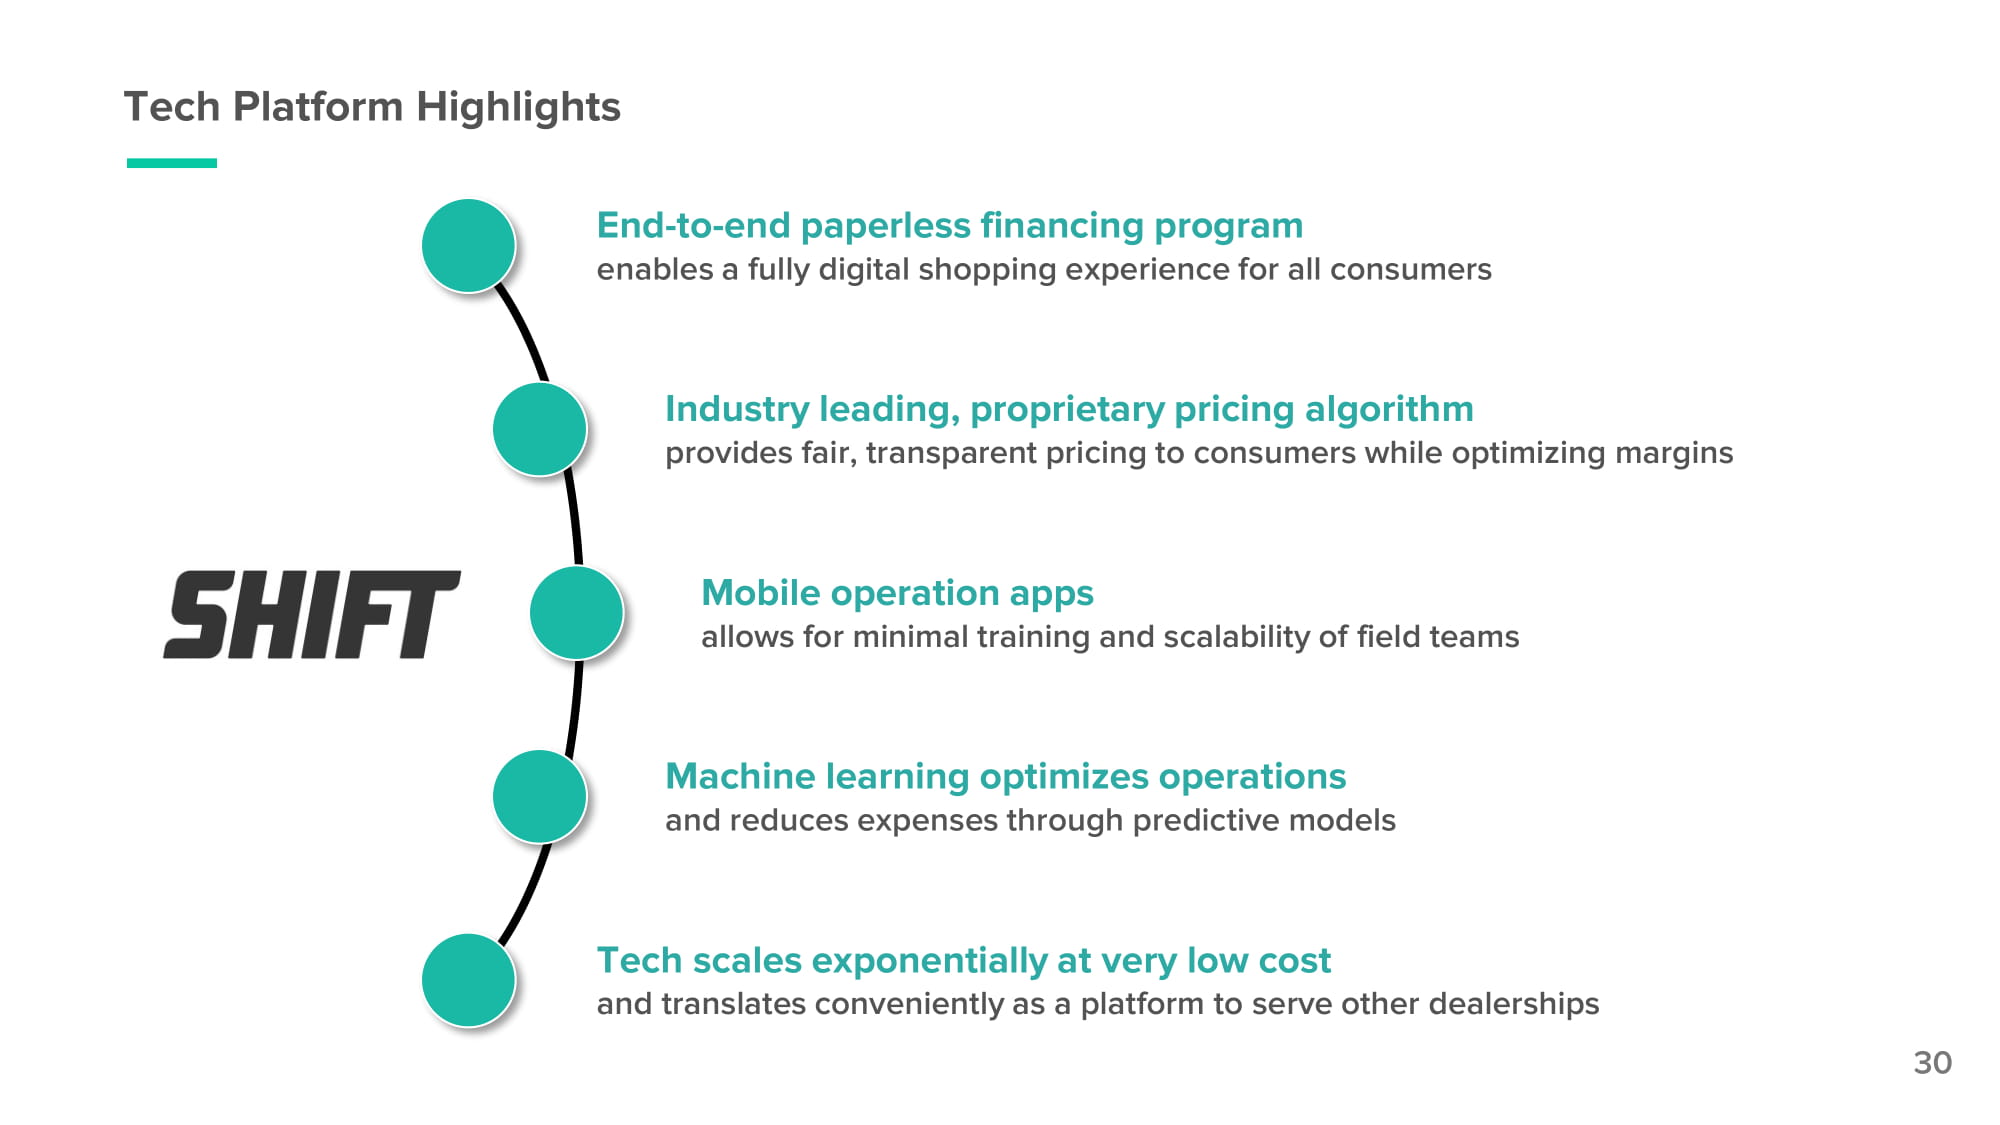
Tech Platform Highlights End - to - end paperless financing program enables a fully digital shopping experience for all consumers Industry leading, proprietary pricing algorithm provides fair, transparent pricing to consumers while optimizing margins Mobile operation apps allows for minimal training and scalability of field teams Machine learning optimizes operations and reduces expenses through predictive models Tech scales exponentially at very low cost and translates conveniently as a platform to serve other dealerships 30

Marketing Strategy VP of Marketing Tracy Lessin

Performance Storytelling 32 The ability to drive business performance without sacrificing your brand.
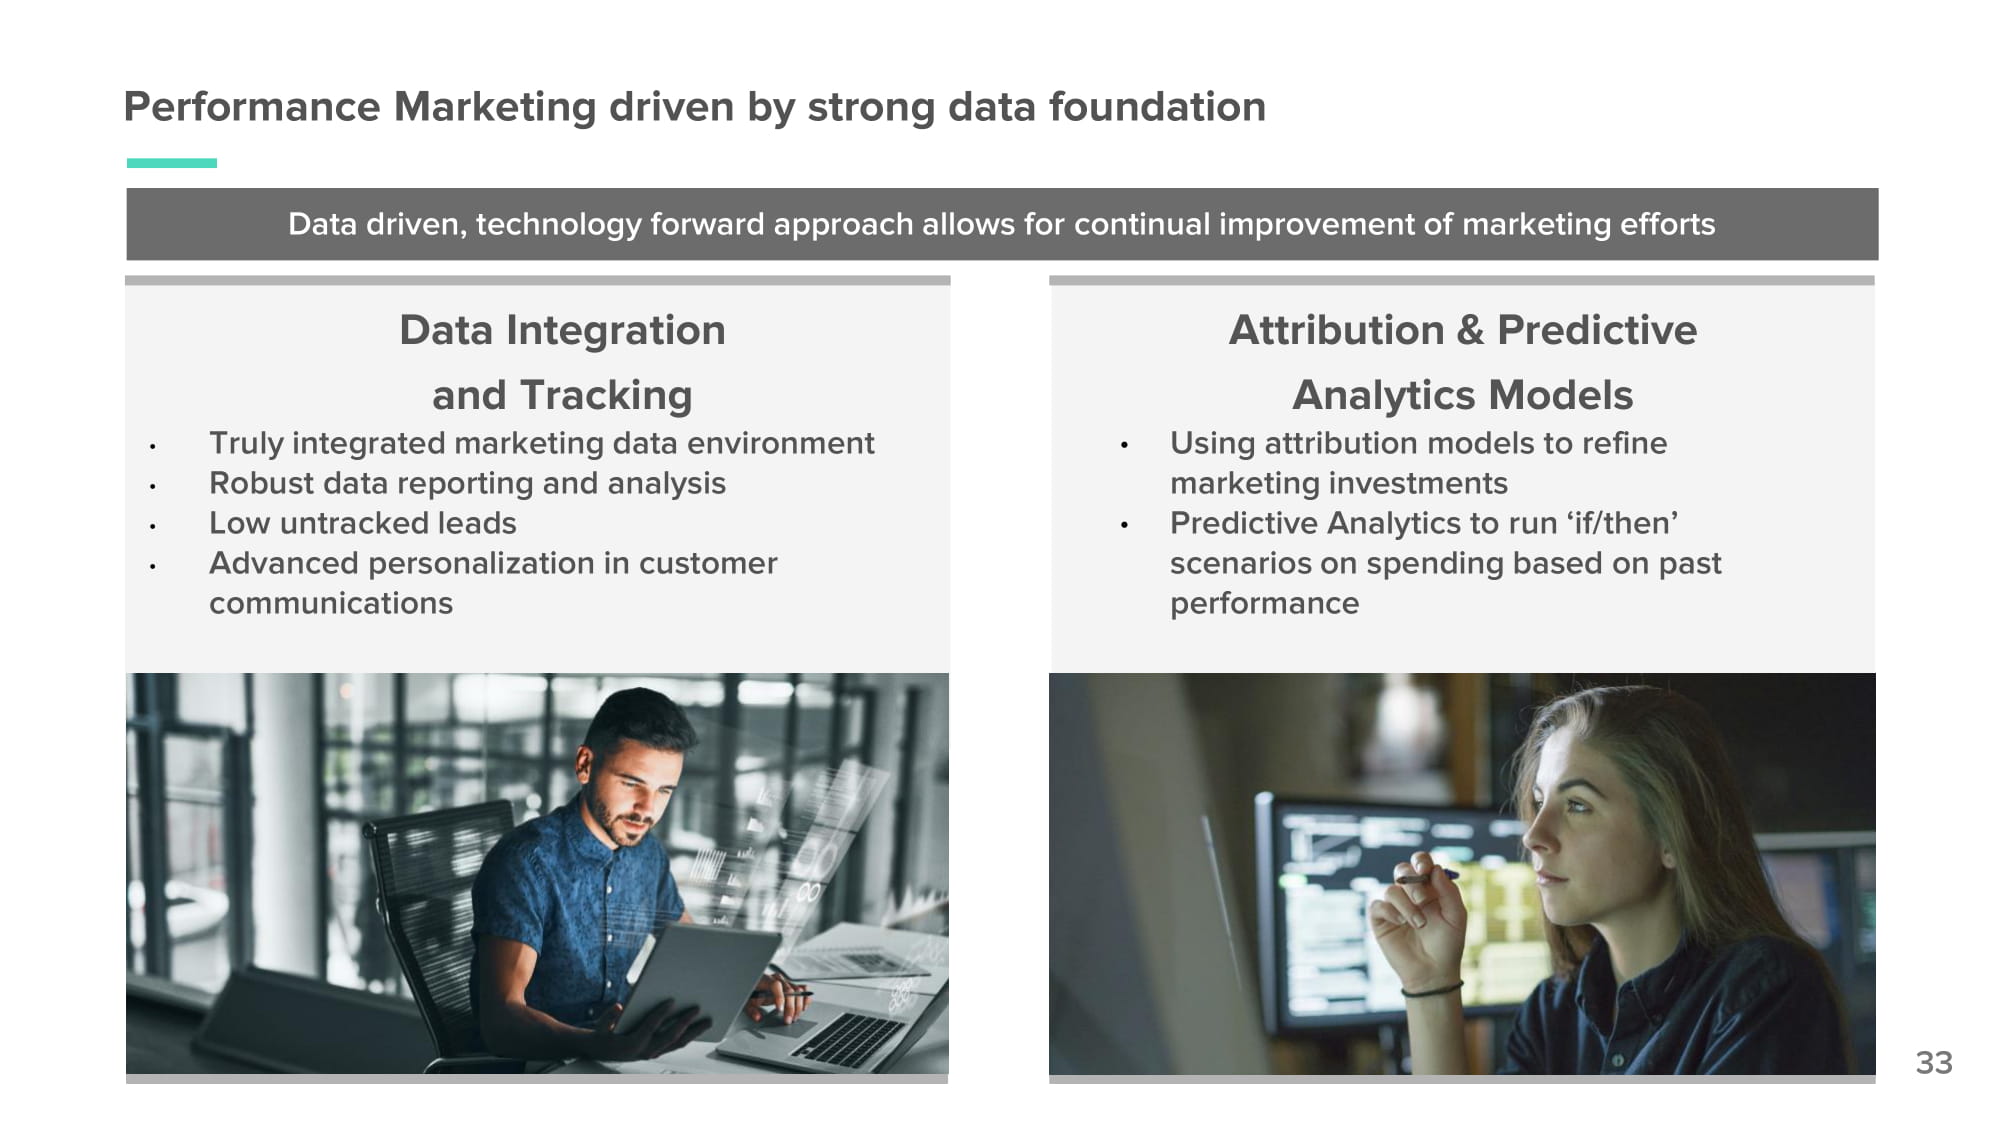
Performance Marketing driven by strong data foundation Attribution & Predictive Analytics Models • Using attribution models to refine marketing investments • Predictive Analytics to run ‘if/then’ scenarios on spending based on past performance Data Integration and Tracking • Truly integrated marketing data environment • Robust data reporting and analysis • Low untracked leads • Advanced personalization in customer communications Data driven, technology forward approach allows for continual improvement of marketing efforts 33
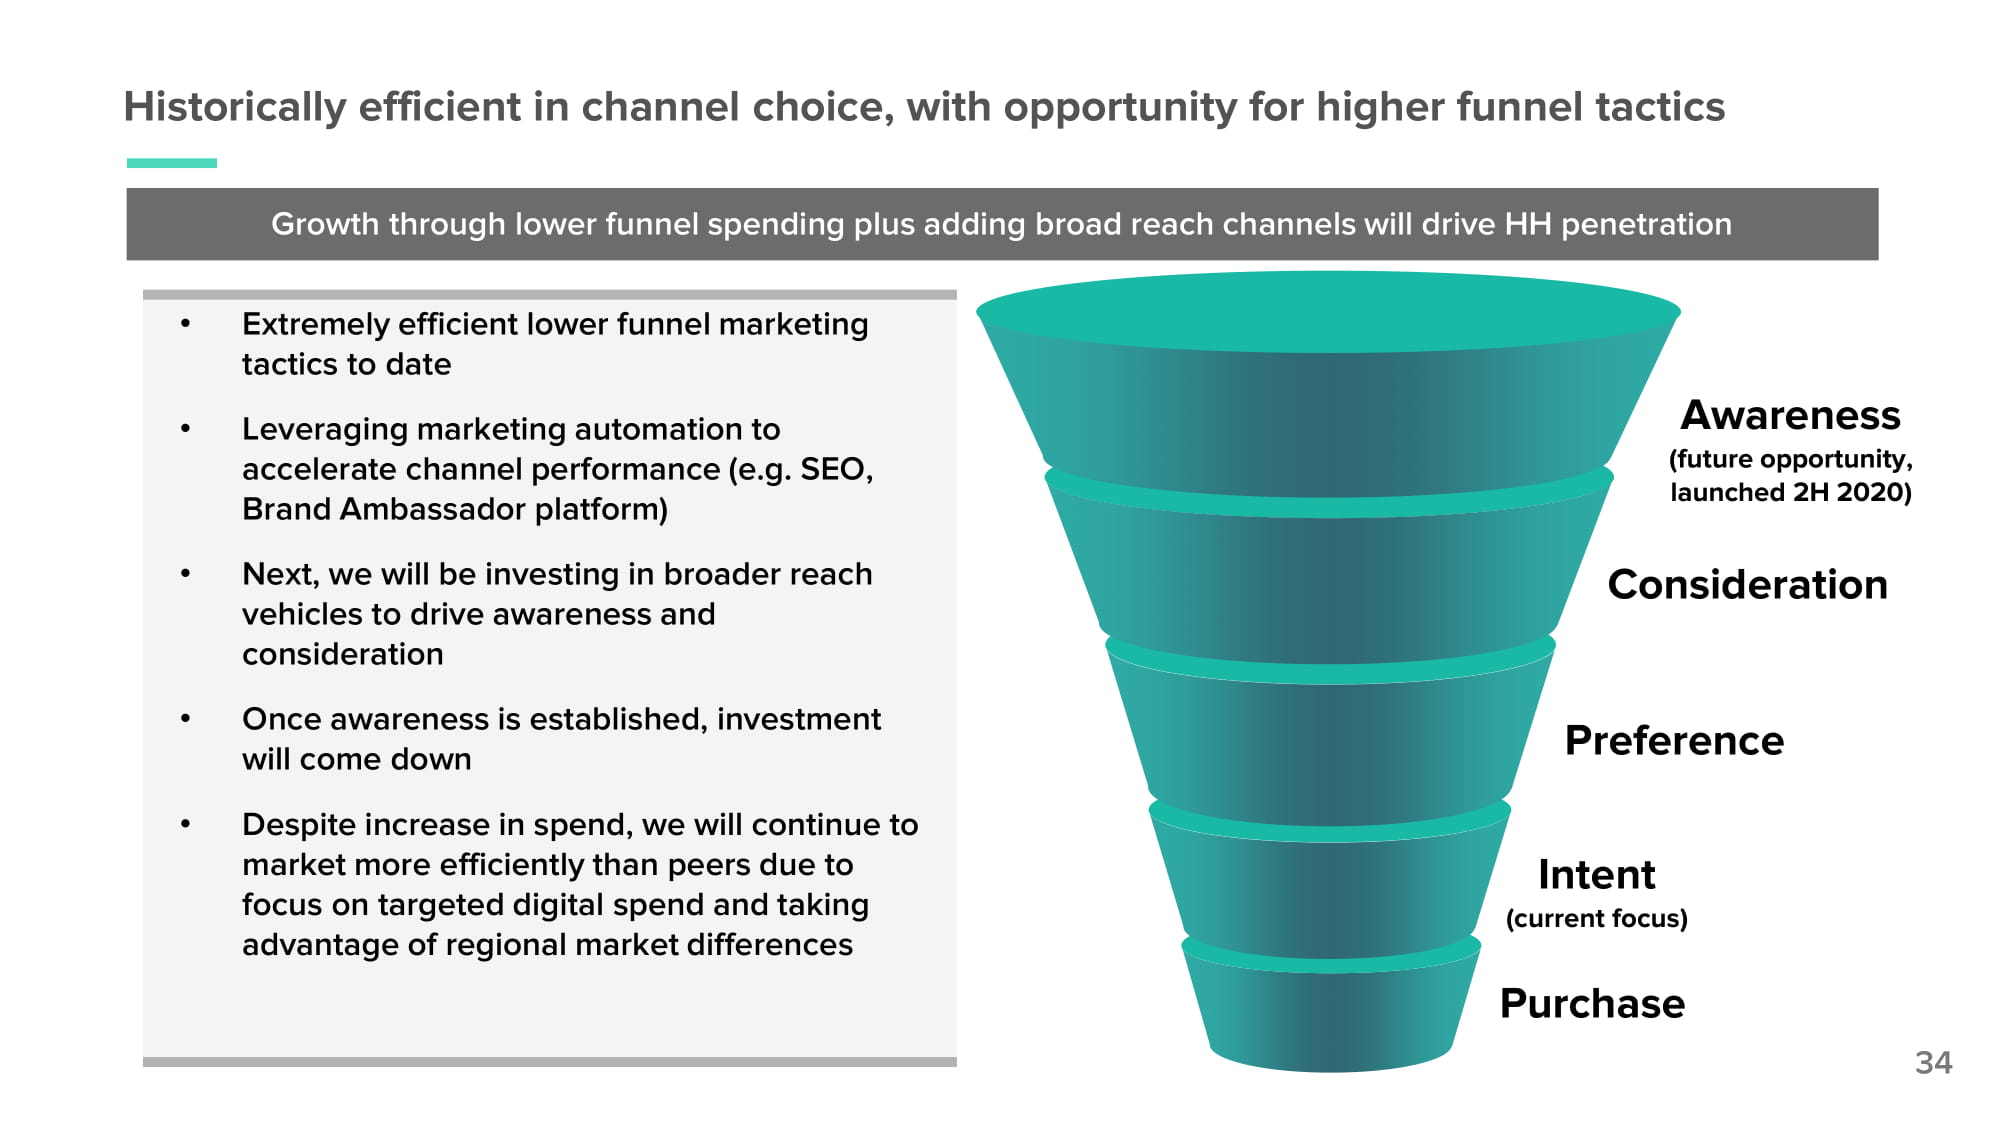
Historically efficient in channel choice, with opportunity for higher funnel tactics Awareness (future opportunity, launched 2H 2020) Pre f e re nce Intent (current focus) Consideration Purchase • Extremely efficient lower funnel marketing tactics to date • Leveraging marketing automation to accelerate channel performance (e.g. SEO, Brand Ambassador platform) • Next, we will be investing in broader reach vehicles to drive awareness and consideration • Once awareness is established, investment will come down • Despite increase in spend, we will continue to market more efficiently than peers due to focus on targeted digital spend and taking advantage of regional market differences Growth through lower funnel spending plus adding broad reach channels will drive HH penetration 34
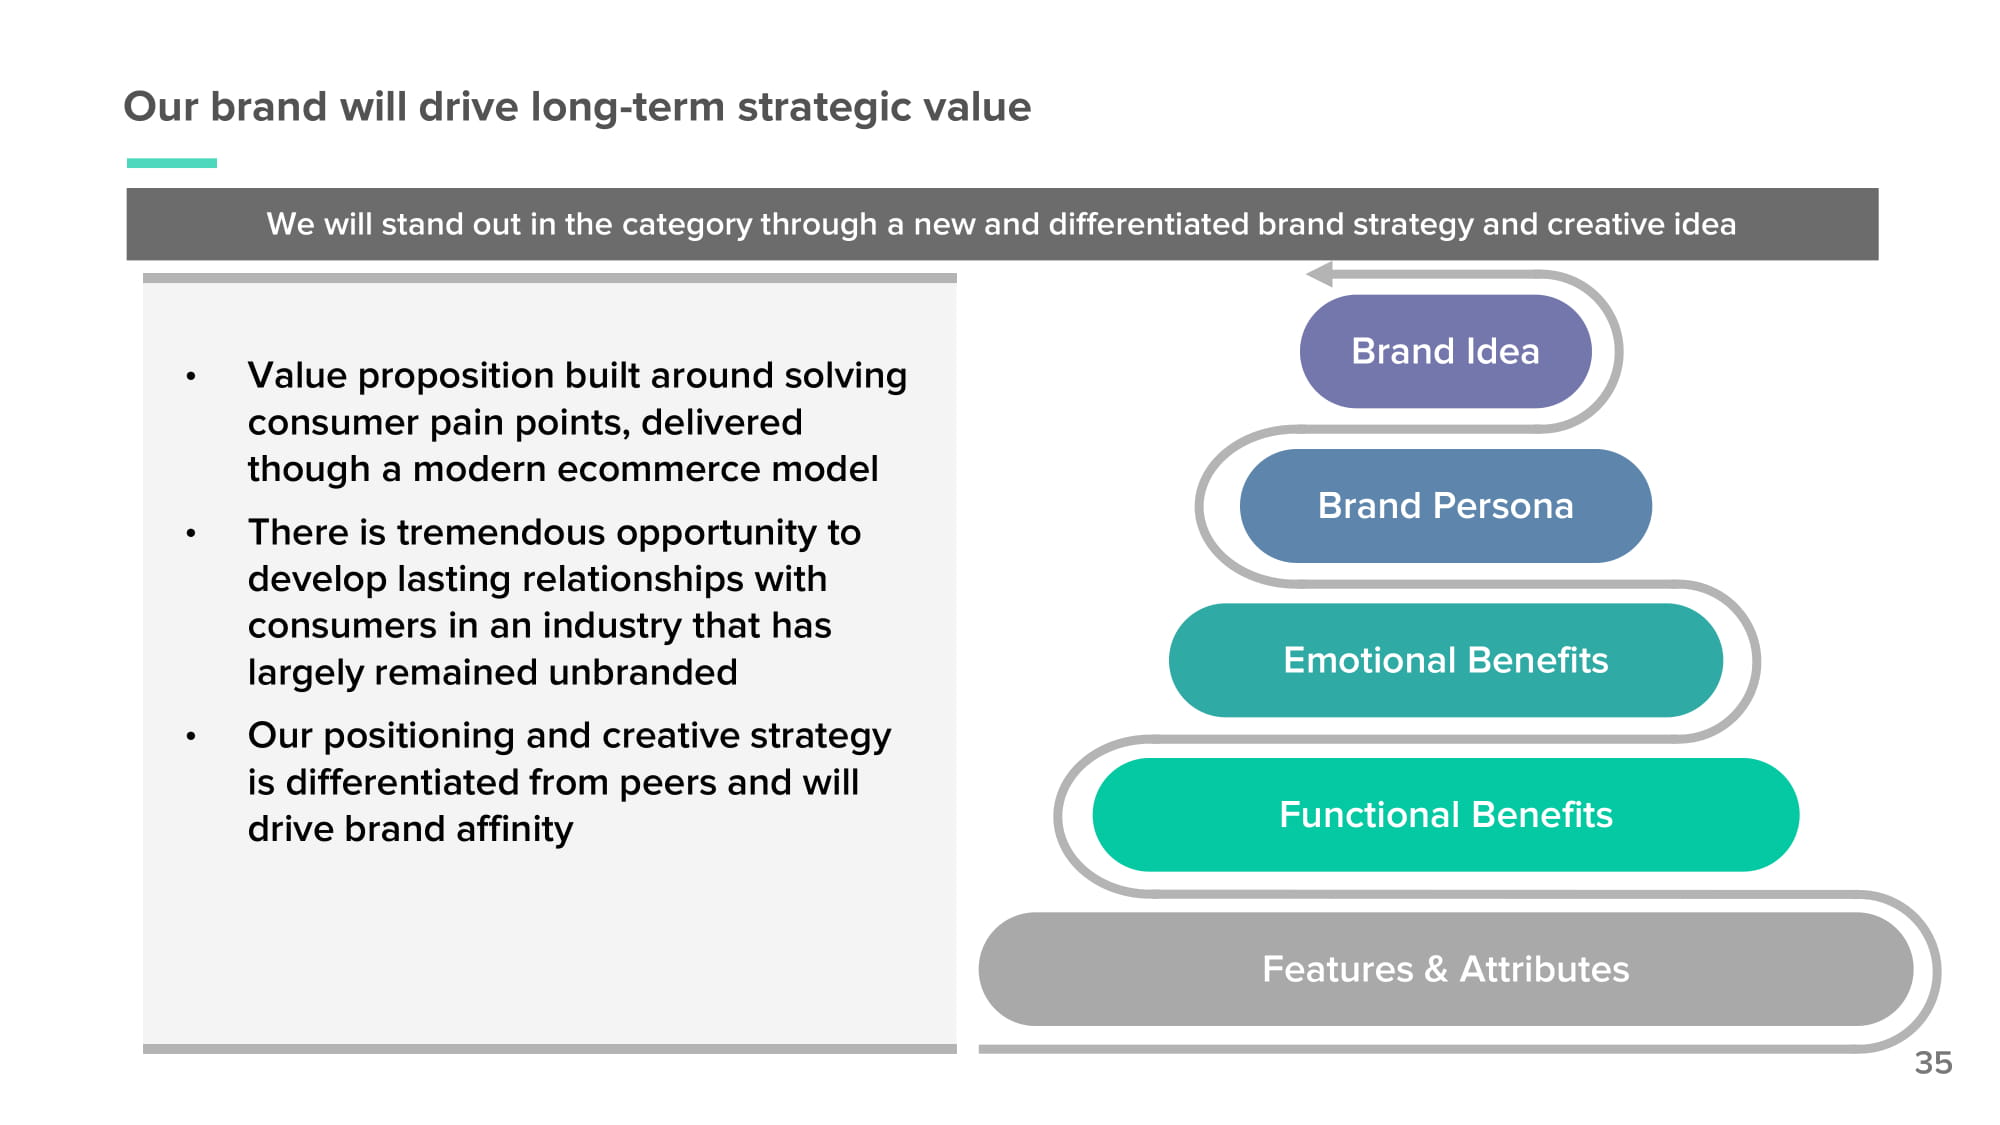
Brand Idea Brand Persona Emotional Benefits Functional Benefits Features & Attributes • Value proposition built around solving consumer pain points, delivered though a modern ecommerce model • There is tremendous opportunity to develop lasting relationships with consumers in an industry that has largely remained unbranded • Our positioning and creative strategy is differentiated from peers and will drive brand affinity Our brand will drive long - term strategic value 35 We will stand out in the category through a new and differentiated brand strategy and creative idea
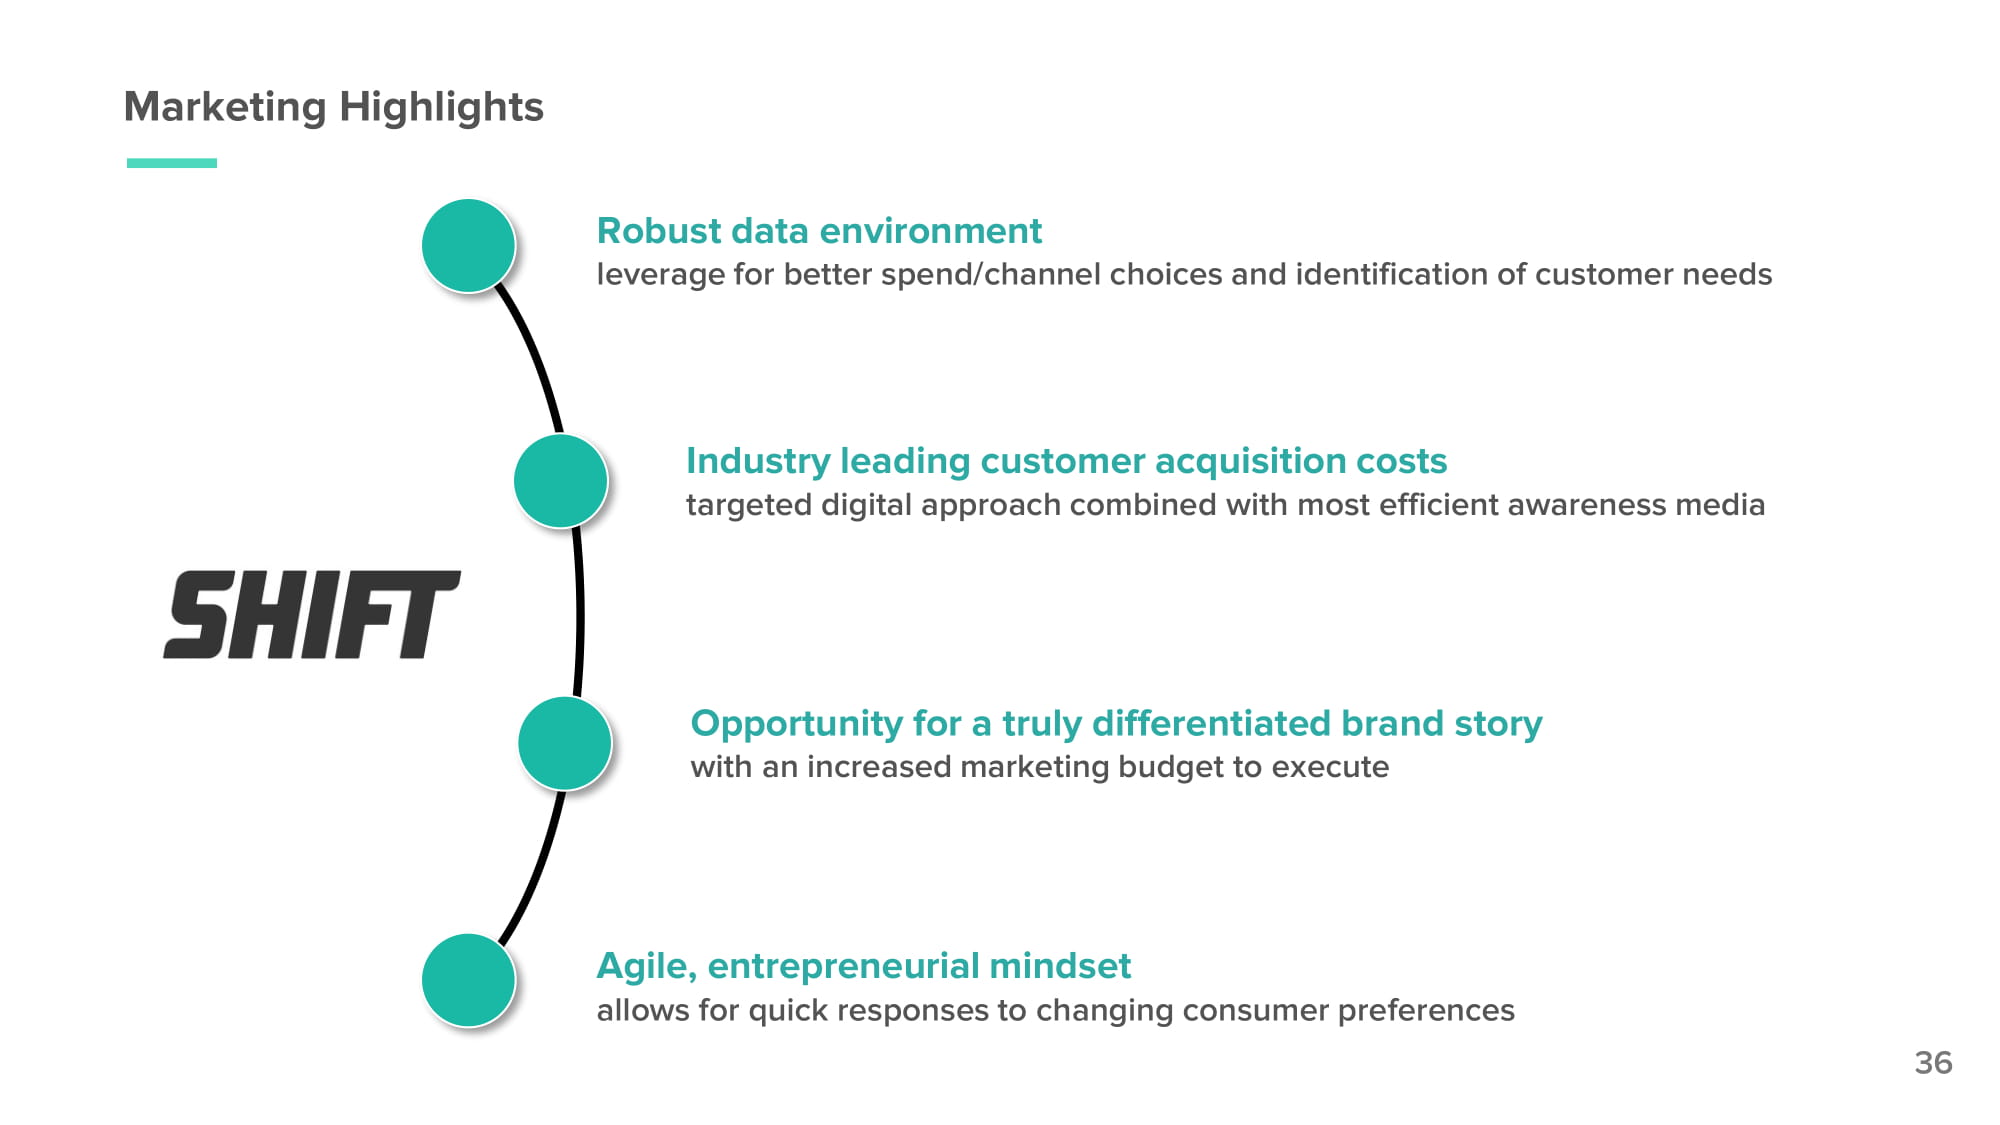
Agile, entrepreneurial mindset Robust data environment leverage for better spend/channel choices and identification of customer needs Marketing Highlights Industry leading customer acquisition costs targeted digital approach combined with most efficient awareness media Opportunity for a truly differentiated brand story with an increased marketing budget to execute allows for quick responses to changing consumer preferences 36

Financial Overview CFO Cindy Hanford VP of Strategy & Finance Henry Bird
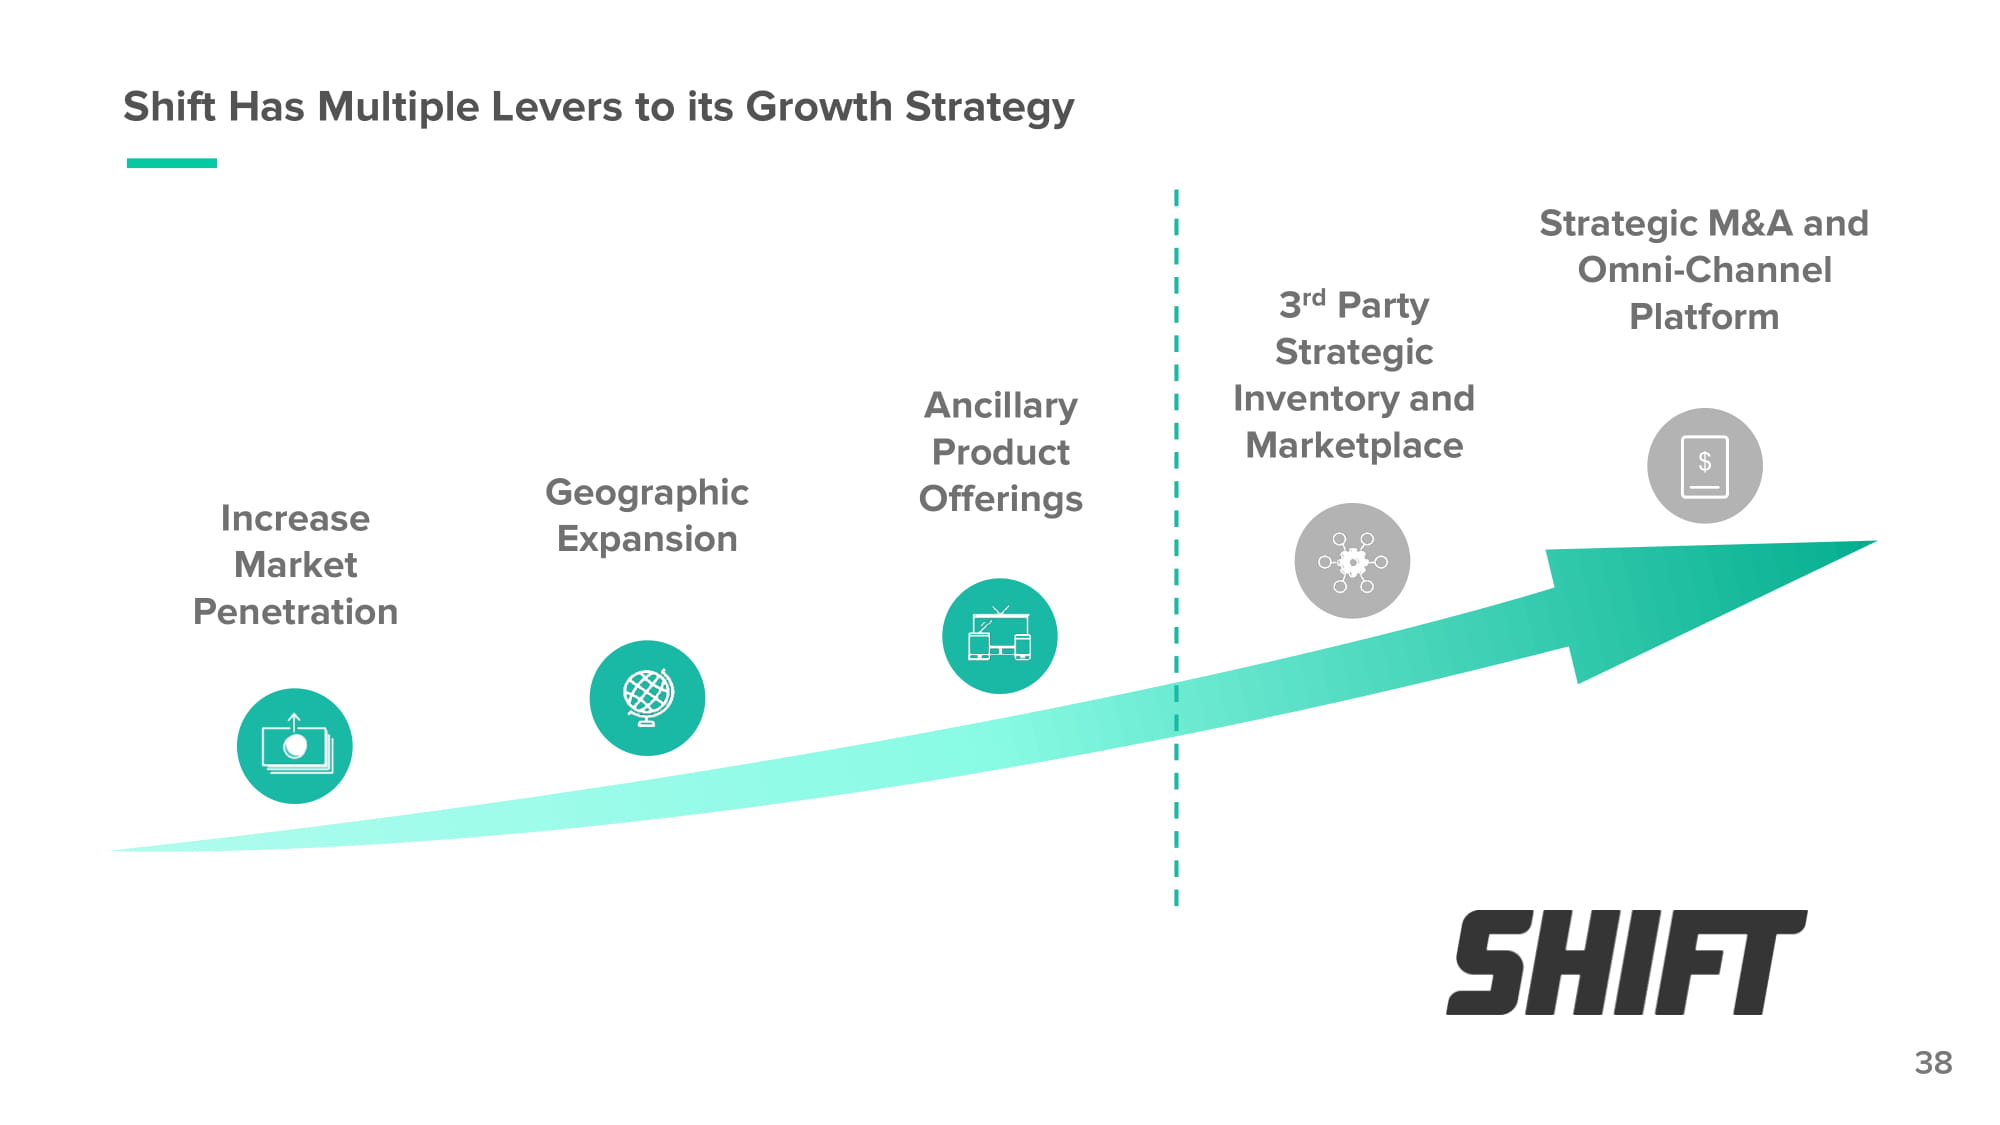
Shift Has Multiple Levers to its Growth Strategy 3 rd Party Strategic Inventory and Marketplace Ancillary Product O f f er i ngs Geographic Expansion Increase Market Pe n e t rat i on Strategic M&A and Omni - Channel Platform 38
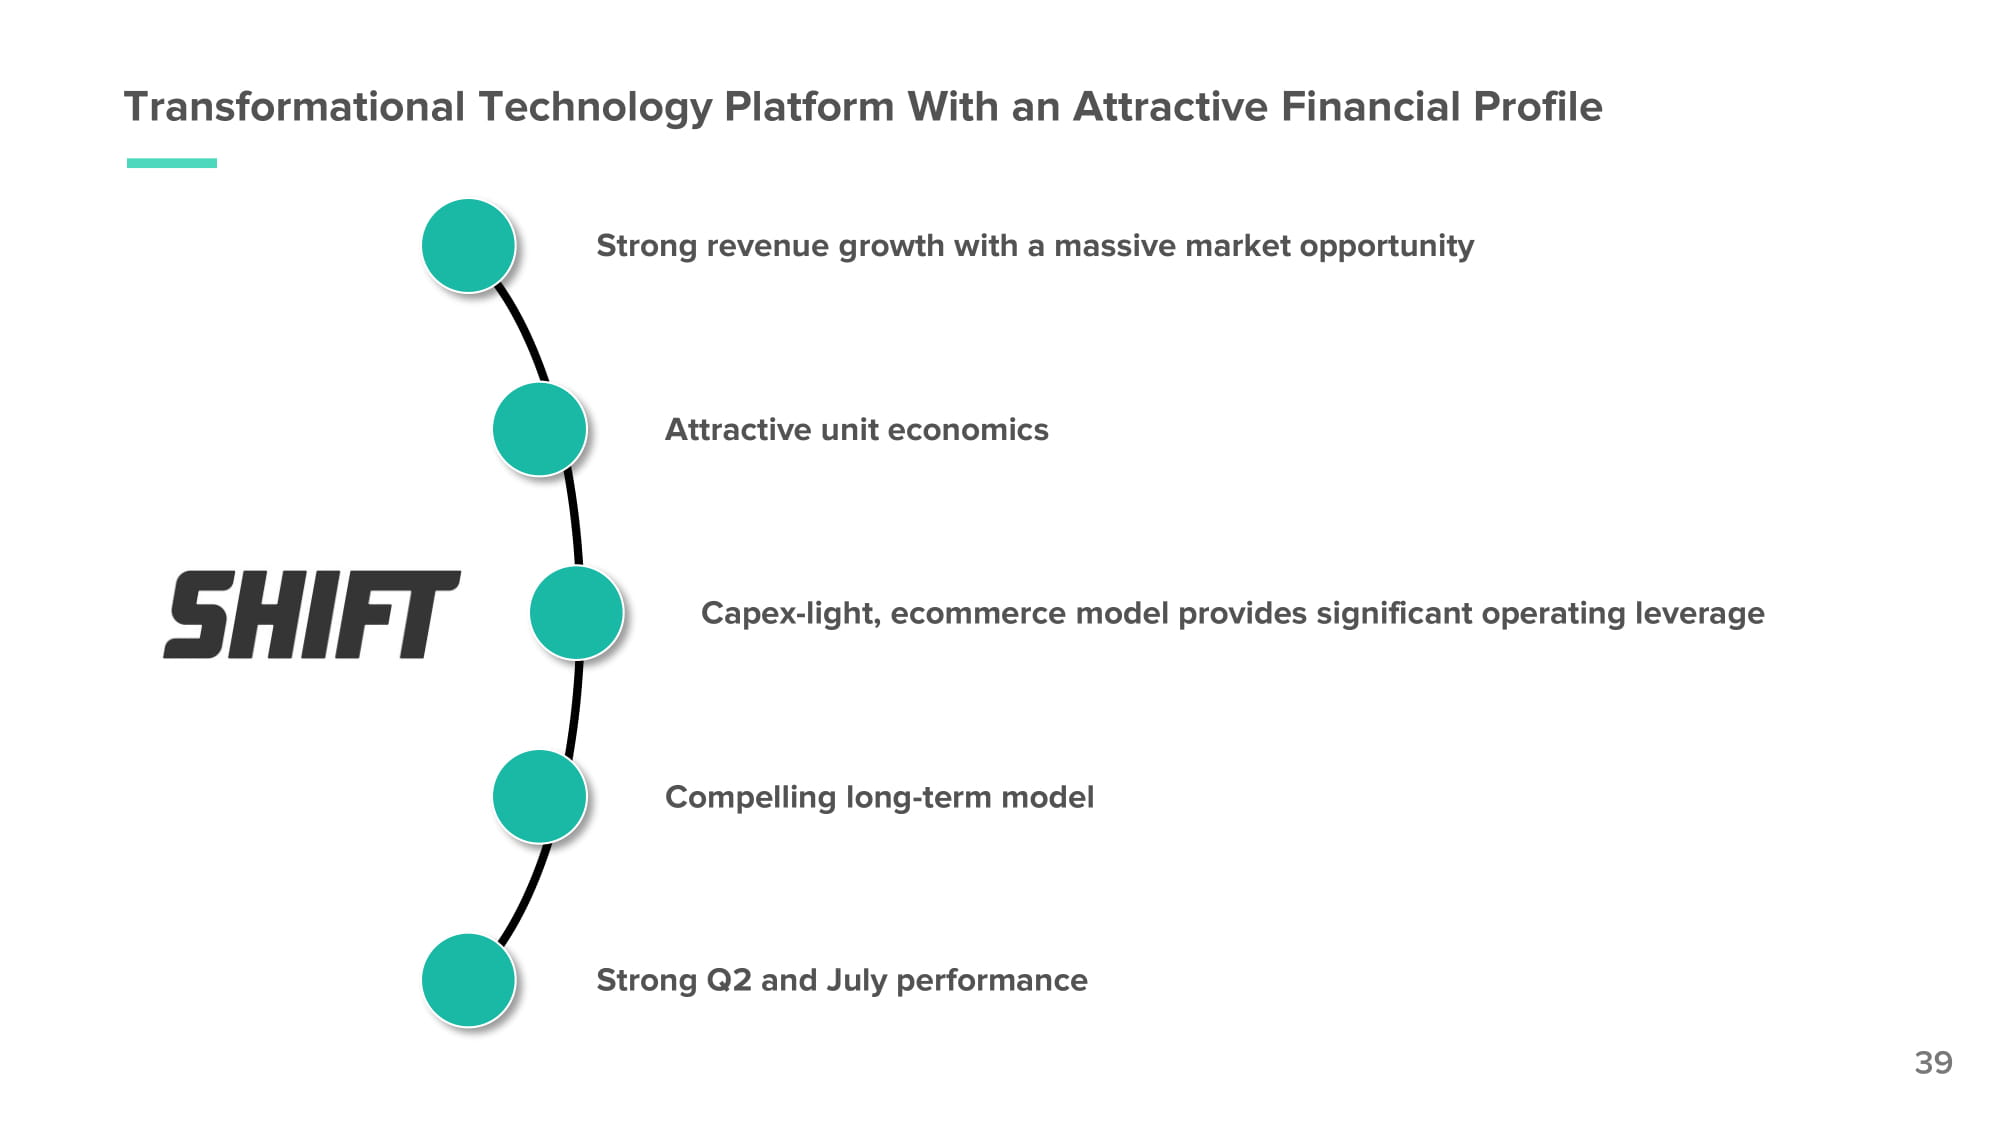
Transformational Technology Platform With an Attractive Financial Profile Strong revenue growth with a massive market opportunity Attractive unit economics Capex - light, ecommerce model provides significant operating leverage Strong Q2 and July performance Compelling long - term model 39
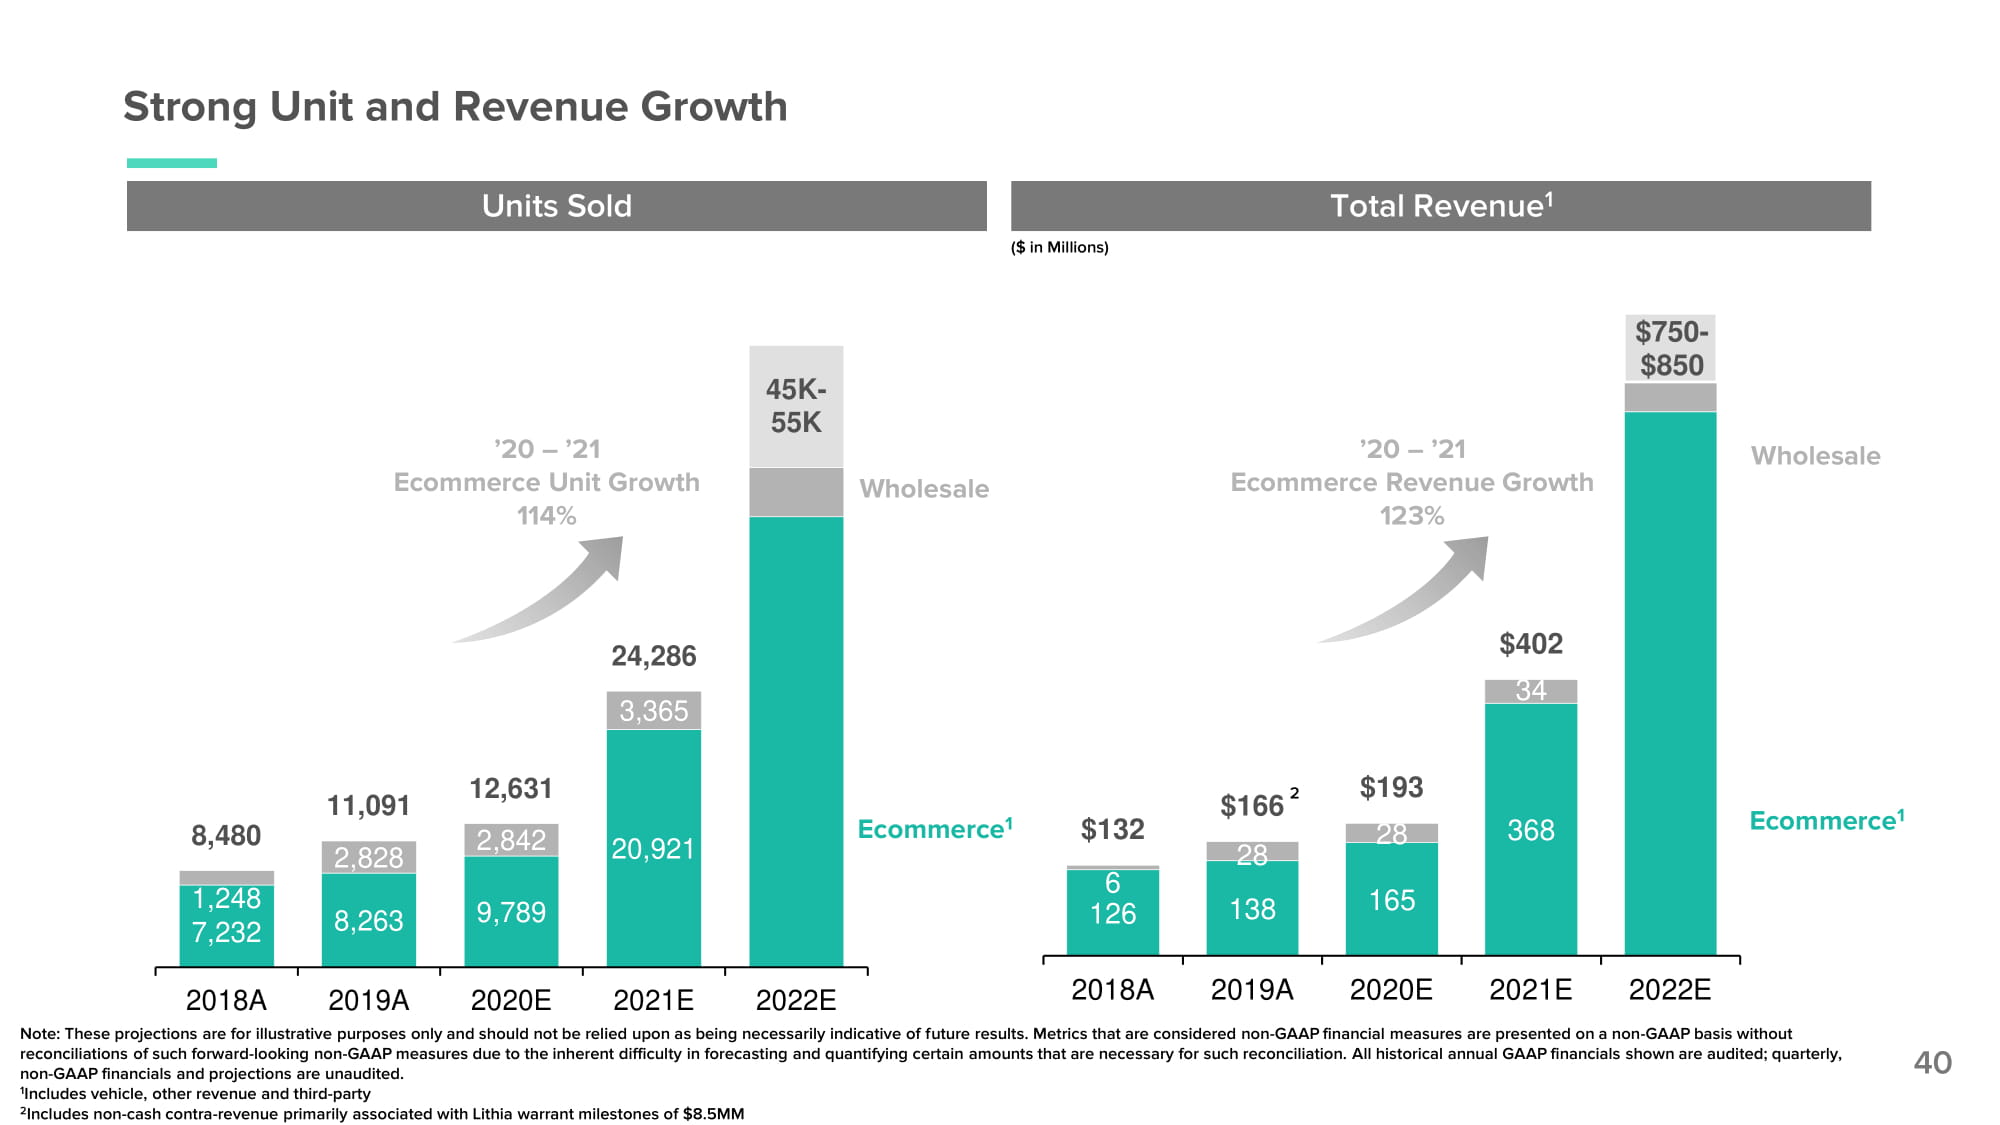
138 165 368 6 126 28 $193 28 $402 34 $132 $166 2 $75 0 - $850 2 0 1 8 A 2 0 1 9 A 2 0 2 0 E 2 0 2 1 E 2 0 2 2 E 8,263 9,789 20,921 1,248 7,232 2,828 2,842 3,365 8,480 11, 0 9 1 12,631 24,286 45K - 55K 2 0 1 8 A 2 0 19A 2 0 2 0 E 2 0 2 1 E 2 0 2 2 E ’20 – ’21 Ecommerce Unit Growth 114% Ecommerce 1 Strong Unit and Revenue Growth Note: These projections are for illustrative purposes only and should not be relied upon as being necessarily indicative of future results. Metrics that are considered non - GAAP financial measures are presented on a non - GAAP basis without reconciliations of such forward - looking non - GAAP measures due to the inherent difficulty in forecasting and quantifying certain amounts that are necessary for such reconciliation. All historical annual GAAP financials shown are audited; quarterly, non - GAAP financials and projections are unaudited. 1 Includes vehicle, other revenue and third - party 2 Includes non - cash contra - revenue primarily associated with Lithia warrant milestones of $8.5MM Units Sold Total Revenue 1 ($ in Millions) 40 Wholesale ’20 – ’21 Ecommerce Revenue Growth 123% Wholesale Ecommerce 1
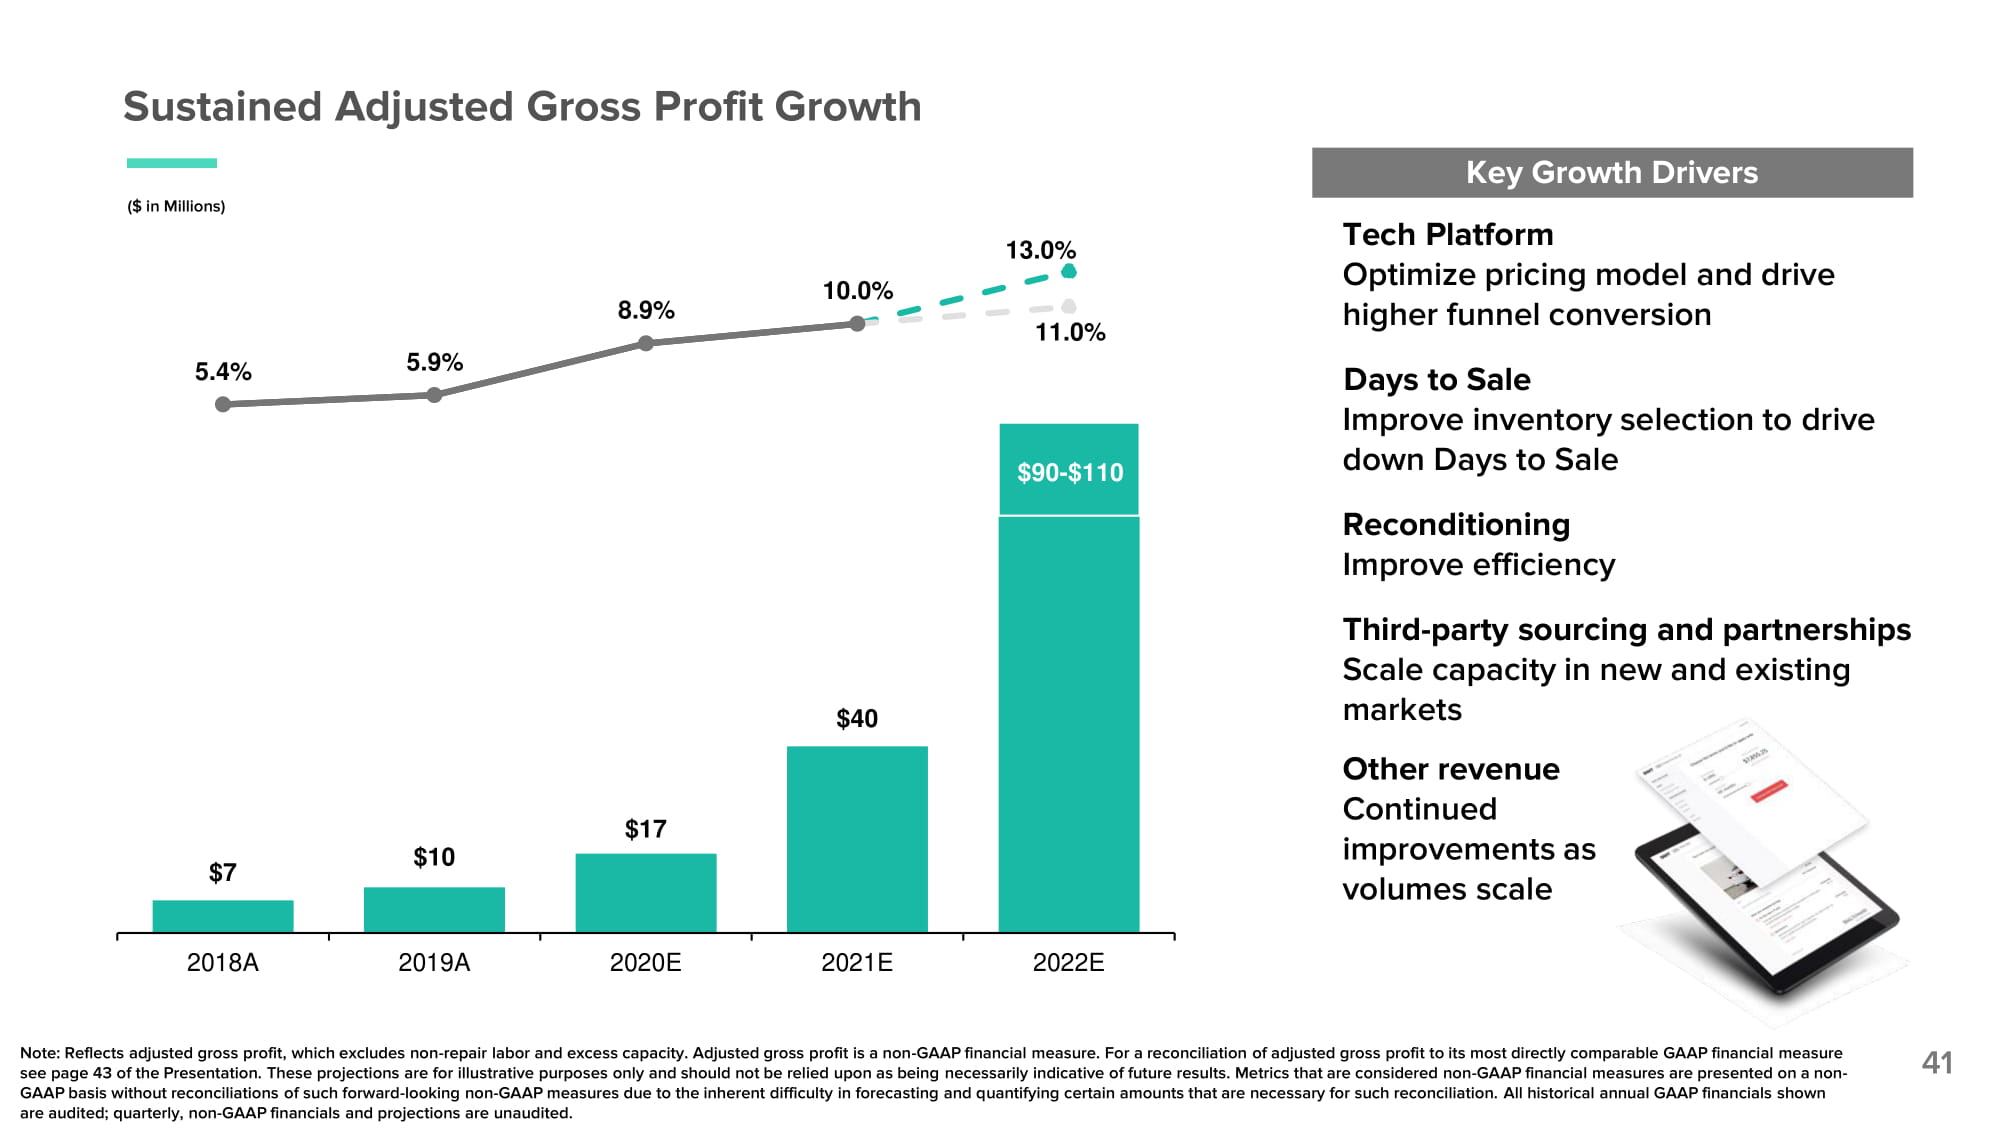
Sustained Adjusted Gross Profit Growth ($ in Millions) 41 Key Growth Drivers Tech Platform Optimize pricing model and drive higher funnel conversion Days to Sale Improve inventory selection to drive down Days to Sale Reconditioning Improve efficiency Third - party sourcing and partnerships Scale capacity in new and existing markets Other revenue Continued improvements as volumes scale Note: Reflects adjusted gross profit, which excludes non - repair labor and excess capacity. Adjusted gross profit is a non - GAAP financial measure. For a reconciliation of adjusted gross profit to its most directly comparable GAAP financial measure see page 43 of the Presentation. These projections are for illustrative purposes only and should not be relied upon as being necessarily indicative of future results. Metrics that are considered non - GAAP financial measures are presented on a non - GAAP basis without reconciliations of such forward - looking non - GAAP measures due to the inherent difficulty in forecasting and quantifying certain amounts that are necessary for such reconciliation. All historical annual GAAP financials shown are audited; quarterly, non - GAAP financials and projections are unaudited. $7 $10 $17 $40 $90 - $110 5 .4 % 5 .9 % 8.9% 10.0% 13.0% 11.0% 2 0 18 A 2 0 19 A 2 0 20 E 2 0 21 E 2 0 22 E
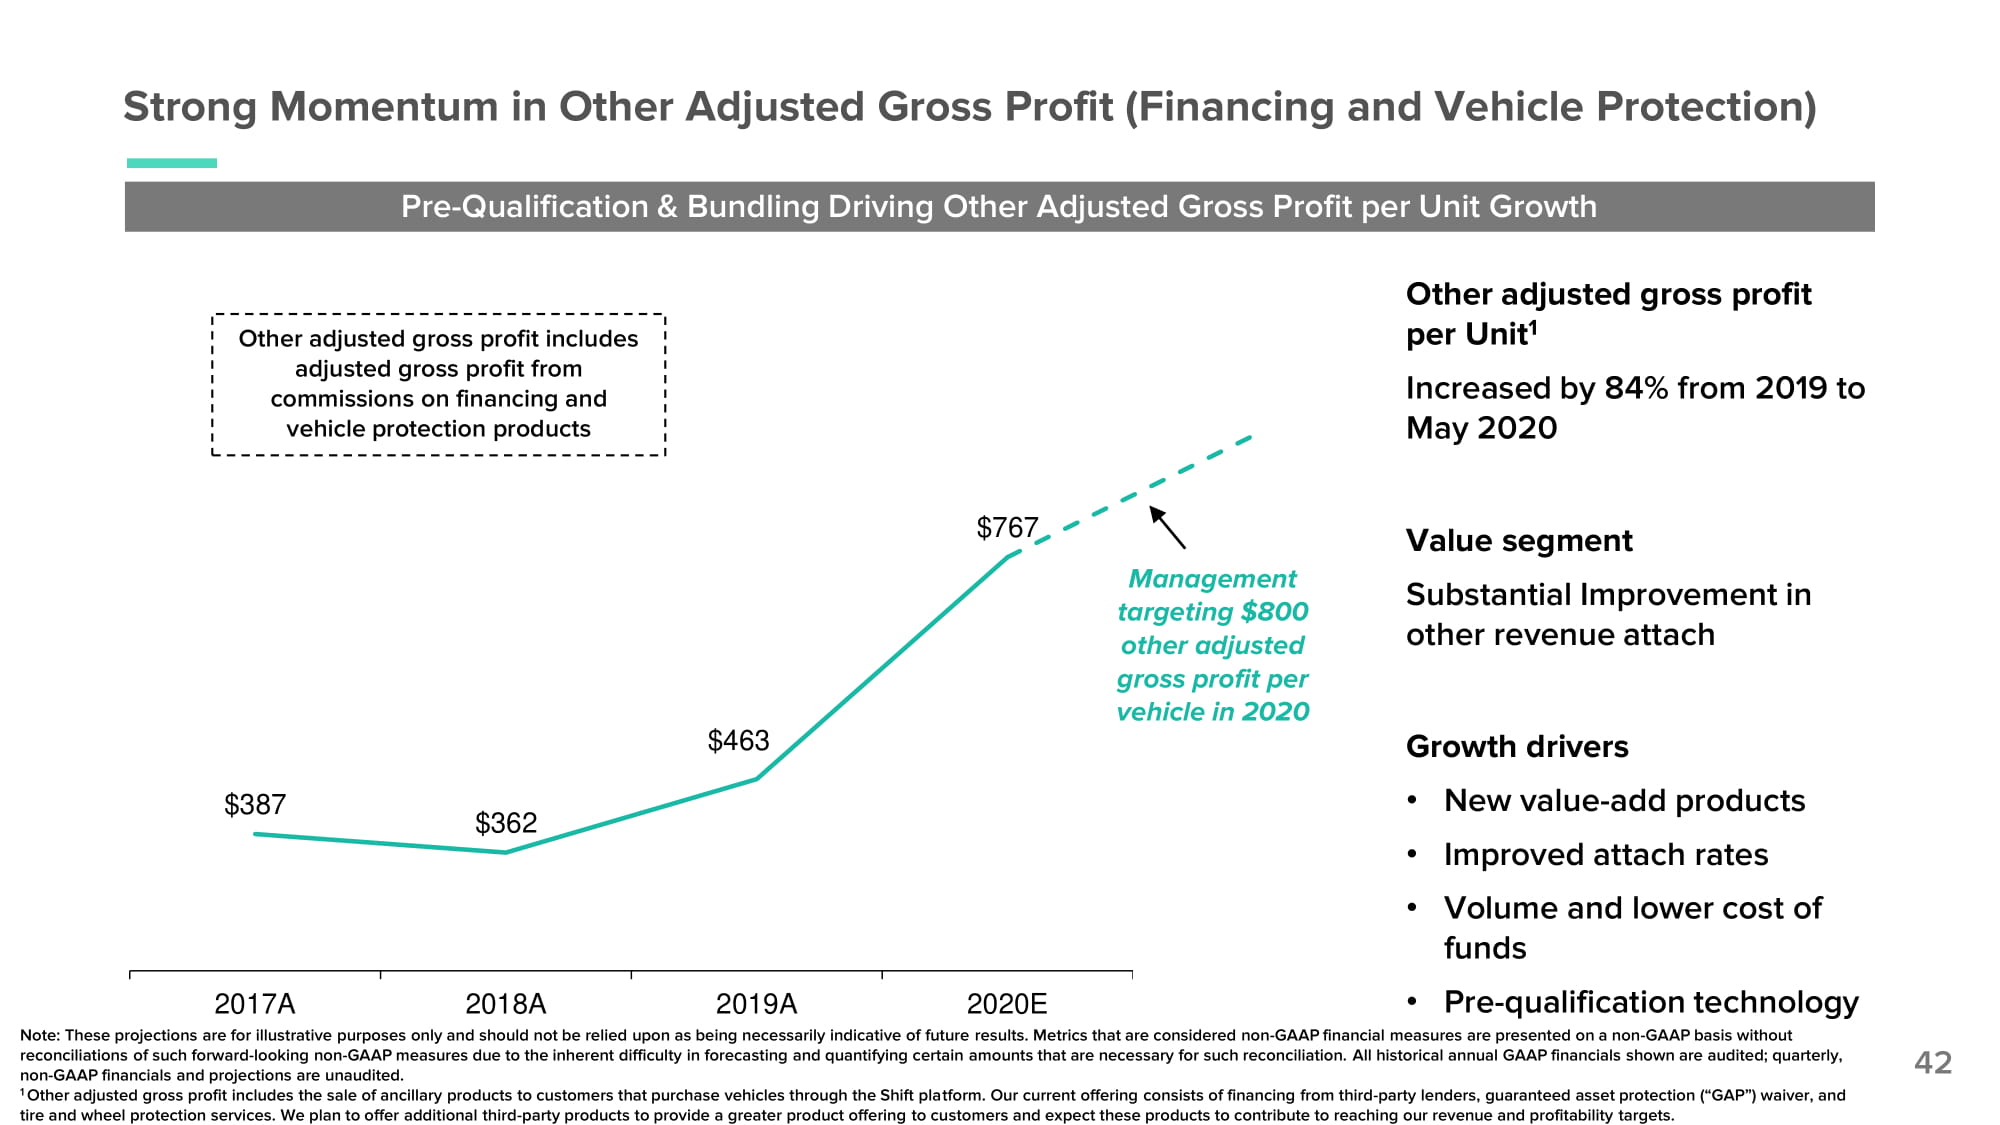
$387 $362 $463 $767 2017A 2018A 2019A 2020E 2021E 42 Pre - Qualification & Bundling Driving Other Adjusted Gross Profit per Unit Growth Other adjusted gross profit per Unit 1 Increased by 84% from 2019 to May 2020 Value segment Substantial Improvement in other revenue attach Growth drivers • New value - add products • Improved attach rates • Volume and lower cost of funds • Pre - qualification technology Strong Momentum in Other Adjusted Gross Profit (Financing and Vehicle Protection) Management targeting $800 other adjusted gross profit per vehicle in 2020 Note: These projections are for illustrative purposes only and should not be relied upon as being necessarily indicative of future results. Metrics that are considered non - GAAP financial measures are presented on a non - GAAP basis without reconciliations of such forward - looking non - GAAP measures due to the inherent difficulty in forecasting and quantifying certain amounts that are necessary for such reconciliation. All historical annual GAAP financials shown are audited; quarterly, non - GAAP financials and projections are unaudited. 1 Other adjusted gross profit includes the sale of ancillary products to customers that purchase vehicles through the Shift platform. Our current offering consists of financing from third - party lenders, guaranteed asset protection (“GAP”) waiver, and tire and wheel protection services. We plan to offer additional third - party products to provide a greater product offering to customers and expect these products to contribute to reaching our revenue and profitability targets. Other adjusted gross profit includes adjusted gross profit from commissions on financing and vehicle protection products
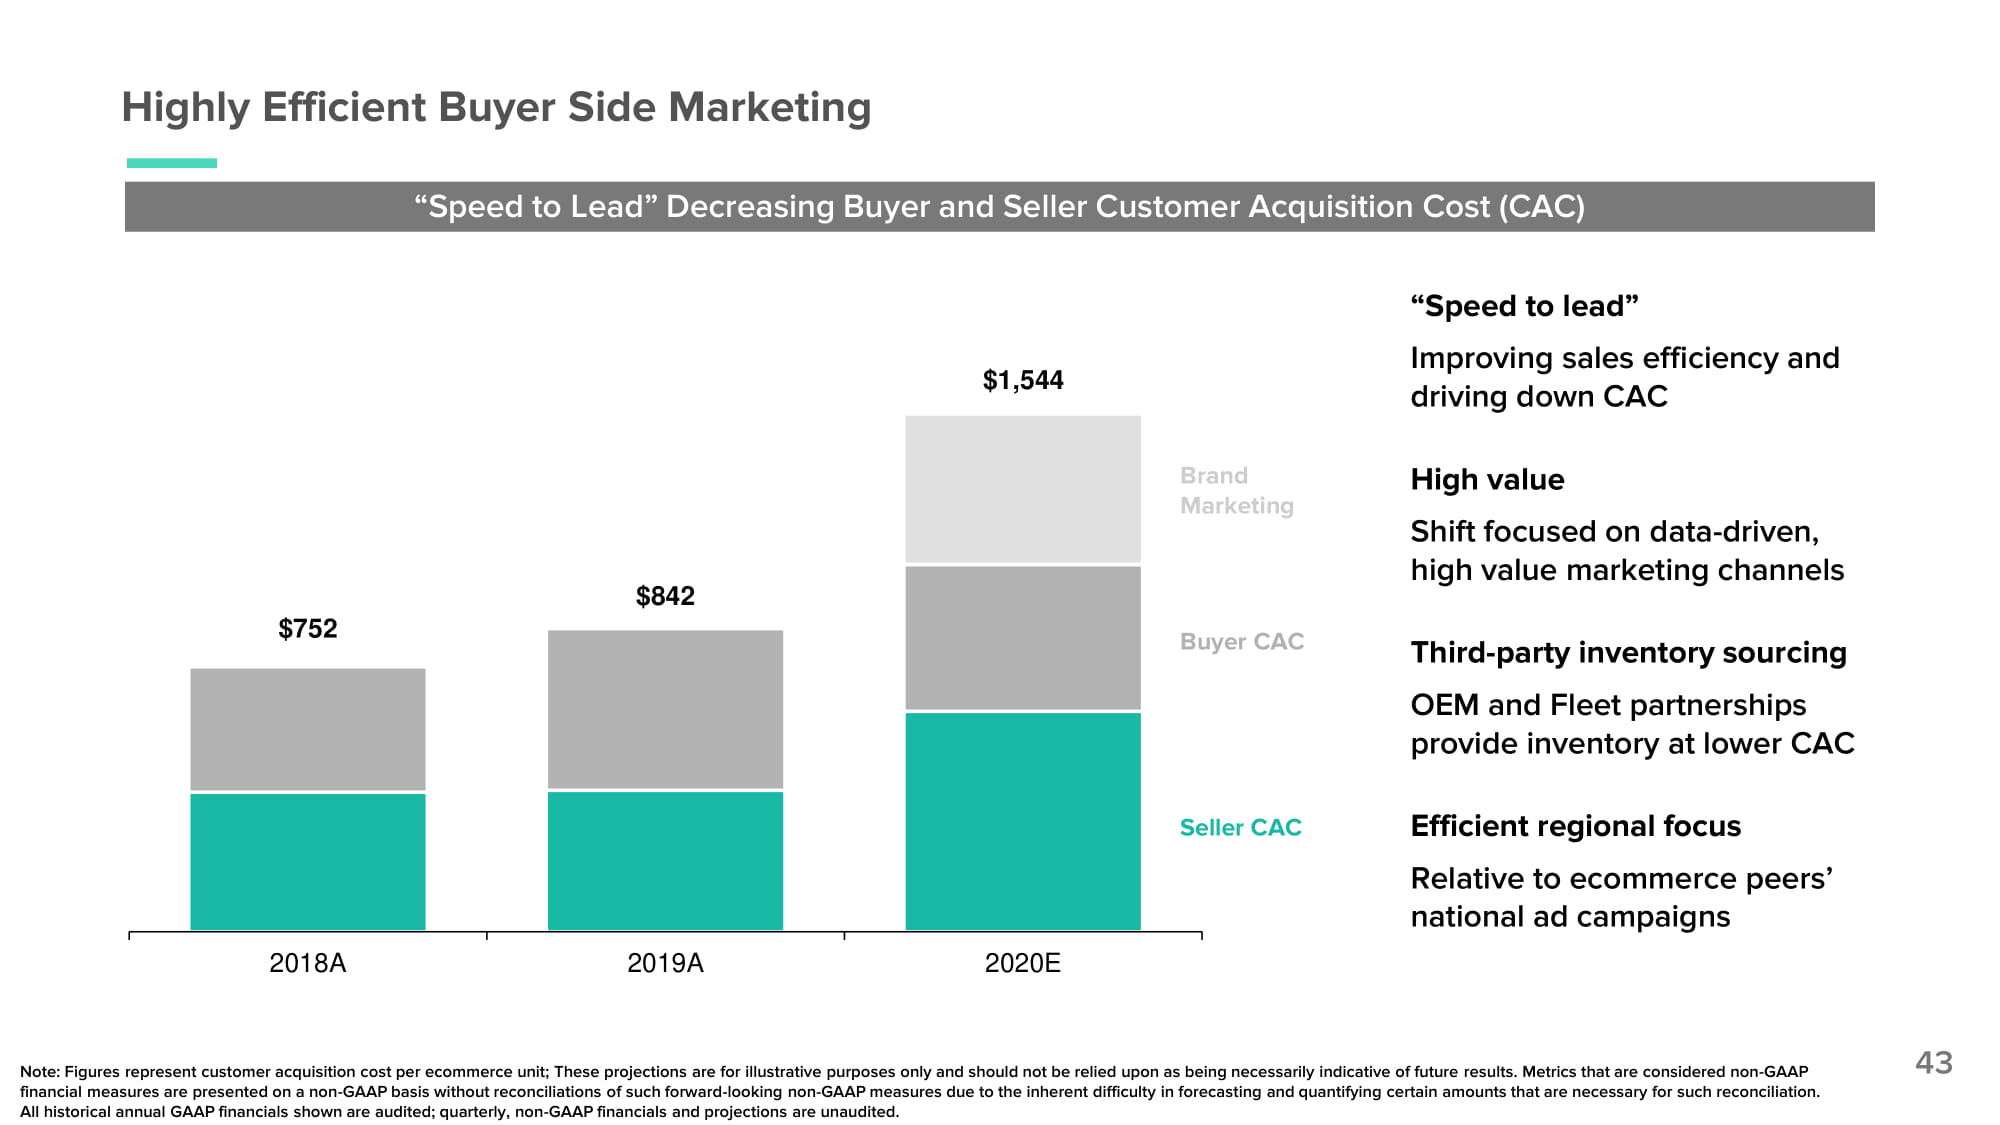
Highly Efficient Buyer Side Marketing “Speed to Lead” Decreasing Buyer and Seller Customer Acquisition Cost (CAC) 43 “Speed to lead” Improving sales efficiency and driving down CAC High value Shift focused on data - driven, high value marketing channels Third - party inventory sourcing OEM and Fleet partnerships provide inventory at lower CAC Efficient regional focus Relative to ecommerce peers’ national ad campaigns $752 financial measures are presented on a non - GAAP basis without reconciliations of such forward - looking non - GAAP measures due to the inherent difficulty in forecasting and quantifying certain amounts that are necessary for such reconciliation. All historical annual GAAP financials shown are audited; quarterly, non - GAAP financials and projections are unaudited. $842 $1,544 2 0 18A 2 0 19A 2 0 20E Buyer CAC Seller CAC Brand Mark e t i n g Note: Figures represent customer acquisition cost per ecommerce unit; These projections are for illustrative purposes only and should not be relied upon as being necessarily indicative of future results. Metrics that are considered non - GAAP
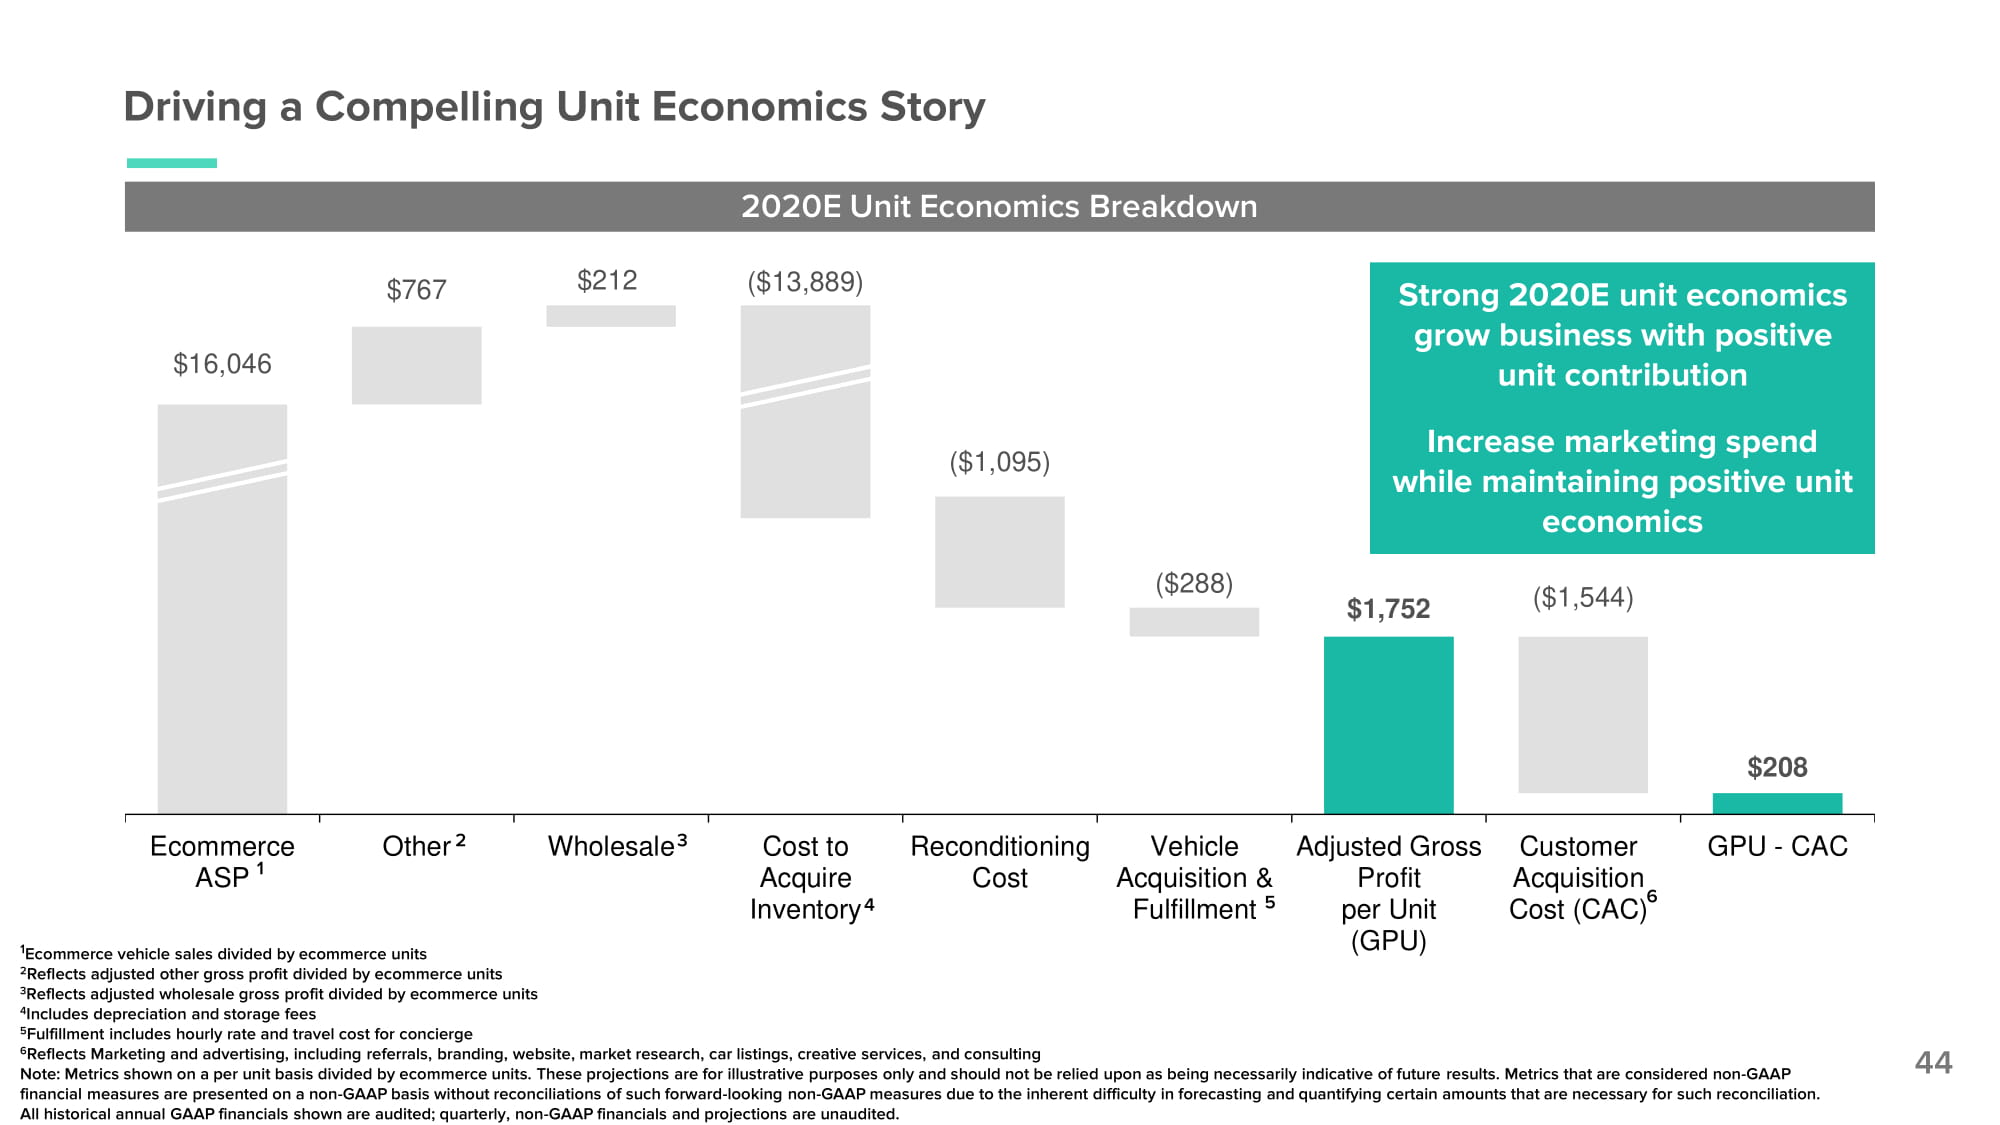
$16, 046 $21 2 ($13,889) $1,752 $208 $767 ($1, 095) ($288) ($1, 544) E c o mm er ce ASP 1 Other 2 Wholesale 3 Cost to Acquire I nve nt or y 4 Re c ondi t ioning Cost Vehicle Acquisition & Fulfillment 5 Adjusted Gross Profit per Unit (GPU) Customer Acquisition Cost (CAC) 6 GPU - CAC Driving a Compelling Unit Economics Story 44 2020E Unit Economics Breakdown 1 Ecommerce vehicle sales divided by ecommerce units 2 Reflects adjusted other gross profit divided by ecommerce units 3 Reflects adjusted wholesale gross profit divided by ecommerce units 4 Includes depreciation and storage fees 5 Fulfillment includes hourly rate and travel cost for concierge 6 Reflects Marketing and advertising, including referrals, branding, website, market research, car listings, creative services, and consulting Note: Metrics shown on a per unit basis divided by ecommerce units. These projections are for illustrative purposes only and should not be relied upon as being necessarily indicative of future results. Metrics that are considered non - GAAP Strong 2020E unit economics grow business with positive unit contribution Increase marketing spend while maintaining positive unit economics financial measures are presented on a non - GAAP basis without reconciliations of such forward - looking non - GAAP measures due to the inherent difficulty in forecasting and quantifying certain amounts that are necessary for such reconciliation. All historical annual GAAP financials shown are audited; quarterly, non - GAAP financials and projections are unaudited.

Customer Acquisition Cost (CAC) 4 Adjusted Gross Profit per Unit (GPU) 1,3 Auto Ecommerce Unit Economics Comparison at IPO Adjusted Gross Margin 2,3 45 1 GPU calculated as adjusted gross profit divided by ecommerce units 2 Gross margin calculated as adjusted gross profit divided by total revenue 3 Reflects adjusted gross margin, which excludes non - repair labor, excess capacity, and a non - cash contra - revenue adjustment primarily associated with Lithia warrant milestones. Adjusted gross margin is a non - GAAP financial measure. For a reconciliation of adjusted gross margin to its most directly comparable GAAP financial measure see page 43 of the Presentation. All historical annual GAAP financials shown are audited; quarterly, non - GAAP financials and projections are unaudited. 4 Customer Acquisition Cost calculated as advertising expense divided by ecommerce units 5 Average Selling Price (ASP) defined as ecommerce revenue divided by ecommerce units 20 1 9 20 1 9 20 1 6 20 1 9 20 1 9 20 1 6 20 1 9 20 1 9 20 1 6 Note: Vroom metrics shown as ecommerce only, excluding TDA. Shift financials are shown unaudited. $1 , 19 0 $1 , 69 6 $1,023 $842 $2,632 $1 , 43 9 5.9 % 5.5 % Healthy GPU with lower ASP leads to a superior Adjusted Gross Margin Significant opportunity to drive growth with increased marketing spend on a positive per unit contribution Strong unit economics pave the way for aggressive growth as a public company Average Ecommerce Sale Price 5 $16,371 $18,229 $30,456
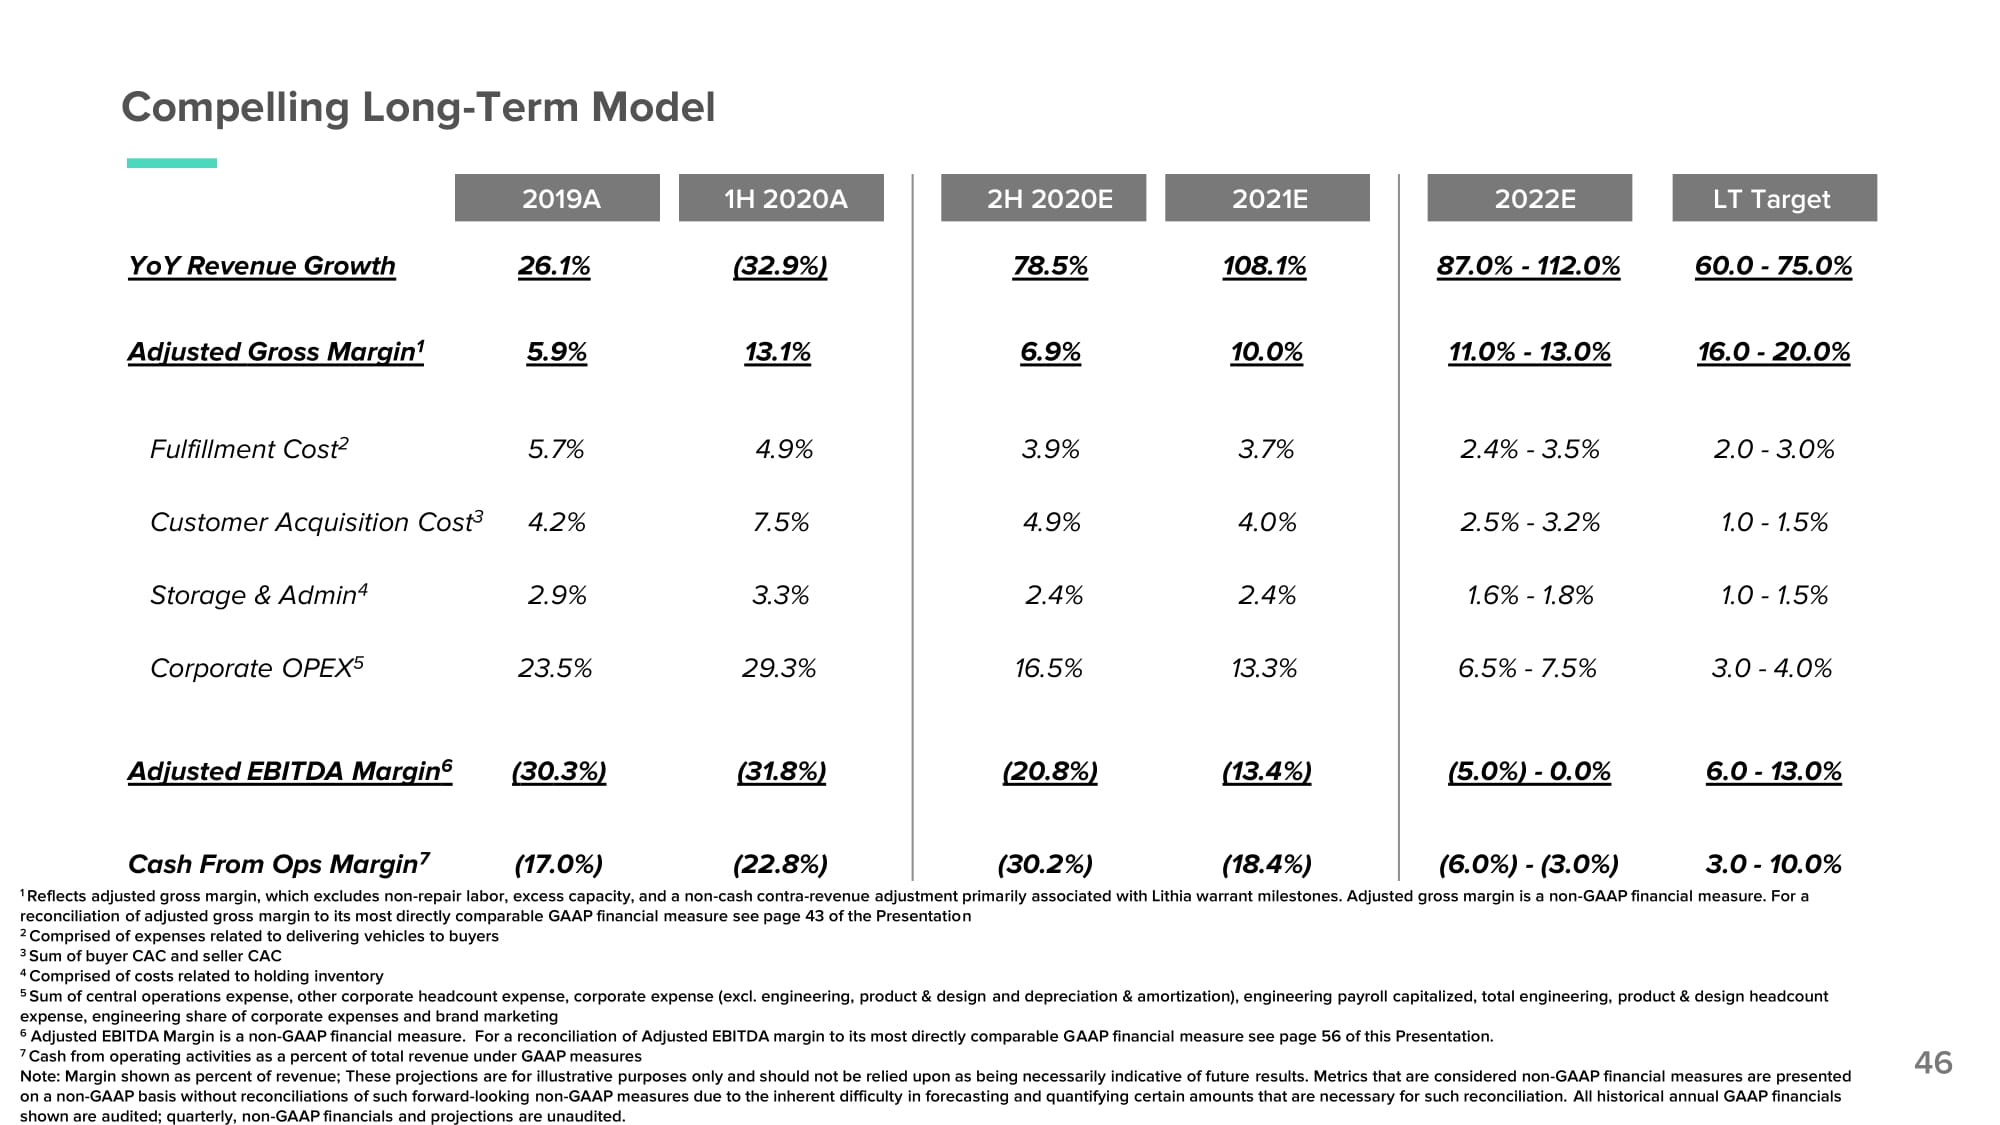
Compelling Long - Term Model 46 1 Reflects adjusted gross margin, which excludes non - repair labor, excess capacity, and a non - cash contra - revenue adjustment primarily associated with Lithia warrant milestones. Adjusted gross margin is a non - GAAP financial measure. For a reconciliation of adjusted gross margin to its most directly comparable GAAP financial measure see page 43 of the Presentation 2 Comprised of expenses related to delivering vehicles to buyers 3 Sum of buyer CAC and seller CAC 4 Comprised of costs related to holding inventory 5 Sum of central operations expense, other corporate headcount expense, corporate expense (excl. engineering, product & design and depreciation & amortization), engineering payroll capitalized, total engineering, product & design headcount expense, engineering share of corporate expenses and brand marketing 6 Adjusted EBITDA Margin is a non - GAAP financial measure. For a reconciliation of Adjusted EBITDA margin to its most directly comparable GAAP financial measure see page 56 of this Presentation. 7 Cash from operating activities as a percent of total revenue under GAAP measures Note: Margin shown as percent of revenue; These projections are for illustrative purposes only and should not be relied upon as being necessarily indicative of future results. Metrics that are considered non - GAAP financial measures are presented on a non - GAAP basis without reconciliations of such forward - looking non - GAAP measures due to the inherent difficulty in forecasting and quantifying certain amounts that are necessary for such reconciliation. All historical annual GAAP financials shown are audited; quarterly, non - GAAP financials and projections are unaudited. 2019A 1H 2020A 2H 2020E 2021E 2022E LT Target YoY Revenue Growth 26.1% (32.9%) 78.5% 108.1% 87.0% - 112.0% 60.0 - 75.0% Adjusted Gross Margin 1 5.9% 13.1% 6.9% 10.0% 11.0% - 13.0% 16.0 - 20.0% Fulfillment Cost 2 5.7% 4.9% 3.9% 3.7% 2.4% - 3.5% 2.0 - 3.0% Customer Acquisition Cost 3 4.2% 7.5% 4.9% 4.0% 2.5% - 3.2% 1.0 - 1.5% Storage & Admin 4 2.9% 3.3% 2.4% 2.4% 1.6% - 1.8% 1.0 - 1.5% Corporate OPEX 5 23.5% 29.3% 16.5% 13.3% 6.5% - 7.5% 3.0 - 4.0% Adjusted EBITDA Margin 6 (30.3%) (31.8%) (20.8%) (13.4%) (5.0%) - 0.0% 6.0 - 13.0% Cash From Ops Margin 7 (17.0%) (22.8%) (30.2%) (18.4%) (6.0%) - (3.0%) 3.0 - 10.0%
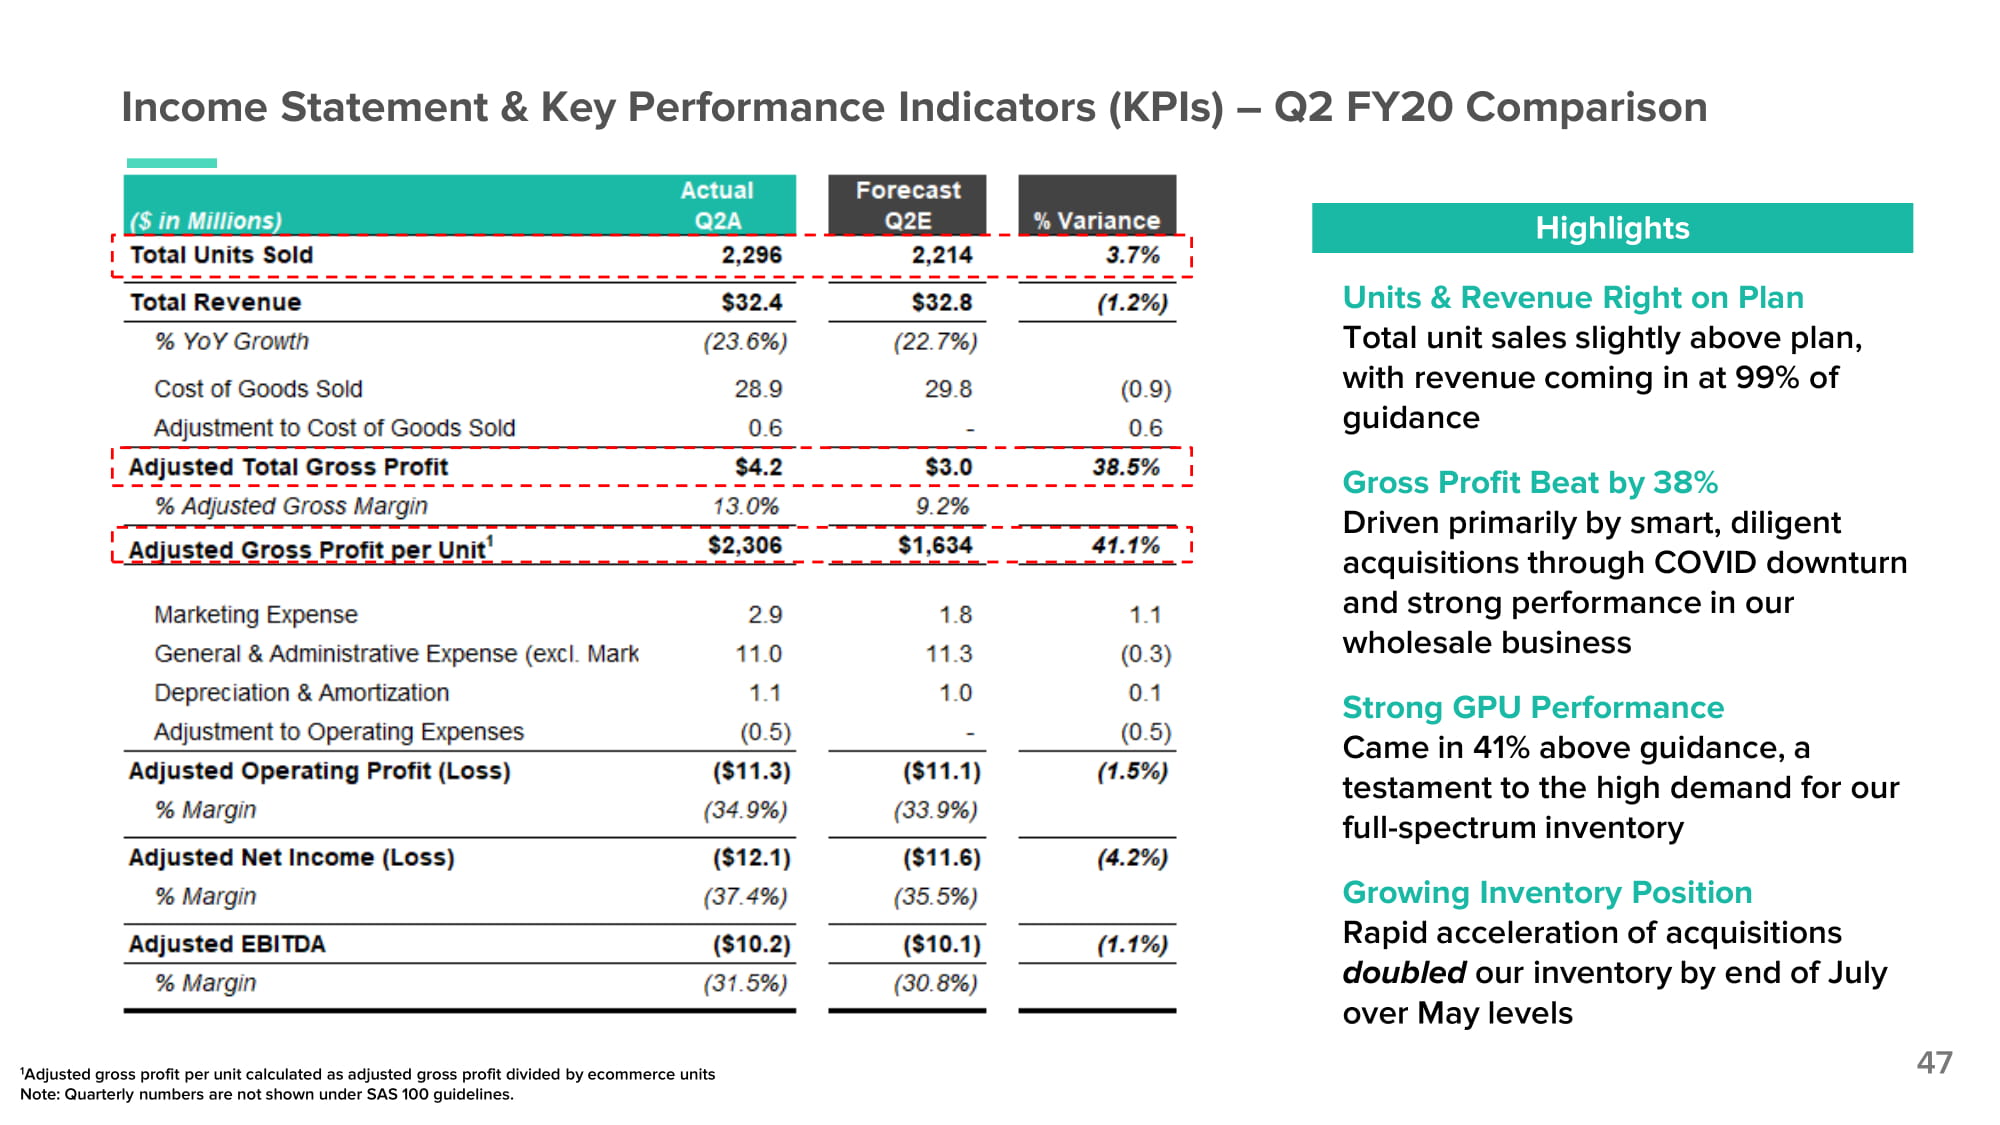
Income Statement & Key Performance Indicators (KPIs) – Q2 FY20 Comparison 47 Units & Revenue Right on Plan Total unit sales slightly above plan, with revenue coming in at 99% of guidance Gross Profit Beat by 38% Driven primarily by smart, diligent acquisitions through COVID downturn and strong performance in our wholesale business Strong GPU Performance Came in 41% above guidance, a testament to the high demand for our full - spectrum inventory Growing Inventory Position Rapid acceleration of acquisitions doubled our inventory by end of July over May levels Highlights 1 Adjusted gross profit per unit calculated as adjusted gross profit divided by ecommerce units Note: Quarterly numbers are not shown under SAS 100 guidelines.
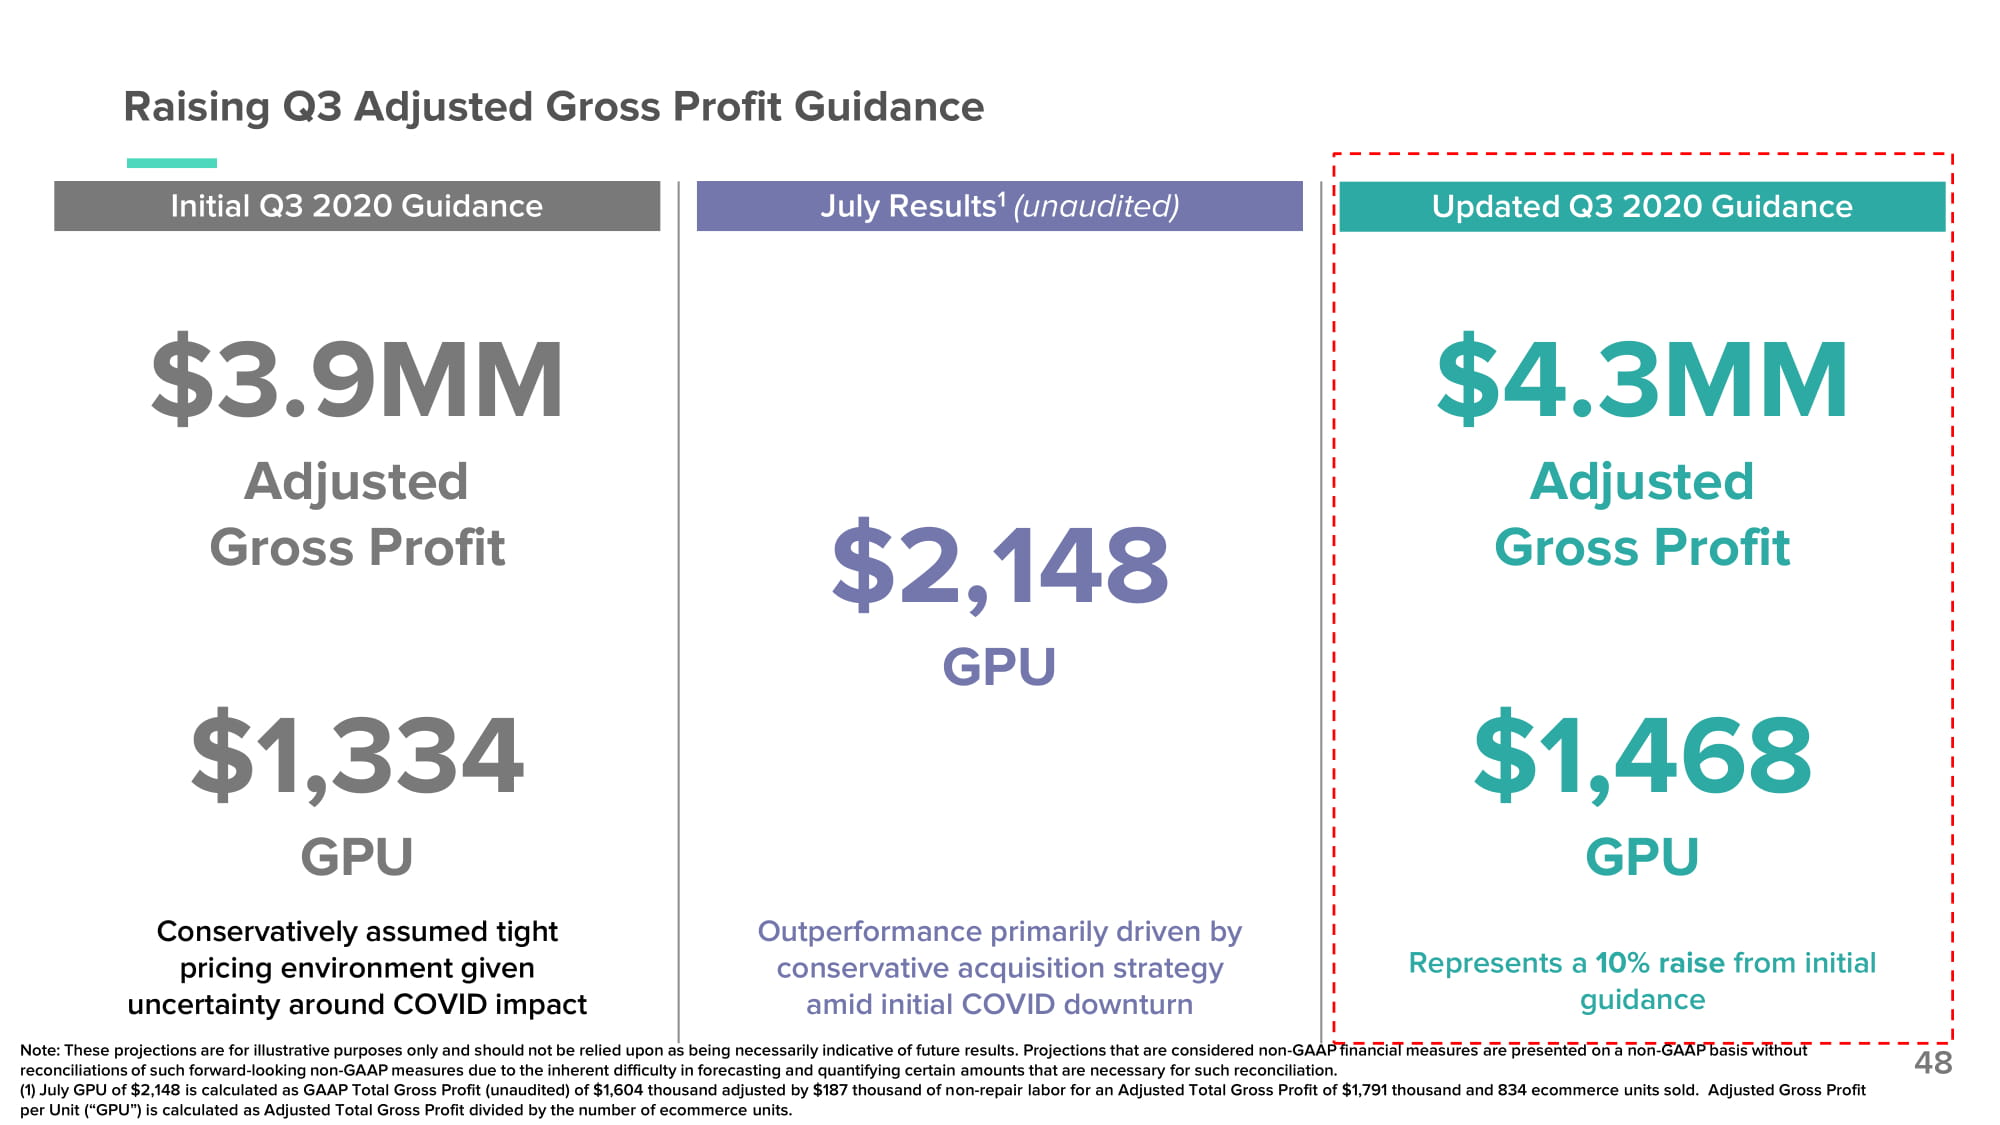
Initial Q3 2020 Guidance Raising Q3 Adjusted Gross Profit Guidance July Results 1 (unaudited) 48 Updated Q3 2020 Guidance $4.3MM Adjusted Gross Profit $1,468 GPU Represents a 10% raise from initial guidance $1,334 GPU Conservatively assumed tight pricing environment given uncertainty around COVID impact $3.9MM Adjusted Gross Profit $2,148 GPU Outperformance primarily driven by conservative acquisition strategy amid initial COVID downturn Note: These projections are for illustrative purposes only and should not be relied upon as being necessarily indicative of future results. Projections that are considered non - GAAP financial measures are presented on a non - GAAP basis without reconciliations of such forward - looking non - GAAP measures due to the inherent difficulty in forecasting and quantifying certain amounts that are necessary for such reconciliation. (1) July GPU of $2,148 is calculated as GAAP Total Gross Profit (unaudited) of $1,604 thousand adjusted by $187 thousand of non - repair labor for an Adjusted Total Gross Profit of $1,791 thousand and 834 ecommerce units sold. Adjusted Gross Profit per Unit (“GPU”) is calculated as Adjusted Total Gross Profit divided by the number of ecommerce units.

Thank you - Q&A

Appendix
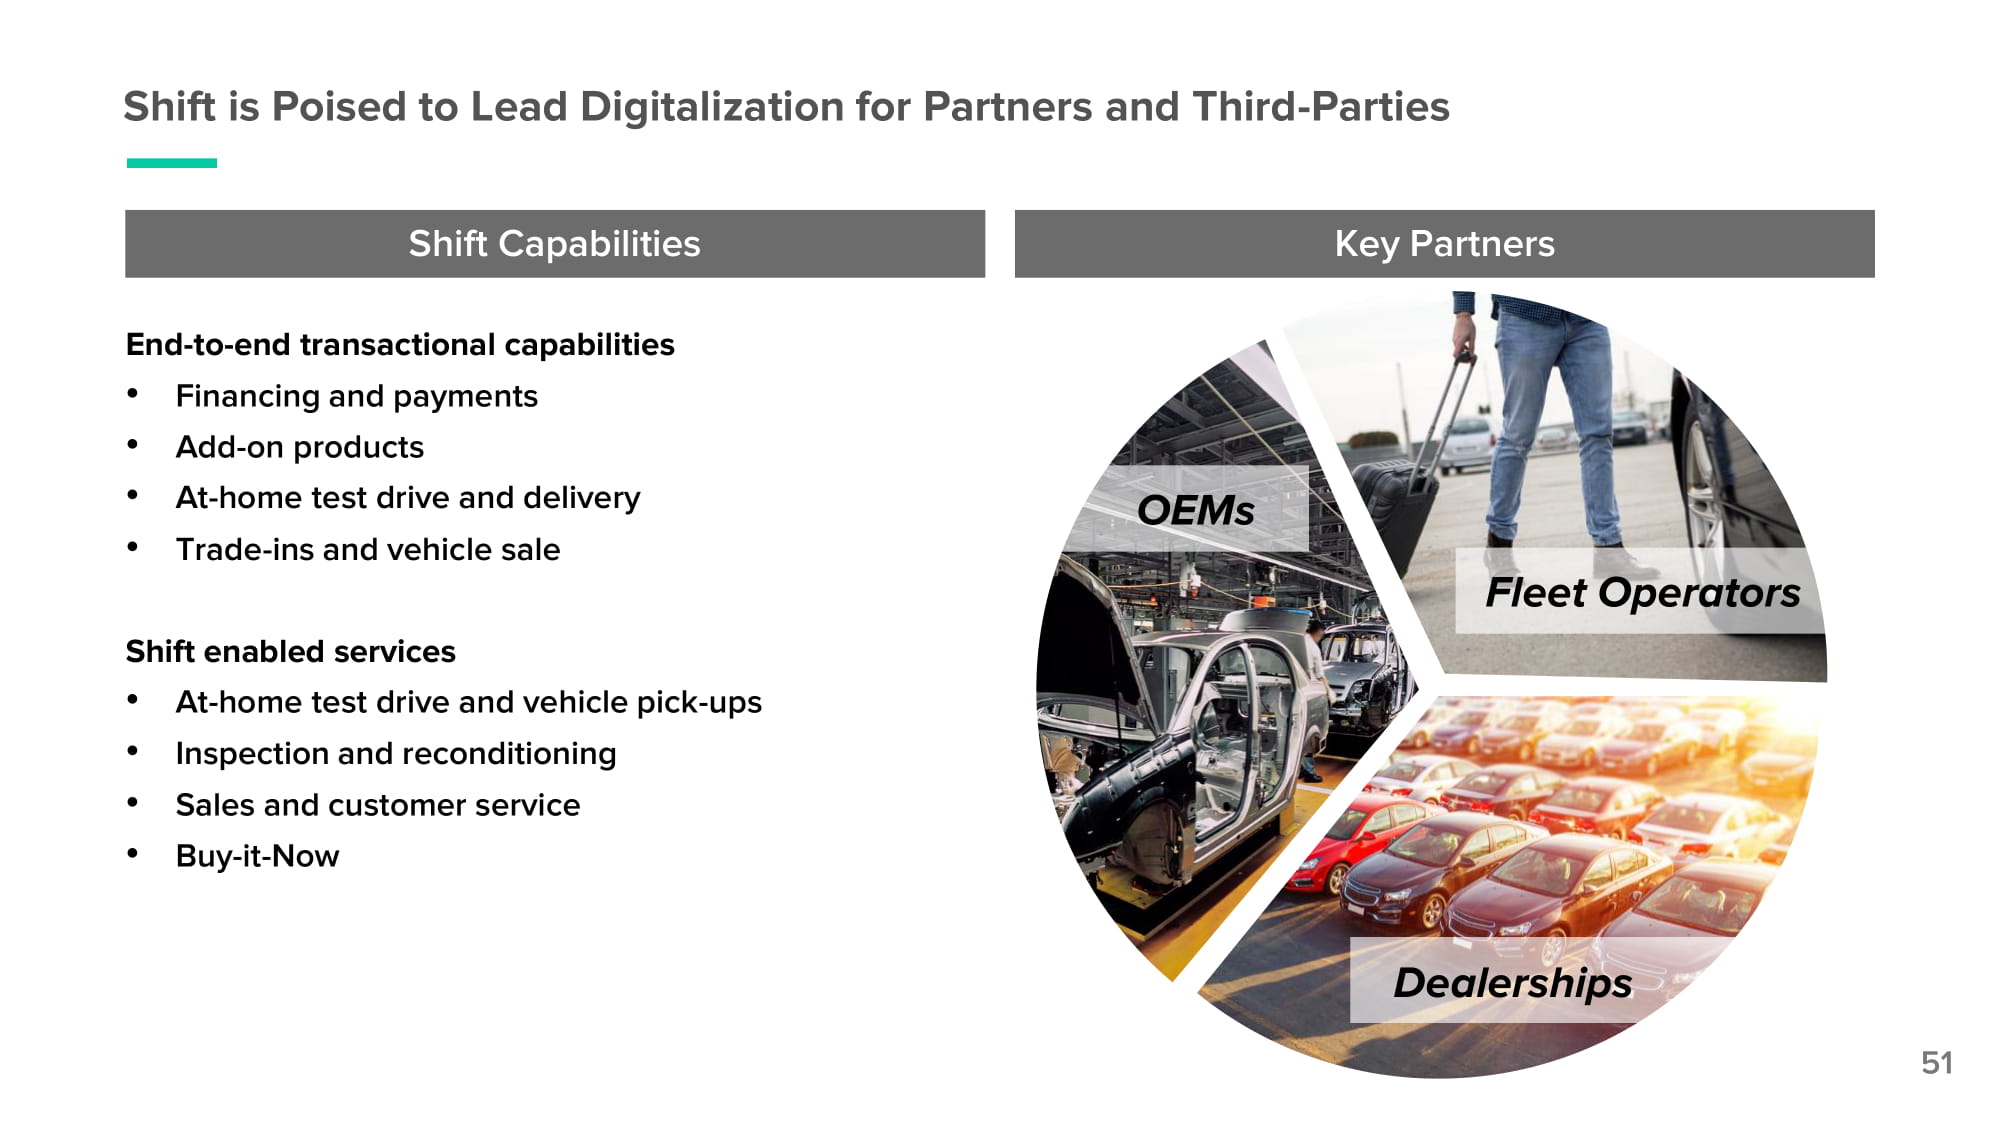
Shift is Poised to Lead Digitalization for Partners and Third - Parties Shift Capabilities End - to - end transactional capabilities • Financing and payments • Add - on products • At - home test drive and delivery • Trade - ins and vehicle sale Shift enabled services • At - home test drive and vehicle pick - ups • Inspection and reconditioning • Sales and customer service • Buy - it - Now Key Partners O E Ms Fleet Operators Dealerships 51
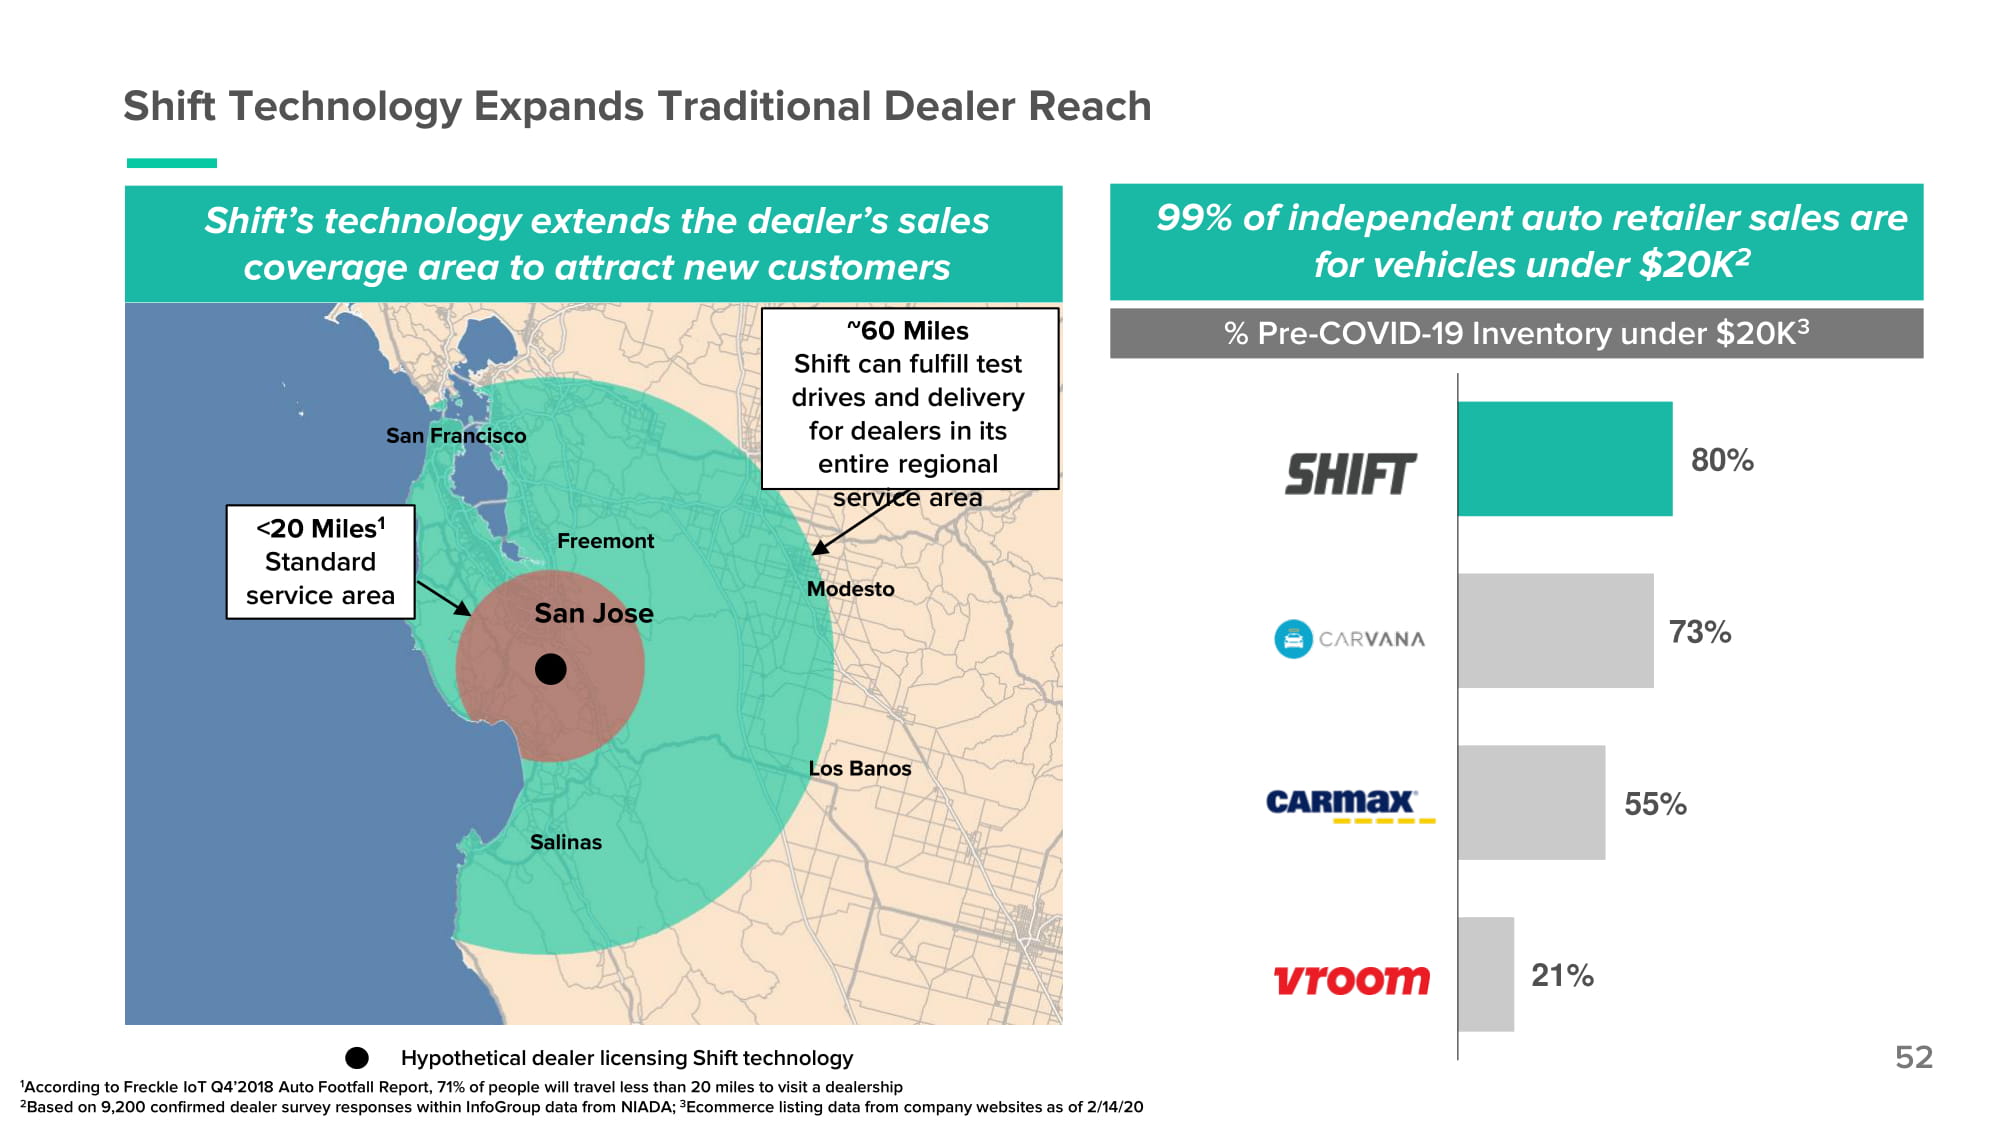
San Jose S a lin a s Los Banos S ac ra ment o Modesto F ree m o n t San Francisco 99% of independent auto retailer sales are for vehicles under $20K 2 Shift Technology Expands Traditional Dealer Reach Shift’s technology extends the dealer’s sales coverage area to attract new customers 52 80% 73% 55% 21% % Pre - COVID - 19 Inventory under $20K 3 Hypothetical dealer licensing Shift technology <20 Miles 1 Standard service area ~60 Miles Shift can fulfill test drives and delivery for dealers in its entire regional service area 1 According to Freckle IoT Q4’2018 Auto Footfall Report, 71% of people will travel less than 20 miles to visit a dealership 2 Based on 9,200 confirmed dealer survey responses within InfoGroup data from NIADA; 3 Ecommerce listing data from company websites as of 2/14/20
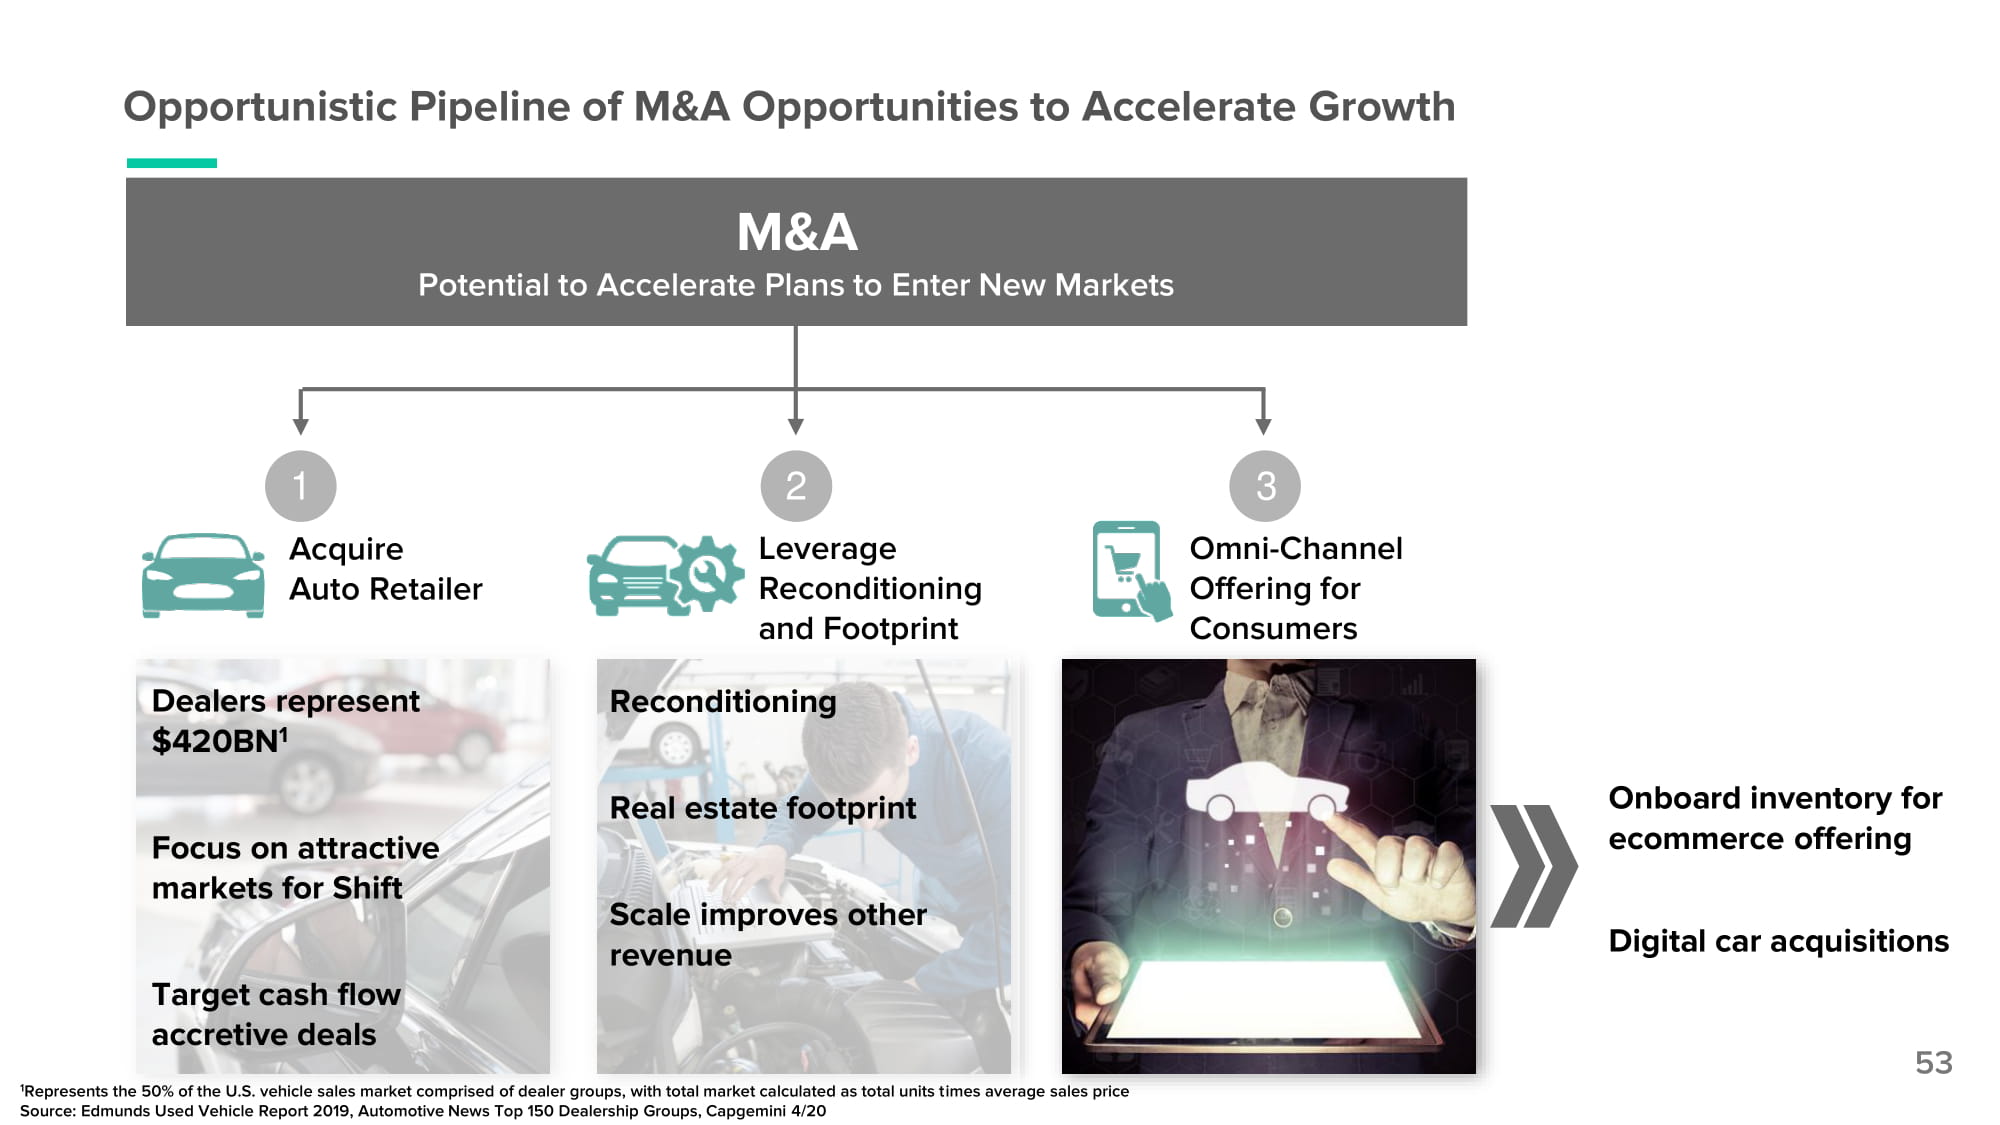
53 Opportunistic Pipeline of M&A Opportunities to Accelerate Growth M&A Potential to Accelerate Plans to Enter New Markets 1 Acquire Auto Retailer 2 Leverage Re conditioning and Footprint 3 O m n i - Cha n n e l Offering for Consumers Dealers represent $420BN 1 Focus on attractive markets for Shift Target cash flow accretive deals Reconditioning Real estate footprint Scale improves other revenue Onboard inventory for ecommerce offering Digital car acquisitions 1 Represents the 50% of the U.S. vehicle sales market comprised of dealer groups, with total market calculated as total units times average sales price Source: Edmunds Used Vehicle Report 2019, Automotive News Top 150 Dealership Groups, Capgemini 4/20
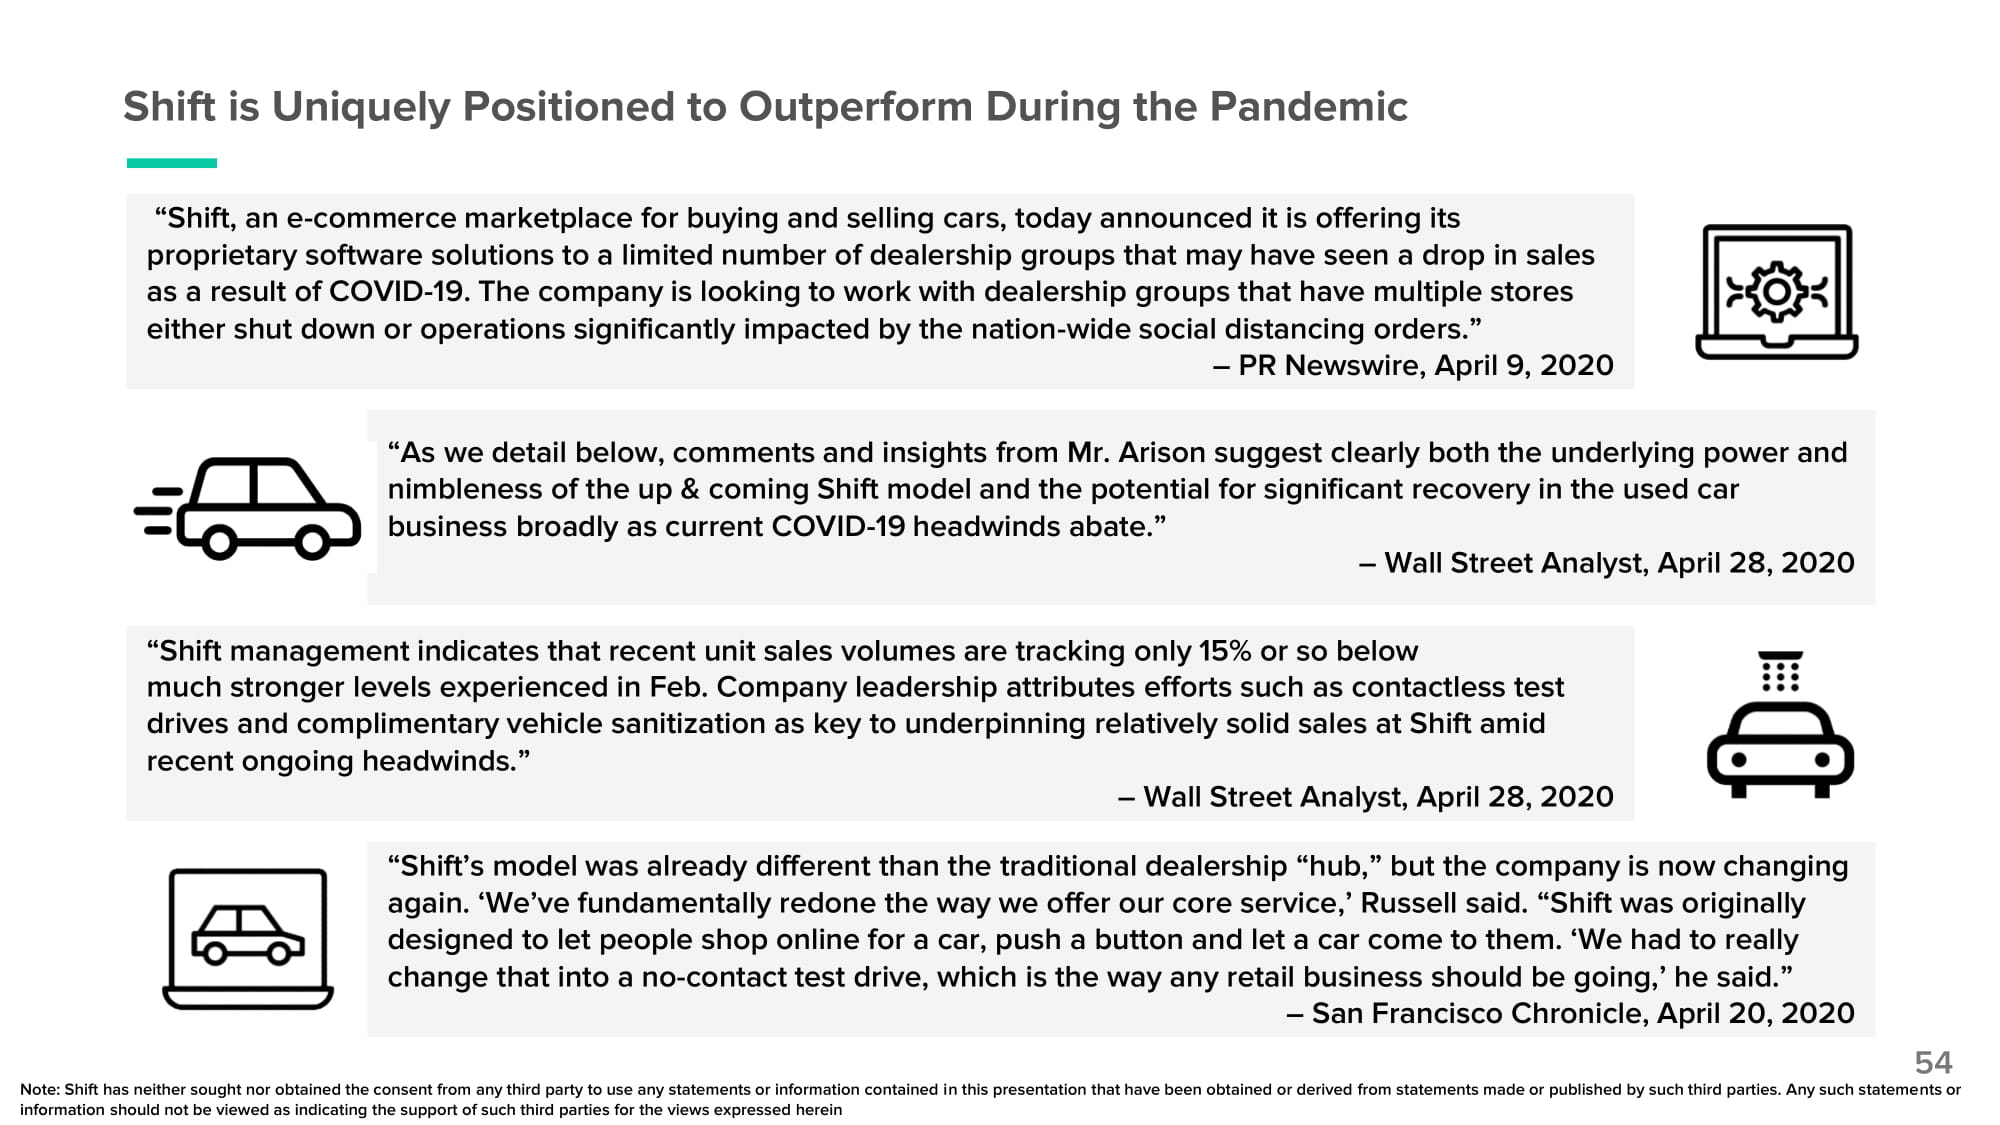
Shift is Uniquely Positioned to Outperform During the Pandemic “Shift, an e - commerce marketplace for buying and selling cars, today announced it is offering its proprietary software solutions to a limited number of dealership groups that may have seen a drop in sales as a result of COVID - 19. The company is looking to work with dealership groups that have multiple stores either shut down or operations significantly impacted by the nation - wide social distancing orders.” – PR Newswire, April 9, 2020 “As we detail below, comments and insights from Mr. Arison suggest clearly both the underlying power and nimbleness of the up & coming Shift model and the potential for significant recovery in the used car business broadly as current COVID - 19 headwinds abate.” – Wall Street Analyst, April 28, 2020 “Shift management indicates that recent unit sales volumes are tracking only 15% or so below much stronger levels experienced in Feb. Company leadership attributes efforts such as contactless test drives and complimentary vehicle sanitization as key to underpinning relatively solid sales at Shift amid recent ongoing headwinds.” – Wall Street Analyst, April 28, 2020 “Shift’s model was already different than the traditional dealership “hub,” but the company is now changing again. ‘We’ve fundamentally redone the way we offer our core service,’ Russell said. “Shift was originally designed to let people shop online for a car, push a button and let a car come to them. ‘We had to really change that into a no - contact test drive, which is the way any retail business should be going,’ he said.” – San Francisco Chronicle, April 20, 2020 54 Note: Shift has neither sought nor obtained the consent from any third party to use any statements or information contained in this presentation that have been obtained or derived from statements made or published by such third parties. Any such statements or information should not be viewed as indicating the support of such third parties for the views expressed herein

Shift Select Investors 55
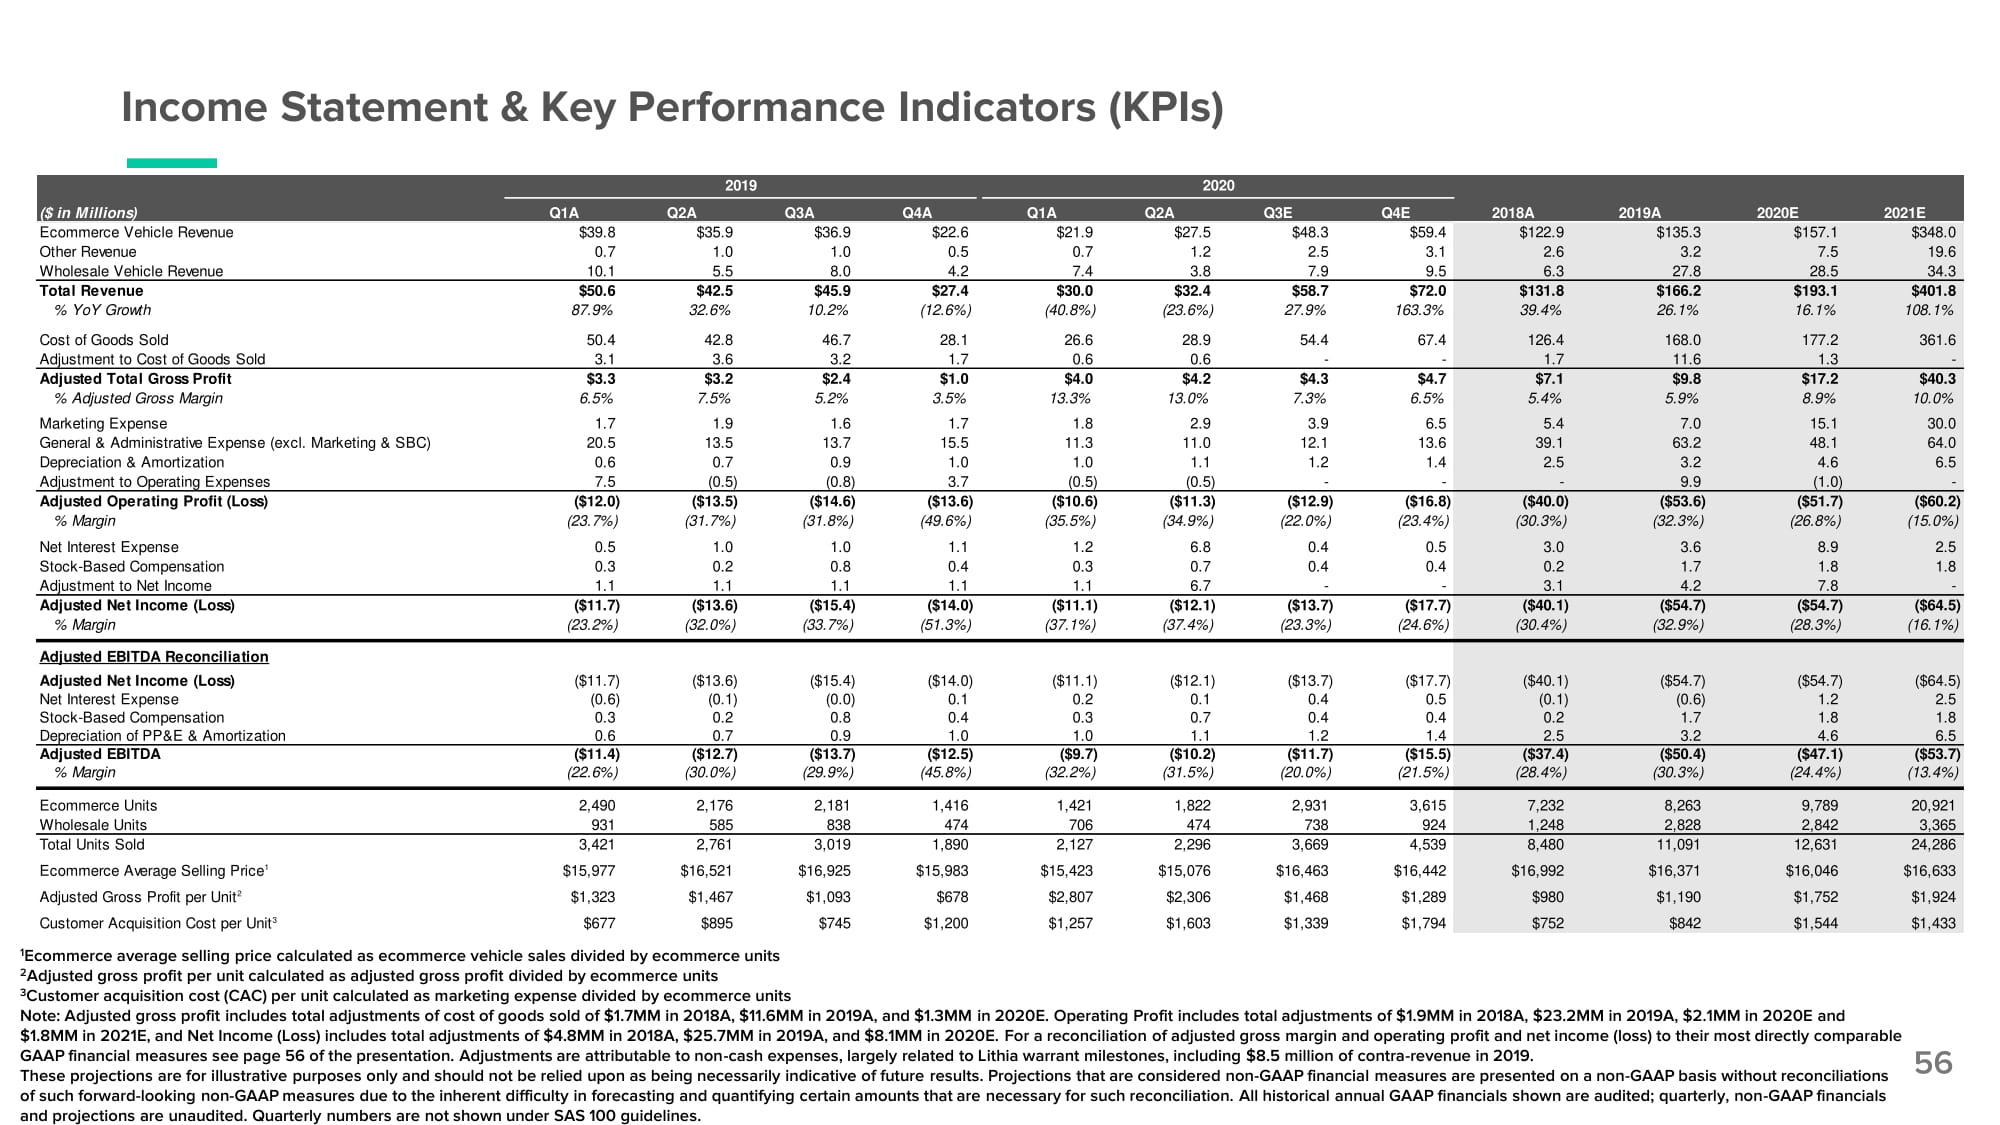
Income Statement & Key Performance Indicators (KPIs) 56 ($ in Millions) Q1A 2019 Q2A Q3A Q4A Q1A 2020 Q2A Q3E Q4E 2018A 2019A 2020E 2021E Ecommerce Vehicle Revenue $39 . 8 $35 . 9 $36 . 9 $22 . 6 $21 . 9 $27 . 5 $48 . 3 $59 . 4 $122 . 9 $135 . 3 $157 . 1 $348 . 0 Other Revenue 0 . 7 1 . 0 1 . 0 0 . 5 0 . 7 1 . 2 2 . 5 3 . 1 2 . 6 3 . 2 7 . 5 19 . 6 Wholesale Vehicle Revenue 10 . 1 5 . 5 8 . 0 4 . 2 7 . 4 3 . 8 7 . 9 9 . 5 6 . 3 27 . 8 28 . 5 34 . 3 Total Revenue $50 . 6 $42 . 5 $45 . 9 $27 . 4 $30 . 0 $32 . 4 $58 . 7 $72 . 0 $131 . 8 $166 . 2 $193 . 1 $401 . 8 % YoY Growth 87 . 9 % 32 . 6 % 10.2% (12 . 6 % ) (40 . 8 % ) (23 . 6 % ) 27.9% 163 . 3 % 39 . 4 % 26 . 1 % 16 . 1 % 108 . 1 % Cost of Goods Sold 50 . 4 42 . 8 46 . 7 28 . 1 26 . 6 28 . 9 54 . 4 67 . 4 126 . 4 168 . 0 177 . 2 361 . 6 Adjustment to Cost of Goods Sold 3 . 1 3 . 6 3 . 2 1 . 7 0 . 6 0 . 6 - - 1 . 7 11 . 6 1 . 3 - Adjusted Total Gross Profit $3 . 3 $3 . 2 $2 . 4 $1 . 0 $4 . 0 $4 . 2 $4 . 3 $4 . 7 $7 . 1 $9 . 8 $17 . 2 $40 . 3 % Adjusted Gross Margin 6 . 5 % 7 . 5 % 5.2% 3 . 5 % 13 . 3 % 13 . 0 % 7.3% 6 . 5 % 5 . 4 % 5 . 9 % 8 . 9 % 10 . 0 % Marketing Expense 1 . 7 1 . 9 1 . 6 1 . 7 1 . 8 2 . 9 3 . 9 6 . 5 5 . 4 7 . 0 15 . 1 30 . 0 General & Administrative Expense (excl. Marketing & SBC) 20 . 5 13 . 5 13 . 7 15 . 5 11 . 3 11 . 0 12 . 1 13 . 6 39 . 1 63 . 2 48 . 1 64 . 0 Depreciation & Amortization 0 . 6 0 . 7 0 . 9 1 . 0 1 . 0 1 . 1 1 . 2 1 . 4 2 . 5 3 . 2 4 . 6 6 . 5 Adjustment to Operating Expenses 7 . 5 (0 . 5 ) (0 . 8 ) 3 . 7 (0 . 5 ) (0 . 5 ) - - - 9 . 9 (1 . 0 ) - Adjusted Operating Profit (Loss) ($12 . 0 ) ($13 . 5 ) ($14 . 6 ) ($13 . 6 ) ($10 . 6 ) ($11 . 3 ) ($12 . 9 ) ($16 . 8 ) ($40 . 0 ) ($53 . 6 ) ($51 . 7 ) ($60 . 2 ) % Margin (23 . 7 % ) (31 . 7 % ) (31 . 8 % ) (49 . 6 % ) (35 . 5 % ) (34 . 9 % ) (22 . 0 % ) (23 . 4 % ) (30 . 3 % ) (32 . 3 % ) (26 . 8 % ) (15 . 0 % ) Net Interest Expense 0 . 5 1 . 0 1 . 0 1 . 1 1 . 2 6 . 8 0 . 4 0 . 5 3 . 0 3 . 6 8 . 9 2 . 5 Stock - Based Compensation 0 . 3 0 . 2 0 . 8 0 . 4 0 . 3 0 . 7 0 . 4 0 . 4 0 . 2 1 . 7 1 . 8 1 . 8 Adjustment to Net Income 1 . 1 1 . 1 1 . 1 1 . 1 1 . 1 6 . 7 - - 3 . 1 4 . 2 7 . 8 - Adjusted Net Income (Loss) ($11 . 7 ) ($13 . 6 ) ($15 . 4 ) ($14 . 0 ) ($11 . 1 ) ($12 . 1 ) ($13 . 7 ) ($17 . 7 ) ($40 . 1 ) ($54 . 7 ) ($54 . 7 ) ($64 . 5 ) % Margin (23 . 2 % ) (32 . 0 % ) (33 . 7 % ) (51 . 3 % ) (37 . 1 % ) (37 . 4 % ) (23 . 3 % ) (24 . 6 % ) (30 . 4 % ) (32 . 9 % ) (28 . 3 % ) (16 . 1 % ) Adjusted EBITDA Reconciliation Adjusted Net Income (Loss) ($11 . 7 ) ($13 . 6 ) ($15 . 4 ) ($14 . 0 ) ($11 . 1 ) ($12 . 1 ) ($13 . 7 ) ($17 . 7 ) ($40 . 1 ) ($54 . 7 ) ($54 . 7 ) ($64 . 5 ) Net Interest Expense (0 . 6 ) (0 . 1 ) (0 . 0 ) 0 . 1 0 . 2 0 . 1 0 . 4 0 . 5 (0 . 1 ) (0 . 6 ) 1 . 2 2 . 5 Stock - Based Compensation 0 . 3 0 . 2 0 . 8 0 . 4 0 . 3 0 . 7 0 . 4 0 . 4 0 . 2 1 . 7 1 . 8 1 . 8 Depreciation of PP&E & Amortization 0 . 6 0 . 7 0 . 9 1 . 0 1 . 0 1 . 1 1 . 2 1 . 4 2 . 5 3 . 2 4 . 6 6 . 5 Adjusted EBITDA ($11 . 4 ) ($12 . 7 ) ($13 . 7 ) ($12 . 5 ) ($9 . 7 ) ($10 . 2 ) ($11 . 7 ) ($15 . 5 ) ($37 . 4 ) ($50 . 4 ) ($47 . 1 ) ($53 . 7 ) % Margin (22 . 6 % ) (30 . 0 % ) (29 . 9 % ) (45 . 8 % ) (32 . 2 % ) (31 . 5 % ) (20 . 0 % ) (21 . 5 % ) (28 . 4 % ) (30 . 3 % ) (24 . 4 % ) (13 . 4 % ) Ecommerce Units 2 , 49 0 2 , 17 6 2 , 18 1 1 , 41 6 1 , 42 1 1 , 82 2 2 , 93 1 3 , 61 5 7 , 23 2 8 , 26 3 9 , 78 9 20 , 92 1 Wholesale Units 931 585 838 474 706 474 738 924 1 , 24 8 2 , 82 8 2 , 84 2 3 , 36 5 Total Units Sold 3 , 42 1 2 , 76 1 3 , 01 9 1 , 89 0 2 , 12 7 2 , 29 6 3 , 66 9 4 , 53 9 8 , 48 0 11 , 09 1 12 , 63 1 24 , 28 6 Ecommerce Average Selling Price 1 $15 , 97 7 $16 , 52 1 $16 , 92 5 $15 , 98 3 $15 , 42 3 $15 , 07 6 $16 , 46 3 $16 , 44 2 $16 , 99 2 $16 , 37 1 $16 , 04 6 $16 , 63 3 Adjusted Gross Profit per Unit 2 $1 , 32 3 $1 , 46 7 $1 , 09 3 $678 $2 , 80 7 $2 , 30 6 $1 , 46 8 $1 , 28 9 $980 $1 , 19 0 $1 , 75 2 $1 , 92 4 Customer Acquisition Cost per Unit 3 $677 $895 $745 $1 , 20 0 $1 , 25 7 $1 , 60 3 $1 , 33 9 $1 , 79 4 $752 $842 $1 , 54 4 $1 , 43 3 1 Ecommerce average selling price calculated as ecommerce vehicle sales divided by ecommerce units 2 Adjusted gross profit per unit calculated as adjusted gross profit divided by ecommerce units 3 Customer acquisition cost (CAC) per unit calculated as marketing expense divided by ecommerce units Note: Adjusted gross profit includes total adjustments of cost of goods sold of $1.7MM in 2018A, $11.6MM in 2019A, and $1.3MM in 2020E. Operating Profit includes total adjustments of $1.9MM in 2018A, $23.2MM in 2019A, $2.1MM in 2020E and $1.8MM in 2021E, and Net Income (Loss) includes total adjustments of $4.8MM in 2018A, $25.7MM in 2019A, and $8.1MM in 2020E. For a reconciliation of adjusted gross margin and operating profit and net income (loss) to their most directly comparable GAAP financial measures see page 56 of the presentation. Adjustments are attributable to non - cash expenses, largely related to Lithia warrant milestones, including $8.5 million of contra - revenue in 2019. These projections are for illustrative purposes only and should not be relied upon as being necessarily indicative of future results . Projections that are considered non - GAAP financial measures are presented on a non - GAAP basis without reconciliations of such forward - looking non - GAAP measures due to the inherent difficulty in forecasting and quantifying certain amounts that are necessary for such reconciliation . All historical annual GAAP financials shown are audited ; quarterly, non - GAAP financials and projections are unaudited . Quarterly numbers are not shown under SAS 100 guidelines .
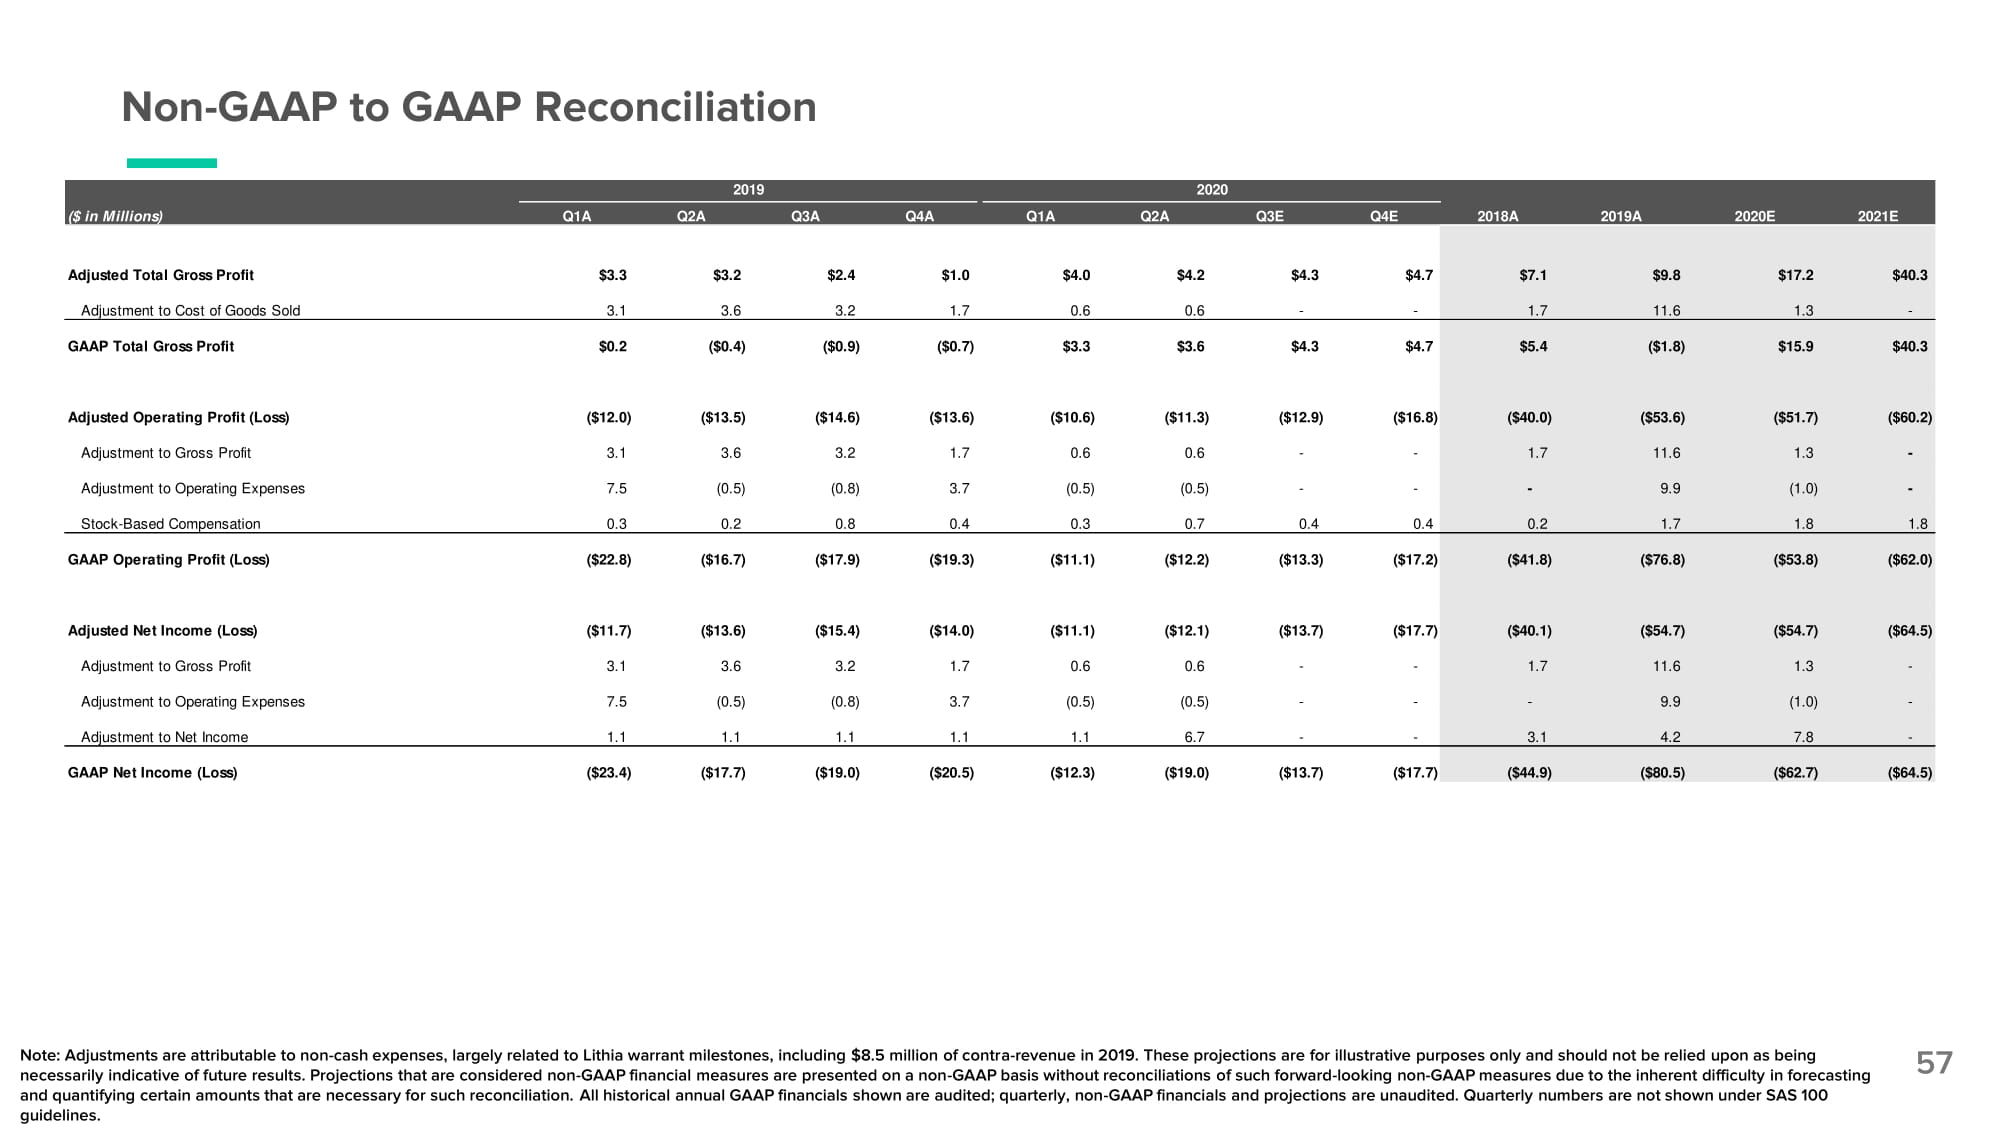
Non - GAAP to GAAP Reconciliation 57 ($ in Millions) Q1A 2019 Q2A Q3A Q4A Q1A 2020 Q2A Q3E Q4E 2018A 2019A 2020E 2021E Adjusted Total Gross Profit $3 . 3 $3 . 2 $2 . 4 $1 . 0 $4 . 0 $4.2 $4 . 3 $4 . 7 $7 . 1 $9 . 8 $17 . 2 $40 . 3 Adjustment to Cost of Goods Sold 3 . 1 3 . 6 3 . 2 1 . 7 0 . 6 0.6 - - 1 . 7 11 . 6 1 . 3 - GAAP Total Gross Profit $0 . 2 ( $0 . 4 ) ( $0 . 9 ) ( $0 . 7 ) $3 . 3 $3.6 $4 . 3 $4 . 7 $5 . 4 ( $1 . 8 ) $15 . 9 $40 . 3 Adjusted Operating Profit (Loss) ( $12 . 0 ) ( $13 . 5 ) ( $14 . 6 ) ( $13 . 6 ) ( $10 . 6 ) ($11.3) ( $12 . 9 ) ( $16 . 8 ) ( $40 . 0 ) ( $53 . 6 ) ( $51 . 7 ) ( $60 . 2 ) Adjustment to Gross Profit 3 . 1 3 . 6 3 . 2 1 . 7 0 . 6 0.6 - - 1 . 7 11 . 6 1 . 3 - Adjustment to Operating Expenses 7 . 5 ( 0 . 5 ) ( 0 . 8 ) 3 . 7 ( 0 . 5 ) (0.5) - - - 9 . 9 ( 1 . 0 ) - Stock - Based Compensation 0 . 3 0 . 2 0 . 8 0 . 4 0 . 3 0.7 0 . 4 0 . 4 0 . 2 1 . 7 1 . 8 1 . 8 GAAP Operating Profit (Loss) ( $22 . 8 ) ( $16 . 7 ) ( $17 . 9 ) ( $19 . 3 ) ( $11 . 1 ) ($12.2) ( $13 . 3 ) ( $17 . 2 ) ( $41 . 8 ) ( $76 . 8 ) ( $53 . 8 ) ( $62 . 0 ) Adjusted Net Income (Loss) ( $11 . 7 ) ( $13 . 6 ) ( $15 . 4 ) ( $14 . 0 ) ( $11 . 1 ) ($12.1) ( $13 . 7 ) ( $17 . 7 ) ( $40 . 1 ) ( $54 . 7 ) ( $54 . 7 ) ( $64 . 5 ) Adjustment to Gross Profit 3 . 1 3 . 6 3 . 2 1 . 7 0 . 6 0.6 - - 1 . 7 11 . 6 1 . 3 - Adjustment to Operating Expenses 7 . 5 ( 0 . 5 ) ( 0 . 8 ) 3 . 7 ( 0 . 5 ) (0.5) - - - 9 . 9 ( 1 . 0 ) - Adjustment to Net Income 1 . 1 1 . 1 1 . 1 1 . 1 1 . 1 6.7 - - 3 . 1 4 . 2 7 . 8 - GAAP Net Income (Loss) ( $23 . 4 ) ( $17 . 7 ) ( $19 . 0 ) ( $20 . 5 ) ( $12 . 3 ) ($19.0) ( $13 . 7 ) ( $17 . 7 ) ( $44 . 9 ) ( $80 . 5 ) ( $62 . 7 ) ( $64 . 5 ) Note: Adjustments are attributable to non - cash expenses, largely related to Lithia warrant milestones, including $8.5 million of contra - revenue in 2019. These projections are for illustrative purposes only and should not be relied upon as being necessarily indicative of future results. Projections that are considered non - GAAP financial measures are presented on a non - GAAP basis without reconciliations of such forward - looking non - GAAP measures due to the inherent difficulty in forecasting and quantifying certain amounts that are necessary for such reconciliation. All historical annual GAAP financials shown are audited; quarterly, non - GAAP financials and projections are unaudited. Quarterly numbers are not shown under SAS 100 guidelines.
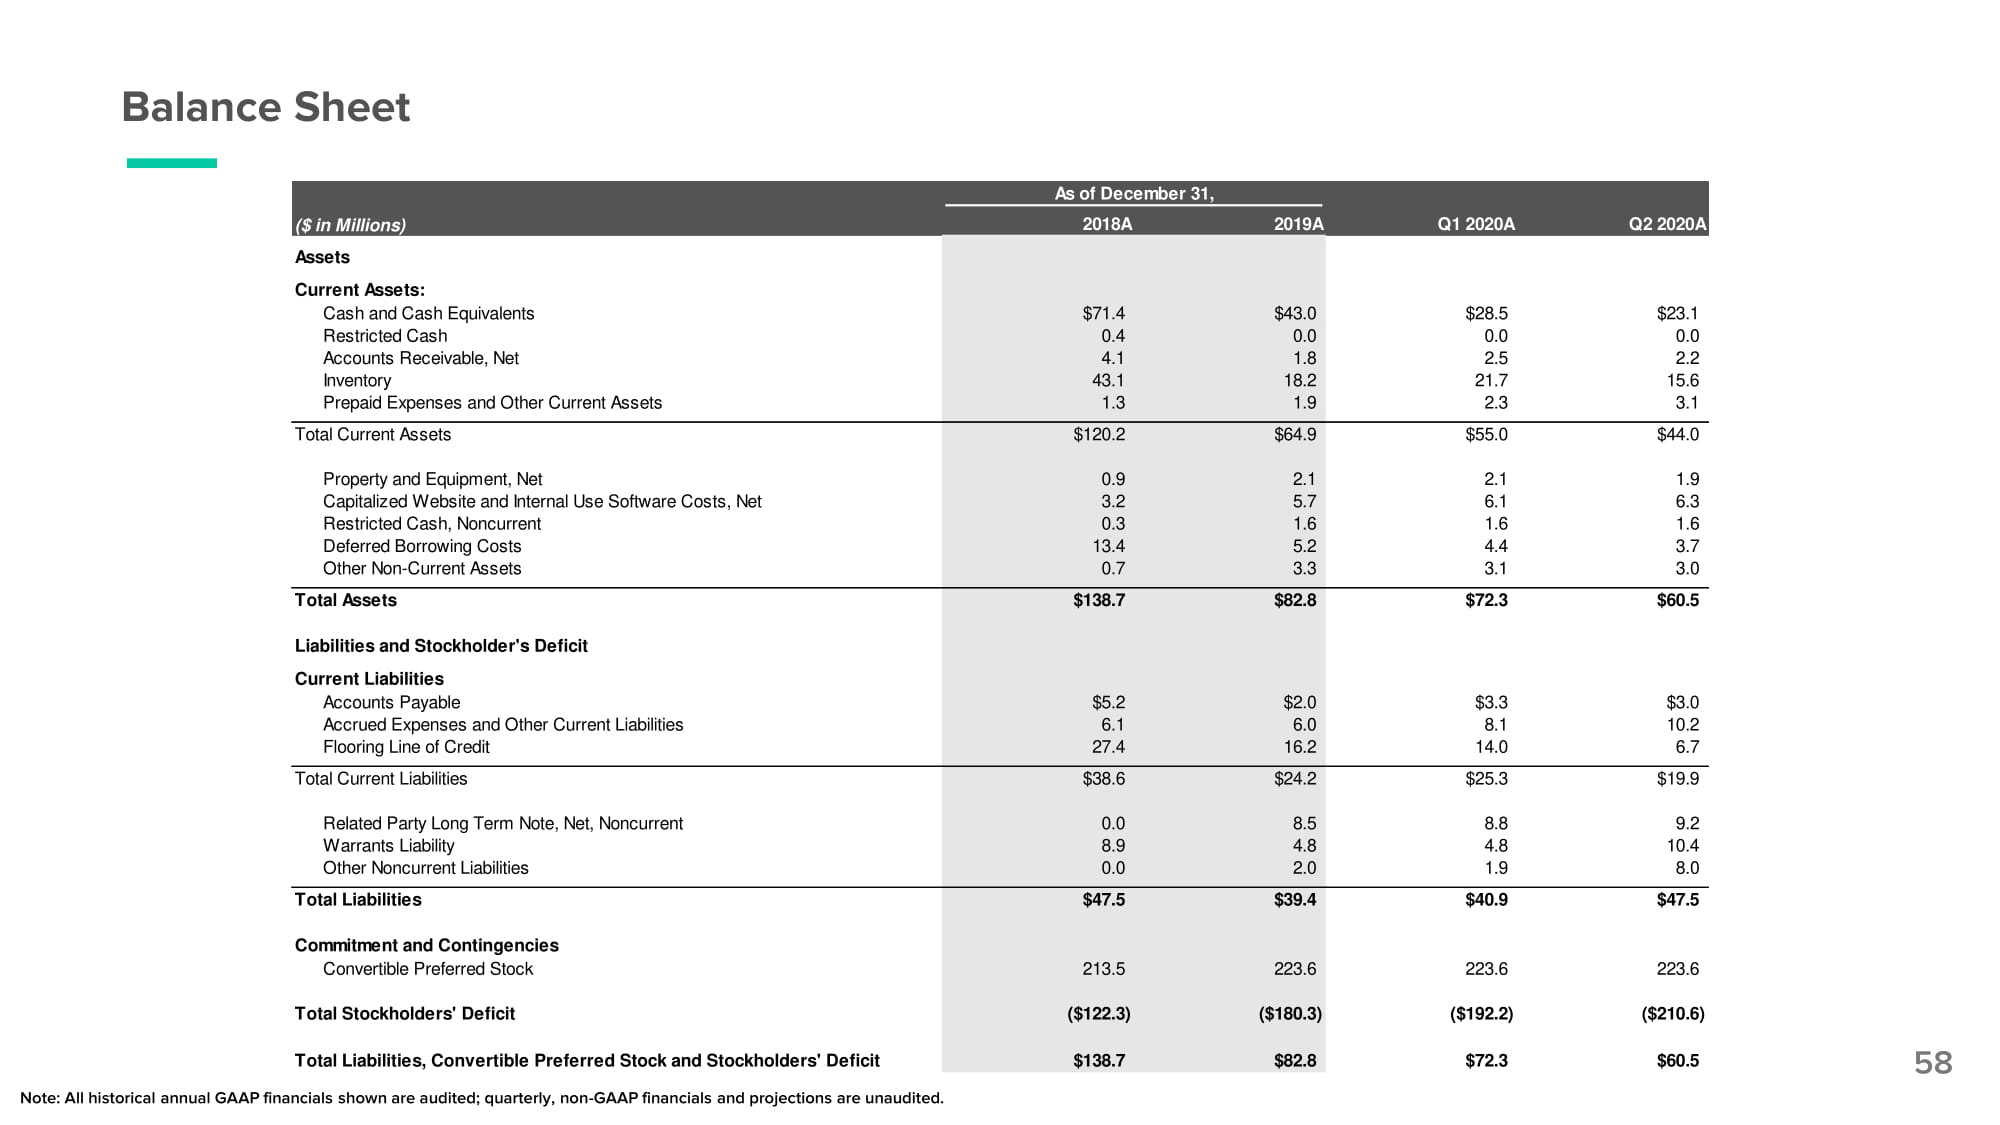
Balance Sheet 58 ($ in Millions) As of December 31, 2018A 2019A Q1 2020A Q2 2020A Assets Current Assets: Cash and Cash Equivalents $71 . 4 $43 . 0 $28 . 5 $23 . 1 Restricted Cash 0 . 4 0 . 0 0 . 0 0 . 0 Accounts Receivable, Net 4 . 1 1 . 8 2 . 5 2 . 2 Inventory 43 . 1 18 . 2 21 . 7 15 . 6 Prepaid Expenses and Other Current Assets 1 . 3 1 . 9 2 . 3 3 . 1 Total Current Assets $120 . 2 $64 . 9 $55 . 0 $44 . 0 Property and Equipment, Net 0 . 9 2 . 1 2 . 1 1 . 9 Capitalized Website and Internal Use Software Costs, Net 3 . 2 5 . 7 6 . 1 6 . 3 Restricted Cash, Noncurrent 0 . 3 1 . 6 1 . 6 1 . 6 Deferred Borrowing Costs 13 . 4 5 . 2 4 . 4 3 . 7 Other Non - Current Assets 0 . 7 3 . 3 3 . 1 3 . 0 Total Assets $138 . 7 $82 . 8 $72 . 3 $60 . 5 Liabilities and Stockholder's Deficit Current Liabilities Accounts Payable $5 . 2 $2 . 0 $3 . 3 $3 . 0 Accrued Expenses and Other Current Liabilities 6 . 1 6 . 0 8 . 1 10 . 2 Flooring Line of Credit 27 . 4 16 . 2 14 . 0 6 . 7 Total Current Liabilities $38 . 6 $24 . 2 $25 . 3 $19 . 9 Related Party Long Term Note, Net, Noncurrent 0 . 0 8 . 5 8 . 8 9 . 2 Warrants Liability 8 . 9 4 . 8 4 . 8 10 . 4 Other Noncurrent Liabilities 0 . 0 2 . 0 1 . 9 8 . 0 Total Liabilities $47 . 5 $39 . 4 $40 . 9 $47 . 5 Commitment and Contingencies Convertible Preferred Stock 213 . 5 223 . 6 223 . 6 223 . 6 Total Stockholders' Deficit ( $122 . 3 ) ( $180 . 3 ) ( $192 . 2 ) ( $210 . 6 ) Total Liabilities, Convertible Preferred Stock and Stockholders' Deficit $138 . 7 $82 . 8 $72 . 3 $60 . 5 Note: All historical annual GAAP financials shown are audited; quarterly, non - GAAP financials and projections are unaudited.
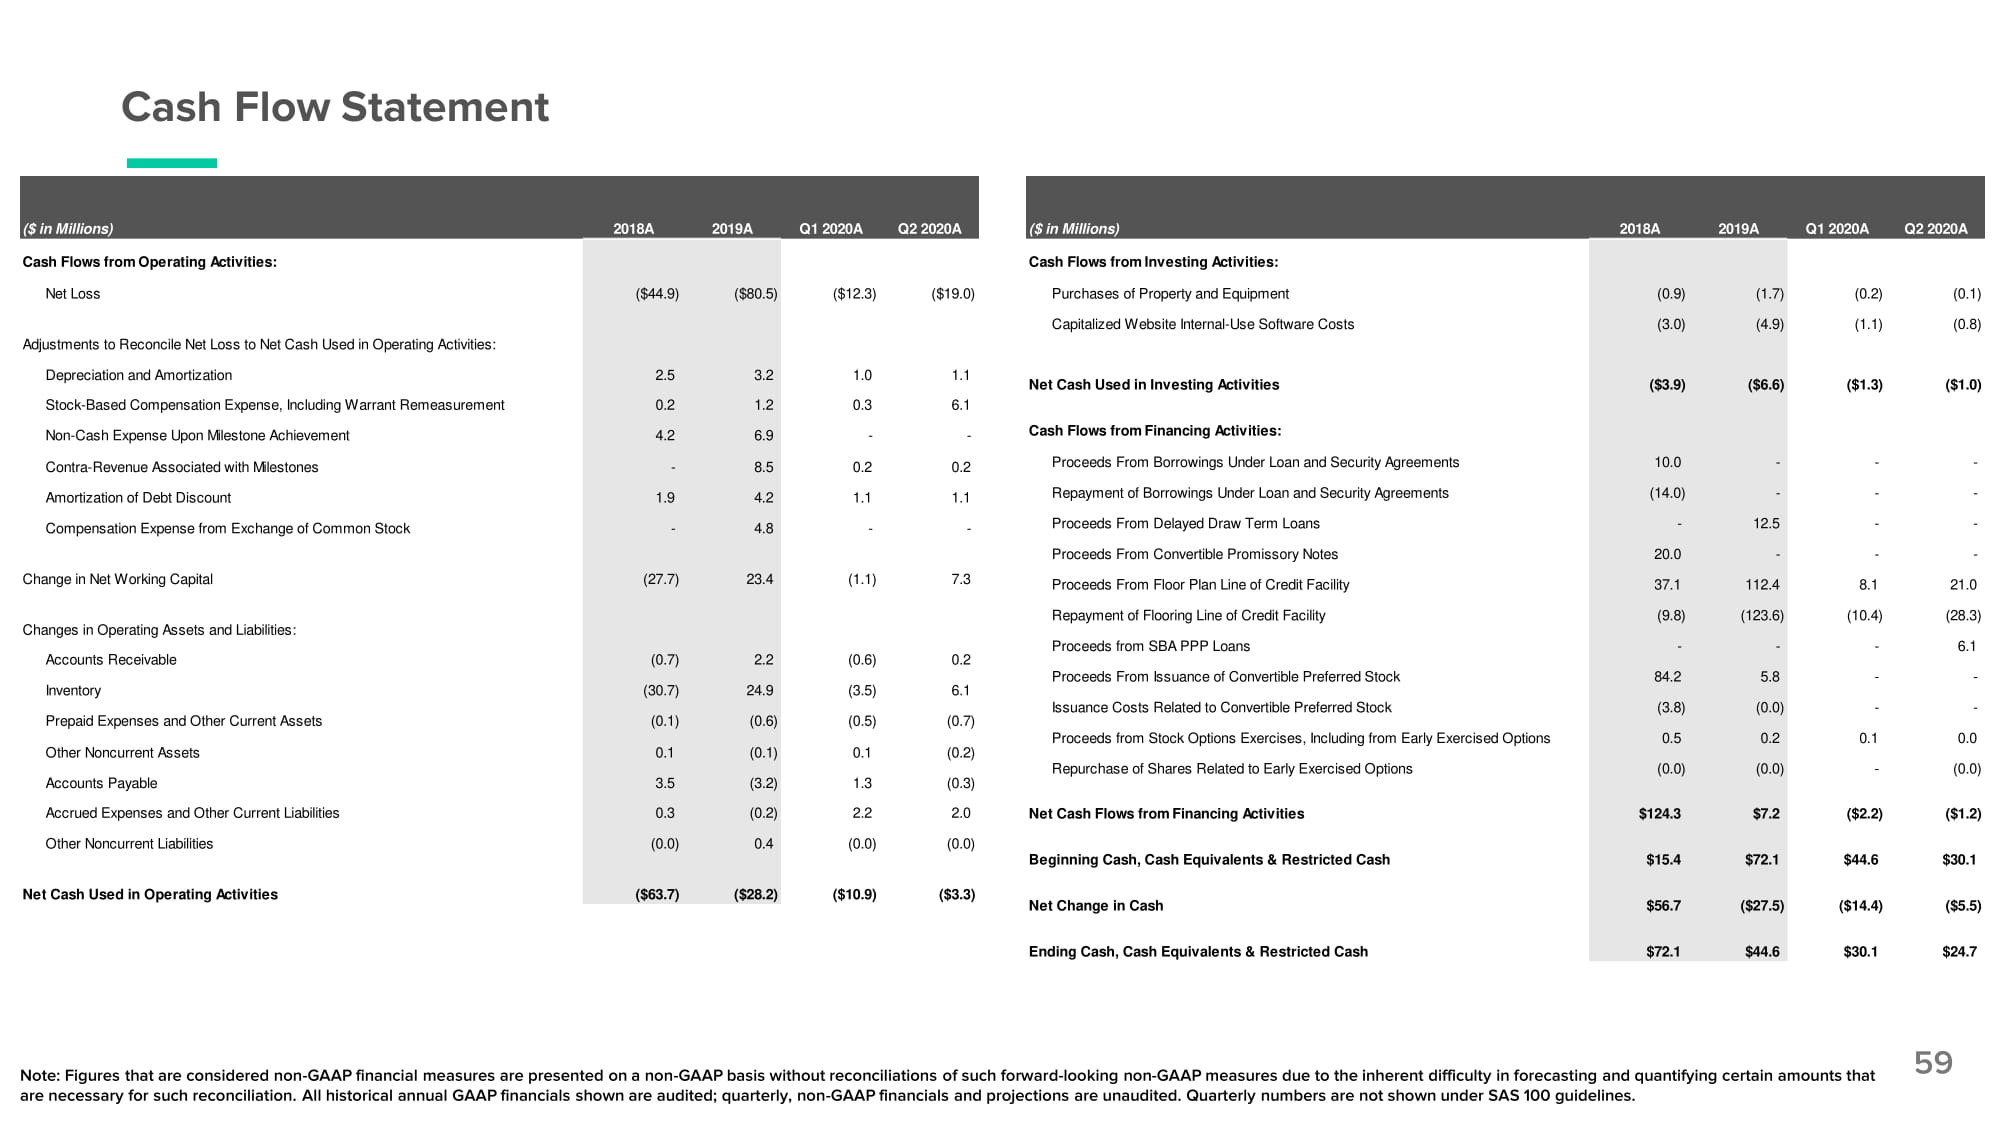
Cash Flow Statement 59 Cash Flows from Operating Activities: Net Loss ( $44 . 9 ) ( $80 . 5 ) ( $12 . 3 ) ( $19 . 0 ) Adjustments to Reconcile Net Loss to Net Cash Used in Operating Activities: Depreciation and Amortization Stock - Based Compensation Expense, Including Warrant Remeasurement 2 . 5 0 . 2 3 . 2 1 . 2 1 . 0 0 . 3 1 . 1 6 . 1 Non - Cash Expense Upon Milestone Achievement 4 . 2 6 . 9 - - - 1 . 9 0 . 2 1 . 1 0 . 2 1 . 1 Contra - Revenue Associated with Milestones Amortization of Debt Discount Compensation Expense from Exchange of Common Stock - 8 . 5 4 . 2 4 . 8 - - Note: Figures that are considered non - GAAP financial measures are presented on a non - GAAP basis without reconciliations of such forward - looking non - GAAP measures due to the inherent difficulty in forecasting and quantifying certain amounts that are necessary for such reconciliation. All historical annual GAAP financials shown are audited; quarterly, non - GAAP financials and projections are unaudited. Quarterly numbers are not shown under SAS 100 guidelines. ($ in Millions) 2018A 2019A Q1 2020A Q2 2020A Cash Flows from Investing Activities: Purchases of Property and Equipment ( 0 . 9 ) ( 1 . 7 ) ( 0 . 2 ) ( 0 . 1 ) Capitalized Website Internal - Use Software Costs ( 3 . 0 ) ( 4 . 9 ) ( 1 . 1 ) ( 0 . 8 ) Net Cash Used in Investing Activities ( $3 . 9 ) ( $6 . 6 ) ( $1 . 3 ) ( $1 . 0 ) Cash Flows from Financing Activities: Proceeds From Borrowings Under Loan and Security Agreements Repayment of Borrowings Under Loan and Security Agreements 10.0 ( 14 . 0 ) - - - - - - Proceeds From Delayed Draw Term Loans - 12 . 5 - - Proceeds From Convertible Promissory Notes 20 . 0 - - - (27.7) 23.4 (1.1) 7.3 Proceeds From Floor Plan Line of Credit Facility 37 . 1 112.4 8.1 21 . 0 Repayment of Flooring Line of Credit Facility ( 9 . 8 ) (123.6) (10.4) ( 28 . 3 ) (0.7) 2.2 (30.7) 24.9 (0.1) (0.6) 0.1 (0.1) 3.5 (3.2) (0.6) 0.2 (3.5) 6.1 (0.5) (0.7) 0.1 (0.2) 1.3 (0.3) Proceeds from SBA PPP Loans Proceeds From Issuance of Convertible Preferred Stock Issuance Costs Related to Convertible Preferred Stock Proceeds from Stock Options Exercises, Including from Early Exercised Repurchase of Shares Related to Early Exercised Options - - 84 . 2 5 . 8 ( 3 . 8 ) ( 0 . 0 ) O p t ion s 0 . 5 0 . 2 ( 0 . 0 ) ( 0 . 0 ) - 6 . 1 - - - - 0 . 1 0 . 0 - ( 0 . 0 ) Change in Net Working Capital Changes in Operating Assets and Liabilities: Accounts Receivable Inventory Prepaid Expenses and Other Current Assets Other Noncurrent Assets Accounts Payable Accrued Expenses and Other Current Liabilities 0.3 (0.2) 2.2 2.0 Net Cash Flows from Financing Activities $124 . 3 $7.2 ($2.2) ( $1 . 2 ) Other Noncurrent Liabilities (0.0) 0.4 (0.0) (0.0) Beginning Cash, Cash Equivalents & Restricted Cash $15 . 4 $72.1 $44.6 $30 . 1 Net Cash Used in Operating Activities ($63.7) ($28.2) ($10.9) ($3.3) Net Change in Cash $56 . 7 ($27.5) ($14.4) ( $5 . 5 ) Ending Cash, Cash Equivalents & Restricted Cash $72 . 1 $44.6 $30.1 $24 . 7 ($ in Millions) 2018A 2019A Q1 2020A Q2 2020A