UNITED STATES
SECURITIES AND EXCHANGE COMMISSION
Washington, D.C. 20549
FORM N-CSR
CERTIFIED SHAREHOLDER REPORT OF REGISTERED MANAGEMENT
INVESTMENT COMPANIES
Investment Company Act File Number 811-23410
FROST FAMILY OF FUNDS
(Exact name of registrant as specified in charter)
One Freedom Valley Drive
Oaks, PA 19456
(Address of Principal Executive Offices, Zip code)
Michael Beattie
c/o SEI Investments
One Freedom Valley Drive
Oaks, PA 19456
(Name and Address of Agent for Service)
Registrant’s telephone number, including area code: 1-877-713-7678
Date of fiscal year end: July 31, 2024
Date of reporting period: July 31, 2024
Item 1. Reports to Stockholders.
(a) A copy of the report transmitted to stockholders pursuant to Rule 30e-1 under the Investment Company Act of 1940, as amended (the “Act”) (17 CFR § 270.30e-1), is attached hereto.
Frost Family of Funds - Institutional Class Shares - FICEX
Annual Shareholder Report - July 31, 2024
This annual shareholder report contains important information about Institutional Class Shares of the Frost Growth Equity Fund (the "Fund") for the period from August 1, 2023 to July 31, 2024. You can find additional information about the Fund at https://frostinv.com/. You can also request this information by contacting us at 1-877-71-FROST.
What were the Fund costs for the last year?
(based on a hypothetical $10,000 investment)
| Fund Name | Costs of a $10,000 investment | Costs paid as a percentage of a $10,000 investment |
|---|
| Frost Growth Equity Fund, Institutional Class Shares | $76 | 0.67% |
How did the Fund perform in the last year?
For fiscal year 2024, the Frost Growth Equity Fund, Institutional Class posted a gain of 27.87%. Outperforming its benchmark, the Russell 1000 Growth Index, by 93 basis points, and its large growth peer group by 433 basis points. The Russell 1000 Growth Index remains more concentrated than the average Large Cap Growth Fund, often experiencing large relative swings based on a few (mega cap) stocks. Relative to our actively managed large growth peer group, the Fund ranked in the top quartile over the period.
Stock selection drove the Fund's performance, with consumer discretionary, communication services and health care as the top contributors, technology and industrials detracted the most. Sector allocation was an immaterial contributor.
In consumer discretionary, an underweight in Tesla and overweight in Amazon and Chipotle Mexican Grill were notable contributors. Tesla cut prices significantly to maintain volume targets, but vehicle sales have not recovered. What was formerly a 50% volume grower is struggling to stay flat. While we believe Tesla will remain a leader in electric vehicles, the stock looks expensive, and we maintain the position as a sizeable underweight in the Fund. Amazon was one of the top contributors driven by the uplift in tech stocks, profit and cash flow growth from cost management and interest in AI/data centers. Amazon was up almost 40% over the 12-month period.
In communication services, our investment in Spotify Technology was a solid contributor for the year. The stock benefitted from solid user growth, cost management, higher pricing and solidifying market leadership. Spotify, increasingly, controls its own destiny as its platform has grown and has branched out to podcasts and audiobooks. Revenue growth should be double digits for the next couple of years.
In health care, Eli Lilly, our top contributor for the year across sectors, rose 78% after a strong return last year. Lilly’s Mounjaro/Zepbound in diabesity is on pace to triple its revenues to more than $15 billion this year. More growth is expected before the end of the decade. Lilly has the most in-depth pipeline in diabesity with multiple follow-on molecules in the clinic currently. Lilly and Novo Nordisk will likely split this market, with a potential size in excess of $150 billion.
On the downside, relative performance in the technology sector was affected by an underweight in Broadcom and to a lesser extent, an underweight position in Apple. We believe Apple is one of the highest quality companies in the market and we have owned the stock for the past 15 years. However, we are underweight relative to the benchmark as we believe the valuation already reflects the quality and the growth prospects of the business. Software companies Microsoft and ServiceNow and the semiconductor company Advanced Micro Devices contributed positively to stock selection in the sector.
How did the fund perform during the last 10 years?
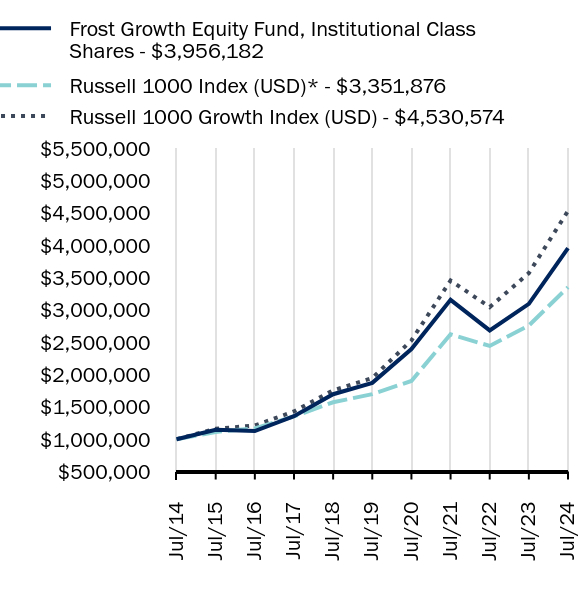
Total Return Based on $1,000,000 Investment
| Frost Growth Equity Fund, Institutional Class Shares - $3956182 | Russell 1000 Index (USD)* - $3351876 | Russell 1000 Growth Index (USD) - $4530574 |
|---|
| Jul/14 | $1000000 | $1000000 | $1000000 |
| Jul/15 | $1144533 | $1112351 | $1160821 |
| Jul/16 | $1124860 | $1166137 | $1211287 |
| Jul/17 | $1355878 | $1352137 | $1429944 |
| Jul/18 | $1695541 | $1571035 | $1756585 |
| Jul/19 | $1870940 | $1696725 | $1946708 |
| Jul/20 | $2393130 | $1900918 | $2527545 |
| Jul/21 | $3154861 | $2622618 | $3454593 |
| Jul/22 | $2682426 | $2442448 | $3042562 |
| Jul/23 | $3093990 | $2758701 | $3569204 |
| Jul/24 | $3956182 | $3351876 | $4530574 |
Average Annual Total Returns as of July 31, 2024
| Fund/Index Name | 1 Year | 5 Years | 10 Years |
|---|
| Frost Growth Equity Fund, Institutional Class Shares | 27.87% | 16.16% | 14.74% |
| Russell 1000 Index (USD)* | 21.50% | 14.59% | 12.86% |
| Russell 1000 Growth Index (USD) | 26.94% | 18.41% | 16.31% |
The line graph represents historical performance of a hypothetical investment of $1,000,000 in the Fund during the last 10 years. Returns shown are total returns, which assume the reinvestment of dividends and capital gains. The table and graph presented above do not reflect the deduction of taxes a shareholder would pay on Fund distributions or the redemption of Fund Shares. Past performance is not indicative of future performance.Call 1-877-71-FROST or visit https://frostinv.com/ for current month-end performance.
Footnote Reference*As of July 2024, pursuant to the new regulatory requirements, this index replaced the prior index as the Fund's primary benchmark to represent a broad-based securities market index.
Key Fund Statistics as of July 31, 2024
| Total Net Assets | Number of Holdings | Total Advisory Fees Paid | Portfolio Turnover Rate |
|---|
| $240,759,686 | 57 | $1,271,123 | 17% |
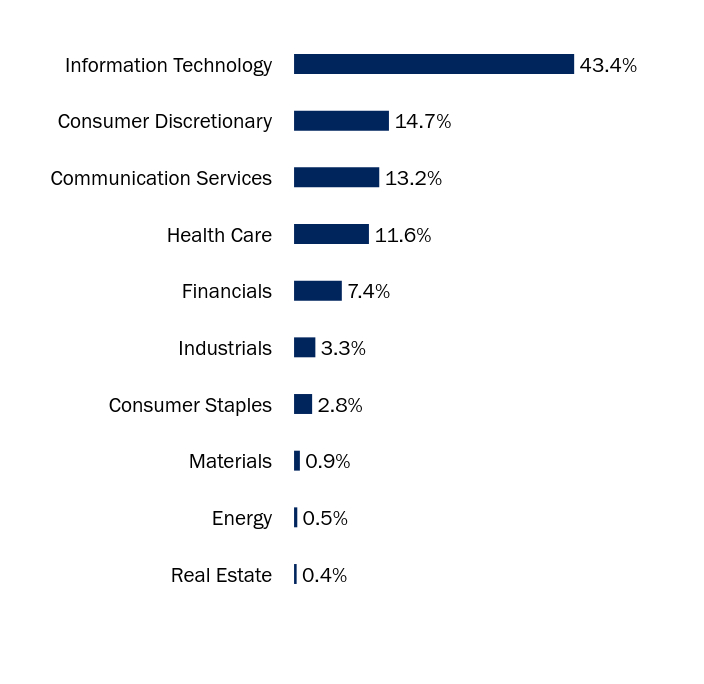
What did the Fund invest in?
Sector WeightingsFootnote Reference*
| Value | Value |
|---|
| Real Estate | 0.4% |
| Energy | 0.5% |
| Materials | 0.9% |
| Consumer Staples | 2.8% |
| Industrials | 3.3% |
| Financials | 7.4% |
| Health Care | 11.6% |
| Communication Services | 13.2% |
| Consumer Discretionary | 14.7% |
| Information Technology | 43.4% |
| Footnote | Description |
Footnote* | Percentages are calculated based on total net assets. |
| Holding Name | | | Percentage of Total Net Assets |
|---|
| Microsoft | | | 12.3% |
| NVIDIA | | | 10.2% |
| Apple | | | 8.6% |
| Amazon.com | | | 7.1% |
| Meta Platforms, Cl A | | | 3.9% |
| Alphabet, Cl A | | | 3.8% |
| Eli Lilly | | | 3.7% |
| Alphabet, Cl C | | | 3.3% |
| Visa, Cl A | | | 2.9% |
| Mastercard, Cl A | | | 2.6% |
There were no material changes during the reporting period.
Changes in and Disagreements with Accountants
There were no changes in or disagreements with accountants during the reporting period.
For additional information about the Fund; including its prospectus, financial information, holdings, and proxy voting information, visit or call:
1-877-71-FROST
https://frostinv.com/
Rule 30e-1 of the Investment Company Act of 1940 permits funds to transmit only one copy of a proxy statement, annual report or semi-annual report to shareholders (who need not be related) with the same residential, commercial or electronic address, provided that the shareholders have consented in writing and the reports are addressed either to each shareholder individually or to the shareholders as a group. This process is known as “householding” and is designed to reduce the duplicate copies of materials that shareholders receive and to lower printing and mailing costs for funds.
Frost Growth Equity Fund / Institutional Class Shares - FICEX
Annual Shareholder Report - July 31, 2024
FIA-AR-TSR-2024-5
Frost Family of Funds - Investor Class Shares - FACEX
Annual Shareholder Report - July 31, 2024
This annual shareholder report contains important information about Investor Class Shares of the Frost Growth Equity Fund (the "Fund") for the period from August 1, 2023 to July 31, 2024. You can find additional information about the Fund at https://frostinv.com/. You can also request this information by contacting us at 1-877-71-FROST.
What were the Fund costs for the last year?
(based on a hypothetical $10,000 investment)
| Fund Name | Costs of a $10,000 investment | Costs paid as a percentage of a $10,000 investment |
|---|
| Frost Growth Equity Fund, Investor Class Shares | $104 | 0.91% |
How did the Fund perform in the last year?
For fiscal year 2024, the Frost Growth Equity Fund, Investor Class posted a gain of 27.55%. Outperforming its benchmark, the Russell 1000 Growth Index, by 61 basis points, and its large growth peer group by 401 basis points. The Russell 1000 Growth Index remains more concentrated than the average Large Cap Growth Fund, often experiencing large relative swings based on a few (mega cap) stocks. Relative to our actively managed large growth peer group, the Fund ranked in the top quartile over the period.
Stock selection drove the Fund’s performance, with consumer discretionary, communication services and health care as the top contributors, technology and industrials detracted the most. Sector allocation was an immaterial contributor.
In consumer discretionary, an underweight in Tesla and overweight in Amazon and Chipotle Mexican Grill were notable contributors. Tesla cut prices significantly to maintain volume targets, but vehicle sales have not recovered. What was formerly a 50% volume grower is struggling to stay flat. While we believe Tesla will remain a leader in electric vehicles, the stock looks expensive, and we maintain the position as a sizeable underweight in the Fund. Amazon was one of the top contributors driven by the uplift in tech stocks, profit and cash flow growth from cost management and interest in AI/data centers. Amazon was up almost 40% over the 12-month period.
In communication services, our investment in Spotify Technology was a solid contributor for the year. The stock benefitted from solid user growth, cost management, higher pricing and solidifying market leadership. Spotify, increasingly, controls its own destiny as its platform has grown and has branched out to podcasts and audiobooks. Revenue growth should be double digits for the next couple of years.
In health care, Eli Lilly, our top contributor for the year across sectors, rose 78% after a strong return last year. Lilly’s Mounjaro/Zepbound in diabesity is on pace to triple its revenues to more than $15 billion this year. More growth is expected before the end of the decade. Lilly has the most in-depth pipeline in diabesity with multiple follow-on molecules in the clinic currently. Lilly and Novo Nordisk will likely split this market, with a potential size in excess of $150 billion.
On the downside, relative performance in the technology sector was affected by an underweight in Broadcom and to a lesser extent, an underweight position in Apple. We believe Apple is one of the highest quality companies in the market and we have owned the stock for the past 15 years. However, we are underweight relative to the benchmark as we believe the valuation already reflects the quality and the growth prospects of the business. Software companies Microsoft and ServiceNow and the semiconductor company Advanced Micro Devices contributed positively to stock selection in the sector.
How did the fund perform during the last 10 years?
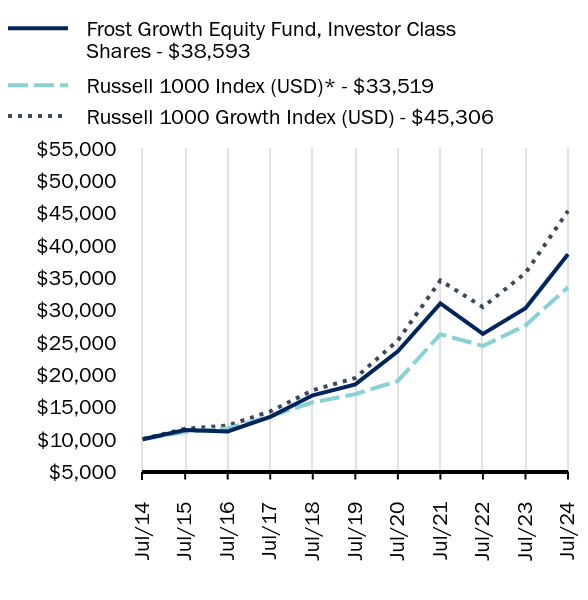
Total Return Based on $10,000 Investment
| Frost Growth Equity Fund, Investor Class Shares - $38593 | Russell 1000 Index (USD)* - $33519 | Russell 1000 Growth Index (USD) - $45306 |
|---|
| Jul/14 | $10000 | $10000 | $10000 |
| Jul/15 | $11417 | $11124 | $11608 |
| Jul/16 | $11188 | $11661 | $12113 |
| Jul/17 | $13462 | $13521 | $14299 |
| Jul/18 | $16789 | $15710 | $17566 |
| Jul/19 | $18476 | $16967 | $19467 |
| Jul/20 | $23579 | $19009 | $25275 |
| Jul/21 | $31010 | $26226 | $34546 |
| Jul/22 | $26285 | $24424 | $30426 |
| Jul/23 | $30256 | $27587 | $35692 |
| Jul/24 | $38593 | $33519 | $45306 |
Average Annual Total Returns as of July 31, 2024
| Fund/Index Name | 1 Year | 5 Years | 10 Years |
|---|
| Frost Growth Equity Fund, Investor Class Shares | 27.55% | 15.87% | 14.46% |
| Russell 1000 Index (USD)* | 21.50% | 14.59% | 12.86% |
| Russell 1000 Growth Index (USD) | 26.94% | 18.41% | 16.31% |
The line graph represents historical performance of a hypothetical investment of $10,000 in the Fund during the last 10 years. Returns shown are total returns, which assume the reinvestment of dividends and capital gains. The table and graph presented above do not reflect the deduction of taxes a shareholder would pay on Fund distributions or the redemption of Fund Shares. Past performance is not indicative of future performance.Call 1-877-71-FROST or visit https://frostinv.com/ for current month-end performance.
Footnote Reference*As of July 2024, pursuant to the new regulatory requirements, this index replaced the prior index as the Fund's primary benchmark to represent a broad-based securities market index.
Key Fund Statistics as of July 31, 2024
| Total Net Assets | Number of Holdings | Total Advisory Fees Paid | Portfolio Turnover Rate |
|---|
| $240,759,686 | 57 | $1,271,123 | 17% |
What did the Fund invest in?
Sector WeightingsFootnote Reference*
| Value | Value |
|---|
| Real Estate | 0.4% |
| Energy | 0.5% |
| Materials | 0.9% |
| Consumer Staples | 2.8% |
| Industrials | 3.3% |
| Financials | 7.4% |
| Health Care | 11.6% |
| Communication Services | 13.2% |
| Consumer Discretionary | 14.7% |
| Information Technology | 43.4% |
| Footnote | Description |
Footnote* | Percentages are calculated based on total net assets. |
| Holding Name | | | Percentage of Total Net Assets |
|---|
| Microsoft | | | 12.3% |
| NVIDIA | | | 10.2% |
| Apple | | | 8.6% |
| Amazon.com | | | 7.1% |
| Meta Platforms, Cl A | | | 3.9% |
| Alphabet, Cl A | | | 3.8% |
| Eli Lilly | | | 3.7% |
| Alphabet, Cl C | | | 3.3% |
| Visa, Cl A | | | 2.9% |
| Mastercard, Cl A | | | 2.6% |
There were no material changes during the reporting period.
Changes in and Disagreements with Accountants
There were no changes in or disagreements with accountants during the reporting period.
For additional information about the Fund; including its prospectus, financial information, holdings, and proxy voting information, visit or call:
1-877-71-FROST
https://frostinv.com/
Rule 30e-1 of the Investment Company Act of 1940 permits funds to transmit only one copy of a proxy statement, annual report or semi-annual report to shareholders (who need not be related) with the same residential, commercial or electronic address, provided that the shareholders have consented in writing and the reports are addressed either to each shareholder individually or to the shareholders as a group. This process is known as “householding” and is designed to reduce the duplicate copies of materials that shareholders receive and to lower printing and mailing costs for funds.
Frost Growth Equity Fund / Investor Class Shares - FACEX
Annual Shareholder Report - July 31, 2024
FIA-AR-TSR-2024-4
Frost Total Return Bond Fund
Frost Family of Funds - Institutional Class Shares - FIJEX
Annual Shareholder Report - July 31, 2024
This annual shareholder report contains important information about Institutional Class Shares of the Frost Total Return Bond Fund (the "Fund") for the period from August 1, 2023 to July 31, 2024. You can find additional information about the Fund at https://frostinv.com/. You can also request this information by contacting us at 1-877-71-FROST.
What were the Fund costs for the last year?
(based on a hypothetical $10,000 investment)
| Fund Name | Costs of a $10,000 investment | Costs paid as a percentage of a $10,000 investment |
|---|
| Frost Total Return Bond Fund, Institutional Class Shares | $49 | 0.46% |
How did the Fund perform in the last year?
• The Bloomberg U.S. Aggregate Bond Index (the AGG) returned 5.10% over the year. The Frost Total Return Bond Fund (Institutional Share Class) returned 11.34% for the same period, bettering the benchmark by over 6.0%.
• Broadly, the Fund obtained outperformance relative to its benchmark from each of the four primary decisions the portfolio team utilizes – interest rate decisions, credit risk allocations, asset sector allocations and security selection.
• The Fund maintained its effective duration – a measure of interest rate risk – between 3.20% and 5.40% with the lower end of the range early in the year and increasing steadily throughout the year and finishing close to the high end of the range at the end of July 2024.
• With the benchmark’s average duration approximately 6.25%, the Fund’s underweight duration allocation resulted in positive outperformance relative to the benchmark. The primary benefit to the Fund’s interest rate profile, compared to the index, was the rise in yields for maturities over ten years due to the yield curve inversion. The Fund was strategically positioned throughout the year to take advantage of further yield curve inversion. The allocation to credit resulted in outperformance relative to the index as the credit markets outperformed U.S. government sectors. Risk asset sectors generally benefited from economic and credit cycle performance. The Fund throughout the year was slightly overweight the below investment grade securities and underweight government securities.
• The Fund outperformed due to individual security selection across several sectors. Individual security selection was the largest positive attribution metric relative to the benchmark during the year.
• The Fund held an average allocation of 5% to energy over the year. This resulted in positive relative performance. Several of the Fund’s oil holdings saw significant outperformance. The Fund held underweight allocations to Treasury, corporate and RMBS sectors and overweight ABS, CMBS and CLOs. Each of these sector allocations aided the Fund’s relative performance to the benchmark, even before any consideration to security selection.
• The Fund’s average allocations during the year were 29% Treasurys, 21% corporates, 17% RMBS, 10% CLOs, 10% ABS, and 6% CMBS.
How did the fund perform during the last 10 years?
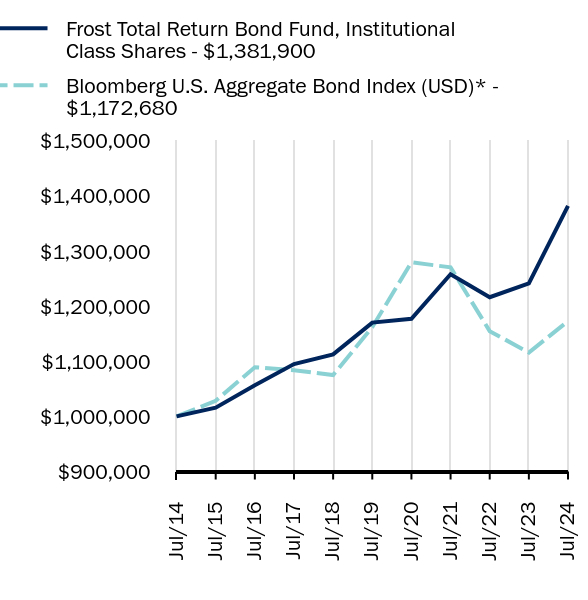
Total Return Based on $1,000,000 Investment
| Frost Total Return Bond Fund, Institutional Class Shares - $1381900 | Bloomberg U.S. Aggregate Bond Index (USD)* - $1172680 |
|---|
| Jul/14 | $1000000 | $1000000 |
| Jul/15 | $1015771 | $1028241 |
| Jul/16 | $1056573 | $1089267 |
| Jul/17 | $1094896 | $1083660 |
| Jul/18 | $1112464 | $1074990 |
| Jul/19 | $1170181 | $1161858 |
| Jul/20 | $1177173 | $1279452 |
| Jul/21 | $1257818 | $1270473 |
| Jul/22 | $1216266 | $1154652 |
| Jul/23 | $1241170 | $1115764 |
| Jul/24 | $1381900 | $1172680 |
Average Annual Total Returns as of July 31, 2024
| Fund/Index Name | 1 Year | 5 Years | 10 Years |
|---|
| Frost Total Return Bond Fund, Institutional Class Shares | 11.34% | 3.38% | 3.29% |
| Bloomberg U.S. Aggregate Bond Index (USD)* | 5.10% | 0.19% | 1.61% |
The line graph represents historical performance of a hypothetical investment of $1,000,000 in the Fund during the last 10 years. Returns shown are total returns, which assume the reinvestment of dividends and capital gains. The table and graph presented above do not reflect the deduction of taxes a shareholder would pay on Fund distributions or the redemption of Fund Shares. Past performance is not indicative of future performance.Call 1-877-71-FROST or visit https://frostinv.com/ for current month-end performance.
Footnote Reference*As of July 2024, pursuant to the new regulatory requirements, this index replaced the prior index as the Fund's primary benchmark to represent a broad-based securities market index.
Key Fund Statistics as of July 31, 2024
| Total Net Assets | Number of Holdings | Total Advisory Fees Paid | Portfolio Turnover Rate |
|---|
| $3,373,875,556 | 392 | $10,281,854 | 48% |
What did the Fund invest in?
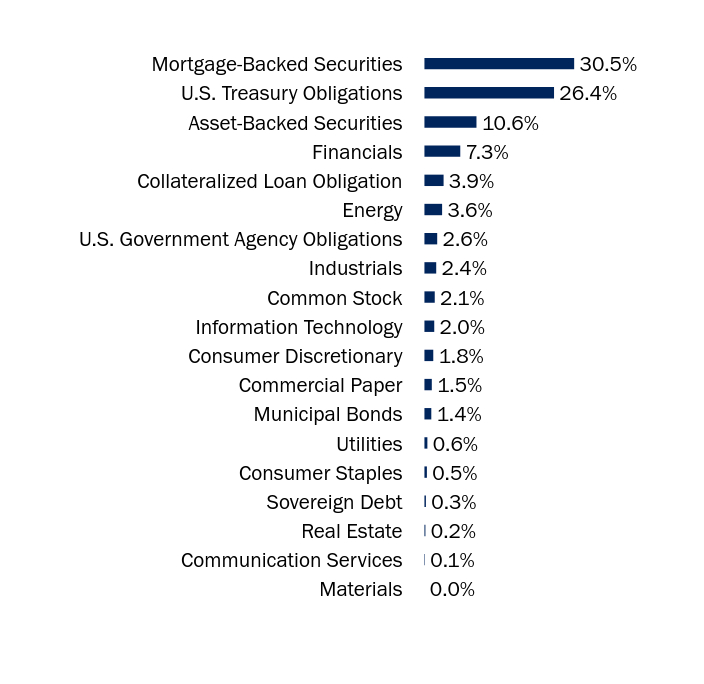
Asset WeightingsFootnote Reference*
| Value | Value |
|---|
| Materials | 0.0% |
| Communication Services | 0.1% |
| Real Estate | 0.2% |
| Sovereign Debt | 0.3% |
| Consumer Staples | 0.5% |
| Utilities | 0.6% |
| Municipal Bonds | 1.4% |
| Commercial Paper | 1.5% |
| Consumer Discretionary | 1.8% |
| Information Technology | 2.0% |
| Common Stock | 2.1% |
| Industrials | 2.4% |
| U.S. Government Agency Obligations | 2.6% |
| Energy | 3.6% |
| Collateralized Loan Obligation | 3.9% |
| Financials | 7.3% |
| Asset-Backed Securities | 10.6% |
| U.S. Treasury Obligations | 26.4% |
| Mortgage-Backed Securities | 30.5% |
| Footnote | Description |
Footnote* | Percentages are calculated based on total net assets. |
| Holding Name | Coupon Rate | Maturity Date | Percentage of Total Net Assets |
|---|
| U.S. Treasury Bonds | 4.375% | 08/15/43 | 4.9% |
| U.S. Treasury Bonds | 3.250% | 05/15/42 | 3.2% |
| FHLMC, Ser 2024-5417, Cl JA | 5.500% | 08/25/44 | 2.9% |
| FHLMC, Ser 2024-5425, Cl A | 5.500% | 09/25/44 | 2.6% |
| U.S. Treasury Bonds | 3.875% | 05/15/43 | 2.3% |
| U.S. Treasury Bonds | 4.000% | 11/15/42 | 2.3% |
| U.S. Treasury Notes | 4.125% | 09/30/27 | 2.2% |
| Paratus Energy Services | 0.000% | — | 2.1% |
| U.S. Treasury Notes | 3.875% | 08/15/33 | 2.0% |
| U.S. Treasury Bonds | 4.000% | 11/15/52 | 1.5% |
There were no material changes during the reporting period.
Changes in and Disagreements with Accountants
There were no changes in or disagreements with accountants during the reporting period.
For additional information about the Fund; including its prospectus, financial information, holdings, and proxy voting information, visit or call:
1-877-71-FROST
https://frostinv.com/
Rule 30e-1 of the Investment Company Act of 1940 permits funds to transmit only one copy of a proxy statement, annual report or semi-annual report to shareholders (who need not be related) with the same residential, commercial or electronic address, provided that the shareholders have consented in writing and the reports are addressed either to each shareholder individually or to the shareholders as a group. This process is known as “householding” and is designed to reduce the duplicate copies of materials that shareholders receive and to lower printing and mailing costs for funds.
Frost Total Return Bond Fund / Institutional Class Shares - FIJEX
Annual Shareholder Report - July 31, 2024
FIA-AR-TSR-2024-10
Frost Total Return Bond Fund
Frost Family of Funds - Investor Class Shares - FATRX
Annual Shareholder Report - July 31, 2024
This annual shareholder report contains important information about Investor Class Shares of the Frost Total Return Bond Fund (the "Fund") for the period from August 1, 2023 to July 31, 2024. You can find additional information about the Fund at https://frostinv.com/. You can also request this information by contacting us at 1-877-71-FROST.
What were the Fund costs for the last year?
(based on a hypothetical $10,000 investment)
| Fund Name | Costs of a $10,000 investment | Costs paid as a percentage of a $10,000 investment |
|---|
| Frost Total Return Bond Fund, Investor Class Shares | $75 | 0.71% |
How did the Fund perform in the last year?
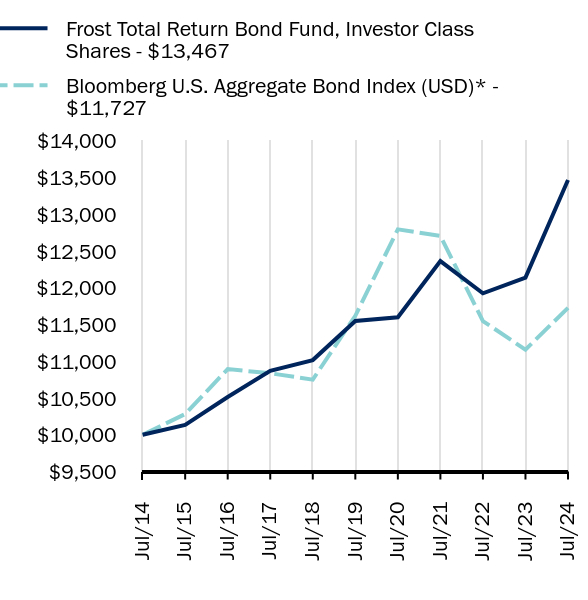
• The Bloomberg U.S. Aggregate Bond Index (the AGG) returned 5.10% over the year. The Frost Total Return Bond Fund (Investor Class Shares) returned 10.94% for the same period, bettering the benchmark by over 5.84%.
• Broadly, the Fund obtained outperformance relative to its benchmark from each of the four primary decisions the portfolio team utilizes – interest rate decisions, credit risk allocations, asset sector allocations and security selection.
• The Fund maintained its effective duration – a measure of interest rate risk – between 3.20% and 5.40% with the lower end of the range early in the year and increasing steadily throughout the year and finishing close to the high end of the range at the end of July 2024.
• With the benchmark’s average duration approximately 6.25%, the Fund’s underweight duration allocation resulted in positive outperformance relative to the benchmark. The primary benefit to the Fund’s interest rate profile, compared to the index, was the rise in yields for maturities over ten years due to the yield curve inversion. The Fund was strategically positioned throughout the year to take advantage of further yield curve inversion. The allocation to credit resulted in outperformance relative to the index as the credit markets outperformed U.S. government sectors. Risk asset sectors generally benefited from economic and credit cycle performance. The Fund throughout the year was slightly overweight the below investment grade securities and underweight government securities.
• The Fund outperformed due to individual security selection across several sectors. Individual security selection was the largest positive attribution metric relative to the benchmark during the year.
• The Fund held an average allocation of 5% to energy over the year. This resulted in positive relative performance. Several of the Fund’s oil holdings saw significant outperformance. The Fund held underweight allocations to Treasury, corporate and RMBS sectors and overweight ABS, CMBS and CLOs. Each of these sector allocations aided the Fund’s relative performance to the benchmark, even before any consideration to security selection.
• The Fund’s average allocations during the year were 29% Treasurys, 21% corporates, 17% RMBS, 10% CLOs, 10% ABS, and 6% CMBS.
How did the fund perform during the last 10 years?
Total Return Based on $10,000 Investment
| Frost Total Return Bond Fund, Investor Class Shares - $13467 | Bloomberg U.S. Aggregate Bond Index (USD)* - $11727 |
|---|
| Jul/14 | $10000 | $10000 |
| Jul/15 | $10133 | $10282 |
| Jul/16 | $10514 | $10893 |
| Jul/17 | $10869 | $10837 |
| Jul/18 | $11016 | $10750 |
| Jul/19 | $11548 | $11619 |
| Jul/20 | $11599 | $12795 |
| Jul/21 | $12363 | $12705 |
| Jul/22 | $11925 | $11547 |
| Jul/23 | $12139 | $11158 |
| Jul/24 | $13467 | $11727 |
Average Annual Total Returns as of July 31, 2024
| Fund/Index Name | 1 Year | 5 Years | 10 Years |
|---|
| Frost Total Return Bond Fund, Investor Class Shares | 10.94% | 3.12% | 3.02% |
| Bloomberg U.S. Aggregate Bond Index (USD)* | 5.10% | 0.19% | 1.61% |
The line graph represents historical performance of a hypothetical investment of $10,000 in the Fund during the last 10 years. Returns shown are total returns, which assume the reinvestment of dividends and capital gains. The table and graph presented above do not reflect the deduction of taxes a shareholder would pay on Fund distributions or the redemption of Fund Shares. Past performance is not indicative of future performance.Call 1-877-71-FROST or visit https://frostinv.com/ for current month-end performance.
Footnote Reference*As of July 2024, pursuant to the new regulatory requirements, this index replaced the prior index as the Fund's primary benchmark to represent a broad-based securities market index.
Key Fund Statistics as of July 31, 2024
| Total Net Assets | Number of Holdings | Total Advisory Fees Paid | Portfolio Turnover Rate |
|---|
| $3,373,875,556 | 392 | $10,281,854 | 48% |
What did the Fund invest in?
Asset WeightingsFootnote Reference*
| Value | Value |
|---|
| Materials | 0.0% |
| Communication Services | 0.1% |
| Real Estate | 0.2% |
| Sovereign Debt | 0.3% |
| Consumer Staples | 0.5% |
| Utilities | 0.6% |
| Municipal Bonds | 1.4% |
| Commercial Paper | 1.5% |
| Consumer Discretionary | 1.8% |
| Information Technology | 2.0% |
| Common Stock | 2.1% |
| Industrials | 2.4% |
| U.S. Government Agency Obligations | 2.6% |
| Energy | 3.6% |
| Collateralized Loan Obligation | 3.9% |
| Financials | 7.3% |
| Asset-Backed Securities | 10.6% |
| U.S. Treasury Obligations | 26.4% |
| Mortgage-Backed Securities | 30.5% |
| Footnote | Description |
Footnote* | Percentages are calculated based on total net assets. |
| Holding Name | Coupon Rate | Maturity Date | Percentage of Total Net Assets |
|---|
| U.S. Treasury Bonds | 4.375% | 08/15/43 | 4.9% |
| U.S. Treasury Bonds | 3.250% | 05/15/42 | 3.2% |
| FHLMC, Ser 2024-5417, Cl JA | 5.500% | 08/25/44 | 2.9% |
| FHLMC, Ser 2024-5425, Cl A | 5.500% | 09/25/44 | 2.6% |
| U.S. Treasury Bonds | 3.875% | 05/15/43 | 2.3% |
| U.S. Treasury Bonds | 4.000% | 11/15/42 | 2.3% |
| U.S. Treasury Notes | 4.125% | 09/30/27 | 2.2% |
| Paratus Energy Services | 0.000% | — | 2.1% |
| U.S. Treasury Notes | 3.875% | 08/15/33 | 2.0% |
| U.S. Treasury Bonds | 4.000% | 11/15/52 | 1.5% |
There were no material changes during the reporting period.
Changes in and Disagreements with Accountants
There were no changes in or disagreements with accountants during the reporting period.
For additional information about the Fund; including its prospectus, financial information, holdings, and proxy voting information, visit or call:
1-877-71-FROST
https://frostinv.com/
Rule 30e-1 of the Investment Company Act of 1940 permits funds to transmit only one copy of a proxy statement, annual report or semi-annual report to shareholders (who need not be related) with the same residential, commercial or electronic address, provided that the shareholders have consented in writing and the reports are addressed either to each shareholder individually or to the shareholders as a group. This process is known as “householding” and is designed to reduce the duplicate copies of materials that shareholders receive and to lower printing and mailing costs for funds.
Frost Total Return Bond Fund / Investor Class Shares - FATRX
Annual Shareholder Report - July 31, 2024
FIA-AR-TSR-2024-8
Frost Total Return Bond Fund
Frost Family of Funds - A Class Shares - FAJEX
Annual Shareholder Report - July 31, 2024
This annual shareholder report contains important information about A Class Shares of the Frost Total Return Bond Fund (the "Fund") for the period from August 1, 2023 to July 31, 2024. You can find additional information about the Fund at https://frostinv.com/. You can also request this information by contacting us at 1-877-71-FROST.
What were the Fund costs for the last year?
(based on a hypothetical $10,000 investment)
| Fund Name | Costs of a $10,000 investment | Costs paid as a percentage of a $10,000 investment |
|---|
| Frost Total Return Bond Fund, A Class Shares | $85 | 0.81% |
How did the Fund perform in the last year?
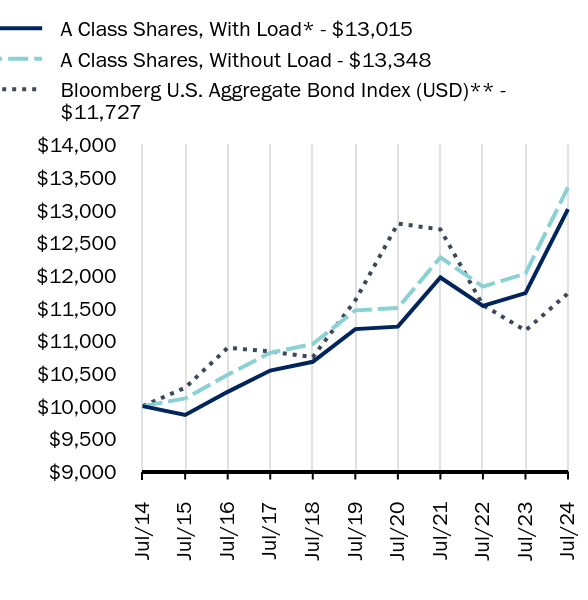
• The Bloomberg U.S. Aggregate Bond Index (the AGG) returned 5.10% over the year. The Frost Total Return Bond Fund (A Class Shares) returned 10.96% for the same period, bettering the benchmark by 5.86%.
• Broadly, the Fund obtained outperformance relative to its benchmark from each of the four primary decisions the portfolio team utilizes – interest rate decisions, credit risk allocations, asset sector allocations and security selection.
• The Fund maintained its effective duration – a measure of interest rate risk – between 3.20% and 5.40% with the lower end of the range early in the year and increasing steadily throughout the year and finishing close to the high end of the range at the end of July 2024.
• With the benchmark’s average duration approximately 6.25%, the Fund’s underweight duration allocation resulted in positive outperformance relative to the benchmark. The primary benefit to the Fund’s interest rate profile, compared to the index, was the rise in yields for maturities over ten years due to the yield curve inversion. The Fund was strategically positioned throughout the year to take advantage of further yield curve inversion.The allocation to credit resulted in outperformance relative to the index as the credit markets outperformed U.S. government sectors. Risk asset sectors generally benefited from economic and credit cycle performance. The Fund throughout the year was slightly overweight the below investment grade securities and underweight government securities.
• The Fund outperformed due to individual security selection across several sectors. Individual security selection was the largest positive attribution metric relative to the benchmark during the year.
• The Fund held an average allocation of 5% to energy over the year. This resulted in positive relative performance. Several of the Fund’s oil holdings saw significant outperformance. The Fund held underweight allocations to Treasury, corporate and RMBS sectors and overweight ABS, CMBS and CLOs. Each of these sector allocations aided the Fund’s relative performance to the benchmark, even before any consideration to security selection.
• The Fund’s average allocations during the year were 29% Treasurys, 21% corporates, 17% RMBS, 10% CLOs, 10% ABS, and 6% CMBS.
How did the fund perform during the last 10 years?
Total Return Based on $10,000 Investment
| A Class Shares, With Load* - $13015 | A Class Shares, Without Load - $13348 | Bloomberg U.S. Aggregate Bond Index (USD)** - $11727 |
|---|
| Jul/14 | $10000 | $10000 | $10000 |
| Jul/15 | $9865 | $10118 | $10282 |
| Jul/16 | $10219 | $10481 | $10893 |
| Jul/17 | $10545 | $10816 | $10837 |
| Jul/18 | $10679 | $10952 | $10750 |
| Jul/19 | $11179 | $11466 | $11619 |
| Jul/20 | $11217 | $11504 | $12795 |
| Jul/21 | $11969 | $12276 | $12705 |
| Jul/22 | $11534 | $11830 | $11547 |
| Jul/23 | $11730 | $12030 | $11158 |
| Jul/24 | $13015 | $13348 | $11727 |
Average Annual Total Returns as of July 31, 2024
| Fund/Index Name | 1 Year | 5 Years | 10 Years |
|---|
| Frost Total Return Bond Fund | | | |
| A Class Shares, With Load* | 8.18% | 2.56% | 2.67% |
| A Class Shares, Without Load | 10.96% | 3.09% | 2.93% |
| Bloomberg U.S. Aggregate Bond Index (USD)** | 5.10% | 0.19% | 1.61% |
The line graph represents historical performance of a hypothetical investment of $10,000 in the Fund during the last 10 years. Returns shown are total returns, which assume the reinvestment of dividends and capital gains. The table and graph presented above do not reflect the deduction of taxes a shareholder would pay on Fund distributions or the redemption of Fund Shares. Past performance is not indicative of future performance.Call 1-877-71-FROST or visit https://frostinv.com/ for current month-end performance.
Footnote Reference*Reflects Sales charge of 2.50%
Footnote Reference**As of July 2024, pursuant to the new regulatory requirements, this index replaced the prior index as the Fund's primary benchmark to represent a broad-based securities market index.
Key Fund Statistics as of July 31, 2024
| Total Net Assets | Number of Holdings | Total Advisory Fees Paid | Portfolio Turnover Rate |
|---|
| $3,373,875,556 | 392 | $10,281,854 | 48% |
What did the Fund invest in?
Asset WeightingsFootnote Reference*
| Value | Value |
|---|
| Materials | 0.0% |
| Communication Services | 0.1% |
| Real Estate | 0.2% |
| Sovereign Debt | 0.3% |
| Consumer Staples | 0.5% |
| Utilities | 0.6% |
| Municipal Bonds | 1.4% |
| Commercial Paper | 1.5% |
| Consumer Discretionary | 1.8% |
| Information Technology | 2.0% |
| Common Stock | 2.1% |
| Industrials | 2.4% |
| U.S. Government Agency Obligations | 2.6% |
| Energy | 3.6% |
| Collateralized Loan Obligation | 3.9% |
| Financials | 7.3% |
| Asset-Backed Securities | 10.6% |
| U.S. Treasury Obligations | 26.4% |
| Mortgage-Backed Securities | 30.5% |
| Footnote | Description |
Footnote* | Percentages are calculated based on total net assets. |
| Holding Name | Coupon Rate | Maturity Date | Percentage of Total Net Assets |
|---|
| U.S. Treasury Bonds | 4.375% | 08/15/43 | 4.9% |
| U.S. Treasury Bonds | 3.250% | 05/15/42 | 3.2% |
| FHLMC, Ser 2024-5417, Cl JA | 5.500% | 08/25/44 | 2.9% |
| FHLMC, Ser 2024-5425, Cl A | 5.500% | 09/25/44 | 2.6% |
| U.S. Treasury Bonds | 3.875% | 05/15/43 | 2.3% |
| U.S. Treasury Bonds | 4.000% | 11/15/42 | 2.3% |
| U.S. Treasury Notes | 4.125% | 09/30/27 | 2.2% |
| Paratus Energy Services | 0.000% | — | 2.1% |
| U.S. Treasury Notes | 3.875% | 08/15/33 | 2.0% |
| U.S. Treasury Bonds | 4.000% | 11/15/52 | 1.5% |
There were no material changes during the reporting period.
Changes in and Disagreements with Accountants
There were no changes in or disagreements with accountants during the reporting period.
For additional information about the Fund; including its prospectus, financial information, holdings, and proxy voting information, visit or call:
1-877-71-FROST
https://frostinv.com/
Rule 30e-1 of the Investment Company Act of 1940 permits funds to transmit only one copy of a proxy statement, annual report or semi-annual report to shareholders (who need not be related) with the same residential, commercial or electronic address, provided that the shareholders have consented in writing and the reports are addressed either to each shareholder individually or to the shareholders as a group. This process is known as “householding” and is designed to reduce the duplicate copies of materials that shareholders receive and to lower printing and mailing costs for funds.
Frost Total Return Bond Fund / A Class Shares - FAJEX
Annual Shareholder Report - July 31, 2024
FIA-AR-TSR-2024-9
Frost Family of Funds - Institutional Class Shares - FCFIX
Annual Shareholder Report - July 31, 2024
This annual shareholder report contains important information about Institutional Class Shares of the Frost Credit Fund (the "Fund") for the period from August 1, 2023 to July 31, 2024. You can find additional information about the Fund at https://frostinv.com/. You can also request this information by contacting us at 1-877-71-FROST.
What were the Fund costs for the last year?
(based on a hypothetical $10,000 investment)
| Fund Name | Costs of a $10,000 investment | Costs paid as a percentage of a $10,000 investment |
|---|
| Frost Credit Fund, Institutional Class Shares | $74 | 0.70% |
How did the Fund perform in the last year?
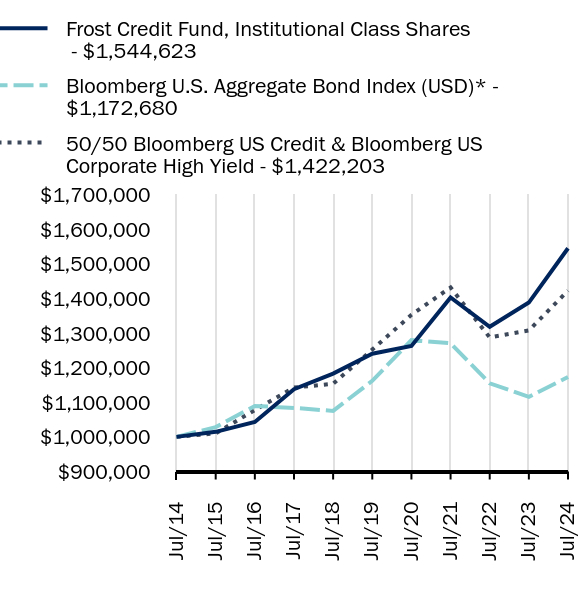
• The Fund’s hybrid benchmark (50% Bloomberg U.S. Credit Index/50% Bloomberg U.S. Corporate High Yield Index) returned 8.79% for the year. The Fund returned 11.30% over the same period (the Institutional Share Class), representing a 2.51% of outperformance.
• The Fund was underweight interest rate risk throughout the year by maintaining its overall effective duration less than that of the benchmark. However, the Fund was also positioned for an expectation of a steeper yield curve (i.e., increasing yields as bond maturities increase) as the year progressed.
• The Fund’s effective duration was between 2.50% and 3.50%, with the low end of the range occurring early in the year and the high end of the range closer to the end of the year. This is compared to the 5.0% effective duration of the benchmark.
• Overall, the Fund saw very little overall performance attribution relative to the benchmark due to its interest rate risk profile. Overall Treasury yields declined somewhat over the year (for example the five-year Treasury Note yield decreased 4.25% to 3.75% in the year) but the yield curve steepened marginally as yields for shorter maturities declined and longer maturities increased. The Fund saw slight underperformance due to the shift in the yield curve but a largely offsetting outperformance in the yield curve twisting steeper as expected. These two interest rate profiles largely offset one another leading to very little performance attribution (positive or negative) for the Fund relative to the benchmark for the full year.
• The Fund was overweight the securitized market sectors (ABS, CMBS and CLOs) and underweight the investment-grade and high-yield corporate sector. These allocation positions resulted in relative outperformance as all three sectors delivered total returns over 12.0% in the year. The CLO sector delivered the best returns with almost 14.0% returns.
• The Fund was underweight credit risk such as high-yield sector, resulting in slight relative underperformance. Riskier sectors such as high yield outperformed during the year.
• The Fund slightly outperformed due to positive security selection. The Fund obtained slightly less than 1.0% of relative outperformance in the year based on security selection.
How did the fund perform during the last 10 years?
Total Return Based on $1,000,000 Investment
| Frost Credit Fund, Institutional Class Shares - $1544623 | Bloomberg U.S. Aggregate Bond Index (USD)* - $1172680 | 50/50 Bloomberg US Credit & Bloomberg US Corporate High Yield - $1422203 |
|---|
| Jul/14 | $1000000 | $1000000 | $1000000 |
| Jul/15 | $1014536 | $1028241 | $1010179 |
| Jul/16 | $1042848 | $1089267 | $1077583 |
| Jul/17 | $1137533 | $1083660 | $1142341 |
| Jul/18 | $1182571 | $1074990 | $1153392 |
| Jul/19 | $1240253 | $1161858 | $1252023 |
| Jul/20 | $1262413 | $1279452 | $1352360 |
| Jul/21 | $1402749 | $1270473 | $1431346 |
| Jul/22 | $1317850 | $1154652 | $1287269 |
| Jul/23 | $1387813 | $1115764 | $1307295 |
| Jul/24 | $1544623 | $1172680 | $1422203 |
Average Annual Total Returns as of July 31, 2024
| Fund/Index Name | 1 Year | 5 Years | 10 Years |
|---|
| Frost Credit Fund, Institutional Class Shares | 11.30% | 4.49% | 4.44% |
| Bloomberg U.S. Aggregate Bond Index (USD)* | 5.10% | 0.19% | 1.61% |
| 50/50 Bloomberg US Credit & Bloomberg US Corporate High Yield | 8.79% | 2.58% | 3.58% |
The line graph represents historical performance of a hypothetical investment of $1,000,000 in the Fund during the last 10 years. Returns shown are total returns, which assume the reinvestment of dividends and capital gains. The table and graph presented above do not reflect the deduction of taxes a shareholder would pay on Fund distributions or the redemption of Fund Shares. Past performance is not indicative of future performance.Call 1-877-71-FROST or visit https://frostinv.com/ for current month-end performance.
Footnote Reference*As of July 2024, pursuant to the new regulatory requirements, this index replaced the prior index as the Fund's primary benchmark to represent a broad-based securities market index.
Key Fund Statistics as of July 31, 2024
| Total Net Assets | Number of Holdings | Total Advisory Fees Paid | Portfolio Turnover Rate |
|---|
| $317,464,023 | 177 | $1,032,438 | 26% |
What did the Fund invest in?
Asset WeightingsFootnote Reference*
| Value | Value |
|---|
| Materials | 0.2% |
| Utilities | 1.2% |
| Real Estate | 1.6% |
| Consumer Staples | 2.7% |
| Communication Services | 3.6% |
| Information Technology | 3.8% |
| Commercial Paper | 5.4% |
| Energy | 5.4% |
| Mortgage-Backed Securities | 6.3% |
| Financials | 8.1% |
| Consumer Discretionary | 9.1% |
| Industrials | 11.0% |
| Collateralized Loan Obligation | 15.8% |
| Asset-Backed Securities | 19.9% |
| Footnote | Description |
Footnote* | Percentages are calculated based on total net assets. |
| Holding Name | Coupon Rate | Maturity Date | Percentage of Total Net Assets |
|---|
| Apidos CLO XL, Ser 2024-40A, Cl CR, TSFR3M + 1.950% | 7.235% | 07/15/37 | 1.6% |
| GoldenTree Loan Management US CLO 14, Ser 2024-14A, Cl CR, TSFR3M + 1.900% | 7.182% | 07/20/37 | 1.6% |
| Battalion CLO 17, Ser 2024-17A, Cl CR, TSFR3M + 2.250% | 7.532% | 03/09/34 | 1.6% |
| Burlington Northern Santa Fe | 5.500% | 03/15/55 | 1.3% |
| Cruise Yacht Upper HoldCo | 11.875% | 07/05/28 | 1.3% |
| Brundage-Bone Concrete Pumping Holdings | 6.000% | 02/01/26 | 1.3% |
| Concentrix | 6.850% | 08/02/33 | 1.3% |
| Race Point IX, Ser 2017-9A, Cl BR, TSFR3M + 2.412% | 7.713% | 10/15/30 | 1.3% |
| Kyndryl Holdings | 4.100% | 10/15/41 | 1.2% |
| Aircastle | 5.750% | 10/01/31 | 1.1% |
There were no material changes during the reporting period.
Changes in and Disagreements with Accountants
There were no changes in or disagreements with accountants during the reporting period.
For additional information about the Fund; including its prospectus, financial information, holdings, and proxy voting information, visit or call:
1-877-71-FROST
https://frostinv.com/
Rule 30e-1 of the Investment Company Act of 1940 permits funds to transmit only one copy of a proxy statement, annual report or semi-annual report to shareholders (who need not be related) with the same residential, commercial or electronic address, provided that the shareholders have consented in writing and the reports are addressed either to each shareholder individually or to the shareholders as a group. This process is known as “householding” and is designed to reduce the duplicate copies of materials that shareholders receive and to lower printing and mailing costs for funds.
Frost Credit Fund / Institutional Class Shares - FCFIX
Annual Shareholder Report - July 31, 2024
FIA-AR-TSR-2024-1
Frost Family of Funds - Investor Class Shares - FCFAX
Annual Shareholder Report - July 31, 2024
This annual shareholder report contains important information about Investor Class Shares of the Frost Credit Fund (the "Fund") for the period from August 1, 2023 to July 31, 2024. You can find additional information about the Fund at https://frostinv.com/. You can also request this information by contacting us at 1-877-71-FROST.
What were the Fund costs for the last year?
(based on a hypothetical $10,000 investment)
| Fund Name | Costs of a $10,000 investment | Costs paid as a percentage of a $10,000 investment |
|---|
| Frost Credit Fund, Investor Class Shares | $100 | 0.95% |
How did the Fund perform in the last year?
• The Fund’s hybrid benchmark (50% Bloomberg U.S. Credit Index/50% Bloomberg U.S. Corporate High Yield Index) returned 8.79% for the year. The Fund returned 11.05% over the same period (the Investor Share Class), representing a 2.27% of outperformance.
• The Fund was underweight interest rate risk throughout the year by maintaining its overall effective duration less than that of the benchmark. However, the Fund was also positioned for an expectation of a steeper yield curve (i.e., increasing yields as bond maturities increase) as the year progressed.
• The Fund’s effective duration was between 2.50% and 3.50%, with the low end of the range occurring early in the year and the high end of the range closer to the end of the year. This is compared to the 5.0% effective duration of the benchmark.
• Overall, the Fund saw very little overall performance attribution relative to the benchmark due to its interest rate risk profile. Overall Treasury yields declined somewhat over the year (for example the five-year Treasury Note yield decreased 4.25% to 3.75% in the year) but the yield curve steepened marginally as yields for shorter maturities declined and longer maturities increased. The Fund saw slight underperformance due to the shift in the yield curve but a largely offsetting outperformance in the yield curve twisting steeper as expected. These two interest rate profiles largely offset one another leading to very little performance attribution (positive or negative) for the Fund relative to the benchmark for the full year.
• The Fund was overweight the securitized market sectors (ABS, CMBS and CLOs) and underweight the investment-grade and high-yield corporate sector. These allocation positions resulted in relative outperformance as all three sectors delivered total returns over 12.0% in the year. The CLO sector delivered the best returns with almost 14.0% returns.
• The Fund was underweight credit risk such as high-yield sector, resulting in slight relative underperformance. Riskier sectors such as high yield outperformed during the year.
• The Fund slightly outperformed due to positive security selection. The Fund obtained slightly less than 1.0% of relative outperformance in the year based on security selection.
How did the fund perform during the last 10 years?
Total Return Based on $10,000 Investment
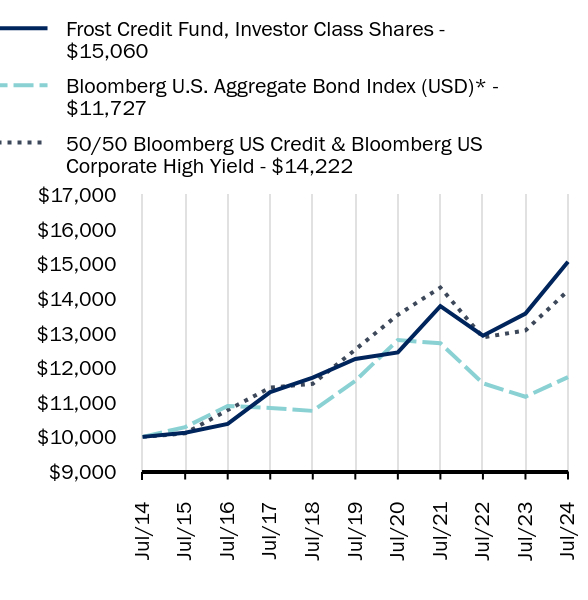
| Frost Credit Fund, Investor Class Shares - $15060 | Bloomberg U.S. Aggregate Bond Index (USD)* - $11727 | 50/50 Bloomberg US Credit & Bloomberg US Corporate High Yield - $14222 |
|---|
| Jul/14 | $10000 | $10000 | $10000 |
| Jul/15 | $10119 | $10282 | $10102 |
| Jul/16 | $10376 | $10893 | $10776 |
| Jul/17 | $11292 | $10837 | $11423 |
| Jul/18 | $11710 | $10750 | $11534 |
| Jul/19 | $12251 | $11619 | $12520 |
| Jul/20 | $12439 | $12795 | $13524 |
| Jul/21 | $13775 | $12705 | $14313 |
| Jul/22 | $12922 | $11547 | $12873 |
| Jul/23 | $13561 | $11158 | $13073 |
| Jul/24 | $15060 | $11727 | $14222 |
Average Annual Total Returns as of July 31, 2024
| Fund/Index Name | 1 Year | 5 Years | 10 Years |
|---|
| Frost Credit Fund, Investor Class Shares | 11.05% | 4.21% | 4.18% |
| Bloomberg U.S. Aggregate Bond Index (USD)* | 5.10% | 0.19% | 1.61% |
| 50/50 Bloomberg US Credit & Bloomberg US Corporate High Yield | 8.79% | 2.58% | 3.58% |
The line graph represents historical performance of a hypothetical investment of $10,000 in the Fund during the last 10 years. Returns shown are total returns, which assume the reinvestment of dividends and capital gains. The table and graph presented above do not reflect the deduction of taxes a shareholder would pay on Fund distributions or the redemption of Fund Shares. Past performance is not indicative of future performance.Call 1-877-71-FROST or visit https://frostinv.com/ for current month-end performance.
Footnote Reference*As of July 2024, pursuant to the new regulatory requirements, this index replaced the prior index as the Fund's primary benchmark to represent a broad-based securities market index.
Key Fund Statistics as of July 31, 2024
| Total Net Assets | Number of Holdings | Total Advisory Fees Paid | Portfolio Turnover Rate |
|---|
| $317,464,023 | 177 | $1,032,438 | 26% |
What did the Fund invest in?
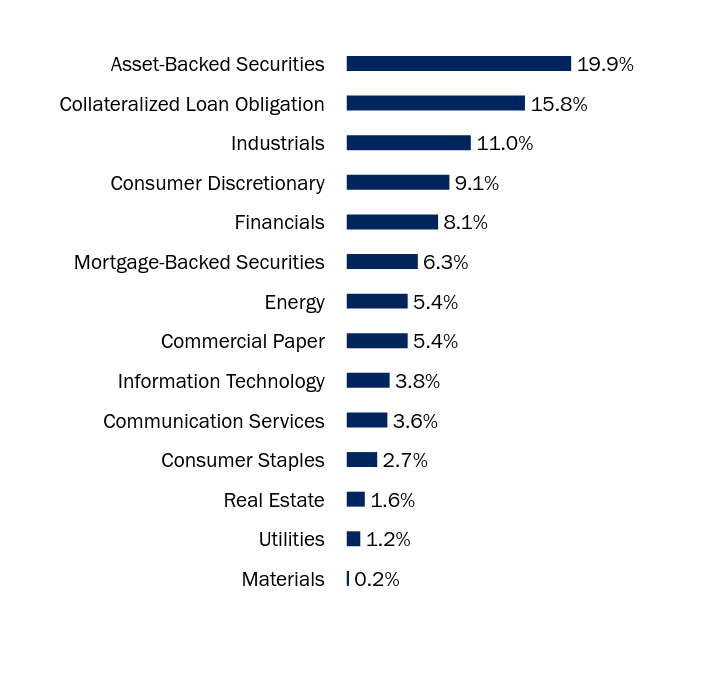
Asset WeightingsFootnote Reference*
| Value | Value |
|---|
| Materials | 0.2% |
| Utilities | 1.2% |
| Real Estate | 1.6% |
| Consumer Staples | 2.7% |
| Communication Services | 3.6% |
| Information Technology | 3.8% |
| Commercial Paper | 5.4% |
| Energy | 5.4% |
| Mortgage-Backed Securities | 6.3% |
| Financials | 8.1% |
| Consumer Discretionary | 9.1% |
| Industrials | 11.0% |
| Collateralized Loan Obligation | 15.8% |
| Asset-Backed Securities | 19.9% |
| Footnote | Description |
Footnote* | Percentages are calculated based on total net assets. |
| Holding Name | Coupon Rate | Maturity Date | Percentage of Total Net Assets |
|---|
| Apidos CLO XL, Ser 2024-40A, Cl CR, TSFR3M + 1.950% | 7.235% | 07/15/37 | 1.6% |
| GoldenTree Loan Management US CLO 14, Ser 2024-14A, Cl CR, TSFR3M + 1.900% | 7.182% | 07/20/37 | 1.6% |
| Battalion CLO 17, Ser 2024-17A, Cl CR, TSFR3M + 2.250% | 7.532% | 03/09/34 | 1.6% |
| Burlington Northern Santa Fe | 5.500% | 03/15/55 | 1.3% |
| Cruise Yacht Upper HoldCo | 11.875% | 07/05/28 | 1.3% |
| Brundage-Bone Concrete Pumping Holdings | 6.000% | 02/01/26 | 1.3% |
| Concentrix | 6.850% | 08/02/33 | 1.3% |
| Race Point IX, Ser 2017-9A, Cl BR, TSFR3M + 2.412% | 7.713% | 10/15/30 | 1.3% |
| Kyndryl Holdings | 4.100% | 10/15/41 | 1.2% |
| Aircastle | 5.750% | 10/01/31 | 1.1% |
There were no material changes during the reporting period.
Changes in and Disagreements with Accountants
There were no changes in or disagreements with accountants during the reporting period.
For additional information about the Fund; including its prospectus, financial information, holdings, and proxy voting information, visit or call:
1-877-71-FROST
https://frostinv.com/
Rule 30e-1 of the Investment Company Act of 1940 permits funds to transmit only one copy of a proxy statement, annual report or semi-annual report to shareholders (who need not be related) with the same residential, commercial or electronic address, provided that the shareholders have consented in writing and the reports are addressed either to each shareholder individually or to the shareholders as a group. This process is known as “householding” and is designed to reduce the duplicate copies of materials that shareholders receive and to lower printing and mailing costs for funds.
Frost Credit Fund / Investor Class Shares - FCFAX
Annual Shareholder Report - July 31, 2024
FIA-AR-TSR-2024-2
Frost Family of Funds - A Class Shares - FCFBX
Annual Shareholder Report - July 31, 2024
This annual shareholder report contains important information about A Class Shares of the Frost Credit Fund (the "Fund") for the period from August 1, 2023 to July 31, 2024. You can find additional information about the Fund at https://frostinv.com/. You can also request this information by contacting us at 1-877-71-FROST.
What were the Fund costs for the last year?
(based on a hypothetical $10,000 investment)
| Fund Name | Costs of a $10,000 investment | Costs paid as a percentage of a $10,000 investment |
|---|
| Frost Credit Fund, A Class Shares | $100 | 0.95% |
How did the Fund perform in the last year?
• The Fund’s hybrid benchmark (50% Bloomberg U.S. Credit Index/50% Bloomberg U.S. Corporate High Yield Index) returned 8.79% for the year. The Fund returned 10.94% over the same period (the A Share Class), representing a 2.15% of outperformance.
• The Fund was underweight interest rate risk throughout the year by maintaining its overall effective duration less than that of the benchmark. However, the Fund was also positioned for an expectation of a steeper yield curve (i.e., increasing yields as bond maturities increase) as the year progressed.
• The Fund’s effective duration was between 2.50% and 3.50%, with the low end of the range occurring early in the year and the high end of the range closer to the end of the year. This is compared to the 5.0% effective duration of the benchmark.
• Overall, the Fund saw very little overall performance attribution relative to the benchmark due to its interest rate risk profile. Overall Treasury yields declined somewhat over the year (for example the five-year Treasury Note yield decreased 4.25% to 3.75% in the year) but the yield curve steepened marginally as yields for shorter maturities declined and longer maturities increased. The Fund saw slight underperformance due to the shift in the yield curve but a largely offsetting outperformance in the yield curve twisting steeper as expected. These two interest rate profiles largely offset one another leading to very little performance attribution (positive or negative) for the Fund relative to the benchmark for the full year.
• The Fund was overweight the securitized market sectors (ABS, CMBS and CLOs) and underweight the investment-grade and high-yield corporate sector. These allocation positions resulted in relative outperformance as all three sectors delivered total returns over 12.0% in the year. The CLO sector delivered the best returns with almost 14.0% returns.
• The Fund was underweight credit risk such as high-yield sector, resulting in slight relative underperformance. Riskier sectors such as high yield outperformed during the year.
• The Fund slightly outperformed due to positive security selection. The Fund obtained slightly less than 1.0% of relative outperformance in the year based on security selection.
How did the fund perform during the last 10 years?
Total Return Based on $10,000 Investment
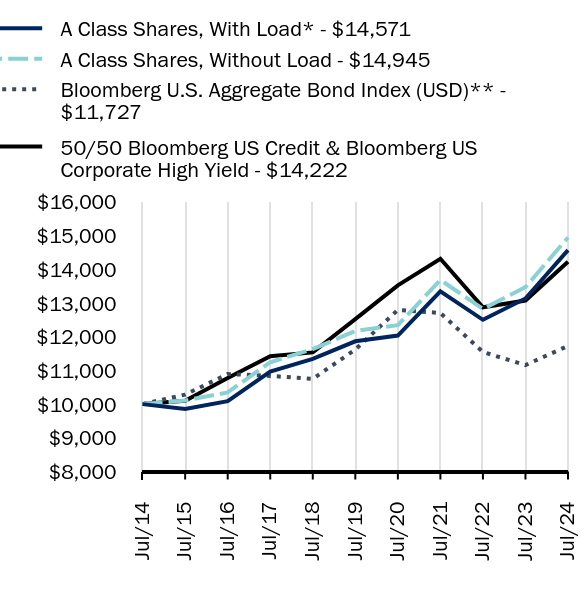
| A Class Shares, With Load* - $14571 | A Class Shares, Without Load - $14945 | Bloomberg U.S. Aggregate Bond Index (USD)** - $11727 | 50/50 Bloomberg US Credit & Bloomberg US Corporate High Yield - $14222 |
|---|
| Jul/14 | $10000 | $10000 | $10000 | $10000 |
| Jul/15 | $9855 | $10108 | $10282 | $10102 |
| Jul/16 | $10087 | $10346 | $10893 | $10776 |
| Jul/17 | $10962 | $11243 | $10837 | $11423 |
| Jul/18 | $11342 | $11633 | $10750 | $11534 |
| Jul/19 | $11864 | $12168 | $11619 | $12520 |
| Jul/20 | $12035 | $12343 | $12795 | $13524 |
| Jul/21 | $13343 | $13685 | $12705 | $14313 |
| Jul/22 | $12502 | $12823 | $11547 | $12873 |
| Jul/23 | $13135 | $13472 | $11158 | $13073 |
| Jul/24 | $14571 | $14945 | $11727 | $14222 |
Average Annual Total Returns as of July 31, 2024
| Fund/Index Name | 1 Year | 5 Years | 10 Years |
|---|
| Frost Credit Fund | | | |
| A Class Shares, With Load* | 8.18% | 3.67% | 3.84% |
| A Class Shares, Without Load | 10.94% | 4.20% | 4.10% |
| Bloomberg U.S. Aggregate Bond Index (USD)** | 5.10% | 0.19% | 1.61% |
| 50/50 Bloomberg US Credit & Bloomberg US Corporate High Yield | 8.79% | 2.58% | 3.58% |
The line graph represents historical performance of a hypothetical investment of $10,000 in the Fund during the last 10 years. Returns shown are total returns, which assume the reinvestment of dividends and capital gains. The table and graph presented above do not reflect the deduction of taxes a shareholder would pay on Fund distributions or the redemption of Fund Shares. Past performance is not indicative of future performance.Call 1-877-71-FROST or visit https://frostinv.com/ for current month-end performance.
Footnote Reference*Reflects Sales charge of 2.50%
Footnote Reference**As of July 2024, pursuant to the new regulatory requirements, this index replaced the prior index as the Fund's primary benchmark to represent a broad-based securities market index.
Key Fund Statistics as of July 31, 2024
| Total Net Assets | Number of Holdings | Total Advisory Fees Paid | Portfolio Turnover Rate |
|---|
| $317,464,023 | 177 | $1,032,438 | 26% |
What did the Fund invest in?
Asset WeightingsFootnote Reference*
| Value | Value |
|---|
| Materials | 0.2% |
| Utilities | 1.2% |
| Real Estate | 1.6% |
| Consumer Staples | 2.7% |
| Communication Services | 3.6% |
| Information Technology | 3.8% |
| Commercial Paper | 5.4% |
| Energy | 5.4% |
| Mortgage-Backed Securities | 6.3% |
| Financials | 8.1% |
| Consumer Discretionary | 9.1% |
| Industrials | 11.0% |
| Collateralized Loan Obligation | 15.8% |
| Asset-Backed Securities | 19.9% |
| Footnote | Description |
Footnote* | Percentages are calculated based on total net assets. |
| Holding Name | Coupon Rate | Maturity Date | Percentage of Total Net Assets |
|---|
| Apidos CLO XL, Ser 2024-40A, Cl CR, TSFR3M + 1.950% | 7.235% | 07/15/37 | 1.6% |
| GoldenTree Loan Management US CLO 14, Ser 2024-14A, Cl CR, TSFR3M + 1.900% | 7.182% | 07/20/37 | 1.6% |
| Battalion CLO 17, Ser 2024-17A, Cl CR, TSFR3M + 2.250% | 7.532% | 03/09/34 | 1.6% |
| Burlington Northern Santa Fe | 5.500% | 03/15/55 | 1.3% |
| Cruise Yacht Upper HoldCo | 11.875% | 07/05/28 | 1.3% |
| Brundage-Bone Concrete Pumping Holdings | 6.000% | 02/01/26 | 1.3% |
| Concentrix | 6.850% | 08/02/33 | 1.3% |
| Race Point IX, Ser 2017-9A, Cl BR, TSFR3M + 2.412% | 7.713% | 10/15/30 | 1.3% |
| Kyndryl Holdings | 4.100% | 10/15/41 | 1.2% |
| Aircastle | 5.750% | 10/01/31 | 1.1% |
There were no material changes during the reporting period.
Changes in and Disagreements with Accountants
There were no changes in or disagreements with accountants during the reporting period.
For additional information about the Fund; including its prospectus, financial information, holdings, and proxy voting information, visit or call:
1-877-71-FROST
https://frostinv.com/
Rule 30e-1 of the Investment Company Act of 1940 permits funds to transmit only one copy of a proxy statement, annual report or semi-annual report to shareholders (who need not be related) with the same residential, commercial or electronic address, provided that the shareholders have consented in writing and the reports are addressed either to each shareholder individually or to the shareholders as a group. This process is known as “householding” and is designed to reduce the duplicate copies of materials that shareholders receive and to lower printing and mailing costs for funds.
Frost Credit Fund / A Class Shares - FCFBX
Annual Shareholder Report - July 31, 2024
FIA-AR-TSR-2024-3
Frost Low Duration Bond Fund
Frost Family of Funds - Institutional Class Shares - FILDX
Annual Shareholder Report - July 31, 2024
This annual shareholder report contains important information about Institutional Class Shares of the Frost Low Duration Bond Fund (the "Fund") for the period from August 1, 2023 to July 31, 2024. You can find additional information about the Fund at https://frostinv.com/. You can also request this information by contacting us at 1-877-71-FROST.
What were the Fund costs for the last year?
(based on a hypothetical $10,000 investment)
| Fund Name | Costs of a $10,000 investment | Costs paid as a percentage of a $10,000 investment |
|---|
| Frost Low Duration Bond Fund, Institutional Class Shares | $47 | 0.45% |
How did the Fund perform in the last year?
• The Bloomberg U.S. Government Credit One to Five Year Bond Index returned 5.83% during the year that ended July 31, 2024. The Frost Low Duration Bond Fund (Institutional Share Class) returned 6.94% over the same period, outperformance of 1.10%.
• The Fund maintained an underweight allocation to interest rate risk, with an effective duration profile of between 2.0% and 2.40% compared to the benchmark’s average duration of approximately 2.65%.
• Short-term interest rates, while volatile, finished the year ever so slightly lower than where they began the year as the Federal Reserve largely made no significant changes to monetary policy and the US economy remained solid.
• In turn, the Fund saw little relative performance attribution (neither positive nor negative) from its interest rate profile compared to its benchmark.
• The Fund’s primary relative outperformance was positive sector allocations. The Fund held a meaningful overweight to the ABS sector (40%) and an underweight to the Treasury sector (26%). The ABS sector during the year meaningfully outperformed, before taking into account security selection, both the investment grade corporate and the Treasury sectors. The Treasury sector delivered the lowest aggregate returns as well. Overall, the Fund obtained approximately 1.0% of its outperformance relative to the benchmark from these sector allocation decisions.
• The Fund obtained approximately 0.25% of outperformance do to solid individual security selection in the year. Most of these results came in the Fund’s investment grade corporate sector.
How did the fund perform during the last 10 years?
Total Return Based on $1,000,000 Investment
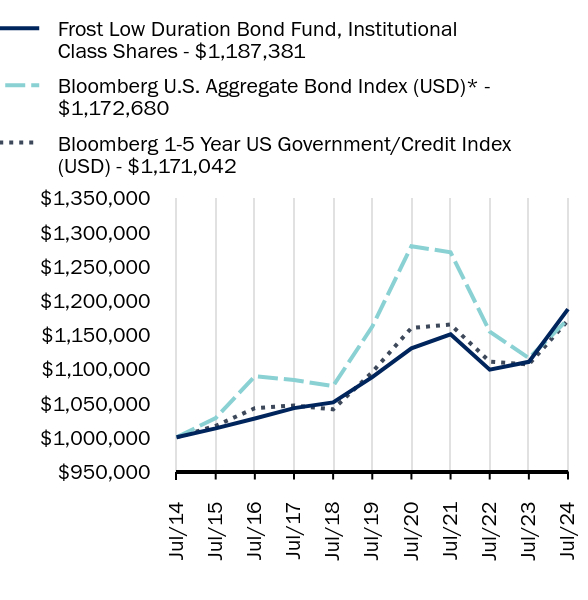
| Frost Low Duration Bond Fund, Institutional Class Shares - $1187381 | Bloomberg U.S. Aggregate Bond Index (USD)* - $1172680 | Bloomberg 1-5 Year US Government/Credit Index (USD) - $1171042 |
|---|
| Jul/14 | $1000000 | $1000000 | $1000000 |
| Jul/15 | $1013015 | $1028241 | $1016817 |
| Jul/16 | $1027478 | $1089267 | $1042602 |
| Jul/17 | $1042698 | $1083660 | $1046542 |
| Jul/18 | $1051007 | $1074990 | $1040877 |
| Jul/19 | $1088009 | $1161858 | $1095239 |
| Jul/20 | $1130030 | $1279452 | $1159926 |
| Jul/21 | $1150561 | $1270473 | $1164863 |
| Jul/22 | $1098858 | $1154652 | $1110767 |
| Jul/23 | $1110356 | $1115764 | $1106545 |
| Jul/24 | $1187381 | $1172680 | $1171042 |
Average Annual Total Returns as of July 31, 2024
| Fund/Index Name | 1 Year | 5 Years | 10 Years |
|---|
| Frost Low Duration Bond Fund, Institutional Class Shares | 6.94% | 1.76% | 1.73% |
| Bloomberg U.S. Aggregate Bond Index (USD)* | 5.10% | 0.19% | 1.61% |
| Bloomberg 1-5 Year US Government/Credit Index (USD) | 5.83% | 1.35% | 1.59% |
The line graph represents historical performance of a hypothetical investment of $1,000,000 in the Fund during the last 10 years. Returns shown are total returns, which assume the reinvestment of dividends and capital gains. The table and graph presented above do not reflect the deduction of taxes a shareholder would pay on Fund distributions or the redemption of Fund Shares. Past performance is not indicative of future performance.Call 1-877-71-FROST or visit https://frostinv.com/ for current month-end performance.
Footnote Reference*As of July 2024, pursuant to the new regulatory requirements, this index replaced the prior index as the Fund's primary benchmark to represent a broad-based securities market index.
Key Fund Statistics as of July 31, 2024
| Total Net Assets | Number of Holdings | Total Advisory Fees Paid | Portfolio Turnover Rate |
|---|
| $320,433,457 | 75 | $902,705 | 72% |
What did the Fund invest in?
Asset WeightingsFootnote Reference*
| Value | Value |
|---|
| Mortgage-Backed Securities | 0.7% |
| Communication Services | 0.9% |
| Real Estate | 0.9% |
| Consumer Discretionary | 1.2% |
| Commercial Paper | 1.9% |
| Information Technology | 3.8% |
| U.S. Government Agency Obligations | 4.3% |
| Industrials | 7.4% |
| Financials | 8.0% |
| U.S. Treasury Obligations | 31.4% |
| Asset-Backed Securities | 34.1% |
| Footnote | Description |
Footnote* | Percentages are calculated based on total net assets. |
| Holding Name | Coupon Rate | Maturity Date | Percentage of Total Net Assets |
|---|
| U.S. Treasury Notes | 4.000% | 01/31/29 | 14.1% |
| U.S. Treasury Notes | 4.375% | 11/30/28 | 7.9% |
| U.S. Treasury Notes | 4.000% | 02/29/28 | 7.8% |
| Molex Electronic Technologies | 3.900% | 04/15/25 | 3.1% |
| Verizon Master Trust, Ser 2023-4, Cl C | 5.650% | 06/20/29 | 3.1% |
| Fifth Third Bancorp, SOFRINDX + 2.192% | 6.361% | 10/27/28 | 2.6% |
| Prestige Auto Receivables Trust, Ser 2023-1A, Cl B | 5.550% | 04/15/27 | 2.5% |
| Kyndryl Holdings | 2.050% | 10/15/26 | 2.3% |
| Westlake Automobile Receivables Trust, Ser 2022-3A, Cl D | 6.680% | 04/17/28 | 2.2% |
| Charles Schwab, SOFRRATE + 2.210% | 5.643% | 05/19/29 | 1.6% |
There were no material changes during the reporting period.
Changes in and Disagreements with Accountants
There were no changes in or disagreements with accountants during the reporting period.
For additional information about the Fund; including its prospectus, financial information, holdings, and proxy voting information, visit or call:
1-877-71-FROST
https://frostinv.com/
Rule 30e-1 of the Investment Company Act of 1940 permits funds to transmit only one copy of a proxy statement, annual report or semi-annual report to shareholders (who need not be related) with the same residential, commercial or electronic address, provided that the shareholders have consented in writing and the reports are addressed either to each shareholder individually or to the shareholders as a group. This process is known as “householding” and is designed to reduce the duplicate copies of materials that shareholders receive and to lower printing and mailing costs for funds.
Frost Low Duration Bond Fund / Institutional Class Shares - FILDX
Annual Shareholder Report - July 31, 2024
FIA-AR-TSR-2024-7
Frost Low Duration Bond Fund
Frost Family of Funds - Investor Class Shares - FADLX
Annual Shareholder Report - July 31, 2024
This annual shareholder report contains important information about Investor Class Shares of the Frost Low Duration Bond Fund (the "Fund") for the period from August 1, 2023 to July 31, 2024. You can find additional information about the Fund at https://frostinv.com/. You can also request this information by contacting us at 1-877-71-FROST.
What were the Fund costs for the last year?
(based on a hypothetical $10,000 investment)
| Fund Name | Costs of a $10,000 investment | Costs paid as a percentage of a $10,000 investment |
|---|
| Frost Low Duration Bond Fund, Investor Class Shares | $71 | 0.69% |
How did the Fund perform in the last year?
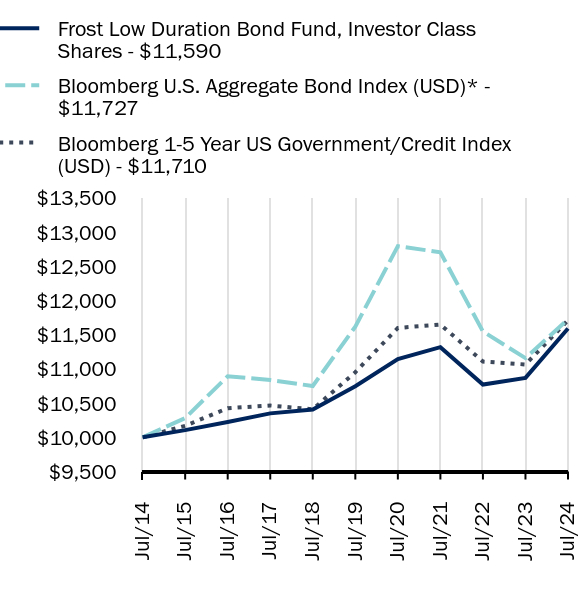
• The Bloomberg U.S. Government Credit One to Five Year Bond Index returned 5.83% during the year that ended July 31, 2024. The Frost Low Duration Bond Fund (Investor Share Class) returned 6.64% over the same period, outperformance of 0.81%.
• The Fund maintained an underweight allocation to interest rate risk, with an effective duration profile of between 2.0% and 2.40% compared to the benchmark’s average duration of approximately 2.65%.
• Short-term interest rates, while volatile, finished the year ever so slightly lower than where they began the year as the Federal Reserve largely made no significant changes to monetary policy and the US economy remained solid.
• In turn, the Fund saw little relative performance attribution (neither positive nor negative) from its interest rate profile compared to its benchmark.
• The Fund’s primary relative outperformance was positive sector allocations. The Fund held a meaningful overweight to the ABS sector (40%) and an underweight to the Treasury sector (26%). The ABS sector during the year meaningfully outperformed, before taking into account security selection, both the investment grade corporate and the Treasury sectors. The Treasury sector delivered the lowest aggregate returns as well. Overall, the Fund obtained approximately 1.0% of its outperformance relative to the benchmark from these sector allocation decisions.
• The Fund obtained approximately 0.25% of outperformance do to solid individual security selection in the year. Most of these results came in the Fund’s investment grade corporate sector.
How did the fund perform during the last 10 years?
Total Return Based on $10,000 Investment
| Frost Low Duration Bond Fund, Investor Class Shares - $11590 | Bloomberg U.S. Aggregate Bond Index (USD)* - $11727 | Bloomberg 1-5 Year US Government/Credit Index (USD) - $11710 |
|---|
| Jul/14 | $10000 | $10000 | $10000 |
| Jul/15 | $10105 | $10282 | $10168 |
| Jul/16 | $10224 | $10893 | $10426 |
| Jul/17 | $10350 | $10837 | $10465 |
| Jul/18 | $10407 | $10750 | $10409 |
| Jul/19 | $10746 | $11619 | $10952 |
| Jul/20 | $11144 | $12795 | $11599 |
| Jul/21 | $11318 | $12705 | $11649 |
| Jul/22 | $10772 | $11547 | $11108 |
| Jul/23 | $10869 | $11158 | $11065 |
| Jul/24 | $11590 | $11727 | $11710 |
Average Annual Total Returns as of July 31, 2024
| Fund/Index Name | 1 Year | 5 Years | 10 Years |
|---|
| Frost Low Duration Bond Fund, Investor Class Shares | 6.64% | 1.52% | 1.49% |
| Bloomberg U.S. Aggregate Bond Index (USD)* | 5.10% | 0.19% | 1.61% |
| Bloomberg 1-5 Year US Government/Credit Index (USD) | 5.83% | 1.35% | 1.59% |
The line graph represents historical performance of a hypothetical investment of $10,000 in the Fund during the last 10 years. Returns shown are total returns, which assume the reinvestment of dividends and capital gains. The table and graph presented above do not reflect the deduction of taxes a shareholder would pay on Fund distributions or the redemption of Fund Shares. Past performance is not indicative of future performance.Call 1-877-71-FROST or visit https://frostinv.com/ for current month-end performance.
Footnote Reference*As of July 2024, pursuant to the new regulatory requirements, this index replaced the prior index as the Fund's primary benchmark to represent a broad-based securities market index.
Key Fund Statistics as of July 31, 2024
| Total Net Assets | Number of Holdings | Total Advisory Fees Paid | Portfolio Turnover Rate |
|---|
| $320,433,457 | 75 | $902,705 | 72% |
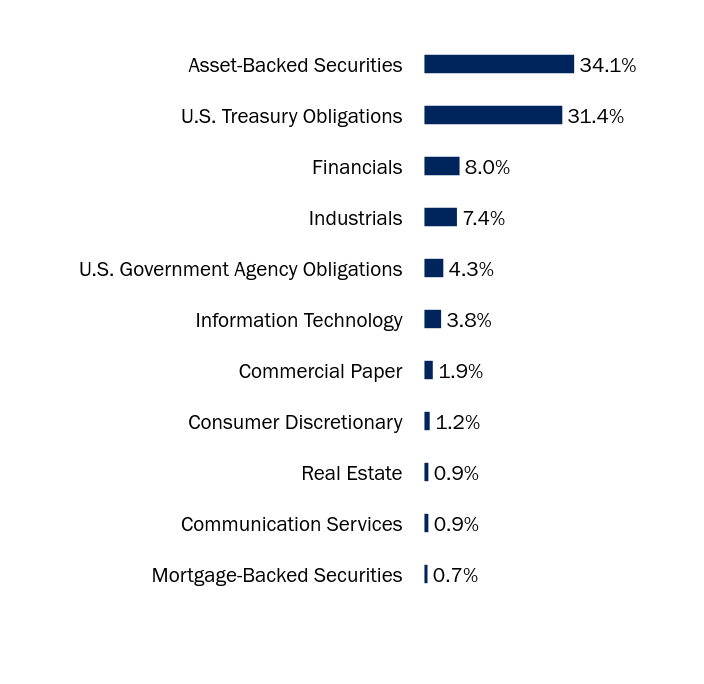
What did the Fund invest in?
Asset WeightingsFootnote Reference*
| Value | Value |
|---|
| Mortgage-Backed Securities | 0.7% |
| Communication Services | 0.9% |
| Real Estate | 0.9% |
| Consumer Discretionary | 1.2% |
| Commercial Paper | 1.9% |
| Information Technology | 3.8% |
| U.S. Government Agency Obligations | 4.3% |
| Industrials | 7.4% |
| Financials | 8.0% |
| U.S. Treasury Obligations | 31.4% |
| Asset-Backed Securities | 34.1% |
| Footnote | Description |
Footnote* | Percentages are calculated based on total net assets. |
| Holding Name | Coupon Rate | Maturity Date | Percentage of Total Net Assets |
|---|
| U.S. Treasury Notes | 4.000% | 01/31/29 | 14.1% |
| U.S. Treasury Notes | 4.375% | 11/30/28 | 7.9% |
| U.S. Treasury Notes | 4.000% | 02/29/28 | 7.8% |
| Molex Electronic Technologies | 3.900% | 04/15/25 | 3.1% |
| Verizon Master Trust, Ser 2023-4, Cl C | 5.650% | 06/20/29 | 3.1% |
| Fifth Third Bancorp, SOFRINDX + 2.192% | 6.361% | 10/27/28 | 2.6% |
| Prestige Auto Receivables Trust, Ser 2023-1A, Cl B | 5.550% | 04/15/27 | 2.5% |
| Kyndryl Holdings | 2.050% | 10/15/26 | 2.3% |
| Westlake Automobile Receivables Trust, Ser 2022-3A, Cl D | 6.680% | 04/17/28 | 2.2% |
| Charles Schwab, SOFRRATE + 2.210% | 5.643% | 05/19/29 | 1.6% |
There were no material changes during the reporting period.
Changes in and Disagreements with Accountants
There were no changes in or disagreements with accountants during the reporting period.
For additional information about the Fund; including its prospectus, financial information, holdings, and proxy voting information, visit or call:
1-877-71-FROST
https://frostinv.com/
Rule 30e-1 of the Investment Company Act of 1940 permits funds to transmit only one copy of a proxy statement, annual report or semi-annual report to shareholders (who need not be related) with the same residential, commercial or electronic address, provided that the shareholders have consented in writing and the reports are addressed either to each shareholder individually or to the shareholders as a group. This process is known as “householding” and is designed to reduce the duplicate copies of materials that shareholders receive and to lower printing and mailing costs for funds.
Frost Low Duration Bond Fund / Investor Class Shares - FADLX
Annual Shareholder Report - July 31, 2024
FIA-AR-TSR-2024-6
Frost Municipal Bond Fund
Frost Family of Funds - Institutional Class Shares - FIMUX
Annual Shareholder Report - July 31, 2024
This annual shareholder report contains important information about Institutional Class Shares of the Frost Municipal Bond Fund (the "Fund") for the period from August 1, 2023 to July 31, 2024. You can find additional information about the Fund at https://frostinv.com/. You can also request this information by contacting us at 1-877-71-FROST. This annual shareholder report describes changes to the Fund that occurred during the reporting period.
What were the Fund costs for the last year?
(based on a hypothetical $10,000 investment)
| Fund Name | Costs of a $10,000 investment | Costs paid as a percentage of a $10,000 investment |
|---|
| Frost Municipal Bond Fund, Institutional Class Shares | $105 | 1.04% |
How did the Fund perform in the last year?
The Fund returned 1.74% (Institutional Share Class) during the year compared to 3.74% for the benchmark, the Bloomberg Municipal Bond Index. The primary underperformance characteristic for the Fund in the year was its meaningful underweight to long-maturity (i.e., bonds with ten years and great maturities) securities as these sectors outperformed. The Fund allocated on average less than 15% to securities over ten-year maturities compared to the benchmark of close to 45%. This long maturity sector of the benchmark delivered returns of close to 5%. Additionally, the Fund held a meaningful allocation to cash during the last few months of the year in preparation for its permanent closing.
How did the fund perform during the last 10 years?
Total Return Based on $1,000,000 Investment
| Frost Municipal Bond Fund, Institutional Class Shares - $1194113 | Bloomberg US Municipal Bond Index (USD)* - $1276168 |
|---|
| Jul/14 | $1000000 | $1000000 |
| Jul/15 | $1025172 | $1035627 |
| Jul/16 | $1068418 | $1107538 |
| Jul/17 | $1068399 | $1110379 |
| Jul/18 | $1071127 | $1121412 |
| Jul/19 | $1129890 | $1203341 |
| Jul/20 | $1170133 | $1267820 |
| Jul/21 | $1202502 | $1309530 |
| Jul/22 | $1168343 | $1218808 |
| Jul/23 | $1173693 | $1230125 |
| Jul/24 | $1194113 | $1276168 |
Average Annual Total Returns as of July 31, 2024
| Fund/Index Name | 1 Year | 5 Years | 10 Years |
|---|
| Frost Municipal Bond Fund, Institutional Class Shares | 1.74% | 1.11% | 1.79% |
| Bloomberg US Municipal Bond Index (USD)* | 3.74% | 1.18% | 2.47% |
The line graph represents historical performance of a hypothetical investment of $1,000,000 in the Fund during the last 10 years. Returns shown are total returns, which assume the reinvestment of dividends and capital gains. The table and graph presented above do not reflect the deduction of taxes a shareholder would pay on Fund distributions or the redemption of Fund Shares. Past performance is not indicative of future performance.Call 1-877-71-FROST or visit https://frostinv.com/ for current month-end performance.
Footnote Reference*As of July 2024, pursuant to the new regulatory requirements, this index replaced the prior index as the Fund's primary benchmark to represent a broad-based securities market index.
Key Fund Statistics as of July 31, 2024
| Total Net Assets | Number of Holdings | Total Advisory Fees Paid | Portfolio Turnover Rate |
|---|
| $3,581,174 | 8 | $11,236 | 0% |
What did the Fund invest in?
Asset WeightingsFootnote Reference*
| Value | Value |
|---|
| Municipal Bonds | 67.1% |
| Footnote | Description |
Footnote* | Percentages are calculated based on total net assets. |
| Holding Name | Coupon Rate | Maturity Date | Percentage of Total Net Assets |
|---|
| Main Street Market Square Redevelopment Authority, BAM | 5.000% | 09/01/29 | 14.3% |
| Taylor, Brownfield Redevelopment Authority, NATL | 4.000% | 05/01/28 | 14.0% |
| Clifton, Higher Education Finance, Ser B | 5.000% | 08/15/25 | 13.0% |
| Clifton, Higher Education Finance, Ser A | 3.375% | 12/01/24 | 7.5% |
| California State, Municipal Finance Authority, Ser A | 5.000% | 03/01/25 | 7.0% |
| Idaho State, Housing & Finance Association | 4.000% | 07/01/26 | 4.3% |
| City of Medina Ohio | 4.000% | 12/01/32 | 4.1% |
| Mount Diablo Unified School District, Ser A | 4.000% | 08/01/31 | 3.0% |
This is a summary of certain changes to the Fund since July 31, 2024. For more complete information, you may review the Fund’s next prospectus, at https://frostinv.com/ or upon request at 1-877-71-FROST.
The Frost Municipal Bond Fund was liquidated on August 28, 2024.
Changes in and Disagreements with Accountants
There were no changes in or disagreements with accountants during the reporting period.
For additional information about the Fund; including its prospectus, financial information, holdings, and proxy voting information, visit or call:
1-877-71-FROST
https://frostinv.com/
Rule 30e-1 of the Investment Company Act of 1940 permits funds to transmit only one copy of a proxy statement, annual report or semi-annual report to shareholders (who need not be related) with the same residential, commercial or electronic address, provided that the shareholders have consented in writing and the reports are addressed either to each shareholder individually or to the shareholders as a group. This process is known as “householding” and is designed to reduce the duplicate copies of materials that shareholders receive and to lower printing and mailing costs for funds.
Frost Municipal Bond Fund / Institutional Class Shares - FIMUX
Annual Shareholder Report - July 31, 2024
FIA-AR-TSR-2024-11
Frost Municipal Bond Fund
Frost Family of Funds - Investor Class Shares - FAUMX
Annual Shareholder Report - July 31, 2024
This annual shareholder report contains important information about Investor Class Shares of the Frost Municipal Bond Fund (the "Fund") for the period from August 1, 2023 to July 31, 2024. You can find additional information about the Fund at https://frostinv.com/. You can also request this information by contacting us at 1-877-71-FROST. This annual shareholder report describes changes to the Fund that occurred during the reporting period.
What were the Fund costs for the last year?
(based on a hypothetical $10,000 investment)
| Fund Name | Costs of a $10,000 investment | Costs paid as a percentage of a $10,000 investment |
|---|
| Frost Municipal Bond Fund, Investor Class Shares | $124 | 1.23% |
How did the Fund perform in the last year?
The Fund returned 1.44% (Investor Share Class) during the year compared to 3.74% for the benchmark, the Bloomberg Municipal Bond Index. The primary under performance characteristic for the Fund in the year was its meaningful underweight to long-maturity (i.e., bonds with ten years and great maturities) securities as these sectors outperformed. The Fund allocated on average less than 15% to securities over ten-year maturities compared to the benchmark of close to 45%. This long maturity sector of the benchmark delivered returns of close to 5%. Additionally, the Fund held a meaningful allocation to cash during the last few months of the year in preparation for its permanent closing.
How did the fund perform during the last 10 years?
Total Return Based on $10,000 Investment
| Frost Municipal Bond Fund, Investor Class Shares - $11651 | Bloomberg US Municipal Bond Index (USD)* - $12762 |
|---|
| Jul/14 | $10000 | $10000 |
| Jul/15 | $10216 | $10356 |
| Jul/16 | $10631 | $11075 |
| Jul/17 | $10605 | $11104 |
| Jul/18 | $10604 | $11214 |
| Jul/19 | $11157 | $12033 |
| Jul/20 | $11525 | $12678 |
| Jul/21 | $11825 | $13095 |
| Jul/22 | $11449 | $12188 |
| Jul/23 | $11485 | $12301 |
| Jul/24 | $11651 | $12762 |
Average Annual Total Returns as of July 31, 2024
| Fund/Index Name | 1 Year | 5 Years | 10 Years |
|---|
| Frost Municipal Bond Fund, Investor Class Shares | 1.44% | 0.87% | 1.54% |
| Bloomberg US Municipal Bond Index (USD)* | 3.74% | 1.18% | 2.47% |
The line graph represents historical performance of a hypothetical investment of $10,000 in the Fund during the last 10 years. Returns shown are total returns, which assume the reinvestment of dividends and capital gains. The table and graph presented above do not reflect the deduction of taxes a shareholder would pay on Fund distributions or the redemption of Fund Shares. Past performance is not indicative of future performance.Call 1-877-71-FROST or visit https://frostinv.com/ for current month-end performance.
Footnote Reference*As of July 2024, pursuant to the new regulatory requirements, this index replaced the prior index as the Fund's primary benchmark to represent a broad-based securities market index.
Key Fund Statistics as of July 31, 2024
| Total Net Assets | Number of Holdings | Total Advisory Fees Paid | Portfolio Turnover Rate |
|---|
| $3,581,174 | 8 | $11,236 | 0% |
What did the Fund invest in?
Asset WeightingsFootnote Reference*
| Value | Value |
|---|
| Municipal Bonds | 67.1% |
| Footnote | Description |
Footnote* | Percentages are calculated based on total net assets. |
| Holding Name | Coupon Rate | Maturity Date | Percentage of Total Net Assets |
|---|
| Main Street Market Square Redevelopment Authority, BAM | 5.000% | 09/01/29 | 14.3% |
| Taylor, Brownfield Redevelopment Authority, NATL | 4.000% | 05/01/28 | 14.0% |
| Clifton, Higher Education Finance, Ser B | 5.000% | 08/15/25 | 13.0% |
| Clifton, Higher Education Finance, Ser A | 3.375% | 12/01/24 | 7.5% |
| California State, Municipal Finance Authority, Ser A | 5.000% | 03/01/25 | 7.0% |
| Idaho State, Housing & Finance Association | 4.000% | 07/01/26 | 4.3% |
| City of Medina Ohio | 4.000% | 12/01/32 | 4.1% |
| Mount Diablo Unified School District, Ser A | 4.000% | 08/01/31 | 3.0% |
This is a summary of certain changes to the Fund since July 31, 2024. For more complete information, you may review the Fund’s next prospectus, at https://frostinv.com/ or upon request at 1-877-71-FROST.
The Frost Municipal Bond Fund was liquidated on August 28, 2024.
Changes in and Disagreements with Accountants
There were no changes in or disagreements with accountants during the reporting period.
For additional information about the Fund; including its prospectus, financial information, holdings, and proxy voting information, visit or call:
1-877-71-FROST
https://frostinv.com/
Rule 30e-1 of the Investment Company Act of 1940 permits funds to transmit only one copy of a proxy statement, annual report or semi-annual report to shareholders (who need not be related) with the same residential, commercial or electronic address, provided that the shareholders have consented in writing and the reports are addressed either to each shareholder individually or to the shareholders as a group. This process is known as “householding” and is designed to reduce the duplicate copies of materials that shareholders receive and to lower printing and mailing costs for funds.
Frost Municipal Bond Fund / Investor Class Shares - FAUMX
Annual Shareholder Report - July 31, 2024
FIA-AR-TSR-2024-12
(b) Not applicable.
Item 2. Code of Ethics.
The Registrant has adopted a code of ethics that applies to the Registrant’s principal executive officer, principal financial officer, controller or principal accounting officer, and any person who performs a similar function. There have been no amendments to or waivers granted to this code of ethics during the period covered by this report.
Item 3. Audit Committee Financial Expert.
(a)(1) The Registrant’s board of trustees has determined that the Registrant has at least one audit committee financial expert serving on the audit committee.
(a) (2) The Registrant’s audit committee financial expert is Robert Mulhall, and is considered to be “independent,” as that term is defined in Form N-CSR Item 3(a)(2).
Item 4. Principal Accountant Fees and Services.
Fees billed by Ernst & Young LLP (“E&Y”) relate to the Frost Family of Funds (the “Trust”).
E&Y billed the Trust aggregate fees for services rendered to the Trust for the last two fiscal years as follows:
| | FYE July 31, 2024 | FYE July 31, 2023 |
| | | All fees and services to the Trust that were pre-approved | All fees and services to service affiliates that were pre-approved | All other fees and services to service affiliates that did not require pre-approval | All fees and services to the Trust that were pre-approved | All fees and services to service affiliates that were pre-approved | All other fees and services to service affiliates that did not require pre-approval |
| (a) | Audit Fees(1) | $259,200 | None | None | $272,400 | None | None |
| (b) | Audit-Related Fees | None | None | None | None | None | None |
| (c) | Tax Fees | None | None | None | None | None | None |
| (d) | All Other Fees | None | None | None | None | None | None |
Notes:
| (1) | Audit fees include amounts related to the audit of the Trust’s annual financial statements and services normally provided by the accountant in connection with statutory and regulatory filings. |
(e)(1) The Trust’s Audit Committee has adopted and the Board of Trustees has ratified an Audit and Non-Audit Services Pre-Approval Policy (the “Policy”), which sets forth the procedures and the conditions pursuant to which services proposed to be performed by the independent auditor of the Funds may be pre-approved.
The Policy provides that all requests or applications for proposed services to be provided by the independent auditor must be submitted to the Registrant’s Chief Financial Officer (“CFO”) and must include a detailed description of the services proposed to be rendered. The CFO will determine whether such services:
| 1. | require specific pre-approval; |
| 2. | are included within the list of services that have received the general pre-approval of the Audit Committee pursuant to the Policy; or |
| 3. | have been previously pre-approved in connection with the independent auditor’s annual engagement letter for the applicable year or otherwise. In any instance where services require pre-approval, the Audit Committee will consider whether such services are consistent with SEC’s rules and whether the provision of such services would impair the auditor’s independence. |
Requests or applications to provide services that require specific pre-approval by the Audit Committee will be submitted to the Audit Committee by the CFO. The Audit Committee will be informed by the CFO on a quarterly basis of all services rendered by the independent auditor. The Audit Committee has delegated specific pre-approval authority to either the Audit Committee Chair or financial expert, provided that the estimated fee for any such proposed pre-approved service does not exceed $100,000 and any pre-approval decisions are reported to the Audit Committee at it’s next regularly-scheduled meeting.
Services that have received the general pre-approval of the Audit Committee are identified and described in the Policy. In addition, the Policy sets forth a maximum fee per engagement with respect to each identified service that has received general pre-approval.
All services to be provided by the independent auditor shall be provided pursuant to a signed written engagement letter with the Registrant, the investment adviser, or applicable control affiliate (except that matters as to which an engagement letter would be impractical because of timing issues or because the matter is small may not be the subject of an engagement letter) that sets forth both the services to be provided by the independent auditor and the total fees to be paid to the independent auditor for those services.
In addition, the Audit Committee has determined to take additional measures on an annual basis to meet the Audit Committee’s responsibility to oversee the work of the independent auditor and to assure the auditor's independence from the Registrant, such as (a) reviewing a formal written statement from the independent auditor delineating all relationships between the independent auditor and the Registrant, and (b) discussing with the independent auditor the independent auditor’s methods and procedures for ensuring independence.
(e)(2) Percentage of fees billed by E&Y applicable to non-audit services pursuant to the “de minimis” exception of Rule 2-01(c)(7)(i)(C) were as follows:
| | FYE July 31, 2024 | FYE July 31, 2023 |
Audit-Related Fees | None | None |
| Tax Fees | None | None |
All Other Fees | None | None |
(f) Not applicable.
(g) The aggregate non-audit fees and services billed by E&Y for services rendered to the Registrant, and rendered to the Registrant’s investment adviser (not including any sub-adviser whose role is primarily portfolio management and is subcontracted with or overseen by another investment adviser), and any entity controlling, controlled by, or under common control with the adviser that provides ongoing services to the Registrant for the last two fiscal-years-ended July 31st were $16,000 and $14,500 for 2024 and 2023, respectively.
(h) During the past fiscal year, all non-audit services provided by Registrant’s principal accountant to either the Registrant’s investment adviser or to any entity controlling, controlled by, or under common control with the Registrant’s investment adviser that provides ongoing services to the Registrant were pre-approved by the Audit Committee of Registrant’s Board of Trustees. Included in the Audit Committee’s pre-approval of these non-audit service were the review and consideration as to whether the provision of these non-audit services is compatible with maintaining the principal accountant’s independence
(i) Not applicable. The Registrant has not retained, for the preparation of the audit report on the financial statements included in the Form N-CSR, a registered public accounting firm that has a branch or office that is located in a foreign jurisdiction and that the Public Company Accounting Oversight Board (the “PCAOB”) has determined that the PCAOB is unable to inspect or investigate completely because of a position taken by an authority in the foreign jurisdiction.
(j) Not applicable. The Registrant is not a “foreign issuer,” as defined in 17 CFR 240.3b-4.
Item 5. Audit Committee of Listed Registrants.
Not applicable to open-end management investment companies.
Item 6. Schedule of Investments.
(a) The Schedule of Investments is included as part of the Financial Statements and Other Information filed under Item 7 of this form.
(b) Not applicable.
Item 7. Financial Statements and Financial Highlights for Open-End Management Investment Companies.
Financial Statements and Financial Highlights are filed herein.

Frost Family of Funds
Annual Financials and
Other Information
July 31, 2024
FROST GROWTH EQUITY FUND | FROST LOW DURATION BOND FUND |
FROST TOTAL RETURN BOND FUND | FROST MUNICIPAL BOND FUND |
FROST CREDIT FUND | |
Investment Adviser:
Frost Investment Advisors, LLC

Table of contents July 31, 2024
| | Page |
| Financial Statements (Form N-CSR Item 7) | |
| Schedules of Investments | 1 |
| Glossary | 21 |
| Statements of Assets and Liabilities | 22 |
| Statements of Operations | 24 |
| Statements of Changes in Net Assets | 26 |
| Financial Highlights | 28 |
| Notes to Financial Statements | 32 |
| Report of Independent Registered Public Accounting Firm | 45 |
| Notice to Shareholders | 49 |
The Funds file their complete schedules of investments with the Securities and Exchange Commission for the first and third quarters of each fiscal year on Form N-PORT. The Funds’ Forms N-PORT are available on the Funds’ website at https://frostinv.com/.
A description of the policies and procedures that the Funds use to determine how to vote proxies relating to fund securities, as well as information relating to how the Funds voted proxies relating to fund securities during the most recent 12-month period ended June 30, is available (i) without charge, upon request, by calling 1-877-71-FROST; and (ii) on the Funds’ website at https://frostinv.com/.

FROST GROWTH EQUITY FUND July 31, 2024
Description | | Shares | | | Value | |
COMMON STOCK§ — 98.2% |
Communication Services — 13.2% | | | | |
Alphabet, Cl A | | | 53,519 | | | $ | 9,180,649 | |
Alphabet, Cl C | | | 45,558 | | | | 7,888,368 | |
Meta Platforms, Cl A | | | 19,711 | | | | 9,359,374 | |
Netflix * | | | 3,934 | | | | 2,471,929 | |
Spotify Technology * | | | 8,305 | | | | 2,856,422 | |
| | | | | | | | 31,756,742 | |
Consumer Discretionary — 14.7% | | | | |
Airbnb, Cl A * | | | 9,233 | | | | 1,288,557 | |
Amazon.com * | | | 91,958 | | | | 17,194,307 | |
Booking Holdings | | | 666 | | | | 2,474,197 | |
Chipotle Mexican Grill, Cl A * | | | 65,000 | | | | 3,530,800 | |
Floor & Decor Holdings, Cl A * | | | 6,249 | | | | 612,402 | |
Home Depot | | | 7,924 | | | | 2,917,300 | |
Lululemon Athletica * | | | 4,027 | | | | 1,041,624 | |
NIKE, Cl B | | | 8,388 | | | | 627,926 | |
O'Reilly Automotive * | | | 2,592 | | | | 2,919,473 | |
Tesla * | | | 4,045 | | | | 938,723 | |
TJX | | | 15,661 | | | | 1,770,006 | |
| | | | | | | | 35,315,315 | |
Consumer Staples — 2.8% | | | | |
Coca-Cola | | | 26,063 | | | | 1,739,445 | |
Costco Wholesale | | | 3,951 | | | | 3,247,722 | |
Monster Beverage * | | | 33,920 | | | | 1,745,184 | |
| | | | | | | | 6,732,351 | |
Energy — 0.5% | | | | |
Hess | | | 8,169 | | | | 1,253,288 | |
| | | | | | | | | |
Financials — 7.4% | | | | |
Cboe Global Markets | | | 9,745 | | | | 1,788,305 | |
Mastercard, Cl A | | | 13,250 | | | | 6,144,158 | |
Moody's | | | 6,228 | | | | 2,842,957 | |
Visa, Cl A | | | 26,131 | | | | 6,942,223 | |
| | | | | | | | 17,717,643 | |
Health Care — 11.6% | | | | |
AbbVie | | | 18,512 | | | | 3,430,644 | |
Boston Scientific * | | | 41,279 | | | | 3,049,693 | |
Charles River Laboratories International * | | | 4,246 | | | | 1,036,449 | |
Danaher | | | 9,184 | | | | 2,544,703 | |
Eli Lilly | | | 11,061 | | | | 8,896,030 | |
Humana | | | 1,945 | | | | 703,331 | |
Intuitive Surgical * | | | 9,756 | | | | 4,337,615 | |
Merck | | | 7,236 | | | | 818,608 | |
UnitedHealth Group | | | 5,631 | | | | 3,244,357 | |
| | | | | | | | 28,061,430 | |
Industrials — 3.3% | | | | |
Canadian Pacific Kansas City | | | 22,086 | | | | 1,851,249 | |
General Electric | | | 6,919 | | | | 1,177,614 | |
Uber Technologies * | | | 47,609 | | | | 3,069,352 | |
Union Pacific | | | 7,982 | | | | 1,969,399 | |
| | | | | | | | 8,067,614 | |
Information Technology — 43.4% | | | | |
Accenture, Cl A | | | 3,622 | | | | 1,197,506 | |
Adobe * | | | 5,368 | | | | 2,961,257 | |
Advanced Micro Devices * | | | 7,687 | | | | 1,110,618 | |
Apple | | | 93,257 | | | | 20,710,515 | |
Atlassian, Cl A * | | | 4,278 | | | | 755,367 | |
Broadcom | | | 24,391 | | | | 3,919,146 | |
Datadog, Cl A * | | | 9,828 | | | | 1,144,372 | |
Globant * | | | 12,116 | | | | 2,359,106 | |
Description | | Shares | | | Value | |
Intuit | | | 3,235 | | | $ | 2,094,177 | |
Lam Research | | | 998 | | | | 919,397 | |
Marvell Technology | | | 27,742 | | | | 1,858,159 | |
Microsoft | | | 70,849 | | | | 29,639,679 | |
NVIDIA | | | 209,979 | | | | 24,571,743 | |
QUALCOMM | | | 7,803 | | | | 1,411,953 | |
Salesforce | | | 3,985 | | | | 1,031,318 | |
ServiceNow * | | | 5,898 | | | | 4,803,272 | |
Snowflake, Cl A * | | | 5,277 | | | | 688,015 | |
Workday, Cl A * | | | 14,570 | | | | 3,309,138 | |
| | | | | | | | 104,484,738 | |
Materials — 0.9% | | | | |
Sherwin-Williams | | | 6,462 | | | | 2,266,870 | |
| | | | | | | | | |
Real Estate — 0.4% | | | | |
American Tower ‡ | | | 4,009 | | | | 883,583 | |
| | | | | | | | | |
Total Common Stock | | | | | | | | |
(Cost $90,938,239) | | | | | | | 236,539,574 | |
| | | | | | | | | |
Total Investments — 98.2% | | | | | | | | |
(Cost $90,938,239) | | | | | | $ | 236,539,574 | |
| |
Percentages are based on Net Assets of $240,759,686. |
* | Non-income producing security. |
§ | Narrow industries are utilized for compliance purposes, whereas broad sectors are utilized for reporting. |
‡ | Real Estate Investment Trust |
As of July 31, 2024, all of the Fund's investments in securities were considered Level 1, in accordance with the authoritative guidance on fair value measurements and disclosure under U.S. GAAP. |
For more information on valuation inputs, see Note 2—Significant Accounting Policies in the Notes to Financial Statements.
See “Glossary” for abbreviations.
The accompanying notes are an integral part of the financial statements.
1
FROST TOTAL RETURN BOND FUND July 31, 2024
Description | | Face Amount | | | Value | |
MORTGAGE-BACKED SECURITIES — 30.5% |
Agency Mortgage-Backed Obligation — 12.5% |
FHLMC | | | | | | | | |
6.000%, 08/01/53 to 09/01/53 | | $ | 47,694,345 | | | $ | 48,487,283 | |
FHLMC STRIPS, Ser 2012-293, Cl IO, IO | | | | | | | | |
4.000%, 11/15/32 | | | 400,282 | | | | 33,553 | |
FHLMC, Ser 2012-3996, Cl QL | | | | | | | | |
4.000%, 02/15/42 | | | 4,824,236 | | | | 4,649,840 | |
FHLMC, Ser 2012-4029, Cl LI, IO | | | | | | | | |
3.000%, 01/15/27 | | | 228,543 | | | | 1,353 | |
FHLMC, Ser 2012-4106, Cl YI, IO | | | | | | | | |
2.500%, 09/15/27 | | | 635,793 | | | | 16,806 | |
FHLMC, Ser 2012-4116, Cl MI, IO | | | | | | | | |
4.000%, 10/15/42 | | | 10,752,622 | | | | 1,389,081 | |
FHLMC, Ser 2012-4116, Cl PI, IO | | | | | | | | |
4.000%, 10/15/42 | | | 3,452,713 | | | | 622,262 | |
FHLMC, Ser 2012-4134, Cl BI, IO | | | | | | | | |
2.500%, 11/15/27 | | | 1,798,848 | | | | 47,608 | |
FHLMC, Ser 2012-4136, Cl PI, IO | | | | | | | | |
3.000%, 11/15/32 | | | 6,185,315 | | | | 532,474 | |
FHLMC, Ser 2012-4148, Cl LI, IO | | | | | | | | |
2.500%, 12/15/27 | | | 1,356,664 | | | | 38,730 | |
FHLMC, Ser 2013-4213, Cl IG, IO | | | | | | | | |
4.000%, 06/15/43 | | | 5,477,695 | | | | 869,187 | |
FHLMC, Ser 2014-4349, Cl KI, IO | | | | | | | | |
3.000%, 04/15/33 | | | 2,817,254 | | | | 133,030 | |
FHLMC, Ser 2015-4457, Cl EI, IO | | | | | | | | |
3.500%, 02/15/45 | | | 239,422 | | | | 34,721 | |
FHLMC, Ser 2017-4675, Cl VE | | | | | | | | |
3.500%, 08/15/37 | | | 4,494,138 | | | | 4,392,796 | |
FHLMC, Ser 2019-4908, Cl AS, IO | | | | | | | | |
0.638%, SOFR30A + 5.986%, 01/25/45 (A) | | | 8,749,067 | | | | 1,230,823 | |
FHLMC, Ser 2021-5085, Cl IG, IO | | | | | | | | |
2.500%, 03/25/51 | | | 19,423,049 | | | | 2,364,853 | |
FHLMC, Ser 2022-5202, Cl KI, IO | | | | | | | | |
3.500%, 06/25/49 | | | 14,202,810 | | | | 2,567,932 | |
FHLMC, Ser 2024-5406, Cl PO, PO | | | | | | | | |
0.000%, 03/25/52 (B)(C) | | | 67,637,936 | | | | 43,524,173 | |
FNMA | | | | | | | | |
6.500%, 11/01/53 | | | 43,130,955 | | | | 44,339,783 | |
6.000%, 09/01/53 | | | 19,048,707 | | | | 19,165,499 | |
5.500%, 05/01/44 to 01/01/54 | | | 22,242,048 | | | | 22,324,102 | |
5.000%, 07/01/53 | | | 19,584,351 | | | | 19,354,862 | |
4.500%, 08/01/41 | | | 1,798,292 | | | | 1,783,169 | |
3.000%, 11/01/46 | | | 3,550,156 | | | | 3,177,491 | |
2.710%, 09/01/29 | | | 8,000,000 | | | | 7,424,299 | |
2.180%, 01/01/27 | | | 5,000,000 | | | | 4,729,360 | |
FNMA STRIPS, Ser 2012-410, Cl C5, IO | | | | | | | | |
3.500%, 05/25/27 | | | 1,103,461 | | | | 21,931 | |
FNMA STRIPS, Ser 2015-421, Cl C1, IO | | | | | | | | |
3.000%, 05/25/30 | | | 1,383,243 | | | | 80,594 | |
FNMA, Ser 2011-103, Cl GI, IO | | | | | | | | |
3.500%, 10/25/26 | | | 236,787 | | | | 3,218 | |
FNMA, Ser 2011-146, Cl AY | | | | | | | | |
3.500%, 01/25/32 | | | 1,697,043 | | | | 1,649,616 | |
Description | | Face Amount | | | Value | |
FNMA, Ser 2012-61, Cl KI, IO | | | | | | | | |
4.000%, 12/25/41 | | $ | 2,155,629 | | | $ | 119,951 | |
FNMA, Ser 2012-68, Cl GY | | | | | | | | |
3.000%, 07/25/32 | | | 5,000,000 | | | | 4,770,108 | |
FNMA, Ser 2013-104, Cl TI, IO | | | | | | | | |
3.000%, 08/25/32 | | | 700,460 | | | | 23,740 | |
FNMA, Ser 2014-40, Cl GI, IO | | | | | | | | |
3.000%, 06/25/33 | | | 3,436,863 | | | | 301,450 | |
FNMA, Ser 2017-52, Cl DI, IO | | | | | | | | |
4.500%, 07/25/47 | | | 5,867,216 | | | | 885,037 | |
FNMA, Ser 2019-44, Cl CI, IO | | | | | | | | |
4.000%, 08/25/59 | | | 5,081,923 | | | | 1,024,585 | |
FNMA, Ser 2019-44, Cl PI, IO | | | | | | | | |
4.000%, 08/25/49 | | | 4,173,961 | | | | 765,805 | |
FNMA, Ser 2020-44, Cl MI, IO | | | | | | | | |
2.500%, 01/25/57 | | | 11,683,445 | | | | 1,823,794 | |
FNMA, Ser 2024-25, Cl A | | | | | | | | |
6.000%, 03/25/44 | | | 19,442,750 | | | | 19,730,231 | |
GNMA | | | | | | | | |
6.500%, 01/20/54 | | | 17,891,367 | | | | 17,995,282 | |
GNMA, Ser 2013-170, Cl QI, IO | | | | | | | | |
3.132%, 11/20/43 (A) | | | 6,518,639 | | | | 687,488 | |
GNMA, Ser 2013-42, Cl MI, IO | | | | | | | | |
3.500%, 04/20/41 | | | 105,696 | | | | 350 | |
GNMA, Ser 2013-62, Cl NI, IO | | | | | | | | |
4.000%, 08/20/40 | | | 1,766,708 | | | | 72,225 | |
GNMA, Ser 2014-32, Cl CI, IO | | | | | | | | |
4.000%, 03/20/43 | | | 1,616,678 | | | | 110,175 | |
GNMA, Ser 2014-44, Cl IO, IO | | | | | | | | |
4.000%, 11/16/26 | | | 1,046,943 | | | | 9,885 | |
GNMA, Ser 2015-103, Cl CI, IO | | | | | | | | |
4.000%, 07/20/45 | | | 9,016,226 | | | | 1,402,111 | |
GNMA, Ser 2015-17, Cl JI, IO | | | | | | | | |
3.500%, 05/20/28 | | | 887,537 | | | | 10,626 | |
GNMA, Ser 2016-99, Cl ID, IO | | | | | | | | |
4.500%, 04/16/44 | | | 13,575,020 | | | | 2,855,044 | |
GNMA, Ser 2017-137, Cl DI, IO | | | | | | | | |
3.000%, 02/20/47 | | | 667,437 | | | | 12,327 | |
GNMA, Ser 2020-189, Cl IJ, IO | | | | | | | | |
2.500%, 12/20/50 | | | 18,845,997 | | | | 2,327,737 | |
GNMA, Ser 2020-191, Cl CT | | | | | | | | |
1.250%, 12/20/50 | | | 3,643,618 | | | | 2,862,365 | |
GNMA, Ser 2021-8, Cl IG, IO | | | | | | | | |
2.500%, 01/20/51 | | | 24,931,810 | | | | 3,051,322 | |
GNMA, Ser 2022-182, Cl PO, PO | | | | | | | | |
0.000%, 10/20/52 (B)(C) | | | 31,461,632 | | | | 22,957,921 | |
GNMA, Ser 2023-122, Cl G | | | | | | | | |
5.500%, 05/20/46 | | | 8,980,668 | | | | 9,026,752 | |
GNMA, Ser 2023-151, Cl PO, PO | | | | | | | | |
0.000%, 10/20/53 (B)(C) | | | 32,641,186 | | | | 27,441,922 | |
GNMA, Ser 2023-163, Cl B | | | | | | | | |
6.000%, 02/20/48 | | | 20,077,727 | | | | 20,608,874 | |
GNMA, Ser 2023-163, Cl LB | | | | | | | | |
6.000%, 02/20/48 | | | 10,000,000 | | | | 10,247,494 | |
GNMA, Ser 2023-59, Cl G | | | | | | | | |
6.000%, 03/20/50 | | | 9,195,879 | | | | 9,275,702 | |
GNMA, Ser 2023-93, Cl B | | | | | | | | |
5.500%, 12/20/44 | | | 9,246,186 | | | | 9,349,289 | |
GNMA, Ser 2024-1, Cl TA | | | | | | | | |
5.500%, 08/20/48 | | | 9,420,304 | | | | 9,403,250 | |
GNMA, Ser 2024-19, Cl H | | | | | | | | |
5.500%, 12/20/51 | | | 3,450,057 | | | | 3,477,358 | |
The accompanying notes are an integral part of the financial statements.
2

FROST TOTAL RETURN BOND FUND July 31, 2024
Description | | Face Amount | | | Value | |
GNMA, Ser 2024-30, Cl NP | | | | | | | | |
5.000%, 02/20/54 | | $ | 5,837,182 | | | $ | 5,717,672 | |
| | | | | | | | 423,338,301 | |
Commercial Mortgage-Backed Obligation — 13.5% |
280 Park Avenue Mortgage Trust, Ser 280P, Cl F | | | | | | | | |
8.455%, TSFR1M + 3.127%, 09/15/34 (A)(D) | | | 12,500,000 | | | | 11,278,159 | |
Bear Stearns Commercial Mortgage Securities Trust, Ser 2007-T26, Cl AJ | | | | | | | | |
5.566%, 01/12/45 (A) | | | 87,215 | | | | 84,940 | |
Benchmark Mortgage Trust, Ser 2020-B18, Cl E | | | | | | | | |
2.250%, 07/15/53 (D) | | | 8,000,000 | | | | 4,049,032 | |
Benchmark Mortgage Trust, Ser 2020-B21, Cl D | | | | | | | | |
2.000%, 12/17/53 (D) | | | 13,000,000 | | | | 8,438,847 | |
Benchmark Mortgage Trust, Ser 2020-IG3, Cl A4 | | | | | | | | |
2.437%, 09/15/48 (D) | | | 10,000,000 | | | | 8,306,542 | |
BX Commercial Mortgage Trust, Ser 2020-VIV3, Cl B | | | | | | | | |
3.544%, 03/09/44 (A)(D) | | | 8,000,000 | | | | 7,214,710 | |
BXMT, Ser 2020-FL2, Cl A | | | | | | | | |
6.349%, TSFR1M + 1.014%, 02/15/38 (A)(D) | | | 6,570,650 | | | | 6,299,210 | |
CAFL Issuer, Ser 2023-RTL1, Cl A2 | | | | | | | | |
9.300%, 12/28/30 (D)(E) | | | 15,000,000 | | | | 15,171,650 | |
CAFL, Ser 2022-RTL1, Cl A1 | | | | | | | | |
4.250%, 05/28/29 (E) | | | 5,339,881 | | | | 5,313,862 | |
Chase Home Lending Mortgage Trust, Ser 2024-2, Cl A6 | | | | | | | | |
6.500%, 02/25/55 (A)(D) | | | 5,359,425 | | | | 5,422,536 | |
Citigroup Commercial Mortgage Trust, Ser 2015-GC31, Cl C | | | | | | | | |
4.033%, 06/10/48 (A) | | | 5,000,000 | | | | 2,921,393 | |
COMM Mortgage Trust, Ser 2014-UBS6, Cl C | | | | | | | | |
4.434%, 12/10/47 (A) | | | 4,000,000 | | | | 3,595,575 | |
COMM Mortgage Trust, Ser 2015-DC1, Cl D | | | | | | | | |
4.274%, 02/10/48 (A)(D) | | | 9,000,000 | | | | 7,181,158 | |
Commercial Mortgage Trust, Ser 2014-LC15, Cl D | | | | | | | | |
4.765%, 04/10/47 (A)(D) | | | 4,485,770 | | | | 4,251,669 | |
Credit Suisse First Boston Mortgage Securities, Ser 2005-C2, Cl AMFL | | | | | | | | |
5.699%, TSFR1M + 0.364%, 04/15/37 (A) | | | 15,070 | | | | 15,042 | |
Credit Suisse First Boston Mortgage Securities, Ser 2005-C2, Cl AMFX | | | | | | | | |
4.877%, 04/15/37 | | | 1,347 | | | | 1,335 | |
CSMC Trust, Ser 2019-AFC1, Cl A1 | | | | | | | | |
3.573%, 07/25/49 (D)(E) | | | 2,013,861 | | | | 1,922,664 | |
DROP Mortgage Trust, Ser 2021-FILE, Cl D | | | | | | | | |
8.194%, TSFR1M + 2.864%, 10/15/43 (A)(D) | | | 15,000,000 | | | | 12,062,883 | |
Description | | Face Amount | | | Value | |
FHLMC Military Housing Bonds Resecuritization Trust Certificates, Ser 2015-R1, Cl C3 | | | | | | | | |
6.008%, 11/25/52 (A)(D) | | $ | 31,908,653 | | | $ | 27,823,484 | |
FHLMC, Ser 2024-5417, Cl JA | | | | | | | | |
5.500%, 08/25/44 | | | 97,723,883 | | | | 98,937,164 | |
FHLMC, Ser 2024-5425, Cl A | | | | | | | | |
5.500%, 09/25/44 | | | 87,950,872 | | | | 89,072,756 | |
FHLMC, Ser 2024-5429, Cl DV | | | | | | | | |
6.000%, 04/25/35 | | | 13,922,624 | | | | 14,421,654 | |
Fontainebleau Miami Beach Trust, Ser 2019-FBLU, Cl A | | | | | | | | |
3.144%, 12/10/36 (D) | | | 10,000,000 | | | | 9,856,763 | |
FREMF Mortgage Trust, Ser 2016-K54, Cl C | | | | | | | | |
4.052%, 04/25/48 (A)(D) | | | 5,000,000 | | | | 4,862,736 | |
FREMF Mortgage Trust, Ser 2016-K57, Cl C | | | | | | | | |
3.917%, 08/25/49 (A)(D) | | | 8,840,000 | | | | 8,535,168 | |
GNMA, Ser 2022-201, Cl PO, PO | | | | | | | | |
0.000%, 11/20/52 (B)(C) | | | 18,550,110 | | | | 13,996,167 | |
Greystone CRE Notes, Ser 2024-HC3, Cl AS | | | | | | | | |
8.160%, TSFR1M + 2.832%, 03/15/41 (A)(D) | | | 18,000,000 | | | | 17,959,939 | |
GS Mortgage-Backed Securities Trust, Ser 2024-PJ5, Cl A4 | | | | | | | | |
6.500%, 09/25/54 (A)(D) | | | 19,479,582 | | | | 19,741,251 | |
Hudson Yards Mortgage Trust, Ser 2019-30HY, Cl B | | | | | | | | |
3.380%, 07/10/39 (A)(D) | | | 2,500,000 | | | | 2,208,079 | |
JPMDB Commercial Mortgage Securities Trust, Ser 2016-C2, Cl C | | | | | | | | |
3.324%, 06/15/49 (A) | | | 4,328,000 | | | | 3,468,691 | |
JPMorgan Chase Commercial Mortgage Securities, Ser 2007-LD12, Cl AJ | | | | | | | | |
6.349%, 02/15/51 (A) | | | 450,062 | | | | 443,734 | |
JPMorgan Chase Commercial Mortgage Securities, Ser 2007-LD12, Cl J | | | | | | | | |
5.994%, 02/15/51 (A)(F)(G) | | | 1,000,000 | | | | — | |
LStar Commercial Mortgage Trust, Ser 2016-4, Cl AS | | | | | | | | |
3.188%, 03/10/49 (D) | | | 3,000,000 | | | | 2,878,052 | |
MFA Trust, Ser 2022-INV1, Cl A3 | | | | | | | | |
4.250%, 04/25/66 (A)(D) | | | 4,000,000 | | | | 3,405,484 | |
Morgan Stanley Bank of America Merrill Lynch Trust, Ser 2016-C29, Cl C | | | | | | | | |
4.716%, 05/15/49 (A) | | | 2,413,000 | | | | 2,240,283 | |
Sequoia Mortgage Trust, Ser 2024-5, Cl A1 | | | | | | | | |
6.500%, 06/25/54 (A)(D) | | | 7,263,568 | | | | 7,365,716 | |
TRTX Issuer, Ser 2021-FL4, Cl C | | | | | | | | |
7.849%, TSFR1M + 2.514%, 03/15/38 (A)(D) | | | 10,000,000 | | | | 9,378,690 | |
Wells Fargo Commercial Mortgage Trust, Ser 2016-C32, Cl C | | | | | | | | |
4.728%, 01/15/59 (A) | | | 5,000,000 | | | | 4,678,939 | |
The accompanying notes are an integral part of the financial statements.
3

FROST TOTAL RETURN BOND FUND July 31, 2024
Description | | Face Amount | | | Value | |
Wells Fargo Commercial Mortgage Trust, Ser 2016-C32, Cl D | | | | | | | | |
3.788%, 01/15/59 (A)(D) | | $ | 2,000,000 | | | $ | 1,812,426 | |
Wells Fargo Commercial Mortgage Trust, Ser 2016-C34, Cl B | | | | | | | | |
4.089%, 06/15/49 | | | 5,000,000 | | | | 4,689,585 | |
Wells Fargo Commercial Mortgage Trust, Ser 2018-AUS, Cl A | | | | | | | | |
4.058%, 08/17/36 (A)(D) | | | 5,000,000 | | | | 4,768,834 | |
| | | | | | | | 456,076,802 | |
Non-Agency Residential Mortgage-Backed Obligation — 4.5% |
510 Asset Backed Trust, Ser 2021-NPL1, Cl A2 | | | | | | | | |
3.967%, 06/25/61 (D)(E) | | | 20,066,117 | | | | 19,941,237 | |
510 Asset Backed Trust, Ser 2021-NPL2, Cl A2 | | | | | | | | |
4.090%, 06/25/61 (D)(E) | | | 7,023,858 | | | | 7,059,887 | |
Angel Oak Mortgage Trust, Ser 2021-4, Cl A3 | | | | | | | | |
1.446%, 01/20/65 (A)(D) | | | 1,866,302 | | | | 1,554,698 | |
Brean Asset Backed Securities Trust, Ser 2023-RM7, Cl A1 | | | | | | | | |
4.500%, 03/25/78 (A)(D) | | | 8,649,966 | | | | 8,208,431 | |
CAFL, Ser 2021-RTL1, Cl A1 | | | | | | | | |
2.239%, 03/28/29 (D)(E) | | | 1,520,790 | | | | 1,485,641 | |
Carrington Mortgage Loan Trust, Ser 2007-FRE1, Cl M8 | | | | | | | | |
2.461%, US0001M + 2.250%, 02/25/37 (A)(F)(G) | | | 1,000,000 | | | | — | |
FirstKey Mortgage Trust, Ser 2015-1, Cl A3 | | | | | | | | |
3.500%, 03/25/45 (A)(D) | | | 738,947 | | | | 674,999 | |
Galton Funding Mortgage Trust, Ser 2019-1, Cl A22 | | | | | | | | |
4.000%, 02/25/59 (A)(D) | | | 95,048 | | | | 89,407 | |
Galton Funding Mortgage Trust, Ser 2019-2, Cl A21 | | | | | | | | |
4.000%, 06/25/59 (A)(D) | | | 1,103,897 | | | | 1,022,423 | |
GS Mortgage-Backed Securities Trust, Ser 2024-RPL2, Cl A2 | | | | | | | | |
4.378%, 07/25/61 (A)(D) | | | 15,000,000 | | | | 14,009,010 | |
JP Morgan Mortgage Trust Series, Ser 2024-3, Cl A3 | | | | | | | | |
3.000%, 05/25/54 (A)(D) | | | 9,695,337 | | | | 8,227,405 | |
JP Morgan Mortgage Trust, Ser 2024-2, Cl A3 | | | | | | | | |
6.000%, 08/25/54 (A)(D) | | | 7,093,159 | | | | 7,094,542 | |
JP Morgan Mortgage Trust, Ser 2024-2, Cl B2 | | | | | | | | |
7.424%, 08/25/54 (A)(D) | | | 2,983,951 | | | | 3,197,650 | |
PRET, Ser 2021-NPL3, Cl A2 | | | | | | | | |
3.721%, 07/25/51 (D)(E) | | | 4,769,744 | | | | 4,568,446 | |
PRET, Ser 2021-NPL5, Cl A2 | | | | | | | | |
4.704%, 10/25/51 (D)(E) | | | 7,000,000 | | | | 6,915,931 | |
PRET, Ser 2021-RN3, Cl A1 | | | | | | | | |
1.843%, 09/25/51 (D)(E) | | | 5,851,520 | | | | 5,751,483 | |
PRET, Ser 2021-RN4, Cl A2 | | | | | | | | |
5.194%, 10/25/51 (A)(D) | | | 6,000,000 | | | | 6,075,526 | |
PRET, Ser 2024-NPL3, Cl A1 | | | | | | | | |
7.520%, 04/27/54 (D)(E) | | | 5,905,613 | | | | 5,957,594 | |
PRET, Ser 2024-RN2, Cl A1 | | | | | | | | |
7.125%, 04/25/54 (D)(E) | | | 4,988,028 | | | | 5,028,177 | |
Description | | Face Amount | | | Value | |
Pretium Mortgage Credit Partners I, Ser 2021-NPL2, Cl A2 | | | | | | | | |
3.844%, 06/27/60 (D)(E) | | $ | 2,758,035 | | | $ | 2,616,510 | |
PRPM, Ser 2021-10, Cl A2 | | | | | | | | |
4.826%, 10/25/26 (D)(E) | | | 8,000,000 | | | | 8,357,551 | |
PRPM, Ser 2021-5, Cl A2 | | | | | | | | |
6.721%, 06/25/26 (D)(E) | | | 5,043,595 | | | | 5,190,263 | |
PRPM, Ser 2024-2, Cl A1 | | | | | | | | |
7.026%, 03/25/29 (D)(E) | | | 1,902,543 | | | | 1,921,338 | |
PRPM, Ser 2024-3, Cl A1 | | | | | | | | |
6.994%, 05/25/29 (D)(E) | | | 4,809,352 | | | | 4,844,176 | |
PSMC Trust, Ser 2020-2, Cl A2 | | | | | | | | |
3.000%, 05/25/50 (A)(D) | | | 521,622 | | | | 461,231 | |
RCO VI Mortgage, Ser 2022-1, Cl A2 | | | | | | | | |
5.250%, 01/25/27 (D)(E) | | | 5,000,000 | | | | 4,913,119 | |
Sequoia Mortgage Trust, Ser 2013-4, Cl AIO1, IO | | | | | | | | |
0.844%, 04/25/43 (A)(D) | | | 44,445,684 | | | | 1,036,260 | |
Toorak Mortgage Trust, Ser 2024-RRTL1, Cl M1 | | | | | | | | |
9.162%, 02/25/39 (A)(D) | | | 1,500,000 | | | | 1,511,697 | |
VOLT CIII, Ser 2021-CF1, Cl A2 | | | | | | | | |
3.967%, 08/25/51 (D)(E) | | | 3,303,000 | | | | 2,766,457 | |
VOLT, Ser 2021-CF2, Cl A2 | | | | | | | | |
5.316%, 11/27/51 (D)(E) | | | 4,000,000 | | | | 3,349,288 | |
WFRBS Commercial Mortgage Trust, Ser 2014-C25, Cl D | | | | | | | | |
3.803%, 11/15/47 (A)(D) | | | 7,310,000 | | | | 6,588,319 | |
| | | | | | | | 150,418,696 | |
Total Mortgage-Backed Securities | | | | |
(Cost $1,033,992,445) | | | | | | | 1,029,833,799 | |
| | | | | | | | | |
U.S. TREASURY OBLIGATIONS — 26.4% |
U.S. Treasury Bill | | | | | | | | |
5.268%, 08/06/24 (H) | | | 2,000,000 | | | | 1,998,537 | |
5.251%, 08/15/24 (H) | | | 2,000,000 | | | | 1,995,905 | |
U.S. Treasury Bonds | | | | | | | | |
4.750%, 11/15/43 | | | 25,000,000 | | | | 26,109,375 | |
4.625%, 05/15/44 | | | 25,000,000 | | | | 25,675,781 | |
4.500%, 02/15/44 | | | 35,000,000 | | | | 35,350,000 | |
4.375%, 08/15/43 | | | 165,000,000 | | | | 164,194,336 | |
4.250%, 02/15/54 | | | 10,000,000 | | | | 9,834,375 | |
4.125%, 08/15/53 | | | 5,000,000 | | | | 4,808,594 | |
4.000%, 11/15/42 to 11/15/52 | | | 135,000,000 | | | | 127,801,172 | |
3.875%, 05/15/43 | | | 85,000,000 | | | | 79,103,125 | |
3.625%, 02/15/53 | | | 25,000,000 | | | | 21,958,008 | |
3.250%, 05/15/42 | | | 125,000,000 | | | | 107,275,390 | |
U.S. Treasury Notes | | | | | | | | |
4.875%, 04/30/26 | | | 50,000,000 | | | | 50,416,016 | |
4.500%, 03/31/26 | | | 10,000,000 | | | | 10,014,453 | |
4.125%, 09/30/27 | | | 75,000,000 | | | | 75,196,289 | |
4.000%, 01/31/31 to 02/15/34 | | | 40,000,000 | | | | 40,015,234 | |
3.875%, 08/15/33 | | | 70,000,000 | | | | 69,081,250 | |
3.750%, 12/31/30 | | | 40,000,000 | | | | 39,518,750 | |
Total U.S. Treasury Obligations | | | | |
(Cost $904,616,623) | | | 890,346,590 | |
The accompanying notes are an integral part of the financial statements.
4

FROST TOTAL RETURN BOND FUND July 31, 2024
Description | | Face Amount | | | Value | |
CORPORATE OBLIGATIONS — 18.5% |
Communication Services — 0.1% |
Warnermedia Holdings | | | | | | | | |
4.279%, 03/15/32 | | $ | 5,000,000 | | | $ | 4,337,242 | |
| | | | | | | | | |
Consumer Discretionary — 1.8% |
Choice Hotels International | | | | | | | | |
3.700%, 12/01/29 | | | 8,000,000 | | | | 7,344,975 | |
3.700%, 01/15/31 | | | 3,000,000 | | | | 2,706,640 | |
Cornell University | | | | | | | | |
4.835%, 06/15/34 | | | 2,000,000 | | | | 2,034,418 | |
Cruise Yacht Upper HoldCo | | | | | | | | |
11.875%, 07/05/28 | | | 2,000,000 | | | | 2,050,000 | |
Hyundai Capital America | | | | | | | | |
5.300%, 01/08/29(D) | | | 5,000,000 | | | | 5,063,730 | |
JBS USA Holding Lux Sarl | | | | | | | | |
7.250%, 11/15/53(D) | | | 4,863,000 | | | | 5,367,575 | |
6.500%, 12/01/52 | | | 5,000,000 | | | | 5,047,860 | |
NES Fircroft Bondco | | | | | | | | |
11.750%, 09/29/26(D) | | | 2,875,000 | | | | 3,033,125 | |
Nissan Motor Acceptance | | | | | | | | |
7.050%, 09/15/28(D) | | | 2,000,000 | | | | 2,103,580 | |
STL Holding | | | | | | | | |
8.750%, 02/15/29(D) | | | 8,000,000 | | | | 8,328,861 | |
TransJamaican Highway | | | | | | | | |
5.750%, 10/10/36(D) | | | 1,337,395 | | | | 1,193,625 | |
VistaJet Malta Finance | | | | | | | | |
7.875%, 05/01/27(D) | | | 14,863,000 | | | | 13,453,744 | |
6.375%, 02/01/30(D) | | | 2,000,000 | | | | 1,593,152 | |
William Marsh Rice University | | | | | | | | |
2.598%, 05/15/50 | | | 1,810,000 | | | | 1,186,291 | |
| | | | | | | | 60,507,576 | |
Consumer Staples — 0.5% |
J M Smucker | | | | | | | | |
6.200%, 11/15/33 | | | 5,000,000 | | | | 5,394,581 | |
JBS USA Holding Lux Sarl | | | | | | | | |
6.750%, 03/15/34(D) | | | 10,000,000 | | | | 10,701,460 | |
Philip Morris International | | | | | | | | |
5.125%, 02/15/30 | | | 2,500,000 | | | | 2,541,258 | |
| | | | | | | | 18,637,299 | |
Energy — 3.6% |
Apache | | | | | | | | |
7.750%, 12/15/29 | | | 4,138,000 | | | | 4,570,740 | |
Banco Santander | | | | | | | | |
9.625%, H15T5Y + 5.298%, 02/21/72(A) | | | 5,000,000 | | | | 5,706,800 | |
Barclays | | | | | | | | |
9.625%, USISSO05 + 5.775%, 03/15/73(A) | | | 5,000,000 | | | | 5,460,510 | |
6.692%, SOFRRATE + 2.620%, 09/13/34(A) | | | 2,000,000 | | | | 2,168,733 | |
Cantor Fitzgerald | | | | | | | | |
7.200%, 12/12/28(D) | | | 1,000,000 | | | | 1,052,150 | |
Danske Bank | | | | | | | | |
5.705%, H15T1Y + 1.400%, 03/01/30(A)(D) | | | 5,000,000 | | | | 5,113,302 | |
New England Power | | | | | | | | |
2.807%, 10/06/50(D) | | | 5,000,000 | | | | 3,114,216 | |
Paratus Energy Services | | | | | | | | |
9.000% PIK, 07/15/26(D) | | | 4,433,363 | | | | 4,433,363 | |
9.000% PIK, 07/15/26 | | | 1,523,728 | | | | 1,523,728 | |
Paratus Energy Services | | | | | | | | |
9.500%, 06/27/29 | | | 37,500,000 | | | | 37,673,437 | |
Description | | Face Amount | | | Value | |
Petroleos Mexicanos | | | | | | | | |
10.000%, 02/07/33 | | $ | 5,000,000 | | | $ | 5,097,020 | |
Puffin Finance Sarl | | | | | | | | |
15.000%, 09/11/25 | | | 14,000,000 | | | | 14,210,000 | |
Varel Energy Solutions | | | | | | | | |
12.250%, 04/07/28 | | | 875,000 | | | | 875,000 | |
Waldorf Energy Finance | | | | | | | | |
12.000%, 03/02/26(G) | | | 7,439,085 | | | | 5,162,725 | |
0.000%, 06/02/73(B) | | | 1,832,387 | | | | 1,273,509 | |
Waldorf Production UK | | | | | | | | |
13.000%, 09/02/25 | | | 11,021,065 | | | | 10,910,854 | |
13.000%, 09/02/25 | | | 10,624,769 | | | | 10,518,521 | |
| | | | | | | | 118,864,608 | |
Financials — 7.3% |
BAC Capital Trust XIV | | | | | | | | |
6.001%, TSFR3M + 0.662%, 09/15/72(A) | | | 9,870,000 | | | | 8,361,867 | |
Barclays | | | | | | | | |
8.000%, H15T5Y + 5.431%, 12/15/72(A) | | | 30,250,000 | | | | 31,068,202 | |
Charles Schwab | | | | | | | | |
4.000%, H15T10Y + 3.079%, 03/01/73(A) | | | 2,000,000 | | | | 1,688,496 | |
Citigroup | | | | | | | | |
6.174%, SOFRRATE + 2.661%, 05/25/34(A) | | | 5,000,000 | | | | 5,190,544 | |
Comerica | | | | | | | | |
5.982%, SOFRRATE + 2.155%, 01/30/30(A) | | | 10,000,000 | | | | 10,025,302 | |
4.000%, 02/01/29 | | | 13,300,000 | | | | 12,443,213 | |
Comerica Bank | | | | | | | | |
7.875%, 09/15/26 | | | 24,790,000 | | | | 25,686,142 | |
Credit Suisse Group | | | | | | | | |
5.100%, H15T5Y + 3.293%, 07/24/73(F)(G) | | | 10,000,000 | | | | 1,100,000 | |
Deutsche Bank | | | | | | | | |
7.500%, USISDA05 + 5.003%, 04/30/73(A) | | | 4,000,000 | | | | 3,955,934 | |
Deutsche Bank NY | | | | | | | | |
7.146%, SOFRRATE + 2.520%, 07/13/27(A) | | | 4,000,000 | | | | 4,133,082 | |
7.079%, SOFRRATE + 3.650%, 02/10/34(A) | | | 10,000,000 | | | | 10,417,754 | |
3.742%, SOFRRATE + 2.257%, 01/07/33(A) | | | 2,000,000 | | | | 1,684,865 | |
Enova International | | | | | | | | |
8.500%, 09/15/25(D) | | | 3,007,000 | | | | 3,010,708 | |
F&G Annuities & Life | | | | | | | | |
7.400%, 01/13/28 | | | 7,000,000 | | | | 7,315,466 | |
Farmers Exchange Capital | | | | | | | | |
7.200%, 07/15/48(D) | | | 3,000,000 | | | | 2,860,897 | |
7.050%, 07/15/28(D) | | | 11,075,000 | | | | 11,571,996 | |
Horace Mann Educators | | | | | | | | |
7.250%, 09/15/28 | | | 5,000,000 | | | | 5,371,265 | |
Intesa Sanpaolo MTN | | | | | | | | |
4.000%, 09/23/29(D) | | | 5,000,000 | | | | 4,710,860 | |
JPMorgan Chase | | | | | | | | |
4.979%, SOFRRATE + 0.930%, 07/22/28(A) | | | 10,000,000 | | | | 10,051,560 | |
KeyBank MTN | | | | | | | | |
5.000%, 01/26/33 | | | 5,000,000 | | | | 4,733,747 | |
4.700%, 01/26/26 | | | 20,750,000 | | | | 20,513,039 | |
The accompanying notes are an integral part of the financial statements.
5

FROST TOTAL RETURN BOND FUND July 31, 2024
Description | | Face Amount | | | Value | |
KeyCorp | | | | | | | | |
6.401%, SOFRINDX + 2.420%, 03/06/35(A) | | $ | 5,000,000 | | | $ | 5,215,553 | |
4.100%, 04/30/28 | | | 7,113,000 | | | | 6,839,976 | |
Royal Bank of Canada MTN | | | | | | | | |
5.500%, 04/28/33 | | | 10,000,000 | | | | 9,999,952 | |
5.200%, 01/31/33 | | | 3,000,000 | | | | 2,957,536 | |
SBL Holdings | | | | | | | | |
7.000%, H15T5Y + 5.580%, 05/13/73(A)(D) | | | 2,500,000 | | | | 2,216,385 | |
6.500%, H15T5Y + 5.620%, 11/13/72(A)(D) | | | 14,492,000 | | | | 12,131,572 | |
Synchrony Bank | | | | | | | | |
5.400%, 08/22/25 | | | 8,144,000 | | | | 8,123,179 | |
Synovus Bank | | | | | | | | |
5.625%, 02/15/28 | | | 8,000,000 | | | | 7,915,563 | |
US Bancorp | | | | | | | | |
5.836%, SOFRRATE + 2.260%, 06/12/34(A) | | | 4,000,000 | | | | 4,152,377 | |
3.700%, H15T5Y + 2.541%, 01/15/73(A) | | | 3,273,000 | | | | 2,961,161 | |
| | | | | | | | 248,408,193 | |
Industrials — 2.4% |
AerCap Ireland Capital DAC | | | | | | | | |
6.450%, 04/15/27 | | | 3,662,000 | | | | 3,790,781 | |
Boeing | | | | | | | | |
7.008%, 05/01/64(D) | | | 7,000,000 | | | | 7,419,698 | |
5.875%, 02/15/40 | | | 15,355,000 | | | | 14,819,262 | |
2.950%, 02/01/30 | | | 3,344,000 | | | | 2,940,665 | |
Brightline East | | | | | | | | |
11.000%, 01/31/30(D) | | | 2,000,000 | | | | 1,819,692 | |
Brundage-Bone Concrete Pumping Holdings | | | | | | | | |
6.000%, 02/01/26(D) | | | 13,294,000 | | | | 13,245,518 | |
Burlington Northern Santa Fe | | | | | | | | |
7.290%, 06/01/36 | | | 5,000,000 | | | | 6,090,831 | |
Concentrix | | | | | | | | |
6.850%, 08/02/33 | | | 12,000,000 | | | | 12,248,166 | |
Flowserve | | | | | | | | |
3.500%, 10/01/30 | | | 4,000,000 | | | | 3,668,772 | |
Hawaiian Airlines 2013-1 Class A Pass Through Certificates | | | | | | | | |
3.900%, 01/15/26 | | | 1,225,346 | | | | 1,180,820 | |
Leidos | | | | | | | | |
2.300%, 02/15/31 | | | 3,291,000 | | | | 2,786,546 | |
nVent Finance Sarl | | | | | | | | |
5.650%, 05/15/33 | | | 3,000,000 | | | | 3,057,379 | |
Regal Rexnord | | | | | | | | |
6.300%, 02/15/30 | | | 4,500,000 | | | | 4,693,407 | |
Twma Finance | | | | | | | | |
13.000%, 02/08/27 | | | 3,500,000 | | | | 3,527,766 | |
| | | | | | | | 81,289,303 | |
Information Technology — 2.0% |
Apple | | | | | | | | |
4.850%, 05/10/53 | | | 7,000,000 | | | | 6,986,081 | |
3.850%, 05/04/43 | | | 10,000,000 | | | | 8,662,576 | |
Avnet | | | | | | | | |
3.000%, 05/15/31 | | | 7,000,000 | | | | 5,999,111 | |
Gartner | | | | | | | | |
3.625%, 06/15/29(D) | | | 3,000,000 | | | | 2,790,861 | |
Kyndryl Holdings | | | | | | | | |
4.100%, 10/15/41 | | | 26,481,000 | | | | 20,763,545 | |
Description | | Face Amount | | | Value | |
Motorola Solutions | | | | | | | | |
4.600%, 05/23/29 | | $ | 21,435,000 | | | $ | 21,253,280 | |
| | | | | | | | 66,455,454 | |
Materials — 0.0% |
Nacional del Cobre de Chile | | | | | | | | |
3.150%, 01/15/51 (D) | | | 500,000 | | | | 316,646 | |
| | | | | | | | | |
Real Estate — 0.2% |
GLP Capital | | | | | | | | |
3.250%, 01/15/32 | | | 750,000 | | | | 643,318 | |
Invitation Homes Operating Partnership | | | | | | | | |
2.000%, 08/15/31 | | | 2,000,000 | | | | 1,624,523 | |
Sabra Health Care | | | | | | | | |
3.200%, 12/01/31 | | | 3,920,000 | | | | 3,346,214 | |
| | | | | | | | 5,614,055 | |
Utilities — 0.6% |
Pacific Gas and Electric | | | | | | | | |
4.500%, 07/01/40 | | | 11,000,000 | | | | 9,357,256 | |
3.750%, 08/15/42 | | | 5,000,000 | | | | 3,733,249 | |
Sempra | | | | | | | | |
6.000%, 10/15/39 | | | 6,000,000 | | | | 6,256,174 | |
| | | | | | | | 19,346,679 | |
Total Corporate Obligations | | | | | | | | |
(Cost $619,983,852) | | | | | | | 623,777,055 | |
| | | | | | | | | |
ASSET-BACKED SECURITIES — 10.6% |
Automotive — 7.0% |
ACC Auto Trust, Ser 2021-A, Cl D | | | | | | | | |
6.100%, 06/15/29 (D) | | | 13,000,000 | | | | 12,979,284 | |
American Credit Acceptance Receivables Trust, Ser 2023-3, Cl D | | | | | | | | |
6.820%, 10/12/29 (D) | | | 5,000,000 | | | | 5,089,321 | |
American Credit Acceptance Receivables Trust, Ser 2023-4, Cl D | | | | | | | | |
7.650%, 09/12/30 (D) | | | 15,000,000 | | | | 15,624,966 | |
American Credit Acceptance Receivables Trust, Ser 2024-1, Cl C | | | | | | | | |
5.630%, 01/14/30 (D) | | | 10,000,000 | | | | 10,004,498 | |
American Credit Acceptance Receivables Trust, Ser 2024-2, Cl C | | | | | | | | |
6.240%, 04/12/30 (D) | | | 12,000,000 | | | | 12,149,012 | |
American Credit Acceptance Receivables Trust, Ser 2024-3, Cl B | | | | | | | | |
5.660%, 08/14/28 (D) | | | 3,000,000 | | | | 3,013,179 | |
American Credit Acceptance Receivables Trust, Ser 2024-3, Cl C | | | | | | | | |
5.730%, 07/12/30 (D) | | | 8,000,000 | | | | 8,045,770 | |
American Credit Acceptance Receivables Trust, Ser 2024-3, Cl D | | | | | | | | |
6.040%, 07/12/30 (D) | | | 8,000,000 | | | | 8,083,544 | |
Avid Automobile Receivables Trust, Ser 2023-1, Cl E | | | | | | | | |
11.140%, 05/15/29 (D) | | | 5,595,000 | | | | 5,730,444 | |
The accompanying notes are an integral part of the financial statements.
6

FROST TOTAL RETURN BOND FUND July 31, 2024
Description | | Face Amount | | | Value | |
CarNow Auto Receivables Trust, Ser 2021-2A, Cl E | | | | | | | | |
4.450%, 02/15/28 (D) | | $ | 4,000,000 | | | $ | 3,787,259 | |
CarNow Auto Receivables Trust, Ser 2023-1A, Cl E | | | | | | | | |
12.040%, 04/16/29 (D) | | | 5,000,000 | | | | 4,840,361 | |
Centerline Logistics, Ser 2023-1, Cl A2 | | | | | | | | |
9.750%, 12/15/27 (D) | | | 11,105,468 | | | | 11,334,223 | |
CIG Auto Receivables Trust, Ser 2021-1A, Cl E | | | | | | | | |
4.450%, 05/12/28 (D) | | | 7,000,000 | | | | 6,857,013 | |
DT Auto Owner Trust, Ser 2021-3A, Cl D | | | | | | | | |
1.310%, 05/17/27 (D) | | | 5,500,000 | | | | 5,263,319 | |
EnFin Residential Solar Receivables Trust, Ser 2024-1A, Cl B | | | | | | | | |
8.440%, 02/20/55 (D) | | | 3,903,819 | | | | 3,904,384 | |
ENFIN, Ser 2024-1A, Cl A | | | | | | | | |
6.650%, 02/20/55 (D) | | | 4,879,773 | | | | 5,047,626 | |
EverBright Solar Trust, Ser 2024-A, Cl B | | | | | | | | |
8.130%, 06/22/54 (D) | | | 6,211,119 | | | | 6,208,919 | |
First Investors Auto Owner Trust, Ser 2022-1A, Cl E | | | | | | | | |
5.410%, 06/15/29 (D) | | | 2,280,000 | | | | 2,166,485 | |
First Investors Auto Owner Trust, Ser 2023-1A, Cl D | | | | | | | | |
7.740%, 01/15/31 (D) | | | 9,000,000 | | | | 9,435,500 | |
Flagship Credit Auto Trust, Ser 2020-1, Cl E | | | | | | | | |
3.520%, 06/15/27 (D) | | | 7,931,000 | | | | 7,693,485 | |
Flagship Credit Auto Trust, Ser 2020-2, Cl E | | | | | | | | |
8.220%, 09/15/27 (D) | | | 8,000,000 | | | | 8,002,227 | |
Ford Credit Auto Lease Trust, Ser 2023-B, Cl C | | | | | | | | |
6.430%, 04/15/27 | | | 5,000,000 | | | | 5,110,191 | |
Foursight Capital Automobile Receivables Trust, Ser 2022-1, Cl E | | | | | | | | |
4.690%, 08/15/29 (D) | | | 4,230,000 | | | | 3,851,322 | |
GLS Auto Receivables Issuer Trust, Ser 2020-1A, Cl D | | | | | | | | |
3.680%, 11/16/26 (D) | | | 3,921,370 | | | | 3,910,458 | |
GLS Auto Receivables Issuer Trust, Ser 2022-1A, Cl E | | | | | | | | |
5.640%, 05/15/29 (D) | | | 4,000,000 | | | | 3,863,264 | |
GLS Auto Receivables Issuer Trust, Ser 2022-3A, Cl E | | | | | | | | |
8.350%, 10/15/29 (D) | | | 1,990,000 | | | | 2,021,545 | |
Hertz Vehicle Financing, Ser 2021-1A, Cl D | | | | | | | | |
3.980%, 12/26/25 (D) | | | 8,333,333 | | | | 8,260,321 | |
Octane Receivables Trust, Ser 2021-2A, Cl B | | | | | | | | |
2.020%, 09/20/28 (D) | | | 3,000,000 | | | | 2,885,209 | |
Santander Consumer Auto Receivables Trust, Ser 2020-AA, Cl F | | | | | | | | |
10.120%, 01/16/29 (D) | | | 7,529,363 | | | | 7,590,745 | |
Description | | Face Amount | | | Value | |
Santander Consumer Auto Receivables Trust, Ser 2020-BA, Cl F | | | | | | | | |
7.030%, 08/15/28 (D) | | $ | 6,250,000 | | | $ | 6,289,858 | |
Tricolor Auto Securitization Trust, Ser 2022-1A, Cl F | | | | | | | | |
9.800%, 07/16/29 (D) | | | 4,000,000 | | | | 3,932,108 | |
Tricolor Auto Securitization Trust, Ser 2023-1A, Cl F | | | | | | | | |
16.000%, 06/17/30 (D) | | | 11,910,000 | | | | 12,544,392 | |
United Auto Credit Securitization Trust, Ser 2022-2, Cl D | | | | | | | | |
6.840%, 01/10/28 (D) | | | 5,389,000 | | | | 5,276,871 | |
Veros Auto Receivables Trust, Ser 2021-1, Cl C | | | | | | | | |
3.640%, 08/15/28 (D) | | | 4,320,000 | | | | 4,313,977 | |
VFI ABS, Ser 2023-1A, Cl B | | | | | | | | |
7.780%, 08/24/29 (D) | | | 10,000,000 | | | | 10,171,923 | |
| | | | | | | | 235,283,003 | |
Credit Card — 0.3% |
Capital One Multi-Asset Execution Trust, Ser 2023-A1, Cl A | | | | | | | | |
4.420%, 05/15/28 | | | 4,000,000 | | | | 3,978,425 | |
Chase Issuance Trust, Ser 2023-A2, Cl A | | | | | | | | |
5.080%, 09/15/30 | | | 7,000,000 | | | | 7,171,718 | |
| | | | | | | | 11,150,143 | |
Other Asset-Backed Securities — 3.3% |
Amur Equipment Finance Receivables IX, Ser 2021-1A, Cl D | | | | | | | | |
2.300%, 11/22/27 (D) | | | 1,250,000 | | | | 1,233,592 | |
Amur Equipment Finance Receivables XI, Ser 2022-2A, Cl E | | | | | | | | |
9.320%, 10/22/29 (D) | | | 2,600,000 | | | | 2,622,774 | |
BHG Securitization Trust, Ser 2022-B, Cl D | | | | | | | | |
6.690%, 06/18/35 (D) | | | 5,993,367 | | | | 5,791,129 | |
CAL Funding IV, Ser 2020-1A, Cl B | | | | | | | | |
3.500%, 09/25/45 (D) | | | 1,146,083 | | | | 1,056,490 | |
CF Hippolyta Issuer, Ser 2020-1, Cl A2 | | | | | | | | |
1.990%, 07/15/60 (D) | | | 5,236,745 | | | | 4,620,995 | |
CIFC Funding, Ser 2018-1A, Cl A | | | | | | | | |
6.541%, TSFR3M + 1.262%, 04/18/31 (A)(D) | | | 6,806,443 | | | | 6,824,541 | |
CIFC Funding, Ser 2022-2A, Cl A1 | | | | | | | | |
6.600%, TSFR3M + 1.320%, 04/19/35 (A)(D) | | | 4,500,000 | | | | 4,505,269 | |
CIFC Funding, Ser 2022-2A, Cl B | | | | | | | | |
7.130%, TSFR3M + 1.850%, 04/19/35 (A)(D) | | | 9,125,000 | | | | 9,134,317 | |
CP EF Asset Securitization I, Ser 2022-1A, Cl A | | | | | | | | |
5.960%, 04/15/30 (D) | | | 1,108,203 | | | | 1,105,698 | |
Global SC Finance VII Srl, Ser 2020-1A, Cl A | | | | | | | | |
2.170%, 10/17/40 (D) | | | 2,289,614 | | | | 2,142,153 | |
JGWPT XXVI LLC, Ser 2012-2A, Cl B | | | | | | | | |
6.770%, 10/17/61 (D) | | | 1,204,568 | | | | 1,222,948 | |
The accompanying notes are an integral part of the financial statements.
7

FROST TOTAL RETURN BOND FUND July 31, 2024
Description | | Face Amount | | | Value | |
Kapitus Asset Securitization, Ser 2022-1A, Cl A | | | | | | | | |
3.382%, 07/10/28 (D) | | $ | 8,000,000 | | | $ | 7,847,691 | |
LCM Loan Income Fund I Income Note Issuer, Ser 2018-27A, Cl A1 | | | | | | | | |
6.628%, TSFR3M + 1.342%, 07/16/31 (A)(D) | | | 7,122,252 | | | | 7,130,557 | |
Libra Solutions, Ser 2023-1A, Cl A | | | | | | | | |
7.000%, 02/15/35 (D) | | | 1,894,548 | | | | 1,892,521 | |
Libra Solutions, Ser 2023-1A, Cl B | | | | | | | | |
10.250%, 02/15/35 (D) | | | 2,749,368 | | | | 2,738,795 | |
Marlette Funding Trust, Ser 2020-1A, Cl D | | | | | | | | |
3.540%, 03/15/30 (D) | | | 56,293 | | | | 56,227 | |
Mosaic Solar Loan Trust, Ser 2020-2A, Cl B | | | | | | | | |
2.210%, 08/20/46 (D) | | | 2,288,791 | | | | 1,871,662 | |
OHA Credit Funding 7, Ser 2022-7A, Cl AR | | | | | | | | |
6.580%, TSFR3M + 1.300%, 02/24/37 (A)(D) | | | 25,000,000 | | | | 25,046,800 | |
Oportun Issuance Trust, Ser 2022-A, Cl C | | | | | | | | |
7.400%, 06/09/31 (D) | | | 3,000,000 | | | | 2,995,246 | |
Pawneee Equipment Receivables, Ser 2021-1, Cl C | | | | | | | | |
2.300%, 07/15/27 (D) | | | 4,700,000 | | | | 4,517,094 | |
Pawneee Equipment Receivables, Ser 2022-1, Cl C | | | | | | | | |
6.010%, 07/17/28 (D) | | | 4,000,000 | | | | 3,896,620 | |
Sapphire Aviation Finance I, Ser 2018-1A, Cl B | | | | | | | | |
5.926%, 03/15/40 (D) | | | 743,407 | | | | 587,322 | |
Textainer Marine Containers VII, Ser 2020-2A, Cl B | | | | | | | | |
3.340%, 09/20/45 (D) | | | 1,256,938 | | | | 1,166,117 | |
Triton Container Finance VIII, Ser 2020-1A, Cl B | | | | | | | | |
3.740%, 09/20/45 (D) | | | 674,167 | | | | 626,668 | |
VR Funding, Ser 2020-1A, Cl A | | | | | | | | |
2.790%, 11/15/50 (D) | | | 5,351,992 | | | | 4,829,706 | |
VR Funding, Ser 2020-1A, Cl C | | | | | | | | |
6.420%, 11/15/50 (D) | | | 3,341,563 | | | | 3,060,994 | |
| | | | | | | | 108,523,926 | |
Student Loan — 0.0% |
Commonbond Student Loan Trust, Ser 2017-AGS, Cl A1 | | | | | | | | |
2.550%, 05/25/41 (D) | | | 941,662 | | | | 890,173 | |
Total Asset-Backed Securities | | | | |
(Cost $355,952,416) | | | | | | | 355,847,245 | |
| | | | | | | | | |
COLLATERALIZED LOAN OBLIGATIONS — 3.9% |
AMMC CLO 26, Ser 2023-26A, Cl B1 | | | | | | | | |
7.751%, TSFR3M + 2.450%, 04/15/36 (A)(D) | | | 7,500,000 | | | | 7,518,112 | |
BlueMountain CLO, Ser 2021-2A, Cl A2R2 | | | | | | | | |
7.287%, TSFR3M + 1.962%, 08/20/32 (A)(D) | | | 10,000,000 | | | | 10,067,260 | |
Description | | Face Amount | | | Value | |
Carlyle Global Market Strategies, Ser 2018-3A, Cl A1A2 | | | | | | | | |
6.743%, TSFR3M + 1.442%, 01/14/32 (A)(D) | | $ | 19,219,081 | | | $ | 19,219,043 | |
Carlyle Global Market Strategies, Ser 2018-3RA, Cl A1A | | | | | | | | |
6.575%, TSFR3M + 1.312%, 07/27/31 (A)(D) | | | 8,299,691 | | | | 8,311,651 | |
Carlyle Global Market Strategies, Ser 2018-5A, Cl A1RR | | | | | | | | |
6.703%, TSFR3M + 1.402%, 07/15/31 (A)(D) | | | 10,768,692 | | | | 10,782,153 | |
Golub Capital Partners, Ser 2017-21A, Cl AR | | | | | | | | |
7.016%, TSFR3M + 1.732%, 01/25/31 (A)(D) | | | 4,986,802 | | | | 4,988,976 | |
Golub Capital Partners, Ser 2017-24A, Cl AR | | | | | | | | |
7.198%, TSFR3M + 1.862%, 11/05/29 (A)(D) | | | 5,185,899 | | | | 5,189,814 | |
Golub Capital Partners, Ser 2021-19RA, Cl B1R2 | | | | | | | | |
7.094%, TSFR3M + 1.812%, 04/20/34 (A)(D) | | | 20,000,000 | | | | 19,996,120 | |
Oaktree CLO, Ser 2021-3A, Cl BR | | | | | | | | |
7.294%, TSFR3M + 2.012%, 10/20/34 (A)(D) | | | 13,500,000 | | | | 13,532,711 | |
Texas Debt Capital CLO, Ser 2023-1A, Cl A | | | | | | | | |
7.082%, TSFR3M + 1.800%, 04/20/36 (A)(D) | | | 4,000,000 | | | | 4,023,028 | |
Venture XIX, Ser 2018-19A, Cl ARR | | | | | | | | |
6.823%, TSFR3M + 1.522%, 01/15/32 (A)(D) | | | 18,989,387 | | | | 19,018,878 | |
Wind River CLO, Ser 2024-1A, Cl D | | | | | | | | |
9.548%, TSFR3M + 4.250%, 04/20/37 (A)(D) | | | 10,000,000 | | | | 10,186,760 | |
Total Collateralized Loan Obligations | | | | |
(Cost $132,449,552) | | | | | | | 132,834,506 | |
| | | | | | | | | |
U.S. GOVERNMENT AGENCY OBLIGATIONS — 2.6% |
FFCB | | | | | | | | |
6.490%, 11/15/38 | | | 2,000,000 | | | | 2,000,988 | |
6.250%, 07/26/38 | | | 2,000,000 | | | | 2,000,487 | |
6.080%, 04/28/33 | | | 5,000,000 | | | | 5,001,089 | |
6.050%, 08/22/31 | | | 3,000,000 | | | | 2,999,951 | |
6.030%, 07/29/39 | | | 2,500,000 | | | | 2,500,530 | |
6.010%, 03/28/44 | | | 2,000,000 | | | | 2,005,254 | |
5.980%, 12/27/33 | | | 2,500,000 | | | | 2,500,085 | |
5.940%, 01/08/44 | | | 7,500,000 | | | | 7,462,627 | |
5.930%, 03/28/33 | | | 3,000,000 | | | | 3,000,458 | |
5.490%, 09/22/42 | | | 1,000,000 | | | | 983,261 | |
5.360%, 06/16/33 | | | 2,000,000 | | | | 1,985,318 | |
FHLB | | | | | | | | |
6.500%, 09/13/38 | | | 2,500,000 | | | | 2,497,275 | |
6.360%, 04/29/44 | | | 2,000,000 | | | | 2,003,046 | |
6.230%, 12/28/37 | | | 2,000,000 | | | | 2,000,516 | |
6.110%, 12/21/32 | | | 12,000,000 | | | | 12,003,313 | |
6.050%, 07/19/38 | | | 2,000,000 | | | | 2,000,081 | |
6.000%, 04/12/38 to 07/15/39 | | | 18,120,000 | | | | 18,177,011 | |
5.940%, 04/20/43 | | | 2,000,000 | | | | 1,999,408 | |
The accompanying notes are an integral part of the financial statements.
8

FROST TOTAL RETURN BOND FUND July 31, 2024
Description | | Face Amount | | | Value | |
5.625%, 02/14/34 to 02/23/39 | | $ | 7,000,000 | | | $ | 7,028,468 | |
2.150%, 09/23/36 | | | 1,500,000 | | | | 1,163,273 | |
FHLMC | | | | | | | | |
7.000%, 10/30/43 | | | 1,000,000 | | | | 1,003,688 | |
Tennessee Valley Authority | | | | | | | | |
4.250%, 09/15/52 | | | 7,521,000 | | | | 6,770,851 | |
Total U.S. Government Agency Obligations | | | | |
(Cost $89,361,245) | | | 89,086,978 | |
| | |
Shares
| | | | | |
COMMON STOCK — 2.1% |
Energy — 2.1% | | | | |
Paratus Energy Services * | | | 12,800,000 | | | | 69,686,360 | |
| | | | | | | | | |
Total Common Stock | | | | | | | | |
(Cost $–) | | | | | | | 69,686,360 | |
| | | Face Amount | | | | | |
MUNICIPAL BONDS — 1.4% |
Board of Regents of the University of Texas System, Build America Bonds, Ser D, Cl D, RB | | | | | | | | |
5.134%, 08/15/42 | | | 3,000,000 | | | | 3,072,034 | |
City of Houston Texas, GO | | | | | | | | |
3.961%, 03/01/47 | | | 12,000,000 | | | | 10,446,716 | |
GDB Debt Recovery Authority of Puerto Rico, RB | | | | | | | | |
7.500%, 08/20/40 | | | 4,879,387 | | | | 4,733,005 | |
Mission, Economic Development, RB | | | | | | | | |
8.550%, 12/01/21(F)(G) | | | 2,125,000 | | | | 21,250 | |
Mission, Economic Development, RB | | | | | | | | |
10.875%, 12/01/28(F)(G) | | | 3,315,000 | | | | 33,150 | |
9.750%, 12/01/25(F)(G) | | | 3,045,000 | | | | 30,450 | |
North Texas Tollway Authority, RB | | | | | | | | |
8.410%, 02/01/30 | | | 1,723,000 | | | | 1,845,353 | |
Northwest Independent School District, Ser A, GO, PSF-GTD | | | | | | | | |
1.776%, 02/15/31 | | | 2,000,000 | | | | 1,720,888 | |
1.836%, 02/15/32 | | | 1,890,000 | | | | 1,591,282 | |
Rhode Island State, Health & Educational System, Providence Public Schools, Ser A, Cl A, RB, CITY APPROP ST AID WITHHLDG | | | | | | | | |
8.000%, 05/15/29 | | | 5,000,000 | | | | 5,010,685 | |
State of Illinois, Ser A, GO | | | | | | | | |
3.140%, 10/01/24 | | | 5,000,000 | | | | 4,982,001 | |
Texas State, Transportation Commission State Highway Fund, Ser B-BUILD, RB | | | | | | | | |
5.178%, 04/01/30 | | | 3,980,000 | | | | 4,031,493 | |
USAFA Visitor's Center Business Improvement District, Ser B, RB | | | | | | | | |
6.750%, 12/01/42(D) | | | 12,570,000 | | | | 11,074,973 | |
Total Municipal Bonds | | | | |
(Cost $56,466,594) | | | 48,593,280 | |
| | | | | | | | | |
SOVEREIGN DEBT — 0.3% |
Colombia Government International Bond | | | | | | | | |
3.250%, 04/22/32 | | | 5,000,000 | | | | 3,911,227 | |
Description | | Face Amount | | | Value | |
Kenya Government International Bond | | | | | | | | |
7.250%, 02/28/28 (D) | | $ | 3,000,000 | | | $ | 2,714,640 | |
Provincia de Buenos Aires | | | | | | | | |
6.375%, 09/01/24 (D)(E) | | | 327,848 | | | | 144,745 | |
Ukraine Government International Bond | | | | | | | | |
7.750%, 09/01/24 (G) | | | 5,000,000 | | | | 1,816,000 | |
Total Sovereign Debt | | | | |
(Cost $12,461,650) | | | | | | | 8,586,612 | |
| | | Face Amount | | | | | |
COMMERCIAL PAPER — 1.5% |
Armada Funding | | | | | | | | |
5.398%, 08/02/24 (D)(H) | | | 2,000,000 | | | | 1,999,400 | |
AT&T | | | | | | | | |
5.530%, 09/04/24 (D)(H) | | | 2,000,000 | | | | 1,989,468 | |
Avangrid | | | | | | | | |
5.429%, 08/06/24 (D)(H) | | | 2,000,000 | | | | 1,996,688 | |
Bacardi-Martini BV | | | | | | | | |
5.735%, 09/05/24 (D)(H) | | | 2,000,000 | | | | 1,988,400 | |
Banco de Credito e Inversiones | | | | | | | | |
5.478%, 09/03/24 (D)(H) | | | 2,000,000 | | | | 1,989,649 | |
Barton Capital | | | | | | | | |
5.379%, 08/01/08 (D)(H) | | | 2,000,000 | | | | 1,999,704 | |
BASF | | | | | | | | |
5.455%, 08/30/24 (D)(H) | | | 2,000,000 | | | | 1,991,050 | |
Brookfield BRP Holdings Canada | | | | | | | | |
5.887%, 08/09/24 (H) | | | 2,000,000 | | | | 1,997,282 | |
Canadian National Railway | | | | | | | | |
5.423%, 08/19/24 (D)(H) | | | 2,000,000 | | | | 1,994,300 | |
Columbia Funding | | | | | | | | |
5.372%, 08/23/24 (D)(H) | | | 2,000,000 | | | | 1,993,150 | |
CommonSpirit Health | | | | | | | | |
5.434%, 08/22/24 (H) | | | 2,000,000 | | | | 1,992,791 | |
DCAT | | | | | | | | |
5.384%, 08/08/24 (H) | | | 2,000,000 | | | | 1,997,618 | |
Harley-Davidson Financial Services | | | | | | | | |
5.917%, 08/12/24 (D)(H) | | | 2,000,000 | | | | 1,996,295 | |
Intesa Sanpaolo Funding | | | | | | | | |
5.584%, 08/21/24 (H) | | | 2,000,000 | | | | 1,993,315 | |
Ionic Funding | | | | | | | | |
5.557%, 09/05/24 (H) | | | 2,000,000 | | | | 1,989,204 | |
Mercy Health | | | | | | | | |
0.000%, 08/28/24 (H) | | | 2,000,000 | | | | 1,991,900 | |
Protective Life Short Term Funding | | | | | | | | |
5.395%, 08/26/24 (D)(H) | | | 2,000,000 | | | | 1,992,185 | |
Sheffield Receivables | | | | | | | | |
5.372%, 08/20/24 (D)(H) | | | 2,000,000 | | | | 1,994,037 | |
UnitedHealth Group | | | | | | | | |
5.423%, 08/13/24 (D)(H) | | | 2,000,000 | | | | 1,996,145 | |
Volkswagen Group of America Finance | | | | | | | | |
5.525%, 08/16/24 (D)(H) | | | 2,000,000 | | | | 1,995,004 | |
VW Credit | | | | | | | | |
5.571%, 08/07/24 (D)(H) | | | 2,295,000 | | | | 2,292,577 | |
5.525%, 08/14/24 (D)(H) | | | 1,900,000 | | | | 1,895,972 | |
Walgreens Boots Alliance | | | | | | | | |
6.726%, 08/15/24 (D)(H) | | | 2,000,000 | | | | 1,994,705 | |
Washington Gas Light | | | | | | | | |
5.467%, 08/05/24 (H) | | | 1,500,000 | | | | 1,498,894 | |
The accompanying notes are an integral part of the financial statements.
9

FROST TOTAL RETURN BOND FUND July 31, 2024
Description | | | | | | Value | |
Whirlpool | | | | | | | | |
5.877%, 08/12/24 (D)(H) | | $ | 2,000,000 | | | $ | 1,996,096 | |
Total Commercial Paper | | | | |
(Cost $49,564,555) | | | 49,555,829 | |
| | | | | | | | | |
Total Investments — 97.8% | | | | | | | | |
(Cost $3,254,848,932) | | | | | | $ | 3,298,148,254 | |
| |
Percentages are based on Net Assets of $3,373,875,556. |
* | Non-income producing security. |
(A) | Variable or floating rate security. The rate shown is the effective interest rate as of period end. The rates on certain securities are not based on published reference rates and spreads and are either determined by the issuer or agent based on current market conditions; by using a formula based on the rates of underlying loans; or by adjusting periodically based on prevailing interest rates. |
(B) | Zero coupon security. The rate reported on the Schedule of Investments is the effective yield at the time of purchase. |
(C) | PO - Principal Only |
(D) | Securities sold within terms of a private placement memorandum, exempt from registration under Section 144A of the Securities Act of 1933, as amended, and may be sold only to dealers in that program or other "accredited investors." The total value of such securities at July 31, 2024 was $1,011,711,694 and represents 30.0% of Net Assets. |
(E) | Step Bonds — The rate reflected on the Schedule of Investments is the effective yield on July 31, 2024. The coupon on a step bond changes on a specific date. |
(F) | Level 3 security in accordance with fair value hierarchy. |
(G) | Security in default on interest payments. |
(H) | Interest rate represents the security’s effective yield at the time of purchase. |
The following is a summary of the level of inputs used as of July 31, 2024, in valuing the Fund's investments carried at value: |
| |
Investments in Securities | | Level 1 | | | Level 2 | | | Level 3(1) | | | Total | |
Mortgage-Backed Securities | | $ | — | | | $ | 1,029,833,799 | | | $ | — | ^ | | $ | 1,029,833,799 | |
U.S. Treasury Obligations | | | 107,275,390 | | | | 783,071,200 | | | | — | | | | 890,346,590 | |
Corporate Obligations | | | — | | | | 623,777,055 | | | | — | | | | 623,777,055 | |
Asset-Backed Securities | | | — | | | | 355,847,245 | | | | — | | | | 355,847,245 | |
Collateralized Loan Obligations | | | — | | | | 132,834,506 | | | | — | | | | 132,834,506 | |
U.S. Government Agency Obligations | | | — | | | | 89,086,978 | | | | — | | | | 89,086,978 | |
Common Stock | | | 69,686,360 | | | | — | | | | — | | | | 69,686,360 | |
Municipal Bonds | | | — | | | | 48,508,430 | | | | 84,850 | | | | 48,593,280 | |
Sovereign Debt | | | — | | | | 8,586,612 | | | | — | | | | 8,586,612 | |
Commercial Paper | | | — | | | | 49,555,829 | | | | — | | | | 49,555,829 | |
Total Investments in Securities | | $ | 176,961,750 | | | $ | 3,121,101,654 | | | $ | 84,850 | | | $ | 3,298,148,254 | |
| |
^ This category includes securities with a value of $0. |
| |
(1) Of the $84,850 in Level 3 securities as of July 31, 2024, $84,850 or 100.0% are not valued via third party pricing vendors and broker quotes. If significant, the disclosure of the unobservable inputs and the interrelationships and sensitivity between these inputs is required for those Level 3 securities that are not valued by third party vendors or broker quotes.
The following is a reconciliation of the investments in which significant unobservable inputs (Level 3) were used in determining value as of July 31, 2024:
| | | Asset-Backed
Securities | | | Mortgage-
Backed
Securities | | | | Municipal Bonds | | | | Common Stock | | | Total | |
Balance as of July 31, 2023 | | $ | — | ^ | | $ | — | ^ | | $ | 84,850 | | | $ | 15,106,308 | | | $ | 15,191,158 | |
Accrued discounts/premiums | | | — | | | | — | | | | — | | | | — | | | | — | |
Realized gain/(loss) | | | — | | | | — | | | | — | | | | — | | | | — | |
Change in unrealized appreciation/(depreciation) | | | — | | | | — | | | | — | | | | — | | | | — | |
Purchases | | | — | | | | — | | | | — | | | | — | | | | — | |
Sales | | | — | | | | — | | | | — | | | | — | | | | — | |
Net transfer into Level 3 | | | — | | | | — | | | | — | | | | — | | | | — | |
Net transfer out of Level 3 | | | — | | | | — | | | | — | | | | (15,106,308 | ) | | | (15,106,308 | ) |
Ending Balance as of July 31, 2024 | | $ | — | | | $ | — | ^ | | $ | 84,850 | | | $ | — | | | $ | 84,850 | |
Change in unrealized gains/(losses) included in earnings related to securities still held at reporting date | | $ | — | | | $ | — | | | $ | — | | | $ | — | | | $ | — | |
^ This category includes securities with a value of $0.
Amounts designated as “—“ are $0 or have been rounded to $0.
For the year ended July 31, 2024, transfers out of Level 3 were due to the availability observable inputs to determine fair value.
The accompanying notes are an integral part of the financial statements.
10

FROST TOTAL RETURN BOND FUND July 31, 2024
The following table summarizes the quantitative inputs and assumptions used for items categorized as recurring Level 3 assets as of July 31, 2024. The following disclosures also include information on the sensitivity of the fair value measurements to changes in the significant unobservable inputs.
The unobservable inputs used to determine fair value of recurring Level 3 assets may have similar or diverging impacts on valuation. Significant increases and decreases in these inputs in isolation and interrelationships between those inputs could result in significantly higher or lower fair value measurement.
| Category | Market Value at July 31, 2024 | Valuation Technique | Unobservable Inputs | Range Input Value(s) (Average Input Value) |
| Municipal Bonds | $ 84,850 | Estimated liquidation value | Liquidation value | $0.01 |
For more information on valuation inputs, see Note 2—Significant Accounting Policies in the Notes to Financial Statements.
See “Glossary” for abbreviations.
The accompanying notes are an integral part of the financial statements.
11

FROST CREDIT FUND July 31, 2024
Description | | Face Amount | | | Value | |
CORPORATE OBLIGATIONS — 46.7% |
Communication Services — 3.6% |
ANGI Group | | | | | | | | |
3.875%, 08/15/28(A) | | $ | 2,000,000 | | | $ | 1,741,375 | |
News | | | | | | | | |
5.125%, 02/15/32(A) | | | 2,000,000 | | | | 1,899,970 | |
Sirius XM Radio | | | | | | | | |
3.875%, 09/01/31(A) | | | 3,000,000 | | | | 2,506,051 | |
Stagwell Global | | | | | | | | |
5.625%, 08/15/29(A) | | | 2,000,000 | | | | 1,885,826 | |
T-Mobile USA | | | | | | | | |
3.500%, 04/15/31 | | | 2,000,000 | | | | 1,830,235 | |
Warnermedia Holdings | | | | | | | | |
4.279%, 03/15/32 | | | 1,750,000 | | | | 1,518,034 | |
| | | | | | | | 11,381,491 | |
Consumer Discretionary — 9.1% |
Airswift Global | | | | | | | | |
10.000%, 02/28/29(A) | | | 3,000,000 | | | | 3,052,500 | |
American Axle & Manufacturing | | | | | | | | |
5.000%, 10/01/29 | | | 1,000,000 | | | | 917,173 | |
APX Group | | | | | | | | |
5.750%, 07/15/29(A) | | | 3,000,000 | | | | 2,918,635 | |
Beazer Homes USA | | | | | | | | |
7.250%, 10/15/29(A) | | | 1,000,000 | | | | 1,014,034 | |
Bloomin' Brands | | | | | | | | |
5.125%, 04/15/29(A) | | | 2,500,000 | | | | 2,297,454 | |
Choice Hotels International | | | | | | | | |
5.850%, 08/01/34 | | | 2,000,000 | | | | 2,009,745 | |
3.700%, 12/01/29 | | | 2,000,000 | | | | 1,836,244 | |
Cruise Yacht Upper HoldCo | | | | | | | | |
11.875%, 07/05/28 | | | 4,000,000 | | | | 4,100,000 | |
Dillard's | | | | | | | | |
7.000%, 12/01/28 | | | 500,000 | | | | 522,673 | |
Imperial Brands Finance | | | | | | | | |
6.125%, 07/27/27(A) | | | 500,000 | | | | 514,973 | |
MajorDrive Holdings IV | | | | | | | | |
6.375%, 06/01/29(A) | | | 2,200,000 | | | | 2,089,480 | |
NES Fircroft Bondco | | | | | | | | |
11.750%, 09/29/26(A) | | | 500,000 | | | | 527,500 | |
Nissan Motor Acceptance | | | | | | | | |
7.050%, 09/15/28(A) | | | 1,000,000 | | | | 1,051,790 | |
STL Holding | | | | | | | | |
8.750%, 02/15/29(A) | | | 2,000,000 | | | | 2,082,215 | |
Tractor Supply | | | | | | | | |
5.250%, 05/15/33 | | | 500,000 | | | | 506,125 | |
Upbound Group | | | | | | | | |
6.375%, 02/15/29(A) | | | 1,000,000 | | | | 978,319 | |
VistaJet Malta Finance | | | | | | | | |
7.875%, 05/01/27(A) | | | 2,500,000 | | | | 2,262,959 | |
| | | | | | | | 28,681,819 | |
Consumer Staples — 2.7% |
J M Smucker | | | | | | | | |
6.500%, 11/15/53 | | | 2,000,000 | | | | 2,216,395 | |
JBS USA Holding Lux Sarl | | | | | | | | |
6.750%, 03/15/34(A) | | | 2,000,000 | | | | 2,140,292 | |
Philip Morris International | | | | | | | | |
5.125%, 02/15/30 | | | 2,000,000 | | | | 2,033,006 | |
Walgreens Boots Alliance | | | | | | | | |
4.800%, 11/18/44 | | | 3,000,000 | | | | 2,249,294 | |
| | | | | | | | 8,638,987 | |
Description | | Face Amount | | | Value | |
Energy — 5.4% |
Aircastle | | | | | | | | |
5.750%, 10/01/31(A) | | $ | 3,500,000 | | | $ | 3,521,978 | |
Borr IHC | | | | | | | | |
10.000%, 11/15/28(A) | | | 1,153,902 | | | | 1,208,354 | |
Colonial Pipeline | | | | | | | | |
8.375%, 11/01/30(A) | | | 1,500,000 | | | | 1,738,242 | |
Oglethorpe Power | | | | | | | | |
5.800%, 06/01/54(A) | | | 2,000,000 | | | | 2,016,074 | |
PBF Holding | | | | | | | | |
7.875%, 09/15/30(A) | | | 2,000,000 | | | | 2,071,388 | |
Puffin Finance Sarl | | | | | | | | |
15.000%, 09/11/25 | | | 1,000,000 | | | | 1,015,000 | |
Southern Natural Gas | | | | | | | | |
4.800%, 03/15/47(A) | | | 3,000,000 | | | | 2,548,972 | |
Summit Midstream Holdings | | | | | | | | |
8.625%, 10/31/29(A) | | | 500,000 | | | | 511,182 | |
Swedbank | | | | | | | | |
7.750%, H15T5Y + 3.657%, 09/17/72(B) | | | 2,000,000 | | | | 2,039,700 | |
Topaz Solar Farms | | | | | | | | |
5.750%, 09/30/39(A) | | | 737,944 | | | | 718,573 | |
| | | | | | | | 17,389,463 | |
Financials — 8.1% |
Arthur J Gallagher | | | | | | | | |
5.750%, 07/15/54 | | | 2,000,000 | | | | 2,004,053 | |
Athene Holding | | | | | | | | |
6.150%, 04/03/30 | | | 500,000 | | | | 527,374 | |
Brown & Brown | | | | | | | | |
5.650%, 06/11/34 | | | 3,000,000 | | | | 3,037,240 | |
Charles Schwab | | | | | | | | |
4.000%, H15T10Y + 3.079%, 03/01/73(B) | | | 2,500,000 | | | | 2,110,619 | |
Deutsche Bank NY | | | | | | | | |
7.146%, SOFRRATE + 2.520%, 07/13/27(B) | | | 1,000,000 | | | | 1,033,270 | |
Discover Financial Services | | | | | | | | |
6.700%, 11/29/32 | | | 2,000,000 | | | | 2,152,776 | |
F&G Annuities & Life | | | | | | | | |
7.400%, 01/13/28 | | | 3,000,000 | | | | 3,135,200 | |
Golub Capital BDC | | | | | | | | |
7.050%, 12/05/28 | | | 800,000 | | | | 830,012 | |
Huntington National Bank | | | | | | | | |
5.699%, SOFRRATE + 1.215%, 11/18/25(B) | | | 1,500,000 | | | | 1,499,607 | |
LPL Holdings | | | | | | | | |
6.000%, 05/20/34 | | | 3,000,000 | | | | 3,023,902 | |
Royal Bank of Canada MTN | | | | | | | | |
5.200%, 01/31/33 | | | 1,000,000 | | | | 985,845 | |
Synchrony Bank | | | | | | | | |
5.625%, 08/23/27 | | | 1,000,000 | | | | 1,003,222 | |
Synchrony Financial | | | | | | | | |
5.935%, SOFRINDX + 2.130%, 08/02/30(B) | | | 500,000 | | | | 503,081 | |
UBS Group | | | | | | | | |
6.373%, SOFRRATE + 3.340%, 07/15/26(A)(B) | | | 1,000,000 | | | | 1,008,743 | |
US Bancorp | | | | | | | | |
5.836%, SOFRRATE + 2.260%, 06/12/34(B) | | | 1,000,000 | | | | 1,038,094 | |
The accompanying notes are an integral part of the financial statements.
12

FROST CREDIT FUND July 31, 2024
Description | | Face Amount | | | Value | |
Westpac Banking | | | | | | | | |
2.894%, H15T5Y + 1.350%, 02/04/30(B) | | $ | 2,000,000 | | | $ | 1,969,970 | |
| | | | | | | | 25,863,008 | |
Industrials — 11.0% |
Boeing | | | | | | | | |
5.150%, 05/01/30 | | | 2,000,000 | | | | 1,969,591 | |
2.196%, 02/04/26 | | | 1,000,000 | | | | 951,705 | |
Brundage-Bone Concrete Pumping Holdings | | | | | | | | |
6.000%, 02/01/26(A) | | | 4,103,000 | | | | 4,088,037 | |
Burlington Northern Santa Fe | | | | | | | | |
5.500%, 03/15/55 | | | 4,000,000 | | | | 4,106,527 | |
Concentrix | | | | | | | | |
6.850%, 08/02/33 | | | 4,000,000 | | | | 4,082,722 | |
Flowserve | | | | | | | | |
3.500%, 10/01/30 | | | 2,000,000 | | | | 1,834,386 | |
GATX | | | | | | | | |
6.050%, 03/15/34 | | | 2,000,000 | | | | 2,097,101 | |
Hexcel | | | | | | | | |
4.950%, 08/15/25 | | | 2,000,000 | | | | 1,983,279 | |
Huntington Ingalls Industries | | | | | | | | |
4.200%, 05/01/30 | | | 3,000,000 | | | | 2,882,800 | |
Icahn Enterprises | | | | | | | | |
9.750%, 01/15/29(A) | | | 1,000,000 | | | | 1,053,061 | |
Lockheed Martin | | | | | | | | |
5.250%, 01/15/33 | | | 1,500,000 | | | | 1,556,332 | |
Masco | | | | | | | | |
7.750%, 08/01/29 | | | 1,088,000 | | | | 1,220,592 | |
nVent Finance Sarl | | | | | | | | |
5.650%, 05/15/33 | | | 1,000,000 | | | | 1,019,126 | |
Owens Corning | | | | | | | | |
5.950%, 06/15/54 | | | 3,000,000 | | | | 3,085,008 | |
Regal Rexnord | | | | | | | | |
6.300%, 02/15/30 | | | 1,500,000 | | | | 1,564,469 | |
Twma Finance | | | | | | | | |
13.000%, 02/08/27 | | | 1,500,000 | | | | 1,511,900 | |
| | | | | | | | 35,006,636 | |
Information Technology — 3.8% |
Apple | | | | | | | | |
3.850%, 05/04/43 | | | 2,000,000 | | | | 1,732,515 | |
Consensus Cloud Solutions | | | | | | | | |
6.000%, 10/15/26(A) | | | 2,000,000 | | | | 1,959,597 | |
Corning | | | | | | | | |
5.450%, 11/15/79 | | | 2,000,000 | | | | 1,906,122 | |
Crowdstrike Holdings | | | | | | | | |
3.000%, 02/15/29 | | | 3,000,000 | | | | 2,692,196 | |
Kyndryl Holdings | | | | | | | | |
4.100%, 10/15/41 | | | 4,929,000 | | | | 3,864,790 | |
| | | | | | | | 12,155,220 | |
Materials — 0.2% |
Mineral Resources | | | | | | | | |
8.125%, 05/01/27 (A) | | | 420,000 | | | | 425,632 | |
| | | | | | | | | |
Real Estate — 1.6% |
GLP Capital | | | | | | | | |
6.750%, 12/01/33 | | | 1,000,000 | | | | 1,072,624 | |
3.250%, 01/15/32 | | | 2,500,000 | | | | 2,144,393 | |
Sabra Health Care | | | | | | | | |
3.200%, 12/01/31 | | | 2,000,000 | | | | 1,707,252 | |
| | | | | | | | 4,924,269 | |
Description | | Face Amount | | | Value | |
Utilities — 1.2% |
Entergy | | | | | | | | |
7.125%, H15T5Y + 2.670%, 12/01/54(B) | | $ | 3,000,000 | | | $ | 3,001,374 | |
Pacific Gas and Electric | | | | | | | | |
4.500%, 07/01/40 | | | 1,000,000 | | | | 850,660 | |
| | | | | | | | 3,852,034 | |
Total Corporate Obligations | | | | | | | | |
(Cost $146,771,986) | | | | | | | 148,318,559 | |
| | | | | | | | | |
ASSET-BACKED SECURITIES — 19.9% |
Automotive — 16.2% |
ACC Auto Trust, Ser 2021-A, Cl D | | | | | | | | |
6.100%, 06/15/29 (A) | | | 1,000,000 | | | | 998,406 | |
American Credit Acceptance Receivables Trust, Ser 2021-4, Cl E | | | | | | | | |
3.120%, 02/14/28 (A) | | | 1,500,000 | | | | 1,462,879 | |
American Credit Acceptance Receivables Trust, Ser 2022-1, Cl F | | | | | | | | |
4.870%, 11/13/28 (A) | | | 2,600,000 | | | | 2,546,652 | |
American Credit Acceptance Receivables Trust, Ser 2023-3, Cl D | | | | | | | | |
6.820%, 10/12/29 (A) | | | 1,000,000 | | | | 1,017,864 | |
American Credit Acceptance Receivables Trust, Ser 2023-4, Cl D | | | | | | | | |
7.650%, 09/12/30 (A) | | | 1,000,000 | | | | 1,041,664 | |
American Credit Acceptance Receivables Trust, Ser 2024-3, Cl D | | | | | | | | |
6.040%, 07/12/30 (A) | | | 3,000,000 | | | | 3,031,329 | |
Amur Equipment Finance Receivables XIII, Ser 2024-1A, Cl E | | | | | | | | |
9.660%, 04/20/32 (A) | | | 1,550,000 | | | | 1,590,841 | |
Amur Equipment Finance Receivables XIV, Ser 2024-2A, Cl D | | | | | | | | |
5.970%, 10/20/31 (A) | | | 800,000 | | | | 801,150 | |
Arivo Acceptance Auto Loan Receivables Trust, Ser 2024-1A, Cl C | | | | | | | | |
7.650%, 07/15/30 (A) | | | 1,000,000 | | | | 1,020,989 | |
Avid Automobile Receivables Trust, Ser 2021-1, Cl F | | | | | | | | |
5.160%, 10/16/28 (A) | | | 2,000,000 | | | | 1,911,813 | |
Bridgecrest Lending Auto Securitization Trust, Ser 2024-3, Cl D | | | | | | | | |
5.830%, 05/15/30 | | | 2,250,000 | | | | 2,263,799 | |
CarNow Auto Receivables Trust, Ser 2021-2A, Cl E | | | | | | | | |
4.450%, 02/15/28 (A) | | | 1,000,000 | | | | 946,815 | |
Carvana Auto Receivables Trust, Ser 2021-N2, Cl E | | | | | | | | |
2.900%, 03/10/28 (A) | | | 1,526,918 | | | | 1,443,778 | |
The accompanying notes are an integral part of the financial statements.
13

FROST CREDIT FUND July 31, 2024
Description | | Face Amount | | | Value | |
CIFC Funding 2021-IV, Ser 2024-4A, Cl CR | | | | | | | | |
7.194%, TSFR3M + 1.900%, 07/23/37 (A)(B) | | $ | 1,750,000 | | | $ | 1,750,000 | |
CIG Auto Receivables Trust, Ser 2021-1A, Cl E | | | | | | | | |
4.450%, 05/12/28 (A) | | | 1,590,000 | | | | 1,557,522 | |
CLI Funding IX, Ser 2024-1A, Cl B | | | | | | | | |
5.660%, 07/20/49 (A) | | | 2,000,000 | | | | 2,026,054 | |
CLI Funding IX, Ser 2024-1A, Cl C | | | | | | | | |
6.000%, 07/20/49 (A) | | | 1,000,000 | | | | 1,012,766 | |
Credibly Asset Securitization II, Ser 2024-1A, Cl C | | | | | | | | |
8.620%, 11/15/29 (A) | | | 2,537,000 | | | | 2,559,082 | |
Credit Acceptance Auto Loan Trust, Ser 2024-2A, Cl C | | | | | | | | |
6.700%, 10/16/34 (A) | | | 3,000,000 | | | | 3,057,175 | |
DT Auto Owner Trust, Ser 2020-3A, Cl E | | | | | | | | |
3.620%, 10/15/27 (A) | | | 1,500,000 | | | | 1,478,102 | |
EnFin Residential Solar Receivables Trust, Ser 2024-1A, Cl B | | | | | | | | |
8.440%, 02/20/55 (A) | | | 975,955 | | | | 976,096 | |
Exeter Automobile Receivables Trust, Ser 2022-2A, Cl E | | | | | | | | |
6.340%, 10/15/29 (A) | | | 1,443,000 | | | | 1,421,707 | |
Foursight Capital Automobile Receivables Trust, Ser 2022-1, Cl E | | | | | | | | |
4.690%, 08/15/29 (A) | | | 1,000,000 | | | | 910,478 | |
GLS Auto Receivables Issuer Trust, Ser 2021-4A, Cl E | | | | | | | | |
4.430%, 10/16/28 (A) | | | 1,500,000 | | | | 1,430,104 | |
GLS Auto Select Receivables Trust, Ser 2024-3A, Cl C | | | | | | | | |
5.920%, 08/15/30 (A) | | | 1,357,000 | | | | 1,376,958 | |
Magnetite XXXVIII, Ser 2024-38A, Cl B | | | | | | | | |
7.294%, TSFR3M + 2.000%, 04/15/37 (A)(B) | | | 2,000,000 | | | | 2,004,670 | |
Magnetite XXXVIII, Ser 2024-38A, Cl D | | | | | | | | |
8.794%, TSFR3M + 3.500%, 04/15/37 (A)(B) | | | 1,000,000 | | | | 1,021,588 | |
Magnetite XXXVIII, Ser 2024-38A, Cl E | | | | | | | | |
11.794%, TSFR3M + 6.500%, 04/15/37 (A)(B) | | | 1,000,000 | | | | 1,016,971 | |
Mercury Financial Credit Card Master Trust, Ser 2024-2A, Cl A | | | | | | | | |
6.560%, 07/20/29 (A) | | | 2,500,000 | | | | 2,528,262 | |
Prestige Auto Receivables Trust, Ser 2024-1A, Cl D | | | | | | | | |
6.210%, 02/15/30 (A) | | | 2,000,000 | | | | 2,033,651 | |
SAFCO Auto Receivables Trust, Ser 2024-1A, Cl E | | | | | | | | |
10.850%, 01/18/30 (A) | | | 500,000 | | | | 505,190 | |
TIC Home Improvement Trust, Ser 2024-A, Cl B | | | | | | | | |
7.890%, 10/15/46 (A) | | | 500,000 | | | | 506,929 | |
Description | | Face Amount | | | Value | |
Tricolor Auto Securitization Trust, Ser 2022-1A, Cl F | | | | | | | | |
9.800%, 07/16/29 (A) | | $ | 1,000,000 | | | $ | 983,027 | |
Tricolor Auto Securitization Trust, Ser 2023-1A, Cl F | | | | | | | | |
16.000%, 06/17/30 (A) | | | 1,000,000 | | | | 1,053,266 | |
| | | | | | | | 51,287,577 | |
Other Asset-Backed Securities — 3.7% |
Amur Equipment Finance Receivables X, Ser 2022-1A, Cl E | | | | | | | | |
5.020%, 12/20/28 (A) | | | 1,348,000 | | | | 1,331,629 | |
Audax Senior Debt 6, Ser 2021-6A, Cl B | | | | | | | | |
7.494%, TSFR3M + 2.212%, 10/20/33 (A)(B) | | | 1,000,000 | | | | 1,006,014 | |
BHG Securitization Trust, Ser 2022-B, Cl D | | | | | | | | |
6.690%, 06/18/35 (A) | | | 998,895 | | | | 965,188 | |
CIFC Funding, Ser 2018-1A, Cl C | | | | | | | | |
7.291%, TSFR3M + 2.012%, 04/18/31 (A)(B) | | | 500,000 | | | | 499,365 | |
CP EF Asset Securitization I, Ser 2022-1A, Cl A | | | | | | | | |
5.960%, 04/15/30 (A) | | | 221,641 | | | | 221,140 | |
Kapitus Asset Securitization, Ser 2022-1A, Cl A | | | | | | | | |
3.382%, 07/10/28 (A) | | | 1,500,000 | | | | 1,471,442 | |
LCM XXII, Ser 2018-22A, Cl BR | | | | | | | | |
7.544%, TSFR3M + 2.262%, 10/20/28 (A)(B) | | | 1,500,000 | | | | 1,502,195 | |
Libra Solutions, Ser 2023-1A, Cl B | | | | | | | | |
10.250%, 02/15/35 (A) | | | 378,910 | | | | 377,453 | |
Mosaic Solar Loans, Ser 2017-2A, Cl B | | | | | | | | |
4.770%, 06/22/43 (A) | | | 162,128 | | | | 143,353 | |
NMEF Funding, Ser 2021-A, Cl D | | | | | | | | |
5.780%, 12/15/27 (A) | | | 1,300,000 | | | | 1,295,910 | |
Pawneee Equipment Receivables, Ser 2021-1, Cl E | | | | | | | | |
5.210%, 05/15/28 (A) | | | 353,000 | | | | 342,096 | |
Pawneee Equipment Receivables, Ser 2022-1, Cl C | | | | | | | | |
6.010%, 07/17/28 (A) | | | 1,000,000 | | | | 974,155 | |
Sapphire Aviation Finance I, Ser 2018-1A, Cl B | | | | | | | | |
5.926%, 03/15/40 (A) | | | 123,901 | | | | 97,887 | |
SCF Equipment Leasing, Ser 2021-1A, Cl D | | | | | | | | |
1.930%, 09/20/30 (A) | | | 1,500,000 | | | | 1,431,257 | |
| | | | | | | | 11,659,084 | |
Total Asset-Backed Securities | | | | |
(Cost $63,069,383) | | | | | | | 62,946,661 | |
| | | | | | | | | |
COLLATERALIZED LOAN OBLIGATIONS — 15.8% |
610 Funding CLO 2, Ser 2024-2RA, Cl BR3 | | | | | | | | |
7.632%, TSFR3M + 2.350%, 01/20/34 (A)(B) | | | 2,000,000 | | | | 2,000,000 | |
Apidos CLO XI, Ser 2021-11A, Cl ER3 | | | | | | | | |
12.117%, TSFR3M + 6.832%, 04/17/34 (A)(B) | | | 1,000,000 | | | | 1,001,910 | |
The accompanying notes are an integral part of the financial statements.
14

FROST CREDIT FUND July 31, 2024
Description | | Face Amount | | | Value | |
Apidos CLO XL, Ser 2024-40A, Cl CR | | | | | | | | |
7.235%, TSFR3M + 1.950%, 07/15/37 (A)(B) | | $ | 5,000,000 | | | $ | 5,000,000 | |
Apidos CLO XL, Ser 2024-40A, Cl ER | | | | | | | | |
10.885%, TSFR3M + 5.600%, 07/15/37 (A)(B) | | | 1,000,000 | | | | 1,000,000 | |
Bain Capital Credit CLO, Ser 2024-2A, Cl AR2 | | | | | | | | |
6.416%, TSFR3M + 1.130%, 10/17/32 (A)(B) | | | 3,000,000 | | | | 2,999,142 | |
Battalion CLO 17, Ser 2024-17A, Cl CR | | | | | | | | |
7.532%, TSFR3M + 2.250%, 03/09/34 (A)(B) | | | 5,000,000 | | | | 4,993,575 | |
BlueMountain XXX, Ser 2022-30A, Cl ER | | | | | | | | |
12.001%, TSFR3M + 6.700%, 04/15/35 (A)(B) | | | 2,000,000 | | | | 1,968,866 | |
Carlyle Global Market Strategies, Ser 2018-1A, Cl CR2 | | | | | | | | |
7.347%, TSFR3M + 2.062%, 04/17/31 (A)(B) | | | 1,250,000 | | | | 1,248,700 | |
Chenango Park, Ser 2018-1A, Cl B | | | | | | | | |
7.413%, TSFR3M + 2.112%, 04/15/30 (A)(B) | | | 1,000,000 | | | | 998,927 | |
GoldenTree Loan Management US CLO 14, Ser 2024-14A, Cl CR | | | | | | | | |
7.182%, TSFR3M + 1.900%, 07/20/37 (A)(B) | | | 5,000,000 | | | | 5,000,000 | |
GoldenTree Loan Management US CLO 19, Ser 2024-19A, Cl B | | | | | | | | |
7.182%, TSFR3M + 1.900%, 04/20/37 (A)(B) | | | 3,000,000 | | | | 3,008,085 | |
Golub Capital Partners, Ser 2017-17A, Cl BR | | | | | | | | |
8.446%, TSFR3M + 3.162%, 10/25/30 (A)(B) | | | 1,500,000 | | | | 1,516,887 | |
Golub Capital Partners, Ser 2017-21A, Cl CR | | | | | | | | |
7.996%, TSFR3M + 2.712%, 01/25/31 (A)(B) | | | 3,000,000 | | | | 3,006,060 | |
Golub Capital Partners, Ser 2017-23A, Cl CR | | | | | | | | |
7.344%, TSFR3M + 2.062%, 01/20/31 (A)(B) | | | 1,050,939 | | | | 1,049,710 | |
Golub Capital Partners, Ser 2017-24A, Cl DR | | | | | | | | |
9.498%, TSFR3M + 4.162%, 11/05/29 (A)(B) | | | 2,000,000 | | | | 1,994,572 | |
Golub Capital Partners, Ser 2018-26A, Cl BR | | | | | | | | |
7.094%, TSFR3M + 1.812%, 04/20/31 (A)(B) | | | 1,000,000 | | | | 999,872 | |
Golub Capital Partners, Ser 2018-36A, Cl B | | | | | | | | |
7.154%, TSFR3M + 1.912%, 02/05/31 (A)(B) | | | 2,000,000 | | | | 1,999,592 | |
Description | | Face Amount | | | Value | |
Golub Capital Partners, Ser 2018-36A, Cl C | | | | | | | | |
7.604%, TSFR3M + 2.362%, 02/05/31 (A)(B) | | $ | 1,500,000 | | | $ | 1,496,597 | |
MCF CLO VIII, Ser 2024-1A, Cl BR | | | | | | | | |
7.699%, TSFR3M + 2.400%, 04/18/36 (A)(B) | | | 3,000,000 | | | | 3,023,778 | |
Race Point IX, Ser 2017-9A, Cl BR | | | | | | | | |
7.713%, TSFR3M + 2.412%, 10/15/30 (A)(B) | | | 4,000,000 | | | | 3,995,688 | |
Race Point IX, Ser 2017-9A, Cl DR | | | | | | | | |
12.463%, TSFR3M + 7.162%, 10/15/30 (A)(B) | | | 2,000,000 | | | | 1,849,618 | |
Total Collateralized Loan Obligations | | | | |
(Cost $50,245,531) | | | | | | | 50,151,579 | |
| | | | | | | | | |
MORTGAGE-BACKED SECURITIES — 6.3% |
Commercial Mortgage-Backed Obligation — 3.2% |
Benchmark Mortgage Trust, Ser 2020-B21, Cl D | | | | | | | | |
2.000%, 12/17/53 (A) | | | 1,000,000 | | | | 649,142 | |
BXMT, Ser 2020-FL2, Cl A | | | | | | | | |
6.349%, TSFR1M + 1.014%, 02/15/38 (A)(B) | | | 505,435 | | | | 484,554 | |
CAFL Issuer, Ser 2023-RTL1, Cl A2 | | | | | | | | |
9.300%, 12/28/30 (A)(C) | | | 2,000,000 | | | | 2,022,887 | |
Chase Home Lending Mortgage Trust, Ser 2024-2, Cl A6 | | | | | | | | |
6.500%, 02/25/55 (A)(B) | | | 893,237 | | | | 903,756 | |
Cold Storage Trust, Ser 2020-ICE5, Cl E | | | | | | | | |
8.208%, TSFR1M + 2.880%, 11/15/37 (A)(B) | | | 982,991 | | | | 979,919 | |
COMM Mortgage Trust, Ser 2014-UBS6, Cl C | | | | | | | | |
4.434%, 12/10/47 (B) | | | 1,000,000 | | | | 898,894 | |
COMM Mortgage Trust, Ser 2015-DC1, Cl D | | | | | | | | |
4.274%, 02/10/48 (A)(B) | | | 1,517,000 | | | | 1,210,424 | |
FREMF Mortgage Trust, Ser 2016-K54, Cl C | | | | | | | | |
4.052%, 04/25/48 (A)(B) | | | 1,000,000 | | | | 972,547 | |
Greystone CRE Notes, Ser 2024-HC3, Cl AS | | | | | | | | |
8.160%, TSFR1M + 2.832%, 03/15/41 (A)(B) | | | 2,000,000 | | | | 1,995,549 | |
| | | | | | | | 10,117,672 | |
Non-Agency Residential Mortgage-Backed Obligation — 3.1% |
Brean Asset Backed Securities Trust, Ser 2023-RM7, Cl A1 | | | | | | | | |
4.500%, 03/25/78 (A)(B) | | | 961,107 | | | | 912,048 | |
PRET, Ser 2021-NPL3, Cl A2 | | | | | | | | |
3.721%, 07/25/51 (A)(C) | | | 501,550 | | | | 480,383 | |
PRET, Ser 2021-RN3, Cl A1 | | | | | | | | |
1.843%, 09/25/51 (A)(C) | | | 650,169 | | | | 639,053 | |
PRET, Ser 2021-RN4, Cl A2 | | | | | | | | |
5.194%, 10/25/51 (A)(B) | | | 1,850,000 | | | | 1,873,287 | |
PRET, Ser 2024-RN2, Cl A1 | | | | | | | | |
7.125%, 04/25/54 (A)(C) | | | 2,260,574 | | | | 2,278,770 | |
PRPM, Ser 2021-10, Cl A2 | | | | | | | | |
4.826%, 10/25/26 (A)(C) | | | 1,000,000 | | | | 1,044,694 | |
The accompanying notes are an integral part of the financial statements.
15

FROST CREDIT FUND July 31, 2024
Description | | Face Amount | | | Value | |
RCO VI Mortgage, Ser 2022-1, Cl A2 | | | | | | | | |
5.250%, 01/25/27 (A)(C) | | $ | 1,000,000 | | | $ | 982,624 | |
VOLT, Ser 2021-CF2, Cl A2 | | | | | | | | |
5.316%, 11/27/51 (A)(C) | | | 1,000,000 | | | | 837,322 | |
WFRBS Commercial Mortgage Trust, Ser 2014-C25, Cl D | | | | | | | | |
3.803%, 11/15/47 (A)(B) | | | 1,000,000 | | | | 901,275 | |
| | | | | | | | 9,949,456 | |
Total Mortgage-Backed Securities | | | | |
(Cost $20,385,273) | | | | | | | 20,067,128 | |
| | | Shares | | | | | |
PREFERRED STOCK — 0.0% |
Communication Services — 0.0% |
MYT Holding LLC | | | | | | | | |
10.000%, 06/07/29 (A) | | | 64,528 | | | | 40,975 | |
Total Preferred Stock | | | | | | | | |
(Cost $64,528) | | | | | | | 40,975 | |
| | | | | | | | | |
COMMERCIAL PAPER — 5.4% |
Avangrid | | | | | | | | |
5.429%, 08/06/24 (A)(D) | | | 2,000,000 | | | | 1,996,688 | |
Bacardi-Martini BV | | | | | | | | |
5.769%, 08/15/24 (A)(D) | | | 1,100,000 | | | | 1,097,363 | |
Brookfield Infrastructure Holdings Canada | | | | | | | | |
5.844%, 08/20/24 (D) | | | 2,000,000 | | | | 1,993,878 | |
Columbia Funding | | | | | | | | |
5.372%, 08/23/24 (A)(D) | | | 2,000,000 | | | | 1,993,150 | |
Hannover Funding | | | | | | | | |
5.506%, 08/30/24 (A)(D) | | | 2,000,000 | | | | 1,990,800 | |
Harley-Davidson Financial Services | | | | | | | | |
5.917%, 08/12/24 (A)(D) | | | 2,000,000 | | | | 1,996,295 | |
ITT | | | | | | | | |
5.511%, 08/08/24 (A)(D) | | | 2,000,000 | | | | 1,997,586 | |
Jones Lang LaSalle Finance BV | | | | | | | | |
5.565%, 08/12/24 (A)(D) | | | 2,000,000 | | | | 1,996,331 | |
Walgreens Boots Alliance | | | | | | | | |
6.726%, 08/15/24 (A)(D) | | | 2,000,000 | | | | 1,994,705 | |
Total Commercial Paper | | | | |
(Cost $17,060,176) | | | 17,056,796 | |
| | | | | | | | | |
Total Investments — 94.1% | | | | | | | | |
(Cost $297,596,877) | | | | | | $ | 298,581,698 | |
| |
Percentages are based on Net Assets of $317,464,023. |
(A) | Securities sold within terms of a private placement memorandum, exempt from registration under Section 144A of the Securities Act of 1933, as amended, and may be sold only to dealers in that program or other "accredited investors." The total value of such securities at July 31, 2024 was $196,939,774 and represents 62.0% of Net Assets. |
(B) | Variable or floating rate security. The rate shown is the effective interest rate as of period end. The rates on certain securities are not based on published reference rates and spreads and are either determined by the issuer or agent based on current market conditions; by using a formula based on the rates of underlying loans; or by adjusting periodically based on prevailing interest rates. |
(C) | Step Bonds — The rate reflected on the Schedule of Investments is the effective yield on July 31, 2024. The coupon on a step bond changes on a specific date. |
(D) | Interest rate represents the security’s effective yield at the time of purchase. |
As of July 31, 2024, all of the Fund's investments in securities were considered Level 2, in accordance with the authoritative guidance on fair value measurements and disclosure under U.S. GAAP. |
For more information on valuation inputs, see Note 2—Significant Accounting Policies in the Notes to Financial Statements.
See “Glossary” for abbreviations.
The accompanying notes are an integral part of the financial statements.
16

FROST LOW DURATION BOND FUND July 31, 2024
Description | | Face Amount | | | Value | |
ASSET-BACKED SECURITIES — 34.1% |
Automotive — 19.3% |
American Credit Acceptance Receivables Trust, Ser 2023-1, Cl C | | | | | | | | |
5.590%, 04/12/29 (A) | | $ | 1,000,000 | | | $ | 999,027 | |
American Credit Acceptance Receivables Trust, Ser 2023-3, Cl C | | | | | | | | |
6.440%, 10/12/29 (A) | | | 5,000,000 | | | | 5,045,682 | |
American Credit Acceptance Receivables Trust, Ser 2024-3, Cl C | | | | | | | | |
5.730%, 07/12/30 (A) | | | 2,000,000 | | | | 2,011,442 | |
Arivo Acceptance Auto Loan Receivables Trust, Ser 2021-1A, Cl A | | | | | | | | |
1.190%, 01/15/27 (A) | | | 19,219 | | | | 19,177 | |
Arivo Acceptance Auto Loan Receivables Trust, Ser 2022-1A, Cl A | | | | | | | | |
3.930%, 05/15/28 (A) | | | 232,691 | | | | 230,146 | |
Carmax Auto Owner Trust, Ser 2022-4, Cl C | | | | | | | | |
6.490%, 07/17/28 | | | 3,500,000 | | | | 3,596,231 | |
Carmax Auto Owner Trust, Ser 2022-4, Cl D | | | | | | | | |
8.080%, 04/16/29 | | | 1,500,000 | | | | 1,569,564 | |
Credit Acceptance Auto Loan Trust, Ser 2021-3A, Cl C | | | | | | | | |
1.630%, 09/16/30 (A) | | | 1,700,000 | | | | 1,678,730 | |
DT Auto Owner Trust, Ser 2022-2A, Cl D | | | | | | | | |
5.460%, 03/15/28 (A) | | | 4,000,000 | | | | 3,972,892 | |
Flagship Credit Auto Trust, Ser 2022-4, Cl B | | | | | | | | |
6.780%, 10/15/27 (A) | | | 1,500,000 | | | | 1,520,048 | |
Foursight Capital Automobile Receivables Trust, Ser 2022-1, Cl D | | | | | | | | |
3.070%, 05/15/28 (A) | | | 4,780,000 | | | | 4,585,329 | |
GLS Auto Receivables Issuer Trust, Ser 2021-2A, Cl D | | | | | | | | |
1.420%, 04/15/27 (A) | | | 20,000 | | | | 19,359 | |
Hilton Grand Vacations Trust, Ser 2024-2A, Cl C | | | | | | | | |
5.990%, 03/25/38 (A) | | | 2,376,344 | | | | 2,414,273 | |
Lendbuzz Securitization Trust, Ser 2024-2A, Cl B | | | | | | | | |
6.520%, 07/16/29 (A) | | | 1,250,000 | | | | 1,274,711 | |
Octane Receivables Trust, Ser 2021-1A, Cl A | | | | | | | | |
0.930%, 03/22/27 (A) | | | 46,057 | | | | 45,901 | |
Octane Receivables Trust, Ser 2021-2A, Cl A | | | | | | | | |
1.210%, 09/20/28 (A) | | | 243,612 | | | | 239,663 | |
Prestige Auto Receivables Trust, Ser 2021-1A, Cl D | | | | | | | | |
2.080%, 02/15/28 (A) | | | 4,000,000 | | | | 3,780,738 | |
Prestige Auto Receivables Trust, Ser 2023-1A, Cl B | | | | | | | | |
5.550%, 04/15/27 (A) | | | 8,000,000 | | | | 7,986,694 | |
Description | | Face Amount | | | Value | |
Prestige Auto Receivables Trust, Ser 2023-2A, Cl C | | | | | | | | |
7.120%, 08/15/29 (A) | | $ | 4,250,000 | | | $ | 4,375,275 | |
United Auto Credit Securitization Trust, Ser 2023-1, Cl C | | | | | | | | |
6.280%, 07/10/28 (A) | | | 4,326,000 | | | | 4,318,856 | |
Westlake Automobile Receivables Trust, Ser 2022-3A, Cl D | | | | | | | | |
6.680%, 04/17/28 (A) | | | 7,000,000 | | | | 7,077,996 | |
Westlake Automobile Receivables Trust, Ser 2023-2A, Cl D | | | | | | | | |
7.010%, 11/15/28 (A) | | | 3,000,000 | | | | 3,071,236 | |
World Omni Select Auto Trust, Ser 2023-A, Cl A2A | | | | | | | | |
5.920%, 03/15/27 | | | 1,889,752 | | | | 1,891,189 | |
| | | | | | | | 61,724,159 | |
Credit Card — 4.0% |
Avant Credit Card Master Trust, Ser 2021-1A, Cl A | | | | | | | | |
1.370%, 04/15/27 (A) | | | 1,220,000 | | | | 1,200,452 | |
Chase Issuance Trust, Ser 2023-A2, Cl A | | | | | | | | |
5.080%, 09/15/30 | | | 3,000,000 | | | | 3,073,593 | |
Continental Finance Credit Card ABS Master Trust, Ser 2021-A, Cl A | | | | | | | | |
2.550%, 12/17/29 (A) | | | 5,000,000 | | | | 4,902,380 | |
Genesis Sales Finance Master Trust, Ser 2021-AA, Cl A | | | | | | | | |
1.200%, 12/21/26 (A) | | | 1,757,019 | | | | 1,729,471 | |
World Financial Network Credit Card Master Trust, Ser 2024-A, Cl A | | | | | | | | |
5.470%, 02/15/31 | | | 2,000,000 | | | | 2,035,249 | |
| | | | | | | | 12,941,145 | |
Other Asset-Backed Securities — 10.8% |
Amur Equipment Finance Receivables X, Ser 2022-1A, Cl D | | | | | | | | |
2.910%, 08/21/28 (A) | | | 2,000,000 | | | | 1,934,091 | |
Aqua Finance Trust, Ser 2021-A, Cl B | | | | | | | | |
2.400%, 07/17/46 (A) | | | 1,000,000 | | | | 867,208 | |
BHG Securitization Trust, Ser 2021-B, Cl A | | | | | | | | |
0.900%, 10/17/34 (A) | | | 267,674 | | | | 264,062 | |
BXG Receivables Note Trust, Ser 2023-A, Cl A | | | | | | | | |
5.770%, 11/15/38 (A) | | | 3,705,098 | | | | 3,728,313 | |
CLI Funding VI, Ser 2020-1A, Cl A | | | | | | | | |
2.080%, 09/18/45 (A) | | | 1,525,382 | | | | 1,392,537 | |
Commonbond Student Loan Trust, Ser 2017-AGS, Cl A1 | | | | | | | | |
2.550%, 05/25/41 (A) | | | 364,199 | | | | 344,285 | |
CP EF Asset Securitization I, Ser 2022-1A, Cl A | | | | | | | | |
5.960%, 04/15/30 (A) | | | 886,562 | | | | 884,559 | |
Hilton Grand Vacations Trust, Ser 2024-1B, Cl B | | | | | | | | |
5.990%, 09/15/39 (A) | | | 692,435 | | | | 707,930 | |
Marlette Funding Trust, Ser 2021-2A, Cl C | | | | | | | | |
1.500%, 09/15/31 (A) | | | 420,094 | | | | 417,969 | |
The accompanying notes are an integral part of the financial statements.
17

FROST LOW DURATION BOND FUND July 31, 2024
Description | | Face Amount | | | Value | |
Mosaic Solar Loan Trust, Ser 2021-3A, Cl B | | | | | | | | |
1.920%, 06/20/52 (A) | | $ | 661,177 | | | $ | 493,216 | |
Mosaic Solar Loans, Ser 2017-1A, Cl A | | | | | | | | |
4.450%, 06/20/42 (A) | | | 158,032 | | | | 152,299 | |
New Economy Assets Phase 1 Sponsor, Ser 2021-1, Cl A1 | | | | | | | | |
1.910%, 10/20/61 (A) | | | 2,000,000 | | | | 1,810,909 | |
Oportun Issuance Trust, Ser 2021-B, Cl A | | | | | | | | |
1.470%, 05/08/31 (A) | | | 1,535,251 | | | | 1,468,195 | |
Oportun Issuance Trust, Ser 2022-A, Cl C | | | | | | | | |
7.400%, 06/09/31 (A) | | | 2,030,000 | | | | 2,026,783 | |
Pawneee Equipment Receivables, Ser 2022-1, Cl C | | | | | | | | |
6.010%, 07/17/28 (A) | | | 5,000,000 | | | | 4,870,775 | |
Verizon Master Trust, Ser 2023-4, Cl C | | | | | | | | |
5.650%, 06/20/29 | | | 9,700,000 | | | | 9,775,808 | |
VFI ABS, Ser 2022-1A, Cl A | | | | | | | | |
2.230%, 03/24/28 (A) | | | 11,111 | | | | 11,079 | |
VFI ABS, Ser 2023-1A, Cl A | | | | | | | | |
7.270%, 03/26/29 (A) | | | 2,171,070 | | | | 2,183,049 | |
Westgate Resorts, Ser 2022-1A, Cl C | | | | | | | | |
2.488%, 08/20/36 (A) | | | 1,461,734 | | | | 1,407,467 | |
| | | | | | | | 34,740,534 | |
Total Asset-Backed Securities | | | | |
(Cost $110,126,897) | | | | | | | 109,405,838 | |
| | | | | | | | | |
U.S. TREASURY OBLIGATIONS — 31.4% |
U.S. Treasury Notes | | | | | | | | |
4.875%, 04/30/26 | | | 5,000,000 | | | | 5,041,602 | |
4.375%, 11/30/28 | | | 25,000,000 | | | | 25,414,062 | |
4.000%, 02/29/28 to 01/31/29 | | | 70,000,000 | | | | 70,084,375 | |
Total U.S. Treasury Obligations | | | | |
(Cost $99,119,952) | | | 100,540,039 | |
| | | | | | | | | |
CORPORATE OBLIGATIONS — 22.2% |
Communication Services — 0.9% |
News | | | | | | | | |
3.875%, 05/15/29 (A) | | | 3,000,000 | | | | 2,777,451 | |
| | | | | | | | | |
Consumer Discretionary — 1.2% |
Hyundai Capital America | | | | | | | | |
5.300%, 01/08/29 (A) | | | 4,000,000 | | | | 4,050,984 | |
| | | | | | | | | |
Financials — 8.0% |
Capital One Financial | | | | | | | | |
5.463%, SOFRRATE + 1.560%, 07/26/30(B) | | | 4,000,000 | | | | 4,036,952 | |
4.200%, 10/29/25 | | | 5,000,000 | | | | 4,928,273 | |
Charles Schwab | | | | | | | | |
5.643%, SOFRRATE + 2.210%, 05/19/29(B) | | | 5,000,000 | | | | 5,122,652 | |
Fifth Third Bancorp | | | | | | | | |
6.361%, SOFRINDX + 2.192%, 10/27/28(B) | | | 8,000,000 | | | | 8,287,114 | |
Golub Capital BDC | | | | | | | | |
7.050%, 12/05/28 | | | 1,200,000 | | | | 1,245,017 | |
Description | | Face Amount | | | Value | |
JPMorgan Chase | | | | | | | | |
4.995%, SOFRRATE + 1.125%, 07/22/30(B) | | $ | 2,000,000 | | | $ | 2,014,854 | |
| | | | | | | | 25,634,862 | |
Industrials — 7.4% |
AerCap Ireland Capital DAC | | | | | | | | |
1.750%, 01/30/26 | | | 5,000,000 | | | | 4,757,530 | |
1.750%, 10/29/24 | | | 1,000,000 | | | | 989,655 | |
Delta Air Lines | | | | | | | | |
7.000%, 05/01/25(A) | | | 5,000,000 | | | | 5,043,029 | |
Molex Electronic Technologies | | | | | | | | |
3.900%, 04/15/25(A) | | | 10,030,000 | | | | 9,925,093 | |
Penske Truck Leasing Lp | | | | | | | | |
5.750%, 05/24/26(A) | | | 3,000,000 | | | | 3,030,009 | |
| | | | | | | | 23,745,316 | |
Information Technology — 3.8% |
Gartner | | | | | | | | |
3.625%, 06/15/29(A) | | | 5,000,000 | | | | 4,651,435 | |
Kyndryl Holdings | | | | | | | | |
2.050%, 10/15/26 | | | 8,000,000 | | | | 7,472,654 | |
| | | | | | | | 12,124,089 | |
Real Estate — 0.9% |
COPT Defense Properties | | | | | | | | |
2.250%, 03/15/26 | | | 3,000,000 | | | | 2,861,200 | |
| | | | | | | | | |
Total Corporate Obligations | | | | | | | | |
(Cost $72,020,785) | | | | | | | 71,193,902 | |
| | | | | | | | | |
U.S. GOVERNMENT AGENCY OBLIGATIONS — 4.3% |
FFCB | | | | | | | | |
5.480%, 10/25/27 | | | 5,000,000 | | | | 4,994,880 | |
FHLMC | | | | | | | | |
5.375%, 11/15/24 | | | 5,000,000 | | | | 5,001,043 | |
5.150%, 10/17/24 | | | 3,800,000 | | | | 3,797,571 | |
Total U.S. Government Agency Obligations | | | | |
(Cost $13,800,000) | | | 13,793,494 | |
| | | | | | | | | |
MORTGAGE-BACKED SECURITIES — 0.7% |
Commercial Mortgage-Backed Obligation — 0.7% |
Benchmark Mortgage Trust, Ser 2020-B19, Cl A2 | | | | | | | | |
1.691%, 09/15/53 | | | 1,231,990 | | | | 1,175,128 | |
Chase Home Lending Mortgage Trust, Ser 2024-2, Cl A6 | | | | | | | | |
6.500%, 02/25/55 (A)(B) | | | 893,237 | | | | 903,756 | |
Total Mortgage-Backed Securities | | | | |
(Cost $2,157,691) | | | | | | | 2,078,884 | |
| | |
Shares
| | | | | |
COMMERCIAL PAPER — 1.9% |
Avangrid | | | | | | | | |
5.429%, 08/06/24 (A)(C) | | | 2,000,000 | | | | 1,996,688 | |
Brookfield Infrastructure Holdings Canada | | | | | | | | |
5.844%, 08/20/24 (C) | | | 2,000,000 | | | | 1,993,878 | |
Columbia Funding | | | | | | | | |
5.372%, 08/23/24 (A)(C) | | | 2,000,000 | | | | 1,993,150 | |
Total Commercial Paper | | | | |
(Cost $5,985,812) | | | 5,983,716 | |
| | | | | | | | | |
Total Investments — 94.6% | | | | | | | | |
(Cost $303,211,137) | | | | | | $ | 302,995,873 | |
| |
| |
Percentages are based on Net Assets of $320,433,457. |
The accompanying notes are an integral part of the financial statements.
18

FROST LOW DURATION BOND FUND July 31, 2024
(A) | Securities sold within terms of a private placement memorandum, exempt from registration under Section 144A of the Securities Act of 1933, as amended, and may be sold only to dealers in that program or other "accredited investors." The total value of such securities at July 31, 2024 was $121,835,799 and represents 38.0% of Net Assets. |
(B) | Variable or floating rate security. The rate shown is the effective interest rate as of period end. The rates on certain securities are not based on published reference rates and spreads and are either determined by the issuer or agent based on current market conditions; by using a formula based on the rates of underlying loans; or by adjusting periodically based on prevailing interest rates. |
(C) | Interest rate represents the security’s effective yield at the time of purchase. |
As of July 31, 2024, all of the Fund's investments in securities were considered Level 2, in accordance with the authoritative guidance on fair value measurements and disclosure under U.S. GAAP. |
For more information on valuation inputs, see Note 2 — Significant Accounting Policies in the Notes to Financial Statements.
See “Glossary” for abbreviations.
The accompanying notes are an integral part of the financial statements.
19

FROST MUNICIPAL BOND FUND July 31, 2024
Description | | Face Amount | | | Value | |
MUNICIPAL BONDS — 67.1% |
California — 10.0% |
California State, Municipal Finance Authority, Ser A, RB | | | | | | | | |
5.000%, 03/01/25(A) | | $ | 250,000 | | | $ | 249,868 | |
Mount Diablo Unified School District, Ser A, GO | | | | | | | | |
4.000%, 08/01/31 | | | 100,000 | | | | 107,402 | |
| | | | | | | | 357,270 | |
Idaho — 4.2% |
Idaho State, Housing & Finance Association, RB | | | | | | | | |
4.000%, 07/01/26(A) | | | 155,000 | | | | 153,002 | |
| | | | | | | | | |
Michigan — 14.0% |
Taylor, Brownfield Redevelopment Authority, RB, NATL | | | | | | | | |
4.000%, 05/01/28 | | | 500,000 | | | | 500,297 | |
| | | | | | | | | |
Ohio — 4.1% |
City of Medina Ohio, GO | | | | | | | | |
4.000%, 12/01/32 | | | 140,000 | | | | 148,308 | |
| | | | | | | | | |
Texas — 34.8% |
Clifton, Higher Education Finance, Ser A, RB | | | | | | | | |
3.375%, 12/01/24 | | | 270,000 | | | | 268,786 | |
Clifton, Higher Education Finance, Ser B, RB | | | | | | | | |
5.000%, 08/15/25 | | | 460,000 | | | | 465,182 | |
Main Street Market Square Redevelopment Authority, TA, BAM | | | | | | | | |
5.000%, 09/01/29 | | | 500,000 | | | | 511,765 | |
| | | | | | | | 1,245,733 | |
Total Municipal Bonds | | | | |
(Cost $2,443,165) | | | 2,404,610 | |
| | | | | | | | | |
Total Investments — 67.1% | | | | | | | | |
(Cost $2,443,165) | | | | | | $ | 2,404,610 | |
| |
Percentages are based on Net Assets of $3,581,174. |
(A) | Securities sold within terms of a private placement memorandum, exempt from registration under Section 144A of the Securities Act of 1933, as amended, and may be sold only to dealers in that program or other "accredited investors." The total value of such securities at July 31, 2024 was $402,870 and represents 11.2% of Net Assets. |
As of July 31, 2024, all of the Fund's investments in securities were considered Level 2, in accordance with the authoritative guidance on fair value measurements and disclosure under U.S. GAAP. |
For more information on valuation inputs, see Note 2 — Significant Accounting Policies in the Notes to Financial Statements.
See “Glossary” for abbreviations.
The accompanying notes are an integral part of the financial statements.
20

Glossary July 31, 2024
Fund Abbreviations |
ABS — Asset-Backed Security |
BAM — Build America Mutual |
Cl — Class |
CLO — Collateralized Loan Obligation |
COP — Certificate of Participation |
FHLB — Federal Home Loan Bank |
FHLMC — Federal Home Loan Mortgage Corporation |
FNMA — Federal National Mortgage Association |
GNMA — Government National Mortgage Association |
GO — General Obligation |
ICE — Intercontinental Exchange |
IO — Interest Only - face amount represents notional amount |
LLC — Limited Liability Company |
MTN — Medium Term Note |
NATL — National Public Finance Guaranty Corporation |
PIK — Payment-in-Kind |
PSF-GTD — Texas Public School Fund Guarantee |
RB — Revenue Bond |
Ser — Series |
SOFR — Secured Overnight Financing Rate |
STRIPS — Separately Traded Registered Interest and Principal Securities |
TA — Tax Allocation TSFR - CME Term SOFR Reference Rates USISDA - USD ICE Swap Rate |
| |
Currency Abbreviations |
USD — U.S. Dollar |
21

STATEMENTS OF ASSETS AND LIABILITIES July 31, 2024
| | | Growth Equity Fund | | | Total Return Bond Fund | | | Credit Fund | |
Assets: | | | | | | | | | | | | |
Investments at Value | | $ | 236,539,574 | | | $ | 3,298,148,254 | | | $ | 298,581,698 | |
Cash | | | 4,278,292 | | | | 58,465,392 | | | | 20,551,478 | |
Dividends and Interest Receivable | | | 45,610 | | | | 29,279,268 | | | | 2,879,186 | |
Foreign Tax Reclaim Receivable | | | 9,961 | | | | – | | | | – | |
Receivable for Capital Shares Sold | | | 4,757 | | | | 6,121,549 | | | | 4,122,139 | |
Receivable for Investment Securities Sold | | | – | | | | 472,500 | | | | – | |
Cash Collateral on Futures Contracts | | | – | | | | 41,586 | | | | – | |
Prepaid Expenses | | | 57,246 | | | | 66,760 | | | | 29,390 | |
Total Assets | | | 240,935,440 | | | | 3,392,595,309 | | | | 326,163,891 | |
Liabilities: | | | | | | | | | | | | |
Payable Due to Investment Adviser | | | 103,750 | | | | 981,948 | | | | 129,737 | |
Payable Due to Administrator | | | 14,904 | | | | 201,494 | | | | 18,637 | |
Payable Due to Distributor - Investor Class Shares | | | 4,096 | | | | 44,205 | | | | 11,532 | |
Payable Due to Distributor - A Class Shares | | | N/A | | | | 862 | | | | 600 | |
Shareholder Servicing Fees Payable - A Class Shares | | | N/A | | | | 2,227 | | | | – | |
Professional Fees Payable | | | 34,903 | | | | 91,856 | | | | 59,769 | |
Transfer Agent Fees Payable | | | 7,232 | | | | 45,927 | | | | 7,254 | |
Payable for Capital Shares Redeemed | | | 2,992 | | | | 1,063,661 | | | | 204,488 | |
Payable Due to Trustees | | | 1,913 | | | | 25,169 | | | | 2,311 | |
Chief Compliance Officer Fees Payable | | | 468 | | | | 6,153 | | | | 565 | |
Pricing Fees Payable | | | 398 | | | | 21,488 | | | | 10,212 | |
Payable for Investment Securities Purchased | | | – | | | | 16,185,906 | | | | 8,250,000 | |
Payable to Custodian | | | – | | | | 194 | | | | – | |
Income Distribution Payable | | | – | | | | 403 | | | | – | |
Other Accrued Expenses | | | 5,098 | | | | 48,260 | | | | 4,763 | |
Total Liabilities | | | 175,754 | | | | 18,719,753 | | | | 8,699,868 | |
Net Assets | | $ | 240,759,686 | | | $ | 3,373,875,556 | | | $ | 317,464,023 | |
NET ASSETS: | | | | | | | | | | | | |
Paid-in Capital | | $ | 51,173,531 | | | $ | 3,587,135,423 | | | $ | 325,291,263 | |
Total Distributable Earnings (Accumulated Loss) | | | 189,586,155 | | | | (213,259,867 | ) | | | (7,827,240 | ) |
Net Assets | | $ | 240,759,686 | | | $ | 3,373,875,556 | | | $ | 317,464,023 | |
Institutional Class Shares: | | | | | | | | | | | | |
Net Assets | | $ | 223,212,611 | | | $ | 3,150,416,369 | | | $ | 253,572,710 | |
Outstanding Shares of Beneficial Interest | | | | | | | | | | | | |
(unlimited authorization - no par value) | | | 12,936,815 | | | | 318,915,985 | | | | 26,866,080 | |
Net Asset Value, Offering and Redemption Price Per Share | | $ | 17.25 | | | $ | 9.88 | | | $ | 9.44 | |
Investor Class Shares: | | | | | | | | | | | | |
Net Assets | | $ | 17,547,075 | | | $ | 219,575,798 | | | $ | 61,156,234 | |
Outstanding Shares of Beneficial Interest | | | | | | | | | | | | |
(unlimited authorization - no par value) | | | 1,055,667 | | | | 22,236,193 | | | | 6,491,485 | |
Net Asset Value, Offering and Redemption Price Per Share | | $ | 16.62 | | | $ | 9.87 | | | $ | 9.42 | |
A Class Shares: | | | | | | | | | | | | |
Net Assets | | | N/A | | | $ | 3,883,389 | | | $ | 2,735,079 | |
Outstanding Shares of Beneficial Interest | | | | | | | | | | | | |
(unlimited authorization - no par value) | | | N/A | | | | 393,579 | | | | 290,515 | |
Net Asset Value, Offering and Redemption Price Per Share | | | N/A | | | $ | 9.87 | | | $ | 9.41 | |
Maximum Offering Price Per Share — Class A | | | N/A | | | $ | 10.20 | | | $ | 9.63 | |
Cost of Investments | | $ | 90,938,239 | | | $ | 3,254,848,932 | | | $ | 297,596,877 | |
“N/A” designates that the Fund does not offer this class.
Amounts designated as “—” are $0.
The accompanying notes are an integral part of the financial statements.
22

STATEMENTS OF ASSETS AND LIABILITIES July 31, 2024
| | | Low Duration Bond Fund | | | Municipal Bond Fund | |
Assets: | | | | | | | | |
Investments at Value | | $ | 302,995,873 | | | $ | 2,404,610 | |
Cash | | | 9,810,786 | | | | 1,211,435 | |
Receivable for Investment Securities Sold | | | 4,923,650 | | | | – | |
Dividends and Interest Receivable | | | 1,802,930 | | | | 36,095 | |
Receivable for Capital Shares Sold | | | 1,076,079 | | | | 5,970 | |
Prepaid Expenses | | | 26,656 | | | | 19,297 | |
Total Assets | | | 320,635,974 | | | | 3,677,407 | |
Liabilities: | | | | | | | | |
Payable Due to Investment Adviser | | | 79,218 | | | | 18,265 | |
Payable Due to Administrator | | | 18,965 | | | | 441 | |
Payable Due to Distributor - Investor Class Shares | | | 515 | | | | 233 | |
Payable for Capital Shares Redeemed | | | 42,671 | | | | – | |
Professional Fees Payable | | | 42,572 | | | | 62,646 | |
Transfer Agent Fees Payable | | | 7,189 | | | | 6,665 | |
Pricing Fees Payable | | | 3,632 | | | | 724 | |
Payable Due to Trustees | | | 2,318 | | | | 109 | |
Chief Compliance Officer Fees Payable | | | 567 | | | | 826 | |
Income Distribution Payable | | | 35 | | | | – | |
Other Accrued Expenses | | | 4,835 | | | | 6,324 | |
Total Liabilities | | | 202,517 | | | | 96,233 | |
Net Assets | | $ | 320,433,457 | | | $ | 3,581,174 | |
NET ASSETS: | | | | | | | | |
Paid-in Capital | | $ | 341,561,273 | | | $ | 4,221,767 | |
Total Distributable Earnings (Accumulated Loss) | | | (21,127,816 | ) | | | (640,593 | ) |
Net Assets | | $ | 320,433,457 | | | $ | 3,581,174 | |
Institutional Class Shares: | | | | | | | | |
Net Assets | | $ | 317,687,322 | | | $ | 2,761,515 | |
Outstanding Shares of Beneficial Interest | | | | | | | | |
(unlimited authorization - no par value) | | | 32,223,294 | | | | 305,299 | |
Net Asset Value, Offering and Redemption Price Per Share | | $ | 9.86 | | | $ | 9.05 | |
Investor Class Shares: | | | | | | | | |
Net Assets | | $ | 2,746,135 | | | $ | 819,659 | |
Outstanding Shares of Beneficial Interest | | | | | | | | |
(unlimited authorization - no par value) | | | 278,327 | | | | 90,509 | |
Net Asset Value, Offering and Redemption Price Per Share | | $ | 9.87 | | | $ | 9.06 | |
Cost of Investments | | $ | 303,211,137 | | | $ | 2,443,165 | |
Amounts designated as “—” are $0.
The accompanying notes are an integral part of the financial statements.
23

STATEMENTS OF OPERATIONS FOR THE YEAR ENDED JULY 31, 2024
| | | Growth Equity Fund | | | Total Return Bond Fund | | | Credit Fund | |
| | | | | | | | | | | | | |
Investment Income: | | | | | | | | | | | | |
Dividend Income | | $ | 1,625,454 | | | $ | – | | | $ | – | |
Interest Income | | | – | | | | 173,107,838 | | | | 14,197,039 | |
Foreign Taxes Withheld | | | (2,943 | ) | | | – | | | | – | |
Total Investment Income | | | 1,622,511 | | | | 173,107,838 | | | | 14,197,039 | |
| | | | | | | | | | | | | |
Expenses: | | | | | | | | | | | | |
Investment Advisory Fees | | | 1,271,123 | | | | 10,281,854 | | | | 1,032,438 | |
Administration Fees | | | 184,800 | | | | 2,134,695 | | | | 149,962 | |
Distribution Fees - Investor Class Shares | | | 63,689 | | | | 569,688 | | | | 95,623 | |
Distribution Fees - A Class Shares | | | N/A | | | | 14,097 | | | | 4,479 | |
Trustees' Fees (Form NCSR Item 10) | | | 7,877 | | | | 90,890 | | | | 6,588 | |
Chief Compliance Officer Fees | | | 2,438 | | | | 12,278 | | | | 2,454 | |
Shareholder Servicing Fees | | | N/A | | | | 5,639 | | | | N/A | |
Registration Fees | | | 85,522 | | | | 154,795 | | | | 73,933 | |
Transfer Agent Fees | | | 51,372 | | | | 439,797 | | | | 60,346 | |
Professional Fees | | | 48,934 | | | | 188,013 | | | | 65,389 | |
Custodian Fees | | | 30,456 | | | | 68,494 | | | | 5,766 | |
Printing Fees | | | 8,268 | | | | 90,665 | | | | 10,113 | |
Pricing Fees | | | 1,568 | | | | 91,016 | | | | 39,869 | |
Insurance and Other Expenses | | | 14,480 | | | | 95,918 | | | | 12,968 | |
Total Expenses | | | 1,770,527 | | | | 14,237,839 | | | | 1,559,928 | |
Less: Fees Paid Indirectly | | | (4,854 | ) | | | (129,189 | ) | | | (14,163 | ) |
Net Expenses | | | 1,765,673 | | | | 14,108,650 | | | | 1,545,765 | |
Net Investment Income/(Loss) | | | (143,162 | ) | | | 158,999,188 | | | | 12,651,274 | |
Net Realized Gain/(Loss) on: | | | | | | | | | | | | |
Investments | | | 98,180,602 | | | | (3,853,261 | ) | | | (2,237,564 | ) |
Foreign Currency Transactions | | | – | | | | (53,997 | ) | | | – | |
Net Realized Gain/(Loss) | | | 98,180,602 | * | | | (3,907,258 | ) | | | (2,237,564 | ) |
Net Change in Unrealized Appreciation (Depreciation) on Investments | | | (41,336,169 | ) | | | 163,650,189 | | | | 12,277,754 | |
Net Realized and Unrealized Gain | | | 56,844,433 | | | | 159,742,931 | | | | 10,040,190 | |
Increase in Net Assets Resulting from Operations | | $ | 56,701,271 | | | $ | 318,742,119 | | | $ | 22,691,464 | |
* Includes realized gains of $22,127,798 from In-Kind Redemptions (Note 10 in the Notes to Financial Statements).
Amounts designated as “—” are $0.
“N/A” designates that the Fund does not offer this class.
The accompanying notes are an integral part of the financial statements.
24

STATEMENTS OF OPERATIONS FOR THE YEAR ENDED JULY 31, 2024
| | | Low Duration Bond Fund | | | Municipal Bond Fund | |
Investment Income: | | | | | | | | |
Interest Income | | $ | 13,971,282 | | | $ | 590,428 | |
Total Investment Income | | | 13,971,282 | | | | 590,428 | |
| | | | | | | | | |
Expenses: | | | | | | | | |
Investment Advisory Fees | | | 902,705 | | | | 44,293 | |
Administration Fees | | | 218,699 | | | | 12,886 | |
Distribution Fees - Investor Class Shares | | | 15,068 | | | | 7,596 | |
Trustees' Fees (Form NCSR Item 10) | | | 9,103 | | | | 537 | |
Chief Compliance Officer Fees | | | 2,598 | | | | 2,446 | |
Transfer Agent Fees | | | 55,609 | | | | 30,094 | |
Registration Fees | | | 51,946 | | | | 41,700 | |
Professional Fees | | | 51,672 | | | | 64,358 | |
Custodian Fees | | | 28,195 | | | | 1,229 | |
Pricing Fees | | | 14,364 | | | | 3,048 | |
Printing Fees | | | 9,163 | | | | 3,369 | |
Insurance and Other Expenses | | | 15,687 | | | | 11,955 | |
Total Expenses | | | 1,374,809 | | | | 223,511 | |
Less: Investment Advisory Fees Waived | | | – | | | | (33,057 | ) |
Less: Fees Paid Indirectly | | | (7,268 | ) | | | (462 | ) |
Net Expenses | | | 1,367,541 | | | | 189,992 | |
Net Investment Income | | | 12,603,741 | | | | 400,436 | |
Net Realized Gain/(Loss) on Investments | | | (3,499,098 | ) | | | (589,160 | ) |
Net Change in Unrealized Appreciation (Depreciation) on Investments | | | 10,808,289 | | | | 482,265 | |
Net Realized and Unrealized Gain (Loss) | | | 7,309,191 | | | | (106,895 | ) |
Increase in Net Assets Resulting from Operations | | $ | 19,912,932 | | | $ | 293,541 | |
Amounts designated as “—” are $0.
The accompanying notes are an integral part of the financial statements.
25

Statements of Changes in Net Assets
| | | Growth Equity Fund | |
| | | | Year ended
July 31, 2024 | | | | Year ended
July 31, 2023 | |
Operations: | | | | | | | | |
Net Investment Income (Loss) | | $ | (143,162 | ) | | $ | 488,316 | |
Net Realized Gain | | | 98,180,602 | | | | 37,210,782 | |
Net Change in Unrealized Appreciation (Depreciation) | | | (41,336,169 | ) | | | 1,539,349 | |
Net Increase in Net Assets Resulting from Operations | | | 56,701,271 | | | | 39,238,447 | |
Distributions: | | | | | | | | |
Institutional Class Shares | | | (38,049,107 | ) | | | (25,062,988 | ) |
Investor Class Shares | | | (2,338,795 | ) | | | (5,184,354 | ) |
A Class Shares | | | N/A | | | | N/A | |
Return of Capital: | | | | | | | | |
Institutional Class Shares | | | – | | | | – | |
Investor Class Shares | | | – | | | | – | |
A Class Shares | | | N/A | | | | N/A | |
Total Distributions | | | (40,387,902 | ) | | | (30,247,342 | ) |
Capital Share Transactions: | | | | | | | | |
Institutional Class Shares: | | | | | | | | |
Issued | | | 72,758,690 | | | | 26,307,969 | |
Reinvestment of Dividends | | | 26,414,831 | | | | 15,845,096 | |
Redeemed | | | (152,446,745 | ) | | | (75,806,336 | ) |
Net Increase (Decrease) in Net Assets from Institutional Class Share Transactions | | | (53,273,224 | ) | | | (33,653,271 | ) |
Investor Class Shares: | | | | | | | | |
Issued | | | 4,883,067 | | | | 5,567,063 | |
Reinvestment of Dividends | | | 2,257,969 | | | | 5,123,670 | |
Redeemed | | | (44,623,097 | ) | | | (9,031,507 | ) |
Net Increase (Decrease) in Net Assets from Investor Class Share Transactions | | | (37,482,061 | ) | | | 1,659,226 | |
A Class Shares: | | | | | | | | |
Issued | | | N/A | | | | N/A | |
Reinvestment of Dividends | | | N/A | | | | N/A | |
Redeemed | | | N/A | | | | N/A | |
Net Increase (Decrease) in Net Assets from A Class Share Transactions | | | N/A | | | | N/A | |
Net Increase (Decrease) in Net Assets from Capital Share Transactions | | | (90,755,285 | ) | | | (31,994,045 | ) |
Total Increase (Decrease) in Net Assets | | | (74,441,916 | ) | | | (23,002,940 | ) |
Net assets: | | | | | | | | |
Beginning of Year | | | 315,201,602 | | | | 338,204,542 | |
End of Year | | $ | 240,759,686 | | | $ | 315,201,602 | |
Share Transactions: | | | | | | | | |
Institutional Class Shares: | | | | | | | | |
Issued | | | 4,779,089 | | | | 1,937,979 | |
Reinvestment of Dividends | | | 1,869,076 | | | | 1,317,132 | |
Redeemed | | | (10,258,381 | ) | | | (5,535,671 | ) |
Total Increase (Decrease) in Institutional Class Shares | | | (3,610,216 | ) | | | (2,280,560 | ) |
Investor Class Shares: | | | | | | | | |
Issued | | | 323,621 | | | | 428,340 | |
Reinvestment of Dividends | | | 165,783 | | | | 438,295 | |
Redeemed | | | (3,007,511 | ) | | | (672,721 | ) |
Total Increase (Decrease) in Investor Class Shares | | | (2,518,107 | ) | | | 193,914 | |
A Class Shares: | | | | | | | | |
Issued | | | N/A | | | | N/A | |
Reinvestment of Dividends | | | N/A | | | | N/A | |
Redeemed | | | N/A | | | | N/A | |
Total Increase (Decrease) in A Class Shares | | | N/A | | | | N/A | |
Net Increase (Decrease) in Shares Outstanding | | | (6,128,323 | ) | | | (2,086,646 | ) |
Amounts designated as “—” are $0.
“N/A” designates that the Fund does not offer this class.
The accompanying notes are an integral part of the financial statements.
26

Statements of Changes in Net Assets
Total Return Bond Fund | | Credit Fund | | Low Duration Bond Fund | | | Municipal Bond Fund | |
| | Year ended
July 31, 2024 | | | | Year ended
July 31, 2023 | | | | Year ended
July 31, 2024 | | | | Year ended
July 31, 2023 | | | | Year ended
July 31, 2024 | | | | Year ended
July 31, 2023 | | | | Year ended
July 31, 2024 | | | | Year ended
July 31, 2023 | |
| | | | | | | | | | | | | | | | | | | | | | | | | | | | | | | |
| $ | 158,999,188 | | | $ | 151,532,381 | | | $ | 12,651,274 | | | $ | 9,316,144 | | | $ | 12,603,741 | | | $ | 10,907,122 | | | $ | 400,436 | | | $ | 769,932 | |
| | (3,907,258 | ) | | | (74,285,266 | ) | | | (2,237,564 | ) | | | (4,241,160 | ) | | | (3,499,098 | ) | | | (14,850,217 | ) | | | (589,160 | ) | | | (24,052 | ) |
| | 163,650,189 | | | | (25,176,519 | ) | | | 12,277,754 | | | | 2,947,524 | | | | 10,808,289 | | | | 7,337,971 | | | | 482,265 | | | | (650,812 | ) |
| | 318,742,119 | | | | 52,070,596 | | | | 22,691,464 | | | | 8,022,508 | | | | 19,912,932 | | | | 3,394,876 | | | | 293,541 | | | | 95,068 | |
| | | | | | | | | | | | | | | | | | | | | | | | | | | | | | | |
| | (144,982,307 | ) | | | (135,856,999 | ) | | | (10,581,993 | ) | | | (7,842,548 | ) | | | (12,474,479 | ) | | | (10,290,434 | ) | | | (421,047 | ) | | | (683,261 | ) |
| | (11,507,752 | ) | | | (14,822,377 | ) | | | (2,322,438 | ) | | | (1,580,341 | ) | | | (219,076 | ) | | | (544,640 | ) | | | (84,837 | ) | | | (121,275 | ) |
| | (280,394 | ) | | | (418,200 | ) | | | (110,119 | ) | | | (60,742 | ) | | | N/A | | | | N/A | | | | N/A | | | | N/A | |
| | | | | | | | | | | | | | | | | | | | | | | | | | | | | | | |
| | – | | | | – | | | | (17,620 | ) | | | – | | | | – | | | | – | | | | (4,911 | ) | | | – | |
| | – | | | | – | | | | (4,249 | ) | | | – | | | | – | | | | – | | | | (1,458 | ) | | | – | |
| | – | | | | – | | | | (190 | ) | | | – | | | | N/A | | | | N/A | | | | N/A | | | | N/A | |
| | (156,770,453 | ) | | | (151,097,576 | ) | | | (13,036,609 | ) | | | (9,483,631 | ) | | | (12,693,555 | ) | | | (10,835,074 | ) | | | (512,253 | ) | | | (804,536 | ) |
| | | | | | | | | | | | | | | | | | | | | | | | | | | | | | | |
| | | | | | | | | | | | | | | | | | | | | | | | | | | | | | | |
| | 1,026,678,903 | | | | 694,114,920 | | | | 143,271,087 | | | | 23,057,562 | | | | 80,500,969 | | | | 44,457,662 | | | | 253,760 | | | | 5,674,456 | |
| | 97,437,577 | | | | 85,757,986 | | | | 4,325,614 | | | | 1,912,894 | | | | 5,355,451 | | | | 4,042,044 | | | | 266,815 | | | | 349,476 | |
| | (598,982,279 | ) | | | (654,551,611 | ) | | | (30,749,142 | ) | | | (38,516,083 | ) | | | (93,287,306 | ) | | | (99,116,471 | ) | | | (17,664,505 | ) | | | (13,643,381 | ) |
| | 525,134,201 | | | | 125,321,295 | | | | 116,847,559 | | | | (13,545,627 | ) | | | (7,430,886 | ) | | | (50,616,765 | ) | | | (17,143,930 | ) | | | (7,619,449 | ) |
| | | | | | | | | | | | | | | | | | | | | | | | | | | | | | | |
| | 41,018,975 | | | | 30,835,131 | | | | 49,664,226 | | | | 19,113,606 | | | | 459,107 | | | | 3,282,996 | | | | 290,879 | | | | 665,868 | |
| | 9,532,933 | | | | 12,781,790 | | | | 2,217,684 | | | | 1,486,602 | | | | 201,846 | | | | 529,792 | | | | 85,691 | | | | 121,157 | |
| | (103,959,715 | ) | | | (73,975,113 | ) | | | (23,792,310 | ) | | | (7,565,369 | ) | | | (15,527,280 | ) | | | (8,037,414 | ) | | | (4,661,417 | ) | | | (218,347 | ) |
| | (53,407,807 | ) | | | (30,358,192 | ) | | | 28,089,600 | | | | 13,034,839 | | | | (14,866,327 | ) | | | (4,224,626 | ) | | | (4,284,847 | ) | | | 568,678 | |
| | | | | | | | | | | | | | | | | | | | | | | | | | | | | | | |
| | 328,817 | | | | 16,572 | | | | 1,651,493 | | | | 9,749 | | | | N/A | | | | N/A | | | | N/A | | | | N/A | |
| | 118,897 | | | | 118,459 | | | | 105,899 | | | | 54,870 | | | | N/A | | | | N/A | | | | N/A | | | | N/A | |
| | (2,917,937 | ) | | | (3,829,280 | ) | | | (139,225 | ) | | | (119,436 | ) | | | N/A | | | | N/A | | | | N/A | | | | N/A | |
| | (2,470,223 | ) | | | (3,694,249 | ) | | | 1,618,167 | | | | (54,817 | ) | | | N/A | | | | N/A | | | | N/A | | | | N/A | |
| | 469,256,171 | | | | 91,268,854 | | | | 146,555,326 | | | | (565,605 | ) | | | (22,297,213 | ) | | | (54,841,391 | ) | | | (21,428,777 | ) | | | (7,050,771 | ) |
| | 631,227,837 | | | | (7,758,126 | ) | | | 156,210,181 | | | | (2,026,728 | ) | | | (15,077,836 | ) | | | (62,281,589 | ) | | | (21,647,489 | ) | | | (7,760,239 | ) |
| | | | | | | | | | | | | | | | | | | | | | | | | | | | | | | |
| | 2,742,647,719 | | | | 2,750,405,845 | | | | 161,253,842 | | | | 163,280,570 | | | | 335,511,293 | | | | 397,792,882 | | | | 25,228,663 | | | | 32,988,902 | |
| $ | 3,373,875,556 | | | $ | 2,742,647,719 | | | $ | 317,464,023 | | | $ | 161,253,842 | | | $ | 320,433,457 | | | $ | 335,511,293 | | | $ | 3,581,174 | | | $ | 25,228,663 | |
| | | | | | | | | | | | | | | | | | | | | | | | | | | | | | | |
| | | | | | | | | | | | | | | | | | | | | | | | | | | | | | | |
| | 107,660,264 | | | | 73,420,239 | | | | 15,461,763 | | | | 2,559,576 | | | | 8,250,402 | | | | 4,599,869 | | | | 26,783 | | | | 600,696 | |
| | 10,234,209 | | | | 9,133,154 | | | | 467,677 | | | | 214,658 | | | | 551,246 | | | | 419,978 | | | | 28,799 | | | | 37,162 | |
| | (63,257,448 | ) | | | (69,472,918 | ) | | | (3,331,848 | ) | | | (4,290,379 | ) | | | (9,619,673 | ) | | | (10,274,821 | ) | | | (1,892,508 | ) | | | (1,449,385 | ) |
| | 54,637,025 | | | | 13,080,475 | | | | 12,597,592 | | | | (1,516,145 | ) | | | (818,025 | ) | | | (5,254,974 | ) | | | (1,836,926 | ) | | | (811,527 | ) |
| | | | | | | | | | | | | | | | | | | | | | | | | | | | | | | |
| | 4,329,702 | | | | 3,255,523 | | | | 5,355,985 | | | | 2,144,445 | | | | 47,248 | | | | 339,169 | | | | 31,250 | | | | 71,414 | |
| | 1,004,833 | | | | 1,361,230 | | | | 240,980 | | | | 167,199 | | | | 20,867 | | | | 55,020 | | | | 9,299 | | | | 12,882 | |
| | (11,103,705 | ) | | | (7,840,462 | ) | | | (2,588,978 | ) | | | (848,978 | ) | | | (1,611,233 | ) | | | (833,198 | ) | | | (493,769 | ) | | | (22,924 | ) |
| | (5,769,170 | ) | | | (3,223,709 | ) | | | 3,007,987 | | | | 1,462,666 | | | | (1,543,118 | ) | | | (439,009 | ) | | | (453,220 | ) | | | 61,372 | |
| | | | | | | | | | | | | | | | | | | | | | | | | | | | | | | |
| | 34,283 | | | | 1,783 | | | | 180,149 | | | | 1,093 | | | | N/A | | | | N/A | | | | N/A | | | | N/A | |
| | 12,514 | | | | 12,631 | | | | 11,506 | | | | 6,173 | | | | N/A | | | | N/A | | | | N/A | | | | N/A | |
| | (302,824 | ) | | | (404,890 | ) | | | (14,977 | ) | | | (13,361 | ) | | | N/A | | | | N/A | | | | N/A | | | | N/A | |
| | (256,027 | ) | | | (390,476 | ) | | | 176,678 | | | | (6,095 | ) | | | N/A | | | | N/A | | | | N/A | | | | N/A | |
| | 48,611,828 | | | | 9,466,290 | | | | 15,782,257 | | | | (59,574 | ) | | | (2,361,143 | ) | | | (5,693,983 | ) | | | (2,290,146 | ) | | | (750,155 | ) |
The accompanying notes are an integral part of the financial statements.
27

FINANCIAL HIGHLIGHTS
For a Share Outstanding Throughout Each Year
For the Years Ended July 31,
| | | Net
Asset Value, Beginning
of Year | | | Net
Investment
Income (Loss)(1) | | | Net Realized and Unrealized Gain (Loss) | | | Total from Operations | | | Dividends from Net Investment Income | | | Distribution
from Realized
Gains | | | Total
Dividends
&
Distributions | | | Net
Asset Value,
End of
Year | | | Total
Return† | | | Net
Assets
End of
Year
(000) | | | Ratio of Expenses to Average Net Assets | | | Expenses
to Average
Net Assets
(Excluding
Waivers and
Fees Paid
Indirectly) | | | Ratio of Net Investment Income (Loss) to Average Net Assets | | | Portfolio
Turnover
Rate | |
Growth Equity Fund |
Institutional Class Shares |
2024 | | $ | 15.75 | | | $ | (0.01 | ) | | $ | 3.87 | | | $ | 3.86 | | | $ | (0.01 | ) | | $ | (2.35 | ) | | $ | (2.36 | ) | | $ | 17.25 | | | | 27.87 | % | | | 223,213 | | | | 0.67 | % | | | 0.67 | % | | | (0.03 | )% | | | 17 | % |
2023 | | | 15.29 | | | | 0.03 | | | | 1.87 | | | | 1.90 | | | | — | | | | (1.44 | ) | | | (1.44 | ) | | | 15.75 | | | | 15.34 | | | | 260,597 | | | | 0.63 | | | | 0.63 | | | | 0.21 | | | | 12 | |
2022 | | | 20.28 | | | | (0.02 | ) | | | (2.56 | ) | | | (2.58 | ) | | | — | | | | (2.41 | ) | | | (2.41 | ) | | | 15.29 | | | | (14.97 | ) | | | 287,799 | | | | 0.63 | | | | 0.63 | | | | (0.11 | ) | | | 7 | |
2021 | | | 15.95 | | | | (0.01 | ) | | | 4.96 | | | | 4.95 | | | | (0.01 | ) | | | (0.61 | ) | | | (0.62 | ) | | | 20.28 | | | | 31.83 | | | | 389,166 | | | | 0.63 | | | | 0.63 | | | | (0.06 | ) | | | 17 | |
2020 | | | 13.82 | | | | 0.03 | | | | 3.53 | | | | 3.56 | | | | (0.04 | ) | | | (1.39 | ) | | | (1.43 | ) | | | 15.95 | | | | 27.91 | | | | 339,542 | | | | 0.64 | | | | 0.64 | | | | 0.20 | | | | 17 | |
Investor Class Shares |
2024 | | $ | 15.28 | | | $ | (0.04 | ) | | $ | 3.73 | | | $ | 3.69 | | | $ | — | | | $ | (2.35 | ) | | $ | (2.35 | ) | | $ | 16.62 | | | | 27.55 | % | | | 17,547 | | | | 0.91 | % | | | 0.91 | % | | | (0.27 | )% | | | 17 | % |
2023 | | | 14.91 | | | | (0.01 | ) | | | 1.82 | | | | 1.81 | | | | — | | | | (1.44 | ) | | | (1.44 | ) | | | 15.28 | | | | 15.11 | | | | 54,604 | | | | 0.88 | | | | 0.88 | | | | (0.05 | ) | | | 12 | |
2022 | | | 19.89 | | | | (0.06 | ) | | | (2.51 | ) | | | (2.57 | ) | | | — | | | | (2.41 | ) | | | (2.41 | ) | | | 14.91 | | | | (15.24 | ) | | | 50,405 | | | | 0.88 | | | | 0.88 | | | | (0.36 | ) | | | 7 | |
2021 | | | 15.68 | | | | (0.05 | ) | | | 4.87 | | | | 4.82 | | | | — | | | | (0.61 | ) | | | (0.61 | ) | | | 19.89 | | | | 31.52 | | | | 69,343 | | | | 0.88 | | | | 0.88 | | | | (0.31 | ) | | | 17 | |
2020 | | | 13.61 | | | | (0.01 | ) | | | 3.48 | | | | 3.47 | | | | (0.01 | ) | | | (1.39 | ) | | | (1.40 | ) | | | 15.68 | | | | 27.62 | | | | 56,812 | | | | 0.89 | | | | 0.89 | | | | (0.05 | ) | | | 17 | |
Total Return Bond Fund |
Institutional Class Shares |
2024 | | $ | 9.36 | | | $ | 0.52 | | | $ | 0.51 | | | $ | 1.03 | | | $ | (0.51 | ) | | $ | — | | | $ | (0.51 | ) | | $ | 9.88 | | | | 11.34 | % | | | 3,150,416 | | | | 0.46 | % | | | 0.46 | % | | | 5.44 | % | | | 48 | % |
2023 | | | 9.70 | | | | 0.53 | | | | (0.34 | ) | | | 0.19 | | | | (0.53 | ) | | | — | | | | (0.53 | ) | | | 9.36 | | | | 2.05 | | | | 2,474,473 | | | | 0.46 | | | | 0.47 | | | | 5.60 | | | | 64 | |
2022 | | | 10.40 | | | | 0.35 | | | | (0.69 | ) | | | (0.34 | ) | | | (0.36 | ) | | | — | | | | (0.36 | ) | | | 9.70 | | | | (3.30 | ) | | | 2,437,441 | | | | 0.47 | | | | 0.47 | | | | 3.46 | | | | 73 | |
2021 | | | 10.07 | | | | 0.30 | | | | 0.38 | | | | 0.68 | | | | (0.35 | ) | | | — | | | | (0.35 | ) | | | 10.40 | | | | 6.85 | | | | 2,741,353 | | | | 0.46 | | | | 0.46 | | | | 2.93 | | | | 38 | |
2020 | | | 10.42 | | | | 0.38 | | | | (0.32 | ) | | | 0.06 | | | | (0.41 | ) | | | — | | | | (0.41 | ) | | | 10.07 | | | | 0.60 | | | | 2,834,690 | | | | 0.47 | | | | 0.47 | | | | 3.74 | | | | 48 | |
Investor Class Shares |
2024 | | $ | 9.36 | | | $ | 0.49 | | | $ | 0.50 | | | $ | 0.99 | | | $ | (0.48 | ) | | $ | — | | | $ | (0.48 | ) | | $ | 9.87 | | | | 10.94 | % | | | 219,576 | | | | 0.71 | % | | | 0.71 | % | | | 5.21 | % | | | 48 | % |
2023 | | | 9.70 | | | | 0.50 | | | | (0.34 | ) | | | 0.16 | | | | (0.50 | ) | | | — | | | | (0.50 | ) | | | 9.36 | | | | 1.79 | | | | 262,100 | | | | 0.71 | | | | 0.72 | | | | 5.34 | | | | 64 | |
2022 | | | 10.40 | | | | 0.32 | | | | (0.68 | ) | | | (0.36 | ) | | | (0.34 | ) | | | — | | | | (0.34 | ) | | | 9.70 | | | | (3.55 | ) | | | 302,887 | | | | 0.72 | | | | 0.72 | | | | 3.20 | | | | 73 | |
2021 | | | 10.07 | | | | 0.27 | | | | 0.38 | | | | 0.65 | | | | (0.32 | ) | | | — | | | | (0.32 | ) | | | 10.40 | | | | 6.59 | | | | 368,782 | | | | 0.71 | | | | 0.71 | | | | 2.67 | | | | 38 | |
2020 | | | 10.41 | | | | 0.35 | | | | (0.31 | ) | | | 0.04 | | | | (0.38 | ) | | | — | | | | (0.38 | ) | | | 10.07 | | | | 0.44 | | | | 429,079 | | | | 0.72 | | | | 0.72 | | | | 3.47 | | | | 48 | |
A Class Shares |
2024 | | $ | 9.35 | | | $ | 0.49 | | | $ | 0.50 | | | $ | 0.99 | | | $ | (0.47 | ) | | $ | — | | | $ | (0.47 | ) | | $ | 9.87 | | | | 10.96 | % | | | 3,883 | | | | 0.81 | % | | | 0.81 | % | | | 5.12 | % | | | 48 | % |
2023 | | | 9.69 | | | | 0.49 | | | | (0.34 | ) | | | 0.15 | | | | (0.49 | ) | | | — | | | | (0.49 | ) | | | 9.35 | | | | 1.69 | | | | 6,075 | | | | 0.81 | | | | 0.82 | | | | 5.23 | | | | 64 | |
2022 | | | 10.40 | | | | 0.32 | | | | (0.69 | ) | | | (0.37 | ) | | | (0.34 | ) | | | — | | | | (0.34 | ) | | | 9.69 | | | | (3.63 | ) | | | 10,078 | | | | 0.79 | | | | 0.79 | | | | 3.19 | | | | 73 | |
2021 | | | 10.06 | | | | 0.28 | | | | 0.39 | | | | 0.67 | | | | (0.33 | ) | | | — | | | | (0.33 | ) | | | 10.40 | | | | 6.71 | | | | 6,894 | | | | 0.72 | | | | 0.72 | | | | 2.69 | | | | 38 | |
2020 | | | 10.41 | | | | 0.35 | | | | (0.32 | ) | | | 0.03 | | | | (0.38 | ) | | | — | | | | (0.38 | ) | | | 10.06 | | | | 0.34 | | | | 1,788 | | | | 0.72 | | | | 0.72 | | | | 3.47 | | | | 48 | |
† | Total Return is for the period indicated and has not been annualized. The return shown does not reflect the deduction of taxes that a shareholder would pay on Fund distributions or the redemption of Fund shares and does not reflect the applicable sales charge, if applicable. |
(1) | Per share data calculated using average shares method. |
Amounts designated as “—” are either $0 or have been rounded to $0.
The accompanying notes are an integral part of the financial statements.
28

FINANCIAL HIGHLIGHTS
| | | Net
Asset Value, Beginning
of Year | | | Net
Investment
Income(1) | | | Net Realized and Unrealized Gain (Loss) | | | Total from Operations | | | Dividends from Net Investment Income | | | Distribution
from Realized
Gains | | | Return of Capital | | | Total
Dividends
&
Distributions | | | Net
Asset Value,
End of
Year | | | Total
Return† | | | Net
Assets
End of
Year
(000) | | | Ratio of Expenses to Average Net Assets | | | Expenses
to Average
Net Assets
(Excluding
Waivers and
Fees Paid
Indirectly) | | | Ratio of Net Investment Income to Average Net Assets | | | Portfolio
Turnover
Rate | |
Credit Fund |
Institutional Class Shares |
2024 | | $ | 9.03 | | | $ | 0.57 | | | $ | 0.42 | | | $ | 0.99 | | | $ | (0.58 | ) | | $ | — | ^^ | | $ | — | ^^ | | $ | (0.58 | ) | | $ | 9.44 | | | | 11.30 | % | | | 253,573 | | | | 0.70 | % | | | 0.70 | % | | | 6.18 | % | | | 26 | % |
2023 | | | 9.11 | | | | 0.53 | | | | (0.07 | ) | | | 0.46 | | | | (0.54 | ) | | | — | | | | — | | | | (0.54 | ) | | | 9.03 | | | | 5.31 | | | | 128,833 | | | | 0.73 | | | | 0.73 | | | | 5.90 | | | | 16 | |
2022 | | | 10.12 | | | | 0.42 | | | | (1.02 | ) | | | (0.60 | ) | | | (0.41 | ) | | | — | ^^ | | | — | | | | (0.41 | ) | | | 9.11 | | | | (6.05 | ) | | | 143,810 | | | | 0.71 | | | | 0.71 | | | | 4.36 | | | | 29 | |
2021 | | | 9.47 | | | | 0.37 | | | | 0.67 | | | | 1.04 | | | | (0.39 | ) | | | — | | | | — | | | | (0.39 | ) | | | 10.12 | | | | 11.12 | | | | 166,805 | | | | 0.71 | | | | 0.71 | | | | 3.78 | | | | 21 | |
2020 | | | 9.72 | | | | 0.41 | | | | (0.25 | ) | | | 0.16 | | | | (0.41 | ) | | | — | | | | — | | | | (0.41 | ) | | | 9.47 | | | | 1.79 | | | | 194,182 | | | | 0.71 | | | | 0.71 | | | | 4.35 | | | | 35 | |
Investor Class Shares |
2024 | | $ | 9.01 | | | $ | 0.55 | | | $ | 0.41 | | | $ | 0.96 | | | $ | (0.55 | ) | | $ | — | ^^ | | $ | — | ^^ | | $ | (0.55 | ) | | $ | 9.42 | | | | 11.05 | % | | | 61,156 | | | | 0.95 | % | | | 0.95 | % | | | 5.93 | % | | | 26 | % |
2023 | | | 9.10 | | | | 0.51 | | | | (0.08 | ) | | | 0.43 | | | | (0.52 | ) | | | — | | | | — | | | | (0.52 | ) | | | 9.01 | | | | 4.94 | | | | 31,396 | | | | 0.98 | | | | 0.98 | | | | 5.72 | | | | 16 | |
2022 | | | 10.10 | | | | 0.40 | | | | (1.01 | ) | | | (0.61 | ) | | | (0.39 | ) | | | — | ^^ | | | — | | | | (0.39 | ) | | | 9.10 | | | | (6.19 | ) | | | 18,380 | | | | 0.96 | | | | 0.96 | | | | 4.18 | | | | 29 | |
2021 | | | 9.46 | | | | 0.35 | | | | 0.65 | | | | 1.00 | | | | (0.36 | ) | | | — | | | | — | | | | (0.36 | ) | | | 10.10 | | | | 10.74 | | | | 9,333 | | | | 0.96 | | | | 0.96 | | | | 3.52 | | | | 21 | |
2020 | | | 9.71 | | | | 0.39 | | | | (0.25 | ) | | | 0.14 | | | | (0.39 | ) | | | — | | | | — | | | | (0.39 | ) | | | 9.46 | | | | 1.53 | | | | 10,815 | | | | 0.96 | | | | 0.96 | | | | 4.11 | | | | 35 | |
A Class Shares |
2024 | | $ | 9.01 | | | $ | 0.55 | | | $ | 0.40 | | | $ | 0.95 | | | $ | (0.55 | ) | | $ | — | ^^ | | $ | — | ^^ | | $ | (0.55 | ) | | $ | 9.41 | | | | 10.94 | % | | | 2,735 | | | | 0.95 | % | | | 0.95 | % | | | 5.94 | % | | | 26 | % |
2023 | | | 9.09 | | | | 0.51 | | | | (0.07 | ) | | | 0.44 | | | | (0.52 | ) | | | — | | | | — | | | | (0.52 | ) | | | 9.01 | | | | 5.06 | | | | 1,025 | | | | 0.98 | | | | 0.98 | | | | 5.66 | | | | 16 | |
2022 | | | 10.10 | | | | 0.40 | | | | (1.02 | ) | | | (0.62 | ) | | | (0.39 | ) | | | — | ^^ | | | — | | | | (0.39 | ) | | | 9.09 | | | | (6.30 | ) | | | 1,090 | | | | 0.96 | | | | 0.96 | | | | 4.12 | | | | 29 | |
2021 | | | 9.45 | | | | 0.35 | | | | 0.66 | | | | 1.01 | | | | (0.36 | ) | | | — | | | | — | | | | (0.36 | ) | | | 10.10 | | | | 10.87 | | | | 1,022 | | | | 0.96 | | | | 0.96 | | | | 3.51 | | | | 21 | |
2020 | | | 9.71 | | | | 0.38 | | | | (0.25 | ) | | | 0.13 | | | | (0.39 | ) | | | — | | | | — | | | | (0.39 | ) | | | 9.45 | | | | 1.44 | | | | 638 | | | | 0.96 | | | | 0.96 | | | | 4.06 | | | | 35 | |
† | Total Return is for the period indicated and has not been annualized. The return shown does not reflect the deduction of taxes that a shareholder would pay on Fund distributions or the redemption of Fund shares and does not reflect the applicable sales charge, if applicable. |
^^ | Amount is less than $0.005 per share. |
(1) | Per share data calculated using average shares method. |
Amounts designated as “—” are either $0 or have been rounded to $0.
The accompanying notes are an integral part of the financial statements.
29

FINANCIAL HIGHLIGHTS
For a Share Outstanding Throughout Each Year
For the Years Ended July 31,
| | | Net
Asset Value, Beginning
of Year | | | Net
Investment
Income(1) | | | Net Realized and Unrealized Gain (Loss) | | | Total from Operations | | | Dividends from Net Investment Income | | | Distribution
from Realized
Gains | | | Return of Capital | | | Total
Dividends
&
Distributions | | | Net
Asset Value,
End of
Year | | | Total
Return† | | | Net
Assets
End of
Year
(000) | | | Ratio of
Expenses to
Average
Net Assets | | | Expenses
to Average
Net Assets
(Excluding
Waivers and
Fees Paid
Indirectly) | | | Ratio of Net Investment Income to Average Net Assets | | | Portfolio
Turnover
Rate | |
Low Duration Bond Fund |
Institutional Class Shares |
2024 | | $ | 9.62 | | | $ | 0.41 | | | $ | 0.24 | | | $ | 0.65 | | | $ | (0.41 | ) | | $ | — | | | $ | — | | | $ | (0.41 | ) | | $ | 9.86 | | | | 6.94 | % | | | 317,687 | | | | 0.45 | % | | | 0.45 | % | | | 4.20 | % | | | 72 | % |
2023 | | | 9.81 | | | | 0.29 | | | | (0.19 | ) | | | 0.10 | | | | (0.29 | ) | | | — | | | | — | | | | (0.29 | ) | | | 9.62 | | | | 1.05 | | | | 317,976 | | | | 0.43 | | | | 0.44 | | | | 2.97 | | | | 81 | |
2022 | | | 10.47 | | | | 0.13 | | | | (0.60 | ) | | | (0.47 | ) | | | (0.13 | ) | | | (0.06 | ) | | | — | | | | (0.19 | ) | | | 9.81 | | | | (4.49 | ) | | | 375,615 | | | | 0.43 | | | | 0.43 | | | | 1.32 | | | | 36 | |
2021 | | | 10.47 | | | | 0.16 | | | | 0.03 | | | | 0.19 | | | | (0.17 | ) | | | (0.02 | ) | | | — | | | | (0.19 | ) | | | 10.47 | | | | 1.82 | | | | 454,723 | | | | 0.43 | | | | 0.43 | | | | 1.50 | | | | 49 | |
2020 | | | 10.28 | | | | 0.20 | | | | 0.19 | | | | 0.39 | | | | (0.20 | ) | | | — | | | | — | | | | (0.20 | ) | | | 10.47 | | | | 3.86 | | | | 402,977 | | | | 0.44 | | | | 0.44 | | | | 1.96 | | | | 71 | |
Investor Class Shares |
2024 | | $ | 9.63 | | | $ | 0.37 | | | $ | 0.26 | | | $ | 0.63 | | | $ | (0.39 | ) | | $ | — | | | $ | — | | | $ | (0.39 | ) | | $ | 9.87 | | | | 6.64 | % | | | 2,746 | | | | 0.69 | % | | | 0.69 | % | | | 3.78 | % | | | 72 | % |
2023 | | | 9.81 | | | | 0.26 | | | | (0.18 | ) | | | 0.08 | | | | (0.26 | ) | | | — | | | | — | | | | (0.26 | ) | | | 9.63 | | | | 0.90 | | | | 17,535 | | | | 0.68 | | | | 0.69 | | | | 2.72 | | | | 81 | |
2022 | | | 10.48 | | | | 0.11 | | | | (0.61 | ) | | | (0.50 | ) | | | (0.11 | ) | | | (0.06 | ) | | | — | | | | (0.17 | ) | | | 9.81 | | | | (4.83 | ) | | | 22,178 | | | | 0.68 | | | | 0.68 | | | | 1.07 | | | | 36 | |
2021 | | | 10.48 | | | | 0.13 | | | | 0.03 | | | | 0.16 | | | | (0.14 | ) | | | (0.02 | ) | | | — | | | | (0.16 | ) | | | 10.48 | | | | 1.56 | | | | 29,523 | | | | 0.68 | | | | 0.68 | | | | 1.25 | | | | 49 | |
2020 | | | 10.28 | | | | 0.18 | | | | 0.20 | | | | 0.38 | | | | (0.18 | ) | | | — | | | | — | | | | (0.18 | ) | | | 10.48 | | | | 3.70 | | | | 27,415 | | | | 0.69 | | | | 0.69 | | | | 1.72 | | | | 71 | |
Municipal Bond Fund |
Institutional Class Shares |
2024 | | $ | 9.39 | | | $ | 0.21 | | | $ | (0.05 | ) | | $ | 0.16 | | | $ | (0.50 | ) | | $ | — | | | $ | — | ^^ | | $ | (0.50 | ) | | $ | 9.05 | | | | 1.74 | % | | | 2,762 | | | | 1.04 | % | | | 1.27 | % | | | 2.30 | % | | | 0 | % |
2023 | | | 9.60 | | | | 0.24 | | | | (0.20 | ) | | | 0.04 | | | | (0.24 | ) | | | (0.01 | ) | | | — | | | | (0.25 | ) | | | 9.39 | | | | 0.46 | | | | 20,120 | | | | 0.70 | | | | 0.70 | | | | 2.53 | | | | 17 | |
2022 | | | 10.24 | | | | 0.23 | | | | (0.51 | ) | | | (0.28 | ) | | | (0.21 | ) | | | (0.15 | ) | | | — | | | | (0.36 | ) | | | 9.60 | | | | (2.84 | ) | | | 28,357 | | | | 0.64 | | | | 0.64 | | | | 2.35 | | | | 8 | |
2021 | | | 10.61 | | | | 0.26 | | | | 0.02 | | | | 0.28 | | | | (0.26 | ) | | | (0.39 | ) | | | — | | | | (0.65 | ) | | | 10.24 | | | | 2.77 | †† | | | 38,590 | | | | 0.56 | | | | 0.59 | | | | 2.49 | | | | 0 | |
2020 | | | 10.51 | | | | 0.23 | | | | 0.14 | | | | 0.37 | | | | (0.27 | ) | | | — | ^^ | | | — | | | | (0.27 | ) | | | 10.61 | | | | 3.56 | †† | | | 55,286 | | | | 0.46 | | | | 0.56 | | | | 2.19 | | | | 19 | |
Investor Class Shares |
2024 | | $ | 9.40 | | | $ | 0.19 | | | $ | (0.06 | ) | | $ | 0.13 | | | $ | (0.47 | ) | | $ | — | | | $ | — | ^^ | | $ | (0.47 | ) | | $ | 9.06 | | | | 1.44 | % | | | 820 | | | | 1.23 | % | | | 1.21 | % | | | 2.07 | % | | | 0 | % |
2023 | | | 9.60 | | | | 0.22 | | | | (0.19 | ) | | | 0.03 | | | | (0.22 | ) | | | (0.01 | ) | | | — | | | | (0.23 | ) | | | 9.40 | | | | 0.31 | | | | 5,108 | | | | 0.96 | | | | 0.96 | | | | 2.29 | | | | 17 | |
2022 | | | 10.25 | | | | 0.21 | | | | (0.53 | ) | | | (0.32 | ) | | | (0.18 | ) | | | (0.15 | ) | | | — | | | | (0.33 | ) | | | 9.60 | | | | (3.18 | ) | | | 4,632 | | | | 0.89 | | | | 0.89 | | | | 2.11 | | | | 8 | |
2021 | | | 10.61 | | | | 0.23 | | | | 0.03 | | | | 0.26 | | | | (0.23 | ) | | | (0.39 | ) | | | — | | | | (0.62 | ) | | | 10.25 | | | | 2.61 | †† | | | 4,797 | | | | 0.81 | | | | 0.84 | | | | 2.23 | | | | 0 | |
2020 | | | 10.51 | | | | 0.21 | | | | 0.13 | | | | 0.34 | | | | (0.24 | ) | | | — | ^^ | | | — | | | | (0.24 | ) | | | 10.61 | | | | 3.30 | †† | | | 4,729 | | | | 0.73 | | | | 0.83 | | | | 1.96 | | | | 19 | |
† | Total Return is for the period indicated and has not been annualized. The return shown does not reflect the deduction of taxes that a shareholder would pay on Fund distributions or the redemption of Fund shares and does not reflect the applicable sales charge, if applicable. |
†† | Total return would have been lower had certain expenses not been waived and assumed by the Adviser during the period. |
^^ | Amount is less than $0.005 per share. |
(1) | Per share data calculated using average shares method. |
Amounts designated as “—” are either $0 or have been rounded to $0.
The accompanying notes are an integral part of the financial statements.
30
This page is intentionally left blank.

Notes to Financial Statements July 31, 2024
1. Organization:
The Frost Family of Funds (the “Trust”) is an open-end investment management company established under Delaware law as a Delaware statutory trust under a Declaration of Trust dated December 11, 2018. The Frost Family of Funds include the Frost Growth Equity Fund (the “Growth Equity Fund”), Frost Total Return Bond Fund (the “Total Return Bond Fund”), Frost Credit Fund (the “Credit Fund”), Frost Low Duration Bond Fund (the “Low Duration Bond Fund”), and Frost Municipal Bond Fund (the “Municipal Bond Fund”) (each a “Fund” and, collectively, the “Funds”). With the exception of the Growth Equity Fund, each fund is classified as a “diversified” investment company under the 1940 Act. Effective May 17, 2021, the Growth Equity Fund was reclassified from a “diversified” to a “non-diversified” investment company under the 1940 Act. The Growth Equity Fund seeks to achieve long- term capital appreciation. The Total Return Bond Fund and Low Duration Bond Fund seek to maximize total return, consisting of income and capital appreciation, consistent with the preservation of principal. The Credit Fund seeks to maximize total return, consisting of income and capital appreciation. The Municipal Bond Fund seeks to provide a consistent level of current income exempt from federal income tax with a secondary emphasis on maximizing total return through capital appreciation. The Funds may change their investment objective without shareholder approval. The assets of each Fund of the Trust are segregated, and a shareholder’s interest is limited to the Fund in which shares are held. Certain of the Funds currently offer Institutional Class Shares, Investor Class Shares and A Class Shares.
2. Significant Accounting Policies:
The accompanying financial statements have been prepared in conformity with U.S. generally accepted accounting principles (“U.S. GAAP”) and are presented in U.S. dollars which is the functional currency of the Funds. The Funds are investment companies and therefore apply the accounting and reporting guidance issued by the U.S. Financial Accounting Standards Board (“FASB”) in Accounting Standards Codification (“ASC”) Topic 946, Financial Services — Investment Companies. The following are significant accounting policies which are consistently followed in the preparation of the financial statements.
Use of Estimates — The preparation of financial statements requires management to make estimates and assumptions that affect the reported amounts of assets and liabilities and disclosure of contingent assets and liabilities at the date of the financial statements and the reported amounts of increases and decreases in net assets from operations during the reporting period. Actual results could differ from those estimates and such differences could be material.
Security Valuation — Securities listed on a securities exchange, market or automated quotation system for which quotations are readily available (except for securities traded on NASDAQ), including securities traded over the counter, are valued at the last quoted sale price on an exchange or market (foreign or domestic) on which they are traded on the valuation date (or at approximately 4:00 p.m. Eastern Time if such exchange is normally open at that time), or, if there is no such reported sale on the valuation date, at the most recent quoted bid price. For securities traded on NASDAQ, the NASDAQ Official Closing Price will be used. Debt securities are priced based upon valuations provided by independent, third-party pricing agents, if available. Such values generally reflect the last reported sales price if the security is actively traded. The third-party pricing agents may also value debt securities at an evaluated bid price by employing methodologies that utilize actual market transactions, broker-supplied valuations, or other methodologies designed to identify the market value for such securities. Such methodologies generally consider such factors as security prices, yields, maturities, call features, ratings and developments relating to specific securities in arriving at valuations. On the first day a new debt security purchase is recorded, if a price is not available on the automated pricing feeds from the primary and secondary pricing vendors nor is it available from an independent broker, the security may be valued at its purchase price. Each day thereafter, the debt security will be valued according to the Trust’s fair value procedures until an independent source can be secured. Debt obligations with remaining maturities of sixty days or less may be valued at their amortized cost, which approximates market value provided that it is determined the amortized cost continues to approximate fair value. Should existing credit, liquidity or interest rate conditions in the relevant markets and issuer specific circumstances suggest that
32

Notes to Financial Statements July 31, 2024
amortized cost does not approximate fair value, then the amortized cost method may not be used. The prices for foreign securities are reported in local currency and converted to U.S. dollars using currency exchange rates.
Exchange-traded registered investment companies are valued at the closing price from the primary exchange.
Open-end investment companies held in the Funds’ portfolios are valued at the published net asset value.
Securities for which market prices are not “readily available” are valued in accordance with fair value procedures (the "Fair Value Procedures") established by the Adviser and approved by the Trust's Board of Trustees (the “Board”). Pursuant to Rule 2a-5 under the 1940 Act, the Board has designated the Adviser as the "valuation designee" to determine the fair value of securities and other instruments for which no readily available market quotations are available. The Fair Value Procedures are implemented through a Fair Value Committee (the “Committee”) of the Adviser.
Some of the more common reasons that may necessitate that a security be valued using fair value procedures include: the security’s trading has been halted or suspended; the security has been de-listed from a national exchange; the security’s primary trading market is temporarily closed at a time when under normal conditions it would be open; or the security’s primary pricing source is not able or willing to provide a price. When a security is valued in accordance with the fair value procedures, the Committee will determine the value after taking into consideration relevant information reasonably available to the Committee.
For securities that principally trade on a foreign market or exchange, a significant gap in time can exist between the time of a particular security’s last trade and the time at which a Fund calculates its net asset value. The closing prices of such securities may no longer reflect their market value at the time a Fund calculates net asset value if an event that could materially affect the value of those securities (a “Significant Event”) has occurred between the time of the security’s last close and the time that a Fund calculates net asset value. A Significant Event may relate to a single issuer or to an entire market sector. If the Adviser becomes aware of a Significant Event that has occurred with respect to a security or group of securities after the closing of the exchange or market on which the security or securities principally trade, but before the time at which a Fund calculates net asset value, it may request that a Committee meeting be called. In addition, SEI Investments Global Funds Services (the “Administrator”), a wholly owned subsidiary of SEI Investments Company, monitors price movements among certain selected indices, securities and/or baskets of securities that may be an indicator that the closing prices received earlier from foreign exchanges or markets may not reflect market value at the time a Fund calculates net asset value. If price movements in a monitored index or security exceed levels established by the Administrator, the Administrator notifies the Adviser if a Fund is holding a relevant security that such limits have been exceeded. In such event, the Adviser makes the determination whether a Committee meeting should be called based on the information provided.
In accordance with the authoritative guidance on fair value measurements and disclosure under U.S. GAAP, the Funds disclose fair value of their investments in a hierarchy that prioritizes the inputs to valuation techniques used to measure the fair value. The objective of a fair value measurement is to determine the price that would be received to sell an asset or paid to transfer a liability in an orderly transaction between market participants at the measurement date (an exit price). Accordingly, the fair value hierarchy gives the highest priority to quoted prices (unadjusted) in active markets for identical assets or liabilities (Level 1) and the lowest priority to unobservable inputs (Level 3).
The three levels of the fair value hierarchy are described below:
| | ● | Level 1 — Unadjusted quoted prices in active markets for identical, unrestricted assets or liabilities that the Funds have the ability to access at the measurement date; |
| | ● | Level 2 — Quoted prices which are not active, or inputs that are observable (either directly or indirectly) for substantially the full term of the asset or liability; and |
| | ● | Level 3 — Prices, inputs or exotic modeling techniques which are both significant to the fair value measurement and unobservable (supported by little or no market activity). |
33

Notes to Financial Statements July 31, 2024
Investments are classified within the level of the lowest significant input considered in determining fair value. Investments classified within Level 3 whose fair value measurement considers several inputs may include Level 1 or Level 2 inputs as components of the overall fair value measurement.
Federal Income Taxes — It is each Fund’s intention to continue to qualify as a regulated investment company under Sub- chapter M of the Internal Revenue Code and to distribute substantially all of its taxable income. Accordingly, no provision for Federal income taxes has been made in the financial statements.
The Funds evaluate tax positions taken or expected to be taken in the course of preparing the Funds’ tax returns to determine whether it is “more-likely-than-not” (i.e., greater than 50-percent) that each tax position will be sustained upon examination by a taxing authority based on the technical merits of the position. Tax positions not deemed to meet the more- likely-than-not threshold are recorded as a tax benefit or expense in the current year. The Funds did not record any tax provision in the current period. However, management’s conclusions regarding tax positions taken may be subject to review and adjustment at a later date based on factors including, but not limited to, examination by tax authorities (i.e., the last 3 tax year ends, as applicable), on-going analysis of and changes to tax laws, regulations and interpretations thereof.
As of and during the year ended July 31, 2024, the Funds did not have liabilities for any unrecognized tax benefits. The Funds recognize interest and penalties, if any, related to unrecognized tax benefits as income tax expense on the Statement of Operations. During the year ended July 31, 2024, the Funds did not incur any interest or penalties.
The Funds may also be subject to taxes imposed by governments of countries in which they invest. Such taxes are generally based on either income or gains earned or repatriated. The Funds accrue and apply such taxes to net investment income, net realized gains and net unrealized gains as income and/or capital gains are earned. In some cases, the Funds may be entitled to reclaim all or a portion of such taxes, and such reclaim amounts, if any, are reflected as an asset on the Funds’ books. In many cases, however, the Funds may not receive such amounts for an extended period of time, depending on the country of investment. Upon the Fund’s receipt of reclaims, the reclaims are recorded as a reduction to foreign taxes withheld.
Withholding taxes on foreign dividends have been provided for in accordance with the Funds’ understanding of the applicable country’s tax rules and rates. The Funds or their agent files withholding tax reclaims in certain jurisdictions to recover certain amounts previously withheld. The Funds may record a reclaim receivable based on collectability, which includes factors such as the jurisdiction’s applicable laws, payment history and market convention. Professional fees paid to those that provide assistance in receiving the tax reclaims, which generally are contingent upon successful receipt of reclaimed amounts, are recorded in Professional Fees on the Statements of Operations once the amounts are due. The professional fees related to pursuing these tax reclaims are not subject to the Adviser’s expense limitation agreement.
Security Transactions and Investment Income — Security transactions are accounted for on trade date for financial reporting purposes. Costs used in determining realized gains and losses on the sales of investment securities are based on the specific identification method. Dividend income is recognized on the ex-dividend date, interest income is recognized on an accrual basis and includes the amortization of premiums and the accretion of discount. Realized gains (losses) on paydowns of mortgage-backed and asset- backed securities are recorded as an adjustment to interest income. Litigation income received during the year is recorded as realized gains by the Fund when such information becomes known. Gains of this type are infrequent to the Fund and are not expected to reoccur on a consistent basis.
Repurchase Agreements — In connection with transactions involving repurchase agreements, a third party custodian bank takes possession of the underlying securities (“collateral”), the value of which exceeds the principal amount of the repurchase transaction, including accrued interest. Such collateral will be cash, debt securities issued or guaranteed by the U.S. Government, securities that at the time the repurchase agreement is entered into are rated in the highest category by a nationally recognized statistical rating organization (“NRSRO”) or unrated category by an NRSRO, as determined by the Adviser. In the event of default on the obligation to repurchase, the Funds have the right to liquidate the collateral
34

Notes to Financial Statements July 31, 2024
and apply the proceeds in satisfaction of the obligation. In the event of default or bankruptcy by the counterparty to the agreement, realization and/or retention of the collateral or proceeds may be subject to legal proceedings.
Futures Contracts — To the extent consistent with its investment objective and strategies, the Fund may use futures contracts for tactical hedging purposes as well as to enhance the Fund’s returns. The Fund’s investments in futures contracts are designed to enable the Fund to more closely approximate the performance of its benchmark indices. Initial margin deposits of cash or securities are made upon entering into futures contracts. The contracts are marked-to-market daily and the resulting changes in value are accounted for as unrealized gains and losses. Variation margin payments are paid or received, depending upon whether unrealized gains or losses are incurred. When contracts are closed, the Fund records a realized gain or loss equal to the difference between the proceeds from (or cost of) the closing transaction and the amount invested in the contract. Risks of entering into futures contracts include the possibility that there will be an imperfect price correlation between the futures and the underlying securities. Second, it is possible that a lack of liquidity for futures contracts could exist in the secondary market, resulting in an inability to close a position prior to its maturity date. Finally, futures contracts involve the risk that a Fund could lose more than the original margin deposit required to initiate a futures transaction.
There were no futures held by the Funds during the period ended and no futures held as of July 31, 2024.
Expenses — Expenses of the Trust that can be directly attributed to a particular fund are borne by that fund. Expenses which cannot be directly attributed to a fund are apportioned among the funds of the Trust based on the number of funds and/or relative net assets.
Classes — Class specific expenses are borne by the specific class of shares. Income, realized and unrealized gain (loss), and non-class specific expenses are allocated to the respective class on the basis of relative daily net assets.
Dividends and Distributions to Shareholders — The Growth Equity Fund distributes its net investment income and makes distributions of its net realized capital gains, if any, at least annually. The Total Return Bond Fund, Credit Fund, Low Duration Bond Fund, and Municipal Bond Fund each distribute their net investment income monthly, as available, and make distributions of their net realized capital gains, if any, at least annually.
Interfund Lending — The SEC has granted an exemption that permits the Funds to participate in an interfund lending program (the “Interfund Lending Program”) whereby the Funds may lend money to, and borrow money from, each other for temporary or emergency purposes, subject to certain terms and conditions. Participation in the Interfund Lending Program is voluntary for both borrowing and lending Funds. For the year ended July 31, 2024, the Funds did not participate in the Interfund Lending Program.
3. Transactions with Affiliates:
Certain officers and two trustees of the Trust are also employees of the Adviser, the Administrator, and/or SEI Investments Distribution Co. (the “Distributor”). Such officers and trustees are paid no fees by the Trust for serving as officers and trustees of the Trust. A portion of the services provided by the Chief Compliance Officer (“CCO”) and his staff, whom are the employees of the Administrator, are paid for by the Trust as incurred. The services include regulatory oversight of the Trust’s advisers and service providers as required by SEC regulations. The CCO’s services have been approved by and are reviewed by the Board.
4. Administration, Distribution, Shareholder Servicing, Transfer Agent and Custodian Agreements:
The Funds and the Administrator are parties to an Administration Agreement under which the Administrator provides administrative services to the Fund. For these services, the Administrator is paid an asset-based fee, which will vary depending on the number of share classes and the average daily net assets of the Funds. For the year ended July 31, 2024, the Funds
35

Notes to Financial Statements July 31, 2024
were charged as follows for these services: $184,800 in the Growth Equity Fund, $2,134,695 in the Total Return Bond Fund, $149,962 in the Credit Fund, $218,699 in the Low Duration Bond Fund, and $12,886 in the Municipal Bond Fund.
The Funds have adopted a Distribution Plan (the “Plan”) for the Investor Class Shares and A Class Shares. Under the Plan, the Distributor, or third parties that enter into agreements with the Distributor, may receive up to 0.25% of each Fund’s average net assets attributable to the Investor Class Shares and A Class Shares as compensation for distribution services.
The Funds have adopted a shareholder servicing plan that provides that the Funds may pay financial intermediaries for shareholder services in an annual amount not to exceed 0.15% based on the average daily net assets of the Funds’ A Class Shares. The services for which financial intermediaries are compensated may include record-keeping, transaction processing for shareholders’ accounts and other shareholder services. For the year ended July 31, 2024, Total Return Bond Fund paid $5,639 for shareholder services.
SS&C Global Investor & Distribution Solutions, Inc. serves as the transfer agent and dividend disbursing agent for the Funds under a transfer agency agreement with the Trust. The Funds may earn cash management credits which can be used to offset transfer agent expenses. These credit amounts are listed as “Fees Paid Indirectly” on the Statements of Operations.
Brown Brothers Harriman & Co. serves as Custodian for the Funds. The Custodian plays no role in determining the investment policies of the Funds or which securities are to be purchased or sold by the Funds.
5. Investment Advisory Agreement:
The Adviser serves as the investment adviser to the Funds. The Adviser is a wholly owned non-banking subsidiary of Cullen/ Frost Bankers, Inc. (“Frost Bank”). For its services, the Adviser is entitled to a fee, which is calculated daily and paid monthly, at the following annual rates based on the average daily net assets of each Fund. The Adviser has contractually agreed to reduce its fees and/or reimburse expenses for certain Funds to the extent necessary to keep total annual Fund operating expenses from exceeding certain levels as set forth below until June 24, 2025 (the “Contractual Expense Limitation”) for the Growth Equity Fund, Total Return Bond Fund, Credit Fund and Low Duration Bond Fund. The Adviser is entitled to the same fee for its services to each Fund. In addition, the Adviser agreed to the same Contractual Expense Limitation and Voluntary Expense Limitation, as applicable, for each Fund.
The table below shows the rate of each Fund’s investment advisory fee and the Adviser’s Contractual Expense Limitation for each Fund:
Fund | Advisory Fee Before Contractual Fee Reduction | Institutional Class Shares Contractual Expense Limitation | Investor Class Shares Contractual Expense Limitation* | A Class Shares Contractual Expense Limitation** |
Growth Equity Fund | 0.50% | 1.25% | 1.50% | N/A |
Total Return Bond Fund | 0.35% | 0.95% | 1.20% | 1.35% |
Credit Fund | 0.50% | 1.00% | 1.25% | 1.40% |
Low Duration Bond Fund | 0.30% | 0.95% | 1.20% | N/A |
Municipal Bond Fund† | 0.25% | N/A | N/A | N/A |
| † | Prior to November 28, 2020, the investment advisory fee was 0.35%. |
| * | The Rate includes the distribution amount of 0.25%. |
| ** | The Rate includes the distribution amount of 0.25% and the servicing amount of 0.15%. |
Prior to November 28, 2020, the Adviser had contractually agreed to waive the advisory fee for the Municipal Bond Fund (which was 0.35% at the time) by 0.01% (the “contractual fee reduction”) and had voluntarily agreed to reduce the advisory fee by an additional 0.09% (the “voluntary fee reduction”).
In addition, the Adviser has voluntarily agreed to reduce its fees and/or reimburse expenses of the Frost Municipal Bond Fund to the extent necessary to keep total annual Fund operating expenses (not including excluded expenses) for Institutional Class Shares and Investor Class Shares from exceeding 1.05% (the “voluntary expense limitation”). The Adviser intends to continue
36

Notes to Financial Statements July 31, 2024
this voluntary expense limitation until further notice, but may discontinue all or part of these fee reductions or expense reimbursements at any time. At July 31, 2024, there were no amounts available for recapture.
If at any point it becomes unnecessary for the Adviser to make Expense Limitation reimbursements, the Adviser may retain the difference between the “Total Annual Fund Operating Expenses” and the aforementioned Expense Limitations to recapture all or a portion of its prior Expense Limitation reimbursements made during the preceding three year period up to the expense cap in place at the time the expenses were waived. The Adviser, however, will not be permitted to recapture any amount that is attributable to its Voluntary Fee Reduction. During the year ended July 31, 2024, the Adviser did not recapture previously waived/reimbursed fees for the Funds.
6. Investment Transactions:
The cost of security purchases and the proceeds from the sales and maturities of securities, other than short-term investments and in-kind transactions, for the year ended July 31, 2024, were as follows:
| | | | U.S. Government | | | | Other | | | Total | |
Growth Equity Fund |
Purchases | | $ | — | | | $ | 43,579,154 | | | $ | 43,579,154 | |
Sales | | | — | | | | 143,337,911 | | | | 143,337,911 | |
Total Return Bond Fund |
Purchases | | | 1,153,481,941 | | | | 548,943,495 | | | | 1,702,425,436 | |
Sales | | | 574,182,184 | | | | 765,415,821 | | | | 1,339,598,005 | |
Credit Fund |
Purchases | | | — | | | | 130,926,232 | | | | 130,926,232 | |
Sales | | | — | | | | 44,147,358 | | | | 44,147,358 | |
Low Duration Bond Fund |
Purchases | | | 149,242,969 | | | | 39,840,734 | | | | 189,083,703 | |
Sales | | | 128,856,445 | | | | 81,434,887 | | | | 210,291,332 | |
Municipal Bond Fund |
Purchases | | | — | | | | — | | | | — | |
Sales | | | — | | | | 22,136,587 | | | | 22,136,587 | |
7. Federal Tax Information:
The timing and characterization of certain income and capital gains distributions are determined annually in accordance with federal tax regulations which may differ from U.S. generally accepted accounting principles. As a result, net investment income (loss) and net realized gain (loss) on investment transactions for a reporting period may differ significantly from distributions during such period. These book/tax differences may be temporary or permanent in nature. To the extent these differences are permanent in nature, they are charged or credited to distributable earnings or paid-in-capital as appropriate, in the period that the difference arises. The permanent differences primarily consist of reclassification of long term capital gain distribution on REITs (Real Estate Investment Trust), market discount adjustment, amortization adjustment on premium bond sold, gains and losses on paydowns of mortgage and asset-backed securities for tax purposes, defaulted bond adjustment, foreign currency gain/(loss), net operating loss offset to gains, perpetual bond adjustment, and distribution reclassification.
The permanent difference that is credited or charged to Paid-in Capital and Distribute Earnings as of July 31, 2024 is primarily related to tax treatment of gains/ (losses) from securities redeemed in-kind and deemed Distribution to Shareholder redemptions:
| | | Paid-in Capital | | | Distributable Earnings (Loss) | |
Frost Growth Equity Fund | | $ | 49,044,806 | | | $ | (49,044,806 | ) |
37

Notes to Financial Statements July 31, 2024
The tax character of dividends and distributions declared during the years ended July 31, 2024 and July 31, 2023, were as follows:
| | | | | | | Tax Exempt | | | Ordinary Income | | | Long-Term Capital Gains | | | Return of Capital | | | Total | |
Growth Equity Fund |
2024 | | $ | – | | | $ | 225,528 | | | $ | 40,162,374 | | | $ | – | | | $ | 40,387,902 | |
2023 | | | – | | | | – | | | | 30,247,342 | | | | – | | | | 30,247,342 | |
Total Return Bond Fund |
2024 | | | – | | | | 156,770,453 | | | | – | | | | – | | | | 156,770,453 | |
2023 | | | – | | | | 151,097,576 | | | | – | | | | – | | | | 151,097,576 | |
Credit Fund |
2024 | | | – | | | | 13,014,550 | | | | – | | | | 22,059 | | | | 13,036,609 | |
2023 | | | – | | | | 9,483,631 | | | | – | | | | – | | | | 9,483,631 | |
Low Duration Bond Fund |
2024 | | | – | | | | 12,693,555 | | | | – | | | | – | | | | 12,693,555 | |
2023 | | | – | | | | 10,835,074 | | | | – | | | | – | | | | 10,835,074 | |
Municipal Bond Fund |
2024 | | | 446,184 | | | | 59,700 | | | | – | | | | 6,369 | | | | 512,253 | |
2023 | | | 673,991 | | | | 95,158 | | | | 35,387 | | | | – | | | | 804,536 | |
As of July 31, 2024, the components of distributable earnings (accumulated losses) on a tax basis were as follows:
| | | Undistributed Ordinary Income | | | Undistributed Tax-Exempt Income | | | Undistributed Long-Term Capital Gains | | | Post October Losses | | | Capital Loss Carryforwards | | | Unrealized Appreciation (Depreciation) on Investments and Foreign Currency | | | Late Year Loss Deferral | | | | Other Temporary Differences | | | Total Distributable Earnings (Accumulated Losses) | |
Growth Equity Fund | | $ | 667,031 | | | $ | – | | | $ | 43,336,915 | | | $ | – | | | $ | – | | | $ | 145,582,207 | | | $ | – | | | $ | 2 | | | $ | 189,586,155 | |
Total Return Bond Fund | | | 1,065,540 | | | | – | | | | – | | | | – | | | | (252,482,318 | ) | | | 38,156,875 | | | | – | | | | 36 | | | | (213,259,867 | ) |
Credit Fund | | | – | | | | – | | | | – | | | | – | | | | (7,572,454 | ) | | | (254,787 | ) | | | – | | | | 1 | | | | (7,827,240 | ) |
Low Duration Bond Fund | | | 26,642 | | | | – | | | | – | | | | – | | | | (20,939,202 | ) | | | (215,264 | ) | | | – | | | | 8 | | | | (21,127,816 | ) |
Municipal Bond Fund | | | – | | | | – | | | | – | | | | – | | | | (602,037 | ) | | | (38,555 | ) | | | – | | | | (1 | ) | | | (640,593 | ) |
Post-October capital losses represent capital losses realized on investment transactions from November 1, 2023, through July 31, 2024, that, in accordance with Federal income tax regulations, the Funds may elect to defer and treat as having arisen in the following fiscal year.
Deferred late-year losses represent ordinary losses realized on investment transactions from January 1, 2024, through July 31, 2024, and specified losses realized on investment transactions from November 1, 2023, through July 31, 2024, that, in accordance with Federal income tax regulations, the Funds may elect to defer and treat as having arisen in the following fiscal year. For the year ended July 31, 2024, there were no deferred Post-October capital losses or late-year losses.
The Fund have capital losses carried forward as follows:
| | | Short-Term
Loss | | | Long-Term
Loss | | | Total | |
Total Return Bond Fund | | $ | 56,629,242 | | | $ | 195,853,076 | | | $ | 252,482,318 | |
Credit Fund | | | 725,716 | | | | 6,846,738 | | | | 7,572,454 | |
Low Duration Bond Fund | | | 4,856,653 | | | | 16,082,549 | | | | 20,939,202 | |
Municipal Bond Fund | | | — | | | | 602,037 | | | | 602,037 | |
38

Notes to Financial Statements July 31, 2024
The aggregate cost of investments for federal income tax purposes at July 31, 2024, is different from book purposes primarily due to wash sales loss deferrals, market discount adjustment, perpetual bond adjustment and the difference due premium amortization on callable securities. The Federal tax cost and aggregate gross unrealized appreciation and depreciation on investments held by the Funds at July 31, 2024, were as follows:
| | | Federal Tax Cost | | | Aggregated Gross Unrealized Appreciation | | | Aggregated Gross Unrealized Depreciation | | | Net Unrealized Appreciation (Depreciation) | |
Growth Equity Fund | | $ | 90,957,367 | | | $ | 147,028,110 | | | $ | (1,445,903 | ) | | $ | 145,582,207 | |
Total Return Bond Fund | | | 3,259,991,361 | | | | 140,982,210 | | | | (102,825,317 | ) | | | 38,156,893 | |
Credit Fund | | | 298,836,485 | | | | 4,324,545 | | | | (4,579,332 | ) | | | (254,787 | ) |
Low Duration Bond Fund | | | 303,211,137 | | | | 2,737,686 | | | | (2,952,950 | ) | | | (215,264 | ) |
Municipal Bond Fund | | | 2,443,165 | | | | 2,037 | | | | (40,592 | ) | | | (38,555 | ) |
8. Risks:
As with all mutual funds, there is no guarantee that the Funds will achieve its investment objective. You could lose money by investing in the Funds. A Fund share is not a bank deposit and it is not insured or guaranteed by the Federal Deposit Insurance Corporation, or any government agency. The principal risks affecting shareholders’ investments in the Funds are set forth below.
Asset-Backed and Mortgage-Backed Securities Risk (Total Return Bond Fund, Credit Fund, Low Duration Bond Fund): Payment of principal and interest on asset-backed securities is dependent largely on the cash flows generated by the assets backing the securities, and asset-backed securities may not have the benefit of any security interest in the related assets, which raises the possibility that recoveries on repossessed collateral may not be available to support payments on these securities. Asset- backed securities are also subject to the risk that underlying borrowers will be unable to meet their obligations. To lessen the effect of failures by obligors on underlying assets to make payments, the entity administering the pool of assets may agree to ensure the receipt of payments on the underlying pool occurs in a timely fashion (“liquidity protection”). In addition, asset- backed securities may obtain insurance, such as guarantees, policies or letters of credit obtained by the issuer or sponsor from third parties, for some or all of the assets in the pool (“credit support”). Delinquency or loss more than that anticipated or failure of the credit support could adversely affect the return on an investment in such a security.
In addition, certain asset-backed securities may not have the benefit of any security interest in the related assets, which raises the possibility that recoveries on repossessed collateral may not be available to support payments on these securities. For example, credit card receivables are generally unsecured and the debtors are entitled to the protection of a number of state and federal consumer credit laws, many of which allow debtors to reduce their balances by offsetting certain amounts owed on the credit cards. Most issuers of asset-backed securities backed by automobile receivables permit the servicers of such receivables to retain possession of the underlying obligations. If the servicer were to sell these obligations to another party, there is a risk that the purchaser would acquire an interest superior to that of the holders of the related asset-backed securities. Due to the quantity of vehicles involved and requirements under state laws, asset-backed securities backed by automobile receivables may not have a proper security interest in all of the obligations backing such receivables.
Mortgage-backed securities are affected by, among other things, interest rate changes and the possibility of prepayment of the underlying mortgage loans. Mortgage-backed securities are also subject to the risk that underlying borrowers will be unable to meet their obligations. In addition, a variety of economic, geographic, social and other factors, such as the sale of the underlying property, refinancing or foreclosure, can cause investors to repay the loans underlying a mortgage-backed security sooner than expected. If the prepayment rates increase, the Fund may have to reinvest its principal at a rate of interest that is lower than the rate on existing mortgage-backed securities.
Collateralized Loan Obligations Risk (Credit Fund, Low Duration Bond Fund, Total Return Bond Fund): Collateralized loan obligations are investment vehicles typically collateralized by a pool of loans, which may include, among others, senior secured loans, senior unsecured loans, and subordinate corporate loans, including loans that may be rated below investment grade or equivalent unrated loans. Collateralized loan obligations are subject to the risks of substantial losses due to actual defaults by borrowers of the loans underlying the collateralized loan obligations, which will be greater during periods of economic or financial stress. Collateralized loan obligations may also lose value due to collateral defaults and disappearance of subordinate tranches, market anticipation of defaults, and investor aversion to collateralized loan obligation securities as
39

Notes to Financial Statements July 31, 2024
a class. The Fund may invest in collateralized loan obligations that hold loans of uncreditworthy borrowers or in subordinate tranches of a collateralized loan obligation, which may absorb losses from underlying borrower defaults before senior tranches. Investments in such collateralized loan obligations present a greater risk of loss. In addition, collateralized loan obligations are subject to interest rate risk and credit risk.
Credit Risk (Total Return Bond Fund, Credit Fund, Low Duration Bond Fund, Municipal Bond Fund): The credit rating or financial condition of an issuer may affect the value of a debt security. Generally, the lower the quality rating of a security, the greater the risk that the issuer will fail to pay interest fully and return principal in a timely manner. If an issuer defaults or becomes unable to honor its financial obligations, the security may lose some or all of its value. The issuer of an investment-grade security is more likely to pay interest and repay principal than an issuer of a lower rated bond. Adverse economic conditions or changing circumstances, however, may weaken the capacity of the issuer to pay interest and repay principal.
U.S. government securities are not guaranteed against price movements due to changing interest rates. Obligations issued by some U.S. government agencies are backed by the U.S. Treasury, while others are backed solely by the ability of the agency to borrow from the U.S. Treasury or by the government sponsored agency’s own resources. As a result, investments in securities issued by government sponsored agencies that are not backed by the U.S. Treasury are subject to higher credit risk than those that are.
High yield, or “junk,” bonds are highly speculative securities that are usually issued by smaller less credit worthy and/or highly leveraged (indebted) companies. Compared with investment-grade bonds, high yield bonds carry a greater degree of risk and are less likely to make payments of interest and principal. Market developments and the financial and business conditions of the corporation issuing these securities influences their price and liquidity more than changes in interest rates, when compared to investment-grade debt securities. Insufficient liquidity in the junk bond market may make it more difficult to dispose of junk bonds and may cause the Fund to experience sudden and substantial price declines. A lack of reliable, objective data or market quotations may make it more difficult to value junk bonds accurately.
Equity Risk (Growth Equity Fund): Since they purchase equity securities, the Funds are subject to the risk that stock prices will fall over short or extended periods of time. Historically, the equity markets have moved in cycles, and the value of each Fund’s equity securities may fluctuate drastically from day to day. Individual companies may report poor results or be negatively affected by industry and/or economic trends and developments. The prices of securities issued by such companies may suffer a decline in response. These factors contribute to price volatility, which is the principal risk of investing in each Fund.
Foreign Company Risk (Growth Equity Fund, Credit Fund): Investing in foreign companies, whether through investments made in foreign markets or made through the purchase of ADRs, which are traded on U.S. exchanges and represent an ownership in a foreign security, poses additional risks since political and economic events unique to a country or region will affect those markets and their issuers. These risks will not necessarily affect the U.S. economy or similar issuers located in the United States. In addition, investments in foreign companies are generally denominated in a foreign currency. As a result, changes in the value of those currencies compared to the U.S. dollar may affect (positively or negatively) the value of a Fund’s investments. These currency movements may occur separately from, and in response to, events that do not otherwise affect the value of the security in the issuer’s home country. Securities of foreign companies may not be registered with the U.S. Securities and Exchange Commission (“SEC”) and foreign companies are generally not subject to the regulatory controls imposed on U.S. issuers and, as a consequence, there is generally less publically available information about foreign securities than is available about domestic securities. Income from foreign securities owned by a Fund may be reduced by a withholding tax at the source, which tax would reduce income received from the securities comprising the Fund’s portfolio. Foreign securities may also be more difficult to value than securities of U.S. issuers. While ADRs provide an alternative to directly purchasing the underlying foreign securities in their respective national markets and currencies, investments in ADRs continue to be subject to many of the risks associated with investing directly in foreign securities.
Growth Style Risk (Growth Equity Fund): The price of equity securities rises and falls in response to many factors, including the historical and prospective earnings of the issuer of the stock, the value of its assets, general economic conditions, interest rates, investor perceptions, and market liquidity. The Fund may invest in securities of companies that the Adviser believes have superior prospects for robust and sustainable growth of revenues and earnings. These may be companies with new, limited or cyclical product lines, markets or financial resources, and the management of such companies may be dependent
40

Notes to Financial Statements July 31, 2024
upon one or a few key people. The stocks of such companies can therefore be subject to more abrupt or erratic market movements than stocks of larger, more established companies or the stock market in general.
High Yield Bond Risk (Municipal Bond Fund, Credit Fund, Low Duration Bond Fund, Total Return Bond Fund): High yield, or “junk,” bonds are highly speculative securities that are usually issued by smaller less credit worthy and/or highly leveraged (indebted) companies. Compared with investment-grade bonds, high yield bonds carry a greater degree of risk and are less likely to make payments of interest and principal. Market developments and the financial and business conditions of the corporation issuing these securities influences their price and liquidity more than changes in interest rates, when compared to investment-grade debt securities. Insufficient liquidity in the junk bond market may make it more difficult to dispose of junk bonds and may cause the Fund to experience sudden and substantial price declines. A lack of reliable, objective data or market quotations may make it more difficult to value junk bonds accurately.
Interest Rate Risk (Total Return Bond Fund, Credit Fund, Low Duration Bond Fund, Municipal Bond Fund): As with most funds that invest in debt securities, changes in interest rates are one of the most important factors that could affect the value of your investment. Rising interest rates tend to cause the prices of debt securities (especially those with longer maturities) and the Fund’s share price to fall. Risks associated with rising interest rates are heightened given that interest rates in the U.S. are at, or near, historic lows.
The concept of duration is useful in assessing the sensitivity of a fixed income fund to interest rate movements, which are usually the main source of risk for most fixed income funds. Duration measures price volatility by estimating the change in price of a debt security for a 1% change in its yield. For example, a duration of five years means the price of a debt security will change about 5% for every 1% change in its yield. Thus, the higher the duration, the more volatile the security.
Issuer Risk (Total Return Bond Fund, Credit Fund, Low Duration Bond Fund): The risk that the value of a security may decline for a reason directly related to the issuer, such as management performance, financial leverage and reduced demand for the issuer’s goods or services.
LIBOR Replacement Risk (Total Return Bond Fund, Credit Fund, Low Duration Bond Fund, Municipal Bond Fund): The Fund may be exposed to financial instruments that recently transitioned from, or continue to be tied to, the London Interbank Offered Rate (“LIBOR”) to determine payment obligations, financing terms, hedging strategies or investment value. The United Kingdom’s Financial Conduct Authority (“FCA”), which regulates LIBOR, has ceased publishing all LIBOR settings on a representative basis. In April 2023, however, the FCA announced that some USD LIBOR settings will continue to be published under a synthetic methodology until September 30, 2024 for certain legacy contracts. The Secured Overnight Financing Rate (“SOFR”), which is a broad measure of the cost of borrowing cash overnight collateralized by U.S. Treasury securities in the repurchase agreement market, has been used increasingly on a voluntary basis in new instruments and transactions. It remains uncertain how such changes would be implemented and the effects such changes would have on the Fund, including any negative effects on the Fund’s liquidity and valuation of the Fund’s investments, issuers of instruments in which the Fund invests and financial markets generally.
Large Shareholder Risk (Growth Equity Fund): Institutional Investor(s) of the Fund may hold a proportion of a Fund’s shares, alone or in the aggregate, greater than the average retail investor(s). Transactions (i.e., large purchase or large redemption) of an institutional investor could impact a retail investor in the process of actively managing the Fund. While it is impossible to predict the long-term impact of these transactions; such events could have an adverse effect on the Fund's performance, expenses, and taxes. Large purchases by an institutional investor may have an adverse effect on the Fund's performance, as it may take time to invest the cash and may require the Fund’s portfolio managers to maintain a larger cash position than they would under normal market conditions. Large redemptions by an institutional investor may increase the Fund’s transactional costs, expense ratio and may have an adverse tax effect for the remaining shareholders of the Fund by requiring a sale of portfolio securities that may have not been sold under normal market conditions.
Liquidity Risk (Total Return Bond Fund, Credit Fund, Low Duration Bond Fund): The risk that certain securities may be difficult or impossible to sell at the time and the price that the Fund would like. The Fund may have to accept a lower price to sell a
41

Notes to Financial Statements July 31, 2024
security, sell other securities to raise cash, or give up an investment opportunity, any of which could have a negative effect on Fund management or performance.
Management Risk (Each Fund): The risk that the investment techniques and risk analyses applied by the Adviser will not pro- duce the desired results and that legislative, regulatory, or tax developments may affect the investment techniques available to the Adviser and the individual portfolio manager in connection with managing each Fund. There is no guarantee that the investment objective of a Fund will be achieved.
Market Risk (Each Fund): The risk that the value of securities owned by the Fund may go up or down, sometimes rapidly or unpredictably, due to factors affecting securities markets generally or particular industries. In addition, the impact of any epidemic, pandemic or natural disaster, or widespread fear that such events may occur, could negatively affect the global economy, as well as the economies of individual countries, the financial performance of individual companies and sectors, and the markets in general in significant and unforeseen ways. Any such impact could adversely affect the prices and liquidity of the securities and other instruments in which the Fund invests, which in turn could negatively impact the Fund’s performance and cause losses on your investment in the Fund. In addition, the impact of any epidemic, pandemic or natural disaster, or widespread fear that such events may occur, could negatively affect the global economy, as well as the economies of individual countries, the financial performance of individual companies and sectors, and the markets in general in significant and unforeseen ways. Any such impact could adversely affect the prices and liquidity of the securities and other instruments in which a Fund invests, which in turn could negatively impact the Fund’s performance and cause losses on your investment in the Fund. Global health events and pandemics, such as COVID-19, have the ability to affect --quickly, drastically and substantially the economies of many nations, states, individual companies and the markets in general and can cause disruptions that cannot necessarily be foreseen. The spread of COVID-19 around the world in 2020 resulted in a substantial number of nations implementing social distancing measures, quarantines, and the shutdown of non-essential businesses and governmental services. Further, it has caused significant volatility in U.S. and international markets. The impact of the outbreak may be short term or may last for an extended period of time.
Municipal Issuers Risk (Low Duration Bond Fund, Municipal Bond Fund, Total Return Bond Fund): There may be economic or political changes that impact the ability of municipal issuers to repay principal and to make interest payments on municipal securities. Changes in the financial condition or credit rating of municipal issuers also may adversely affect the value of each Fund’s municipal securities. Constitutional or legislative limits on borrowing by municipal issuers may result in reduced supplies of municipal securities. Moreover, certain municipal securities are backed only by a municipal issuer’s ability to levy and collect taxes.
Non-Diversified Risk (Growth Equity Fund) – The Fund is non-diversified, which means that it may invest in the securities of relatively few issuers. As a result, the Fund may be more susceptible to a single adverse economic or political occurrence affecting one or more of these issuers and may experience increased volatility due to its investments in those securities. However, the Fund intends to satisfy the diversification requirements for qualifying as a regulated investment company (a “RIC”) under Subchapter M of the Internal Revenue Code of 1986, as amended (the “Code”).
Prepayment and Extension Risk (Total Return Bond Fund, Credit Fund, Low Duration Bond Fund, Municipal Bond Fund): Prepayment and extension risk is the risk that a loan, bond or other security might be called or otherwise converted, prepaid or redeemed before maturity. This risk is primarily associated with corporate-backed, mortgage-backed and asset-backed securities. If a security is converted, prepaid or redeemed before maturity, particularly during a time of declining interest rates or spreads, the Fund may not be able to invest the proceeds in securities providing as high a level of income, resulting in a reduced yield to the Fund. Conversely, as interest rates rise or spreads widen, the likelihood of prepayment decreases. The Fund may be unable to capitalize on securities with higher interest rates or wider spreads because the Fund’s investments are locked in at a lower rate for a longer period of time.
Repurchase Agreement Risk (Credit Fund, Low Duration Bond Fund, Total Return Bond Fund): Under a repurchase agreement, the seller of a security to the Fund agrees to repurchase the security at a mutually agreed-upon time and price. If the seller in a repurchase agreement transaction defaults on its obligation under the agreement, the Fund may suffer delays and incur costs or lose money in exercising its rights under the agreement.
Sector Focus Risk (Growth Equity Fund, Credit Fund, Low Duration Bond Fund, Total Return Bond Fund): Because the Fund may, from time to time, be more heavily invested in particular sectors, the value of its shares may be especially sensitive to
42

Notes to Financial Statements July 31, 2024
factors and economic risks that specifically affect those sectors. As a result, the Fund’s share price may fluctuate more widely than the value of shares of a mutual fund that invests in a broader range of sectors.
Small- and Mid-Capitalization Company Risk (Growth Equity Fund): The small- and mid-capitalization companies in which these Funds may invest may be more vulnerable to adverse business or economic events than larger, more established companies. In particular, investments in these small- and mid-sized companies may pose additional risks, including liquidity risk, because these companies tend to have limited product lines, markets and financial resources, and may depend upon a relatively small management group. Therefore, small- and mid-capitalization stocks may be more volatile than those of larger companies. These securities may be traded over-the-counter or listed on an exchange.
State-Specific Risk (Municipal Bond Fund): The Fund is subject to the risk that the economy of the states in which it invests, and the revenues underlying state municipal bonds, may decline. Investing primarily in a single state means that the Fund is more exposed to negative political or economic factors in that state than a fund that invests more widely.
Structured Note Risk (Credit Fund): The Fund may invest in fixed income linked structured notes. Structured notes are typically privately negotiated transactions between two or more parties. The fees associated with a structured note may lead to increased tracking error. The Fund also bears the risk that the issuer of the structured note will default. The Fund bears the risk of loss of its principal investment and periodic payments expected to be received for the duration of its investment. In addition, a liquid market may not exist for the structured notes. The lack of a liquid market may make it difficult to sell the structured notes at an acceptable price or to accurately value them.
Tax and Federal AMT Risk (Municipal Bond Fund) – The Fund will rely on the opinion of issuers’ bond counsel on the tax-exempt status of interest on municipal bond obligations. Neither the Fund nor the Adviser will independently review the bases for those tax opinions, which may ultimately be determined to be incorrect and subject the Fund and its shareholders to substantial tax liabilities. The Fund may invest in bonds subject to the federal AMT applicable to non-corporate shareholders. Shareholders subject to the federal AMT will be required to report the portion of the Fund’s distributions attributable to income from the bonds as a tax preference item in determining their amounts due under the federal AMT. The Fund may not be a suitable investment for individual retirement accounts (“IRAs”) and other tax-deferred arrangements.
Texas Municipal Securities Risk (Municipal Bond Fund) – The Fund may invest more than 25% of its total assets in securities issued by Texas and its municipalities, and as a result is more vulnerable to unfavorable developments in Texas than funds that invest a lesser percentage of their assets in such securities. For example, important sectors of the State’s economy include the oil and gas industry (including drilling, production, refining, chemicals and energy-related manufacturing) and high technology manufacturing (including computers, electronics and telecommunications equipment), along with an increasing emphasis on international trade. Each of these sectors has from time to time suffered from economic downturns. Adverse conditions in one or more of these sectors could have an adverse impact on Texas municipal securities.
Zero Coupon, Deferred Interest and Pay-In-Kind Bond Risk (Credit Fund): These bonds are issued at a discount from their face value because interest payments are typically postponed until maturity. Pay-in-kind securities are securities that have interest payable by the delivery of additional securities. The market prices of these securities generally are more volatile than the market prices of interest-bearing securities and are likely to respond to a greater degree to changes in interest rates than interest- bearing securities having similar maturities and credit quality.
43

Notes to Financial Statements July 31, 2024
9. Other:
On July 31, 2024, the number of shareholders below held the following percentage of the outstanding shares of the Funds:
| | # of Shareholders | % of Outstanding Shares |
Growth Equity Fund | | |
Institutional Class Shares | 4 | 87% |
Investor Class Shares | 2 | 65% |
Total Return Bond Fund | | |
Institutional Class Shares | 3 | 52% |
Investor Class Shares | — | — |
A Class Shares | 3 | 32% |
Credit Fund | | |
Institutional Class Shares | 3 | 52% |
Investor Class Shares | 1 | 69% |
A Class Shares | 1 | 12% |
Low Duration Bond Fund | | |
Institutional Class Shares | 2 | 46% |
Investor Class Shares | 2 | 40% |
Municipal Bond Fund | | |
Institutional Class Shares | 2 | 72% |
Investor Class Shares | 3 | 84% |
These shareholders are comprised of omnibus accounts, which are held on behalf of various individual shareholders.
10. In Kind Transactions:
During the year ended July 31, 2024 the Growth Equity Fund redeemed the shares of beneficial interest and these securities were transferred at their current value on the date below.
| | | Trade Date | | | Shares Redeemed | | | Cash Value | | | Share Value | | | Realized Gain | | | Total | |
Growth Equity Fund | | | 10/18/2023 | | | | 187,700 | | | $ | 229,621 | | | $ | 12,963,682 | | | $ | 22,127,798 | | | $ | 35,321,101 | |
11. Indemnifications:
In the normal course of business, the Funds enter into contracts that provide general indemnifications. The Funds’ maximum exposure under these arrangements is dependent on future claims that may be made against the Funds and, therefore, cannot be established; however, based on experience, the risk of loss from such claims is considered remote.
12. Subsequent Events:
The Funds have evaluated the need for additional disclosures and/or adjustments resulting from subsequent events through the date the financial statements were issued. Based on this evaluation, no additional disclosures and/or adjustments were required to the financial statements as of July 31, 2024, except the following:
Effective May 23, 2024, the Board approved the liquidation of the Municipal Bond Fund and was closed to new and existing shareholders on July 31, 2024. The Municipal Bond Fund was liquidated effective August 28, 2024.
44

Report of Independent Registered Public Accounting Firm July 31, 2024
To the Shareholders and the Board of Trustees of Frost Family of Funds
Opinion on the Financial Statements
We have audited the accompanying statements of assets and liabilities of Frost Family of Funds (the “Trust”) (comprising the Frost Credit Fund, Frost Growth Equity Fund, Frost Low Duration Bond Fund, Frost Municipal Bond Fund, and Frost Total Return Bond Fund (collectively referred to as the “Funds”)), including the schedules of investments, as of July 31, 2024, and the related statements of operations for the year then ended, the statements of changes in net assets for each of the two years in the period then ended, the financial highlights for each of the five years in the period then ended and the related notes (collectively referred to as the “financial statements”). In our opinion, the financial statements present fairly, in all material respects, the financial position of each of the Funds comprising Frost Family of Funds at July 31, 2024, the results of their operations for the year then ended, the changes in their net assets for each of the two years in the period then ended and their financial highlights for each of the five years in the period then ended, in conformity with U.S. generally accepted accounting principles.
Basis for Opinion
These financial statements are the responsibility of the Trust’s management. Our responsibility is to express an opinion on each of the Funds’ financial statements based on our audits. We are a public accounting firm registered with the Public Company Accounting Oversight Board (United States) ("PCAOB") and are required to be independent with respect to the Trust in accordance with the U.S. federal securities laws and the applicable rules and regulations of the Securities and Exchange Commission and the PCAOB.
We conducted our audits in accordance with the standards of the PCAOB. Those standards require that we plan and perform the audit to obtain reasonable assurance about whether the financial statements are free of material misstatement, whether due to error or fraud. The Trust is not required to have, nor were we engaged to perform, an audit of the Trust’s internal control over financial reporting. As part of our audits, we are required to obtain an understanding of internal control over financial reporting but not for the purpose of expressing an opinion on the effectiveness of the Trust’s internal control over financial reporting. Accordingly, we express no such opinion.
Our audits included performing procedures to assess the risks of material misstatement of the financial statements, whether due to error or fraud, and performing procedures that respond to those risks. Such procedures included examining, on a test basis, evidence regarding the amounts and disclosures in the financial statements. Our procedures included confirmation of securities owned as of July 31, 2024, by correspondence with the custodian and brokers; when replies were not received from brokers, we performed other auditing procedures. Our audits also included evaluating the accounting principles used and significant estimates made by management, as well as evaluating the overall presentation of the financial statements. We believe that our audits provide a reasonable basis for our opinion.

We have served as the auditor of one or more Frost investment companies since 2008.
San Antonio, Texas
September 25, 2024
45
This page is intentionally left blank.
This page is intentionally left blank.
This page is intentionally left blank.

Notice to Shareholders July 31, 2024 (Unaudited)
For shareholders who do not have a July 31, 2024 taxable year end, this notice is for informational purposes only. For share- holders with a July 31, 2024 taxable year end, please consult your tax adviser as to the pertinence of this notice. For the fiscal year ended July 31, 2024, the Funds are designating the following items with regard to distributions paid during the year.
| | | Return of Capital | | | Long Term Capital Gains Distributions (Tax Basis) | | | Ordinary Income Distributions (Tax Basis) | | | Tax Exempt Income Distribution (Tax Basis) | | | Total Distributions (Tax Basis) | |
Growth Equity Fund | | | 0.00% | | | | 99.06% | | | | 0.94% | | | | 0.00% | | | | 100.00% | |
Total Return Bond Fund | | | 0.00% | | | | 0.00% | | | | 100.00% | | | | 0.00% | | | | 100.00% | |
Credit Fund | | | 0.17% | | | | 0.00% | | | | 99.83% | | | | 0.00% | | | | 100.00% | |
Low Duration Bond Fund | | | 0.00% | | | | 0.00% | | | | 100.00% | | | | 0.00% | | | | 100.00% | |
Municipal Bond Fund | | | 1.24% | | | | 0.00% | | | | 11.66% | | | | 87.10% | | | | 100.00% | |
| | | | | | | | | | | | | | | | | | | | | |
| | | Dividends Qualifying for Corporate Dividends Rec. Deduction(1) | | | Qualifying Dividend Income (15% Tax Rate for QDI)(2) | | | U.S. Government Interest(3) | | | Qualifying Interest Income(4) | | | Qualified Short-Term Capital Gain(5) | |
Growth Equity Fund | | | 100.00% | | | | 100.00% | | | | 0.00% | | | | 0.00% | | | | 100.00% | |
Total Return Bond Fund | | | 0.00% | | | | 0.00% | | | | 23.83% | | | | 92.89% | | | | 0.00% | |
Credit Fund | | | 0.00% | | | | 0.00% | | | | 0.00% | | | | 95.48% | | | | 0.00% | |
Low Duration Bond Fund | | | 0.00% | | | | 0.00% | | | | 24.96% | | | | 99.13% | | | | 0.00% | |
Municipal Bond Fund(6) | | | 0.00% | | | | 0.00% | | | | 0.00% | | | | 0.00% | | | | 0.00% | |
(1) | Qualifying dividends represent dividends which qualify for the corporate dividends received deduction and is reflected as a percentage of ordinary income distributions (the total of short-term capital gain and net investment income distributions). |
(2) | The percentage in this column represents the amount of “Qualifying Dividend Income” as created by the Jobs and Growth Tax Relief Reconciliation Act of 2003 and is reflected as a percentage of ordinary income distributions (the total of short-term capital gain and net investment income distributions). It is the intention of each of the aforementioned funds to designate the maximum amount permitted by law. |
(3) | “U.S. Government Interest” represents the amount of interest that was derived from direct U.S. Government obligations and distributed during the fiscal year. This amount is reflected as a percentage of ordinary income. Generally, interest from direct U.S. Government obligations is exempt from state income tax. However, for shareholders who are residents of California, Connecticut and New York, the statutory threshold requirements were not satisfied to permit exemption of these amounts from state income. |
(4) | The percentage in this column represents the amount of “Qualifying Interest Income” and is reflected as a percentage of net investment income distributions that is exempt from U.S withholding tax when paid to foreign investors. |
(5) | The percentage in this column represents the amount of “Qualifying Short-Term Capital Gain” and is reflected as a percentage of short-term capital gain distributions that is exempt from U.S withholding tax when paid to foreign investors. |
(6) | For California income tax purposes, for the fiscal year ended July 31, 2024, Municipal Bond Fund, designated 3.90% of their distributions paid from net investment income as exempt-interest dividends under Section 17145 of the California Revenue and Taxation Code. |
Please consult your tax advisor for proper treatment of this information. This notification should be kept with you permanent tax papers.
49
Frost Family of Funds
Investment Adviser
Frost Investment Advisors, LLC
111 West Houston Street
P.O. Box 2509
San Antonio, Texas 78299-2509
Distributor
SEI Investments Distribution Co.
One Freedom Valley Drive
Oaks, Pennsylvania 19456
Administrator
SEI Investments Global Fund Services
One Freedom Valley Drive
Oaks, Pennsylvania 19456
Independent Registered Public Accounting Firm
Ernst & Young LLP
111 West Houston St., Suite 1901
San Antonio, Texas 78205
Legal Counsel
Morgan, Lewis & Bockius LLP
2222 Market Street
Philadelphia, Pennsylvania 19103
This information must be preceded or accompanied by a current prospectus for the Funds.
FIA-AR-001-1700
Item 8. Changes in and Disagreements with Accountants for Open-End Management Investment Companies.
There were no changes in or disagreements with accountants on accounting and financial disclosure during the period covered by the report.
Item 9. Proxy Disclosures for Open-End Management Investment Companies.
There were no matters submitted to a vote of shareholders during the period covered by this report.
Item 10. Remuneration Paid to Directors, Officers, and Others of Open-End Management Investment Companies.
The remuneration paid by the company during the period covered by the report to the Trustees on the company’s Board of Trustees is disclosed as part of the financial statements included above in Item 7.
Item 11. Statement Regarding Basis for Approval of Investment Advisory Contract.
The disclosure regarding the Approval of Advisory Agreement, if applicable, is included as part of the financial statements included above in Item 7.
Item 12. Disclosure of Proxy Voting Policies and Procedures for Closed-End Management Investment Companies.
Not applicable to open-end management investment companies.
Item 13. Portfolio Managers of Closed-End Management Investment Companies.
Not applicable to open-end management investment companies.
Item 14. Purchases of Equity Securities by Closed-End Management Company and Affiliated Purchasers.
Not applicable to open-end management investment companies.
Item 15. Submission of Matters to a Vote of Security Holders.
There have been no changes to the procedures by which shareholders may recommend nominees to the Registrant’s Board of Trustees during the period covered by this report.
Item 16. Controls and Procedures.
(a) The Registrant's principal executive and principal financial officers, or persons performing similar functions, have concluded that the Registrant's disclosure controls and procedures, as defined in Rule 30a-3(c) under the Act (17 CFR § 270.30a-3(c)), as of a date within 90 days of the filing date of the report, are effective based on the evaluation of these controls and procedures required by Rule 30a-3(b) under the Act (17 CFR § 270.30a-3(b)) and Rule 13a-15(b) or Rule 15d-15(b) under the Securities Exchange Act of 1934, as amended (17 CFR § 240.13a-15(b) or § 240.15d-15(b)).
(b) There has been no change in the Registrant's internal control over financial reporting (as defined in Rule 30a-3(d) under the Act (17 CFR § 270.30a-3(d)) that occurred during the period covered by this report that has materially affected, or is reasonably likely to materially affect, the Registrant's internal control over financial reporting.
Item 17. Disclosure of Securities Lending Activities for Closed-End Management Investment Companies.
Not applicable to open-end management investment companies.
Item 18. Recovery of Erroneously Awarded Compensation.
(a) Not applicable.
(b) Not applicable.
Item 19. Exhibits.
(a)(1) Code of Ethics attached hereto.
(a)(2) Not applicable.
(a)(3) A separate certification for the principal executive officer and the principal financial officer of the Registrant, as required by Rule 30a-2(a) under the Act (17 CFR § 270.30a-2(a)), are filed herewith.
(a)(4) Not applicable.
(b) Officer certifications, as required by Rule 30a-2(b) under the Act (17 CFR § 270.30a-2(b)), also accompany this filing as exhibits.
SIGNATURES
Pursuant to the requirements of the Securities Exchange Act of 1934 and the Investment Company Act of 1940, the Registrant has duly caused this report to be signed on its behalf by the undersigned, thereunto duly authorized.
| (Registrant) | Frost Family of Funds | |
| | | |
| By (Signature and Title) | /s/ Michael Beattie | |
| | Michael Beattie | |
| | Principal Executive Officer | |
| | | |
| Date: October 4, 2024 | | |
Pursuant to the requirements of the Securities Exchange Act of 1934 and the Investment Company Act of 1940, this report has been signed below by the following persons on behalf of the Registrant and in the capacities and on the dates indicated.
| By (Signature and Title) | /s/ Michael Beattie | |
| | Michael Beattie | |
| | Principal Executive Officer | |
| | | |
| Date: October 4, 2024 | | |
| | | |
| By (Signature and Title) | /s/ Andrew Metzger | |
| | Andrew Metzger | |
| | Principal Financial Officer | |
| | | |
| Date: October 4, 2024 | | |