DouYu International Holdings Limited (DOYU)
Filed: 12 Nov 20, 12:00am
Exhibit (c)(2)
Citi | Banking, Capital Markets and Advisory
October 12, 2020
Project Bayard
Presentation to Special Committee of the Board of Directors of HUYA Inc.
Strictly Private and Confidential
Disclaimer
This document contains materials provided to the Special Committee (the “Client”) of the Board of Directors of HUYA Inc. (the “Company”) by Citigroup Global Markets Inc. (“Citi”) in connection with the proposed transaction involving the Company and DouYu International Holdings Limited and pursuant to the terms of a letter of engagement with the Client, dated as of August 26, 2020 (the “Engagement Letter”).
This document was compiled or prepared on a confidential basis solely for the use of the Client and must not be photocopied or reproduced in any other electronic or physical form and must not be communicated, disclosed or distributed to any other person in whole or in part at any time except with our prior written consent. The information contained in this document was obtained from the Company, DouYu International Holdings Limited and other relevant third parties and other sources. Any estimates and projections contained herein have been prepared or adopted by managements of the Company, DouYu International Holdings Limited, obtained from public sources, or are based upon such estimates and projections, and involve numerous and significant subjective determinations, and there is no assurance that such estimates and projections will be realized. Citi and its affiliates do not take responsibility for such estimates and projections, or the basis on which they were prepared. No representation or warranty, express or implied, is made as to the accuracy or completeness of such information (including without limitation the achievement or reasonableness of any projections or estimates) and nothing contained herein is, or shall be relied upon as, a representation, whether as to the past, the present or the future. In preparing this document, Citi assumed and relied, without independent verification, upon the accuracy and completeness of all financial and other information and data publicly available or provided to or otherwise reviewed by or discussed with Citi and upon the assurances of the managements of the Company, DouYu International Holdings Limited, that they are not aware of any relevant information that has been omitted or that remains undisclosed to Citi.
Each of Citi, its affiliates and their respective legal or financial advisors or accountants disclaims any liability or responsibility which may be based on or arise out of this document, any errors herein and/or omissions herefrom. This document is not a financial opinion or recommendation by Citi or its affiliates. This document is necessarily based upon information available to Citi, and financial, stock market and other conditions and circumstances existing and disclosed to Citi, as of the date of this document. Citi does not have any obligation to update or otherwise revise this document. Nothing contained herein shall be construed as legal, regulatory, tax or accounting advice.
This document and the information contained herein do not constitute an offer to sell or the solicitation of an offer to buy any security, commodity or instrument or related derivative, nor do they constitute an offer or commitment to lend, syndicate or arrange a financing, underwrite or purchase or act as an agent or advisor or in any other capacity with respect to any transaction, or commit capital, or to participate in any trading strategies. This document is not a research report and was not prepared by the research department of Citi or any of its affiliates.
1

Table of Contents
1. Overview of the Contemplated Transaction 2
2. Financial Analysis Summary 4
3. Supporting Materials
A. HUYA Financial Analysis 10 B. DouYu + Penguin Pro Forma Financial Analysis 13 C. Trading Comparables Analysis 16 D. Reference Materials 17
1. Overview of the Contemplated Transaction
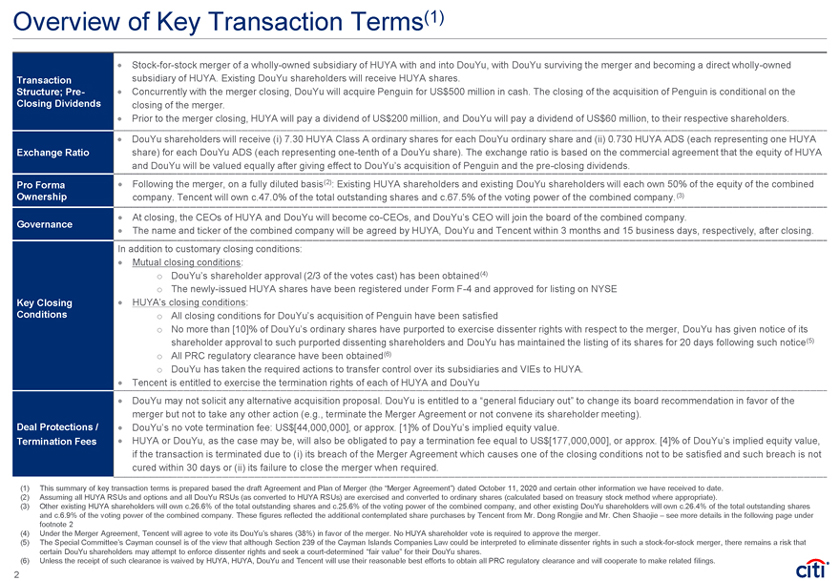
Overview of Key Transaction Terms(1)
Stock-for-stock merger of a wholly-owned subsidiary of HUYA with and into DouYu, with DouYu surviving the merger and becoming a direct wholly-owned subsidiary of HUYA. Existing DouYu shareholders will receive HUYA shares.
Transaction Structure; Pre-Closing Dividends Concurrently with the merger closing, DouYu will acquire Penguin for US$500 million in cash. The closing of the acquisition of Penguin is conditional on the closing of the merger.
Prior to the merger closing, HUYA will pay a dividend of US$200 million, and DouYu will pay a dividend of US$60 million, to their respective shareholders.
Exchange Ratio DouYu shareholders will receive (i) 7.30 HUYA Class A ordinary shares for each DouYu ordinary share and (ii) 0.730 HUYA ADS (each representing one HUYA share) for each DouYu ADS (each representing one-tenth of a DouYu share). The exchange ratio is based on the commercial agreement that the equity of HUYA and DouYu will be valued equally after giving effect to DouYu’s acquisition of Penguin and the pre-closing dividends.
Pro Forma Ownership Following the merger, on a fully diluted basis(2): Existing HUYA shareholders and existing DouYu shareholders will each own 50% of the equity of the combined company. Tencent will own c.47.0% of the total outstanding shares and c.67.5% of the voting power of the combined company.(3)ï,·
Governance At closing, the CEOs of HUYA and DouYu will become co-CEOs, and DouYu’s CEO will join the board of the combined company.
The name and ticker of the combined company will be agreed by HUYA, DouYu and Tencent within 3 months and 15 business days, respectively, after closing.
Key Closing Conditions In addition to customary closing conditions:
Mutual closing conditions:
DouYu’s shareholder approval (2/3 of the votes cast) has been obtained(4)
The newly-issued HUYA shares have been registered under Form F-4 and approved for listing on NYSE
HUYA’s closing conditions:
All closing conditions for DouYu’s acquisition of Penguin have been satisfied
No more than [10]% of DouYu’s ordinary shares have purported to exercise dissenter rights with respect to the merger, DouYu has given notice of its shareholder approval to such purported dissenting shareholders and DouYu has maintained the listing of its shares for 20 days following such notice(5)
All PRC regulatory clearance have been obtained(6)
DouYu has taken the required actions to transfer control over its subsidiaries and VIEs to HUYA.
Tencent is entitled to exercise the termination rights of each of HUYA and DouYu
Deal Protections /Termination Fees
DouYu may not solicit any alternative acquisition proposal. DouYu is entitled to a “general fiduciary out” to change its board recommendation in favor of the merger but not to take any other action (e.g., terminate the Merger Agreement or not convene its shareholder meeting).
DouYu’s no vote termination fee: US$[44,000,000], or approx. [1]% of DouYu’s implied equity value.
HUYA or DouYu, as the case may be, will also be obligated to pay a termination fee equal to US$[177,000,000], or approx. [4]% of DouYu’s implied equity value, if the transaction is terminated due to (i) its breach of the Merger Agreement which causes one of the closing conditions not to be satisfied and such breach is not cured within 30 days or (ii) its failure to close the merger when required.
(1) This summary of key transaction terms is prepared based the draft Agreement and Plan of Merger (the “Merger Agreement”) dated October 11, 2020 and certain other information we have received to date. (2) Assuming all HUYA RSUs and options and all DouYu RSUs (as converted to HUYA RSUs) are exercised and converted to ordinary shares (calculated based on treasury stock method where appropriate).
(3) Other existing HUYA shareholders will own c.26.6% of the total outstanding shares and c.25.6% of the voting power of the combined company, and other existing DouYu shareholders will own c.26.4% of the total outstanding shares and c.6.9% of the voting power of the combined company. These figures reflected the additional contemplated share purchases by Tencent from Mr. Dong Rongjie and Mr. Chen Shaojie – see more details in the following page under footnote 2 (4) Under the Merger Agreement, Tencent will agree to vote its DouYu’s shares (38%) in favor of the merger. No HUYA shareholder vote is required to approve the merger.
(5) The Special Committee’s Cayman counsel is of the view that although Section 239 of the Cayman Islands Companies Law could be interpreted to eliminate dissenter rights in such a stock-for-stock merger, there remains a risk that certain DouYu shareholders may attempt to enforce dissenter rights and seek a court-determined “fair value” for their DouYu shares.
(6) Unless the receipt of such clearance is waived by HUYA, HUYA, DouYu and Tencent will use their reasonable best efforts to obtain all PRC regulatory clearance and will cooperate to make related filings.
2
Post Merger Pro Forma Shareholding Structure Overview(1)
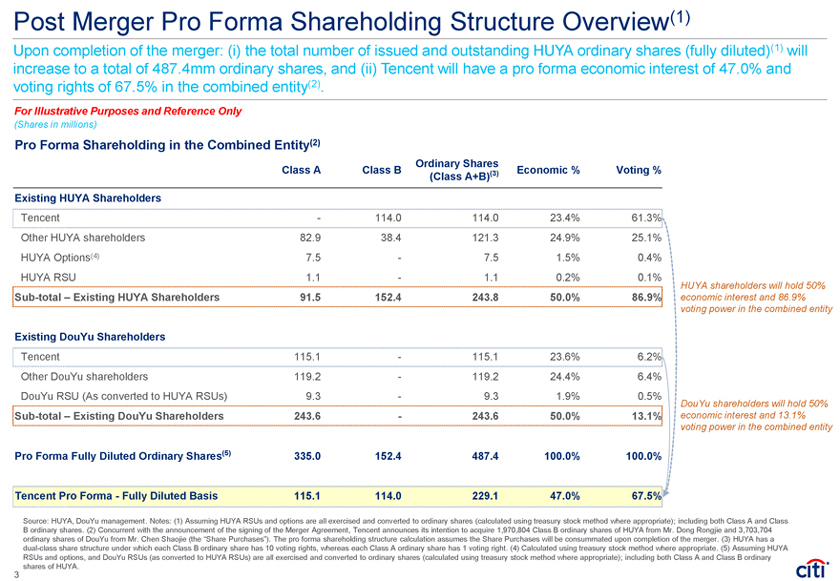
Upon completion of the merger: (i) the total number of issued and outstanding HUYA ordinary shares (fully diluted)(1) will increase to a total of 487.4mm ordinary shares, and (ii) Tencent will have a pro forma economic interest of 47.0% and voting rights of 67.5% in the combined entity(2).
For Illustrative Purposes and Reference Only
(Shares in millions)
Pro Forma Shareholding in the Combined Entity(2)
Ordinary Shares
Class A Class B (3) Economic % Voting % (Class A+B)
Existing HUYA Shareholders
Tencent - 114.0 114.0 23.4% 61.3% Other HUYA shareholders 82.9 38.4 121.3 24.9% 25.1% HUYA Options(4) 7.5 - 7.5 1.5% 0.4% HUYA RSU 1.1 - 1.1 0.2% 0.1%
Sub-total – Existing HUYA Shareholders 91.5 152.4 243.8 50.0% 86.9%
Existing DouYu Shareholders
Tencent 115.1 - 115.1 23.6% 6.2% Other DouYu shareholders 119.2 - 119.2 24.4% 6.4% DouYu RSU (As converted to HUYA RSUs) 9.3 - 9.3 1.9% 0.5%
Sub-total – Existing DouYu Shareholders 243.6 - 243.6 50.0% 13.1% Pro Forma Fully Diluted Ordinary Shares(5) 335.0 152.4 487.4 100.0% 100.0% Tencent Pro Forma - Fully Diluted Basis 115.1 114.0 229.1 47.0% 67.5%
HUYA shareholders will hold 50% economic interest and 86.9% voting power in the combined entity
DouYu shareholders will hold 50% economic interest and 13.1% voting power in the combined entity
Source: HUYA, DouYu management. Notes: (1) Assuming HUYA RSUs and options are all exercised and converted to ordinary shares (calculated using treasury stock method where appropriate); including both Class A and Class B ordinary shares. (2) Concurrent with the announcement of the signing of the Merger Agreement, Tencent announces its intention to acquire 1,970,804 Class B ordinary shares of HUYA from Mr. Dong Rongjie and 3,703,704 ordinary shares of DouYu from Mr. Chen Shaojie (the “Share Purchases”). The pro forma shareholding structure calculation assumes the Share Purchases will be consummated upon completion of the merger. (3) HUYA has a dual-class share structure under which each Class B ordinary share has 10 voting rights, whereas each Class A ordinary share has 1 voting right. (4) Calculated using treasury stock method where appropriate. (5) Assuming HUYA RSUs and options, and DouYu RSUs (as converted to HUYA RSUs) are all exercised and converted to ordinary shares (calculated using treasury stock method where appropriate); including both Class A and Class B ordinary shares of HUYA.
3
2. Financial Analysis Summary
Historical Share Price Performance
For Illustrative Purposes and Reference Only
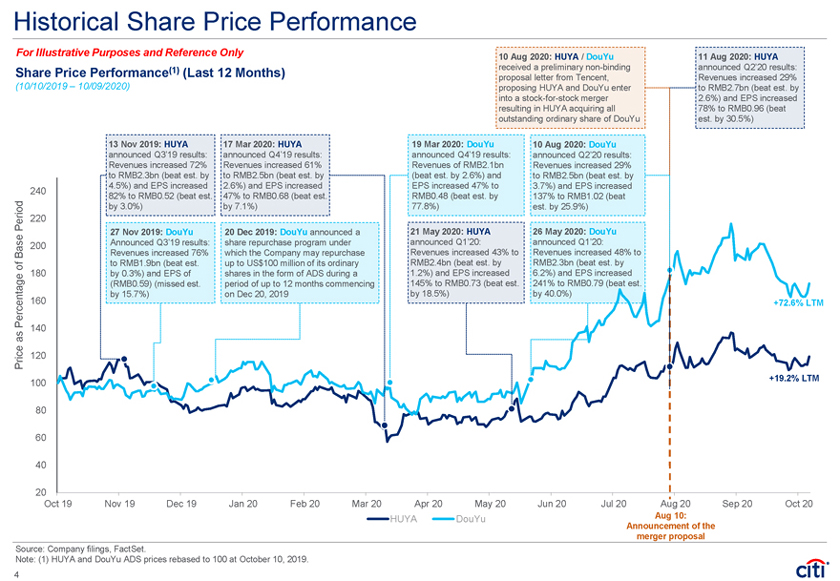
Share Price Performance(1) (Last 12 Months)
(10/10/2019 – 10/09/2020)
240
Period 220 Base 200 of
180
Percentage 160 as 140
Price 120 100
80 60 40 20
Oct 19 Nov 19 Dec 19 Jan 20 Feb 20 Mar 20 Apr 20 May 20 Jun 20 Jul 20 Aug 20 Sep 20 Oct 20
HUYA DouYu
Aug 10: Announcement of the merger proposal
13 Nov 2019: HUYA announced Q3’19 results: Revenues increased 72% to RMB2.3bn (beat est. by 4.5%) and EPS increased 82% to RMB0.52 (beat est. by 3.0%)
17 Mar 2020: HUYA announced Q4’19 results: Revenues increased 61% to RMB2.5bn (beat est. by 2.6%) and EPS increased 47% to RMB0.68 (beat est. by 7.1%)
27 Nov 2019: DouYu Announced Q3’19 results:
Revenues increased 76% to RMB1.9bn (beat est. by 0.3%) and EPS of (RMB0.59) (missed est. by 15.7%)
20 Dec 2019: DouYu announced a share repurchase program under which the Company may repurchase up to US$100 million of its ordinary shares in the form of ADS during a period of up to 12 months commencing on Dec 20, 2019
10 Aug 2020: HUYA / DouYu received a preliminary non-binding proposal letter from Tencent, proposing HUYA and DouYu enter into a stock-for-stock merger resulting in HUYA acquiring all outstanding ordinary share of DouYu
19 Mar 2020: DouYu announced Q4’19 results: Revenues of RMB2.1bn (beat est. by 2.6%) and EPS increased 47% to RMB0.48 (beat est. by 77.8%)
10 Aug 2020: DouYu announced Q2’20 results: Revenues increased 29% to RMB2.5bn (beat est. by 3.7%) and EPS increased 137% to RMB1.02 (beat est. by 25.9%)
21 May 2020: HUYA announced Q1’20: Revenues increased 43% to RMB2.4bn (beat est. by 1.2%) and EPS increased 145% to RMB0.73 (beat est. by 18.5%)
26 May 2020: DouYu announced Q1’20: Revenues increased 48% to RMB2.3bn (beat est. by 6.2%) and EPS increased 241% to RMB0.79 (beat est. by 40.0%)
11 Aug 2020: HUYA announced Q2’20 results: Revenues increased 29% to RMB2.7bn (beat est. by 2.6%) and EPS increased 78% to RMB0.96 (beat est. by 30.5%)
Source: Company filings, FactSet.
Note: (1) HUYA and DouYu ADS prices rebased to 100 at October 10, 2019. 4
Overview of Historical Exchange Ratio (Adjusted for Dividends)
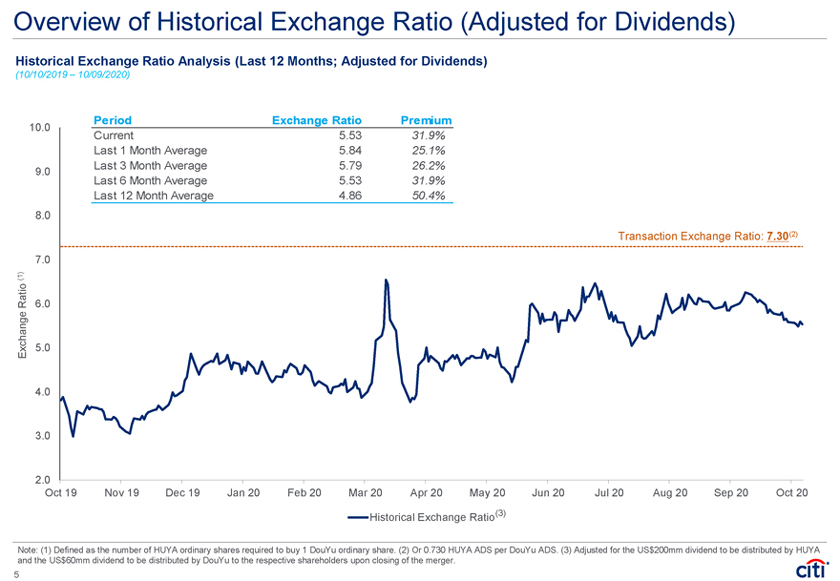
Historical Exchange Ratio Analysis (Last 12 Months; Adjusted for Dividends)
(10/10/2019 – 10/09/2020)
Exchange Ratio(1)
10.0
9.0
8.0
7.0
6.0
5.0
4.0
3.0
2.0
Oct 19 Nov 19 Dec 19 Jan 20 Feb 20 Mar 20 Apr 20 May 20 Jun 20 Jul 20 Aug 20 Sep 20 Oct 20
Historical Exchange Ratio(3)
Period Exchange Ratio Premium
Current 5.53 31.9% Last 1 Month Average 5.84 25.1% Last 3 Month Average 5.79 26.2% Last 6 Month Average 5.53 31.9% Last 12 Month Average 4.86 50.4%
Transaction Exchange Ratio: 7.30(2)
Note: (1) Defined as the number of HUYA ordinary shares required to buy 1 DouYu ordinary share. (2) Or 0.730 HUYA ADS per DouYu ADS. (3) Adjusted for the US$200mm dividend to be distributed by HUYA and the US$60mm dividend to be distributed by DouYu to the respective shareholders upon closing of the merger.
5
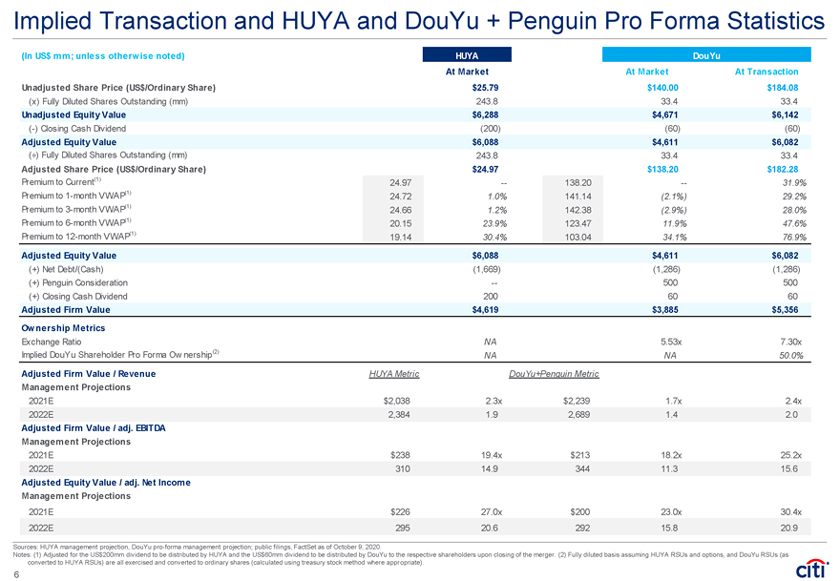
Implied Transaction and HUYA and DouYu + Penguin Pro Forma Statistics
(In US$ mm; unless otherwise noted) HUYA DouYu
At Market At Market At Transaction Unadjusted Share Price (US$/Ordinary Share) $25.79 $140.00 $184.08
(x) Fully Diluted Shares Outstanding (mm) 243.8 33.4 33.4
Unadjusted Equity Value $6,288 $4,671 $6,142
(-) Closing Cash Dividend (200) (60) (60)
Adjusted Equity Value $6,088 $4,611 $6,082
(÷) Fully Diluted Shares Outstanding (mm) 243.8 33.4 33.4
Adjusted Share Price (US$/Ordinary Share) $24.97 $138.20 $182.28
Premium to Current(1) 24.97 — 138.20 — 31.9% Premium to 1-month VWAP(1) 24.72 1.0% 141.14 (2.1%) 29.2% Premium to 3-month VWAP(1) 24.66 1.2% 142.38 (2.9%) 28.0% Premium to 6-month VWAP(1) 20.15 23.9% 123.47 11.9% 47.6% Premium to 12-month VWAP(1) 19.14 30.4% 103.04 34.1% 76.9%
Adjusted Equity Value $6,088 $4,611 $6,082
(+) Net Debt/(Cash) (1,669) (1,286) (1,286) (+) Penguin Consideration — 500 500 (+) Closing Cash Dividend 200 60 60
Adjusted Firm Value $4,619 $3,885 $5,356
Ownership Metrics
Exchange Ratio NA 5.53x 7.30x Implied DouYu Shareholder Pro Forma Ownership(2) NA NA 50.0%
Adjusted Firm Value / Revenue HUYA Metric DouYu+Penguin Metric
Management Projections
2021E $2,038 2.3x $2,239 1.7x 2.4x 2022E 2,384 1.9 2,689 1.4 2.0
Adjusted Firm Value / adj. EBITDA Management Projections
2021E $238 19.4x $213 18.2x 25.2x 2022E 310 14.9 344 11.3 15.6
Adjusted Equity Value / adj. Net Income Management Projections
2021E $226 27.0x $200 23.0x 30.4x 2022E 295 20.6 292 15.8 20.9
Sources: HUYA management projection, DouYu pro-forma management projection; public filings, FactSet as of October 9, 2020.
Notes: (1) Adjusted for the US$200mm dividend to be distributed by HUYA and the US$60mm dividend to be distributed by DouYu to the respective shareholders upon closing of the merger. (2) Fully diluted basis assuming HUYA RSUs and options, and DouYu RSUs (as converted to HUYA RSUs) are all exercised and converted to ordinary shares (calculated using treasury stock method where appropriate).
6

HUYA: Financial Analysis Summary
Implied Adjusted Equity Value Per Share(1) Implied Adjusted Equity Value (US$ mm)(1) Selected Ranges and Metrics(2)
Discounted Cash Flow
Public Comparable Companies Analysis
For Reference Only
52-Week Share
Price
Broker Target Price
HUYA Management Projection
Firm Value / 2021E Revenue
Firm Value / 2022E Revenue
Firm Value / 2021E adj. EBITDA
Firm Value / 2022E adj. EBITDA
Equity Value / 2021E adj. Net Income
Equity Value / 2022E adj. Net Income
HUYA 52-Week Trading Range
HUYA Brokers’ Stock Broker Price Targets
$19.7 $22.9 $30.8 $36.3 $28.7 $33.8 $15.8 $17.9 $16.0 $18.2 $12.1 $15.0 $12.2 $15.1 $11.5 $28.8 $19.2 $30.2
$4,806 – $5,591 $7,504 – $8,845 $7,000 – $8,229 $3,845 – $4,373 $3,902 – $4,442 $2,962 – $3,664 $2,977 – $3,683 $2,814 – $7,012 $4,676 – $7,358
WACC range: 11.0% - 12.8% Terminal adj. EBITDA multiple: mean of 11.1x +/- 10%
Selected Range Mean of 3.3x +/- 10%
2021E Revenue $2,038mm
Selected Range Mean of 2.6x +/- 10%
2022E Revenue $2,384mm
Selected Range Mean of 11.1x +/- 10%
2021E adj. EBITDA $238mm
Selected Range Mean of 8.7x +/- 10%
2022E adj. EBITDA $310mm
Selected Range Mean of 15.6x +/- 10%
2021E adj. Net Income $226mm
Selected Range Mean of 12.0x +/- 10%
2022E adj. Net Income $295mm
52-Week Low 03/18/2020
52-Week High 09/01/2020
Low End $20.0
High End $31.0
Current Trading Share Price(3): $25.79
Unaffected Share Price(3): $26.66
Sources: HUYA management projection, public filings, broker research, FactSet as of October 9, 2020. US$/RMB = 6.6947:1.
Notes: (1) Based on the fully diluted and as converted total shares outstanding. Assumes US$1,669mm of firm value adjustment to derive the equity value as well as an additional US$200mm dividend to be paid at closing of the merger. (2) “Mean” refers to the mean of the metrics of comparable companies (excluding HUYA and DouYu). (3) Current trading share price refers to the closing price on October 9, 2020. Unaffected share price refers to the closing price on August 7, 2020, the last trading day prior to the merger proposal. Both unadjusted for US$200mm dividend to be paid at closing of the merger
7
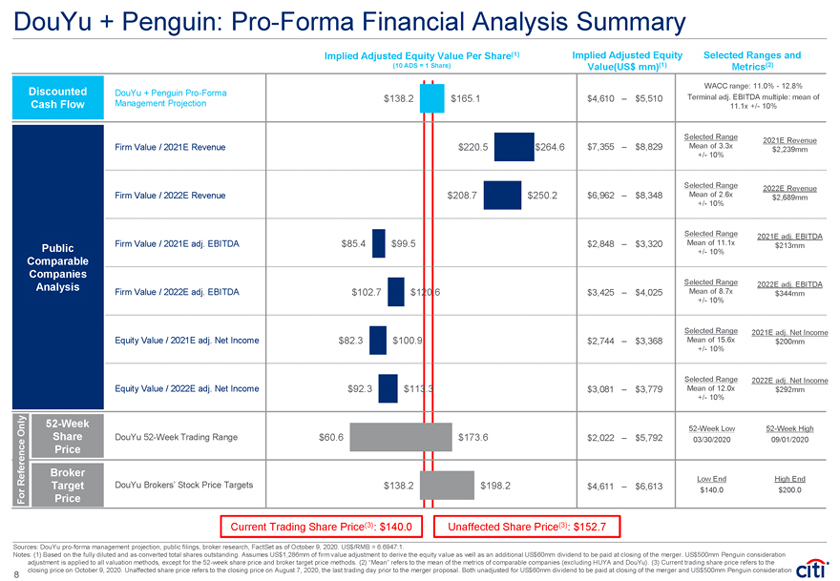
DouYu + Penguin: Pro-Forma Financial Analysis Summary
Implied Adjusted Equity Value Per Share(1) (10 ADS = 1 Share) Implied Adjusted Equity Value(US$ mm)(1) Selected Ranges and Metrics(2)
Discounted Cash Flow
Public Comparable Companies Analysis
For Reference Only
52-Week Share
Price
Broker Target Price
DouYu + Penguin Pro-Forma Management Projection
Firm Value / 2021E Revenue
Firm Value / 2022E Revenue
Firm Value / 2021E adj. EBITDA
Firm Value / 2022E adj. EBITDA
Equity Value / 2021E adj. Net Income
Equity Value / 2022E adj. Net Income
DouYu 52-Week Trading Range
DouYu Brokers’ Stock Price Targets
$138.2 $165.1 $220.5 $264.6 $208.7 $250.2 $85.4 $99.5 $102.7 $120.6 $82.3 $100.9 $92.3 $113.3 $60.6 $173.6 $138.2 $198.2
$4,610 – $5,510 $7,355 – $8,829 $6,962 – $8,348 $2,848 – $3,320 $3,425 – $4,025 $2,744 – $3,368 $3,081 – $3,779 $2,022 – $5,792 $4,611 – $6,613
WACC range: 11.0% - 12.8% Terminal adj. EBITDA multiple: mean of 11.1x +/- 10%
Selected Range Mean of 3.3x +/- 10%
2021E Revenue $2,239mm
Selected Range Mean of 2.6x +/- 10%
2022E Revenue $2,689mm
Selected Range Mean of 11.1x +/- 10%
2021E adj. EBITDA $213mm
Selected Range Mean of 8.7x +/- 10%
2022E adj. EBITDA $344mm
Selected Range Mean of 15.6x +/- 10%
2021E adj. Net Income $200mm
Selected Range Mean of 12.0x +/- 10%
2022E adj. Net Income $292mm
52-Week Low 03/30/2020
52-Week High 09/01/2020
Low End $140.0
High End $200.0
Current Trading Share Price : $140.0 Unaffected Share Price : $152.7
Sources: DouYu pro-forma management projection, public filings, broker research, FactSet as of October 9, 2020. US$/RMB = 6.6947:1.
Notes: (1) Based on the fully diluted and as converted total shares outstanding. Assumes US$1,286mm of firm value adjustment to derive the equity value as well as an additional US$60mm dividend to be paid at closing of the merger. US$500mm Penguin consideration adjustment is applied to all valuation methods, except for the 52-week share price and broker target price methods. (2) “Mean” refers to the mean of the metrics of comparable companies (excluding HUYA and DouYu). (3) Current trading share price refers to the closing price on October 9, 2020. Unaffected share price refers to the closing price on August 7, 2020, the last trading day prior to the merger proposal. Both unadjusted for US$60mm dividend to be paid at closing of the merger and US$500mm Penguin consideration
8

Implied Relative Financial Analysis Summary
Implied Exchange Ratio (x) Implied Adjusted Equity Value Per Share(1) HUYA DouYu + Penguin
Discounted Cash Flow(2)
Public Comparable Companies Analysis(2)
For Reference Only
52-Week Share
Price
Common Broker Target Price
Management Projection
Firm Value / 2021E Revenue
Firm Value / 2022E Revenue
Firm Value / 2021E adj. EBITDA
Firm Value / 2022E adj. EBITDA
Equity Value / 2021E adj. Net Income
Equity Value / 2022E adj. Net Income
DouYu / HUYA 52-Week 52 Trading Week Range
DouYu / HUYA Common Brokers’ Stock Price Targets
6.03 8.38
6.08 8.60
6.18 8.71
4.76 6.31
5.63 7.54
5.47 8.31
6.11 9.28
2.99 6.54
5.08 7.57
$19.7 – $22.9 $30.8 – $36.3 $28.7 – $33.8 $15.8 – $17.9 $16.0 – $18.2 $12.1 – $15.0 $12.2 – $15.1 $11.5 – $28.8 $19.2 – $29.2
$138.2 – $165.1 $220.5 – $264.6 $208.7 – $250.2 $85.4 – $99.5 $102.7 – $120.6 $82.3 – $100.9 $92.3 – $113.3 $60.6 – $173.6 $138.2 – $198.2
Transaction Exchange Ratio(5): 7.30
Sources: HUYA management projection. DouYu pro-forma management projection, public filings, broker research, FactSet as of October 9, 2020. US$/RMB = 6.6947:1.
Notes: (1) Applied the same adjustments as the previous two pages. (2) Low end = low-end of DouYu + Penguin range over high-end of HUYA range; high end = high-end of DouYu + Penguin range over low-end of HUYA range. (3) Low end = lowest observed implied closing exchange ratio over last 52 weeks; high end = highest observed implied closing exchange ratio over last 52 weeks (the adjustment of US$200mm and US$60mm of dividend at closing of merger is applied to HUYA and DouYu, respectively). (4) Derived the exchange ratios for the target prices of each broker covering both HUYA and DouYu and based the range on the observed low to high of the derived exchange ratios. (5)The transaction exchange ratio for ADS is 0.730.
9
3. Supporting Materials
A. HUYA Financial Analysis
HUYA: Summary HUYA Management Financial Forecasts
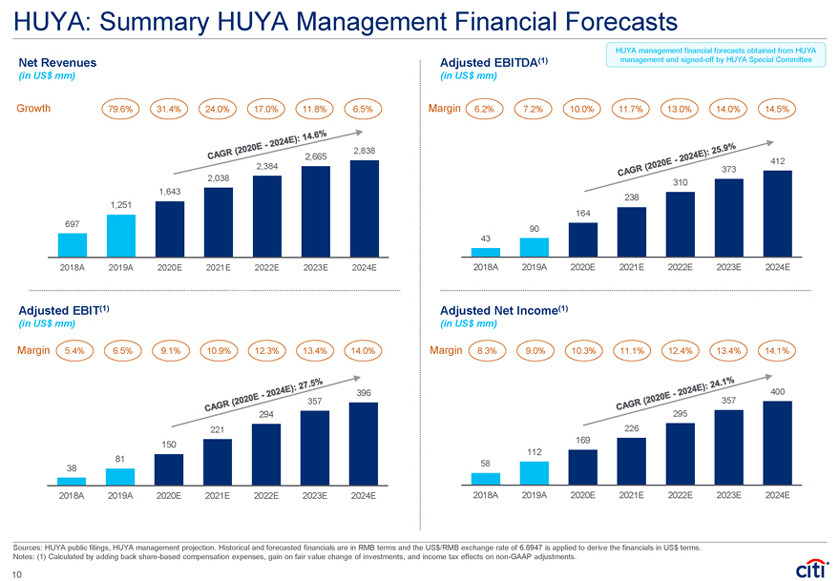
Net Revenues
(in US$ mm)
Growth 79.6% 31.4% 24.0% 17.0% 11.8% 6.5%
CAGR (2020E – 2024E): 14.6%
2,838 2,665 2,384 2,038 1,643 1,251
697
2018A 2019A 2020E 2021E 2022E 2023E 2024E
Adjusted EBIT(1)
(in US$ mm)
Margin 5.4% 6.5% 9.1% 10.9% 12.3% 13.4% 14.0%
CAGR (2020E – 2024E): 27.5%
396 357 294 221 150
81
38
2018A 2019A 2020E 2021E 2022E 2023E 2024E
HUYA management financial forecasts obtained from HUYA management and signed-off by HUYA Special Committee
Adjusted EBITDA(1)
(in US$ mm)
Margin 6.2% 7.2% 10.0% 11.7% 13.0% 14.0% 14.5%
CAGR (2020E – 2024E): 25.9%
412 373 310 238 164
90
43
2018A 2019A 2020E 2021E 2022E 2023E 2024E
Adjusted Net Income(1)
(in US$ mm)
Margin 8.3% 9.0% 10.3% 11.1% 12.4% 13.4% 14.1%
CAGR (2020E – 2024E): 24.1%
400 357 295 226 169 112
58
2018A 2019A 2020E 2021E 2022E 2023E 2024E
Sources: HUYA public filings, HUYA management projection. Historical and forecasted financials are in RMB terms and the US$/RMB exchange rate of 6.6947 is applied to derive the financials in US$ terms. Notes: (1) Calculated by adding back share-based compensation expenses, gain on fair value change of investments, and income tax effects on non-GAAP adjustments.
HUYA: Discounted Cash Flow Analysis
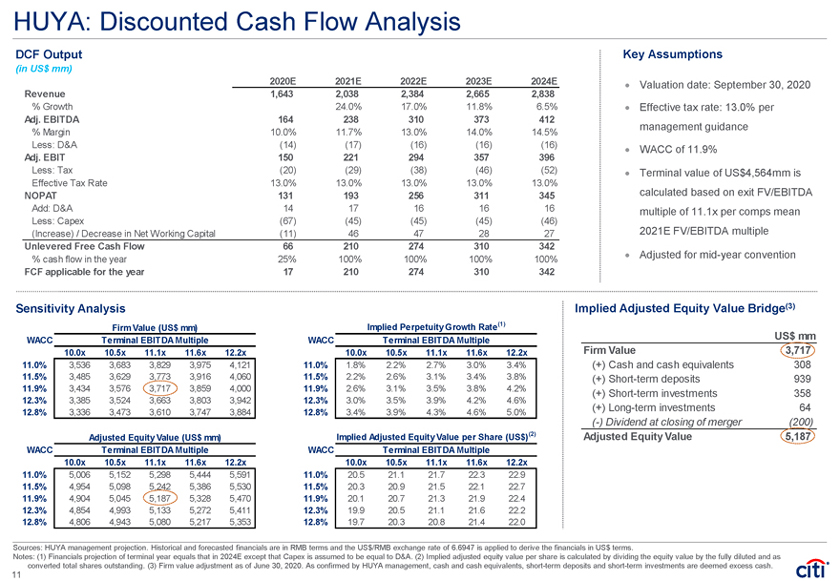
DCF Output
(in US$ mm)
2020E 2021E 2022E 2023E 2024E
Revenue 1,643 2,038 2,384 2,665 2,838
% Growth 24.0% 17.0% 11.8% 6.5%
Adj. EBITDA 164 238 310 373 412
% Margin 10.0% 11.7% 13.0% 14.0% 14.5%
Less: D&A (14) (17) (16) (16) (16)
Adj. EBIT 150 221 294 357 396
Less: Tax (20) (29) (38) (46) (52)
Effective Tax Rate 13.0% 13.0% 13.0% 13.0% 13.0%
NOPAT 131 193 256 311 345
Add: D&A 14 17 16 16 16
Less: Capex (67) (45) (45) (45) (46)
(Increase) / Decrease in Net Working Capital (11) 46 47 28 27
Unlevered Free Cash Flow 66 210 274 310 342
% cash flow in the year 25% 100% 100% 100% 100%
FCF applicable for the year 17 210 274 310 342
Sensitivity Analysis
Firm Value (US$ mm)
WACC Terminal EBITDA Multiple
####### 10.0x 10.5x 11.1x 11.6x 12.2x
11.0% 3,536 3,683 3,829 3,975 4,121
11.5% 3,485 3,629 3,773 3,916 4,060
11.9% 3,434 3,576 3,717 3,859 4,000
12.3% 3,385 3,524 3,663 3,803 3,942
12.8% 3,336 3,473 3,610 3,747 3,884
Adjusted Equity Value (US$ mm)
WACC Terminal EBITDA Multiple
####### 10.0x 10.5x 11.1x 11.6x 12.2x
11.0% 5,006 5,152 5,298 5,444 5,591
11.5% 4,954 5,098 5,242 5,386 5,530
11.9% 4,904 5,045 5,187 5,328 5,470
12.3% 4,854 4,993 5,133 5,272 5,411
12.8% 4,806 4,943 5,080 5,217 5,353
Implied Perpetuity Growth Rate(1)
WACC Terminal EBITDA Multiple
3.5% 10.0x 10.5x 11.1x 11.6x 12.2x
11.0% 1.8% 2.2% 2.7% 3.0% 3.4%
11.5% 2.2% 2.6% 3.1% 3.4% 3.8%
11.9% 2.6% 3.1% 3.5% 3.8% 4.2%
12.3% 3.0% 3.5% 3.9% 4.2% 4.6%
12.8% 3.4% 3.9% 4.3% 4.6% 5.0%
Implied Adjusted Equity Value per Share (US$)(2)
WACC Terminal EBITDA Multiple
10.0x 10.5x 11.1x 11.6x 12.2x
11.0% 20.5 21.1 21.7 22.3 22.9
11.5% 20.3 20.9 21.5 22.1 22.7
11.9% 20.1 20.7 21.3 21.9 22.4
12.3% 19.9 20.5 21.1 21.6 22.2
12.8% 19.7 20.3 20.8 21.4 22.0
Key Assumptions
Valuation date: September 30, 2020ï,· Effective tax rate: 13.0% per management guidance
ï,· WACC of 11.9%
ï,· Terminal value of US$4,564mm is calculated based on exit FV/EBITDA multiple of 11.1x per comps mean 2021E FV/EBITDA multiple
ï,· Adjusted for mid-year convention
Implied Adjusted Equity Value Bridge(3)
US$ mm Firm Value 3,717
(+) Cash and cash equivalents 308
(+) Short-term deposits 939
(+) Short-term investments 358
(+) Long-term investments 64
(-) Dividend at closing of merger (200)
Adjusted Equity Value 5,187
Sources: HUYA management projection. Historical and forecasted financials are in RMB terms and the US$/RMB exchange rate of 6.6947 is applied to derive the financials in US$ terms.
Notes: (1) Financials projection of terminal year equals that in 2024E except that Capex is assumed to be equal to D&A. (2) Implied adjusted equity value per share is calculated by dividing the equity value by the fully diluted and as converted total shares outstanding. (3) Firm value adjustment as of June 30, 2020. As confirmed by HUYA management, cash and cash equivalents, short-term deposits and short-term investments are deemed excess cash.
HUYA: WACC Analysis
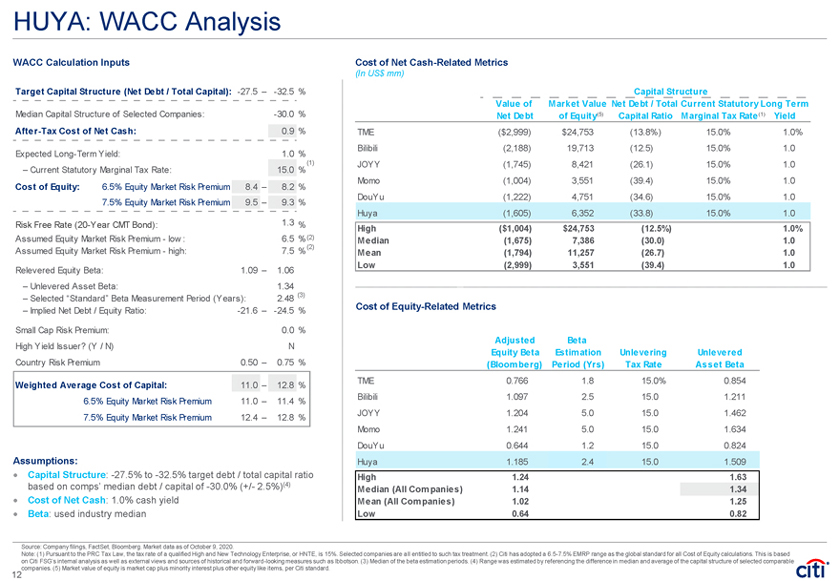
WACC Calculation Inputs
Target Capital Structure (Net Debt / Total Capital): -27.5 – -32.5 %
Median Capital Structure of Selected Companies: -30.0 %
After-Tax Cost of Net Cash: 0.9 %
Expected Long-Term Yield: 1.0 %
(1)
– Current Statutory Marginal Tax Rate: 15.0 %
Cost of Equity: 6.5% Equity Market Risk Premium 8.4 – 8.2 %
7.5% Equity Market Risk Premium 9.5 – 9.3 %
Risk Free Rate (20-Year CMT Bond): 1.3 %
Assumed Equity Market Risk Premium - low : 6.5 %(2)
Assumed Equity Market Risk Premium - high: 7.5 %(2)
Relevered Equity Beta: 1.09 – 1.06
– Unlevered Asset Beta: 1.34
– Selected “Standard” Beta Measurement Period (Years): 2.48 (3)
– Implied Net Debt / Equity Ratio: -21.6 – -24.5 %
Small Cap Risk Premium: 0.0 %
High Yield Issuer? (Y / N) N
Country Risk Premium 0.50 – 0.75 %
Weighted Average Cost of Capital: 11.0 – 12.8 %
6.5% Equity Market Risk Premium 11.0 – 11.4 %
7.5% Equity Market Risk Premium 12.4 – 12.8 %
Assumptions:
ï,· Capital Structure: -27.5% to -32.5% target debt / total capital ratio based on comps’ median debt / capital of -30.0% (+/- 2.5%)(4)
ï,· Cost of Net Cash: 1.0% cash yield
ï,· Beta: used industry median
Cost of Net Cash-Related Metrics
(In US$ mm)
Capital Structure
Value of Market Value Net Debt / Total Current Statutory Long Term
Net Debt of Equity(5) Capital Ratio Marginal Tax Rate (1) Yield
TME ($2,999) $24,753 (13.8%) 15.0% 1.0%
Bilibili (2,188) 19,713 (12.5) 15.0% 1.0
JOYY (1,745) 8,421 (26.1) 15.0% 1.0
Momo (1,004) 3,551 (39.4) 15.0% 1.0
DouYu (1,222) 4,751 (34.6) 15.0% 1.0
Huya (1,605) 6,352 (33.8) 15.0% 1.0
High ($1,004) $24,753 (12.5%) 1.0%
Median (1,675) 7,386 (30.0) 1.0
Mean (1,794) 11,257 (26.7) 1.0
Low (2,999) 3,551 (39.4) 1.0
Cost of Equity-Related Metrics
Adjusted Beta
Equity Beta Estimation Unlevering Unlevered
(Bloomberg) Period (Yrs) Tax Rate Asset Beta
TME 0.766 1.8 15.0% 0.854
Bilibili 1.097 2.5 15.0 1.211
JOYY 1.204 5.0 15.0 1.462
Momo 1.241 5.0 15.0 1.634
DouYu 0.644 1.2 15.0 0.824
Huya 1.185 2.4 15.0 1.509
High 1.24 1.63
Median (All Companies) 1.14 1.34
Mean (All Companies) 1.02 1.25
Low 0.64 0.82
Source: Company filings, FactSet, Bloomberg. Market data as of October 9, 2020.
Note: (1) Pursuant to the PRC Tax Law, the tax rate of a qualified High and New Technology Enterprise, or HNTE, is 15%. Selected companies are all entitled to such tax treatment. (2) Citi has adopted a 6.5-7.5% EMRP range as the global standard for all Cost of Equity calculations. This is based on Citi FSG’s internal analysis as well as external views and sources of historical and forward-looking measures such as Ibbotson. (3) Median of the beta estimation periods. (4) Range was estimated by referencing the difference in median and average of the capital structure of selected comparable companies. (5) Market value of equity is market cap plus minority interest plus other equity like items, per Citi standard.
B. DouYu + Penguin Pro Forma Financial Analysis
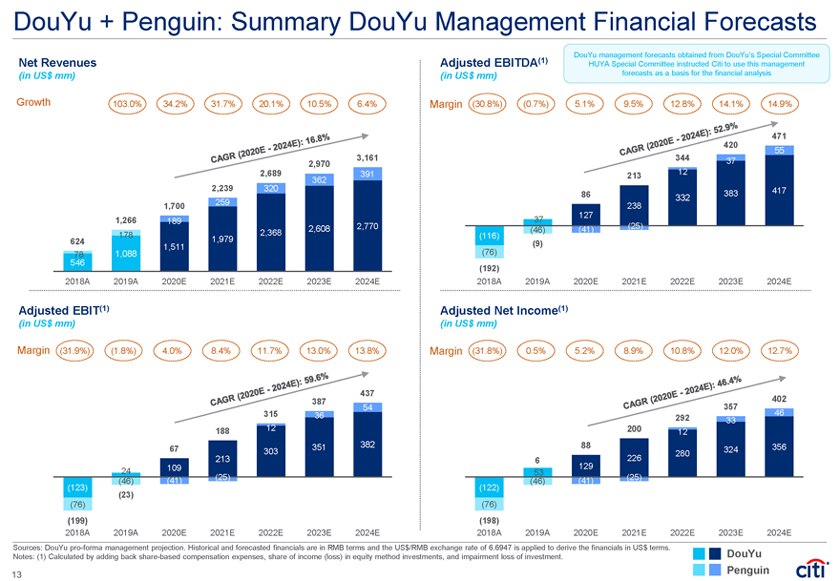
DouYu + Penguin: Summary DouYu Management Financial Forecasts
Net Revenues
(in US$ mm)
Growth 103.0% 34.2% 31.7% 20.1% 10.5% 6.4%
CAGR (2020E – 2024E): 16.8%
3,161 2,970 2,689 391
362
2,239 320 1,700 259 1,266 189
2,608 2,770 178 2,368 624 1,511 1,979
78 1,088 546
2018A 2019A 2020E 2021E 2022E 2023E 2024E
Adjusted EBIT(1)
(in US$ mm)
Margin (31.9%) (1.8%) 4.0% 8.4% 11.7% 13.0% 13.8%
CAGR (2020E – 2024E): 59.6%
437 387
54
315 36 188 12
351 382
67 303 213
24 109
(41) (25) (46) (123) (23) (76)
(199)
2018A 2019A 2020E 2021E 2022E 2023E 2024E
Adjusted EBITDA(1)
(in US$ mm)
DouYu management forecasts obtained from DouYu’s Special Committee HUYA Special Committee instructed Citi to use this management forecasts as a basis for the financial analysis
Margin (30.8%) (0.7%) 5.1% 9.5% 12.8% 14.1% 14.9%
CAGR (2020E – 2024E): 52.9%
471
420
344 55
37
12
213
383 417
86 332
238
127
37
(41) (25)
(46)
(116) (9)
(76)
(192)
2018A 2019A 2020E 2021E 2022E 2023E 2024E
Adjusted Net Income(1)
(in US$ mm)
CAGR (2020E – 2024E): 46.4%
Margin (31.8%) 0.5% 5.2% 8.9% 10.8% 12.0% 12.7%
357 402
46
292 33 200 12
88 356 324 280
6 226 129
53
(41) (25) (46) (122) (76)
(198)
2018A 2019A 2020E 2021E 2022E 2023E 2024E
Sources: DouYu pro-forma management projection. Historical and forecasted financials are in RMB terms and the US$/RMB exchange rate of 6.6947 is applied to derive the financials in US$ terms. Notes: (1) Calculated by adding back share-based compensation expenses, share of income (loss) in equity method investments, and impairment loss of investment.
DouYu Penguin
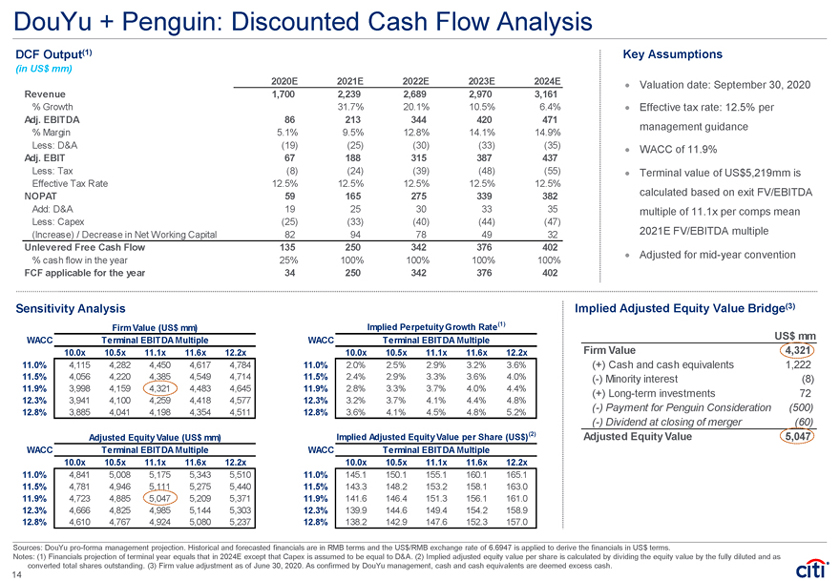
DouYu + Penguin: Discounted Cash Flow Analysis
DCF Output(1)
(in US$ mm)
2020E 2021E 2022E 2023E 2024E
Revenue
% Growth
Adj. EBITDA
% Margin Less: D&A
Adj. EBIT
Less: Tax
Effective Tax Rate
NOPAT
Add: D&A Less: Capex
(Increase) / Decrease in Net Working Capital
Unlevered Free Cash Flow
% cash flow in the year
FCF applicable for the year
1,700 2,239 2,689 2,970 3,161
31.7% 20.1% 10.5% 6.4%
86 213 344 420 471
5.1% 9.5% 12.8% 14.1% 14.9%
(19) (25) (30) (33) (35)
67 188 315 387 437
(8) (24) (39) (48) (55)
12.5% 12.5% 12.5% 12.5% 12.5%
59 165 275 339 382
19 25 30 33 35
(25) (33) (40) (44) (47)
82 94 78 49 32
135 250 342 376 402
25% 100% 100% 100% 100%
34 250 342 376 402
Sensitivity Analysis
Firm Value (US$ mm) WACC Terminal EBITDA Multiple
####### 10.0x 10.5x 11.1x 11.6x 12.2x
11.0% 4,115 4,282 4,450 4,617 4,784
11.5% 4,056 4,220 4,385 4,549 4,714
11.9% 3,998 4,159 4,321 4,483 4,645
12.3% 3,941 4,100 4,259 4,418 4,577
12.8% 3,885 4,041 4,198 4,354 4,511
Adjusted Equity Value (US$ mm)
WACC Terminal EBITDA Multiple
####### 10.0x 10.5x 11.1x 11.6x 12.2x
11.0% 4,841 5,008 5,175 5,343 5,510
11.5% 4,781 4,946 5,111 5,275 5,440
11.9% 4,723 4,885 5,047 5,209 5,371
12.3% 4,666 4,825 4,985 5,144 5,303
12.8% 4,610 4,767 4,924 5,080 5,237
Implied Perpetuity Growth Rate(1) WACC Terminal EBITDA Multiple
3.7% 10.0x 10.5x 11.1x 11.6x 12.2x
11.0% 2.0% 2.5% 2.9% 3.2% 3.6%
11.5% 2.4% 2.9% 3.3% 3.6% 4.0%
11.9% 2.8% 3.3% 3.7% 4.0% 4.4%
12.3% 3.2% 3.7% 4.1% 4.4% 4.8%
12.8% 3.6% 4.1% 4.5% 4.8% 5.2%
Implied Adjusted Equity Value per Share (US$)(2)
WACC Terminal EBITDA Multiple
10.0x 10.5x 11.1x 11.6x 12.2x
11.0% 145.1 150.1 155.1 160.1 165.1
11.5% 143.3 148.2 153.2 158.1 163.0
11.9% 141.6 146.4 151.3 156.1 161.0
12.3% 139.9 144.6 149.4 154.2 158.9
12.8% 138.2 142.9 147.6 152.3 157.0
Key Assumptions
Valuation date: September 30, 2020ï,· Effective tax rate: 12.5% per management guidance
WACC of 11.9%
Terminal value of US$5,219mm is calculated based on exit FV/EBITDA multiple of 11.1x per comps mean 2021E FV/EBITDA multiple
Adjusted for mid-year convention
Implied Adjusted Equity Value Bridge(3)
US$ mm
Firm Value 4,321
(+) Cash and cash equivalents 1,222
(-) Minority interest (8)
(+) Long-term investments 72
(-) Payment for Penguin Consideration (500)
(-) Dividend at closing of merger (60)
Adjusted Equity Value 5,047
Sources: DouYu pro-forma management projection. Historical and forecasted financials are in RMB terms and the US$/RMB exchange rate of 6.6947 is applied to derive the financials in US$ terms.
Notes: (1) Financials projection of terminal year equals that in 2024E except that Capex is assumed to be equal to D&A. (2) Implied adjusted equity value per share is calculated by dividing the equity value by the fully diluted and as converted total shares outstanding. (3) Firm value adjustment as of June 30, 2020. As confirmed by DouYu management, cash and cash equivalents are deemed excess cash.
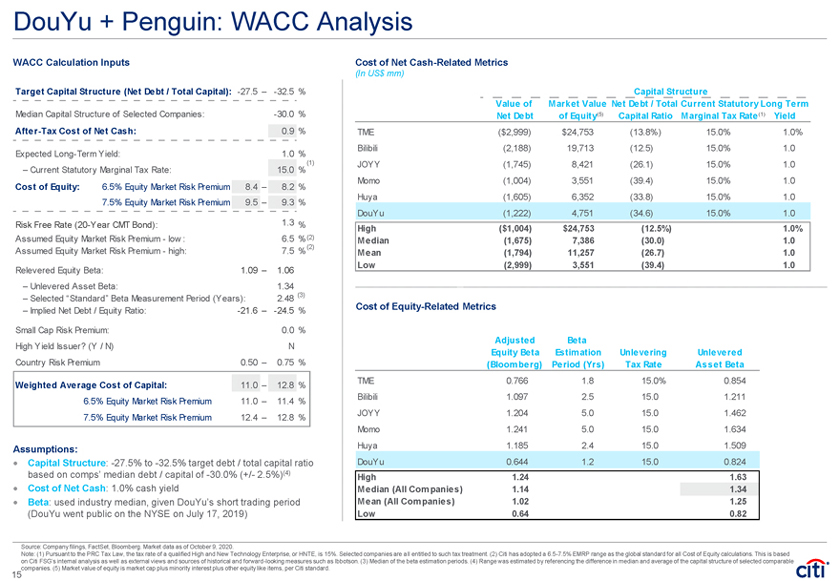
DouYu + Penguin: WACC Analysis
WACC Calculation Inputs
Target Capital Structure (Net Debt / Total Capital): -27.5 – -32.5 %
Median Capital Structure of Selected Companies: -30.0 %
After-Tax Cost of Net Cash: 0.9 %
Expected Long-Term Yield: 1.0 %
– Current Statutory Marginal Tax Rate: 15.0 %(1)
Cost of Equity: 6.5% Equity Market Risk Premium 8.4 – 8.2 %
7.5% Equity Market Risk Premium 9.5 – 9.3 %
Risk Free Rate (20-Year CMT Bond): 1.3 % Assumed Equity Market Risk Premium—low : 6.5 %(2) Assumed Equity Market Risk Premium—high: 7.5 %(2) Relevered Equity Beta: 1.09 – 1.06
– Unlevered Asset Beta: 1.34
– Selected “Standard” Beta Measurement Period (Years): 2.48 (3)
– Implied Net Debt / Equity Ratio: -21.6 – -24.5 %
Small Cap Risk Premium: 0.0 % High Yield Issuer? (Y / N) N Country Risk Premium 0.50 – 0.75 %
Weighted Average Cost of Capital: 11.0 – 12.8 %
6.5% Equity Market Risk Premium 11.0 – 11.4 %
7.5% Equity Market Risk Premium 12.4 – 12.8 %
Assumptions:
Capital Structure: -27.5% to -32.5% target debt / total capital ratio based on comps’ median debt / capital of -30.0% (+/- 2.5%)(4)
Cost of Net Cash: 1.0% cash yield
Beta: used industry median, given DouYu’s short trading period
(DouYu went public on the NYSE on July 17, 2019)
Cost of Net Cash-Related Metrics
(In US$ mm)
Capital Structure
Value of Market Value Net Debt / Total Current Statutory Long Term Net Debt of Equity(5) Capital Ratio Marginal Tax Rate(1) Yield
TME ($2,999) $24,753 (13.8%) 15.0% 1.0% Bilibili (2,188) 19,713 (12.5) 15.0% 1.0 JOYY (1,745) 8,421 (26.1) 15.0% 1.0 Momo (1,004) 3,551 (39.4) 15.0% 1.0 Huya (1,605) 6,352 (33.8) 15.0% 1.0 DouYu (1,222) 4,751 (34.6) 15.0% 1.0
High ($1,004) $24,753 (12.5%) 1.0% Median (1,675) 7,386 (30.0) 1.0 Mean (1,794) 11,257 (26.7) 1.0 Low (2,999) 3,551 (39.4) 1.0
Cost of Equity-Related Metrics
Adjusted Beta
Equity Beta Estimation Unlevering Unlevered
(Bloomberg) Period (Yrs) Tax Rate Asset Beta
TME 0.766 1.8 15.0% 0.854
Bilibili 1.097 2.5 15.0 1.211
JOYY 1.204 5.0 15.0 1.462
Momo 1.241 5.0 15.0 1.634
Huya 1.185 2.4 15.0 1.509
DouYu 0.644 1.2 15.0 0.824
High 1.24 1.63
Median (All Companies) 1.14 1.34
Mean (All Companies) 1.02 1.25
Low 0.64 0.82
Source: Company filings, FactSet, Bloomberg. Market data as of October 9, 2020.
Note: (1) Pursuant to the PRC Tax Law, the tax rate of a qualified High and New Technology Enterprise, or HNTE, is 15%. Selected companies are all entitled to such tax treatment. (2) Citi has adopted a 6.5-7.5% EMRP range as the global standard for all Cost of Equity calculations. This is based on Citi FSG’s internal analysis as well as external views and sources of historical and forward-looking measures such as Ibbotson. (3) Median of the beta estimation periods. (4) Range was estimated by referencing the difference in median and average of the capital structure of selected comparable companies. (5) Market value of equity is market cap plus minority interest plus other equity like items, per Citi standard.
C. Trading Comparables Analysis

Valuation Benchmarking
(In US$ mm)
Market Firm (4) FV / Revenue FV / EBITDA P / E
Company Share Price Cap Value CY2020 CY2021 CY2022 CY2020 CY2021 CY2022 CY2020 CY2021 CY2022
HUYA and DouYu
HUYA (Broker Consensus) (1) 25.79 $6,288 $4,619 2.7x 2.2x 1.9x 26.9x 17.3x 13.9x 33.1x 23.4x 18.3x
HUYA (Management Projection) (1) 25.79 $6,288 $4,619 2.8x 2.3x 1.9x 28.2x 19.4x 14.9x 37.3x 27.8x 21.3x
DouYu (Broker Consensus) (2) 14.00 (3) $4,671 $3,385 2.2x 1.8x 1.6x 20.3x 12.3x 9.6x 26.4x 18.3x 14.3x
DouYu (Management Projection) (2) 14.00 (3) $4,671 $3,385 2.2x 1.7x 1.4x 26.6x 14.2x 10.2x 36.2x 20.7x 16.7x
Comparables
TME 14.52 $24,420 $21,116 5.0x 4.0x 3.3x 28.7x 21.0x 15.7x 36.1x 26.1x 20.2x
BIlIbili 48.42 $19,400 $17,084 10.5x 7.3x 5.5x NM (5) NM (5) NM (5) NM (5) NM (5) NM (5)
JOYY 82.67 $6,860 $3,633 1.0x 0.9x 0.7x 11.0x 7.6x 6.4x 20.8x 14.0x 10.4x
Momo 14.98 $3,482 $2,407 1.1x 0.9x 0.8x 5.5x 4.6x 4.0x 8.5x 6.5x 5.3x
Comparables—Mean — — — 4.4x 3.3x 2.6x 15.1x 11.1x 8.7x 21.8x 15.6x 12.0x
Comparables—Median — — — 3.0x 2.5x 2.1x 11.0x 7.6x 6.4x 20.8x 14.0x 10.4x
Source: Company filings, FactSet. Market data per FactSet as of October 9, 2020, FactSet estimate in USD as of October 9, 2020. HUYA and DouYu’s management projection are in RMB terms and the US$/RMB exchange rate of 6.6947 is applied to derive the financials in US$ terms.
Note: (1) HUYA’s firm value calculated as price target multiplied by fully diluted shares outstanding of ~243.8mm, plus firm value adjustment of (US$1,669mm) as of June 30, 2020. (2) DouYu’s firm value calculated as price target multiplied by fully diluted ADS outstanding of ~333.6mm, plus firm value adjustment of (US$1,286mm) as of June 30, 2020. (3) DouYu share price in ADS. (4) Firm value adjustment includes debt, cash and cash equivalents, short-term deposits, short-term investments, long term investments, and non-controlling interests.(5) NM represent the multiples is either less than 0 or greater than 80x for FV/EBITDA or greater than 100x for P/E.
D. Reference Materials
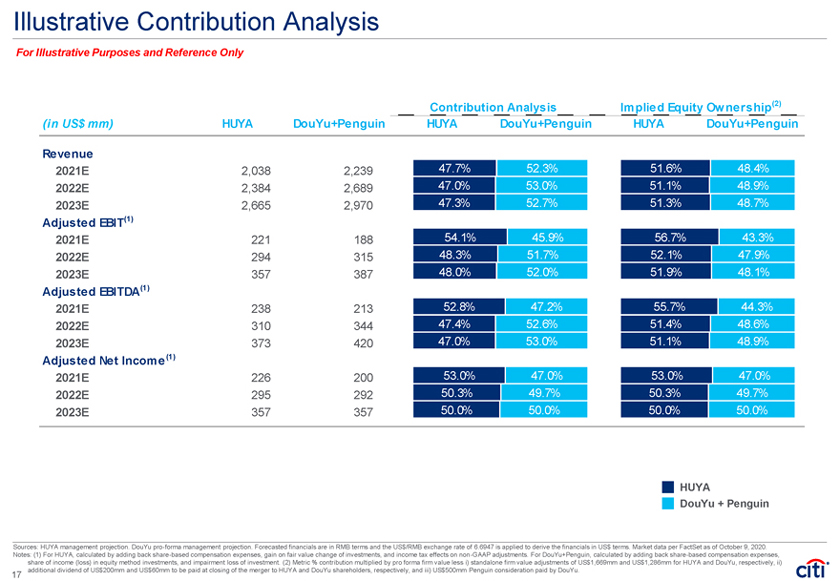
Illustrative Contribution Analysis
For Illustrative Purposes and Reference Only
Contribution Analysis Implied Equity Ow nership (2)
(in US$ mm) HUYA DouYu+Penguin HUYA DouYu+Penguin HUYA DouYu+Penguin
Revenue
2021E 2,038 2,239 47.7% 52.3% 51.6% 48.4%
2022E 2,384 2,689 47.0% 53.0% 51.1% 48.9%
2023E 2,665 2,970 47.3% 52.7% 51.3% 48.7%
Adjusted EBIT(1)
2021E 221 188 54.1% 45.9% 56.7% 43.3%
2022E 294 315 48.3% 51.7% 52.1% 47.9%
2023E 357 387 48.0% 52.0% 51.9% 48.1%
Adjusted EBITDA(1)
2021E 238 213 52.8% 47.2% 55.7% 44.3%
2022E 310 344 47.4% 52.6% 51.4% 48.6%
2023E 373 420 47.0% 53.0% 51.1% 48.9%
Adjusted Net Income (1)
2021E 226 200 53.0% 47.0% 53.0% 47.0%
2022E 295 292 50.3% 49.7% 50.3% 49.7%
2023E 357 357 50.0% 50.0% 50.0% 50.0%
HUYA
DouYu + Penguin
Sources: HUYA management projection. DouYu pro-forma management projection. Forecasted financials are in RMB terms and the US$/RMB exchange rate of 6.6947 is applied to derive the financials in US$ terms. Market data per FactSet as of October 9, 2020. Notes: (1) For HUYA, calculated by adding back share-based compensation expenses, gain on fair value change of investments, and income tax effects on non-GAAP adjustments. For DouYu+Penguin, calculated by adding back share-based compensation expenses, share of income (loss) in equity method investments, and impairment loss of investment. (2) Metric % contribution multiplied by pro forma firm value less i) standalone firm value adjustments of US$1,669mm and US$1,286mm for HUYA and DouYu, respectively, ii) additional dividend of US$200mm and US$60mm to be paid at closing of the merger to HUYA and DouYu shareholders, respectively, and iii) US$500mm Penguin consideration paid by DouYu.
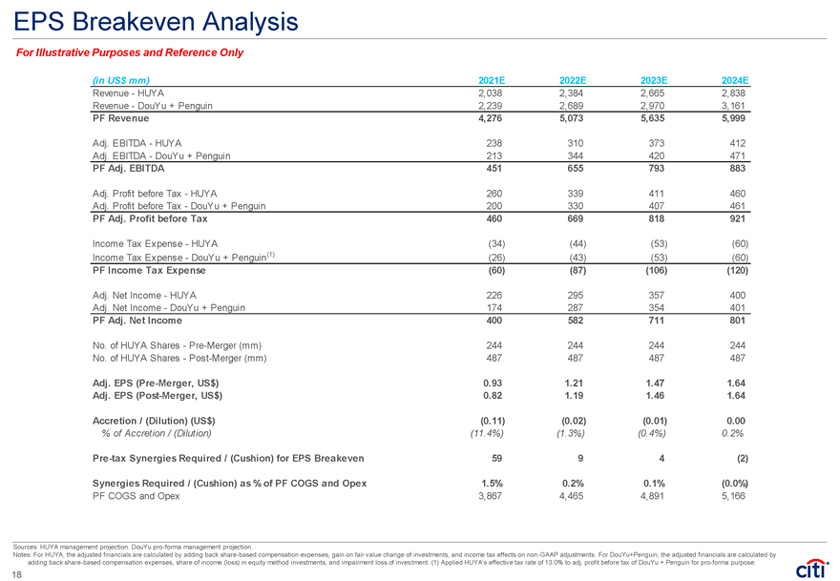
EPS Breakeven Analysis
For Illustrative Purposes and Reference Only
(in US$ mm) 2021E 2022E 2023E 2024E
Revenue—HUYA 2,038 2,384 2,665 2,838 Revenue—DouYu + Penguin 2,239 2,689 2,970 3,161
PF Revenue 4,276 5,073 5,635 5,999
Adj. EBITDA—HUYA 238 310 373 412 Adj. EBITDA—DouYu + Penguin 213 344 420 471
PF Adj. EBITDA 451 655 793 883
Adj. Profit before Tax—HUYA 260 339 411 460 Adj. Profit before Tax—DouYu + Penguin 200 330 407 461
PF Adj. Profit before Tax 460 669 818 921
Income Tax Expense—HUYA (34) (44) (53) (60) Income Tax Expense—DouYu + Penguin(1) (26) (43) (53) (60)
PF Income Tax Expense (60) (87) (106) (120)
Adj. Net Income—HUYA 226 295 357 400 Adj. Net Income—DouYu + Penguin 174 287 354 401
PF Adj. Net Income 400 582 711 801
No. of HUYA Shares—Pre-Merger (mm) 244 244 244 244 No. of HUYA Shares—Post-Merger (mm) 487 487 487 487
Adj. EPS (Pre-Merger, US$) 0.93 1.21 1.47 1.64 Adj. EPS (Post-Merger, US$) 0.82 1.19 1.46 1.64
Accretion / (Dilution) (US$) (0.11) (0.02) (0.01) 0.00
% of Accretion / (Dilution) (11.4%) (1.3%) (0.4%) 0.2%
Pre-tax Synergies Required / (Cushion) for EPS Breakeven 59 9 4 (2)
Synergies Required / (Cushion) as % of PF COGS and Opex 1.5% 0.2% 0.1% (0.0%)
PF COGS and Opex 3,867 4,465 4,891 5,166
Sources: HUYA management projection. DouYu pro-forma management projection.
Notes: For HUYA, the adjusted financials are calculated by adding back share-based compensation expenses, gain on fair value change of investments, and income tax effects on non-GAAP adjustments. For DouYu+Penguin, the adjusted financials are calculated by adding back share-based compensation expenses, share of income (loss) in equity method investments, and impairment loss of investment. (1) Applied HUYA’s effective tax rate of 13.0% to adj. profit before tax of DouYu + Penguin for pro-forma purpose.
18
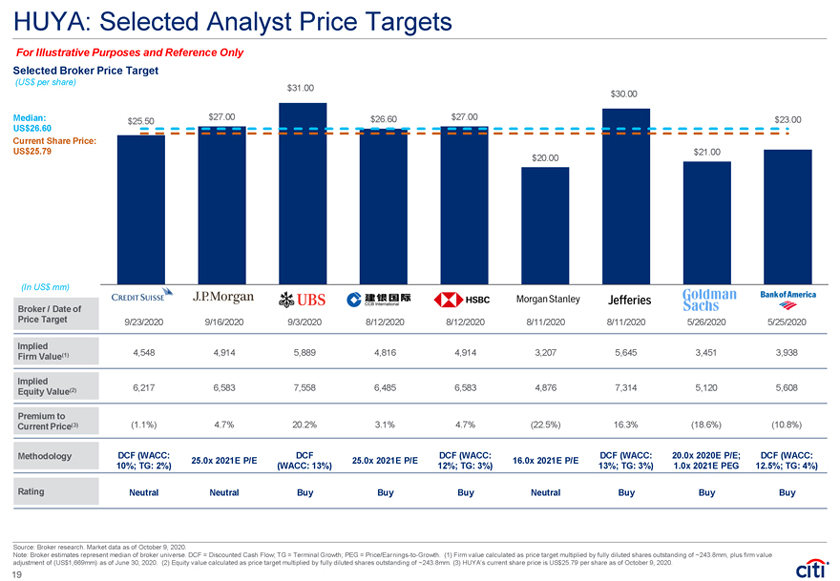
HUYA: Selected Analyst Price Targets
For Illustrative Purposes and Reference Only
Selected Broker Price Target
(US$ per share) $31.00 $30.00
Median: $27.00 $26.60 $27.00 $23.00 $25.50
US$26.60
Current Share Price:
US$25.79 $21.00 $20.00
(In US$ mm)
Broker / Date of
Price Target 9/23/2020 9/16/2020 9/3/2020 8/12/2020 8/12/2020 8/11/2020 8/11/2020 5/26/2020 5/25/2020
Implied
(1) 4,548 4,914 5,889 4,816 4,914 3,207 5,645 3,451 3,938
Firm Value
Implied
(2) 6,217 6,583 7,558 6,485 6,583 4,876 7,314 5,120 5,608
Equity Value
Premium to
Current Price(3) (1.1%) 4.7% 20.2% 3.1% 4.7% (22.5%) 16.3% (18.6%) (10.8%)
Methodology DCF (WACC: DCF DCF (WACC: DCF (WACC: 20.0x 2020E P/E; DCF (WACC: 25.0x 2021E P/E 25.0x 2021E P/E 16.0x 2021E P/E
10%; TG: 2%) (WACC: 13%) 12%; TG: 3%) 13%; TG: 3%) 1.0x 2021E PEG 12.5%; TG: 4%)
Rating Neutral Neutral Buy Buy Buy Neutral Buy Buy Buy
Source: Broker research. Market data as of October 9, 2020.
Note: Broker estimates represent median of broker universe. DCF = Discounted Cash Flow; TG = Terminal Growth; PEG = Price/Earnings-to-Growth. (1) Firm value calculated as price target multiplied by fully diluted shares outstanding of ~243.8mm, plus firm value adjustment of (US$1,669mm) as of June 30, 2020. (2) Equity value calculated as price target multiplied by fully diluted shares outstanding of ~243.8mm. (3) HUYA’s current share price is US$25.79 per share as of October 9, 2020.
19

DouYu: Selected Analyst Price Targets
For Illustrative Purposes and Reference Only
Selected Broker Price Target
(US$ per share)
$20.00
$16.50 Median: $15.50 $15.30
$15.00
US$15.40 $14.00 Current Share Price(1): US$14.00
(In US$ mm)
Broker / Date of Price Target
9/16/2020 8/11/2020 8/11/2020 8/10/2020 7/13/2020 7/7/2020
Implied
5,387 3,886 3,819 3,719 4,220 3,385
Firm Value(2)
Implied
6,673 5,172 5,105 5,005 5,505 4,671
Equity Value(3)
Premium to
42.9% 10.7% 9.3% 7.1% 17.9% 0.0%
Current Price(4)
DCF
Methodology 25.0x 2020E P/E 25.0x 2021E P/E 22.0x 2021E P/E 23.5x 2021E P/E 16.0x 2021E P/E (WACC: 12%; TG: 3%)
Rating Buy Buy Neutral Buy Buy Neutral
Source: Broker research. Market data as of October 9, 2020.
Note: Broker estimates represent median of broker universe. DCF = Discounted Cash Flow; TG = Terminal Growth. (1) DouYu share price in ADS. (2) Firm value calculated as price target multiplied by fully diluted ADS outstanding of ~333.6mm, plus firm value adjustment of (US$1,286mm) as of June 30, 2020. (3) Equity value calculated as price target multiplied by fully diluted ADS outstanding of ~333.6mm. (4) DouYu’s current price is US$14.00 per ADS as of October 9, 2020.
20