UNITED STATES
SECURITIES AND EXCHANGE COMMISSION
Washington, D.C. 20549
FORM N-CSR
CERTIFIED SHAREHOLDER REPORT OF REGISTERED
MANAGEMENT INVESTMENT COMPANIES
Investment Company Act file number: 811-23417
X-Square Balanced Fund, LLC
(Exact name of Registrant as specified in charter)
Centro Internacional de Mercadeo II, 90 Carr. 165, Suite 803,
Guaynabo, Puerto Rico 000968
(Address of Principal Executive Offices) (Zip code)
Registrant’s Telephone Number, including Area Code: +1 (787) 282-1621
X-Square Capital, LLC
Centro Internacional de Mercadeo II, 90 Carr 165, Suite 803
Guaynabo, Puerto Rico 00968
(Name and Address of Agent for Service)
With a copy to:
Andrew Davalla
Thompson Hine LLP
41 S. High Street, Suite 1700
Columbus, OH 43215 (Name and Address of Agent for Service)
Date of fiscal year end: December 31
Date of reporting period: January 1, 2024 - June 30, 2024
| Item 1. | Report to Shareholders. |
SEMI-ANNUAL SHAREHOLDER REPORT - June 30, 2024
This semi-annual shareholder report contains important information about X- Square Balanced Fund - A for the period of January 1, 2024 to June 30, 2024.
You can find additional information about the Fund at https://xsquarecapital.com/. You can also request this information by contacting us at 1-787-282-1621.
What were the Fund's cost for the last six months?
(based on a hypothetical $10,000 investment)
| Class Name | Cost of a $10,000 Investment | Cost Paid as a percentage of a $10,000 Investment |
|---|
| X- Square Balanced Fund - A | $141 | 2.75% |
How did the Fund perform last year?
Performance of the Fund in 2024 was driven by heightened volatility and declining valuations in equity markets, which impacted all three major strategy groups. The market has been increasingly unpredictable and may increase risk in the investment strategy. The Fund will aim to stretch the risks of the markets in the next year.
During the fiscal year ended June 30, 2024, the Fund's use of their current investment strategies did not cause the Fund's performance to materially deviate.
How did the Fund perform since inception?
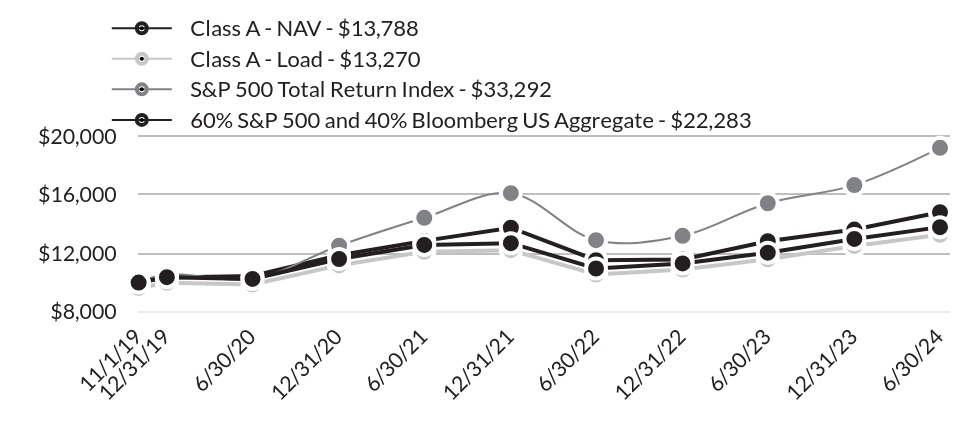
The X- Square Balanced Fund - A Fund returned 14.48% for the period November 1, 2019 to June 30, 2024. This is in contrast to the S&P 500 Total Return Index, which had a 24.56% return for the same time period. Please see below tables for additional indexes.
TOTAL RETURN BASED ON $10,000 INVESTMENT
| Class A - NAV - $13,788 | Class A - Load - $13,270 | S&P 500 Total Return Index - $33,292 | 60% S&P 500 and 40% Bloomberg US Aggregate - $22,283 |
|---|
| 6/30/24 | $13,788 | $13,270 | $19,209 | $14,808 |
| 12/31/23 | $12,983 | $12,496 | $16,662 | $13,623 |
| 6/30/23 | $12,044 | $11,592 | $15,422 | $12,829 |
| 12/31/22 | $11,310 | $10,886 | $13,193 | $11,578 |
| 6/30/22 | $10,960 | $10,549 | $12,896 | $11,533 |
| 12/31/21 | $12,691 | $12,215 | $16,111 | $13,748 |
| 6/30/21 | $12,570 | $12,098 | $14,427 | $12,849 |
| 12/31/20 | $11,610 | $11,174 | $12,518 | $11,866 |
| 6/30/20 | $10,250 | $9,865 | $10,247 | $10,445 |
| 12/31/19 | $10,370 | $9,981 | $10,573 | $10,343 |
| 11/1/19 | $10,000 | $9,625 | $10,000 | $10,000 |
The chart above represents historical performance of a hypothetical investment of $10,000 in the Fund over the past ten years (or since inception if shorter). Performance data quoted represents past performance and does not guarantee future results. Returns shown are total returns, which assume the reinvestment of dividends and capital gains. The table and graph presented above do not reflect the deduction of taxes a shareholder would pay on fund distributions or the redemption of fund shares.
AVERAGE ANNUAL TOTAL RETURNS
| X-Square Balanced Fund | 1 Year | Since Inception |
|---|
| Class A - NAV (Incep. November 1, 2019) | 14.48% | 7.13% |
| Class A - Load | 10.19% | 6.26% |
| S&P 500 Total Return Index | 24.56% | 15.03% |
| 60% S&P 500 and 40% Bloomberg US Aggregate | 15.42% | 8.91% |
- Total Net Assets$53,626,267
- # of Portfolio Holdings78
- Portfolio Turnover Rate 12%
- Advisory Fees Paid$243,694
Past performance does not guarantee future results. Call 1-787-282-1621 for current month-end performance.
What did the Fund invest in?
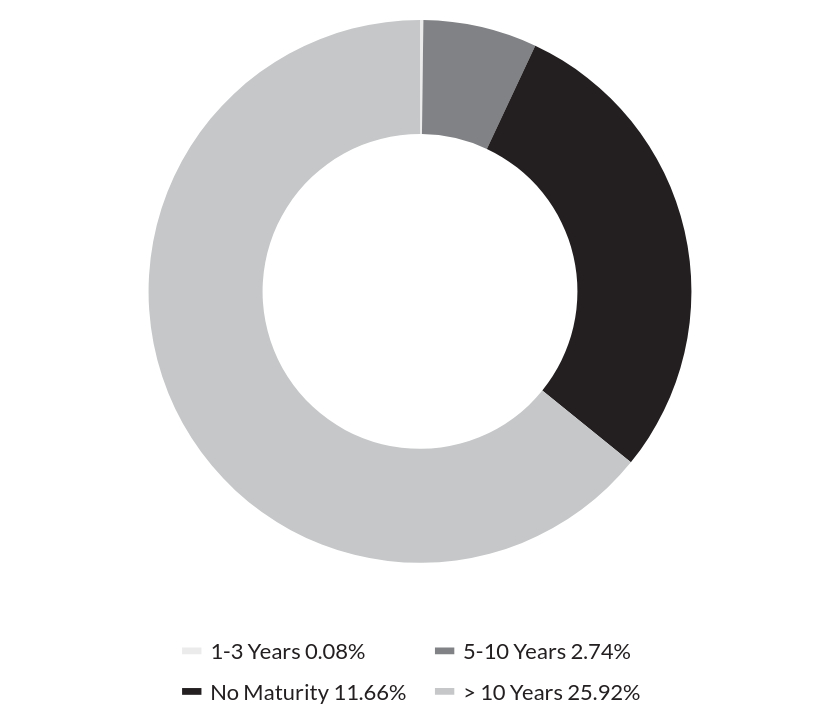
MATURITY WEIGHTINGS (as of % Net Assets)
| Value | Value |
|---|
| 1-3 Years | 0.08% |
| 5-10 Years | 2.74% |
| No Maturity | 11.66% |
| > 10 Years | 25.92% |
TOP 10 HOLDINGS (as of % Net Assets)
| Top 10 | Top 10 |
|---|
| Ginnie Mae II Pool, 2.00%, 08/20/2051 | 7.81% |
| Ginnie Mae II Pool, 2.00%, 10/20/2051 | 7.61% |
| Ginnie Mae II Pool, 2.00%, 11/20/2051 | 6.78% |
| United States Treasury Bill, 5.19%, 09/05/2024 | 5.82% |
| Ginnie Mae II Pool, 2.00%, 12/20/2051 | 3.72% |
| U.S. Treasury Note, 0.625%, 10/15/2024 | 2.92% |
| U.S. Treasury Bond, 2.75%, 08/15/2032 | 2.74% |
| Suncor Energy, Inc. | 2.16% |
| United States Treasury Bill, 5.13%, 07/25/2024 | 2.04% |
| Occidental Petroleum Corp. | 1.97% |
There have been no material fund changes during the reporting period.
Changes in and Disagreements with Accountants
There have been no changes in or disagreements with the Fund's independent accounting firm during the reporting period.
If you have consented to receive a single annual or semi-annual shareholder report at a shared address you may revoke this consent by calling the Transfer Agent 1-787-282-1621.
Additional information about the Fund, including its prospectus, financial information, holdings, and proxy voting information, can be found by visiting https://xsquarecapital.com/.
Distributor, ALPS Distributors, Inc.
CONNECT WITH US
Phone: 1-787-282-1621
Email: info@xsquarecapital.com
X-SQUARE BALANCED FUND - CLASS A : SQBFX
SEMI-ANNUAL SHAREHOLDER REPORT - June 30, 2024
SEMI-ANNUAL SHAREHOLDER REPORT - June 30, 2024
This semi-annual shareholder report contains important information about X- Square Balanced Fund - C for the period of January 1, 2024 to June 30, 2024.
You can find additional information about the Fund at https://xsquarecapital.com/. You can also request this information by contacting us at 1-787-282-1621.
What were the Fund's cost for the last six months?
(based on a hypothetical $10,000 investment)
| Class Name | Cost of a $10,000 Investment | Cost Paid as a percentage of a $10,000 Investment |
|---|
| X- Square Balanced Fund - C | $179 | 3.50% |
How did the Fund perform last year?
Performance of the Fund in 2024 was driven by heightened volatility and declining valuations in equity markets, which impacted all three major strategy groups. The market has been increasingly unpredictable and may increase risk in the investment strategy. The Fund will aim to stretch the risks of the markets in the next year.
During the fiscal year ended June 30, 2024, the Fund's use of their current investment strategies did not cause the Fund's performance to materially deviate.
How did the Fund perform since inception?
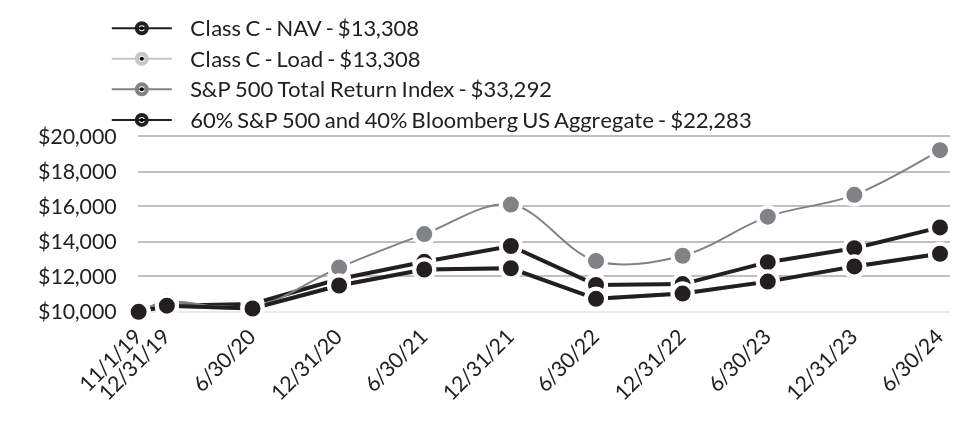
The X- Square Balanced Fund - C Fund returned 13.55% for the period November 1, 2019 to June 30, 2024. This is in contrast to the S&P 500 Total Return Index, which had a 24.56% return for the same time period. Please see below tables for additional indexes.
TOTAL RETURN BASED ON $10,000 INVESTMENT
| Class C - NAV - $13,308 | Class C - Load - $13,308 | S&P 500 Total Return Index - $33,292 | 60% S&P 500 and 40% Bloomberg US Aggregate - $22,283 |
|---|
| 6/30/24 | $13,308 | $13,308 | $19,209 | $14,808 |
| 12/31/23 | $12,587 | $12,587 | $16,662 | $13,623 |
| 6/30/23 | $11,720 | $11,720 | $15,422 | $12,829 |
| 12/31/22 | $11,038 | $11,038 | $13,193 | $11,578 |
| 6/30/22 | $10,739 | $10,739 | $12,896 | $11,533 |
| 12/31/21 | $12,481 | $12,481 | $16,111 | $13,748 |
| 6/30/21 | $12,410 | $12,410 | $14,427 | $12,849 |
| 12/31/20 | $11,500 | $11,500 | $12,518 | $11,866 |
| 6/30/20 | $10,190 | $10,190 | $10,247 | $10,445 |
| 12/31/19 | $10,350 | $10,350 | $10,573 | $10,343 |
| 11/1/19 | $10,000 | $10,000 | $10,000 | $10,000 |
The chart above represents historical performance of a hypothetical investment of $10,000 in the Fund over the past ten years (or since inception if shorter). Performance data quoted represents past performance and does not guarantee future results. Returns shown are total returns, which assume the reinvestment of dividends and capital gains. The table and graph presented above do not reflect the deduction of taxes a shareholder would pay on fund distributions or the redemption of fund shares.
AVERAGE ANNUAL TOTAL RETURNS
| X-Square Balanced Fund | 1 Year | Since Inception |
|---|
| Class C - NAV (Incep. November 1, 2019) | 13.55% | 6.32% |
| Class C - Load | 12.55% | 6.32% |
| S&P 500 Total Return Index | 24.56% | 15.03% |
| 60% S&P 500 and 40% Bloomberg US Aggregate | 15.42% | 8.91% |
- Total Net Assets$53,626,267
- # of Portfolio Holdings78
- Portfolio Turnover Rate 12%
- Advisory Fees Paid$243,694
Past performance does not guarantee future results. Call 1-787-282-1621 for current month-end performance.
What did the Fund invest in?
MATURITY WEIGHTINGS (as of % Net Assets)
| Value | Value |
|---|
| 1-3 Years | 0.08% |
| 5-10 Years | 2.74% |
| No Maturity | 11.66% |
| > 10 Years | 25.92% |
TOP 10 HOLDINGS (as of % Net Assets)
| Top 10 | Top 10 |
|---|
| Ginnie Mae II Pool, 2.00%, 08/20/2051 | 7.81% |
| Ginnie Mae II Pool, 2.00%, 10/20/2051 | 7.61% |
| Ginnie Mae II Pool, 2.00%, 11/20/2051 | 6.78% |
| United States Treasury Bill, 5.19%, 09/05/2024 | 5.82% |
| Ginnie Mae II Pool, 2.00%, 12/20/2051 | 3.72% |
| U.S. Treasury Note, 0.625%, 10/15/2024 | 2.92% |
| U.S. Treasury Bond, 2.75%, 08/15/2032 | 2.74% |
| Suncor Energy, Inc. | 2.16% |
| United States Treasury Bill, 5.13%, 07/25/2024 | 2.04% |
| Occidental Petroleum Corp. | 1.97% |
There have been no material fund changes during the reporting period.
Changes in and Disagreements with Accountants
There have been no changes in or disagreements with the Fund's independent accounting firm during the reporting period.
If you have consented to receive a single annual or semi-annual shareholder report at a shared address you may revoke this consent by calling the Transfer Agent 1-787-282-1621.
Additional information about the Fund, including its prospectus, financial information, holdings, and proxy voting information, can be found by visiting https://xsquarecapital.com/.
Distributor, ALPS Distributors, Inc.
CONNECT WITH US
Phone: 1-787-282-1621
Email: info@xsquarecapital.com
X-SQUARE BALANCED FUND - CLASS C : SQCBX
SEMI-ANNUAL SHAREHOLDER REPORT - June 30, 2024
SEMI-ANNUAL SHAREHOLDER REPORT - June 30, 2024
This semi-annual shareholder report contains important information about X- Square Balanced Fund - Institutional for the period of January 1, 2024 to June 30, 2024.
You can find additional information about the Fund at https://xsquarecapital.com/. You can also request this information by contacting us at 1-787-282-1621.
What were the Fund's cost for the last six months?
(based on a hypothetical $10,000 investment)
| Class Name | Cost of a $10,000 Investment | Cost Paid as a percentage of a $10,000 Investment |
|---|
| X- Square Balanced Fund - Institutional | $128 | 2.50% |
How did the Fund perform last year?
Performance of the Fund in 2024 was driven by heightened volatility and declining valuations in equity markets, which impacted all three major strategy groups. The market has been increasingly unpredictable and may increase risk in the investment strategy. The Fund will aim to stretch the risks of the markets in the next year.
During the fiscal year ended June 30, 2024, the Fund's use of their current investment strategies did not cause the Fund's performance to materially deviate.
How did the Fund perform since inception?
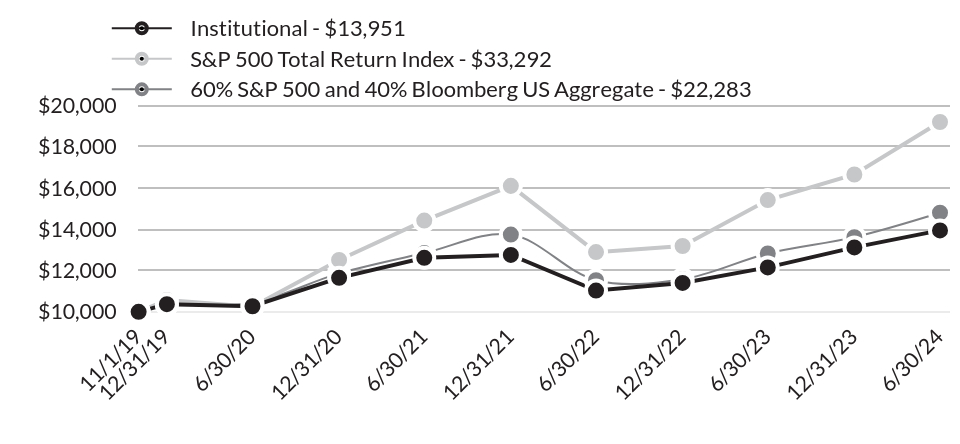
The X- Square Balanced Fund - Institutional Fund returned 14.78% for the period November 1, 2019 to June 30, 2024. This is in contrast to the S&P 500 Total Return Index, which had a 24.56% return for the same time period. Please see below tables for additional indexes.
TOTAL RETURN BASED ON $10,000 INVESTMENT
| Institutional - $13,951 | S&P 500 Total Return Index - $33,292 | 60% S&P 500 and 40% Bloomberg US Aggregate - $22,283 |
|---|
| 6/30/24 | $13,951 | $19,209 | $14,808 |
| 12/31/23 | $13,126 | $16,662 | $13,623 |
| 6/30/23 | $12,155 | $15,422 | $12,829 |
| 12/31/22 | $11,401 | $13,193 | $11,578 |
| 6/30/22 | $11,031 | $12,896 | $11,533 |
| 12/31/21 | $12,761 | $16,111 | $13,748 |
| 6/30/21 | $12,620 | $14,427 | $12,849 |
| 12/31/20 | $11,650 | $12,518 | $11,866 |
| 6/30/20 | $10,270 | $10,247 | $10,445 |
| 12/31/19 | $10,370 | $10,573 | $10,343 |
| 11/1/19 | $10,000 | $10,000 | $10,000 |
The chart above represents historical performance of a hypothetical investment of $10,000 in the Fund over the past ten years (or since inception if shorter). Performance data quoted represents past performance and does not guarantee future results. Returns shown are total returns, which assume the reinvestment of dividends and capital gains. The table and graph presented above do not reflect the deduction of taxes a shareholder would pay on fund distributions or the redemption of fund shares.
AVERAGE ANNUAL TOTAL RETURNS
| X-Square Balanced Fund | 1 Year | Since Inception |
|---|
| Institutional (Incep. November 1, 2019) | 14.78% | 7.40% |
| S&P 500 Total Return Index | 24.56% | 15.03% |
| 60% S&P 500 and 40% Bloomberg US Aggregate | 15.42% | 8.91% |
- Total Net Assets$53,626,267
- # of Portfolio Holdings78
- Portfolio Turnover Rate 12%
- Advisory Fees Paid$243,694
Past performance does not guarantee future results. Call 1-787-282-1621 for current month-end performance.
What did the Fund invest in?
MATURITY WEIGHTINGS (as of % Net Assets)
| Value | Value |
|---|
| 1-3 Years | 0.08% |
| 5-10 Years | 2.74% |
| No Maturity | 11.66% |
| > 10 Years | 25.92% |
TOP 10 HOLDINGS (as of % Net Assets)
| Top 10 | Top 10 |
|---|
| Ginnie Mae II Pool, 2.00%, 08/20/2051 | 7.81% |
| Ginnie Mae II Pool, 2.00%, 10/20/2051 | 7.61% |
| Ginnie Mae II Pool, 2.00%, 11/20/2051 | 6.78% |
| United States Treasury Bill, 5.19%, 09/05/2024 | 5.82% |
| Ginnie Mae II Pool, 2.00%, 12/20/2051 | 3.72% |
| U.S. Treasury Note, 0.625%, 10/15/2024 | 2.92% |
| U.S. Treasury Bond, 2.75%, 08/15/2032 | 2.74% |
| Suncor Energy, Inc. | 2.16% |
| United States Treasury Bill, 5.13%, 07/25/2024 | 2.04% |
| Occidental Petroleum Corp. | 1.97% |
There have been no material fund changes during the reporting period.
Changes in and Disagreements with Accountants
There have been no changes in or disagreements with the Fund's independent accounting firm during the reporting period.
If you have consented to receive a single annual or semi-annual shareholder report at a shared address you may revoke this consent by calling the Transfer Agent 1-787-282-1621.
Additional information about the Fund, including its prospectus, financial information, holdings, and proxy voting information, can be found by visiting https://xsquarecapital.com/.
Distributor, ALPS Distributors, Inc.
CONNECT WITH US
Phone: 1-787-282-1621
Email: info@xsquarecapital.com
X-SQUARE BALANCED FUND - INSTITUTIONAL : SQBIX
SEMI-ANNUAL SHAREHOLDER REPORT - June 30, 2024
Not applicable to semi-annual report.
| Item 3. | Audit Committee Financial Expert. |
Not applicable to semi-annual report.
| Item 4. | Principal Accountant Fees and Services. |
Not applicable to semi-annual report.
| Item 5. | Audit Committee of Listed Registrants. |
Not applicable to semi-annual report.
| | (a) | The Schedule of Investments is included in the financial statements filed under Item 7 of this Form. |
| Item 7. | Financial Statements and Financial Highlights for Open-End Management Investment Companies. |

| Item 7 – Financial Statements and Financial Highlights for Open-End Management Investment Companies | 1 |
| Schedule of Investments | 2 |
| Statement of Assets and Liabilities | 6 |
| Statement of Operations | 8 |
| Statements of Changes in Net Assets | 9 |
| Financial Highlights | 12 |
| Notes to Financial Statements and Financial Highlights | 18 |
| Additional Information | 25 |
| Item 8 – Changes in and Disagreements with Accountants for Open-End Management Investment Companies | 26 |
| Item 9 – Proxy Disclosures for Open-End Management Investment Companies | 27 |
| Item 10 – Remuneration Paid to Trustees, Officers, and Others of Open-End Management Investment Companies | 28 |
| Item 11 – Statement Regarding Basis for Approval of Investment Advisory Contract | 29 |
X-Square Balanced Fund
ITEM 7 – Financial Statements and Financial Highlights for
Open-End Management Investment Companies
| Semi-Annual Report | June 30, 2024 | 1 |
| X-Square Balanced Fund | Schedule of Investments |
| June 30, 2024 (Unaudited) |
| Description | | Shares | | | Value | |
| COMMON STOCKS (59.44%) | | | | | | | | |
| COMMUNICATIONS (3.89%) | | | | | | | | |
| Alphabet, Inc., Class C | | | 4,523 | | | $ | 829,608 | |
| Booking Holdings, Inc. | | | 47 | | | | 186,191 | |
| Expedia Group, Inc.(a) | | | 1,221 | | | | 153,834 | |
| Meta Platforms, Inc., Class A | | | 1,577 | | | | 795,154 | |
| Zillow Group, Inc., Class C(a) | | | 2,688 | | | | 124,696 | |
| | | | | | | | 2,089,483 | |
| | | | | | | | | |
| CONSUMER DISCRETIONARY (13.34%) | | | | | | | | |
| Alibaba Group Holding, Ltd., Sponsored ADR | | | 1,650 | | | | 118,800 | |
| Amazon.com, Inc.(a) | | | 2,818 | | | | 544,579 | |
| Chipotle Mexican Grill, Inc.(a) | | | 9,731 | | | | 609,647 | |
| Copart, Inc. | | | 13,731 | | | | 743,671 | |
| Domino's Pizza, Inc. | | | 244 | | | | 125,985 | |
| Home Depot, Inc. | | | 1,294 | | | | 445,447 | |
| Lennar Corp., Class A | | | 4,417 | | | | 661,976 | |
| MercadoLibre, Inc.(a) | | | 352 | | | | 578,477 | |
| PulteGroup, Inc. | | | 7,635 | | | | 840,613 | |
| RH(a) | | | 1,497 | | | | 365,927 | |
| Skechers USA, Inc., Class A(a) | | | 9,876 | | | | 682,629 | |
| TJX Cos., Inc. | | | 7,042 | | | | 775,324 | |
| Tractor Supply Co. | | | 2,430 | | | | 656,100 | |
| | | | | | | | 7,149,175 | |
| | | | | | | | | |
| CONSUMER STAPLES (5.78%) | | | | | | | | |
| Altria Group, Inc. | | | 8,697 | | | | 396,148 | |
| Costco Wholesale Corp. | | | 1,115 | | | | 947,738 | |
| Dollar General Corp. | | | 2,299 | | | | 303,997 | |
| Philip Morris International, Inc. | | | 5,027 | | | | 509,386 | |
| Walmart, Inc. | | | 13,802 | | | | 934,533 | |
| | | | | | | | 3,091,802 | |
| | | | | | | | | |
| ENERGY (6.13%) | | | | | | | | |
| Chesapeake Energy Corp. | | | 5,271 | | | | 433,223 | |
| EOG Resources, Inc. | | | 3,236 | | | | 407,315 | |
| New Fortress Energy, Inc. | | | 10,555 | | | | 231,999 | |
| Occidental Petroleum Corp. | | | 16,800 | | | | 1,058,904 | |
| See Notes to Financial Statements. |
| 2 | www.xsquarecapital.com |
| X-Square Balanced Fund | Schedule of Investments |
| | June 30, 2024 (Unaudited) |
| Description | | Shares | | | Value | |
| ENERGY (continued) | | | | | | | | |
| Suncor Energy, Inc. | | | 30,391 | | | $ | 1,157,898 | |
| | | | | | | | 3,289,339 | |
| | | | | | | | | |
| FINANCIALS (8.44%) | | | | | | | | |
| Ally Financial, Inc. | | | 10,226 | | | | 405,665 | |
| Berkshire Hathaway, Inc., Class B(a) | | | 1,718 | | | | 698,882 | |
| Chubb, Ltd. | | | 2,472 | | | | 630,558 | |
| Intercontinental Exchange, Inc. | | | 1,232 | | | | 168,648 | |
| JPMorgan Chase & Co. | | | 3,327 | | | | 672,919 | |
| MarketAxess Holdings, Inc. | | | 969 | | | | 194,314 | |
| Marsh & McLennan Cos., Inc. | | | 2,957 | | | | 623,099 | |
| Mastercard, Inc., Class A | | | 1,060 | | | | 467,631 | |
| OFG Bancorp | | | 3,525 | | | | 132,011 | |
| PayPal Holdings, Inc.(a) | | | 2,836 | | | | 164,573 | |
| Popular, Inc. | | | 1,151 | | | | 101,783 | |
| Truist Financial Corp. | | | 6,725 | | | | 261,266 | |
| | | | | | | | 4,521,349 | |
| | | | | | | | | |
| HEALTH CARE (3.95%) | | | | | | | | |
| AbbVie, Inc. | | | 1,548 | | | | 265,513 | |
| Amgen, Inc. | | | 1,879 | | | | 587,094 | |
| Bausch Health Cos., Inc.(a) | | | 11,163 | | | | 77,806 | |
| Johnson & Johnson | | | 2,811 | | | | 410,856 | |
| Teva Pharmaceutical Industries, Ltd., Sponsored ADR(a) | | | 47,575 | | | | 773,093 | |
| | | | | | | | 2,114,362 | |
| | | | | | | | | |
| INDUSTRIALS (8.06%) | | | | | | | | |
| Fastenal Co. | | | 7,634 | | | | 479,721 | |
| Generac Holdings, Inc.(a) | | | 2,591 | | | | 342,582 | |
| General Dynamics Corp. | | | 2,472 | | | | 717,227 | |
| Lockheed Martin Corp. | | | 1,173 | | | | 547,908 | |
| RXO, Inc.(a) | | | 5,654 | | | | 147,852 | |
| TransDigm Group, Inc. | | | 502 | | | | 641,360 | |
| United Rentals, Inc. | | | 1,348 | | | | 871,792 | |
| XPO, Inc.(a) | | | 5,416 | | | | 574,909 | |
| | | | | | | | 4,323,351 | |
| | | | | | | | | |
| MATERIALS (3.07%) | | | | | | | | |
| Freeport-McMoRan, Inc. | | | 7,988 | | | | 388,217 | |
| See Notes to Financial Statements. |
| Semi-Annual Report | June 30, 2024 | 3 |
| X-Square Balanced Fund | Schedule of Investments |
| June 30, 2024 (Unaudited) |
| Description | | Shares | | | Value | |
| MATERIALS (continued) | | | | | | | | |
| Glencore PLC, ADR | | | 51,750 | | | $ | 586,845 | |
| Rio Tinto PLC, ADR | | | 3,941 | | | | 259,830 | |
| Tecnoglass, Inc. | | | 4,363 | | | | 218,935 | |
| Vale SA, ADR | | | 17,388 | | | | 194,224 | |
| | | | | | | | 1,648,051 | |
| | | | | | | | | |
| TECHNOLOGY (6.78%) | | | | | | | | |
| Advanced Micro Devices, Inc.(a) | | | 5,250 | | | | 851,603 | |
| Akamai Technologies, Inc.(a) | | | 2,630 | | | | 236,910 | |
| Booz Allen Hamilton Holding Corp. | | | 1,508 | | | | 232,081 | |
| Fortinet, Inc.(a) | | | 5,755 | | | | 346,854 | |
| Garmin, Ltd. | | | 3,670 | | | | 597,916 | |
| Micron Technology, Inc. | | | 6,640 | | | | 873,359 | |
| N-able, Inc.(a) | | | 5,242 | | | | 79,836 | |
| Shopify, Inc., Class A(a) | | | 4,296 | | | | 283,751 | |
| SolarWinds Corp. | | | 11,606 | | | | 139,852 | |
| | | | | | | | 3,642,162 | |
| | | | | | | | | |
| TOTAL COMMON STOCKS (Cost $25,083,070) | | | | | | | 31,869,074 | |
| | | Principal Amount | | | Value | |
| MORTGAGE-BACKED SECURITIES (25.92%) | | | | | | | | |
| | | | | | | | | |
| Residential (25.92%) | | | | | | | | |
| Ginnie Mae II Pool, Series | | | | | | | | |
| MA7533 - 2021 | | | | | | | | |
| 08/20/51, 2.00% | | $ | 5,171,725 | | | $ | 4,186,032 | |
| Ginnie Mae II Pool, Series | | | | | | | | |
| 2021- | | | | | | | | |
| 10/20/51, 2.00% | | | 5,045,057 | | | | 4,083,492 | |
| 12/20/51, 2.00% | | | 2,467,263 | | | | 1,996,994 | |
| | | | | | | | 6,080,486 | |
| See Notes to Financial Statements. |
| 4 | www.xsquarecapital.com |
| X-Square Balanced Fund | Schedule of Investments |
| | June 30, 2024 (Unaudited) |
| | | Principal Amount | | | Value | |
| MORTGAGE-BACKED SECURITIES (continued) | | | | | | |
| Ginnie Mae II Pool, Series | | | | | | |
| MA7704 - 2021 | | | | | | | | |
| 11/20/51, 2.00% | | $ | 4,491,854 | | | $ | 3,635,708 | |
| | | | | | | | | |
| TOTAL MORTGAGE-BACKED SECURITIES (Cost $14,199,963) | | | | | | | 13,902,226 | |
| GOVERNMENT BONDS (5.97%) | | | | | | | | |
| U.S. Treasury Bond | | | | | | | | |
| 08/15/32, 2.75% | | | 1,650,000 | | | | 1,468,307 | |
| U.S. Treasury Notes | | | | | | | | |
| 10/15/24, 0.63% | | | 1,590,000 | | | | 1,568,262 | |
| 01/31/25, 1.38% | | | 126,500 | | | | 123,666 | |
| 10/31/26, 1.63% | | | 45,600 | | | | 42,584 | |
| | | | | | | | 1,734,512 | |
| | | | | | | | | |
| TOTAL GOVERNMENT BONDS (Cost $3,277,152) | | | | | | | 3,202,819 | |
| SHORT-TERM INVESTMENTS (8.51%) | | | | | | | | |
| U.S. Treasury Bills | | | | | | | | |
| 07/25/24, 5.13% | | | 1,100,000 | | | | 1,096,161 | |
| 09/05/24, 5.19% | | | 3,150,000 | | | | 3,119,859 | |
| 08/15/24, 5.23% | | | 350,000 | | | | 347,707 | |
| | | | | | | | 4,563,727 | |
| | | | | | | | | |
| TOTAL SHORT-TERM INVESTMENTS (Cost $4,563,791) | | | | | | | 4,563,727 | |
| | | | | | | | | |
| TOTAL INVESTMENTS (99.84%) (Cost $47,123,976) | | | | | | | 53,537,846 | |
| Other Assets In Excess Of Liabilities (0.16%) | | | | | | | 88,421 | |
| NET ASSETS (100.00%) | | | | | | $ | 53,626,267 | |
| (a) | Non-income producing security. |
| See Notes to Financial Statements. | |
| Semi-Annual Report | June 30, 2024 | 5 |
| X-Square Balanced Fund | Statement of Assets and Liabilities |
| | June 30, 2024 (Unaudited) |
| ASSETS: | | | |
| Investments, at fair value (Cost $47,123,976) | | $ | 53,537,846 | |
| Cash | | | 90,312 | |
| Dividend and interest receivable | | | 75,429 | |
| Capital shares sold receivable | | | 76,570 | |
| Prepaid expenses and other assets | | | 27,695 | |
| Total Assets | | | 53,807,852 | |
| | | | | |
| LIABILITIES: | | | | |
| Accrued chief compliance officer fees payable | | | 5,948 | |
| Payable due to advisor | | | 77,078 | |
| Accrued fund investment and administration fees payable | | | 1,147 | |
| Accrued distribution fees payable | | | 13,934 | |
| Accrued professional fees payable | | | 18,300 | |
| Accrued trustees' fees payable | | | 936 | |
| Capital shares redeemed payable | | | 102 | |
| Other payables and accrued expenses | | | 64,140 | |
| Total Liabilities | | | 181,585 | |
| Net Assets | | $ | 53,626,267 | |
| | | | | |
| COMPOSITION OF NET ASSETS ATTRIBUTABLE TO SHARES: | | | | |
| Paid-in capital | | $ | 47,003,806 | |
| Total distributable earnings/(deficit) | | | 6,622,461 | |
| Net Assets | | $ | 53,626,267 | |
| See Notes to Financial Statements. |
| 6 | www.xsquarecapital.com |
| X-Square Balanced Fund | Statement of Assets and Liabilities |
| | June 30, 2024 (Unaudited) |
| NET ASSET VALUE | | | |
| Class A: | | | |
| Net assets | | $ | 45,161,607 | |
| Shares outstanding (unlimited shares authorized, no par value) | | | 3,482,751 | |
| Net Asset Value per Share | | $ | 12.97 | |
| Maximum offering price per share (NAV/0.945, based on maximum sales charge of 5.50% of the offering price) | | $ | 13.72 | |
| Class C: | | | | |
| Net assets | | $ | 5,826,521 | |
| Shares outstanding (unlimited shares authorized, no par value) | | | 466,136 | |
| Net Asset Value per Share | | $ | 12.50 | |
| Institutional Class: | | | | |
| Net assets | | $ | 2,638,138 | |
| Shares outstanding (unlimited shares authorized, no par value) | | | 200,904 | |
| Net Asset Value per Share | | $ | 13.13 | |
| See Notes to Financial Statements. |
| Semi-Annual Report | June 30, 2024 | 7 |
| X-Square Balanced Fund | Statement of Operations |
| | For the Six Months Ended June 30, 2024 (Unaudited) |
| INVESTMENT INCOME: | | | |
| Dividends (net of foreign withholding tax $5,488) | | $ | 249,131 | |
| Interest | | | 245,750 | |
| Total Investment Income | | | 494,881 | |
| | | | | |
| EXPENSES: | | | | |
| Investment advisory fee (see Note 4) | | | 243,694 | |
| Fund accounting, administration and compliance fees | | | 101,421 | |
| Distribution fees | | | | |
| Class A | | | 51,813 | |
| Class C | | | 26,170 | |
| Professional fees | | | 39,875 | |
| Trustees' fees and expenses | | | 18,036 | |
| Transfer agent fees | | | 19,566 | |
| Recoupment of previously waived fees | | | | |
| Class A | | | 127,025 | |
| Class C | | | 16,040 | |
| Institutional Class | | | 6,366 | |
| Other expenses | | | 38,065 | |
| Total Expenses | | | 688,071 | |
| Less fees reimbursed by Adviser (See Note 4) | | | | |
| Net Expenses | | | 688,071 | |
| Net Investment Loss | | | (193,190 | ) |
| | | | | |
| REALIZED AND UNREALIZED GAIN/(LOSS) ON INVESTMENTS: | | | | |
| Net realized gain/(loss) on: | | | | |
| Investment securities | | | 922,989 | |
| Foreign currency transactions | | | (19 | ) |
| Net realized gain: | | | 922,970 | |
| Change in unrealized appreciation/(depreciation) on: | | | | |
| Investment securities | | | 2,091,004 | |
| Foreign currency transactions | | | 15 | |
| Net change in unrealized appreciation/ (depreciation) | | | 2,091,019 | |
| Net Realized and Unrealized Gain on Investments | | | 3,013,989 | |
| Net Increase in Net Assets Resulting from Operations | | $ | 2,820,799 | |
| See Notes to Financial Statements. | |
| 8 | www.xsquarecapital.com |
| X-Square Balanced Fund | Statements of Changes in Net Assets |
| | | For the Six Months Ended June 30, 2024 (Unaudited) | | | For the Year Ended December 31, 2023 | |
| FROM OPERATIONS: | | | | | | | | |
| Net investment loss | | $ | (193,190 | ) | | $ | (165,254 | ) |
| Net realized gain/(loss) | | | 922,970 | | | | (173,202 | ) |
| Net change in unrealized appreciation | | | 2,091,019 | | | | 5,635,080 | |
| Net Increase in Net Assets from Operations | | | 2,820,799 | | | | 5,296,624 | |
| | | | | | | | | |
| DISTRIBUTIONS TO SHAREHOLDERS: | | | | | | | | |
| From distributable earnings | | | | | | | | |
| Class A: | | | (107,474 | ) | | | – | |
| Class C: | | | (14,100 | ) | | | – | |
| Institutional Class: | | | (5,259 | ) | | | – | |
| From return of capital | | | | | | | | |
| Class A: | | | (275,092 | ) | | | (649,532 | ) |
| Class C: | | | (36,091 | ) | | | (93,638 | ) |
| Institutional Class: | | | (13,460 | ) | | | (31,980 | ) |
| Net Decrease in Net Assets from Distributions to Shareholders | | | (451,476 | ) | | | (775,150 | ) |
| | | | | | | | | |
| CAPITAL SHARE TRANSACTIONS: | | | | | | | | |
| Proceeds from sale of shares | | | | | | | | |
| Class A: | | | 8,691,714 | | | | 5,594,255 | |
| Class C: | | | 809,800 | | | | 334,500 | |
| Institutional Class: | | | 734,000 | | | | 383,800 | |
| Reinvestment of distributions | | | | | | | | |
| Class A: | | | 241,841 | | | | 413,261 | |
| Class C: | | | 23,062 | | | | 41,727 | |
| Institutional Class: | | | 12,269 | | | | 24,922 | |
| Cost of shares redeemed | | | | | | | | |
| Class A: | | | (1,742,327 | ) | | | (2,941,433 | ) |
| Class C: | | | (12,296 | ) | | | (286,672 | ) |
| Institutional Class: | | | (51,456 | ) | | | (170,056 | ) |
| Redemption fees | | | | | | | | |
| Institutional Class: | | | – | | | | 620 | |
| Net Increase from Capital Share Transactions | | | 8,706,608 | | | | 3,394,924 | |
| Net Increase in Net Assets | | $ | 11,075,931 | | | $ | 7,916,398 | |
| See Notes to Financial Statements. | |
| Semi-Annual Report | June 30, 2024 | 9 |
| X-Square Balanced Fund | Statements of Changes in Net Assets |
| | | For the Six Months Ended June 30, 2024 (Unaudited) | | | For the Year Ended December 31, 2023 | |
| NET ASSETS: | | | | | | | | |
| Beginning of period | | | 42,550,336 | | | | 34,633,938 | |
| End of period | | $ | 53,626,267 | | | $ | 42,550,336 | |
| | | | | | | | | |
| OTHER INFORMATION: | | | | | | | | |
| Capital Share Transactions: | | | | | | | | |
| Class A: | | | | | | | | |
| Beginning shares | | | 2,912,534 | | | | 2,645,402 | |
| Shares sold | | | 687,471 | | | | 487,050 | |
| Shares issued as reinvestment of dividends | | | 19,232 | | | | 36,406 | |
| Shares redeemed | | | (136,486 | ) | | | (256,324 | ) |
| Ending Shares | | | 3,482,751 | | | | 2,912,534 | |
| Class C: | | | | | | | | |
| Beginning shares | | | 400,200 | | | | 392,989 | |
| Shares sold | | | 65,046 | | | | 29,552 | |
| Shares issued as reinvestment of dividends | | | 1,898 | | | | 3,779 | |
| Shares redeemed | | | (1,008 | ) | | | (26,120 | ) |
| Ending Shares | | | 466,136 | | | | 400,200 | |
| Institutional Class: | | | | | | | | |
| Beginning shares | | | 148,239 | | | | 127,916 | |
| Shares sold | | | 55,818 | | | | 32,966 | |
| Shares issued as reinvestment of dividends | | | 966 | | | | 2,176 | |
| Shares redeemed | | | (4,119 | ) | | | (14,819 | ) |
| Ending Shares | | | 200,904 | | | | 148,239 | |
| See Notes to Financial Statements. | |
| 10 | www.xsquarecapital.com |
Intentionally Left Blank
| X-Square Balanced Fund – Class A | Financial Highlights |
| For a Share Outstanding Throughout the Periods Presented |
| | | For the Six
Months
Ended June 30, 2024
(Unaudited) | | | For the
Year
Ended
December
31, 2023 | | | For the
Year
Ended
December
31, 2022 | | | For the
Year
Ended
December
31, 2021 | | | For the
Year
Ended
December
31, 2020 | | | For the Period
May 18, 2023
(Commencement
of Operations) to
December 31,
2019 | |
| PER SHARE OPERATING PERFORMANCE: | | | | | | | | | | | | | | | | | | | | | | | | |
| Net asset value - beginning of period | | $ | 12.33 | | | $ | 10.97 | | | $ | 12.57 | | | $ | 11.61 | | | $ | 10.37 | | | $ | 10.00 | |
| INCOME/(LOSS) FROM INVESTMENT OPERATIONS: | | | | | | | | | | | | | | | | | | | | | | | | |
| Net investment loss(a) | | | (0.05 | ) | | | (0.04 | ) | | | (0.07 | ) | | | (0.20 | ) | | | (0.14 | ) | | | (0.00 | )(b)(c) |
| Net realized and unrealized gain/(loss) on investments | | | 0.81 | | | | 1.64 | | | | (1.29 | ) | | | 1.28 | | | | 1.38 | | | | 0.37 | |
| Net increase/(decrease) in Net Asset Value | | | 0.76 | | | | 1.60 | | | | (1.36 | ) | | | 1.08 | | | | 1.24 | | | | 0.37 | |
| | | | | | | | | | | | | | | | | | | | | | | | | |
| DISTRIBUTIONS TO COMMON SHAREHOLDERS: | | | | | | | | | | | | | | | | | | | | | | | | |
| From net investment income | | | (0.03 | ) | | | – | | | | – | | | | (0.12 | ) | | | – | | | | – | |
| From return of capital | | | (0.09 | ) | | | (0.24 | ) | | | (0.24 | ) | | | – | | | | – | | | | – | |
| Total Distributions to Common Shareholders | | | (0.12 | ) | | | (0.24 | ) | | | (0.24 | ) | | | (0.12 | ) | | | – | | | | – | |
| Net asset value per share - end of period | | $ | 12.97 | | | $ | 12.33 | | | $ | 10.97 | $ | | | 12.57 | | | $ | 11.61 | $ | | | 10.37 | |
| Total Investment Return - Net Asset Value(d) | | | 6.20 | % | | | 14.79 | % | | | (10.88 | %) | | | 9.31 | % | | | 11.96 | % | | | 3.70 | % |
| | | | | | | | | | | | | | | | | | | | | | | | | |
| RATIOS AND SUPPLEMENTAL DATA: | | | | | | | | | | | | | | | | | | | | | | | | |
| Net assets attributable to shares, end of period (000s) | | $ | 45,162 | | | $ | 35,924 | | | $ | 29,014 | | | $ | 26,262 | | | $ | 8,756 | $ | | | 779 | |
| Ratio of actual expenses to average net assets including fee waivers and reimbursements | | | 2.75 | % | | | 2.75 | % | | | 2.75 | % | | | 2.75 | % | | | 2.75 | % | | | 2.75 | %(e) |
| See Notes to Financial Statements. |
| 12 | www.xsquarecapital.com |
| X-Square Balanced Fund – Class A | Financial Highlights |
| For a Share Outstanding Throughout the Periods Presented |
| | | For the Six
Months
Ended June 30, 2024
(Unaudited) | | | For the
Year
Ended
December
31, 2023 | | | For the
Year
Ended
December
31, 2022 | | | For the
Year
Ended
December
31, 2021 | | | For the
Year
Ended
December
31, 2020 | | | For the Period
May 18, 2023
(Commencement
of Operations) to
December 31,
2019 | |
| Ratio of actual expenses to average net assets excluding fee waivers and reimbursements | | | 2.75 | % | | | 2.80 | % | | | 3.28 | % | | | 3.50 | % | | | 13.07 | % | | | 115.61 | %(e) |
| Ratio of net investment loss to average net assets | | | (0.72 | %) | | | (0.37 | %) | | | (0.59 | %) | | | (1.59 | %) | | | (1.26 | %) | | | (0.19 | %) |
| Portfolio turnover rate | | | 12.39 | % | | | 30.18 | % | | | 51.37 | % | | | 18.40 | % | | | 20.14 | % | | | 0.00 | % |
| (a) | Calculated using average shares outstanding. |
| (b) | Less than $0.005 per share. |
| (d) | Total investment return is calculated assuming a purchase of shares at the opening on the first day and a sale at closing on the last day of the period reported. Dividends and distributions are assumed for purposes of this calculation to be reinvested at prices obtained under the Fund's dividend reinvestment plan. Total investment returns do not reflect brokerage commissions, if any, and are not annualized. |
| (e) | These ratios to average net assets have been annualized except the non-recurring offering costs, which have not been annualized. |
| See Notes to Financial Statements. | |
| Semi-Annual Report | June 30, 2024 | 13 |
| X-Square Balanced Fund – Class C | Financial Highlights |
| For a Share Outstanding Throughout the Periods Presented |
| | | For the Six
Months
Ended
June 30,
2024
(Unaudited) | | | For the
Year
Ended
December
31, 2023 | | | For the
Year
Ended
December
31, 2022 | | | For the
Year
Ended
December
31, 2021 | | | For the
Year
Ended
December
31, 2020 | | | For the Period
May 18, 2023
(Commencement
of Operations) to
December 31,
2019 | |
| PER SHARE OPERATING PERFORMANCE: | | | | | | | | | | | | | | | | | | | | | | | | |
| Net asset value - beginning of period | | $ | 11.94 | | | $ | 10.70 | | | $ | 12.36 | $ | | | 11.50 | | | $ | 10.35 | | | $ | 10.00 | |
| INCOME/(LOSS) FROM INVESTMENT OPERATIONS: | | | | | | | | | | | | | | | | | | | | | | | | |
| Net investment loss(a) | | | (0.09 | ) | | | (0.12 | ) | | | (0.15 | ) | | | (0.29 | ) | | | (0.21 | ) | | | (0.02 | )(b) |
| Net realized and unrealized gain/(loss) on investments | | | 0.77 | | | | 1.60 | | | | (1.27 | ) | | | 1.27 | | | | 1.36 | | | | 0.37 | |
| Net increase/(decrease) in Net Asset Value | | | 0.68 | | | | 1.48 | | | | (1.42 | ) | | | 0.98 | | | | 1.15 | | | | 0.35 | |
| | | | | | | | | | | | | | | | | | | | | | | | | |
| DISTRIBUTIONS TO COMMON SHAREHOLDERS: | | | | | | | | | | | | | | | | | | | | | | | | |
| From net investment income | | | (0.03 | ) | | | – | | | | – | | | | (0.12 | ) | | | – | | | | – | |
| From return of capital | | | (0.09 | ) | | | (0.24 | ) | | | (0.24 | ) | | | – | | | | – | | | | – | |
| Total Distributions to Common Shareholders | | | (0.12 | ) | | | (0.24 | ) | | | (0.24 | ) | | | (0.12 | ) | | | – | | | | – | |
| | | | | | | | | | | | | | | | | | | | | | | | | |
| Net asset value per share - end of period | | $ | 12.50 | | | $ | 11.94 | | | $ | 10.70 | | | $ | 12.36 | | | $ | 11.50 | | | $ | 10.35 | |
| | | | | | | | | | | | | | | | | | | | | | | | | |
| Total Investment Return - Net Asset Value(c) | | | 5.73 | % | | | 14.03 | % | | | (11.56 | %) | | | 8.53 | % | | | 11.11 | % | | | 3.50 | % |
| | | | | | | | | | | | | | | | | | | | | | | | | |
| RATIOS AND SUPPLEMENTAL DATA: | | | | | | | | | | | | | | | | | | | | | | | | |
| Net assets attributable to shares, end of period (000s) | | $ | 5,827 | | | $ | 4,778 | | | $ | 4,205 | $ | | | 4,345 | | | $ | 1,431 | | | $ | 113 | |
| Ratio of actual expenses to average net assets including fee waivers and reimbursements | | | 3.50 | % | | | 3.50 | % | | | 3.50 | % | | | 3.50 | % | | | 3.50 | % | | | 3.50 | %(d) |
| See Notes to Financial Statements. | |
| 14 | www.xsquarecapital.com |
| X-Square Balanced Fund – Class C | Financial Highlights |
| For a Share Outstanding Throughout the Periods Presented |
| | | For the Six
Months
Ended
June 30,
2024
(Unaudited) | | | For the
Year
Ended
December
31, 2023 | | | For the
Year
Ended
December
31, 2022 | | | For the
Year
Ended
December
31, 2021 | | | For the
Year
Ended
December
31, 2020 | | | For the Period
May 18, 2023
(Commencement
of Operations) to
December 31,
2019 | |
| Ratio of actual expenses to average net assets excluding fee waivers and reimbursements | | | 3.50 | % | | | 3.55 | % | | | 4.02 | % | | | 4.23 | % | | | 14.81 | % | | | 161.50 | %(d) |
| Ratio of net investment loss to average net assets | | | (1.48 | %) | | | (1.12 | %) | | | (1.35 | %) | | | (2.34 | %) | | | (1.95 | %) | | | (0.99 | %) |
| Portfolio turnover rate | | | 12.39 | % | | | 30.18 | % | | | 51.37 | % | | | 18.40 | % | | | 20.14 | % | | | 0.00 | % |
| (a) | Calculated using average shares outstanding. |
| (c) | Total investment return is calculated assuming a purchase of shares at the opening on the first day and a sale at closing on the last day of the period reported. Dividends and distributions are assumed for purposes of this calculation to be reinvested at prices obtained under the Fund's dividend reinvestment plan. Total investment returns do not reflect brokerage commissions, if any, and are not annualized. |
| (d) | These ratios to average net assets have been annualized except the non-recurring offering costs, which have not been annualized. |
| See Notes to Financial Statements. | |
| Semi-Annual Report | June 30, 2024 | 15 |
| X-Square Balanced Fund – Institutional Class | Financial Highlights |
| For a Share Outstanding Throughout the Periods Presented |
| | | For the Six
Months
Ended
June 30,
2024
(Unaudited) | | | For the
Year
Ended
December
31, 2023 | | | For the
Year
Ended
December
31, 2022 | | | For the
Year
Ended
December
31, 2021 | | | For the
Year
Ended
December
31, 2020 | | | For the Period
May 18, 2023
(Commencement
of Operations) to
December 31,
2019 | |
| PER SHARE OPERATING PERFORMANCE: | | | | | | | | | | | | | | | | | | | | | | | | |
| Net asset value - beginning of period | | $ | 12.47 | | | $ | 11.06 | | | $ | 12.63 | | | $ | 11.65 | | | $ | 10.37 | | | $ | 10.00 | |
| INCOME/(LOSS) FROM INVESTMENT OPERATIONS: | | | | | | | | | | | | | | | | | | | | | | | | |
| Net investment loss(a) | | | (0.03 | ) | | | (0.01 | ) | | | (0.04 | ) | | | (0.17 | ) | | | (0.11 | ) | | | (0.00 | )(b)(c) |
| Net realized and unrealized gain/(loss) on investments | | | 0.81 | | | | 1.66 | | | | (1.29 | ) | | | 1.27 | | | | 1.39 | | | | 0.37 | |
| Net increase/(decrease) in Net Asset Value | | | 0.78 | | | | 1.65 | | | | (1.33 | ) | | | 1.10 | | | | 1.28 | | | | 0.37 | |
| | | | | | | | | | | | | | | | | | | | | | | | | |
| DISTRIBUTIONS TO COMMON SHAREHOLDERS: | | | | | | | | | | | | | | | | | | | | | | | | |
| From net investment income | | | (0.03 | ) | | | – | | | | – | | | | (0.12 | ) | | | – | | | | – | |
| From return of capital | | | (0.09 | ) | | | (0.24 | ) | | | (0.24 | ) | | | – | | | | – | | | | – | |
| Total Distributions to Common Shareholders | | | (0.12 | ) | | | (0.24 | ) | | | (0.24 | ) | | | (0.12 | ) | | | – | | | | – | |
| | | | | | | | | | | | | | | | | | | | | | | | | |
| Net asset value per share - end of period | | $ | 13.13 | | | $ | 12.47 | | | $ | 11.06 | | | $ | 12.63 | | | $ | 11.65 | | | $ | 10.37 | |
| | | | | | | | | | | | | | | | | | | | | | | | | |
| Total Investment Return - Net Asset Value(d) | | | 6.29 | % | | | 15.13 | % | | | (10.59 | %) | | | 9.45 | % | | | 12.34 | % | | | 3.70 | % |
| | | | | | | | | | | | | | | | | | | | | | | | | |
| RATIOS AND SUPPLEMENTAL DATA: | | | | | | | | | | | | | | | | | | | | | | | | |
| Net assets attributable to shares, end of period (000s) | | $ | 2,638 | | | $ | 1,849 | | | $ | 1,414 | $ | | | 1,590 | | | $ | 1,035 | | | $ | 41 | |
| Ratio of actual expenses to average net assets including fee waivers and reimbursements | | | 2.50 | % | | | 2.50 | % | | | 2.50 | % | | | 2.50 | % | | | 2.50 | % | | | 2.50 | %(e) |
| See Notes to Financial Statements. | |
| 16 | www.xsquarecapital.com |
| X-Square Balanced Fund – Institutional Class | Financial Highlights |
| For a Share Outstanding Throughout the Periods Presented |
| | | For the Six
Months
Ended
June 30,
2024
(Unaudited) | | | For the
Year
Ended
December
31, 2023 | | | For the
Year
Ended
December
31, 2022 | | | For the
Year
Ended
December
31, 2021 | | | For the
Year
Ended
December
31, 2020 | | | For the Period
May 18, 2023
(Commencement
of Operations) to
December 31,
2019 | |
| Ratio of actual expenses to average net assets excluding fee waivers and reimbursements | | | 2.50 | % | | | 2.55 | % | | | 3.01 | % | | | 3.37 | % | | | 12.00 | % | | | 239.72 | %(e) |
| Ratio of net investment loss to average net assets | | | (0.48 | %) | | | (0.12 | %) | | | (0.36 | %) | | | (1.37 | %) | | | (1.00 | %) | | | (0.21 | %) |
| Portfolio turnover rate | | | 12.39 | % | | | 30.18 | % | | | 51.37 | % | | | 18.40 | % | | | 20.14 | % | | | 0.00 | % |
| (a) | Calculated using average shares outstanding. |
| (b) | Less than $0.005 per share. |
| (d) | Total investment return is calculated assuming a purchase of shares at the opening on the first day and a sale at closing on the last day of the period reported. Dividends and distributions are assumed for purposes of this calculation to be reinvested at prices obtained under the Fund's dividend reinvestment plan. Total investment returns do not reflect brokerage commissions, if any, and are not annualized. |
| (e) | These ratios to average net assets have been annualized except the non-recurring offering costs, which have not been annualized. |
| See Notes to Financial Statements. | |
| Semi-Annual Report | June 30, 2024 | 17 |
| X-Square Balanced Fund | Notes to Financial Statements and Financial Highlights |
| | June 30, 2024 (Unaudited) |
NOTE 1 — ORGANIZATION AND REGISTRATION
X-Square Balanced Fund, LLC (the "Fund") is an open-end investment company registered under the Investment Company Act of 1940, as amended (the “1940 Act”). The Fund is a non-diversified investment company with an investment objective which seeks conservation of capital, current income and long-term growth of capital and income. The Fund currently offers Class A, Class C and Institutional Class Shares. Each share class of the Fund represents an investment in the same portfolio of securities, but each share class has its own expense structures. The Fund’s Investment Adviser is X-Square Capital, LLC (the “Adviser”). The Fund is a related party to the Adviser.
Subject to certain exceptions, investments in Class C shares are subject to a 1.00% contingent deferred sales charge if shares are sold within 12 months of purchase. The contingent deferred sales charge is expected to be calculated based on the lesser of the offering price and market value of shares being sold.
NOTE 2 — SIGNIFICANT ACCOUNTING POLICIES
The following is a summary of significant accounting policies consistently followed by the Fund in the preparation of its financial statements. The financial statements are prepared in United States Dollars and in conformity with accounting principles generally accepted in the United States of America (“GAAP”), which requires management to make certain estimates and assumptions that affect the reported amounts of assets and liabilities, disclosure of contingent assets and liabilities at the date of the financial statements, and the reported amounts of income and expenses during the reporting period. Actual results may differ from these estimates. The Fund is considered an investment company under GAAP and follows the accounting and reporting guidance applicable to investment companies in the Financial Accounting Standards Board Accounting Standards Codification Topic 946. The financial statements have been prepared as of the close of the New York Stock Exchange (“NYSE”) as of the fiscal year end of the Fund.
Portfolio Valuation: The net asset value (“NAV”) per common share of the Fund is determined daily, on each day that there is a regular trading session on the NYSE as of the close of regular trading. The Fund’s NAV per common share is calculated by dividing the value of the Fund’s total assets, less its liabilities, by the number of shares outstanding and rounding the result to the nearest full cent.
The Fund generally values its securities based on market prices determined at the close of regular trading on the NYSE (normally, 4 p.m. Eastern time) on each business day (Monday through Friday). The Fund will not value its securities on any day that the NYSE is closed, including the following observed holidays: New Year’s Day, Martin Luther King, Jr. Day, Washington’s Birthday, Good Friday, Memorial Day, Juneteenth National Independence Day, Independence Day, Labor Day, Thanksgiving Day and Christmas Day. The Fund’s currency valuations are done as of the close of regular trading on the NYSE (normally, 4 p.m. Eastern time).
For equity securities that are traded on an exchange, the market price is usually the closing sale or official closing price on that exchange, provided such price is not deemed stale, and that it represents fair value. In the case of securities not traded on an exchange, or if such closing prices are not otherwise available, the market price is typically determined by independent third party pricing vendors approved by the Fund’s Board of Managers (“the Board”) using a variety of pricing techniques and methodologies.
| X-Square Balanced Fund | Notes to Financial Statements and Financial Highlights |
| | June 30, 2024 (Unaudited) |
The market price for debt obligations (including short-term debt obligations with remaining maturities of 60 days or less) is generally the price supplied by an independent third-party pricing service approved by the Board, which may use a matrix, formula or other objective method that takes into consideration market indices, yield curves and other specific adjustments. In certain circumstances, bid and ask prices may be obtained from: (i) a broker/ dealer specified and deemed reliable by the Adviser, (ii) pink sheets, yellow sheets or the blue list, or (iii) a pricing agent that obtains quotations from broker/dealers or evaluates the value of the respective bid and ask prices. If vendors are unable to supply a price, or if the price supplied is deemed to be unreliable, the market price may be determined using quotations received from one or more brokers/dealers that make a market in the security.
When such prices or quotations are not available, or when the Adviser believes that they are unreliable, securities may be priced using fair value procedures approved by the Board. The Fund may also use fair value procedures if the Adviser determines that a significant event has occurred between the time at which a market price is determined and the time at which the Fund NAV is calculated. In particular, the value of foreign securities may be materially affected by events occurring after the close of the market on which they are traded, but before the Fund prices its shares.
The Fund may determine the fair value of investments based on information provided by pricing services and other third-party vendors, which may recommend fair value prices or adjustments with reference to other securities, indices or assets. In considering whether fair value pricing is required and in determining fair values, the Fund may, among other things, consider significant events (which may be considered to include changes in the value of U.S. securities or securities indices) that occur after the close of the relevant market and before the Fund values its securities. In addition, the Fund may utilize modeling tools provided by third-party vendors to determine fair values of foreign securities.
Valuing securities at fair value involves greater reliance on judgment than valuation of securities based on readily available market quotations. A fund that uses fair value to price securities may value those securities higher or lower than another fund using market quotations or its own fair value methodologies to price the same securities. There can be no assurance that the Fund could obtain the fair value assigned to a security if it were to sell the security at approximately the time at which the Fund determines its NAV.
The information above is not intended to reflect an exhaustive list of the methodologies that may be used to value portfolio investments. The Fund’s valuation procedures permit the use of a variety of valuation methodologies in connection with valuing portfolio investments. The methodology used for a specific type of investment may vary based on the market data available or other considerations. The methodologies summarized above may not represent the specific means by which portfolio investments are valued on any particular business day.
| Semi-Annual Report | June 30, 2024 | 19 |
| X-Square Balanced Fund | Notes to Financial Statements and Financial Highlights |
| | June 30, 2024 (Unaudited) |
Cash and Cash Equivalents: Idle cash may be swept into various overnight demand deposits and is classified as cash and cash equivalents on the Statements of Assets and Liabilities. The Fund maintains cash in bank deposit accounts which, at times, may exceed United States federally insured limits. Amounts swept overnight are available on the next business day.
Securities Transactions and Investment Income: Investment security transactions are accounted for on a trade date basis. Dividend income is recorded on the ex-dividend date. Realized gains and losses from securities transactions and unrealized appreciation and depreciation of securities are determined using the identified cost basis method for financial reporting purposes. Dividends are recorded net of foreign withholding taxes. Interest income is recorded on an accrual basis.
Expenses: Some expenses of the Fund can be directly attributed to a Fund specific share class. Expenses that cannot be directly attributed are apportioned among all share classes based on average net assets. Expenses are recognized when incurred.
Income Taxes: The Fund is taxed under the dispositions applicable to Registered Investment Companies established by the Puerto Rico Internal Revenue Code of 2011, as amended ("the Code"), its regulations and the administrative pronouncements promulgated thereunder. The Code states that every registered investment company will be exempt from Puerto Rico income tax for a taxable year if it distributes to its stockholders at least 90% of its taxable net investment income for such taxable year. The Fund intends to meet the 90% distribution requirement on a yearly basis to maintain the income tax exemption.
For U.S. federal income taxes, the Fund will be treated as a foreign corporation not engaged in a trade or business in the United States for purposes of the U.S. Internal Revenue Code of 1986, as amended (the “U.S. Code”) and does not intend to derive income treated as effectively connected with a trade or business in the United States. As a foreign corporation not engaged in a trade or business in the United States, the Fund will only be subject to United States federal income taxes if it realizes certain items of U.S. source income of a fixed or determinable annual or periodic nature, in which case the Fund will be subject to withholding of United States federal income tax at a 30% gross rate on such U.S. source income (not including interest received by the Fund on certain registered obligations).
The Puerto Rico income tax basis of the Fund's investments at June 30, 2024, was $47,123,976, and net unrealized appreciation for income tax purposes was $6,413,870 (gross unrealized appreciation $8,633,638; gross unrealized depreciation $2,219,768).
The Fund recognizes the tax benefits of uncertain tax positions only when the position is more likely than not to be sustained, assuming examination by tax authorities. Management has analyzed the Fund's tax positions and concluded that no liability for unrecognized tax benefits should be recorded related to uncertain tax positions expected to be taken in the Fund's 2023 tax returns. The Fund identifies its major tax jurisdictions as Commonwealth of Puerto Rico; however, the Fund is not aware of any tax positions for which it is reasonably possible that the total amounts of unrecognized tax benefits will change materially in the next 12 months. The Fund remains subject to income tax examinations for its PR income taxes generally for the years 2019 through 2023.
| X-Square Balanced Fund | Notes to Financial Statements and Financial Highlights |
| | June 30, 2024 (Unaudited) |
Indemnification: The Fund indemnifies its officers and managers for certain liabilities that may arise from the performance of their duties to the Fund. Additionally, in the normal course of business, the Fund enters into contracts that contain a variety of representations and warranties that provide general indemnities. The Fund’s maximum exposure under these arrangements is unknown, as this would involve future claims that may be made against the Fund that have not yet occurred. However, the Fund expects the risk of loss due to these warranties and indemnities to be remote.
NOTE 3 — FAIR VALUE MEASUREMENTS
The Fund discloses the classification of its fair value measurements following a three-tier hierarchy based on the inputs used to measure fair value. Inputs refer broadly to the assumptions that market participants would use in pricing the asset or liability, including assumptions about risk. Inputs may be observable or unobservable. Observable inputs reflect the assumptions market participants would use in pricing the asset or liability that are developed based on market data obtained from sources independent of the reporting entity. Unobservable inputs reflect the reporting entity’s own assumptions about the assumptions market participants would use in pricing the asset or liability that are developed based on the best information available.
Various inputs are used in determining the value of the Fund’s investments as of the end of the reporting period. When inputs used fall into different levels of the fair value hierarchy, the level in the hierarchy within which the fair value measurement falls is determined based on the lowest level input that is significant to the fair value measurement in its entirety. The designated input levels are not necessarily an indication of the risk or liquidity associated with these investments.
These inputs are categorized in the following hierarchy under applicable financial accounting standards:
| Level 1 – | Unadjusted quoted prices in active markets for identical investments, unrestricted assets or liabilities that the Fund has the ability to access at the measurement date; |
| Level 2 – | Quoted prices which are not active, quoted prices for similar assets or liabilities in active markets or inputs other than quoted prices that are observable (either directly or indirectly) for substantially the full term of the asset or liability; and |
| Level 3 – | Significant unobservable prices or inputs (including the Fund’s own assumptions in determining the fair value of investments) where there is little or no market activity for the asset or liability at the measurement date. |
| Semi-Annual Report | June 30, 2024 | 21 |
| X-Square Balanced Fund | Notes to Financial Statements and Financial Highlights |
| | June 30, 2024 (Unaudited) |
The following is a summary of the inputs used to value the Fund’s investments as of June 30, 2024:
| Investments in Securities at Value | | Level 1 | | | Level 2 | | | Level 3 | | | Total | |
| Common Stocks(a) | | $ | 31,869,074 | | | $ | – | | | $ | – | | | $ | 31,869,074 | |
| Government Bonds | | | 3,202,819 | | | | – | | | | – | | | | 3,202,819 | |
| Mortgage-Backed Securities | | | – | | | | 13,902,226 | | | | – | | | | 13,902,226 | |
| Short-Term Investments | | | 4,563,727 | | | | – | | | | – | | | | 4,563,727 | |
| Total | | $ | 39,635,620 | | | $ | 13,902,226 | | | $ | – | | | $ | 53,537,846 | |
| (a) | For a detailed sector breakdown, see the accompanying Schedule of Investments. |
There were no Level 3 securities held in the Fund at June 30, 2024. There were no transfers in or out from Level 3 as of and for the six months ended June 30, 2024.
NOTE 4 — INVESTMENT ADVISORY AGREEMENT
As compensation for its services, the Fund pays to the Adviser a monthly management fee at an annual rate of 1.00% of its average daily net assets.
The Adviser, a related party to the Fund, pursuant to an Amended and Restated Expense Reimbursement Agreement (the “Agreement”), has contractually agreed to reduce its fees and/or absorb expenses of the Fund, at least until one year from the date of the Fund’s prospectus (through April 30, 2025), to ensure that Net Annual Operating Expenses (excluding taxes, extraordinary expenses, reorganization expenses, brokerage commissions, interest, other expenditures that are not capitalized in accordance with generally accepted accounting principles, and other extraordinary expenses not incurred in the ordinary course of the Fund’s business) will not exceed 2.75%, 3.50% and 2.50% of the Fund’s average daily net assets, respectively for Class A, Class C and Institutional Class Shares, respectively. The Adviser will be permitted to recover, on a class-by-class basis, any fees waived and/or expenses reimbursed pursuant to the Agreement described above to the extent that the Fund expenses in later periods fall below the lesser of (i) the expense limitation in effect at the time the fees and/or expenses to be recovered were waived and/or reimbursed and (ii) the expense limitation in effect at the time the Adviser seeks to recover the fees or expenses. The Adviser will not be entitled to recover any such waived or reimbursed fees and expenses more than three years after the date on which the fees were waived or expenses were reimbursed. This Agreement will renew automatically for periods of one year (each such one year period, a “Renewal Year”). This Agreement may be terminated, as to any succeeding Renewal Year, by either party upon 60 days’ written notice prior to the end of the then current Renewal Year. Notwithstanding the foregoing, this Agreement may be terminated by the Fund’s Board of Managers at any time if it determines that such termination is in the best interest of the Fund and its Members. The Adviser may not terminate this waiver arrangement without the approval of the Fund’s Board of Managers.
| X-Square Balanced Fund | Notes to Financial Statements and Financial Highlights |
| | June 30, 2024 (Unaudited) |
As of June 30, 2024, the following amounts were available for recoupment by the Adviser based upon their potential expiration date:
| | | Expiring in 2024 | | | Expiring in 2025 | | | Expiring in 2026 | |
| Class A | | $ | 8,124 | | | $ | 146,429 | | | $ | 13,945 | |
| Class C | | $ | 5,093 | | | $ | 20,782 | | | $ | 2,024 | |
| Institutional | | $ | 4,427 | | | $ | 7,432 | | | $ | 671 | |
NOTE 5 — OTHER AGREEMENTS
Distribution and Services Agreement
The Fund has adopted a Distribution and Shareholder Servicing Plan pursuant to Rule 12b-1 under the 1940 Act (the “Plan”). Under the Plan, the Fund is authorized to pay distribution fees in connection with the sale and distribution of its shares and pay service fees in connection with the provision of ongoing services to shareholders of each class and the maintenance of shareholder accounts in an amount up to 0.25% of its average daily net assets each year with respect to Class A Shares, 0.00% with respect to Institutional Class shares and 1.00% with respect to Class C shares. The Class C distribution fee includes a distribution fee of up to 0.75% and a service fee of up to 0.25%.
ALPS Distributors, Inc. (the “Distributor”) serves as the Fund’s distributor. The Distributor acts as an agent for the Fund and the distributor of the Fund’s shares.
Administration, Bookkeeping and Pricing Agreement
ALPS Fund Services, Inc. (“ALPS”) serves as the administrator to the Fund. The Fund has agreed to pay expenses incurred in connection with ALPS administrative activities. Pursuant to the Administration, Bookkeeping and Pricing Services Agreement, ALPS will provide operational services to the Fund including, but not limited to fund accounting and fund administration and generally assist in the Fund operations.
Transfer Agency Agreement
ALPS also serves as the Transfer Agent to the Fund. Under the Transfer Agency Agreement, ALPS is responsible for maintaining all shareholder records of the Fund.
NOTE 6 — INVESTMENT TRANSACTIONS
Investment transactions for the six months ended June 30, 2024, excluding U.S. Government Obligations and short-term investments, were as follows:
| | | Cost of Investments Purchased | | | Proceeds from Investments Sold | |
| | $ | 11,297,600 | | | $ | 2,357,002 | |
| Semi-Annual Report | June 30, 2024 | 23 |
| X-Square Balanced Fund | Notes to Financial Statements and Financial Highlights |
| | June 30, 2024 (Unaudited) |
Purchases and sales of U.S. Government Obligations for the six months ended June 30, 2024, were as follows:
| | | Cost of Investments Purchased | | | Proceeds from Investments Sold | |
| | $ | — | | | $ | 3,620,000 | |
NOTE 7 — LINE OF CREDIT
As of June 30, 2024, the Fund had secured a bank line of credit through U.S. Bank, subject to the limitations of the 1940 Act for borrowings. As of the six months ended June 30, 2024, the Fund had no outstanding borrowings.
NOTE 8 — RISKS AND UNCERTAINTIES
The ongoing war in Ukraine posses a risk to global stability. Supply chains including crops such as wheat could be further disrupted by the conflict, thus putting incremental pressure on prices. In addition, energy security and markets will continue to experience instability as Ukraine is a major gas corridor and Russia supplies more than 10% of global energy consumption. The net result of this environment is inflation which has a negative impact on margins, consumption and Central Bank reaction function which is to deliver higher rates for longer.
NOTE 9 — SUBSEQUENT EVENTS
The Adviser has evaluated subsequent events through the date of issuance of the financial statements included herein. There have been no subsequent events that occurred during such period that would require disclosure or would be required to be recognized in the financial statements.
| X-Square Balanced Fund | Additional Information |
| | June 30, 2024 (Unaudited) |
| Semi-Annual Report | June 30, 2024 | 25 |
| X-Square Balanced Fund | Item 8 – Changes in and Disagreements with Accountants for Open-End Management Investment Companies |
| | June 30, 2024 (Unaudited) |
Not applicable for this reporting period.
| X-Square Balanced Fund | Item 9 – Proxy Disclosures for Open-End Management Investment Companies |
| | June 30, 2024 (Unaudited) |
Not applicable for this reporting period.
| Semi-Annual Report | June 30, 2024 | 27 |
| X-Square Balanced Fund | Item 10 – Remuneration Paid to Trustees, Officers, and Others of Open-End Management Investment Companies |
| | June 30, 2024 (Unaudited) |
Included under Item 7 in the Notes to Financial Statements.
The following chart provides certain information about the Trustee fees paid by the Fund for the period ended June 30, 2024:
| | | Aggregate Regular
Compensation From
the Trust | | | Aggregate Special
Compensation From
the Trust | | | Total Compensation
From the Trust | |
| Ramon Ponte | | $ | 6,000 | | | $ | – | | | $ | 6,000 | |
| Denisse Rodriguez | | $ | 6,000 | | | $ | – | | | $ | 6,000 | |
| Luis R. Roig Hosta | | $ | 6,000 | | | $ | – | | | $ | 6,000 | |
| Total | | $ | 18,000 | | | $ | – | | | $ | 18,000 | |
| X-Square Balanced Fund | Item 11 – Statement Regarding Basis for Approval of Investment Advisory Contract |
| | June 30, 2024 (Unaudited) |
Not applicable for this reporting period.
| Semi-Annual Report | June 30, 2024 | 29 |

| Item 8. | Changes in and Disagreements with Accountants for Open-End Management Investment Companies. |
None.
| Item 9. | Proxy Disclosures for Open-End Management Investment Companies. |
None.
| Item 10. | Remuneration Paid to Directors, Officers, and Others of Open-End Management Investment Companies. |
Remuneration Paid to Directors, Officers, and Others is included as part of the Financial Statements and Financial Highlights filed under Item 7 of this report.
| Item 11. | Statement Regarding Basis for Approval of Investment Advisory Contract. |
Not applicable to Registrant during the reporting period.
| Item 12. | Disclosure of Proxy Voting Policies and Procedures for Closed-End Management Investment Companies. |
Not applicable to Registrant.
| Item 13. | Portfolio Managers of Closed-End Management Investment Companies. |
Not applicable to Registrant.
| Item 14. | Purchases of Equity Securities by Closed-End Management Investment Company and Affiliated Purchasers. |
Not applicable to Registrant.
| Item 15. | Submission of Matters to Vote of Security Holders. |
There have been no material changes to the procedures by which shareholders may recommend nominees to the Registrant’s Board of Managers, where those changes were implemented after the Registrant last provided disclosure in response to the requirements of Item 407(c)(2) of Regulation S-K, or this Item.
| Item 16. | Controls and Procedures. |
| | (a) | The Registrant’s principal executive officer and principal financial officer have concluded that the Registrant’s disclosure controls and procedures (as defined in Rule 30a-3(c) under the Investment Company Act of 1940, as amended) are effective based on their evaluation of these controls and procedures as of a date within 90 days of the filing date of this report. |
| | (b) | There was no change in the Registrant's internal control over financial reporting (as defined in Rule 30a-3(d) under the Investment Company Act of 1940, as amended) during the period covered by this report that has materially affected, or is reasonably likely to materially affect, the Registrant's internal control over financial reporting. |
| Item 17. | Disclosure of Securities Lending Activities for Closed-end Management Investment Companies. |
Not applicable to Registrant.
| Item 18. | Recovery of Erroneously Awarded Compensation. |
| | (a)(1) | Not applicable to semi-annual report. |
| | (a)(2) | Not applicable to semi-annual report. |
SIGNATURES
Pursuant to the requirements of the Securities Exchange Act of 1934 and the Investment Company Act of 1940, the Registrant has duly caused this Report to be signed on its behalf by the undersigned, thereunto duly authorized.
| | X-Square Balanced Fund, LLC |
| | | |
| | By: | /s/ Ignacio Canto |
| | | Ignacio Canto |
| | | Principal Executive Officer/President |
| | | |
| | Date: | September 5, 2024 |
Pursuant to the requirements of the Securities Exchange Act of 1934 and the Investment Company Act of 1940, this Report has been signed below on behalf of the Registrant and in the capacities and on the dates indicated.
| | X-Square Balanced Fund, LLC |
| | | |
| | By: | /s/ Cristina Perez |
| | | Cristina Perez |
| | | Principal Financial Officer/Treasurer |
| | | |
| | Date: | September 5, 2024 |