Third Quarter 2021 Earnings Supplemental Angel Oak Mortgage, Inc.
Table of Contents 2 AOMR Overview 5 Third Quarter 2021 Earnings Results 7 Book Value 8 Securitization and Funding Update 9 Portfolio Overview 10 Investment Highlights 12 Appendix: Financial Statements 13
Important Notices 3 References in this presentation to “we,” “us,” “our,” “AOMR” and the “Company” refer to Angel Oak Mortgage, Inc., a Maryland corporation, its operating partnership and their respective subsidiaries; the term “Manager” refers to Falcons I, LLC, our external manager; the term “Angel Oak Capital” refers to Angel Oak Capital Advisors, LLC; the term “Angel Oak Mortgage Lending” refers collectively to Angel Oak Mortgage Solutions, Angel Oak Home Loans and Angel Oak Commercial Lending; the term “Angel Oak Mortgage Solutions” refers to Angel Oak Mortgage Solutions LLC; the term “Angel Oak Home Loans” refers to Angel Oak Home Loans LLC; the term “Angel Oak Commercial Lending” refers to Angel Oak Commercial Lending, LLC, Angel Oak Prime Bridge, Angel Oak Commercial Bridge and Cherrywood Mortgage; the term “Angel Oak Prime Bridge” refers to Angel Oak Prime Bridge, LLC; the term “Angel Oak Commercial Bridge” refers to Angel Oak Commercial Bridge, LLC; and the term “Cherrywood Mortgage” refers to Cherrywood Mortgage, LLC; the term “Angel Oak” refers collectively to Angel Oak Capital and its affiliates, including our Manager; and the term “AOMT” refers to Angel Oak Mortgage Trust I, LLC, Angel Oak’s securitization platform, including its subsidiaries and affiliates. This presentation has been prepared by the Company solely for your information and may not be reproduced or redistributed, in whole or in part, to any other person. The information contained in this presentation is provided to you as a summary as of the date of this presentation and is subject to change without notice. The Company does not undertake any obligation to update this presentation to reflect actual events, circumstances or changes in expectations. This presentation was prepared based upon information believed to be reliable. However, the Company does not make any representation or warranty with regard to the accuracy or completeness of the information herein and some of such information was obtained from published sources or other third parties without independent verification. This presentation contains certain forward-looking statements that are subject to various risks and uncertainties, including, without limitation, statements relating to the performance of our investments. Forward-looking statements are generally identifiable by use of forward-looking terminology such as “may,” “will,” “should,” “potential,” “intend,” “expect,” “endeavor,” “seek,” “anticipate,” “estimate,” “believe,” “could,” “project,” “predict,” “continue” or by the negative of these words and phrases or other similar words or expressions. Forward-looking statements are based on certain assumptions, discuss future expectations, describe existing or future plans and strategies, contain projections of results of operations, liquidity and/or financial condition or state other forward-looking information. Our ability to predict future events or conditions or their impact or the actual effect of existing or future plans or strategies is inherently uncertain, in particular due to the uncertainties created by the COVID-19 pandemic, including the projected impact of the COVID-19 pandemic on our business, financial results and performance. Although we believe that such forward-looking statements are based on reasonable assumptions, actual results and performance in the future could differ materially from those set forth in or implied by such forward-looking statements. Factors that could have a material adverse effect on future results and performance relative to those set forth in or implied by the related forward-looking statements, as well as on our business, financial condition, liquidity, results of operations and prospects, include, but are not limited to (see next page):

Important Notices 4 the severity and duration of the COVID-19 pandemic, actions that have been taken and may be taken in the future by governmental authorities to contain the COVID-19 outbreak, including variants and resurgences thereof, or to mitigate its impact and the adverse impacts that the COVID-19 pandemic has had, and may continue to have, on the global economy and on our business, financial results and performance; the effects of adverse conditions or developments in the financial markets and the economy upon our ability to acquire non-QM loans sourced from Angel Oak’s proprietary mortgage lending platform, Angel Oak Mortgage Lending, and other target assets; the level and volatility of prevailing interest rates and credit spreads; changes in our industry, interest rates, the debt or equity markets, the general economy (or in specific regions) or the residential real estate finance and the real estate markets specifically; changes in our business strategies or target assets; general volatility of the markets in which we invest; changes in the availability of attractive loan and other investment opportunities, including non-QM loans sourced from Angel Oak Mortgage Lending platforms; the ability of our Manager to locate suitable investments for us, manage our portfolio, and implement our strategy; our ability to obtain and maintain financing arrangements on favorable terms, or at all; the adequacy of collateral securing our investments and a decline in the fair value of our investments; the timing of cash flows, if any, from our investments; our ability to profitably execute securitization transactions; the operating performance, liquidity, and financial condition of borrowers; increased rates of default and/or decreased recovery rates on our investments; changes in prepayment rates on our investments; the departure of any of the members of senior management of the Company, our Manager, or Angel Oak; the availability of qualified personnel; conflicts with Angel Oak, including our Manager, and its personnel, including our officers, and entities managed by Angel Oak; events, contemplated or otherwise, such as acts of God, including hurricanes, earthquakes, and other natural disasters, pandemics, acts of war and/or terrorism and others that may cause unanticipated and uninsured performance declines and/or losses to us or the owners and operators of the real estate securing our investments; impact of and changes in governmental regulations, tax laws and rates, accounting principles and policies and similar matters; the level of governmental involvement in the U.S. mortgage market; future changes with respect to government-sponsored enterprises (i.e., Fannie Mae or Freddie Mac) and related events, including the lack of certainty as to the future roles of these entities and the U.S. Government in the mortgage market and changes to legislation and regulations affecting these entities; effects of hedging instruments on our target assets and our returns, and the degree to which our hedging strategies may or may not protect us from interest rate volatility; our ability to make distributions to our stockholders in the future at the level contemplated by our stockholders or the market generally, or at all; our ability to qualify and maintain our qualification as a real estate investment trust for U.S. federal income tax purposes; and our ability to maintain our exclusion from regulation as an investment company under the Investment Company Act of 1940, as amended. Readers are cautioned not to place undue reliance on any of these forward-looking statements, which reflect our management’s views only as of the date of this presentation. Actual results and performance may differ materially from those set forth in or implied by our forward-looking statements. New risks and uncertainties arise over time, and it is not possible for us to predict those events or how they may affect us. Except as required by applicable law, we assume no obligation, and do not intend to, update or otherwise revise any of our forward-looking statements, whether as a result of new information, future events or otherwise.
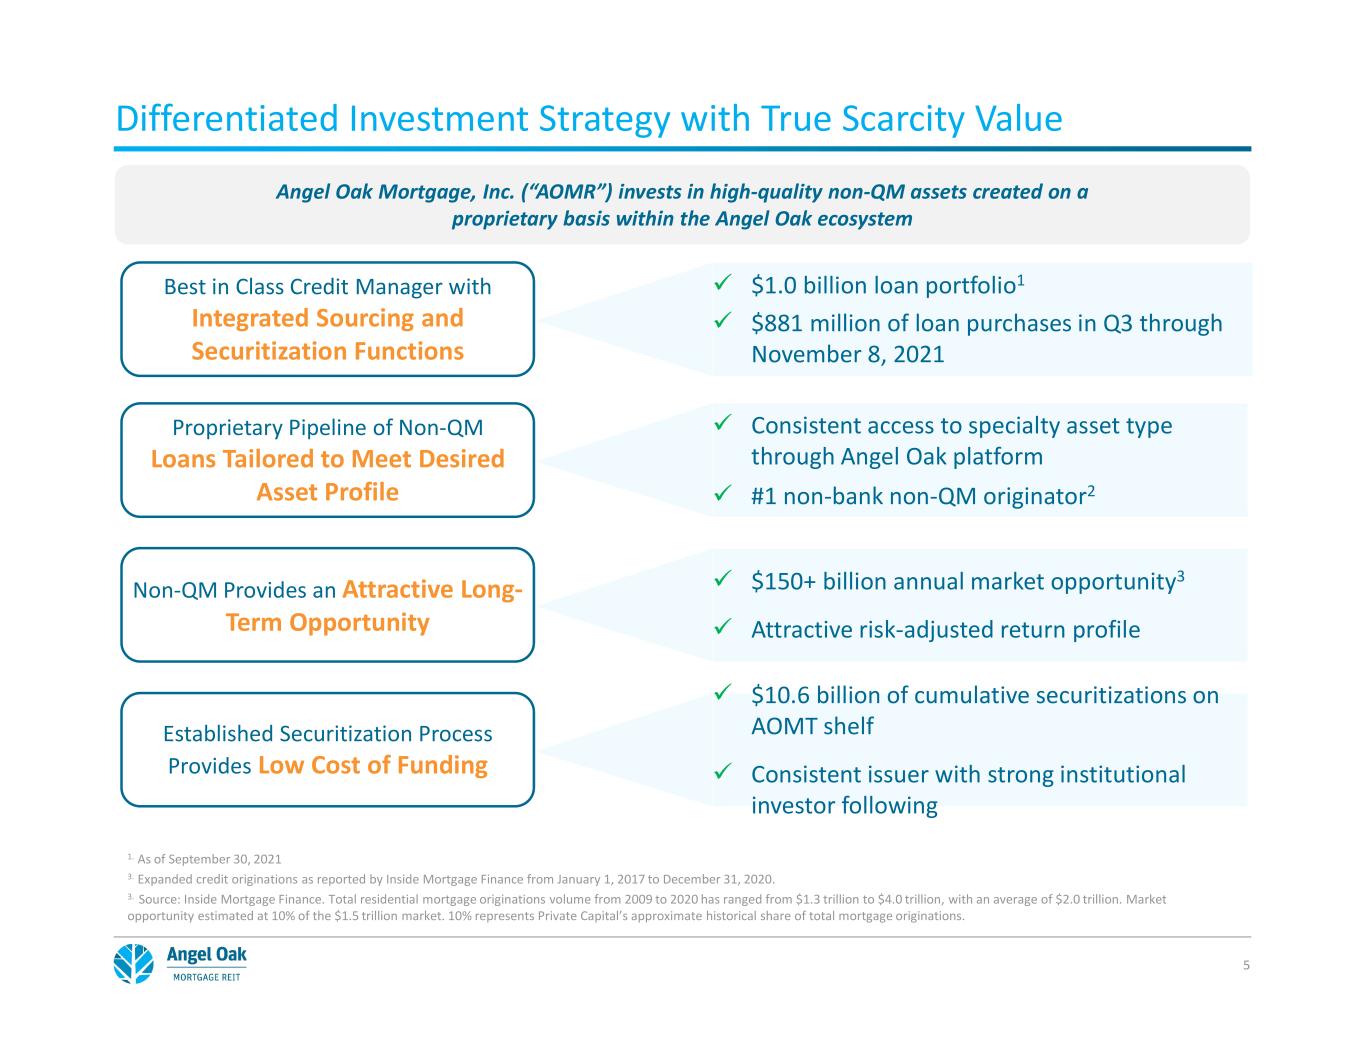
Differentiated Investment Strategy with True Scarcity Value 5 Angel Oak Mortgage, Inc. (“AOMR”) invests in high-quality non-QM assets created on a proprietary basis within the Angel Oak ecosystem Best in Class Credit Manager with Integrated Sourcing and Securitization Functions $1.0 billion loan portfolio1 $881 million of loan purchases in Q3 through November 8, 2021 Proprietary Pipeline of Non-QM Loans Tailored to Meet Desired Asset Profile Consistent access to specialty asset type through Angel Oak platform #1 non-bank non-QM originator2 Non-QM Provides an Attractive Long- Term Opportunity $150+ billion annual market opportunity3 Attractive risk-adjusted return profile Established Securitization Process Provides Low Cost of Funding $10.6 billion of cumulative securitizations on AOMT shelf Consistent issuer with strong institutional investor following 1. As of September 30, 2021 3. Expanded credit originations as reported by Inside Mortgage Finance from January 1, 2017 to December 31, 2020. 3. Source: Inside Mortgage Finance. Total residential mortgage originations volume from 2009 to 2020 has ranged from $1.3 trillion to $4.0 trillion, with an average of $2.0 trillion. Market opportunity estimated at 10% of the $1.5 trillion market. 10% represents Private Capital’s approximate historical share of total mortgage originations.
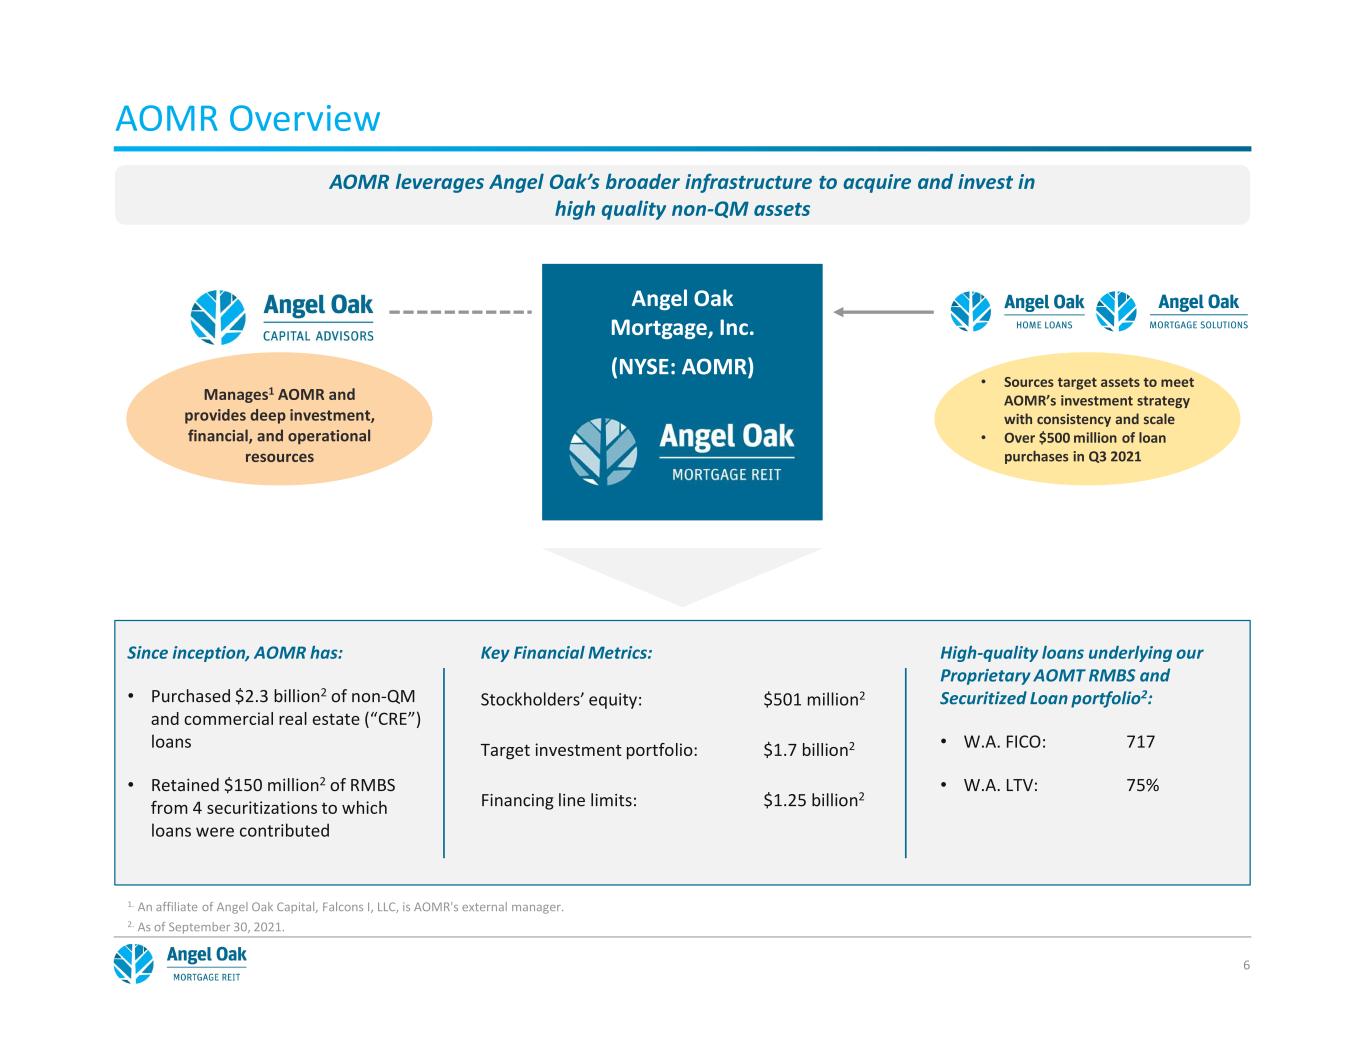
AOMR Overview AOMR leverages Angel Oak’s broader infrastructure to acquire and invest in high quality non-QM assets 6 Since inception, AOMR has: • Purchased $2.3 billion2 of non-QM and commercial real estate (“CRE”) loans • Retained $150 million2 of RMBS from 4 securitizations to which loans were contributed Key Financial Metrics: Stockholders’ equity: $501 million2 Target investment portfolio: $1.7 billion2 Financing line limits: $1.25 billion2 High-quality loans underlying our Proprietary AOMT RMBS and Securitized Loan portfolio2: • W.A. FICO: 717 • W.A. LTV: 75% Angel Oak Mortgage, Inc. (NYSE: AOMR) Manages1 AOMR and provides deep investment, financial, and operational resources 1. An affiliate of Angel Oak Capital, Falcons I, LLC, is AOMR's external manager. 2. As of September 30, 2021. • Sources target assets to meet AOMR’s investment strategy with consistency and scale • Over $500 million of loan purchases in Q3 2021
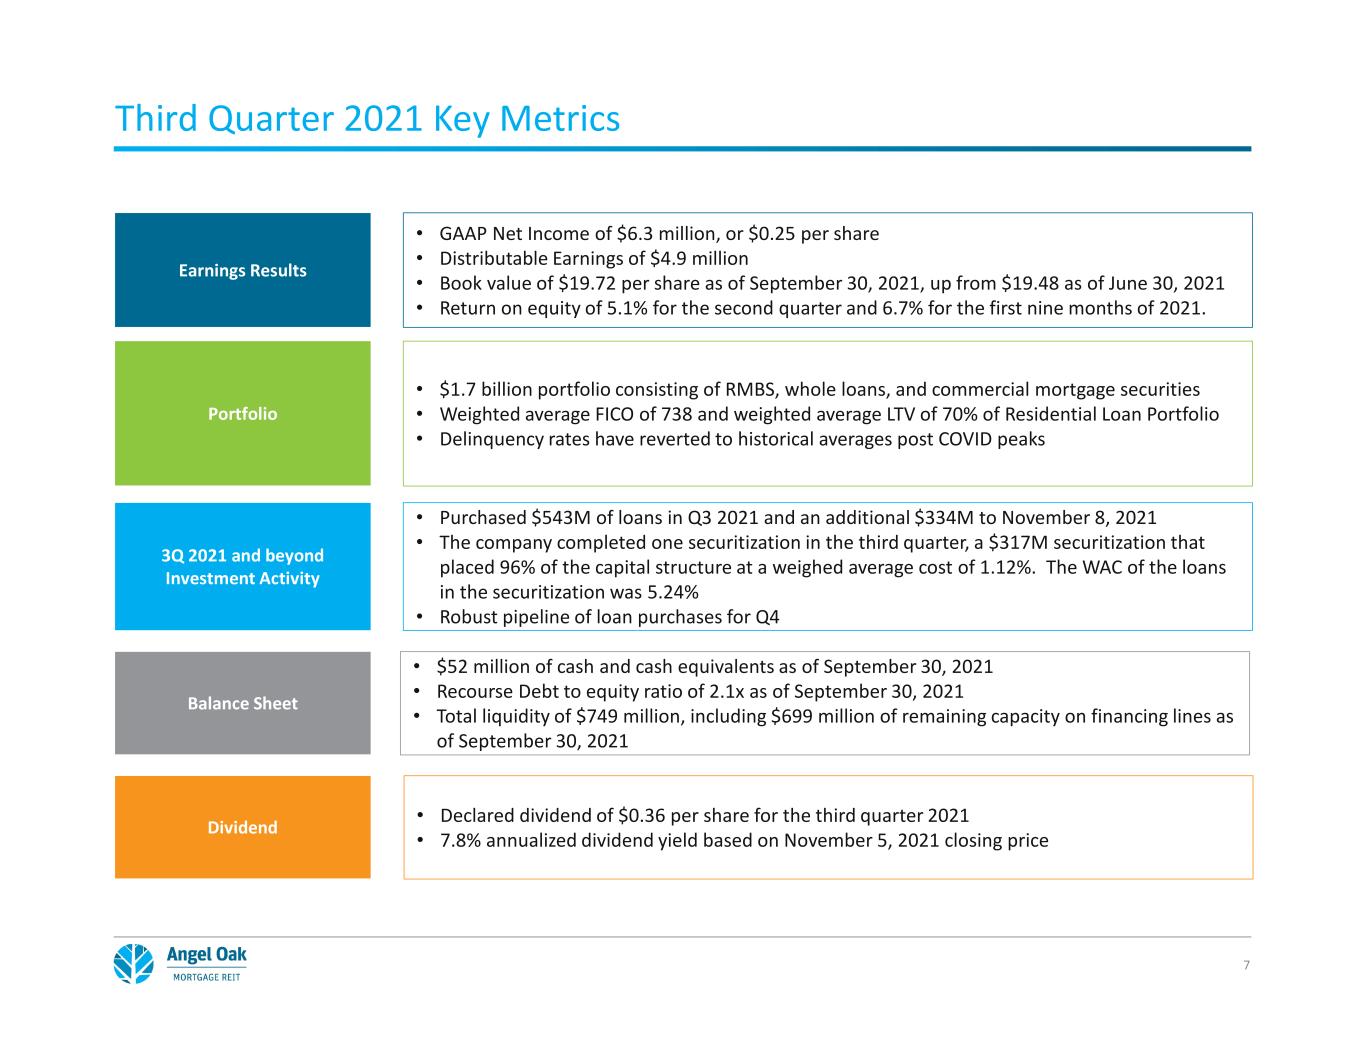
Third Quarter 2021 Key Metrics • GAAP Net Income of $6.3 million, or $0.25 per share • Distributable Earnings of $4.9 million • Book value of $19.72 per share as of September 30, 2021, up from $19.48 as of June 30, 2021 • Return on equity of 5.1% for the second quarter and 6.7% for the first nine months of 2021. • $52 million of cash and cash equivalents as of September 30, 2021 • Recourse Debt to equity ratio of 2.1x as of September 30, 2021 • Total liquidity of $749 million, including $699 million of remaining capacity on financing lines as of September 30, 2021 • Purchased $543M of loans in Q3 2021 and an additional $334M to November 8, 2021 • The company completed one securitization in the third quarter, a $317M securitization that placed 96% of the capital structure at a weighed average cost of 1.12%. The WAC of the loans in the securitization was 5.24% • Robust pipeline of loan purchases for Q4 • $1.7 billion portfolio consisting of RMBS, whole loans, and commercial mortgage securities • Weighted average FICO of 738 and weighted average LTV of 70% of Residential Loan Portfolio • Delinquency rates have reverted to historical averages post COVID peaks • Declared dividend of $0.36 per share for the third quarter 2021 • 7.8% annualized dividend yield based on November 5, 2021 closing price 7 3Q 2021 and beyond Investment Activity Portfolio Dividend Earnings Results Balance Sheet
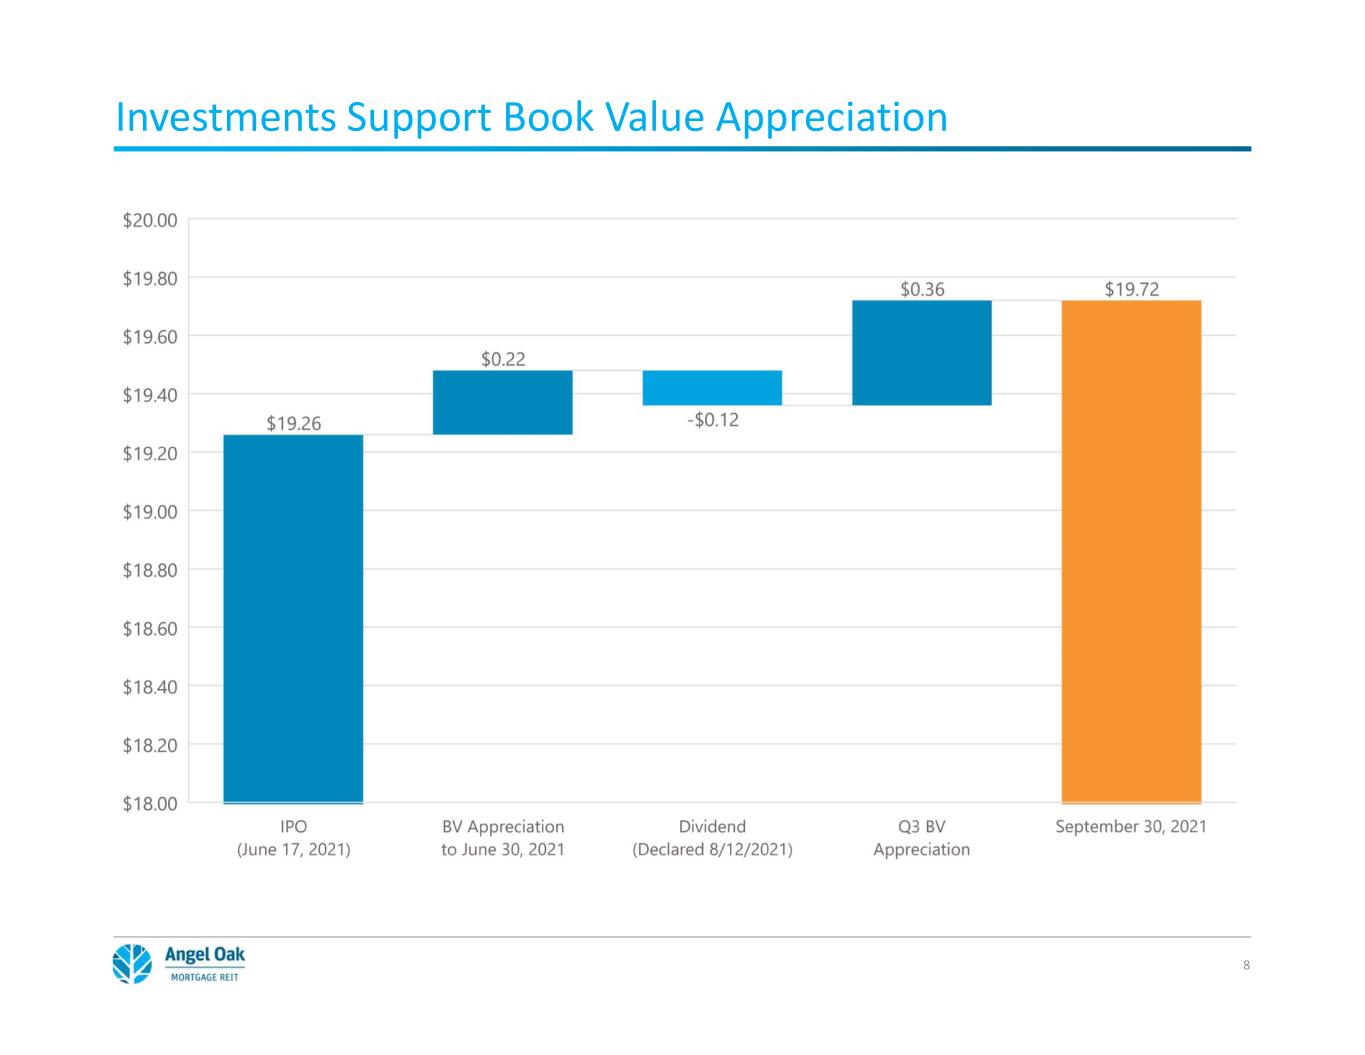
Investments Support Book Value Appreciation 8

Securitization and Funding Strategy 9 Securitization Date Amount WA Cost of Funding WA Credit Score WA LTV WA DTI Senior Tranche Credit Rating AOMR 2021-4 8/25/2021 $316.6M 1.12% 739 73.8% 33.3% AAA (Fitch) AAA (Kroll) Completed one securitization in Q3 2021 totaling $316.6 million Expanded loan financing facilities in Q3 2021 by $450 million to $1.25B Facility Lender Borrowing Capacity Advance Rate Maturity Pricing MTM Terms Nomura $300M 65%-85% Aug. 2022 Base: 3-month LIBOR+ 1.70% - 3.50% FV MTM Banc of California $50M 75%-97% Mar. 2022 Base: 1-month LIBOR+ 2.50% - 3.13% Non-MTM for 12 Months Deutsche Bank $250M 60%-92% Feb. 2022 Base: 1-month LIBOR+ 2.00% - 3.25% FV MTM Goldman Sachs $200M 75%-85% Mar. 2022 Base: 3-month LIBOR+ 2.25% FV MTM Veritex Community Bank $50M 80%-93% Aug. 2023 Base: 1-month LIBOR+ 2.30%-3.13% Non-MTM Barclays $400M 87%-92% Sept. 2022 Base: 1- or 3-month LIBOR+ (asset dependent) 1.70%-3.50% FV MTM Total $1,250M
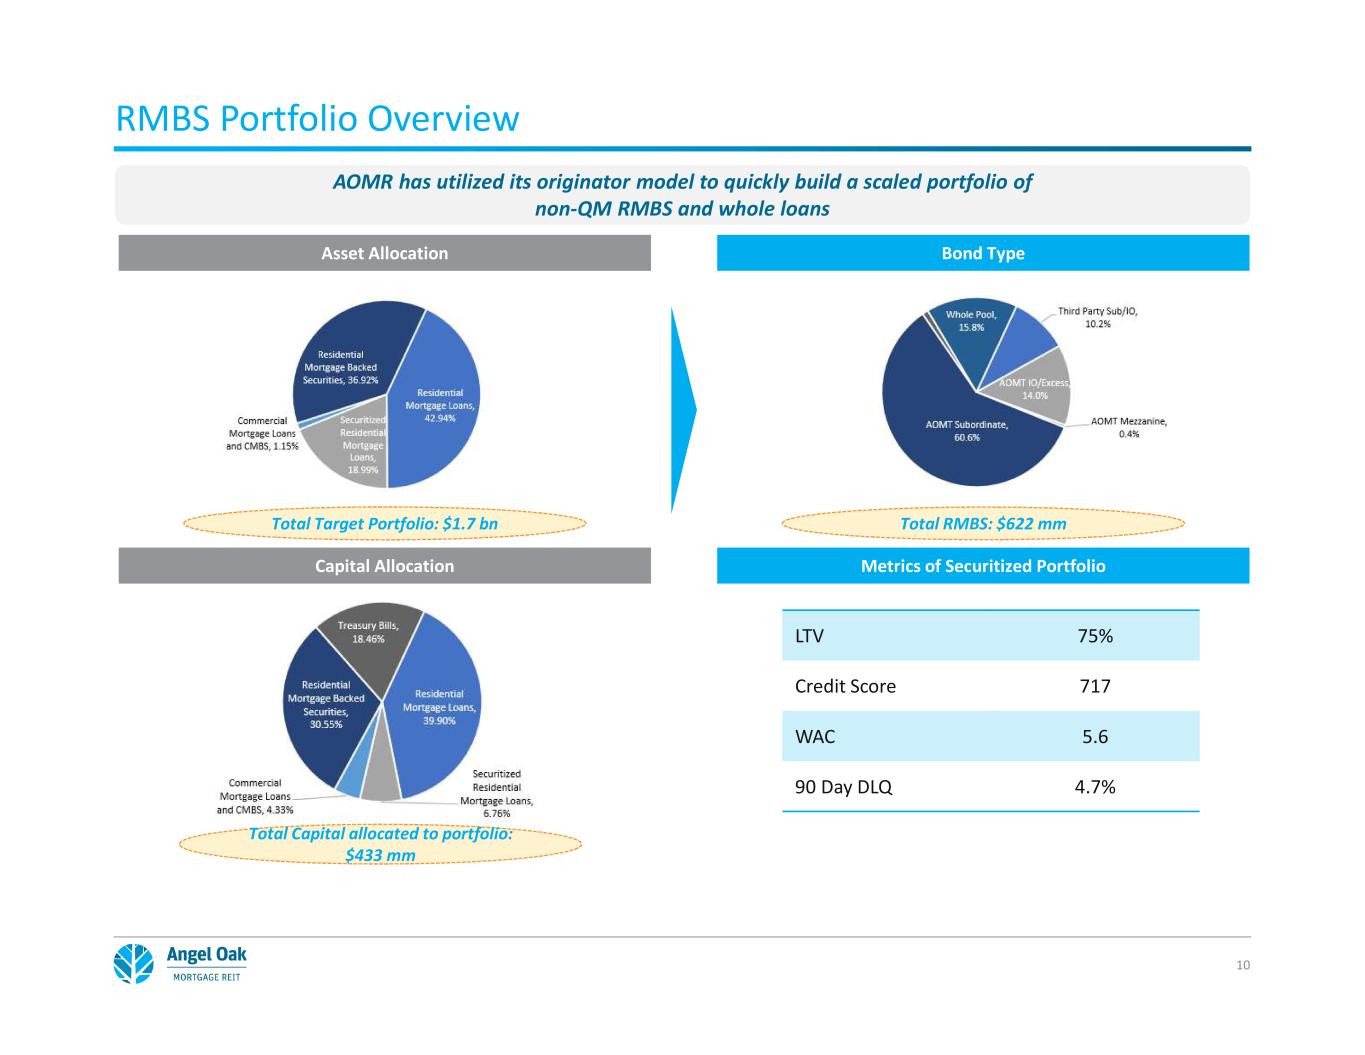
RMBS Portfolio Overview 10 Asset Allocation Total Target Portfolio: $1.7 bn AOMR has utilized its originator model to quickly build a scaled portfolio of non-QM RMBS and whole loans Total RMBS: $622 mm Bond Type Metrics of Securitized PortfolioCapital Allocation Total Capital allocated to portfolio: $433 mm LTV 75% Credit Score 717 WAC 5.6 90 Day DLQ 4.7%

Whole Loan Portfolio Overview 11 Portfolio Range Portfolio Weighted Average Unpaid principal balance (“UPB”) $29 - $3,535 $415 Interest rate 2.75% - 9.88% 4.74% Maturity date 1/1/2038 - 9/1/2061 6/16/2051 FICO score at loan origination 521 - 823 738 LTV at loan origination 39% - 90% 70% DTI at loan origination 1.60% - 50.48% 32% Percentage of first lien loans N/A 99.94% Percentage of loans 90+ days delinquent (based on UPB) N/A 1.39% (As of September 30, 2021) Other 37% CA 30% FL 20% TX 7% GA 6% Characteristics of Residential Mortgage Loan Portfolio as of September 30, 2021
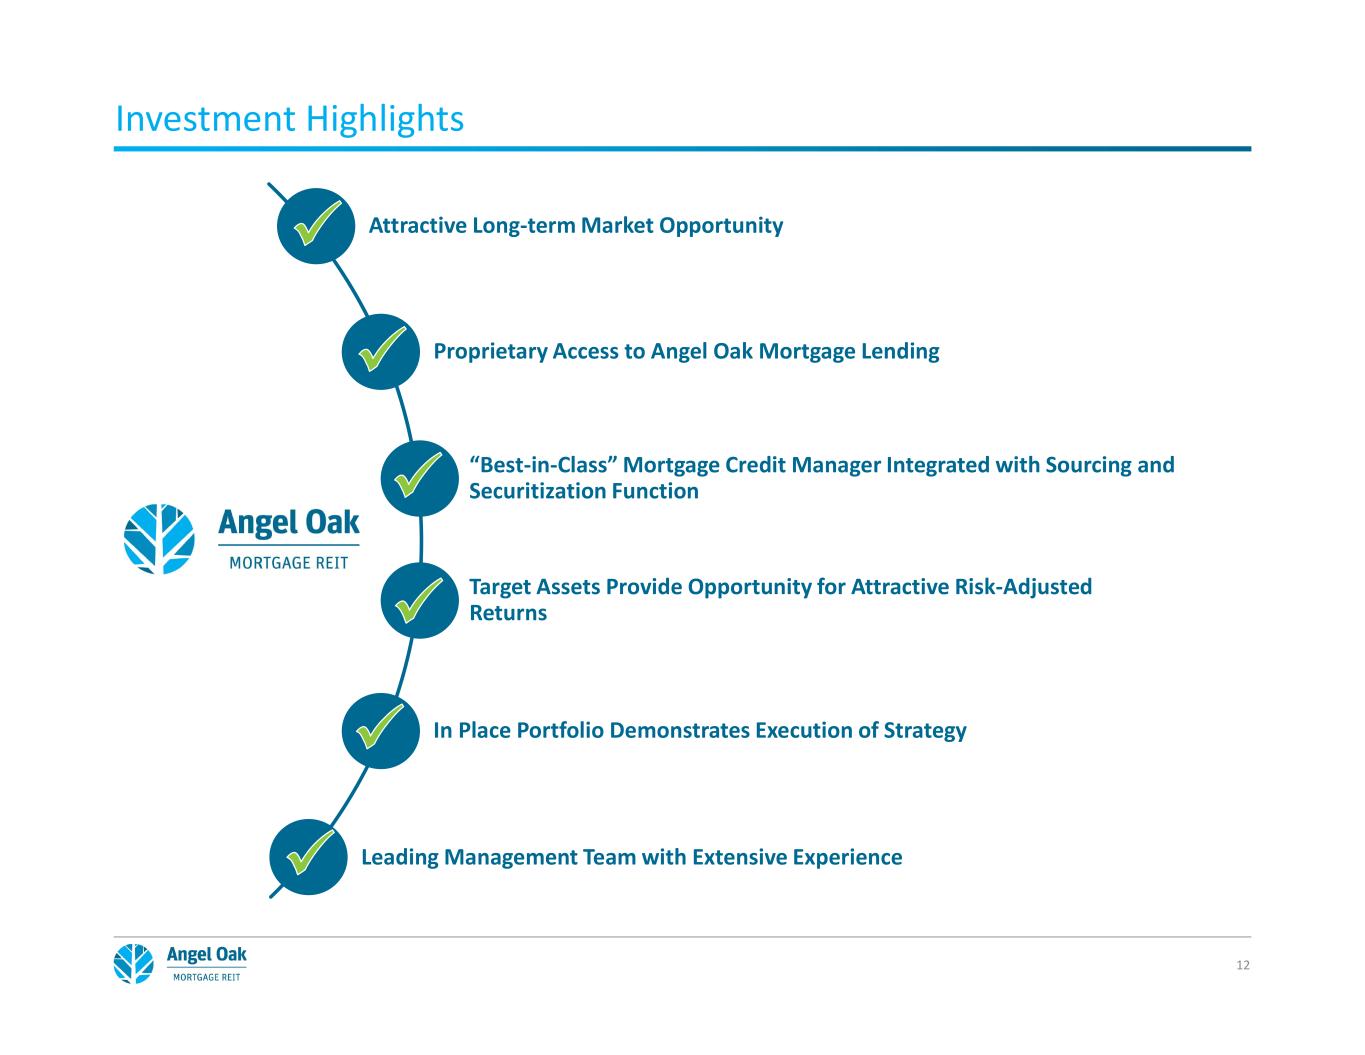
Proprietary Access to Angel Oak Mortgage Lending In Place Portfolio Demonstrates Execution of Strategy “Best-in-Class” Mortgage Credit Manager Integrated with Sourcing and Securitization Function Leading Management Team with Extensive Experience Target Assets Provide Opportunity for Attractive Risk-Adjusted Returns Investment Highlights Attractive Long-term Market Opportunity 12
Appendix 13
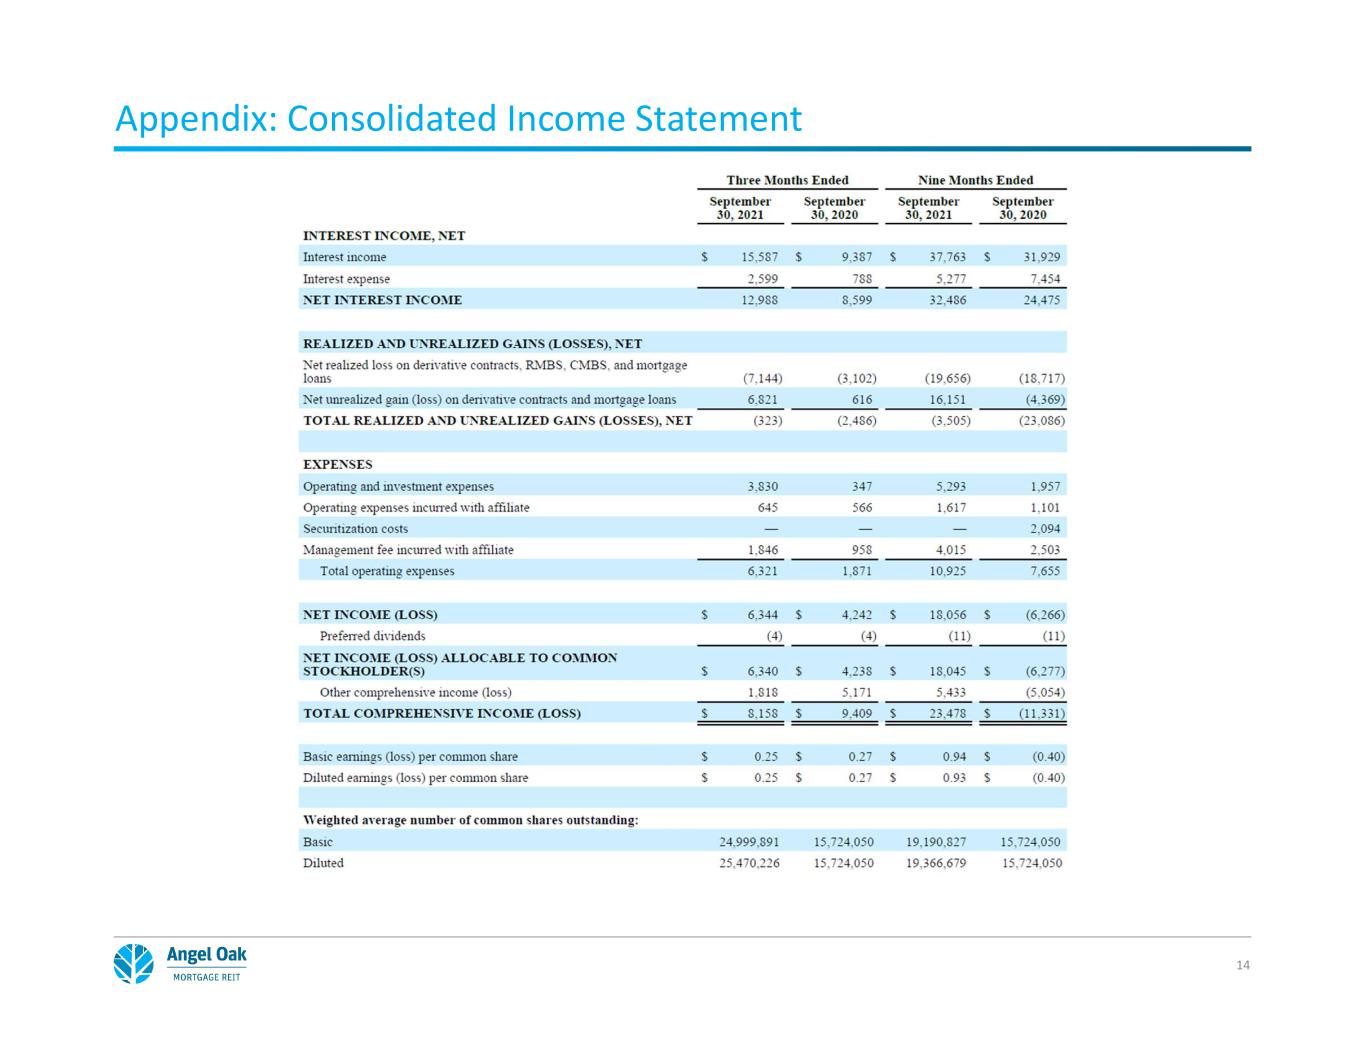
Appendix: Consolidated Income Statement 14
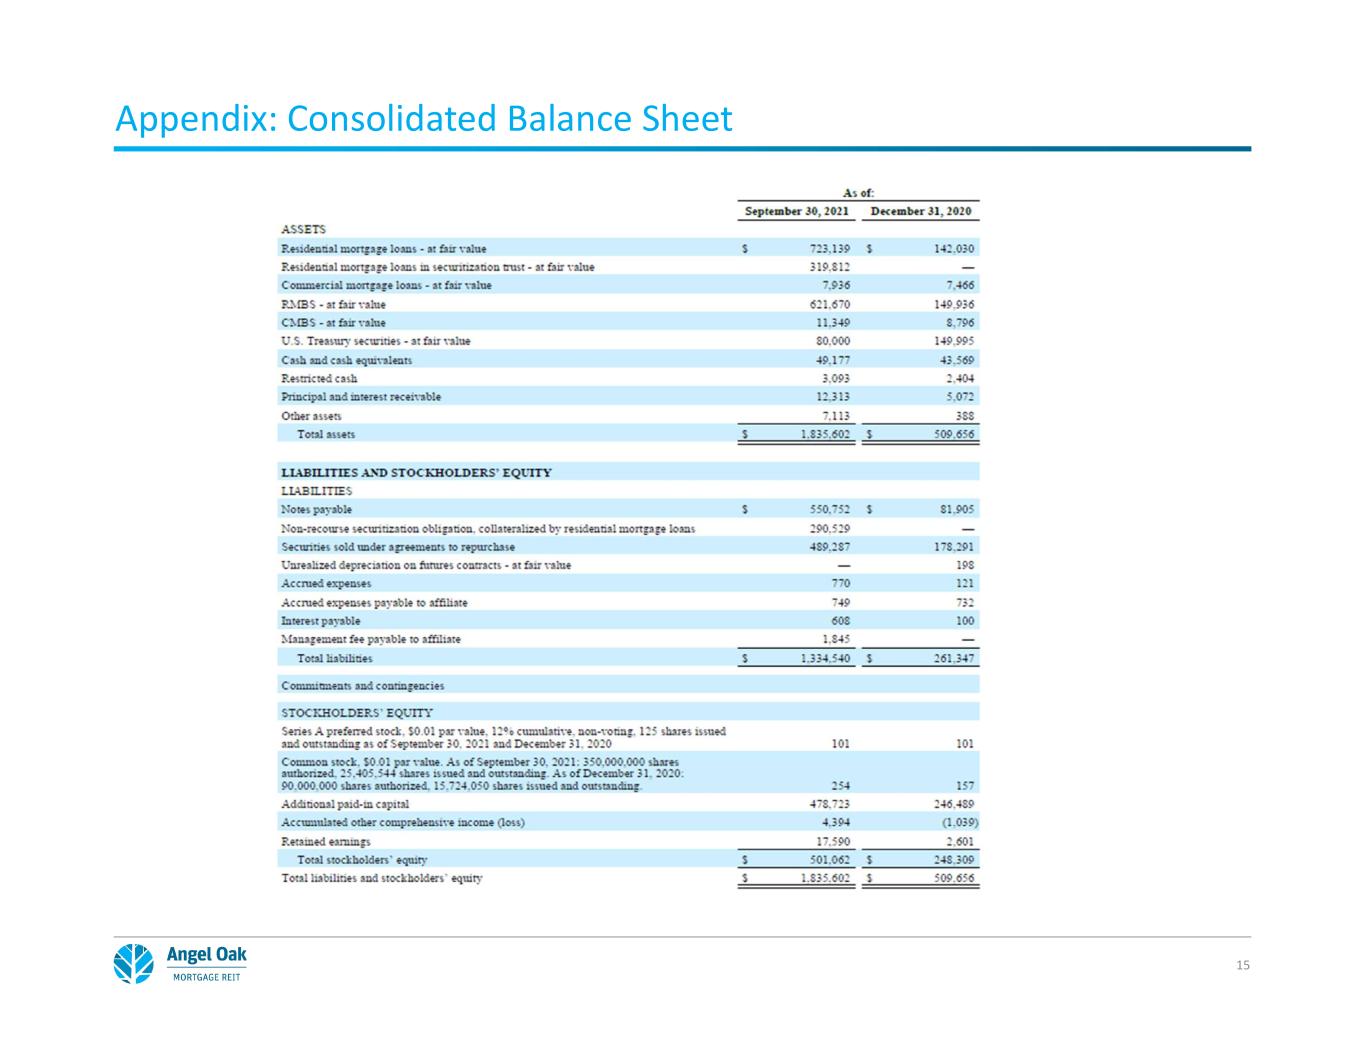
Appendix: Consolidated Balance Sheet 15
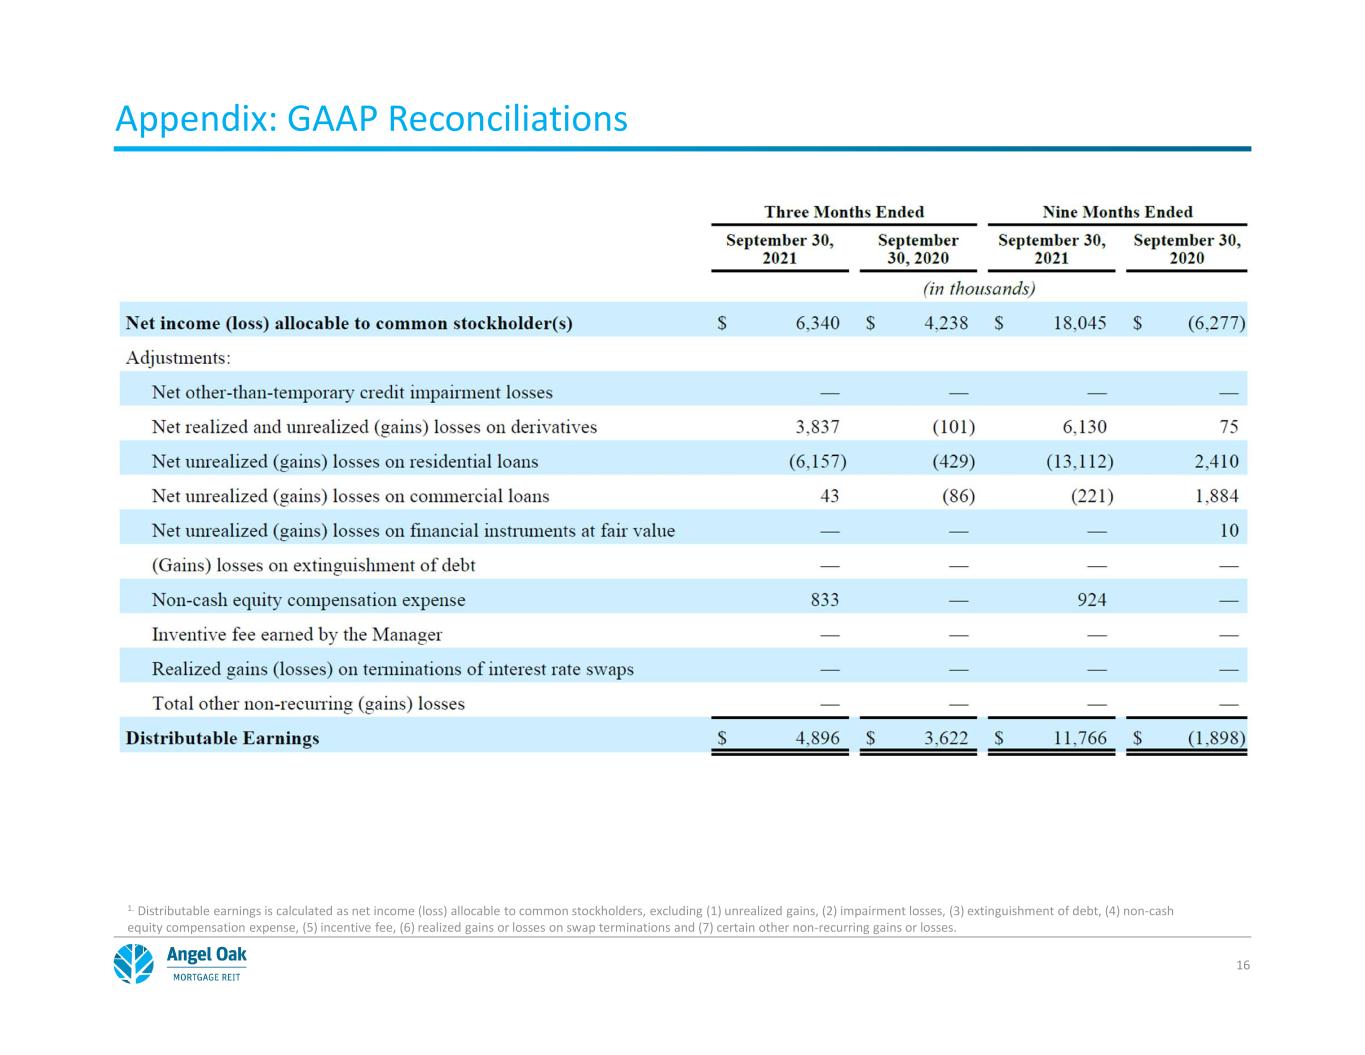
Appendix: GAAP Reconciliations 16 1. Distributable earnings is calculated as net income (loss) allocable to common stockholders, excluding (1) unrealized gains, (2) impairment losses, (3) extinguishment of debt, (4) non-cash equity compensation expense, (5) incentive fee, (6) realized gains or losses on swap terminations and (7) certain other non-recurring gains or losses.


