Q3 FISCAL 2019 LETTER TO SHAREHOLDERS DECEMBER 9, 2019 CHEWY, INC. | LETTER TO SHAREHOLDERS 1

‘TIS THE SEASON FOR PETS We love pets! Our four-legged (and two-legged, no- legged, feathery, and everything in between) family members enrich our lives and bring us joy every day of the year, especially during the holidays. At Chewy, our little elves are working extra hard to make sure pet parents find everything they want and everything they need for their pets this time of year. This holiday season, Our Holly Jolly Holiday Shop provides our customers an amazing selection of gifts and great deals that are sure to spread joy and cheer. From splurge-worthy pet tech to cold-weather apparel and themed toys and treats, Chewy delivers must-have gifts that pets (and pet parents) are sure to love! OUR MISSION To be the most trusted and convenient online destination for pet parents everywhere. CHEWY, INC. | LETTER TO SHAREHOLDERS 2
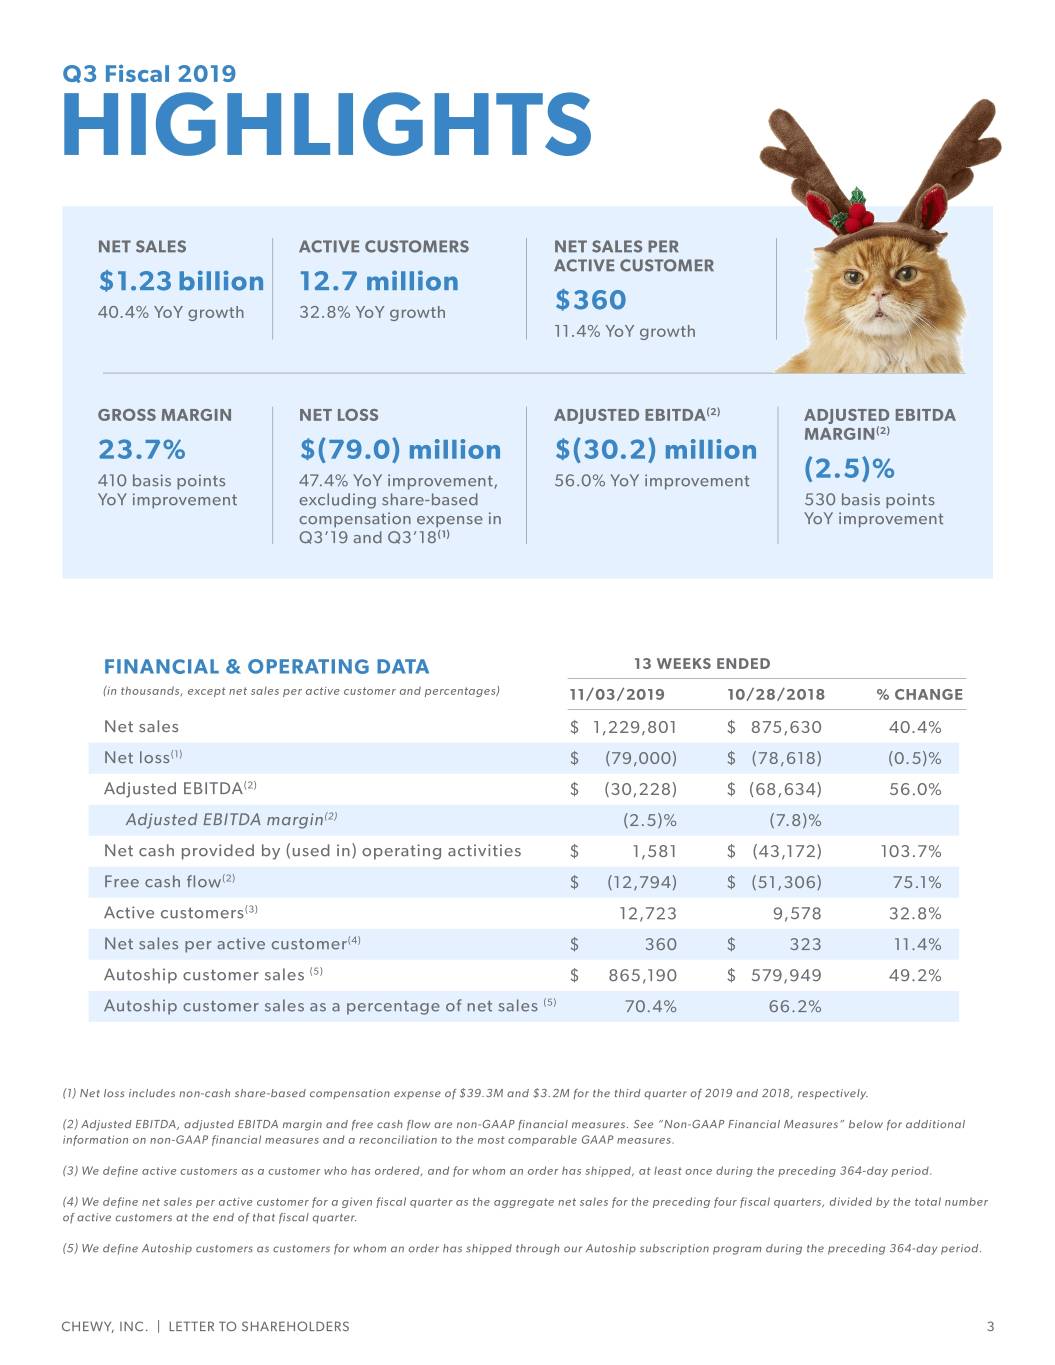
Q3 Fiscal 2019 HIGHLIGHTS NET SALES ACTIVE CUSTOMERS NET SALES PER ACTIVE CUSTOMER $1.23 billion 12.7 million 40.4% YoY growth 32.8% YoY growth $360 11.4% YoY growth GROSS MARGIN NET LOSS ADJUSTED EBITDA(2) ADJUSTED EBITDA MARGIN(2) 23.7% $(79.0) million $(30.2) million 410 basis points 47.4% YoY improvement, 56.0% YoY improvement (2.5)% YoY improvement excluding share-based 530 basis points compensation expense in YoY improvement Q3’19 and Q3’18(1) FINANCIAL & OPERATING DATA 13 WEEKS ENDED (in thousands, except net sales per active customer and percentages) 11/03/2019 10/28/2018 % CHANGE Net sales $ 1,229,801 $ 875,630 40.4% Net loss(1) $ (79,000) $ (78,618) (0.5)% Adjusted EBITDA(2) $ (30,228) $ (68,634) 56.0% Adjusted EBITDA margin(2) (2.5)% (7.8)% Net cash provided by (used in) operating activities $ 1,581 $ (43,172) 103.7% Free cash flow(2) $ (12,794) $ (51,306) 75.1% Active customers(3) 12,723 9,578 32.8% Net sales per active customer(4) $ 360 $ 323 11.4% Autoship customer sales (5) $ 865,190 $ 579,949 49.2% Autoship customer sales as a percentage of net sales (5) 70.4% 66.2% (1) Net loss includes non-cash share-based compensation expense of $39.3M and $3.2M for the third quarter of 2019 and 2018, respectively. (2) Adjusted EBITDA, adjusted EBITDA margin and free cash flow are non-GAAP financial measures. See “Non-GAAP Financial Measures” below for additional information on non-GAAP financial measures and a reconciliation to the most comparable GAAP measures. (3) We define active customers as a customer who has ordered, and for whom an order has shipped, at least once during the preceding 364-day period. (4) We define net sales per active customer for a given fiscal quarter as the aggregate net sales for the preceding four fiscal quarters, divided by the total number of active customers at the end of that fiscal quarter. (5) We define Autoship customers as customers for whom an order has shipped through our Autoship subscription program during the preceding 364-day period. CHEWY, INC. | LETTER TO SHAREHOLDERS 3

DEAR SHAREHOLDER, We are pleased to share our results for the third quarter ended November 3, 2019. We again delivered strong year- over-year growth in net sales, while improving gross and adjusted EBITDA margin: • Net sales of $1.23 billion, an increase of 40% year-over-year • Gross margin of 23.7%, improved 410 basis points year-over-year • Adjusted EBITDA margin of (2.5%), improved 530 basis points year-over-year Chewy’s mission is to be the most trusted and convenient online destination for pet parents everywhere. We believe we are positively transforming the industry with a superior value proposition that keeps our customers at the center of everything we do, from our high-touch customer service, to our broad assortment of brands, to delivering on the core tenets of ecommerce of speed and convenience. We are maniacally focused on providing a truly unique and personalized shopping experience that builds trust, brand loyalty, and drives repeat purchasing. CHEWY, INC. | LETTER TO SHAREHOLDERS 4
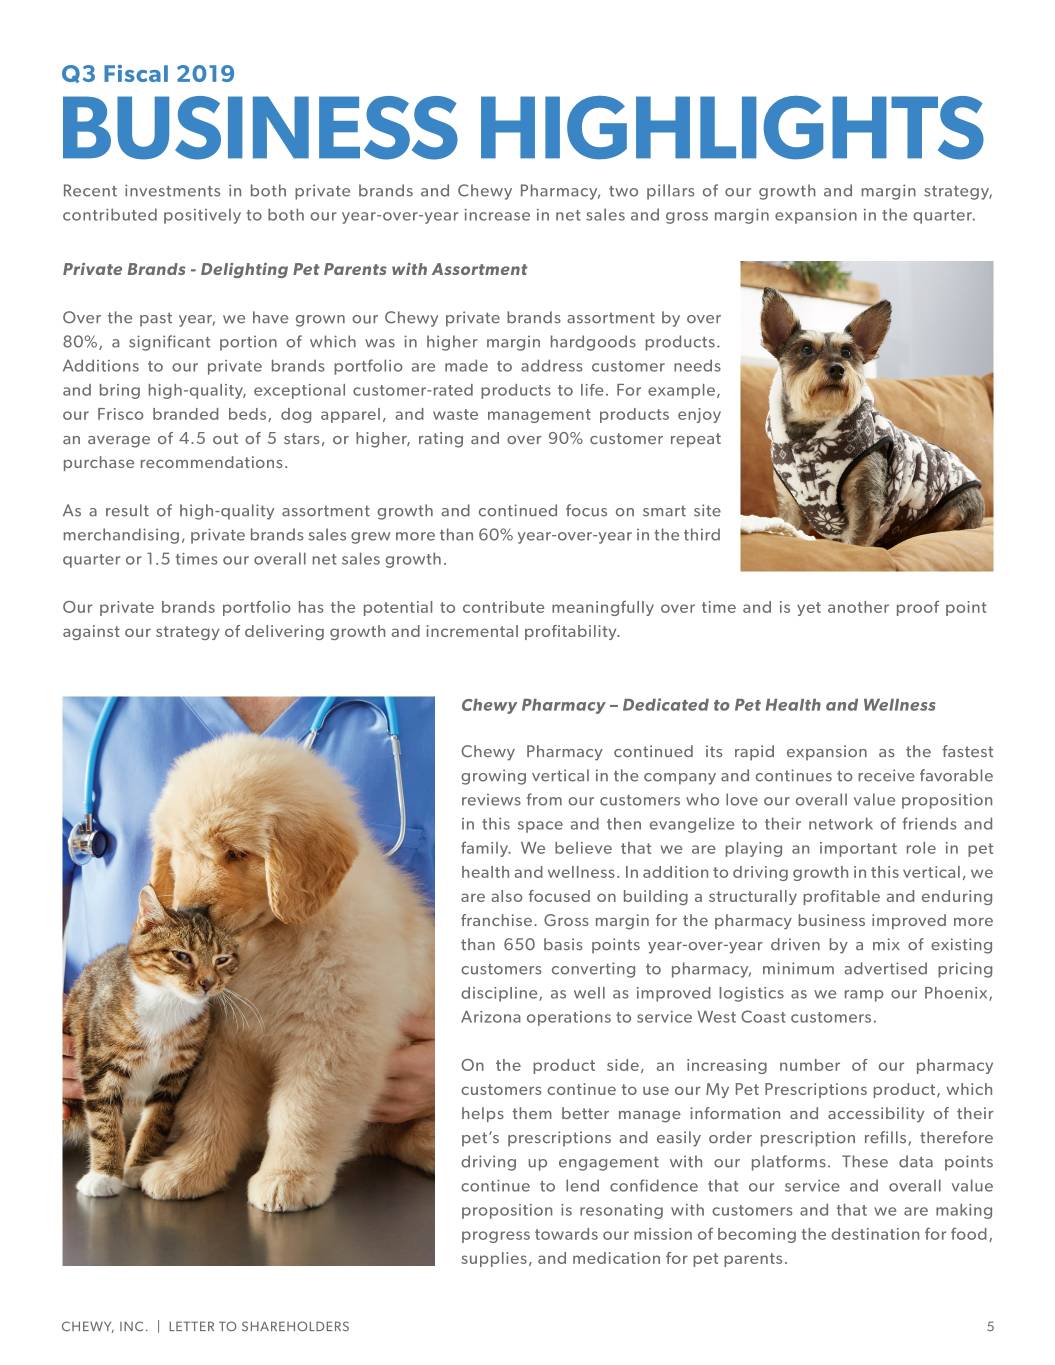
Q3 Fiscal 2019 BUSINESS HIGHLIGHTS Recent investments in both private brands and Chewy Pharmacy, two pillars of our growth and margin strategy, contributed positively to both our year-over-year increase in net sales and gross margin expansion in the quarter. Private Brands - Delighting Pet Parents with Assortment Over the past year, we have grown our Chewy private brands assortment by over 80%, a significant portion of which was in higher margin hardgoods products. Additions to our private brands portfolio are made to address customer needs and bring high-quality, exceptional customer-rated products to life. For example, our Frisco branded beds, dog apparel, and waste management products enjoy an average of 4.5 out of 5 stars, or higher, rating and over 90% customer repeat purchase recommendations. As a result of high-quality assortment growth and continued focus on smart site merchandising, private brands sales grew more than 60% year-over-year in the third quarter or 1.5 times our overall net sales growth. Our private brands portfolio has the potential to contribute meaningfully over time and is yet another proof point against our strategy of delivering growth and incremental profitability. Chewy Pharmacy – Dedicated to Pet Health and Wellness Chewy Pharmacy continued its rapid expansion as the fastest growing vertical in the company and continues to receive favorable reviews from our customers who love our overall value proposition in this space and then evangelize to their network of friends and family. We believe that we are playing an important role in pet health and wellness. In addition to driving growth in this vertical, we are also focused on building a structurally profitable and enduring franchise. Gross margin for the pharmacy business improved more than 650 basis points year-over-year driven by a mix of existing customers converting to pharmacy, minimum advertised pricing discipline, as well as improved logistics as we ramp our Phoenix, Arizona operations to service West Coast customers. On the product side, an increasing number of our pharmacy customers continue to use our My Pet Prescriptions product, which helps them better manage information and accessibility of their pet’s prescriptions and easily order prescription refills, therefore driving up engagement with our platforms. These data points continue to lend confidence that our service and overall value proposition is resonating with customers and that we are making progress towards our mission of becoming the destination for food, supplies, and medication for pet parents. CHEWY, INC. | LETTER TO SHAREHOLDERS 5
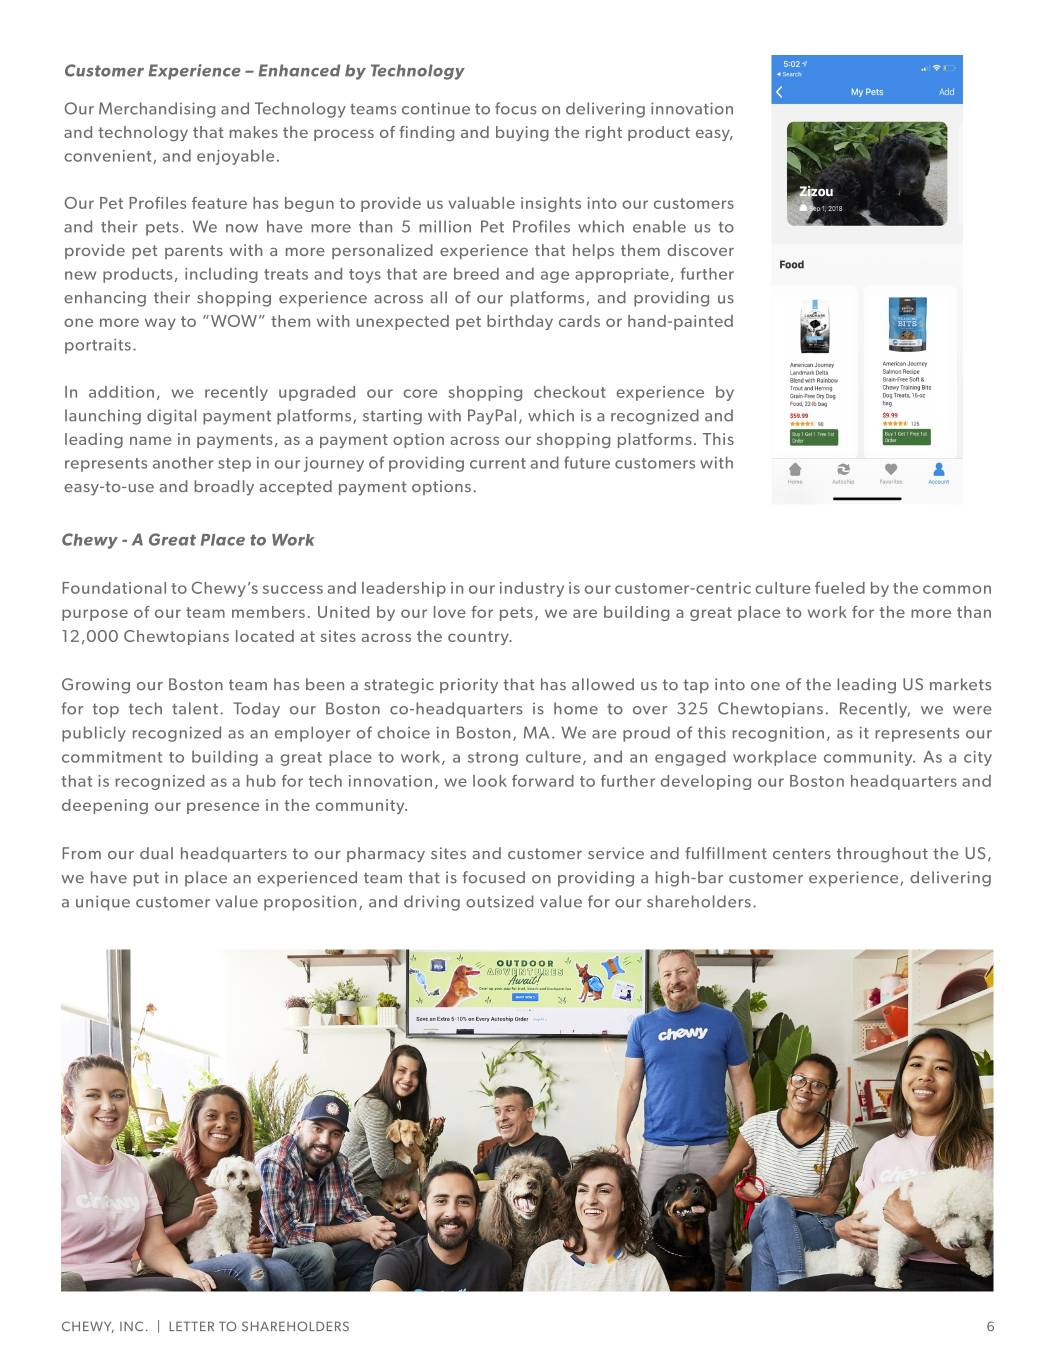
Customer Experience – Enhanced by Technology Our Merchandising and Technology teams continue to focus on delivering innovation and technology that makes the process of finding and buying the right product easy, convenient, and enjoyable. Our Pet Profiles feature has begun to provide us valuable insights into our customers and their pets. We now have more than 5 million Pet Profiles which enable us to provide pet parents with a more personalized experience that helps them discover new products, including treats and toys that are breed and age appropriate, further enhancing their shopping experience across all of our platforms, and providing us one more way to “WOW” them with unexpected pet birthday cards or hand-painted portraits. In addition, we recently upgraded our core shopping checkout experience by launching digital payment platforms, starting with PayPal, which is a recognized and leading name in payments, as a payment option across our shopping platforms. This represents another step in our journey of providing current and future customers with easy-to-use and broadly accepted payment options. Chewy - A Great Place to Work Foundational to Chewy’s success and leadership in our industry is our customer-centric culture fueled by the common purpose of our team members. United by our love for pets, we are building a great place to work for the more than 12,000 Chewtopians located at sites across the country. Growing our Boston team has been a strategic priority that has allowed us to tap into one of the leading US markets for top tech talent. Today our Boston co-headquarters is home to over 325 Chewtopians. Recently, we were publicly recognized as an employer of choice in Boston, MA. We are proud of this recognition, as it represents our commitment to building a great place to work, a strong culture, and an engaged workplace community. As a city that is recognized as a hub for tech innovation, we look forward to further developing our Boston headquarters and deepening our presence in the community. From our dual headquarters to our pharmacy sites and customer service and fulfillment centers throughout the US, we have put in place an experienced team that is focused on providing a high-bar customer experience, delivering a unique customer value proposition, and driving outsized value for our shareholders. CHEWY, INC. | LETTER TO SHAREHOLDERS 6

Seasonal Celebrations – Category Expansion This year we launched a fully coordinated Holiday Shop which provides a broad yet personalized selection of holiday products for every type of pet and pet parent. The holidays provide us an opportunity to expand our assortment and category depth in our most popular seasonal categories of holiday toys, treats, costumes and apparel, and particularly in hardgoods and our private brands. For example, this year we launched seasonal toys and dog beds as part of our private label brand, Frisco, and have already seen a positive customer response to these newly launched categories. To further support our holistic assortment, we implemented an integrated marketing approach to amplify visibility of our holiday shop through a combination of smart and well thought out social media, email, on-site, and digital tactics. We also enhanced our recommendation engine, leveraging our vast amount of data to make better and more targeted product suggestions. This strategy, which we designed to be even more deliberate this year given the shorter holiday calendar, has been well received by our new and existing customers. We are thrilled that Black Friday and Cyber Monday were record setting days, with Cyber Monday being the single biggest shopping day in our company’s history. CHEWY, INC. | LETTER TO SHAREHOLDERS 7
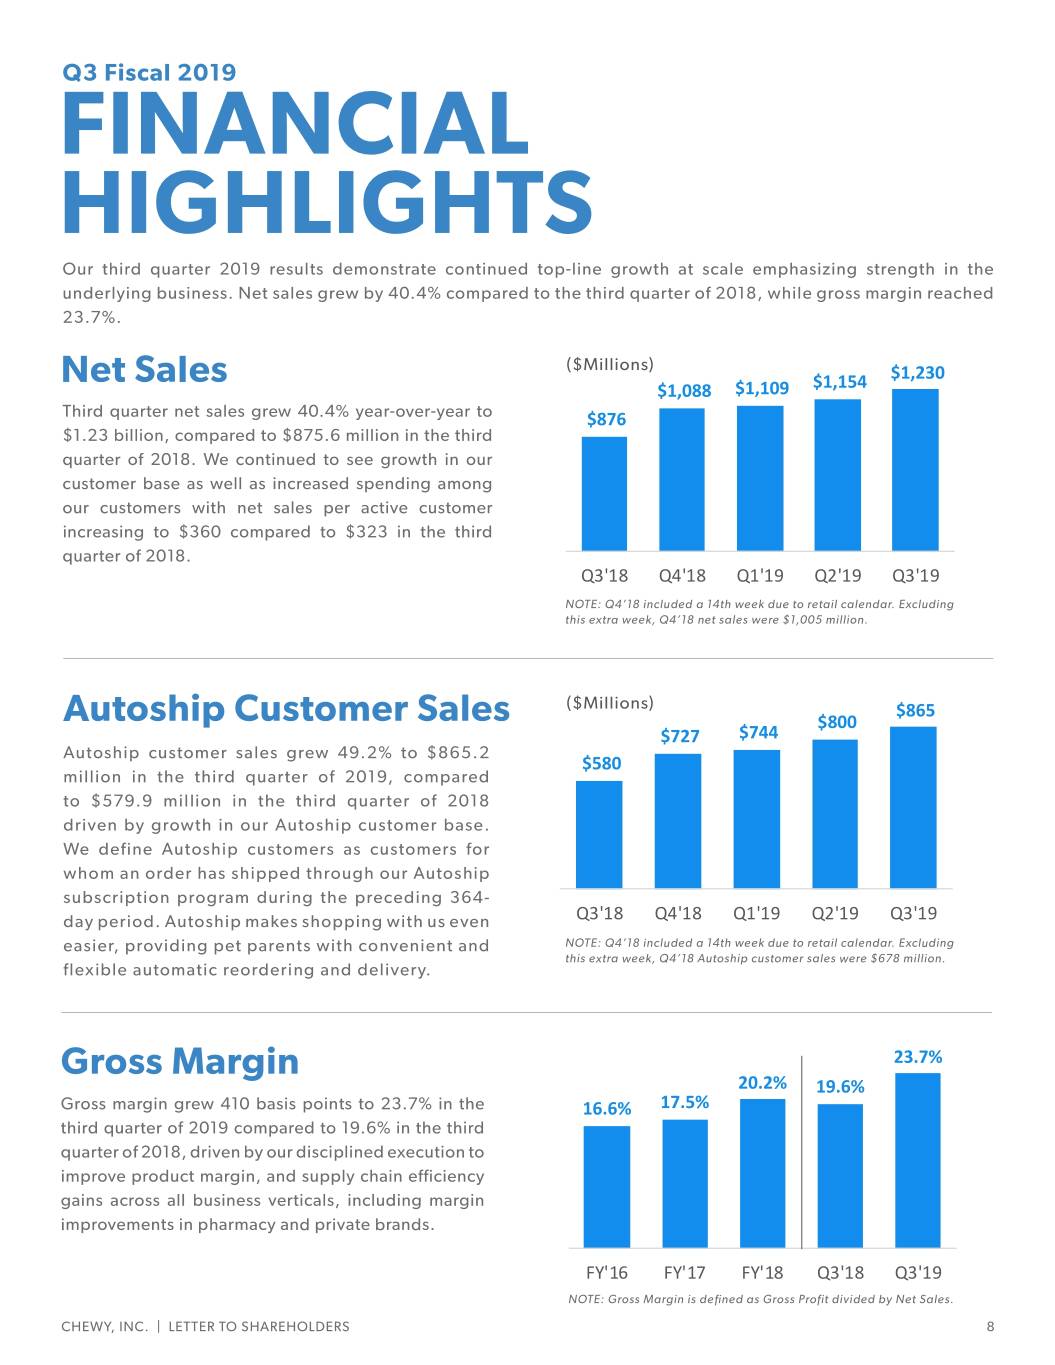
Q3 Fiscal 2019 FINANCIAL HIGHLIGHTS Our third quarter 2019 results demonstrate continued top-line growth at scale emphasizing strength in the underlying business. Net sales grew by 40.4% compared to the third quarter of 2018, while gross margin reached 23.7%. Net Sales ($Millions) ($Millions) Net Sales $1,230 $1,088 $1,109 $1,154 Third quarter net sales grew 40.4% year-over-year to $876 $1.23 billion, compared to $875.6 million in the third quarter of 2018. We continued to see growth in our customer base as well as increased spending among our customers with net sales per active customer increasing to $360 compared to $323 in the third quarter of 2018. Q3'18 Q4'18 Q1'19 Q2'19 Q3'19 NOTE: Q4’18 included a 14th week due to retail calendar. Excluding this extra week, Q4’18 net sales were $1,005 million. Autoship Customer Sales ($Millions) ($Millions) $865 Autoship Customer Sales $800 $727 $744 Autoship customer sales grew 49.2% to $865.2 $580 million in the third quarter of 2019, compared to $579.9 million in the third quarter of 2018 driven by growth in our Autoship customer base. We define Autoship customers as customers for whom an order has shipped through our Autoship subscription program during the preceding 364- day period. Autoship makes shopping with us even Q3'18 Q4'18 Q1'19 Q2'19 Q3'19 easier, providing pet parents with convenient and NOTE: Q4’18 included a 14th week due to retail calendar. Excluding this extra week, Q4’18 Autoship customer sales were $678 million. flexible automatic reordering and delivery. Gross Margin Gross Margin 23.7% 20.2% 19.6% Gross margin grew 410 basis points to 23.7% in the 16.6% 17.5% third quarter of 2019 compared to 19.6% in the third quarter of 2018, driven by our disciplined execution to improve product margin, and supply chain efficiency gains across all business verticals, including margin improvements in pharmacy and private brands. FY'16 FY'17 FY'18 Q3'18 Q3'19 NOTE: Gross Margin is defined as Gross Profit divided by Net Sales. CHEWY, INC. | LETTER TO SHAREHOLDERS 8
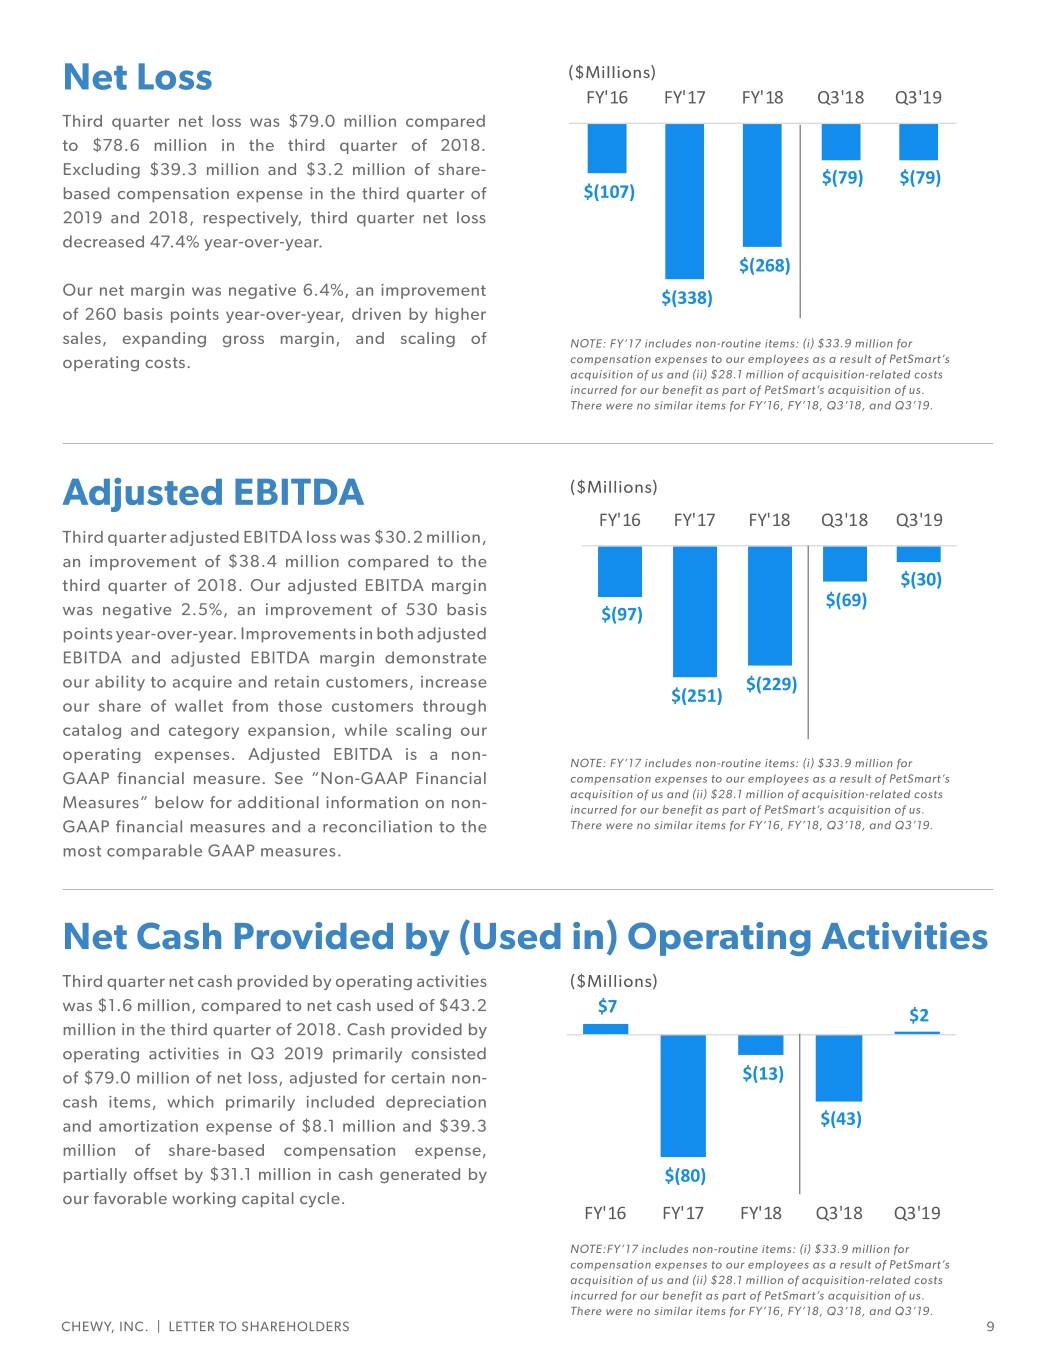
Net Loss ($Millions) Net Loss ($Millions) FY'16 FY'17 FY'18 Q3'18 Q3'19 Third quarter net loss was $79.0 million compared to $78.6 million in the third quarter of 2018. Excluding $39.3 million and $3.2 million of share- $(79) $(79) based compensation expense in the third quarter of $(107) 2019 and 2018, respectively, third quarter net loss decreased 47.4% year-over-year. $(268) Our net margin was negative 6.4%, an improvement $(338) of 260 basis points year-over-year, driven by higher sales, expanding gross margin, and scaling of NOTE: FY’17 includes non-routine items: (i) $33.9 million for operating costs. compensation expenses to our employees as a result of PetSmart’s acquisition of us and (ii) $28.1 million of acquisition-related costs incurred for our benefit as part of PetSmart’s acquisition of us. There were no similar items for FY’16, FY’18, Q3’18, and Q3’19. Adjusted EBITDA ($Millions) Adjusted EBITDA ($Millions) FY'16 FY'17 FY'18 Q3'18 Q3'19 Third quarter adjusted EBITDA loss was $30.2 million, an improvement of $38.4 million compared to the third quarter of 2018. Our adjusted EBITDA margin $(30) $(69) was negative 2.5%, an improvement of 530 basis $(97) points year-over-year. Improvements in both adjusted EBITDA and adjusted EBITDA margin demonstrate our ability to acquire and retain customers, increase $(229) our share of wallet from those customers through $(251) catalog and category expansion, while scaling our operating expenses. Adjusted EBITDA is a non- NOTE: FY’17 includes non-routine items: (i) $33.9 million for GAAP financial measure. See “Non-GAAP Financial compensation expenses to our employees as a result of PetSmart’s acquisition of us and (ii) $28.1 million of acquisition-related costs Measures” below for additional information on non- incurred for our benefit as part of PetSmart’s acquisition of us. GAAP financial measures and a reconciliation to the There were no similar items for FY’16, FY’18, Q3’18, and Q3’19. most comparable GAAP measures. Net Cash Provided by (Used in) Operating Activities Net Cash From Operations Third quarter net cash provided by operating activities ($Millions) was $1.6 million, compared to net cash used of $43.2 $7 $2 million in the third quarter of 2018. Cash provided by operating activities in Q3 2019 primarily consisted of $79.0 million of net loss, adjusted for certain non- $(13) cash items, which primarily included depreciation and amortization expense of $8.1 million and $39.3 $(43) million of share-based compensation expense, partially offset by $31.1 million in cash generated by $(80) our favorable working capital cycle. FY'16 FY'17 FY'18 Q3'18 Q3'19 NOTE:FY’17 includes non-routine items: (i) $33.9 million for compensation expenses to our employees as a result of PetSmart’s acquisition of us and (ii) $28.1 million of acquisition-related costs incurred for our benefit as part of PetSmart’s acquisition of us. There were no similar items for FY’16, FY’18, Q3’18, and Q3’19. CHEWY, INC. | LETTER TO SHAREHOLDERS 9
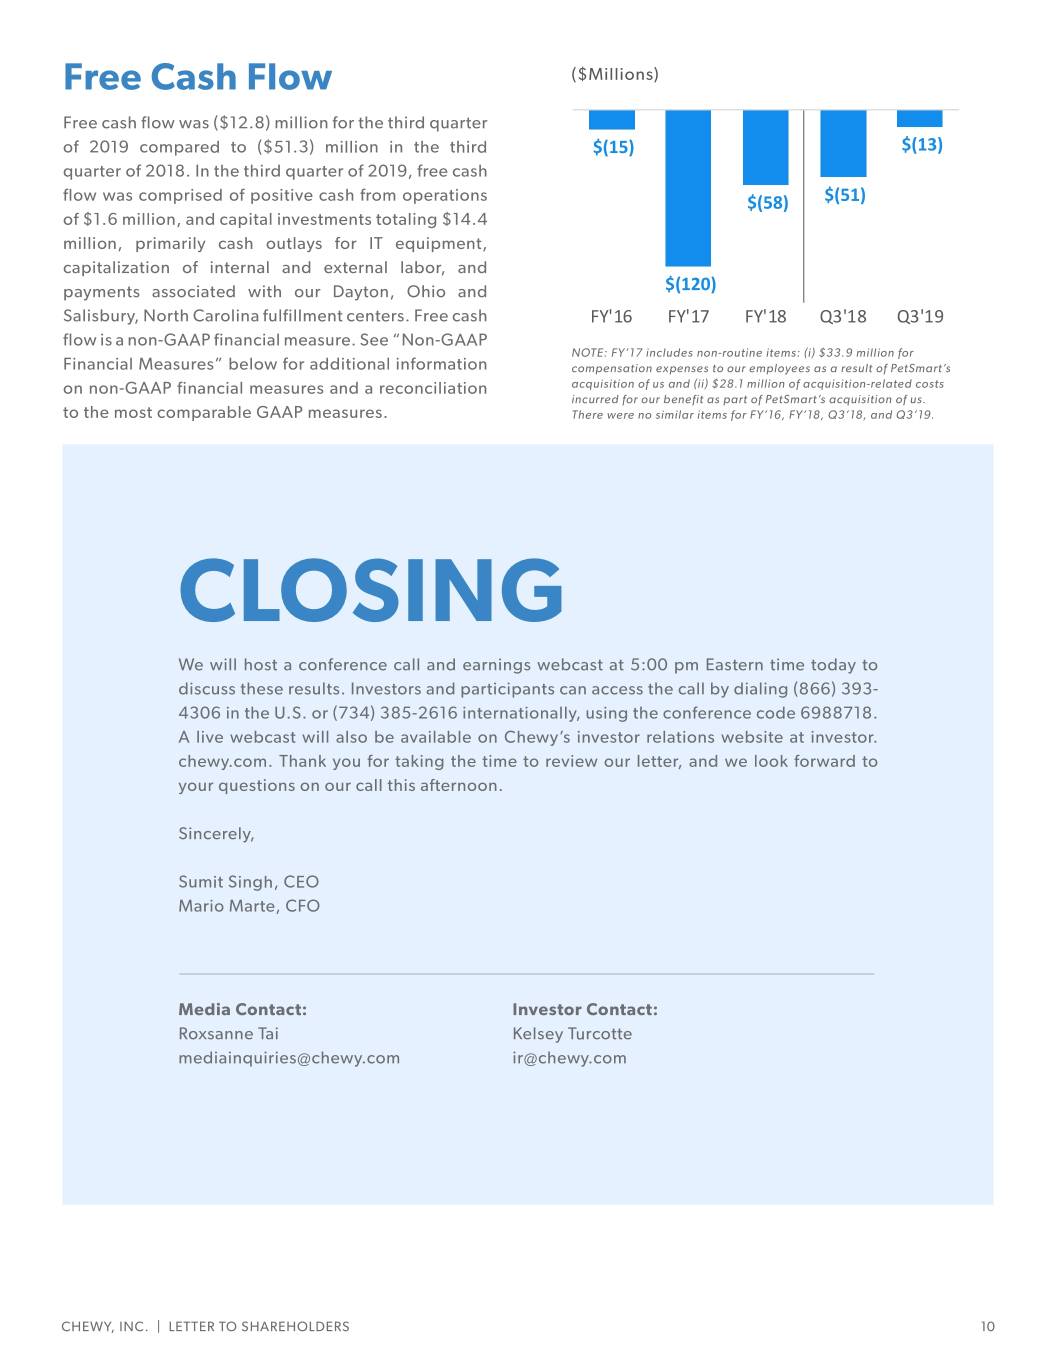
Free Cash Flow Free($Millions) Cash Flow Free cash flow was ($12.8) million for the third quarter of 2019 compared to ($51.3) million in the third $(15) $(13) quarter of 2018. In the third quarter of 2019, free cash flow was comprised of positive cash from operations $(58) $(51) of $1.6 million, and capital investments totaling $14.4 million, primarily cash outlays for IT equipment, capitalization of internal and external labor, and payments associated with our Dayton, Ohio and $(120) Salisbury, North Carolina fulfillment centers. Free cash FY'16 FY'17 FY'18 Q3'18 Q3'19 flow is a non-GAAP financial measure. See “Non-GAAP NOTE: FY’17 includes non-routine items: (i) $33.9 million for Financial Measures” below for additional information compensation expenses to our employees as a result of PetSmart’s on non-GAAP financial measures and a reconciliation acquisition of us and (ii) $28.1 million of acquisition-related costs incurred for our benefit as part of PetSmart’s acquisition of us. to the most comparable GAAP measures. There were no similar items for FY’16, FY’18, Q3’18, and Q3’19. CLOSING We will host a conference call and earnings webcast at 5:00 pm Eastern time today to discuss these results. Investors and participants can access the call by dialing (866) 393- 4306 in the U.S. or (734) 385-2616 internationally, using the conference code 6988718. A live webcast will also be available on Chewy’s investor relations website at investor. chewy.com. Thank you for taking the time to review our letter, and we look forward to your questions on our call this afternoon. Sincerely, Sumit Singh, CEO Mario Marte, CFO Media Contact: Investor Contact: Roxsanne Tai Kelsey Turcotte mediainquiries@chewy.com ir@chewy.com CHEWY, INC. | LETTER TO SHAREHOLDERS 10

Chewy, Inc. Condensed Consolidated Balance Sheets (in thousands, except share and per share data) As of November 3, February 3, 2019 2019 Assets (Unaudited) Current assets: Cash and cash equivalents $ 135,871 $ 88,331 Accounts receivable 94,087 48,738 Inventories 289,935 220,855 Due from Parent, net 11,764 78,712 Prepaid expenses and other current assets 34,557 11,949 Total current assets 566,214 448,585 Property and equipment, net 107,703 91,691 Operating lease right-of-use assets 181,035 — Other non-current assets 3,735 1,346 Total assets $ 858,687 $ 541,622 Liabilities and stockholders' deficit Current liabilities: Trade accounts payable $ 637,687 $ 502,880 Accrued expenses and other current liabilities 373,744 311,150 Total current liabilities 1,011,431 814,030 Operating lease liabilities 202,621 — Other long-term liabilities 34,092 63,534 Total liabilities 1,248,144 877,564 Stockholders' deficit: Preferred stock, $0.01 par value per share, 5,000,000 shares authorized, no shares issued and outstanding as of November 3, 2019; no shares authorized, issued or outstanding as of February 3, 2019 — — Class A common stock, $0.01 par value per share, 1,500,000,000 shares authorized, 53,475,000 shares issued and outstanding as of November 3, 2019; no shares authorized, issued or outstanding as of February 3, 2019 535 — Class B common stock, $0.01 par value per share, 395,000,000 shares authorized, 345,125,000 shares issued and outstanding as of November 3, 2019; no shares authorized, issued or outstanding as of February 3, 2019 3,451 — Voting common stock, $0.01 par value per share, no shares authorized, issued or outstanding as of November 3, 2019; 1,000 shares authorized, 100 shares issued and outstanding as of February 3, 2019 — — Additional paid-in capital 1,390,089 1,256,160 Accumulated deficit (1,783,532) (1,592,102) Total stockholders' deficit (389,457) (335,942) Total liabilities and stockholders' deficit $ 858,687 $ 541,622 CHEWY, INC. | LETTER TO SHAREHOLDERS 11

Chewy, Inc. Condensed Consolidated Statements of Operations (In thousands, except per share data. Unaudited) 13 Weeks Ended 39 Weeks Ended November 3, 2019 October 28, 2018 November 3, 2019 October 28, 2018 Net sales $ 1,229,801 $ 875,630 $ 3,492,218 $ 2,444,679 Cost of goods sold 938,021 703,589 2,674,313 1,956,774 Gross profit 291,780 172,041 817,905 487,905 Operating expenses: Selling, general and administrative 258,488 150,375 684,948 413,275 Advertising and marketing 112,071 100,163 325,086 276,087 Total operating expenses 370,559 250,538 1,010,034 689,362 Loss from operations (78,779) (78,497) (192,129) (201,457) Interest (expense) income, net (221) (121) 699 (90) Loss before income tax provision (79,000) (78,618) (191,430) (201,547) Income tax provision — — — — Net loss $ (79,000) $ (78,618) $ (191,430) $ (201,547) Net loss per share attributable to common Class A and Class B stockholders, basic and diluted $ (0.20) $ (0.20) $ (0.48) $ (0.51) Weighted average common shares used in computing net loss per share attributable to common Class A and Class B stockholders, basic and diluted 401,317 393,000 397,235 393,000 CHEWY, INC. | LETTER TO SHAREHOLDERS 12
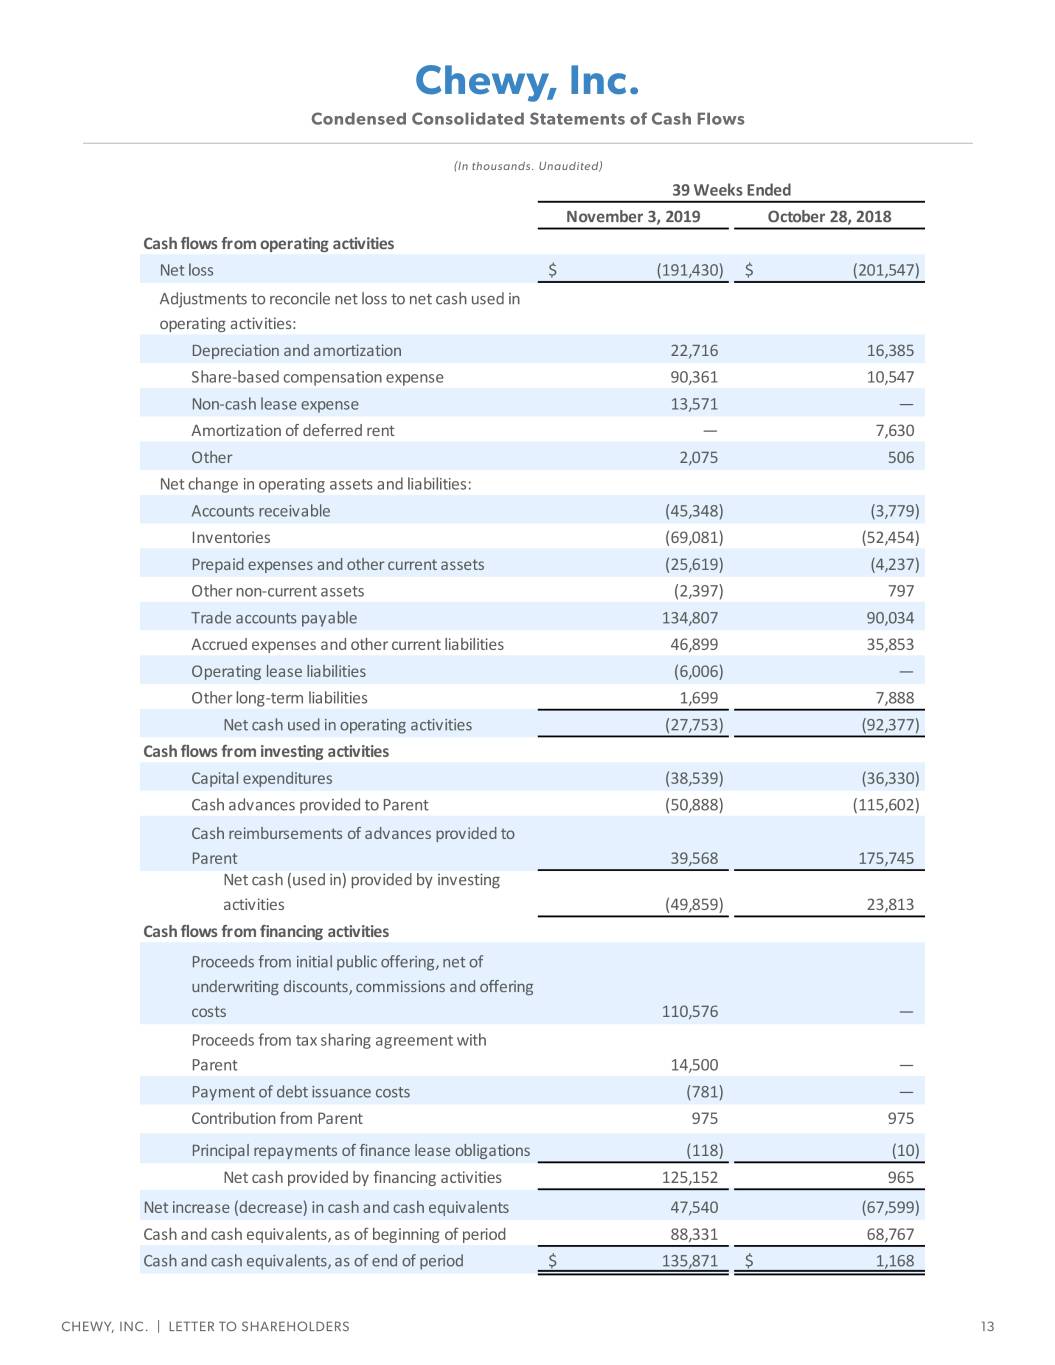
Chewy, Inc. Condensed Consolidated Statements of Cash Flows (In thousands. Unaudited) CHEWY, INC. | LETTER TO SHAREHOLDERS 13
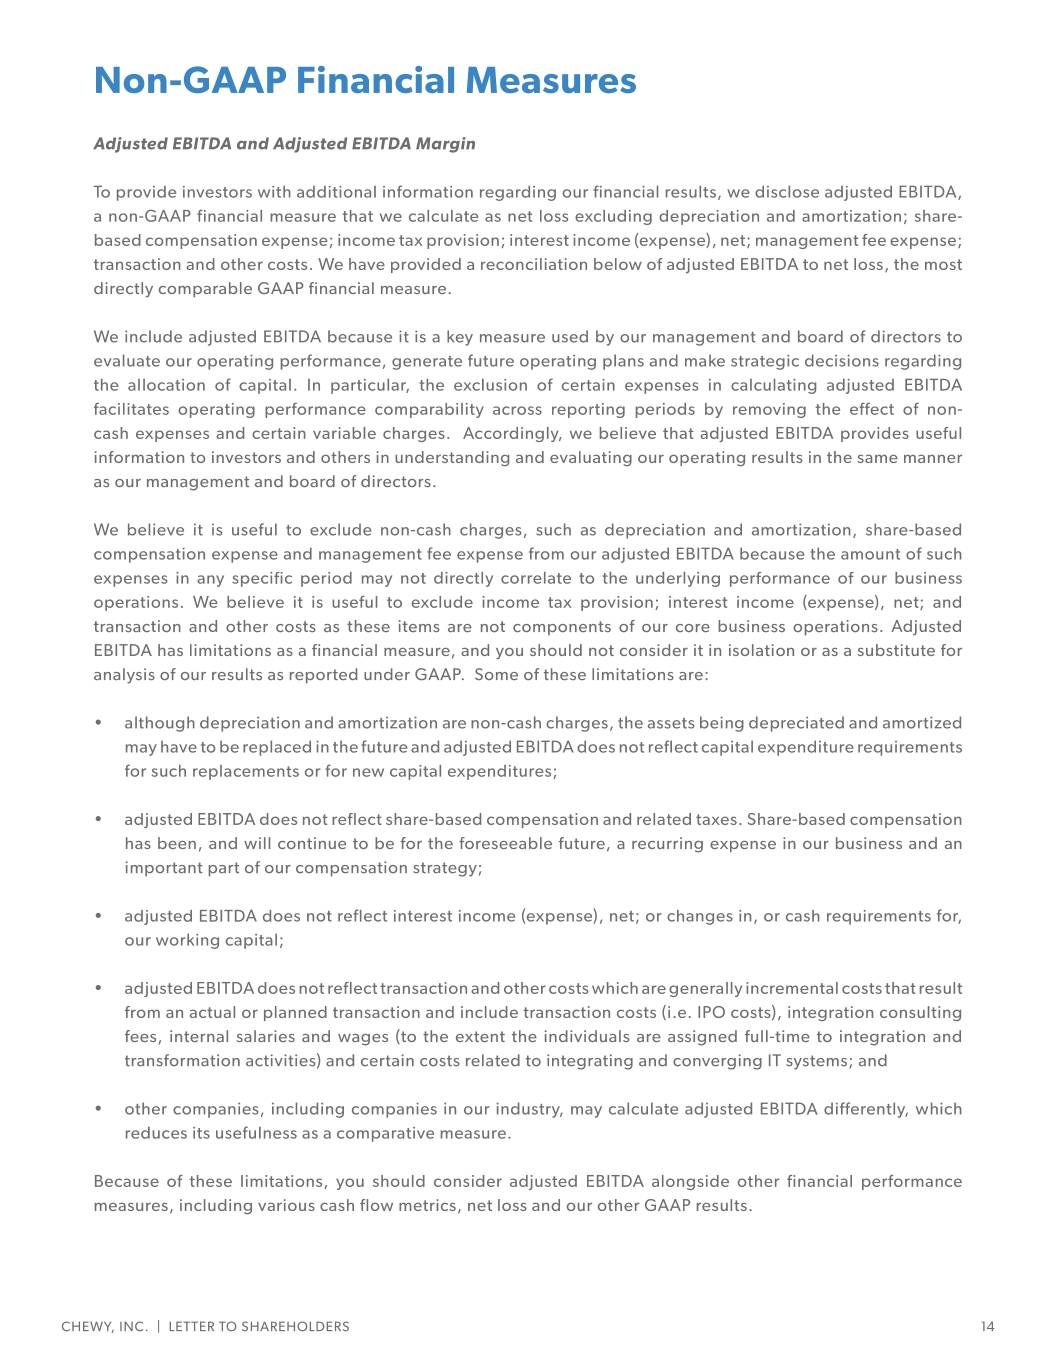
Non-GAAP Financial Measures Adjusted EBITDA and Adjusted EBITDA Margin To provide investors with additional information regarding our financial results, we disclose adjusted EBITDA, a non-GAAP financial measure that we calculate as net loss excluding depreciation and amortization; share- based compensation expense; income tax provision; interest income (expense), net; management fee expense; transaction and other costs. We have provided a reconciliation below of adjusted EBITDA to net loss, the most directly comparable GAAP financial measure. We include adjusted EBITDA because it is a key measure used by our management and board of directors to evaluate our operating performance, generate future operating plans and make strategic decisions regarding the allocation of capital. In particular, the exclusion of certain expenses in calculating adjusted EBITDA facilitates operating performance comparability across reporting periods by removing the effect of non- cash expenses and certain variable charges. Accordingly, we believe that adjusted EBITDA provides useful information to investors and others in understanding and evaluating our operating results in the same manner as our management and board of directors. We believe it is useful to exclude non-cash charges, such as depreciation and amortization, share-based compensation expense and management fee expense from our adjusted EBITDA because the amount of such expenses in any specific period may not directly correlate to the underlying performance of our business operations. We believe it is useful to exclude income tax provision; interest income (expense), net; and transaction and other costs as these items are not components of our core business operations. Adjusted EBITDA has limitations as a financial measure, and you should not consider it in isolation or as a substitute for analysis of our results as reported under GAAP. Some of these limitations are: • although depreciation and amortization are non-cash charges, the assets being depreciated and amortized may have to be replaced in the future and adjusted EBITDA does not reflect capital expenditure requirements for such replacements or for new capital expenditures; • adjusted EBITDA does not reflect share-based compensation and related taxes. Share-based compensation has been, and will continue to be for the foreseeable future, a recurring expense in our business and an important part of our compensation strategy; • adjusted EBITDA does not reflect interest income (expense), net; or changes in, or cash requirements for, our working capital; • adjusted EBITDA does not reflect transaction and other costs which are generally incremental costs that result from an actual or planned transaction and include transaction costs (i.e. IPO costs), integration consulting fees, internal salaries and wages (to the extent the individuals are assigned full-time to integration and transformation activities) and certain costs related to integrating and converging IT systems; and • other companies, including companies in our industry, may calculate adjusted EBITDA differently, which reduces its usefulness as a comparative measure. Because of these limitations, you should consider adjusted EBITDA alongside other financial performance measures, including various cash flow metrics, net loss and our other GAAP results. CHEWY, INC. | LETTER TO SHAREHOLDERS 14
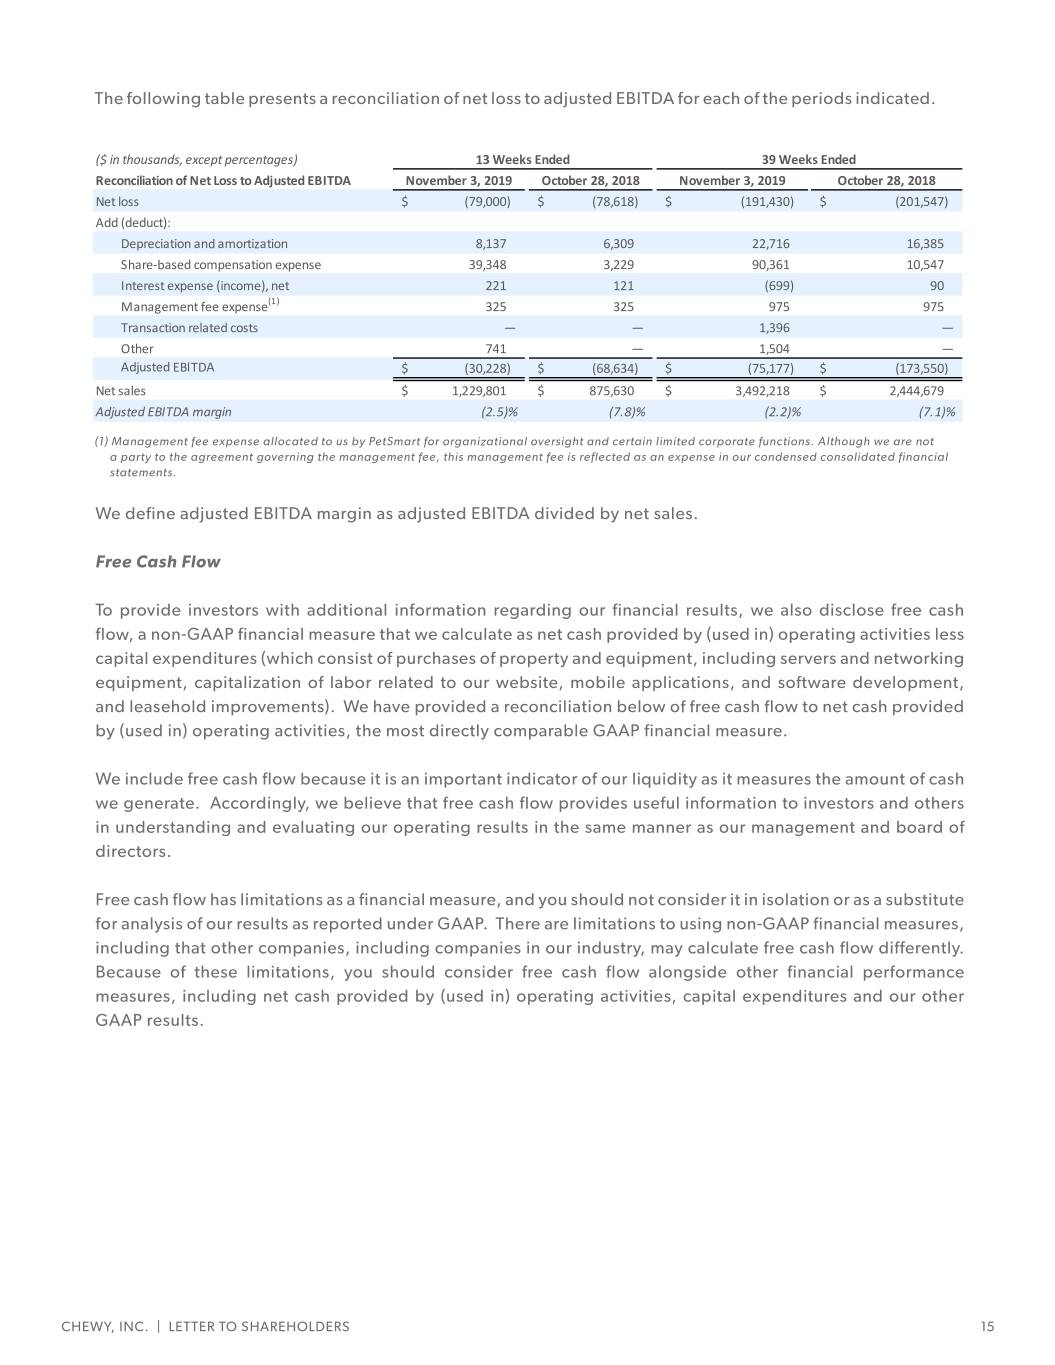
The following table presents a reconciliation of net loss to adjusted EBITDA for each of the periods indicated. ($ in thousands, except percentages) 13 Weeks Ended 39 Weeks Ended Reconciliation of Net Loss to Adjusted EBITDA November 3, 2019 October 28, 2018 November 3, 2019 October 28, 2018 Net loss $ (79,000) $ (78,618) $ (191,430) $ (201,547) Add (deduct): Depreciation and amortization 8,137 6,309 22,716 16,385 Share-based compensation expense 39,348 3,229 90,361 10,547 Interest expense (income), net 221 121 (699) 90 Management fee expense(1) 325 325 975 975 Transaction related costs — — 1,396 — Other 741 — 1,504 — Adjusted EBITDA $ (30,228) $ (68,634) $ (75,177) $ (173,550) Net sales $ 1,229,801 $ 875,630 $ 3,492,218 $ 2,444,679 Adjusted EBITDA margin (2.5)% (7.8)% (2.2)% (7.1)% (1) Management fee expense allocated to us by PetSmart for organizational oversight and certain limited corporate functions. Although we are not a party to the agreement governing the management fee, this management fee is reflected as an expense in our condensed consolidated financial statements. We define adjusted EBITDA margin as adjusted EBITDA divided by net sales. Free Cash Flow To provide investors with additional information regarding our financial results, we also disclose free cash flow, a non-GAAP financial measure that we calculate as net cash provided by (used in) operating activities less capital expenditures (which consist of purchases of property and equipment, including servers and networking equipment, capitalization of labor related to our website, mobile applications, and software development, and leasehold improvements). We have provided a reconciliation below of free cash flow to net cash provided by (used in) operating activities, the most directly comparable GAAP financial measure. We include free cash flow because it is an important indicator of our liquidity as it measures the amount of cash we generate. Accordingly, we believe that free cash flow provides useful information to investors and others in understanding and evaluating our operating results in the same manner as our management and board of directors. Free cash flow has limitations as a financial measure, and you should not consider it in isolation or as a substitute for analysis of our results as reported under GAAP. There are limitations to using non-GAAP financial measures, including that other companies, including companies in our industry, may calculate free cash flow differently. Because of these limitations, you should consider free cash flow alongside other financial performance measures, including net cash provided by (used in) operating activities, capital expenditures and our other GAAP results. CHEWY, INC. | LETTER TO SHAREHOLDERS 15
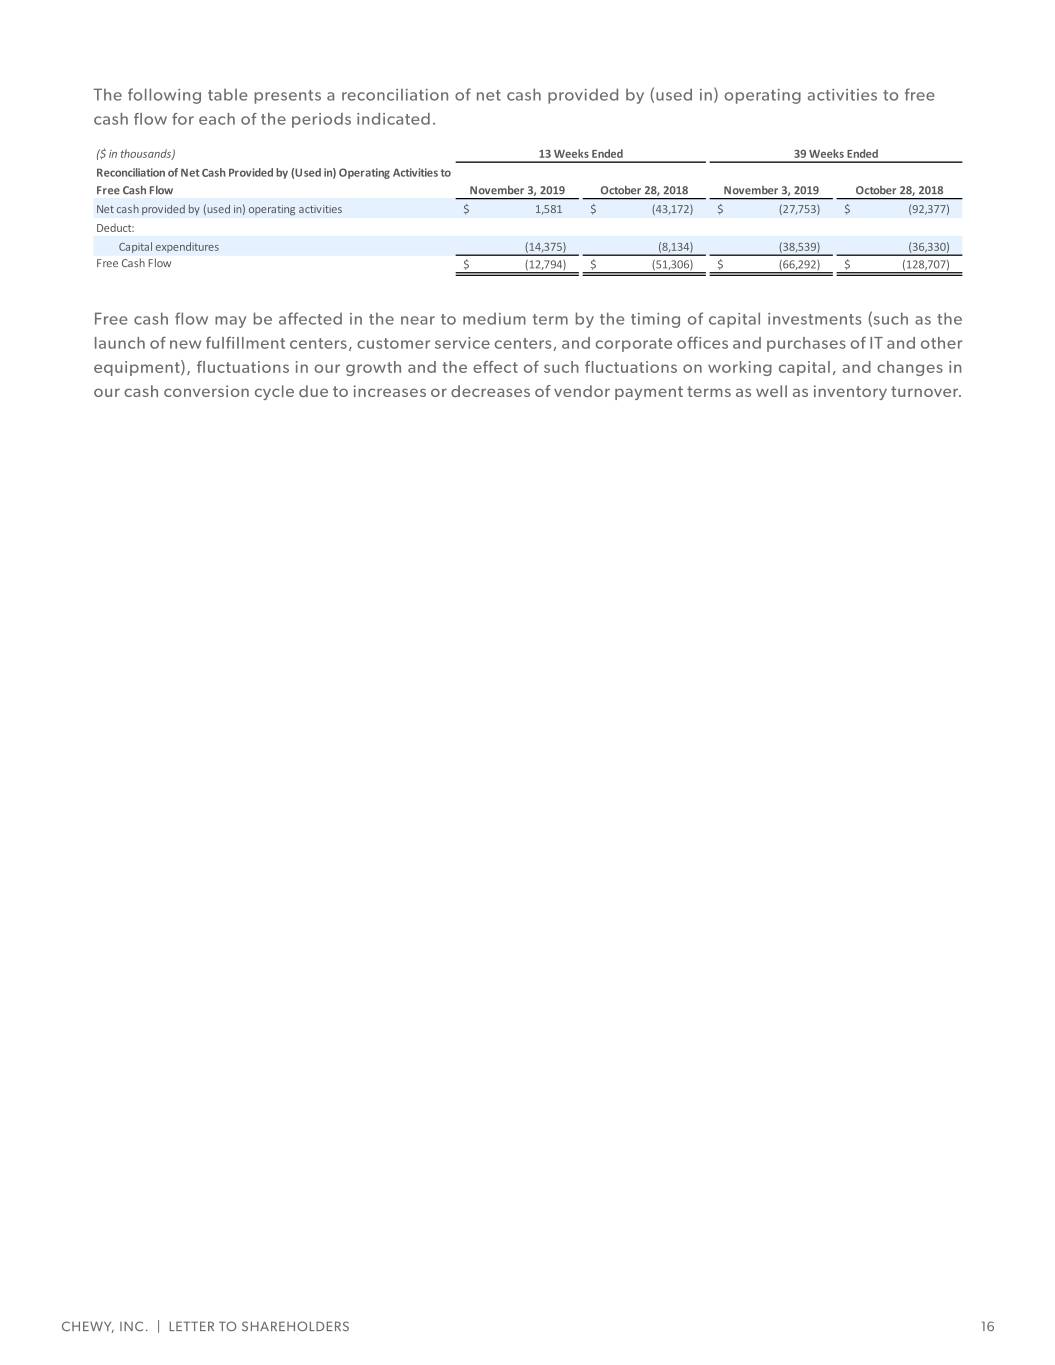
The following table presents a reconciliation of net cash provided by (used in) operating activities to free cash flow for each of the periods indicated. ($ in thousands) 13 Weeks Ended 39 Weeks Ended Reconciliation of Net Cash Provided by (Used in) Operating Activities to Free Cash Flow November 3, 2019 October 28, 2018 November 3, 2019 October 28, 2018 Net cash provided by (used in) operating activities $ 1,581 $ (43,172) $ (27,753) $ (92,377) Deduct: Capital expenditures (14,375) (8,134) (38,539) (36,330) Free Cash Flow $ (12,794) $ (51,306) $ (66,292) $ (128,707) Free cash flow may be affected in the near to medium term by the timing of capital investments (such as the launch of new fulfillment centers, customer service centers, and corporate offices and purchases of IT and other equipment), fluctuations in our growth and the effect of such fluctuations on working capital, and changes in our cash conversion cycle due to increases or decreases of vendor payment terms as well as inventory turnover. CHEWY, INC. | LETTER TO SHAREHOLDERS 16
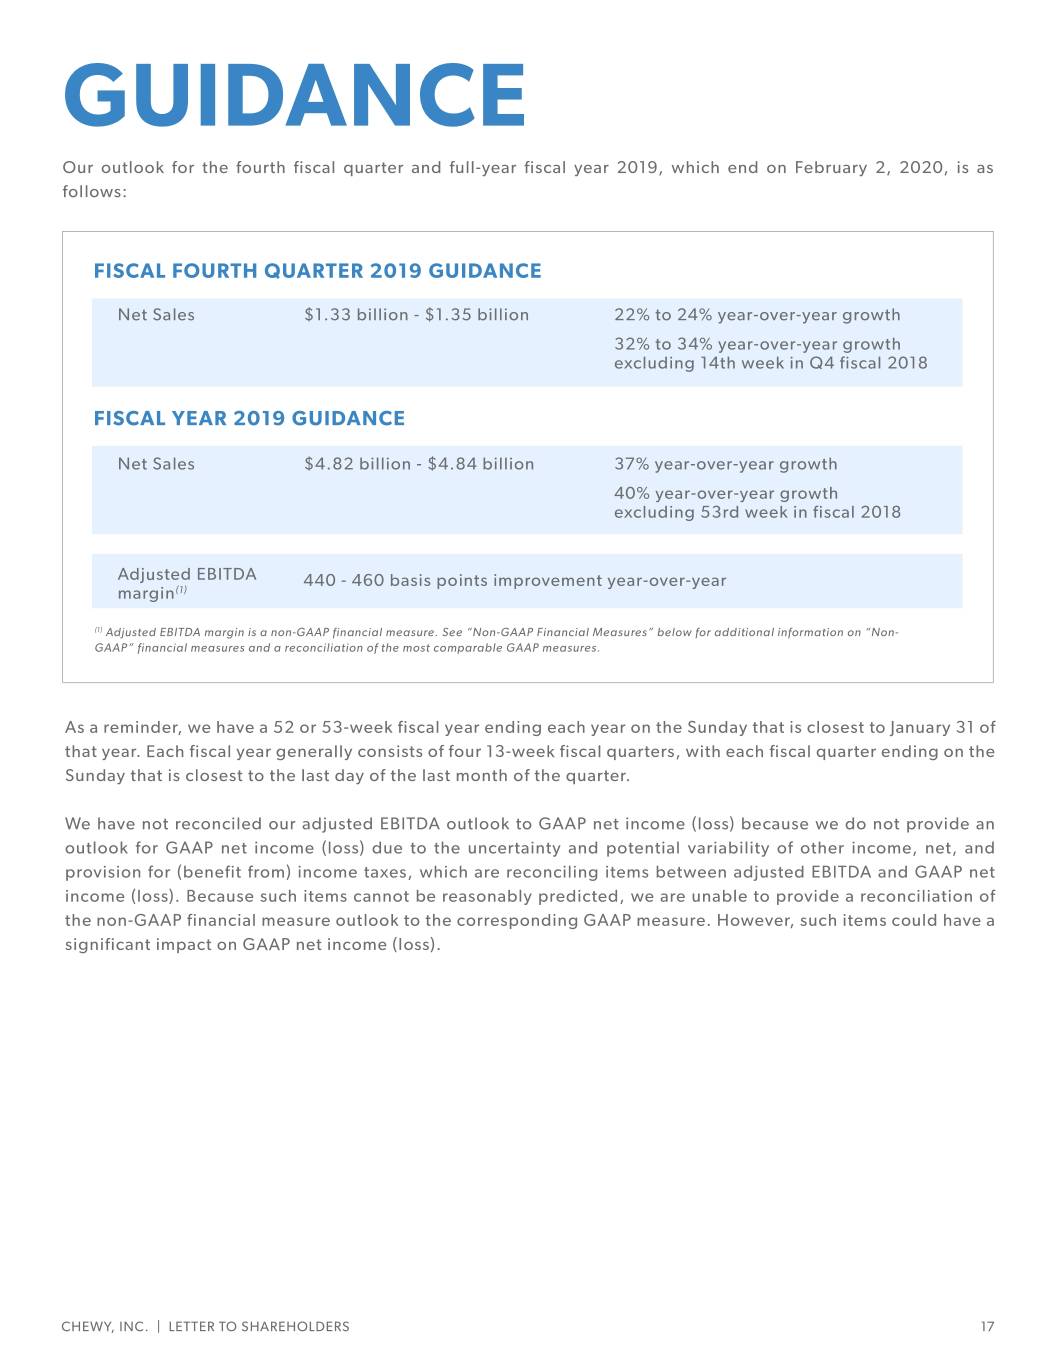
GUIDANCE Our outlook for the fourth fiscal quarter and full-year fiscal year 2019, which end on February 2, 2020, is as follows: FISCAL FOURTH QUARTER 2019 GUIDANCE Net Sales $1.33 billion - $1.35 billion 22% to 24% year-over-year growth 32% to 34% year-over-year growth excluding 14th week in Q4 fiscal 2018 FISCAL YEAR 2019 GUIDANCE Net Sales $4.82 billion - $4.84 billion 37% year-over-year growth 40% year-over-year growth excluding 53rd week in fiscal 2018 Adjusted EBITDA 440 - 460 basis points improvement year-over-year margin(1) (1) Adjusted EBITDA margin is a non-GAAP financial measure. See “Non-GAAP Financial Measures” below for additional information on “Non- GAAP” financial measures and a reconciliation of the most comparable GAAP measures. As a reminder, we have a 52 or 53-week fiscal year ending each year on the Sunday that is closest to January 31 of that year. Each fiscal year generally consists of four 13-week fiscal quarters, with each fiscal quarter ending on the Sunday that is closest to the last day of the last month of the quarter. We have not reconciled our adjusted EBITDA outlook to GAAP net income (loss) because we do not provide an outlook for GAAP net income (loss) due to the uncertainty and potential variability of other income, net, and provision for (benefit from) income taxes, which are reconciling items between adjusted EBITDA and GAAP net income (loss). Because such items cannot be reasonably predicted, we are unable to provide a reconciliation of the non-GAAP financial measure outlook to the corresponding GAAP measure. However, such items could have a significant impact on GAAP net income (loss). CHEWY, INC. | LETTER TO SHAREHOLDERS 17

FORWARD-LOOKING STATEMENTS This communication contains forward-looking per active customer; accurately predict economic statements about us and our industry that involve conditions and their impact on consumer spending substantial risks and uncertainties. All statements patterns, particularly in the pet products market, and other than statements of historical facts contained in accurately forecast net sales and appropriately plan this communication, including statements regarding our expenses in the future; introduce new products or our future results of operations or financial condition, offerings and improve existing products; successfully business strategy and plans and objectives of compete in the pet products and services retail management for future operations, are forward- industry, especially in the e-commerce sector; source looking statements. In some cases, you can identify additional, or strengthen our existing relationships forward-looking statements because they contain with, suppliers; negotiate acceptable pricing and words such as “anticipate,” “believe,” “contemplate,” other terms with third-party service providers, “continue,” “could,” “estimate,” “expect,” “intend,” suppliers and outsourcing partners and maintain our “may,” “plan,” “potential,” “predict,” “project,” relationships with such entities; optimize, operate “should,” “target,” “will” or “would” or the negative and manage the expansion of the capacity of our of these words or other similar terms or expressions. fulfillment centers; provide our customers with a These forward-looking statements include, but are cost-effective platform that is able to respond and not limited to, statements concerning our ability adapt to rapid changes in technology; maintain to: sustain our recent growth rates and manage adequate cybersecurity with respect to our systems our growth effectively; acquire new customers in and ensure that our third-party service providers do a cost-effective manner and increase our net sales the same with respect to their systems; successfully CHEWY, INC. | LETTER TO SHAREHOLDERS 18
manufacture and sell our own private brand products; on these statements. The forward-looking statements maintain consumer confidence in the safety and quality made in this communication relate only to events as of our vendor-supplied and private brand food products of the date on which the statements are made. We and hardgood products; comply with existing or future undertake no obligation to update any forward-looking laws and regulations in a cost-efficient manner; attract, statements made in this communication to reflect events develop, motivate and retain well-qualified employees; or circumstances after the date of this communication and adequately protect our intellectual property or to reflect new information or the occurrence of rights and successfully defend ourselves against any unanticipated events, except as required by law. We may intellectual property infringement claims or other not actually achieve the plans, intentions or expectations allegations that we may be subject to. disclosed in our forward-looking statements, and you should not place undue reliance on our forward-looking You should not rely on forward-looking statements as statements. Our forward-looking statements do not predictions of future events. We have based the forward- reflect the potential impact of any future acquisitions, looking statements contained in this communication mergers, dispositions, joint ventures or investments. primarily on our current expectations and projections about future events and trends that we believe may affect our business, financial condition, and results of operations. The outcome of the events described in these forward-looking statements is subject to risks, uncertainties and other factors described in our filings with the Securities and Exchange Commission and elsewhere in this communication. Moreover, we operate in a very competitive and rapidly changing environment. New risks and uncertainties emerge from time to time, and it is not possible for us to predict all risks and uncertainties that could have an impact on the forward- looking statements contained in this communication. The results, events and circumstances reflected in the forward-looking statements may not be achieved or occur, and actual results, events or circumstances could differ materially from those described in the forward- looking statements. In addition, statements that “we believe” and similar statements reflect our beliefs and opinions on the relevant subject. These statements are based on information available to us as of the date of this communication. While we believe that information provides a reasonable basis for these statements, that information may be limited or incomplete. Our statements should not be read to indicate that we have conducted an exhaustive inquiry into, or review of, all relevant information. These statements are inherently uncertain, and investors are cautioned not to unduly rely CHEWY, INC. | LETTER TO SHAREHOLDERS 19

CHEWY, INC. | LETTER TO SHAREHOLDERS 20


