
Q4 and Fiscal Year 2020 LETTER TO SHAREHOLDERS March 30, 2021

Chewy, Inc. | Q4 Fiscal 2020 Letter to Shareholders 2 Our mission To be the most trusted and convenient online destination for pet parents (and partners) everywhere.
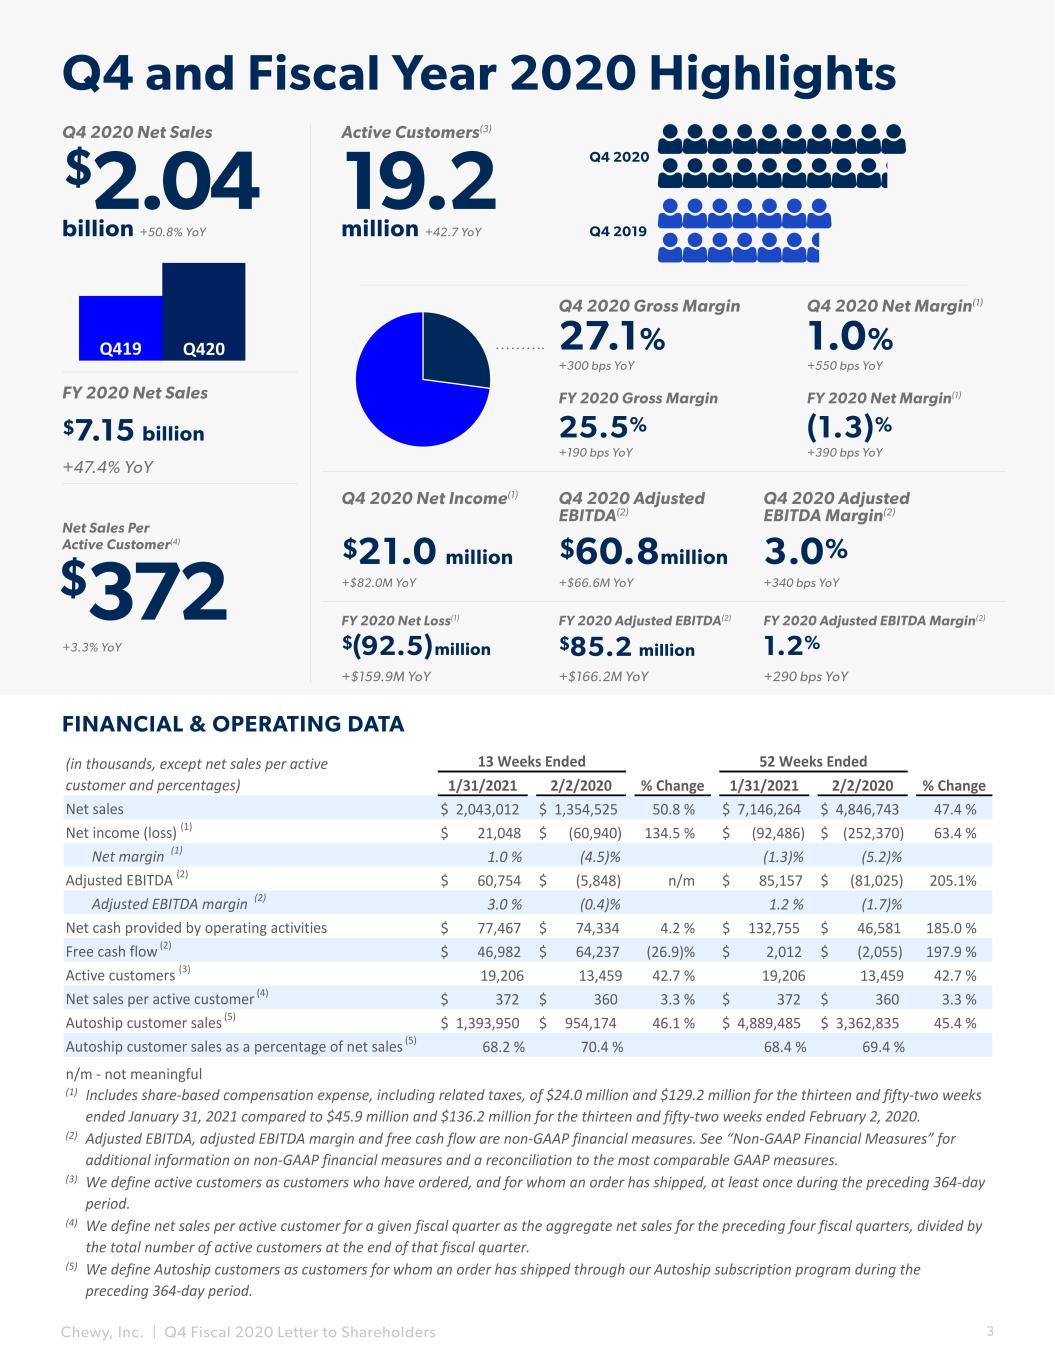
Chewy, Inc. | Q4 Fiscal 2020 Letter to Shareholders 3 FINANCIAL & OPERATING DATA $2.04 $372 +3.3% YoY +$82.0M YoY +$66.6M YoY +340 bps YoY 27.1% $21.0 million $60.8million 3.0% 19.2 billion +50.8% YoY million +42.7 YoY Q4 2020 Net Sales Net Sales Per Active Customer(4) Q4 2020 Net Income(1) Q4 2020 Adjusted EBITDA(2) Q4 2020 Adjusted EBITDA Margin(2) Active Customers(3) Q4 2020 Gross Margin +300 bps YoY Q4 and Fiscal Year 2020 Highlights Q4 2019 Q4 2020 +47.4% YoY $7.15 billion FY 2020 Net Sales +190 bps YoY 25.5% FY 2020 Gross Margin 1.0% Q4 2020 Net Margin(1) +550 bps YoY +390 bps YoY (1.3)% FY 2020 Net Margin(1) +$159.9M YoY +$166.2M YoY $(92.5)million $85.2 million 1.2% FY 2020 Net Loss(1) FY 2020 Adjusted EBITDA(2) FY 2020 Adjusted EBITDA Margin(2) +290 bps YoY 1/31/2021 2/2/2020 % Change 1/31/2021 2/2/2020 % Change $ 2,043,012 $ 1,354,525 50.8 % $ 7,146,264 $ 4,846,743 47.4 % $ 21,048 $ (60,940) 134.5 % $ (92,486) $ (252,370) 63.4 % 1.0 % (4.5)% (1.3)% (5.2)% $ 60,754 $ (5,848) n/m $ 85,157 $ (81,025) 205.1% 3.0 % (0.4)% 1.2 % (1.7)% $ 77,467 $ 74,334 4.2 % $ 132,755 $ 46,581 185.0 % $ 46,982 $ 64,237 (26.9)% $ 2,012 $ (2,055) 197.9 % 19,206 13,459 42.7 % 19,206 13,459 42.7 % $ 372 $ 360 3.3 % $ 372 $ 360 3.3 % $ 1,393,950 $ 954,174 46.1 % $ 4,889,485 $ 3,362,835 45.4 % 68.2 % 70.4 % 68.4 % 69.4 % (1) (2) (3) (4) (5) 52 Weeks Ended Includes share-based compensation expense, including related taxes, of $24.0 million and $129.2 million for the thirteen and fifty-two weeks ended January 31, 2021 compared to $45.9 million and $136.2 million for the thirteen and fifty-two weeks ended February 2, 2020. Free cash flow (2) Active customers (3) Net sales per active customer (4) Autoship customer sales (5) Autoship customer sales as a percentage of net sales (5) n/m - not meaningful 13 Weeks Ended Net sales Net income (loss) (1) Net margin (1) (in thousands, except net sales per active customer and percentages) Adjusted EBITDA, adjusted EBITDA margin and free cash flow are non-GAAP financial measures. See “Non-GAAP Financial Measures” for additional information on non-GAAP financial measures and a reconciliation to the most comparable GAAP measures. We define active customers as customers who have ordered, and for whom an order has shipped, at least once during the preceding 364-day period. We define net sales per active customer for a given fiscal quarter as the aggregate net sales for the preceding four fiscal quarters, divided by the total number of active customers at the end of that fiscal quarter. We define Autoship customers as customers for whom an order has shipped through our Autoship subscription program during the preceding 364-day period. Adjusted EBITDA (2) Adjusted EBITDA margin (2) Net cash provided by operating activities Q419 Q420
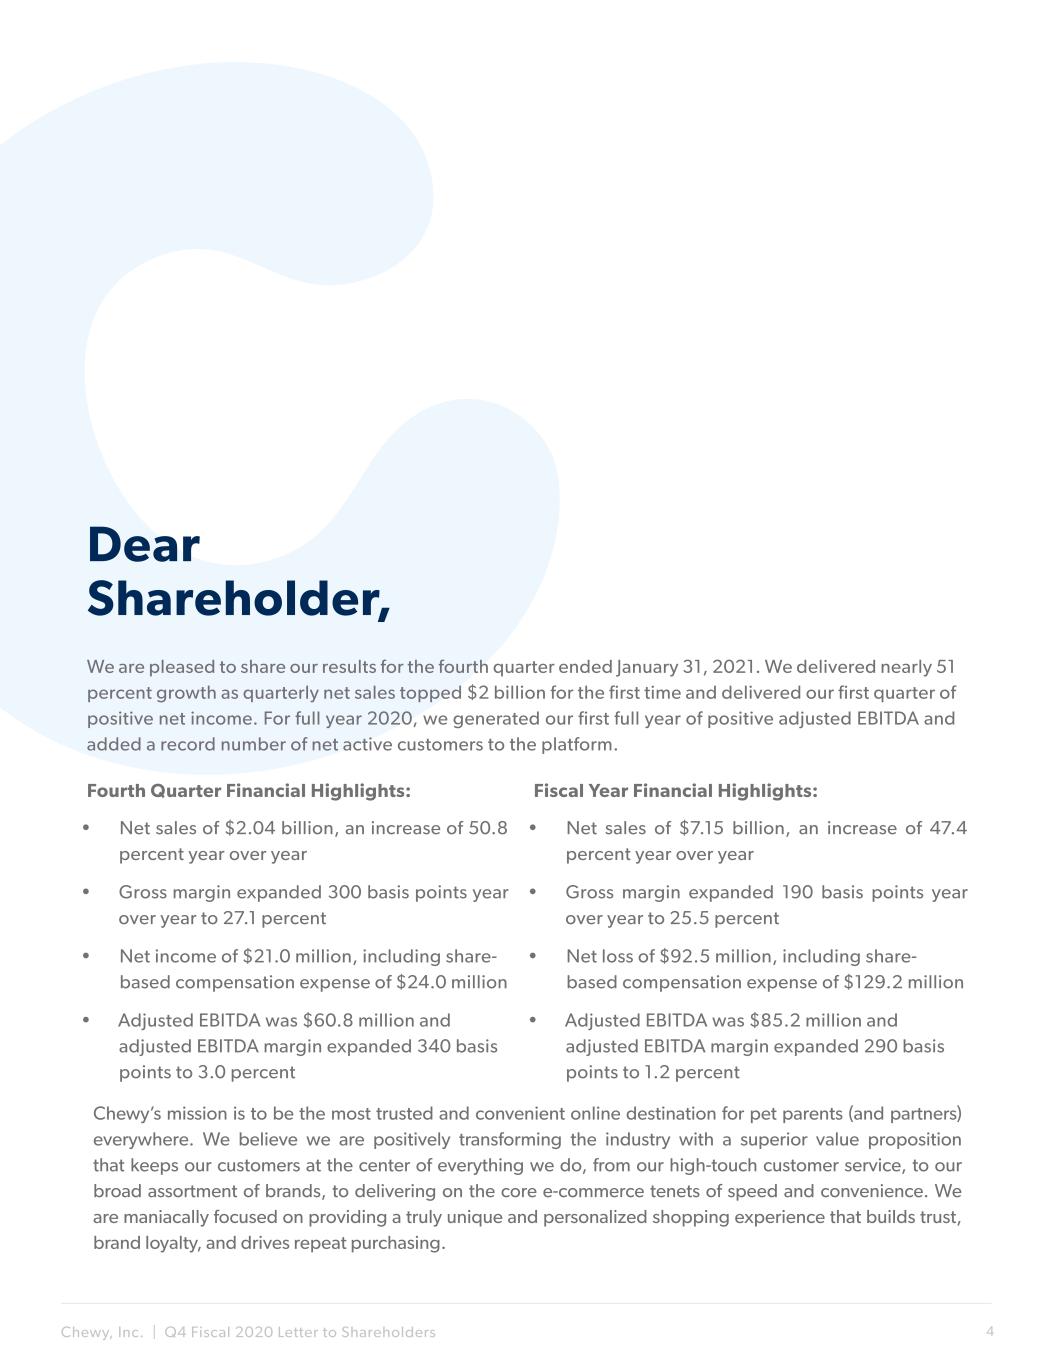
Chewy, Inc. | Q4 Fiscal 2020 Letter to Shareholders 4 We are pleased to share our results for the fourth quarter ended January 31, 2021. We delivered nearly 51 percent growth as quarterly net sales topped $2 billion for the first time and delivered our first quarter of positive net income. For full year 2020, we generated our first full year of positive adjusted EBITDA and added a record number of net active customers to the platform. Fourth Quarter Financial Highlights: Chewy’s mission is to be the most trusted and convenient online destination for pet parents (and partners) everywhere. We believe we are positively transforming the industry with a superior value proposition that keeps our customers at the center of everything we do, from our high-touch customer service, to our broad assortment of brands, to delivering on the core e-commerce tenets of speed and convenience. We are maniacally focused on providing a truly unique and personalized shopping experience that builds trust, brand loyalty, and drives repeat purchasing. • Net sales of $2.04 billion, an increase of 50.8 percent year over year • Gross margin expanded 300 basis points year over year to 27.1 percent • Net income of $21.0 million, including share- based compensation expense of $24.0 million • Adjusted EBITDA was $60.8 million and adjusted EBITDA margin expanded 340 basis points to 3.0 percent Dear Shareholder, Fiscal Year Financial Highlights: • Net sales of $7.15 billion, an increase of 47.4 percent year over year • Gross margin expanded 190 basis points year over year to 25.5 percent • Net loss of $92.5 million, including share- based compensation expense of $129.2 million • Adjusted EBITDA was $85.2 million and adjusted EBITDA margin expanded 290 basis points to 1.2 percent

Chewy, Inc. | Q4 Fiscal 2020 Letter to Shareholders 5 Q4 and Fiscal Year 2020 Business Highlights 2020 was a landmark year in Chewy’s history. As of this writing a year ago, we were just beginning to realize the scope of the COVID-19 pandemic. Looking back, we are proud of the way Chewtopians came together to execute through an incredibly challenging year. As a leadership team, we communicated frequently and honestly with each other about how we would navigate the pandemic with our team members’ safety in the forefront. We made sure our teams had safe and healthy workspaces and implemented new team member friendly policies and benefits. In response, our teams redoubled their dedication to our customers and made sure our customers’ pets kept receiving the vital products and care that they needed. In the face of surging volume, we kept our supply chain operating and our fulfillment centers running. Our corporate staff and customer service teams quickly adapted to working from home and our Tech and Product teams solved challenge after challenge to seamlessly foster that transition. Amid the disruptions caused by COVID we accelerated the roll out of several strategic initiatives including the launch of e-gift cards and personalized products, the introduction of service innovations like our telehealth offering, “Connect with a Vet” and compounding services, and the opening of our first automated and first high-velocity fulfillment centers. These accelerated roll-outs speak to the adaptability and innovative spirit of our entire Chewy Team. Even with the COVID backdrop, our teams remained relentlessly focused on the strong execution required to deliver a superior customer experience to over 19 million pet parents who trusted us to deliver on our promise. Adding Customers and Growing Share of Wallet Efficiently adding new customers to our platform and then growing their share of wallet is a key part of our growth strategy. We added 5.7 million net active customers in 2020, reflecting 42.7 percent annual growth. The customer cohorts we acquired in 2020 were highly engaged and displayed similar, or in some cases stronger, purchase and repurchase behavior compared to previous cohorts. These positive behaviors were driven by a wider product assortment, and by our growing set of customer offerings such as gift cards, personalized products, compounding services, and “Connect with a Vet”.

Chewy, Inc. | Q4 Fiscal 2020 Letter to Shareholders 6 Assessing our progress by business vertical, we are pleased to note that our core consumables business remains strong and that we continue to gain accelerated traction in hardgoods, healthcare, and proprietary brands. Looking at the fourth-quarter trends within our key verticals, third-party hardgoods sales grew 40 percent faster than the business overall, and proprietary brands hardgoods sales more than doubled year over year. Furthermore, within hardgoods, our proprietary brands penetration rate increased 570 basis points year over year, to reach 21 percent, continuing the share gains we have reported throughout the year. These results provide us confidence that we are on the right track and that there are ample opportunities in front of us to continue winning customers’ hearts and minds in these areas. We are encouraged to see our efforts to increase customer lifetime value drive higher margins as fourth -quarter gross margin expanded 300 basis points year over year to 27.1 percent. Approximately half of the 300 basis point increase in fourth-quarter gross margin came from structural and sustainable drivers like higher penetration rates into higher-margin verticals like hardgoods, proprietary brands, and healthcare. Notably, on a year-over-year basis, we achieved a 510 basis point mix shift into higher- margin verticals like healthcare and hardgoods. The Large and Growing Opportunity Before Us Our performance and the dynamics of 2020 have provided us with an advance look at Chewy’s future. We believe that our future is bright given the size of the opportunity in front of us and our relentless focus. Moving forward, we plan on executing against the opportunity in order to realize even greater scale and profitability. We believe Chewy is well prepared to capitalize on a market opportunity that is being driven by three important trends. First is the increase in the number of pet owning households. Pet adoptions surged in 2020 as millions of homebound people and families sought out the comfort, companionship, and joy of pet parenthood. According to industry analysts, the number of pet owning households increased by 5.7 percent in 2020, a significant acceleration from the pre-pandemic, five-year CAGR of 0.6 percent. Looking at our own data, it’s clear to us that these new pet parents are joining us early in their journey. For example, in 2020 we observed a 35 percent year-over-year increase in the creation of pet profiles for puppies and kittens and a 40 percent increase in the creation of profiles for newly adopted pets. We get excited about these insights, because that newly adopted Chewy puppy is going to grow up, eat more food, and shred more toys — leading to a long-lasting relationship with us, resulting in a stream of recurring revenues for years to come. Understanding our customers, and anticipating their wants and needs help us create sustainable advantages to win in the pet space. The second trend is the size of the US pet market opportunity and our ability to expand the competitive playing field. Today, Chewy competes in roughly 70 percent of the $100 billion US pet market, and we do so primarily in the areas of food, supplies, and prescription drugs and diet. That leaves us with an additional $30 billion opportunity in healthcare and services that we are confident we can grow into. We are equally excited to note that we are continuing to increase our penetration into the growing US pet market, which is expected to reach $120 Billion by 2024. At $7 billion in net sales, Chewy is clearly only scratching the surface of the overall market opportunity that stands before us.
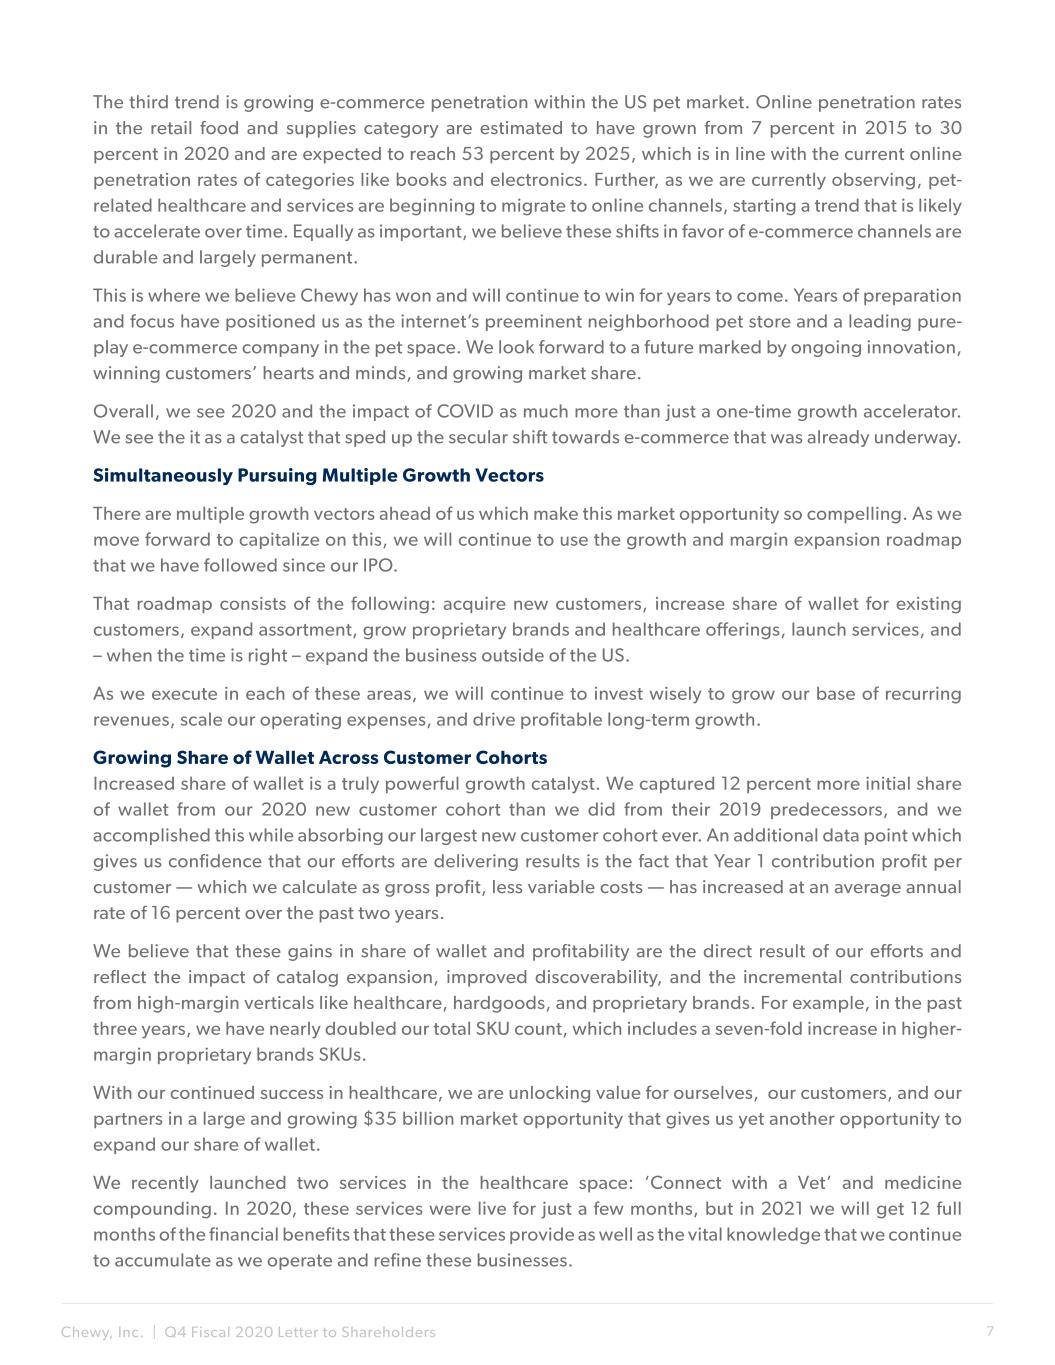
Chewy, Inc. | Q4 Fiscal 2020 Letter to Shareholders 7 The third trend is growing e-commerce penetration within the US pet market. Online penetration rates in the retail food and supplies category are estimated to have grown from 7 percent in 2015 to 30 percent in 2020 and are expected to reach 53 percent by 2025, which is in line with the current online penetration rates of categories like books and electronics. Further, as we are currently observing, pet- related healthcare and services are beginning to migrate to online channels, starting a trend that is likely to accelerate over time. Equally as important, we believe these shifts in favor of e-commerce channels are durable and largely permanent. This is where we believe Chewy has won and will continue to win for years to come. Years of preparation and focus have positioned us as the internet’s preeminent neighborhood pet store and a leading pure- play e-commerce company in the pet space. We look forward to a future marked by ongoing innovation, winning customers’ hearts and minds, and growing market share. Overall, we see 2020 and the impact of COVID as much more than just a one-time growth accelerator. We see the it as a catalyst that sped up the secular shift towards e-commerce that was already underway. Simultaneously Pursuing Multiple Growth Vectors There are multiple growth vectors ahead of us which make this market opportunity so compelling. As we move forward to capitalize on this, we will continue to use the growth and margin expansion roadmap that we have followed since our IPO. That roadmap consists of the following: acquire new customers, increase share of wallet for existing customers, expand assortment, grow proprietary brands and healthcare offerings, launch services, and – when the time is right – expand the business outside of the US. As we execute in each of these areas, we will continue to invest wisely to grow our base of recurring revenues, scale our operating expenses, and drive profitable long-term growth. Growing Share of Wallet Across Customer Cohorts Increased share of wallet is a truly powerful growth catalyst. We captured 12 percent more initial share of wallet from our 2020 new customer cohort than we did from their 2019 predecessors, and we accomplished this while absorbing our largest new customer cohort ever. An additional data point which gives us confidence that our efforts are delivering results is the fact that Year 1 contribution profit per customer — which we calculate as gross profit, less variable costs — has increased at an average annual rate of 16 percent over the past two years. We believe that these gains in share of wallet and profitability are the direct result of our efforts and reflect the impact of catalog expansion, improved discoverability, and the incremental contributions from high-margin verticals like healthcare, hardgoods, and proprietary brands. For example, in the past three years, we have nearly doubled our total SKU count, which includes a seven-fold increase in higher- margin proprietary brands SKUs. With our continued success in healthcare, we are unlocking value for ourselves, our customers, and our partners in a large and growing $35 billion market opportunity that gives us yet another opportunity to expand our share of wallet. We recently launched two services in the healthcare space: ‘Connect with a Vet’ and medicine compounding. In 2020, these services were live for just a few months, but in 2021 we will get 12 full months of the financial benefits that these services provide as well as the vital knowledge that we continue to accumulate as we operate and refine these businesses.
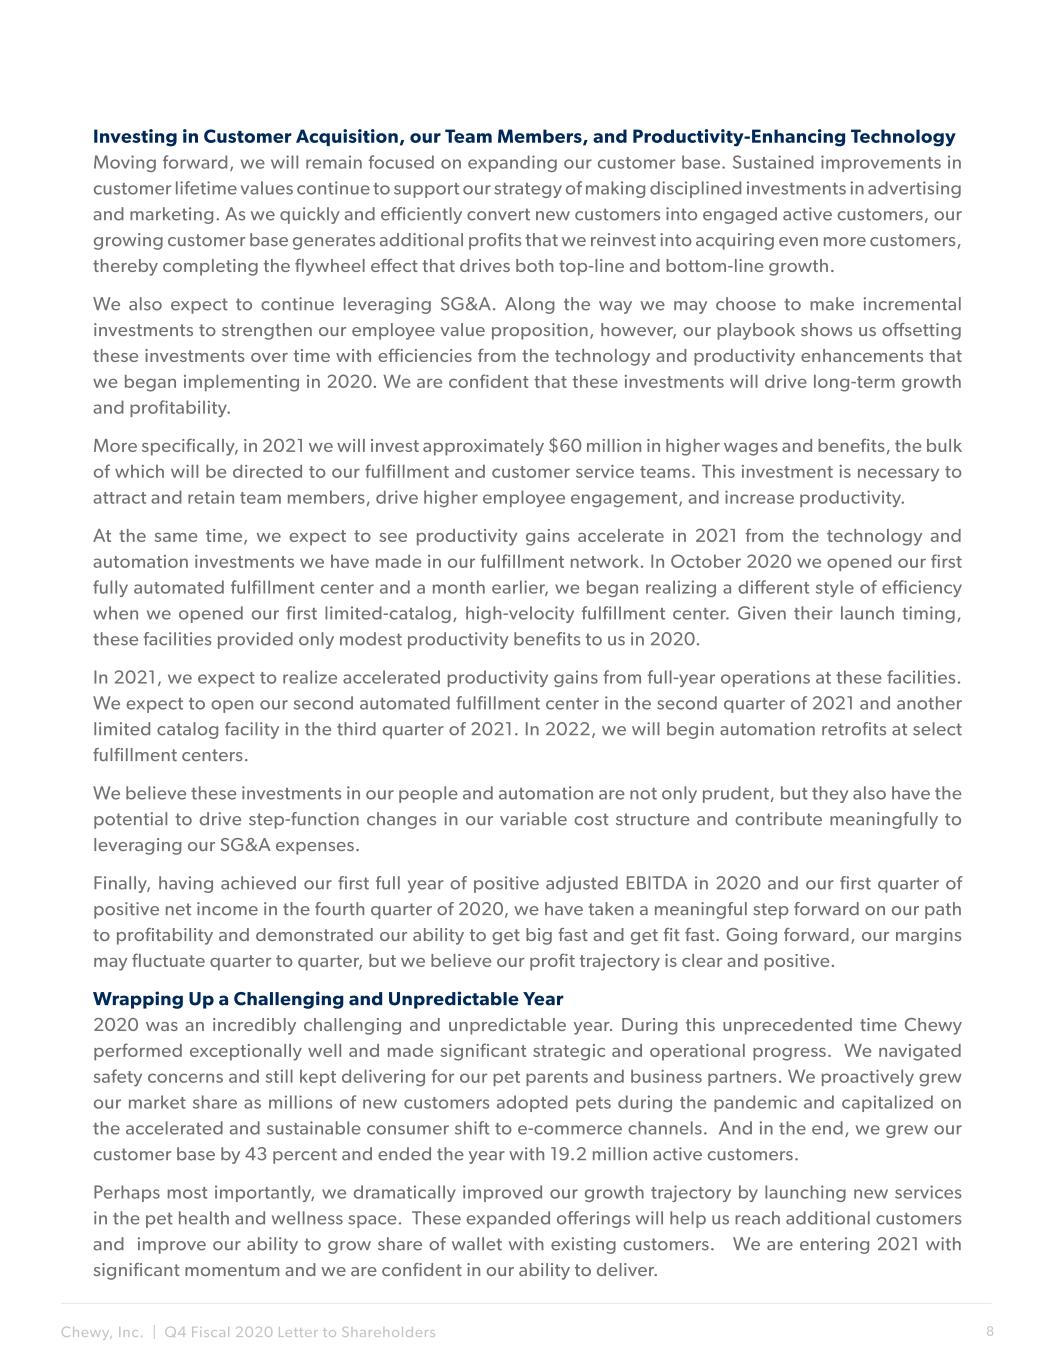
Chewy, Inc. | Q4 Fiscal 2020 Letter to Shareholders 8 Investing in Customer Acquisition, our Team Members, and Productivity-Enhancing Technology Moving forward, we will remain focused on expanding our customer base. Sustained improvements in customer lifetime values continue to support our strategy of making disciplined investments in advertising and marketing. As we quickly and efficiently convert new customers into engaged active customers, our growing customer base generates additional profits that we reinvest into acquiring even more customers, thereby completing the flywheel effect that drives both top-line and bottom-line growth. We also expect to continue leveraging SG&A. Along the way we may choose to make incremental investments to strengthen our employee value proposition, however, our playbook shows us offsetting these investments over time with efficiencies from the technology and productivity enhancements that we began implementing in 2020. We are confident that these investments will drive long-term growth and profitability. More specifically, in 2021 we will invest approximately $60 million in higher wages and benefits, the bulk of which will be directed to our fulfillment and customer service teams. This investment is necessary to attract and retain team members, drive higher employee engagement, and increase productivity. At the same time, we expect to see productivity gains accelerate in 2021 from the technology and automation investments we have made in our fulfillment network. In October 2020 we opened our first fully automated fulfillment center and a month earlier, we began realizing a different style of efficiency when we opened our first limited-catalog, high-velocity fulfillment center. Given their launch timing, these facilities provided only modest productivity benefits to us in 2020. In 2021, we expect to realize accelerated productivity gains from full-year operations at these facilities. We expect to open our second automated fulfillment center in the second quarter of 2021 and another limited catalog facility in the third quarter of 2021. In 2022, we will begin automation retrofits at select fulfillment centers. We believe these investments in our people and automation are not only prudent, but they also have the potential to drive step-function changes in our variable cost structure and contribute meaningfully to leveraging our SG&A expenses. Finally, having achieved our first full year of positive adjusted EBITDA in 2020 and our first quarter of positive net income in the fourth quarter of 2020, we have taken a meaningful step forward on our path to profitability and demonstrated our ability to get big fast and get fit fast. Going forward, our margins may fluctuate quarter to quarter, but we believe our profit trajectory is clear and positive. Wrapping Up a Challenging and Unpredictable Year 2020 was an incredibly challenging and unpredictable year. During this unprecedented time Chewy performed exceptionally well and made significant strategic and operational progress. We navigated safety concerns and still kept delivering for our pet parents and business partners. We proactively grew our market share as millions of new customers adopted pets during the pandemic and capitalized on the accelerated and sustainable consumer shift to e-commerce channels. And in the end, we grew our customer base by 43 percent and ended the year with 19.2 million active customers. Perhaps most importantly, we dramatically improved our growth trajectory by launching new services in the pet health and wellness space. These expanded offerings will help us reach additional customers and improve our ability to grow share of wallet with existing customers. We are entering 2021 with significant momentum and we are confident in our ability to deliver.

Chewy, Inc. | Q4 Fiscal 2020 Letter to Shareholders 9 Q4 Fiscal 2020 Financial Highlights Our strong fourth-quarter finish to 2020 sets the stage for continued top line growth and profitability expansion in 2021. Net sales grew 50.8 percent year over year, while gross margin reached 27.1 percent, thanks in part to continued growth from our hardgoods and proprietary brands verticals. In 2020 we recorded our first full year of positive adjusted EBITDA, and in the fourth quarter, we produced our first quarter of positive net income. NOTE: Gross Margin is defined as Gross Profit divided by Net Sales. Net sales increased 50.8 percent year over year to $2.04 billion. Key revenue drivers in the quarter were a 42.7 percent increase in active customers and a 3.3 percent increase in net sales per active customer, to $372. Momentum from a strong holiday season carried into January as the pricing and promotional environment remained favorable. Net Sales Autoship customer sales were $1.39 billion, a year- over-year increase of 46.1 percent and represented 68.2 percent of total net sales. We define Autoship customers as customers for whom an order has shipped through our Autoship subscription program during the preceding 364-day period. Autoship provides pet parents with convenient and flexible automatic reordering and delivery that makes meeting their recurring needs even easier. Autoship Customer Sales Gross margin improved 300 basis points to 27.1 percent. Approximately half of the 300 basis point increase in fourth-quarter gross margin came from structural and sustainable drivers like incremental scale benefits and greater penetration rates into higher-margin verticals like hardgoods, proprietary brands, and healthcare. The other half of the increase came from a favorable pricing and promotional environment throughout the quarter. Gross Margin ($Millions) ($Millions)
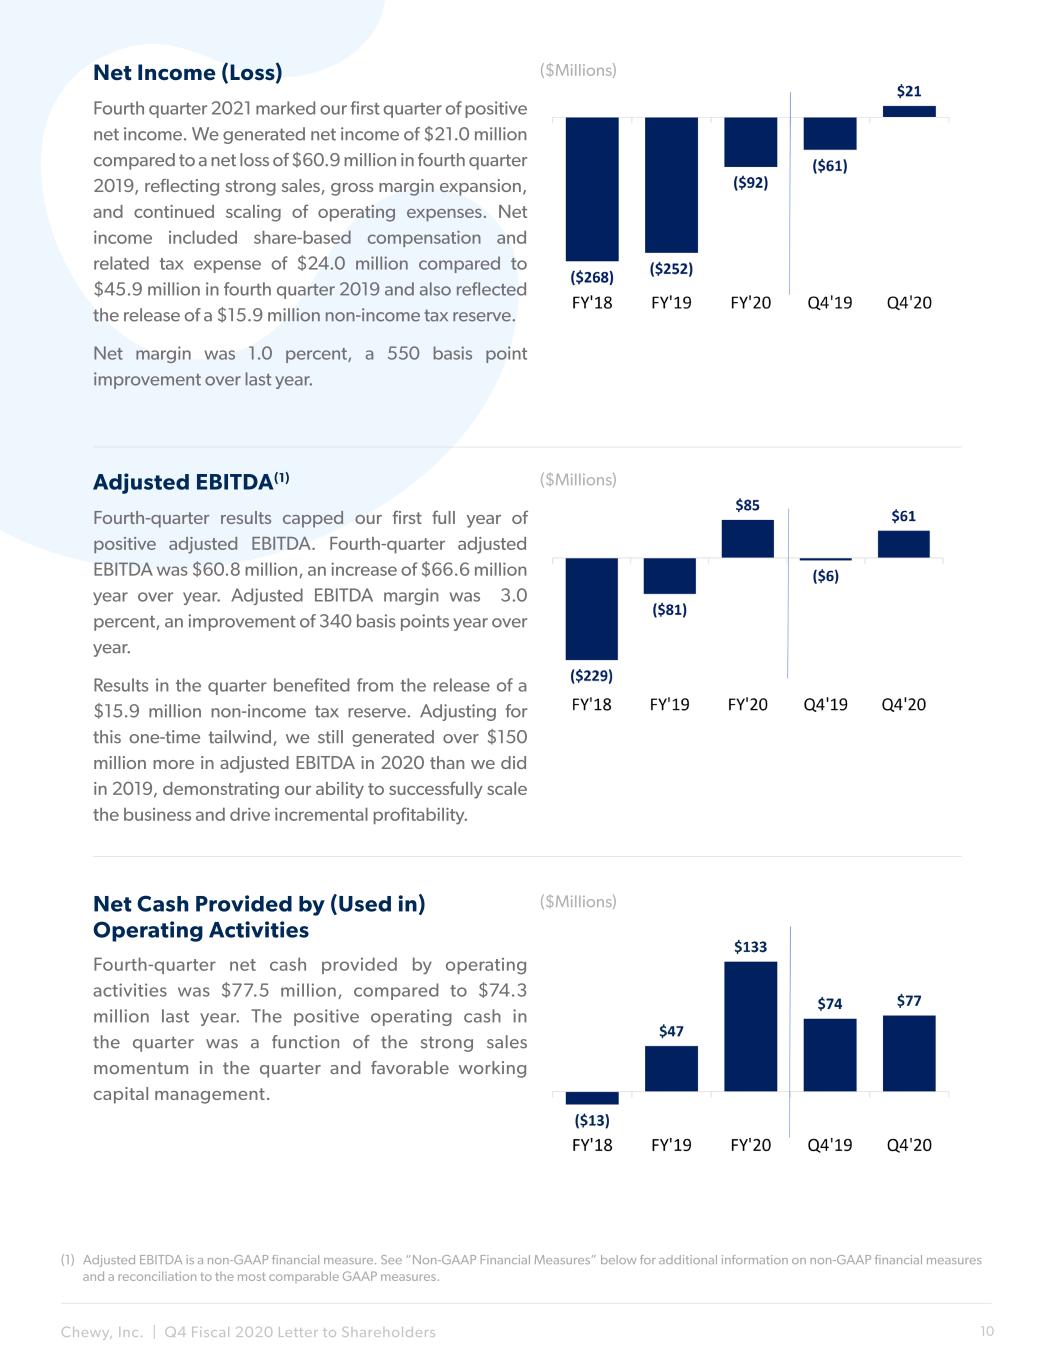
Chewy, Inc. | Q4 Fiscal 2020 Letter to Shareholders 10 Fourth quarter 2021 marked our first quarter of positive net income. We generated net income of $21.0 million compared to a net loss of $60.9 million in fourth quarter 2019, reflecting strong sales, gross margin expansion, and continued scaling of operating expenses. Net income included share-based compensation and related tax expense of $24.0 million compared to $45.9 million in fourth quarter 2019 and also reflected the release of a $15.9 million non-income tax reserve. Net margin was 1.0 percent, a 550 basis point improvement over last year. Net Income (Loss) Fourth-quarter results capped our first full year of positive adjusted EBITDA. Fourth-quarter adjusted EBITDA was $60.8 million, an increase of $66.6 million year over year. Adjusted EBITDA margin was 3.0 percent, an improvement of 340 basis points year over year. Results in the quarter benefited from the release of a $15.9 million non-income tax reserve. Adjusting for this one-time tailwind, we still generated over $150 million more in adjusted EBITDA in 2020 than we did in 2019, demonstrating our ability to successfully scale the business and drive incremental profitability. Adjusted EBITDA(1) Fourth-quarter net cash provided by operating activities was $77.5 million, compared to $74.3 million last year. The positive operating cash in the quarter was a function of the strong sales momentum in the quarter and favorable working capital management. Net Cash Provided by (Used in) Operating Activities ($Millions) ($Millions) ($Millions) (1) Adjusted EBITDA is a non-GAAP financial measure. See “Non-GAAP Financial Measures” below for additional information on non-GAAP financial measures and a reconciliation to the most comparable GAAP measures.
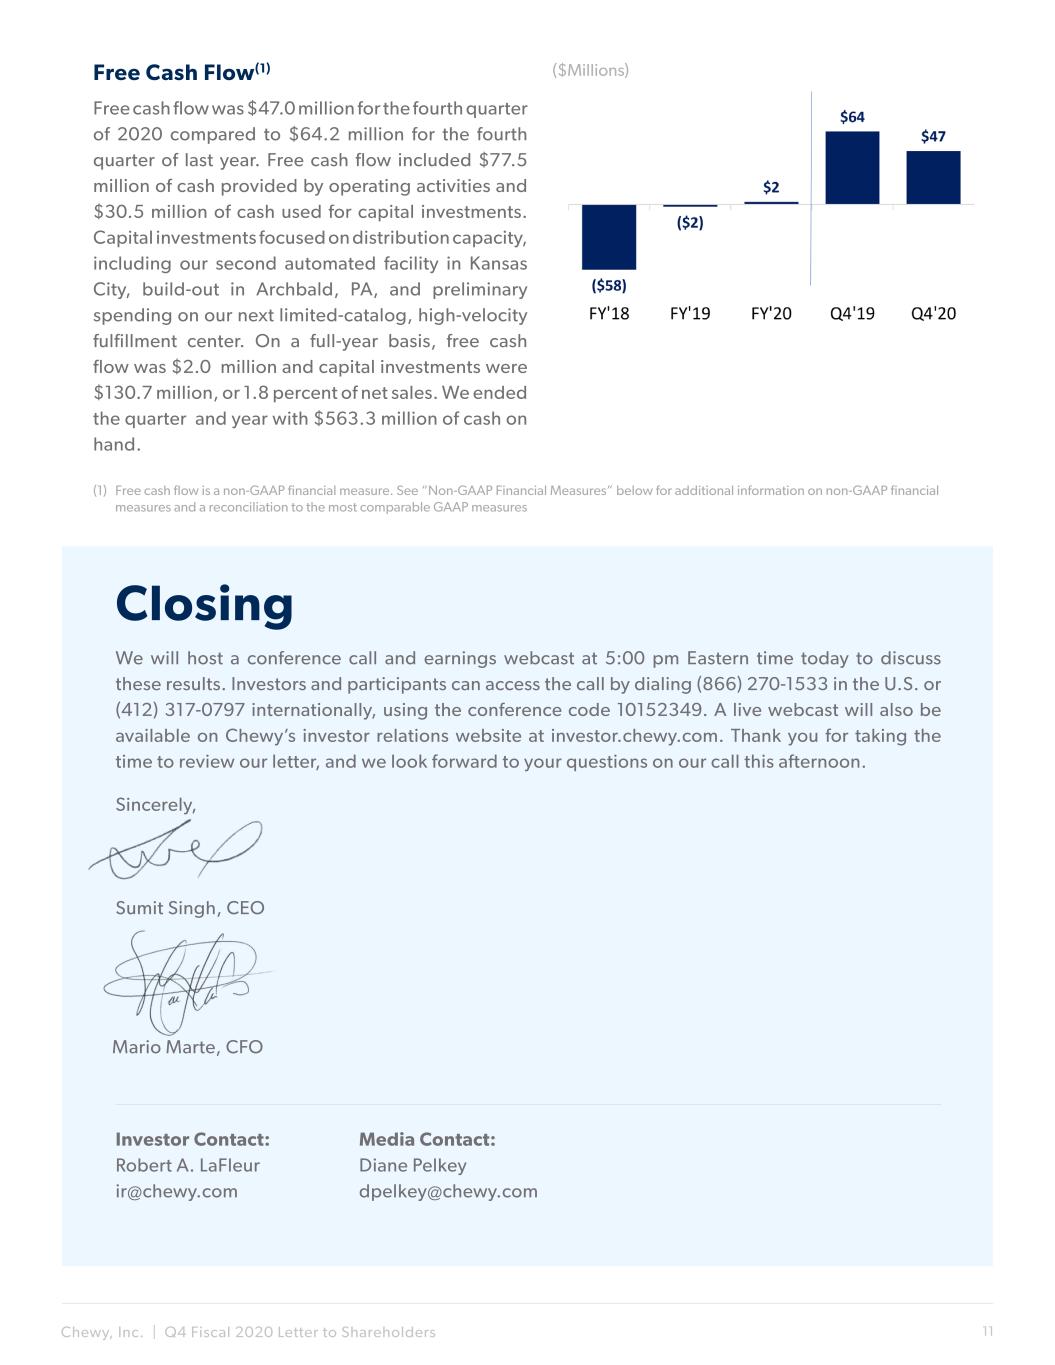
Chewy, Inc. | Q4 Fiscal 2020 Letter to Shareholders 11 Free cash flow was $47.0 million for the fourth quarter of 2020 compared to $64.2 million for the fourth quarter of last year. Free cash flow included $77.5 million of cash provided by operating activities and $30.5 million of cash used for capital investments. Capital investments focused on distribution capacity, including our second automated facility in Kansas City, build-out in Archbald, PA, and preliminary spending on our next limited-catalog, high-velocity fulfillment center. On a full-year basis, free cash flow was $2.0 million and capital investments were $130.7 million, or 1.8 percent of net sales. We ended the quarter and year with $563.3 million of cash on hand. We will host a conference call and earnings webcast at 5:00 pm Eastern time today to discuss these results. Investors and participants can access the call by dialing (866) 270-1533 in the U.S. or (412) 317-0797 internationally, using the conference code 10152349. A live webcast will also be available on Chewy’s investor relations website at investor.chewy.com. Thank you for taking the time to review our letter, and we look forward to your questions on our call this afternoon. Sincerely, Sumit Singh, CEO Free Cash Flow(1) Media Contact: Diane Pelkey dpelkey@chewy.com Investor Contact: Robert A. LaFleur ir@chewy.com Closing ($Millions) Mario Marte, CFO (1) Free cash flow is a non-GAAP financial measure. See “Non-GAAP Financial Measures” below for additional information on non-GAAP financial measures and a reconciliation to the most comparable GAAP measures
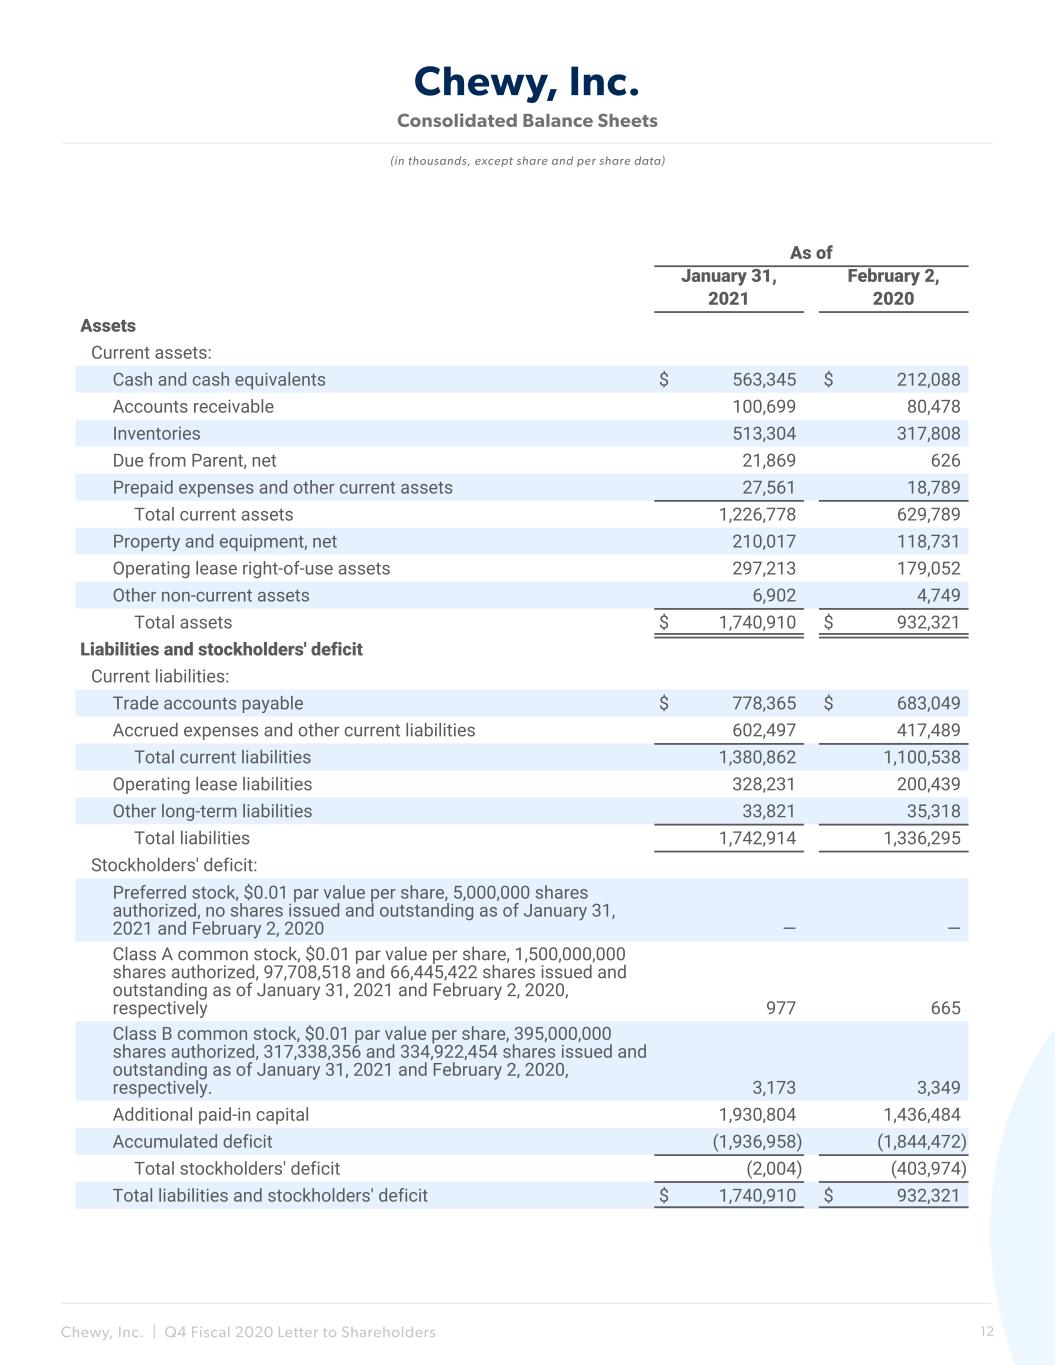
Chewy, Inc. | Q4 Fiscal 2020 Letter to Shareholders 12 Consolidated Balance Sheets Chewy, Inc. (in thousands, except share and per share data) As of January 31, February 2, 2021 2020 Assets Current assets: Cash and cash equivalents $ 563,345 $ 212,088 Accounts receivable 100,699 80,478 Inventories 513,304 317,808 Due from Parent, net 21,869 626 Prepaid expenses and other current assets 27,561 18,789 Total current assets 1,226,778 629,789 Property and equipment, net 210,017 118,731 Operating lease right-of-use assets 297,213 179,052 Other non-current assets 6,902 4,749 Total assets $ 1,740,910 $ 932,321 Liabilities and stockholders' deficit Current liabilities: Trade accounts payable $ 778,365 $ 683,049 Accrued expenses and other current liabilities 602,497 417,489 Total current liabilities 1,380,862 1,100,538 Operating lease liabilities 328,231 200,439 Other long-term liabilities 33,821 35,318 Total liabilities 1,742,914 1,336,295 Stockholders' deficit: Preferred stock, $0.01 par value per share, 5,000,000 shares authorized, no shares issued and outstanding as of January 31, 2021 and February 2, 2020 — — Class A common stock, $0.01 par value per share, 1,500,000,000 shares authorized, 97,708,518 and 66,445,422 shares issued and outstanding as of January 31, 2021 and February 2, 2020, respectively 977 665 Class B common stock, $0.01 par value per share, 395,000,000 shares authorized, 317,338,356 and 334,922,454 shares issued and outstanding as of January 31, 2021 and February 2, 2020, respectively. 3,173 3,349 Additional paid-in capital 1,930,804 1,436,484 Accumulated deficit (1,936,958) (1,844,472) Total stockholders' deficit (2,004) (403,974) Total liabilities and stockholders' deficit $ 1,740,910 $ 932,321 Chewy, Inc.

Chewy, Inc. | Q4 Fiscal 2020 Letter to Shareholders 13 Chewy, Inc. Condensed Consolidated Statements of Operations Chewy, Inc. (in thousands, except per share data, Unaudited) 13 Weeks Ended 52 Weeks Ended January 31, 2021 February 2, 2020 January 31, 2021 February 2, 2020 Net sales $ 2,043,012 $ 1,354,525 $ 7,146,264 $ 4,846,743 Cost of goods sold 1,488,828 1,028,370 5,325,457 3,702,683 Gross profit 554,184 326,155 1,820,807 1,144,060 Operating expenses: Selling, general and administrative 382,481 284,942 1,397,969 969,890 Advertising and marketing 150,102 101,810 513,302 426,896 Total operating expenses 532,583 386,752 1,911,271 1,396,786 Income (loss) from operations 21,601 (60,597) (90,464) (252,726) Interest (expense) income, net (553) (343) (2,022) 356 Income (loss) before income tax provision 21,048 (60,940) (92,486) (252,370) Income tax provision — — — — Net income (loss) $ 21,048 $ (60,940) $ (92,486) $ (252,370) Net income (loss) per share attributable to common Class A and Class B stockholders, basic $ 0.05 $ (0.15) $ (0.23) $ (0.63) Net income (loss) per share attributable to common Class A and Class B stockholders, diluted $ 0.05 $ (0.15) $ (0.23) $ (0.63) Weighted average common shares used in computing net income (loss) per share attributable to common Class A and Class B stockholders, basic 413,918 401,319 407,240 398,256 Weighted average common shares used in computing net income (loss) per share attributable to common Class A and Class B stockholders, diluted (1) 427,451 401,319 407,240 398,256 (1) The thirteen weeks ended January 31, 2021 exclude the dilutive effect of 1.5 million potential common shares from stock-based awards.
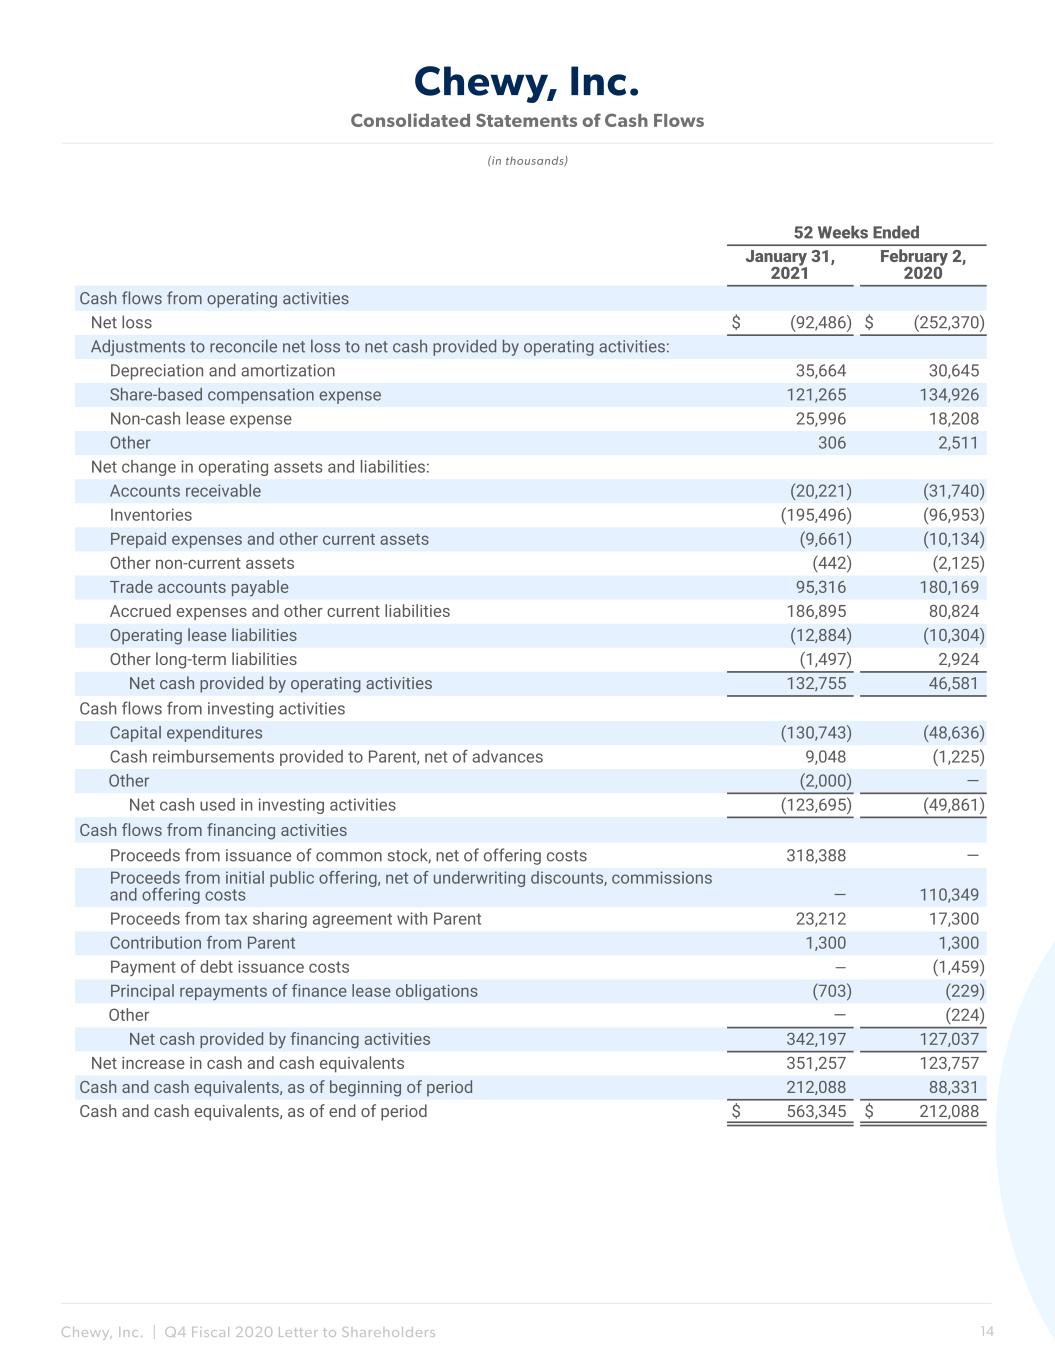
Chewy, Inc. | Q4 Fiscal 2020 Letter to Shareholders 14 Consolidated Statements of Cash Flows Chewy, Inc. (in thousands) 52 Weeks Ended January 31, 2021 February 2, 2020 Cash flows from operating activities Net loss $ (92,486) $ (252,370) Adjustments to reconcile net loss to net cash provided by operating activities: Depreciation and amortization 35,664 30,645 Share-based compensation expense 121,265 134,926 Non-cash lease expense 25,996 18,208 Other 306 2,511 Net change in operating assets and liabilities: Accounts receivable (20,221) (31,740) Inventories (195,496) (96,953) Prepaid expenses and other current assets (9,661) (10,134) Other non-current assets (442) (2,125) Trade accounts payable 95,316 180,169 Accrued expenses and other current liabilities 186,895 80,824 Operating lease liabilities (12,884) (10,304) Other long-term liabilities (1,497) 2,924 Net cash provided by operating activities 132,755 46,581 Cash flows from investing activities Capital expenditures (130,743) (48,636) Cash reimbursements provided to Parent, net of advances 9,048 (1,225) Other (2,000) — Net cash used in investing activities (123,695) (49,861) Cash flows from financing activities Proceeds from issuance of common stock, net of offering costs 318,388 — Proceeds from initial public offering, net of underwriting discounts, commissions and offering costs — 110,349 Proceeds from tax sharing agreement with Parent 23,212 17,300 Contribution from Parent 1,300 1,300 Payment of debt issuance costs — (1,459) Principal repayments of finance lease obligations (703) (229) Other — (224) Net cash provided by financing activities 342,197 127,037 Net increase in cash and cash equivalents 351,257 123,757 Cash and cash equivalents, as of beginning of period 212,088 88,331 Cash and cash equivalents, as of end of period $ 563,345 $ 212,088

Chewy, Inc. | Q4 Fiscal 2020 Letter to Shareholders 15 Chewy, Inc. Non-GAAP Financial Measures Adjusted EBITDA and Adjusted EBITDA Margin To provide investors with additional information regarding our financial results, we disclose adjusted EBITDA, a non-GAAP financial measure that we calculate as net income (loss) excluding depreciation and amortization; share-based compensation expense and related taxes; income tax provision; interest income (expense), net; management fee expense; transaction related costs; and litigation matters and other items that we do not consider representative of our underlying operations. We have provided a reconciliation below of adjusted EBITDA to net income (loss), the most directly comparable GAAP financial measure. We include adjusted EBITDA because it is a key measure used by our management and board of directors to evaluate our operating performance, generate future operating plans and make strategic decisions regarding the allocation of capital. In particular, the exclusion of certain expenses in calculating adjusted EBITDA facilitates operating performance comparability across reporting periods by removing the effect of non- cash expenses and certain variable charges. Accordingly, we believe that adjusted EBITDA provides useful information to investors and others in understanding and evaluating our operating results in the same manner as our management and board of directors. We believe it is useful to exclude non-cash charges, such as depreciation and amortization, share-based compensation expense and management fee expense from our adjusted EBITDA because the amount of such expenses in any specific period may not directly correlate to the underlying performance of our business operations. We believe it is useful to exclude income tax provision; interest income (expense), net; transaction related costs; and litigation matters and other items which are not components of our core business operations. Adjusted EBITDA has limitations as a financial measure and you should not consider it in isolation or as a substitute for analysis of our results as reported under GAAP. Some of these limitations are: • although depreciation and amortization are non-cash charges, the assets being depreciated and amortized may have to be replaced in the future and adjusted EBITDA does not reflect capital expenditure requirements for such replacements or for new capital expenditures; • adjusted EBITDA does not reflect share-based compensation and related taxes. Share-based compensation has been, and will continue to be for the foreseeable future, a recurring expense in our business and an important part of our compensation strategy; • adjusted EBITDA does not reflect interest income (expense), net; or changes in, or cash requirements for, our working capital; • adjusted EBITDA does not reflect transaction related costs (e.g. IPO costs) and other items which are either not representative of our underlying operations or are incremental costs that result from an actual or planned transaction and include litigation matters, integration consulting fees, internal salaries and wages (to the extent the individuals are assigned full-time to integration and transformation activities) and certain costs related to integrating and converging IT systems; and • other companies, including companies in our industry, may calculate adjusted EBITDA differently, which reduces its usefulness as a comparative measure. Because of these limitations, you should consider adjusted EBITDA and adjusted EBITDA margin alongside other financial performance measures, including various cash flow metrics, net income (loss), net margin, and our other GAAP results.
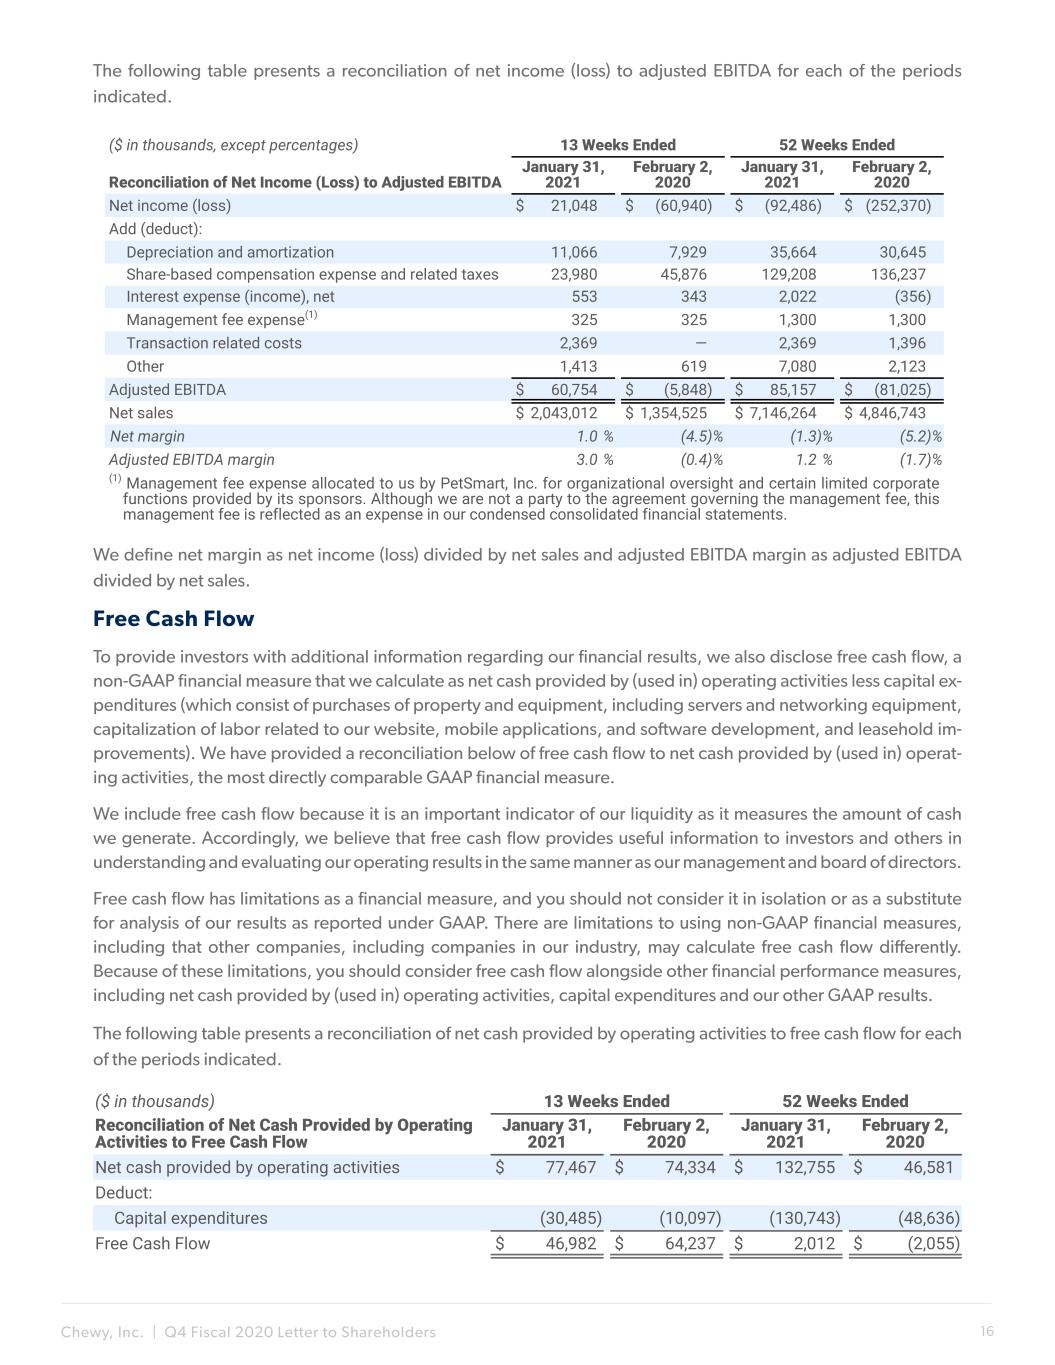
Chewy, Inc. | Q4 Fiscal 2020 Letter to Shareholders 16 The following table presents a reconciliation of net income (loss) to adjusted EBITDA for each of the periods indicated. Free Cash Flow To provide investors with additional information regarding our financial results, we also disclose free cash flow, a non-GAAP financial measure that we calculate as net cash provided by (used in) operating activities less capital ex- penditures (which consist of purchases of property and equipment, including servers and networking equipment, capitalization of labor related to our website, mobile applications, and software development, and leasehold im- provements). We have provided a reconciliation below of free cash flow to net cash provided by (used in) operat- ing activities, the most directly comparable GAAP financial measure. We include free cash flow because it is an important indicator of our liquidity as it measures the amount of cash we generate. Accordingly, we believe that free cash flow provides useful information to investors and others in understanding and evaluating our operating results in the same manner as our management and board of directors. Free cash flow has limitations as a financial measure, and you should not consider it in isolation or as a substitute for analysis of our results as reported under GAAP. There are limitations to using non-GAAP financial measures, including that other companies, including companies in our industry, may calculate free cash flow differently. Because of these limitations, you should consider free cash flow alongside other financial performance measures, including net cash provided by (used in) operating activities, capital expenditures and our other GAAP results. The following table presents a reconciliation of net cash provided by operating activities to free cash flow for each of the periods indicated. We define net margin as net income (loss) divided by net sales and adjusted EBITDA margin as adjusted EBITDA divided by net sales. ($ in thousands, except percentages) 13 Weeks Ended 52 Weeks Ended Reconciliation of Net Income (Loss) to Adjusted EBITDA January 31, 2021 February 2, 2020 January 31, 2021 February 2, 2020 Net income (loss) $ 21,048 $ (60,940) $ (92,486) $ (252,370) Add (deduct): Depreciation and amortization 11,066 7,929 35,664 30,645 Share-based compensation expense and related taxes 23,980 45,876 129,208 136,237 Interest expense (income), net 553 343 2,022 (356) Management fee expense(1) 325 325 1,300 1,300 Transaction related costs 2,369 — 2,369 1,396 Other 1,413 619 7,080 2,123 Adjusted EBITDA $ 60,754 $ (5,848) $ 85,157 $ (81,025) Net sales $ 2,043,012 $ 1,354,525 $ 7,146,264 $ 4,846,743 Net margin 1.0 % (4.5) % (1.3) % (5.2) % Adjusted EBITDA margin 3.0 % (0.4) % 1.2 % (1.7) % (1) Management fee expense allocated to us by PetSmart, Inc. for organizational oversight and certain limited corporate functions provided by its sponsors. Although we are not a party to the agreement governing the management fee, this management fee is reflected as an expense in our condensed consolidated financial statements. ($ in thousands) 13 Weeks Ended 52 Weeks Ended Reconciliation of Net Cash Provided by Operating Activities to Free Cash Flow January 31, 2021 February 2, 2020 January 31, 2021 February 2, 2020 Net cash provided by operating activities $ 77,467 $ 74,334 $ 132,755 $ 46,581 Deduct: Capital expenditures (30,485) (10,097) (130,743) (48,636) Free Cash Flow $ 46,982 $ 64,237 $ 2,012 $ (2,055)
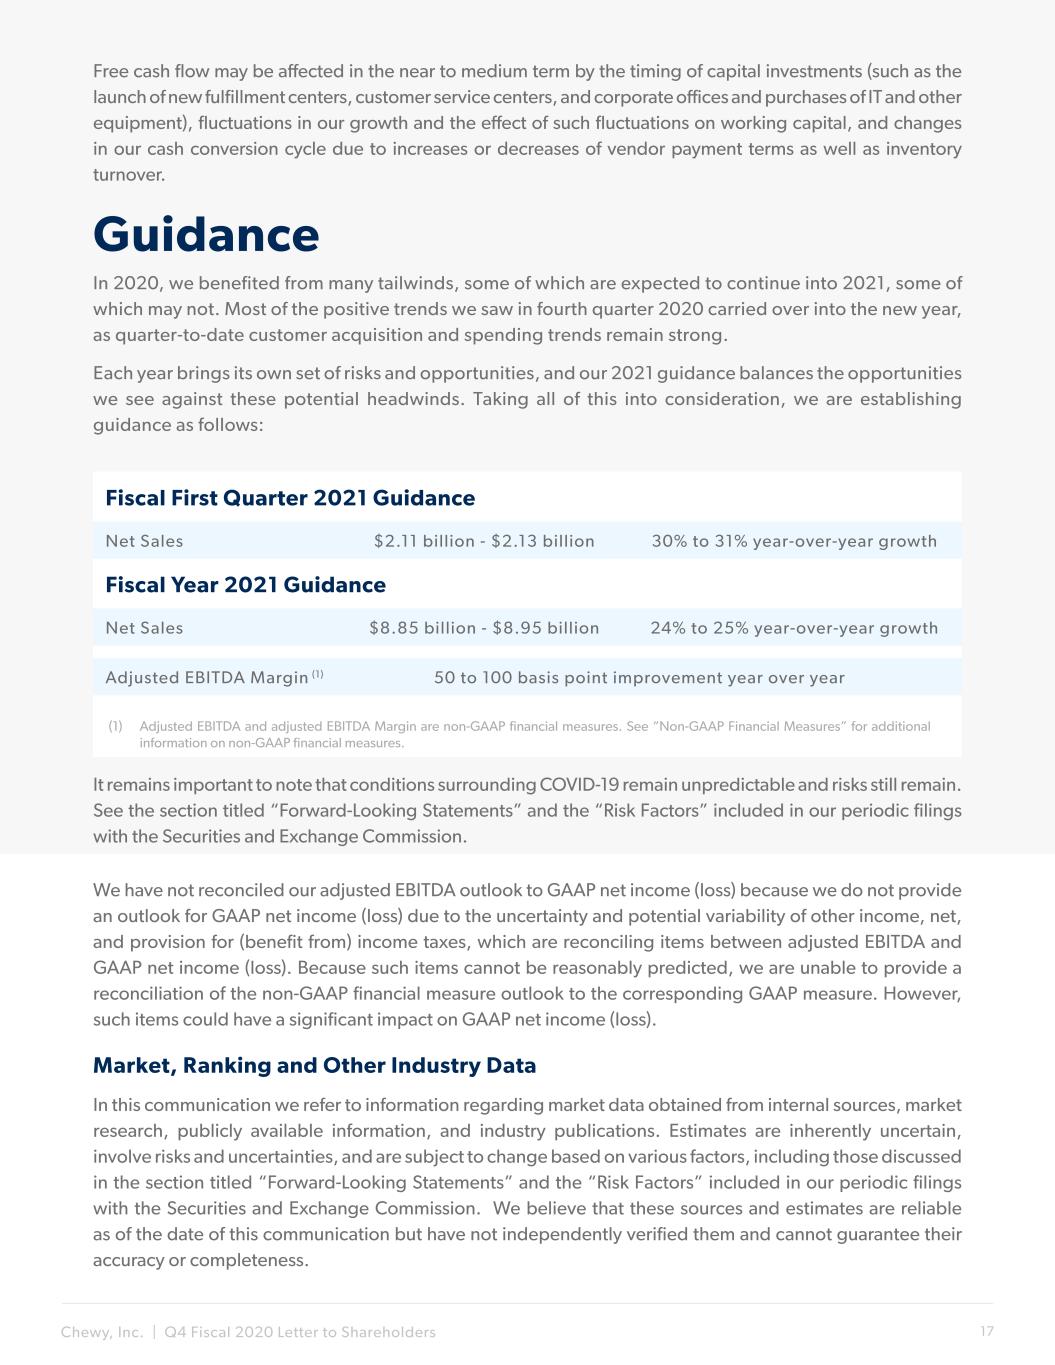
Chewy, Inc. | Q4 Fiscal 2020 Letter to Shareholders 17 Fiscal First Quarter 2021 Guidance Market, Ranking and Other Industry Data In this communication we refer to information regarding market data obtained from internal sources, market research, publicly available information, and industry publications. Estimates are inherently uncertain, involve risks and uncertainties, and are subject to change based on various factors, including those discussed in the section titled “Forward-Looking Statements” and the “Risk Factors” included in our periodic filings with the Securities and Exchange Commission. We believe that these sources and estimates are reliable as of the date of this communication but have not independently verified them and cannot guarantee their accuracy or completeness. We have not reconciled our adjusted EBITDA outlook to GAAP net income (loss) because we do not provide an outlook for GAAP net income (loss) due to the uncertainty and potential variability of other income, net, and provision for (benefit from) income taxes, which are reconciling items between adjusted EBITDA and GAAP net income (loss). Because such items cannot be reasonably predicted, we are unable to provide a reconciliation of the non-GAAP financial measure outlook to the corresponding GAAP measure. However, such items could have a significant impact on GAAP net income (loss). Fiscal Year 2021 Guidance Adjusted EBITDA Margin (1) (1) Adjusted EBITDA and adjusted EBITDA Margin are non-GAAP financial measures. See “Non-GAAP Financial Measures” for additional information on non-GAAP financial measures. It remains important to note that conditions surrounding COVID-19 remain unpredictable and risks still remain. See the section titled “Forward-Looking Statements” and the “Risk Factors” included in our periodic filings with the Securities and Exchange Commission. 50 to 100 basis point improvement year over year Net Sales $2.11 billion - $2.13 billion 30% to 31% year-over-year growth Net Sales $8.85 billion - $8.95 billion 24% to 25% year-over-year growth Free cash flow may be affected in the near to medium term by the timing of capital investments (such as the launch of new fulfillment centers, customer service centers, and corporate offices and purchases of IT and other equipment), fluctuations in our growth and the effect of such fluctuations on working capital, and changes in our cash conversion cycle due to increases or decreases of vendor payment terms as well as inventory turnover. Guidance In 2020, we benefited from many tailwinds, some of which are expected to continue into 2021, some of which may not. Most of the positive trends we saw in fourth quarter 2020 carried over into the new year, as quarter-to-date customer acquisition and spending trends remain strong. Each year brings its own set of risks and opportunities, and our 2021 guidance balances the opportunities we see against these potential headwinds. Taking all of this into consideration, we are establishing guidance as follows:

Chewy, Inc. | Q4 Fiscal 2020 Letter to Shareholders 18 Forward-Looking Statements This communication contains forward-looking statements about us and our industry that involve substantial risks and uncertainties. All statements other than statements of historical facts contained in this communication, including statements regarding our future results of operations or financial condition, business strategy and plans and objectives of management for future operations, are forward-looking statements. In some cases, you can identify forward-looking statements because they contain words such as “anticipate,” “believe,” “contemplate,” “continue,” “could,” “estimate,” “expect,” “intend,” “may,” “plan,” “potential,” “predict,” “project,” “should,” “target,” “will” or “would” or the negative of these words or other similar terms or expressions. These forward-looking statements include, but are not limited to, statements concerning our ability to: successfully manage risks relating to the spread of COVID-19, including any adverse impacts on our supply chain, workforce, facilities, customer services, and operations; sustain our recent growth rates and manage our growth effectively; acquire new customers in a cost-effective manner and increase our net sales per active customer; accurately predict economic conditions, particularly the impact on economic conditions of the spread of COVID-19, and their impact on consumer spending patterns, particularly in the pet products market, and accurately forecast net sales and appropriately plan our expenses in the future; introduce new products or offerings and improve existing products; successfully compete in the pet products and services retail industry, especially in the e-commerce sector; source additional, or strengthen our existing relationships with, suppliers; negotiate acceptable pricing and other terms with third-party service providers, suppliers and outsourcing partners and maintain our relationships with such entities; optimize, operate and manage the expansion of the capacity of our fulfillment centers, including risks from the spread of COVID-19 relating to our plans to expand capacity and develop new facilities; provide our customers with a cost-effective platform that is able to respond and adapt to rapid changes in technology; maintain adequate cybersecurity with respect to our systems and ensure that our third-party service providers do the same with respect to their systems; successfully manufacture and sell our own proprietary brand products; maintain consumer confidence in the safety and quality of our vendor-supplied and proprietary brand food products and hardgood products; comply with existing or future laws and regulations in a cost-efficient manner; attract, develop, motivate and retain well-qualified employees; and adequately protect our intellectual property rights and successfully defend ourselves against any intellectual property infringement claims or other allegations that we may be subject to. You should not rely on forward-looking statements as predictions of future events. We have based the forward-looking statements contained in this communication primarily on our current expectations and projections about future events and trends that we believe may affect our business, financial condition, and results of operations. The outcome of the events described in these forward-looking statements is subject to risks, uncertainties and other factors described in our filings with the Securities and Exchange Commission and elsewhere in this communication. Moreover, we operate in a very competitive and rapidly-changing environment. New risks and uncertainties emerge from time to time, and it is not possible for us to predict all risks and uncertainties that could have an impact on the forward-looking statements contained in this communication. The results, events and circumstances reflected in the forward-looking statements may not be achieved or occur, and actual results, events or circumstances could differ materially from those described in the forward-looking statements. In addition, statements that “we believe” and similar statements reflect our beliefs and opinions on the relevant subject. These statements are based on information available to us as of the date of this communication. While we believe that information provides a reasonable basis for these statements, that information may be limited or incomplete. Our statements should not be read to indicate that we have conducted an exhaustive inquiry into, or review of, all relevant information. These statements are inherently uncertain, and investors are cautioned not to unduly rely on these statements. The forward-looking statements made in this communication relate only to events as of the date on which the statements are made. We undertake no obligation to update any forward-looking statements made in this communication to reflect events or circumstances after the date of this communication or to reflect new information or the occurrence of unanticipated events, except as required by law. We may not actually achieve the plans, intentions or expectations disclosed in our forward-looking statements, and you should not place undue reliance on our forward-looking statements. Our forward-looking statements do not reflect the potential impact of any future acquisitions, mergers, dispositions, joint ventures or investments.


