
Letter to Shareholders May 31, 2023 Q1 Fiscal 2023

Our mission To be the most trusted and convenient destination for pet parents and partners everywhere.
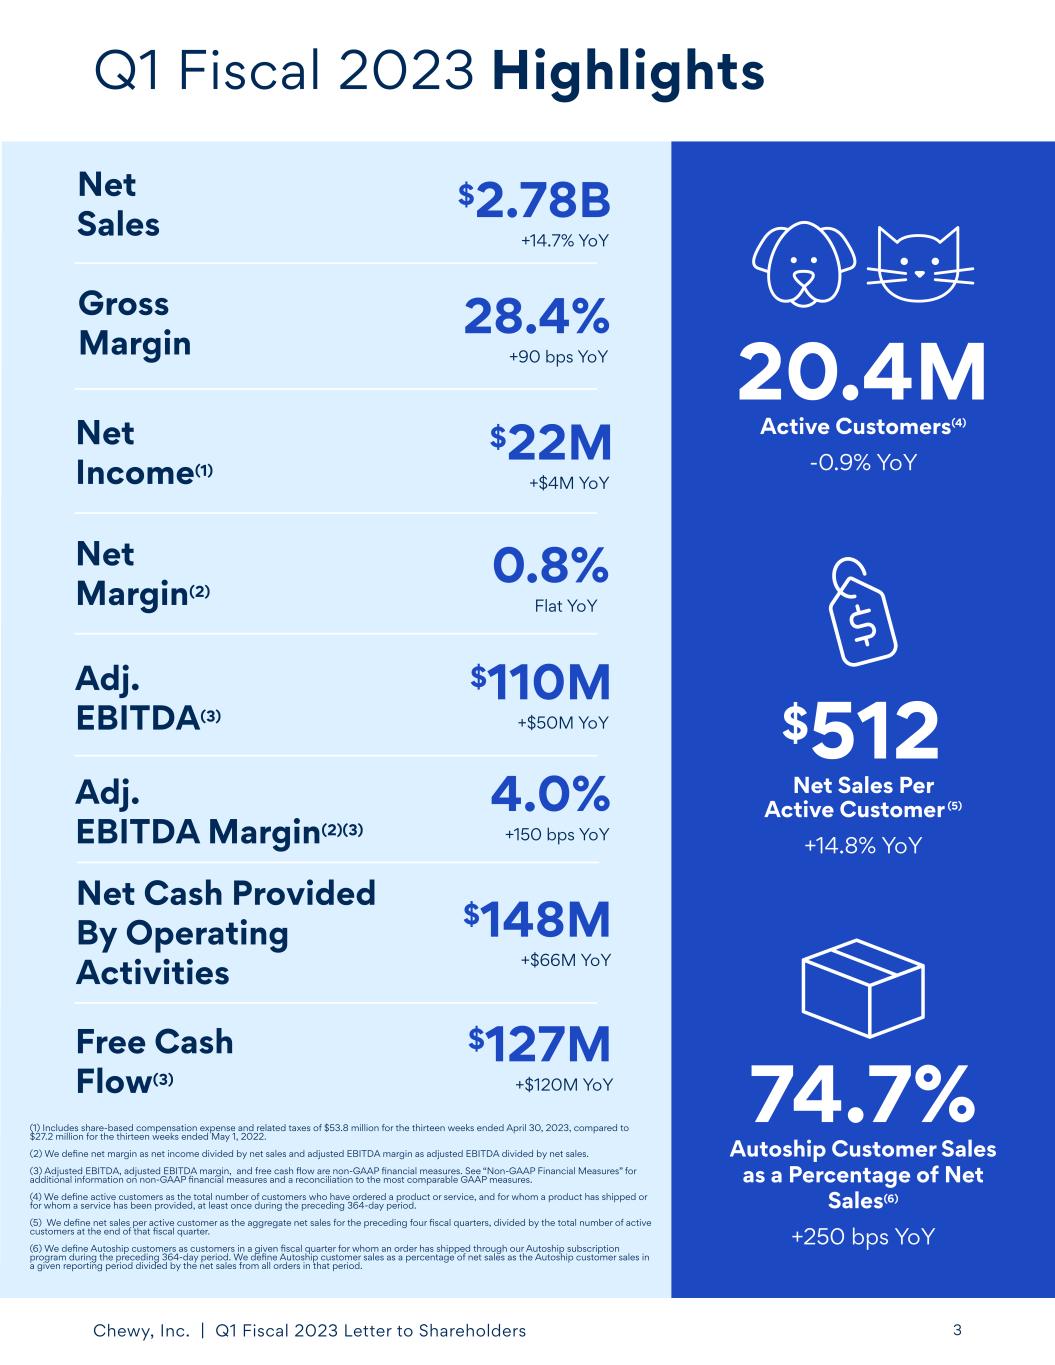
Chewy, Inc. | Q1 Fiscal 2023 Letter to Shareholders 3 Q1 Fiscal 2023 Highlights 74.7% Autoship Customer Sales as a Percentage of Net Sales(6) +250 bps YoY $512 Net Sales Per Active Customer (5) +14.8% YoY 20.4M Active Customers(4) -0.9% YoY Net Sales $2.78B +14.7% YoY Net Income(1) $22M +$4M YoY Adj. EBITDA(3) $110M +$50M YoY Free Cash Flow(3) $127M +$120M YoY Net Margin(2) 0.8% Flat YoY Gross Margin 28.4% +90 bps YoY Adj. EBITDA Margin(2)(3) 4.0% +150 bps YoY Net Cash Provided By Operating Activities $148M +$66M YoY (1) Includes share-based compensation expense and related taxes of $53.8 million for the thirteen weeks ended April 30, 2023, compared to $27.2 million for the thirteen weeks ended May 1, 2022. (2) We define net margin as net income divided by net sales and adjusted EBITDA margin as adjusted EBITDA divided by net sales. (3) Adjusted EBITDA, adjusted EBITDA margin, and free cash flow are non-GAAP financial measures. See “Non-GAAP Financial Measures” for additional information on non-GAAP financial measures and a reconciliation to the most comparable GAAP measures. (4) We define active customers as the total number of customers who have ordered a product or service, and for whom a product has shipped or for whom a service has been provided, at least once during the preceding 364-day period. (5) We define net sales per active customer as the aggregate net sales for the preceding four fiscal quarters, divided by the total number of active customers at the end of that fiscal quarter. (6) We define Autoship customers as customers in a given fiscal quarter for whom an order has shipped through our Autoship subscription program during the preceding 364-day period. We define Autoship customer sales as a percentage of net sales as the Autoship customer sales in a given reporting period divided by the net sales from all orders in that period.
Chewy, Inc. | Q1 Fiscal 2023 Letter to Shareholders 4 We are pleased to share our results for the first quarter ended April 30, 2023. Our value proposition continues to resonate strongly with customers, as we produced accelerating net sales and continue to deliver steady growth in profitability. Looking ahead, we are encouraged by the many initiatives that we expect to drive continued growth and innovation in the pet category, while delivering a progressively compelling experience for pet parents. First Quarter Financial Highlights: • Net sales of $2.78 billion, an increase of 14.7 percent year-over-year • Gross margin expanded 90 basis points year-over-year to 28.4 percent • Net Income was $22 million, and Net Margin remained flat year-over-year at 0.8 percent • Adjusted EBITDA was $110 million and adjusted EBITDA margin expanded 150 basis points to 4.0 percent Chewy’s mission is to be the most trusted and convenient destination for pet parents and partners everywhere. We believe we are positively transforming the industry with a superior value proposition that keeps our customers at the center of everything we do, from our high-touch customer service, to our broad assortment of brands, to delivering on the core e-commerce tenets of speed and convenience. We are maniacally focused on providing a truly unique and personalized shopping experience that builds trust, brand loyalty, and drives repeat purchasing. Dear Shareholder,
Chewy, Inc. | Q1 Fiscal 2023 Letter to Shareholders 5 A Strong Start to the Year Throughout the first quarter, customers remained engaged with our platform and shopping trends remained strong. As a result, we reported $2.78 billion in net sales, an approximately 15 percent year-over-year increase, and a 4 percent adjusted EBITDA margin. Our active customer base steadied, and net sales per active customer, or NSPAC, grew nearly 15 percent year-over-year to exceed $500. Consistent NSPAC growth is driven by strong and ongoing customer engagement in programs like Autoship, and expansion in cross-category purchases. Autoship customer sales represented nearly 75 percent of total net sales in the first quarter. Our Autoship subscription service is a powerful tool for us, driving recurring and predictable revenue and long-term customer loyalty. Net sales resulted from strength across the Consumables, Premium and Healthcare categories. Our customers continue to show durability and product loyalty in these non-discretionary categories with no discernable trade down behavior, all of which translated to strength in average order size or AOV. A healthy start to the flea and tick season further supported performance in our Healthcare business. Record Profitability in the Quarter Gross margin of 28.4 percent exceeded expectations and was buoyed by lower than anticipated promotional activity, overall strength in AOV, and better than expected leverage at the freight and packaging level. Adjusted EBITDA margin expanded to a record 4 percent for the quarter. Canada, Chewy’s First International Market We are excited to announce that we expect to bring Chewy’s superior value proposition, including our personalized and outstanding customer experience, to Canadian pet parents in the third quarter of this year. International expansion has long been a part of our strategic roadmap and there are several reasons that make now the right time for us to embark on this journey. First, we have strengthened our fundamentals over the past few years, both operationally and financially, and we have put our U.S. business on a steady trajectory of growth and profitability. Additionally, having undergone a multi-year transition of our tech stack into the cloud, we can now leverage our platform to be reliably deployed in Canada, without meaningful incremental investment. Q1 Fiscal 2023 Business Highlights
Chewy, Inc. | Q1 Fiscal 2023 Letter to Shareholders 6 As we assessed which geography would be most suitable for our expansion plans, we honed in on Canada’s large and growing market, where we see a path to achieving market share and profitability akin to our U.S. business. Canada has significant and increasing e-commerce penetration where we believe we can offer a differentiated value proposition relative to existing players in the market, and build the same level of trust with Canadian pet parents that those in the U.S. have come to associate with the Chewy brand. Our initial launch will focus on the Greater Toronto market, which represents the largest metropolitan area in Canada, from which we plan to take a gradual and responsible approach to expanding our footprint. Our service delivery model will leverage our assets to create operational efficiency and attractive economics, while ensuring a high-bar customer experience. Specifically, we intend to support our Canada strategy with a scaled, local third-party fulfillment and logistics partner. Our U.S. supply chain affords us an additional asset, and we will leverage our U.S. network in situations where it is strategically or economically advantaged to do so. Taken together, this approach allows us to launch in Canada with a focus on optimal customer experience and without any material commitment to capital spend, until the success and scale of the business supports an investment in this area. We do not anticipate this market requiring material capital investment through at least 2024. More broadly, on a company-wide level, we do not expect our investments in Canada to deviate us from our projected long-term profitability, cost or capital expenditure targets. Launched our Fourth Automated FC We launched our fourth automated fulfillment center, this one in Nashville, Tennessee. Our growing network of automated FCs, accompanied by our supply chain transformation, is improving margin efficiency and we believe will contribute to scaling SG&A over the long term. Careplus Insurance Portfolio Expands with Lemonade Partnership We are excited to announce the official launch of Lemonade as part of the CarePlus suite of wellness and insurance offerings. With this launch, CarePlus plans are now available across a wide spectrum of coverage options and price points, from two best-in-class providers, Lemonade and Trupanion, allowing us to meet the needs of a broader range of pet parents. We expect these plans to be available nationwide to the vast majority of our customers by next quarter. As we drive broader awareness and education around our insurance product offerings, we continue to see a compelling opportunity to expand TAM in this underpenetrated and highly profitable category.
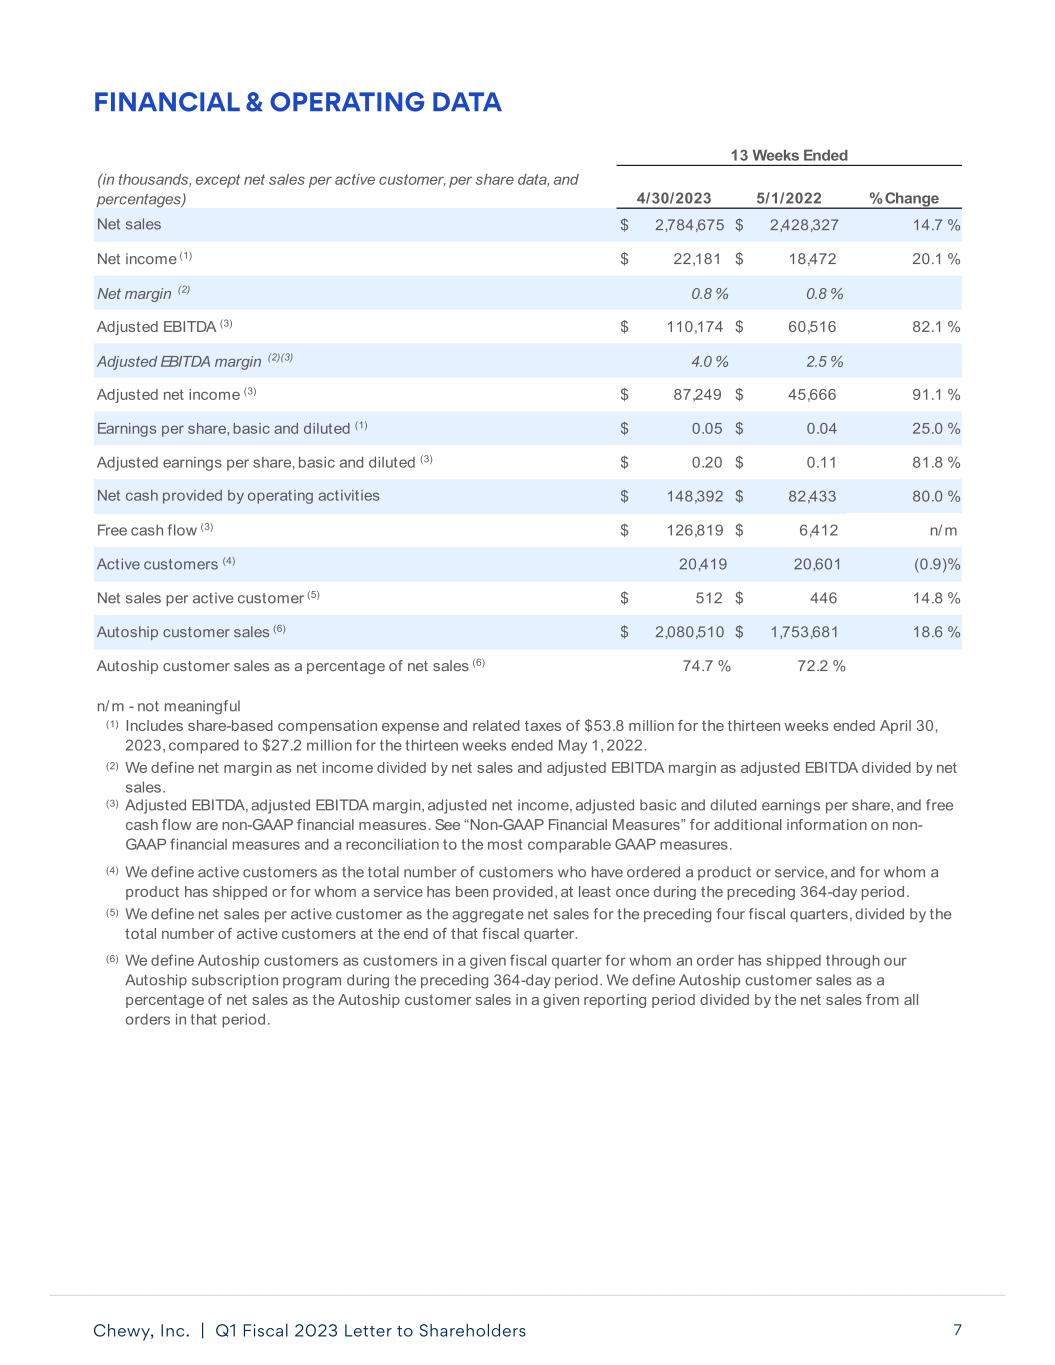
Chewy, Inc. | Q1 Fiscal 2023 Letter to Shareholders 7 FINANCIAL & OPERATING DATA 4/30/2023 5/1/2022 % Change $ 2,784,675 $ 2,428,327 14.7 % $ 22,181 $ 18,472 20.1 % 0.8 % 0.8 % $ 110,174 $ 60,516 82.1 % 4.0 % 2.5 % $ 87,249 $ 45,666 91.1 % $ 0.05 $ 0.04 25.0 % $ 0.20 $ 0.11 81.8 % $ 148,392 $ 82,433 80.0 % $ 126,819 $ 6,412 n/m 20,419 20,601 (0.9)% $ 512 $ 446 14.8 % $ 2,080,510 $ 1,753,681 18.6 % 74.7 % 72.2 % (1) (2) (3) (4) (5) (6) Adjusted EBITDA (3) Adjusted EBITDA margin (2)(3) Adjusted net income (3) Includes share-based compensation expense and related taxes of $53.8 million for the thirteen weeks ended April 30, 2023, compared to $27.2 million for the thirteen weeks ended May 1, 2022. (in thousands, except net sales per active customer, per share data, and percentages) Net sales Net income (1) Net margin (2) 13 Weeks Ended We define net margin as net income divided by net sales and adjusted EBITDA margin as adjusted EBITDA divided by net sales. Free cash flow (3) Earnings per share, basic and diluted (1) Active customers (4) Adjusted earnings per share, basic and diluted (3) Net sales per active customer (5) Net cash provided by operating activities Autoship customer sales (6) Autoship customer sales as a percentage of net sales (6) n/m - not meaningful Adjusted EBITDA, adjusted EBITDA margin, adjusted net income, adjusted basic and diluted earnings per share, and free cash flow are non-GAAP financial measures. See “Non-GAAP Financial Measures” for additional information on non- GAAP financial measures and a reconciliation to the most comparable GAAP measures. We define active customers as the total number of customers who have ordered a product or service, and for whom a product has shipped or for whom a service has been provided, at least once during the preceding 364-day period. We define net sales per active customer as the aggregate net sales for the preceding four fiscal quarters, divided by the total number of active customers at the end of that fiscal quarter. We define Autoship customers as customers in a given fiscal quarter for whom an order has shipped through our Autoship subscription program during the preceding 364-day period. We define Autoship customer sales as a percentage of net sales as the Autoship customer sales in a given reporting period divided by the net sales from all orders in that period.
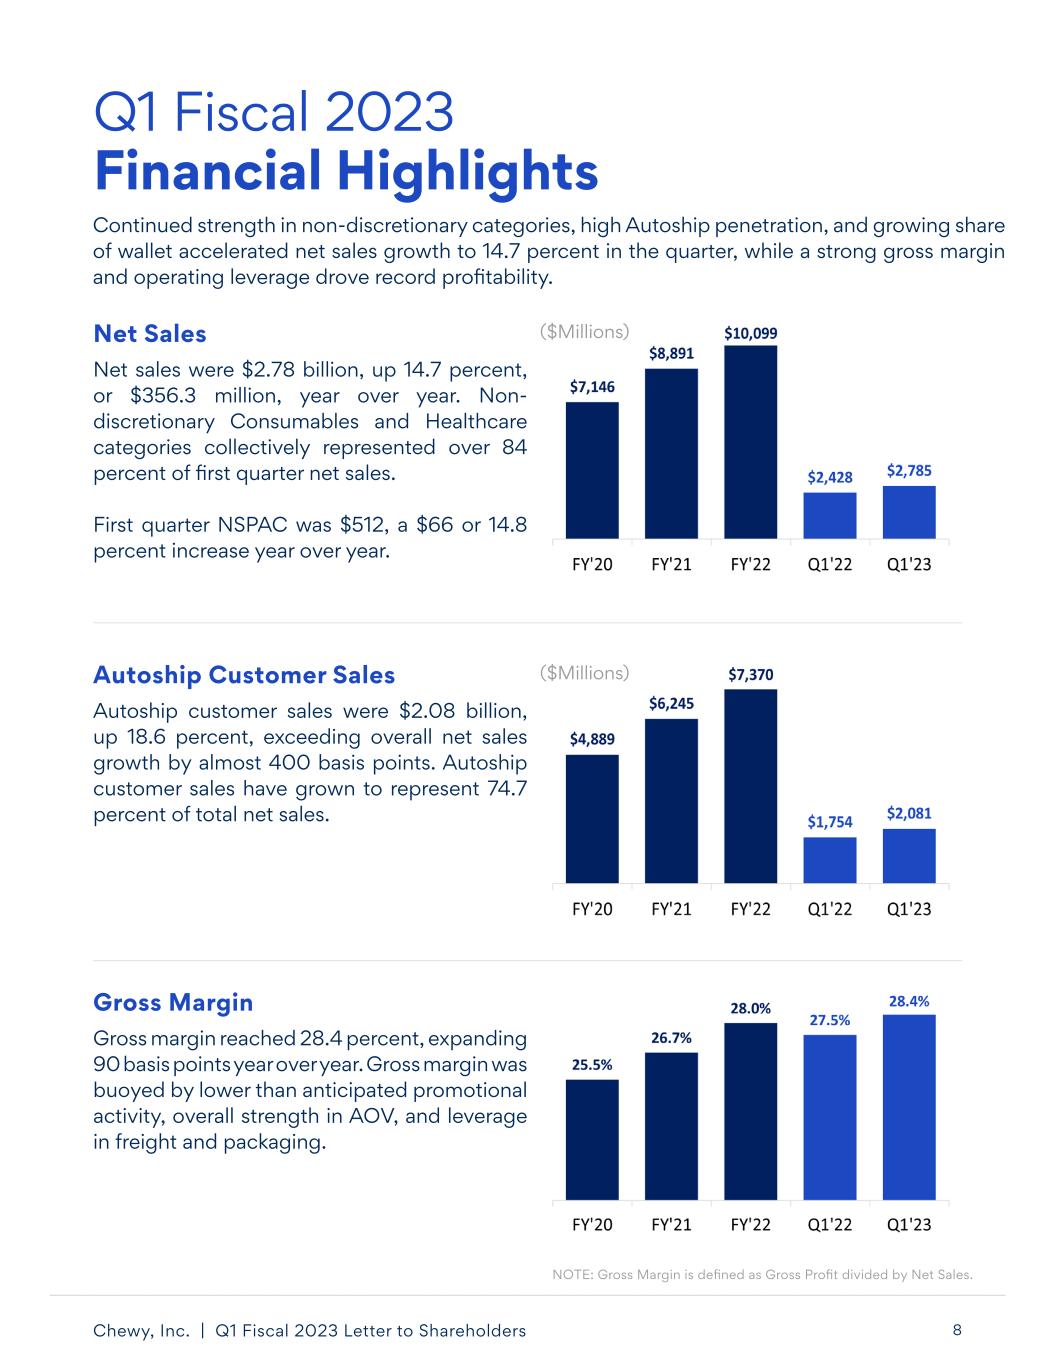
Chewy, Inc. | Q1 Fiscal 2023 Letter to Shareholders 8 Q1 Fiscal 2023 Financial Highlights NOTE: Gross Margin is defined as Gross Profit divided by Net Sales. Net sales were $2.78 billion, up 14.7 percent, or $356.3 million, year over year. Non- discretionary Consumables and Healthcare categories collectively represented over 84 percent of first quarter net sales. First quarter NSPAC was $512, a $66 or 14.8 percent increase year over year. Net Sales Autoship customer sales were $2.08 billion, up 18.6 percent, exceeding overall net sales growth by almost 400 basis points. Autoship customer sales have grown to represent 74.7 percent of total net sales. Autoship Customer Sales Gross margin reached 28.4 percent, expanding 90 basis points year over year. Gross margin was buoyed by lower than anticipated promotional activity, overall strength in AOV, and leverage in freight and packaging. Gross Margin ($Millions) ($Millions) Continued strength in non-discretionary categories, high Autoship penetration, and growing share of wallet accelerated net sales growth to 14.7 percent in the quarter, while a strong gross margin and operating leverage drove record profitability.
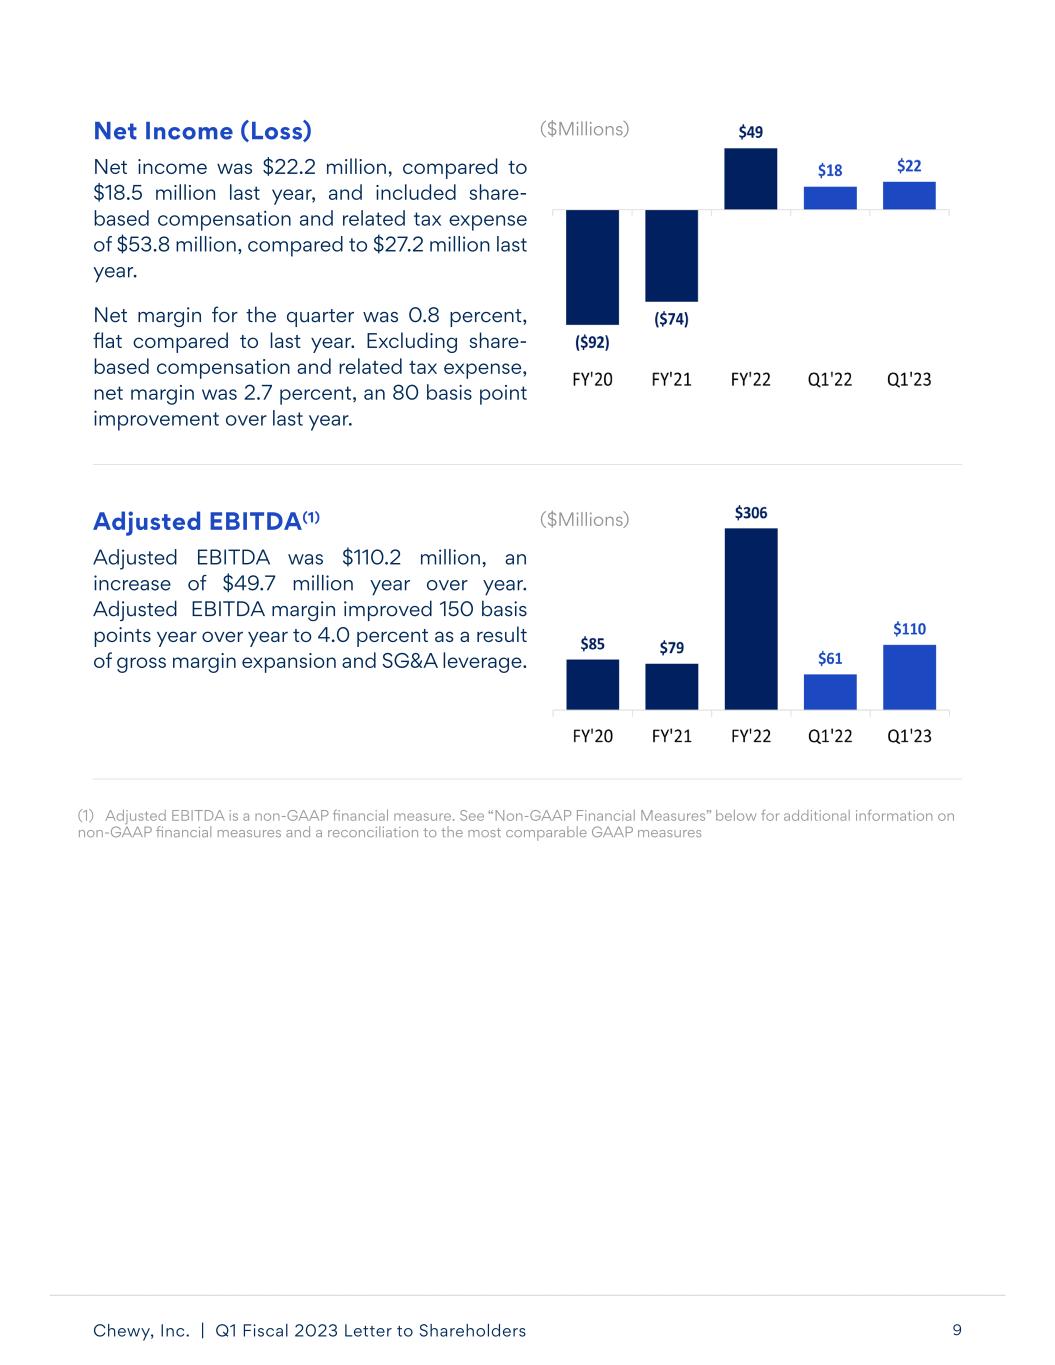
Chewy, Inc. | Q1 Fiscal 2023 Letter to Shareholders 9 Net Income (Loss) Adjusted EBITDA was $110.2 million, an increase of $49.7 million year over year. Adjusted EBITDA margin improved 150 basis points year over year to 4.0 percent as a result of gross margin expansion and SG&A leverage. Adjusted EBITDA(1) ($Millions) ($Millions) (1) Adjusted EBITDA is a non-GAAP financial measure. See “Non-GAAP Financial Measures” below for additional information on non-GAAP financial measures and a reconciliation to the most comparable GAAP measures Net income was $22.2 million, compared to $18.5 million last year, and included share- based compensation and related tax expense of $53.8 million, compared to $27.2 million last year. Net margin for the quarter was 0.8 percent, flat compared to last year. Excluding share- based compensation and related tax expense, net margin was 2.7 percent, an 80 basis point improvement over last year.
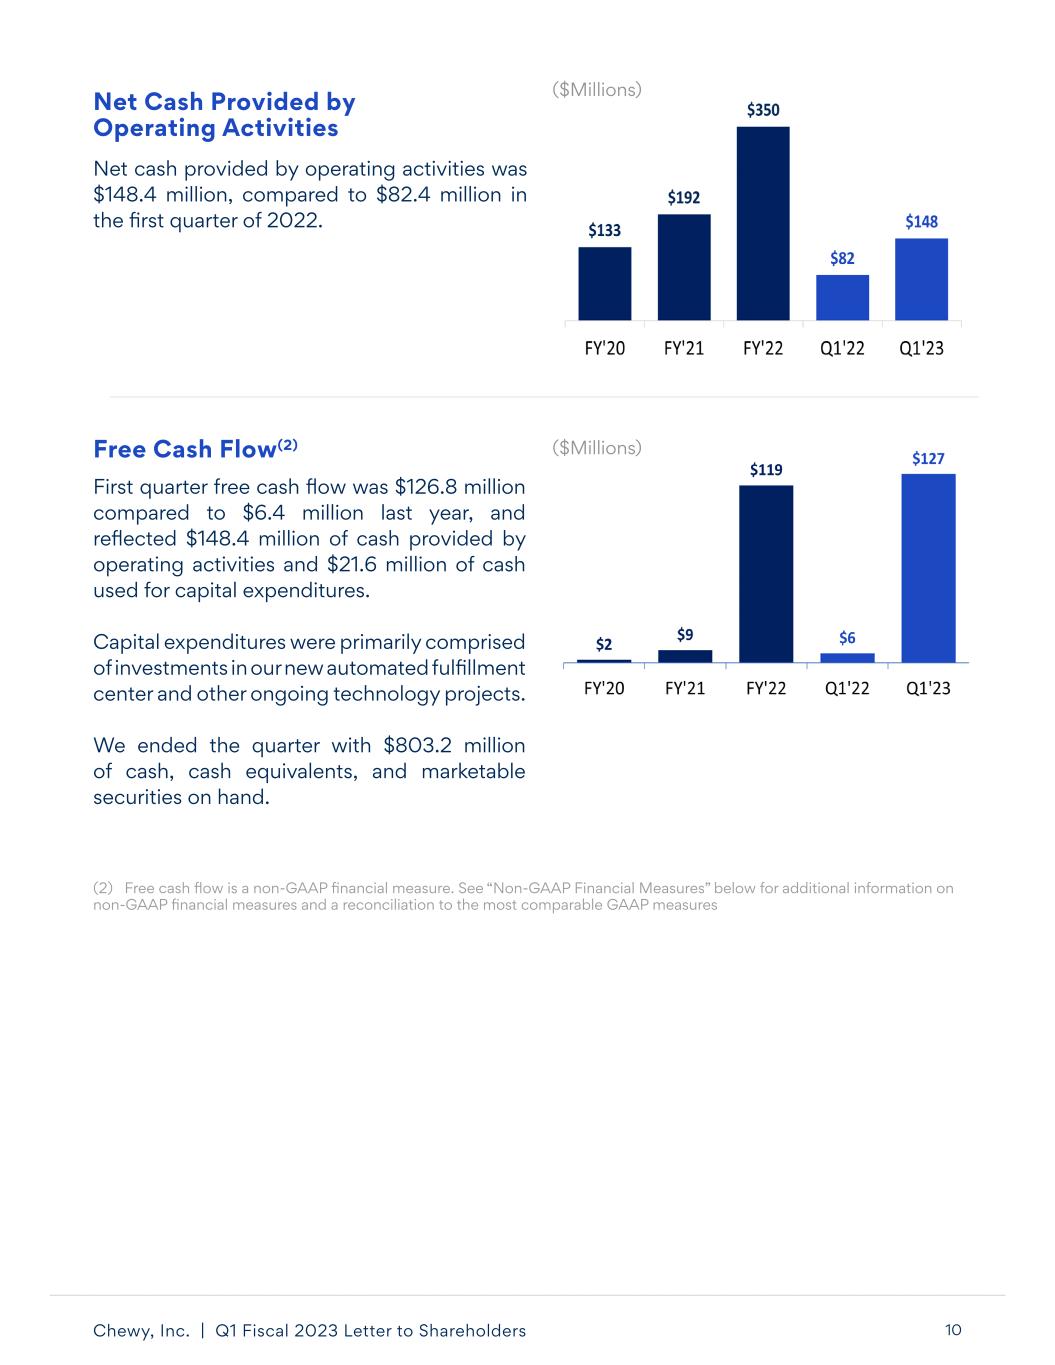
Chewy, Inc. | Q1 Fiscal 2023 Letter to Shareholders 10 First quarter free cash flow was $126.8 million compared to $6.4 million last year, and reflected $148.4 million of cash provided by operating activities and $21.6 million of cash used for capital expenditures. Capital expenditures were primarily comprised of investments in our new automated fulfillment center and other ongoing technology projects. We ended the quarter with $803.2 million of cash, cash equivalents, and marketable securities on hand. Free Cash Flow(2) (2) Free cash flow is a non-GAAP financial measure. See “Non-GAAP Financial Measures” below for additional information on non-GAAP financial measures and a reconciliation to the most comparable GAAP measures ($Millions) Net Cash Provided by Operating Activities Net cash provided by operating activities was $148.4 million, compared to $82.4 million in the first quarter of 2022. ($Millions)
Chewy, Inc. | Q1 Fiscal 2023 Letter to Shareholders 11 Media Contact: Diane Pelkey dpelkey@chewy.com Investor Contact: Jennifer Hsu ir@chewy.com We will host a conference call and earnings webcast at 5:00 pm Eastern time today to discuss these results. Investors and participants can access the call by dialing (833) 470-1428 in the U.S. or +1 (404) 975-4839 internationally using the conference code 659648. A live webcast will also be available on Chewy’s investor relations website at investor.chewy.com. Thank you for taking the time to review our letter, and we look forward to your questions on our call this afternoon. Sincerely, Closing Mario Marte, CFO Sumit Singh, CEO
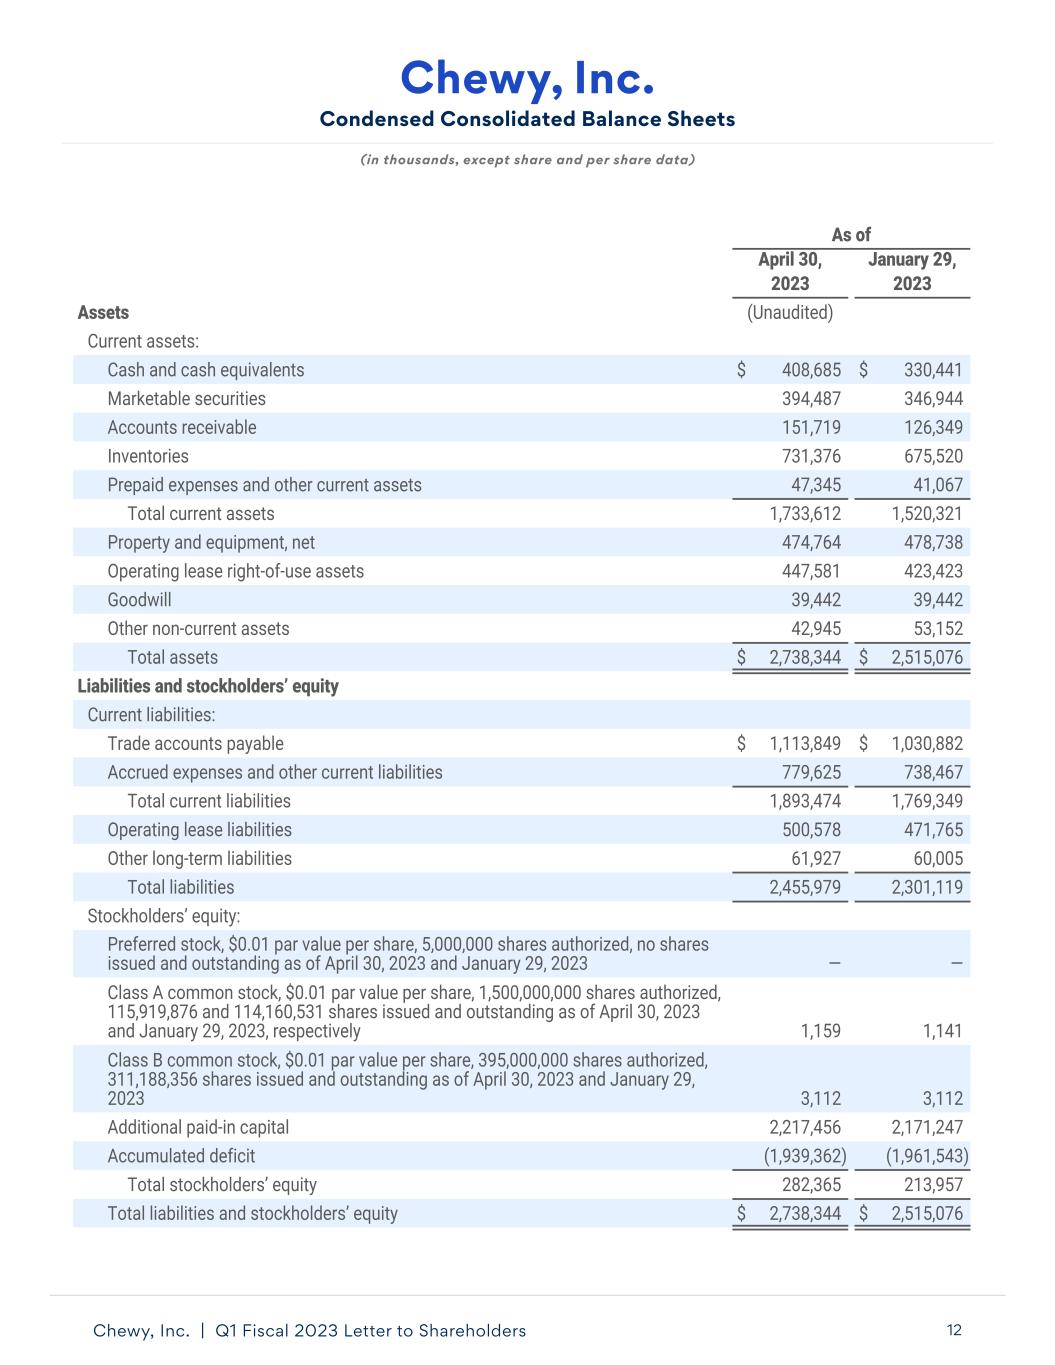
Chewy, Inc. | Q1 Fiscal 2023 Letter to Shareholders 12 Condensed Consolidated Balance Sheets Chewy, Inc. (in thousands, except share and per share data) As of April 30, January 29, 2023 2023 Assets (Unaudited) Current assets: Cash and cash equivalents $ 408,685 $ 330,441 Marketable securities 394,487 346,944 Accounts receivable 151,719 126,349 Inventories 731,376 675,520 Prepaid expenses and other current assets 47,345 41,067 Total current assets 1,733,612 1,520,321 Property and equipment, net 474,764 478,738 Operating lease right-of-use assets 447,581 423,423 Goodwill 39,442 39,442 Other non-current assets 42,945 53,152 Total assets $ 2,738,344 $ 2,515,076 Liabilities and stockholders’ equity Current liabilities: Trade accounts payable $ 1,113,849 $ 1,030,882 Accrued expenses and other current liabilities 779,625 738,467 Total current liabilities 1,893,474 1,769,349 Operating lease liabilities 500,578 471,765 Other long-term liabilities 61,927 60,005 Total liabilities 2,455,979 2,301,119 Stockholders’ equity: Preferred stock, $0.01 par value per share, 5,000,000 shares authorized, no shares issued and outstanding as of April 30, 2023 and January 29, 2023 — — Class A common stock, $0.01 par value per share, 1,500,000,000 shares authorized, 115,919,876 and 114,160,531 shares issued and outstanding as of April 30, 2023 and January 29, 2023, respectively 1,159 1,141 Class B common stock, $0.01 par value per share, 395,000,000 shares authorized, 311,188,356 shares issued and outstanding as of April 30, 2023 and January 29, 2023 3,112 3,112 Additional paid-in capital 2,217,456 2,171,247 Accumulated deficit (1,939,362) (1,961,543) Total stockholders’ equity 282,365 213,957 Total liabilities and stockholders’ equity $ 2,738,344 $ 2,515,076
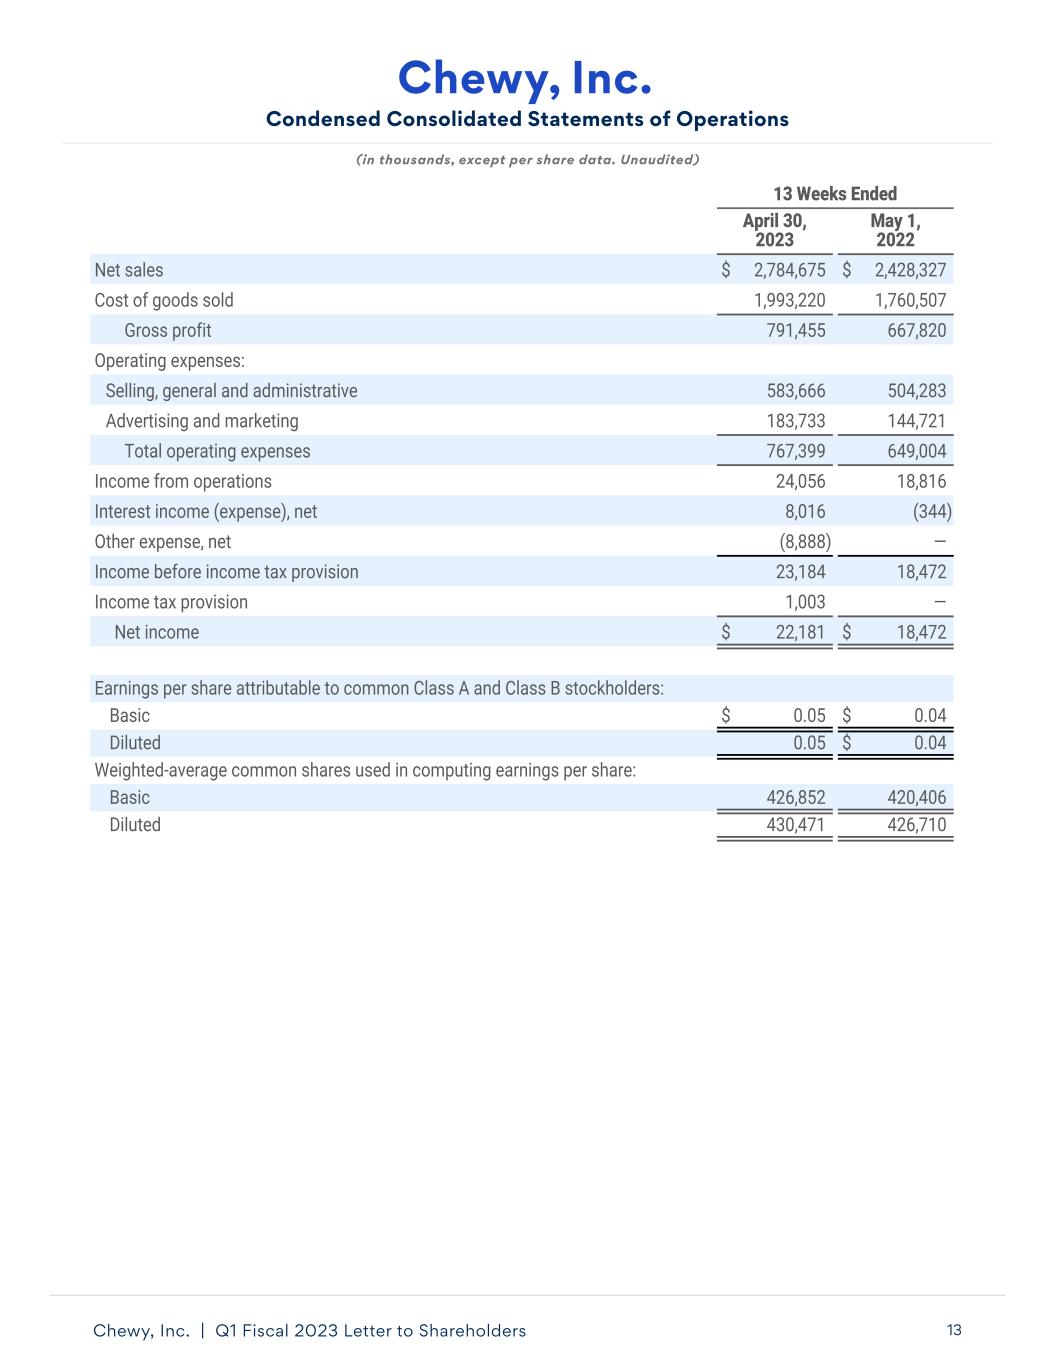
Chewy, Inc. | Q1 Fiscal 2023 Letter to Shareholders 13 Condensed Consolidated Statements of Operations Chewy, Inc. (in thousands, except per share data. Unaudited) 13 Weeks Ended April 30, 2023 May 1, 2022 Net sales $ 2,784,675 $ 2,428,327 Cost of goods sold 1,993,220 1,760,507 Gross profit 791,455 667,820 Operating expenses: Selling, general and administrative 583,666 504,283 Advertising and marketing 183,733 144,721 Total operating expenses 767,399 649,004 Income from operations 24,056 18,816 Interest income (expense), net 8,016 (344) Other expense, net (8,888) — Income before income tax provision 23,184 18,472 Income tax provision 1,003 — Net income $ 22,181 $ 18,472 Earnings per share attributable to common Class A and Class B stockholders: Basic $ 0.05 $ 0.04 Diluted 0.05 $ 0.04 Weighted-average common shares used in computing earnings per share: Basic 426,852 420,406 Diluted 430,471 426,710
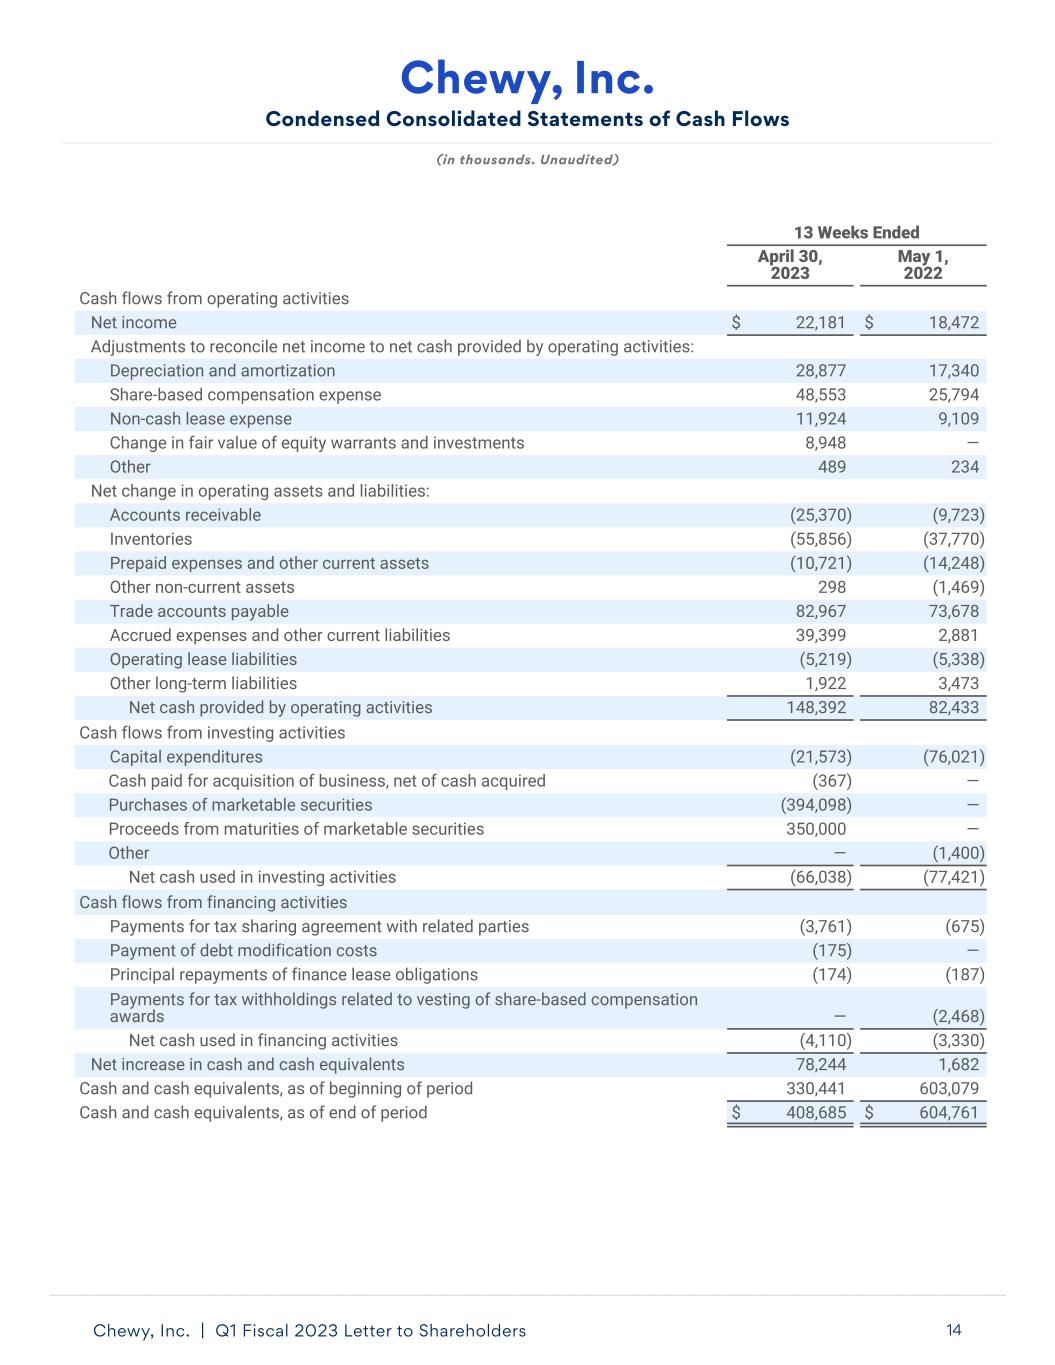
Chewy, Inc. | Q1 Fiscal 2023 Letter to Shareholders 14 Condensed Consolidated Statements of Cash Flows Chewy, Inc. (in thousands. Unaudited) 13 Weeks Ended April 30, 2023 May 1, 2022 Cash flows from operating activities Net income $ 22,181 $ 18,472 Adjustments to reconcile net income to net cash provided by operating activities: Depreciation and amortization 28,877 17,340 Share-based compensation expense 48,553 25,794 Non-cash lease expense 11,924 9,109 Change in fair value of equity warrants and investments 8,948 — Other 489 234 Net change in operating assets and liabilities: Accounts receivable (25,370) (9,723) Inventories (55,856) (37,770) Prepaid expenses and other current assets (10,721) (14,248) Other non-current assets 298 (1,469) Trade accounts payable 82,967 73,678 Accrued expenses and other current liabilities 39,399 2,881 Operating lease liabilities (5,219) (5,338) Other long-term liabilities 1,922 3,473 Net cash provided by operating activities 148,392 82,433 Cash flows from investing activities Capital expenditures (21,573) (76,021) Cash paid for acquisition of business, net of cash acquired (367) — Purchases of marketable securities (394,098) — Proceeds from maturities of marketable securities 350,000 — Other — (1,400) Net cash used in investing activities (66,038) (77,421) Cash flows from financing activities Payments for tax sharing agreement with related parties (3,761) (675) Payment of debt modification costs (175) — Principal repayments of finance lease obligations (174) (187) Payments for tax withholdings related to vesting of share-based compensation awards — (2,468) Net cash used in financing activities (4,110) (3,330) Net increase in cash and cash equivalents 78,244 1,682 Cash and cash equivalents, as of beginning of period 330,441 603,079 Cash and cash equivalents, as of end of period $ 408,685 $ 604,761
Chewy, Inc. | Q1 Fiscal 2023 Letter to Shareholders 15 Non-GAAP Financial Measures Adjusted EBITDA and Adjusted EBITDA Margin To provide investors with additional information regarding our financial results, we have disclosed adjusted EBITDA, a non-GAAP financial measure that we calculate as net income (loss) excluding depreciation and amortization; share-based compensation expense and related taxes; income tax provision; interest income (expense), net; transaction related costs; changes in the fair value of equity warrants; exit costs; and litigation matters and other items that we do not consider representative of our underlying operations. We have provided a reconciliation below of adjusted EBITDA to net income (loss), the most directly comparable GAAP financial measure. We have included adjusted EBITDA and adjusted EBITDA margin because each is a key measure used by our management and board of directors to evaluate our operating performance, generate future operating plans and make strategic decisions regarding the allocation of capital. In particular, the exclusion of certain expenses in calculating adjusted EBITDA and adjusted EBITDA margin facilitates operating performance comparability across reporting periods by removing the effect of non-cash expenses and certain variable charges. Accordingly, we believe that adjusted EBITDA and adjusted EBITDA margin provide useful information to investors and others in understanding and evaluating our operating results in the same manner as our management and board of directors. We believe it is useful to exclude non-cash charges, such as depreciation and amortization and share-based compensation expense from our adjusted EBITDA because the amount of such expenses in any specific period may not directly correlate to the underlying performance of our business operations. We believe it is useful to exclude income tax provision; interest income (expense), net; transaction related costs; changes in the fair value of equity warrants; exit costs; and litigation matters and other items which are not components of our core business operations. Adjusted EBITDA has limitations as a financial measure and you should not consider it in isolation or as a substitute for analysis of our results as reported under GAAP. Some of these limitations are: • although depreciation and amortization are non-cash charges, the assets being depreciated and amortized may have to be replaced in the future and adjusted EBITDA does not reflect capital expenditure requirements for such replacements or for new capital expenditures; • adjusted EBITDA does not reflect share-based compensation and related taxes. Share- based compensation has been, and will continue to be for the foreseeable future, a recurring expense in our business and an important part of our compensation strategy; • adjusted EBITDA does not reflect interest income (expense), net; or changes in, or cash requirements for, our working capital; • adjusted EBITDA does not reflect transaction related costs and other items which are either not representative of our underlying operations or are incremental costs that result from an actual or planned transaction and include changes in the fair value of equity warrants, exit costs, litigation matters, integration consulting fees, internal salaries and wages (to the extent the individuals are assigned full-time to integration and transformation activities) and certain costs related to integrating and converging IT systems; and • other companies, including companies in our industry, may calculate adjusted EBITDA differently, which reduces its usefulness as a comparative measure.
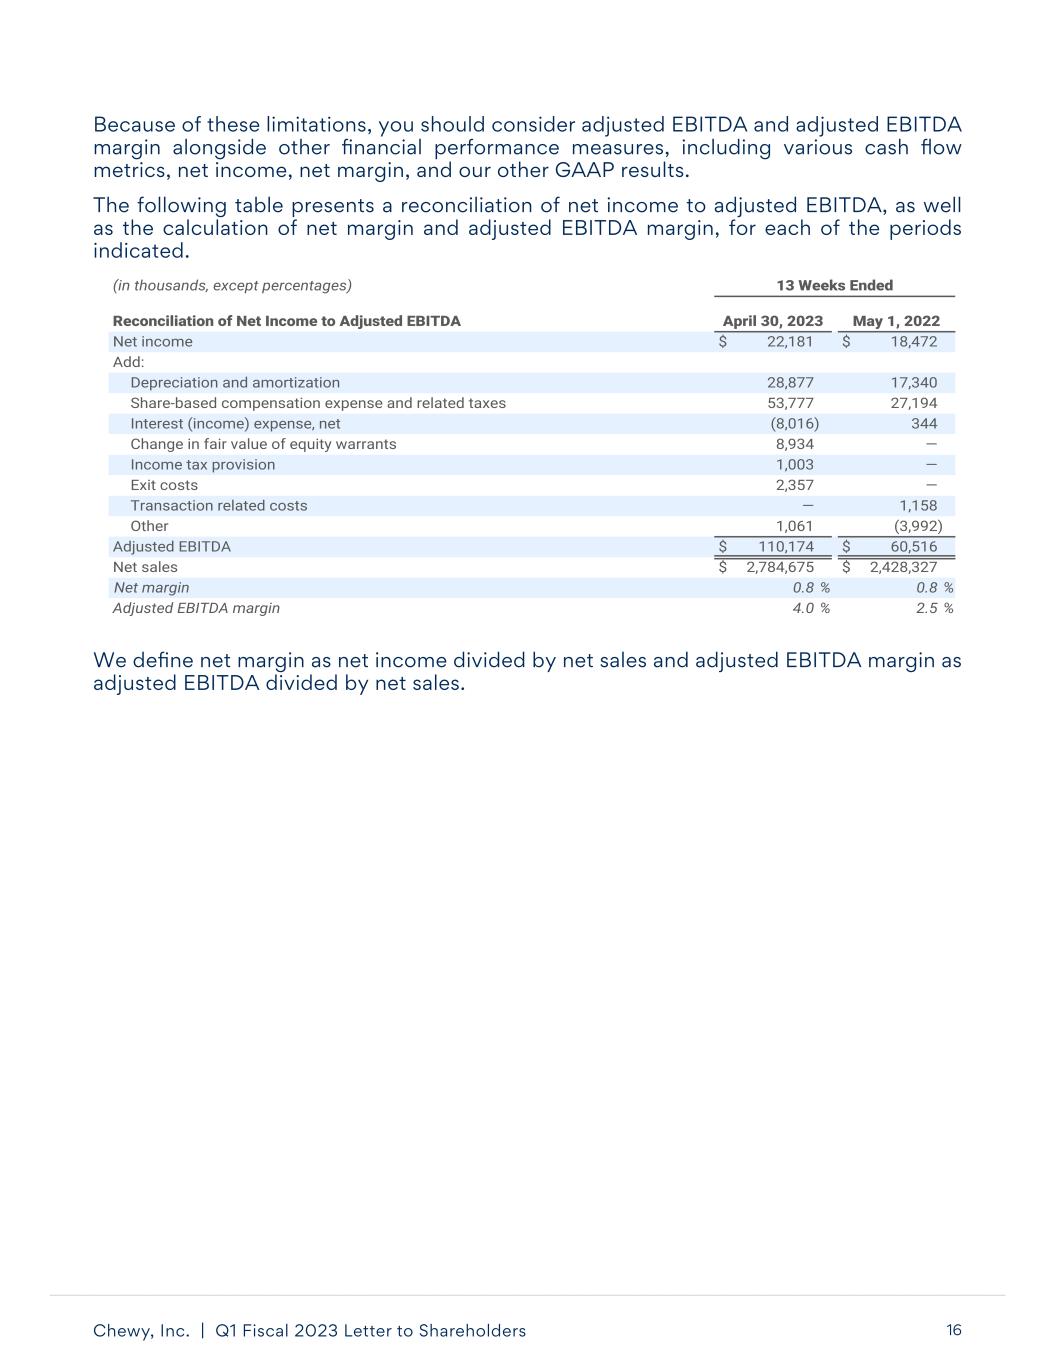
Chewy, Inc. | Q1 Fiscal 2023 Letter to Shareholders 16 Because of these limitations, you should consider adjusted EBITDA and adjusted EBITDA margin alongside other financial performance measures, including various cash flow metrics, net income, net margin, and our other GAAP results. The following table presents a reconciliation of net income to adjusted EBITDA, as well as the calculation of net margin and adjusted EBITDA margin, for each of the periods indicated. We define net margin as net income divided by net sales and adjusted EBITDA margin as adjusted EBITDA divided by net sales. (in thousands, except percentages) 13 Weeks Ended Reconciliation of Net Income to Adjusted EBITDA April 30, 2023 May 1, 2022 Net income $ 22,181 $ 18,472 Add: Depreciation and amortization 28,877 17,340 Share-based compensation expense and related taxes 53,777 27,194 Interest (income) expense, net (8,016) 344 Change in fair value of equity warrants 8,934 — Income tax provision 1,003 — Exit costs 2,357 — Transaction related costs — 1,158 Other 1,061 (3,992) Adjusted EBITDA $ 110,174 $ 60,516 Net sales $ 2,784,675 $ 2,428,327 Net margin 0.8 % 0.8 % Adjusted EBITDA margin 4.0 % 2.5 %
Chewy, Inc. | Q1 Fiscal 2023 Letter to Shareholders 17 Adjusted Net Income & Adjusted Basic & Diluted Earnings Per Share To provide investors with additional information regarding our financial results, we have disclosed adjusted net income and adjusted basic and diluted earnings per share, which represent non-GAAP financial measures. We calculate adjusted net income as net income excluding share-based compensation expense and related taxes, changes in the fair value of equity warrants, and exit costs. We calculate adjusted basic and diluted earnings per share by dividing adjusted net income attributable to common stockholders by the weighted-average shares outstanding during the period. We have provided a reconciliation below of adjusted net income to net income, the most directly comparable GAAP financial measure. We have included adjusted net income and adjusted basic and diluted earnings per share because each is a key measure used by our management and board of directors to evaluate our operating performance, generate future operating plans and make strategic decisions regarding the allocation of capital. In particular, the exclusion of certain expenses in calculating adjusted net income and adjusted basic and diluted earnings per share facilitates operating performance comparability across reporting periods by removing the effect of non-cash expenses and certain variable gains and losses that do not represent a component of our core business operations. We believe it is useful to exclude non- cash share-based compensation expense because the amount of such expenses in any specific period may not directly correlate to the underlying performance of our business operations. We believe it is useful to exclude exit costs and the changes in the fair value of equity warrants, because exit costs and the variability of equity warrant gains and losses are not representative of our underlying operations. Accordingly, we believe that these measures provide useful information to investors and others in understanding and evaluating our operating results in the same manner as our management and board of directors. Adjusted net income and adjusted basic and diluted earnings per share have limitations as financial measures and you should not consider them in isolation or as substitutes for analysis of our results as reported under GAAP. Other companies may calculate adjusted net income and adjusted basic and diluted earnings per share differently, which reduces their usefulness as comparative measures. Because of these limitations, you should consider adjusted net income and adjusted basic and diluted earnings alongside other financial performance measures, including various cash flow metrics, net income, basic and diluted earnings per share, and our other GAAP results. The following table presents a reconciliation of net income to adjusted net income, as well as the calculation of adjusted basic and diluted earnings per share, for each of the periods indicated.
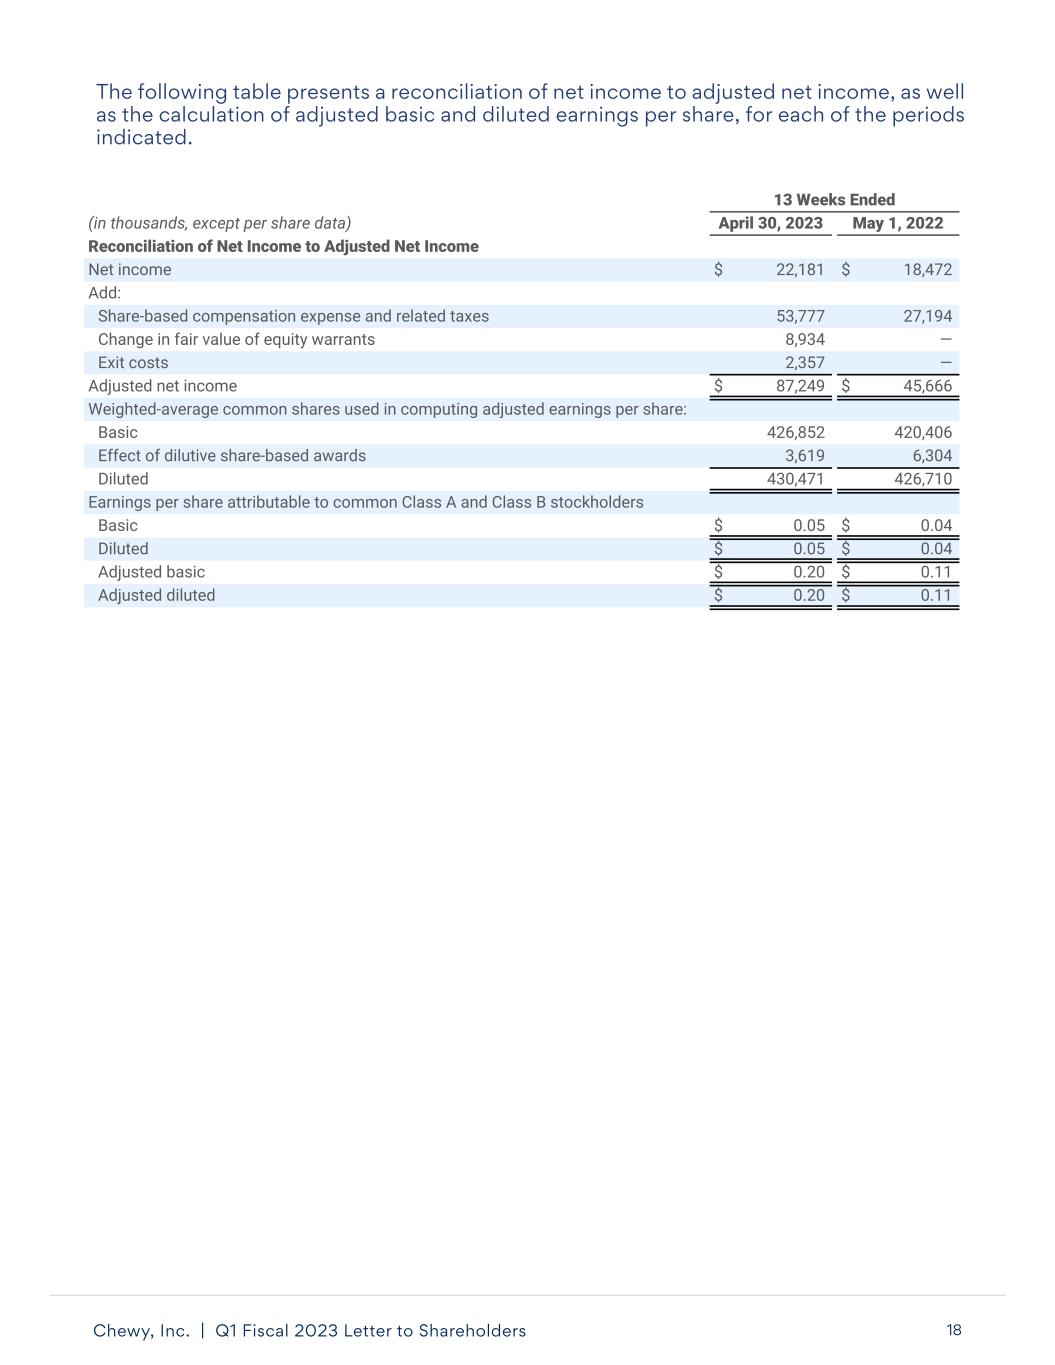
Chewy, Inc. | Q1 Fiscal 2023 Letter to Shareholders 18 13 Weeks Ended (in thousands, except per share data) April 30, 2023 May 1, 2022 Reconciliation of Net Income to Adjusted Net Income Net income $ 22,181 $ 18,472 Add: Share-based compensation expense and related taxes 53,777 27,194 Change in fair value of equity warrants 8,934 — Exit costs 2,357 — Adjusted net income $ 87,249 $ 45,666 Weighted-average common shares used in computing adjusted earnings per share: Basic 426,852 420,406 Effect of dilutive share-based awards 3,619 6,304 Diluted 430,471 426,710 Earnings per share attributable to common Class A and Class B stockholders Basic $ 0.05 $ 0.04 Diluted $ 0.05 $ 0.04 Adjusted basic $ 0.20 $ 0.11 Adjusted diluted $ 0.20 $ 0.11 The following table presents a reconciliation of net income to adjusted net income, as well as the calculation of adjusted basic and diluted earnings per share, for each of the periods indicated.
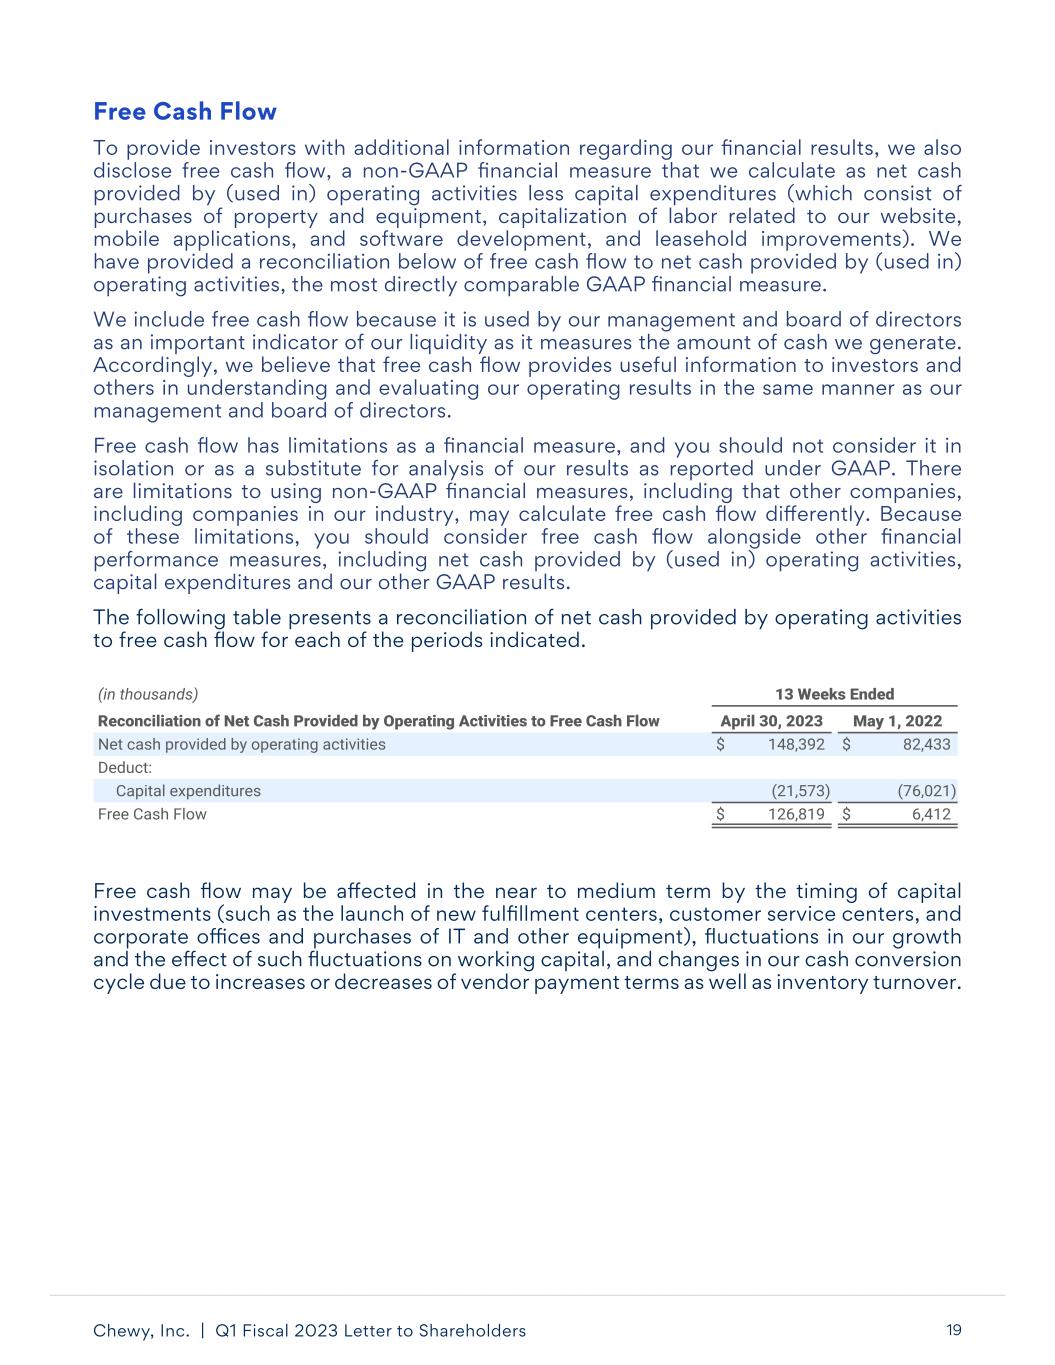
Chewy, Inc. | Q1 Fiscal 2023 Letter to Shareholders 19 (in thousands) 13 Weeks Ended Reconciliation of Net Cash Provided by Operating Activities to Free Cash Flow April 30, 2023 May 1, 2022 Net cash provided by operating activities $ 148,392 $ 82,433 Deduct: Capital expenditures (21,573) (76,021) Free Cash Flow $ 126,819 $ 6,412 Free cash flow may be affected in the near to medium term by the timing of capital investments (such as the launch of new fulfillment centers, customer service centers, and corporate offices and purchases of IT and other equipment), fluctuations in our growth and the effect of such fluctuations on working capital, and changes in our cash conversion cycle due to increases or decreases of vendor payment terms as well as inventory turnover. Free Cash Flow To provide investors with additional information regarding our financial results, we also disclose free cash flow, a non-GAAP financial measure that we calculate as net cash provided by (used in) operating activities less capital expenditures (which consist of purchases of property and equipment, capitalization of labor related to our website, mobile applications, and software development, and leasehold improvements). We have provided a reconciliation below of free cash flow to net cash provided by (used in) operating activities, the most directly comparable GAAP financial measure. We include free cash flow because it is used by our management and board of directors as an important indicator of our liquidity as it measures the amount of cash we generate. Accordingly, we believe that free cash flow provides useful information to investors and others in understanding and evaluating our operating results in the same manner as our management and board of directors. Free cash flow has limitations as a financial measure, and you should not consider it in isolation or as a substitute for analysis of our results as reported under GAAP. There are limitations to using non-GAAP financial measures, including that other companies, including companies in our industry, may calculate free cash flow differently. Because of these limitations, you should consider free cash flow alongside other financial performance measures, including net cash provided by (used in) operating activities, capital expenditures and our other GAAP results. The following table presents a reconciliation of net cash provided by operating activities to free cash flow for each of the periods indicated.
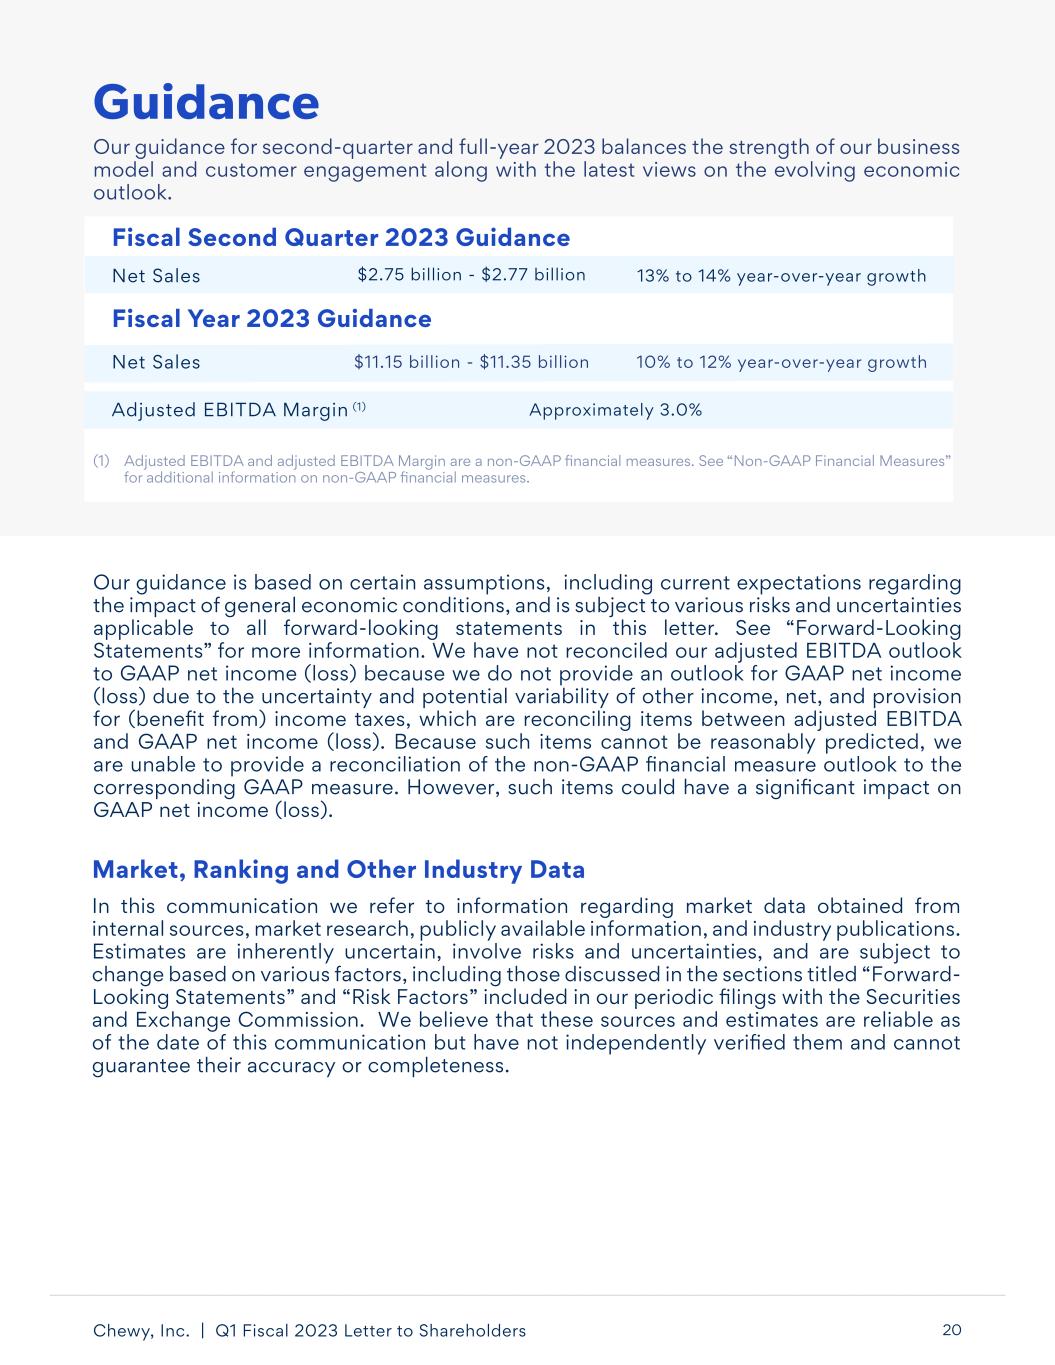
Chewy, Inc. | Q1 Fiscal 2023 Letter to Shareholders 20 Fiscal Second Quarter 2023 Guidance Our guidance is based on certain assumptions, including current expectations regarding the impact of general economic conditions, and is subject to various risks and uncertainties applicable to all forward-looking statements in this letter. See “Forward-Looking Statements” for more information. We have not reconciled our adjusted EBITDA outlook to GAAP net income (loss) because we do not provide an outlook for GAAP net income (loss) due to the uncertainty and potential variability of other income, net, and provision for (benefit from) income taxes, which are reconciling items between adjusted EBITDA and GAAP net income (loss). Because such items cannot be reasonably predicted, we are unable to provide a reconciliation of the non-GAAP financial measure outlook to the corresponding GAAP measure. However, such items could have a significant impact on GAAP net income (loss). Fiscal Year 2023 Guidance Adjusted EBITDA Margin (1) (1) Adjusted EBITDA and adjusted EBITDA Margin are a non-GAAP financial measures. See “Non-GAAP Financial Measures” for additional information on non-GAAP financial measures. Approximately 3.0% Net Sales $2.75 billion - $2.77 billion 13% to 14% year-over-year growth Net Sales $11.15 billion - $11.35 billion 10% to 12% year-over-year growth Guidance Our guidance for second-quarter and full-year 2023 balances the strength of our business model and customer engagement along with the latest views on the evolving economic outlook. Market, Ranking and Other Industry Data In this communication we refer to information regarding market data obtained from internal sources, market research, publicly available information, and industry publications. Estimates are inherently uncertain, involve risks and uncertainties, and are subject to change based on various factors, including those discussed in the sections titled “Forward- Looking Statements” and “Risk Factors” included in our periodic filings with the Securities and Exchange Commission. We believe that these sources and estimates are reliable as of the date of this communication but have not independently verified them and cannot guarantee their accuracy or completeness.
Chewy, Inc. | Q1 Fiscal 2023 Letter to Shareholders 21 Forward-Looking Statements This communication contains forward-looking statements about us and our industry that involve substantial risks and uncertainties. All statements other than statements of historical facts contained in this communication, including statements regarding our future results of operations or financial condition, business strategy and plans and objectives of management for future operations, are forward-looking statements. In some cases, you can identify forward-looking statements because they contain words such as “anticipate,” “believe,” “contemplate,” “continue,” “could,” “estimate,” “expect,” “forecast,” “intend,” “may,” “plan,” “potential,” “predict,” “project,” “seek,” “should,” “target,” “will” or “would” or the negative of these words or other similar terms or expressions. These forward-looking statements include, but are not limited to, statements concerning our ability to: sustain our recent growth rates and successfully manage challenges to our future growth, including introducing new products or services, improving existing products and services, and expanding into new offerings; successfully manage risks related to the macroeconomic environment, including any adverse impacts on our business operations, financial performance, supply chain, workforce, facilities, customer services and operations; acquire and retain new customers in a cost-effective manner and increase our net sales, improve margins and maintain profitability; manage our growth effectively; maintain positive perceptions of our company and preserve, grow, and leverage the value of our reputation and our brand; limit operating losses as we continue to expand our business; forecast net sales and appropriately plan our expenses in the future; estimate the size of our addressable market; strengthen our current supplier relationships, retain key suppliers and source additional suppliers; negotiate acceptable pricing and other terms with third-party service providers, suppliers and outsourcing partners and maintain our relationships with such parties; mitigate changes in, or disruptions to, our shipping arrangements and operations; optimize, operate and manage the expansion of the capacity of our fulfillment centers; provide our customers with a cost-effective platform that is able to respond and adapt to rapid changes in technology; limit our losses related to online payment methods; maintain and scale our technology, including the reliability of our website, mobile applications, and network infrastructure; maintain adequate cybersecurity with respect to our systems and ensure that our third-party service providers do the same with respect to their systems; maintain consumer confidence in the safety, quality and health of our products; limit risks associated with our suppliers and our outsourcing partners; comply with existing or future laws and regulations in a cost- efficient manner; compete with other retailers and service providers; utilize tax attributes, net operating loss and tax credit carryforwards, and limit fluctuations in our tax obligations and effective tax rate; adequately protect our intellectual property rights; successfully defend ourselves against any allegations or claims that we may be subject to; attract, develop, motivate and retain highly-qualified and skilled employees; predict and respond to economic conditions, industry trends, and market conditions, and their impact on the pet products market; reduce merchandise returns or refunds; respond to severe weather and limit disruption to normal business operations; manage new acquisitions, investments or alliances, and integrate them into our existing business; successfully compete in the pet insurance market; manage challenges presented by international markets; successfully compete in the pet products and services health and retail industry, especially in the e-commerce sector; raise capital as needed; and maintain effective internal control over financial reporting and disclosure controls and procedures.
Chewy, Inc. | Q1 Fiscal 2023 Letter to Shareholders 22 You should not rely on forward-looking statements as predictions of future events, and you should understand that these statements are not guarantees of performance or results, and our actual results could differ materially from those expressed in the forward- looking statements due to a variety of factors. We have based the forward-looking statements contained in this communication primarily on our current assumptions, expectations, and projections about future events and trends that we believe may affect our business, financial condition, and results of operations. The outcome of the events described in these forward-looking statements is subject to risks, uncertainties and other factors described in the section titled “Risk Factors” included under Part I, Item 1A of our Annual Report on Form 10-K, and in our other filings with the Securities and Exchange Commission and elsewhere in this communication. Moreover, we operate in a very competitive and rapidly changing environment. New risks and uncertainties emerge from time to time, and it is not possible for us to predict all risks and uncertainties that could have an impact on the forward-looking statements contained in this communication. The results, events and circumstances reflected in the forward-looking statements may not be achieved or occur, and actual results, events or circumstances could differ materially from those described in the forward-looking statements. In addition, statements that “we believe” and similar statements reflect our beliefs and opinions on the relevant subject. These statements are based on information available to us as of the date of this communication. While we believe that information provides a reasonable basis for these statements, that information may be limited or incomplete. Our statements should not be read to indicate that we have conducted an exhaustive inquiry into, or review of, all relevant information. These statements are inherently uncertain, and investors are cautioned not to unduly rely on these statements. The forward-looking statements made in this communication relate only to events as of the date on which the statements are made. We undertake no obligation to update any forward-looking statements made in this communication to reflect events or circumstances after the date of this communication or to reflect new information or the occurrence of unanticipated events, except as required by law. We may not actually achieve the plans, intentions or expectations disclosed in our forward-looking statements, and you should not place undue reliance on our forward-looking statements. Our forward-looking statements do not reflect the potential impact of any future acquisitions, mergers, dispositions, joint ventures or investments.
