
December 6, 2023 Letter to Shareholders Q3 Fiscal 2023

Our mission To be the most trusted and convenient destination for pet parents and partners everywhere.
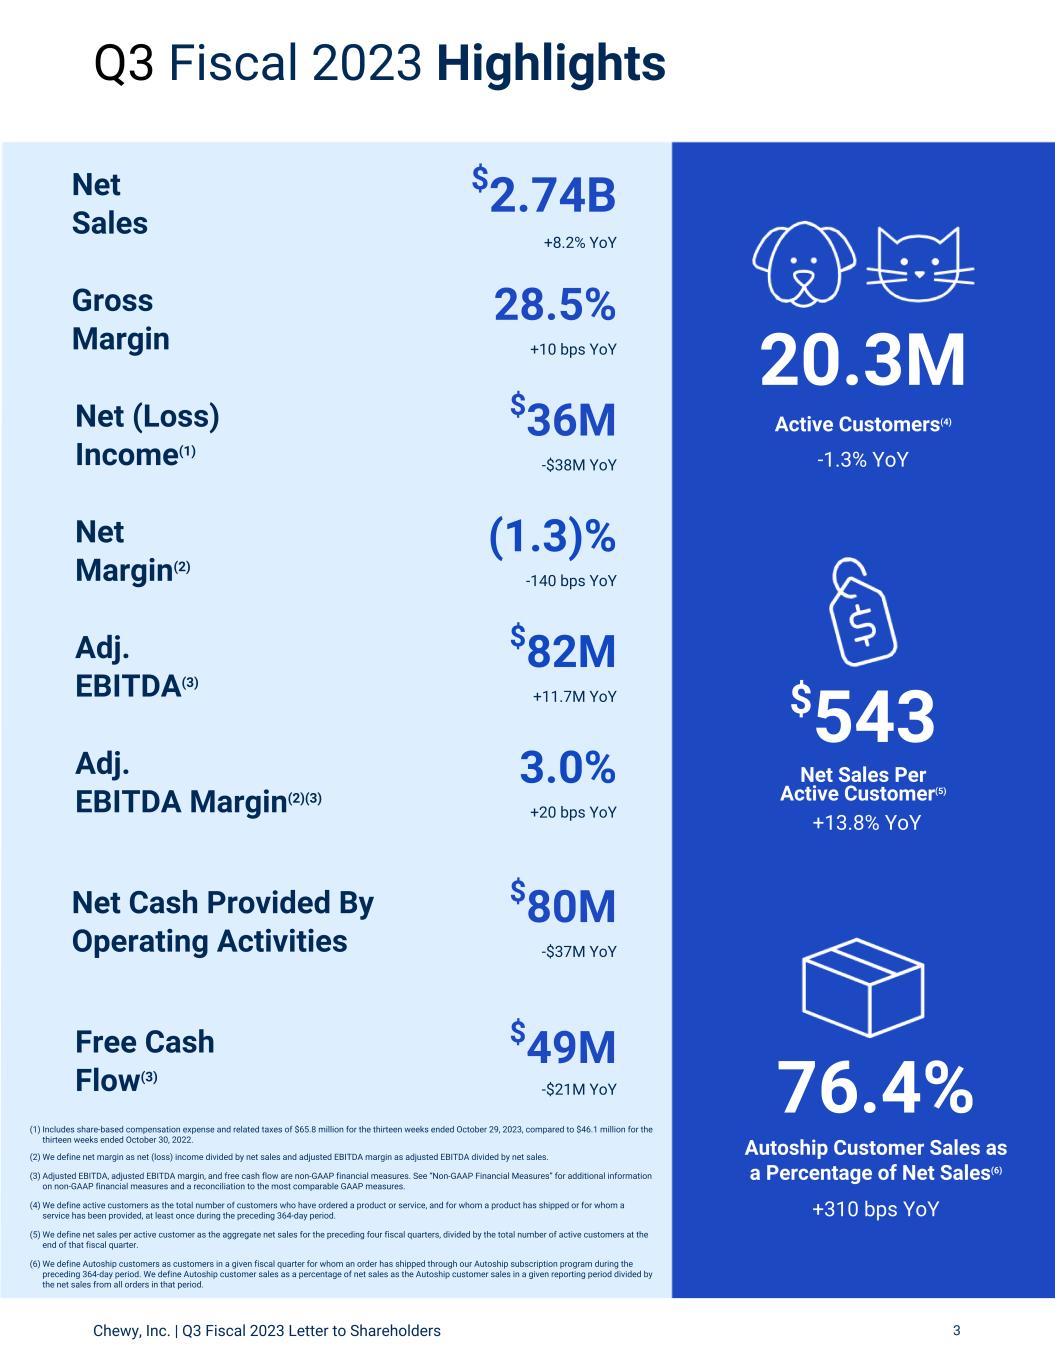
Chewy, Inc. | Q2 Fiscal 2023 Letter to Shareholders 3 Q3 Fiscal 2023 Highlights he y, Inc. | 3 Fiscal 2023 Letter to Shareholders 3 76.4% Autoship Customer Sales as a Percentage of Net Sales(6) +310 bps YoY $543 Net Sales Per Active Customer(5) +13.8% YoY 20.3M Active Customers(4) -1.3% YoY Net Sales $2.74B +8.2% YoY Net (Loss) Income(1) $36M -$38M YoY Adj. EBITDA(3) $82M +11.7M YoY Free Cash Flow(3) Net Margin(2) (1.3)% -140 bps YoY Gross Margin 28.5% +10 bps YoY Adj. EBITDA Margin(2)(3) 3.0% +20 bps YoY Net Cash Provided By Operating Activities $80M -$37M YoY (1) Includes share-based compensation expense and related taxes of $65.8 million for the thirteen weeks ended October 29, 2023, compared to $46.1 million for the thirteen weeks ended October 30, 2022. (2) We define net margin as net (loss) income divided by net sales and adjusted EBITDA margin as adjusted EBITDA divided by net sales. (3) Adjusted EBITDA, adjusted EBITDA margin, and free cash flow are non-GAAP financial measures. See “Non-GAAP Financial Measures” for additional information on non-GAAP financial measures and a reconciliation to the most comparable GAAP measures. (4) We define active customers as the total number of customers who have ordered a product or service, and for whom a product has shipped or for whom a service has been provided, at least once during the preceding 364-day period. (5) We define net sales per active customer as the aggregate net sales for the preceding four fiscal quarters, divided by the total number of active customers at the end of that fiscal quarter. (6) We define Autoship customers as customers in a given fiscal quarter for whom an order has shipped through our Autoship subscription program during the preceding 364-day period. We define Autoship customer sales as a percentage of net sales as the Autoship customer sales in a given reporting period divided by the net sales from all orders in that period. $49M -$21M YoY
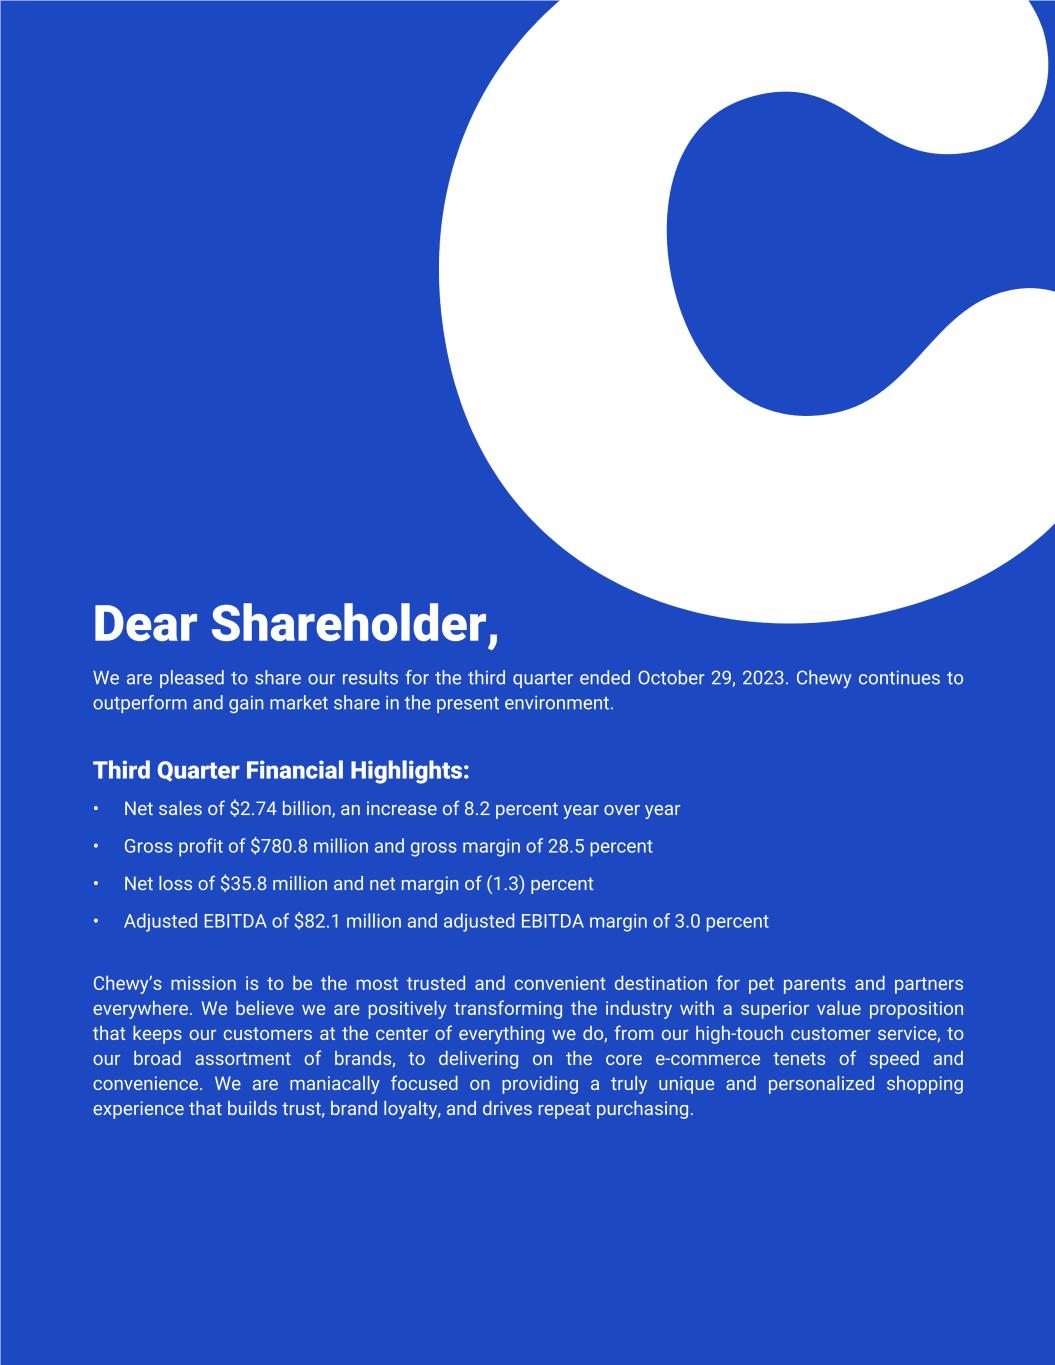
Dear Shareholder, We are pleased to share our results for the third quarter ended October 29, 2023. Chewy continues to outperform and gain market share in the present environment. Third Quarter Financial Highlights: • Net sales of $2.74 billion, an increase of 8.2 percent year over year • Gross profit of $780.8 million and gross margin of 28.5 percent • Net loss of $35.8 million and net margin of (1.3) percent • Adjusted EBITDA of $82.1 million and adjusted EBITDA margin of 3.0 percent Chewy’s mission is to be the most trusted and convenient destination for pet parents and partners everywhere. We believe we are positively transforming the industry with a superior value proposition that keeps our customers at the center of everything we do, from our high-touch customer service, to our broad assortment of brands, to delivering on the core e-commerce tenets of speed and convenience. We are maniacally focused on providing a truly unique and personalized shopping experience that builds trust, brand loyalty, and drives repeat purchasing.
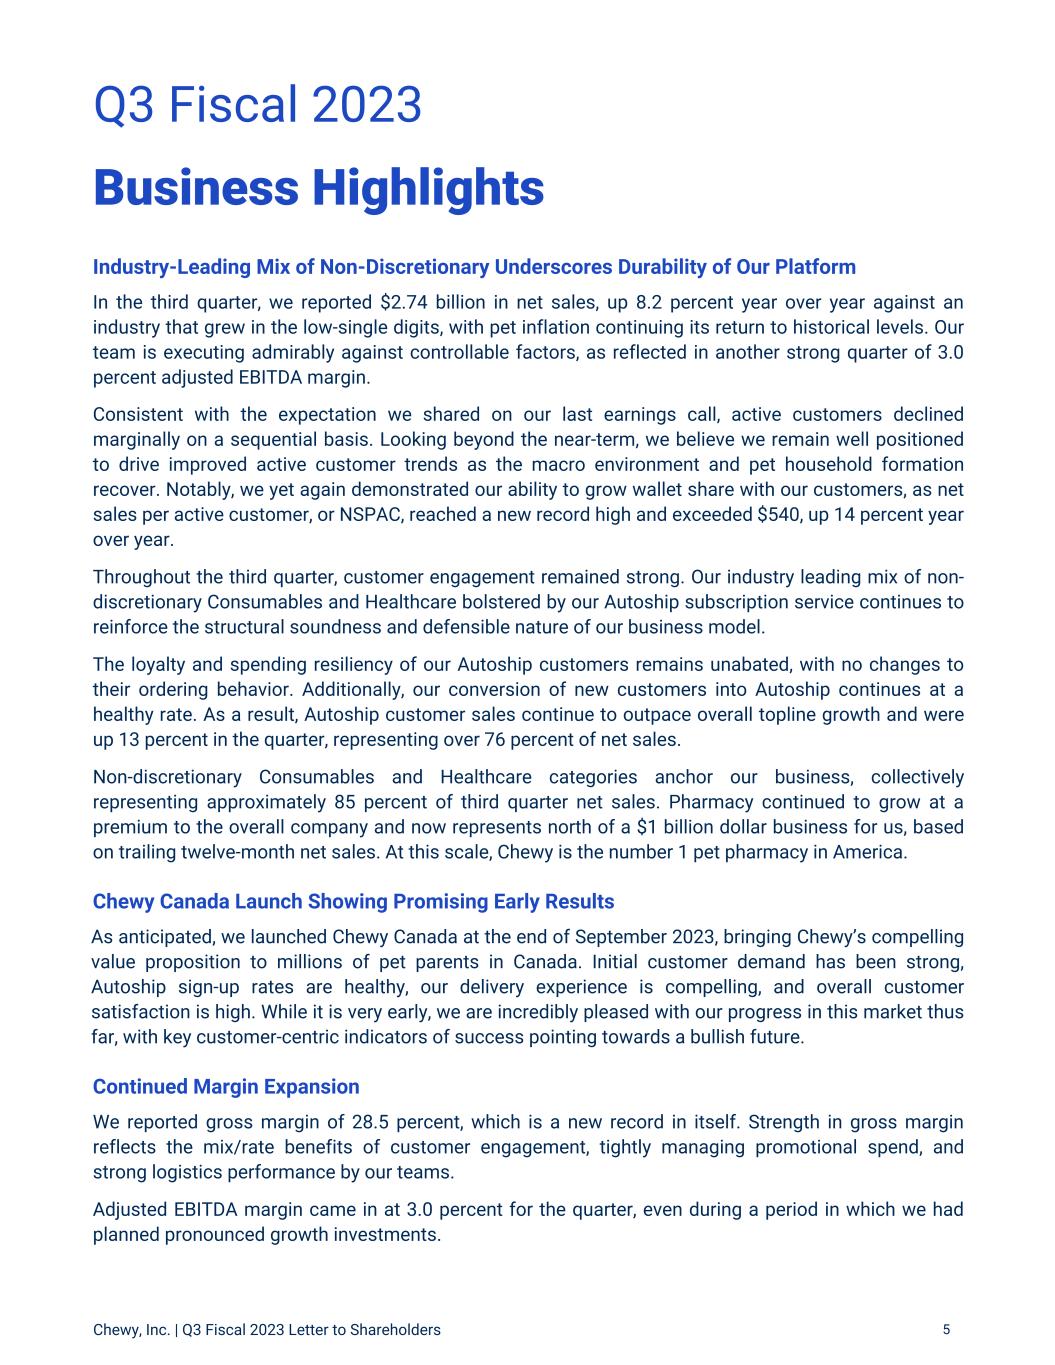
Chewy, Inc. | Q3 Fiscal 2023 Letter to Shareholders 5 Q3 Fiscal 2023 Business Highlights Industry-Leading Mix of Non-Discretionary Underscores Durability of Our Platform In the third quarter, we reported $2.74 billion in net sales, up 8.2 percent year over year against an industry that grew in the low-single digits, with pet inflation continuing its return to historical levels. Our team is executing admirably against controllable factors, as reflected in another strong quarter of 3.0 percent adjusted EBITDA margin. Consistent with the expectation we shared on our last earnings call, active customers declined marginally on a sequential basis. Looking beyond the near-term, we believe we remain well positioned to drive improved active customer trends as the macro environment and pet household formation recover. Notably, we yet again demonstrated our ability to grow wallet share with our customers, as net sales per active customer, or NSPAC, reached a new record high and exceeded $540, up 14 percent year over year. Throughout the third quarter, customer engagement remained strong. Our industry leading mix of non- discretionary Consumables and Healthcare bolstered by our Autoship subscription service continues to reinforce the structural soundness and defensible nature of our business model. The loyalty and spending resiliency of our Autoship customers remains unabated, with no changes to their ordering behavior. Additionally, our conversion of new customers into Autoship continues at a healthy rate. As a result, Autoship customer sales continue to outpace overall topline growth and were up 13 percent in the quarter, representing over 76 percent of net sales. Non-discretionary Consumables and Healthcare categories anchor our business, collectively representing approximately 85 percent of third quarter net sales. Pharmacy continued to grow at a premium to the overall company and now represents north of a $1 billion dollar business for us, based on trailing twelve-month net sales. At this scale, Chewy is the number 1 pet pharmacy in America. Chewy Canada Launch Showing Promising Early Results As anticipated, we launched Chewy Canada at the end of September 2023, bringing Chewy’s compelling value proposition to millions of pet parents in Canada. Initial customer demand has been strong, Autoship sign-up rates are healthy, our delivery experience is compelling, and overall customer satisfaction is high. While it is very early, we are incredibly pleased with our progress in this market thus far, with key customer-centric indicators of success pointing towards a bullish future. Continued Margin Expansion We reported gross margin of 28.5 percent, which is a new record in itself. Strength in gross margin reflects the mix/rate benefits of customer engagement, tightly managing promotional spend, and strong logistics performance by our teams. Adjusted EBITDA margin came in at 3.0 percent for the quarter, even during a period in which we had planned pronounced growth investments.
Strong Black Friday and Cyber Monday Performance We observed strong customer purchasing intent during this important holiday shopping week. Traffic and sales exceeded our expectations across all categories, including hardgoods, and conversion rates were up year over year. New customer acquisition during this period was 40 percent higher than our Q3 weekly average. While we have seen trends return to pre-holiday levels, our Black Friday and Cyber Monday performance was encouraging. Specifically, while consumer spending behavior remains opportunistic in the current environment, our results illustrate that Chewy’s value proposition continues to resonate loudly, and will prevail when consumer demand and industry inputs improve. Becoming an Ever More Agile and Disciplined Company In November 2023, as part of our 2024 strategic planning process, we implemented actions to reduce our headcount in certain areas of the organization. This decision was carefully considered as part of our ongoing focus on becoming an ever more agile and disciplined company, and to align our efforts with priorities which we believe will gain us the most significant customer wins and generate the highest business returns. While we consolidated some roles within the organization, we continue to invest in other high priority areas. As we head into 2024, these actions create room for us to continue investing behind our growth initiatives. We are incredibly grateful to our team members for their contributions and remain committed to supporting them during this transition. Chewy’s Inaugural Investor Day As previously announced, we will be hosting our inaugural Investor Day next week on Thursday, December 14, 2023 at 8:00 am ET in New York City and we look forward to welcoming many of you in person. A link to a live webcast is available on Chewy’s investor relations website at https:// investor.chewy.com. Following the conclusion of the event, a replay and presentation materials will be available for at least 90 days. We are excited to introduce you to our broader senior leadership team. We plan to provide a comprehensive update on our strategic roadmap, including a deep dive into our Chewy Health business, and will share refreshed long-term financial targets. In closing, while the macro dynamics will play itself out in due course, we are extremely proud of our ability to execute and deliver strong results in this environment, showcasing the durability of our platform, and our ability to grow profitably while capturing incremental market share. Chewy, Inc. | Q3 Fiscal 2023 Letter to Shareholders 6
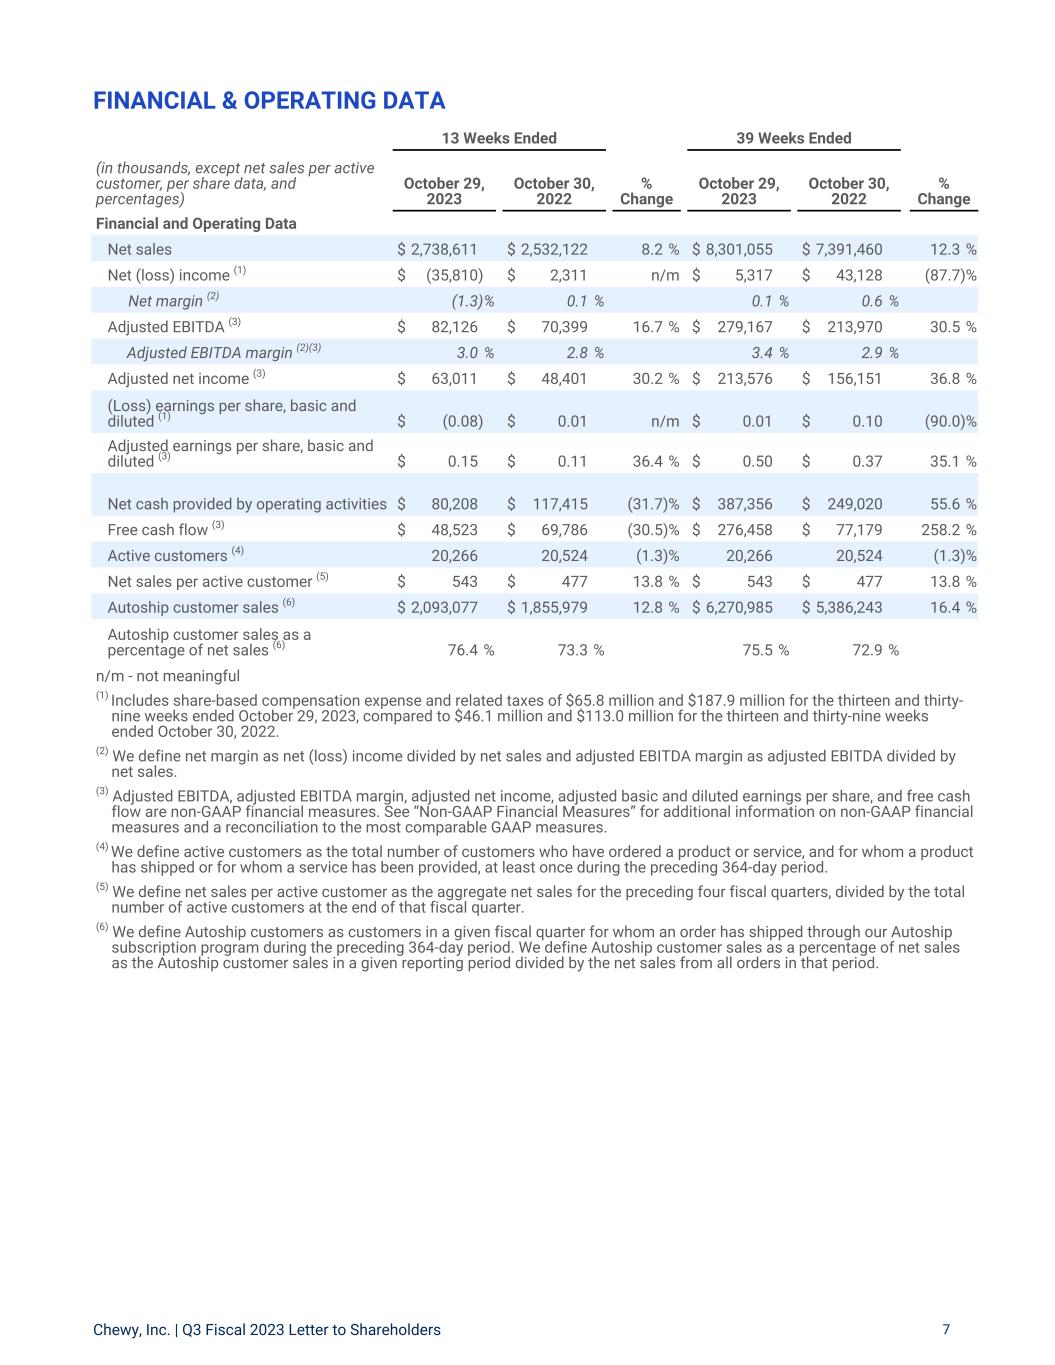
FINANCIAL & OPERATING DATA Chewy, Inc. | Q3 Fiscal 2023 Letter to Shareholders 7 13 Weeks Ended 39 Weeks Ended (in thousands, except net sales per active customer, per share data, and percentages) October 29, 2023 October 30, 2022 % Change October 29, 2023 October 30, 2022 % Change Financial and Operating Data Net sales $ 2,738,611 $ 2,532,122 8.2 % $ 8,301,055 $ 7,391,460 12.3 % Net (loss) income (1) $ (35,810) $ 2,311 n/m $ 5,317 $ 43,128 (87.7) % Net margin (2) (1.3) % 0.1 % 0.1 % 0.6 % Adjusted EBITDA (3) $ 82,126 $ 70,399 16.7 % $ 279,167 $ 213,970 30.5 % Adjusted EBITDA margin (2)(3) 3.0 % 2.8 % 3.4 % 2.9 % Adjusted net income (3) $ 63,011 $ 48,401 30.2 % $ 213,576 $ 156,151 36.8 % (Loss) earnings per share, basic and diluted (1) $ (0.08) $ 0.01 n/m $ 0.01 $ 0.10 (90.0) % Adjusted earnings per share, basic and diluted (3) $ 0.15 $ 0.11 36.4 % $ 0.50 $ 0.37 35.1 % Net cash provided by operating activities $ 80,208 $ 117,415 (31.7) % $ 387,356 $ 249,020 55.6 % Free cash flow (3) $ 48,523 $ 69,786 (30.5) % $ 276,458 $ 77,179 258.2 % Active customers (4) 20,266 20,524 (1.3) % 20,266 20,524 (1.3) % Net sales per active customer (5) $ 543 $ 477 13.8 % $ 543 $ 477 13.8 % Autoship customer sales (6) $ 2,093,077 $ 1,855,979 12.8 % $ 6,270,985 $ 5,386,243 16.4 % Autoship customer sales as a percentage of net sales (6) 76.4 % 73.3 % 75.5 % 72.9 % n/m - not meaningful (1) Includes share-based compensation expense and related taxes of $65.8 million and $187.9 million for the thirteen and thirty- nine weeks ended October 29, 2023, compared to $46.1 million and $113.0 million for the thirteen and thirty-nine weeks ended October 30, 2022. (2) We define net margin as net (loss) income divided by net sales and adjusted EBITDA margin as adjusted EBITDA divided by net sales. (3) Adjusted EBITDA, adjusted EBITDA margin, adjusted net income, adjusted basic and diluted earnings per share, and free cash flow are non-GAAP financial measures. See “Non-GAAP Financial Measures” for additional information on non-GAAP financial measures and a reconciliation to the most comparable GAAP measures. (4) We define active customers as the total number of customers who have ordered a product or service, and for whom a product has shipped or for whom a service has been provided, at least once during the preceding 364-day period. (5) We define net sales per active customer as the aggregate net sales for the preceding four fiscal quarters, divided by the total number of active customers at the end of that fiscal quarter. (6) We define Autoship customers as customers in a given fiscal quarter for whom an order has shipped through our Autoship subscription program during the preceding 364-day period. We define Autoship customer sales as a percentage of net sales as the Autoship customer sales in a given reporting period divided by the net sales from all orders in that period.
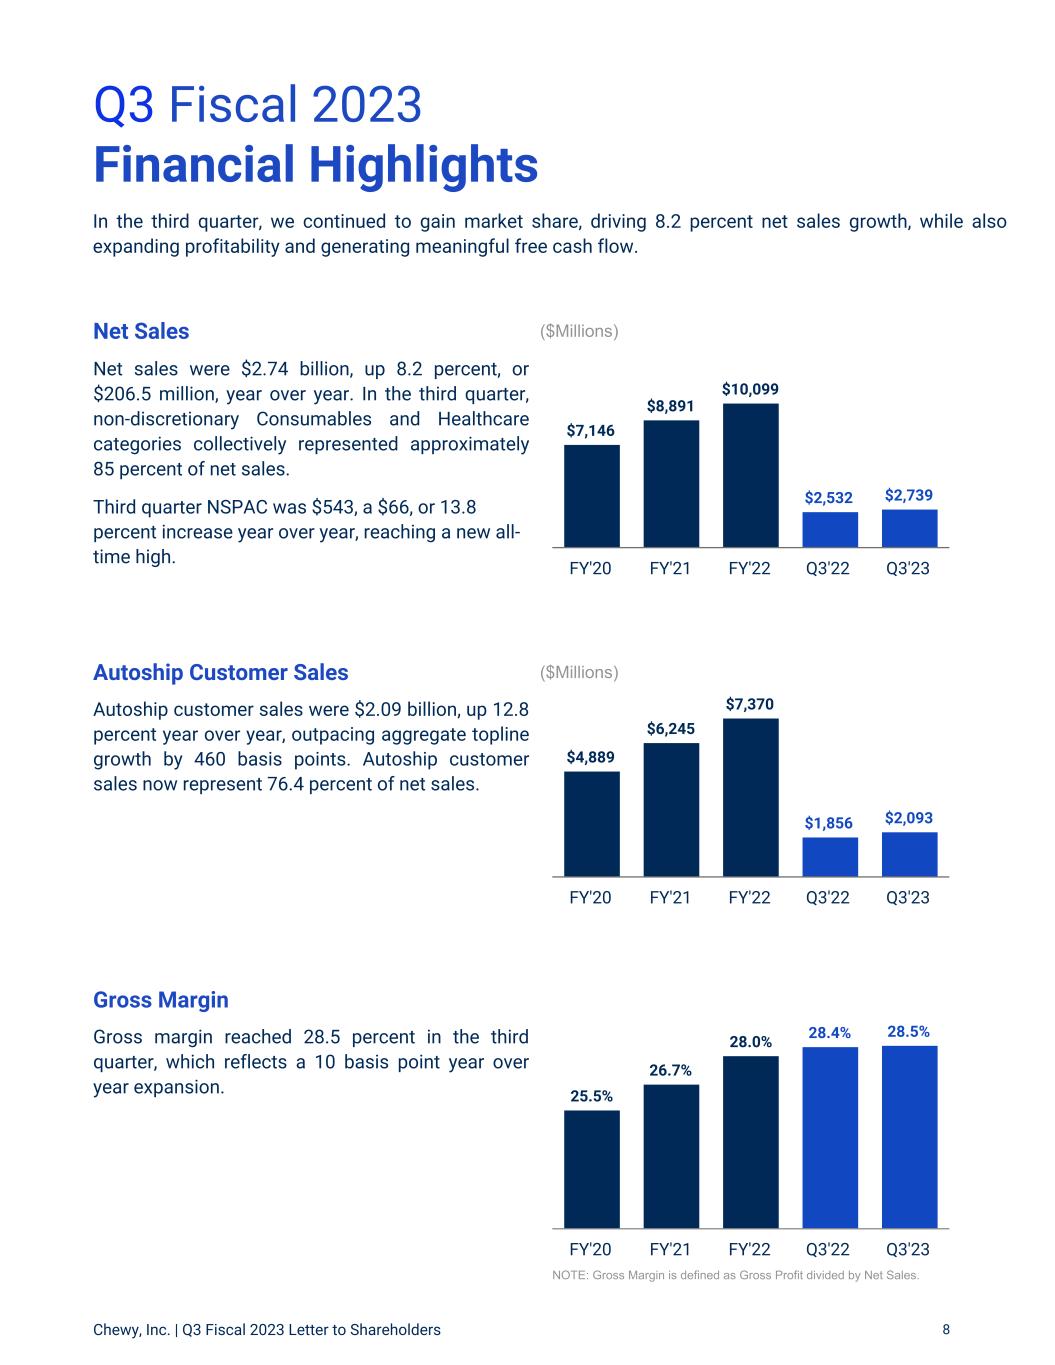
In the third quarter, we continued to gain market share, driving 8.2 percent net sales growth, while also expanding profitability and generating meaningful free cash flow. 25.5% 26.7% 28.0% 28.4% 28.5% FY'20 FY'21 FY'22 Q3'22 Q3'23 $4,889 $6,245 $7,370 $1,856 $2,093 FY'20 FY'21 FY'22 Q3'22 Q3'23 Q3 Fiscal 2023 Financial Highlights NOTE: Gross Margin is defined as Gross Profit divided by Net Sales. Net Sales Net sales were $2.74 billion, up 8.2 percent, or $206.5 million, year over year. In the third quarter, non-discretionary Consumables and Healthcare categories collectively represented approximately 85 percent of net sales. Third quarter NSPAC was $543, a $66, or 13.8 percent increase year over year, reaching a new all- time high. Autoship Customer Sales Autoship customer sales were $2.09 billion, up 12.8 percent year over year, outpacing aggregate topline growth by 460 basis points. Autoship customer sales now represent 76.4 percent of net sales. Gross Margin Gross margin reached 28.5 percent in the third quarter, which reflects a 10 basis point year over year expansion. ($Millions) ($Millions) Chewy, Inc. | Q3 Fiscal 2023 Letter to Shareholders 8 $7,146 $8,891 $10,099 $2,532 $2,739 FY'20 FY'21 FY'22 Q3'22 Q3'23
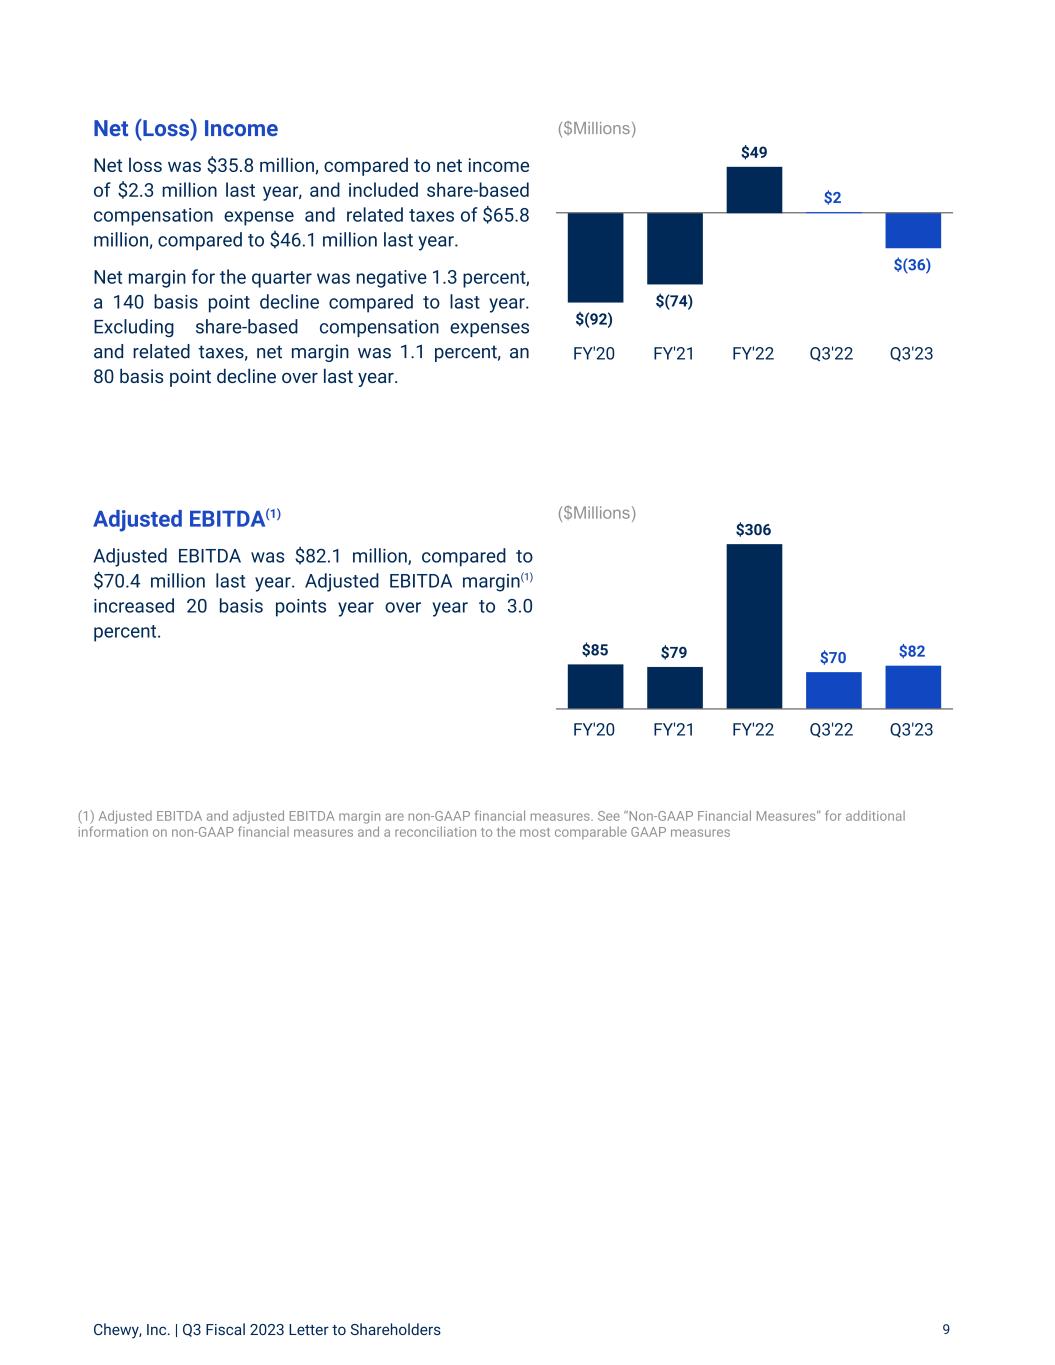
$(92) $(74) $49 $2 $(36) FY'20 FY'21 FY'22 Q3'22 Q3'23 $85 $79 $306 $70 $82 FY'20 FY'21 FY'22 Q3'22 Q3'23 Net (Loss) Income Net loss was $35.8 million, compared to net income of $2.3 million last year, and included share-based compensation expense and related taxes of $65.8 million, compared to $46.1 million last year. Net margin for the quarter was negative 1.3 percent, a 140 basis point decline compared to last year. Excluding share-based compensation expenses and related taxes, net margin was 1.1 percent, an 80 basis point decline over last year. Adjusted EBITDA(1) Adjusted EBITDA was $82.1 million, compared to $70.4 million last year. Adjusted EBITDA margin(1) increased 20 basis points year over year to 3.0 percent. ($Millions) Chewy, Inc. | Q3 Fiscal 2023 Letter to Shareholders 9 ($Millions) (1) Adjusted EBITDA and adjusted EBITDA margin are non-GAAP financial measures. See “Non-GAAP Financial Measures” for additional information on non-GAAP financial measures and a reconciliation to the most comparable GAAP measures
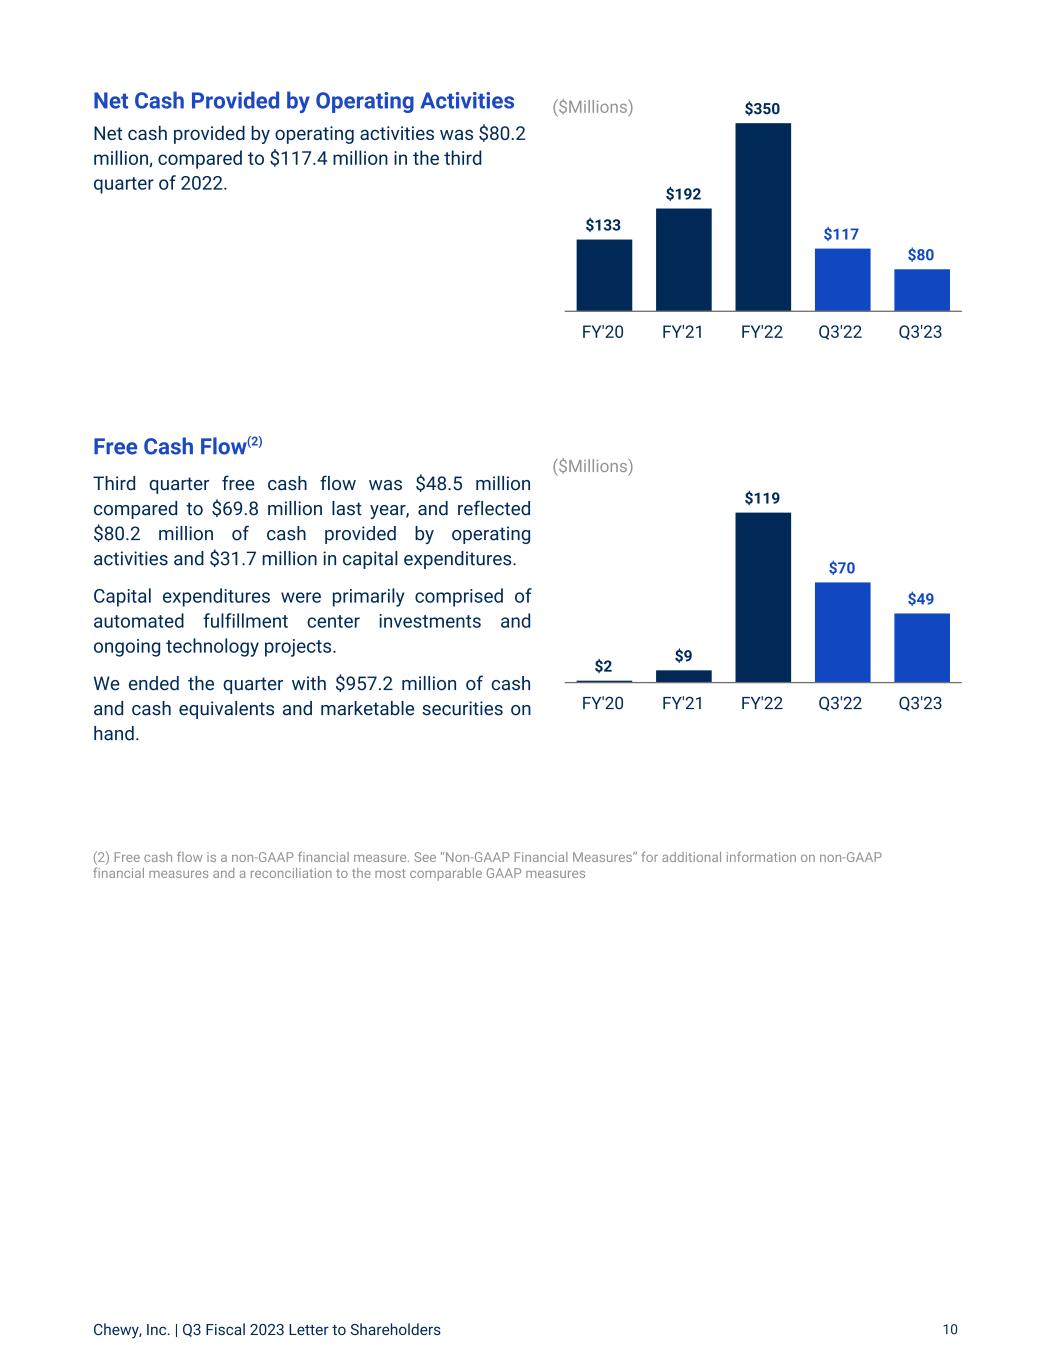
$2 $9 $119 $70 $49 FY'20 FY'21 FY'22 Q3'22 Q3'23 $133 $192 $350 $117 $80 FY'20 FY'21 FY'22 Q3'22 Q3'23 (2) Free cash flow is a non-GAAP financial measure. See “Non-GAAP Financial Measures” for additional information on non-GAAP financial measures and a reconciliation to the most comparable GAAP measures ($Millions) Net Cash Provided by Operating Activities Net cash provided by operating activities was $80.2 million, compared to $117.4 million in the third quarter of 2022. ($Millions) Chewy, Inc. | Q3 Fiscal 2023 Letter to Shareholders 10 Free Cash Flow(2) Third quarter free cash flow was $48.5 million compared to $69.8 million last year, and reflected $80.2 million of cash provided by operating activities and $31.7 million in capital expenditures. Capital expenditures were primarily comprised of automated fulfillment center investments and ongoing technology projects. We ended the quarter with $957.2 million of cash and cash equivalents and marketable securities on hand.
Media Contact: Diane Pelkey dpelkey@chewy.com Investor Contact: Jennifer Hsu ir@chewy.com We will host a conference call and earnings webcast at 5:00 pm ET today to discuss these results. Investors and participants can access the call by dialing (844) 200-6205 in the U.S. or +1 (646) 904-5544 internationally using the conference code 528484. A live webcast will also be available on Chewy’s investor relations website at investor.chewy.com. Thank you for taking the time to review our letter, and we look forward to your questions on our call this afternoon. Sincerely, Closing Stacy Bowman, Interim CFO Sumit Singh, CEO Chewy, Inc. | Q3 Fiscal 2023 Letter to Shareholders 11
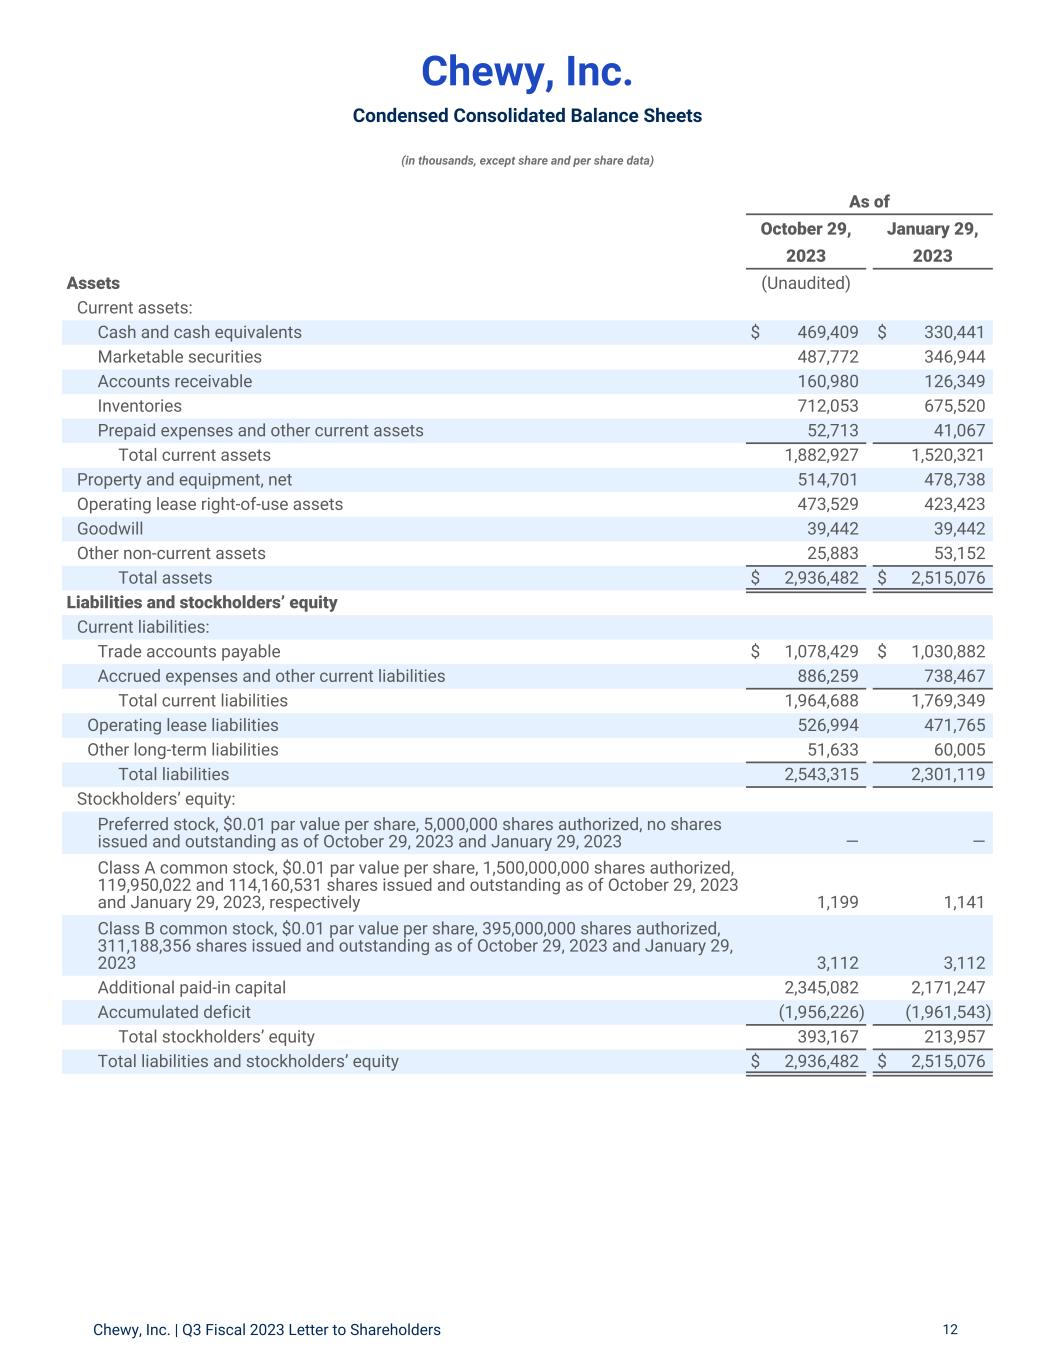
Chewy, Inc. Condensed Consolidated Balance Sheets (in thousands, except share and per share data) Chewy, Inc. | Q3 Fiscal 2023 Letter to Shareholders 12 As of October 29, January 29, 2023 2023 Assets (Unaudited) Current assets: Cash and cash equivalents $ 469,409 $ 330,441 Marketable securities 487,772 346,944 Accounts receivable 160,980 126,349 Inventories 712,053 675,520 Prepaid expenses and other current assets 52,713 41,067 Total current assets 1,882,927 1,520,321 Property and equipment, net 514,701 478,738 Operating lease right-of-use assets 473,529 423,423 Goodwill 39,442 39,442 Other non-current assets 25,883 53,152 Total assets $ 2,936,482 $ 2,515,076 Liabilities and stockholders’ equity Current liabilities: Trade accounts payable $ 1,078,429 $ 1,030,882 Accrued expenses and other current liabilities 886,259 738,467 Total current liabilities 1,964,688 1,769,349 Operating lease liabilities 526,994 471,765 Other long-term liabilities 51,633 60,005 Total liabilities 2,543,315 2,301,119 Stockholders’ equity: Preferred stock, $0.01 par value per share, 5,000,000 shares authorized, no shares issued and outstanding as of October 29, 2023 and January 29, 2023 — — Class A common stock, $0.01 par value per share, 1,500,000,000 shares authorized, 119,950,022 and 114,160,531 shares issued and outstanding as of October 29, 2023 and January 29, 2023, respectively 1,199 1,141 Class B common stock, $0.01 par value per share, 395,000,000 shares authorized, 311,188,356 shares issued and outstanding as of October 29, 2023 and January 29, 2023 3,112 3,112 Additional paid-in capital 2,345,082 2,171,247 Accumulated deficit (1,956,226) (1,961,543) Total stockholders’ equity 393,167 213,957 Total liabilities and stockholders’ equity $ 2,936,482 $ 2,515,076
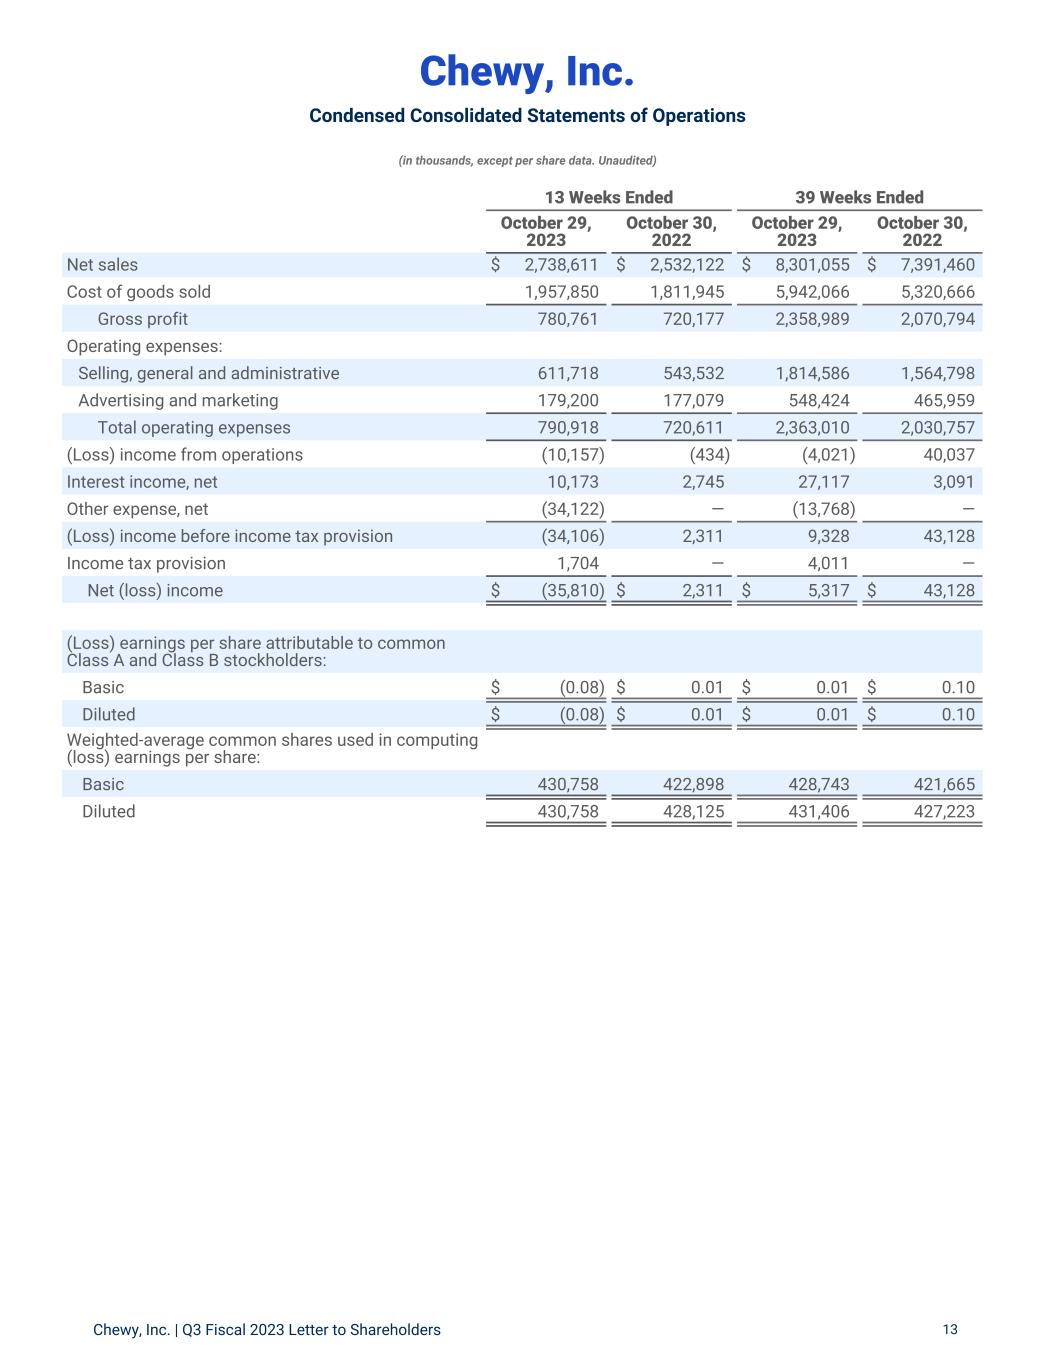
Chewy, Inc. Condensed Consolidated Statements of Operations (in thousands, except per share data. Unaudited) Chewy, Inc. | Q3 Fiscal 2023 Letter to Shareholders 13 13 Weeks Ended 39 Weeks Ended October 29, 2023 October 30, 2022 October 29, 2023 October 30, 2022 Net sales $ 2,738,611 $ 2,532,122 $ 8,301,055 $ 7,391,460 Cost of goods sold 1,957,850 1,811,945 5,942,066 5,320,666 Gross profit 780,761 720,177 2,358,989 2,070,794 Operating expenses: Selling, general and administrative 611,718 543,532 1,814,586 1,564,798 Advertising and marketing 179,200 177,079 548,424 465,959 Total operating expenses 790,918 720,611 2,363,010 2,030,757 (Loss) income from operations (10,157) (434) (4,021) 40,037 Interest income, net 10,173 2,745 27,117 3,091 Other expense, net (34,122) — (13,768) — (Loss) income before income tax provision (34,106) 2,311 9,328 43,128 Income tax provision 1,704 — 4,011 — Net (loss) income $ (35,810) $ 2,311 $ 5,317 $ 43,128 (Loss) earnings per share attributable to common Class A and Class B stockholders: Basic $ (0.08) $ 0.01 $ 0.01 $ 0.10 Diluted $ (0.08) $ 0.01 $ 0.01 $ 0.10 Weighted-average common shares used in computing (loss) earnings per share: Basic 430,758 422,898 428,743 421,665 Diluted 430,758 428,125 431,406 427,223

Chewy, Inc. Condensed Consolidated Statements of Cash Flows (in thousands. Unaudited) Chewy, Inc. | Q3 Fiscal 2023 Letter to Shareholders 14 39 Weeks Ended October 29, 2023 October 30, 2022 Cash flows from operating activities Net income $ 5,317 $ 43,128 Adjustments to reconcile net income to net cash provided by operating activities: Depreciation and amortization 82,195 60,696 Share-based compensation expense 178,897 109,701 Non-cash lease expense 29,371 29,286 Change in fair value of equity warrants and investments 13,589 — Other 3,810 840 Net change in operating assets and liabilities: Accounts receivable (34,631) (3,453) Inventories (36,533) (118,719) Prepaid expenses and other current assets (27,363) (6,237) Other non-current assets (1,337) (44,220) Trade accounts payable 47,547 108,635 Accrued expenses and other current liabilities 144,599 42,306 Operating lease liabilities (19,774) (15,790) Other long-term liabilities 1,669 42,847 Net cash provided by operating activities 387,356 249,020 Cash flows from investing activities Capital expenditures (110,898) (171,841) Cash paid for acquisition of business, net of cash acquired (367) — Purchases of marketable securities (876,189) (296,624) Proceeds from maturities of marketable securities 750,000 — Other — (1,400) Net cash used in investing activities (237,454) (469,865) Cash flows from financing activities Payments for tax sharing agreement with related parties (10,279) (1,040) Principal repayments of finance lease obligations (475) (492) Payment of debt modification costs (175) — Payments for tax withholdings related to vesting of share-based compensation awards (5) (2,475) Net cash used in financing activities (10,934) (4,007) Net increase (decrease) in cash and cash equivalents 138,968 (224,852) Cash and cash equivalents, as of beginning of period 330,441 603,079 Cash and cash equivalents, as of end of period $ 469,409 $ 378,227
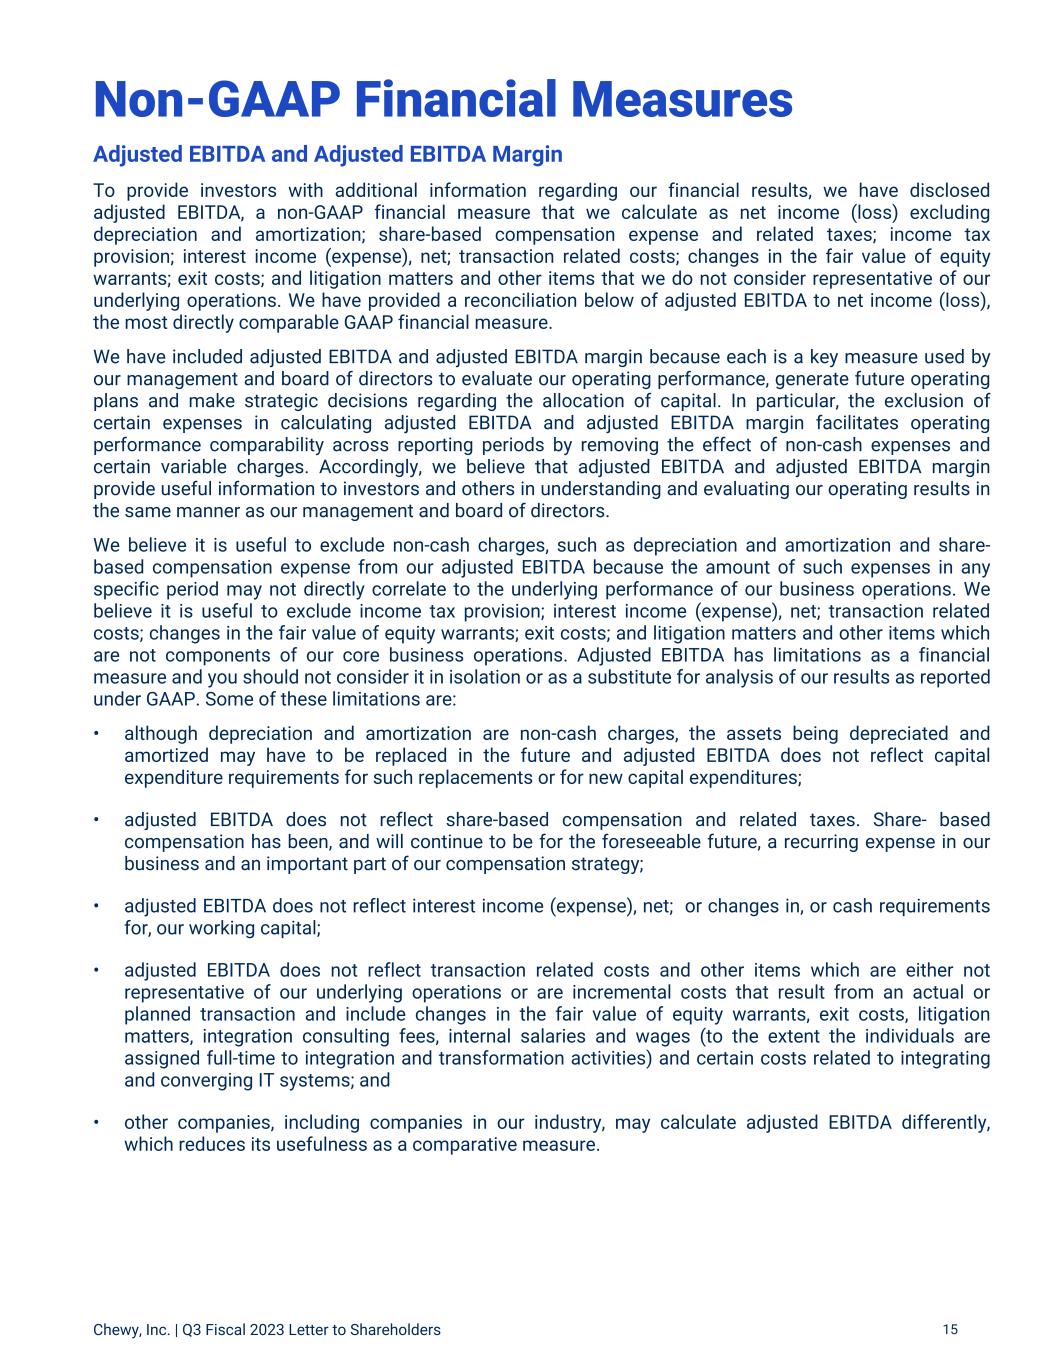
Non-GAAP Financial Measures Chewy, Inc. | Q3 Fiscal 2023 Letter to Shareholders 15 Adjusted EBITDA and Adjusted EBITDA Margin To provide investors with additional information regarding our financial results, we have disclosed adjusted EBITDA, a non-GAAP financial measure that we calculate as net income (loss) excluding depreciation and amortization; share-based compensation expense and related taxes; income tax provision; interest income (expense), net; transaction related costs; changes in the fair value of equity warrants; exit costs; and litigation matters and other items that we do not consider representative of our underlying operations. We have provided a reconciliation below of adjusted EBITDA to net income (loss), the most directly comparable GAAP financial measure. We have included adjusted EBITDA and adjusted EBITDA margin because each is a key measure used by our management and board of directors to evaluate our operating performance, generate future operating plans and make strategic decisions regarding the allocation of capital. In particular, the exclusion of certain expenses in calculating adjusted EBITDA and adjusted EBITDA margin facilitates operating performance comparability across reporting periods by removing the effect of non-cash expenses and certain variable charges. Accordingly, we believe that adjusted EBITDA and adjusted EBITDA margin provide useful information to investors and others in understanding and evaluating our operating results in the same manner as our management and board of directors. We believe it is useful to exclude non-cash charges, such as depreciation and amortization and share- based compensation expense from our adjusted EBITDA because the amount of such expenses in any specific period may not directly correlate to the underlying performance of our business operations. We believe it is useful to exclude income tax provision; interest income (expense), net; transaction related costs; changes in the fair value of equity warrants; exit costs; and litigation matters and other items which are not components of our core business operations. Adjusted EBITDA has limitations as a financial measure and you should not consider it in isolation or as a substitute for analysis of our results as reported under GAAP. Some of these limitations are: • although depreciation and amortization are non-cash charges, the assets being depreciated and amortized may have to be replaced in the future and adjusted EBITDA does not reflect capital expenditure requirements for such replacements or for new capital expenditures; • adjusted EBITDA does not reflect share-based compensation and related taxes. Share- based compensation has been, and will continue to be for the foreseeable future, a recurring expense in our business and an important part of our compensation strategy; • adjusted EBITDA does not reflect interest income (expense), net; or changes in, or cash requirements for, our working capital; • adjusted EBITDA does not reflect transaction related costs and other items which are either not representative of our underlying operations or are incremental costs that result from an actual or planned transaction and include changes in the fair value of equity warrants, exit costs, litigation matters, integration consulting fees, internal salaries and wages (to the extent the individuals are assigned full-time to integration and transformation activities) and certain costs related to integrating and converging IT systems; and • other companies, including companies in our industry, may calculate adjusted EBITDA differently, which reduces its usefulness as a comparative measure.
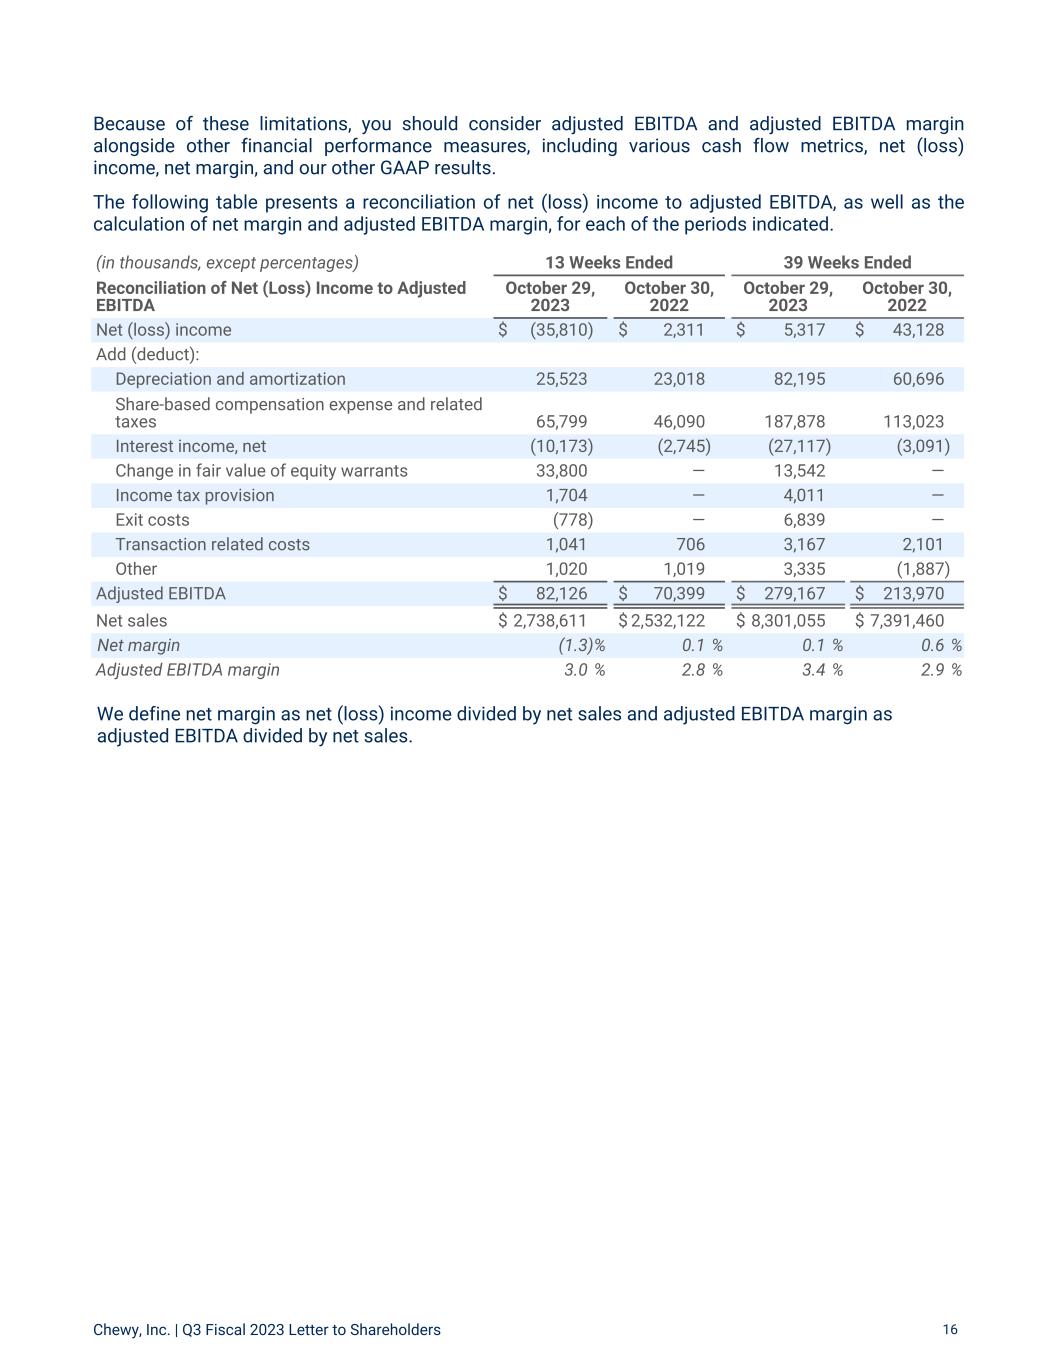
Because of these limitations, you should consider adjusted EBITDA and adjusted EBITDA margin alongside other financial performance measures, including various cash flow metrics, net (loss) income, net margin, and our other GAAP results. The following table presents a reconciliation of net (loss) income to adjusted EBITDA, as well as the calculation of net margin and adjusted EBITDA margin, for each of the periods indicated. Chewy, Inc. | Q3 Fiscal 2023 Letter to Shareholders 16 We define net margin as net (loss) income divided by net sales and adjusted EBITDA margin as adjusted EBITDA divided by net sales. (in thousands, except percentages) 13 Weeks Ended 39 Weeks Ended Reconciliation of Net (Loss) Income to Adjusted EBITDA October 29, 2023 October 30, 2022 October 29, 2023 October 30, 2022 Net (loss) income $ (35,810) $ 2,311 $ 5,317 $ 43,128 Add (deduct): Depreciation and amortization 25,523 23,018 82,195 60,696 Share-based compensation expense and related taxes 65,799 46,090 187,878 113,023 Interest income, net (10,173) (2,745) (27,117) (3,091) Change in fair value of equity warrants 33,800 — 13,542 — Income tax provision 1,704 — 4,011 — Exit costs (778) — 6,839 — Transaction related costs 1,041 706 3,167 2,101 Other 1,020 1,019 3,335 (1,887) Adjusted EBITDA $ 82,126 $ 70,399 $ 279,167 $ 213,970 Net sales $ 2,738,611 $ 2,532,122 $ 8,301,055 $ 7,391,460 Net margin (1.3) % 0.1 % 0.1 % 0.6 % Adjusted EBITDA margin 3.0 % 2.8 % 3.4 % 2.9 %
Adjusted Net Income & Adjusted Basic & Diluted Earnings Per Share To provide investors with additional information regarding our financial results, we have disclosed adjusted net income and adjusted basic and diluted earnings per share, which represent non-GAAP financial measures. We calculate adjusted net income as net income (loss) excluding share-based compensation expense and related taxes, changes in the fair value of equity warrants, and exit costs. We calculate adjusted basic and diluted earnings per share by dividing adjusted net income attributable to common stockholders by the weighted-average shares outstanding during the period. We have provided a reconciliation below of adjusted net income to net income (loss), the most directly comparable GAAP financial measure. We have included adjusted net income and adjusted basic and diluted earnings per share because each is a key measure used by our management and board of directors to evaluate our operating performance, generate future operating plans and make strategic decisions regarding the allocation of capital. In particular, the exclusion of certain expenses in calculating adjusted net income and adjusted basic and diluted earnings per share facilitates operating performance comparability across reporting periods by removing the effect of non-cash expenses and certain variable gains and losses that do not represent a component of our core business operations. We believe it is useful to exclude non- cash share-based compensation expense because the amount of such expenses in any specific period may not directly correlate to the underlying performance of our business operations. We believe it is useful to exclude exit costs and the changes in the fair value of equity warrants, because exit costs and the variability of equity warrant gains and losses are not representative of our underlying operations. Accordingly, we believe that these measures provide useful information to investors and others in understanding and evaluating our operating results in the same manner as our management and board of directors. Adjusted net income and adjusted basic and diluted earnings per share have limitations as financial measures and you should not consider them in isolation or as substitutes for analysis of our results as reported under GAAP. Other companies may calculate adjusted net income and adjusted basic and diluted earnings per share differently, which reduces their usefulness as comparative measures. Because of these limitations, you should consider adjusted net income and adjusted basic and diluted earnings alongside other financial performance measures, including various cash flow metrics, net income (loss), basic and diluted earnings (loss) per share, and our other GAAP results. The following table presents a reconciliation of net income to adjusted net income, as well as the calculation of adjusted basic and diluted earnings per share, for each of the periods indicated. Chewy, Inc. | Q3 Fiscal 2023 Letter to Shareholders 17
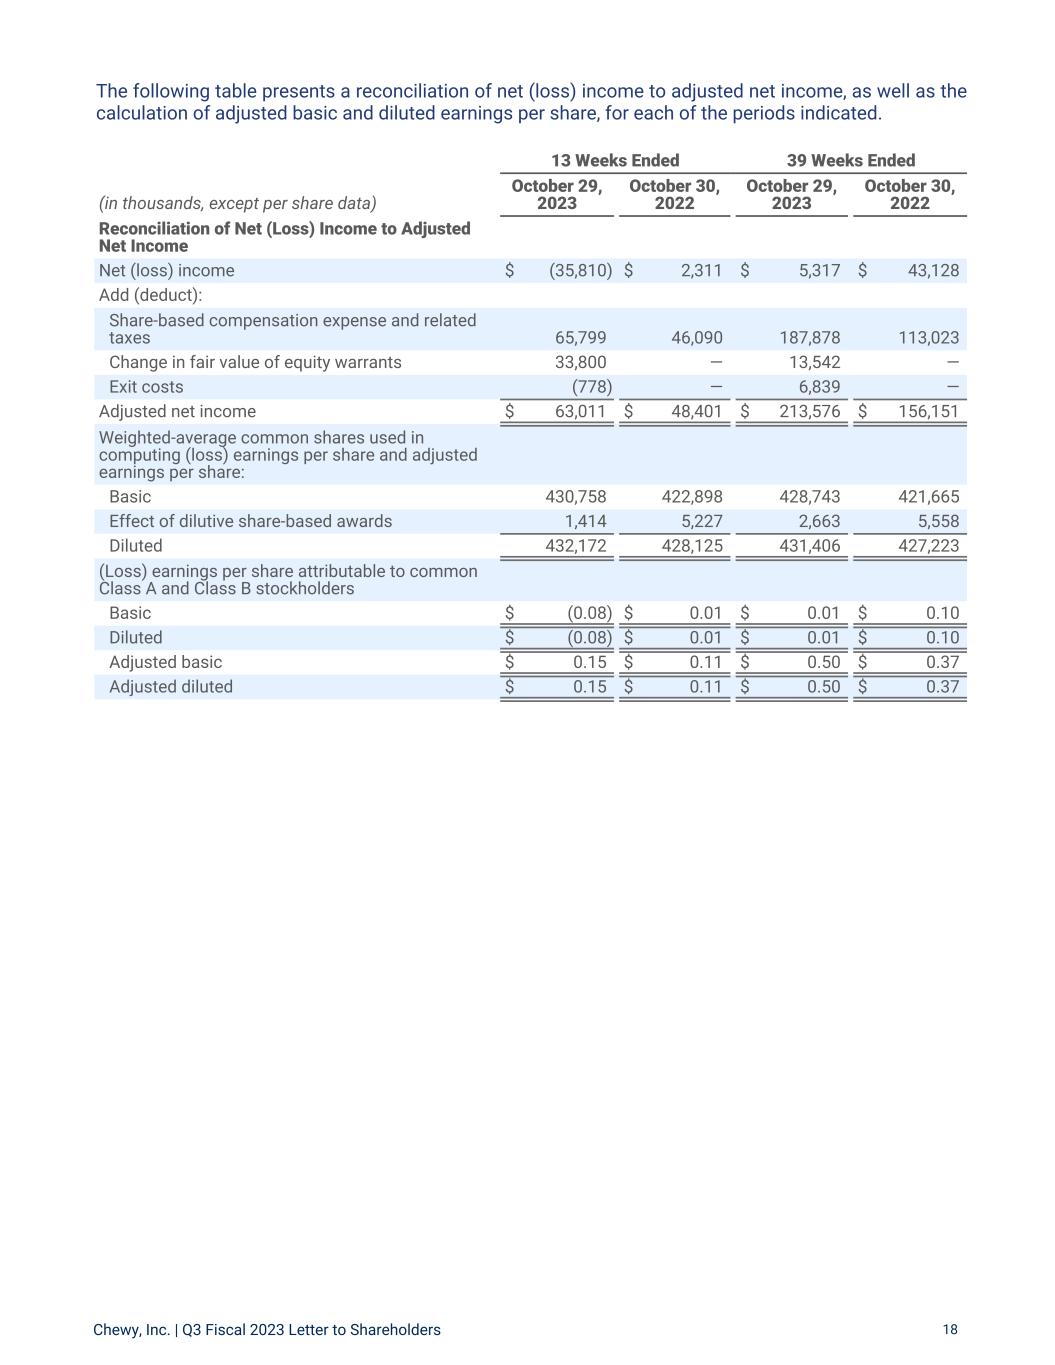
The following table presents a reconciliation of net (loss) income to adjusted net income, as well as the calculation of adjusted basic and diluted earnings per share, for each of the periods indicated. Chewy, Inc. | Q3 Fiscal 2023 Letter to Shareholders 18 13 Weeks Ended 39 Weeks Ended (in thousands, except per share data) October 29, 2023 October 30, 2022 October 29, 2023 October 30, 2022 Reconciliation of Net (Loss) Income to Adjusted Net Income Net (loss) income $ (35,810) $ 2,311 $ 5,317 $ 43,128 Add (deduct): Share-based compensation expense and related taxes 65,799 46,090 187,878 113,023 Change in fair value of equity warrants 33,800 — 13,542 — Exit costs (778) — 6,839 — Adjusted net income $ 63,011 $ 48,401 $ 213,576 $ 156,151 Weighted-average common shares used in computing (loss) earnings per share and adjusted earnings per share: Basic 430,758 422,898 428,743 421,665 Effect of dilutive share-based awards 1,414 5,227 2,663 5,558 Diluted 432,172 428,125 431,406 427,223 (Loss) earnings per share attributable to common Class A and Class B stockholders Basic $ (0.08) $ 0.01 $ 0.01 $ 0.10 Diluted $ (0.08) $ 0.01 $ 0.01 $ 0.10 Adjusted basic $ 0.15 $ 0.11 $ 0.50 $ 0.37 Adjusted diluted $ 0.15 $ 0.11 $ 0.50 $ 0.37
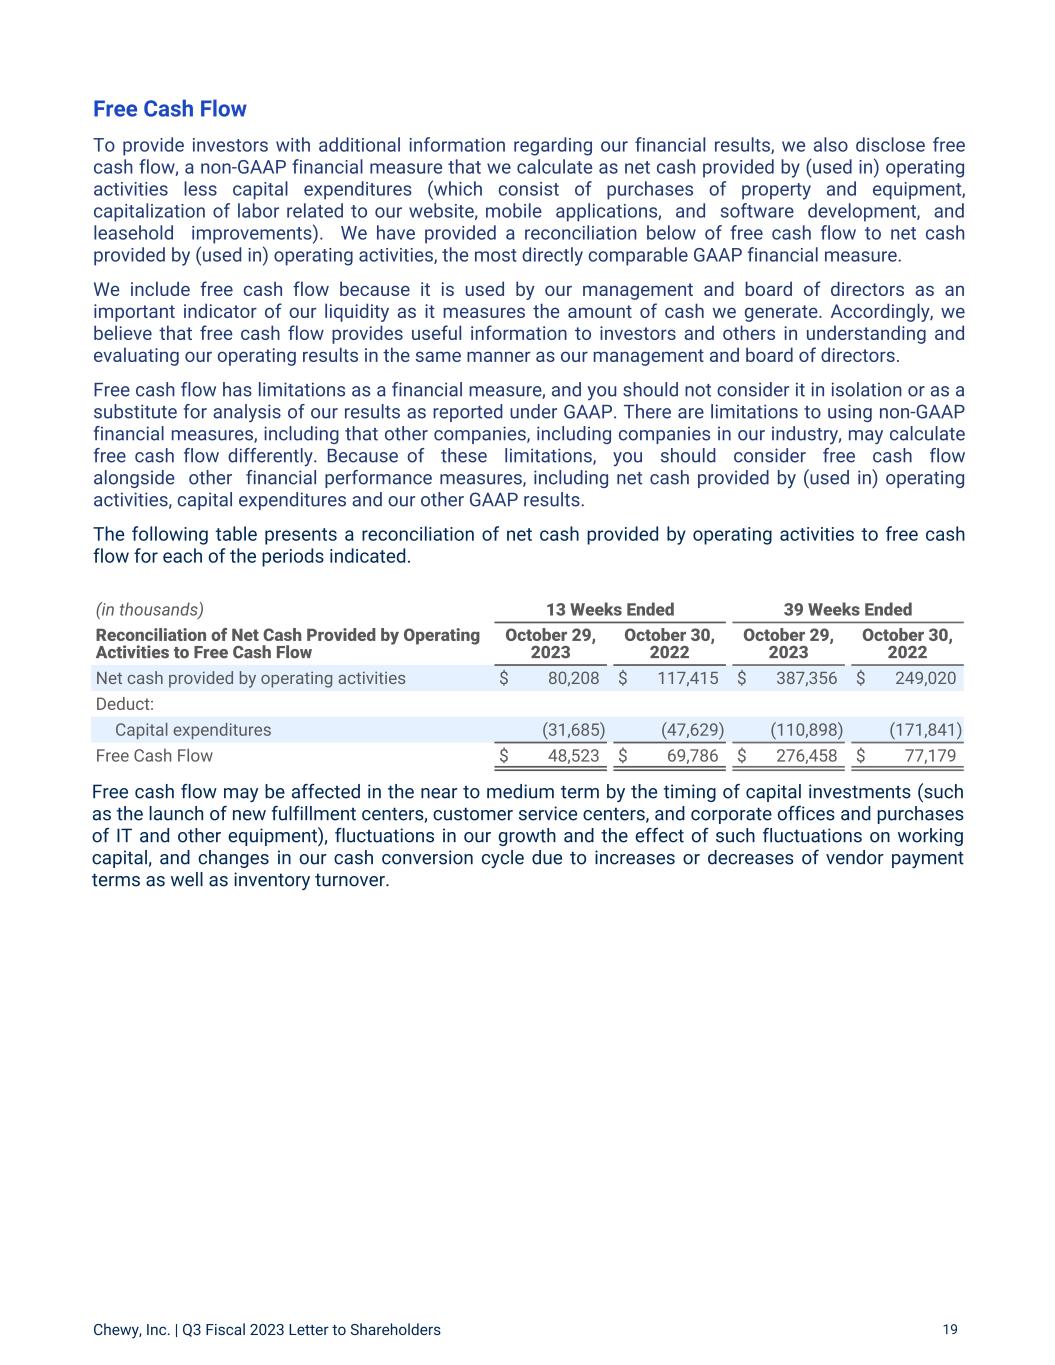
Chewy, Inc. | Q3 Fiscal 2023 Letter to Shareholders 19 Free cash flow may be affected in the near to medium term by the timing of capital investments (such as the launch of new fulfillment centers, customer service centers, and corporate offices and purchases of IT and other equipment), fluctuations in our growth and the effect of such fluctuations on working capital, and changes in our cash conversion cycle due to increases or decreases of vendor payment terms as well as inventory turnover. Free Cash Flow To provide investors with additional information regarding our financial results, we also disclose free cash flow, a non-GAAP financial measure that we calculate as net cash provided by (used in) operating activities less capital expenditures (which consist of purchases of property and equipment, capitalization of labor related to our website, mobile applications, and software development, and leasehold improvements). We have provided a reconciliation below of free cash flow to net cash provided by (used in) operating activities, the most directly comparable GAAP financial measure. We include free cash flow because it is used by our management and board of directors as an important indicator of our liquidity as it measures the amount of cash we generate. Accordingly, we believe that free cash flow provides useful information to investors and others in understanding and evaluating our operating results in the same manner as our management and board of directors. Free cash flow has limitations as a financial measure, and you should not consider it in isolation or as a substitute for analysis of our results as reported under GAAP. There are limitations to using non-GAAP financial measures, including that other companies, including companies in our industry, may calculate free cash flow differently. Because of these limitations, you should consider free cash flow alongside other financial performance measures, including net cash provided by (used in) operating activities, capital expenditures and our other GAAP results. The following table presents a reconciliation of net cash provided by operating activities to free cash flow for each of the periods indicated. (in thousands) 13 Weeks Ended 39 Weeks Ended Reconciliation of Net Cash Provided by Operating Activities to Free Cash Flow October 29, 2023 October 30, 2022 October 29, 2023 October 30, 2022 Net cash provided by operating activities $ 80,208 $ 117,415 $ 387,356 $ 249,020 Deduct: Capital expenditures (31,685) (47,629) (110,898) (171,841) Free Cash Flow $ 48,523 $ 69,786 $ 276,458 $ 77,179
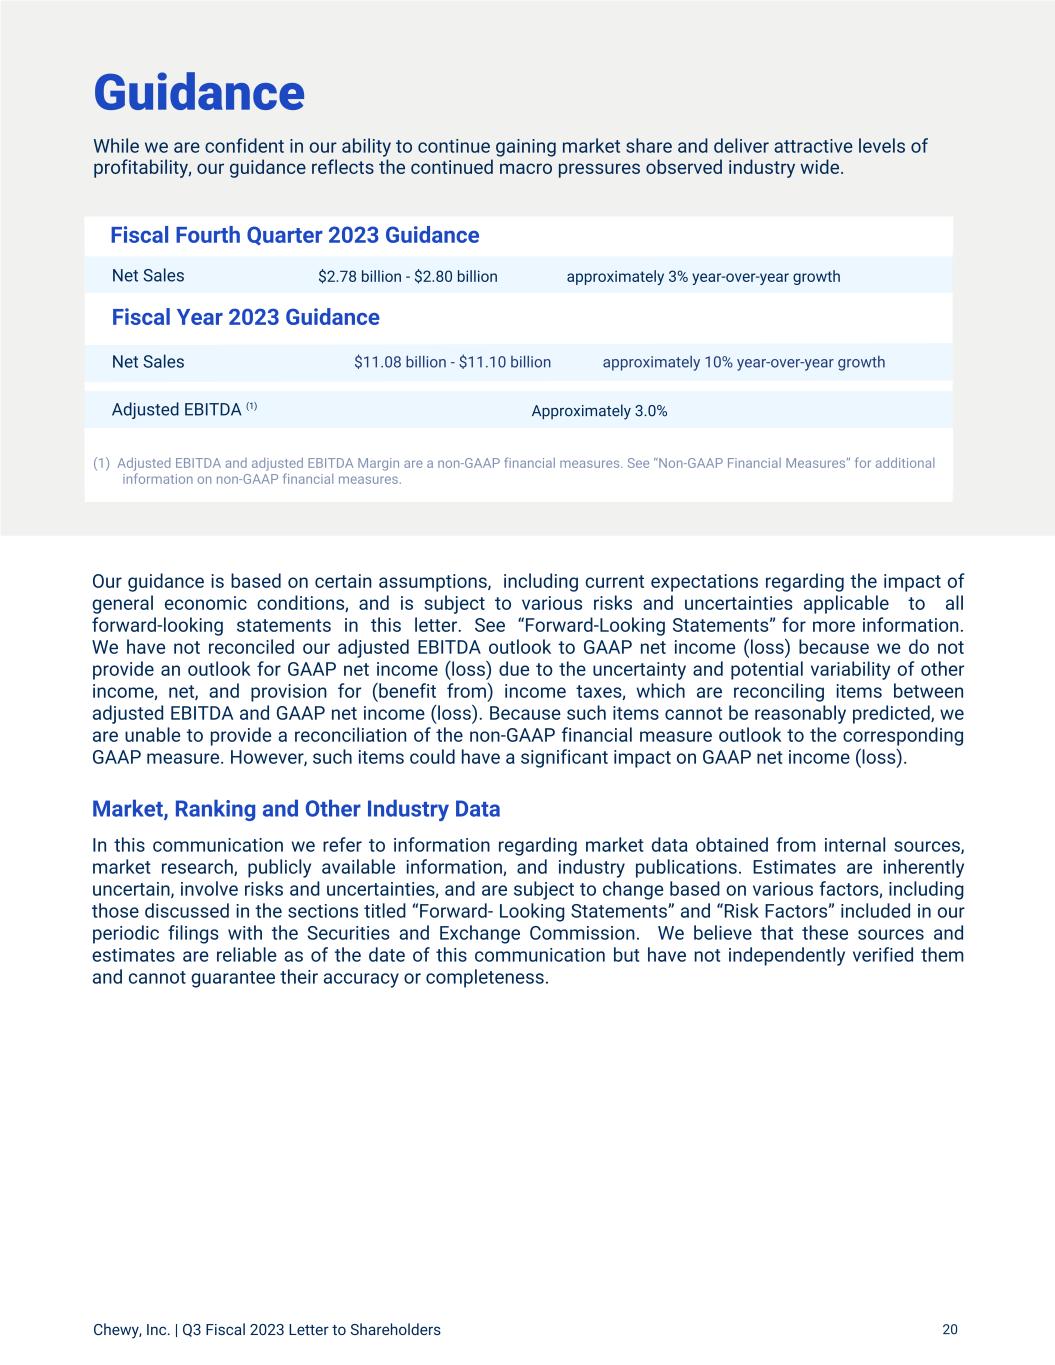
Chewy, Inc. | Q3 Fiscal 2023 Letter to Shareholders 20 Guidance Fiscal Fourth Quarter 2023 Guidance Fiscal Year 2023 Guidance Adjusted EBITDA (1) (1) Adjusted EBITDA and adjusted EBITDA Margin are a non-GAAP financial measures. See “Non-GAAP Financial Measures” for additional information on non-GAAP financial measures. Approximately 3.0% Net Sales $2.78 billion - $2.80 billion approximately 3% year-over-year growth Net Sales $11.08 billion - $11.10 billion approximately 10% year-over-year growth Our guidance is based on certain assumptions, including current expectations regarding the impact of general economic conditions, and is subject to various risks and uncertainties applicable to all forward-looking statements in this letter. See “Forward-Looking Statements” for more information. We have not reconciled our adjusted EBITDA outlook to GAAP net income (loss) because we do not provide an outlook for GAAP net income (loss) due to the uncertainty and potential variability of other income, net, and provision for (benefit from) income taxes, which are reconciling items between adjusted EBITDA and GAAP net income (loss). Because such items cannot be reasonably predicted, we are unable to provide a reconciliation of the non-GAAP financial measure outlook to the corresponding GAAP measure. However, such items could have a significant impact on GAAP net income (loss). Market, Ranking and Other Industry Data In this communication we refer to information regarding market data obtained from internal sources, market research, publicly available information, and industry publications. Estimates are inherently uncertain, involve risks and uncertainties, and are subject to change based on various factors, including those discussed in the sections titled “Forward- Looking Statements” and “Risk Factors” included in our periodic filings with the Securities and Exchange Commission. We believe that these sources and estimates are reliable as of the date of this communication but have not independently verified them and cannot guarantee their accuracy or completeness. While we are confident in our ability to continue gaining market share and deliver attractive levels of profitability, our guidance reflects the continued macro pressures observed industry wide.
Forward-Looking Statements This communication contains forward-looking statements about us and our industry that involve substantial risks and uncertainties. All statements other than statements of historical facts contained in this communication, including statements regarding our future results of operations or financial condition, business strategy and plans and objectives of management for future operations, are forward-looking statements. In some cases, you can identify forward-looking statements because they contain words such as “anticipate,” “believe,” “contemplate,” “continue,” “could,” “estimate,” “expect,” “forecast,” “intend,” “may,” “plan,” “potential,” “predict,” “project,” “seek,” “should,” “target,” “will” or “would” or the negative of these words or other similar terms or expressions. These forward-looking statements include, but are not limited to, statements concerning our ability to: sustain our recent growth rates and successfully manage challenges to our future growth, including introducing new products or services, improving existing products and services, and expanding into new offerings; successfully manage risks related to the macroeconomic environment, including any adverse impacts on our business operations, financial performance, supply chain, workforce, facilities, customer services and operations; acquire and retain new customers in a cost-effective manner and increase our net sales, improve margins and maintain profitability; manage our growth effectively; maintain positive perceptions of our company and preserve, grow, and leverage the value of our reputation and our brand; limit operating losses as we continue to expand our business; forecast net sales and appropriately plan our expenses in the future; estimate the size of our addressable market; strengthen our current supplier relationships, retain key suppliers and source additional suppliers; negotiate acceptable pricing and other terms with third-party service providers, suppliers and outsourcing partners and maintain our relationships with such parties; mitigate changes in, or disruptions to, our shipping arrangements and operations; optimize, operate and manage the expansion of the capacity of our fulfillment centers; provide our customers with a cost-effective platform that is able to respond and adapt to rapid changes in technology; limit our losses related to online payment methods; maintain and scale our technology, including the reliability of our website, mobile applications, and network infrastructure; maintain adequate cybersecurity with respect to our systems and ensure that our third-party service providers do the same with respect to their systems; maintain consumer confidence in the safety, quality and health of our products; limit risks associated with our suppliers and our outsourcing partners; comply with existing or future laws and regulations in a cost- efficient manner; compete with other retailers and service providers; utilize tax attributes, net operating loss and tax credit carryforwards, and limit fluctuations in our tax obligations and effective tax rate; adequately protect our intellectual property rights; successfully defend ourselves against any allegations or claims that we may be subject to; attract, develop, motivate and retain highly-qualified and skilled employees; predict and respond to economic conditions, industry trends, and market conditions, and their impact on the pet products market; reduce merchandise returns or refunds; respond to severe weather and limit disruption to normal business operations; manage new acquisitions, investments or alliances, and integrate them into our existing business; successfully compete in the pet insurance market; manage challenges presented by international markets; successfully compete in the pet products and services health and retail industry, especially in the e- commerce sector; raise capital as needed; and maintain effective internal control over financial reporting and disclosure controls and procedures. Chewy, Inc. | Q3 Fiscal 2023 Letter to Shareholders 21
Chewy, Inc. | Q3 Fiscal 2023 Letter to Shareholders 22 You should not rely on forward-looking statements as predictions of future events, and you should understand that these statements are not guarantees of performance or results, and our actual results could differ materially from those expressed in the forward-looking statements due to a variety of factors. We have based the forward-looking statements contained in this communication primarily on our current assumptions, expectations, and projections about future events and trends that we believe may affect our business, financial condition, and results of operations. The outcome of the events described in these forward-looking statements is subject to risks, uncertainties and other factors described in the section titled “Risk Factors” included under Part I, Item 1A of our Annual Report on Form 10-K for the fiscal year ended January 29, 2023, and in our other filings with the Securities and Exchange Commission and elsewhere in this communication. Moreover, we operate in a very competitive and rapidly changing environment. New risks and uncertainties emerge from time to time, and it is not possible for us to predict all risks and uncertainties that could have an impact on the forward-looking statements contained in this communication. The results, events and circumstances reflected in the forward-looking statements may not be achieved or occur, and actual results, events or circumstances could differ materially from those described in the forward-looking statements. In addition, statements that “we believe” and similar statements reflect our beliefs and opinions on the relevant subject. These statements are based on information available to us as of the date of this communication. While we believe that information provides a reasonable basis for these statements, that information may be limited or incomplete. Our statements should not be read to indicate that we have conducted an exhaustive inquiry into, or review of, all relevant information. These statements are inherently uncertain, and investors are cautioned not to unduly rely on these statements. The forward- looking statements made in this communication relate only to events as of the date on which the statements are made. We undertake no obligation to update any forward-looking statements made in this communication to reflect events or circumstances after the date of this communication or to reflect new information or the occurrence of unanticipated events, except as required by law. We may not actually achieve the plans, intentions or expectations disclosed in our forward-looking statements, and you should not place undue reliance on our forward-looking statements. Our forward-looking statements do not reflect the potential impact of any future acquisitions, mergers, dispositions, joint ventures or investments.
