
INITIAL PUBLIC OFFERING OF PREFERRED STOCKNASDAQ Global Market: TECTP2019 16200 Dallas Parkway, Suite 190 | Dallas, Texas 75248 | (972) 720-9000 DRAFT – 5.3.2019 Free Writing ProspectusFiled Pursuant to Rule 433Registration No. 333-230949Dated May 6, 2019 140 171 231 28 65 136 162 160 164 162 175 200 83 130 220 235 74 36 Tectonic Financial, Inc.

Forward Looking Statements 2 Tectonic Financial, Inc. (the “Company”) has filed a registration statement (including a prospectus, which is preliminary and subject to completion) with the U.S. Securities and Exchange Commission (the “SEC”) for the offering of shares to which this communication relates. Before you invest, you should read the prospectus in that registration statement and the other documents the Company has filed with the SEC for more complete information about the Company and the offering. You may get these documents for free by visiting the SEC web site at www.sec.gov. Alternatively, you may obtain a copy of the prospectus by contacting: Sandler O'Neill & Partners, L.P., Attn: Syndicate, 1251 Avenue of the Americas, 6th Floor, New York, NY 10020, Tel: 1-866-805-4128 or Email: syndicate@sandleroneill.com, Sanders Morris Harris LLC, 600 Travis Street, 59th Floor, Houston, TX 77002, Tel: 713-224-3100 or Email: syndicate@smhgroup.com, or American Capital Partners, LLC, 205 Oser Avenue, Hauppauge, NY 11788, Tel: 631-851-0918 or Email: info@americancapitalpartners.com.This presentation (and oral statements made regarding the subject of this presentation) contain certain “forward looking statements”. These forward-looking statements reflect management's current views with respect to, among other things, future events and our financial performance. These statements are often, but not always, made through the use of words or phrases such as “may,” “might,” “should,” “could,” “predict,” “potential,” “believe,” “expect,” “continue,” “will,” “will likely result,” “anticipate,” “seek,” “estimate,” “intend,” “plan,” “projection,” “goal,” “target,” “outlook,” “aim,” “annualized,” “would” and “outlook,” or the negative version of those words or other comparable words or phrases of a future or forward-looking nature. These forward-looking statements are not historical facts, and are based on current expectations, estimates and projections about the Company's industry, management's beliefs and certain assumptions made by management, many of which, by their nature, are inherently uncertain and beyond our control. Accordingly, we caution you that any such forward-looking statements are not guarantees of future performance and are subject to risks, assumptions, estimates and uncertainties that are difficult to predict. Although we believe that the expectations reflected in these forward-looking statements are reasonable as of the date made, actual results may prove to be materially different from the results expressed or implied by the forward-looking statements. Forward-looking statements are not guarantees of future performance and should not be relied upon as representing management’s views as of any subsequent date. The Company undertakes no obligation to update forward-looking statements, whether as a result of new information, future events or otherwise, except as may be required by law. This presentation is not an offer to sell securities, nor is it a solicitation of an offer to buy securities in any locality, state, country or other jurisdiction where such distribution, publication, availability or use would be contrary to law or regulation or which would require any registration or licensing within such jurisdiction. Neither the SEC nor any other regulatory body has approved or disapproved of the securities of the Company or passed upon the accuracy or adequacy of this presentation. Any representation to the contrary is a criminal offense. Except as otherwise indicated, this presentation speaks as of the date hereof. The delivery of this presentation shall not, under any circumstances, create any implication there has been no change in the affairs of the Company after the date hereof.Our Fixed-to-Floating Rate Series B Non-Cumulative Perpetual Preferred Stock (the “Preferred Stock”) is not a deposit or savings account. The Preferred Stock is not insured by the Federal Deposit Insurance Corporation or any other government agency. This presentation includes industry and market data that we obtained from periodic industry publications, third-party studies and surveys. Although we believe this industry and market data is reliable as of the date of this presentation, this information could prove to be inaccurate. Industry and market data could be inaccurate because of the method by which sources obtained their data and because information cannot always be verified with complete certainty due to the limits on the availability and reliability of raw data, the voluntary nature of the data gathering process and other limitations and uncertainties. In addition, we do not know all of the assumptions regarding general economic conditions or growth that were used in preparing the forecasts from the sources relied upon or cited herein. This presentation contains financial information determined by methods other than in accordance with accounting principles generally accepted in the United States of America (“GAAP”). Management uses these “non-GAAP” measures in its analysis of our performance. Management believes that these non-GAAP financial measures allow for better comparability with prior periods, as well as with peers in the industry who provide a similar presentation, and provide a further understanding of our ongoing operations. These disclosures should not be viewed as a substitute for operating results determined in accordance with GAAP, nor are they necessarily comparable to non-GAAP performance measures that may be presented by other companies. A reconciliation of the non-GAAP measures used in this presentation to the most directly comparable GAAP measures is provided in the Appendix to this presentation. 140 171 231 28 65 136 162 160 164 162 175 200 83 130 220 235 74 36
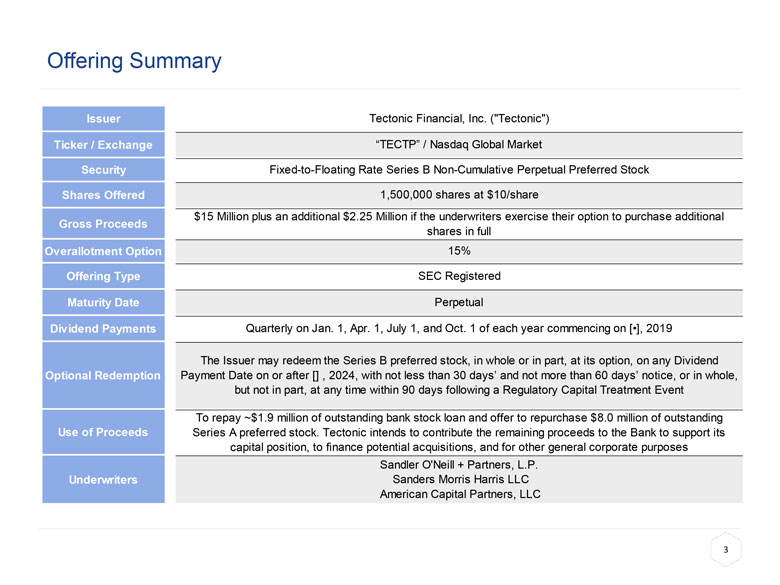
Offering Summary 3 140 171 231 28 65 136 162 160 164 162 175 200 83 130 220 235 74 36

Tectonic Financial, Inc.1 4 COMPANY OVERVIEW HEADQUARTERS DALLAS (Bank)HOUSTON (Investment Services) CLIENT ASSETS $3.3 BILLION2 EMPLOYEES 89 SERVICES BANKING / TRUSTWEALTH MANAGEMENTPRIVATE EQUITYINSURANCE TECTONIC, adj. (\tek-ˈtä-nik\)Having a strong and widespread impact; often used in geological terms to describe gradual or abrupt shifts in the earth’s structure. TIMELESS PHILOSOPHYAt Tectonic, we view wealth accumulation as a gradual (almost glacial) and disciplined process, and risk management as protection against an abrupt event (like a tsunami or earthquake).EXPERIENCED MANAGEMENTStrong history of growing companies in a creative, but risk-conscious manner. ALIGNED OWNERSHIPNearly 80% owned by professionals responsible for management and/or growth of business. OUR CLIENTS HIGH NET WORTH INDIVIDUALSSMALL BUSINESSESREGISTERED INVESTMENT ADVISERS Information is as of and for the year ended December 31, 2018 and assumes the consummation of the merger described hereinClient assets include assets under management, client assets in custody, and client brokerage assets HIGHLY CONFIDENTIAL – NOT FOR REDISTRIBUTION 140 171 231 28 65 136 162 160 164 162 175 200 83 130 220 235 74 36
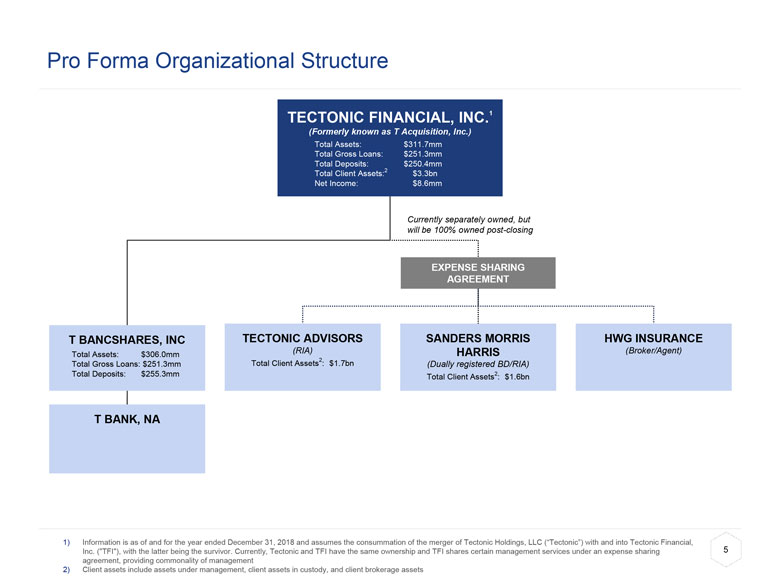
Pro Forma Organizational Structure 5 Information is as of and for the year ended December 31, 2018 and assumes the consummation of the merger of Tectonic Holdings, LLC (“Tectonic”) with and into Tectonic Financial, Inc. ("TFI"), with the latter being the survivor. Currently, Tectonic and TFI have the same ownership and TFI shares certain management services under an expense sharing agreement, providing commonality of management Client assets include assets under management, client assets in custody, and client brokerage assets TECTONIC FINANCIAL, INC.1(Formerly known as T. Acquisition, Inc.)Total Assets: $311.7mmTotal Gross Loans: $251.3mmTotal Deposits: $250.4mmTotal Client Assets:2 $3.3bnNet Income: $8.6mm SANDERS MORRIS HARRIS(Dually registered BD/RIA)Total Client Assets2: $1.6bn HWG INSURANCE(Broker/Agent) TECTONIC ADVISORS(RIA)Total Client Assets2: $1.7bn T BANCSHARES, INCTotal Assets: $306.0mm Total Gross Loans: $251.3mmTotal Deposits: $255.3mm T BANK, NA Currently separately owned, but will be 100% owned post-closing EXPENSE SHARING AGREEMENT 140 171 231 28 65 136 162 160 164 162 175 200 83 130 220 235 74 36

Franchise Overview 6 *Note: Represents a non-GAAP measure; see appendix for GAAP reconciliationsAs of and for the year ended December 31, 2018 and assumes the consummation of the merger described hereinNPLs exclude guaranteed portion of SBA loansClient assets include assets under management, client assets in custody, and client brokerage assets 2018 Financial Snapshot1 Balance Sheet Profitability Capital Ratios Asset Quality Franchise Overview Chartered on November 2, 2004 and headquartered in Dallas, TexasProvides a variety of traditional and niche lending services through its single branch location in Dallas, TexasThree main lending verticals:SBA & USDADental & Other ProfessionalTraditional Community BankingGenerate significant non-interest income through its trust services offered to its clientsAs of December 31, 2018, the Bank had approximately $1.2 billion in market value of trust assetsSmall business banking (particularly dental practices), SBA and USDA loans and trust services are national in scope Banking – T Bank, National Association (the "Bank") Investment Services Provides a variety of investment and insurance services to clients, including investment advisory, investment banking, asset management, securities investments, institutional execution, private equity and access to public offerings and other investmentsInvestment services subsidiaries include:Tectonic Advisors (Investment Advisory)Sanders Morris Harris (Brokerage/Advisory/Investment Banking)HWG Insurance (Insurance Agency) Investment Services 140 171 231 28 65 136 162 160 164 162 175 200 83 130 220 235 74 36

Prudent and rapid growth, with strong credit metrics; 18.5% and 18.1% annual growth in loans and client assets1, respectively; 17 basis points net charge-offs to average loans over the last 4 years Key Investment Highlights 7 Financial data shown as of and for the year ended December 31, 2018, except where noted*Note: Represents a non-GAAP measure; see appendix for GAAP reconciliationsClient assets include assets under management, client assets in custody, and client brokerage assets High performer with return on average assets (ROAA) of 3.0% and return on average tangible common equity (ROATCE*) of 51.6% as of and for the year ended December 31, 2018 Well-diversified and recurring revenue stream with fee based income of 71% of total revenue driven by client assets1 of $3.3 billion Ability to scale through technology; continued focus on an integrated long-term funding strategy Credentialed management team with past experience in successfully growing companies Significant insider and affiliate ownership closely aligns management; directors, named executive officers and affiliates beneficially own ~77.5% of outstanding common shares Located in robust, fast-growing metropolitan Texas markets (Dallas / Houston) with added diversification benefits via national lending platforms Proven ability to grow client assets1 organically and through strategic acquisitions 140 171 231 28 65 136 162 160 164 162 175 200 83 130 220 235 74 36

8 Interest Coverage Ratio* 140 171 231 28 65 136 162 160 164 162 175 200 83 130 220 235 74 36 *Note: Assumes $15.0 million of outstanding Series B Non-Cumulative Perpetual Preferred stock at a 9.0% illustrative annual dividend rate and repurchase of $8.0 million of Series A Preferred Stock at a 10.0% annual dividend rate
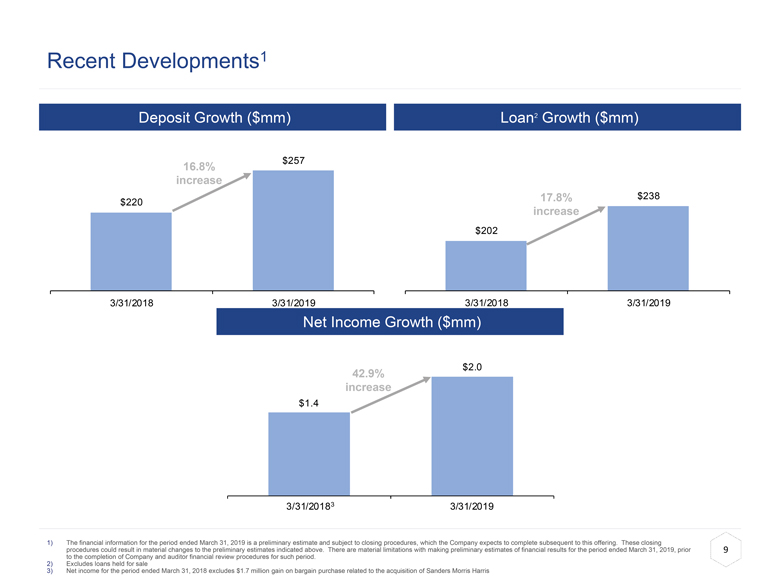
9 Recent Developments Deposit Growth ($mm) Loan1 Growth ($mm) Net Income Growth ($mm) 16.8% increase 140 171 231 28 65 136 162 160 164 162 175 200 83 130 220 235 74 36 17.8% increase 11.1% increase The financial information for the period ended March 31, 2019 is a preliminary estimate and subject to closing procedures, which the Company expects to complete subsequent to this offering. These closing procedures could result in material changes to the preliminary estimates indicated above. There are material limitations with making preliminary estimates of financial results for the period ended March 31, 2019, prior to the completion of Company and auditor financial review procedures for such period. Excludes loans held for saleNet income for the period ended March 31, 2018 excludes $1.3 million gain on bargain purchase related to the acquisition of Sanders Morris Harris 2 3

10 High PerformerAbility to Generate Significant Returns for Shareholders *Note: Peer group includes Texas banks with assets ranging from $250 million-$500 million as of and for the year ended December 31, 2018Represents a non-GAAP measure; see appendix for GAAP reconciliations Return on Average Assetsfor the year ended December 31, 2018 Return on Average Tangible Common Equity1for the year ended December 31, 2018 1 140 171 231 28 65 136 162 160 164 162 175 200 83 130 220 235 74 36

11 High Earnings Combined With Strategy of De-Risking Balance SheetRetain Guaranteed Portion of SBA Loans: High Earning Power & Increasing Ratios * Note: Closed acquisition of bank in May 2017 and implemented strategy of holding SBA loans Impressive Loan Growth Strong Capital Ratios 1 In May 2017 (when the current ownership group acquired T Bank, NA), management embarked on a strategy to both grow the balance sheet, and de-risk it, through retaining the guaranteed portion of SBA loans. This strategy has resulted in: (a) larger loan portfolio, (b) increased earning power and (c) stronger capital ratios. 22.5% 22.5% 26.2% 8.8% 35.36% 140 171 231 28 65 136 162 160 164 162 175 200 83 130 220 235 74 36

Well-Diversified and Recurring Revenue StreamSubstantial Fee Revenue and Recurring Pre-Tax Earnings² 12 Note: Data shown as of and for the year ended December 31, 2018 and the allocation of pre-tax earnings among the various business lines is based on management estimates Consists primarily of Tectonic’s net gain on bargain purchase in connection with its acquisition of Sanders MorrisExcludes non-deposit interest expense Approximately 83% of pre-tax and pre-interest earnings² are generated by revenues from lending, trust, investment advisory and insurance $35.9mm 2 Gross Revenue Breakdown Pre-Tax Earnings2 Composition 140 171 231 28 65 136 162 160 164 162 175 200 83 130 220 235 74 36

Well-Diversified and Recurring Revenue Stream (Cont.)Investment Services 13 *Note: Client assets include assets under management, client assets in custody, and client brokerage assetsExcludes non-deposit interest expenseIncludes pre-tax earnings from trust business Tectonic Advisors(Investment Advisory) Sanders Morris Harris(Brokerage) HWG Insurance(Insurance Broker) Business Description / Products & Services Offered AUM / AUA 2018 Pre-Tax Earnings1 Investment advisory services to individuals, institutions (including affiliates) and families principally for an asset-based feeMakes recommendations on retaining investment managers, making investments in exchange traded funds (ETFs) or other passive investments and/or providing advice on the allocation of assets among investment managers and asset classes$1.7 billion in assets under management and administration as of December 31, 2018, including the Bank's $1.2 billion in trust assetsProvides advice on 8 common pooled funds, which are combined in various manners to develop different portfolios for investorsAlso advises on assets for Cain Watters Dual registered broker-dealer and RIA headquartered in Houston, TX$273 million in assets under management as of December 31, 2018Nearly $1.3 billion in client brokerage assets domiciled at its clearing firm as of December 31, 2018Provides clients with access to private investmentsParticipates in public offerings, as a selling group member or underwriterProvides access to margin loans offered through its clearing firmProvides institutional trading and other services for commissions Broker personal lines, property and casualty (for small businesses) and death and disability insuranceAgreement under which Cain Watters agrees to refer, as it deems appropriate, its clients to HWG so that HWG may present insurance products and solutions as a broker to clients of Cain Watters $1.2bn trust assets(at the Bank)$1.7bn total client assets* $5.44mm2 $273mm AUM$1.3bn client brokerage assets$1.6bn total client assets* – $0.38mm $0.12mm 2 140 171 231 28 65 136 162 160 164 162 175 200 83 130 220 235 74 36
Trust clients include over 2,000 individuals, individual retirement plans (IRAs) and defined contribution and benefit plans established by small businesses for their owners and employees across 48 statesApproximately $1.2 billion in trust assets as of December 31, 2018Common pooled funds to comingle clients' capital to invest in professionally managed portfolios of stocks, bonds, ETFs and other investmentsAllows smaller investors to achieve diversification, reduce certain costs and access professional investment advisorsRecently acquired The Nolan Company ("Nolan"), a third-party retirement plan administrator based in Overland Park, KansasNolan provides clients with retirement plan design and administrative services, specializing in independent ministerial recordkeeping, administration, actuarial and design services for retirement plans of small businesses and professional practices Well-Diversified and Recurring Revenue Stream (Cont.)Trust Services and Third Party Administration ("TPA") 14 2 140 171 231 28 65 136 162 160 164 162 175 200 83 130 220 235 74 36

15 *Represents role post-merger As of and for the quarter ended March 31, 2019Source: S&P Global Market Intelligence Credentialed Management TeamWith Significant Past Experience Growing Businesses Co-Founded and formerly served as CEO / CIO of Salient Partners, which grew from $200 million to $17.5 billionDeveloped investment products and systems to distribute them ($12.5 billion in asset growth)Co-patented software to manage and deliver scale in the distribution of investment productsIdentified and closed high return acquisitions (4x to 12x ROIC)Current director of Hilltop Holdings, Inc. (NYSE: HTH), a Dallas-based financial holding company with consolidated assets of $13.5bn¹ T Bank CEOTook over when T Bank was under MOU, stabilized the bank and brought it to significant profitability Developed vertical strategy and built out SBA platformFormerly COO of $2.2 billion bank holding company (started with $50mm in assets)Developed funding strategy through strategic acquisitions (trust companies / sweeps) Chairman and CEO of Sanders Morris HarrisFormer Chairman of Edelman FinancialHelped foster low cost client acquisition strategy to grow Edelman from $3 billion to $18 billion Former Chairman & CEO, Prudential Securities Former President, EF Hutton & Co. 3 A. HAAG SHERMANCHIEF EXECUTIVE OFFICER* GEORGE L. BALLEXECUTIVE CO-CHAIRMAN* PATRICK HOWARDPRESIDENT & COO* 140 171 231 28 65 136 162 160 164 162 175 200 83 130 220 235 74 36
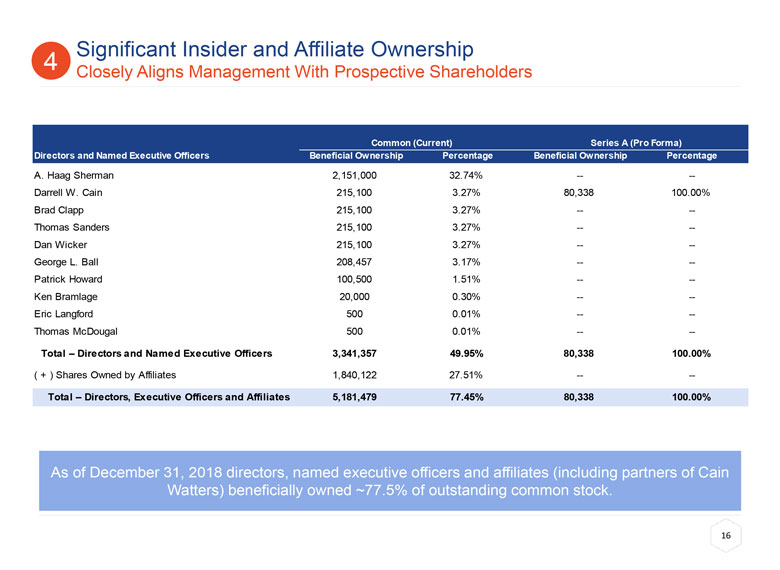
Significant Insider and Affiliate OwnershipClosely Aligns Management With Prospective Shareholders 16 As of December 31, 2018 directors, named executive officers and affiliates (including partners of Cain Watters) beneficially owned ~77.5% of outstanding common stock. 140 171 231 28 65 136 162 160 164 162 175 200 83 130 220 235 74 36 4

Since 1984, Cain Watters has been highly successful in providing a variety of consulting and investment advisory services to dentists and dental practices nationwideCain Watters is a significant referral source and a key strategic partner of the CompanyT Bank's principal referral source for dental loansTectonic Advisors also provides investment advisory services on $461.8 million assets for Cain WattersThe genesis of the Company began in 2015 when Mr. Sherman and the partners of Cain Watters formed Tectonic Holdings as a holding company to acquire Tectonic AdvisorsPartners of Cain Watters own approximately 31.1% of Tectonic 4 partners of Cain Watters serve on the board of directors of Tectonic Significant Insider and Affiliate Ownership (Cont.)Cain Watters & Associates, LLC ("Cain Watters") Relationship 17 4
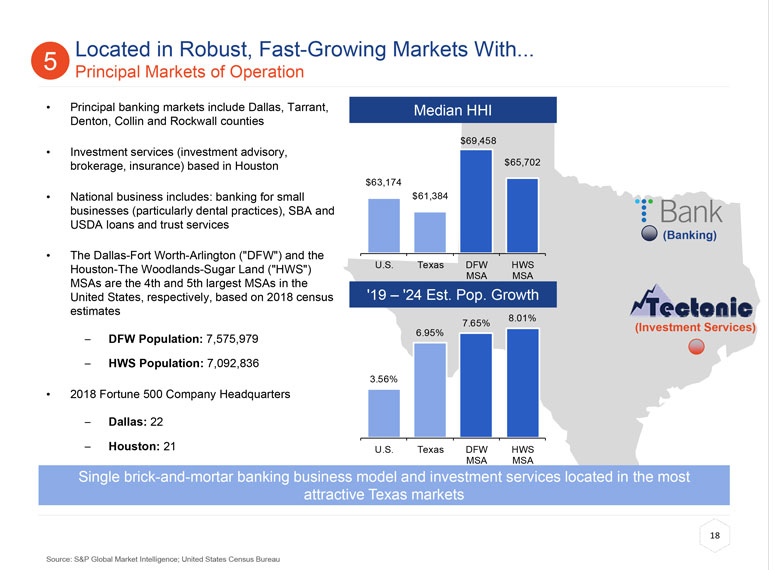
Principal banking markets include Dallas, Tarrant, Denton, Collin and Rockwall countiesInvestment services (investment advisory, brokerage, insurance) based in HoustonNational business includes: banking for small businesses (particularly dental practices), SBA and USDA loans and trust servicesThe Dallas-Fort Worth-Arlington ("DFW") and the Houston-The Woodlands-Sugar Land ("HWS") MSAs are the 4th and 5th largest MSAs in the United States, respectively, based on 2018 census estimatesDFW Population: 7,575,979HWS Population: 7,092,8362018 Fortune 500 Company HeadquartersDallas: 22Houston: 21 Located in Robust, Fast-Growing Markets With...Principal Markets of Operation 18 Source: S&P Global Market Intelligence; United States Census Bureau Single brick-and-mortar banking business model and investment services located in the most attractive Texas markets Median HHI '19 – '24 Est. Pop. Growth 5 (Investment Services) (Banking)

SBA & USDA54% ...Added Diversification Benefits Via National Lending PlatformsLending Strategy Overview 19 Note: Loan compositions as of and for the year ended December 31, 2018 Three Main Lending Strategies Maintaining a Well-Diversified Loan Portfolio Type Segment Location 140 171 231 28 65 136 162 160 164 162 175 200 83 130 220 235 74 36 ��Community Bank Traditional lending services, including commercial, commercial real estate, construction and consumer loans on a very limited basisMajority of loans are to small commercial enterprises in the Dallas, Texas area Dental & Professional Primary referral source of dental loans is Cain WattersVast majority of loans are to dentists with established practices and a strong track record of earningsHave incurred losses on just 7 loans totaling $2.1 million, or 0.7%, in 14-year history of originating over $331.8 million of dental loans SBA & USDA Started division in 2012; team has originated SBA loans together for more than 20 yearsBusiness Development Officers in Colorado, Arizona, Oregon, Texas, Tennessee, Utah and FloridaSince formation, there have been only 7 loans with net losses totaling $775 thousand, or 0.23%, of the total $331.1 million of SBA and USDA loansSBA lending has grown from 2% of loan portfolio as of 12/31/2012 to 39% as of 12/31/2018Retaining guaranteed portion to provide more stable, high quality earnings 5

Total Assets¹ ($mm) Total Gross Loans¹ ($mm) A Rapid and Prudent Growth Story... 20 Bank level financial information 140 171 231 28 65 136 162 160 164 162 175 200 83 130 220 235 74 36 6
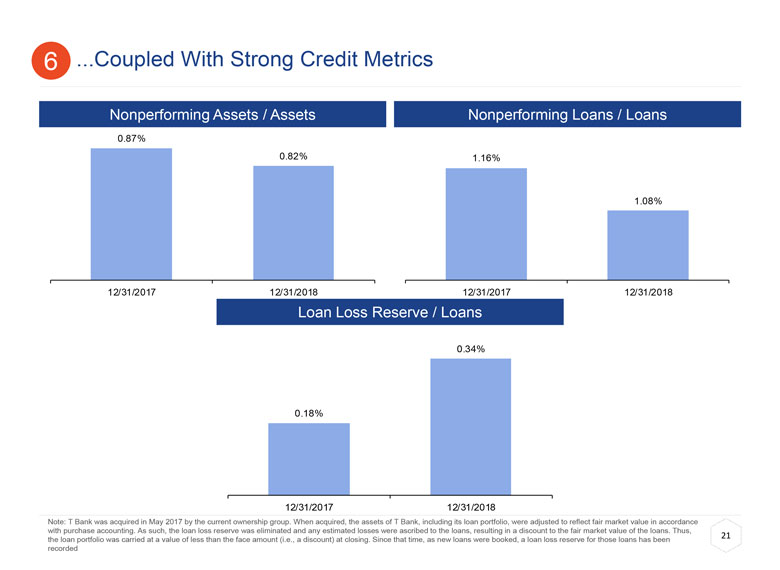
Nonperforming Assets / Assets Nonperforming Loans / Loans ...Coupled With Strong Credit Metrics 21 Loan Loss Reserve / Loans 140 171 231 28 65 136 162 160 164 162 175 200 83 130 220 235 74 36 6 Note: T Bank was acquired in May 2017 by the current ownership group. When acquired, the assets of T Bank, including its loan portfolio, were adjusted to reflect fair market value in accordance with purchase accounting. As such, the loan loss reserve was eliminated and any estimated losses were ascribed to the loans, resulting in a discount to the fair market value of the loans. Thus, the loan portfolio was carried at a value of less than the face amount (i.e., a discount) at closing. Since that time, as new loans were booked, a loan loss reserve for those loans has been recorded
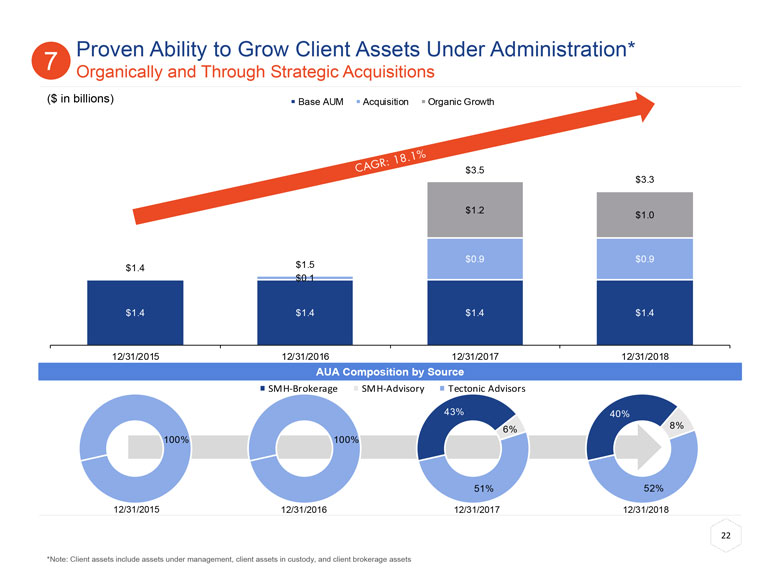
Proven Ability to Grow Client Assets Under Administration*Organically and Through Strategic Acquisitions 22 *Note: Client assets include assets under management, client assets in custody, and client brokerage assets ($ in billions) AUA Composition by Source 140 171 231 28 65 136 162 160 164 162 175 200 83 130 220 235 74 36 7 CAGR: 18.1% 12/31/2015 12/31/2016 12/31/2017 12/31/2018

Net Interest Margin¹ and Cost of Deposits¹ Ability to Scale Through Technology; Continued Focus on Funding 23 As of and for the years ended December 31, 2018 and December 31, 2017 and assumes the consummation of the merger described herein Current and Long-Term Funding Strategy Scaling Through Technology Long-term strategy includes the development by the Bank of a sweep program to utilize the cash balances of Sanders Morris clients to assist the Bank in meeting its funding needsSanders Morris client funds at the Bank totaled $7.0 million as of December 31, 2018Potential for a significant portion of the more than $135 million of Sanders Morris client cash equivalent funds could be swept into the Bank to meet current and future funding needsThe Bank also can access un-invested cash as deposits from customers of its trust departmentAs of December 31, 2018, the Bank had access to $24 million from its trust customers$12 million held at the Bank and $12 million held at a third party money market mutual fundIncreased emphasis on capturing transaction account balances Deposit Composition as of December 31, 2018 Current technology platform allows Tectonic to provide trust services and loans to clients in all 50 statesAllows Tectonic to grow its business by identifying additional loan verticals and serving potential borrowers on a national basisCurrently developing a proprietary technology platform intended to synthesize financial services platform and allow a client to access many of Tectonic's services in a holistic manner, including investments, insurance and other financial services 140 171 231 28 65 136 162 160 164 162 175 200 83 130 220 235 74 36 8 4.49% 4.41%

Pro Forma Capitalization 24 Includes conversion of preferred stockAssumes $15.0 million initial public offering, net of the deduction for underwriting discounts and commissions, but before payment of estimated offering expenses, $1.9 million repayment of existing bank loan & $5.0 million contribution to the bank; assumes 20% risk-weighting on net offering proceeds after debt repayment 140 171 231 28 65 136 162 160 164 162 175 200 83 130 220 235 74 36

Keys to Continued Success 25 Lowering Client Acquisition Costs; Integration of Technology P Selective Acquisitions to Further Diversify Financial Products P Increase Lower Risk Earnings P Focus on Niche Lending Areas P Expand Core Deposits and Cash Sweep Program P 140 171 231 28 65 136 162 160 164 162 175 200 83 130 220 235 74 36
Summary of Investment Opportunity 26 Financial data shown as of and for the year ended December 31, 2018*Note: Represents a non-GAAP measure; see appendix for GAAP reconciliations Client assets include assets under management, client assets in custody, and client brokerage assets High performer with ROAA of 3.0% and ROATCE* of 51.6% as of and for the year ended December 31, 2018Well-diversified and recurring revenue stream, with fee based income of 71% of total revenue driven by client assets1 of $3.3 billionCredentialed management team with past experience in successfully growing companiesSignificant insider and affiliate ownership closely aligns management; directors, named executive officers and affiliates beneficially own ~77.5% of outstanding common sharesLocated in robust, fast-growing metropolitan Texas markets (Dallas / Houston) with added diversification benefits via national lending platformsPrudent and rapid growth, with strong credit metrics; 18.5% and 18.1% CAGR on loans and client assets1, respectively; 17 basis points net charge-offs to average loans over the last 4 yearsProven ability to grow client client assets1 organically and through strategic acquisitionsAbility to scale through technology; continued focus on an integrated long-term funding strategy 140 171 231 28 65 136 162 160 164 162 175 200 83 130 220 235 74 36

27 Appendix 140 171 231 28 65 136 162 160 164 162 175 200 83 130 220 235 74 36

Unaudited Pro Forma Condensed Combined Statement of Income1 28 Represents unaudited, pro forma, condensed consolidated statement of income for the periods set forth in the table above, as if Tectonic Holdings had been merged with and into the Company on January 1, 2017 and its results included in the year ended December 31, 2018 and the 2017 fiscal year 140 171 231 28 65 136 162 160 164 162 175 200 83 130 220 235 74 36

Unaudited Pro Forma Condensed Statement of Financial Condition1 29 140 171 231 28 65 136 162 160 164 162 175 200 83 130 220 235 74 36 Represents unaudited, pro forma, condensed consolidated statement of financial condition as of the year ended December 31, 2018, as if Tectonic Holdings had been merged with and into the Company on January 1, 2017

Pro Forma Reconciliation of Non-GAAP Measures1 30 140 171 231 28 65 136 162 160 164 162 175 200 83 130 220 235 74 36 These adjustments are pro forma for the merger described herein and should not be considered in isolation or as a substitute for the most directly comparable financial measures calculated in accordance with GAAP