UNITED STATES
SECURITIES AND EXCHANGE COMMISSION
Washington, D.C. 20549
FORM N-CSR
CERTIFIED SHAREHOLDER REPORT OF REGISTERED
MANAGEMENT INVESTMENT COMPANIES
Investment Company Act file number: 811-23425
CIM Real Assets & Credit Fund
(Exact Name of Registrant as Specified in Charter)
4700 Wilshire Boulevard
Los Angeles, California 90010
(Address of Principal Executive Offices)
David Thompson
Chief Executive Officer
CIM Real Assets & Credit Fund
4700 Wilshire Boulevard
Los Angeles, California 90010
(Name and Address of Agent for Service)
Registrant’s Telephone Number, Including Area Code: (323) 860-4900
Date of fiscal year end: September 30
Date of reporting period: September 30, 2023
Item 1. Reports to Stockholders.

Table of Contents
| Shareholder Letter | 1 |
| Portfolio Update | 4 |
| Consolidated Schedule of Investments | 6 |
| Consolidated Statement of Assets and Liabilities | 14 |
| Consolidated Statement of Operations | 16 |
| Consolidated Statements of Changes in Net Assets | 17 |
| Consolidated Statement of Cash Flows | 19 |
| Consolidated Financial Highlights | |
| Class A | 20 |
| Class C | 21 |
| Class I | 22 |
| Class L | 23 |
| Consolidated Notes to Financial Statements | 24 |
| Report of Independent Registered Public Accounting Firm | 42 |
| Additional Information | 43 |
| Trustee & Officers | 44 |
| Privacy Policy | 47 |
Important Notice Regarding Electronic Delivery
If you already elected to receive shareholder reports electronically, you will not be affected by this change and you do not need to take any action. For shareholder reports and other communications from the Fund issued prior to 2023, you may elect to receive such reports and other communications electronically. If you own shares of the Fund through a financial intermediary, you may contact your financial intermediary to elect to receive materials electronically. This information is available free of charge by contacting us by mail at 4700 Wilshire Boulevard, Los Angeles, CA, 90010, by telephone at (866) 907-2653 or on our website at https://www.cimgroup.com/ public-investment-programs/current-public-programs/racr.
You may elect to receive all future reports in paper, free of charge. If you own shares of the Fund through a financial intermediary, you may contact your financial intermediary to elect to continue to receive paper copies of your shareholder reports in 2023. This information is available free of charge by contacting us by mail at 4700 Wilshire Boulevard, Los Angeles, CA, 90010, by telephone at (866) 907-2653 or on our website at https://www.cimgroup.com/public-investment-programs/current-public-programs/racr. If you make such an election through your financial intermediary, your election to receive reports in paper may apply to all funds held through your financial intermediary.
Dear Shareholders,
We are pleased to provide you with the 2023 annual report for CIM Real Assets & Credit Fund (“we,” “us,” “our,” “CIM RACR,” or the “Fund”). CIM RACR is a continuously-offered, closed-end interval fund registered under the Investment Company Act of 1940, as amended. The Fund primarily invests in credit (of both real assets and corporates) and real estate equity.
In October 2023, our Board of Directors declared monthly cash dividends representing an annualized distribution rate of 8.5% of net asset value per share (as of the close of business on October 12, 2023). This 21% increase in the distribution (from the prior distribution rate) rate reflects increasing income on CIM RACR’s floating rate real estate and credit investments and the expectation of improving net operating income on its real estate equity investments from recent strong leasing activity.1 In addition, a portion of RACR’s distribution may be tax deferred whereas income from bonds and credit funds are typically 100% ordinary income and taxed at the highest rate.
Since inception (May 2020), RACR’s Class I Common Shares have generated an annualized return of 5.58%, as of September 30, 2023, and have outperformed widely followed income alternatives such as the Bloomberg US Aggregate Bond Index, The Markit iBoxx USD Liquid Investment Grade Index and the Bloomberg US Corporate High Yield Bond Index.2
RACR’s returns since inception have primarily been driven by interest income from our real estate debt and corporate credit investments.
We believe the Fund is well positioned. In our view, it is an attractive environment to be a lender. Banks have reduced lending which has led to less competition and thus better terms for lenders like the Fund. Because of this dynamic, RACR has increased its allocation of investments higher in the capital stack (i.e. increased allocation to more senior debt investments and reduced allocation to more junior equity investments). For example, RACR’s real estate debt investments increased to 21.2% of the portfolio as of September 30, 2023, compared to 14.8% from the year-earlier period. And on the corporate credit side, we are focused on investing in 1st lien secured loans and CLO debt collateralized by 1st lien secured corporate loans, as opposed to 2nd lien or unsecured bonds.
RACR’s real estate equity investments decreased to 15.8% of the portfolio as of September 30, 2023, compared to 23.3% from the year-earlier period. However, we believe this asset class will be a source of compelling opportunities for the fund. The increase in interest rates and accompanying capitalization rates has led to a reduction in real estate values. As real estate owners seek to refinance their debt, the reduction in their asset value means they will likely need to either partially pay down their mortgage, sell their asset or partner with other equity providers. We believe this will present compelling deal flow for CIM RACR.
Fund Overview
The Fund’s investment objective is to generate current income through cash distributions and preserve shareholders’ capital across various market cycles, with a secondary objective of capital appreciation. However, there can be no assurance that the Fund will achieve its investment objective.
The Fund seeks to provide shareholders with income and capital appreciation, with lower volatility and correlation to the broader equity markets and other widely used income alternatives. We believe our real asset equity allocation may reduce volatility and correlation, while creating the potential for appreciation as well as allowing for the Fund to generate income used to pay distributions. This real asset equity allocation may also create a more tax efficient distribution for shareholders. Real estate investments
generate tax depreciation expenses. These tax depreciation expenses can be used to reduce the taxable income generated from credit investments, resulting in a lower current year taxable income.
The Fund’s innovative structure allows it to directly invest in real estate rather than private funds of other managers, and thus avoiding multiple layers of fees. To promote further alignment with other funds managed by affiliates of CIM Group, LLC (“CIM”) and OFS Capital Management, LLC (the “OFS Sub- Adviser” or “OFS”), the Fund has obtained exemptive relief from the U.S. Securities and Exchange Commission (“SEC”) that allows it to co-invest alongside funds managed by affiliates of CIM and OFS, in accordance with the conditions specified in the exemptive relief. The Fund seeks to provide investors with exposure to proprietary transactions, alongside large, sophisticated institutions, that otherwise may not be available to retail investors and that may have high investment minimums.
About the Advisor
CIM Capital IC Management, LLC (the “Adviser”), registered as an investment adviser with the SEC under the Investment Advisers Act of 1940, as amended (the “Advisers Act”), acts as the Fund’s investment adviser and is primarily responsible for determining the amount of the Fund’s total assets that are allocated to each of the Fund’s sub-advisers. The Adviser has engaged each of CIM Capital SA Management, LLC (the “CIM Sub-Adviser”) and the OFS Sub-Adviser, each a SEC-registered investment adviser, to act as an investment sub-adviser to the Fund. The CIM Sub-Adviser is responsible for identifying and sourcing investment opportunities with respect to investments in real assets held by the Fund. The OFS Sub-Adviser is responsible for identifying and sourcing credit and credit-related investment opportunities.
CIM is a vertically-integrated owner and operator of real assets for its own account and on behalf of its partners and co-investors, seeking exposure to real assets and associated credit strategies, with a principal focus on metropolitan areas across the Americas. Since inception, CIM, on behalf of itself and over 200 institutional partners and co-investors, has operated over 300 discretionary real estate and real estate-related equity, debt and infrastructure holdings (excluding net-lease).3 As of June 30, 2023, CIM owns and operates approximately $30.8 billion of assets4 across its products and has deployed assets for its Principals, partners and co-investors, which include U.S. and Non-U.S. public and corporate pension funds, endowments, foundations, sovereign wealth funds and other institutional and private partners and co- investors since 2000. As of September 30, 2023, CIM has over 1,000 employees and more than 600 professionals and 9 corporate offices worldwide. CIM also maintains additional offices across the United States as well as in Korea to support its platform.
OFS is a full-service provider of capital and levered financial solutions with $4.3 billion in assets under management as of June 30, 2023, with a focus on middle market lending, broadly syndicated loans, and structured credit. OFS serves as the investment adviser to business development companies, registered closed-end funds, and separately managed, proprietary and sub-advised accounts, as well as the collateral manager to various collateralized loan obligations.
Thank you for your investment in CIM RACR. If you have any questions, please contact the CIM Shareholder Relations team at 866.907.2653. We look forward to continuing our relationship in the years to come.
Sincerely,
Steve Altebrando
1st Vice President, Portfolio Oversight
David Thompson
Chief Executive Officer
| 1 | Based on current estimates, the Fund expects a portion of the distributions to be a return of capital. |
| 2 | The performance data quoted above represents past performance. Past performance does not guarantee future results. The investment return and principle value of an investment will fluctuate so that an investor’s shares, when sold or repurchased, may be worth more or less than the original cost. The current performance may be lower or higher than performance data quoted. The indices shown are for informational purposes only and are not reflective of any investment. Investors cannot invest directly in an index, and unmanaged index returns do no reflect any fees, expenses or sales charges. |
| 4 | “Assets Owned and Operated” represents the aggregate assets owned and operated by CIM on behalf of partners (including where CIM Group contributes alongside for its own account) and co-investors, whether or not CIM has discretion, in each case without duplication. |
Forward-Looking Statements
Statements in this letter regarding management’s future expectations, beliefs, intentions, goals, strategies, plans or prospects, including statements relating management’s belief that CIM RACR will benefit from CIM Group’s combined real assets, credit and transaction experience and deal-sourcing capabilities; the composition of CIM RACR’s portfolio of real assets and corporate credit assets and the potential benefits to investors, which may not be realized; opportunities for individuals to invest alongside institutional partners, and whether those opportunities will align the interests among sponsors, partners and shareholders; and other factors may constitute forward-looking statements for purposes of the safe harbor protection under applicable securities laws. Forward-looking statements can be identified by terminology such as “anticipate,” “believe,” “could,” “could increase the likelihood,” “estimate,” “expect,” “intend,” “is planned,” “may,” “should,” “will,” “will enable,” “would be expected,” “look forward,” “may provide,” “would” or similar terms, variations of such terms or the negative of those terms. Such forward-looking statements involve known and unknown risks, uncertainties and other factors, including rising inflation and interest rates, the risk of recession, the ongoing war between Russia and Ukraine, the escalated conflict in the Middle East, supply chain disruptions, resource shortages, significant market volatility on our business, our industry, and the global economy, and those risks, uncertainties and factors referred to in CIM RACR’s Prospectus filed with the SEC under the section “Risks” and other documents that may be filed by CIM RACR from time to time with the SEC. As a result of such risks, uncertainties and factors, actual results may differ materially from any future results, performance or achievements discussed in or implied by the forward-looking statements contained herein. CIM RACR is providing the information in this letter as of this date and assumes no obligations to update the information included in this letter or revise any forward- looking statements, whether as a result of new information, future events or otherwise.
17646841-NLD-11282023
| CIM Real Assets & Credit Fund | Portfolio Update |
| | September 30, 2023 (unaudited) |
Performance as of September 30, 2023
| | | Annualized |
Annualized
Since |
| CIM Real Assets & Credit Fund | 1 Year | 3 Year | Inception |
| CIM Real Assets & Credit Fund - A-NAV | (0.58)% | 5.14% | 5.32% |
| CIM Real Assets & Credit Fund - A-Load | (6.29)% | 3.08% | 3.50% |
| CIM Real Assets & Credit Fund - C-NAV | (1.43)% | 4.31% | 4.49% |
| CIM Real Assets & Credit Fund - I-NAV | (0.31)% | 5.41% | 5.58% |
| CIM Real Assets & Credit Fund - L-NAV | (0.91)% | 4.84% | 5.02% |
| CIM Real Assets & Credit Fund - L-Load | (5.12)% | 3.33% | 3.69% |
| Bloomberg US Aggregate Bond Index (a) | (0.64)% | (5.21)% | (4.07)% |
| Bloomberg US Corporate High Yield Bond Index (b) | 10.28% | 1.75% | 4.62% |
| Credit Suisse Leverage Loan Index (c) | 12.47% | 5.91% | 8.04% |
| Market iBoxx Liquid Investment Grade (d) | 3.71% | (5.90)% | (3.56)% |
Comparison of the Change in Value of a $10,000 Investment
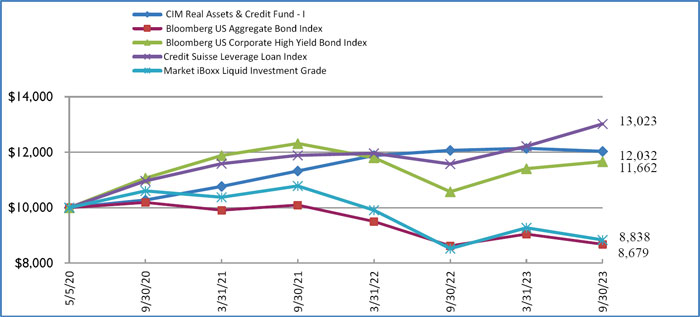
| (a) | Bloomberg US Aggregate Bond Index is a broad based, market capitalization-weighted bond market index representing intermediate term investment grade bonds traded in the United States. |
| | |
| (b) | The Bloomberg US Corporate High Yield Bond Index measures the USD-denominated, high yield, fixed-rate corporate bond market. Securities are classified as high yield if the middle rating of Moody’s, Fitch and S&P is Ba1/BB+/BB+ or below. Bonds from issuers with an emerging markets country of risk, based on the indices’ EM country definition, are excluded. |
| | |
| (c) | The Credit Suisse Leverage Loan Index tracks the investable market of the U.S. dollar denominated leveraged loan market. It consists of issues rated “5B” or lower, meaning that the highest rated issues included in this index are Moody’s/S&P ratings of Baa1/BB+ or Ba1/BBB+. All loans are funded term loans with a tenor of at least one year and are made by issuers domiciled in developed countries. |
| | |
| (d) | The Markit iBoxx USD Liquid Investment Grade Index is designed to reflect the performance of USD denominated investment grade corporate debt. The index rules aim to offer a broad coverage of the USD investment grade liquid bond universe. The index is market-value weighted with an issuer cap of 3%. |
The Fund previously compared its performance against the Morningstar LSTA US Leverage Loan index. The Fund decided to substitute the Morningstar LSTA US Leverage Loan Index with the Credit Suisse Leverage Loan USD index because of the costs associated with using the former index and the Fund’s belief that the replacement index is a close proximate of the original index.
Index performance is shown for illustrative purposes only as (i) all indices referenced above are unmanaged, (ii) index performance does not reflect the expenses associated with active management of an actual portfolio, (iii) the composition of each of the indices differs signficantly from that of the portfolio of the Fund and (iv) investors cannot invest directly in an index. The performance data quoted above represents past performance. Past performance does not guarantee future results. The investment return and principle value of an investment will fluctuate so that an investor’s shares, when sold or repurchased, may be worth more or less than the original cost. The performance data does not reflect the deduction of taxes that a shareholder would pay on any fund distributions or the sale of fund shares. The current performance may be lower or higher than performance data quoted. Please visit the Fund’s website at https://www.cimgroup.com/public-investment-programs/current-public-programs/racr for performance data current to the most recent month-end.
| CIM Real Assets & Credit Fund | Portfolio Update |
| | September 30, 2023 (unaudited) |
Top Ten Long Holdings as of September 30, 2023
| EPIC Dallas | | | 5.2 | % |
| Del Mar Terrace - Phoenix, AZ | | | 4.5 | % |
| Society Las Olas - PMG Greybook Riverfront I LLC | | | 3.3 | % |
| Sora Multifamily Residential Property | | | 3.0 | % |
| Extended Stay America Trust 2021-ESH, Class F | | | 2.9 | % |
| Elevation CLO 2022-16, Ltd., Class E | | | 2.8 | % |
| WMRK Commercial Mortgage Trust 2022-WMRK, Class E | | | 2.4 | % |
| 1902 Park Avenue (Los Angeles) Owner, L.P. | | | 2.3 | % |
| Regatta XXII Funding, Ltd., Class E | | | 2.2 | % |
| IENTC 2, LLC DDTL B-1 | | | 2.2 | % |
| | | | 30.8 | % |
Portfolio Composition as of September 30, 2023
| Collateralized Loan Obligations | | | 30.71 | % |
| Direct Real Estate | | | 20.49 | % |
| Commercial Mortgage-Backed Securities | | | 19.81 | % |
| Bank Loan | | | 21.27 | % |
| Real Estate-Related Securities | | | 7.66 | % |
| Common Stock | | | 2.66 | % |
| Loan Accumulation Facility | | | 0.52 | % |
| Cash, Cash Equivalents, & Other Net Assets | | | -3.12 | % |
| | | | 100.00 | % |
| CIM Real Assets & Credit Fund | Consolidated Schedule of Investments |
| | September 30, 2023 |
| Shares | | | | | | | | | | | Fair Value | |
| | | | | Common Stock - 2.66% | | | | | |
| | | | | Private - 2.16% | | | | | |
| | 580,645 | | | Boca Homecare Holdings, Inc. (Equity) (a),(b),(c),(d) | | | $ | 421,800 | |
| | 155,086 | | | CGA Holdings, Inc., Class A (a),(b),(c),(d) | | | | 154,820 | |
| | 3,763,895 | | | IENTC 1, LLC (a),(c),(d),(e) | | | | 6,212,460 | |
| | | | | | | | | | | | | | 6,789,080 | |
| | | | | Real Estate Investment Trust - .50% | | | | | |
| | 388,344 | | | Creative Media & Community Trust Corp. (b),(d),(h),(f) | | | | 1,572,793 | |
| | | | | | | | | | | | | �� | | |
| | | | | Total Common Stock (Cost $7,337,902) | | | | 8,361,873 | |
| | | | | | | | | | | | | |
| Principal | | | | | | | Coupon Rate | | | | | |
| Amount ($) | | | | | Spread | | (%) | | Maturity | | | |
| | | | | Bank Loans - 21.27% | | | | | | | | | | |
| | | | | Consumer Non-Cyclical - 2.56% | | | | | | | | | | |
| | 1,026,443 | | | Baart Programs, Inc., Second Lien Term Loan (a),(g),(h) | | 3M SOFR + 8.500% | | 14.150 | | 6/11/2028 | | | 964,856 | |
| | 500,000 | | | Bengal Debt Merger SUB, LLC TL 1L (a),(g) | | 3M SOFR + 6.000% | | 11.490 | | 1/24/2030 | | | 410,548 | |
| | 378,788 | | | MedMark Services, Inc., Second Lien Term Loan (a),(g) | | 3M SOFR + 8.500% | | 14.150 | | 6/11/2028 | | | 356,061 | |
| | 1,016,949 | | | RC Buyer, Inc., Second Lien Initial Term Loan (a),(g) | | 3M SOFR + 6.250% | | 11.920 | | 7/30/2029 | | | 948,305 | |
| | 2,985,000 | | | Spear Education Holdings, LLC Term A Loan (a),(b),(c),(g) | | 3M SOFR + 7.500% | | 12.548 | | 12/15/2027 | | | 2,952,165 | |
| | 430,240 | | | Spring Education Group, Inc., Second Lien Initial Term Loan (a),(g) | | 3M SOFR + 8.250% | | 13.680 | | 7/30/2026 | | | 414,966 | |
| | 1,985,000 | | | Tony’s Fresh Market / Cardenas Markets First lien Term Loan (g) | | 3M SOFR + 6.750% | | 12.240 | | 8/1/2029 | | | 1,990,796 | |
| | | | | | | | | | | | | | 8,037,697 | |
| | | | | | | | | | | | | | | |
| | | | | Electronic Equipment, Instruments & Components - 0.60% | | | | | | | | | | |
| | 2,000,000 | | | Idera, Inc. (a),(g),(h) | | 3M SOFR + 6.750% | | 11.880 | | 3/2/2029 | | | 1,900,000 | |
| | | | | | | | | | | | | | | |
| | | | | Financial Services - 0.64% | | | | | | | | | | |
| | 2,000,000 | | | PSB Group, LLC, Term Loan (Last Out) - May 2023 (a),(b),(c) | | 3M SOFR + 7.629% | | 12.935 | | 9/17/2026 | | | 1,996,000 | |
| | | | | | | | | | | | | | | |
| | | | | Financials - 0.16% | | | | | | | | | | |
| | 794,000 | | | Avison Young Canada, Inc., First Lien Term Loan (a),(g),(h) | | 3M SOFR + 7.000% | | 12.268 | | 1/31/2026 | | | 496,250 | |
| | | | | | | | | | | | | | | |
| | | | | Food Products - 0.22% | | | | | | | | | | |
| | 833,333 | | | BCPE North Star US Holdco 2, Inc. 2L TL (a),(g),(h) | | 3M SOFR + 7.250% | | 12.409 | | 6/8/2029 | | | 679,863 | |
| | | | | | | | | | | | | | | |
| | | | | Health Care Equipment & Supplies - 0.66% | | | | | | | | | | |
| | 163,043 | | | Kreg LLC, Revolver (a),(b),(c),(g),(i) | | 3M SOFR + 6.250% | | 0.500 | | 12/20/2026 | | | 151,467 | |
| | 2,064,011 | | | Kreg LLC, Term Loan (a),(b),(c),(g) | | 3M SOFR + 2.250% | | 7.298 | | 12/20/2026 | | | 1,917,466 | |
| | | | | | | | | | | | | | 2,068,933 | |
| | | | | Health Care Providers & Services - 6.78% | | | | | | | | | | |
| | 580,645 | | | Boca Home Care Holdings Revolver (a),(b),(c),(g),(i) | | 3M SOFR + 6.500% | | — | | 2/25/2027 | | | 559,161 | |
| | 5,001,895 | | | Boca Home Care Holdings, Inc Delayed Draw Term Loan (a),(b),(c),(g) | | 1M SOFR + 6.500% | | 11.648 | | 2/25/2027 | | | 4,816,824 | |
| | 1,183,256 | | | CVAUSA Management, LLC Primary DDTL (a),(b),(c),(g) | | 3M SOFR + 6.500% | | — | | 5/22/2029 | | | 1,165,507 | |
| | 495,316 | | | CVAUSA Management, LLC Secondary DDTL (a),(b),(c),(g) | | 3M SOFR + 6.500% | | — | | 5/22/2029 | | | 487,886 | |
| | 285,714 | | | CVAUSA Management, LLC, Revolver, TL (a),(b),(c),(g) | | 3M SOFR + 6.500% | | — | | 5/22/2028 | | | 281,429 | |
| | 1,991,747 | | | CVAUSA Management, LLC, Term Loan (a),(b),(c),(g) | | 3M SOFR + 6.500% | | 11.594 | | 5/22/2029 | | | 2,005,179 | |
| | 715,677 | | | Honor HN Buyer, Inc. Delayed Draw Term Loan (a),(b),(c),(g),(i) | | 3M SOFR + 5.750% | | 11.290 | | 10/15/2027 | | | 715,677 | |
| | 132,013 | | | Honor HN Buyer, Inc. Revolver (a),(b),(c),(g),(i) | | Prime + 5.000% | | 13.250 | | 10/15/2027 | | | 132,013 | |
| | 1,130,299 | | | Honor HN Buyer, Inc. Term Loan (a),(b),(c),(g) | | 3M SOFR + 5.750% | | 10.798 | | 10/15/2027 | | | 1,130,299 | |
| | 791,254 | | | Honor HN Buyer, Inc. Term Loan 1st Amendment Health Network (a),(b),(c) | | 6M SOFR + 6.000% | | 11.540 | | 10/15/2027 | | | 796,001 | |
| | 333,333 | | | One GI Intermediate LLC, Revolver Upsize (a),(b),(c),(g) | | 3M SOFR + 6.750% | | 11.961 | | 12/22/2025 | | | 313,667 | |
| | 1,723,750 | | | One GI Intermediate LLC, Tranche B Delayed Draw Term Loan (a),(b),(c),(g) | | 3M SOFR + 6.750% | | 12.003 | | 12/22/2025 | | | 1,622,049 | |
| | 914,390 | | | One GI Intermediate LLC, Tranche C Delayed Draw Term Loan (a),(b),(c),(g),(i) | | 3M SOFR + 6.750% | | 11.948 | | 12/22/2025 | | | 860,441 | |
| | 147,059 | | | Shiftkey, Revolver (a),(b),(c),(g),(i) | | 3M SOFR + 5.750% | | 10.616 | | 6/21/2027 | | | 143,382 | |
| | 2,329,412 | | | Shiftkey, Term Loan (a),(b),(c),(g) | | 3M SOFR + 5.750% | | 10.910 | | 6/21/2027 | | | 2,271,177 | |
| | 3,989,880 | | | Spectrum Vision Partners, LLC (a),(b),(c) | | 3M SOFR + 6.500% | | 12.150 | | 11/18/2024 | | | 3,977,910 | |
| | | | | | | | | | | | | | 21,278,602 | |
| | | | | Hotels, Restaurants & Leisure - 1.41% | | | | | | | | | | |
| | 1,440,000 | | | SS Acquisition LLC, Delayed Draw Term Loan (a),(b),(c),(g) | | 3M SOFR + 7.591% | | 12.625 | | 12/30/2026 | | | 1,440,000 | |
| | 3,000,000 | | | SS Acquisition LLC, Term Loan (a),(b),(c),(g) | | 3M SOFR + 6.751% | | 11.919 | | 12/30/2026 | | | 3,000,000 | |
| | | | | | | | | | | | | | 4,440,000 | |
| | | | | Household Durables - 0.17% | | | | | | | | | | |
| | 1,000,000 | | | Astro One Acquisition Corporation (a),(g),(h) | | 6M US L + 8.500% | | 13.663 | | 9/14/2029 | | | 521,665 | |
See Notes to Consolidated Financial Statements.
| CIM Real Assets & Credit Fund | Consolidated Schedule of Investments |
| | September 30, 2023 |
| Principal | | | | | | | Coupon Rate | | | | | |
| Amount ($) | | | | | Spread | | (%) | | Maturity | | Fair Value | |
| | | | | Bank Loans - 21.27% (Continued) | | | | | | | | | | |
| | | | | Industrial - 1.09% | | | | | | | | | | |
| | 2,545,527 | | | AIDC Intermediate Co. 2, LLC, Term Loan (a),(b),(c),(g) | | 3M SOFR + 6.250% | | 11.770 | | 7/22/2027 | | $ | 2,525,163 | |
| | 1,097,499 | | | Energy Acquisition LP, Second Lien Initial Term Loan (a),(g),(i) | | 3M SOFR + 8.500% | | 13.864 | | 6/26/2026 | | | 891,718 | |
| | | | | | | | | | | | | | 3,416,881 | |
| | | | | Personal Products - 0.60% | | | | | | | | | | |
| | 1,994,911 | | | Journey Personal Care Corp TL 1L (a),(i) | | 6M US L + 4.250% | | 9.980 | | 3/1/2028 | | | 1,883,944 | |
| | | | | | | | | | | | | | | |
| | | | | Retail - 0.97% | | | | | | | | | | |
| | 3,157,895 | | | LSF9 Atlantis Holdings, LLC (g),(h) | | 1M SOFR + 7.250% | | 12.640 | | 3/31/2029 | | | 3,033,555 | |
| | | | | | | | | | | | | | | |
| | | | | Services - 3.10% | | | | | | | | | | |
| | 4,286,957 | | | 24 Seven, Inc., Term Loan (a),(b),(c),(g) | | 3M SOFR + 6.000% | | 11.260 | | 11/16/2027 | | | 4,171,209 | |
| | 999,970 | | | Convergint Technologies LLC, Second Lien Term Loan (a),(g),(h) | | 3M SOFR + 6.750% | | 12.018 | | 3/30/2029 | | | 888,724 | |
| | 1,500,000 | | | EOS-Metasource Intermediate, Inc., DDC (a),(b),(c),(g),(i) | | 3M SOFR + 6.250% | | — | | 5/17/2027 | | | 1,413,000 | |
| | 3,456,250 | | | EOS-Metasource Intermediate, Inc., TL (a),(b),(c),(g) | | 3M SOFR + 6.250% | | 11.518 | | 5/17/2027 | | | 3,255,788 | |
| | | | | | | | | | | | | | 9,728,721 | |
| | | | | Technology - 1.65% | | | | | | | | | | |
| | 3,000,000 | | | Exponential Power, Inc., TL (a),(b),(c),(g) | | 3M SOFR + 6.500% | | 11.672 | | 5/12/2026 | | | 2,955,000 | |
| | 800,000 | | | Redstone HoldCo 2 LP, Second Lien Initial TL (a),(g),(h) | | 3M SOFR + 7.750% | | 13.042 | | 4/27/2029 | | | 527,000 | |
| | 500,021 | | | RumbleON, Inc. Delay Draw Term Loan (a),(b),(c),(g),(i) | | 3M SOFR + 8.250% | | 13.409 | | 8/31/2026 | | | 458,520 | |
| | 1,359,163 | | | RumbleON, Inc. TL (a),(b),(c),(g) | | 3M SOFR + 8.750% | | 13.409 | | 8/31/2026 | | | 1,246,353 | |
| | | | | | | | | | | | | | 5,186,873 | |
| | | | | Transportation - 0.66% | | | | | | | | | | |
| | 2,167,683 | | | Reception Purchaser, LLC (a),(g),(h) | | 3M SOFR + 6.000% | | 11.253 | | 3/24/2028 | | | 2,086,393 | |
| | | | | | | | | | | | | | | |
| | | | | Total Bank Loans (Cost$68,908,659) | | | | | | | | | 66,755,377 | |
| | | | | | | | | | | | | | | |
| | | | | Collateralized Loan Obligations - Debt - 24.18% | | | | | | | | | | |
| | 1,000,000 | | | Allegro CLO XII, Ltd., Class E (b),(g),(j) | | 3M SOFR+ 7.100% | | 12.695 | | 1/21/2032 | | | 943,848 | |
| | 4,000,000 | | | Atlas Senior Loan Fund XX, Ltd., Class (b),(g) | | 3M SOFR + 9.430% | | 14.750 | | 10/19/2035 | | | 3,992,857 | |
| | 1,000,000 | | | Barings Middle Market CLO, Ltd. 2021-I, Class D (g),(h),(j) | | 3M SOFR+ 8.650% | | 14.238 | | 7/20/2033 | | | 973,965 | |
| | 2,500,000 | | | Birch Grove CLO 6 Ltd Series 6A E (b),(g),(i),(j) | | 3M SOFR + 8.930% | | 14.468 | | 7/7/2035 | | | 2,524,141 | |
| | 430,442 | | | Brightwood Capital MM CLO 2023-1A D Ltd (g),(j) | | 3M SOFR + 6.460% | | 11.860 | | 10/15/2035 | | | 417,529 | |
| | 1,003,974 | | | Brightwood Capital MM CLO 2023-1A E Ltd (g),(j) | | 3M SOFR + 10.360% | | 15.760 | | 10/15/2035 | | | 903,577 | |
| | 4,250,000 | | | Carlyle US CLO 2022-4, Ltd., Class E (g),(h),(j) | | 3M SOFR + 8.150% | | 13.501 | | 7/22/2034 | | | 4,194,760 | |
| | 2,000,000 | | | Carlyle US CLO 2022-6, Ltd., Class E (b),(g),(h),(j) | | 3M SOFR + 8.630% | | 13.981 | | 10/25/2034 | | | 2,001,660 | |
| | 5,285,000 | | | CFIP CLO 2017-1, Ltd., Class ER (g),(h),(j) | | 3M SOFR+ 7.300% | | 12.872 | | 10/18/2034 | | | 4,807,605 | |
| | 9,100,000 | | | Elevation CLO 2022-16, Ltd., Class E (g),(h),(j) | | 3M SOFR + 8.300% | | 13.651 | | 7/25/2034 | | | 8,842,419 | |
| | 6,000,000 | | | Empower CLO 2022-1, Ltd., Class E (g),(h),(j) | | 3M SOFR + 8.550% | | 13.876 | | 10/20/2034 | | | 6,000,586 | |
| | 3,000,000 | | | Empower CLO 2023-1, Ltd., Class D (b),(g),(h),(j) | | 3M SOFR + 5.500% | | 10.568 | | 4/25/2036 | | | 3,033,929 | |
| | 500,000 | | | Flatiron CLO 20, Ltd., Class E (g),(h),(j) | | 3M SOFR+ 7.850% | | 13.229 | | 11/20/2033 | | | 497,920 | |
| | 2,000,000 | | | Ivy Hill Middle Market Credit Fund XVIII, Ltd., Class E (g),(j) | | 3M SOFR+ 7.750% | | 13.357 | | 4/22/2033 | | | 1,855,501 | |
| | 1,250,000 | | | LCM 31, Ltd., Class E (g),(h),(j) | | 3M SOFR + 7.08% | | 12.406 | | 1/20/2032 | | | 1,167,245 | |
| | 5,500,000 | | | LCM 38, Ltd., Class E (g),(h),(j) | | 3M SOFR+ 7.73% | | 13.064 | | 10/15/2036 | | | 5,382,153 | |
| | 600,000 | | | Madison Park Funding XLVII, Ltd., Class E (g),(h),(j) | | 3M SOFR+ 7.460% | | 13.042 | | 1/19/2034 | | | 595,793 | |
| | 2,500,000 | | | MCF CLO VII LLC, Class ER (g),(h),(j) | | 3M SOFR + 9.150% | | 14.738 | | 7/20/2033 | | | 2,466,017 | |
| | 3,500,000 | | | Monroe Capital Mml CLO X, Ltd., Class ER (b),(g),(h),(j) | | 3M SOFR + 8.750% | | 14.130 | | 5/20/2034 | | | 3,359,226 | |
| | 2,250,000 | | | Northwoods Capital 25, Ltd., Class E (g),(h),(j) | | 3M SOFR+ 7.140% | | 12.728 | | 7/20/2034 | | | 2,105,490 | |
| | 500,000 | | | OCP CLO 2020-20, Ltd., Class E (g),(h),(j) | | 3M SOFR+ 7.660% | | 13.203 | | 10/9/2033 | | | 495,269 | |
| | 3,000,000 | | | PennantPark CLO III, Ltd., Class E (g),(h),(j) | | 3M SOFR+ 8.140% | | 13.747 | | 10/22/2032 | | | 2,860,904 | |
| | 2,000,000 | | | PPM CLO 2022-6, Ltd., Class E (g),(h),(j) | | 3M SOFR + 8.210% | | 13.798 | | 1/20/2031 | | | 1,955,733 | |
| | 400,000 | | | Regatta Funding LP 2013-2A, Class DR2 (b),(g),(h),(j) | | 3M SOFR+ 6.950% | | 12.520 | | 1/15/2029 | | | 389,617 | |
| | 7,000,000 | | | Regatta XXII Funding, Ltd., Class E (b),(g),(h),(j) | | 3M SOFR + 7.190% | | 12.516 | | 7/20/2035 | | | 6,973,780 | |
| | 2,800,000 | | | Sandstone Peak II Ltd 2023-2 (b),(g),(j) | | 3M SOFR + 8.790% | | 13.938 | | 7/20/2036 | | | 2,782,700 | |
| | 2,000,000 | | | Saratoga Investment Corp. CLO 2013-1, Ltd., Class F1R3 (g),(h),(j) | | 3M SOFR+ 10.000% | | 15.250 | | 4/20/2033 | | | 1,678,971 | |
| | 500,000 | | | VCP CLO II, Ltd., Class E (b),(g),(h),(j) | | 3M SOFR+ 8.400% | | 13.970 | | 4/15/2031 | | | 484,397 | |
| | 3,000,000 | | | Venture 45 CLO, Ltd., Class E (b),(g),(j) | | 3M SOFR + 7.700% | | 13.026 | | 7/20/2035 | | | 2,240,373 | |
| | | | | Total Collateralized Loan Obligations - Debt (Cost$76,072,290) | | | | | | | | | 75,927,965 | |
See Notes to Consolidated Financial Statements.
| CIM Real Assets & Credit Fund | Consolidated Schedule of Investments |
| | September 30, 2023 |
| Principal | | | | | | | Coupon Rate | | | | | |
| Amount ($) | | | | | Spread | | (%) | | Maturity | | Fair Value | |
| | | | | Collateralized Loan Obligations - Equity - 6.53% | | | | | | | | | | |
| | 4,060,000 | | | Allegro CLO XV, Ltd., Class SUB (a),(b),(g),(j),(k) | | | | 21.47 | | 7/20/2035 | | $ | 3,083,397 | |
| | 2,980,000 | | | Apex Credit CLO 2021, Ltd., Class SUB (a),(b),(g),(j),(k) | | | | 19.97 | | 7/18/2034 | | | 1,899,699 | |
| | 3,000,000 | | | Atlas Senior Loan Fund XVII, Ltd., Class SUB (a),(b),(g),(j),(k) | | | | 23.46 | | 10/20/2034 | | | 1,705,177 | |
| | 2,585,233 | | | Brightwood Capital MM CLO 2023-1A Sub1 Ltd (a),(b),(g),(j),(k) | | | | 14.56 | | 10/15/2035 | | | 2,275,005 | |
| | 5,500,000 | | | Dryden 98 CLO, Ltd., Class SUB (a),(b),(g),(j),(k) | | | | 19.90 | | 4/20/2035 | | | 4,014,436 | |
| | 3,750,000 | | | Elevation CLO 2021-15, Ltd., Class SUB (a),(b),(g),(j),(k) | | | | 16.31 | | 1/5/2035 | | | 1,856,645 | |
| | 250,000 | | | LCM 31, Ltd., Class INC (a),(b),(g),(j),(k) | | | | 22.01 | | 1/20/2032 | | | 128,819 | |
| | 2,750,000 | | | Marble Point CLO XXI, Ltd., Class Inc (a),(b),(g),(j),(k) | | | | 17.29 | | 10/17/2051 | | | 1,573,534 | |
| | 5,000,000 | | | Steele Creek CLO 2022-1, Ltd., Class SUB (a),(b),(g),(j),(k) | | | | 19.80 | | 4/15/2035 | | | 3,280,832 | |
| | 2,300,000 | | | Trinitas CLO VIII, Ltd., Class SUB (a),(b),(g),(j),(k) | | | | 10.59 | | 7/20/2117 | | | 688,084 | |
| | | | | Total Collateralized Loan Obligations - Equity (Cost$25,031,461) | | | | | | | | | 20,505,628 | |
| | | | | | | | | | | | | | | |
| | | | | Commercial Mortgage-Backed Securities - 19.81% | | | | | | | | | | |
| | 391,000 | | | BPR Trust 2021-TY, Class D (g),(h),(j) | | 1M SOFR + 2.464% | | 7.655 | | 9/15/2038 | | | 367,107 | |
| | 1,785,235 | | | BX Trust 2022-PSB, Class E (g),(h),(j) | | 1M SOFR + 6.337% | | 11.669 | | 8/15/2039 | | | 1,787,825 | |
| | 3,570,470 | | | BX Trust 2022-PSB, Class F (g),(h),(j) | | 1M SOFR + 7.333% | | 12.665 | | 8/15/2039 | | | 3,559,738 | |
| | 1,380,514 | | | BX Trust 2023-VLT2, Class C (g),(h),(j) | | 1M SOFR + 4.176% | | 9.508 | | 6/15/2040 | | | 1,374,965 | |
| | 2,098,537 | | | BX Trust 2023-VLT2, Class D (g),(h),(j) | | 1M SOFR + 4.774% | | 10.106 | | 6/15/2040 | | | 2,091,679 | |
| | 520,949 | | | BX Trust 2023-VLT2, Class E (g),(h),(j) | | 1M SOFR + 5.871% | | 11.203 | | 6/15/2040 | | | 522,378 | |
| | 3,924,118 | | | Campus Drive Secured Lease-Backed Pass-Though Trust, Series C (a),(h),(j) | | | | 6.912 | | 6/15/2058 | | | 2,291,685 | |
| | 400,000 | | | CSMC 2020-TMIC, Class C (g),(h),(j) | | 1M SOFR + 7.365% | | 11.955 | | 12/9/2023 | | | 398,523 | |
| | 4,500,000 | | | CXP Trust 2022-CXP1, Class E (g),(h),(j) | | 1M SOFR + 4.545% | | 9.877 | | 12/15/2038 | | | 3,866,173 | |
| | 1,500,000 | | | CXP Trust 2022-CXP1, Class F (g),(h),(j) | | 1M SOFR + 5.461% | | 10.793 | | 12/15/2038 | | | 926,339 | |
| | 190,098 | | | Extended Stay America Trust 2021-ESH, Class D (g),(h),(j) | | 1M SOFR + 2.364% | | 7.455 | | 7/15/2038 | | | 186,774 | |
| | 2,946,512 | | | Extended Stay America Trust 2021-ESH, Class E (g),(h),(j) | | 1M SOFR + 2.964% | | 8.055 | | 7/15/2038 | | | 2,892,575 | |
| | 9,382,406 | | | Extended Stay America Trust 2021-ESH, Class F (g),(h),(j) | | 1M SOFR + 3.814% | | 8.905 | | 7/15/2038 | | | 9,193,940 | |
| | 4,034,600 | | | ILPT Commercial Mortgage Trust 2022-LPF2, Class E (g),(h),(j) | | 1M SOFR + 5.940% | | 11.272 | | 10/15/2039 | | | 4,035,713 | |
| | 4,037,768 | | | LAQ 2023-LAQ Mortgage Trust, Class D (g),(h),(j) | | 1M SOFR + 4.188% | | 9.499 | | 3/15/2036 | | | 4,036,172 | |
| | 3,710,000 | | | One New York Plaza Trust 2020-1NYP, Class B (g),(h),(j) | | 1M SOFR + 1.614% | | 10.244 | | 1/15/2036 | | | 3,385,793 | |
| | 3,400,000 | | | One New York Plaza Trust 2020-1NYP, Class C (g),(h),(j) | | 1M SOFR + 2.314% | | 6.884 | | 1/15/2036 | | | 2,933,634 | |
| | 1,500,000 | | | One New York Plaza Trust 2020-1NYP, Class D (g),(h),(j) | | 1M SOFR + 2.864% | | 6.162 | | 1/15/2036 | | | 1,159,329 | |
| | 2,900,000 | | | PGA National Resort Trust 2023-RSRT, Class C (g),(h),(j) | | 1M SOFR + 3.789% | | 9.121 | | 5/15/2033 | | | 2,897,646 | |
| | 1,370,000 | | | PGA National Resort Trust 2023-RSRT, Class D (g),(h),(j) | | 1M SOFR + 4.588% | | 9.923 | | 5/15/2033 | | | 1,377,136 | |
| | 1,811,000 | | | TWO VA Repack Trust Class B-2, Series B2 (a),(h),(j),(l) | | | | — | | 11/15/2033 | | | 604,874 | |
| | 177,084 | | | VA Gilbert AZ Subordinated Note Lease-Backed Pass -Through Trust (a),(h),(j) | | | | 12.997 | | 3/15/2034 | | | 200,814 | |
| | 4,010,000 | | | Wells Fargo Commercial Mortgage Trust 2021-FCMT, Class D (g),(h),(j) | | 1M SOFR + 3.614% | | 13.149 | | 5/15/2031 | | | 3,736,510 | |
| | 1,000,000 | | | Wells Fargo Commercial Mortgage Trust 2021-FCMT, Class F (g),(h),(j) | | 1M SOFR + 6.010% | | 11.105 | | 5/15/2031 | | | 929,468 | |
| | 7,500,000 | | | WMRK Commercial Mortgage Trust 2022-WMRK, Class E (g),(h),(j) | | 1M SOFR + 5.676% | | 11.008 | | 11/15/2035 | | | 7,448,690 | |
| | | | | Total Commercial Mortgage-Backed Securities (Cost$64,052,250) | | | | | | | | | 62,205,480 | |
| | | | | | | | | | | | | | | |
| Cost Basis ($) | | | | | | | | | | | | |
| | | | | Direct Real Estate - 20.49% | | | | | | | | | | |
| | 6,927,834 | | | 1902 Park Avenue (Los Angeles) Owner, L.P. (a),(d) | | | | 7,144,478 | |
| | 5,107,443 | | | 3816-3822 W Jefferson Blvd (a) | | | | 4,908,552 | |
| | 3,840,582 | | | 4707 W Jefferson Blvd (a),(e) | | | | 3,063,409 | |
| | 4,408,174 | | | 4901 W Jefferson Blvd - Los Angeles, CA (a),(e) | | | | 4,222,470 | |
| | 15,025,000 | | | Del Mar Terrace - Phoenix, AZ (a),(d) | | | | 14,202,188 | |
| | 13,671,116 | | | EPIC Dallas (a),(d) | | | | 16,374,709 | |
| | 16,876,244 | | | Sora Multifamily Residential Property (a) | | | | 9,463,484 | |
| | 5,141,761 | | | Vale at the Parks - DC (a),(d) | | | | 4,965,143 | |
| | | | | Total Direct Real Estate (Cost$70,998,154) | | | | 64,344,433 | |
| | | | | | | | | | | | | | | |
| Principal | | | | | | | | | | | | |
| Amount ($) | | | | | | | | | | | | |
| | | | | Loan Accumulation Facility - 0.52% | | | | | | | | | | |
| | 1,623,750 | | | Allegro CLO XVI, Ltd, Warehouse (a),(b),(c),(g) | | 3M SOFR + 14.500% | | 14.500 | | 5/5/2025 | | | 1,623,750 | |
| | | | | Total Loan Accumulation Facility (Cost$1,623,750) | | | | | | | | | | |
See Notes to Consolidated Financial Statements.
| CIM Real Assets & Credit Fund | Consolidated Schedule of Investments |
| | September 30, 2023 |
| Principal | | | | | | | Coupon Rate | | | | | |
| Amount ($) | | | | | Spread | | (%) | | Maturity | | Fair Value | |
| | | | | Real Estate-Related Securities - 7.66% | | | | | | | | | | |
| | | | | Other - 7.66% | | | | | | | | | | |
| | 1,645,000 | | | IENTC 2, LLC (a),(c),(d),(g) | | 1M SOFR + 9.750% | | 15.066 | | 3/31/2031 | | $ | 1,645,000 | |
| | 6,815,000 | | | IENTC 2, LLC DDTL B-1 (a),(c),(d),(g) | | 1M SOFR + 9.750% | | 15.066 | | 3/31/2031 | | | 6,815,000 | |
| | 10,381,385 | | | Society Las Olas - PMG Greybook Riverfront I LLC (a),(c),(d),(g) | | 1M SOFR + 1.470% | | 6.800 | | 10/7/2024 | | | 10,371,004 | |
| | 5,291,016 | | | Society Las Olas 301 - S 1st Avenue Holdings LLC (a),(c),(d),(g) | | 1M SOFR + 6.823% | | 12.151 | | 10/7/2024 | | | 5,226,752 | |
| | | | | Total Real Estate-Related Securities (Cost$24,130,979) | | | | | | | | | 24,057,756 | |
| | | | | | | | | | | | | | | |
| Shares | | | | | | | Expiration Date | | Strike Price | | | |
| | | | | Warrant — 0.0% (m) | | | | | | | | | | |
| | | | | Internet Media & Services - 0.0% (m) | | | | 6,970 | |
| | 7,576 | | | RumbleON, Inc. (a),(b),(c),(e) | | | | 8/14/2028 | | $33.00 | | | | |
| | | | | Total Warrant (Cost $83,469) | | | | | |
| | | | | | | | | | | | | | | |
| | | | | Short-Term Investments - 5.66% | | | | | |
| | | | | Money Market Funds - 5.66% | | | | | |
| | 39,249,639 | | | First American Treasury Obligations Fund, Class Z, 5.23% (n),(o) (Cost $17,770,670) | | | | 17,770,670 | |
| | | | | | | | | | | | | | | |
| | | | | Total Investments 108.78% (Cost $356,009,584) | | | $ | 341,559,902 | |
| | | | | Liabilities in Excess of Other Assets - (-8.78%) | | | | (27,573,821 | ) |
| | | | | Net Assets (100.00%) | | | $ | 313,986,081 | |
| (a) | Fair value of this security was determined using significant, unobservable inputs and was determined in accordance with Rule 2a-5 under the Investment Company Act of 1940, as amended (the “1940 Act”). |
| (b) | A co-investment, completed under an order for exemptive relief granted by the U.S. Securities and Exchange Commission (“SEC”) on August 4, 2020, that is advised by the OFS Adviser. |
| (d) | A co-investment, completed under an order for exemptive relief granted by the SEC on August 4,2020, that is advised by the CIM Sub-Adviser. |
| (e) | Non-income producing security. |
| (f) | Investment in affiliate. See also footnotes (b), (d) and (i). |
| (g) | Variable or floating rate security, the interest rate of which adjusts periodically based on changes in current interest rates and prepayments on the underlying pool of assets. |
| (h) | A co-investment under the “Mass Mutual” no action letters. |
| (i) | This Investment or portion thereof was not funded as of September 30, 2023. The Fund had $9,381,183 at par value in unfunded commitments as of September 30, 2023. |
| (j) | Security exempt from registration under Rule 144A or Section 4(2) of the Securities Act of 1933. The security may be resold in transactions exempt from registration, normally to qualified institutional buyers. As of September 30, 2023 the total market value of 144A securities is $154,646,216 or 49.26% of net assets. |
| (k) | Collateralized loan obligation (“CLO”) subordinated notes are residual positions in the CLO vehicle. CLO subordinated notes are entitled to distributions that are generally equal to the residual cash flows of the underlying securities less contractual payments to debt holders and fund expenses. The effective yield is estimated based upon the amount and timing of these distributions in addition to the estimated amount of terminal distribution. Effective yields for the CLO equity positions are updated generally once a quarter in connection with a transaction, such as an add-on purchase, refinancing or reset. The estimated yield and investment cost may ultimately not be realized. Estimated yields are periodically adjusted based on information reported by the CLO as of the date of determination. |
| (m) | Percentage rounds to less than 0.1%. |
| (n) | Rate disclosed is the seven day effective yield as of June 30, 2023. |
| (o) | A portion of this security is held as collateral for total return swaps. |
See Notes to Consolidated Financial Statements.
| CIM Real Assets & Credit Fund | Consolidated Schedule of Investments |
Restricted Securities
| | | Acquisition | | | | | | | | Market Value as a | |
| Issuer Description | | Date | | Cost | | | Market Value | | | Percentage of Net Assets | |
| 24 Seven, Inc., Term Loan | | 1/28/2022 | | $ | 4,254,100 | | | $ | 4,171,209 | | | | 1.33 | % |
| AIDC Intermediate Co. 2, LLC, Term Loan | | 7/22/2022 | | | 2,499,398 | | | | 2,525,163 | | | | 0.80 | % |
| Allegro CLO XVI, Ltd, Warehouse | | 5/5/2023 | | | 1,623,750 | | | | 1,623,750 | | | | 0.52 | % |
| Boca Home Care Holdings Revolver | | 2/25/2022 | | | 574,839 | | | | 559,161 | | | | 0.18 | % |
| Boca Home Care Holdings, Inc. DDTL | | 2/25/2022 | | | 4,940,904 | | | | 4,816,824 | | | | 1.53 | % |
| Boca Homecare Holdings, Inc. (Equity) | | 2/25/2022 | | | 580,645 | | | | 421,800 | | | | 0.13 | % |
| CGA Holdings, Inc., Class A | | 3/3/2023 | | | 155,086 | | | | 154,820 | | | | 0.05 | % |
| CVAUSA Management, LLC Primary DDTL | | 5/22/2023 | | | 1,183,256 | | | | 1,165,507 | | | | 0.37 | % |
| CVAUSA Management, LLC Secondary DDTL | | 5/22/2023 | | | 495,316 | | | | 487,886 | | | | 0.16 | % |
| CVAUSA Management, LLC, Revolver, TL | | 5/22/2023 | | | 285,714 | | | | 281,429 | | | | 0.09 | % |
| CVAUSA Management, LLC, Term Loan | | 5/22/2023 | | | 1,991,747 | | | | 2,005,179 | | | | 0.64 | % |
| EOS-Metasource Intermediate, Inc., DDC | | 5/17/2022 | | | 1,485,000 | | | | 1,413,000 | | | | 0.45 | % |
| EOS-Metasource Intermediate, Inc., TL | | 5/17/2022 | | | 3,428,954 | | | | 3,255,788 | | | | 1.04 | % |
| Exponential Power, Inc., TL | | 5/17/2023 | | | 2,948,965 | | | | 2,955,000 | | | | 0.94 | % |
| Honor HN Buyer, Inc. Delayed Draw Term Loan | | 10/15/2021 | | | 715,677 | | | | 715,677 | | | | 0.23 | % |
| Honor HN Buyer, Inc. Revolver | | 10/15/2021 | | | 132,013 | | | | 132,013 | | | | 0.04 | % |
| Honor HN Buyer, Inc. Term Loan | | 10/15/2021 | | | 1,114,809 | | | | 1,130,299 | | | | 0.36 | % |
| Honor HN Buyer, Inc. Term Loan 1st Amendment Health Network | | 10/15/2021 | | | 791,254 | | | | 796,001 | | | | 0.25 | % |
| IENTC 1, LLC | | 3/31/2022 | | | 3,763,895 | | | | 6,212,460 | | | | 1.98 | % |
| IENTC 2, LLC | | 3/31/2022 | | | 1,645,000 | | | | 1,645,000 | | | | 0.52 | % |
| IENTC 2, LLC DDTL B-1 | | 3/31/2022 | | | 6,815,000 | | | | 6,815,000 | | | | 2.17 | % |
| Kreg LLC, Revolver | | 12/20/2021 | | | 162,228 | | | | 151,467 | | | | 0.05 | % |
| Kreg LLC, Term Loan | | 12/20/2021 | | | 2,052,469 | | | | 1,917,466 | | | | 0.61 | % |
| One GI Intermediate LLC, Revolver Upsize | | 12/13/2021 | | | 333,333 | | | | 313,667 | | | | 0.10 | % |
| One GI Intermediate LLC, Tranche B DDTL | | 12/13/2021 | | | 1,711,895 | | | | 1,622,049 | | | | 0.52 | % |
| One GI Intermediate LLC, Tranche C DDTL | | 12/13/2021 | | | 914,329 | | | | 860,441 | | | | 0.27 | % |
| PSB Group, LLC, Term Loan (Last Out) May 2023 | | 5/1/2023 | | | 1,981,985 | | | | 1,996,000 | | | | 0.64 | % |
| Rumbleon, INC. TL | | 8/31/2021 | | | 1,307,915 | | | | 1,246,353 | | | | 0.40 | % |
| RumbleOn, Inc., Delayed Draw Term Loan | | 8/31/2021 | | | 500,022 | | | | 458,520 | | | | 0.15 | % |
| RumbleON, Inc., Warrant | | 8/31/2021 | | | 83,469 | | | | 6,970 | | | | 0.00 | % |
| Shiftkey, Revolver | | 6/21/2022 | | | 147,059 | | | | 143,382 | | | | 0.05 | % |
| Shiftkey, Term Loan | | 6/21/2022 | | | 2,311,236 | | | | 2,271,177 | | | | 0.72 | % |
| Society Las Olas - PMG Greybook Riverfront I LLC | | 9/23/2021 | | | 10,379,962 | | | | 10,371,004 | | | | 3.30 | % |
| Society Las Olas 301 - S 1st Avenue Holdings LLC | | 6/7/2022 | | | 5,291,016 | | | | 5,226,752 | | | | 1.66 | % |
| Spear Education Holdings, LLC Term A Loan | | 2/10/2023 | | | 2,917,665 | | | | 2,952,165 | | | | 0.94 | % |
| Spectrum Vision Partners, LLC | | 5/5/2023 | | | 3,959,512 | | | | 3,977,910 | | | | 1.27 | % |
| SS Acquisition LLC, Delayed Draw Term Loan | | 12/30/2021 | | | 1,430,180 | | | | 1,440,000 | | | | 0.46 | % |
| SS Acquisition LLC, Term Loan | | 12/30/2021 | | | 2,976,874 | | | | 3,000,000 | | | | 0.96 | % |
| | | | | $ | 79,886,471 | | | $ | 81,238,289 | | | | 25.88 | % |
Other than as described above, we do not “control” and are not an “affiliate” of any of our portfolio investments, each as defined in the 1940 Act. In general, under the 1940 Act, we would be presumed to “control” a portfolio investment if we owned 25% or more of its voting securities and would be an “affiliate” of a portfolio investment if we owned 5% or more of its voting securities.
See Notes to Consolidated Financial Statements.
| CIM Real Assets & Credit Fund | Consolidated Schedule of Investments |
TOTAL RETURN SWAP CONTRACTS (a)
| | | | | | | | | | | | | | | Net Unrealized | |
| | | | | Notional | | | | | Termination | | | | | Appreciation | |
| Counterparty | | Reference Entity/Obligation | | Amount | | | Fund Pays | | Date | | Value | | | Depreciation | |
| Citibank, N.A. | | ABG Intermediate Holdings 2 LLC TLB 1L, 1M SOFR + 4.00 | | $ | 690,848 | | | 3M SOFR + 1.80% | | 12/21/2028 | | $ | 700,466 | | | $ | 9,618 | |
| Citibank, N.A. | | ABG Intermediate Holdings 2 LLC, TL B 2 DDTL, 3M SOFR + 4.00 | | | 131,739 | | | 3M SOFR + 1.80% | | 12/21/2028 | | | 133,913 | | | | 2,174 | |
| Citibank, N.A. | | Academy, Ltd., 1M SOFR + 3.75 | | | 565,618 | | | 3M SOFR + 1.80% | | 11/5/2027 | | | 566,289 | | | | 671 | |
| Citibank, N.A. | | Acrisure LLC, 1M SOFR + 3.50 | | | 584,969 | | | 3M SOFR + 1.80% | | 2/15/2027 | | | 579,348 | | | | (5,621 | ) |
| Citibank, N.A. | | Acrisure LLC, 1M SOFR + 3.75 | | | 544,698 | | | 3M SOFR + 1.80% | | 2/15/2027 | | | 541,975 | | | | (2,723 | ) |
| Citibank, N.A. | | Acrisure LLC, 1M SOFR + 4.25 | | | 146,983 | | | 3M SOFR + 1.80% | | 2/15/2027 | | | 147,704 | | | | 721 | |
| Citibank, N.A. | | ADMI Corp. TLB3 1L, 1M SOFR + 3.75 | | | 789,478 | | | 3M SOFR + 1.80% | | 12/23/2027 | | | 741,118 | | | | (48,360 | ) |
| Citibank, N.A. | | Advantage Sales & Marketing, Inc., 3M SOFR + 4.50 | | | 748,967 | | | 3M SOFR + 1.80% | | 10/28/2027 | | | 731,840 | | | | (17,127 | ) |
| Citibank, N.A. | | Aegion Corp., 1M SOFR + 4.75 | | | 811,461 | | | 3M SOFR + 1.80% | | 5/17/2028 | | | 812,999 | | | | 1,538 | |
| Citibank, N.A. | | AHP Health Partners, Inc., 1M SOFR + 3.50 | | | 284,466 | | | 3M SOFR + 1.80% | | 8/24/2028 | | | 285,570 | | | | 1,104 | |
| Citibank, N.A. | | AI Aqua Merger Sub, Inc., 1M SOFR + 3.75 | | | 740,170 | | | 3M SOFR + 1.80% | | 7/31/2028 | | | 738,164 | | | | (2,006 | ) |
| Citibank, N.A. | | Allen Media LLC, 3M SOFR + 5.50 | | | 1,502,061 | | | 3M SOFR + 1.80% | | 2/10/2027 | | | 1,353,934 | | | | (148,127 | ) |
| Citibank, N.A. | | Allied Universal Holdco LLC, 1M SOFR + 3.75 | | | 489,388 | | | 3M SOFR + 1.80% | | 5/14/2028 | | | 475,311 | | | | (14,077 | ) |
| Citibank, N.A. | | Amentum Government Services Holdings LLC TLB 1L, 1M SOFR + 4.00 | | | 347,993 | | | 3M SOFR + 1.80% | | 2/15/2029 | | | 345,483 | | | | (2,510 | ) |
| Citibank, N.A. | | American Airlines, Inc. Seventh Amendment Extended Term Loan, 1M SOFR + 2.75 | | | 498,125 | | | 3M SOFR + 1.80% | | 2/7/2028 | | | 497,045 | | | | (1,080 | ) |
| Citibank, N.A. | | American Axle & Manufacturing, Inc., TL, 6M SOFR + 3.50 | | | 993,699 | | | 3M SOFR + 1.80% | | 12/13/2029 | | | 1,001,097 | | | | 7,398 | |
| Citibank, N.A. | | AMYNTA AGENCY BORROWER INC, TLB, 1M SOFR + 5.00 | | | 910,152 | | | 3M SOFR + 1.80% | | 2/28/2028 | | | 914,154 | | | | 4,002 | |
| Citibank, N.A. | | AP Core Holdings II LLC, 1M SOFR + 5.50 (b) | | | 1,097,877 | | | 3M SOFR + 1.80% | | 9/1/2027 | | | 1,090,761 | | | | (7,116 | ) |
| Citibank, N.A. | | AppLovin Corporation Aug-2023 TL, 1M SOFR + 3.10 | | | 691,031 | | | 3M SOFR + 1.80% | | 8/19/2030 | | | 692,624 | | | | 1,593 | |
| Citibank, N.A. | | Aramark Services, Inc. U.S. Term B-6 Loan, 1M SOFR + 1.75 | | | 130,375 | | | 3M SOFR + 1.80% | | 6/22/2030 | | | 131,846 | | | | 1,471 | |
| Citibank, N.A. | | Arches Buyer, Inc., 1M SOFR + 3.25 | | | 832,835 | | | 3M SOFR + 1.80% | | 12/6/2027 | | | 825,716 | | | | (7,119 | ) |
| Citibank, N.A. | | ASGN Incorporated Term Loan B, 1M SOFR + 2.25 (b) | | | 997,510 | | | 3M SOFR + 1.80% | | 8/31/2030 | | | 1,005,000 | | | | 7,490 | |
| Citibank, N.A. | | Asurion, LLC NEW B-11 TERM LOAN, 1M SOFR + 4.25 | | | 368,628 | | | 3M SOFR + 1.80% | | 8/19/2028 | | | 370,123 | | | | 1,495 | |
| Citibank, N.A. | | Asurion, LLC TLB 1L, 1M SOFR + 4.00 | | | 593,762 | | | 3M SOFR + 1.80% | | 8/21/2028 | | | 602,671 | | | | 8,909 | |
| Citibank, N.A. | | Athenahealth Group Inc. TLB 1L, 1M SOFR + 3.25 | | | 439,580 | | | 3M SOFR + 1.80% | | 2/15/2029 | | | 434,254 | | | | (5,326 | ) |
| Citibank, N.A. | | Athletico Physical Therapy TLB, 3M SOFR + 4.25 | | | 896,338 | | | 3M SOFR + 1.80% | | 2/15/2029 | | | 757,687 | | | | (138,651 | ) |
| Citibank, N.A. | | Autokiniton US Holdings, Inc., 1M SOFR + 4.50 | | | 1,077,527 | | | 3M SOFR + 1.80% | | 4/6/2028 | | | 1,056,409 | | | | (21,118 | ) |
| Citibank, N.A. | | Axalta Coating Systems US Holdings Repriced TL, 1M SOFR + 2.50 | | | 728,324 | | | 3M SOFR + 1.80% | | 12/20/2029 | | | 732,795 | | | | 4,471 | |
| Citibank, N.A. | | Bakemark Holdings, Inc., 1M SOFR + 4.00 | | | 490,632 | | | 3M SOFR + 1.80% | | 9/5/2028 | | | 488,806 | | | | (1,826 | ) |
| Citibank, N.A. | | Banijay Entertainment S.A.S., Banijay 1L, 1M SOFR + 3.75 | | | 358,278 | | | 3M SOFR + 1.80% | | 3/2/2028 | | | 362,277 | | | | 3,999 | |
| Citibank, N.A. | | Barnes Group First Lien TLB, 1M SOFR + 3.00 | | | 496,264 | | | 3M SOFR + 1.80% | | 8/11/2030 | | | 501,375 | | | | 5,111 | |
| Citibank, N.A. | | BCPE North Star US Holdco 2, Inc. TL 1L, 3M SOFR + 4.00 (b) | | | 946,917 | | | 3M SOFR + 1.80% | | 6/9/2028 | | | 855,829 | | | | (91,088 | ) |
| Citibank, N.A. | | BJ’s Wholesale Club, Inc., 1M SOFR + 2.75 | | | 198,427 | | | 3M SOFR + 1.80% | | 2/3/2027 | | | 199,320 | | | | 893 | |
| Citibank, N.A. | | BROOKFIELD WEC HOLDINGS INC TL 1L, 1M SOFR + 3.75 | | | 201,619 | | | 3M SOFR + 1.80% | | 8/1/2025 | | | 207,520 | | | | 5,901 | |
| Citibank, N.A. | | BROWN GROUP HOLDING, LLC TLB2 1L, 1M SOFR + 3.75 | | | 197,581 | | | 3M SOFR + 1.80% | | 7/2/2029 | | | 199,622 | | | | 2,041 | |
| Citibank, N.A. | | Burlington Coat Factory Warehouse Corp., 1M SOFR + 2.00 | | | 537,017 | | | 3M SOFR + 1.80% | | 6/26/2028 | | | 538,663 | | | | 1,646 | |
| Citibank, N.A. | | Buzz Merger Sub LTD. Initial Term Loan, 1M SOFR + 2.75 | | | 500,000 | | | 3M SOFR + 1.80% | | 1/29/2027 | | | 500,158 | | | | 158 | |
| Citibank, N.A. | | Cablevision Lightpath LLC Initial Term Loan, 1M SOFR + 3.25 | | | 737,126 | | | 3M SOFR + 1.80% | | 11/30/2027 | | | 742,500 | | | | 5,374 | |
| Citibank, N.A. | | CCRR Parent, Inc. TLB, 1M SOFR + 3.75 | | | 881,407 | | | 3M SOFR + 1.80% | | 3/5/2028 | | | 842,730 | | | | (38,677 | ) |
| Citibank, N.A. | | CDK GLOBAL, INC.TLB 1L, 3M SOFR + 4.25 | | | 247,877 | | | 3M SOFR + 1.80% | | 7/6/2029 | | | 254,087 | | | | 6,210 | |
| Citibank, N.A. | | Charlotte Buyer, Inc.; Curo Health Services, LLC, 1M SOFR + 5.25 | | | 936,497 | | | 3M SOFR + 1.80% | | 2/11/2028 | | | 986,025 | | | | 49,528 | |
| Citibank, N.A. | | Chart Industries, Inc., 1M SOFR + 3.75 (b) | | | 195,692 | | | 3M SOFR + 1.80% | | 3/15/2030 | | | 200,104 | | | | 4,412 | |
| Citibank, N.A. | | Charter Next Generation, Inc., 1M SOFR + 3.75 | | | 729,246 | | | 3M SOFR + 1.80% | | 12/1/2027 | | | 728,674 | | | | (572 | ) |
| Citibank, N.A. | | CHG Healthcare Services Inc TLB 2023, 1M SOFR + 3.75 | | | 247,500 | | | 3M SOFR + 1.80% | | 9/30/2028 | | | 250,156 | | | | 2,656 | |
| Citibank, N.A. | | CHG Healthcare Services, Inc., 1M SOFR + 3.25 | | | 345,450 | | | 3M SOFR + 1.80% | | 9/29/2028 | | | 345,761 | | | | 311 | |
| Citibank, N.A. | | City Brewing Co. LLC, 3M SOFR + 3.50 | | | 219,097 | | | 3M SOFR + 1.80% | | 4/5/2028 | | | 144,464 | | | | (74,633 | ) |
| Citibank, N.A. | | Clarios Global LP TL, 1M SOFR + 3.75 | | | 287,078 | | | 3M SOFR + 1.80% | | 5/6/2030 | | | 288,327 | | | | 1,249 | |
| Citibank, N.A. | | Clydesdale Acquisition Holdings, Inc., 1M SOFR + 4.18 | | | 789,100 | | | 3M SOFR + 1.80% | | 4/13/2029 | | | 802,454 | | | | 13,354 | |
| Citibank, N.A. | | Cogeco Communications Finance USA LP, Amendment No. 5 Incremental Term B Loan, 1M SOFR + 2.50 | | | 491,877 | | | 3M SOFR + 1.80% | | 9/1/2028 | | | 487,580 | | | | (4,297 | ) |
| Citibank, N.A. | | Compass Power Generation LLC, 1M SOFR + 4.25 | | | 921,302 | | | 3M SOFR + 1.80% | | 4/14/2029 | | | 933,440 | | | | 12,138 | |
| Citibank, N.A. | | Conduent Business Services LLC, 1M SOFR + 4.25 | | | 988,339 | | | 3M SOFR + 1.80% | | 10/15/2028 | | | 988,902 | | | | 563 | |
| Citibank, N.A. | | Connect Finco Sarl, 1M SOFR + 3.50 | | | 981,780 | | | 3M SOFR + 1.80% | | 12/12/2026 | | | 963,965 | | | | (17,815 | ) |
| Citibank, N.A. | | Core & Main LP, 1M SOFR + 2.50 | | | 407,580 | | | 3M SOFR + 1.80% | | 7/27/2028 | | | 408,895 | | | | 1,315 | |
| Citibank, N.A. | | Corel Corp., 3M SOFR + 5.00 | | | 609,177 | | | 3M SOFR + 1.80% | | 7/2/2026 | | | 608,623 | | | | (554 | ) |
| Citibank, N.A. | | CoreLogic, Inc., 1M SOFR + 3.50 | | | 204,267 | | | 3M SOFR + 1.80% | | 6/2/2028 | | | 189,898 | | | | (14,369 | ) |
| Citibank, N.A. | | CORGI BIDCO, INC.TL 1L, 3M SOFR + 5.00 | | | 172,674 | | | 3M SOFR + 1.80% | | 10/15/2029 | | | 180,950 | | | | 8,276 | |
| Citibank, N.A. | | Cornerstone Building Brands, Inc., 1M SOFR + 3.25 | | | 245,399 | | | 3M SOFR + 1.80% | | 4/12/2028 | | | 270,406 | | | | 25,007 | |
| Citibank, N.A. | | Cornerstone OnDemand, Inc., TL, 3M SOFR + 3.75 | | | 684,806 | | | 3M SOFR + 1.80% | | 10/16/2028 | | | 653,972 | | | | (30,834 | ) |
| Citibank, N.A. | | Covanta Holding Corporation, TLB, 1M SOFR + 3.00 | | | 525,375 | | | 3M SOFR + 1.80% | | 11/30/2028 | | | 526,584 | | | | 1,209 | |
| Citibank, N.A. | | Covanta Holding Corporation, TLC, 1M SOFR + 3.00 | | | 39,403 | | | 3M SOFR + 1.80% | | 11/30/2028 | | | 39,494 | | | | 91 | |
| Citibank, N.A. | | CP Atlas Buyer, Inc., 1M SOFR + 3.75 | | | 392,673 | | | 3M SOFR + 1.80% | | 11/23/2027 | | | 371,484 | | | | (21,189 | ) |
| Citibank, N.A. | | Dermatology Intermediate Holdings III, Inc. 1L, 3M SOFR +4.25 | | | 55,130 | | | 3M SOFR + 1.80% | | 3/26/2029 | | | 54,875 | | | | (255 | ) |
See Notes to Consolidated Financial Statements.
| CIM Real Assets & Credit Fund | Consolidated Schedule of Investments |
TOTAL RETURN SWAP CONTRACTS (a)
| | | | | | | | | | | | | | | Net Unrealized | |
| | | | | Notional | | | | | Termination | | | | | Appreciation | |
| Counterparty | | Reference Entity/Obligation | | Amount | | | Fund Pays | | Date | | Value | | | Depreciation | |
| Citibank, N.A. | | Dermatology Intermediate Holdings III, Inc. TLB 1L, 3M SOFR + 4.25 | | | 289,494 | | | 3M SOFR + 1.80% | | 3/26/2029 | | | 293,025 | | | | 3,531 | |
| Citibank, N.A. | | DexKo Global Inc., TLB, 3M SOFR + 3.75 | | | 640,231 | | | 3M SOFR + 1.80% | | 10/4/2028 | | | 627,584 | | | | (12,647 | ) |
| Citibank, N.A. | | DG Investment Intermediate Holdings 2, Inc., 1M SOFR + 3.75 | | | 739,928 | | | 3M SOFR + 1.80% | | 3/31/2028 | | | 729,142 | | | | (10,786 | ) |
| Citibank, N.A. | | DIRECTV Financing LLC, 1M SOFR + 5.00 | | | 1,179,206 | | | 3M SOFR + 1.80% | | 8/2/2027 | | | 1,159,502 | | | | (19,704 | ) |
| Citibank, N.A. | | East West Manufacturing, LLC TLB 1L, 3M SOFR + 5.75 (b) | | | 641,258 | | | 3M SOFR + 1.80% | | 12/22/2028 | | | 560,906 | | | | (80,352 | ) |
| Citibank, N.A. | | Electrical Components International, Inc. Initial Term Loan (First Lien), 1M SOFR + 4.25 (b) | | | 497,539 | | | 3M SOFR + 1.80% | | 6/26/2025 | | | 496,250 | | | | (1,289 | ) |
| Citibank, N.A. | | Element Materials Tech Group US Holdings Delayed TL, 3M SOFR + 4.25 (b) | | | 55,449 | | | 3M SOFR + 1.80% | | 6/22/2029 | | | 54,941 | | | | (508 | ) |
| Citibank, N.A. | | Element Materials Tech Group US Holdings Inc. TL, 3M SOFR + 4.25 | | | 119,603 | | | 3M SOFR + 1.80% | | 6/22/2029 | | | 119,038 | | | | (565 | ) |
| Citibank, N.A. | | EnergySolutions, LLC 2023 TL, 1M SOFR + 4.00 (b) | | | 545,723 | | | 3M SOFR + 1.80% | | 9/18/2030 | | | 549,868 | | | | 4,145 | |
| Citibank, N.A. | | Fertitta Entertainment, LLC TLB 1L, 1M SOFR + 4.00 | | | 342,788 | | | 3M SOFR + 1.80% | | 1/29/2029 | | | 340,598 | | | | (2,190 | ) |
| Citibank, N.A. | | Gainwell Acquisition Corp., 1M SOFR + 4.25 | | | 490,965 | | | 3M SOFR + 1.80% | | 2/1/2029 | | | 495,542 | | | | 4,577 | |
| Citibank, N.A. | | Gainwell Acquisition Corp., 3M SOFR + 4.00 | | | 232,080 | | | 3M SOFR + 1.80% | | 10/1/2027 | | | 226,663 | | | | (5,417 | ) |
| Citibank, N.A. | | Garda World Security Corp., 1M SOFR + 4.25 | | | 593,103 | | | 3M SOFR + 1.80% | | 10/30/2026 | | | 593,182 | | | | 79 | |
| Citibank, N.A. | | GIP Pilot Acquisition Partners L.P. - 2023 TL 2023 TL, 1M SOFR + 3.00 (b) | | | 248,750 | | | 3M SOFR + 1.80% | | 9/19/2030 | | | 249,688 | | | | 938 | |
| Citibank, N.A. | | Gloves Buyer, Inc. Non-Fung Inc 1LTL, 1M SOFR + 5.00 (b) | | | 727,627 | | | 3M SOFR + 1.80% | | 12/29/2027 | | | 730,313 | | | | 2,686 | |
| Citibank, N.A. | | Great Outdoors Group, LLC TLB 1L, 1M SOFR + 3.75 | | | 1,469,713 | | | 3M SOFR + 1.80% | | 3/6/2028 | | | 1,476,262 | | | | 6,549 | |
| Citibank, N.A. | | Help/Systems Holdings, Inc., 3M SOFR + 4.00 | | | 488,636 | | | 3M SOFR + 1.80% | | 11/19/2026 | | | 469,499 | | | | (19,137 | ) |
| Citibank, N.A. | | Hunter Douglas Inc. TLB 1L, 3M SOFR +3.50 | | | 492,989 | | | 3M SOFR + 1.80% | | 2/25/2029 | | | 483,244 | | | | (9,745 | ) |
| Citibank, N.A. | | Hyperion Materials and Technologies Inc Initial Term Loans, 3M SOFR + 4.25 | | | 747,545 | | | 3M SOFR + 1.80% | | 8/30/2028 | | | 749,531 | | | | 1,986 | |
| Citibank, N.A. | | Indy US Holdco LLC, 1M SOFR + 6.25 | | | 813,093 | | | 3M SOFR + 1.80% | | 3/5/2028 | | | 887,877 | | | | 74,784 | |
| Citibank, N.A. | | Installed Building Products, Inc. Repriced TLB, 1M SOFR + 2.00 | | | 500,000 | | | 3M SOFR + 1.80% | | 12/14/2028 | | | 500,003 | | | | 3 | |
| Citibank, N.A. | | Ivanti Software, Inc., 3M SOFR + 4.25 | | | 657,114 | | | 3M SOFR + 1.80% | | 12/1/2027 | | | 571,519 | | | | (85,595 | ) |
| Citibank, N.A. | | Jadex, Inc., 1M SOFR + 4.75 (b) | | | 359,051 | | | 3M SOFR + 1.80% | | 2/11/2028 | | | 340,567 | | | | (18,484 | ) |
| Citibank, N.A. | | Janus International Group LLC, Amendment No. 6 Refinancing Term Loan, 1M SOFR + 3.25 | | | 235,755 | | | 3M SOFR + 1.80% | | 8/5/2030 | | | 237,649 | | | | 1,894 | |
| Citibank, N.A. | | KKR Apple Bidco, LLC, 1M SOFR + 2.75 | | | 945,663 | | | 3M SOFR + 1.80% | | 9/22/2028 | | | 942,143 | | | | (3,520 | ) |
| Citibank, N.A. | | KKR Apple Bidco, LLC, 1M SOFR + 4.00 | | | 224,138 | | | 3M SOFR + 1.80% | | 9/22/2028 | | | 236,312 | | | | 12,174 | |
| Citibank, N.A. | | KNS Midco Corp., 1M SOFR + 6.25 (b) | | | 573,750 | | | 3M SOFR + 1.80% | | 4/16/2027 | | | 490,556 | | | | (83,194 | ) |
| Citibank, N.A. | | LBM Acquisition LLC, 1M SOFR + 3.75 | | | 634,659 | | | 3M SOFR + 1.80% | | 12/17/2027 | | | 621,527 | | | | (13,132 | ) |
| Citibank, N.A. | | Liftoff Mobile, Inc., 1M SOFR + 3.75 | | | 489,890 | | | 3M SOFR + 1.80% | | 10/2/2028 | | | 470,718 | | | | (19,172 | ) |
| Citibank, N.A. | | LogMeIn, Inc. TLB, 3M SOFR + 4.75 | | | 684,225 | | | 3M SOFR + 1.80% | | 8/31/2027 | | | 457,318 | | | | (226,907 | ) |
| Citibank, N.A. | | LSF11 A5 HOLDCO LLC, TLB, 1M SOFR + 4.25 | | | 643,752 | | | 3M SOFR + 1.80% | | 10/15/2028 | | | 646,490 | | | | 2,738 | |
| Citibank, N.A. | | LSF9 ATLANTIS HOLDINGS, LLC, 3M SOFR + 7.25 | | | 1,146,461 | | | 3M SOFR + 1.80% | | 3/29/2029 | | | 1,137,582 | | | | (8,879 | ) |
| Citibank, N.A. | | Madison IAQ LLC, 1M SOFR + 3.25 | | | 639,847 | | | 3M SOFR + 1.80% | | 6/21/2028 | | | 634,194 | | | | (5,653 | ) |
| Citibank, N.A. | | Magenta Buyer LLC, 3M SOFR + 5.00 | | | 795,266 | | | 3M SOFR + 1.80% | | 7/27/2028 | | | 597,545 | | | | (197,721 | ) |
| Citibank, N.A. | | McAfee Corp. TLB 1L, 1M SOFR + 3.75 | | | 910,127 | | | 3M SOFR + 1.80% | | 3/1/2029 | | | 894,139 | | | | (15,988 | ) |
| Citibank, N.A. | | McGraw-Hill Education, Inc., 1M SOFR + 4.75 | | | 721,339 | | | 3M SOFR + 1.80% | | 7/28/2028 | | | 714,691 | | | | (6,648 | ) |
| Citibank, N.A. | | Medline Industries, LP, Term Loan, 1M SOFR + 3.25 | | | 861,990 | | | 3M SOFR + 1.80% | | 10/23/2028 | | | 862,736 | | | | 746 | |
| Citibank, N.A. | | Mega Broadband Investments LLC Initial Term Loan, 3M SOFR + 3.00 | | | 488,125 | | | 3M SOFR + 1.80% | | 11/12/2027 | | | 489,220 | | | | 1,095 | |
| Citibank, N.A. | | MH Sub I LLC, 1M SOFR + 4.25 | | | 677,053 | | | 3M SOFR + 1.80% | | 5/3/2028 | | | 677,675 | | | | 622 | |
| Citibank, N.A. | | Midwest Physician Administrative Services LLC, 3M SOFR + 3.25 | | | 720,775 | | | 3M SOFR + 1.80% | | 3/13/2028 | | | 678,543 | | | | (42,232 | ) |
| Citibank, N.A. | | Mitchell International, Inc., 1M SOFR + 3.75 | | | 654,558 | | | 3M SOFR + 1.80% | | 10/16/2028 | | | 648,649 | | | | (5,909 | ) |
| Citibank, N.A. | | Mosel Bidco SE TLB, 1M SOFR + 4.75 | | | 198,000 | | | 3M SOFR + 1.80% | | 8/1/2030 | | | 200,250 | | | | 2,250 | |
| Citibank, N.A. | | Naked Juice LLC 3M SOFR + 3.25 | | | 985,520 | | | 3M SOFR + 1.80% | | 1/24/2029 | | | 941,487 | | | | (44,033 | ) |
| Citibank, N.A. | | Olaplex, Inc TL 1L, 1M SOFR + 3.50 | | | 350,871 | | | 3M SOFR + 1.80% | | 2/17/2029 | | | 300,782 | | | | (50,089 | ) |
| Citibank, N.A. | | Oldcastle Building Envelope Inc TLB 1L, 3M SOFR + 4.50 | | | 730,052 | | | 3M SOFR + 1.80% | | 4/30/2029 | | | 741,922 | | | | 11,870 | |
| Citibank, N.A. | | OpenText Corporation Repriced TLB, 1M SOFR + 2.75 | | | 500,000 | | | 3M SOFR + 1.80% | | 1/31/2030 | | | 500,655 | | | | 655 | |
| Citibank, N.A. | | PetSmart LLC, 1M SOFR + 3.75 | | | 1,273,394 | | | 3M SOFR + 1.80% | | 2/11/2028 | | | 1,275,013 | | | | 1,619 | |
| Citibank, N.A. | | Pitney Bowes INC.TL, 1M SOFR + 4.00 (b) | | | 747,078 | | | 3M SOFR + 1.80% | | 3/17/2028 | | | 723,646 | | | | (23,432 | ) |
| Citibank, N.A. | | Primary Products Finance LLC, 3M SOFR+ 4.00 | | | 247,862 | | | 3M SOFR + 1.80% | | 4/2/2029 | | | 249,481 | | | | 1,619 | |
| Citibank, N.A. | | Proofpoint, Inc., 1M SOFR + 3.25 | | | 701,225 | | | 3M SOFR + 1.80% | | 8/31/2028 | | | 698,636 | | | | (2,589 | ) |
| Citibank, N.A. | | Quest Borrower Limited TL 1L, 3M SOFR + 4.25 | | | 981,999 | | | 3M SOFR + 1.80% | | 2/1/2029 | | | 828,610 | | | | (153,389 | ) |
| Citibank, N.A. | | Redstone Holdco 2 LP, 1M SOFR + 4.75 | | | 831,305 | | | 3M SOFR + 1.80% | | 4/27/2028 | | | 808,856 | | | | (22,449 | ) |
| Citibank, N.A. | | Ring Container Technologies Group LLC, 1M SOFR + 3.50 | | | 385,221 | | | 3M SOFR + 1.80% | | 8/12/2028 | | | 387,985 | | | | 2,764 | |
| Citibank, N.A. | | Roper Industrial Products Investment Co LLC, TL, 3M SOFR + 4.50 | | | 96,491 | | | 3M SOFR + 1.80% | | 11/22/2029 | | | 100,089 | | | | 3,598 | |
| Citibank, N.A. | | Rough Country, LLC 1L, 3M SOFR + 3.25(b) | | | 1,253,409 | | | 3M SOFR + 1.80% | | 7/26/2028 | | | 1,228,102 | | | | (25,307 | ) |
| Citibank, N.A. | | Ryan Specialty Group LLC, 1M SOFR + 3.00 | | | 194,713 | | | 3M SOFR + 1.80% | | 9/1/2027 | | | 194,900 | | | | 187 | |
| Citibank, N.A. | | Scientific Games Holdings LP TLB 1L, 3M SOFR + 3.50 | | | 698,631 | | | 3M SOFR + 1.80% | | 4/4/2029 | | | 698,069 | | | | (562 | ) |
| Citibank, N.A. | | Select Medical Corp. Tranche B-1 Term Loan, 1M SOFR + 3.00 | | | 331,731 | | | 3M SOFR + 1.80% | | 3/6/2027 | | | 332,917 | | | | 1,186 | |
| Citibank, N.A. | | Simon & Schuster TLB, 1M SOFR + 4.00 (b) | | | 99,000 | | | 3M SOFR + 1.80% | | 11/27/2030 | | | 99,500 | | | | 500 | |
| Citibank, N.A. | | Sinclair Television Group, Inc. TLB4 1L, 1M SOFR + 3.75 | | | 570,985 | | | 3M SOFR + 1.80% | | 4/13/2029 | | | 418,092 | | | | (152,893 | ) |
See Notes to Consolidated Financial Statements.
| CIM Real Assets & Credit Fund | Consolidated Schedule of Investments |
TOTAL RETURN SWAP CONTRACTS (a)
| | | | | | | | | | | | | | | Net Unrealized | |
| | | | | Notional | | | | | Termination | | | | | Appreciation | |
| Counterparty | | Reference Entity/Obligation | | Amount | | | Fund Pays | | Date | | Value | | | Depreciation | |
| Citibank, N.A. | | Sitel Worldwide Corp., 1M SOFR + 3.75 | | | 671,183 | | | 3M SOFR + 1.80% | | 8/27/2028 | | | 658,872 | | | | (12,311 | ) |
| Citibank, N.A. | | Sovos Brands Intermediate, Inc., 1M SOFR + 3.50 | | | 351,455 | | | 3M SOFR + 1.80% | | 6/8/2028 | | | 353,516 | | | | 2,061 | |
| Citibank, N.A. | | Specialty Building Products Holdings LLC, 1M SOFR + 3.75 | | | 492,622 | | | 3M SOFR + 1.80% | | 10/15/2028 | | | 489,254 | | | | (3,368 | ) |
| Citibank, N.A. | | Spring Education Group, Inc., 3M SOFR + 4.50 | | | 136,991 | | | 3M SOFR + 1.80% | | 9/28/2030 | | | 136,991 | | | | — | |
| Citibank, N.A. | | SRS Distribution Inc., 1M SOFR + 3.50 | | | 175,996 | | | 3M SOFR + 1.80% | | 6/2/2028 | | | 175,416 | | | | (580 | ) |
| Citibank, N.A. | | Sunshine Luxembourg VII S.a r.l., 3M SOFR + 3.75 | | | 953,122 | | | 3M SOFR + 1.80% | | 10/2/2026 | | | 951,481 | | | | (1,641 | ) |
| Citibank, N.A. | | Star Parent, Inc. TLB, 3M SOFR + 4.00 | | | 175,892 | | | 3M SOFR + 1.80% | | 9/30/2030 | | | 174,863 | | | | (1,029 | ) |
| Citibank, N.A. | | Teneo Holdings LLC, 1M SOFR + 5.25 | | | 1,033,068 | | | 3M SOFR + 1.80% | | 7/12/2025 | | | 1,037,452 | | | | 4,384 | |
| Citibank, N.A. | | Tenneco Inc. Cov-Lite TLB, 1M SOFR + 5.00 | | | 426,377 | | | 3M SOFR + 1.80% | | 11/17/2028 | | | 425,783 | | | | (594 | ) |
| Citibank, N.A. | | Tony’s Fresh Market / Cardenas Markets TLB 1L, 1M SOFR + 6.75 | | | 939,773 | | | 3M SOFR + 1.80% | | 8/1/2029 | | | 995,398 | | | | 55,625 | |
| Citibank, N.A. | | Topgolf Callaway Brands Corp, TLB, 1M SOFR + 3.50 | | | 594,102 | | | 3M SOFR + 1.80% | | 3/15/2030 | | | 592,831 | | | | (1,271 | ) |
| Citibank, N.A. | | TransDigm Inc., TLH, 3M SOFR + 3.25 | | | 486,676 | | | 3M SOFR + 1.80% | | 2/22/2027 | | | 496,226 | | | | 9,550 | |
| Citibank, N.A. | | TricorBraun Holdings, Inc., 1M SOFR + 3.25 | | | 331,397 | | | 3M SOFR + 1.80% | | 3/3/2028 | | | 328,231 | | | | (3,166 | ) |
| Citibank, N.A. | | Tronox Finance LLC August 2023 Loan, 1M SOFR + 3.50 | | | 247,500 | | | 3M SOFR + 1.80% | | 8/10/2028 | | | 248,250 | | | | 750 | |
| Citibank, N.A. | | TruGreen LP, 1M SOFR + 4.00 | | | 362,155 | | | 3M SOFR + 1.80% | | 11/2/2027 | | | 359,241 | | | | (2,914 | ) |
| Citibank, N.A. | | TTM Technologies, Inc. TLB 1L, 1M SOFR + 2.75 (b) | | | 82,530 | | | 3M SOFR + 1.80% | | 5/30/2030 | | | 83,542 | | | | 1,012 | |
| Citibank, N.A. | | U.S. Anesthesia Partners, Inc., 1M SOFR + 4.25 | | | 930,304 | | | 3M SOFR + 1.80% | | 10/2/2028 | | | 859,484 | | | | (70,820 | ) |
| Citibank, N.A. | | U.S. Silica Company TLB, 1M SOFR + 4.75 | | | 628,335 | | | 3M SOFR + 1.80% | | 3/25/2030 | | | 640,584 | | | | 12,249 | |
| Citibank, N.A. | | Virtusa Corporation TL 1L, 1M SOFR + 3.75 | | | 790,697 | | | 3M SOFR + 1.80% | | 2/15/2029 | | | 793,463 | | | | 2,766 | |
| Citibank, N.A. | | Watlow Electric Manufacturing Co., 3M SOFR + 3.75 | | | 1,038,894 | | | 3M SOFR + 1.80% | | 3/2/2028 | | | 1,033,011 | | | | (5,883 | ) |
| Citibank, N.A. | | WildBrain Ltd Initial Term Loan, 1M SOFR + 4.25 | | | 748,135 | | | 3M SOFR + 1.80% | | 3/24/2028 | | | 738,750 | | | | (9,385 | ) |
| Citibank, N.A. | | Worldpay 1L Term Loan, 1M SOFR + 3.00 | | | 271,364 | | | 3M SOFR + 1.80% | | 9/19/2030 | | | 272,827 | | | | 1,463 | |
| Citibank, N.A. | | WW International, Inc., 1M SOFR + 3.50 | | | 1,171,950 | | | 3M SOFR + 1.80% | | 4/13/2028 | | | 891,220 | | | | (280,730 | ) |
| Citibank, N.A. | | Xperi Corporation TLB , 1M SOFR + 3.50 | | | 794,981 | | | 3M SOFR + 1.80% | | 6/8/2028 | | | 796,914 | | | | 1,933 | |
| Citibank, N.A. | | Zelis Payments Buyer, Inc., 1M SOFR + 3.50 | | | 978,332 | | | 3M SOFR + 1.80% | | 9/30/2026 | | | 981,227 | | | | 2,895 | |
| | | | | $ | 85,807,765 | | | | | | | $ | 83,770,466 | | | $ | (2,037,299 | ) |
| (a) | The Fund’s interest in the total return swap transactions are held through a wholly-owned subsidiary of the Fund, RACR-FS, LLC, a Delaware Limited Liability Company. |
| (b) | Security is classified as Level 3 in the Fund’s fair value hierarchy (see Note 2). |
See Notes to Consolidated Financial Statements.
| CIM Real Assets & Credit Fund | Consolidated Statement of Assets and Liabilities |
| | September 30, 2023 |
| ASSETS | | | | |
| Investments: | | | | |
| Unaffiliated Investments at fair value (cost $284,495,278) | | $ | 267,030,375 | |
| Affiliated Investments at fair value (cost $71,514,306) | | | 74,529,527 | |
| Cash | | | 1,212,343 | |
| Cash collateral for total return swaps | | | 21,478,969 | |
| Interest receivable | | | 3,915,890 | |
| Receivable for investments sold | | | 7,043,143 | |
| Receivable for Fund shares sold | | | 1,211,071 | |
| Unrealized appreciation on total return swap contracts | | | 443,580 | |
| Prepaid expenses and other assets | | | 142,069 | |
| TOTAL ASSETS | | $ | 377,006,967 | |
| | | | | |
| LIABILITIES | | | | |
| Payable for securities purchased | | | 12,179,944 | |
| Line of credit payable (Note 7) | | | 45,000,000 | |
| Unrealized depreciation on total return swap contracts | | | 2,480,879 | |
| Due to Advisor | | | 527,318 | |
| Administrative fees payable (Note 8) | | | 683,589 | |
| Professional fees payable | | | 444,755 | |
| Trustee fees payable (Note 8) | | | 353,185 | |
| Payable for Fund shares repurchased | | | 270 | |
| Transfer agency fees payable (Note 8) | | | 212,241 | |
| Custody fees payable | | | 20,140 | |
| Distribution fee payable (Note 8) | | | 19,975 | |
| Shareholder Servicing fees payable (Note 8) | | | 8,411 | |
| Accrued expenses and other liabilities | | | 1,090,179 | |
| TOTAL LIABILITIES | | | 63,020,886 | |
| COMMITMENTS AND CONTINGENCIES (Note 2) | | | | |
| NET ASSETS | | $ | 313,986,081 | |
| | | | | |
| NET ASSETS CONSIST OF | | | | |
| Paid-in capital | | $ | 320,660,547 | |
| Accumulated earnings | | | (6,674,466 | ) |
| NET ASSETS | | $ | 313,986,081 | |
See Notes to Consolidated Financial Statements.
| CIM Real Assets & Credit Fund | Consolidated Statement of Assets and Liabilities |
| | September 30, 2023 |
| PRICING OF SHARES | | | | |
| Class A | | | | |
| Net Assets | | $ | 10,364,407 | |
| Shares of beneficial interest outstanding (unlimited number of authorized shares, no par value common stock authorized) | | | 424,355 | |
| Net asset value | | $ | 24.42 | |
| Maximum offering price per share (Maximum sales load of 5.75%) | | $ | 25.91 | |
| Class C | | | | |
| Net Assets | | | | |
| Shares of beneficial interest outstanding (unlimited number of authorized shares, no par value common stock authorized) | | $ | 12,302,623 | |
| Net asset value (a) | | | 518,546 | |
| Maximum offering price per share | | $ | 23.73 | |
| Class I | | | | |
| Net Assets | | $ | 290,728,226 | |
| Shares of beneficial interest outstanding (unlimited number of authorized shares, no par value common stock authorized) | | | 11,824,907 | |
| Net asset value | | $ | 24.59 | |
| Maximum offering price per share | | | | |
| Class L | | | | |
| Net Assets | | $ | 590,825 | |
| Shares of beneficial interest outstanding (unlimited number of authorized shares, no par value common stock authorized) | | | 24,478 | |
| Net asset value | | $ | 24.14 | |
| Maximum offering price per share (Maximum sales load of 4.25%) | | $ | 25.21 | |
| (a) | Subject to early-withdrawal charge. Redemption price varies based on length of time held (Note 2). |
See Notes to Consolidated Financial Statements.
| CIM Real Assets & Credit Fund | Consolidated Statement of Operations |
| | For the Year Ended September 30, 2023 |
| INVESTMENT INCOME | | | | |
| Interest income | | $ | 30,284,888 | |
| Income from affiliated investments | | | 2,351,186 | |
| Total Investment Income | | | 32,636,074 | |
| | | | | |
| EXPENSES | | | | |
| Management fees (Note 8) | | | 4,482,850 | |
| Incentive Fees (Note 8) | | | 3,897,500 | |
| Shareholder Servicing fees (Note 8) | | | | |
| Class A | | | 18,878 | |
| Class C | | | 29,006 | |
| Class L | | | 934 | |
| Distribution fees (Note 8) | | | | |
| Class C | | | 87,019 | |
| Class L | | | 934 | |
| Networking fees | | | | |
| Class I | | | 348,447 | |
| Interest expense (Note 7) | | | 3,267,891 | |
| Administrative fees (Note 8) | | | 2,753,343 | |
| Professional fees | | | 1,205,783 | |
| Transfer agency fees (Note 8) | | | 200,022 | |
| Trustees fees (Note 8) | | | 289,493 | |
| Printing fees | | | 234,123 | |
| Taxes | | | 159,125 | |
| Custody fees | | | 117,998 | |
| State Registration fees | | | 61,494 | |
| Insurance fees | | | 30,879 | |
| Other expenses | | | 870,533 | |
| Total Expenses | | | 18,056,252 | |
| Expenses reimbursed by Advisor (Note 8) | | | (4,024,557 | ) |
| Net Expenses | | | 14,031,695 | |
| Net Investment Income | | | 18,604,379 | |
| Net realized gain on investments | | | 575,609 | |
| Net realized loss on total return swap contracts | | | (224,905 | ) |
| Net change in unrealized depreciation on affiliated investments | | | (10,956,654 | ) |
| Net change in unrealized depreciation on unaffiliated investments | | | (12,387,359 | ) |
| Net change in unrealized appreciation on total return swap contracts | | | 3,298,067 | |
| NET REALIZED AND UNREALIZED LOSS ON INVESTMENTS | | | (19,695,242 | ) |
| NET DECREASE IN NET ASSETS RESULTING FROM OPERATIONS | | $ | (1,090,863 | ) |
See Notes to Consolidated Financial Statements.
| CIM Real Assets & Credit Fund | Consolidated Statements of Changes in Net Assets |
| | | For the Fiscal | | | For the Fiscal | |
| | | Year Ended | | | Year Ended | |
| | | September 30, 2023 | | | September 30, 2022 | |
| OPERATIONS | | | | | | | | |
| Net investment income | | $ | 18,604,379 | | | $ | 8,524,523 | |
| Net realized gain on investments and total return swap contracts | | | 350,704 | | | | 68,711 | |
| Net change in unrealized appreciation (depreciation) on unaffiliated investments, affiliated investments and total return swap contracts | | | (20,045,946 | ) | | | 638,440 | |
| Net increase/(decrease) in net assets resulting from operations | | | (1,090,863 | ) | | | 9,231,674 | |
| | | | | | | | | |
| DISTRIBUTIONS TO SHAREHOLDERS | | | | | | | | |
| Class A | | | | | | | | |
| From distributable earnings | | | (332,416 | ) | | | (89,655 | ) |
| From return of capital | | | (217,258 | ) | | | (94,765 | ) |
| Class C | | | | | | | | |
| From distributable earnings | | | (439,865 | ) | | | (223,307 | ) |
| From return of capital | | | (302,280 | ) | | | (236,035 | ) |
| Class I | | | | | | | | |
| From distributable earnings | | | (10,757,554 | ) | | | (4,948,719 | ) |
| From return of capital | | | (7,127,153 | ) | | | (5,230,796 | ) |
| Class L | | | | | | | | |
| From distributable earnings | | | (21,890 | ) | | | (10,720 | ) |
| From return of capital | | | (14,933 | ) | | | (11,331 | ) |
| Net Decrease in Net Assets from Distributions to Shareholders | | | (19,213,349 | ) | | | (10,845,328 | ) |
| | | | | | | | | |
| BENEFICIAL INTEREST TRANSACTIONS | | | | | | | | |
| Class A | | | | | | | | |
| Shares sold | | | 4,978,302 | | | | 5,209,584 | |
| Distribution reinvested | | | 266,811 | | | | 89,513 | |
| Shares repurchased | | | (532,675 | ) | | | (145,501 | ) |
| Class C | | | | | | | | |
| Shares sold | | | 5,196,744 | | | | 6,025,825 | |
| Distribution reinvested | | | 321,991 | | | | 250,889 | |
| Shares repurchased, net of redemption fees (Note 2) | | | (1,840,067 | ) | | | (2,572,168 | ) |
| Class I | | | | | | | | |
| Shares sold | | | 99,671,901 | | | | 192,301,288 | |
| Distribution reinvested | | | 4,737,505 | | | | 3,093,698 | |
| Shares repurchased | | | (53,518,094 | ) | | | (16,586,596 | ) |
| Class L | | | | | | | | |
| Shares sold | | | 42,609 | | | | 479,875 | |
| Distribution reinvested | | | 6,409 | | | | 491 | |
| Net Increase in Net Assets Derived from Beneficial Interest Transactions | | | 59,331,436 | | | | 188,146,898 | |
| Net increase in net assets | | | 39,027,224 | | | | 186,533,244 | |
| | | | | | | | | |
| NET ASSETS | | | | | | | | |
| Beginning of Year | | | 274,958,857 | | | | 88,425,613 | |
| End of Year | | $ | 313,986,081 | | | $ | 274,958,857 | |
See Notes to Consolidated Financial Statements.
| CIM Real Assets & Credit Fund | Consolidated Statements of Changes in Net Assets |
| | | For the Fiscal | | | For the Fiscal | |
| | | Year Ended | | | Year Ended | |
| | | September 30, 2023 | | | September 30, 2022 | |
| Other Information | | | | | | | | |
| Class A: | | | | | | | | |
| Beginning shares | | | 239,584 | | | | 42,619 | |
| Shares sold | | | 195,366 | | | | 199,238 | |
| Distribution reinvested | | | 10,535 | | | | 3,440 | |
| Shares repurchased | | | (21,130 | ) | | | (5,713 | ) |
| Net Increase in Shares Outstanding | | | 184,771 | | | | 196,965 | |
| Ending shares | | | 424,355 | | | | 239,584 | |
| Class C | | | | | | | | |
| Beginning shares | | | 372,331 | | | | 228,241 | |
| Shares sold | | | 206,769 | | | | 233,571 | |
| Distribution reinvested | | | 12,984 | | | | 9,737 | |
| Shares repurchased | | | (73,538 | ) | | | (99,218 | ) |
| Net Increase in Shares Outstanding | | | 146,215 | | | | 144,090 | |
| Ending shares | | | 518,546 | | | | 372,331 | |
| Class I: | | | | | | | | |
| Beginning shares | | | 9,848,041 | | | | 3,060,662 | |
| Shares Sold | | | 3,878,370 | | | | 7,308,078 | |
| Distribution reinvested | | | 185,092 | | | | 118,042 | |
| Shares Repurchased | | | (2,086,596 | ) | | | (638,741 | ) |
| Net Increase in Shares Outstanding | | | 1,976,866 | | | | 6,787,379 | |
| Ending shares | | | 11,824,907 | | | | 9,848,041 | |
| Class L: | | | | | | | | |
| Beginning shares | | | 22,504 | | | | 4,000 | |
| Shares Sold | | | 1,720 | | | | 18,485 | |
| Distribution reinvested | | | 254 | | | | 19 | |
| Net Increase in Shares Outstanding | | | 1,974 | | | | 18,504 | |
| Ending shares | | | 24,478 | | | | 22,504 | |
See Notes to Consolidated Financial Statements.
| CIM Real Assets & Credit Fund | Consolidated Statement of Cash Flows |
| | For the Year Ended September 30, 2023 |
| Cash Flows From Operating Activities | | | | |
| Net decrease in net assets resulting from operations | | $ | (1,090,863 | ) |
| Adjustments to reconcile net decrease in net assets resulting from operations to net cash used in operating activities: | | | | |
| Purchase of investments | | | (114,673,576 | ) |
| Proceeds from sales of investments | | | 21,005,243 | |
| Net purchases from short-term investments | | | (11,833,832 | ) |
| Net realized gain from investments | | | (575,609 | ) |
| Net realized losses on total return swap contracts | | | 224,905 | |
| Net change in unrealized depreciation on investments | | | 12,387,359 | |
| Net change in unrealized depreciation on affiliated investments | | | 10,956,654 | |
| Net change in unrealized appreciation on total return swap contracts | | | (3,298,067 | ) |
| Accretion and amortization of discounts and premiums, net | | | 544,389 | |
| (Increase)/Decrease in Assets: | | | | |
| Prepaid expenses and other assets | | | 1,013,500 | |
| Interest receivable | | | (893,052 | ) |
| Increase/(Decrease) in Liabilities: | | | | |
| Due to Adviser | | | 275,295 | |
| Professional fees payable | | | (165,129 | ) |
| Administration fees payable | | | 199,171 | |
| Transfer agency fees payable | | | 48,625 | |
| Distribution fee payable | | | 14,118 | |
| Shareholder servicing fee payable | | | 5,151 | |
| Accrued expenses and other liabilities | | | 208,790 | |
| Custody fees payable | | | (4,102 | ) |
| Trustees’ fees payable | | | 82,500 | |
| Net cash used in operating activities | | | (85,568,530 | ) |
| | | | | |
| Cash Flows from Financing Activities: | | | | |
| Lines of Credit borrowings | | | 45,000,000 | |
| Proceeds from Shares sold | | | 110,457,544 | |
| Payment of Shares repurchased | | | (55,890,566 | ) |
| Cash distributions paid | | | (13,880,633 | ) |
| Net cash provided by financing activities | | | 85,686,345 | |
| | | | | |
| Net Change in Cash and Cash Equivalents | | | 117,815 | |
| | | | | |
| Cash and Cash Equivalents, beginning of year | | $ | 22,573,497 | |
| Cash and Cash Equivalents, end of year | | $ | 22,691,312 | |
| | | | | |
| Non-cash financing activities herein consist of reinvestment of distributions of: | | $ | 5,332,716 | |
| Cash paid during the period for interest from bank borrowing: | | $ | 3,275,461 | |
| | | | | |
| RECONCILIATION OF RESTRICTED AND UNRESTRICTED CASH AT THE BEGINNING OF YEAR TO THE STATEMENT OF ASSETS AND LIABILITIES | | | | |
| Cash | | $ | 1,983,729 | |
| Cash collateral for total return swaps | | $ | 20,589,768 | |
| Total | | $ | 22,573,497 | |
| RECONCILIATION OF RESTRICTED AND UNRESTRICTED CASH AT THE END OF YEAR TO THE STATEMENT OF ASSETS AND LIABILITIES | | | | |
| Cash | | $ | 1,212,343 | |
| Cash collateral for total return swaps | | $ | 21,478,969 | |
| Total | | $ | 22,691,312 | |
See Notes to Consolidated Financial Statements.
| CIM Real Assets & Credit Fund | Consolidated Financial Highlights |
| | For a Share of Outstanding Throughout the Periods Presented |
Class A
| | | | | | | | | | | | For the Period | |
| | | | | | | | | | | | May 5, 2020 | |
| | | For the | | | For the | | | For the | | | (Commencement | |
| | | Year Ended | | | Year Ended | | | Year Ended | | | of Operations) to | |
| | | September 30, 2023 | | | September 30, 2022 | | | September 30, 2021 | | | September 30, 2020 | |
| Net asset value, beginning of period | | $ | 26.11 | | | $ | 26.45 | | | $ | 25.16 | | | $ | 25.00 | |
| | | | | | | | | | | | | | | | | |
| INCOME FROM INVESTMENT OPERATIONS | | | | | | | | | | | | | | | | |
| Net investment income (a) | | | 1.53 | | | | 1.20 | | | | 0.91 | | | | 0.20 | |
| Net realized and unrealized gain/(loss) | | | (1.58 | ) | | | 0.02 | | | | 1.91 | | | | 0.46 | |
| Total from investment operations | | | (0.05 | ) | | | 1.22 | | | | 2.82 | | | | 0.66 | |
| | | | | | | | | | | | | | | | | |
| DISTRIBUTIONS | | | | | | | | | | | | | | | | |
| From net investment income | | | (0.99 | ) | | | (0.78 | ) | | | (0.99 | ) | | | (0.50 | ) |
| From net realized gain on investments | | | — | | | | — | | | | (0.36 | ) | | | — | |
| Return of Capital | | | (0.65 | ) | | | (0.78 | ) | | | (0.18 | ) | | | — | |
| Total distributions | | | (1.64 | ) | | | (1.56 | ) | | | (1.53 | ) | | | (0.50 | ) |
| | | | | | | | | | | | | | | | | |
| Net increase/(decrease) in net asset value | | | (1.69 | ) | | | (0.34 | ) | | | 1.29 | | | | 0.16 | |
| Net asset value, end of period | | $ | 24.42 | | | $ | 26.11 | | | $ | 26.45 | | | $ | 25.16 | |
| TOTAL RETURN (b) | | | (0.26 | )% (h) | | | 4.78 | % | | | 11.60 | % | | | 2.67 | % |
| | | | | | | | | | | | | | | | | |
| RATIOS/SUPPLEMENTAL DATA | | | | | | | | | | | | | | | | |
| Net assets, end of period (000s) | | $ | 10,364 | | | $ | 6,256 | | | $ | 1,127 | | | $ | 101 | |
| | | | | | | | | | | | | | | | | |
| Ratios to Average Net Assets | | | | | | | | | | | | | | | | |
| Ratio of expenses to average net assets excluding fee waivers and reimbursements | | | 6.23 | % (d) | | | 3.76 | % | | | 9.94 | % | | | 45.26 | % (c) |
| Ratio of expenses to average net assets including fee waivers and reimbursements | | | 4.94 | % (d) | | | 2.50 | % | | | 1.74 | % (f) | | | 1.00 | % (e)(f) |
| Ratio of net investment income to average net assets including fee waivers and reimbursements | | | 6.01 | % | | | 4.60 | % | | | 3.53 | % | | | 1.94 | % (e) |
| Portfolio Turnover Rate | | | 9 | % | | | 11 | % | | | 122 | % | | | 1 | % (g) |
| (a) | Calculated using the average shares method. |
| (b) | Total returns have not been annualized and do not reflect the impact of sales load. Total returns would have been lower had certain expenses not been waived or reimbursed during the period. Returns shown do not reflect the deduction of taxes that a shareholder would pay on Fund distributions or redemption of Fund shares. |
| (c) | These ratios to average net assets have been annualized except for the non-recurring offering and organizational expenses which have not been annualized. |
| (d) | The ratio includes the incentive fee incurred during the year ended September 30, 2023. |
| (f) | The Adviser waived the management fees from commencement of operations May 5, 2020 to June 30, 2021. Without this waiver the net expense ratio would have been 2.50%. |
| (h) | Includes adjustments in accordance with accounting principles generally accepted in the United States and, consequently, the net asset values for financial reporting purposes and the returns based upon those net asset values may differ from the net asset values and returns for shareholder transactions. |
See Notes to Consolidated Financial Statements.
| CIM Real Assets & Credit Fund | Consolidated Financial Highlights |
| | For a Share of Outstanding Throughout the Periods Presented |
Class C
| | | | | | | | | | | | For the Period | |
| | | | | | | | | | | | May 5, 2020 | |
| | | For the | | | For the | | | For the | | | (Commencement | |
| | | Year Ended | | | Year Ended | | | Year Ended | | | of Operations) to | |
| | | September 30, 2023 | | | September 30, 2022 | | | September 30, 2021 | | | September 30, 2020 | |
| Net asset value, beginning of period | | $ | 25.63 | | | $ | 26.16 | | | $ | 25.08 | | | $ | 25.00 | |
| | | | | | | | | | | | | | | | | |
| INCOME FROM INVESTMENT OPERATIONS | | | | | | | | | | | | | | | | |
| Net investment income (a) | | | 1.31 | | | | 0.90 | | | | 0.70 | | | | 0.22 | |
| Net realized and unrealized gain/(loss) | | | (1.61 | ) | | | 0.11 | | | | 1.90 | | | | 0.36 | |
| Total from investment operations | | | (0.30 | ) | | | 1.01 | | | | 2.60 | | | | 0.58 | |
| | | | | | | | | | | | | | | | | |
| DISTRIBUTIONS | | | | | | | | | | | | | | | | |
| From net investment income | | | (0.95 | ) | | | (0.77 | ) | | | (0.98 | ) | | | (0.50 | ) |
| From net realized gain on investments | | | — | | | | — | | | | (0.36 | ) | | | — | |
| Return of Capital | | | (0.65 | ) | | | (0.77 | ) | | | (0.18 | ) | | | — | |
| Total distributions | | | (1.60 | ) | | | (1.54 | ) | | | (1.52 | ) | | | (0.50 | ) |
| | | | | | | | | | | | | | | | | |
| Net increase/(decrease) in net asset value | | | (1.90 | ) | | | (0.53 | ) | | | 1.08 | | | | 0.08 | |
| Net asset value, end of period | | $ | 23.73 | | | $ | 25.63 | | | $ | 26.16 | | | $ | 25.08 | |
| TOTAL RETURN (b) | | | (1.26 | )% (h) | | | 4.05 | % | | | 10.73 | % | | | 2.35 | % |
| | | | | | | | | | | | | | | | | |
| RATIOS/SUPPLEMENTAL DATA | | | | | | | | | | | | | | | | |
| Net assets, end of period (000s) | | $ | 12,303 | | | $ | 9,543 | | | $ | 5,972 | | | $ | 572 | |
| | | | | | | | | | | | | | | | | |
| Ratios to Average Net Assets | | | | | | | | | | | | | | | | |
| Ratio of expenses to average net assets excluding fee waivers and reimbursements | | | 6.94 | % (d) | | | 4.57 | % | | | 11.49 | % | | | 44.33 | % (c) |
| Ratio of expenses to average net assets including fee waivers and reimbursements | | | 5.66 | % (d) | | | 3.25 | % | | | 2.48 | % (f) | | | 1.75 | % (e)(f) |
| Ratio of net investment income to average net assets including fee waivers and reimbursements | | | 5.25 | % | | | 3.50 | % | | | 2.73 | % | | | 2.20 | % (e) |
| Portfolio Turnover Rate | | | 9 | % | | | 11 | % | | | 122 | % | | | 1 | % (g) |
| (a) | Calculated using the average shares method. |
| (b) | Total returns have not been annualized. Total returns would have been lower had certain expenses not been waived or reimbursed during the period. Returns shown do not reflect the deduction of taxes that a shareholder would pay on Fund distributions or redemption of Fund shares. |
| (c) | These ratios to average net assets have been annualized except for the non-recurring offering and organizational expenses which have not been annualized. |
| (d) | The ratio includes the incentive fee incurred during the year ended September 30, 2023. |
| (f) | The Adviser waived the management fees from commencement of operations May 5, 2020 to June 30, 2021. Without this waiver the net expense ratio would have been 2.50%. |
| (h) | Includes adjustments in accordance with accounting principles generally accepted in the United States and, consequently, the net asset values for financial reporting purposes and the returns based upon those net asset values may differ from the net asset values and returns for shareholder transactions. |
See Notes to Consolidated Financial Statements.
| CIM Real Assets & Credit Fund | Consolidated Financial Highlights |
| | For a Share of Outstanding Throughout the Periods Presented |
Class I
| | | | | | | | | | | | For the Period | |
| | | | | | | | | | | | May 5, 2020 | |
| | | For the | | | For the | | | For the | | | (Commencement | |
| | | Year Ended | | | Year Ended | | | Year Ended | | | of Operations) to | |
| | | September 30, 2023 | | | September 30, 2022 | | | September 30, 2021 | | | September 30, 2020 | |
| Net asset value, beginning of period | | $ | 26.26 | | | $ | 26.54 | | | $ | 25.18 | | | $ | 25.00 | |
| | | | | | | | | | | | | | | | | |
| INCOME FROM INVESTMENT OPERATIONS | | | | | | | | | | | | | | | | |
| Net investment income (a) | | | 1.60 | | | | 1.21 | | | | 0.99 | | | | 0.23 | |
| Net realized and unrealized gain/(loss) | | | (1.62 | ) | | | 0.08 | | | | 1.90 | | | | 0.45 | |
| Total from investment operations | | | (0.02 | ) | | | 1.29 | | | | 2.89 | | | | 0.68 | |
| | | | | | | | | | | | | | | | | |
| DISTRIBUTIONS | | | | | | | | | | | | | | | | |
| From net investment income | | | (1.00 | ) | | | (0.78 | ) | | | (0.99 | ) | | | (0.50 | ) |
| From net realized gain on investments | | | — | | | | — | | | | (0.36 | ) | | | — | |
| Return of Capital | | | (0.65 | ) | | | (0.79 | ) | | | (0.18 | ) | | | — | |
| Total distributions | | | (1.65 | ) | | | (1.57 | ) | | | (1.53 | ) | | | (0.50 | ) |
| | | | | | | | | | | | | | | | | |
| Net increase/(decrease) in net asset value | | | (1.67 | ) | | | (0.28 | ) | | | 1.36 | | | | 0.18 | |
| Net asset value, end of period | | $ | 24.59 | | | $ | 26.26 | | | $ | 26.54 | | | $ | 25.18 | |
| TOTAL RETURN (b) | | | (0.15 | )% (h) | | | 5.04 | % | | | 11.88 | % | | | 2.75 | % |
| | | | | | | | | | | | | | | | | |
| RATIOS/SUPPLEMENTAL DATA | | | | | | | | | | | | | | | | |
| Net assets, end of period (000s) | | $ | 290,728 | | | $ | 258,576 | | | $ | 81,221 | | | $ | 6,259 | |
| | | | | | | | | | | | | | | | | |
| Ratios to Average Net Assets | | | | | | | | | | | | | | | | |
| Ratio of expenses to average net assets excluding fee waivers and reimbursements | | | 5.97 | % (d) | | | 3.60 | % | | | 9.98 | % | | | 44.53 | % (c) |
| Ratio of expenses to average net assets including fee waivers and reimbursements | | | 4.62 | % (d) | | | 2.25 | % | | | 1.48 | % (f) | | | 0.75 | % (e)(f) |
| Ratio of net investment income to average net assets including fee waivers and reimbursements | | | 6.24 | % | | | 4.60 | % | | | 3.86 | % | | | 2.29 | % (e) |
| Portfolio Turnover Rate | | | 9 | % | | | 11 | % | | | 122 | % | | | 1 | % (g) |
| (a) | Calculated using the average shares method. |
| (b) | Total returns have not been annualized. Total returns would have been lower had certain expenses not been waived or reimbursed during the period. Returns shown do not reflect the deduction of taxes that a shareholder would pay on Fund distributions or redemption of Fund shares. |
| (c) | These ratios to average net assets have been annualized except for the non-recurring offering and organizational expenses which have not been annualized. |
| (d) | The ratio includes the incentive fee incurred during the year ended September 30, 2023. |
| (f) | The Adviser waived the management fees from commencement of operations May 5, 2020 to June 30, 2021. Without this waiver the net expense ratio would have been 2.50%. |
| (h) | Includes adjustments in accordance with accounting principles generally accepted in the United States and, consequently, the net asset values for financial reporting purposes and the returns based upon those net asset values may differ from the net asset values and returns for shareholder transactions. |
See Notes to Consolidated Financial Statements.
| CIM Real Assets & Credit Fund | Consolidated Financial Highlights |
| | For a Share of Outstanding Throughout the Periods Presented |
Class L
| | | | | | | | | | | | For the Period | |
| | | | | | | | | | | | May 5, 2020 | |
| | | For the | | | For the | | | For the | | | (Commencement | |
| | | Year Ended | | | Year Ended | | | Year Ended | | | of Operations) to | |
| | | September 30, 2023 | | | September 30, 2022 | | | September 30, 2021 | | | September 30, 2020 | |
| Net asset value, beginning of period | | $ | 25.93 | | | $ | 26.35 | | | $ | 25.13 | | | $ | 25.00 | |
| | | | | | | | | | | | | | | | | |
| INCOME FROM INVESTMENT OPERATIONS | | | | | | | | | | | | | | | | |
| Net investment income (a) | | | 1.45 | | | | 1.06 | | | | 0.95 | | | | 0.17 | |
| Net realized and unrealized gain/(loss) | | | (1.61 | ) | | | 0.08 | | | | 1.79 | | | | 0.46 | |
| Total from investment operations | | | (0.16 | ) | | | 1.14 | | | | 2.74 | | | | 0.63 | |
| | | | | | | | | | | | | | | | | |
| DISTRIBUTIONS | | | | | | | | | | | | | | | | |
| From net investment income | | | (0.98 | ) | | | (0.78 | ) | | | (0.98 | ) | | | (0.50 | ) |
| From net realized gain on investments | | | — | | | | — | | | | (0.36 | ) | | | — | |
| Return of Capital | | | (0.65 | ) | | | (0.78 | ) | | | (0.18 | ) | | | — | |
| Total distributions | | | (1.63 | ) | | | (1.56 | ) | | | (1.52 | ) | | | (0.50 | ) |
| | | | | | | | | | | | | | | | | |
| Net increase/(decrease) in net asset value | | | (1.79 | ) | | | (0.42 | ) | | | 1.22 | | | | 0.13 | |
| Net asset value, end of period | | $ | 24.14 | | | $ | 25.93 | | | $ | 26.35 | | | $ | 25.13 | |
| TOTAL RETURN (b) | | | (0.71 | )% (h) | | | 4.51 | % | | | 11.31 | % | | | 2.55 | % |
| | | | | | | | | | | | | | | | | |
| RATIOS/SUPPLEMENTAL DATA | | | | | | | | | | | | | | | | |
| Net assets, end of period (000s) | | $ | 591 | | | $ | 584 | | | $ | 105 | | | $ | 101 | |
| | | | | | | | | | | | | | | | | |
| Ratios to Average Net Assets | | | | | | | | | | | | | | | | |
| Ratio of expenses to average net assets excluding fee waivers and reimbursements | | | 6.22 | % (d) | | | 4.08 | % | | | 17.63 | % | | | 45.51 | % (c) |
| Ratio of expenses to average net assets including fee waivers and reimbursements | | | 5.10 | % (d) | | | 2.75 | % | | | 1.59 | % (f) | | | 1.25 | % (e)(f) |
| Ratio of net investment income to average net assets including fee waivers and reimbursements | | | 5.75 | % | | | 4.10 | % | | | 3.73 | % | | | 1.68 | % (e) |
| Portfolio Turnover Rate | | | 9 | % | | | 11 | % | | | 122 | % | | | 1 | % (g) |
| (a) | Calculated using the average shares method. |
| (b) | Total returns have not been annualized. Total returns would have been lower had certain expenses not been waived or reimbursed during the period. Returns shown do not reflect the deduction of taxes that a shareholder would pay on Fund distributions or redemption of Fund shares. |
| (c) | These ratios to average net assets have been annualized except for the non-recurring offering and organizational expenses which have not been annualized. |
| (d) | The ratio includes the incentive fee incurred during the year ended September 30, 2023. |
| (f) | The Adviser waived the management fees from commencement of operations May 5, 2020 to June 30, 2021. Without this waiver the net expense ratio would have been 2.50%. |
| (h) | Includes adjustments in accordance with accounting principles generally accepted in the United States and, consequently, the net asset values for financial reporting purposes and the returns based upon those net asset values may differ from the net asset values and returns for shareholder transactions. |
See Notes to Consolidated Financial Statements.
| CIM Real Assets & Credit Fund | Consolidated Notes to Financial Statements |
| | September 30, 2023 |
| | |
NOTE 1 – Organization and Registration
CIM Real Assets & Credit Fund (the “Fund”), a Delaware statutory trust, is a non-diversified, closed-end management investment company, registered under the Investment Company Act of 1940, as amended (the “1940 Act”). The Fund engages in a continuous offering of shares and operates as an interval fund that offers to make quarterly repurchases of shares at net asset value (“NAV”). The Fund’s investment objective is to generate current income through cash distributions and preserve shareholders’ capital across various market cycles, with a secondary objective of capital appreciation.
The Fund’s investment adviser is CIM Capital IC Management, LLC, a Delaware limited liability company (the “Adviser”) that is registered as an investment adviser with the U.S. Securities and Exchange Commission (the “SEC”) under the Investment Advisers Act of 1940, as amended (the “Advisers Act”). The Adviser is primarily responsible for determining the amount of the Fund’s total assets that are allocated to each of the Fund’s sub-advisers, and will review such allocation percentage on an ongoing basis and adjust the allocation percentage as necessary to best achieve the Fund’s investment objective.
The Adviser has engaged CIM Capital SA Management, LLC, a Delaware limited liability company (the “CIM Sub-Adviser”) that is registered as an investment adviser with the SEC under the Advisers Act, to act as an investment sub-adviser to the Fund. The CIM Sub-Adviser is an indirectly wholly- owned subsidiary of CIM Group Management, LLC and is an affiliate of the Adviser. The CIM Sub-Adviser is responsible for identifying and sourcing investment opportunities with respect to real assets held by the Fund. The Fund defines “real assets” as assets issued by issuers where the underlying interests are investments in real estate or infrastructure (“Real Assets”).The Fund’s investments in Real Assets will consist of (1) direct real estate that may be held through one or more wholly-owned subsidiary, (2) public real estate investment trusts (“REITs”) (including publicly-traded REITs and publicly registered and non-listed REITs) and private REITs, (3) real estate mortgages, (4) commercial mortgage-backed securities (“CMBS”) and (5) infrastructure assets. The Fund’s investments in Real Assets will generally consist of Real Assets in qualified communities throughout the United States (“Qualified Communities”). In addition to its Real Assets located in the United States, the Fund invests in Real Assets located in foreign countries (including real estate debt or mortgages backed by real estate in foreign countries). The Fund will limit its foreign Real Assets investments to Real Assets located in Canada, and countries in Western Europe, Central America or South America and may invest in emerging markets countries located in those regions. The Fund will limit its foreign investments to 10% of its total assets. There is no minimum allocation to foreign investments and, at times, the Fund may hold only U.S. investments. The Fund has formed a wholly-owned subsidiary that has elected to be taxed as a REIT (the “REIT Subsidiary”). Certain of the Fund’s Real Assets are held through the REIT Subsidiary.
The Adviser has also engaged OFS Capital Management, LLC, a Delaware limited liability company (the “OFS Sub-Adviser”, and, together with the CIM Sub-Adviser, the “Sub-Advisers”) that is registered as an investment adviser with the SEC under the Advisers Act, to act as an investment sub-adviser to the Fund. The OFS Sub-Adviser is a wholly-owned subsidiary of Orchard First Source Asset Management, LLC, and is an affiliate of the Adviser. The OFS Sub-Adviser is responsible for identifying and sourcing credit and credit-related investment opportunities (“Credit and Credit-Related Investments”) as well as investments in CMBS. The Fund intends for its Credit and Credit-Related Investments to consist of (1) investments in floating and fixed rate loans; (2) broadly syndicated senior secured corporate loans; (3) investments in the debt and equity tranches of collateralized loan obligations (“CLOs”) and CLO warehouses; and (4) opportunistic credit investments, by which the Fund means stressed and distressed credit situations, restructurings and non-performing loans.
The Fund was organized as a statutory trust on February 4, 2019 under the laws of the State of Delaware. The Fund had no operations from that date through May 4, 2020 other than those relating to organizational matters and the registration of its shares under applicable securities laws.
On May 5, 2020, the Fund commenced a continuous public offering of Class I Common Shares (the “Class I Shares”), Class A Common Shares (the “Class A Shares”), Class C Common Shares (the “Class C Shares”) and Class L Common Shares (the “Class L Shares”). The Fund has received exemptive relief from the SEC to permit the Fund to issue multiple classes of shares and to impose asset-based distribution fees and early withdrawal charges.1 The Adviser and its affiliates own shares in the Fund representing 2.8% of the NAV as of September 30, 2023.
Class C Shares and Class I Shares are offered on a continuous basis at NAV. Class C Shares are subject to a 1.00% early withdrawal charge. Class A Shares are offered at NAV plus a maximum sales load of 5.75% of the offering price. Class L Shares are offered at NAV plus a maximum sales load of 4.25% of the offering price. Each class represents an interest in the same assets of the Fund and classes are identical except for differences in their sales charge structures, ongoing service and distribution charges and early withdrawal charges. All classes of shares have equal voting privileges except that each class has exclusive voting rights with respect to its service and/or distribution plans, and other matters that exclusively affect such class, and separate voting rights on any matter submitted to shareholders in which the interests of one class differ from the interests of any other class. The Fund’s income, expenses (other than class-specific distribution fees) and realized and unrealized gains and losses are allocated proportionately each day based upon the relative net assets of each class. Class specific expenses, where applicable, include distribution fees, shareholder servicing fees and networking fees.
| 1 | (CIM Real Assets & Credit Fund, et al. (File No. 812-15001, Release No. IC-33659 (Oct. 22, 2019) (order), Release No. IC-33630 (Sep. 23, 2019) (notice)) |
| CIM Real Assets & Credit Fund | Consolidated Notes to Financial Statements |
| | September 30, 2023 |
| | |
NOTE 2 – Significant Accounting Policies
The following is a summary of significant accounting policies followed by the Fund in preparation of its financial statements. The policies are in conformity with accounting principles generally accepted in the United States of America (“U.S. GAAP”). The Fund is an investment company and, accordingly, follows the investment company accounting and reporting guidance of the Financial Accounting Standards Board Accounting Standards Codification (“ASC”) Topic 946 - Investment Companies. The consolidated financial statements include the accounts of the Fund and its wholly-owned subsidiaries. All intercompany balances and transactions have been eliminated in consolidation.
Use of Estimates
The preparation of the financial statements in accordance with U.S. GAAP requires management to make estimates and assumptions that affect the reported amounts of assets and liabilities and disclosure of contingent assets and liabilities at the date of the financial statements. Actual results could differ from these estimates.
Portfolio Valuation
The Fund determines the NAV per each class of Common Shares on each day that the New York Stock Exchange (“NYSE”) is open for business as of the close of the regular trading session (normally, 4:00 pm eastern time). The Fund calculates NAV per Common Share on a class-specific basis, by dividing the total value of the Fund’s assets attributable to the applicable class by the total number of Common Shares of such class outstanding. The Fund’s assets are determined by subtracting any liabilities (including borrowings for investment purposes) from the total value of its portfolio investments and other assets.
Pursuant to Rule 2a-5 (“Rule 2a-5”) of the 1940 Act, the Board of Trustees (the “Board’) of the Fund has designated the Adviser as the “valuation designee” under Rule 2a-5, meaning that the Adviser values the Fund’s assets in good faith pursuant to valuation policies and procedures that were approved by the Board.
In accordance with ASC Topic 820 – Fair Value Measurement and Disclosures, and consistent with the valuation policy and procedures approved by the Board, portfolio securities and other assets for which market quotes are readily available are valued at market value. In circumstances where market quotes are not readily available, the Adviser, in accordance with Rule 2a-5, has adopted policies and procedures for determining the fair value of such securities and other assets.
Fair Value Measurements
In accordance with ASC Topic 820 – Fair Value Measurements and Disclosures, a three-tier fair value hierarchy has been established to classify fair value measurements for disclosure purposes. Inputs refer broadly to the assumptions that market participants would use in pricing the asset or liability, including assumptions about risk. Inputs may be observable or unobservable. Observable inputs reflect the assumptions market participants would use in pricing the asset or liability that are developed based on market data obtained from sources independent of the reporting entity. Unobservable inputs reflect the reporting entity’s own assumptions about the assumptions market participants would use in pricing the asset or liability that are developed based on the best information available.
Various inputs are used in determining the fair value of the Fund’s investments as of the end of the reporting period. When inputs used fall into different levels of the fair value hierarchy, the level in the hierarchy within which the fair value measurement falls is determined based on the lowest level input that is significant to the fair value measurement in its entirety.
These inputs are categorized in the following hierarchy under applicable financial accounting standards:
| Level 1 – | Inputs are quoted prices (unadjusted) in active markets for identical assets or liabilities that the Fund has the ability to access at the measurement date. An active market is defined as a market in which transactions for the assets or liabilities occur with sufficient frequency and volume to provide pricing information on an ongoing basis. |
| Level 2 – | Inputs include quoted prices for similar assets or liabilities in active markets, quoted prices for identical or similar assets or liabilities in markets that are not active (markets with few transactions), inputs other than quoted prices that are observable for the asset or liability (i.e., interest rates, yield curves etc.), and inputs that are derived principally from or corroborated by observable market data correlation or other means (market corroborated inputs). |
| Level 3 – | Unobservable inputs, which are only used to the extent that observable inputs are not available, reflect the Fund’s assumptions about the pricing of an asset or liability. |
| CIM Real Assets & Credit Fund | Consolidated Notes to Financial Statements |
| | September 30, 2023 |
| | |
The following is a summary of the values of the Fund’s investments based upon the hierarchy described above as of September 30, 2023:
| | | Level 1 - | | | Level 2 - | | | Level 3 - | | | | |
| | | Unadjusted | | | Other Significant | | | Significant | | | | |
| Investments in Securities at Value | | Quoted Prices | | | Observable Inputs | | | Unobservable Inputs | | | Total | |
| Common Stock | | $ | 1,572,793 | | | $ | — | | | $ | 6,789,080 | | | $ | 8,361,873 | |
| Bank Loans | | | — | | | | 5,024,351 | | | | 61,731,026 | | | | 66,755,377 | |
| Collateralized Loan Obligations - Debt | | | — | | | | 75,927,965 | | | | — | | | | 75,927,965 | |
| Collateralized Loan Obligations - Equity | | | — | | | | — | | | | 20,505,628 | | | | 20,505,628 | |
| Commercial Mortgaged-Backed Securities | | | — | | | | 59,108,107 | | | | 3,097,373 | | | | 62,205,480 | |
| Direct Real Estate | | | — | | | | — | | | | 64,344,433 | | | | 64,344,433 | |
| Loan Accumulation | | | — | | | | — | | | | 1,623,750 | | | | 1,623,750 | |
| Real Estate Related Securities | | | — | | | | — | | | | 24,057,756 | | | | 24,057,756 | |
| Warrants | | | — | | | | — | | | | 6,970 | | | | 6,970 | |
| Short Term Investments | | | 17,770,670 | | | | — | | | | — | | | | 17,770,670 | |
| | | $ | 19,343,463 | | | $ | 140,060,423 | | | $ | 182,156,016 | | | $ | 341,559,902 | |
| | | | | | | | | | | | | | | | | |
| Other Financial Instruments | | | | | | | | | | | | | | | | |
| Assets | | | | | | | | | | | | | | | | |
| Total Return Swap Contracts | | $ | — | | | $ | 422,397 | | | $ | 21,183 | | | $ | 443,580 | |
| Liabilities | | | | | | | | | | | | | | | | |
| Total Return Swap Contracts | | | — | | | | (2,150,109 | ) | | | (330,770 | ) | | | (2,480,879 | ) |
| Total | | | — | | | | (1,727,712 | ) | | | (309,587 | ) | | | (2,037,299 | ) |
| | | | | | | | | | | | | | | | | |
Transfers pertain primarily to the Fund’s bank loans that are classified as Level 2 or Level 3 depending on the number of market quotations or indicative prices from pricing services that are available, and whether the depth of the market is sufficient to transact those prices in amounts approximating the Fund’s investment position at the measurement date. To the extent a particular bank loan was previously classified at Level 2 but currently there is insufficient trading activities for such (or similar) bank loan to obtain market quotations or indicative prices from pricing services that are available during the relevant valuation period, such bank loan would be transferred to Level 3. Conversely, to the extent a particular bank loan was previously classified at Level 3 but currently there is sufficient trading activities for such (or similar) bank loan to obtain market quotations or indicative prices from pricing services that are available during the relevant valuation period, such bank loan would be transferred to Level 2.
The changes of the fair value of investments for which the Fund has used Level 3 inputs to determine the fair value are as follows:
| | | Balances | | | | | | | | | Change in | | | | | | | | | | | | | | | Balances | |
| | | as of | | | Accrued | | | Realized | | | Unrealized | | | | | | | | | Transfer | | | Transfer | | | as of | |
| | | September | | | Discount/ | | | Gain/ | | | Appreciation/ | | | | | | Sales | | | into | | | Out of | | | September | |
| Asset Type | | 30, 2022 | | | Premium | | | (Loss) | | | Depreciation | | | Purchases | | | Proceeds | | | Level 3 | | | Level 3 | | | 30, 2023 | |
| Common Stock | | $ | 4,742,838 | | | $ | 3,895 | | | $ | — | | | $ | 1,887,261 | | | $ | 155,086 | | | $ | — | | | $ | — | | | $ | — | | | $ | 6,789,080 | |
| Bank Loans | | | 51,991,401 | | | | 166,855 | | | | 42,015 | | | | (1,172,447 | ) | | | 19,945,598 | | | | (4,218,047 | ) | | | — | | | | (5,024,349 | ) | | $ | 61,731,026 | |
| Collateralized Loan Obligations -Equity | | | 22,816,896 | | | | (1,355,712 | ) | | | — | | | | (3,230,561 | ) | | | 2,275,005 | | | | — | | | | — | | | | — | | | $ | 20,505,628 | |
| Commercial Mortgaged-Backed Securities | | | 3,773,335 | | | | 62,785 | | | | (1,649 | ) | | | (350,558 | ) | | | 120,902 | | | | (507,442 | ) | | | — | | | | — | | | $ | 3,097,373 | |
| Direct Real Estate | | | 75,602,716 | | | | — | | | | — | | | | (23,668,272 | ) | | | 12,409,989 | | | | — | | | | — | | | | — | | | $ | 64,344,433 | |
| Loan Accumulation | | | 9,593,750 | | | | — | | | | — | | | | — | | | | 1,811,250 | | | | (9,781,250 | ) | | | — | | | | — | | | $ | 1,623,750 | |
| Real Estate Related Securities | | | 23,878,402 | | | | 83,580 | | | | — | | | | 91,248 | | | | 4,526 | | | | — | | | | — | | | | — | | | $ | 24,057,756 | |
| Warrants | | | 13,917 | | | | — | | | | — | | | | (6,947 | ) | | | — | | | | — | | | | — | | | | — | | | $ | 6,970 | |
| | | | 192,413,255 | | | $ | (1,038,597 | ) | | $ | 40,366 | | | $ | (26,450,276 | ) | | $ | 36,722,356 | | | $ | (14,506,739 | ) | | $ | — | | | $ | (5,024,349 | ) | | | 182,156,016 | |
| CIM Real Assets & Credit Fund | Consolidated Notes to Financial Statements |
| | September 30, 2023 |
| | |
The table below provides additional information about the Level 3 Fair Value Measurements as of September 30, 2023:
| | | | | | | | | | Range | | Weighted |
| Asset Class | | Fair Value | | | Valuation Technique | | Unobservable Inputs | | Minimum | | Maximum | | Average |
| Direct Real Estate | | $ | 64,344,433 | | | Income Approach | | Discount Rate | | 6.25% | | 7.75% | | 6.86% |
| | | | | | | | | Terminal Capitalization Rate | | 5.00% | | 6.25% | | 5.62% |
| Real Estate Related Securities | | | 24,057,756 | | | Discounted Cash Flows | | Discount Rate | | 1.80% | | 13.00% | | 6.06% |
| Commercial Mortgage-Backed Securities | | | 3,097,373 | | | Discounted Cash Flows | | Discount Rate | | 9.98% | | 11.95% | | 11.43% |
| Collateralized Loan Obligations - Equity | | | 20,505,628 | | | Discounted Cash Flows | | Discount Rate | | 18.00% | | 51.50% | | 21.78% |
| Bank Loans | | | 48,760,732 | | | Discounted Cash Flows | | Discount Rate | | 10.83% | | 19.31% | | 26.51% |
| Bank Loans | | | 12,970,294 | | | Third Party Pricing Service | | Broker Quote | | — | | — | | — |
| Loan Accumulation Facility | | | 1,623,750 | | | Market Approach | | Transaction Price | | — | | — | | — |
| Common Stock | | | 6,789,080 | | | Multiple Analysis | | EBITDA Multiple | | 6.57 | | 10.51 | | 9.58 |
| | | | | | | Market Approach | | Transaction Price | | 357.41 | | 486.19 | | 421.80 |
| Warrants | | | 6,970 | | | Black-Scholes | | Volatility | | 0.90% | | 0.94% | | 0.92% |
| Total | | $ | 182,156,016 | | | | | | | | | | | |
| | | | | | | | | | | | | | | |
The following is a reconciliation for the year ended September 30, 2023, of the total return swap contracts for which significant unobservable inputs (Level 3) were used in determining fair value:
| | | Total Return Swap Contracts | |
| Balance as of September 30, 2022 | | $ | (726,015 | ) |
| Change in unrealized appreciation/depreciation | | | (53,589 | ) |
| Purchased unrealized appreciation/depreciation | | | 19,894 | |
| Sold Unrealized appreciation/depreciation | | | 114,989 | |
| Transfers in of Unrealized appreciation/depreciation | | | (7,624 | ) |
| Transfers Out of unrealized appreciation/depreciation | | | 342,758 | |
| Ending Balance as of September 30, 2023 | | $ | (309,587 | ) |
| Net change in unrealized appreciation/depreciation attributed to Level 3 investments held at September 30, 2023 | | $ | (41,319 | ) |
| | | | | |
Cash
The Fund places its cash with two banking institutions, which are insured by the Federal Deposit Insurance Corporation (“FDIC”). The FDIC limit is $250,000. At various times throughout the year ended September 30, 2023, the amount on deposit exceeded the FDIC limit and subjected the Fund to credit risk. The Fund does not believe that such deposits are subject to any unusual risk associated with investment activities; however, If a depository institution fails to return these deposits or is otherwise subject to adverse conditions in the financial or credit markets, our access to such deposits could be limited, which could in turn adversely impact our short-term liquidity and our ability to meet our operating expenses or working capital needs.
Commitments and Contingencies
In the normal course of business, the Fund’s investment activities involve executions, settlement and financing of various transactions resulting in receivables from, and payables to, brokers, dealers and the Fund’s custodian. These activities may expose the Fund to risk in the event that such parties are unable to fulfill contractual obligations. Management does not anticipate any material losses from counterparties with whom it conducts business. Consistent with standard business practice, the Fund enters into contracts that contain a variety of representations and warranties and indemnification provisions and may engage from time to time in various legal actions. The maximum exposure of the Fund under these arrangements and activities is unknown as this would involve future claims that may be made against the Fund that have not yet occurred. However, the Fund expects the risk of material loss to be remote.
Income Tax
For U.S. federal income tax purposes, the Fund has elected to qualify as a regulated investment company under the provisions of Subchapter M of the Internal Revenue Code of 1986, as amended (the “Code”), by distributing substantially all of its investment company taxable net income and realized gains, not offset by capital loss carryforwards, if any, to its shareholders. The Fund intends to file U.S. federal, state, and local tax returns as required.
On March 30, 2022, the Fund formed a REIT subsidiary (the “REIT Subsidiary”) to hold certain of the Fund’s real estate investments. The REIT Subsidiary qualified and elected to be taxed as a REIT for federal income tax purposes under Sections 856 through 860 of the Code, commencing with its taxable year ending December 31, 2022. If the REIT Subsidiary continues to qualify for taxation as a REIT, the REIT Subsidiary will generally not be subject to federal corporate income tax to the extent it distributes its taxable income to its stockholders, and so long as it, among other things, distributes at least 90% of its annual taxable income (computed without regard to the dividends paid deduction and excluding net capital gains). REITs are subject to a number of other organizational and operational requirements. Even though the REIT Subsidiary qualified for taxation as a REIT, and even if the REIT Subsidiary continues to qualify as a REIT, it may be subject to certain state and local taxes on its income and property,
| CIM Real Assets & Credit Fund | Consolidated Notes to Financial Statements |
| | September 30, 2023 |
| | |
and federal income and excise taxes on its undistributed income. The financial statements contained herein include the accounts of the Fund, the REIT Subsidiary and all other subsidiaries of the Fund.
Investment Transactions and Investment Income
Investment security transactions are accounted for on a trade date basis. Interest income (including interest income from payment-in-kind securities), adjusted for amortization of premium and accretion of discount, is recorded on the accrual basis. Gains and losses on securities sold are determined by use of the specific identification method. To the extent any issuer defaults or a credit event occurs that impacts the issuer, the Fund may halt any additional interest income accruals and consider the realizability of interest accrued up to the date of default or credit event. Dividend income for public securities is recorded on the ex-dividend date. Dividend income received from the Fund’s direct real estate investments is recorded when distributions are declared by vehicles into which the Fund has invested. During the year ended September 30, 2023, the Fund did not receive any dividend income related to its direct real estate investments.
Distributions to Shareholders
The Fund intends to distribute substantially all of its net investment income to shareholders in the form of dividends. The Fund has and expects to continue to declare dividends quarterly and pay them out to shareholders monthly. Distributions from net realized capital gains, if any, are expected to be declared and paid annually and are recorded on the applicable ex-dividend date. The character of income and gains to be distributed is determined in accordance with U.S. federal income tax regulations, which may differ from U.S. GAAP.
Early Withdrawal Charge
Selling brokers, or other financial intermediaries that have entered into selling agreements with the ALPS Distributors, Inc. (“ALPS Distributors”), the Fund’s distributor from the commencement of the Fund’s offering in May 2020 to June 23, 2023, or Northern Lights Distributors, LLC (“Ultimus Northern Lights” and/or ALPS Distributors, as the context may require, the “Distributor”), the Fund’s distributor as of June 26, 2023, may receive a commission of up to 1.0% of the purchase price of Class C Shares. Class C Shares will be subject to an early withdrawal charge of 1.0% of the shareholder’s repurchase proceeds in the event that a shareholder tenders his or her Class C Shares for repurchase such that they will have been held less than 365 days after purchase, as of the time of repurchase. The Distributor may waive the imposition of the early withdrawal charge in the following situations: (1) shareholder death or (2) shareholder bankruptcy. The early withdrawal charge may also be waived in connection with a number of additional circumstances, including repurchases representing returns of excess contributions to employer-sponsored benefit plans. Any such waiver does not imply that the early withdrawal charge will be waived at any time in the future or that such early withdrawal charge will be waived for any other shareholder. For any waiver request, notification must be made in conjunction with the repurchase request. If no such notification is received, the Fund reserves the right to reject the request for a waiver. During the year ended September 30, 2023, the Fund had withdrawal charges in the amount of $52,730.
NOTE 3 – Derivative Transactions
The Fund’s investment objectives allow the Fund to enter into various types of derivative contracts such as total return swaps and forward foreign currency contracts. In doing so, the Fund and RACR-FS, LLC (its “Swap Subsidiary”) will employ strategies in differing combinations to permit it to increase, decrease, or change the level or types of exposure to market factors. Central to those strategies are features inherent to derivatives that make them more attractive for this purpose than equity or debt securities; they require little or no initial cash investment, they can focus exposure only on certain selected risk factors, and they may not require the ultimate receipt or delivery of the underlying security (or securities) to the contract. This may allow the Fund to pursue its objectives more quickly and efficiently than if it were to make direct purchases or sales of securities capable of effecting a similar response to market factors.
Risk of Investing in Derivatives – The Fund’s use of derivatives can result in losses due to unanticipated changes in the market risk factors and the overall market.
Derivatives may have little or no initial cash investment relative to their market value exposure and therefore can produce significant gains or losses in excess of their cost. This use of embedded leverage allows the Fund to increase its market value exposure relative to its net assets and can substantially increase the volatility of the Fund’s performance.
Additional associated risks from investing in derivatives also exist and potentially could have significant effects on the valuation of the derivative and the Fund. Typically, the associated risks are not the risks that the Fund is attempting to increase or decrease exposure to, per their investment objectives, but are the additional risks from investing in derivatives.
Examples of these associated risks are liquidity risk, which is the risk that the Fund will not be able to sell the derivative in the open market in a timely manner, and counterparty credit risk, which is the risk that the counterparty will not fulfill its obligation to the Fund.
Total Return Swap Contract – The Swap Subsidiary has entered into a total return swap referencing a portfolio of bank loans with Citibank, N.A. (“Citi”) as the counterparty. The total return swap allows the Fund to indirectly obtain exposure to a portfolio of bank loans (each a “Reference Asset”) without owning or taking physical custody of such bank loans. Under the total return swap, Citi has contractually committed to make payments based on the total return (income plus realized appreciation) of each Reference Asset in exchange for a periodic payment from the Swap Subsidiary based on a floating interest rate and any realized depreciation of each Reference Asset. Additionally, the Swap Subsidiary posts collateral
| CIM Real Assets & Credit Fund | Consolidated Notes to Financial Statements |
| | September 30, 2023 |
| | |
to cover its potential contractual obligations to Citi under the total return swap. The total return swap is marked-to-market daily consistent with the Fund’s Valuation Policy and changes in value are recorded by the Fund as unrealized gain or loss in the consolidated financial statements. If a Reference Asset is removed from the total return swap, the Fund records a realized gain or loss in the Consolidated Statement of Operations equal to the difference between the price of such Reference Asset from the date it was added to the total return swap and the price of the Reference Asset at the time it was removed from the total return swap. As of September 30, 2023, the total return swap had unrealized loss of $2,037,299.
The total return swap effectively adds leverage to the Fund’s portfolio because, in addition to the Fund’s total net assets, the Fund would be subject to investment exposure on the amount of bank loans subject to the total return swap. The total return swap is also subject to the risk that a counterparty will default on its payment obligations thereunder or that the Fund will not be able to meet its obligations to the counterparty. In addition, because the total return swap is a form of synthetic leverage, such arrangement is subject to risks similar to those associated with the use of leverage.
Fair values of total return swap contracts on the Consolidated Statement of Assets and Liabilities as of September 30, 2023, categorized by risk exposure:
| | | Consolidated Statement of | | | | | Consolidated Statement of | | | |
| | | Assets and Liabilities | | | | | Assets and Liabilities | | | |
| Risk Exposure | | Location | | Fair Value | | | Location | | Fair Value | |
| Market and Credit Risk (Total Return Swap Contracts) | | Unrealized appreciation on total return swap contracts | | $ | 443,580 | | | Unrealized depreciation on total return swap contracts | | $ | (2,480,879 | ) |
| Total | | | | $ | 443,580 | | | | | $ | (2,480,879 | ) |
| | | | | | | | | | | | | |
For the year ended September 30, 2023, the average monthly notional value of total return swap contracts was $70,542,637. The effect of total return swap contracts on the Consolidated Statement of Operations for the year ended September 30, 2023:
| | | | | | | | Change in
Unrealized | |
| | | | | Realized | | | Appreciation/ | |
| Risk Exposure | | Consolidated Statement of
Operations Location | | Gain/(Loss)
on Derivatives | | | (Depreciation) on
Derivatives | |
| Market and Credit Risk (Total Return Swap Contracts) | | Net realized gain/(loss) on total return swaps / Net change in unrealized appreciation/ (depreciation) on total return swaps | | $ | (224,905 | ) | | $ | 3,298,067 | |
| Total | | | | $ | (224,905 | ) | | $ | 3,298,067 | |
| | | | | | | | | | | |
In the normal course of business, the Fund uses certain types of derivative instruments for the purpose of managing or hedging its interest rate risk.
As of September 30, 2023, the Fund had two non-designated interest rate cap agreements in connection with two direct real estate investments with a fair value asset of $615,692.
NOTE 4 – Direct Real Estate Investments
During the year ended September 30, 2023, the Fund invested $6,927,834 for a 50.0% membership interest in a joint venture (the “1902 Park Ave Joint Venture”) with an affiliate (“1902 Park Ave Joint Venture Partner”). The 1902 Park Ave Joint Venture owns a residential property for seniors in Los Angeles, California. As of September 30, 2023, the value of the Fund’s investment in the 1902 Park Ave Joint Venture was $7,144,478, net of the Fund’s share of an affiliated mortgage note with a fair value of $4,677,372. An unrealized gain of $216,644 was recognized in the statement of operations during the year ended September 30, 2023.
During the year ended September 30, 2023, the Fund held an 11.0% membership interest in a joint venture (the “Dallas Joint Venture”) with affiliates and an unrelated third party (“Unrelated Third Party Joint Venture Partner”). Development of the office property held by the Dallas Joint Venture was completed during the year ended September 30, 2023. As of September 30, 2023, the Fund’s amortized cost basis in the property was $13,671,116, net of the Fund’s share of an affiliated mortgage note with a fair value from the Unrelated Third Party Joint Venture Partner of $14,673,944 and the value of the Fund’s investment in the Dallas Joint Venture was $16,374,709. An unrealized loss of $6,957,162 was recognized in the statement of operations during the year ended September 30, 2023.
During the year ended September 30, 2023, the Fund held an 8.0% membership interest in a joint venture (the “Washington Joint Venture”) with an affiliate. The Washington Joint Venture owns a multi-family residential property in Washington D.C.’s metropolitan area. As of September 30, 2023, the Fund’s amortized cost basis in the property held by the Washington Joint Venture was $5,141,761, net of the Fund’s share of a related mortgage note with a fair value of $5,089,518 and the value of the Fund’s investment in the Washington Joint Venture was $4,965,143. An
| CIM Real Assets & Credit Fund | Consolidated Notes to Financial Statements |
| | September 30, 2023 |
| | |
unrealized loss of $1,294,950 was recognized in the statement of operations during the year ended September 30, 2023.
During the year ended September 30, 2023, the Fund held a 17.91% membership interest in a joint venture (the “Del Mar Joint Venture”) with an amortized cost basis in the property of $15,025,000, with no unfunded commitment as of September 30, 2023, with affiliates. The Del Mar Joint Venture owns a multi-family residential property in Phoenix, Arizona. As of September 30, 2023, the value of Fund’s investment in the Del Mar Joint Venture was $14,202,188, net of the Fund’s share of a related mortgage note with a fair value of $33,522,654, which resulted in an unrealized loss of $4,144,425 being recognized in the statement of operations during the year ended September 30, 2023.
The following table summarizes our wholly owned real estate investments during the year ended September 30, 2023:
| | | | | | | | | Market Value as | | | | | | | | | | |
| | | | | Property | | | | of October 1, | | | | | | | | | | |
| Property Name | | Property Type | | Location | | Acquisition Date | | 2022 | | | Purchases | | | Fair Value | | | Unrealized (Loss) | |
| Sora | | Multi-Family | | Los Angeles | | December 2021 | | $ | 16,275,923 | | | $ | 3,454,556 | | | $ | 9,463,484 | | | $ | (10,266,995 | ) |
| 4901 W Jefferson Blvd | | Commercial | | Los Angeles | | June 2022 | | $ | 3,096,386 | | | $ | 1,150,000 | | | $ | 4,222,470 | | | $ | (23,916 | ) |
| 4707 W Jefferson Blvd | | Commercial | | Los Angeles | | June 2022 | | $ | 3,284,033 | | | $ | 595,000 | | | $ | 3,063,409 | | | $ | (815,624 | ) |
| 3816-3822 W Jefferson Blvd | | Development | | Los Angeles | | August 2022 | | $ | 5,090,398 | | | $ | 200,000 | | | $ | 4,908,552 | | | $ | (381,846 | ) |
| | | | | | | | | | | | | | | | | | | | | | | |
NOTE 5 – Investment Transactions
Investment transactions for the year ended September 30, 2023 were as follows:
| Purchases of Investments | | | Sales of Investments | |
| $ | 100,423,660 | | | $ | 28,048,386 | |
NOTE 6 – Affiliated Investments
The following table shows the list of affiliated investments (as defined under the 1940 Act) made by the Fund during the year ended September 30, 2023 and related positions as of September 30, 2023.
| | | | | | Market | | | | | | | | | Market Value | | | Shares | | | | | | | |
| | | | | | Value as | | | | | | | | | as of | | | Balance as | | | | | | Change in | |
| | | | | | of October 1, | | | | | | | | | September | | | of September | | | | | | Unrealized | |
| Name | | Ownership | | | 2022 | | | Purchases | | | Sales | | | 30, 2023 | | | 30, 2023 | | | Income | | | Gain/(Loss) | |
| Creative Media & Community Trust | | | 2 | % | | $ | 2,481,518 | | | $ | — | | | $ | — | | | $ | 1,572,793 | | | | 388,344 | | | $ | 132,037 | | | $ | (908,725 | ) |
| 1902 Park Avenue (Los Angeles) Owner, L.P. | | | 50 | % | | | — | | | | 6,927,834 | | | | — | | | | 7,144,478 | | | | N/A | | | | — | | | | 216,644 | |
| Del Mar Terrace Phoenix,AZ | | | 18 | % | | | 18,321,612 | | | | 25,000 | | | | — | | | | 14,202,188 | | | | N/A | | | | — | | | | (4,144,424 | ) |
| EPIC Dallas | | | 11 | % | | | 23,315,871 | | | | 16,000 | | | | — | | | | 16,374,709 | | | | N/A | | | | — | | | | (6,957,162 | ) |
| Society Las Olas – 301 SW 1st Avenue Holdings LLC | | | 7 | % | | | 5,168,154 | | | | 59,030 | | | | — | | | | 5,226,752 | | | | N/A | | | | 595,985 | | | | (432 | ) |
| Society Las Olas PMG Greybook Riverfront I - LLC | | | 7 | % | | | 10,250,248 | | | | 4,526 | | | | — | | | | 10,371,004 | | | | N/A | | | | 618,826 | | | | 116,230 | |
| Vale at the Parks DC | | | 8 | % | | | 6,218,493 | | | | 41,600 | | | | — | | | | 4,965,143 | | | | N/A | | | | — | | | | (1,294,950 | ) |
| IENTC 1, LLC | | | 21 | % | | | 4,192,400 | | | | 3,895 | | | | — | | | | 6,212,460 | | | | N/A | | | | — | | | | 2,016,165 | |
| IENTC 2, LLC | | | 24 | % | | | 1,645,000 | | | | — | | | | — | | | | 1,645,000 | | | | N/A | | | | 269,736 | | | | — | |
| IENTC 2, LLC DDTL B 1 | | | 24 | % | | | 6,815,000 | | | | — | | | | — | | | | 6,815,000 | | | | N/A | | | | 734,603 | | | | — | |
| | | | | | | $ | 78,408,296 | | | $ | 7,077,885 | | | $ | — | | | $ | 74,529,527 | | | $ | 388,344 | | | $ | 2,351,187 | | | $ | (10,956,654 | ) |
| CIM Real Assets & Credit Fund | Consolidated Notes to Financial Statements |
| | September 30, 2023 |
| | |
NOTE 7 – Leverage
As of September 30, 2023, the Fund has an unsecured credit facility with a bank in place under which the Fund can borrow up to $70 million, subject to a borrowing base calculation. Subject to the satisfaction of certain conditions and the borrowing base calculation, the Fund can increase the amount that it may borrow under the unsecured credit facility to $100 million. Outstanding advances under the unsecured credit facility bear interest at the rate of SOFR plus 4.00%. The Fund also pays a quarterly facility fee of 0.125% of the commitment under the unsecured credit facility. The unsecured credit facility contains certain customary covenants, including a maximum debt to asset value ratio covenant and a minimum liquidity requirement. The unsecured credit facility matures in December 2026, provided that the Fund may elect to extend the maturity date for two periods of 12 months each, in each instance upon satisfaction of certain conditions. As of September 30, 2023, $45 million was outstanding under the unsecured credit facility.
In addition to any indebtedness incurred by the Fund, the Fund may also utilize leverage by mortgaging properties held by the Fund (or any subsidiary), or by acquiring property with existing debt. Any such leverage relating to properties that are wholly owned or that are held in the REIT Subsidiary by the Fund will be consolidated with any leverage incurred directly by the Fund and subject to the 1940 Act’s limitations on leverage, which allows for borrowings in an aggregate amount of up to 33 1/3% of the Fund’s total assets. As of September 30, 2023, the Fund had one wholly owned property with a mortgage note outstanding. The mortgage has an interest rate of SOFR plus 2.95% and matures in January 2024, provided that, subject to the satisfaction of certain conditions, there is an option to extend the term for three additional 12-month periods. In addition, as of September 30, 2023, the Fund had certain co-investments in real properties that had mortgage notes outstanding. As of September 30, 2023, the Fund’s share of the mortgage notes outstanding related to these co-investments had a carrying value of $58.8 million with a fair value of $58.0 million.
NOTE 8 – Investment Advisory, Related Parties and Other Agreements
Investment Advisory and Sub-Advisory Agreements
The Adviser serves as the Fund’s investment adviser pursuant to an Investment Advisory Agreement with the Fund (the “Investment Advisory Agreement”).
Pursuant to the Investment Advisory Agreement and in consideration of the advisory services to be provided by the Adviser to the Fund, the Adviser is entitled to a fee consisting of two components - the Management Fee and the Incentive Fee (each as defined below). Pursuant to the Investment Sub-Advisory Agreement that the Adviser has entered into with the CIM Sub-Adviser (the “CIM Investment Sub-Advisory Agreement”), the Adviser pays the CIM Sub-Adviser a portion of the quarterly management and incentive fees payable to the Adviser attributable to all investments in Real Assets identified and sourced by the CIM Sub-Adviser. Pursuant to the Investment Sub-Advisory Agreement that the Adviser has entered into with the OFS Sub-Adviser (the “OFS Investment Sub-Advisory Agreement”), the Adviser pays the OFS Sub-Adviser a portion of the quarterly management and incentive fees payable to the Adviser attributable to all Credit and Credit-Related Investments and CMBS identified and sourced by the Sub-Adviser. The Adviser pays the Sub- Advisers a quarterly fee equal to 50% of the management and incentive fees payable to the Adviser (the “Quarterly Sub-Adviser Fee”). The Quarterly Sub-Adviser Fee is allocated between CIM Sub-Adviser and OFS Sub-Adviser based on the proportionate share of shareholders’ equity that is invested in Real Assets and Credit and Credit-Related Investments, respectively. The Sub-Advisers’ fees are paid by the Adviser out of the fee the Adviser receives from the Fund, and do not otherwise impact the Fund’s expenses.
Since the end of March 2022, the Adviser has also served as the REIT Subsidiary’s investment adviser pursuant to an investment advisory agreement (the “REIT Subsidiary Advisory Agreement”) with the REIT Subsidiary. Pursuant to the REIT Subsidiary Advisory Agreement and in consideration of the advisory services to be provided by the Adviser to the REIT Subsidiary, the Adviser is entitled to a management fee as described below. Pursuant to an investment sub-advisory agreement that the CIM Sub-Adviser has entered into with the Adviser on behalf of the REIT Subsidiary, the Adviser pays the Sub-Adviser 50% of the management fee payable to the Adviser on behalf of the REIT Subsidiary.
Management Fees
The management fee payable to the Adviser is calculated at an annual rate of 1.50% of the daily value of the Fund’s net assets and is payable quarterly in arrears (the “Management Fee”). The management fee payable to the Adviser on behalf of the REIT Subsidiary is calculated at an annual rate of 1.50% of the daily value of the REIT Subsidiary’s net assets.
Incentive Fee
The Fund has agreed to pay the Adviser as compensation under the Investment Advisory Agreement a quarterly incentive fee, which for the fiscal year ended September 30, 2023 was equal to 20% of its “Pre-Incentive Fee Net Investment Income” for the immediately preceding quarter, subject to a quarterly preferred return, or hurdle, of 1.50% of the NAV (the “Hurdle Rate”) and a catch-up feature. Incentive fees payable to our Adviser will be offset by any incentive fees payable by the REIT Subsidiary. Pre-Incentive Fee Net Investment Income includes accrued income that the Fund has not yet received in cash. No incentive fee is payable to the Adviser on realized capital gains. The incentive fee is paid to the Adviser as follows:
| ● | No Incentive Fee is payable in any calendar quarter in which the Fund’s Pre-Incentive Fee Net Investment Income does not exceed the Hurdle Rate of 1.50%; |
| CIM Real Assets & Credit Fund | Consolidated Notes to Financial Statements |
| | September 30, 2023 |
| | |
| ● | 100% of the Fund’s Pre-Incentive Fee Net Investment Income, if any, that exceeds the Hurdle Rate but is less than or equal to 1.875% in any calendar quarter is payable to the Adviser. This portion of the Fund’s Pre-Incentive Fee Net Investment Income which exceeds the Hurdle Rate but is less than or equal to 1.875% is referred to as the “catch-up.” The “catch-up” provision is intended to provide the Adviser with an incentive fee of 20% on all of the Fund’s Pre-Incentive Fee Net Investment Income when the Fund’s Pre-Incentive Fee Net Investment Income reaches 1.875% of our NAV in any calendar quarter; and |
| ● | 20% of the Fund’s Pre-Incentive Fee Net Investment Income, if any, that exceeds 1.875% in any calendar quarter is payable to the Adviser once the Hurdle Rate is reached and the catch-up is achieved (20% of all the Fund’s Pre-Incentive Fee Net Investment Income thereafter is allocated to the Adviser). |
Administration Agreements
Under the administration agreement (the “Administration Agreement”) that the Fund has with the Adviser (in its capacity as co-administrator), the Adviser furnishes the Fund with the provision of clerical and other administrative services, including investor relations and accounting services and maintenance of certain books and records on our behalf. In accordance with the Administration Agreement, the Fund will reimburse the Adviser (in its capacity as co-administrator) for certain expenses incurred by it or its affiliates in connection with the administration of the Fund’s business and affairs.
In addition, pursuant to an administration agreement (the “REIT Subsidiary Administration Agreement”) that the REIT Subsidiary has with the Adviser (in its capacity as administrator), the Adviser furnishes the REIT Subsidiary with the provision of administrative services. In accordance with the REIT Subsidiary Administration Agreement, the REIT Subsidiary reimburses the Adviser (in its capacity as the REIT Subsidiary administrator) for certain expenses incurred by it or its affiliates in connection with the administration of the REIT Subsidiary’s business and affairs.
Property Management Fees and Reimbursements
CIM Management, Inc. and certain of its affiliates (collectively, the “Affiliated Real Estate Service Providers”), which are all affiliates of the Adviser, provide property management, leasing, and development services to the Fund and its subsidiaries (including the REIT Subsidiary) for real properties owned by the Fund and its subsidiaries. The Fund and its subsidiaries (including the REIT Subsidiary) will also reimburse the Affiliated Real Estate Service Providers for actual expenses incurred in connection with these services. Such property management fees earned by the Affiliated Real Estate Service Providers, onsite management costs incurred on behalf of the Fund and its subsidiaries (including the REIT Subsidiary) [and reimbursements received by the Affiliated Real Estate Service Providers] are included in operating expenses] in the underlying property’s income statement, which reduces the Fund’s share of the net asset value as reflected on the consolidated statement of assets and liabilities. Certain onsite management costs are capitalized on the underlying property’s balance sheet. Leasing commissions, construction management fees and development management reimbursements are capitalized on the underlying property’s balance sheets.
Fees paid to Related Parties
For the year ended September 30, 2023, the Company’s share of recorded fees and expense reimbursements as shown in the table below for services provided by related parties related to the services described above:
| | | For the year ended
September 30, 2023 | |
| Management Fee: | | | | |
| Management fee (for the Fund)(1) | | $ | 3,779,542 | |
| Management fee (for the REIT Subsidiary)(1) | | | 694,449 | |
| Incentive Fee: | | | 3,897,500 | |
| Property Management Fees and Reimbursements: | | | | |
| Property management fees | | | 145,936 | |
| Development management Fees | | | 47,192 | |
| Property management and other onsite reimbursements | | | 2,088,036 | |
| Leasing commissions | | | 102,556 | |
| Administrative Fees and Expenses: | | | | |
| Expense reimbursements by the Fund (2) | | | 1,949,720 | |
| | | | | |
| (1) | Management fee for the Fund will be offset by the management fee of the REIT Subsidiary. |
| (2) | Includes approximately $10,000 of reimbursements related to the Fund’s REIT Subsidiary. |
Expense Limitation Agreement
The Adviser and the Fund have entered into an expense limitation and reimbursement agreement (the “Expense Limitation Agreement”) under which the Adviser has agreed contractually to waive its fees and to pay or absorb the ordinary operating expenses of the Fund (including organizational and offering expenses, but excluding the incentive fee, the management fee, the shareholder services fee, fees and expenses associated with property management, development management and leasing brokerage services for real properties owned by the REIT Subsidiary, the distribution fee, dividend and interest payments (including any dividend payments, interest expenses, commitment fees, or other expenses
| CIM Real Assets & Credit Fund | Consolidated Notes to Financial Statements |
| | September 30, 2023 |
| | |
related to any leverage incurred by the fund), brokerage commissions, acquired fund fees and expenses, taxes and extraordinary expenses), to the extent that they exceed 0.75% per annum of the Fund’s average daily net assets (the “Expense Limitation”). In consideration of the Adviser’s agreement to limit the Fund’s expenses, the Fund has agreed to repay the Adviser in the amount of any fees waived and Fund expenses paid or absorbed, subject to the limitations that: (1) the reimbursement for fees and expenses will be made only if payable not more than three years from the date which they were incurred and (2) the reimbursement may not be made if it would cause the expense limitation then in effect or that was in effect at the time the expenses were waived or absorbed, whichever amount is lower, to be exceeded. On November 16, 2023, the Adviser extended the termination date of the Expense Limitation Agreement to January 31, 2025, as approved by the Board. The Fund expects the Expense Limitation Agreement to continue in effect for successive twelve-month periods, contingent on the annual approval of a majority of the Board. The Expense Limitation Agreement may be terminated at any time, and without payment of any penalty, by the Board, upon 60 days’ written notice to the Adviser. The Expense Limitation Agreement may not be terminated by the Adviser without the consent of the Board.
For the year ended September 30, 2023, the Adviser waived fees and reimbursed expenses of $4,024,557.
As of September 30, 2023, the following amounts were available for recoupment by the Adviser based upon their potential expiration dates:
| Period Waived | | | | | Maximum |
| From | | To | | Amount | | | Expiration Date |
| 10/1/2020 | | 9/30/2021 | | $ | 2,851,947 | | | 9/30/2024 |
| 10/1/2021 | | 9/30/2022 | | $ | 2,519,264 | | | 9/30/2025 |
| 10/1/2022 | | 9/30/2023 | | $ | 4,024,557 | | | 9/30/2026 |
| | | | | | | | | |
For the year ended September 30, 2023, $1,745,735 in recapturable expenses expired including $440,015, which represents expired recapture of organization and offering expenses on May 4, 2023.
Fund Administration and Accounting Fees and Expenses
ALPS Fund Services, Inc. (“AFS”), served as administrator to the Fund from the commencement of the Fund’s offering in May 2020 through June 23, 2023. Under an Administration, Bookkeeping and Pricing Services Agreement, AFS was responsible for calculating the Fund’s NAV per class of Common Shares, providing additional fund accounting and tax services, and providing fund administration and compliance-related services to the Fund. Ultimus Fund Solutions, LLC (“Ultimus”) began serving as administrator to the Fund on June 26, 2023. Under a Master Services Agreement, Ultimus is responsible for calculating the Fund’s NAV per class of Common Shares, providing additional fund accounting services, and providing administration and compliance-related services to the Fund.
Distribution and Shareholder Servicing Fees and Expenses
From the commencement of the Fund’s offering in May 2020 through June 23, 2023, ALPS Distributors served as the Fund’s distributor. There were no fees paid to ALPS Distributor. As of June 26, 2023, Ultimus Northern Lights has been serving as the Fund’s distributor. Pursuant to the Distribution Agreement between the Fund, the Adviser and Ultimus Northern Lights, the Adviser (and not the Fund) pays a fee to Ultimus Northern Lights. The Board has adopted, on behalf of the Fund, a distribution and shareholder servicing plan under which the Fund may compensate financial industry professionals for providing ongoing services in respect of clients with whom they have distributed shares of the Fund (the “Distribution and Shareholder Servicing Plan”). Under the Distribution and Shareholder Servicing Plan, the Fund pays the Distributor (i) a distribution fee that is calculated monthly and accrued daily at an annualized rate of 0.75% and 0.25% of the average daily net assets of the Fund attributable to Class C Shares and Class L Shares, respectively, and (ii) a Servicing Fee that is paid monthly and that will accrue at an annual rate of up to 0.25% of the Fund’s average daily net assets attributable to the Class C Shares, Class A Shares and Class L Shares, respectively. For the year ended September 30, 2023, Class C Shares, Class A Shares and Class L Shares incurred shareholder servicing fees of $29,006, $18,878, and $934, respectively. For the year ended September 30, 2023, Class C Shares and Class L Shares incurred distribution fees of $87,019 and $934, respectively.
Transfer Agency Fees and Expenses
DST Systems, Inc. (“DST”), an affiliate of AFS, serves as the transfer agent for the Fund. Under the Transfer Agency Agreement, DST is responsible for maintaining all shareholder records of the Fund, and receives customary fees from the Fund for such services.
Custody Fees and Expenses
U.S. Bank, National Association, serves as the primary custodian to the Fund and UMB Bank N.A. serves as custodian regarding certain of the Fund’s assets. The Fund pays customary fees for the services of these two custodians.
Officer and Trustee Compensation
Each independent trustee currently receives an annual cash retainer of $90,000, as well as reimbursement for any reasonable expenses incurred attending meetings.
| CIM Real Assets & Credit Fund | Consolidated Notes to Financial Statements |
| | September 30, 2023 |
| | |
David Thompson has been a trustee of the Fund since January 2019 and Chief Executive Officer of the Fund since August 2019. Bilal Rashid has been a trustee of the Fund since August 2019. Mr. Thompson and Mr. Rashid both serve in officer roles at affiliates of the Fund, and are not paid by the Fund for serving as interested trustees.
NOTE 9 –Tax Basis Information
For the year ended September 30, 2023, the following reclassifications, which had no impact on results of operations or net assets, were recorded to reflect tax character.
| Paid in Capital | | | Total Distributable Earnings | |
| $ | 1,128,736 | | | $ | (1,128,736 | ) |
| | | | | | | |
The following information is computed on a tax basis for each item as of September 30, 2023:
| | | | | | | Other | | | Net Unrealized | | | | |
| Undistributed net | | | Undistributed
Long-Term | | | cumulative
effect of timing | | | Appreciation/
Depreciation | | | | |
| Investment Income | | | capital gain | | | differences | | | on Investments | | | Total | |
| $ | — | | | $ | — | | | $ | — | | | $ | (6,674,466 | ) | | $ | (6,674,466 | ) |
| | | | | | | | | | | | | | | | | | | |
The difference between book basis and tax basis distributable earnings and unrealized appreciation/(depreciation) is primarily attributable to the tax deferral of losses on wash sales, investments in partnerships, Direct Real Estate and asset-backed securities. As of September 30, 2023, the components of accumulated earnings on a tax basis were as follows:
| Gross Appreciation | | | Gross Depreciation | | | Net Unrealized | | | Cost of Investments | |
| (Excess of value | | | (Excess of tax cost | | | Appreciation/ | | | for Income Tax | |
| over tax cost) | | | over value) | | | Depreciation | | | Purposes | |
| $ | 20,727,807 | | | $ | (27,402,273 | ) | | $ | (6,674,466 | ) | | $ | 346,197,069 | |
| | | | | | | | | | | | | | | |
The tax characteristics of distributions paid were as follows:
| Year | | | Ordinary Income | | | Long-Term
Capital Gain | | | Return of Capital | |
| | 2023 | | | $ | 11,551,725 | | | | — | | | $ | 7,661,624 | |
| | 2022 | | | $ | 5,263,430 | | | $ | 8,971 | | | $ | 5,572,297 | |
| | | | | | | | | | | | | | | |
Distributions received from the Fund’s investments in REITs may be classified as dividends, capital gains and/or return of capital.
NOTE 10 – Repurchase Offers
The Fund has adopted a fundamental investment policy to make quarterly offers to repurchase no less than 5% of its outstanding Common Shares at NAV. As a fundamental policy, this policy may not be changed without shareholder approval. If a repurchase offer is oversubscribed, the Fund may determine to increase the amount repurchased by up to 2% of the Fund’s outstanding Common Shares as of the date of the Repurchase Request Deadline (as defined below). Any share repurchase offer in excess of 5% of the Fund’s outstanding Common Shares is entirely within the discretion of the Fund. In the event that the Fund determines not to repurchase more than the repurchase offer amount, or if the Fund does determine to increase the amount but shareholders tender more than the repurchase offer amount plus 2% of the Fund’s outstanding Common Shares as of the date of the Repurchase Request Deadline, the Fund will repurchase the Common Shares tendered on a pro rata basis, and shareholders will have to wait until the next repurchase offer to make another repurchase request. Shareholders will receive written notice of each quarterly repurchase offer (the “Repurchase Offer Notice”) at least 21 calendar days and not more than 42 calendar days before the date the repurchase offer ends (the “Repurchase Request Deadline”). Common Shares will be repurchased at the NAV per Common Share determined as of the close of regular trading on the NYSE no later than the 14th day after the Repurchase Request Deadline, or the next business day if the 14th day is not a business day (each “Repurchase Pricing Date”). The Fund will distribute such payment no later than seven calendar days after the Repurchase Pricing Date.
| CIM Real Assets & Credit Fund | Consolidated Notes to Financial Statements |
| | September 30, 2023 |
| | |
During the year ended September 30, 2023, the Fund completed four quarterly repurchase offers. In these offers, the Fund offered to repurchase up to 5% of the number of its outstanding shares as of the Repurchase Request Deadline. With regard to each of the offers, repurchase requests received by the Fund exceeded the limit described above, and therefore the Fund limited the number of shares repurchased during each quarterly repurchase offers to 5% of the Fund’s outstanding common shares for each respective quarterly repurchase offer. The result of those repurchase offers were as follows:
| | | Repurchase Offer #1 | | Repurchase Offer #2 | | Repurchase Offer #3 | | Repurchase Offer #4 |
| Repurchase Offer Notice Date | | September 14, 2022 | | December 13, 2022 | | March 14, 2023 | | June 14, 2023 |
| Repurchase Request Deadline | | October 14, 2022 | | January 12, 2023 | | April 13, 2023 | | July 14, 2023 |
| Repurchase Payment Deadline | | October 21, 2022 | | January 19, 2023 | | April 20, 2023 | | July 21, 2023 |
| Amount Repurchased | | $8,749,450 | | $14,746,678 | | $15,712,602 | | $16,072,110 |
| Shares Repurchased | | 335,357 | | 570,428 | | 613,595 | | 637,886 |
| | | | | | | | | |
NOTE 11 – Risk Factors
In the normal course of business, the Fund invests in financial instruments and enters into financial transactions where risk of potential loss exists due to such things as changes in the market (market risk) or failure or inability of the other party to a transaction to perform (credit and counterparty risk). Please see below for a detailed description of select principal risks. The following list is not intended to be a comprehensive listing of all of the potential risks associated with the Fund. For a more comprehensive list of potential risks the Fund may be subject to, please refer to the Fund’s Prospectus and Statement of Additional Information (“SAI”).
Geopolitical and Global Economic Risk
The current worldwide financial markets situation, as well as various social and political tensions in the United States and around the world (including wars and other forms of conflict, terrorist acts, security operations and catastrophic events such as fires, floods, earthquakes, tornadoes, hurricanes and global health epidemics), may contribute to increased market volatility, may have long term effects on the United States and worldwide financial markets, and may cause economic uncertainties or deterioration in the United States and worldwide. For example, we have observed and continue to observe labor and resource shortages, commodity inflation, elevated interest rates, a risk of recession and the shutdown of U.S. government services. In addition, the impacts of the ongoing war between Russia and Ukraine and the escalated conflict in the Middle East are uncertain. Elements of geopolitical, economic and financial market instability in the United States, the United Kingdom, the European Union and China. Any of the above factors could have a material adverse effect on our business, financial condition, cash flows and results of operations and could cause the market value of our common shares to decline. We monitor developments and seek to manage our investments in a manner consistent with achieving our investment objectives, but there can be no assurance that we will be successful in doing so.
From time to time, the Fund maintains cash balances at banks in excess of the FDIC insurance limit. If a bank in which the Fund holds funds fails or is subject to significant adverse conditions in the financial or credit markets, the Fund could be subject to a risk of loss of all or a portion of such funds or be subject to a delay in accessing all or a portion of such uninsured funds. In addition, the Fund has undrawn capacities under its credit facility. Any loss of such funds, lack of access to such funds or inability to borrow from any of the Fund’s lenders could adversely impact the Fund’s short-term liquidity and ability of the Fund to meet its operating expenses or working capital needs.
Real Estate Industry Risk
The Fund will invest a substantial portion of its assets in Real Assets, which includes real estate-related securities. Therefore, the performance of its portfolio will be significantly impacted by the performance of the real estate market in general and the Fund may experience more volatility and be exposed to greater risk than it would be if it held a more diversified portfolio. The Fund will be impacted by factors particular to the real estate industry including, among others: (i) changes in general economic and market conditions; (ii) changes in the value of real estate properties; (iii) risks related to local economic conditions, overbuilding, increased competition and a decreased demand for office properties as a result of the increasing shift to remote work following the COVID-19 pandemic; (iv) increases in operating expenses including property taxes; (v) changes in zoning laws; (vi) casualty and condemnation losses; (vii) variations in rental income, neighborhood values or the appeal of property to tenants; (viii) the availability of financing; (ix) prolonged periods of higher interest rates, such as the current period; and (x) changes in availability of leverage on loans for or secured by real estate. Changes in federal tax laws which are being debated or pending as of the date of these financial statements may have a significant impact on the U.S. real estate industry in general, particularly in the geographic markets targeted by Fund investments. The value of securities in the real estate industry may go through cycles of relative under-performance and over-performance in comparison to equity securities markets in general.
Collateralized Mortgage-Backed Securities Risk
Mortgage-backed securities are bonds which evidence interests in, or are secured by, commercial mortgage loans. Accordingly, collateralized mortgage-backed securities (“CMBS”) are subject to all of the risks of the underlying mortgage loans. In a rising interest rate environment, the value of CMBS may be adversely affected when payments on underlying mortgages do not occur as anticipated. The value of CMBS may also change due to shifts in the market’s perception of issuers and regulatory or tax changes adversely affecting the mortgage securities markets as a whole. In addition, CMBS are subject to the credit risk associated with the performance of the underlying commercial mortgage properties. CMBS are also subject to several risks created through the securitization process.
The Fund may invest in the residual or equity tranches of CMBS, which are referred to as subordinate CMBS or interest-only CMBS. Subordinate CMBSs are paid interest only to the extent there are funds available to make payments. There are multiple tranches of CMBS, offering investors various maturity and credit risk characteristics. Tranches are categorized as senior, mezzanine, and subordinated/equity, according to their degree of risk. The most senior tranche of a CMBS has the greatest collateralization and pays the lowest interest rate. If there are defaults or the collateral
| CIM Real Assets & Credit Fund | Consolidated Notes to Financial Statements |
| | September 30, 2023 |
| | |
otherwise underperforms, scheduled payments to senior tranches take precedence over those of mezzanine tranches, and scheduled payments to mezzanine tranches take precedence over those to subordinated/equity tranches. Lower tranches represent lower degrees of credit quality and pay higher interest rates intended to compensate for the attendant risks. The return on the lower tranches is especially sensitive to the rate of defaults in the collateral pool. The lowest tranche (i.e. the “equity” or “residual” tranche) specifically receives the residual interest payments (i.e., money that is left over after the higher tranches have been paid and expenses of the issuing entities have been paid) rather than a fixed interest rate. As a result, interest only CMBS possess the risk of total loss of investment in the event of prepayment of the underlying mortgages. There is no limit on the portion of the Fund’s total assets that may be invested in interest-only multifamily CMBS.
The Fund also may invest in interest-only multifamily CMBS issued by multifamily mortgage loan securitizations. However, these interest-only multifamily CMBS typically only receive payments of interest to the extent that there are funds available in the securitization to make the payment and may introduce increased risks since these securities have no underlying principal cash flows.
Broadly Syndicated Loans Risk
The broadly syndicated senior secured corporate loans (“Broadly Syndicated Loans”) in which the Fund invests are primarily rated below investment grade, but some Broadly Syndicated Loans may be unrated and of comparable credit quality. As a result, the risks associated with such Broadly Syndicated Loans are generally similar to the risks of other below investment grade fixed income instruments, although Broadly Syndicated Loans are senior and typically secured in contrast to other below investment grade fixed income instruments, which are often subordinated or unsecured. Investments in below investment grade Broadly Syndicated Loans are considered speculative because of the credit risk of the borrowers. Such borrowers are more likely than investment grade borrowers to default on their payments of interest and principal owed to the Fund, and such defaults could reduce the Fund’s NAV and income dividends. An economic downturn would generally lead to a higher non-payment rate, and a Broadly Syndicated Loan may lose significant market value before a default occurs. Moreover, any specific collateral used to secure a Broadly Syndicated Loan may decline in value or become illiquid, which would adversely affect the Broadly Syndicated Loan’s value. Broadly Syndicated Loans are subject to a number of risks described elsewhere in this prospectus, including liquidity risk and the risk of investing in below investment grade fixed income instruments.
Broadly Syndicated Loans are subject to the risk of non-payment of scheduled interest or principal. Such non-payment would result in a reduction of income to the Fund, a reduction in the value of the investment and a potential decrease in the NAV of the Fund. There can be no assurance that the liquidation of any collateral securing a Broadly Syndicated Loan would satisfy the borrower’s obligation in the event of non-payment of scheduled interest or principal payments, whether when due or upon acceleration, or that the collateral could be liquidated, readily or otherwise. In the event of bankruptcy or insolvency of a borrower, the Fund could experience delays or limitations with respect to its ability to realize the benefits of the collateral, if any, securing a Broadly Syndicated Loan. The collateral securing a Broadly Syndicated Loan, if any, may lose all or substantially all of its value in the event of the bankruptcy or insolvency of a borrower. Some Broadly Syndicated Loans are subject to the risk that a court, pursuant to fraudulent conveyance or other similar laws, could subordinate such Broadly Syndicated Loans to presently existing or future indebtedness of the borrower or take other action detrimental to the holders of Broadly Syndicated Loans including, in certain circumstances, invalidating such Broadly Syndicated Loans or causing interest previously paid to be refunded to the borrower. Additionally, a Broadly Syndicated Loan may be “primed” in bankruptcy, which reduces the ability of the holders of the Broadly Syndicated Loan to recover on the collateral. Priming takes place when a debtor in bankruptcy is allowed to incur additional indebtedness by the bankruptcy court and such indebtedness has a senior or pari passu lien with the debtor’s existing secured indebtedness, such as existing Broadly Syndicated Loans or secured corporate bonds.
There may be less readily available information about most Broadly Syndicated Loans and the borrowers thereunder than is the case for many other types of securities, including securities issued in transactions registered under the Securities Act of 1933, as amended, or registered under the Securities Exchange Act of 1934, as amended, and borrowers subject to the periodic reporting requirements of Section 13 of the Exchange Act. Broadly Syndicated Loans may be issued by companies that are not subject to SEC reporting requirements and these companies, therefore, do not file reports with the SEC that must comply with SEC form requirements and in addition are subject to a less stringent liability disclosure regime than companies subject to SEC reporting requirements. As a result, the OFS Sub-Adviser will rely most often on their own evaluation of a borrower’s credit quality rather than on any available independent sources. Therefore, the Fund will be particularly dependent on the analytical abilities of the OFS Sub-Adviser.
The secondary trading market for Broadly Syndicated Loans may be less liquid than the secondary trading market for registered investment grade debt securities. No active trading market may exist for certain Broadly Syndicated Loans, which may make it difficult to value them. Illiquidity and adverse market conditions may mean that the Fund may not be able to sell Broadly Syndicated Loans quickly or at a fair price. To the extent that a secondary market does exist for certain Broadly Syndicated Loans, the market for them may be subject to irregular trading activity, wide bid/ask spreads and extended trade settlement periods.
Broadly Syndicated Loans and other variable rate debt instruments are subject to the risk of payment defaults of scheduled interest or principal. Such payment defaults would result in a reduction of income to the Fund, a reduction in the value of the investment and a potential decrease in the NAV of the Fund. Similarly, a sudden and significant increase in market interest rates may increase the risk of payment defaults and cause a decline in the value of these investments and in the Fund’s NAV. Other factors (including, but not limited to, rating downgrades, credit deterioration, a large downward movement in share prices, a disparity in supply and demand of certain securities or market conditions that reduce liquidity) can reduce the value of Broadly Syndicated Loans and other debt obligations, impairing the Fund’s NAV.
| CIM Real Assets & Credit Fund | Consolidated Notes to Financial Statements |
| | September 30, 2023 |
| | |
The Fund will acquire Broadly Syndicated Loans through assignments and through participations. The purchaser of an assignment typically succeeds to all the rights and obligations of the assigning institution and becomes a lender under the credit agreement with respect to the debt obligation; however, the purchaser’s rights can be more restricted than those of the assigning institution, and the Fund may not be able to unilaterally enforce all rights and remedies under the loan and with regard to any associated collateral. In general, a participation is a contractual relationship only with the institution participating out the interest, not with the borrower. Sellers of participations typically include banks, broker-dealers, other financial institutions and lending institutions. In purchasing participations, the Fund generally will have no right to enforce compliance by the borrower with the terms of the loan agreement against the borrower, and the Fund may not directly benefit from the collateral supporting the debt obligation in which it has purchased the participation. As a result, (i) the Fund will be exposed to the credit risk of both the borrower and the institution selling the participation; and (ii) both the borrower and the institution selling the participation will be considered issuers for purposes of the Fund’s investment restriction concerning industry concentration. Further, in purchasing participations in lending syndicates, the Fund may be more limited than it otherwise would be in its ability to conduct due diligence on the borrower. In addition, as a holder of the participations, the Fund may not have voting rights or inspection rights that the Fund would otherwise have if it were investing directly in the Broadly Syndicated Loan, which may result in the Fund being exposed to greater credit or fraud risk with respect to the borrower or the Broadly Syndicated Loan.
Valuation Risk
Pursuant to Rule 2a-5, the Board has designated the Adviser as the “valuation designee.” Where possible, the Adviser utilizes independent pricing services to value certain portfolio instruments at their market value. If the pricing services are unable to provide a market value or if a significant event occurs such that the valuation(s) provided are deemed unreliable, the Adviser may value portfolio instrument(s) at their fair value, which is generally the amount an owner might reasonably expect to receive upon a current sale. Valuation risks associated with the Fund’s investments include, but are not limited to: a limited number of market participants compared to publicly traded investment grade securities, a lack of publicly available information about some borrowers, resale restrictions, settlement delays, corporate actions and adverse market conditions that may make it difficult to value or sell such instruments.
A large percentage of the Fund’s portfolio investments will not be publicly traded. The fair value of investments that are not publicly traded may not be readily determinable. The Adviser values these investments at fair value in good faith pursuant to Rule 2a-5. The types of factors that may be considered in valuing the Fund’s investments include the enterprise value of the portfolio company (the entire value of the portfolio company to a market participant, including the sum of the values of debt and equity securities used to capitalize the enterprise at a point in time), the nature and realizable value of any collateral, the portfolio company’s ability to make payments and its earnings and discounted cash flows, the markets in which the portfolio company does business, a comparison of the portfolio company’s securities to similar publicly traded securities, changes in the interest rate environment and the credit markets generally that may affect the price at which similar investments would trade in their principal markets and other relevant factors. When an external event such as a purchase transaction, public offering or subsequent equity sale occurs, the Adviser considers the pricing indicated by the external event to corroborate the Fund’s valuation. Because such valuations, and particularly valuations of private investments and private companies, are inherently uncertain, may fluctuate over short periods of time and may be based on estimates, the Adviser’s determinations of fair value may differ materially from the values that would have been used if a ready market for these investments existed and may differ materially from the values that the Fund may ultimately realize. The Fund’s NAV per each class of Common Shares could be adversely affected if the Adviser’s determinations regarding the fair value of these investments are higher than the values that the Fund realizes upon disposition of such investments.
Additionally, the Adviser’s participation in the Fund’s valuation process could result in a conflict of interest since the Adviser’s management fee is based on our net assets.
Liquidity Risk
The Fund may invest without limitation in securities that, at the time of investment, are illiquid (determined using the SEC’s standard applicable to registered investment companies, i.e., securities that cannot be disposed of by the Fund within seven days in the ordinary course of business at approximately the amount at which the Fund has valued the securities). The Fund may also invest in securities subject to restrictions on resale. Investments in restricted securities could have the effect of increasing the amount of the Fund’s assets invested in illiquid securities if qualified institutional buyers are unwilling to purchase these securities. The illiquidity of these investments may make it difficult for the Fund to sell such investments if the need arises. In addition, if the Fund is required to liquidate all or a portion of its portfolio quickly, the Fund may realize significantly less than the value at which it has previously recorded these investments.
Illiquid and restricted securities may be difficult to dispose of at a fair price at the times when the Fund believes it is desirable to do so. The market price of illiquid and restricted securities generally is more volatile than that of more liquid securities, which may adversely affect the price that the Fund pays for or recovers upon the sale of such securities. Illiquid and restricted securities are also more difficult to value, especially in challenging markets. Each Sub-Adviser’s judgment may play a greater role in the valuation process. Investment of the Fund’s assets in illiquid and restricted securities may restrict the Fund’s ability to take advantage of market opportunities. In order to dispose of an unregistered security, the Fund, where it has contractual rights to do so, may have to cause such security to be registered. A considerable period may elapse between the time the decision is made to sell the security and the time the security is registered, thereby enabling the Fund to sell it. Contractual restrictions on the resale of securities vary in length and scope and are generally the result of a negotiation between the issuer and acquiror of the securities. In either case, the Fund would bear market risks during that period.
| CIM Real Assets & Credit Fund | Consolidated Notes to Financial Statements |
| | September 30, 2023 |
| | |
Some loans and other instruments are not readily marketable and may be subject to restrictions on resale. Loans and other instruments may not be listed on any national securities exchange and no active trading market may exist for certain of the loans and other instruments in which the Fund will invest. Where a secondary market exists, the market for some loans and other instruments may be subject to irregular trading activity, wide bid/ask spreads and extended trade settlement periods.
Credit Risk
Credit risk is the risk that one or more loans or other floating rate instruments in the Fund’s portfolio will decline in price or fail to pay interest or principal when due because the issuer of the instrument experiences a decline in its financial status. While a senior position in the capital structure of a borrower or issuer may provide some protection with respect to the Fund’s investments in certain loans, losses may still occur because the market value of loans is affected by the creditworthiness of borrowers or issuers and by general economic and specific industry conditions and the Fund’s other investments will often be subordinate to other debt in the issuer’s capital structure. To the extent the Fund invests in below investment grade instruments, it will be exposed to a greater amount of credit risk than a fund which invests in investment grade securities. The prices of lower grade instruments are more sensitive to negative developments, such as a decline in the issuer’s revenues or a general economic downturn, than are the prices of higher grade instruments. Instruments of below investment grade quality are predominantly speculative with respect to the issuer’s capacity to pay interest and repay principal when due and therefore involve a greater risk of default.
CLO Risk
In addition to the general risks associated with debt securities and structured products discussed herein, CLOs carry additional risks, including, but not limited to (i) the possibility that distributions from collateral securities will not be adequate to make interest or other payments; (ii) the quality of the collateral may decline in value or default; (iii) the possibility that the investments in CLOs are subordinate to other classes or tranches thereof; (iv) the potential of spread compression in the underlying loans of the CLO, which could reduce credit enhancement in the CLOs; and (v) the complex structure of the security may not be fully understood at the time of investment and may produce disputes with the issuer or unexpected investment results.
CLO junior debt securities that the Fund may acquire are subordinated to more senior tranches of CLO debt. CLO junior debt securities are subject to increased risks of default relative to the holders of superior priority interests in the same securities. In addition, at the time of issuance, CLO equity securities are under-collateralized in that the liabilities of a CLO at inception exceed its total assets. Though not exclusively, the Fund will typically be in a first loss or subordinated position with respect to realized losses on the assets of the CLOs in which it is invested. The Fund may recognize phantom taxable income from its investments in the subordinated tranches of CLOs.
Between the closing date and the effective date of a CLO, the CLO collateral manager will generally expect to purchase additional collateral obligations for the CLO. During this period, the price and availability of these collateral obligations may be adversely affected by a number of market factors, including price volatility and availability of investments suitable for the CLO, which could hamper the ability of the collateral manager to acquire a portfolio of collateral obligations that will satisfy specified concentration limitations and allow the CLO to reach the initial par amount of collateral prior to the effective date. An inability or delay in reaching the target initial par amount of collateral may adversely affect the timing and amount of interest or principal payments received by the holders of the CLO debt securities and distributions of the CLO on equity securities and could result in early redemptions which may cause CLO debt and equity investors to receive less than the face value of their investment.
In addition, the portfolios of certain CLOs in which the Fund may invest may contain “covenant-lite” loans. The Fund uses the term “covenant-lite” loans to refer generally to loans that do not have a complete set of financial maintenance covenants. Generally, “covenant-lite” loans provide borrower companies more freedom to negatively impact lenders because their covenants are incurrence-based, which means they are only tested and can only be breached following an affirmative action of the borrower, rather than by a deterioration in the borrower’s financial condition. Accordingly, to the extent the Fund is exposed to “covenant-lite” loans, the Fund may have a greater risk of loss on such investments as compared to investments in or exposure to loans with financial maintenance covenants.
The failure by a CLO in which the Fund invests to satisfy financial covenants, including with respect to adequate collateralization and/or interest coverage tests, could lead to a reduction in the CLO’s payments to the Fund. In the event that a CLO fails certain tests, holders of CLO senior debt may be entitled to additional payments that would, in turn, reduce the payments the Fund would otherwise be entitled to receive. Separately, the Fund may incur expenses to the extent necessary to seek recovery upon default or to negotiate new terms, which may include the waiver of certain financial covenants, with a defaulting CLO or any other investment the Fund may make. If any of these occur, it could adversely affect the Fund’s operating results and cash flows.
The Fund’s CLO investments are exposed to leveraged credit risk. If certain minimum collateral value ratios and/or interest coverage ratios are not met by a CLO, primarily due to senior secured loan defaults, then cash flow that otherwise would have been available to pay distributions to the Fund on its CLO investments may instead be used to redeem any senior notes or to purchase additional senior secured loans, until the ratios again exceed the minimum required levels or any senior notes are repaid in full.
| CIM Real Assets & Credit Fund | Consolidated Notes to Financial Statements |
| | September 30, 2023 |
| | |
Leverage Risk
The 1940 Act requires a registered investment company to satisfy an asset coverage requirement of 300% of its indebtedness, including amounts borrowed, measured at the time of incurrence of indebtedness. This means that the value of the Fund’s total indebtedness may not exceed one-third of the value of its total assets, including the value of the assets purchased with the proceeds of its indebtedness. Under current market conditions, the Fund intends to utilize leverage principally through (i) borrowings in an aggregate amount of up to 33 1/3% of the Fund’s total assets (including the assets subject to, and obtained with the proceeds of, such borrowings) immediately after such borrowings or (ii) the issuance of preferred shares in an aggregate amount of up to 50% of the Fund’s total assets (including the assets subject to, and obtained with the proceeds of, such issuance) immediately after such issuance. Leverage may result in greater volatility of the NAV and distributions on the Common Shares because changes in the value of the Fund’s portfolio investments, including investments purchased with the proceeds from are borne entirely by shareholders. Common Share income may fluctuate if the interest rate on borrowings changes. In addition, the Fund’s use of leverage will result in increased operating costs. Thus, to the extent that the then-current cost of any leverage, together with other related expenses, approaches the net return on the Fund’s investment portfolio, the benefit of leverage to shareholders will be reduced, and if the then-current cost of any leverage together with related expenses were to exceed the net return on the Fund’s portfolio, the Fund’s leveraged capital structure would result in a lower rate of return to shareholders than if the Fund were not so leveraged. In addition, the costs associated with the Fund’s incurrence and maintenance of leverage could increase over time. There can be no assurance that the Fund’s leveraging strategy will be successful.
Any decline in the NAV of the Fund will be borne entirely by shareholders. Therefore, if the market value of the Fund’s portfolio declines, the Fund’s use of leverage will result in a greater decrease in NAV to shareholders than if the Fund were not leveraged.
Certain types of borrowings may result in the Fund being subject to covenants in credit agreements relating to asset coverage or portfolio composition or otherwise. In addition, the terms of the credit agreements may also require that the Fund pledge some or all of its assets as collateral.
Non-Diversification Risk
The Fund is classified as “non-diversified” under the 1940 Act. As a result, it can invest a greater portion of its assets in obligations of a single issuer other than a “diversified” fund. The Fund may therefore be more susceptible than a diversified fund to being adversely affected by any single corporate, economic, political or regulatory occurrence. The Fund intends to qualify for the special tax treatment available to “regulated investment companies” under Subchapter M of the Code, and thus intends to satisfy the diversification requirements of Subchapter M, including its less stringent diversification requirements that apply to the percentage of the Fund’s total assets that are represented by cash and cash items (including receivables), U.S. government securities, the securities of other regulated investment companies and certain other securities.
Affiliates Risk
Our Adviser and Sub-Advisers will experience conflicts of interest in connection with the management of our business affairs relating to and arising from a number of matters, including: the allocation of investment opportunities by our Adviser and Sub-Advisers and their affiliates; compensation to our Adviser and Sub-Advisers; services that may be provided by our Adviser and Sub-Advisers and their affiliates to issuers in which we invest; investments by us and other clients of our Adviser and Sub-Advisers, subject to the limitations of the 1940 Act; the formation of additional investment funds managed by our Adviser or Sub-Advisers; differing recommendations given by our Adviser and Sub-Advisers to us versus other clients; our Adviser’s and Sub-Advisers’ use of information gained from issuers in our portfolio for investments by other clients, subject to applicable law; and restrictions on our Adviser’s and Sub-Advisers’ use of “inside information” with respect to potential investments by us.
We may be prohibited under the 1940 Act from participating in certain transactions with our affiliates without the prior approval of our directors who are not interested persons and, in some cases, the prior approval of the SEC. To promote further alignment with other funds managed by CIM and its affiliates, the Fund has obtained an order for exemptive relief (the “Order”) from the SEC that allows it to co-invest alongside certain funds managed by affiliates of our Adviser and the OFS Sub-Adviser, in accordance with the conditions specified in the Order. We may therefore compete for capital and investment opportunities with other entities managed by our Adviser or Sub-Advisers or their affiliates, subjecting our Adviser and Sub-Advisers and their affiliates to certain conflicts of interest in evaluating the suitability of investment opportunities and making or recommending investments on our behalf.
Pursuant to the Order, we generally are permitted to co-invest with certain of our affiliates if a “required majority” (as defined in Section 57 of the 1940 Act) of our independent directors make certain conclusions in connection with a co-investment transaction, including that (1) the terms of the transaction, including the consideration to be paid, are reasonable and fair to us and our shareholders and do not involve overreaching of us or our shareholders on the part of any person concerned, (2) the transaction is consistent with the interests of our shareholders and is consistent with our investment objective and strategies, and (3) the investment by our affiliates would not disadvantage us, and our participation would not be on a basis different from or less advantageous than that on which our affiliates are investing. As a result of the Order, there could be significant overlap in our investment portfolio and the investment portfolio of other funds established by the Adviser or Sub-Adviser or their affiliates that could avail themselves of the exemptive relief.
In addition, we intend to file an application for an amendment to our existing Order to permit us to co-invest in our existing portfolio companies with certain affiliates that are private funds even if such other funds had not previously invested in such existing portfolio companies, subject to certain conditions. However, if filed, there is no guarantee that such application will be granted.
| CIM Real Assets & Credit Fund | Consolidated Notes to Financial Statements |
| | September 30, 2023 |
| | |
Total Return Swap Risk
The Fund has entered, and may enter into additional, total return swap (“TRS”) agreements that would expose the Fund to certain risks, including market risk, liquidity risk and other risks similar to those associated with the use of leverage. A TRS is a contract in which one party agrees to make periodic payments to another party based on the return of the assets underlying the TRS, which may include a specified security, basket of securities or securities indices during the specified period, in return for periodic payments based on a fixed or variable interest rate. A TRS is typically used to obtain exposure to a basket of securities or loans or market without owning or taking physical custody of such securities or loans or investing directly in such market. A TRS effectively adds leverage to our portfolio because, in addition to our total net assets, we would be subject to investment exposure on the amount of securities subject to the TRS. A TRS is also subject to the risk that a counterparty will default on its payment obligations thereunder or that we will not be able to meet our obligations to the counterparty. In addition, because a TRS is a form of synthetic leverage, such arrangements are subject to risks similar to those associated with the use of leverage.
Cyber-Security Risk and Identity Theft Risks
Cyber-security incidents and cyber-attacks have been occurring globally at a more frequent and severe level and will likely continue to increase in frequency in the future. The Advisers’ information and technology systems may be vulnerable to damage or interruption from computer viruses and other malicious code, network failures, computer and telecommunication failures, infiltration by unauthorized persons and security breaches, usage errors by their respective professionals or service providers, power, communications or other service outages and catastrophic events such as fires, tornadoes, floods, hurricanes and earthquakes. If unauthorized parties gain access to such information and technology systems, they may be able to steal, publish, delete or modify private and sensitive information. Although the Advisers have implemented various measures to manage risks relating to these types of events, such systems could be inadequate and, if compromised, could become inoperable for extended periods of time, cease to function properly or fail to adequately secure private information. Breaches such as those involving covertly introduced malware, impersonation of authorized users and industrial or other espionage may not be identified even with sophisticated prevention and detection systems, potentially resulting in further harm and preventing it from being addressed appropriately. The Advisers and/or the Fund may have to make a significant investment to fix or replace them. The failure of these systems and/or of disaster recovery plans for any reason could cause significant interruptions in the Advisers’, and/or the Fund’s operations and result in a failure to maintain the security, confidentiality or privacy of sensitive data, including personal information relating to shareholders and the intellectual property and trade secrets of the Advisers. Such a failure could harm the Advisers’ and/or the Fund’s reputation, subject any such entity and their respective affiliates to legal claims and adverse publicity and otherwise affect their business and financial performance.
A disaster or a disruption in the infrastructure that supports the Fund’s business, including a disruption involving electronic communications or other services used by the Fund or by third parties with whom the Fund conducts business, or directly affecting the Fund’s headquarters, could have a material adverse impact on the Fund’s ability to continue to operate its business without interruption. The Fund’s disaster recovery programs may not be sufficient to mitigate the harm that may result from such a disaster or disruption. In addition, insurance and other safeguards might only partially reimburse the Fund for its losses, if at all.
Third parties with which the Fund does business may also be sources of cyber-security or other technological risk. The Fund outsources certain functions and these relationships allow for the storage and processing of its information, as well as client, counterparty, employee, and borrower information. While the Fund engages in actions to reduce its exposure resulting from outsourcing, ongoing threats may result in unauthorized access, loss, exposure, destruction, or other cyber-security incident that affects its data, resulting in increased costs and other consequences as described above.
Foreign Investments’ Risks
The Fund has invested in, and may in the future make additional investments in securities, direct loans, Broadly Syndicated Loans and subordinated loans, of non-U.S. issuers or borrowers. These investments involve certain risks not involved in domestic investments and may experience more rapid and extreme changes in value than investments in U.S. companies. Markets for these investments in foreign countries often are not as developed, efficient or liquid as similar markets in the United States, and therefore, the prices of non-U.S. instruments may be more volatile. Certain foreign countries may impose restrictions on the ability of issuers of non-U.S. instruments to make payments of principal and interest to investors located outside the country, whether from currency blockage or otherwise. In addition, the Fund will be subject to risks associated with adverse political and economic developments in foreign countries, including seizure or nationalization of foreign deposits, different legal systems and laws relating to creditors’ rights and the potential inability to enforce legal judgments, all of which could cause the Fund to lose money on its foreign investments. Generally, there is less readily available and reliable information about non-U.S. issuers or borrowers due to less rigorous disclosure or accounting standards and regulatory practices. Investments in so-called “emerging markets” (or lesser developed countries) are particularly speculative and entail all of the risks of investing in non-U.S. securities but to a heightened degree. Compared to developed countries, emerging market countries may have relatively unstable governments, economies based on only a few industries and smaller securities and debt markets. Securities and debt issued by companies located in emerging market countries tend to be especially volatile and may be less liquid than securities and debt traded in developed countries. Additionally, companies in emerging market countries may not be subject to accounting, auditing, financial reporting and recordkeeping requirements that are as robust as those in more developed countries.
| CIM Real Assets & Credit Fund | Consolidated Notes to Financial Statements |
| | September 30, 2023 |
| | |
Foreign Real Estate and Real Estate-Related Investment Risk
We have invested and may make additional investments in real estate located outside of the United States and real estate debt issued in, and/or backed by real estate in, countries outside the United States, including Canada, countries in Western Europe, Central America and South America. Foreign real estate and real estate-related investments involve certain factors not typically associated with investing in real estate and real estate- related investments in the United States, including risks relating to (i) currency exchange matters, including fluctuations in the rate of exchange between the U.S. dollar and the various non-U.S. currencies in which such investments are denominated, and costs associated with conversion of investment principal and income from one currency into another; (ii) differences in conventions relating to documentation, settlement, corporate actions, stakeholder rights and other matters; (iii) differences between U.S. and non-U.S. real estate markets, including potential price volatility in and relative illiquidity of some non-U.S. markets; (iv) the absence of uniform accounting, auditing and financial reporting standards, practices and disclosure requirements and differences in government supervision and regulation; (v) certain economic, social and political risks, including potential exchange-control regulations, potential restrictions on non-U.S. investment and repatriation of capital, the risks associated with political, economic or social instability, including the risk of sovereign defaults, regulatory change, and the possibility of expropriation or confiscatory taxation or the imposition of withholding or other taxes on dividends, interest, capital gains, other income or gross sale or disposition proceeds, and adverse economic and political developments; (vi) the possible imposition of non-U.S. taxes on income and gains and gross sales or other proceeds recognized with respect to such investments; (vii) differing and potentially less well-developed or well-tested corporate laws regarding stakeholder rights, creditors’ rights (including the rights of secured parties), fiduciary duties and the protection of investors; (viii) different laws and regulations including differences in the legal and regulatory environment or enhanced legal and regulatory compliance; (ix) political hostility to investments by foreign investors; and (x) less publicly available information.
Emerging Market Investments Risk
The Fund has invested and may make additional investments in real estate or issuers in emerging markets, specifically certain markets in Central America or South America. Investing in emerging markets imposes risks different from, or greater than, risks of investing in foreign developed countries. These risks include (i) the smaller market capitalization of securities markets, which may suffer periods of relative illiquidity; (ii) significant price volatility; (iii) restrictions on foreign investment; and (iv) possible repatriation of investment income and capital. In addition, foreign investors may be required to register the proceeds of sales, and future economic or political crises could lead to price controls, forced mergers, expropriation or confiscatory taxation, seizure, nationalization, or the creation of government monopolies. The currencies of emerging market countries may experience significant declines against the U.S. dollar, and devaluation may occur subsequent to investments in these currencies by the Fund. Inflation and rapid fluctuations in inflation rates have had, and may continue to have, negative effects on the economies and securities markets of certain emerging market countries.
Certain emerging markets limit, or require governmental approval prior to, investments by foreign persons. Repatriation of investment income and capital from certain emerging markets is subject to certain governmental consents. Even where there is no outright restriction on repatriation of capital, the mechanics of repatriation may affect the operation of the Fund.
Additional risks of emerging markets investments may include (i) greater social, economic and political uncertainty and instability; (ii) more substantial governmental involvement in the economy; (iii) less governmental supervision and regulation; (iv) the unavailability of currency hedging technique;(v) companies that are newly organized and small; (vi) differences in auditing and financial reporting standards; which may result in unavailability of material information about issuers; and (vii) less developed legal systems. In addition, emerging securities markets may have different clearance and settlement procedures, which may be unable to keep pace with the volume of securities transactions or otherwise make it difficult to engage in such transactions. Settlement problems may cause the Fund to miss attractive investment opportunities, hold a portion of its assets in cash pending investment, or be delayed in disposing of a security. Such a delay could result in possible liability to a purchaser of the security.
NOTE 12 – Subsequent Events
Subsequent events after the date of the Financial Statements have been evaluated through the date the financial statements were available to be issued.
On October 13, 2023, the Fund completed a quarterly repurchase offer which resulted in 650,302, 6,753, 3,500 and 557 of Class I, Class A, Class C Shares and Class L Shares being repurchased for $15,899,882, $163,868, $82,524, and $13,358, respectively.
The Fund invested an additional $7,445,305 in investments. The Fund also added exposure to broadly syndicated loans under the total return swap transactions with a notional amount of $359,592.
On November 16, 2023, the Boad approved the extension of the termination date of the Expense Limitation Agreement to January 31, 2025. The Fund expects the Expense Limitation Agreement to continue in effect for successive twelve-month periods contingent on the annual approval of a majority of the Board.
Management has determined that there were no other subsequent events to report through the issuance of these financial statements.
Report of Independent Registered Public Accounting Firm
To the Board of Trustees and Shareholders of CIM Real Assets & Credit Fund
Opinion on the Financial Statements
We have audited the accompanying consolidated statement of assets and liabilities, including the consolidated schedule of investments, of CIM Real Assets & Credit Fund (the “Fund”) as of September 30, 2023, the related consolidated statements of operations and cash flows for the year ended September 30, 2023, the consolidated statements of changes in net assets for each of the two years in the period ended September 30, 2023, including the related notes, and the financial highlights for each of the three years in the period ended September 30, 2023 and for the period May 5, 2020 (commencement of operations) to September 30, 2020 (collectively referred to as the financial statements”). In our opinion, the financial statements present fairly, in all material respects, the financial position of the Fund as of September 30, 2023, the results of its operations and its cash flows for the year then ended, the changes in its net assets for each of the two years in the period ended September 30, 2023, and the financial highlights for each of the three years in the period ended September 30, 2023 and for the period May 5, 2020 (commencement of operations) to September 30, 2020 in conformity with accounting principles generally accepted in the United States of America.
Basis for Opinion
These financial statements are the responsibility of the Fund’s management. Our responsibility is to express an opinion on the Fund’s financial statements based on our audits. We are a public accounting firm registered with the Public Company Accounting Oversight Board (United States) (PCAOB) and are required to be independent with respect to the Fund in accordance with the U.S. federal securities laws and the applicable rules and regulations of the Securities and Exchange Commission and the PCAOB.
We conducted our audits of these financial statements in accordance with the standards of the PCAOB. Those standards require that we plan and perform the audit to obtain reasonable assurance about whether the financial statements are free of material misstatement, whether due to error or fraud.
Our audits included performing procedures to assess the risks of material misstatement of the financial statements, whether due to error or fraud, and performing procedures that respond to those risks. Such procedures included examining, on a test basis, evidence regarding the amounts and disclosures in the financial statements. Our audits also included evaluating the accounting principles used and significant estimates made by management, as well as evaluating the overall presentation of the financial statements. Our procedures included confirmation of securities owned as of September 30, 2023 by correspondence with the custodians and brokers; when replies were not received from brokers, we performed other auditing procedures. We believe that our audits provide a reasonable basis for our opinion.
/s/ PricewaterhouseCoopers LLP
Los Angeles, California
November 29, 2023
We have served as the auditor of one or more investment companies in CIM Group Investment Company Complex since 2019.
CIM Real Assets & Credit Fund | Additional Information |
| | September 30, 2023(Unaudited) |
PROXY VOTING POLICIES AND VOTING RECORD
Information regarding how the Adviser, or the Sub-Advisers, when applicable, voted proxies relating to the Fund’s portfolio securities is available: (1) without charge, upon request, by calling (866) 907-2653; and (2) on the SEC’s website at http://www.sec.gov. Information about how the Adviser, or the Sub-Advisers, when applicable, voted proxies with respect to the Fund’s portfolio securities during the most recent period ended June 30, 2021 can be obtained by making a written request for proxy voting information to: CIM Capital IC Management, LLC, 4700 Wilshire Boulevard, Los Angeles, CA, 90010
QUARTERLY PORTFOLIO HOLDINGS
The Fund files a complete listing of its portfolio holdings with the SEC as of the first and third quarters of each fiscal year as an exhibit to Form N-PORT. The Fund’s Form N-PORT filings are available upon request by calling 855-747-9559 or by contacting the Fund by mail at 4700 Wilshire Boulevard, Los Angeles, CA, 90010. You may also obtain a copy of each of the filings on the SEC’s website at http://www.sec.gov or on our website at https://www.cimgroup.com/investment-platforms/credit/racr.
CIM REAL ASSETS & CREDIT FUND – TRUSTEES AND OFFICERS
The Board is comprised of five Trustees, including three Independent Trustees. The name, age and principal occupations for the past five years of the Trustees and Executive Officers of the Fund are listed below. Additional information regarding the Fund’s Trustees is included in the Fund’s Statement of Additional Information, which can be obtained, without charge, by calling (866) 907-2653 or emailing racr@cimgroup.com.
INTERESTED TRUSTEES
The following Trustees are “interested persons” as defined in the 1940 Act (the “Interested Trustees”). The address for each Trustee is c/o CIM Real Assets & Credit Fund, 4700 Wilshire Boulevard, Los Angeles, California 90010.
| Name and Age | Position(s) Held
with the Fund | Term of Office
and Length of
Time Served(1) | Principal Occupation(s) During Past 5 Years | Number of
Portfolios in
Principal Fund
Complex(2)
Overseen by
Trustee | Other
Directorships
Held by Trustee |
David Thompson
Birth year: 1963 | Chairman of the Board of Trustees and Chief Executive Officer | 2019 | Mr. Thompson has been the Chief Executive Officer of the Fund since August 2019. In addition, Mr. Thompson is a Principal and Chief Financial Officer of CIM. As a Principal, Mr. Thompson serves on CIM’s Investment Committee, Investment Committee — Credit Subcommittee and Valuation Committee. He has also been Chief Executive Officer of Creative Media & Community Trust Corporation (Nasdaq: CMCT), a CIM- managed real estate investment trust that seeks to own, operate and develop premier multifamily and creative office assets in vibrant and emerging communities throughout the United States, since March 2019. Previously, Mr. Thompson served as the Chief Financial Officer of CMCT from March 2014 to March 2019. | 1 | None |
Bilal Rashid
Birth year: 1971 | Trustee | 2019 | Mr. Rashid is the Chairman of the Board and Chief Executive Officer of OFS Capital Corporation, the Chairman of the Board, President and Chief Executive Officer of Hancock Park Corporate Income, Inc. and OFS Credit Company, Inc., President and a Senior Managing Director of the OFS Sub-Adviser, Chief Executive Officer of Orchard First Source Asset Management Holdings, LLC (“Holdings”), and a member of Holdings’s executive committee. Mr. Rashid also serves on the Middle-Market Investment Committee, Broadly Syndicated Investment Committee and Structured Credit Investment Committee of the OFS Sub-Adviser. | 4 | None |
| (1) | The Trustees and Officers serve until their successors are duly elected and qualified. |
| (2) | The Fund Complex includes the Fund, OFS Capital Corporation (Nasdaq: OFS), a business development company managed by the OFS Sub- Adviser, OFS Credit Company (Nasdaq: OCCI), a registered investment company managed by the OFS Sub-Adviser, and Hancock Park Corporate Income, Inc., a business development company managed by the OFS Sub-Adviser. |
INDEPENDENT TRUSTEES
The following Trustees are not “interested persons” as defined in the 1940 Act (the “Independent Trustees”). The address for each Trustee is c/o CIM Real Assets & Credit Fund, 4700 Wilshire Boulevard, Los Angeles, California 90010.
| Name and Age | Term of Office and
Length of Time
Served(1) | Principal Occupation(s) During Past 5 Years | Number of
Portfolios in
Principal Fund
Complex(2)
Overseen by
Trustee | Other
Directorships
Held by Trustee |
Stephen O. Evans
Birth year: 1945 | 2019 | Mr. Evans served as a member of the Board of Directors of CIM Real Estate Finance Trust, Inc. (“CMFT”), a non-listed REIT that invests primarily in net lease core real estate assets as well as real estate loans and other credit investments, from December 2020 to December 2021. He served as a member of the board of directors of Cole Office & Industrial REIT (CCIT III), Inc. (“CCIT III”) from July 2016 until CCIT III’s merger with and into CMFT in December 2020. Since 2000, Mr. Evans has served as the president of Evans Realty Associates, a private real estate investment company. | 1 | Communities Southwest, Inc., a private land investment and development company |
Carol (“Lili”) Lynton
Birth year: 1961 | 2019 | Since 1992, Ms. Lynton has been an operating partner for The Dinex Group, which operates Daniel Boulud branded restaurants, and which she co-founded. Ms. Lynton also currently serves as the President and Chief Financial Officer of Lezen Acquisition, LLC, which is the owner of Arcadia Publishing Company. Further, Ms. Lynton has served as the chief investment officer of HD American Trust, a family investment office she started in 1987. | 1 | El Pollo Loco Holdings, Inc. (NASDAQ: EPL); Gaming and Leisure Properties, Inc. (NASDAQ: GLPI) and Phaidon Press, a private publishing company. |
Ashwin Ranganathan
Birth year: 1969 | 2019 | Mr. Ranganathan is the Founder and CEO of Sikander Capital, a multi-asset family office focused on equity, venture capital and real estate, which he started in 2013. Since January 2022, Mr. Ranganathan has served as a member of the Board of Directors, as a member of the Audit Committee, Nominating & Corporate Governance Committee and as Chairman of the Compensation Committee of OFS Capital Corporation and a member of the Board of Directors, the Audit Committee and Nominating & Governance Committee of Hancock Park Corporate Income, Inc. | 3* | None |
| (1) | The Trustees and Officers serve until their successors are duly elected and qualified. |
| (2) | The Fund Complex includes the Fund, OFS Capital Corporation and Hancock Park Corporate Income, Inc. |
EXECUTIVE OFFICERS WHO DO NOT SERVE AS A TRUSTEE
Information on each of the Fund’s Executive Officers who do not serve as a Trustee is provided below. The address for each Executive Officer is c/o CIM Real Assets & Credit Fund, 4700 Wilshire Boulevard, Los Angeles, California 90010.
| Name and Age | Position(s)
Held with
the Fund | Term of
Office and
Length of
Time
Served(1) | Principal Occupation(s) During Past 5 Years |
Barry Berlin
Birth year: 1960 | Chief Financial Officer, Treasurer and Secretary | Since 2022 | Mr. Berlin has been the Chief Financial Officer of CMCT since 2022. He has been the Executive Vice President of CMCT since October 2008, Chief Financial Officer of CMCT’s wholly-owned subsidiary lending business since 1992 and the Chief Executive Officer and Chairman of the Board of Directors of that business since 2020. In addition, Mr. Berlin was also Chief Financial Officer of PMC Capital, Inc., an affiliate of the predecessor of CMCT, from November 1992 to February 2004. PMC Capital, Inc. was a registered investment company under the 1940 Act that merged with and into CMCT’s predecessor in 2004 (with such predecessor as the surviving entity). Further, Mr. Berlin has served in various finance and accounting roles within CIM Group and its affiliates since 2017 and is currently a Managing Director of CIM Group and Chief Financial Officer of CIM Capital, LLC, an investment adviser registered with the Securities & Exchange Commission that is an affiliate of CIM Capital IC Management, LLC. Mr. Berlin earned a Bachelor of Science degree in Accounting from the University of Florida and is a certified public accountant. Mr. Berlin’s career began at Laventhol and Horwath in September 1982; he remained there until August 1986. From August 1986 to November 1992, Mr. Berlin was an audit manager with Imber and Company, Certified Public Accountants and its predecessor. |
Stephen Altebrando
Birth year: 1977 | Vice President, Portfolio Oversight | Since 2019 | Mr. Altebrando is First Vice President, Portfolio Oversight at CIM Group and is responsible for overseeing the composition, operations and investment priorities of the Fund and CMCT. Mr. Altebrando joined CIM Group in 2015 to oversee public capital markets across real estate and corporate credit strategies. Prior to joining CIM, he spent ten years as a senior research analyst covering the gaming, lodging and leisure sectors at Sidoti & Company, an institutional brokerage firm focused on small and mid- cap U.S. equities. Prior to his role as a sell-side securities analyst, Mr. Altebrando spent six years working in capital market roles at Schwab and the online division of Donaldson, Lufkin and Jenrette and Brokerage America. Mr. Altebrando earned a Bachelor of Science degree in Finance from Villanova University and received an MBA in Finance & Business Economics from the Fordham Graduate School of Business & Economics. |
Jordan Dembro
Birth year: 1978 | Assistant Secretary | Since 2020 | Mr. Dembo served as Secretary of the Fund from 2020 until 2022. He is a Principal and Chief Legal Officer within CIM Group’s legal department. In this capacity, Mr. Dembo oversees fund formation, assists with corporate governance and compliance oversight, and provides general advice on other legal issues affecting CIM Group and its investments. Prior to joining CIM Group in November 2011, Mr. Dembo was a Senior Associate in the Real Estate Department for four years at the Los Angeles office of Katten Muchin Rosenman. Prior to that, from 2005 to 2007, Mr. Dembo was an Associate at Cox, Castle & Nicholson, LLP. Mr. Dembo holds a B.B.A. in Real Estate from the University of Wisconsin-Madison and received a J.D. from UCLA, graduating Order of the Coif. Mr. Dembo was named a rising star by Super Lawyers from 2009-2011. |
Lisa Kustron
Birth year: 1981 | Chief Compliance Officer | Since November 2023 | Ms. Kustron has served as the Deputy Chief Compliance Officer of the Adviser and its other advisory’s affiliates since 2019. Ms. Kustron has been a First Vice President of CIM since 2021 and is responsible for overseeing CIM’s Advisers’ compliance programs and dedicated team of professionals. Prior to joining CIM in 2017, Ms. Kustron served as a Vice President of Compliance at Oaktree Capital Management. Her experience also includes global roles at Morningstar Investment Management. Ms. Kustron earned a Bachelor of Arts degree in Finance from the University of Northern Iowa. |
| (1) | The Officers serve until their successors are duly elected and qualified. |
| Privacy Policy |  |
| CIM Group | www.cimgroup.com |
At CIM Group, including its funds, general partners, managers, investment advisers, broker dealer and other affiliates (“CIM”, “our”, “us” or “we”), we are committed to maintaining the confidentiality and privacy of your personal and financial information. The purpose of this Privacy Policy is to explain the types of personal information that CIM collects, how the personal information is obtained, how it is used and the choices that you have regarding our use of, and your ability to review and correct, the personal information we collect about you, among other things.
This Privacy Policy applies to CIM business activities that involve the collection and processing of personal information, including users accessing our website or parties engaging in communications or transactions with CIM. Please read this Privacy Policy as it provides important information regarding your use of our website, our data and privacy practices, and an explanation of your rights. If you do not agree with this Privacy Policy, please do not access or use the website or otherwise provide us personal information.
Last updated: December 2022
| 1. | What Personal Information We Collect |
The personal information we collect from or about you may include the following:
| » | Addresses and other identifiers – such as name, postal address, email address, phone number, account name, date of birth, Social Security number, driver’s license number, photograph, passport number, or other similar identifiers |
| » | Protected status – such as citizenship, ethnic background, gender or other similar identifiers |
| » | Electronic Communication – such as email communications, text communications, or other similar identifiers |
| » | Financial information – such as bank account details, credit history, income details or other similar identifiers |
| » | Commercial information – such as records of personal property, products or services purchased, obtained, or considered, or other purchasing or consuming histories or tendencies or other similar identifiers |
| » | Education or other professional information, including veteran status or other similar information |
| » | Inferences drawn from personal information – such as individual profiles, preferences, characteristics, behaviors or other similar identifiers |
Whether you choose to provide any particular information requested by CIM is completely your own choice. But, if you choose not to provide the information we request, you may be unable to receive or access certain services, offers and information.
We do not sell or share personal information, as those terms are defined in the California Consumer Privacy Act, as amended (“CCPA”).
We may collect your personal information for the following purposes:
| » | Manage and administer your holding of interests in a fund, and any related accounts on an ongoing basis |
| » | Assess and process any applications or requests made by you |
| » | Open, maintain or close accounts in connection with your investment in, or redemption from, the fund scheme |
| » | Send updates, information and notices or otherwise correspond |
with you in connection with your investment in the fund scheme
| » | Address or investigate any complaints, claims, proceedings or disputes |
| » | Provide you with, and inform you about, our investment products and services |
| » | Send direct marketing communications to you |
| » | Comply with applicable regulatory, accounting, tax and audit requirements |
| » | Manage our risk and operations |
| » | Assist with internal compliance with our policies and process |
| » | Protect our business against fraud, breach of confidence, theft of proprietary materials, and other financial or business crimes (to the extent that this is not required of us by law) |
| » | Facilitate business asset transactions involving the fund partnership or fund-related vehicles |
| » | Monitor communications to/from us using our systems |
We keep your personal information for as long as it is required by us for our legitimate business purposes, to perform our contractual obligations, to comply with regulatory requirements, in connection with any investment you are involved in, and in accordance with our data retention schedule. We may retain your personal information for a longer period if doing so is necessary to comply with our legal or reporting obligations, or as otherwise permitted or required by law. We may also retain your personal information in a deidentified or aggregated form so that it can no longer be associated with you. To determine the appropriate retention period for your personal information, we consider various factors, such as the amount, nature, and sensitivity of your information; the potential risk of unauthorized access, use or disclosure; the purposes for which we collect or process your personal information; and applicable legal requirements.
Our website functions are based, in part, on your browser’s ability to accept cookie files. Cookies are pieces of information that a website transfers to your hard drive that allow you to more easily navigate a website and customize website features that are updated each time you visit a website. Our web servers may automatically recognize a visitor’s domain name (such as .com, .edu, etc.), the web page from which a visitor enters our website,
| 2 | CIM Group Privacy Policy |
which pages a visitor visits on our website and on certain other websites, and/or how much time a visitor spends on each page. We may also use cookies to track you or your online activities over time or across websites. We aggregate this information and use it to evaluate and improve our website, or to support our advertising practices.
You may set your preferences to refuse cookies; however, this may limit your access to some areas of our website. If you have enabled your Internet browser to refuse cookies, we will not collect personal information about you. However, we do not respond to browser do-not-track signals.
| 5. | Collecting the Personal Information of Minors |
Our products and services are not directed to minors under the age of 16, and we do not knowingly collect or sell the personal information of minors.
| 6. | Your Choices Regarding Direct Marketing |
On occasion, we may use your personal information for direct marketing purposes and/or provide your personal information to affiliates for direct marketing purposes (e.g., to provide you with information, products and services that may be of interest to you in the context of the investment-related activities, when raising investments into our funds, in connection with future fundraising activities). If you do not wish to receive such marketing communications from us, please let us know that you would like to “opt out” by emailing us at privacy@cimgroup.com, contacting us at 1-833-687-3621 or using this webform.
Some email communications from us include instructions on how to stop receiving them. Please follow these instructions if you no longer wish to receive such email messages from us.
We endeavor, in good faith, to adhere to self-regulatory advertising principles, such as the Digital Advertising Alliance’s Principles. If you are interested in learning more about and/or opting out of online behavioral advertising, sometimes called interest-based advertising, we encourage you to visit one of the advertising industry-developed opt-out pages, such as www.youradchoices.com or aboutads.info. Please note, we provide these links for your convenience only, we do not have access to, or control over, these sites’ use of cookies or other tracking technologies.
| 8. | Protecting Your Personal Information |
We implement and maintain reasonable data security safeguards appropriate to the nature of the personal information that we collect, use, retain, transfer or otherwise process. Our policy is to restrict access to your personal information to only those employees, service providers and other third parties who need to know that information to provide products or services to you. We maintain commercially reasonable physical, technical, and administrative safeguards consistent with industry standards and other applicable standards as required by law and we require service providers and third parties to do the same.
While we are committed to developing, implementing, maintaining, monitoring and updating a reasonable information security program, unfortunately, no data transmission over the Internet or any wireless network can be guaranteed to be 100%
secure. Data security incidents and breaches can occur due to vulnerabilities, criminal exploits or other factors that cannot reasonably be prevented. Accordingly, while our reasonable security program is designed to manage data security risks and thus help prevent data security incidents and breaches, it cannot be assumed that the occurrence of any given incident or breach results from our failure to implement and maintain reasonable security. As a result, while we strive to protect your personal information, you acknowledge that: (a) there are security and privacy limitations of the Internet which are beyond our control; (b) the security, integrity, and privacy of any and all information and data exchanged between you and us through the website cannot be guaranteed; and (c) any such information and data may be viewed or tampered with in transit by a third party.
| 9. | Links to Third-Party Websites |
Our websites may contain links to websites operated and maintained by third parties, over which we have no control. Privacy policies on such linked websites may be different from our Privacy Policy. You access such linked websites at your own risk. You should always read the Privacy Policy of a linked website before disclosing any personal information on such website.
To improve the services we can offer you, and in connection with changes in our business operations, CIM may opt to expand or modify our capabilities for obtaining and processing information, including personal information, about users in the future. CIM will update this Privacy Policy when necessary to ensure that you are aware of developments in this area.
We will post those changes on our websites and update our Privacy Policy so that you will know what information we collect, how we use it and what choices you have. Regardless of any changes we make to our Privacy Policy, we will always use your personal information in accordance with the version of the Privacy Policy in place at the time you provided your information, unless you give your express consent for us to do otherwise or as otherwise permitted or required by applicable law.
| 11. | Additional Privacy Terms |
In conducting business with CIM or when using our websites, you may be required to agree to additional written or electronic agreements, including additional privacy terms and conditions (“Additional Privacy Terms”), as a condition to visiting the websites or receiving products, services and/or other information. In the event of any conflict between the Additional Privacy Terms and this Privacy Policy, the Additional Privacy Terms shall prevail but we will treat personal information that you provide to us before we adopt such Additional Privacy Terms in accordance with the terms of this Privacy Policy, unless and until you agree with the application of the Additional Privacy Terms to your personal information collected by us prior to the updates or amendments or as otherwise permitted or required by applicable law.
To help us improve our Privacy Policy and practices, please give us your feedback by emailing us at privacy@cimgroup.com, contacting us at 1-833-687-3621 or using this webform.
| 3 | CIM Group Privacy Policy |
| 13. | California Privacy Rights and Disclosures |
This California Privacy Rights and Disclosure section addresses legal obligations and rights specified in the California Consumer Privacy Act, or CCPA, as amended. For the purposes of this section (California Privacy Rights and Disclosures), personal information means information that identifies, relates to, describes, is reasonably capable of being associated with, or could be reasonably linked, directly or indirectly, with a particular consumer or household. If you need access to this privacy policy in a different format for accessibility reasons, please email us at privacy@cimgroup.com, contact us at 1-833-687-3621 or use this webform.
These obligations and rights apply to businesses doing business in California and to California residents and information that identifies, relates to, describes, is reasonably capable of being associated with, or could reasonably be linked, directly or indirectly, with California consumers or households. It does not include deidentified or aggregate information, publicly available information, or lawfully obtained, truthful information that is a matter of public concern.
The following chart describes the categories of personal information we may collect or have collected about you in the past 12 months and, for each category, where and why we collect it, and the categories of entities to whom we disclose the personal information, if any:
Category of
Personal Information (PI) | Sources From Which
PI is/was Collected | Purpose of Collection | Categories of Entities with
Whom PI is/was Disclosed |
Address and other identifiers – such as name, postal address, email address, phone number, account name, date of birth, Social Security number, driver’s license number, photograph, passport number, or other similar identifiers NOTE: The information in this category may include the following elements of Sensitive Personal Information: social security number, driver’s license number, state identification card number, and/or passport number. | » Directly from you; » Automatically when you use our Site or services; » From third parties; including business partners, your employer, tax authorities and background/credit check providers; and » Publicly available sources | » To provide you services; » To contact you to discuss the services or products you receive from us; » To respond to any questions or concerns you have raised; » To deal with administrative matters such as capital calls or redemptions; » To perform services on our behalf, such as customer service, processing or fulfilling orders,; » To otherwise carry out our obligations arising under our contract with you and to enforce the same; » To carry out anti-money laundering and other compliance checks and controls; » To verify your identity or for other fraud and/or crime prevention; » To debug errors in our systems; » For marketing and advertising purposes; and » For internal research, analytics and development. | » Professional advisers, including depositories, administrators, custodians, investment advisers, accountancy and legal firms, in order to provide us with advice and services; » Service providers, including to provide and support our data management, analytics, security, background and credit checks, and storage systems; » Group companies, for business, marketing and operational purposes; » Transaction (merger and acquisition) partners, including to facilitate the diligence, negotiation, and completion phases of transactions contemplated by us, our parent company, or affiliated operating companies; and » Government authorities or other entities with legal authority to request the information |
Protected status – such as citizenship, ethnic background, gender or other similar identifiers NOTE: The information in this category may include the following elements of Sensitive Personal Information: racial, ethnic, or national origin. | » Directly from you; » From third parties; including business partners, your employer and background/credit check providers; and » Publicly available sources | » To provide you services; » To contact you to discuss the services or products you receive from us; » To respond to any questions or concerns you have raised; » To deal with administrative matters; » To perform services on our behalf; » To otherwise carry out our obligations arising under our contract with you and to enforce the same; » To carry out anti-money laundering and other compliance checks and controls; and » To verify your identity or for other fraud and/or crime prevention. | » Professional advisers, including depositories, administrators, custodians, investment advisers, accountancy and legal firms, in order to provide us with advice and services; » Service providers, including to provide and support our data management, analytics, security, background and credit checks, and storage systems; » Group companies, for business, marketing and operational purposes; » Transaction (merger and acquisition) partners, including to facilitate the diligence, negotiation, and completion phases of transactions contemplated by us, our parent company, or affiliated operating companies; and » Government authorities or other entities with legal authority to request the information |
| 4 | CIM Group Privacy Policy |
Category of Personal Information (PI) | Sources From Which PI is/was Collected | Purpose of Collection | Categories of Entities with
Whom PI is/was Disclosed |
Electronic Communication such as email communications and text messages NOTE: The information in this category may include the following elements of Sensitive Personal Information: the contents of mail, email, or text messages, to which the business was not the intended recipient. | » Automatically when you use our Site or services | » To debug errors in our systems; » For marketing and advertising purposes; and » For internal research, analytics and development. | » Group companies, for business, marketing and operational purposes |
Financial information such as bank account details, credit history, income details, assets and investment experience, risk tolerance or other similar identifiers NOTE: The information in this category may include the following elements of Sensitive Personal Information: log-in, financial account, debit card, or credit card number, in combination with any required security or access code, password, or credential allowing access to an account. | » Directly from you; » From your employer; » Automatically when you use our Site or services; » From third parties acting on your behalf; including business partners, accountancy and law firms; and » Background/credit check providers | » To provide you services; » To deal with administrative matters such as invoicing, renewal or to audit customer transactions; » To perform services on our behalf, such as processing capital calls or redemptions; » To otherwise carry out our obligations arising under our contract with you and to enforce the same; » To carry out anti-money laundering and other compliance checks and controls; and » To verify your identity or for other fraud and/or crime prevention. | » Professional advisers, including depositories, administrators, custodians, investment advisers, accountancy and legal firms, in order to provide us with advice and services; » Service providers, including to provide and support our data management, analytics, security, and storage systems; » Group companies, for business, marketing and operational purposes; » Transaction partners, including to facilitate the diligence, negotiation, and completion phases of transactions contemplated by us, our parent company, or affiliated operating companies; and » Government authorities or other entities with legal authority to request the information |
| Commercial information – such as records of personal property, products or services purchased, obtained, or considered, or other purchasing or consuming histories or tendencies or other similar identifiers | » Directly from you; » Automatically when you use our Site or services; » From third parties acting on your behalf; including business partners and law firms; and » Through publicly available sources | » To provide you services; and » To otherwise carry out our obligations arising under our contract with you and to enforce the same. | » Professional advisers, including depositories, administrators, custodians, investment advisers, accountancy and legal firms, in order to provide us with advice and services; » Group companies, for business, marketing and operational purposes; » Transaction partners, including to facilitate the diligence, negotiation, and completion phases of transactions contemplated by us, our parent company, or affiliated operating companies; and » Government authorities or other entities with legal authority to request the information |
Education or other professional information, including veteran status or other similar identifiers NOTE: The information in this category may include the following elements of Sensitive Personal Information: union membership. | » Directly from you; » From your employer; and » Through publicly available sources | » To provide you services; and » To otherwise carry out our obligations arising under our contract with you and to enforce the same. | » Group companies, for business, marketing and operational purposes; » Transaction partners, including to facilitate the diligence, negotiation, and completion phases of transactions contemplated by you, us, our parent company, or affiliated operating companies; and » Government authorities or other entities with legal authority to request the information |
| Inferences drawn from CCPA PI – such as individual profiles, preferences, characteristics, behaviors or other similar identifiers | » Directly from you; » Automatically when you use our Site or services; and » From third parties; including business partners or firms acting on your behalf | » To provide you services; » To contact you to discuss the services or products you receive from us; » To respond to any questions or concerns you have raised; » To deal with administrative matters; » To perform services on your behalf, such as booking travel arrangements; » To otherwise carry out our obligations arising under our contract with you and to enforce the same; » For marketing and advertising purposes; and » For internal research, analytics and development | » Group companies, for business, marketing and operational purposes |
| 5 | CIM Group Privacy Policy |
| a. | Your Right to Request Disclosure of Information We Collect and Disclose about You |
If you are a California resident, the CCPA grants you the right to request certain information about our practices with respect to personal information. In particular, you can request the following:
1. The categories of your personal information that we’ve collected.
2. The specific pieces of your personal information that we’ve collected.
3. The categories of sources from which we collected your personal information.
4. The categories of your personal information that we’ve sold or disclosed for a business purpose.
5. The business or commercial purposes for which we collected, sold or shared your personal information.
6. The categories of third parties to whom we’ve disclosed your personal information.
To exercise your CCPA right to request this information, either email us at privacy@cimgroup.com, contact us at 1-833-687-3621 or use this webform. These requests for disclosure are generally free.
b. Your Right to Request the Deletion of Personal Information
Upon your request, and subject to certain exceptions, we will delete, and direct applicable service providers to delete, the personal information we have collected about you.
To exercise your right to request the deletion of your personal information, either email us at privacy@cimgroup.com, contact us at 1-833-687-3621 or use this webform. These requests for deletion are generally free.
c. Your Right to Ask Us Not to Sell or Share Your Personal Information
We do not, and will not, sell or share your personal information.
d. Your Right to Request the Correction of Your Personal Information
Upon your request, and subject to certain limitations, we will correct any inaccurate personal information we maintain about you.
To exercise your right to request the correction of your personal information, either email us at privacy@cimgroup.com, contact us at 1-833-687-3621 or use this webform. These requests for correction are generally free.
e. Our Use or Disclosure of Sensitive Personal Information
We only use and disclose Sensitive Personal Information for the purposes set forth in Section 7027(m) of the CCPA regulations.
f. Our Support for the Exercise of Your Data Rights
We are committed to providing you control over your personal information. If you exercise any of these rights explained in this section of the Privacy Policy, we will not disadvantage you. You will not be denied or charged different prices or rates for goods or services or provided a different level or quality of goods or services.
g. How We Will Handle a Request to Exercise Your Rights
For requests for access or deletion, we will first acknowledge receipt of your request. We will provide a substantive response to your request as soon as we can, generally within 45 days from when we receive your request, although we may be allowed to take longer to process your request under certain circumstances. If we expect your request is going to take us longer than normal to fulfil, we’ll let you know.
When you make a request to access, correct, or delete your personal information, we will take steps to verify your identity. These steps may include asking you for personal information, such as your name, address, or other information we maintain about you. If we are unable to verify your identity with the degree of certainty required, we will not be able to respond to the request. We will notify you to explain the basis of the denial.
You may also designate an authorized agent to submit requests on your behalf. If you do so, you will be required to verify your identity by providing us with certain personal information as described above. Additionally, we will also require that you provide the agent with written permission to act on your behalf, and we will deny the request if the agent is unable to submit proof to us that you have authorized them to act on your behalf.
14. European Privacy Rights and Disclosures
This European Privacy Rights and Disclosure section addresses legal obligations and rights specified in the General Data Protection Regulation, or GDPR. These obligations and rights apply to individuals who are located in the European Economic Area. This section describes the policies and procedures followed by CIM regarding the collection, use and disclosure of your personal data when you visit the website, or otherwise interact with CIM. For the purposes of this section (European Privacy Rights and Disclosures), personal data means any information relating to an identified or identifiable natural person, either directly or indirectly.
According to the GDPR, CIM is the controller of your personal data.
a. Collection of Your Personal Data
When you visit the website, receive services from us or otherwise interact with us, we may collect the following personal data about you: your name, postal address, email address, phone number, account name, date of birth, Social Security number, driver’s license number, photograph, passport number, employer, job title, bank account information, financial information such as your income and net worth, risk tolerance and transaction history, details about your investment activity or retirement portfolios and information about your transactions with us such as the investment amount and any contributions and/or distributions, as well as any other information you choose to provide to us.
Where CIM carries out background checks on certain individuals for a business purpose, this may involve the processing of data relating to criminal convictions and offences. This data will only be processed where such processing is specifically required or authorized by law.
| 6 | CIM Group Privacy Policy |
b. Use of Your Personal Data
We may use the personal data you give us to carry out the following purposes:
To contact you and to respond to your requests and enquiries when you contact us or subscribe to receive email alerts: We have a legitimate interest to respond to your requests and enquiries for ongoing business administration.
To deliver services to you: To manage and perform our contract with you.
For business administration, including statistical analysis: We have a legitimate interest to properly manage and administer our relationship with you and to ensure that we are effective and efficient.
To personalise your visit to the website and to assist you while you use the websites: We have a legitimate interest to properly manage and administer our relationship with you and to ensure that we are effective and efficient.
To improve the website by helping us understand who uses the websites: We have a legitimate interest to properly manage and administer our relationship with you and to ensure that we are effective and efficient.
For fraud prevention and detection and to comply with applicable laws, regulations or codes of practice: To comply with our legal obligations.
c. Sharing Your Personal Data
We may share your personal information with others, but only in certain limited situations, including: (i) within our corporate group or among our affiliated entities, all of which follow this Privacy Policy or equivalent privacy policies; (ii) with our service providers or other parties who agree to keep your personal information confidential and use it only on behalf of CIM; (iii) if your investment is transferred from your current custodian to another custodian, we provide your contact details, tax identification number and other personal information contained within transfer documents to the new custodian on your behalf; and (iv) as otherwise agreed by you. Third parties with whom we share your personal information are bound to comply with similar and equally stringent undertakings of privacy and confidentiality.
In some cases, we may be required to disclose certain personal information to comply with legal or regulatory obligations; to comply with the charter of the applicable entity into which you invest; to detect and protect against fraud, or any technical or security vulnerabilities; for an investigation or a legal process, such as a court order or subpoena; to respond to an emergency; or otherwise to protect the rights, property, safety, or security of third parties, visitors to the website, our businesses, or the public. In addition, CIM may disclose certain personal information to any third party that acquires, or is interested in acquiring, all or part of CIM’s assets or shares, or that succeeds CIM in carrying on all or a part of its business, whether by merger, acquisition, reorganization or otherwise.
d. International Transfers
When you are based in the European Union (the “EU”), personal data collected from you, including via the websites may be transferred to certain recipients located outside the EU, which do not provide a similar or adequate level of protection to that provided by countries in the EU. You hereby consent to the transfer of your personal data to recipients as described in this Privacy Policy which are located outside of the EU. You may withdraw your consent at any time. The withdrawal of consent shall not affect the lawfulness of processing based on consent before its withdrawal.
e. Rights of Individuals
You may have certain data privacy rights which may be subject to limitations and/or restrictions. These rights include the right to: (i) request access to and rectification and erasure of your personal data; (ii) obtain restriction of processing or to object to processing of your personal data; and (iii) ask for a copy of your personal data to be provided to you, or a third party, in a digital format. You also have the right to lodge a complaint about the processing of your personal data with your local data protection authority. If you would like to exercise any of these rights, please feel free to email us at privacy@cimgroup.com, contact us at 1-833-687-3621 or use this webform.
15. Canadian Privacy Rights and Disclosures
If you are in Canada, you have a right to request access to your personal information and to request a correction to it if you believe it is inaccurate. To exercise these rights, please email us at privacy@cimgroup.com, contact us at 1-833-687-3621 or use this webform. Please note, however, that in some cases we may not be able to allow you to access certain personal information in certain circumstances, for example if it contains personal information of other persons, or for legal reasons.
When you make a request to exercise your rights, we will take steps to verify your identity. These steps may include asking you for personal information, such as your name, address, or other information we maintain about you. If we are unable to verify your identity with the degree of certainty required, we will not be able to respond to the request. We will notify you to explain the basis of the denial.
For information on withdrawing your consent to the processing of your personal information, please email us at privacy@cimgroup.com, contact us at 1-833-687-3621 or use this webform.
Please note that some or all of the personal information we collect may be stored or processed on servers located outside Canada and your jurisdiction of residence, including in the United States, whose data protection laws may differ from the jurisdiction in which you live. As a result, this information may be subject to access requests from governments, courts, or law enforcement in those jurisdictions according to laws in those jurisdictions.
| 4700 Wilshire Boulevard, Los Angeles, CA 90010 | 833-687-3621 | www.cimgroup.com/privacy-policy | ©2022 |
CORP-PRVC-2 (12/22)
Item 2. Code of Ethics.
As of the end of the period covered by this report, CIM Real Assets & Credit Fund (the “Registrant”) has adopted a Sarbanes-Oxley Code of Business Conduct that applied to the Registrant’s principal executive officer, principal financial officer, and certain other people (the “SOX Code of Business Conduct”). The Registrant did not amend, or grant any waivers from, any provisions of the SOX Code of Business Conduct during the period covered by this report. A copy of the Registrant’s SOX Code of Business Conduct is available, free of charge, by making a written request to: CIM Real Assets & Credit Fund, 4700 Wilshire Boulevard, Los Angeles, California 90010, or by calling the Fund at (866) 907-2653.
Item 3. Audit Committee Financial Expert.
As of the end of the period covered by the report, the Registrant’s Board of Trustees has determined that Carol (“Lili”) Lynton is qualified to serve as an audit committee financial expert serving on its audit committee based on her
experience in financial and accounting matters, and has determined that she is “independent,” as defined in paragraph (a)(2) of Item 3 of Form N-CSR.
Item 4. Principal Accountant Fees and Services.
(a) Audit Fees – The aggregate fees billed for the last two fiscal years ended September 30, 2023 and September 2022 for professional services rendered by PricewaterhouseCoopers LLP (“PwC”), the principal accountant for the audit of the Registrant’s annual financial statements, or services that are normally provided by the accountant in connection with statutory and regulatory filings or engagements were $396,400 and $359,500, respectively.
(b) Audit-Related Fees – The aggregate fees billed for the last two fiscal years ended September 30, 2023 and September 30, 2022 for assurance and related services by PwC that are reasonably related to the performance of the audit of the Registrant’s financial statements and which are not reported under (a) of this Item were $0 for both periods.
(c) Tax Fees – The aggregate fees billed in the last two fiscal years ended September 30, 2023 and September 30, 2022 for professional services rendered by Cohen & Company and PwC for the review of the Registrant’s income tax returns, excise tax returns and dividend calculations were $114,330 and $62,300, respectively.
(d) All Other Fees – The aggregate fees billed for the two last fiscal years ended September 30, 2023 and September 30, 2022 for products and services provided by PwC, other than the services reported in (a) through (c) of this Item, were $0 and $0, respectively.
(e)(1) The Registrant’s Audit Committee has adopted written policies relating to the pre-approval of audit and permitted non-audit services to be performed by the Registrant’s independent registered public accounting firm. Under the policies, on an annual basis, the Registrant’s Audit Committee reviews and pre-approves proposed audit and permitted non-audit services to be performed by the independent registered public accounting firm on behalf of the Registrant.
(e)(2) No services described in paragraphs (b) through (d) were approved pursuant to paragraph (c)(7)(i)(C) of Rule 2-01 of Regulation S-X.
(f) Not Applicable
(g) The aggregate non-audit fees billed by PwC for services rendered to the Registrant, and rendered to the Registrant’s investment adviser, and any entity controlling, controlled by, or under common control with the investment adviser that provides ongoing services to the Registrant for the last fiscal year of the Registrant were $0 and $0 in 2023 and 2022, respectively.
(h) Not applicable.
(i) Not applicable.
(j) Not applicable.
Item 5. Audit Committee of Listed Registrants.
(a) Not applicable. The Fund is not a listed issuer as defined in Rule 10A-3 under the Securities Exchange Act of 1934, as amended (the “Exchange Act”).
(b) Not applicable. The Fund is not a listed issuer as defined in Rule 10A-3 under the Exchange Act.
Item 6. Investments.
(a) The Registrant’s full schedule of investments as of September 30, 2023 is included as part of the annual report to stockholders included in Item 1 of this Form N-CSR.
(b) Not applicable.
Item 7. Financial Statements and Financial Highlights for Open-End Management Investment Companies.
Item 8. Changes in and Disagreements with Accountants for Open-End Management Investment Companies.
Not applicable.
Item 9. Proxy Disclosures for Open-End Management Investment Companies.
Not applicable.
Item 10. Remuneration Paid to Directors, Officers, and Others of Open-End Management Investment Companies.
Not applicable.
Item 11. Statement Regarding Basis for Approval of Investment Advisory Contract.
Not applicable.
Item 12. Disclosure of Proxy Voting Policies and Procedures for Closed-End Management Investment Companies.
The Registrant’s Board of Trustees has delegated the voting of proxies for Fund securities to CIM Capital IC Management, LLC, a Delaware limited liability company (the “Adviser”), the Fund’s investment adviser, with assistance from each of the Fund’s sub-advisers, CIM Capital SA Management, LLC, a Delaware limited liability company (the “CIM Sub-Adviser”), and OFS Capital Management, LLC, a Delaware limited liability company (the “OFS Sub-Adviser”, and, together with the CIM Sub-Adviser, the “Sub-Advisers”) as appropriate. The Adviser votes proxies relating to the Fund’s portfolio securities in what the Adviser perceives to be the best interest of its clients. The Adviser reviews on a case-by-case basis each proposal submitted to a shareholder vote to determine its effect on the portfolio securities held by its clients. In most cases the Adviser will vote in favor of proposals that the Adviser believes are likely to increase the economic value of the underlying portfolio securities held by the Adviser’s clients. Although the Adviser will generally vote against proposals that may have a negative effect on its clients’ portfolio securities, the Adviser may vote for such a proposal if there exist compelling long-term reasons to do so.
The Adviser’s proxy voting decisions are made by those senior officers who are responsible for monitoring each of its clients’ investments. When appropriate, the Adviser solicits assistance from senior officers of the applicable Sub-Adviser in making proxy voting decisions. To ensure that the Adviser’s vote is not the product of a conflict of interest, the Adviser requires that (1) anyone involved in the decision-making process disclose to the Adviser’s chief compliance officer any potential conflict that he or she is aware of and any contact that he or she has had with any interested party regarding a proxy vote; and (2) employees involved in the decision-making process or vote administration are prohibited from revealing how the Adviser intends to vote on a proposal in order to reduce any attempted influence from interested parties. Where conflicts of interest may be present, the Adviser will disclose such conflicts to its client, including with respect to the Fund, the Independent Trustees and the Adviser may request guidance from such persons on how to vote such proxies for their account.
Item 13. Portfolio Managers of Closed-End Management Investment Companies.
(a)(1) Information regarding the portfolio managers primarily responsible for the day-to-day management of the Fund’s portfolio as of the date hereof is set forth below. Each of the portfolio managers listed below has served as a portfolio manager since the Fund’s inception.
The Adviser and CIM Sub-Adviser – Members of the CIM Investment Committee and other Professionals:
Richard Ressler is the founder and President of Orchard Capital Corporation (“Orchard Capital”), a firm through which Mr. Ressler oversees companies in which Orchard Capital or its affiliates invest. Through his affiliation with Orchard Capital, Mr. Ressler serves in various senior capacities with, among others, CIM Group, L.P. (together with its controlled affiliates, “CIM”), a community-focused real estate and infrastructure owner, operator, lender and developer, Orchard First Source Asset Management Holdings, LLC, a holding company of asset management businesses, and Orchard First Source Asset Management, LLC (together with its controlled affiliates, “OFSAM”), which provides personnel staffing to OFS Capital Management, LLC, a registered investment adviser focusing primarily on investments in middle market and broadly syndicated US loans, debt and equity positions in collateralized loan obligations and other structured credit investments, OFS CLO Management, LLC, a registered investment adviser focusing primarily on investments in broadly syndicated US loans, and OCV Management, LLC (“OCV”), an investor, owner and operator of technology companies. Mr. Ressler also serves as a board member for various public and private companies in which Orchard Capital or its affiliates invest. Mr. Ressler served as non-executive chairman of the board of Ziff Davis, Inc. (NASDAQ: ZD), formerly known as j2Global, Inc., from 1997 until May 2022. In addition, he has also served as the Chief Executive Officer and President and as a director of CIM Real Estate Finance Trust, Inc. (“CMFT”), a non-listed REIT operated by an affiliate of CIM that invests in net lease core real estate assets as well as real estate loans and other credit investments, since February 2018, and has served as Chairman of its board of directors since August 2018. Mr. Ressler has served as the chairman of the investment risk management committee of CMFT since April 2022 and served as a member of the nominating and corporate governance committee from August 2018 to March 2022. Mr. Ressler has served as Chairman of the Board of Creative Media & Trust Corporation (Nasdaq: CMCT), a real estate investment trust that owns, operates and develops premier multifamily and creative office assets in vibrant communities throughout the United States, since 2014. Mr. Ressler served as the Chief Executive Officer, President and a director of CIM Income NAV, Inc. (“CIM Income NAV”) from February 2018 to December 2021 and as Chairman of the board of directors of CIM Income NAV from August 2018 to December 2021 until CIM Income NAV’s merger with and into CMFT in December 2021. Mr. Ressler served as the Chief Executive Officer and President and as a director of Cole Office & Industrial REIT (CCIT III), Inc. (“CCIT III”) from February 2018 and as chairman of its board of directors from August 2018 until CCIT III’s merger with and into CMFT in December 2020. Mr. Ressler also served as a director of Cole Office & Industrial REIT (CCIT II), Inc. (“CCIT II”) from January 2019 until CCIT II’s merger with Griffin Realty Trust, Inc. (“GRT”) in March 2021 and as a director of Cole Credit Property Trust V, Inc. (“CCPT V”) from January 2019 to October 2019.
Mr. Ressler co-founded CIM Group, L.P. in 1994 and serves as the Executive Chairman of CIM and as an officer of various affiliates of CIM, including our manager. He chairs CIM’s Executive, Investment, Allocation and Real Asset Management Committees. Mr. Ressler co-founded the predecessor of OFSAM in 2001 and chairs its executive committee. Mr. Ressler co-founded OCV in 2016 and chairs its executive committee. Prior to founding Orchard Capital, from 1988 until 1994, Mr. Ressler served as Vice Chairman of Brooke Group Limited, the predecessor of Vector Group, Ltd. (NYSE: VGR) and served in various executive capacities at VGR and its subsidiaries. Prior to VGR, Mr. Ressler was with Drexel Burnham Lambert, Inc., where he focused on merger and acquisition transactions and the financing needs of middle-market companies. Mr. Ressler began his career in 1983 with Cravath, Swaine and Moore LLP, working on public offerings, private placements, and merger and acquisition transactions. Mr. Ressler holds a B.A. from Brown University, and J.D. and M.B.A. degrees from Columbia University
Avraham Shemesh is a Co-Founder, Principal and President of CIM’s Real Asset Management division with more than 30 years of active real estate, infrastructure and lending experience. Since co-founding CIM Group, L.P. in 1994, Mr. Shemesh has been instrumental in building CIM Group, L.P.’s real estate, infrastructure and debt platforms. He serves on CIM Group, L.P.’s Investment, Allocation, Valuation and Real Assets Management Committees as well as the Investment Committee – Credit Subcommittee (“ICCS”), providing guidance on the diverse opportunities available across CIM’s various platforms and acts in various senior capacities within CIM Mr. Shemesh is responsible for CIM’s long-time relationships with strategic institutions and oversees teams essential to acquisitions, portfolio management and internal and external communication. He serves as an officer of various affiliates of CIM. In addition,
Mr. Shemesh has served as a director of CMFT since March 2019. He has also served as a director of CMCT since 2014. He served as a director of CIM Income NAV from January 2019 to December 2021. He also served as the Chief Executive Officer and President and as a director of CCIT II from February 2018, and as Chairman of the board of directors of CCIT II from August 2018 until CCIT II’s merger with GRT in March 2021. Until the mergers of such entities with and into CMFT in December 2020, he served as the Chief Executive Officer and as a director of CCPT V beginning in March 2018, as Chairman of the board of directors of CCPT V beginning in August 2018, and as a director of CCIT III beginning in January 2019. Prior to CIM Group, L.P., Mr. Shemesh was involved in a number of successful entrepreneurial real estate activities, including co-founding Dekel Development, a developer of a wide variety of commercial and multifamily properties in Los Angeles.
Shaul Kuba is a Co-Founder, Principal and President of CIM’s Real Asset Services division with more than 30 years of active real estate, infrastructure and lending experience. Since co-founding CIM Group, L.P. in 1994, Mr. Kuba has been an integral part of building CIM Group, L.P.’s platforms. As a Principal and Head of CIM Group, L.P.’s Development Group, he is actively involved in the development, redevelopment and repositioning of CIM Group, L.P.’s real estate assets. Additionally, Mr. Kuba is instrumental in sourcing new opportunities and establishing and maintaining relationships with national and regional retailers, hospitality brands and restaurateurs. He serves on CIM Group, L.P.’s Investment, Allocation and Real Asset Management Committees and provides guidance on the diverse opportunities across CIM’s platforms. He also serves as an officer of various affiliates of CIM. He has served as a director of CMCT since 2014 and its Chief Investment Officer since March 2023. Prior to CIM Group, L.P., Mr. Kuba was involved in a number of successful entrepreneurial real estate activities including co-founding Dekel Development, a developer of commercial and multifamily properties in Los Angeles.
OFS Sub-Adviser Portfolio Managers:
Bilal Rashid is a Trustee of the Fund, the Chairman of the Board and Chief Executive Officer of OFS Capital Corporation (“OFS Capital”), the Chairman of the Board, President and Chief Executive Officer of Hancock Park Corporate Income, Inc. (“Hancock Park”) and OFS Credit Company, Inc. (“OFS Credit”), President and a Senior Managing Director of the OFS Sub-Adviser, Chief Executive Officer of Orchard First Source Asset Management Holdings, LLC (“Holdings”), and a member of Holdings’s investment and executive committees. Mr. Rashid also serves on the Middle-Market Investment Committee, Broadly Syndicated Investment Committee and Structured Credit Investment Committee of the OFS Sub-Adviser. Prior to joining Orchard First Source Capital, Inc. (“OFSC”) in 2008, Mr. Rashid was a managing director in the global markets and investment banking division at Merrill Lynch. Mr. Rashid has more than 25 years of experience in investment banking, debt capital markets and investing as it relates to corporate credit and structured credit, debt capital markets and investment banking. Over the years, he has advised and arranged financing for investment management companies and commercial finance companies including business development companies. Before joining Merrill Lynch in 2005, he was a vice president at Natixis Capital Markets, which he joined as part of a large team move from Canadian Imperial Bank of Commerce (“CIBC”). Prior to CIBC, he worked as an investment analyst in the project finance area at the International Finance Corporation, which is part of the World Bank. Prior to that, Mr. Rashid was a financial analyst at Lehman Brothers. Mr. Rashid has a B.S. in Electrical Engineering from Carnegie Mellon University and an MBA from Columbia University.
Jeffrey A. Cerny is a director, Chief Financial Officer and Treasurer of OFS Capital and OFS Credit, Chief Financial Officer and Treasurer of Hancock Park, a Senior Managing Director of the OFS Sub-Adviser, a Vice President ofHoldings, and a member of Holdings’s executive committee. Mr. Cerny also serves on the Middle-Market Investment Committee, Broadly Syndicated Investment Committee and Structured Credit Investment Committee of the OFS Sub-Adviser. Mr. Cerny oversees the finance and accounting functions of the OFS Capital, Hancock Park and OFS Credit, as well as underwriting, credit monitoring and CLO portfolio compliance for the OFS Sub-Adviser’s syndicated senior loan business. Prior to joining OFSC in 1999, Mr. Cerny held various positions at Sanwa Business Credit Corporation, American National Bank and Trust Company of Chicago and Charter Bank Group, a multi-bank holding company. Mr. Cerny holds a B.S. in Finance from Northern Illinois University, a Masters of Management in Finance and Economics from Northwestern University’s J.L. Kellogg School of Management, and a J.D. from DePaul University’s School of Law.
Kyde Sharp is a Managing Director and member of the Middle Market Investment Committee of the OFS Sub-Adviser. Mr. Sharp is responsible for sourcing and evaluating investment opportunities for the middle market
lending business as well as portfolio management. Prior to joining OFSC in 2017, Mr. Sharp was a Managing Director of Fifth Street Asset Management (NASDAQ: FSAM), a credit-focused asset manager located in Greenwich, CT. Earlier in his career he was an Associate with The Ben Barnes Group (formerly Entrecorp) where he priced, structured and negotiated equity-based consulting engagements. Mr. Sharp holds a Master of Business Administration from The Wharton School, University of Pennsylvania, a Juris Doctor from Fordham University School of Law, and a Bachelor of Arts in Philosophy from Hamilton College.
Kenneth A. Brown is a Managing Director of the OFS Sub-Adviser and serves as a member of the Broadly Syndicated Investment Committee and the Structured Credit Investment Committee of the OFS Sub-Adviser. He is responsible for leading the trading, underwriting and credit monitoring functions of the CLOs, as well as maintaining relationships with agent/investment banks. Mr. Brown has over 24 years of experience in leveraged finance and public accounting. Prior to joining OFSC in 2007, Mr. Brown was a Vice President at GE Antares Capital, a unit of General Electric Capital Corporation and a leading middle market agent lender for private equity sponsored transactions. Prior to GE Antares, Mr. Brown was at First Source Financial, Inc., a middle market lender focused on direct and participation interests in private equity sponsored transactions, and Arthur Andersen LLP, a national public accounting firm. Mr. Brown has also earned his CPA certification. Mr. Brown holds a Bachelor of Science in Accountancy from the University of Illinois at Urbana-Champaign and a Master of Business Administration, with concentrations in Finance and Strategic Management, from The University of Chicago Booth School of Business.
Glen Ostrander is a Managing Director of the OFS Sub-Adviser and focuses on structured products investment activities of the firm, capital markets related activities, fundraising, and strategic initiatives. Mr. Ostrander serves as a member of the Structured Credit Investment Committee of the OFS Sub-Adviser. Mr. Ostrander has more than 19 years of experience in investing, banking and debt capital markets relating to securitization, corporate credit, and structured credit. Mr. Ostrander has been involved in the CLO market since the late 1990s, with experience in the creation and full life cycle of various types of CLOs through multiple credit cycles. Prior to joining OFSC, Mr. Ostrander worked within the Global Markets & Investment Banking division at Merrill Lynch. Prior to joining Merrill Lynch, he was a Vice President at Wachovia Capital Markets from 1998 to 2006 and worked at International Business Machines and Koch Industries. Throughout his experience at Wachovia Capital Markets, Merrill Lynch, and the OFS Sub-Adviser, Mr. Ostrander has been involved in the structuring of CLO transactions, investing throughout the CLO capital structure, and the creation and vetting of CLO collateral managers. Mr. Ostrander holds a Bachelor of Science in Accounting from Belmont Abbey College.
(a)(2) Certain of the portfolio managers primarily responsible for the day-to-day management of the Fund also manage other registered investment companies, other pooled investment vehicles and other accounts, as indicated below. The following table identifies, as of September 30, 2023 (with respect to portfolio managers of the OFS Sub-Advisor) and June 30, 2022 (with respect to the portfolio managers of the CIM Sub-Advisor)*: (i) the number of other registered investment companies, other pooled investment vehicles and other accounts managed by each portfolio manager; (ii) the total assets of such companies, vehicles and accounts; and (iii) the number and total assets of such companies, vehicles and accounts that are subject to an advisory fee based on performance, unless otherwise noted:
| | Number of
Accounts | | Assets of
Accounts
(in thousands) | | Number of
Accounts
Subject to a
Performance Fee | | Assets
Subject to a Performance Fee
(in thousands) | |
| Richard Ressler | | | | | | | | | | | | |
| Registered Investment Companies | | 0 | | $ | — | | | | | $ | — | |
| Other Pooled Investment Vehicles | | 73 | | $ | 29,800,000 | | | 73 | | $ | 29,800,000 | |
| Other Accounts | | 1 | | $ | 67,100 | | | 1 | | $ | 67,100 | |
| | | | | | | | | | | | | |
| Avraham Shemesh | | | | | | | | | | | | |
| Registered Investment Companies | | 0 | | $ | — | | | | | $ | — | |
| Other Pooled Investment Vehicles | | 73 | | $ | 29,800,000 | | | 73 | | $ | 29,800,000 | |
| Other Accounts | | 1 | | $ | 67,100 | | | 1 | | $ | 67,100 | |
| | | | | | | | | | | | | |
| Shaul Kuba | | | | | | | | | | | | |
| Registered Investment Companies | | 0 | | $ | — | | | | | $ | — | |
| Other Pooled Investment Vehicles | | 73 | | $ | 29,800,000 | | | 73 | | $ | 29,800,000 | |
| Other Accounts | | 1 | | $ | 67,100 | | | 1 | | $ | 67,100 | |
| | | | | | | | | | | | | |
| Bilal Rashid | | | | | | | | | | | | |
| Registered Investment Companies | | 3 | | $ | 713,191 | | | 3 | | $ | 713,191 | |
| Other Pooled Investment Vehicles | | 10 | | $ | 3,374,123 | | | 10 | | $ | 3,374,123 | |
| Other Accounts | | 1 | | $ | 74,483 | | | | | $ | — | |
| | | | | | | | | | | | | |
| Jeffrey A. Cerny | | | | | | | | | | | | |
| Registered Investment Companies | | 3 | | $ | 713,191 | | | 3 | | $ | 713,191 | |
| Other Pooled Investment Vehicles | | 10 | | $ | 3,374,123 | | | 10 | | $ | 3,374,123 | |
| Other Accounts | | 1 | | $ | 74,483 | | | | | $ | — | |
| | | | | | | | | | | | | |
| Kyde Sharp | | | | | | | | | | | | |
| Registered Investment Companies | | 2 | | $ | 523,950 | | | 2 | | $ | 523,950 | |
| Other Pooled Investment Vehicles | | 5 | | $ | 1,858,388 | | | 5 | | $ | 1,858,388 | |
| Other Accounts | | | | $ | — | | | | | $ | — | |
| | | | | | | | | | | | | |
| Kenneth A. Brown | | | | | | | | | | | | |
| Registered Investment Companies | | 3 | | $ | 713,191 | | | 1 | | $ | 713,191 | |
| Other Pooled Investment Vehicles | | 10 | | $ | 3,374,123 | | | 10 | | $ | 3,374,123 | |
| Other Accounts | | 1 | | $ | 74,483 | | | | | $ | — | |
| | | | | | | | | | | | | |
| Glen Ostrander | | | | | | | | | | | | |
| Registered Investment Companies | | | | | | | | | | | | |
| Other Pooled Investment Vehicles | | 10 | | $ | 3,374,123 | | | 10 | | $ | 3,374,123 | |
| Other Accounts | | 1 | | $ | 74,483 | | | | | $ | — | |
*With respect to the CIM Sub-Advisor: (i) figures indicate assets owned and operated as of June 30, 2023, which represents the aggregate assets owned and operated by CIM on behalf of partners (including where CIM contributes alongside for its own account) and co-investors, whether or not CIM has discretion, in each case without duplication; (ii) figures exclude arrangements in which management responsibility is shared with an unaffiliated third party and (iii) September 30, 2023 numbers are not available as of the date hereof.
Portfolio Manager Potential Conflicts of Interest
The Adviser, the Sub-Advisers and their respective affiliates will be subject to certain conflicts of interest with the portfolio managers. These conflicts will arise primarily from the involvement of the Adviser, the Sub-Advisers, and other funds, vehicles and separate accounts managed by the Adviser, the Sub-Advisers and/or their respective affiliates (for third-party investors or otherwise) (collectively, the “CIM/OFS Vehicles”) in other activities that may conflict with the Fund’s activities. Shareholders should be aware that individual conflicts will not necessarily be resolved in favor of the Fund’s interest.
Broad and Wide-Ranging Activities
The CIM/OFS Vehicles, the Adviser and the Sub-Advisers engage in a broad spectrum of activities. In the ordinary course of business, the CIM/OFS Vehicles, the Adviser and/or the Sub-Advisers may engage in activities where the interests of any of them may conflict with the Fund’s and its shareholders’ interests. Other present and future activities of any of them may give rise to additional conflicts of interest. In the event that a conflict of interest arises, the Adviser and the Sub-Advisers will attempt to resolve such conflicts in a fair and equitable manner, subject to applicable law.
Policies and Procedures
Specified policies and procedures implemented by the Adviser and the Sub-Advisers to mitigate potential conflicts of interest and address certain regulatory requirements and contractual restrictions may reduce the synergies across the CIM/OFS Vehicles’, the Adviser’s and/or the Sub-Advisers’ various businesses that the Fund expects to draw on for purposes of pursuing attractive investment opportunities. Because each of the Adviser and the Sub-Advisers has various asset management, advisory and other businesses, it is subject to a number of actual and potential conflicts of interest, greater regulatory oversight and more legal and contractual restrictions than that to which it would otherwise be subject if it had just one line of business. Finally, the Adviser or the Sub-Advisers may enter into one or more strategic relationships in certain regions or with respect to certain types of investments that, although possibly intended to provide greater opportunities for the Fund, may require the Fund to share such opportunities or otherwise limit the amount of an opportunity the Fund can otherwise take.
Allocation of Personnel
The Adviser and the Sub-Advisers and their respective officers, managers, members and employees will devote as much of their time to the Fund’s activities as the Adviser and Sub-Advisers deem necessary and appropriate. Subject to the terms of the applicable offering and/or governing documents, affiliates of the Adviser and the Sub-Advisers expect to form additional investment funds, enter into other investment advisory relationships and engage in other business activities, even though such activities may be in competition with the Fund and/or may involve substantial time and resources of the Adviser or the Sub-Advisers. These activities could be viewed as creating a conflict of interest in that the time and effort of the Adviser and the Sub-Advisers and their respective officers, managers, members and employees will not be devoted exclusively to the Fund’s business but will be allocated between the Fund’s business and the management of the assets of other clients of the Adviser and the Sub-Advisers.
Allocation of Investment Opportunities
The Adviser and each Sub-Adviser has adopted allocation procedures that are intended to treat each fund they advise in a manner that, over a period of time, is fair and equitable. The Adviser, the Sub-Advisers or their respective affiliates currently provide investment advisory and administration services and may provide in the future similar services to other entities (collectively, “Advised Funds”). Certain existing Advised Funds have, and future Advised Funds may have, investment objectives similar to those of the Fund, and such Advised Funds will invest in asset classes similar to those targeted by the Fund. Certain other existing Advised Funds do not, and future Advised Funds may not, have similar investment objectives, but such funds may from time to time invest in asset classes similar to those targeted by the Fund. The Adviser and each Sub-Adviser will endeavor to allocate investment opportunities in a fair and equitable manner, and in any event consistent with any fiduciary duties owed to the Fund and other clients and in an effort to avoid favoring one client over another and taking into account all relevant facts and circumstances, including (without limitation): (i) differences with respect to available capital, size of client, and remaining life of a client; (ii) differences with respect to investment objectives or current investment strategies, including regarding: (a) current and total return requirements, (b) emphasizing or limiting exposure to the security or type of security in question, (c) diversification, including industry or company exposure, currency and jurisdiction, or (d) rating agency ratings; (iii) differences in risk profile at the time an opportunity becomes available; (iv) the potential transaction and other costs of allocating an opportunity among various clients; (v) potential conflicts of interest, including whether a client has an existing investment in the security in question or the issuer of such security; (vi) the nature of the security or the transaction, including minimum investment amounts and the source of the opportunity; (vii) current and anticipated market and general economic conditions; (viii) existing positions in a borrower/loan/security; and (ix) prior positions in a borrower/loan/security. Nevertheless, it is possible that the Fund may not be given the opportunity to participate in certain investments made by investment funds managed by investment managers affiliated with the Adviser or the Sub-Advisers.
In the event investment opportunities are allocated among the Fund and the other Advised Funds, the Fund may not be able to structure its investment portfolio in the manner desired. Furthermore, the Fund and the other Advised Funds may make investments in securities where the prevailing trading activity may make impossible the receipt of the same price or execution on the entire volume of securities purchased or sold by the Fund and the other Advised Funds. When this occurs, the various prices may be averaged, and the Fund will be charged or credited with the average price. Thus, the effect of the aggregation may operate on some occasions to the disadvantage of the Fund. In addition, under certain circumstances, the Fund may not be charged the same commission or commission equivalent rates in connection with a bunched or aggregated order.
It is likely that the other Advised Funds may make investments in the same or similar securities at different times and on different terms than the Fund. The Fund and the other Advised Funds may make investments at different levels of a borrower’s capital structure or otherwise in different classes of a borrower’s securities, to the extent permitted by applicable law. Such investments may inherently give rise to conflicts of interest or perceived conflicts of interest between or among the various classes of securities that may be held by such entities. Conflicts may also arise because portfolio decisions regarding the Fund may benefit the other Advised Funds. For example, the sale of a long position or establishment of a short position by the Fund may impair the price of the same security sold short by (and therefore benefit) one or more Advised Funds, and the purchase of a security or covering of a short position in a security by the Fund may increase the price of the same security held by (and therefore benefit) one or more Advised Funds.
Applicable law, including the Investment Company Act of 1940, as amended (the “1940 Act”), may at times prevent the Fund from being able to participate in investments that it otherwise would participate in, and may require the Fund to dispose of investments at a time when it otherwise would not dispose of such investment or hold an investment when it would otherwise dispose of it, in each case, in order to comply with applicable law.
The Adviser, the Sub-Advisers, their affiliates and their clients may pursue or enforce rights with respect to a borrower in which the Fund has invested, and those activities may have an adverse effect on the Fund. As a result, prices, availability, liquidity and terms of the Fund’s investments may be negatively impacted by the activities of the Adviser and the Sub-Advisers and their affiliates or their clients, and transactions for the Fund may be impaired or effected at prices or terms that may be less favorable than would otherwise have been the case.
The Adviser and the Sub-Advisers may have a conflict of interest in deciding whether to cause the Fund to incur leverage or to invest in more speculative investments or financial instruments, thereby potentially increasing the management and incentive fee payable by the Fund and, accordingly, the fees received by the Adviser and the Sub-Advisers. Certain other Advised Funds pay the Adviser, the Sub-Advisers or their affiliates greater performance-based compensation, which could create an incentive for the Adviser, the Sub-Advisers or an affiliate to favor such investment fund or account over the Fund.
Purchases and Sales by the Fund and Other Clients
Conflicts may arise when the Fund makes an investment in conjunction with an investment being made by the Advised Funds or other clients of the Adviser, Sub-Advisers or their affiliates, or in a transaction where another client or client of such affiliates has already made an investment. Investment opportunities are, from time to time, appropriate for more than one client of the Adviser, Sub-Advisers or their affiliates in the same, different or overlapping securities of a portfolio company’s capital structure. Conflicts arise in determining the terms of investments, particularly where these clients may invest in different types of securities in a single portfolio company. Questions arise as to whether payment obligations and covenants should be enforced, modified or waived, or whether debt should be restructured, modified or refinanced.
The Fund may invest in debt and other securities of companies in which other clients hold those same securities or different securities, including equity securities. In the event that such investments are made by the Fund, the Fund’s interests will at times conflict with the interests of such other clients or clients of the Adviser’s or the Sub-Advisers’ affiliates, particularly in circumstances where the underlying company is facing financial distress. Decisions about what action should be taken, particularly in troubled situations, raises conflicts of interest, including, among other things, whether or not to enforce claims, whether or not to advocate or initiate a restructuring or liquidation inside or outside of bankruptcy, and the terms of any work-out or restructuring. The involvement of multiple clients at both the equity and debt levels could inhibit strategic information exchanges among fellow creditors, including among the Fund, the Advised Funds and other clients of the Adviser, Sub-Advisers or their affiliates. In certain circumstances, the Fund, the Advised Funds or other clients of the Adviser, Sub-Advisers or their affiliates may be prohibited from exercising voting or other rights and may be subject to claims by other creditors with respect to the subordination of their interest.
For example, in the event that one client has a controlling or significantly influential position in a portfolio company, that client may have the ability to elect some or all of the board of directors of such a portfolio company, thereby controlling the policies and operations, including the appointment of management, future issuances of securities, payment of dividends, incurrence of debt and entering into extraordinary transactions. In addition, a controlling client is likely to have the ability to determine, or influence, the outcome of operational matters and to cause, or prevent, a change in control of such a portfolio company. Such management and operational decisions may, at times, be in direct conflict with the Fund, the Advised Funds or other clients that have invested in the same portfolio company that do not have the same level of control or influence over the portfolio company.
If additional capital is necessary as a result of financial or other difficulties, or to finance growth or other opportunities, the Fund, the Advised Funds or other clients of the Adviser, Sub-Advisers or their affiliates may or may not provide such additional capital, and if provided each client will supply such additional capital in such amounts, if any, as determined by the Adviser, Sub-Advisers and/or their affiliates. Investments by more than one client of the Adviser, Sub-Advisers or their affiliates in a portfolio company also raises the risk of using assets of a client of the Adviser, Sub-Advisers or their affiliates to support positions taken by other clients of the Adviser, Sub-Advisers or their affiliates, or that a client may remain passive in a situation in which it is entitled to vote. In addition, there may be differences in timing of entry into, or exit from, a portfolio company for reasons such as differences in strategy, existing portfolio or liquidity needs, different client mandates or fund differences, or different securities being held. These variations in timing may be detrimental to the Fund.
The application of the Fund’s investment mandate as compared to investment mandates of other clients of the Adviser, the Sub-Advisers or their affiliates and the policies and procedures of the Adviser, Sub-Advisers and their affiliates are expected to vary based on the particular facts and circumstances surrounding each investment by two or more clients, in particular when those clients are in different classes of an issuer’s capital structure (as well as across
multiple issuers or borrowers within the same overall capital structure) and, as such, there may be a degree of variation and potential inconsistencies, in the manner in which potential or actual conflicts are addressed.
Material Non-Public Information
The Adviser, the Sub-Advisers or certain of their respective affiliates may come into possession of material non-public information with respect to a borrower or an issuer (or an affiliate). Should this occur, the Adviser or the Sub-Advisers would be restricted from buying or selling securities, derivatives or loans of the borrower or the issuer on behalf of the Fund until such time as the information became public or was no longer deemed material to preclude the Fund from participating in an investment. Due to these restrictions, the Adviser or the Sub-Advisers may not be able to initiate a transaction that it otherwise might have initiated and may not be able to sell an investment that it otherwise might have sold.
To the extent permitted by the 1940 Act and the rules and regulations and other guidelines of the SEC, the Fund may invest in private and public vehicles sponsored by affiliates of the Adviser and Sub-Advisers. To the extent that the Adviser or Sub-Advisers, as the case may be, were to come into possession of material non-public information relevant to an investment decision in connection with a potential investment or sale of securities of a private or public vehicle sponsored by an affiliate of the Adviser or the Sub-Advisers, the Fund may be precluded from making such investment or sale.
Possible Future Activities
Affiliates of the Adviser and the Sub-Advisers may expand the range of services that they provide over time and will not be restricted in the scope of their business or in the performance of any such services (whether now offered or undertaken in the future) even if such activities could give rise to conflicts of interest, and whether or not such conflicts are described herein. Each of the Adviser and the Sub-Advisers has, and will continue to develop, relationships with a significant number of companies, financial sponsors and their senior managers, including relationships with clients who may hold or may have held investments similar to those intended to be made by the Fund. These clients may themselves represent appropriate investment opportunities for the Fund or may compete with the Fund for investment opportunities.
(a)(3) The Adviser and each Sub-Adviser’s investment personnel are not employed by the Fund and receive no direct compensation from the Fund in connection with their investment management activities.
Investment personnel of the Adviser and the CIM Sub-Adviser that are Principals are compensated with a base salary, profit participation and participation in the general partner’s carried interest, or adviser’s incentive fees, as applicable, earned with respect to funds managed by CIM Group and its affiliates. Non-Principal Investment professionals are compensated with a base salary plus bonus, which is determined by both the overall performance of the assets to which such investment professionals are assigned as well as their overall citizenship and contribution to the culture at CIM Group.
The OFS Sub-Adviser compensates its investment professionals through a base salary and a discretionary annual bonus based on a number of factors, including job performance, profitability of OFS Sub-Adviser and market conditions. Professional compensation at the OFS Sub-Adviser is structured so that key professionals benefit from strong investment performance generated on the accounts that the OFS Sub-Adviser manages and from their longevity with the OFS Sub-Adviser. In addition, certain of OFS Sub-Adviser’s Portfolio Managers have ownership and financial interests in, and may receive compensation and/or profit distributions from Holdings and/or its subsidiaries. These individuals receive compensation from OFS Sub-Adviser that includes an annual base salary, an annual discretionary bonus and a portion of the distributions made by OFS Sub-Adviser, a portion of which may relate to incentive fees or carried interest earned by OFS Sub-Adviser in connection with its services.
(a)(4) The following table shows the dollar range of equity securities in the Fund beneficially owned by each of the Fund’s portfolio managers as of September 30, 2023.
| Securities Ownership of Portfolio Managers |
| Name of Portfolio Manager | | Dollar Range of Equity Securities in the Fund(1)(2)(3) |
| Richard Ressler(4) | | Over $1,000,000 |
| Avraham Shemesh(4) | | Over $1,000,000 |
| Shaul Kuba(4) | | Over $1,000,000 |
| Bilal Rashid | | $ | — |
| Jeffrey Cerny | | $ | — |
| Kyde Sharp | | $ | — |
| Kenneth A. Brown | | $ | — |
| Glen Ostrander | | $ | — |
(1) Dollar ranges are as follows: None, $1 – $10,000, $10,001 – $50,000, $50,001 – $100,000, $100,001 – $500,000, $500,001 – $1,000,000 or Over $1,000,000.
(2) Beneficial ownership has been determined in accordance with Rule 16a-1(a)(2) under the Exchange Act.
(3) The dollar range of equity beneficially owned is based on the current NAV per Class I Common Share as of September 30, 2023.
(4) These shares are owned directly by CIM Capital IC Management, LLC and CIM RACR, LLC, each of which is owned by CIM Group, LLC. Each of Richard Ressler, Avraham Shemesh and Shaul Kuba may be deemed to beneficially own all of these shares because of their positions with CIM Group, LLC. Each of them disclaims beneficial ownership of these securities except to the extent of his pecuniary interest therein, and the inclusion of these shares in this report shall not be deemed an admission of beneficial ownership of all of the reported shares for purposes of Section 16 of the Exchange Act or for any other purpose.
(b) Not applicable.
Item 14. Purchases of Equity Securities by Closed-End Management Investment Company and Affiliated Purchasers.
Item 15. Submission of Matters to a Vote of Security Holders.
There were no material changes to the procedures by which the Registrant’s shareholders may recommend nominees to the Registrant’s board of trustees during the period covered by this annual report included in Item 1 of this Form N-CSR.
Item 16. Controls and Procedures.
(a) The Registrant’s Principal Executive Officer and Principal Financial Officer have concluded that the Registrant's disclosure controls and procedures (as defined in Rule 30a-3(c) under the Investment Company Act of 1940, as amended (the “1940 Act”) (17 CFR 270.30a-3(c))) are effective, as of a date within 90 days of the filing date of the report that includes the disclosure required by this paragraph, based on their evaluation of these controls and procedures required by Rule 30a-3(b) under the 1940 Act (17 CFR 270.30a-3(b)) and Rules 13a-15(b) or 15d-15(b) under the Securities Exchange Act of 1934, as amended (17 CFR 240.13a-15(b) or 240.15d-15(b)).
(b) There were no changes in the Registrant’s internal control over financial reporting (as defined in Rule 30a-3(d) under the 1940 Act (17 CFR 270.30a-3(d)) that occurred during the period covered by this report that has materially affected, or is reasonably likely to materially affect, the Registrant’s internal control over financial reporting.
Item 17. Disclosure of Securities Lending Activities for Closed-End Management Investment Companies.
Item 18. Recovery of Erroneously Awarded Compensation.
Item 19. Exhibits.
(a)(1) Not Applicable.
(a) (2) Not Applicable.
(a)(3) Certifications as required by Rule 30a-2(a) under the 1940 Act (17 CFR 270.30a-2(a)) are attached hereto as Exhibits 99.302(i) CERT.
(b) Certifications as required by Rule 30a-2(b) of the 1940 Act, and Section 906 of the Sarbanes-Oxley Act of 2002 are attached hereto as Exhibit 99.906 CERT.
SIGNATURES
Pursuant to the requirements of the Securities Exchange Act of 1934 and the Investment Company Act of 1940, the Registrant has duly caused this report to be signed on its behalf by the undersigned, thereunto duly authorized.
CIM REAL ASSETS & CREDIT FUND
| By: | /s/ David Thompson | |
| | David Thompson |
| | Chief Executive Officer and Trustee (Principal Executive Officer) |
Pursuant to the requirements of the Securities Exchange Act of 1934 and the Investment Company Act of 1940, this report has been signed below by the following persons on behalf of the Registrant and in the capacities and on the dates indicated.
| By: | /s/ David Thompson | |
| | David Thompson |
| | Chief Executive Officer and Trustee (Principal Executive Officer) |
| By: | /s/ Barry N. Berlin | |
| | Barry N. Berlin |
| | Chief Financial Officer and Treasurer (Principal Financial Officer) |
Date: December 11, 2023