
Exhibit 99.2 Cerence Q1FY22 Earnings Call Presentation • Stefan Ortmanns, CEO • Mark Gallenberger, CFO • Rich Yerganian, SVP of IR February 7, 2022
Forward-Looking Statements This material and any oral statements made in connection with this material include forward-looking statements within the meaning of the Securities Act of 1933 and the Securities Exchange Act of 1934. Statements made which provide the Company’s or management’s intentions, beliefs, expectations or predictions for the future are forward-looking statements and are inherently uncertain. The opinions, forecasts, projections or other statements other than statements of historical fact, including, without limitation, plans and objectives of management of the Company are forward- looking statements. It is important to note that actual results could differ materially from those discussed in such forward-looking statements. Important factors that could cause actual results to differ materially include the risk factors and other cautionary statements contained from time to time in the Company’s SEC filings, which may be obtained by contacting the Company or the SEC. These filings are also available through the Company’s web site at http://www.cerence.com or through the SEC’s Electronic Data Gathering and Analysis Retrieval System (EDGAR) at http://www.sec.gov. We undertake no obligation to publicly update or revise any forward-looking statement. 2 © 2022 Cerence Inc.

Executive Summary

Automotive Industry at a Tipping Point More cars powered by electricity will accelerate the transition to a fully digital cockpit and cabin, transforming the driver and passenger experience 4 © 2022 Cerence Inc.
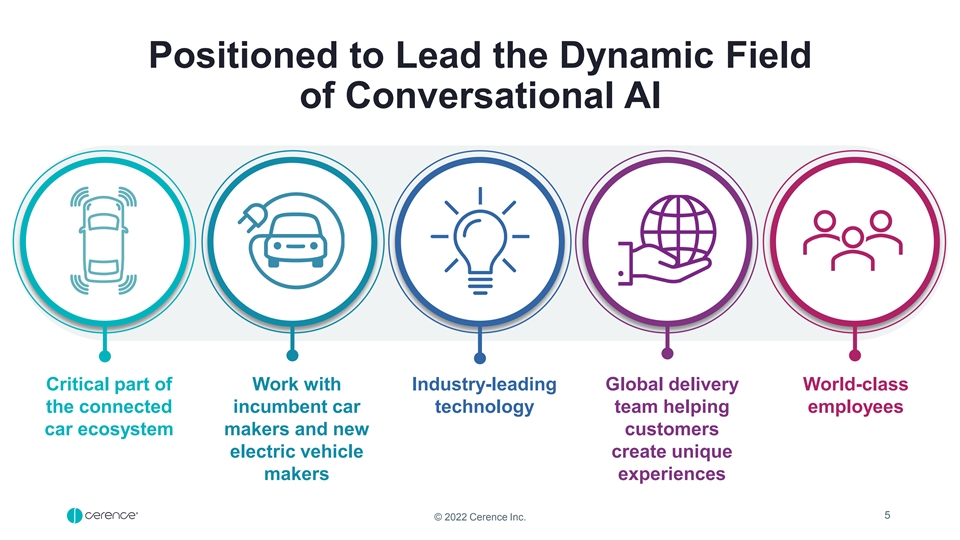
Positioned to Lead the Dynamic Field of Conversational AI Critical part of Work with Industry-leading Global delivery World-class the connected incumbent car technology team helping employees car ecosystem makers and new customers electric vehicle create unique makers experiences 5 © 2022 Cerence Inc.
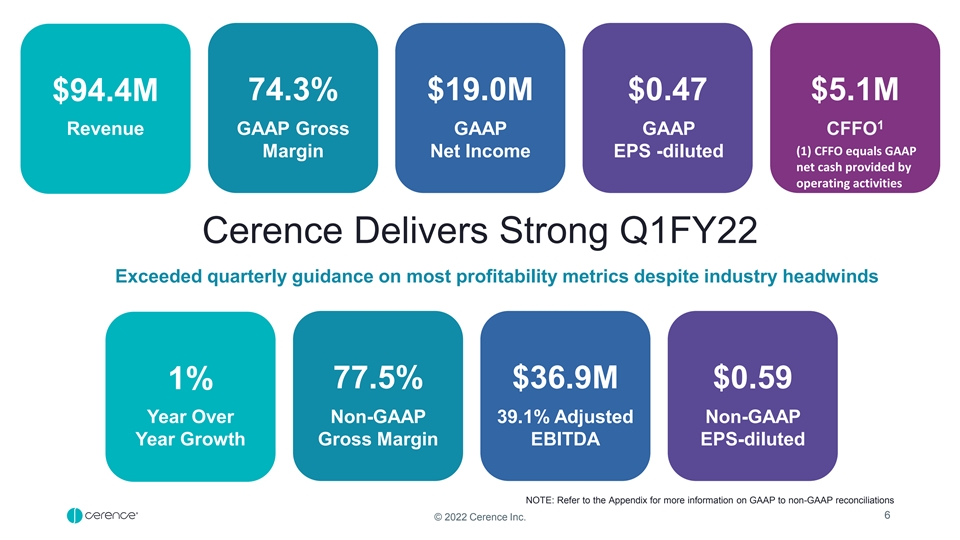
74.3% $19.0M $0.47 $5.1M $94.4M 1 Revenue GAAP Gross GAAP GAAP CFFO (1) CFFO equals GAAP Margin Net Income EPS -diluted net cash provided by operating activities Cerence Delivers Strong Q1FY22 Exceeded quarterly guidance on most profitability metrics despite industry headwinds 77.5% $36.9M $0.59 1% Year Over Non-GAAP 39.1% Adjusted Non-GAAP Year Growth Gross Margin EBITDA EPS-diluted NOTE: Refer to the Appendix for more information on GAAP to non-GAAP reconciliations 6 © 2022 Cerence Inc.
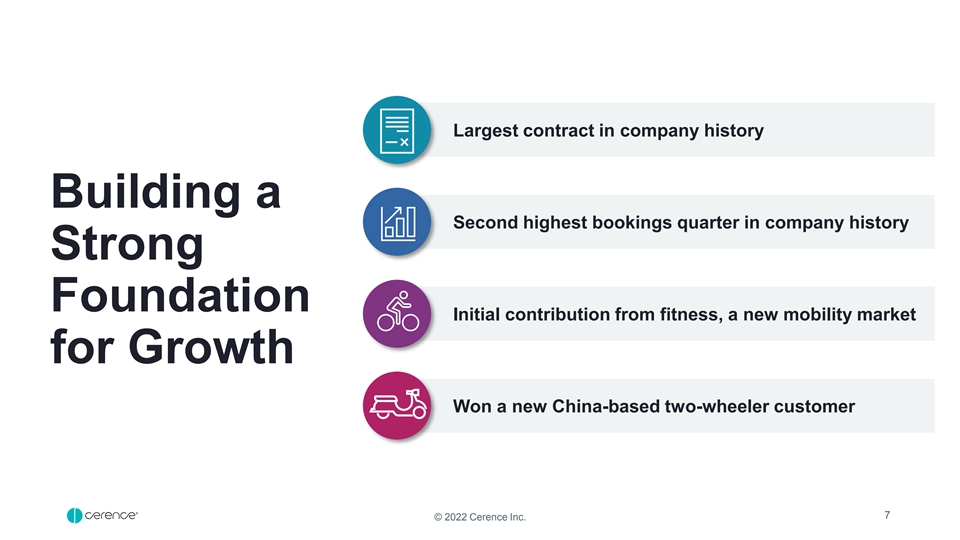
Largest contract in company history Building a Second highest bookings quarter in company history Strong Foundation Initial contribution from fitness, a new mobility market for Growth Won a new China-based two-wheeler customer 7 © 2022 Cerence Inc.

Financial Summary

Q1 Exceeded Guidance on Most Profitability Metrics Q1FY22 Q1FY22 Q1FY21 In millions, except per share amounts Actual Results Guidance Actual Results Revenue $91 - $96 $94.4 $93.6 GAAP Gross Margin 74.3% 73% - 74% 71.3% (a) Non-GAAP Gross Margin 77.5% 76% - 77% 75.0% GAAP Operating Margin 13% - 16% 24.3% 18.7% (a) Non-GAAP Operating Margin 36.8% 32% - 34% 38.9% GAAP Net Income $8 - $10 $19.0 $20.9 (a) Adjusted EBITDA $36.9 $31 - $35 $39.0 (a) Adjusted EBITDA Margin 39.1% 34% - 36% 41.6% GAAP Net Income per share – diluted $0.20 - $0.26 $0.47 $0.53 (a) Non-GAAP EPS – diluted $0.59 $0.47 - $0.53 $0.57 CFFO $5.1 n/a $10.8 Footnote: a) Non-GAAP excludes acquisition-related costs, amortization of acquired intangible assets, restructuring expense, and stock-based compensation. Refer to the Appendix for more information on GAAP to non-GAAP reconciliations 9 © 2022 Cerence Inc.
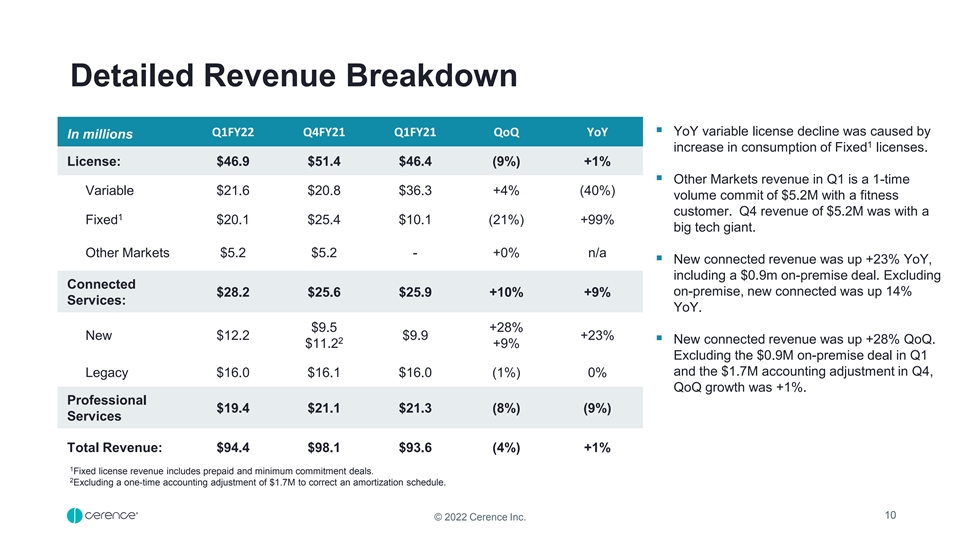
Detailed Revenue Breakdown Q1FY22 Q4FY21 Q1FY21 QoQ YoY▪ YoY variable license decline was caused by In millions 1 increase in consumption of Fixed licenses. License: $46.9 $51.4 $46.4 (9%) +1% ▪ Other Markets revenue in Q1 is a 1-time Variable $21.6 $20.8 $36.3 +4% (40%) volume commit of $5.2M with a fitness customer. Q4 revenue of $5.2M was with a 1 Fixed $20.1 $25.4 $10.1 (21%) +99% big tech giant. Other Markets $5.2 $5.2 - +0% n/a ▪ New connected revenue was up +23% YoY, including a $0.9m on-premise deal. Excluding Connected on-premise, new connected was up 14% $28.2 $25.6 $25.9 +10% +9% Services: YoY. $9.5 +28% New $12.2 $9.9 +23% 2▪ New connected revenue was up +28% QoQ. $11.2 +9% Excluding the $0.9M on-premise deal in Q1 and the $1.7M accounting adjustment in Q4, Legacy $16.0 $16.1 $16.0 (1%) 0% QoQ growth was +1%. Professional $19.4 $21.1 $21.3 (8%) (9%) Services Total Revenue: $94.4 $98.1 $93.6 (4%) +1% 1 Fixed license revenue includes prepaid and minimum commitment deals. 2 Excluding a one-time accounting adjustment of $1.7M to correct an amortization schedule. 10 © 2022 Cerence Inc.
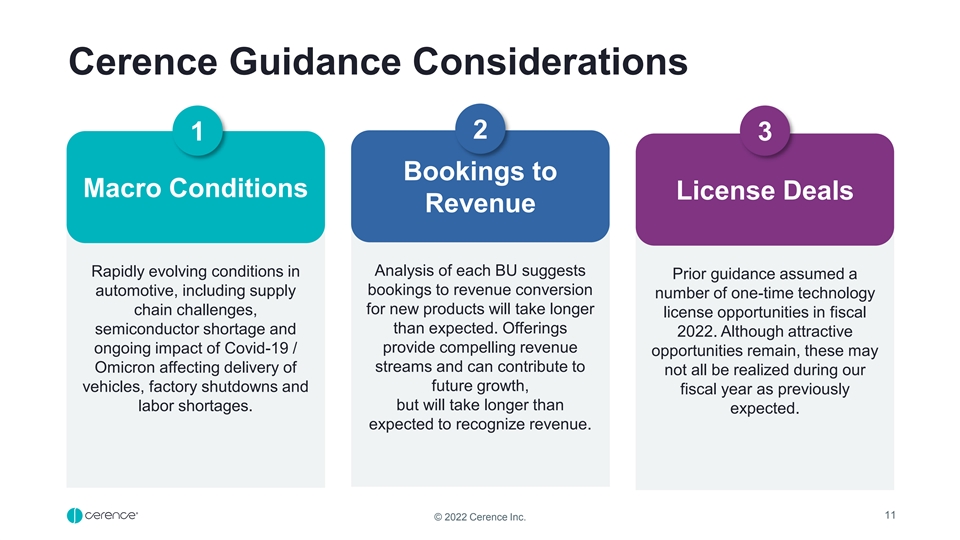
Cerence Guidance Considerations 2 1 3 Bookings to Macro Conditions License Deals Revenue Analysis of each BU suggests Rapidly evolving conditions in Prior guidance assumed a bookings to revenue conversion automotive, including supply number of one-time technology for new products will take longer chain challenges, license opportunities in fiscal than expected. Offerings semiconductor shortage and 2022. Although attractive ongoing impact of Covid-19 / provide compelling revenue opportunities remain, these may streams and can contribute to Omicron affecting delivery of not all be realized during our future growth, vehicles, factory shutdowns and fiscal year as previously but will take longer than labor shortages. expected. expected to recognize revenue. 11 © 2022 Cerence Inc.
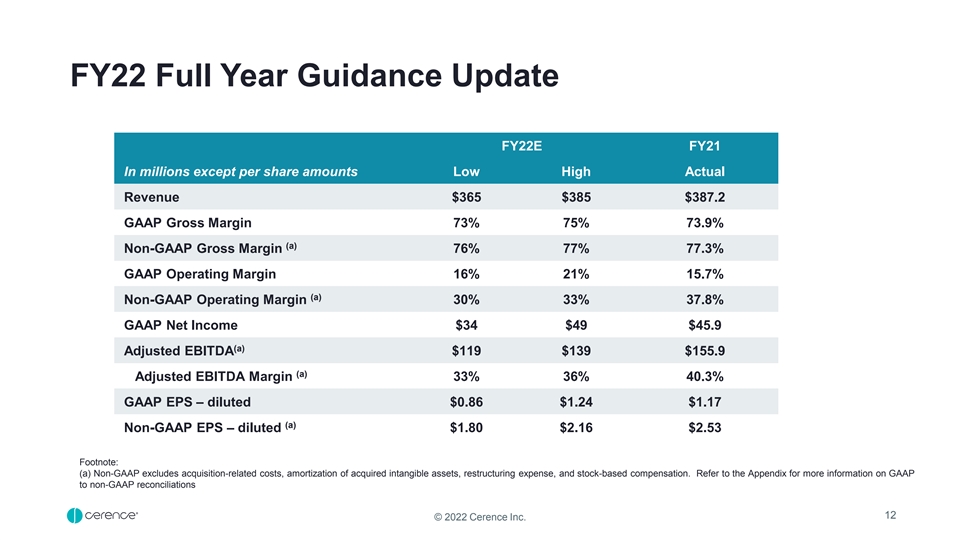
FY22 Full Year Guidance Update FY22E FY21 In millions except per share amounts Low High Actual Revenue $365 $385 $387.2 GAAP Gross Margin 73% 75% 73.9% (a) Non-GAAP Gross Margin 76% 77% 77.3% GAAP Operating Margin 16% 21% 15.7% (a) Non-GAAP Operating Margin 30% 33% 37.8% GAAP Net Income $34 $49 $45.9 (a) Adjusted EBITDA $119 $139 $155.9 (a) Adjusted EBITDA Margin 33% 36% 40.3% GAAP EPS – diluted $0.86 $1.24 $1.17 (a) Non-GAAP EPS – diluted $1.80 $2.16 $2.53 Footnote: (a) Non-GAAP excludes acquisition-related costs, amortization of acquired intangible assets, restructuring expense, and stock-based compensation. Refer to the Appendix for more information on GAAP to non-GAAP reconciliations 12 © 2022 Cerence Inc.
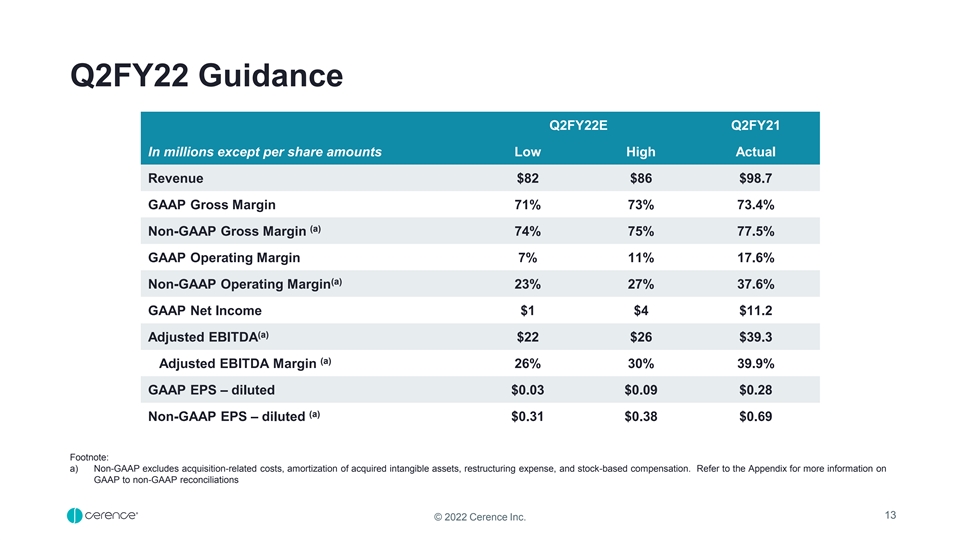
Q2FY22 Guidance Q2FY22E Q2FY21 In millions except per share amounts Low High Actual Revenue $82 $86 $98.7 GAAP Gross Margin 71% 73% 73.4% (a) Non-GAAP Gross Margin 74% 75% 77.5% GAAP Operating Margin 7% 11% 17.6% (a) Non-GAAP Operating Margin 23% 27% 37.6% GAAP Net Income $1 $4 $11.2 (a) Adjusted EBITDA $22 $26 $39.3 (a) Adjusted EBITDA Margin 26% 30% 39.9% GAAP EPS – diluted $0.03 $0.09 $0.28 (a) Non-GAAP EPS – diluted $0.31 $0.38 $0.69 Footnote: a) Non-GAAP excludes acquisition-related costs, amortization of acquired intangible assets, restructuring expense, and stock-based compensation. Refer to the Appendix for more information on GAAP to non-GAAP reconciliations 13 © 2022 Cerence Inc.

Long-Term Goal | Key Provider of AI for Mobility Road AI Driver Cabin 14 © 2022 Cerence Inc.

Thank you. 15 © 2022 Cerence Inc.

Appendix
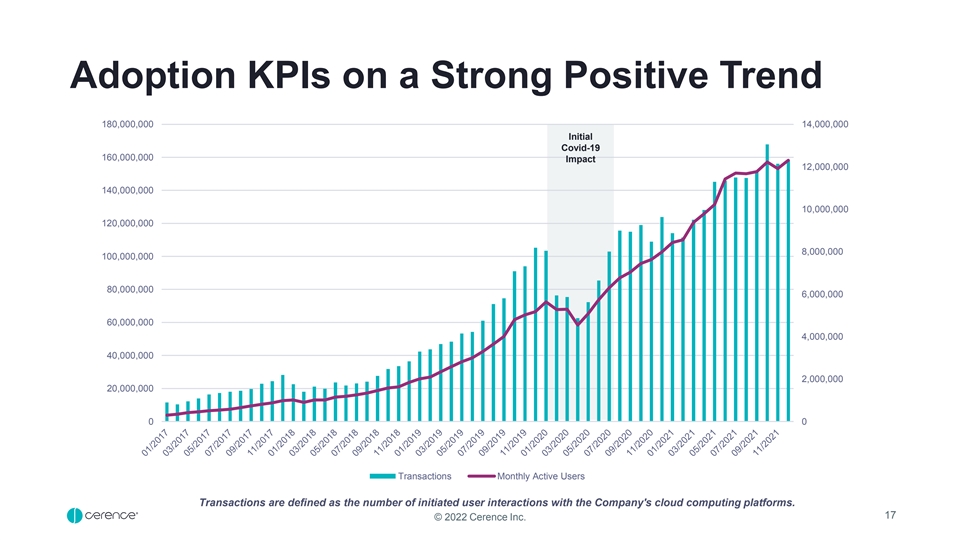
Adoption KPIs on a Strong Positive Trend 180,000,000 14,000,000 Initial Covid-19 160,000,000 Impact 12,000,000 140,000,000 10,000,000 120,000,000 8,000,000 100,000,000 80,000,000 6,000,000 60,000,000 4,000,000 40,000,000 2,000,000 20,000,000 0 0 Transactions Monthly Active Users Transactions are defined as the number of initiated user interactions with the Company's cloud computing platforms. 17 © 2022 Cerence Inc.
Non-GAAP Financial Measures – Definitions Discussion of Non-GAAP Financial Measures We believe that providing the non-GAAP information in addition to the GAAP presentation, allows investors to view the financial results in the way management views the operating results. We further believe that providing this information allows investors to not only better understand our financial performance, but more importantly, to evaluate the efficacy of the methodology and information used by management to evaluate and measure such performance. The non-GAAP information should not be considered superior to, or a substitute for, financial statements prepared in accordance with GAAP. We utilize a number of different financial measures, both GAAP and non-GAAP, in analyzing and assessing the overall performance of the business, for making operating decisions and for forecasting and planning for future periods. While our management uses these non-GAAP financial measures as a tool to enhance their understanding of certain aspects of our financial performance, our management does not consider these measures to be a substitute for, or superior to, the information provided by GAAP financial statements. Consistent with this approach, we believe that disclosing non-GAAP financial measures to the readers of our financial statements provides such readers with useful supplemental data that, while not a substitute for GAAP financial statements, allows for greater transparency in the review of our financial and operational performance. In assessing the overall health of the business during the three months December 31, 2021 and 2020, our management has either included or excluded the following items in general categories, each of which is described below. Adjusted EBITDA Adjusted EBITDA is defined as net income attributable to Cerence Inc. before net income (loss) attributable to income tax (benefit) expense, other income (expense) items, net, depreciation and amortization expense, and excluding acquisition-related costs, amortization of acquired intangible assets, stock- based compensation, and restructuring and other costs, net or impairment charges related to fixed and intangible assets and gains or losses on the sale of long-lived assets, if any. From time to time we may exclude from Adjusted EBITDA the impact of events, gains, losses or other charges (such as significant legal settlements) that affect the period-to-period comparability of our operating performance. Other income (expense) items, net include interest expense, interest income, and other income (expense), net (as stated in our Condensed Consolidated Statement of Operations). Our management and Board of Directors use this financial measure to evaluate our operating performance. It is also a significant performance measure in our annual incentive compensation programs. 18 © 2022 Cerence Inc.
Non-GAAP Financial Measures – Definitions Restructuring and other costs, net. Restructuring and other charges, net include restructuring expenses as well as other charges that are unusual in nature, are the result of unplanned events, and arise outside the ordinary course of our business such as employee severance costs, costs for consolidating duplication facilities, and separation costs directly attributable to the Cerence business becoming a standalone public company. Acquisition-related costs, net. In recent years, we have completed a number of acquisitions, which result in operating expenses, which would not otherwise have been incurred. We provide supplementary non-GAAP financial measures, which exclude certain transition, integration and other acquisition-related expense items resulting from acquisitions, to allow more accurate comparisons of the financial results to historical operations, forward looking guidance and the financial results of less acquisitive peer companies. We consider these types of costs and adjustments, to a great extent, to be unpredictable and dependent on a significant number of factors that are outside of our control. Furthermore, we do not consider these acquisition-related costs and adjustments to be related to the organic continuing operations of the acquired businesses and are generally not relevant to assessing or estimating the long-term performance of the acquired assets. In addition, the size, complexity and/or volume of past acquisitions, which often drives the magnitude of acquisition related costs, may not be indicative of the size, complexity and/or volume of future acquisitions. By excluding acquisition-related costs and adjustments from our non-GAAP measures, management is better able to evaluate our ability to utilize our existing assets and estimate the long-term value that acquired assets will generate for us. We believe that providing a supplemental non-GAAP measure, which excludes these items allows management and investors to consider the ongoing operations of the business both with, and without, such expenses. These acquisition-related costs fall into the following categories: (i) transition and integration costs; (ii) professional service fees and expenses; and (iii) acquisition-related adjustments. Although these expenses are not recurring with respect to past acquisitions, we generally will incur these expenses in connection with any future acquisitions. These categories are further discussed as follows: • Transition and integration costs. Transition and integration costs include retention payments, transitional employee costs, and earn-out payments treated as compensation expense, as well as the costs of integration-related activities, including services provided by third-parties. • Professional service fees and expenses. Professional service fees and expenses include financial advisory, legal, accounting and other outside services incurred in connection with acquisition activities, and disputes and regulatory matters related to acquired entities. • Acquisition-related adjustments. Acquisition-related adjustments include adjustments to acquisition-related items that are required to be marked to fair value each reporting period, such as contingent consideration, and other items related to acquisitions for which the measurement period has ended, such as gains or losses on settlements of pre-acquisition contingencies. 19 © 2022 Cerence Inc.
Non-GAAP Financial Measures – Definitions Amortization of acquired intangible assets. We exclude the amortization of acquired intangible assets from non-GAAP expense and income measures. These amounts are inconsistent in amount and frequency and are significantly impacted by the timing and size of acquisitions. Providing a supplemental measure which excludes these charges allows management and investors to evaluate results “as-if” the acquired intangible assets had been developed internally rather than acquired and, therefore, provides a supplemental measure of performance in which our acquired intellectual property is treated in a comparable manner to our internally developed intellectual property. Although we exclude amortization of acquired intangible assets from our non-GAAP expenses, we believe that it is important for investors to understand that such intangible assets contribute to revenue generation. Amortization of intangible assets that relate to past acquisitions will recur in future periods until such intangible assets have been fully amortized. Future acquisitions may result in the amortization of additional intangible assets. Non-cash expenses. We provide non-GAAP information relative to the following non-cash expenses: (i) stock-based compensation; and (ii) non-cash interest. These items are further discussed as follow: • (i)Stock-based compensation. Because of varying valuation methodologies, subjective assumptions and the variety of award types, we exclude stock- based compensation from our operating results. We evaluate performance both with and without these measures because compensation expense related to stock-based compensation is typically non-cash and awards granted are influenced by the Company’s stock price and other factors such as volatility that are beyond our control. The expense related to stock-based awards is generally not controllable in the short-term and can vary significantly based on the timing, size and nature of awards granted. As such, we do not include such charges in operating plans. Stock-based compensation will continue in future periods. • ii)Non-cash interest. We exclude non-cash interest because we believe that excluding this expense provides management, as well as other users of the financial statements, with a valuable perspective on the cash-based performance and health of the business, including the current near-term projected liquidity. Non-cash interest expense will continue in future periods. Other expenses. We exclude certain other expenses that result from unplanned events outside the ordinary course of continuing operations, in order to measure operating performance and current and future liquidity both with and without these expenses. By providing this information, we believe management and the users of the financial statements are better able to understand the financial results of what we consider to be our organic, continuing operations. Included in these expenses are items such as other charges (credits), net, losses from extinguishment of debt, and changes in indemnification assets corresponding with the release of pre-spin liabilities for uncertain tax positions. 20 © 2022 Cerence Inc.
KPI Measures – Definitions Key performance indicators We believe that providing key performance indicators (“KPIs”), allows investors to gain insight into the way management views the performance of the business. We further believe that providing KPIs allows investors to better understand information used by management to evaluate and measure such performance. KPIs should not be considered superior to, or a substitute for, operating results prepared in accordance with GAAP. In assessing the performance of the business during the three months ended December 31, 2021, our management has reviewed the following KPIs, each of which is described below: • Percent of worldwide auto production with Cerence Technology: The number of Cerence enabled cars shipped as compared to IHS Markit car production data. • Average contract duration: The weighted average annual period over which we expect to recognize the estimated revenues from new license and connected contracts signed during the quarter, calculated on a trailing twelve months (“TTM”) basis and presented in years. • Repeatable software contribution: The percentage of repeatable revenues as compared to total GAAP revenue in the quarter on a TTM basis. Repeatable revenues are defined as the sum of License and Connected Services revenues. • Change in number of Cerence connected cars shipped: The year over year change in the number of cars shipped with Cerence connected solutions. Amounts calculated on a TTM basis. • Growth in billings per car: The rate of growth calculated from the average billings per car based on a trailing twelve month comparison while excluding legacy contract and adjusted for prepay usage. 21 © 2022 Cerence Inc.

Q1FY22 Reconciliations of GAAP to non-GAAP Results Three Months Ended Three Months Ended December 31, December 31, (unaudited - in thousands, except per share data) (unaudited - in thousands, except per share data) 2021 2020 2021 2020 GAAP net income $ 19,044 $ 20,941 GAAP revenue $ 94,426 $ 93,643 Stock-based compensation* 1,841 13,325 Amortization of intangible assets 5,033 5,037 GAAP gross profit $ 70,199 $ 66,755 Restructuring and other costs, net* 4,915 480 Stock-based compensation 1,092 1,592 Non-cash interest expense 1,301 1,230 Amortization of intangible assets 1,879 1,879 Indemnification asset release 1,302 - Non-GAAP gross profit $ 73,170 $ 70,226 Adjustments to income tax expense (8,108 ) (17,416 ) GAAP gross margin 74.3 % 71.3 % Non-GAAP net income $ 25,328 $ 23,597 Non-GAAP gross margin 77.5 % 75.0 % Adjusted EPS: GAAP operating income $ 22,932 $ 17,544 GAAP Numerator: Net income attributed to common shareholders $ 19,044 $ 20,941 Stock-based compensation* 1,841 13,325 Interest on Convertible Senior Notes, net of tax 1,911 1,831 Amortization of intangible assets 5,033 5,037 Net income attributed to common shareholders - diluted $ 20,955 $ 22,772 Restructuring and other costs, net* 4,915 480 Non-GAAP operating income $ 34,721 $ 36,386 Non-GAAP Numerator: GAAP operating margin 24.3 % 18.7 % Net income attributed to common shareholders $ 25,328 $ 23,597 Non-GAAP operating margin 36.8 % 38.9 % Interest on Convertible Senior Notes, net of tax 1,019 1,005 Net income attributed to common shareholders - diluted $ 26,347 $ 24,602 GAAP net income $ 19,044 $ 20,941 Stock-based compensation* 1,841 13,325 GAAP Denominator: Weighted-average common shares outstanding - basic 38,839 37,180 Amortization of intangible assets 5,033 5,037 Adjustment for diluted shares 5,531 6,184 Restructuring and other costs, net* 4,915 480 Weighted-average common shares outstanding - diluted 44,370 43,364 Depreciation 2,177 2,587 Total other income (expense), net (3,589 ) (6,018 ) Non-GAAP Denominator: Provision for (benefit from) income taxes 299 (9,415 ) Weighted-average common shares outstanding- basic 38,839 37,180 Adjusted EBITDA $ 36,898 $ 38,973 Adjustment for diluted shares 5,531 6,184 GAAP net income margin 20.2 % 22.4 % Weighted-average common shares outstanding - diluted 44,370 43,364 Adjusted EBITDA margin 39.1 % 41.6 % GAAP net income per share - diluted $ 0.47 $ 0.53 Non-GAAP net income per share - diluted $ 0.59 $ 0.57 GAAP net cash provided by operating activities $ 5,145 $ 10,809 Capital expenditures (4,410 ) (2,369 ) Free Cash Flow $ 735 $ 8,440
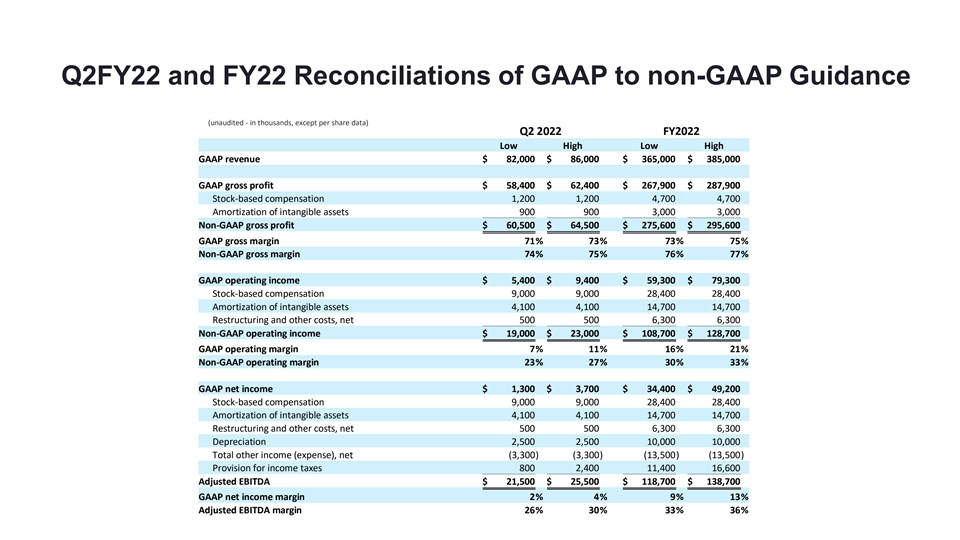
Q2FY22 and FY22 Reconciliations of GAAP to non-GAAP Guidance (unaudited - in thousands, except per share data) Q2 2022 FY2022 Low High Low High GAAP revenue $ 82,000 $ 86,000 $ 365,000 $ 385,000 GAAP gross profit $ 58,400 $ 62,400 $ 267,900 $ 287,900 Stock-based compensation 1,200 1,200 4,700 4,700 Amortization of intangible assets 900 900 3,000 3,000 Non-GAAP gross profit $ 60,500 $ 64,500 $ 275,600 $ 295,600 GAAP gross margin 71 % 73 % 73 % 75 % Non-GAAP gross margin 74 % 75 % 76 % 77 % GAAP operating income $ 5,400 $ 9,400 $ 59,300 $ 79,300 Stock-based compensation 9,000 9,000 28,400 28,400 Amortization of intangible assets 4,100 4,100 14,700 14,700 Restructuring and other costs, net 500 500 6,300 6,300 Non-GAAP operating income $ 19,000 $ 23,000 $ 108,700 $ 128,700 GAAP operating margin 7 % 11 % 16 % 21 % Non-GAAP operating margin 23 % 27 % 30 % 33 % GAAP net income $ 1,300 $ 3,700 $ 34,400 $ 49,200 Stock-based compensation 9,000 9,000 28,400 28,400 Amortization of intangible assets 4,100 4,100 14,700 14,700 Restructuring and other costs, net 500 500 6,300 6,300 Depreciation 2,500 2,500 10,000 10,000 Total other income (expense), net (3,300 ) (3,300 ) (13,500 ) (13,500 ) Provision for income taxes 800 2,400 11,400 16,600 Adjusted EBITDA $ 21,500 $ 25,500 $ 118,700 $ 138,700 GAAP net income margin 2 % 4 % 9 % 13 % Adjusted EBITDA margin 26 % 30 % 33 % 36 %
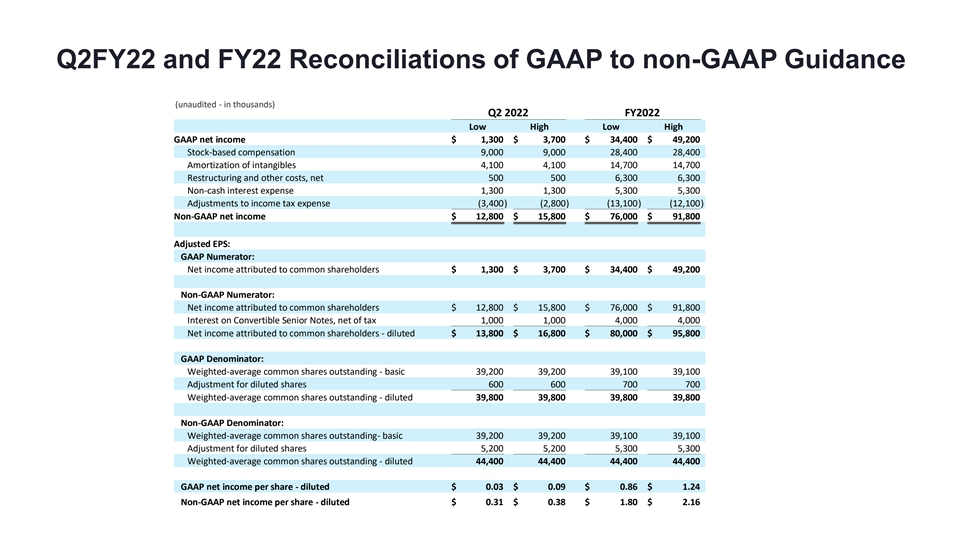
Q2FY22 and FY22 Reconciliations of GAAP to non-GAAP Guidance (unaudited - in thousands) Q2 2022 FY2022 Low High Low High GAAP net income $ 1,300 $ 3,700 $ 34,400 $ 49,200 Stock-based compensation 9,000 9,000 28,400 28,400 Amortization of intangibles 4,100 4,100 14,700 14,700 Restructuring and other costs, net 500 500 6,300 6,300 Non-cash interest expense 1,300 1,300 5,300 5,300 Adjustments to income tax expense (3,400 ) (2,800 ) (13,100 ) (12,100 ) Non-GAAP net income $ 12,800 $ 15,800 $ 76,000 $ 91,800 Adjusted EPS: GAAP Numerator: Net income attributed to common shareholders $ 1,300 $ 3,700 $ 34,400 $ 49,200 Non-GAAP Numerator: Net income attributed to common shareholders $ 12,800 $ 15,800 $ 76,000 $ 91,800 Interest on Convertible Senior Notes, net of tax 1,000 1,000 4,000 4,000 Net income attributed to common shareholders - diluted $ 13,800 $ 16,800 $ 80,000 $ 95,800 GAAP Denominator: Weighted-average common shares outstanding - basic 39,200 39,200 39,100 39,100 Adjustment for diluted shares 600 600 700 700 Weighted-average common shares outstanding - diluted 39,800 39,800 39,800 39,800 Non-GAAP Denominator: Weighted-average common shares outstanding- basic 39,200 39,200 39,100 39,100 Adjustment for diluted shares 5,200 5,200 5,300 5,300 Weighted-average common shares outstanding - diluted 44,400 44,400 44,400 44,400 GAAP net income per share - diluted $ 0.03 $ 0.09 $ 0.86 $ 1.24 Non-GAAP net income per share - diluted $ 0.31 $ 0.38 $ 1.80 $ 2.16