Exhibit 99.3
FELDMAN FINANCIAL ADVISORS, INC.
8804 MIRADOR PLACE
MCLEAN, VA 22102
202-467-6862
Federal Savings Bank
Dover, New Hampshire
Conversion Valuation Appraisal Report
Valued as of February 15, 2019
Prepared By
Feldman Financial Advisors, Inc.
McLean, Virginia
FELDMAN FINANCIAL ADVISORS, INC.
8804 MIRADOR PLACE
MCLEAN, VA 22102
202-467-6862
February 15, 2019
Board of Directors
Federal Savings Bank
633 Central Avenue
Dover, New Hampshire 03820
Members of the Board:
At your request, we have completed and hereby provide an independent appraisal (the “Appraisal”) of the estimated pro forma market value of Federal Savings Bank (“FSB” or the “Bank”) on a fully converted basis as of February 15, 2019 in conjunction with the Bank’s reorganization (the “Reorganization”) from a federally chartered mutual savings bank into atwo-tier federal mutual holding company structure. The Bank intends to change its name to “First Seacoast Bank” in connection with the Reorganization.
Pursuant to the Reorganization, the Bank will become a stock savings bank and wholly owned subsidiary of First Seacoast Bancorp (the “Company”). The Company will be a majority-owned subsidiary of First Seacoast Bancorp, MHC (the “MHC”) and offer 44.0% of its outstanding shares of common stock for sale in a subscription and community offering (the “Offering”) to eligible depositors and borrowers, employee benefit plans, and certain members of the general public. The Appraisal is furnished pursuant to the filing by the Bank of an application with respect to the Reorganization and Offering with the Board of Governors of the Federal Reserve System.
Feldman Financial Advisors, Inc. (“Feldman Financial”) is a financial consulting and economic research firm that specializes in financial valuations and analyses of business enterprises and securities in the thrift, banking, and mortgage industries. The background of Feldman Financial is presented in Exhibit I. In preparing the Appraisal, we conducted an analysis of the Bank that included discussions with the Bank’s management, the Bank’s legal counsel, Luse Gorman, PC, and the Bank’s independent registered public accounting firm, Baker Newman & Noyes LLC. In addition, where appropriate, we considered information based on other available published sources that we believe are reliable; however, we cannot guarantee the accuracy and completeness of such information.
We also reviewed, among other factors, the economy in the Bank’s primary market area and compared the Bank’s financial condition and operating performance with that of selected publicly traded thrift institutions. We reviewed conditions in the securities markets in general and in the market for thrift institution common stocks in particular.
FELDMAN FINANCIAL ADVISORS, INC.
Board of Directors
Federal Savings Bank
February 15, 2019
Page Two
The Appraisal is based on the Bank’s representation that the information contained in the Application and additional evidence furnished to us by the Bank and its independent auditor are truthful, accurate, and complete. We did not independently verify the financial statements and other information provided by the Bank and its independent auditor, nor did we independently value the assets or liabilities of the Bank. The Appraisal considers the Bank only as a going concern and should not be considered as an indication of the liquidation value of the Bank.
It is our opinion that, as of February 15, 2019, the estimated pro forma market value of the Bank on a fully converted basis was within a range (the “Valuation Range”) of $39,100,000 to $52,900,000 with a midpoint of $46,000,000. The Valuation Range was based upon a 15% decrease from the midpoint to determine the minimum and a 15% increase from the midpoint to establish the maximum. Assuming an additional 15% increase above the maximum value would result in an adjusted maximum of $60,835,000.
As part of the Offering, the Company will offer common stock for sale in an amount equal to 44.0% of the aggregate pro forma market value. Thus, assuming an offering price of $10.00 per share of common stock, the Company will offer a minimum of 1,720,400 shares, a midpoint of 2,024,000 shares, a maximum of 2,327,600 shares, and an adjusted maximum of 2,676,740 shares. The aggregate pro forma market value of the common stock sold in the Offering will range from $17,204,000 at the minimum and $20,240,000 at the midpoint to $23,276,000 at the maximum and $26,767,400 at the adjusted maximum.
The shares being sold in the Offering represent 44.0% of the shares of common stock of the Company that will be outstanding following the Offering. After the Offering, 55.0% of the Company’s outstanding shares of common stock will be owned by the MHC and 1.0% will be contributed to the Bank’s charitable foundation, so long as such contribution is approved by the members of the Bank. The Bank also plans to contribute $150,000 in cash to the charitable foundation from the net proceeds raised in the Offering.
Our Appraisal is not intended, and must not be construed, to be a recommendation of any kind as to the advisability of purchasing shares of common stock in the Offering. Moreover, because the Appraisal is necessarily based upon estimates and projections of a number of matters, all of which are subject to change from time to time, no assurance can be given that persons who purchase shares of stock in the Offering will thereafter be able to sell such shares at prices related to the foregoing estimate of the Bank’s pro forma market value. Feldman Financial is not a seller of securities within the meaning of any federal or state securities laws and any report prepared by Feldman Financial shall not be used as an offer or solicitation with respect to the purchase or sale of any securities.
FELDMAN FINANCIAL ADVISORS, INC.
Board of Directors
Federal Savings Bank
February 15, 2019
Page Three
The Valuation Range reported herein will be updated as appropriate. These updates will consider, among other factors, any developments or changes in the Bank’s operating performance, financial condition, or management policies, and current conditions in the securities markets for thrift institution common stocks. Should any such new developments or changes be material, in our opinion, to the valuation of the Bank, appropriate adjustments to the estimated pro forma market value will be made. The reasons for any such adjustments will be explained in detail at that time.
| Respectfully submitted, |
| Feldman Financial Advisors, Inc. |
 |
| Trent R. Feldman |
| President |
 |
| Peter W. L. Williams |
| Principal |
FELDMAN FINANCIAL ADVISORS, INC.
TABLE OF CONTENTS
TAB | PAGE | |||||
| INTRODUCTION | 1 | |||||
| I. | CHAPTER ONE – BUSINESS OF FEDERAL SAVINGS BANK | |||||
| General Overview | 4 | |||||
| Financial Condition | 12 | |||||
| Income and Expense Trends | 23 | |||||
| Interest Rate Risk Management | 29 | |||||
| Asset Quality | 33 | |||||
| Subsidiary Activity | 36 | |||||
| Office Facilities | 37 | |||||
| Legal Proceedings | 39 | |||||
| Market Area | 40 | |||||
| Summary Outlook | 53 | |||||
| II. | CHAPTER TWO – COMPARISONS WITH PUBLICLY TRADED THRIFTS | |||||
| General Overview | 55 | |||||
| Selection Criteria | 56 | |||||
| Recent Financial Comparisons | 60 | |||||
| III. | CHAPTER THREE – MARKET VALUE ADJUSTMENTS | |||||
| General Overview | 72 | |||||
| Earnings Prospects | 73 | |||||
| Financial Condition | 74 | |||||
| Market Area | 74 | |||||
| Management | 75 | |||||
| Dividend Payments | 76 | |||||
| Liquidity of the Issue | 77 | |||||
| Subscription Interest | 78 | |||||
| Recent Acquisition Activity | 79 | |||||
| Effect of Banking Regulations and Regulatory Reform | 81 | |||||
| Stock Market Conditions | 82 | |||||
| Adjustments Conclusion | 88 | |||||
| Valuation Approach | 88 | |||||
| Valuation Conclusion | 91 | |||||
| IV. | APPENDIX – EXHIBITS | |||||
| I | Background of Feldman Financial Advisors, Inc. | I-1 | ||||
| II-1 | Balance Sheets | II-1 | ||||
| II-2 | Income Statements | II-2 | ||||
| II-3 | Loan Portfolio Composition | II-3 | ||||
| II-4 | Cash and Investments Composition | II-4 | ||||
| II-5 | Deposit Account Composition | II-5 | ||||
| II-6 | Borrowed Funds Composition | II-6 | ||||
| II-7 | Office Properties | II-7 | ||||
| III | Financial and Market Data for All Public Thrifts | III-1 | ||||
| IV-1 | Pro Forma Assumptions for the Fully Converted Valuation Range | IV-1 | ||||
| IV-2 | Pro Forma Fully Converted Valuation Range | IV-2 | ||||
| IV-3 | Pro Forma Fully Converted Analysis at the Maximum Valuation | IV-3 | ||||
| IV-4 | Comparative Valuation Ratio Differential | IV-4 | ||||
| V-1 | Pro Forma Assumptions for the MHC Minority Offering | V-1 | ||||
| V-2 | Pro Forma MHC Minority Offering Range | V-2 | ||||
i
FELDMAN FINANCIAL ADVISORS, INC.
LIST OF TABLES
TAB | PAGE | |||||
| I. | CHAPTER ONE – BUSINESS OF FEDERAL SAVINGS BANK | |||||
| Table 1 | Selected Financial Condition Data | 12 | ||||
| Table 2 | Relative Balance Sheet Concentrations | 13 | ||||
| Table 3 | Income Statement Summary | 24 | ||||
| Table 4 | Income Statement Ratios | 25 | ||||
| Table 5 | Yield and Cost Summary | 26 | ||||
| Table 6 | Net Portfolio Value of Equity | 32 | ||||
| Table 7 | Non-performing Asset Summary | 34 | ||||
| Table 8 | Allowance for Loan Losses | 35 | ||||
| Table 9 | Selected Demographic Data | 42 | ||||
| Table 10 | Branch Office Deposit Data and Map | 45 | ||||
| Table 11 | Deposit Market Share in Strafford County, New Hampshire | 47 | ||||
| Table 12 | Deposit Market Share in Rockingham County, New Hampshire | 48 | ||||
| Table 13 | Residential Lending Share in Stafford County, New Hampshire | 50 | ||||
| Table 14 | Residential Lending Share in Rockingham County, New Hampshire | 51 | ||||
| Table 15 | Residential Lending Share in York County, Maine | 52 | ||||
| II. | CHAPTER TWO – COMPARISONS WITH PUBLICLY TRADED THRIFTS | |||||
| Table 16 | Comparative Group Operating Summary | 59 | ||||
| Table 17 | Key Financial Comparisons | 61 | ||||
| Table 18 | General Operating Characteristics | 67 | ||||
| Table 19 | Summary Financial Performance Ratios | 68 | ||||
| Table 20 | Income and Expense Analysis | 69 | ||||
| Table 21 | Balance Sheet Composition | 70 | ||||
| Table 22 | Growth Rates, Credit Risk, and Loan Composition | 71 | ||||
| III. | CHAPTER THREE – MARKET VALUE ADJUSTMENTS | |||||
| Table 23 | Summary of Recent Northeast Acquisition Activity | 80 | ||||
| Table 24 | Comparative Three-Year Stock Index Performance | 83 | ||||
| Table 25 | ComparativeOne-Year Stock Index Performance | 84 | ||||
| Table 26 | Summary of Recent MHC Minority Stock Offerings | 86 | ||||
| Table 27 | Comparative Pro Forma Fully Converted Valuation Analysis | 93 | ||||
| Table 28 | Comparative Pro Forma Minority Offering Valuation Analysis | 94 | ||||
ii
FELDMAN FINANCIAL ADVISORS, INC.
INTRODUCTION
At your request, we have completed and hereby provide an independent appraisal (the “Appraisal”) of the estimated pro forma market value of Federal Savings Bank (“FSB” or the “Bank”) on a fully converted basis as of February 15, 2019 in conjunction with the Bank’s reorganization (the “Reorganization”) from a federally chartered mutual savings bank into atwo-tier federal mutual holding company structure. The Bank intends to change its name to “First Seacoast Bank” in connection with the Reorganization.
Pursuant to the Reorganization, the Bank will become a stock savings bank and wholly owned subsidiary of First Seacoast Bancorp (the “Company”). The Company will be a majority-owned subsidiary of First Seacoast Bancorp, MHC (the “MHC”) and offer 44.0% of its outstanding shares of common stock for sale in a subscription and community offering (the “Offering”) to eligible depositors and borrowers, employee benefit plans, and certain members of the general public. The Appraisal is furnished pursuant to the filing by the Bank of an application with respect to the Reorganization and Offering with the Board of Governors of the Federal Reserve System.
Feldman Financial Advisors, Inc. (“Feldman Financial”) is a financial consulting and economic research firm that specializes in financial valuations and analyses of business enterprises and securities in the thrift, banking, and mortgage industries. The background of Feldman Financial is presented in Exhibit I. In preparing the Appraisal, we conducted an analysis of the Bank that included discussions with the Bank’s management, the Bank’s legal counsel, Luse Gorman, PC, and the Bank’s independent registered public accounting firm, Baker Newman & Noyes LLC. In addition, where appropriate, we considered information based on other available published sources that we believe are reliable; however, we cannot guarantee the accuracy and completeness of such information.
1
FELDMAN FINANCIAL ADVISORS, INC.
We also reviewed, among other factors, the economy in the Bank’s primary market area and compared the Bank’s financial condition and operating performance with that of selected publicly traded thrift institutions. We reviewed conditions in the securities markets in general and in the market for thrift institution common stocks in particular.
The Appraisal is based on the Bank’s representation that the information contained in the Application and additional evidence furnished to us by the Bank and its independent auditor are truthful, accurate, and complete. We did not independently verify the financial statements and other information provided by the Bank and its independent auditor, nor did we independently value the assets or liabilities of the Bank. The Appraisal considers the Bank only as a going concern and should not be considered as an indication of the liquidation value of the Bank.
Our Appraisal is not intended, and must not be construed, to be a recommendation of any kind as to the advisability of purchasing shares of common stock in the Offering. Moreover, because the Appraisal is necessarily based upon estimates and projections of a number of matters, all of which are subject to change from time to time, no assurance can be given that persons who purchase shares of stock in the Offering will thereafter be able to sell such shares at prices related to the foregoing estimate of the Bank’s pro forma market value. Feldman Financial is not a seller of securities within the meaning of any federal or state securities laws and any report prepared by Feldman Financial shall not be used as an offer or solicitation with respect to the purchase or sale of any securities.
2
FELDMAN FINANCIAL ADVISORS, INC.
The Valuation Range reported herein will be updated as appropriate. These updates will consider, among other factors, any developments or changes in the Bank’s operating performance, financial condition, or management policies, and current conditions in the securities markets for thrift institution common stocks. Should any such new developments or changes be material, in our opinion, to the valuation of the Bank, appropriate adjustments to the estimated pro forma market value will be made. The reasons for any such adjustments will be explained in detail at that time.
3
FELDMAN FINANCIAL ADVISORS, INC.
I. BUSINESS OF FEDERAL SAVINGS BANK
General Overview
Originally chartered in 1890, FSB is a federally chartered mutual savings bank headquartered in Dover, New Hampshire. The Bank’s business consists primarily of taking deposits from the general public and investing those deposits, together with funds generated from operations and borrowings from the Federal Home Loan Bank (“FHLB”), inone- to four-family residential real estate loans, commercial real estate and multi-family loans, commercial business loans, home equity loans and lines of credit, and consumer loans. In recent years, the Bank has increased its focus on originating higher yielding commercial real estate and commercial business loans, and intends to continue expanding its portfolio ofnon-residential loans.
The Bank intends to change its name to “First Seacoast Bank” in connection with the Reorganization and Offering. The Bank believes this new name will enhance its brand and market visibility and associate it by name with the New Hampshire and southern Maine Seacoast Region, which the Bank serves and considers to be its primary market area.
FSB conducts its operations from four full-service banking offices in Strafford County, New Hampshire and one full-service banking office in Rockingham County, New Hampshire. The Bank considers its primary lending market area to be Strafford and Rockingham counties in New Hampshire and York County in southern Maine. At December 31, 2018, the Bank had total assets of $387.1 million, total deposits of $274.4 million, and total equity of $32.7 million (8.45% of assets). The Bank reported net income of $1.1 million for the year ended December 31, 2018. The Bank’s deposits are insured up to applicable limits by the Federal Deposit Insurance Corporation (“FDIC”). The Bank is subject to regulation, examination, and supervision by the Office of the Comptroller of the Currency, its primary federal regulator, and the FDIC, its deposit insurer. The Bank is also a member of the FHLB of Boston.
4
FELDMAN FINANCIAL ADVISORS, INC.
The Bank has served residents of the Seacoast Region of New Hampshire since 1890. Originally established as DoverCo-Operative Savings Fund and Loan Association, the Bank was known subsequently as DoverCo-Operative Bank and later became Dover Federal Savings and Loan Association. The Bank’s present main office at 633 Central Avenue in Dover was constructed in 1972. The Bank’s name was changed to Federal Savings Bank in 1983 to reflect a growing customer base in areas outside of Dover.
Historically, the Bank has operated as a conservative residential lender with a focus on managing growth and increasing its capital. Sinceyear-end 2000, the Bank’s assets increased at a compound annual growth rate (“CAGR”) of 4.8% and increased from $$165.3 million at December 31, 2000 to $387.1 million at December 31, 2018. Over the same time period, the Bank’s ratio of total equity to assets improved from 6.56% to 8.45%. While the Bank’s primary lending thrust has centered on the origination of residential mortgage loans, FSB has steadily expanded its balances of commercial real estate loans and commercial business loans.
The Bank has continued its track record of maintaining excellent asset quality. Even during the financial crisis and recessionary period from 2007 to 2010, the Bank’syear-end ratio ofnon-performing assets to assets peaked at only 1.13% as of December 31, 2010. More recently, the Bank’s ratio ofnon-performing asset to assets measured 0.02% at December 31, 2018. While the Bank has enjoyed steady asset growth, improved capital ratios, and outstanding asset quality, its profitability in recent years has been somewhat undistinguished. From 2010 to 2018, the Bank reported consecutive years of positive earnings with an average return on assets (“ROA”) of 0.35%. FSB reported an ROA of 0.29% for year ended December 31, 2018.
5
FELDMAN FINANCIAL ADVISORS, INC.
The Bank’s earnings generally have been hampered by relatively high levels ofnon-interest expense and low levels ofnon-interest income. The recent increases in operating expenses have mostly reflected FSB’s investment in staffing, systems, and infrastructure to facilitate the implementation and management of its organic growth strategies. The Bank believes that these expenditures and enhancement will position it to take advantage of growth opportunities given the attractive demographics of its primary market area. In addition, the Bank also faces intensified competition from other financial institutions, including new entrants, because of the favorable market attributes and must also seek to defend its market share penetration from further encroachment.
The Seacoast Region benefits from an economy with high employment, rising home values, and a migration of individuals fromout-of-state. The Bank is optimistic about the growth of business and residential real estate activity in the current environment. Rising costs for employees, healthcare, technology, compliance and other expenses, combined with a flattening yield curve, remain a financial challenge for the Bank
The Bank has continued to pursue a business strategy that is intended to improve long-term profitability and optimize its capital position. Among other initiatives, the business strategy emphasizes: (1) maintaining a conservative balance sheet; (2) investing in personnel, technology, and marketing; (3) enhancing asset quality; and (4) maintaining an effective risk management system. The Bank has reformulated its strategic planning process to adopt a longer-term outlook. As part of that process and in preparation for a potential capital infusion, the Bank implemented a management team transition in 2018.
6
FELDMAN FINANCIAL ADVISORS, INC.
James Brannen, who joined the Bank in 2007 and previously served as Executive Vice President, Chief Financial Officer and Senior Loan Officer, became President and Chief Executive Officer in 2018. Mr. Brannen has 35 years of experience in community banking in New Hampshire. During his banking career, he has gained experience in credit, lending, collections and branch administration functions, as well as in developing new lending programs, implementing new technologies, and in bank mergers and branch acquisitions. Richard Donovan joined the Bank in 2018 as Senior Vice President and Chief Financial Officer. Previously, Mr. Donovan served as a finance consultant for several community and regional banks in theMid-Atlantic and New England and as Vice President of Finance at a community bank in New York, and spent 12 years as a Certified Public Accountant at a regional accounting firm. In addition, the Bank also hired two new officers in 2018 for the positions of Vice President-Bank Administration and Risk Management Officer and Vice President-Human Resources Director.
The Bank’s current long-term strategic objectives focus on (1) earnings growth, (2) capital planning, (3) asset growth, and (4) cost control and efficiency. The earnings growth objective is aimed primarily at achieving commercial real estate and residential mortgage loan growth along with wealth management and deposit fee income growth. The capital planning objective will be accomplished principally through completion of the planned Reorganization and Offering. The asset growth objective will be facilitated by realizing growth in commercial real estate, residential mortgage, and consumer loan originations and portfolio size, as well as increases in the Bank’s investment portfolio. The efficiency and cost control objective will be achieved partially by a renegotiation of the core processor vendor contract, a focus on technology-supported process reengineering, and an increase in total assets to improve the efficiency ratio.
7
FELDMAN FINANCIAL ADVISORS, INC.
The Bank believes that its community orientation is attractive to customers and distinguishes it from the larger banks that operate in the local market area. The Bank continues to stress high quality, personal customer service through an honest, straightforward, and upfront marketing approach and has developed a loyal customer base. The Bank relies on its experienced and committed staff to meet the needs of customers and effectively deliver banking products and services.
The core elements of the Bank business strategy are outlined in more detail below:
| • | Grow the balance sheet, leverage existing infrastructure, and improve profitability and operating efficiency.Given the Bank’s existing infra-structure and capabilities, FSB believes it is well-positioned to grow without a proportional increase in overhead expense or operating risk. In recent years, it has assembled an experienced management team and selectively hired lending, business development, and support staff. The Bank’s operations also benefit from established marketing, information technology, and audit and compliance departments. Additionally, FSB has invested in Internet banking capabilities and introduced a mobile banking application. The Bank has continued to invest in its existing branch office network and has renovated all branch offices within the past five years. This investment in infrastructure is reflected in the Bank’s relatively high efficiency ratio of 89.63% for the year ended December 31, 2018. The Offering will provide the Bank with funds to increase its lending and investment activity on a managed basis, which FSB expects will increase earnings and improve its operating efficiency. |
| • | Grow the loan portfolio and increase commercial real estate and commercial business lending.Historically, the Bank’s principal business activity has been the origination ofone- to four-family residential mortgage loans. In recent years the Bank has have sought to supplement these originations by focusing on originating higher yielding commercial real estate loans (including owner-occupied andnon-owner-occupied commercial real estate and multi-family loans), construction loans, commercial business loans, and home equity loans and lines of credit. The Bank intends to remain an active residential mortgage lender in its market area while expanding its focus on originating commercial real estate and commercial business loans. The capital that FSB is raising in the Offering will increase the Bank’s legal lending limits, which will enable it to originate larger loans for portfolio retention to new and existing customers and reduce the need to participate with other lenders to originate larger loans. |
| • | Maintain strong asset quality and manage credit risk.Strong asset quality is a key to the long-term financial success of any financial institution. FSB has been successful in maintaining strong asset quality in recent years. The Bank’s ratio ofnon-performing assets to total assets was 0.02%, 0.33%, 0.06%, 0.11% and 0.20% at December 31, 2018, 2017, 2016, 2015 and 2014, |
8
FELDMAN FINANCIAL ADVISORS, INC.
respectively. FSB attributes this historical credit quality to a conservative credit culture and an effective credit risk management environment. The Bank has an experienced team of credit professionals, well-defined and implemented credit policies and procedures, active credit monitoring policies and procedures, and what it believes to be are conservative loan underwriting criteria. |
| • | Increase core deposits and reduce reliance on higher cost borrowings. Deposits are the Bank’s primary source of funds for lending and investment. Core deposits (which are defined as all deposits except for certificates of deposit), particularlynon-interest-bearing demand deposits, represent alow-cost, stable source of funds. Core deposits amounted to 77.2% of the Bank’s total deposits at December 31, 2018. However, the Bank also relies on higher cost FHLB borrowings as a supplemental funding source as indicated by the Bank’s relatively highloan-to-deposit ratio. At December 31, 2018, the Bank’s ratio of net loans to deposits was 116.1% and FHLB borrowings totaled $75.7 million. FSB intends to use a portion of the net proceeds from the Offering to repay certain FHLB borrowings, which it may do without incurring prepayment penalties. In addition, the Bank intends to continue to focus on expanding core deposits by leveraging its business development officers and commercial lending and retail relationships. |
| • | Grow organically and through opportunistic acquisitions or de novo branching.The Bank’s primary intention is to grow its balance sheet organically, and the capital it is raising in the Offering will enable it to increase its lending and investment capacity. As a local independent bank, FSB believes that it will have opportunities to gain market share from customer fallout resulting from the consolidation of competing financial institutions in its market area into larger,out-of-market acquirers. In addition to organic growth, the Bank may also consider expansion opportunities in its market area or in contiguous markets that it believes would enhance both its franchise value and stockholder returns. These opportunities may include establishing loan production offices, establishing new, orde novo, branch offices and/or acquiring branch offices. The capital that FSB is raising in the Offering would help it fund any such expansion opportunities that may arise. However, the Bank has no current plans or pending transactions related to such expansion opportunities. |
While its equity level is solid at 8.45% of total assets as of December 31, 2018, the Bank believes it must raise additional capital in order to facilitate its growth objectives and loan generation activity, and provide a greater cushion in response to the risk profile associated with continued expansion and future economic conditions. Over the past five years, the Bank’s total
9
FELDMAN FINANCIAL ADVISORS, INC.
equity increased from $28.0 million at December 31, 2013 to $32.7 million at December 31, 2018. However, the ratio of total equity to assets declined from 9.77% atyear-end 2013 to 8.45% atyear-end 2018 as the Bank’s asset growth outpaced its capital formation, which in the Bank’s current mutual form of ownership is reliant upon earnings generation. As a stock organization upon completion of the Reorganization, the Bank will be organized in the form used by commercial banks, most major corporations, and a majority of savings institutions. The ability to raise new equity capital through the issuance and sale of capital stock will allow the Bank the flexibility to increase its equity capital position more rapidly than by accumulating earnings.
The Bank also believes that the ability to attract new capital also will help address the needs of the communities it serves and enhance its ability to expand or to make acquisitions. After the Reorganization, the Bank will have increased ability to merge with or acquire other financial institutions or business enterprises. Finally, the Bank expects to benefit from its employees and directors having stock ownership in its business, since that is viewed as an effective performance incentive and a means of attracting, retaining, and compensating employees and directors. Although the Reorganization and Offering will create a stock savings bank and a stock holding company, only a minority of the common stock will be offered for sale in the offering. As a result, the mutual form of ownership and the ability to provide community-oriented financial services will be preserved through the mutual holding company structure.
In summary, the Bank’s primary reasons for implementing the Reorganization and undertaking the Offering are to:
| • | Increase the capital base to support new loan originations, higher lending limits, and expected future growth and profitability, although the Bank currently has capital well in excess of all applicable regulatory requirements. |
10
FELDMAN FINANCIAL ADVISORS, INC.
| • | Compete more effectively in the financial services marketplace. |
| • | Offer the Bank’s customers, employees, management and directors an equity ownership interest in First Seacoast Bancorp, the proposed stock holding company, and thereby an economic interest in the expected future success of the Bank and the Company. |
| • | Attract and retain qualified personnel by establishing stock-based benefit plans. |
| • | Increase the Bank’s flexibility to structure and finance the expansion of its operations, including potential acquisitions of other financial institutions or their branches, or establishingde novo branches, although the Bank has no current acquisitions or new branches planned. |
The remainder of Chapter I examines in more detail the trends addressed in this section, including the impact of changes in the Bank’s economic and competitive environment, and recent strategic initiatives. The discussion is supplemented by the exhibits in the Appendix. ExhibitII-1 summarizes the Bank’s audited balance sheets as December 31, 2017 and 2018. ExhibitII-2 presents the Bank’s audited income statements for the years ended December 31, 2016 to 2018.
11
FELDMAN FINANCIAL ADVISORS, INC.
Financial Condition
Table 1 presents selected data concerning the Bank’s financial position as of December 31, 2016 to 2018. Table 2 displays relative balance sheet concentrations for the Bank as of similaryear-end dates.
Table 1
Selected Financial Condition Data
As of December 31, 2016 to 2018
(Dollars in Thousands)
| December 31, | ||||||||||||
| 2018 | 2017 | 2016 | ||||||||||
Total assets | $ | 387,114 | $ | 359,747 | $ | 330,375 | ||||||
Cash and due from banks | 5,889 | 5,650 | 7,767 | |||||||||
Securitiesavailable-for-sale | 39,443 | 28,894 | 32,269 | |||||||||
Federal Home Loan Bank Stock | 3,718 | 3,179 | 2,338 | |||||||||
Total loans, net | 318,615 | 304,491 | 272,444 | |||||||||
Premises and equipment, net | 5,581 | 5,944 | 5,107 | |||||||||
Total deposits | 274,446 | 249,561 | 245,216 | |||||||||
Borrowings | 75,737 | 72,225 | 50,131 | |||||||||
Total equity | 32,727 | 31,898 | 30,907 | |||||||||
Source: Federal Savings Bank, financial statements.
Asset Composition
The Bank’s total assets amounted to $387.1 million at December 31, 2018, reflecting a 7.6% or $27.4 million increase from total assets of $359.7 million at December 31, 2017. In the prior year, the Bank’s total assets increased by 8.9% or $29.3 million from $330.4 million at December 31, 2016 to $359.7 million at December 31, 2017. The recent increase in total assets was primarily attributable to increases in the holdings of loans and investment securities funded by increases in total deposits and borrowings. Net total loans increased by 4.6% or $14.1 million from $304.5 million atyear-end 2017 to $318.6 million atyear-end 2018, spurred by growth
12
FELDMAN FINANCIAL ADVISORS, INC.
mainly in the residential mortgage loan portfolio and, to a lesser extent, increases in commercial real estate and commercial business loans. Securitiesavailable-for-sale increased by 36.5% or $9.5 million from $29.9 million atyear-end 2017 to $39.4 million atyear-end 2018. As a result of the increase in cash and investments, the ratio of net total loans to total assets declined from 84.6% at December 31, 2017 to 82.3% at December 31, 2018. Conversely, the aggregate balance of cash and investments increased from 10.5% at December 31, 2017 to 12.7% at December 31, 2018. Total deposits increased notably by 10.0% or $24.8 million from $249.6 million atyear-end 2017 to $274.4 million atyear-end 2018. The Bank’s ratio of net loans to total deposits decreased from 122.0% at December 31, 2017 to 116.1% at December 31, 2018.
Table 2
Relative Balance Sheet Concentrations
As of December 31, 2016 to 2018
(Percent of Total Assets)
| December 31, | ||||||||||||
| 2018 | 2017 | 2016 | ||||||||||
Cash and investments | 12.67 | % | 10.49 | % | 12.83 | % | ||||||
Total loans, net | 82.31 | 84.64 | 82.47 | |||||||||
Premises and equipment, net | 1.44 | 1.65 | 1.55 | |||||||||
Other assets | 3.58 | 3.22 | 3.16 | |||||||||
|
|
|
|
|
| |||||||
Total assets | 100.00 | % | 100.00 | % | 100.00 | % | ||||||
|
|
|
|
|
| |||||||
Total deposits | 70.90 | % | 69.37 | % | 74.22 | % | ||||||
Borrowings | 19.57 | 20.08 | 15.17 | |||||||||
Other liabilities | 1.08 | 1.69 | 1.25 | |||||||||
|
|
|
|
|
| |||||||
Total liabilities | 91.55 | 91.13 | 90.64 | |||||||||
Total equity | 8.45 | 8.87 | 9.36 | |||||||||
|
|
|
|
|
| |||||||
Total liabilities and equity | 100.00 | % | 100.00 | % | 100.00 | % | ||||||
|
|
|
|
|
| |||||||
Source: Federal Savings Bank, financial statements.
13
FELDMAN FINANCIAL ADVISORS, INC.
Lending is the principal business activity of the Bank, and its loan portfolio constitutes the largest portion of its assets and is the predominant source of its income. The largest segment of the Bank’s loan portfolio comprises real estate mortgage loans, consisting primarily of residential mortgage loans, commercial real estate and multi-family mortgage loans, and acquisition, development and land loans. Substantially all of the Bank’s collateralized real estate loans are secured by properties located in the Bank’s primary lending area.
As presented in ExhibitII-3, the Bank’s current loan portfolio is composed substantially of real estate loans. At December 31, 2018, real estate loans comprised $297.3 million or 92.7% of the gross loan portfolio and included residential loans (includingone- to four-family mortgages and home equity lines of credit) andnon-residential real estate loans (generally consisting of loans secured by commercial and multi-family real estate and acquisition, development and land loans).Non-real estate loans chiefly comprised commercial business loans and a limited amount of consumer loans. The Bank intends to continue to emphasize residential and commercial real estate lending with a focus on full-service relationship banking in its primary market area.
During the year ended December 31, 2018, the Bank originated $74.9 million of loans, including $25.8 million ofone- to four-family residential mortgages, $17.4 million of commercial real estate mortgages, $65,000 of multi-family dwelling unit loans, $18.7 million of acquisition, development and land loans, and $8.5 million of commercial business loans, with the remaining $4.4 million of originations comprising home equity and consumer loans. During the year ended December 31, 2018, the Bank received $60.9 million in loan principal repayments.
14
FELDMAN FINANCIAL ADVISORS, INC.
At December 31, 2018, the Bank had $201.8 million inone- to four-family residential loans, which represented 62.9% of its total loan portfolio.One- to four-family residential loans increased by 6.9% or $13.0 million from $188.8 million atyear-end 2017 to $201.8 million atyear-end 2018. The Bank’sone- to four-family residential real estate loans have terms of up to 30 years and are generally underwritten according to Freddie Mac guidelines. At December 31, 2018, approximately 91.5% of the Bank’sone- to four-family residential real estate loans were fixed-rate loans. The Bank sells a portion of fixed-rate conforming loans that it originates on a servicing-retained basis. Secondary market investors that purchase the Bank’s loans include Freddie Mac and the New Hampshire Housing Finance Authority. For the year ended December 31, 2017 and 2018, the Bank sold $7.2 million and $5.7 million, respectively, ofone-to four-family residential mortgage loans. The Bank’s portfolio of loans serviced for other amounted to $49.2 million at December 31, 2018.
At December 31, 2018, approximately 8.5% of the Bank’s residential mortgage loans were adjustable-rate loans. The Bank’s adjustable-rate mortgage loans have initialre-pricing terms of one, three, or five years. Following the initialre-pricing term, such loans adjust annually for the balance of the loan term. Adjustable-rate mortgage loans are indexed to theone-year U.S. Treasury constant maturity rate. The Bank typically retains its adjustable-rate residential mortgage loans in portfolio. The Bank does not offer “interest only” mortgage loans on permanent residential mortgage loans, and also does not offer residential mortgage loans that provide for negative amortization or principal or contain any other subprime loan characteristics.
In past years, the Bank has have purchasedone- to four-family jumbo residential mortgage loans to supplement its own origination efforts. The Bank purchased $10.9 million ofone- to four-family residential mortgage loans secured by properties in a contiguous state during the year ended December 31, 2017. As of December 31, 2018, those loans had an outstanding balance of $9.7 million and were performing according with their original terms.
15
FELDMAN FINANCIAL ADVISORS, INC.
At December 31, 2018, the Bank had $68.8 million in commercial real estate and multi-family real estate loans, which represented 21.5% of its total loan portfolio. The Bank’s commercial real estate lending activity is consistent with its strategy to diversify the loan portfolio and increase the overall portfolio yield. The Bank’s commercial real estate loans are secured by a variety of properties in the Bank’s primary market area, including retail spaces, distribution centers, office buildings, manufacturing and warehouse properties, convenience stores, and other local businesses. The Bank’s multi-family real estate loans, which amounted to $4.9 million atyear-end 2018, are secured by properties consisting of five or more rental units in the Bank’s market area, including apartment buildings and student housing.
The Bank’s commercial real estate and multi-family loans are generally originated as10-year balloon loans, whichre-price after five years and are amortized over 20 years. Interest rates on such loans are generally indexed to the FHLB of Boston five-year regular advance rate, plus a margin. The maximumloan-to-value ratio of the Bank’s commercial real estate loans is generally 80% of the lower of purchase price or appraised value of the properties securing the loan and generally requires a minimum debt-service coverage ratio of 1.2x. On a limited basis, the Bank also purchases and participates in commercial real estate loans from other financial institutions. Such loans are subject to the same underwriting criteria and loan approval requirements applied to loans originated by the Bank.
At December 31, 2018, the Bank had $15.6 million in acquisition, development and land loans, which represented 4.9% of its total loan portfolio. Acquisition, development and loan loans increased from $14.1 million atyear-end 2015 to $18.0 million atyear-end 2016 and $24.9 million atyear-end 2017, before declining to $15.6 million atyear-end 2018. These loans consist of residential construction loans, commercial real estate construction loans, and land
16
FELDMAN FINANCIAL ADVISORS, INC.
loans. The Bank originates loans to finance the construction or rehabilitation of owner-occupiedone- to four-family residential properties to prospective homeowners primarily located in its market area. Upon completion of construction, such loans convert to permanent mortgage loans. Atyear-end, 2018, residential construction loan balances were $13.7 million or 4.3% of the total loan portfolio, with an additional $9.5 million available for advance to borrowers. Residential construction loans are generally structured as interest-only for nine months, with a loan to value ratio generally not exceeding 80% of the appraised value on a completed basis or the cost of completion, whichever is less.
The Bank also originates loans to finance the construction of commercial properties, primarily owner-occupied properties located in its market area. Upon completion of construction, such loans convert to permanent commercial mortgage loans. At December 31, 2018, commercial construction loan balances totaled $1.9 million or 0.6% of the total loan portfolio, with an additional $1.9 million available for advance to borrowers. Commercial real estate construction loans are generally structured as interest-only for up to 18 months, with a loan to value of up to 80% of the appraised value on a completed basis or a loan to cost of completion ratio of up to 85%.
At December 31, 2018, the Bank had $22.0 million in commercial business loans, which represented 6.9% of its total loan portfolio. Commercial business loans outstanding have increased steadily from $16.2 million and $18.6 million at December 31, 2016 and 2017, respectively. The Bank’s commercial business loans include equipment loans, business acquisition loans, and lines of credit to businesses operating in the local market area. The Bank’s commercial business loans are generally used by the borrowers for working capital purposes or for acquiring equipment, inventory or furniture. These loans are generally secured bynon-real
17
FELDMAN FINANCIAL ADVISORS, INC.
estate business assets, including equipment, inventory, and accounts receivable, although the Bank may support this collateral with liens on real property such as buildings and other equipment. FSB generally requires its commercial business borrowers to maintain their primary deposit accounts with the Bank, which help to improve the Bank’s overall interest rate spread and profitability. The Bank’s commercial business loans include term loans and revolving lines of credit and are made with either variable or fixed rates of interest. Variable interest rates are indexed to the prime rate as published inThe Wall Street Journal, plus a margin.
The Bank had $11.2 million of home equity loans and lines of credit as of December 31, 2018, representing 3.5% of total loans. FSB offers home equity loans and lines of credit, which are multi-purpose loans used to finance various home or personal needs, where aone- to four-family primary or secondary residence serves as collateral. At December 31, 2018, the Bank’s home equity lines of credit had an additional $14.7 million available to draw. Home equity loans are originated by the Bank as fixed-rate term loans. Home equity lines of credit are tied to the prime rate as published inThe Wall Street Journal and are offered for terms of up to 25 years, with a10-year draw period and15-year repayment period. Generally, the Bank’s home equity loans and lines of credit are originated withloan-to-value ratios of up to 80%, inclusive of existing liens on the property.
At December 31, 2018, the Bank’s consumer loans amounted to $1.3 million, representing 0.4% of total loans. The Bank offers consumer loans to individuals who reside or work in its primary market area. Consumer lending has been a minor area of lending diversification for the Bank. Consumer loans generally consist of installment loans extended directly to the borrower. FSB expects that growth of its consumer loan portfolio will be limited, with such loans extended primarily to existing customers of the Bank.
18
FELDMAN FINANCIAL ADVISORS, INC.
ExhibitII-4 presents a summary of the Bank’s portfolio of cash, liquidity, and investments as of December 31, 2016 to 2018. The Bank’s primary investment objectives include the following: (1) provide and maintain liquidity to meet deposit withdrawal and loan funding needs; (2) help mitigate interest rate and market risk; (3) diversify the Bank’s assets; and (4) generate a reasonable rate of return on funds within the context of the Bank’s interest rate and credit risk objectives. The Bank’s Board of Directors is responsible for adopting and reviewing annually the investment policy of FSB. The Bank’s Asset/Liability Management Committee (“ALCO”) is responsible for implementing the Bank’s investment policy. Authority to make investments under the approved investment policy guidelines is delegated to the President and Chief Executive Officer, Chief Financial Officer, and Finance Officer. All of the Bank’s investment securities are classified asavailable-for-sale.
At December 31, 2018, the Bank’s cash and investments amounted to $55.5 million or 14.3% of total assets. Cash and cash equivalents along with certificates of deposit in other financial institutions amounted to $12.4 million or 22.2% of the Bank’s total cash and investments as of December 31, 2018. The Bank’savailable-for-sale securities portfolio totaled $39.4 million at December 31, 2018 and was composed of U.S. Government-sponsored enterprises obligations, municipal bonds, and residential mortgage-backed securities. The Bank’s securities portfolio had a weighted average yield of 2.64% at December 31, 2018. The Bank also owned $3.7 million of stock in the FHLB of Boston as of December 31, 2018.
Liability Composition
Deposits are the Bank’s primary external source of funds for lending and other investment purposes. The Bank has also utilized used borrowings actively to supplement deposits as a funding source. ExhibitII-5 presents a summary of the Bank’s deposit composition
19
FELDMAN FINANCIAL ADVISORS, INC.
as of December 31, 2016 to 2018. Total deposits amounted to $274.4 million or 70.9% of total assets and 77.4% of total liabilities at December 31, 2018. Total deposits increased by 10.0% or $24.8 million from $249.6 million at December 31, 2017 to $274.4 million at December 31, 2018. Recent deposit growth has largely been concentrated in the Bank’s money market deposit accounts and certificate of deposit accounts, which increased in 2018 by $18.5 million and $7.2 million, respectively.
FSB relies on personalized customer service, longstanding relationships with customers, and the favorable image of the Bank in its primary market area to attract and retain deposits. Deposit account terms vary according to the minimum balance required, the time period that funds must remain on deposit, and the interest rate, among other factors. In determining the terms of its deposit accounts, the Bank considers the rates offered by its competition, its liquidity needs, profitability, and customer preferences and concerns. FSB generally reviews its deposit pricing on a monthly basis and continually reviews its deposit mix. The Bank’s deposit pricing strategy has generally been to offer competitive rates, while generally not providing the highest rates in the market. The Bank finds it more profitable to concentrate on specific special rate and term accounts, which allows it to increase certain deposits without impacting the Bank’s overall liability costs for existing accounts. FSB also relies on customer service, convenience of its branch office locations, advertising, and existing customers to gather and develop deposit relationships.
The Bank has placed a concerted emphasis on attracting core(non-certificate) deposit accounts, which tend to represent low cost and more stable funding sources. Core deposits composed 77.2% or $211.8 million of total deposits at December 31, 2018, which reflected increases from 76.8% of total deposits or $188.4 million at December 31, 2016. As of December 31, 2018, the Bank’s weighted average cost of core deposits was 0.43%, the cost of certificate deposits was 1.69%, and the overall cost of total deposits was 0.72% (inclusive ofnon-interest bearing accounts).
20
FELDMAN FINANCIAL ADVISORS, INC.
As a member of the FHLB of Boston, the Bank may obtain FHLB borrowings based upon the security of FHLB capital stock owned and certain of the Bank’s real estate mortgage loans. Such advances may be made pursuant to several different credit programs, each of which has its own interest rate terms and range of maturities. The Bank uses FHLB advances to provide short-term funding as a supplement to its deposits. As of December 31, 2018, the Bank had $75.7 million in FHLB advances outstanding and $72.1 million in additional borrowing capacity from the FHLB of Boston. The Bank could access additional advances if it purchased additional FHLB of Boston capital stock.
The Bank intends to use a portion of the net proceeds from the Offering to repay FHLB borrowings, which it may do without incurring prepayment penalties. As of December 31, 2018, approximately 97.0% or $73.5 million of the total outstanding FHLB borrowings $75.7 were scheduled to mature in the year ended December 31, 2019. The weighted average interest rate of total borrowings outstanding as of December 31, 2018 was 2.52%.
Equity Capital
The Bank has historically maintained solid capital levels. However, as the Bank has steadily expanded its asset base, the ratio of total equity to total assets has declined. The total equity to assets ratio decreased from 9.77% at December 31, 2013 to 8.45% at December 31, 2018, although total equity capital increased from $28.0 million atyear-end 2013 to $32.7 million atyear-end 2018. Because of the Bank’s consistently below average level of profitability, its incremental equity accumulation has been slow. Over the five-year period fromyear-end 2013 toyear-end 2018, the Bank’s total equity increased at a compound annual growth rate of 2.8%, while it total assets increased by a corresponding rate of 6.1%.
21
FELDMAN FINANCIAL ADVISORS, INC.
The Bank’s capital level remains solid in comparison to minimum regulatory requirements. The Bank’s regulatory capital ratios of tier 1 leverage capital, common equity tier 1 risk-based capital, tier 1 risk-based capital, and total risk-based capital were 8.83%, 13.27%, 13.27%, and 14.41%, respectively, as of December 31, 2018. In comparison, the minimum regulatory requirements under federal banking agency guidelines were 4.00%, 4.50%, 6.00%, and 8.00%, and the threshold requirements for regulatory “well capitalized” levels were 5.00%, 6.50%, 8.00%, and 10.00%, respectively. Based on these regulatory capital ratios and requirements, the Bank was considered well capitalized for regulatory purposes as of December 31, 2018.
22
FELDMAN FINANCIAL ADVISORS, INC.
Income and Expense Trends
Table 3 displays the main components of the Bank’s earnings performance for the years ended December 31, 2016 to 2018. Table 4 displays the Bank’s principal income and expense ratios as a percent of average assets for the corresponding periods. Table 5 displays the Bank’s weighted average yields on interest-earning assets and weighted average costs of interest-bearing liabilities for the years ended December 31, 2016 to 2018.
General Overview
Over recent years, the Bank has exhibited a record of low to moderate profitability. The Bank’s average ROA for the past seven years ended December 31, 2018 was approximately 0.37%, and ranged from a high of 0.51% in 2012 to a low of 0.26% in 2017. The Bank reported an ROA of 0.29% for the year months ended December 31, 2018. Over the same time period for the seven years ended December 31, 2018, the Bank’sasset-size peer group of federally insured savings institutions registered an average ROA of 0.57%. Compared to its peer group, the Bank’s profitability trends can be characterized by above-average net interest margins, offset by relatively low levels ofnon-interest income and comparatively high operating expense ratios.
The Bank’s earnings were relative flat from 2014 to 2016, amounting to $1.1 million in 2014 and 2015 and $1.0 million in 2016. The Bank’s ROA measured 0.36%, 0.36%, and 0.32%, respectively, in 2014, 2015, and 2016. The Bank’s earnings amounted to $912,000 in 2017 and $1.1 million in 2018, reflecting ROA results of 0.26% and 0.29%, respectively, and return on average equity (“ROE”) results of 2.88% and 3.38%, respectively. The Bank net income for 2017 was impacted by aone-time,non-cash tax adjustment of $257,000 related to the reduction in the federal corporate income tax rate from 34.0% to 21.0% and the resulting effect on net deferred tax assets.
23
FELDMAN FINANCIAL ADVISORS, INC.
Table 3
Income Statement Summary
For the Years Ended December 31, 2015 to 2018
(Dollars in Thousands)
| Year Ended December 31, | ||||||||||||||||
| 2018 | 2017 | 2016 | 2015 | |||||||||||||
Interest income | $ | 14,264 | $ | 12,600 | $ | 11,489 | $ | 11,293 | ||||||||
Interest expense | 3,145 | 1,820 | 1,501 | 1,069 | ||||||||||||
|
|
|
|
|
|
|
| |||||||||
Net interest income | 11,119 | 10,780 | 9,988 | 10,224 | ||||||||||||
Provision for loan losses | — | 160 | 40 | (60 | ) | |||||||||||
|
|
|
|
|
|
|
| |||||||||
Net interest income after provision | 11,119 | 10,620 | 9,948 | 10,284 | ||||||||||||
Non-interest income | 1,550 | 1,815 | 1,549 | 1,616 | ||||||||||||
Non-interest expense | 11,356 | 10,822 | 10,065 | 10,342 | ||||||||||||
|
|
|
|
|
|
|
| |||||||||
Income before income taxes | 1,313 | 1,613 | 1,432 | 1,558 | ||||||||||||
Income tax provision | 232 | 701 | 430 | 479 | ||||||||||||
|
|
|
|
|
|
|
| |||||||||
Net income | $ | 1,081 | $ | 912 | $ | 1,002 | $ | 1,079 | ||||||||
|
|
|
|
|
|
|
| |||||||||
Source: Federal Savings Bank, financial statements.
Years Ended December 31, 2017 and 2018
Net income was $1.1 million for the year ended December 31, 2018, compared to net income of $912,000 for the year ended December 31, 2017, an increase of $169,000, or 18.5%. The increase was due to a $499,000 increase in net interest income after provision for loan losses and a $469,000 decrease in the provision for income taxes offset by a decrease innon-interest income of $265,000 and a $534,000 increase innon-interest expense. Net interest income increased by $339,000, or 3.1%, to $11.1 million in 2018 from $10.8 million in 2017. This increase was due to an increase in the balance of interest-earning assets in 2018 versus 2017, offset by a decrease in the net interest rate spread to 2.84% for 2018 from 3.07% in 2017 and a decrease in the net interest margin to 3.06% for 2018 from 3.22% in 2017.
24
FELDMAN FINANCIAL ADVISORS, INC.
Table 4
Income Statement Ratios
For the Years Ended December 31, 2015 to 2018
(Percent of Average Assets)
| Year Ended December 31, | ||||||||||||||||
| 2018 | 2017 | 2016 | 2015 | |||||||||||||
Interest income | 3.81 | % | 3.64 | % | 3.68 | % | 3.77 | % | ||||||||
Interest expense | 0.84 | 0.52 | 0.48 | 0.36 | ||||||||||||
|
|
|
|
|
|
|
| |||||||||
Net interest income | 2.97 | 3.12 | 3.20 | 3.41 | ||||||||||||
Provision for loan losses | 0.00 | 0.05 | 0.01 | (0.02 | ) | |||||||||||
|
|
|
|
|
|
|
| |||||||||
Net interest income after provision | 2.97 | 3.07 | 3.19 | 3.43 | ||||||||||||
Non-interest income | 0.41 | 0.52 | 0.50 | 0.54 | ||||||||||||
Non-interest expense | 3.03 | 3.13 | 3.23 | 3.45 | ||||||||||||
|
|
|
|
|
|
|
| |||||||||
Income before income taxes | 0.35 | 0.46 | 0.46 | 0.52 | ||||||||||||
Income tax provision | 0.06 | 0.20 | 0.14 | 0.16 | ||||||||||||
|
|
|
|
|
|
|
| |||||||||
Net income | 0.29 | 0.26 | 0.32 | 0.36 | ||||||||||||
|
|
|
|
|
|
|
| |||||||||
Source: Federal Savings Bank, financial statements; Feldman Financial.
The decrease in the net interest rate spread and the net interest margin was primarily due to the increase in the average balance of interest-bearing liabilities from $262.0 million for the year ended December 31, 2017 to $289.3 million for the year ended December 31, 2018 and an increase in the weighted average rate paid on interest-bearing liabilities from 0.69% for the year ended December 31, 2017 to 1.09% for the year ended December 31, 2018. This decrease was partially offset by an increase in the average balances and yields on interest-earning assets. The Bank’s loan portfolio yield increased by 12 basis points from 4.01% in 2017 to 4.13% in 2018, and the securities portfolio yield increased by 37 basis points from 2.18% in 2017 to 2.55% in 2018. As a result, the overall yield on total interest-earning assets increased by 17 basis points from 3.76% in 2017 to 3.93% in 2018.
25
FELDMAN FINANCIAL ADVISORS, INC.
Table 5
Yield and Cost Summary
For the Years Ended December 31, 2016 to 2018
| Year Ended | ||||||||||||
| December 31, | ||||||||||||
| 2018 | 2017 | 2016 | ||||||||||
Weighted Average Yields | ||||||||||||
Loans receivable | 4.13 | % | 4.01 | % | 4.06 | % | ||||||
Investment securities | 2.55 | 2.18 | 1.96 | |||||||||
Other interest-earning assets | 2.86 | 2.05 | 1.56 | |||||||||
Total interest-earning assets | 3.93 | 3.76 | 3.81 | |||||||||
Weighted Average Costs | ||||||||||||
NOW and demand deposits | 0.09 | 0.08 | 0.09 | |||||||||
Money market deposits | 1.23 | 0.74 | 0.96 | |||||||||
Savings deposits | 0.27 | 0.18 | 0.15 | |||||||||
Certificates of deposit | 1.51 | 1.29 | 1.19 | |||||||||
Total interest-bearing deposits | 0.79 | 0.58 | 0.60 | |||||||||
Borrowed funds | 1.99 | 1.11 | 0.93 | |||||||||
Total interest-bearing liabilities | 1.09 | 0.69 | 0.65 | |||||||||
Net interest rate spread (1) | 2.84 | 3.07 | 3.16 | |||||||||
Net interest margin (2) | 3.06 | 3.22 | 3.31 | |||||||||
| (1) | Weighted average yield on interest-earning assets less the weighted average cost of interest-bearing liabilities. |
| (2) | Net interest income divided by average total interest-earning assets. |
Source: Federal Savings Bank, financial data.
While the Bank’s weighted average yield on interest-earning assets increased by 17 basis points from 2017 to 2018, the weighted average cost of interest-bearing liabilities increased by 40 basis points from 0.69% to 1.09%. The Bank’s cost of interest-bearing deposits increased by 21 basis points from 0.58% in 2017 to 0.79% in 2018. The Bank’s cost of borrowings increased by 88 basis points from 1.11% in 2017 to 1.99% in 2018.
26
FELDMAN FINANCIAL ADVISORS, INC.
The Bank’s provision for loan losses declined from $160,000 for the year ended December 31, 2017 to zero for the year ended December 31, 2018. Based on management’s analysis of the allowance for loan losses, the Bank did not record a provision for loan losses during 2018. The decrease in the provision for the year ended December 31, 2018 was primarily related to the decrease innon-accrual loans from $1.2 million at December 31, 2017 to $68,000 at December 31, 2018. The Bank’s ratio ofnon-performing assets to total assets improved further from 0.33% at December 31, 2017 to 0.02% at December 31, 2018.
The Bank’snon-interest income primarily comprises customer service fees and charges, income from bank-owned life insurance, loan servicing fee income, and investment services fees. The Bank’snon-interest income decreased by $265,000 or 14.6% to $1.5 million for the year ended December 31, 2018 compared to $1.8 million for the year ended December 31, 2017. The decrease was primarily due to decreases in securities gains (losses) and loan servicing fee income during the year ended December 31, 2018, partially offset by an increase in fees and service charges. The Bank’s ratio ofnon-interest income to average assets declined from 0.52% to 0.41%. Excluding the impact of securities gains (losses), the Bank’snon-interest income declined from 0.47% of average assets in 2017 to 0.41% in 2018. The Bank’s customers service fees increased by 6.8% from $957,000 in 2017 to $1.0 million in 2018, while investment services fee income increased by 37.7% from $146,000 in 2017 to $200,000 in 2018.
The Bank generates investment services fee income through wealth management operations conducted by FSB Wealth Management, a division of the Bank. FSB Wealth Management currently employs two financial advisors and provides access tonon-FDIC insured products that include retirement planning, portfolio management, investment and insurance strategies, business retirement plans, and college planning to individuals throughout the Bank’s primary market area. These investments and services are offered through Infinex Investments, Inc., a registered broker-dealer and investment advisor. FSB Wealth Management receives fees
27
FELDMAN FINANCIAL ADVISORS, INC.
from advisory services and commissions on individual investment and insurance products purchased by clients. At December 31, 2018, FSB Wealth Management had approximately $39.5 million in assets under management.
Non-interest expense increased $534,000 or 4.9% to $11.4 million for the year ended December 31, 2018 from $10.8 million for the year ended December 31, 2017. The increase was due primarily to a $330,000 or 5.2% increase in salaries and employee benefits, a $71,000 or 14.8% increase in advertising costs, and an $111,000 or 11.6% increase in technology expenses. The increase in salaries and benefits was due to increased staffing, normal salary increases, and an increase in the cost of medical insurance benefits. The ratio ofnon-interest expense to average assets declined from 3.13% for the year ended December 31, 2017 to 3.03% for the year ended December 31, 2018. However, the Bank’s efficiency ratio increased from 88.3% in 2017 to 89.6% in 2018. (The efficiency ratio representsnon-interest expense divided by the sum of net interest income andnon-interest income exclusive of securities gains.)
The provision for income taxes decreased by $469,000 or 66.8% to $232,000 for the year ended December 31, 2018 from $701,000 for the year ended December 31, 2017. The effective tax rate was 43.5% and 17.7% for the years ended December 31, 2017 and 2018, respectively. The decrease in the provision for income taxes and effective tax rate was due primarily to the enactment of the Tax Cuts and Jobs Act of 2017 on December 22, 2017. Among other provisions, the legislation reduced the federal corporate income tax rate from 34.0% to 21.0% for tax years beginning after December 31, 2017. At the date the new legislation was enacted, the Bank was required to recognize the effects of the change in tax law and rates on its deferred tax assets and liabilities as a charge to income tax expense. As a result, the Bank recognized additional income tax expense of approximately $258,000 in 2017.
28
FELDMAN FINANCIAL ADVISORS, INC.
Interest Rate Risk Management
The Bank seeks to reduce its earnings vulnerability and capital risk to changes in market interest rates by managing the mismatch between asset and liability maturities and interest rates. The primary objective of the Bank’s asset/liability management program is to optimize earnings and return on capital within acceptable levels of risk. The Bank’s ALCO focuses on ensuring a stable and steadily increasing flow of net interest income through managing the size and mix of the balance sheet. The ALCO is expected to integrate the Bank’s asset/liability management process into its operational decision making, including portfolio structure, investments, business planning, funding decisions, and pricing. The ALCO is responsible for evaluating the interest rate risk inherent in the Bank’s assets and liabilities, for determining the level of risk that is appropriate given the Bank’s business strategy, operating environment, capital, liquidity and performance objectives, and for managing this risk consistent with the policy and guidelines approved by the Board of Directors.
The asset/liability management policy of the Bank falls under the authority of the Board of Directors, who in turn assigns authority for its formulation, revision and administration to the ALCO. Ultimate responsibility for effective asset/liability management rests with the Board.
The responsibilities conveyed to the ALCO include:
| • | Developing an asset/liability management process and related procedures. |
| • | Establishing a monitoring and reporting system. |
| • | Developing asset/liability strategies and tactics. |
| • | Submitting a written report to the Board at least quarterly. |
| • | Overseeing the maintenance of a management information system that supplies, on a timely basis, the information and data necessary for the ALCO to fulfill its role as asset/liability manager. |
29
FELDMAN FINANCIAL ADVISORS, INC.
FSB attempts to manage its interest rate risk to minimize the exposure of the Bank’s earnings and capital to changes in market interest rates. The Bank has implemented various strategies to manage its interest rate risk. By enacting these strategies, the Bank believe that it is better positioned to react to changes in market interest rates. These strategies include:
| • | Originating loans with adjustable interest rates. |
| • | Promoting core deposit products. |
| • | Selling a portion of fixed-rateone- to four-family residential mortgage loans. |
| • | Maintaining investment asavailable-for-sale securities. |
| • | Diversifying the Bank’s loan portfolio. |
| • | Strengthening the Bank’s capital position, so as to increase the ratio of interest-earning assets relative to interest-rate sensitivity funding sources. |
The Bank analyzes its sensitivity to changes in interest rates through a net portfolio value of equity (“NPV”) model. NPV represents the present value of the expected cash flows from the Bank’s assets less the present value of the expected cash flows arising from the Bank’s liabilities adjusted for the value ofoff-balance sheet contracts. The NPV ratio represents the dollar amount of NPV divided by the present value of total assets for a given interest rate scenario. NPV attempts to quantify the Bank’s economic value using a discounted cash flow methodology while the NPV ratio reflects that value as a form of capital ratio. The Bank estimates its NPV at a specific date, and then calculates the NPV at the same date throughout a series of interest rate scenarios representing immediate and permanent, parallel shifts in the yield curve. The Bank currently calculates NPV under the assumptions that interest rates increase 100, 200, 300 and 400 basis points from current market rates and that interest rates decrease 100 and 200 basis points from current market rates.
30
FELDMAN FINANCIAL ADVISORS, INC.
Table 6 represents an analysis of the Bank’ interest rate risk as measured by the estimated changes in its NPV, resulting from an instantaneous and sustained parallel shift in the yield curve at December 31, 2018, with no effect given to any steps that the Bank might take to counter the effect of such interest rate movement. As shown in Table 6, the Bank’s NPV would be negatively impacted by an increase in interest rates and positively impacted from a decrease in interest rates from current levels. As interest rates rise, the market value of fixed-rate mortgage loans tends to decline due to both the rate increases and slowing prepayments.
Table 6 indicates that the Bank’s NPV was $39.5 million or 10.48% of the fair value of portfolio assets as of December 31, 2018. Based upon the assumptions utilized, an immediate 200 basis point increase in market interest rates would result in a $6.5 million decrease in the Bank’s NPV and would result in a decrease of 108 basis points in the NPV ratio to 9.40%. An immediate increase of 100 basis points in market interest rates would result in a $2.9 million decrease in the Bank’s NPV and a decrease of 42 basis points in the NPV ratio to 10.06%. Conversely, an immediate decrease of 100 basis points in market interest rates would result in a $1.3 million increase in the Bank’s NPV and no change in the NPV ratio at 10.48%. As of December 31, 2018, the simulated changes in NPV were within the limits established in the Bank’s asset/liability management policy.
31
FELDMAN FINANCIAL ADVISORS, INC.
Table 6
Net Portfolio Value of Equity
As of December 31, 2018
(Dollars in Thousands)
Basis Point Change in Interest | Estimated NPV(2) | Amount Change from Base (000s) | Percent Change from Base | NPV Ratio(3) | Basis Point Change in NPV Ratio | |||||||||||||||
+ 400 b.p. | $ | 25,991 | $ | (13,510 | ) | (34.2 | )% | 7.91 | % | (257 | ) b.p. | |||||||||
+ 300 b.p. | 29,518 | (9,983 | ) | (25.3 | )% | 8.69 | % | (179 | ) b.p. | |||||||||||
+ 200 b.p. | 33,037 | (6,464 | ) | (16.4 | )% | 9.40 | % | (108 | ) b.p. | |||||||||||
+ 100 b.p. | 36,639 | (2,862 | ) | (7.2 | )% | 10.06 | % | (42 | ) b.p. | |||||||||||
Base | 39,501 | — | — | 10.48 | % | — | ||||||||||||||
- 100 b.p. | 40,789 | 1,288 | 3.3 | % | 10.48 | % | 0 | b.p. | ||||||||||||
- 200 b.p. | 36,747 | (2,754 | ) | (7.0 | )% | 9.24 | % | (124 | ) b.p. | |||||||||||
| (1) | Assumes an immediate uniform change in interest rates at all maturities. |
| (2) | NPV is the fair value of expected cash flows from assets, less fair value of the expected cash flows arising from liabilities adjusted for the value ofoff-balance sheet contracts. |
| (3) | NPV ratio represents NPV divided by the fair value of assets. |
Source: Federal Savings Bank, financial data.
32
FELDMAN FINANCIAL ADVISORS, INC.
Asset Quality
Table 7 summarizes the Bank’s totalnon-performing assets as of December 31, 2016 to 2018. The Bank has a solid record of reporting favorable asset quality in recent years. Totalnon-performing assets increased from $184,000 at December 31, 2016 to $1.2 million at December 31, 2017 and then decreased to $68,000 at December 31, 2018. The increase in 2017 reflected $1.2 million of acquisition, development and land loans placed onnon-accrual status. In relation to total assets,non-performing assets increased from 0.06% at December 31, 2016 to 0.33% at December 31, 2017 and subsequently declined to 0.02% at December 31, 2018. The Bank had no real estate owned at December 31, 2017 and 2018. Real estate owned of $90,000 was reported at December 31, 2016 and was attributable to foreclosed residential property.
Table 8 summarizes the Bank’s allowance for loan losses as of and for the year ended December 31, 2016 to 2018. The allowance for loan losses increased from $2.7 million at December 31, 2016 to $2.8 million at December 31, 2017 and 2018. The Bank recorded a provision for loan losses of $160,000 in 2017, but made no provision for loan losses in 2018 based on management’s analysis of the allowance for loan losses. As previously noted,non-accrual loans declined from $1.2 million atyear-end 2017 to $68,000 atyear-end 2018.
In relation to total loans, the allowance for loan losses decreased from 0.91% at December 31, 2017 to 0.88% at December 31, 2018. However, when compared tonon-performing loans, the allowance for loan losses increased from 233.08% at December 31, 2017 to 4,126.47% as a result of the decline innon-accrual loans. The Bank incurred $33,000 in net loan charge-offs during the year ended December 31, 2018 and $2,000 in net recoveries for the year ended December 31, 2018.
33
FELDMAN FINANCIAL ADVISORS, INC.
Table 7
Non-performing Asset Summary
As of December 31, 2016 to 2018
(Dollars in Thousands)
| December 31, | ||||||||||||
| 2018 | 2017 | 2016 | ||||||||||
Non-accrual Loans | ||||||||||||
One- to four-family residential | $ | 68 | $ | — | $ | 92 | ||||||
Commercial and multi-family real estate | — | — | — | |||||||||
Acquisition, development and land | — | 1,203 | — | |||||||||
Commercial business | — | — | — | |||||||||
Home equity line of credit | — | — | 2 | |||||||||
Consumer | — | — | — | |||||||||
|
|
|
|
|
| |||||||
Totalnon-accrual loans | 68 | 1,203 | 94 | |||||||||
|
|
|
|
|
| |||||||
Real estate owned | ||||||||||||
One- to four-family residential | — | — | 90 | |||||||||
Commercial and multi-family real estate | — | — | — | |||||||||
Acquisition, development and land | — | — | — | |||||||||
Commercial business | — | — | — | |||||||||
Home equity line of credit | — | — | — | |||||||||
Consumer | — | — | — | |||||||||
|
|
|
|
|
| |||||||
Total real estate owned | — | — | 90 | |||||||||
|
|
|
|
|
| |||||||
Totalnon-performing assets | $ | 68 | $ | 1,203 | $ | 184 | ||||||
|
|
|
|
|
| |||||||
Totalnon-performing loans to total loans | 0.02 | % | 0.39 | % | 0.03 | % | ||||||
Totalnon-performing assets to total assets | 0.02 | % | 0.33 | % | 0.06 | % | ||||||
Source: Federal Savings Bank, financial data.
34
FELDMAN FINANCIAL ADVISORS, INC.
Table 8
Allowance for Loan Losses
As of or For the Years Ended December 31, 2016 to 2018
(Dollars in Thousands)
| As of or For the Year Ended December 31, | ||||||||||||
| 2018 | 2017 | 2016 | ||||||||||
Allowance at beginning of year | $ | 2,804 | $ | 2,677 | $ | 2,731 | ||||||
Provision for loan losses | — | 160 | 40 | |||||||||
Charge-offs: | ||||||||||||
One- to four-family residential | — | — | (97 | ) | ||||||||
Commercial and multi-family real estate | — | — | — | |||||||||
Acquisition, development and land | — | (34 | ) | — | ||||||||
Commercial business | — | — | — | |||||||||
Home equity line of credit | — | — | — | |||||||||
Consumer | — | — | (2 | ) | ||||||||
|
|
|
|
|
| |||||||
Total charge-offs | — | (34 | ) | (99 | ) | |||||||
Recoveries | ||||||||||||
One- to four-family residential | — | — | — | |||||||||
Commercial and multi-family real estate | — | — | — | |||||||||
Acquisition, development and land | — | — | — | |||||||||
Commercial business | 1 | — | — | |||||||||
Home equity line of credit | — | — | — | |||||||||
Consumer | 1 | 1 | 5 | |||||||||
|
|
|
|
|
| |||||||
Total recoveries | 2 | 1 | 5 | |||||||||
Net (charge-offs) recoveries | 2 | (33 | ) | (94 | ) | |||||||
|
|
|
|
|
| |||||||
Allowance at end of year | $ | 2,806 | $ | 2,804 | $ | 2,677 | ||||||
|
|
|
|
|
| |||||||
Allowance tonon-performing loans | 4,126.47 | % | 233.08 | % | 2,847.87 | % | ||||||
Allowance to total loans at end of year | 0.88 | % | 0.91 | % | 0.98 | % | ||||||
Net (charge-offs) recoveries to average loans during the year | 0.00 | % | -0.01 | % | -0.04 | % | ||||||
Source: Federal Savings Bank, financial data.
35
FELDMAN FINANCIAL ADVISORS, INC.
Subsidiary Activity
The Bank has one subsidiary, FSB Service Corporation, Inc., which is inactive. Upon completion of the Reorganization, the Bank will become the wholly owned subsidiary of First Seacoast Bancorp.
36
FELDMAN FINANCIAL ADVISORS, INC.
Office Facilities
The Bank currently conducts business from its main office in Dover, New Hampshire and four additional full-service branch offices located in the New Hampshire towns of Barrington, Durham, Portsmouth, and Rochester. The Bank owns its main office building in Dover and the three branch offices in Barrington, Portsmouth, and Rochester. The Bank leases the branch office location in Durham. As of December 31, 2018, the net book value of the Bank’s land, buildings, and equipment was $5.6 million, measuring 1.4% of total assets. The Bank believes that its current facilities are adequate to meet its present and foreseeable needs, subject to possible future expansion.
ExhibitII-7 provides summary information about the Bank’s office properties. The main office and headquarters location are situated at 633 Central Avenue in Dover (Strafford County), Hampshire. This office is owned by the Bank and had a net book value of $2.1 million at December 31, 2018. The facility also includes adrive-up lane and an automated teller machine (“ATM”). The main office was opened originally in 1890.
The Barrington branch is located at 6 Eastern Avenue in Barrington (Strafford County), New Hampshire. This branch office is owned by the Bank and had a net book value of $1.1 million at December 31, 2018. The facility also has a drive-thru lane and an ATM. The Barrington branch has been open since 1974.
The Durham branch is located at 7A Mill Road in Durham (Strafford County), New Hampshire. This branch office is leased by the Bank and had a net book value of $60,000 at December 31, 2018. The facility has an ATM but does not have a drive-thru lane. The Durham branch was opened in 1979.
37
FELDMAN FINANCIAL ADVISORS, INC.
The Portsmouth branch is located at 1650 Woodbury Avenue in Portsmouth (Rockingham County), New Hampshire. This branch office is owned by the Bank and had a net book value of $1.1 million at December 31, 2018. The facility also has adrive-up lane and an ATM. The Portsmouth branch has been open since 1987. FSB also operates a stand-alone ATM located at 1 Market Square in Portsmouth.
The Rochester branch is located at 17 Wakefield Street in Rochester (Strafford County), New Hampshire. This branch office is owned by the Bank and had a net book value of $1.3 million at December 31, 2018. The facility has adrive-up lane and an ATM. The Rochester branch was opened in 2009.
38
FELDMAN FINANCIAL ADVISORS, INC.
Legal Proceedings
The Bank is not currently involved in any pending legal proceedings as a defendant other than routine legal proceeding occurring in the ordinary course of business. The Bank is not currently a party to any pending legal proceedings that it believes would have a material adverse effect on its financial condition, operating results, or cash flows.
39
FELDMAN FINANCIAL ADVISORS, INC.
Market Area
Overview of Market Area
FSB is headquartered in Dover (Strafford County), New Hampshire and primarily serves customers located in Strafford County and Rockingham County, along with certain towns in neighboring counties. In addition to its main office, the Bank operates three other branches in Stratford County (Barrington, Durham, and Rochester) and one branch in Rockingham County (Portsmouth). The Bank’s office locations offer reasonable operating hours, including Saturday openings. All of the Bank’s office locations feature an ATM for24-hour banking access, and the Bank operates an additional stand-alone ATM in Portsmouth.
Rockingham and Strafford counties are part of the Boston-Cambridge-Newton,MA-NH Metropolitan Statistical Area (the “Boston MSA”). The two counties constitute the Rockingham- Strafford County, NH Metropolitan Division (the “Rockingham-Strafford Metropolitan Division) within the Boston MSA. Dover is located approximately 65 miles from Boston, Massachusetts and less than 50 miles from Manchester, New Hampshire and Portland, Maine. Table 9 presents comparative demographic data for the United States, the state of New Hampshire, the Boston MSA, Strafford County, and Rockingham County.
Dover is the county seat of and largest city in Strafford County. With an estimated 2019 population of 31,766, Dover is also the largest city in the New Hampshire Seacoast Region. The Seacoast Region is the southeast area of New Hampshire that includes the eastern portion of Rockingham County and the southern portion of Strafford County. The region stretches along the Atlantic Ocean from New Hampshire’s border with Salisbury, Massachusetts, to the Piscataqua River and New Hampshire’s border with Kittery, Maine. The shoreline alternates between rocky and rough headlands and areas with sandy beaches. The Seacoast has become
40
FELDMAN FINANCIAL ADVISORS, INC.
known for its historical, tourist, and vacation attractions. In addition, the Seacoast is home to a thriving professional sector, particularly in the financial services and high-tech sectors and leveraging its proximity to the greater Boston and Portland metropolitan areas.
Strafford County is located in southeastern New Hampshire, separated from York County in the state of Maine by the Salmon Falls River. Strafford County had an estimated 2019 population of 129,420. Since 2010, Strafford County’s population increased by 4.95%, which exceeded the state of New Hampshire’s population growth rate of 2.58%. Over the next five years, Strafford County’s population is projected to increase by 2.66% as compared to the state’s growth projection of 1.76%.
Strafford County includes three cities (Dover, Rochester, and Somersworth) and ten towns within its geographical boundaries. Though the state’s smallest county in land area at 369 square miles, Strafford County ranks as the state’s third highest based on population density. The median age in Strafford County was 37.8 years, as compared to the state’s median age of 43.3 years. Strafford County is the home to the University of New Hampshire (“UNH”), which is located in Durham.
UNH is the state’s largest university and the largest employer in Strafford County. Other major employers in Strafford County include Liberty Mutual Insurance, Frisbie Memorial Hospital, Conitech (manufacturing), City of Rochester Schools, City of Dover, Wentworth-Douglass Hospital, Strafford County, Albany Engineered Composites (materials processing), Turbocam USA (manufacturing), and General Electric (manufacturing). The economic base of Strafford County constitutes a diverse cross section of employment sectors, led by education and health services, retail trade, manufacturing, local government, and professional, business, and financial services.
41
FELDMAN FINANCIAL ADVISORS, INC.
Table 9
Selected Demographic Data
| United States | Boston MSA | New Hampshire | Strafford County | Rockingham County | ||||||||||||||||
Total Population | ||||||||||||||||||||
2010 - Base | 308,745,538 | 4,552,402 | 1,316,470 | 123,143 | 295,223 | |||||||||||||||
2019 - Current | 329,236,175 | 4,886,491 | 1,350,496 | 129,240 | 308,365 | |||||||||||||||
2024 - Projected | 340,950,101 | 5,063,214 | 1,374,296 | 132,675 | 315,976 | |||||||||||||||
% Change2010-19 | 6.64 | % | 7.34 | % | 2.58 | % | 4.95 | % | 4.45 | % | ||||||||||
% Change2019-24 | 3.56 | % | 3.62 | % | 1.76 | % | 2.66 | % | 2.47 | % | ||||||||||
Age Distribution, 2019 | ||||||||||||||||||||
0 - 14 Age Group | 18.61 | % | 16.38 | % | 15.30 | % | 15.18 | % | 15.27 | % | ||||||||||
15 - 34 Age Group | 26.93 | % | 27.57 | % | 25.25 | % | 31.63 | % | 23.42 | % | ||||||||||
35 - 54 Age Group | 25.30 | % | 26.32 | % | 25.23 | % | 24.00 | % | 26.51 | % | ||||||||||
55 - 69 Age Group | 18.51 | % | 19.09 | % | 22.63 | % | 19.09 | % | 23.79 | % | ||||||||||
70+ Age Group | 10.66 | % | 10.63 | % | 11.59 | % | 10.09 | % | 11.01 | % | ||||||||||
Median Age (years) | 38.5 | 39.7 | 43.3 | 37.8 | 44.9 | |||||||||||||||
Total Households | ||||||||||||||||||||
2010 - Base | 116,716,292 | 1,760,584 | 518,973 | 47,100 | 115,033 | |||||||||||||||
2019 - Current | 125,018,808 | 1,907,242 | 539,929 | 50,014 | 122,595 | |||||||||||||||
2024 - Projected | 129,683,914 | 1,984,364 | 552,269 | 51,519 | 126,513 | |||||||||||||||
% Change2010-19 | 7.11 | % | 8.33 | % | 4.04 | % | 6.19 | % | 6.57 | % | ||||||||||
% Change2019-24 | 3.73 | % | 4.04 | % | 2.29 | % | 3.01 | % | 3.20 | % | ||||||||||
Household Income, 2019 | ||||||||||||||||||||
< $25,000 | 19.57 | % | 14.91 | % | 13.12 | % | 12.03 | % | 8.70 | % | ||||||||||
$25,000 - $49,999 | 21.51 | % | 14.37 | % | 18.24 | % | 18.56 | % | 15.16 | % | ||||||||||
$50,000 - $99,999 | 29.25 | % | 25.25 | % | 31.35 | % | 34.52 | % | 30.42 | % | ||||||||||
$100,000 - $199,999 | 21.61 | % | 29.03 | % | 27.31 | % | 26.43 | % | 31.50 | % | ||||||||||
$200,000+ | 8.06 | % | 16.43 | % | 9.99 | % | 8.46 | % | 14.23 | % | ||||||||||
Average Household Income | ||||||||||||||||||||
2019 - Current | $ | 89,646 | $ | 125,863 | $ | 103,141 | $ | 97,444 | $ | 122,343 | ||||||||||
2024 - Projected | $ | 98,974 | $ | 140,614 | $ | 114,209 | $ | 112,779 | $ | 134,969 | ||||||||||
% Change2019-24 | 10.41 | % | 11.72 | % | 10.73 | % | 15.74 | % | 10.32 | % | ||||||||||
Median Household Income | ||||||||||||||||||||
2019 - Current | $ | 63,174 | $ | 90,268 | $ | 77,568 | $ | 76,909 | $ | 91,891 | ||||||||||
2024 - Projected | $ | 68,744 | $ | 100,258 | $ | 85,576 | $ | 87,897 | $ | 100,243 | ||||||||||
% Change2019-24 | 8.82 | % | 11.07 | % | 10.32 | % | 14.29 | % | 9.09 | % | ||||||||||
Unemployment Rate | ||||||||||||||||||||
December 2017 | 3.9 | % | 2.8 | % | 2.3 | % | 2.0 | % | 2.5 | % | ||||||||||
December 2018 | 3.7 | % | 2.4 | % | 2.1 | % | 1.9 | % | 2.2 | % | ||||||||||
% Change2017-18 | -5.1 | % | -14.3 | % | -8.7 | % | -5.0 | % | -12.0 | % | ||||||||||
42
FELDMAN FINANCIAL ADVISORS, INC.
Table 9 (continued)
Selected Demographic Data
| United States | Boston MSA | New Hampshire | Strafford County | Rockingham County | ||||||||||||||||
Total Housing Units, 2019 | 140,899,212 | 2,033,228 | 638,229 | 54,704 | 134,522 | |||||||||||||||
Owner Occupied | 81,287,885 | 1,166,549 | 383,532 | 33,152 | 94,258 | |||||||||||||||
Renter Occupied | 43,730,923 | 740,693 | 156,397 | 16,862 | 28,337 | |||||||||||||||
Vacant | 15,880,404 | 125,986 | 98,300 | 4,690 | 11,927 | |||||||||||||||
Owner Occupied | 57.69 | % | 57.37 | % | 60.09 | % | 60.60 | % | 70.07 | % | ||||||||||
Renter Occupied | 31.04 | % | 36.43 | % | 24.50 | % | 30.82 | % | 21.06 | % | ||||||||||
Vacant | 11.27 | % | 6.20 | % | 15.40 | % | 8.57 | % | 8.87 | % | ||||||||||
Owner Occupied Units | ||||||||||||||||||||
2019 - Current | 81,287,885 | 1,166,549 | 383,532 | 33,152 | 94,258 | |||||||||||||||
2024 - Projected | 84,266,838 | 1,211,585 | 392,398 | 34,143 | 97,309 | |||||||||||||||
% Change2000-19 | 6.98 | % | 7.75 | % | 4.13 | % | 6.11 | % | 6.67 | % | ||||||||||
% Change2019-24 | 3.66 | % | 3.86 | % | 2.31 | % | 2.99 | % | 3.24 | % | ||||||||||
Source: Claritas; S&P Global Market Intelligence; U.S. Department of Labor.
Covering the southeast corner of the state, Rockingham County contains all of the state’s 18 miles of Atlantic Ocean coastline. Rockingham County includes one city (Portsmouth) and 36 towns within its geographical boundaries. Rockingham County had an estimated population in 2019 population of 308,365, which had increased by 4.45% between 2010 and 2019, and is projected to increase by 2.47% from 2019 to 2024. Portsmouth is the largest city in Rockingham County with an estimated 2019 population of 20,941 and serves as the cultural and commercial hub of the Seacoast Region due to its numerous historical landmarks and tourist attractions.
The largest employers in Rockingham County include the Portsmouth Consular Center (U.S. Department of State), Timberlane Regional School District, HCA Portsmouth Regional Hospital, Liberty Mutual Insurance, Next Era (electric utility), Exeter Hospital, and Lonza Biologies (pharmaceuticals and biotechnology). The employment base in Rockingham County is centered on education and health services, retail trade, leisure and hospitality, federal government, manufacturing, and professional, business, and financial services.
43
FELDMAN FINANCIAL ADVISORS, INC.
The estimated median household income in 2019 was $76,909 for Strafford County and $91,891 for Rockingham County. The state’s median household income of $77,568 was higher than the national median of $63,174, but below the Boston MSA median of $90,268. The median home value in 2018 was $245,200 for Strafford County and $353,500 for Rockingham County, as compared to the state median of $273,800 and the nationwide median of $223,900. The owner-occupied housing unit rates in Rockingham and Strafford counties were 70.1% and 60.6%, respectively, as compared to the state and national rates of 60.1% and 57.7%, respectively. The state’s unemployment rate has historically compared favorably to the national unemployment rate. In December 2018, the New Hampshire unemployment rate was 2.1% versus the U.S. unemployment rate of 3.7%. The corresponding unemployment rates in Rockingham and Strafford counties were 2.2% and 1.9%, respectively.
Overview of Branch Network
The Bank’s branch network consists of five full-service banking offices, including the main office in Dover and additional offices in Barrington, Durham, Portsmouth, and Rochester. Table 10 provides deposit data for the Bank’s banking offices from June 30, 2013 to June 30, 2018 along with a map of the office locations. The Bank’s deposits increased by a compound annual growth rate of 7.1% over this five-year period. The Bank’s largest office based on deposits is the main office in Dover, which had total deposits of $112.1 million or 42.1% of the Bank’s total deposits at June 30, 2018. Approximately 82.1% ($218.5 million) of the Bank’s deposits were held in banking offices in Strafford County and approximately 17.9% ($47.8 million) were held in the one banking office located in Rockingham County.
44
FELDMAN FINANCIAL ADVISORS, INC.
Table 10
Branch Office Deposit Data and Map
Data as of June 30, 2013, 2017, and 2018
| Branch Deposits at June 30, | 1-Year | 5-Year | ||||||||||||||||||||||||||
| 2018 | 2017 | 2013 | Growth | CAGR | ||||||||||||||||||||||||
Address | City | St. | ($000) | ($000) | ($000) | (%) | (%) | |||||||||||||||||||||
Strafford County | ||||||||||||||||||||||||||||
633 Central Avenue | Dover | NH | 112,131 | 104,891 | 92,718 | 6.90 | 3.88 | |||||||||||||||||||||
7 Mill Road | Durham | NH | 47,921 | 46,223 | 35,564 | 3.67 | 6.15 | |||||||||||||||||||||
6 Eastern Avenue | Barrington | NH | 35,232 | 34,598 | 23,302 | 1.83 | 8.62 | |||||||||||||||||||||
17 Wakefield Street | Rochester | NH | 23,265 | 27,728 | 11,040 | (16.10 | ) | 16.08 | ||||||||||||||||||||
Rockingham County | ||||||||||||||||||||||||||||
1650 Woodbury Avenue | Portsmouth | NH | 47,772 | 42,343 | 26,227 | 12.82 | 12.74 | |||||||||||||||||||||
Bank Total | 266,321 | 255,783 | 188,851 | 4.12 | 7.12 | |||||||||||||||||||||||
Source: S&P Global Market Intelligence.
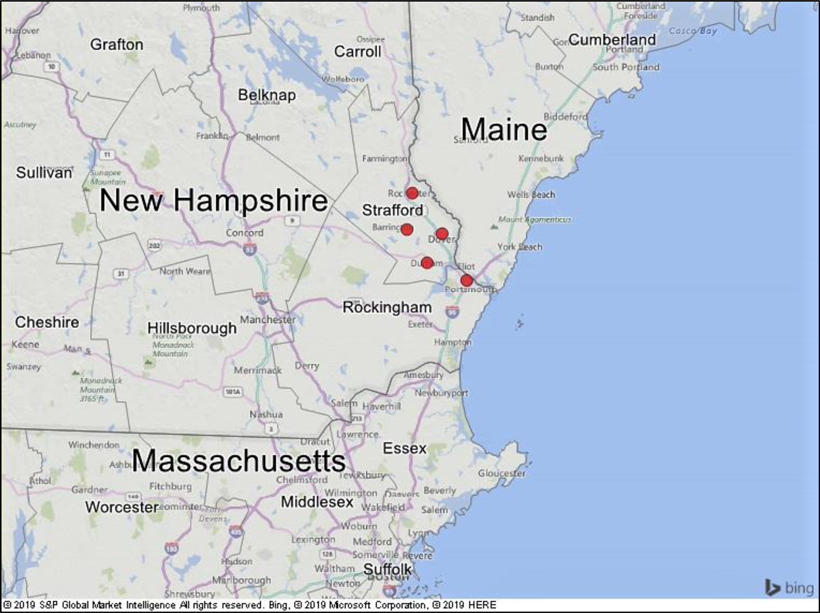
● Full-service banking offices of Federal Savings Bank
45
FELDMAN FINANCIAL ADVISORS, INC.
Market Share Analysis
Table 11 displays branch deposit data for financial institutions (commercial banks and savings institutions) in Strafford County as of June 30, 2018 (with deposit data adjusted for subsequently completed mergers). The Bank ranked third in Strafford County out of 11 financial institutions with total deposits of $218.5 million in four offices as of June 30, 2018 for a market share of 11.3%. The deposit market share leaders in Strafford County included largeout-of-state banks such as Citizens Bank, TD Bank, People’s United Bank, and Bank of America. Citizens Bank and TD Bank had deposit market share concentrations of 36.8% and 23.9%, respectively, as of June 30, 2018. Collectively, the top five financial institutions held 89.4% of the total deposits in Strafford County as of June 30, 2018. The aggregate deposit total in Strafford County increased by 14.2% from $1.7 billion at June 30, 2017 to $1.9 billion at June 30, 2018.
Table 12 provides branch deposit data for financial institutions in Rockingham County as of June 30, 2018. The Bank ranked 16th in Rockingham County out of 26 financial institutions with total deposits of $47.8 million in its Portsmouth office as of June 30, 2018 for a market share of 0.6%. The deposit market share leaders in Rockingham County also included largeout-of-state banks such as TD Bank, Citizens Bank, Bank of America, Santander Bank, and People’s United Bank. TD Bank and Citizens Bank had deposit market share concentrations of 26.6% and 17.5%, respectively. The top five financial institutions held an aggregate of 69.6% of the total deposits in Rockingham County. The overall deposit market in Rockingham County increased by 14.2% from $1.7 billion at June 30, 2017 to $1.9 billion at June 30, 2018. Based on combined data for the Strafford and Rockingham counties, the Bank had total deposits of $266.3 million for a deposit market share 2.7% as of June 30, 2018. TD Bank and Citizens Bank were the deposit leaders in the combined counties with market shares of 26.0% and 21.4%, respectively, as of June 30, 2018.
46
FELDMAN FINANCIAL ADVISORS, INC.
Table 11
Deposit Market Share in Strafford County, New Hampshire
Data as of June 30, 2018
(Adjusted for Subsequently Completed Mergers)
| No. of | Market | Market | Market | Market | 1-Year | 5-Year | ||||||||||||||||||||||||
| Market | Branch | Deposits | Share | Deposits | Share | Deposit | Deposit | |||||||||||||||||||||||
| Rank | Financial | Offices | 2018 | 2018 | 2017 | 2017 | Growth | CAGR | ||||||||||||||||||||||
2018 | Institution | 2018 | ($000) | (%) | ($000) | (%) | (%) | (%) | ||||||||||||||||||||||
Strafford County, NH | ||||||||||||||||||||||||||||||
| 1 | Citizens Bank NA (RI) | 7 | 714,185 | 36.81 | 457,130 | 26.90 | 56.23 | 10.46 | ||||||||||||||||||||||
| 2 | TD Bank NA (DE) | 5 | 463,241 | 23.87 | 509,230 | 29.97 | (9.03 | ) | 3.17 | |||||||||||||||||||||
|
|
|
|
|
|
|
|
|
|
|
|
|
| |||||||||||||||||
| 3 | Federal Savings Bank (NH) | 4 | 218,549 | 11.26 | 213,440 | 12.56 | 2.39 | 6.09 | ||||||||||||||||||||||
|
|
|
|
|
|
|
|
|
|
|
|
|
| |||||||||||||||||
| 4 | People’s United Bank NA (CT) | 3 | 205,257 | 10.58 | 201,051 | 11.83 | 2.09 | 2.24 | ||||||||||||||||||||||
| 5 | Bank of America NA (NC) | 2 | 133,248 | 6.87 | 131,977 | 7.77 | 0.96 | 6.85 | ||||||||||||||||||||||
| 6 | Profile Bank (NH) | 2 | 113,917 | 5.87 | 120,071 | 7.07 | (5.13 | ) | 1.34 | |||||||||||||||||||||
| 7 | Bank of New Hampshire (NH) | 2 | 37,320 | 1.92 | 29,211 | 1.72 | 27.76 | 12.18 | ||||||||||||||||||||||
| 8 | Kennebunk Savings Bank (ME) | 2 | 31,724 | 1.64 | 21,301 | 1.25 | 48.93 | 52.45 | ||||||||||||||||||||||
| 9 | Eastern Bank (MA) | 1 | 16,446 | 0.85 | 15,889 | 0.94 | 3.51 | 0.27 | ||||||||||||||||||||||
| 10 | Optima Bank & Trust Company (NH) | 1 | 6,397 | 0.33 | — | — | — | — | ||||||||||||||||||||||
| 11 | Newburyport Five Cts. Svgs. Bk. (MA) | 1 | — | — | — | — | — | — | ||||||||||||||||||||||
Market Total | 30 | 1,940,284 | 100.00 | 1,699,300 | 100.00 | 14.18 | 6.44 | |||||||||||||||||||||||
Source: S&P Global Market Intelligence.
47
FELDMAN FINANCIAL ADVISORS, INC.
Table 12
Deposit Market Share in Rockingham County, New Hampshire
Data as of June 30, 2018
(Adjusted for Subsequently Completed Mergers)
| No. of | Market | Market | Market | Market | 1-Year | 5-Year | ||||||||||||||||||||||||
| Market | Branch | Deposits | Share | Deposits | Share | Deposit | Deposit | |||||||||||||||||||||||
| Rank | Financial | Offices | 2018 | 2018 | 2017 | 2017 | Growth | CAGR | ||||||||||||||||||||||
2018 | Institution | 2018 | ($000) | (%) | ($000) | (%) | (%) | (%) | ||||||||||||||||||||||
Rockingham County, NH | ||||||||||||||||||||||||||||||
| 1 | TD Bank NA (DE) | 18 | 2,089,699 | 26.57 | 1,904,934 | 25.69 | 9.70 | 6.48 | ||||||||||||||||||||||
| 2 | Citizens Bank NA (RI) | 15 | 1,379,288 | 17.54 | 1,352,354 | 18.24 | 1.99 | 4.20 | ||||||||||||||||||||||
| 3 | Bank of America NA (NC) | 8 | 968,218 | 12.31 | 921,398 | 12.43 | 5.08 | 8.01 | ||||||||||||||||||||||
| 4 | Santander Bank NA (MA) | 7 | 536,150 | 6.82 | 495,760 | 6.69 | 8.15 | 7.30 | ||||||||||||||||||||||
| 5 | People’s United Bank NA (CT) | 11 | 499,011 | 6.35 | 504,723 | 6.81 | (1.13 | ) | 2.77 | |||||||||||||||||||||
| 6 | Bank of New England (NH) | 3 | 438,679 | 5.58 | 496,918 | 6.70 | (11.72 | ) | 15.40 | |||||||||||||||||||||
| 7 | Optima Bank & Trust Company (NH) | 4 | 417,963 | 5.31 | 359,209 | 4.85 | 16.36 | 13.80 | ||||||||||||||||||||||
| 8 | Provident Bank (MA) | 4 | 271,373 | 3.45 | 228,506 | 3.08 | 18.76 | 7.94 | ||||||||||||||||||||||
| 9 | Enterprise Bank and Trust Co. (MA) | 3 | 254,545 | 3.24 | 230,997 | 3.12 | 10.19 | 17.45 | ||||||||||||||||||||||
| 10 | SalemCo-operative Bank (NH) | 1 | 243,647 | 3.10 | 225,068 | 3.04 | 8.25 | 1.94 | ||||||||||||||||||||||
| 11 | Piscataqua Savings Bank (NH) | 1 | 221,588 | 2.82 | 221,639 | 2.99 | (0.02 | ) | 3.45 | |||||||||||||||||||||
| 12 | Pentucket Bank (MA) | 2 | 147,148 | 1.87 | 131,955 | 1.78 | 11.51 | 4.97 | ||||||||||||||||||||||
| 13 | Kennebunk Savings Bank (ME) | 4 | 87,418 | 1.11 | 63,361 | 0.85 | 37.97 | 47.56 | ||||||||||||||||||||||
| 14 | Newburyport Five Cts. Svgs. Bk. (MA) | 3 | 82,218 | 1.05 | 62,770 | 0.85 | 30.98 | NM | ||||||||||||||||||||||
| 15 | Eastern Bank (MA) | 1 | 50,540 | 0.64 | 43,065 | 0.58 | 17.36 | (0.79 | ) | |||||||||||||||||||||
|
|
|
|
|
|
|
|
|
|
|
|
|
| |||||||||||||||||
| 16 | Federal Savings Bank (NH) | 1 | 47,772 | 0.61 | 42,343 | 0.57 | 12.82 | 12.74 | ||||||||||||||||||||||
|
|
|
|
|
|
|
|
|
|
|
|
|
| |||||||||||||||||
| 17 | North Shore Bank aCo-op. Bk. (MA) | 1 | 30,636 | 0.39 | 29,514 | 0.40 | 3.80 | 5.30 | ||||||||||||||||||||||
| 18 | Bangor Savings Bank (ME) | 2 | 23,462 | 0.30 | 43,419 | 0.59 | (45.96 | ) | (0.08 | ) | ||||||||||||||||||||
| 19 | Haverhill Bank (MA) | 1 | 14,889 | 0.19 | 14,002 | 0.19 | 6.33 | — | ||||||||||||||||||||||
| 20 | Bank of New Hampshire (NH) | 1 | 14,820 | 0.19 | 2,062 | 0.03 | 618.72 | — | ||||||||||||||||||||||
| 21 | Salem Five Cents Savings Bank (MA) | 1 | 13,274 | 0.17 | 11,046 | 0.15 | 20.17 | — | ||||||||||||||||||||||
| 22 | Sanford Institution for Savings (ME) | 1 | 11,162 | 0.14 | 11,895 | 0.16 | (6.16 | ) | 34.59 | |||||||||||||||||||||
| 23 | NBT Bank NA (NY) | 1 | 8,765 | 0.11 | 9,923 | 0.13 | (11.67 | ) | (15.96 | ) | ||||||||||||||||||||
| 24 | Meredith Village Savings Bank (NH) | 1 | 6,246 | 0.08 | — | — | — | — | ||||||||||||||||||||||
| 25 | Northway Bank (NH) | 1 | 5,503 | 0.07 | 6,988 | 0.09 | (21.25 | ) | — | |||||||||||||||||||||
| 26 | Cambridge Trust Company (MA) | 1 | — | — | — | — | — | — | ||||||||||||||||||||||
Market Total | 97 | 7,864,014 | 100.00 | 7,413,849 | 100.00 | 6.07 | 7.26 | |||||||||||||||||||||||
Source: S&P Global Market Intelligence.
48
FELDMAN FINANCIAL ADVISORS, INC.
Tables 13 to 16 provide residential mortgage market share data for the top 20 lenders in Strafford County, Rockingham County, and York County (Maine) during 2016 and 2017, the most recent periods available for comparable data. Not all companies in the respective markets report the sourced data. The Bank ranked 10th in Strafford County with 2017 residential mortgage originations of $19.1 million, 52nd in Rockingham County with residential mortgage originations of $14.8 million, and 43rd in York County with residential mortgage originations of $10.3 million. The average residential mortgage loan funded by all reporting lenders in Strafford, Rockingham, and York counties was $215,000, $283,000, and $220,000, respectively, in 2017.
Competition for residential mortgage lending in these market areas is high. In addition to local and regional participants, many nationwide lenders are present the Bank’s lending market.Out-of-state mortgage banking companies were prevalent among the top 10 residential lenders in Strafford and Rockingham counties, while local commercial and savings banks were positioned among the top residential lenders in York County. The most active nationwide lenders operating in these local markets included Quicken Loans, LendUS, FBC Mortgage, and loanDepot. LendUS ranked first in Strafford County for 2017, while Quicken Loans and Camden National Bank ranked first in Rockingham and York counties, respectively.
49
FELDMAN FINANCIAL ADVISORS, INC.
Table 13
Residential Mortgage Lending Market Share
Strafford County, New Hampshire
Data for 2016 and 2017
2017 | 2016 Rank | Company (State) | Type | 2017 Funded Loans ($000) | 2017 Market Share (%) | 2016 Funded Loans ($000) | 2016 Market Share (%) | |||||||||||||||||
| 1 | 4 | LendUS LLC (CA) | Mortgage Bank | 55,881 | 8.05 | 33,788 | 4.76 | |||||||||||||||||
| 2 | 1 | Envoy Mortgage Ltd. (TX) | Mortgage Bank | 34,174 | 4.92 | 38,419 | 5.41 | |||||||||||||||||
| 3 | 42 | Eastern Bank (MA) | Comm’l Bank | 33,711 | 4.86 | 4,089 | 0.58 | |||||||||||||||||
| 4 | 3 | Quicken Loans Inc. (MI) | Mortgage Bank | 32,105 | 4.63 | 34,600 | 4.87 | |||||||||||||||||
| 5 | 5 | FBC Mortgage LLC (FL) | Mortgage Bank | 25,518 | 3.68 | 33,548 | 4.72 | |||||||||||||||||
| 6 | 9 | Northpoint Mortgage Inc. (MA) | Mortgage Bank | 24,490 | 3.53 | 20,966 | 2.95 | |||||||||||||||||
| 7 | 2 | HarborOne Mortgage LLC (NH) | Mortgage Bank | 23,517 | 3.39 | 35,395 | 4.98 | |||||||||||||||||
| 8 | 10 | Primary Residential Mrtg. (UT) | Mortgage Bank | 20,349 | 2.93 | 20,344 | 2.86 | |||||||||||||||||
| 9 | 8 | Northeast Credit Union (NH) | Credit Union | 20,269 | 2.92 | 21,534 | 3.03 | |||||||||||||||||
|
|
|
|
|
|
|
| |||||||||||||||||
| 10 | 13 | Federal Savings Bank (NH) | Savings Bank | 19,138 | 2.76 | 18,246 | 2.57 | |||||||||||||||||
|
|
|
|
|
|
|
| |||||||||||||||||
| 11 | 7 | Residential Mortgage Svcs. (ME) | Mortgage Bank | 17,312 | 2.49 | 23,289 | 3.28 | |||||||||||||||||
| 12 | 14 | loanDepot.com LLC (CA) | Mortgage Bank | 17,302 | 2.49 | 16,392 | 2.31 | |||||||||||||||||
| 13 | 20 | Citizens Bank NA (RI) | Comm’l Bank | 16,053 | 2.31 | 10,429 | 1.47 | |||||||||||||||||
| 14 | 28 | Bank of New Hampshire (NH) | Savings Bank | 13,982 | 2.01 | 7,461 | 1.05 | |||||||||||||||||
| 15 | 6 | Wells Fargo Bank NA (SD) | Comm’l Bank | 13,941 | 2.01 | 25,626 | 3.61 | |||||||||||||||||
| 16 | 12 | Holy Rosary Credit Union (NH) | Credit Union | 13,268 | 1.91 | 18,310 | 2.58 | |||||||||||||||||
| 17 | 34 | Sanford Institution for Svgs. (ME) | Savings Bank | 11,789 | 1.70 | 5,119 | 0.72 | |||||||||||||||||
| 18 | 18 | Optima B&TC (NH) | Comm’l Bank | 11,700 | 1.69 | 11,199 | 1.58 | |||||||||||||||||
| 19 | 17 | radius financial group inc. (MA) | Mortgage Bank | 10,731 | 1.55 | 12,143 | 1.71 | |||||||||||||||||
| 20 | 11 | Service Credit Union (NH) | Credit Union | 10,725 | 1.55 | 18,311 | 2.58 | |||||||||||||||||
Total for Lenders in Market | 693,979 | 710,522 | ||||||||||||||||||||||
Source: S&P Global Market Intelligence.
50
FELDMAN FINANCIAL ADVISORS, INC.
Table 14
Residential Mortgage Lending Market Share
Rockingham County, New Hampshire
Data for 2016 and 2017
2017 | 2016 Rank | Company (State) | Type | 2017 Funded Loans ($000) | 2017 Market Share (%) | 2016 Funded Loans ($000) | 2016 Market Share (%) | |||||||||||||||
| 1 | 1 | Quicken Loans Inc. (MI) | Mortgage Bank | 144,331 | 5.35 | 158,904 | 5.07 | |||||||||||||||
| 2 | 5 | LendUS LLC (CA) | Mortgage Bank | 135,463 | 5.02 | 112,316 | 3.58 | |||||||||||||||
| 3 | 2 | Residential Mortgage Svcs. (ME) | Mortgage Bank | 124,070 | 4.60 | 155,919 | 4.98 | |||||||||||||||
| 4 | 3 | HarborOne Mortgage LLC (NH) | Mortgage Bank | 93,595 | 3.47 | 138,162 | 4.41 | |||||||||||||||
| 5 | 10 | Optima B&TC (NH) | Comm’l Bank | 83,462 | 3.09 | 67,879 | 2.17 | |||||||||||||||
| 6 | 4 | FBC Mortgage LLC (FL) | Mortgage Bank | 80,973 | 3.00 | 127,252 | 4.06 | |||||||||||||||
| 7 | 7 | loanDepot.com LLC (CA) | Mortgage Bank | 77,863 | 2.88 | 95,153 | 3.04 | |||||||||||||||
| 8 | 6 | Wells Fargo Bank NA (SD) | Comm’l Bank | 72,346 | 2.68 | 103,748 | 3.31 | |||||||||||||||
| 9 | 9 | Mortgage Network Inc. (MA) | Mortgage Bank | 70,221 | 2.60 | 70,244 | 2.24 | |||||||||||||||
| 10 | 11 | Citizens Bank NA (RI) | Comm’l Bank | 58,434 | 2.16 | 66,122 | 2.11 | |||||||||||||||
| 11 | 14 | United Shore Fin’l Svcs. (MI) | Mortgage Bank | 57,092 | 2.11 | 53,146 | 1.70 | |||||||||||||||
| 12 | 28 | CrossCountry Mortgage (OH) | Mortgage Bank | 52,811 | 1.96 | 30,165 | 0.96 | |||||||||||||||
| 13 | 50 | Enterprise B&TC (MA) | Comm’l Bank | 52,148 | 1.93 | 15,676 | 0.50 | |||||||||||||||
| 14 | 12 | Bank of America NA (NC) | Comm’l Bank | 51,633 | 1.91 | 65,333 | 2.09 | |||||||||||||||
| 15 | 17 | Primary Residential Mrtg. (UT) | Mortgage Bank | 41,502 | 1.54 | 44,205 | 1.41 | |||||||||||||||
| 16 | 13 | Service Credit Union (NH) | Credit Union | 39,947 | 1.48 | 56,779 | 1.81 | |||||||||||||||
| 17 | 18 | People’s United Bank NA (CT) | Comm’l Bank | 39,290 | 1.46 | 40,724 | 1.30 | |||||||||||||||
| 18 | 40 | Piscataqua Savings Bank (NH) | Savings Bank | 38,654 | 1.43 | 20,925 | 0.67 | |||||||||||||||
| 19 | 20 | Guaranteed Rate Inc. (IL) | Mortgage Bank | 37,723 | 1.40 | 39,124 | 1.25 | |||||||||||||||
| 20 | 19 | St. Mary’s Bank CU (NH) | Credit Union | 37,691 | 1.40 | 39,667 | 1.27 | |||||||||||||||
|
|
|
|
|
|
|
| |||||||||||||||
| 52 | 63 | Federal Savings Bank (NH) | Savings Bank | 14,802 | 0.55 | 12,776 | 0.41 | |||||||||||||||
|
|
|
|
|
|
|
| |||||||||||||||
Total for Lenders in Market | 2,700,073 | 3,133,411 | ||||||||||||||||||||
Source: S&P Global Market Intelligence.
51
FELDMAN FINANCIAL ADVISORS, INC.
Table 15
Residential Mortgage Lending Market Share
York County, Maine
Data for 2016 and 2017
2017 | 2016 Rank | Company (State) | Type | 2017 Funded Loans ($000) | 2017 Market Share (%) | 2016 Funded Loans ($000) | 2016 Market Share (%) | |||||||||||||||||
| 1 | 5 | Camden National Bank (ME) | Comm’l Bank | 93,495 | 6.20 | 55,047 | 3.55 | |||||||||||||||||
| 2 | 1 | Residential Mortgage Svcs. (ME) | Mortgage Bank | 71,850 | 4.77 | 84,723 | 5.46 | |||||||||||||||||
| 3 | 3 | Kennebunk Savings Bank (ME) | Savings Bank | 58,962 | 3.91 | 59,744 | 3.85 | |||||||||||||||||
| 4 | 10 | LendUS LLC (CA) | Mortgage Bank | 56,735 | 3.76 | 38,227 | 2.46 | |||||||||||||||||
| 5 | 2 | Quicken Loans Inc. (MI) | Mortgage Bank | 54,953 | 3.65 | 61,587 | 3.97 | |||||||||||||||||
| 6 | 4 | Biddeford Savings Bank (ME) | Savings Bank | 49,732 | 3.30 | 55,201 | 3.56 | |||||||||||||||||
| 7 | 6 | Saco & Biddeford Svgs. Inst. (ME) | Savings Bank | 47,834 | 3.17 | 48,613 | 3.13 | |||||||||||||||||
| 8 | 18 | York County FCU (ME) | Credit Union | 46,552 | 3.09 | 27,365 | 1.76 | |||||||||||||||||
| 9 | 15 | Bangor Savings Bank (ME) | Savings Bank | 42,775 | 2.84 | 31,531 | 2.03 | |||||||||||||||||
| 10 | 9 | Sanford Institution for Svgs (ME) | Savings Bank | 39,511 | 2.62 | 38,861 | 2.50 | |||||||||||||||||
| 11 | 7 | HarborOne Mortgage LLC (NH) | Mortgage Bank | 36,220 | 2.40 | 41,759 | 2.69 | |||||||||||||||||
| 12 | 12 | Norwich Commercial Group (CT) | Mortgage Bank | 34,018 | 2.26 | 35,118 | 2.26 | |||||||||||||||||
| 13 | 14 | loanDepot.com LLC (CA) | Mortgage Bank | 33,319 | 2.21 | 32,949 | 2.12 | |||||||||||||||||
| 14 | 13 | Mortgage Network Inc. (MA) | Mortgage Bank | 32,980 | 2.19 | 34,023 | 2.19 | |||||||||||||||||
| 15 | 8 | Wells Fargo Bank NA (SD) | Comm’l Bank | 31,211 | 2.07 | 40,367 | 2.60 | |||||||||||||||||
| 16 | 11 | Franklin American Mrtg. Co. (TN) | Mortgage Bank | 31,115 | 2.06 | 35,877 | 2.31 | |||||||||||||||||
| 17 | 23 | CrossCountry Mortg. (OH) | Mortgage Bank | 26,187 | 1.74 | 19,588 | 1.26 | |||||||||||||||||
| 18 | 19 | United Shore Fin’l Svcs. (MI) | Mortgage Bank | 26,099 | 1.73 | 24,450 | 1.57 | |||||||||||||||||
| 19 | 16 | Bank of America NA (NC) | Comm’l Bank | 23,587 | 1.57 | 31,410 | 2.02 | |||||||||||||||||
| 20 | 29 | Guaranteed Rate Inc. (IL) | Mortgage Bank | 19,545 | 1.30 | 15,054 | 0.97 | |||||||||||||||||
|
|
|
|
|
|
|
| |||||||||||||||||
| 43 | 49 | Federal Savings Bank (NH) | Savings Bank | 10,274 | 0.68 | 8,697 | 0.56 | |||||||||||||||||
|
|
|
|
|
|
|
| |||||||||||||||||
Total for Lenders in Market | 1,506,978 | 1,552,445 | ||||||||||||||||||||||
Source: S&P Global Market Intelligence.
52
FELDMAN FINANCIAL ADVISORS, INC.
Summary Outlook
The Bank has reported low to moderate levels of profitability over the past five years with an average ROA of approximately 0.32% from 2014 to 2018. Over the same five-year period, the Bank’s annual earnings ranged in a narrow band from just over $900,000 to slightly less than $1.1 million. While the Bank progressed steadily in growing its balance sheet and maintaining sound asset quality, its net interest margin remained under pressure and its efficiency ratio did not show any signs of measurable improvement. The relatively flat interest rate environment proved challenging for most financial institutions during this period, but especially for a predominantly fixed-rate residential loan, portfolio lender such as FSB. In addition, the Bank’s profitability has been tasked with absorbing the infrastructure, systems, and staffing investments in current periods while FSB positions itself to take advantage of future growth opportunities in a market that exhibits favorable demographics.
The Bank’s current business strategy places an emphasis on improving the net interest margin through a combination of reducing funding costs and increasing asset yields via increased diversification into higher yielding types of loans and emphasizing growth of lower cost core deposits. The Bank believes that it can successfully leverage its operating expense base to generate increased levels of net interest andnon-interest income by increasing its product and service penetration with existing customers and enhancing its market perception as a viable banking organization capable of serving the retail and commercial banking needs of new customers.
FSB plans to continue its emphasis on residential and commercial real estate lending. The residential lending operations will continue to sell a portion of fixed-rate residential mortgage loan originations, providing the Bank with recurring sources of revenue from loan
53
FELDMAN FINANCIAL ADVISORS, INC.
servicing income and gains on the sale of such loans. The commercial real estate lending operations will provide the Bank with higher yielding loans and banking relationships that also generatelow-cost deposit balances and ancillarynon-interest income.
A key element of the Bank’s operating strategy is to continue to aggressively manage credit risk, so as to continue to maintain the Bank’s favorable measures for credit quality. The Bank estimates that it can achieve higher profitability over future years in part through added efficiencies gained through growth in the earning asset base without adding additional infrastructure, which has already been put in place to facilitate and manage such growth. However, as noted earlier, the Bank will face intensified competition as the attractive demographics in the Bank’s market area are also precipitatingramped-up expansion goals by existing competitors as well as new entrants.
54
FELDMAN FINANCIAL ADVISORS, INC.
II. COMPARISONS WITH PUBLICLY TRADED THRIFTS
General Overview
The comparative market approach provides a sound basis for determining estimates of going-concern valuations where a regular and active market exists for the stocks of peer institutions. The comparative market approach was utilized in determining the estimated pro forma market value of the Bank because: (1) reliable market and financial data are readily available for comparable institutions; (2) the comparative market method is required by the applicable regulatory guidelines; and (3) other alternative valuation methods (such as income capitalization, liquidation analysis, or discounted cash flow) are unlikely to produce a valuation relevant to the future trading patterns of the related equity interest. The generally employed valuation method in initial public offerings, where possible, is the comparative market approach, which also can be relied upon to determine pro forma market value in a thrift stock conversion.
The comparative market approach derives valuation benchmarks from the trading patterns of selected peer institutions which, due to certain factors such as financial performance and operating strategies, enable the appraiser to estimate the potential value of the subject institution in a stock conversion offering. The pricing and trading history of recent initial public offerings of thrifts are also examined to provide evidence of the “new issue discount” that must be considered. In Chapter II, our valuation analysis focuses on the selection and comparison of the Bank with a comparable group of publicly traded thrift institutions (the “Comparative Group”). Chapter III will detail any additional discounts or premiums that we believe are appropriate to the Bank’s pro forma market value.
55
FELDMAN FINANCIAL ADVISORS, INC.
Selection Criteria
Selected market price and financial performance data for all public thrifts listed on major stock exchanges are shown in Exhibit III. The list excludes companies that are subject to being acquired under a pending transaction and companies that have a majority ownership interest controlled by a mutual holding company. Several criteria, discussed below, were used to select the individual members of the Comparative Group from the overall universe of publicly traded thrifts.
| • | Operating characteristics – An institution’s operating characteristics are the most important factors because they affect investors’ expected rates of return on a company’s stock under various business/economic scenarios, and they influence the market’s general perception of the quality and attractiveness of a given company. Operating characteristics, which may vary in importance during the business cycle, include financial variables such as profitability, balance sheet growth, capitalization, asset quality, and other factors such as lines of business and management strategies. |
| • | Degree of marketability and liquidity – Marketability of a stock reflects the relative ease and promptness with which a security may be sold when desired, at a representative current price, without material concession in price merely because of the necessity of sale. Marketability also connotes the existence of buying interest as well as selling interest and is usually indicated by trading volumes and the spread between the bid and asked price for a security. Liquidity of the stock issue refers to the organized market exchange process whereby the security can be converted into cash. We attempted to limit our selection to companies that have access to a regular trading market or price quotations, and therefore only considered companies listed on major stock exchanges. We eliminated from the Comparative Group companies with market prices that were materially influenced by announced acquisitions or other unusual circumstances. However, the expectation of continued industry consolidation is currently embedded in thrift equity valuations. |
| • | Geographic Location – The region of the country where a company operates is also of importance in selecting the comparative group. The operating environment for thrift institutions varies from region to region with respect to business and economic environments, real estate market conditions, speculative takeover activity, and investment climates. Economic and investor climates can also vary greatly within a region, particularly due to takeover activity. |
56
FELDMAN FINANCIAL ADVISORS, INC.
The operations of the Bank fit the general profile of asmall-to-medium sized thrift institution, concentrating primarily on real estate lending in its local market and relying on retail deposits as a funding source. Residential mortgage loans remain the core product in the Bank’s loan portfolio, drawing upon its roots as a traditional home lender. However, the Bank has diversified its loan mix through the steady origination of commercial real estate, commercial business, and construction and development loans.
In determining the Comparative Group composition, we focused on the Bank’s asset size, capitalization, geographic location, asset quality, and earnings fundamentals. Attempting to concentrate on the Bank’s performance characteristics and to develop a meaningful number of comparables for valuation purposes, we expanded the criteria to include a statistically significant number of companies. In addition, because of the scarcity of candidates meeting the criteria precisely, we increased the asset size constraint to generate a meaningful number of comparables while maintainingnon-size related characteristics. As with any composition of a group of comparable companies, the selection criteria were broadened sufficiently to assemble a meaningful number of members. We performed an initial screening of publicly traded thrifts headquartered in the Northeast region of the United States with total assets less than $700 million. We then expanded the selection criteria to other geographic regions and applied the following overall selection criteria:
| • | Publicly traded thrift – stock-form thrift whose shares are traded on the New York, NYSE American, or NASDAQ stock exchanges. |
| • | Excludes mutual holding companies – company’s corporate structure is organized in fully converted stock form and excludes companies whose majority ownership interest is held by a mutual holding company. |
| • | Seasoned trading issue – company has been publicly traded for at least six months. |
| • | Geographic location – based in the Northeast,Mid-Atlantic, Southeast, or Midwest region of the country. |
57
FELDMAN FINANCIAL ADVISORS, INC.
| • | Non-acquisition target – company is not subject to a pending acquisition. |
| • | Asset size – total assets greater than $200 million and less than $700 million. |
| • | Capital level – tangible equity to assets ratio greater than 7.00%. |
| • | Profitability – ROA greater than 0.00% and less than 1.00%. |
| • | Credit quality –non-performing assets to total assets ratio less than 2.50%. |
As a result of applying the stated criteria, the screening process produced a reliable representation of public thrifts. A general operating summary of the 10 companies included in the Comparative Group is presented in Table 16. All of the selected companies are traded on the NASDAQ market. The Comparative Group ranged in asset size from $200.7 million atMid-Southern Bancorp to $664.3 million at IF Bancorp. The median and average asset sizes of the Comparative Group were $338.6 million and $417.5 million, respectively, reasonably comparable to the Bank’s total assets of $387.1 million as of December 31, 2018.
There are eight public thrifts located in the Northeast region of the United States. However, most of them are much larger than the Bank and exceeded the asset size criteria. Of the three meeting the asset size criteria, Melrose Bancorp (Massachusetts) and PB Bancorp (Connecticut) were selected for inclusion in the Comparative Group. Randolph Bancorp (Massachusetts) qualified based on its asset size, but was excluded due to its negative earnings position. Five of the Comparative Group members are located in theMid-Atlantic states of New York (Elmira Savings Bank and FSB Bancorp), New Jersey (MSB Financial), and Pennsylvania (HV Bancorp and WVS Financial). Three of the Comparative Group members are based in the Midwest states of Illinois (IF Bancorp and Ottawa Bancorp) and Indiana(Mid-Southern Bancorp). While some differences inevitably may exist between the Bank and the individual companies, we believe that the chosen Comparative Group on the whole provides a meaningful basis of financial comparison for valuation purposes.
58
FELDMAN FINANCIAL ADVISORS, INC.
Table 16
Comparative Group Operating Summary
As of December 31, 2018
Company | City | St. | No. of Offices | Initial Public Offering Date | Total Assets ($Mil.) | Tang. Equity/ Assets (%) | ||||||||||
Federal Saving Bank | Dover | NH | 5 | NA | $ | 387.1 | 8.45 | |||||||||
Comparative Group | ||||||||||||||||
Elmira Savings Bank | Elmira | NY | 13 | 03/01/85 | 590.0 | 7.90 | ||||||||||
FSB Bancorp, Inc. | Fairport | NY | 5 | 08/10/07 | 328.3 | 9.60 | ||||||||||
HV Bancorp, Inc. | Huntingdon Valley | PA | 6 | 01/11/17 | 320.9 | 9.79 | ||||||||||
IF Bancorp, Inc. | Watseka | IL | 8 | 07/07/11 | 664.3 | 11.82 | ||||||||||
Melrose Bancorp, Inc. | Melrose | MA | 1 | 10/21/14 | 323.9 | 13.96 | ||||||||||
Mid-Southern Bancorp, Inc. | Salem | IN | 3 | 04/08/98 | 200.7 | 24.34 | ||||||||||
MSB Financial Corp. | Millington | NJ | 4 | 01/04/07 | 584.5 | 11.40 | ||||||||||
Ottawa Bancorp, Inc. | Ottawa | IL | 3 | 07/11/05 | 292.7 | 18.05 | ||||||||||
PB Bancorp, Inc. | Putnam | CT | 8 | 10/04/04 | 520.4 | 16.00 | ||||||||||
WVS Financial Corp. | Pittsburgh | MA | 6 | 11/29/93 | 349.0 | 9.57 | ||||||||||
Source: Federal Savings Bank; S&P Global Market Intelligence.
59
FELDMAN FINANCIAL ADVISORS, INC.
Recent Financial Comparisons
Table 17 summarizes certain key financial comparisons between the Bank and the Comparative Group. Tables 18 through 22 contain the detailed financial comparisons of the Bank with the individual Comparative Group companies based on measures of profitability, income and expense components, capital levels, balance sheet composition, asset quality, and growth rates. Financial data for the Bank, the Comparative Group, and All Public Thrift aggregate were utilized for the latest available period as of or for the last twelve months (“LTM”) ended December 31, 2018.
The Bank’s LTM ROA was 0.29%, reflecting profitability below the Comparative Group median of 0.72% and the All Public Thrift median of 0.87%. The Bank’s lower ROA was attributable mainly to a lower level ofnon-interest income and a higher level ofnon-interest expense. The Bank’s LTM ROE was 0.36% and further lagged the Comparative Group median of 2.49%. Among the Comparative Group companies, only two members reported ROA results below that of the Bank. HV Bancorp and FSB Bancorp generated LTM ROA ratios of 0.27% and 0.04%, respectively, while the remaining Comparative Group companies exhibited LTM ROA ratios between 0.50% and 0.85%.
Based onpre-tax core earnings as adjusted to exclude income taxes, intangibles amortization expense, andnon-recurring items, the Bank’s core profitability was also lower than the Comparative Group’s levels. The Bank’s LTMpre-tax core earnings ratio was 0.35% of average assets and positioned below the corresponding Comparative Group median of 0.90% and the All Public Thrift median of 1.15%. The Bank’s net interest income margin surpassed the Comparative Group median, but did not sufficiently offset the disadvantage in lowernon-interest income and highernon-interest expense levels.
60
FELDMAN FINANCIAL ADVISORS, INC.
Table 17
Key Financial Comparisons
Federal Savings Bank and the Comparative Group
As of or For the Last Twelve Months Ended December 31, 2018
| Federal Savings Bank | Comp. Group Median | All Public Thrift Median | ||||||||||
Profitability Ratios | ||||||||||||
LTM Return on Average Assets (ROA) | 0.29 | % | 0.72 | % | 0.87 | % | ||||||
LTM Return on Average Equity (ROE) | 3.38 | 4.11 | 7.33 | |||||||||
Core Return on Avg. Assets (Core ROA) | 0.29 | 0.73 | 0.82 | |||||||||
Core Return on Avg. Equity (Core ROE) | 3.38 | 4.02 | 7.30 | |||||||||
Net Interest Margin | 3.06 | 2.88 | 3.13 | |||||||||
Efficiency Ratio | 89.63 | 73.18 | 65.93 | |||||||||
Income and Expense(% of avg. assets) | ||||||||||||
Total Interest Income | 3.81 | 3.72 | 3.80 | |||||||||
Total Interest Expense | 0.84 | 0.87 | 0.92 | |||||||||
Net Interest Income | 2.97 | 2.77 | 2.97 | |||||||||
Provision for Loan Losses | 0.01 | 0.06 | 0.06 | |||||||||
Other Operating Income | 0.41 | 0.58 | 0.58 | |||||||||
Net Secs. Gains andNon-rec. Income | 0.00 | 0.00 | 0.00 | |||||||||
General and Administrative Expense | 3.03 | 2.68 | 2.63 | |||||||||
Intangibles Amortization Expense | 0.00 | 0.00 | 0.00 | |||||||||
Non-recurring Expense | 0.00 | 0.00 | 0.00 | |||||||||
Pre-tax Core Earnings | 0.35 | 0.90 | 1.15 | |||||||||
Equity Capital Ratios | ||||||||||||
Total Equity / Total Assets | 8.45 | 11.61 | 11.67 | |||||||||
Tangible Equity / Tangible Assets | 8.45 | 11.61 | 10.59 | |||||||||
Growth Rates | ||||||||||||
Total Assets | 7.61 | 5.85 | 5.37 | |||||||||
Net Total Loans | 4.61 | 7.91 | 7.20 | |||||||||
Total Deposits | 9.97 | 3.76 | 6.60 | |||||||||
61
FELDMAN FINANCIAL ADVISORS, INC.
Table 17 (continued)
Key Financial Comparisons
Federal Savings Bank and the Comparative Group
As of or For the Last Twelve Months Ended December 31, 2018
| Federal | Comp. | All Public | ||||||||||
| Savings | Group | Thrift | ||||||||||
| Bank | Median | Median | ||||||||||
Balance Sheet Composition(% of total assets) |
| |||||||||||
Cash and Securities | 14.34 | % | 16.72 | % | 15.52 | % | ||||||
Loans Receivable, net | 82.31 | 78.85 | 77.50 | |||||||||
Real Estate Owned | 0.00 | 0.00 | 0.04 | |||||||||
Intangible Assets | 0.00 | 0.00 | 0.15 | |||||||||
Other Assets | 3.35 | 3.83 | 3.98 | |||||||||
Total Deposits | 70.90 | 74.81 | 75.36 | |||||||||
Borrowed Funds | 19.56 | 11.54 | 10.18 | |||||||||
Other Liabilities | 1.09 | 0.90 | 2.79 | |||||||||
Total Liabilities | 91.55 | 88.39 | 88.33 | |||||||||
Total Equity | 8.45 | 11.61 | 11.67 | |||||||||
Loan Portfolio Composition (% of total loans) |
| |||||||||||
Residential Real Estate Loans | 66.39 | 61.17 | 29.93 | |||||||||
Other Real Estate Loans | 26.24 | 21.22 | 46.98 | |||||||||
Non-Real Estate Loans | 7.37 | 8.14 | 23.09 | |||||||||
Credit Risk Ratios | ||||||||||||
Non-performing Loans / Total Loans | 0.02 | 0.89 | 0.84 | |||||||||
Non-performing Assets / Total Assets | 0.02 | 0.77 | 0.79 | |||||||||
Reserves /Non-performing Loans(1) | NM | 94.41 | 99.60 | |||||||||
Reserves / Total Loans | 0.88 | 0.84 | 0.84 | |||||||||
| (1) | NM =non-meaningful value; calculated ratio greater than 1,000%. |
Source: Federal Savings Bank; S&P Global Market Intelligence; Feldman Financial.
62
FELDMAN FINANCIAL ADVISORS, INC.
As shown in Table 20, the Bank’s level of net interest income at 2.97% of average assets exceeded the Comparative Group median of 2.77%, owing to the Bank’s relatively high concentration of assets invested in loans and very low levels ofnon-performing assets and othernon-earning assets. The Bank’s total interest income measured 3.81% of average assets for the LTM period, exceeding the Comparative Group median of 3.72%. The Bank’s interest expense amounted to 0.84% of average assets and was positioned slightly below the corresponding Comparative Group median of 0.87%. The Bank’s weighted average yield for the loan portfolio increased by 12 basis points from 4.01% for the year ended December 31, 2017 to 4.13% for the year ended December 31, 2018. The Bank’s weighted average yield for the investment portfolio increased from 1.96% for the year ended December 31, 2017 to 2.55% for the year ended December 31, 2018.
The Bank’snon-interest operating income totaled 0.41% of average assets, lagging behind the Comparative Group median of 0.58%. The Bank’s primary sources ofnon-interest income include service charges on deposit accounts, wealth management revenue, loan servicing fees, and debit card and credit card interchange fees. Most of the Comparative Group companies reported higher levels ofnon-interest income, particularly generating additional revenue from gains on sale of loans. For example, HV Bancorp and FSB Bancorp reportednon-interest income levels measuring 1.25% and 0.85% of average assets, respectively, reflecting significant income contributions from mortgage banking activities.
The Bank’s loan loss provision amounted to 0.00% of average assets for the recent LTM period and was less than the Comparative Group median of 0.06%. As noted previously, based on management’s analysis of the allowance for loan losses, the Bank recorded a provision for loan losses of zero for the year ended December 31, 2018 as compared to $160,000 for the year
63
FELDMAN FINANCIAL ADVISORS, INC.
ended December 31, 2017. The decrease in the provision for the year ended December 31, 2018 was primarily due to the decrease innon-accrual loans from $1.2 million at December 31, 2017 to $68,000 at December 31, 2018. The Bank’s totalnon-performing assets measured 0.02% at December 31, 2018, comparing favorably to the Comparative Group median of 0.77% and reflecting a level below thenon-performing asset ratios for each of the Comparative Group companies. The Bank’s ratio ofnon-performing assets to total assets had improved from 0.33% at December 31, 2017. The Bank’s 0.88% ratio of reserves to total loans was positioned slightly ahead of the corresponding Comparative Group median of 0.84%.
The Bank’s operating expense ratio at 3.03% of average assets was significantly higher than the Comparative Group median of 2.68%. The members of the Comparative Group reporting above-average ratios of operating expense also exhibited above-average levels ofnon-interest income as the added expense infrastructure partially supports thenon-interest income production. However, the Bank’s relatively high operating expense ratio is not accompanied by comparably high levels of operating revenue. The Bank’s efficiency ratio(non-interest expense less intangibles amortization expense as a percent of net interest income before provision plusnon-interest operating income) was relatively high at 89.6% and surpassed the Comparative Group median of 73.2%. Only two members of the Comparative Group exhibited efficiency ratios above 80% with FSB Bancorp at 95.9% and HV Bancorp at 86.9%. Both of these companies also reported subpar earnings levels that measured the lowest among the Comparative Group with FSB Bancorp reporting an LTM ROA of 0.04% and HV Bancorp at 0.27%.
As reflected in Table 21, the overall balance sheet composition of the Bank reflected a slightly higher concentration of loans to assets versus that of the overall Comparative Group. The Bank’s net total loans amounted to 82.31% of total assets as of December 31, 2018,
64
FELDMAN FINANCIAL ADVISORS, INC.
eclipsing the median of 78.85% for the Comparative Group. The Bank’s ratio of cash and securities to total assets was 14.34% and slightly lower than the median of 16.72% of the Comparative Group. The Bank had no goodwill or other intangible assets (exclusive of mortgage servicing rights) on its balance sheet as of December 31, 2018, as well as no real estate owned at such date. The Bank’s ratio of other assets measured 3.35% and was slightly lower than the Comparative Group median of 3.83%.
The Bank has actively utilized borrowings as a supplemental source of funds to support its loan origination activity. The Bank’s ratio of borrowed funds to total assets amounted to 19.56% at December 31, 2018 and surpassed the Comparative Group median of 11.54%. The Bank’s deposit level at 70.90% of total assets was below the Comparative Group median of 74.81% of total assets. The Bank’s equity level before the Offering was 8.45% relative to total assets, which was below the Comparative Group median of 11.61%.
The Bank’s level of residential real estate loans (including home equity and second mortgage loans) measured 66.39% of total loans based on regulatory financial data as of December 31, 2018, above the Comparative Group median of 61.17%. The Comparative Group includes a number of companies that also maintain a traditional thrift orientation with a heavy emphasis on residential mortgage lending, while also including other companies that have progressed toward diversifying their loan portfolio composition.
The Bank’s concentration ofnon-residential real estate loans (commercial real estate, multi-family real estate, and construction and land development loans) represented 26.24% of total loans and was slightly above the Comparative Group median of 21.22%. The Bank exhibited a lower level ofnon-real estate loans, which accounted for only 7.37% of total loans versus the Comparative Group median of 8.14%. The Bank has a negligible amount of consumer loans, while its commercial business loan portfolio has begun to gain growth momentum in recent years.
65
FELDMAN FINANCIAL ADVISORS, INC.
The Bank’s recent emphasis on balance sheet growth is reflected in the comparative growth rates. The Bank’s asset growth rate measured 7.61% over the recent LTM period versus the Comparative Group median asset growth rate of 5.85%. The Bank also exhibited a strong deposit growth rate of 9.97% versus the Comparative Group median of 3.76%. However, the Bank’s loan growth rate of 4.61% lagged the Comparative Group median loan growth rate of 7.916%. The Bank registered solid growth in its residential mortgage loan portfolio over the recent LTM period, but curtailed its exposure to construction and development loans outstanding.
In summary, the Bank’s recent earnings performance was below the results exhibited by the Comparative Group, while its asset quality was superior and its capital position as a mutual institution was below the overall equity levels displayed by the stock-form companies within the Comparative Group. The Bank’s profitability was characterized by an above-average level of net interest income offset by a higher operating expense ratio and lowernon-interest income production. Similar to most financial institutions its size, the Bank is faced with the ongoing challenge of improving its efficiency ratio either through bolstering its net interest margin, enhancingnon-interest income generation, or improving the efficiency and productivity of its operating infrastructure. The Bank’s earnings growth outlook will depend largely on its ability to maintain satisfactory loan quality as its grows the portfolio, to improve the net interest margin across movements in the interest rate environment, and to controlnon-interest expense as it seeks to expand its operations and transition to a public company.
66
FELDMAN FINANCIAL ADVISORS, INC.
Table 18
General Operating Characteristics
As of December 31, 2018
| Tang. | ||||||||||||||||||||||||||||
| Total | Total | Total | Common | |||||||||||||||||||||||||
| No. of | IPO | Assets | Deposits | Equity | Equity | |||||||||||||||||||||||
| City/State | Ticker | Exchange | Offices | Date | ($000s) | ($000s) | ($000s) | ($000s) | ||||||||||||||||||||
Federal Savings Bank | Dover, NH | NA | NA | 5 | NA | 387,114 | 274,446 | 32,727 | 32,727 | |||||||||||||||||||
Comparative Group Average | 417,451 | 302,951 | 52,960 | 50,943 | ||||||||||||||||||||||||
Comparative Group Median | 338,626 | 258,759 | 50,834 | 47,211 | ||||||||||||||||||||||||
Comparative Group | ||||||||||||||||||||||||||||
Elmira Savings Bank | Elmira, NY | ESBK | NASDAQ | 13 | 03/01/85 | 590,040 | 491,517 | 57,949 | 45,578 | |||||||||||||||||||
FSB Bancorp, Inc. | Fairport, NY | FSBC | NASDAQ | 5 | 08/10/07 | 328,269 | �� | 222,615 | 31,513 | 31,513 | ||||||||||||||||||
HV Bancorp, Inc. | Huntingdon Valley, PA | HVBC | NASDAQ | 6 | 01/11/17 | 320,883 | 273,461 | 31,411 | 31,411 | |||||||||||||||||||
IF Bancorp, Inc. | Watseka, IL | IROQ | NASDAQ | 8 | 07/07/11 | 664,274 | 493,719 | 78,521 | 78,521 | |||||||||||||||||||
Melrose Bancorp, Inc. | Melrose, MA | MELR | NASDAQ | 1 | 10/21/14 | 323,853 | 244,056 | 45,215 | 45,215 | |||||||||||||||||||
Mid-Southern Bancorp, Inc. | Salem, IN | MSVB | NASDAQ | 3 | 04/08/98 | 200,662 | 151,108 | 48,843 | 48,843 | |||||||||||||||||||
MSB Financial Corp. | Millington, NJ | MSBF | NASDAQ | 4 | 01/04/07 | 584,500 | 420,579 | 66,646 | 66,646 | |||||||||||||||||||
Ottawa Bancorp, Inc. | Ottawa, IL | OTTW | NASDAQ | 3 | 07/11/05 | 292,664 | 223,276 | 52,824 | 51,946 | |||||||||||||||||||
PB Bancorp, Inc. | Putnam, CT | PBBI | NASDAQ | 8 | 10/04/04 | 520,387 | 365,935 | 83,286 | 76,374 | |||||||||||||||||||
WVS Financial Corp. | Pittsburgh, PA | WVFC | NASDAQ | 6 | 11/29/93 | 348,982 | 143,245 | 33,387 | 33,387 | |||||||||||||||||||
Source: Federal Savings Bank; S&P Global Market Intelligence; Feldman Financial.
67
FELDMAN FINANCIAL ADVISORS, INC.
Table 19
General Financial Performance Ratios
As of or For the Last Twelve Months Ended December 31, 2018
| Total | Tang. | Net | ||||||||||||||||||||||||||||||||||||||
| Total | Total | Equity/ | Equity/ | Interest | Effcy. | LTM | LTM | Core | Core | |||||||||||||||||||||||||||||||
| Assets | Deposits | Assets | Assets | Margin | Ratio | ROA | ROE | ROA | ROE | |||||||||||||||||||||||||||||||
| ($000s) | ($000s) | (%) | (%) | (%) | (%) | (%) | (%) | (%) | (%) | |||||||||||||||||||||||||||||||
Federal Savings Bank | 387,114 | 274,446 | 8.45 | 8.45 | 3.06 | 89.63 | 0.29 | 3.38 | 0.29 | 3.38 | ||||||||||||||||||||||||||||||
Comparative Group Average | 417,451 | 302,951 | 13.44 | 13.11 | 2.94 | 73.95 | 0.60 | 4.58 | 0.59 | 4.55 | ||||||||||||||||||||||||||||||
Comparative Group Median | 338,626 | 258,759 | 11.61 | 11.61 | 2.88 | 73.18 | 0.72 | 4.11 | 0.73 | 4.02 | ||||||||||||||||||||||||||||||
All Public Thrift Average | 4,355,200 | 3,044,217 | 12.81 | 11.83 | 3.30 | 67.32 | 0.92 | 7.73 | 0.88 | 7.11 | ||||||||||||||||||||||||||||||
All Public Thrift Median | 1,467,969 | 1,038,495 | 11.67 | 10.59 | 3.13 | 65.93 | 0.87 | 7.33 | 0.82 | 7.30 | ||||||||||||||||||||||||||||||
Comparative Group | ||||||||||||||||||||||||||||||||||||||||
Elmira Savings Bank | 590,040 | 491,517 | 9.82 | 7.90 | 3.31 | 73.82 | 0.75 | 7.37 | 0.75 | 7.37 | ||||||||||||||||||||||||||||||
FSB Bancorp, Inc. | 328,269 | 222,615 | 9.60 | 9.60 | 2.79 | 95.86 | 0.04 | 0.43 | 0.04 | 0.43 | ||||||||||||||||||||||||||||||
HV Bancorp, Inc. | 320,883 | 273,461 | 9.79 | 9.79 | 2.74 | 86.93 | 0.27 | 2.48 | 0.33 | 3.11 | ||||||||||||||||||||||||||||||
IF Bancorp, Inc. | 664,274 | 493,719 | 11.82 | 11.82 | 2.85 | 76.76 | 0.50 | 3.94 | 0.48 | 3.77 | ||||||||||||||||||||||||||||||
Melrose Bancorp, Inc. | 323,853 | 244,056 | 13.96 | 13.96 | 2.43 | 68.38 | 0.56 | 3.94 | 0.44 | 3.07 | ||||||||||||||||||||||||||||||
Mid-Southern Bancorp, Inc. | 200,662 | 151,108 | 24.34 | 24.34 | 3.53 | 79.59 | 0.72 | 4.28 | 0.72 | 4.28 | ||||||||||||||||||||||||||||||
MSB Financial Corp. | 584,500 | 420,579 | 11.40 | 11.40 | 3.28 | 63.27 | 0.85 | 6.88 | 0.85 | 6.88 | ||||||||||||||||||||||||||||||
Ottawa Bancorp, Inc. | 292,664 | 223,276 | 18.05 | 17.80 | 3.57 | 71.91 | 0.73 | 3.67 | 0.75 | 3.76 | ||||||||||||||||||||||||||||||
PB Bancorp, Inc. | 520,387 | 365,935 | 16.00 | 14.87 | 2.92 | 72.53 | 0.81 | 5.00 | 0.80 | 4.99 | ||||||||||||||||||||||||||||||
WVS Financial Corp. | 348,982 | 143,245 | 9.57 | 9.57 | 1.99 | 50.48 | 0.75 | 7.79 | 0.76 | 7.81 | ||||||||||||||||||||||||||||||
Source: Federal Savings Bank; S&P Global Market Intelligence; Feldman Financial.
68
FELDMAN FINANCIAL ADVISORS, INC.
Table 20
Income and Expense Analysis
For the Last Twelve Months Ended December 31, 2018
| As a Percent of Average Assets | ||||||||||||||||||||||||||||||||||||||||
| Net | Other | Gains & | Loan | Gen. & | Amort. | Pre-tax | ||||||||||||||||||||||||||||||||||
| Interest | Interest | Interest | Oper. | Non-rec. | Loss | Admin. | of | Non-rec. | Core | |||||||||||||||||||||||||||||||
| Income | Expense | Income | Income | Income | Prov. | Expense | Intang. | Expense | Earnings | |||||||||||||||||||||||||||||||
Federal Savings Bank | 3.81 | 0.84 | 2.97 | 0.41 | 0.00 | 0.00 | 3.03 | 0.00 | 0.00 | 0.35 | ||||||||||||||||||||||||||||||
Comparative Group Average | 3.68 | 0.89 | 2.79 | 0.58 | 0.02 | 0.05 | 2.53 | 0.00 | 0.01 | 0.79 | ||||||||||||||||||||||||||||||
Comparative Group Median | 3.72 | 0.87 | 2.77 | 0.58 | 0.00 | 0.06 | 2.68 | 0.00 | 0.00 | 0.90 | ||||||||||||||||||||||||||||||
All Public Thrift Average | 3.98 | 0.88 | 3.11 | 0.92 | 0.05 | 0.08 | 2.77 | 0.02 | 0.02 | 1.19 | ||||||||||||||||||||||||||||||
All Public Thrift Median | 3.80 | 0.92 | 2.97 | 0.58 | 0.00 | 0.06 | 2.63 | 0.00 | 0.00 | 1.15 | ||||||||||||||||||||||||||||||
Comparative Group | ||||||||||||||||||||||||||||||||||||||||
Elmira Savings Bank | 3.75 | 0.80 | 2.94 | 0.80 | 0.00 | 0.07 | 2.75 | 0.00 | 0.00 | 0.93 | ||||||||||||||||||||||||||||||
FSB Bancorp, Inc. | 3.93 | 1.25 | 2.68 | 0.85 | 0.00 | 0.09 | 3.39 | 0.00 | 0.00 | 0.05 | ||||||||||||||||||||||||||||||
HV Bancorp, Inc. | 3.41 | 0.76 | 2.65 | 1.25 | 0.00 | 0.09 | 3.39 | 0.00 | 0.09 | 0.41 | ||||||||||||||||||||||||||||||
IF Bancorp, Inc. | 3.88 | 1.12 | 2.76 | 0.66 | 0.00 | 0.12 | 2.61 | 0.00 | 0.00 | 0.68 | ||||||||||||||||||||||||||||||
Melrose Bancorp, Inc. | 3.42 | 1.09 | 2.33 | 0.24 | 0.16 | 0.06 | 1.76 | 0.00 | 0.00 | 0.75 | ||||||||||||||||||||||||||||||
Mid-Southern Bancorp, Inc. | 3.70 | 0.37 | 3.33 | 0.43 | 0.00 | (0.10 | ) | 2.99 | 0.00 | 0.00 | 0.87 | |||||||||||||||||||||||||||||
MSB Financial Corp. | 4.10 | 0.95 | 3.15 | 0.14 | 0.00 | 0.04 | 2.09 | 0.00 | 0.00 | 1.17 | ||||||||||||||||||||||||||||||
Ottawa Bancorp, Inc. | 4.06 | 0.72 | 3.33 | 0.79 | 0.00 | 0.19 | 2.93 | 0.02 | 0.00 | 1.00 | ||||||||||||||||||||||||||||||
PB Bancorp, Inc. | 3.41 | 0.64 | 2.77 | 0.50 | 0.00 | (0.10 | ) | 2.38 | 0.00 | 0.00 | 0.99 | |||||||||||||||||||||||||||||
WVS Financial Corp. | 3.11 | 1.15 | 1.96 | 0.13 | (0.00 | ) | 0.02 | 1.05 | 0.00 | 0.00 | 1.01 | |||||||||||||||||||||||||||||
Source: Federal Savings Bank; S&P Global Market Intelligence; Feldman Financial.
69
FELDMAN FINANCIAL ADVISORS, INC.
Table 21
Balance Sheet Composition
As of December 31, 2018
| As a Percent of Total Assets | ||||||||||||||||||||||||||||||||||||||||
| Cash and | Net | Real | Intang. | Other | Total | Borrowed | Other | Total | Total | |||||||||||||||||||||||||||||||
| Securities | Loans | Estate | Assets | Assets | Deposits | Funds | Liabs. | Liabs. | Equity | |||||||||||||||||||||||||||||||
Federal Savings Bank | 14.34 | 82.31 | 0.00 | 0.00 | 3.35 | 70.90 | 19.56 | 1.09 | 91.55 | 8.45 | ||||||||||||||||||||||||||||||
Comparative Group Average | 22.82 | 72.77 | 0.08 | 0.37 | 3.96 | 72.09 | 13.58 | 0.89 | 86.56 | 13.44 | ||||||||||||||||||||||||||||||
Comparative Group Median | 16.72 | 78.85 | 0.00 | 0.00 | 3.83 | 74.81 | 11.54 | 0.90 | 88.39 | 11.61 | ||||||||||||||||||||||||||||||
All Public Thrift Average | 18.82 | 76.13 | 0.08 | 0.95 | 4.17 | 74.46 | 11.81 | 0.92 | 87.19 | 12.81 | ||||||||||||||||||||||||||||||
All Public Thrift Median | 15.52 | 77.50 | 0.04 | 0.15 | 3.98 | 75.36 | 10.18 | 2.79 | 88.33 | 11.67 | ||||||||||||||||||||||||||||||
Comparative Group | ||||||||||||||||||||||||||||||||||||||||
Elmira Savings Bank | 10.43 | 81.23 | 0.02 | 2.09 | 6.23 | 83.30 | 5.25 | 1.62 | 90.18 | 9.82 | ||||||||||||||||||||||||||||||
FSB Bancorp, Inc. | 10.45 | 86.48 | 0.00 | 0.00 | 3.07 | 67.81 | 21.88 | 0.71 | 90.40 | 9.60 | ||||||||||||||||||||||||||||||
HV Bancorp, Inc. | 19.62 | 77.08 | 0.00 | 0.00 | 3.30 | 85.22 | 3.88 | 1.11 | 90.21 | 9.79 | ||||||||||||||||||||||||||||||
IF Bancorp, Inc. | 21.20 | 74.40 | 0.44 | 0.00 | 3.96 | 74.32 | 12.70 | 1.16 | 88.18 | 11.82 | ||||||||||||||||||||||||||||||
Melrose Bancorp, Inc. | 13.66 | 82.82 | 0.00 | 0.00 | 3.52 | 75.36 | 10.50 | 0.18 | 86.04 | 13.96 | ||||||||||||||||||||||||||||||
Mid-Southern Bancorp, Inc. | 33.25 | 62.94 | 0.12 | 0.00 | 3.69 | 75.30 | 0.00 | 0.35 | 75.66 | 24.34 | ||||||||||||||||||||||||||||||
MSB Financial Corp. | 9.59 | 85.94 | 0.00 | 0.00 | 4.48 | 71.96 | 16.13 | 0.51 | 88.60 | 11.40 | ||||||||||||||||||||||||||||||
Ottawa Bancorp, Inc. | 13.83 | 80.61 | 0.00 | 0.30 | 5.26 | 76.29 | 4.13 | 1.53 | 81.95 | 18.05 | ||||||||||||||||||||||||||||||
PB Bancorp, Inc. | 23.59 | 70.84 | 0.25 | 1.33 | 4.00 | 70.32 | 12.58 | 1.09 | 84.00 | 16.00 | ||||||||||||||||||||||||||||||
WVS Financial Corp. | 72.61 | 25.33 | 0.00 | 0.00 | 2.06 | 41.05 | 48.73 | 0.65 | 90.43 | 9.57 | ||||||||||||||||||||||||||||||
Source: Federal Savings Bank; S&P Global Market Intelligence; Feldman Financial.
70
FELDMAN FINANCIAL ADVISORS, INC.
Table 22
Growth Rates, Credit Risk, and Loan Composition
As of or For the Last Twelve Months Ended December 31, 2018
| Resid. | Other | Non- | ||||||||||||||||||||||||||||||||||||||
| Asset | Loan | Deposit | Real Est. | Real Est. | Real Est. | |||||||||||||||||||||||||||||||||||
| Growth | Growth | Growth | NPLs/ | NPAs/ | Resrvs./ | Resrvs./ | Loans/ | Loans/ | Loans/ | |||||||||||||||||||||||||||||||
| Rate | Rate | Rate | Loans | Assets | NPLs(1) | Loans | Loans | Loans | Loans | |||||||||||||||||||||||||||||||
Federal Savings Bank | 7.61 | 4.61 | 9.97 | 0.02 | 0.02 | NM | 0.88 | 66.39 | 26.24 | 7.37 | ||||||||||||||||||||||||||||||
Comparative Group Average | 8.44 | 11.67 | 7.96 | 0.96 | 0.81 | 126.25 | 0.83 | 63.44 | 26.03 | 10.53 | ||||||||||||||||||||||||||||||
Comparative Group Median | 5.85 | 7.91 | 3.76 | 0.89 | 0.77 | 94.41 | 0.84 | 61.17 | 21.22 | 8.14 | ||||||||||||||||||||||||||||||
All Public Thrift Average | 9.00 | 11.86 | 10.77 | 1.09 | 0.90 | 99.62 | 0.83 | 38.44 | 39.77 | 21.79 | ||||||||||||||||||||||||||||||
All Public Thrift Median | 5.37 | 7.20 | 6.60 | 0.84 | 0.79 | 91.71 | 0.84 | 29.93 | 46.98 | 23.09 | ||||||||||||||||||||||||||||||
Comparative Group | ||||||||||||||||||||||||||||||||||||||||
Elmira Savings Bank | 6.40 | 5.07 | 7.61 | 0.93 | 0.78 | 94.41 | 0.90 | 62.50 | 20.18 | 17.33 | ||||||||||||||||||||||||||||||
FSB Bancorp, Inc. | 4.42 | 6.93 | 2.73 | 0.04 | 0.03 | NM | 0.56 | 84.24 | 13.19 | 2.57 | ||||||||||||||||||||||||||||||
HV Bancorp, Inc. | 32.24 | 43.82 | 41.61 | 0.87 | 0.67 | 44.51 | 0.39 | 87.50 | 4.41 | 8.09 | ||||||||||||||||||||||||||||||
IF Bancorp, Inc. | 8.63 | 7.81 | 6.96 | 0.52 | 0.83 | 114.66 | 1.26 | 27.96 | 55.75 | 16.29 | ||||||||||||||||||||||||||||||
Melrose Bancorp, Inc. | 5.31 | 6.72 | 4.78 | 0.13 | 0.11 | 380.17 | 0.49 | 80.05 | 19.93 | 0.02 | ||||||||||||||||||||||||||||||
Mid-Southern Bancorp, Inc. | 13.58 | 9.92 | (0.52 | ) | 2.26 | 1.56 | 52.04 | 1.17 | 59.84 | 33.79 | 6.37 | |||||||||||||||||||||||||||||
MSB Financial Corp. | 3.81 | 6.10 | (6.31 | ) | 2.58 | 2.24 | 43.17 | 1.11 | 34.50 | 48.42 | 17.08 | |||||||||||||||||||||||||||||
Ottawa Bancorp, Inc. | 14.59 | 13.68 | 22.16 | 0.92 | 0.75 | 119.67 | 1.10 | 54.81 | 22.26 | 22.93 | ||||||||||||||||||||||||||||||
PB Bancorp, Inc. | (2.75 | ) | 8.63 | 1.00 | 1.06 | 1.02 | 72.62 | 0.77 | 57.54 | 34.27 | 8.19 | |||||||||||||||||||||||||||||
WVS Financial Corp. | (1.86 | ) | 8.02 | (0.42 | ) | 0.26 | 0.07 | 215.02 | 0.56 | 85.50 | 8.11 | 6.39 | ||||||||||||||||||||||||||||
| (1) | NM =non-meaningful value; calculated ratio greater than 1,000%. |
Source: Federal Savings Bank; S&P Global Market Intelligence; Feldman Financial.
71
FELDMAN FINANCIAL ADVISORS, INC.
III. MARKET VALUE ADJUSTMENTS
General Overview
This concluding chapter of the Appraisal identifies certain additional adjustments to the Bank’s estimated pro forma market value on a fully converted basis relative to the Comparative Group selected in Chapter II. The adjustments discussed in this chapter are made from the viewpoints of potential investors, which would include depositors holding subscription rights and unrelated parties who may purchase stock in a community offering. It is assumed that these potential investors are aware of all relevant and necessary facts as they would pertain to the value of the Bank relative to other publicly traded thrift institutions and relative to alternative investments.
Our appraised value is predicated on a continuation of the current operating environment for the Bank and thrift institutions in general. Changes in the Bank’s operating performance along with changes in the local and national economy, the stock market, interest rates, the regulatory environment, and other external factors may occur from time to time, often with great unpredictability, which could impact materially the pro forma market value of the Bank or thrift stocks in general. Therefore, the Valuation Range provided herein is subject to a more currentre-evaluation prior to the actual completion of the Reorganization and Offering.
In addition to the comparative operating fundamentals discussed in Chapter II, it is important to address additional market value adjustments based on certain financial and other criteria, which include, among other factors:
| (1) | Earnings Prospects |
| (2) | Financial Condition |
| (3) | Market Area |
| (4) | Management |
72
FELDMAN FINANCIAL ADVISORS, INC.
| (5) | Dividend Payments |
| (6) | Liquidity of the Issue |
| (7) | Subscription Interest |
| (8) | Recent Acquisition Activity |
| (9) | Effect of Banking Regulations and Regulatory Reform |
| (10) | Stock Market Conditions |
Earnings Prospects
Earnings prospects are dependent upon the sensitivity of asset yields and liability costs to changes in market rates, the credit quality of assets, the stability ofnon-interest components of income and expense, and the ability to leverage the balance sheet. Each of the foregoing is an important factor for investors in assessing earnings prospects. The Bank’s profitability in recent years generally has been restrained due to a combination of earnings fundamentals reflecting an above-average operating expense level and below-averagenon-interest income production. These disadvantages are offset somewhat by the Bank’s solid net interest margin and its very low level of credit-related losses.
The Bank’s earnings compared unfavorably to the Comparative Group for the recent LTM period. The Bank’s ROA measured 0.29% versus the Comparative Group median of 0.72% and All Public Thrift median of 0.87%. For each of the past five years, the Bank’s net interest income has not covered itsnon-interest expense, which represents a formidable hurdle toward achieving competitive levels of profitability. The Bank believes that it is positioned to achieve its internal growth objectives in an attractive market area. The Bank’s increased capital position after the Offering will help to improve its net interest margin across changing interest rate and business cycles, provide added interest rate risk protection, and additional leverage capacity to grow the balance sheet. In the near term, the Bank’s profitability will continue to be challenged by net interest margin pressure, increased operating expenses associated with new stock benefit plans and managing a public company, and regular loan loss provisions to ensure
73
FELDMAN FINANCIAL ADVISORS, INC.
that the Bank’s reserve level increases commensurately with the risk profile of the growing loan portfolio. Based on the Bank’s earnings fundamentals and recent operating results, we believe that a downward adjustment is warranted to the Bank’s pro forma market value for earnings prospects relative to the Comparative Group.
Financial Condition
As discussed and summarized in Chapter I, the Bank’s balance sheet composition reflects a large concentration of real estate loans, a lesser amount of investment securities, and a liquidity portfolio comprising cash and cash equivalents along with certificates of deposit in other financial institutions. The Bank relies mainly on its deposit base as a funding source, but also actively utilizes borrowings to supplement deposits. In contrast to the Comparative Group, the Bank exhibited a lower level of equity capital, higher level of borrowings, and more favorable measures of credit quality. Before the infusion of net capital proceeds, the Bank’s total equity ratio at 8.45% of assets trailed the 11.61% median of the Comparative Group. However, assuming completion of the Offering, the Company should achieve a capital level on a consolidated basis approaching or exceeding the Comparative Group median. The selection criteria for the Comparative Group ensured a collection of companies with solid capital positions and satisfactory asset quality, similar to the Bank’s financial profile. Therefore, on the whole, we believe that no adjustment is warranted for the Bank’s financial condition relative to the Comparative Group.
Market Area
The members of the Comparative Group are located in the Northeast,Mid-Atlantic, and Midwest regions of the country. The market areas encompassing the Comparative Group companies include metropolitan areas such as Boston, Philadelphia, Pittsburgh, Rochester, and
74
FELDMAN FINANCIAL ADVISORS, INC.
Louisville, along with smaller metropolitan and micropolitan areas. The Comparative Group companies are characterized by a cross-section of market areas that constitute smaller to larger metropolitan areas with relatively stable economies and moderate population growth prospects. However, on a more localized level, the Bank’s primary market area as represented by itstwo-county presence in New Hampshire exemplifies more favorable demographics than does the Comparative Group as a whole.
The weighted average household income of the Bank’s market area (as computed based on pro rata branch deposit concentrations) was $79,596 and above the Comparative Group median of $62,630 and the U.S. nationwide median of $63,174. Among the Comparative Group members, only three companies exhibited median household incomes in their market areas above that of the Bank and these markets have consistently stood out for their favorable demographics. Melrose Bancorp operates in Middlesex County adjacent to the city of Boston. HV Bancorp operates in Montgomery and Bucks counties outside of Philadelphia. MSB Financial operates in Morris and Somerset counties in northern New Jersey. The other members of the Comparative Group generally displayed median household incomes below that of the national median. In addition, the New Hampshire unemployment rate of 2.1% for the month of December 2018 ranked as the lowest among the country’s 50 states and below the national unemployment rate of 3.7%. The corresponding unemployment rates in Strafford and Rockingham counties were 1.9% and 2.2%, respectively. In recognition of these factors altogether, we believe that an upward adjustment is warranted for market area.
Management
Management’s principal challenges are to generate profitable results, monitor credit risks, and control operating costs while the Bank competes in an increasingly challenging financial
75
FELDMAN FINANCIAL ADVISORS, INC.
services environment. The normal challenges facing the Bank in attempting to deliver earnings growth and enhance its competitiveness remain paramount as it attempts to leverage the net capital proceeds from the Offering. The Bank is led by its President and Chief Executive Officer, James Brannen, who assumed the top administrative position in 2018. The Bank also hired a new Chief Financial Officer in 2018. Each of these executive officers has extensive year of banking experience. Nevertheless, the management team has significant challenges ahead in improving earnings results. Investors will likely rely upon actual financial results as the means of evaluating the future performance of management as the Bank pursues its asset growth and earnings improvement objectives. Based on these considerations, we believe that no adjustment is warranted relative to the Comparative Group for this factor.
Dividend Payments
Following completion of the Reorganization and Offering, the Board of Directors of the Company will have the authority to declare cash dividends on the shares of common stock, subject to statutory and regulatory requirements. The Company does not currently intend to pay dividends on its common stock following completion of the Offering. If it does determine to pay dividends in the future, the payment and amount of any dividends will depend upon a number of factors, including the following: (1) the Company’s financial performance; (2) regulatory capital requirements and limitations on dividends; (3) other uses of funds for the long-term value of stockholders; (4) tax considerations; (5) the FRB’s current regulations restricting the waiver of dividends by mutual holding companies; and (6) general economic conditions.
If the Company pays dividends to its stockholders, it also will be required to pay dividends to the MHC, unless the MHC is permitted by the FRB to waive the receipt of dividends. The FRB’s current regulations significantly restrict the ability of newly organized
76
FELDMAN FINANCIAL ADVISORS, INC.
mutual holding companies to waive dividends declared by their subsidiaries. Accordingly, because dividends would likely be required to be paid to the MHC along with all other stockholders, the amount of dividends available for all other stockholders will be less than if the MHC were to waive the receipt of dividends. In addition, the receipt or waiver of dividends by the MHC will may have a dilutive impact on minority shareholders in the event of a conversion of the MHC to stock form.
Payment of cash dividends has become commonplace among publicly traded thrifts with solid capital levels. Of the 10 members of the Comparative Group, seven currently pay regular cash dividends. The median dividend yield of the Comparative Group was 1.35% as of February 15, 2019. The median dividend yield of the All Public Thrift aggregate was 1.48% of February 15, 2019. Based on the Bank’s current capital level and recent earnings trends and coupled with the lack of an affirmative dividend declaration, investors are not likely to expect the payment of dividends until more robust levels of profits are generated by the Company. Therefore, we have concluded that a slight downward adjustment is warranted for purposes of dividend policy.
Liquidity of the Issue
With the increased number of market makers and institutional investors following thrift stocks, the majority of initial public offerings by thrifts are able to develop a public market for their new stock issues. Most publicly traded thrift stocks continue to be traded on the NASDAQ market. All 10 members of the Comparative Group are listed on the NASDAQ market. In conjunction with the Offering, the Company will apply to list its shares of common stock for trading on the NASDAQ market.
77
FELDMAN FINANCIAL ADVISORS, INC.
The development and maintenance of a public market, having the desirable characteristics of depth, liquidity and orderliness, depend on the existence of willing buyers and sellers. The average and median market capitalization of the Comparative Group companies was $53.0 million and $44.3 million, respectively, as of February 15, 2019. The All Public Thrift median market capitalization was much higher at $227.9 million. Of the 10 companies in the Comparative Group, all are traded on NASDAQ and indicated an overall average daily trading volume of approximately 3,600 shares over the LTM period. Because the Offering will represent a minority issue of 44.0% of the Company’s total shares outstanding, the public float of shares available for trading will be restrained by the aggregate number of shares held by the MHC, the employee stock ownership plan (“ESOP”), and the charitable foundation. Therefore, we have concluded that a slight adjustment to the Bank’s estimated pro forma market value is warranted to address the liquidity of the issue.
Subscription Interest
The Bank has retained the services of Keefe, Bruyette & Woods, Inc. to assist in the marketing and sale of the Offering. The Bank’s ESOP plans to purchase 3.92% of the total amount of shares to be outstanding. The Bank expects its directors, executive officers and their associates, to purchase 104,400 shares of common stock in the offering for an aggregate amount of approximately $1.0 million based on a $10.00 offering price per share. The minimum number of shares of common stock that may be purchased in the Offering is 25 shares ($250). Excluding the ESOP purchase, the maximum number of shares of common stock that may be purchased in the Offering by any person or persons exercising subscription rights through a single deposit account is 15,000 shares ($150,000). No person together with an associate or group of persons acting in concert may purchase more than 25,000 shares ($250,000).
78
FELDMAN FINANCIAL ADVISORS, INC.
Recent subscription interest in thrift stock conversion offerings has been varied. Two minority offerings of mutual holding companies have been completed thus far in 2019. During 2018, five thrift stock conversion offerings were completed, involving two standard conversions, one second-step transaction, and two minority offerings of mutual holding companies. The majority of these transactions experienced full investor participation with stock purchases limited to eligible depositors in the subscription phase.
Investor interest in thrift stock issues has been supported by the overall favorable performance results of the banking industry, stable housing market conditions, after-market pricing trends, and the expectation of continued merger and acquisition activity. Included among the Bank’s eligible depositor subscription base are a number of account holders who are considered professional thrift conversion investors. We are not currently aware of any additional market evidence or characteristics that may help predict the likely level of interest in the Bank’s subscription offering. Accordingly, absent actual results of the subscription offering, we believe that subscription interest is currently a neutral factor and, at the present time, requires no further adjustment.
Recent Acquisition Activity
Table 23 summarizes recent acquisition activity involving banks and thrifts based in the Northeast from January 1, 2018 to February 15, 2019. There were 23 announced acquisition transactions in the Northeast, with 14 transactions involving Massachusetts sellers, five Connecticut sellers, three New Hampshire sellers, and one seller from Rhode Island. The three New Hampshire sellers included Portsmouth-based Optima Bank & Trust Company, Savings Bank of Walpole, and First Colebrook Bancorp.
79
FELDMAN FINANCIAL ADVISORS, INC.
Table 23
Summary of Recent Northeast Acquisition Activity
Pending or Completed Transactions Announced Since January 1, 2017
| Seller’s Prior Financial Data | Offer Value to | |||||||||||||||||||||||||||||||||||||||||||||||||||||
| Total | Equity/ | LTM | LTM | Offer | Book | Tang. | LTM | Total | ||||||||||||||||||||||||||||||||||||||||||||||
| B/T | Assets | Assets | ROA | ROE | Date | Status | Value | Value | Book | EPS | Assets | |||||||||||||||||||||||||||||||||||||||||||
Buyer | St. | Seller | St. | (1) | ($Mil.) | (%) | (%) | (%) | Announced | (2) | ($Mil.) | (%) | (%) | (x) | (%) | |||||||||||||||||||||||||||||||||||||||
Average | 779.3 | 9.46 | 0.36 | 3.76 | NA | NA | 157.1 | 157.6 | 156.7 | 29.1 | 15.12 | |||||||||||||||||||||||||||||||||||||||||||
Median | 323.8 | 9.46 | 0.44 | 4.16 | NA | NA | 57.8 | 159.0 | 158.3 | 29.6 | 15.05 | |||||||||||||||||||||||||||||||||||||||||||
Hometown Financial MHC | MA | Abington Bank (3) | MA | B | 314.1 | 10.55 | 0.47 | 4.45 | 02/06/19 | P | NA | NA | NA | NA | NA | |||||||||||||||||||||||||||||||||||||||
Berkshire Hills Bancorp, Inc. | MA | SI Financial Group, Inc. | CT | T | 1,607.1 | 10.58 | 0.41 | 3.82 | 12/11/18 | P | 182.5 | 106.1 | 117.5 | 27.3 | 11.35 | |||||||||||||||||||||||||||||||||||||||
Cambridge Bancorp | MA | Optima Bank & Trust Co. | NH | B | 524.2 | 6.29 | 0.47 | 7.22 | 12/05/18 | P | 67.2 | 203.9 | 203.9 | 29.3 | 12.83 | |||||||||||||||||||||||||||||||||||||||
People’s United Financial | CT | BSB Bancorp, Inc. | MA | T | 2,971.8 | 6.66 | 0.74 | 11.00 | 11/27/18 | P | 328.7 | 159.8 | 159.8 | 14.9 | 11.06 | |||||||||||||||||||||||||||||||||||||||
North Easton Svgs. Bank | MA | Mutual Bank (3) | MA | B | 518.0 | 8.99 | 0.59 | 6.65 | 11/06/18 | P | NA | NA | NA | NA | NA | |||||||||||||||||||||||||||||||||||||||
Independent Bank Corp. | MA | Blue Hills Bancorp, Inc. | MA | T | 2,741.2 | 14.60 | 0.70 | 4.54 | 09/20/18 | P | 725.4 | 173.7 | 177.9 | 35.0 | 26.46 | |||||||||||||||||||||||||||||||||||||||
South Shore MHC | MA | Equitable Bancorp, MHC (3) | MA | B | 332.9 | 10.10 | 0.41 | 4.08 | 08/14/18 | P | NA | NA | NA | NA | NA | |||||||||||||||||||||||||||||||||||||||
Hometown Financial MHC | MA | Pilgrim Bancshares, Inc. | MA | T | 265.6 | 12.93 | 0.52 | 4.04 | 07/25/18 | C | 53.8 | 151.4 | 151.4 | 35.4 | 20.26 | |||||||||||||||||||||||||||||||||||||||
PeoplesBancorp, MHC | MA | First Suffield Financial, Inc. | CT | B | 281.5 | 10.56 | NA | NA | 07/17/18 | C | 60.0 | 201.9 | NA | NA | 21.32 | |||||||||||||||||||||||||||||||||||||||
People’s United Financial | CT | First Connecticut Bancorp | CT | B | 3,137.6 | 8.82 | 0.57 | 6.23 | 06/19/18 | C | 552.3 | 186.6 | 186.6 | 29.9 | 17.60 | |||||||||||||||||||||||||||||||||||||||
Independent Bank Corp. | MA | MNB Bancorp | MA | B | 365.4 | 8.19 | 0.55 | 6.19 | 05/29/18 | C | 54.3 | 203.7 | 203.7 | 41.4 | 14.87 | |||||||||||||||||||||||||||||||||||||||
Salem Five Bancorp | MA | Sage Bank | MA | T | 141.7 | 7.22 | (1.25 | ) | (15.66 | ) | 04/30/18 | C | 9.3 | 113.0 | 113.0 | NM | 6.59 | |||||||||||||||||||||||||||||||||||||
HarborOne Bancorp MHC | MA | Coastway Bancorp, Inc. | RI | T | 738.9 | 9.66 | 0.39 | 3.72 | 03/14/18 | C | 125.6 | 173.8 | 173.8 | 44.1 | 16.99 | |||||||||||||||||||||||||||||||||||||||
New Hamp. Mutual Bancorp | NH | Savings Bank of Walpole (3) | NH | T | 400.1 | 7.55 | 0.32 | 4.23 | 12/14/17 | C | NA | NA | NA | NA | NA | |||||||||||||||||||||||||||||||||||||||
Bangor Bancorp, MHC | ME | First Colebrook Bancorp | NH | B | 262.4 | 9.46 | 0.07 | 0.79 | 10/24/17 | C | 45.0 | 181.1 | 184.9 | NM | 17.13 | |||||||||||||||||||||||||||||||||||||||
Brookline Bancorp, Inc. | MA | First Commons Bank | MA | B | 323.8 | 10.83 | 0.74 | 7.45 | 09/21/17 | C | 55.5 | 158.3 | 158.3 | 22.1 | 17.15 | |||||||||||||||||||||||||||||||||||||||
Fidelity Mutual Holding Co. | MA | ColonialCo-op. Bank (3) | MA | T | 69.0 | 8.12 | 0.11 | 1.40 | 09/19/17 | C | NA | NA | NA | NA | NA | |||||||||||||||||||||||||||||||||||||||
Patriot National Bancorp, | CT | Prime Bank | CT | B | 75.1 | 10.97 | 0.62 | 5.16 | 08/02/17 | C | 10.2 | 115.0 | 115.0 | 19.6 | 13.53 | |||||||||||||||||||||||||||||||||||||||
Atlantic Community Bancshs. | PA | BBN Financial Corporation | CT | B | 167.1 | 10.56 | 0.36 | 3.35 | 08/02/17 | C | 17.0 | 107.8 | 109.2 | 36.2 | 10.17 | |||||||||||||||||||||||||||||||||||||||
South Shore Bancorp MHC | MA | Braintree Bancorp MHC (3) | MA | B | 258.6 | 8.09 | 0.20 | 2.54 | 07/18/17 | C | NA | NA | NA | NA | NA | |||||||||||||||||||||||||||||||||||||||
Meridian Bancorp, Inc. | MA | Meetinghouse Bancorp, Inc. | MA | T | 117.8 | 9.29 | 0.06 | 0.62 | 06/26/17 | C | 17.9 | 157.2 | 157.2 | NM | 15.23 | |||||||||||||||||||||||||||||||||||||||
Berkshire Hills Bancorp, Inc. | MA | Commerce Bancshares Corp. | MA | B | 2,219.4 | 7.33 | 0.75 | 8.80 | 05/22/17 | C | 209.2 | 128.6 | 138.3 | 14.6 | 9.43 | |||||||||||||||||||||||||||||||||||||||
Abington Bank | MA | AvonCo-operative Bank (3) | MA | B | 90.5 | 10.15 | 0.22 | 2.10 | 05/17/17 | C | NA | NA | NA | NA | NA | |||||||||||||||||||||||||||||||||||||||
| (1) | B = bank; T = thrift. |
| (2) | P = pending; C = completed. |
| (3) | Mutual-form seller with no offer value consideration. |
Source: S&P Global Market Intelligence.
80
FELDMAN FINANCIAL ADVISORS, INC.
The acquisition valuation ratios paid in the Northeast transactions generally have followed the nationwide valuation trends for bank and thrift acquisitions. Given that there will be significant regulatory restrictions on the ability to acquire control of the Company or the Bank for a period of three years following the Reorganization, we do not believe that acquisition premiums are a significant factor to consider in analyzing the Bank’s pro forma market value. Moreover the standard of value applied herein does not require an acquisition value determination.
Effect of Banking Regulations and Regulatory Reform
In response to the financial crisis of 2008 and 2009, Congress took actions intended to strengthen confidence and encourage liquidity in financial institutions. The Dodd-Frank Wall Street Reform and Consumer Protection Act (“Dodd-Frank”) was enacted in 2010, and provided for new restrictions and an expanded framework of regulatory oversight for financial institutions. The legislation also created the Consumer Financial Protection Bureau that has broad authority to issue regulations governing the services and products provided by financial institutions. Community bankers believe that the Dodd-Frank legislation has led to increased compliance costs. Legislation was recently enacted in 2018 that preserves the fundamental elements of the post-Dodd-Frank regulatory framework, but includes modifications that will result in some meaningful regulatory relief for smaller and certain larger banking organizations.
As a stock savings bank insured by the FDIC and supervised by its primary regulators, the Bank will continue to operate in the same regulatory environment that is substantially similar to that faced by the Comparative Group companies. As of December 31, 2018, the Bank was considered well capitalized, similar to all the members of the Comparative Group. Therefore, given these factors, we believe that no specific adjustment is necessary for the effect of banking regulations and regulatory reform.
81
FELDMAN FINANCIAL ADVISORS, INC.
Stock Market Conditions
Financial stocks have performed well in the economic recovery, and bank and thrift stocks participated fully in the sustained market rally from 2009 to 2018. Robust corporate earnings growth, sustained economic expansion, and generally low interest rates were major factors influencing equity market returns over this period, the second longest market rally in U.S. history. Table 24 displays the three-year performance of an array of market indexes maintained on the SNL Financial market data platform by S&P Global Market Intelligence. The SNL Micro Cap Thrift Index (all publicly traded thrifts with market capitalizations less than $250 million) increased by 41.1% over the past three years, while the Standard & Poor’s500-Stock Index (“S&P 500”) and NASDAQ Bank Index increased by 43.7% and 52.0%, respectively.
Table 25 presents the comparative market indexes over theone-year ending February 15, 2019 and highlights the recent volatility in the U.S. equity markets. Market exuberance in early 2018 was buffeted by concerns about the U.S. tariff initiative escalating global trade tensions. Market volatility continued to pull the market downward in August and September 2018 as concerns mounted about the historically high valuation levels embedded in stock prices. In addition, market momentum has been shaken by the slowdown of U.S. gross domestic product’s growth pace and expectations for impending inflation and continued rate increases by the FRB. Reflecting the weaker and more volatile market conditions through the early part of 2019, the SNL Micro Cap Index inched forward by only 1.0% for theone-year period ended February 15, 2019, while the S&P 500 advanced 2.4% and the NASDAQ Bank Index was down 5.4%. In particular, there was asell-off of larger capitalization bank stocks toward the end of 2018 as concerns rose that growth, fueled by corporate tax cuts, might have peaked and credit tailwinds may begin to stir in the future and stall loan expansion.
82
FELDMAN FINANCIAL ADVISORS, INC.
Table 24
Comparative Three-Year Stock Index Performance
For the Three-Year Period Through February 15, 2019
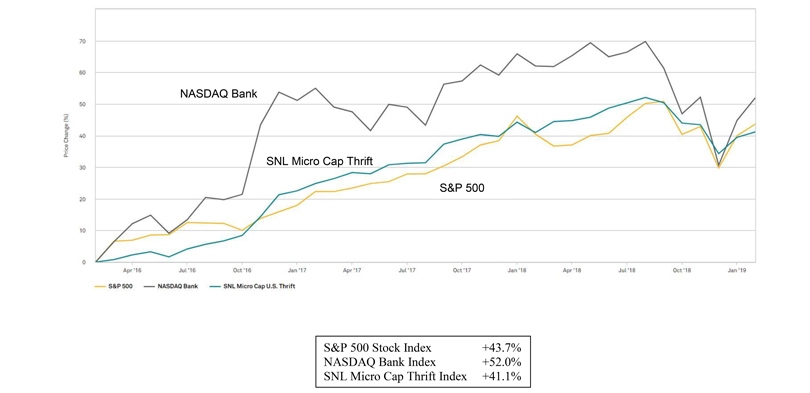
83
FELDMAN FINANCIAL ADVISORS, INC.
Table 25
ComparativeOne-Year Stock Index Performance
For theOne-Year Period Through February 15, 2019
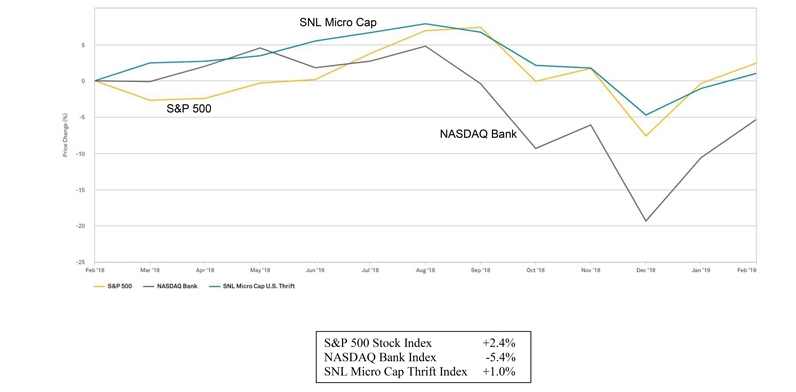
84
FELDMAN FINANCIAL ADVISORS, INC.
A “new issue” discount that reflects investor concerns and investment risks inherent in all initial public offerings is a factor to be considered for purposes of valuing converting thrifts. The magnitude of the new issue discount typically expands during periods of declining or volatile thrift stock prices as investors require larger inducements, and narrows during strong market conditions. Table 26 presents a summary of minority stock offerings since January 1, 2015 involving mutual holding companies. The pricing of these offerings confirms the presence of the new issue discount in the pro forma market valuations of converting thrifts versus existing public thrifts. The distinction of the new issue discount is most apparent with theprice-to-book value ratio because the pro forma equity calculation involves combining the net new capital proceeds with the historical equity of the converting company. The median fully converted pro formaprice-to-book value ratio for minority offerings involving mutual holding companies was 71.7% for the 2015 to 2019year-to-date period and 73.6% for the 2018 to 2019year-to-date period. In January 2019, Rhinebeck Bancorp and 1895 Bancorp of Wisconsin completed their minority offerings at fully convertedprice-to-book ratios of 74.7% and 62.3%, respectively.
Historically, newly converted thrifts have gradually traded upward to a range near existing thrift stock valuation levels, but found resistance approaching book value until a discernible trend in earnings improvement was evident. Pricing a new offering at a relatively high ratio in relation to pro forma book value, because of the mathematics of the calculation, would require very large increases in valuations resulting in unsustainableprice-to-earnings ratios and very marginal returns on equity. Accordingly, thrift conversions continue to be priced at discounts to publicly traded companies. This is due to the relatively high pro forma equity ratios, expected low returns on equity, and the uncertainty regarding the prospects of an institution to leverage the balance sheet prudently and effectively in the current interest rate environment and against the backdrop of an increasingly competitive banking marketplace.
85
FELDMAN FINANCIAL ADVISORS, INC.
Table 26
Summary of Recent MHC Minority Stock Offerings
Transactions Completed Since January 1, 2015
| Fully | After-Market Trading | |||||||||||||||||||||||||||||||||||||||||||||||||||||||||||
| Gross | MHC | Tang. Equity/ | Conv. | 2/15/19 | Price Change | Change | ||||||||||||||||||||||||||||||||||||||||||||||||||||||
| Total | Offering | Owner- | Assets | P/B | IPO | Closing | One | One | Three | Through | ||||||||||||||||||||||||||||||||||||||||||||||||||
| Stock | Offering | Assets | Proceeds | ship | Pre | Post | Ratio | Price | Price | Week | Month | Mnths. | 2/15/19 | |||||||||||||||||||||||||||||||||||||||||||||||
Company | St. | Exchange | Date | ($Mil.) | ($Mil.) | (%) | (%) | (%) | (%) | ($) | ($) | (%) | (%) | (%) | (%) | |||||||||||||||||||||||||||||||||||||||||||||
2018 to 2019 — Average | 1,806.8 | 144.4 | 55.3 | 7.61 | 12.56 | 72.8 | NA | NA | 17.6 | 19.6 | 28.0 | 14.4 | ||||||||||||||||||||||||||||||||||||||||||||||||
2018 to 2019 — Median | 651.3 | 34.7 | 55.0 | 7.79 | 11.86 | 73.6 | NA | NA | 9.7 | 5.6 | 28.0 | 4.1 | ||||||||||||||||||||||||||||||||||||||||||||||||
2015 to 2019 — Average | 1,066.5 | 84.5 | 54.4 | 10.04 | 15.53 | 70.9 | NA | NA | 20.7 | 20.3 | 23.9 | 27.1 | ||||||||||||||||||||||||||||||||||||||||||||||||
2015 to 2019 — Median | 482.8 | 34.7 | 54.0 | 8.10 | 13.23 | 71.7 | NA | NA | 19.0 | 16.2 | 25.1 | 16.2 | ||||||||||||||||||||||||||||||||||||||||||||||||
MHC Minority Offerings | ||||||||||||||||||||||||||||||||||||||||||||||||||||||||||||
Rhinebeck Bancorp, Inc. | NY | NASDAQ | 01/16/19 | 819.7 | 47.9 | 57.0 | 6.76 | 11.51 | 74.7 | 10.00 | 11.62 | 19.0 | 16.2 | NA | 16.2 | |||||||||||||||||||||||||||||||||||||||||||||
1895 Bancorp of Wisconsin | WI | NASDAQ | 01/08/19 | 482.8 | 21.5 | 55.0 | 7.82 | 10.95 | 62.3 | 10.00 | 9.20 | 0.3 | (5.2 | ) | NA | (8.0 | ) | |||||||||||||||||||||||||||||||||||||||||||
Columbia Financial, Inc. | NJ | NASDAQ | 04/19/18 | 5,766.5 | 498.3 | 54.0 | 8.10 | 15.56 | 81.6 | 10.00 | 15.95 | 55.6 | 72.4 | 63.4 | 59.5 | |||||||||||||||||||||||||||||||||||||||||||||
SSB Bancorp, Inc. | PA | OTC Pink | 01/24/18 | 158.3 | 10.1 | 55.0 | 7.76 | 12.21 | 72.5 | 10.00 | 9.00 | (4.5 | ) | (5.1 | ) | (7.5 | ) | (10.0 | ) | |||||||||||||||||||||||||||||||||||||||||
Seneca Financial Corp. | NY | OTC Pink | 10/11/17 | 172.4 | 9.1 | 54.0 | 6.65 | 10.18 | 71.7 | 10.00 | 8.10 | 2.0 | (5.0 | ) | (10.0 | ) | (19.0 | ) | ||||||||||||||||||||||||||||||||||||||||||
FFBW, Inc. | WI | NASDAQ | 10/10/17 | 236.2 | 29.5 | 55.4 | 14.49 | 22.45 | 73.7 | 10.00 | 10.85 | 15.5 | 12.5 | 10.4 | 8.5 | |||||||||||||||||||||||||||||||||||||||||||||
PDL Community Bancorp | NY | NASDAQ | 09/29/17 | 813.0 | 83.1 | 51.7 | 11.64 | 19.04 | 75.8 | 10.00 | 12.95 | 50.4 | 50.4 | 54.3 | 29.5 | |||||||||||||||||||||||||||||||||||||||||||||
Community First Bancshares | GA | NASDAQ | 04/27/17 | 238.0 | 34.7 | 54.0 | 19.10 | 28.22 | 69.5 | 10.00 | 10.31 | 34.7 | 30.5 | 31.2 | 3.1 | |||||||||||||||||||||||||||||||||||||||||||||
HarborOne Bancorp, Inc. | MA | NASDAQ | 06/29/16 | 2,244.8 | 144.5 | 53.8 | 7.99 | 13.23 | 70.3 | 10.00 | 15.92 | 28.8 | 34.2 | 57.8 | 59.2 | |||||||||||||||||||||||||||||||||||||||||||||
Cincinnati Bancorp | OH | OTC Pink | 10/14/15 | 137.8 | 7.7 | 55.0 | 8.55 | 12.45 | 66.0 | 10.00 | 12.90 | (2.5 | ) | (5.2 | ) | (9.9 | ) | 29.0 | ||||||||||||||||||||||||||||||||||||||||||
Provident Bancorp, Inc. | MA | NASDAQ | 07/15/15 | 662.4 | 42.7 | 53.0 | 11.63 | 15.07 | 61.7 | 10.00 | 23.05 | 28.5 | 28.0 | 25.1 | 130.5 | |||||||||||||||||||||||||||||||||||||||||||||
Source: S&P Global Market Intelligence.
86
FELDMAN FINANCIAL ADVISORS, INC.
The 5,406 FDIC-insured commercial banks and savings institutions reported quarterly net income of $59.1 billion in the fourth quarter of 2018, an increase of $33.8 billion (133.4%) from a year earlier. Improvement in quarterly net income was attributable to higher net operating revenue (the sum of net interest income andnon-interest income) and lower income tax expenses. The average ROA was 1.33% for the quarter. Growth in net operating revenue (up $53.1 billion or 7.0%), coupled with lower income tax expenses (down $36.9 billion or 37.7%) and loan loss provisions (down $1.1 billion or 2.2% percent), lifted full-year 2018 net income to $236.7 billion, an improvement of $72.4 billion (44.1%) from 2017. The average net interest margin rose from 3.25% in 2017 to 3.40%, as average asset yields (up 43 basis points) exceeded average funding costs (up 28 basis points). The average ROA for 2018 was 1.35%, up from 0.97% for 2017. The banking industry’s core leverage capital ratio improved from 9.63% atyear-end 2017 to 9.70% atyear-end 2018, while the ratio ofnon-performing assets declined from 0.72% atyear-end 2017 to 0.60% atyear-end 2018.
Bank and thrift industry earnings results have recently been sustained by expanding net interest margins and decreasing credit-related charges. Industry operating expenses generally continue to rise in the face of sluggish growth innon-interest operating income or securities gains. While bank and thrift industry capital levels remain strong and asset quality has improved, there continue to be volatile swings in the market for bank and thrift stocks. Therefore, we believe that while stock market conditions are somewhat neutral, the new issue discount continues to be relevant because of the risks and uncertainties associated with a new stock offering.
87
FELDMAN FINANCIAL ADVISORS, INC.
Adjustments Conclusion
It is our opinion that the Bank’s pro forma market valuation should be discounted relative to the Comparative Group. Our conclusion is based on a downward adjustment for earnings prospects, accompanied by slight downward adjustments for dividend payments, liquidity of the issue, and the new issue discount underlying stock market conditions. These downward adjustments were offset partially by an upward adjustment for market area. Currently, converting thrifts are often valued at meaningful discounts to peer institutions relative toprice-to-book andprice-to-tangible book ratios. Due to initially low post-conversion earnings from there-investment of net offering proceeds at relatively low rates, resultingprice-to-earnings ratios may reflect premiums to established trading companies. It is the judgment of the appraiser to balance the relative dynamics ofprice-to-book andprice-to-earnings discounts or premiums.
Valuation Approach
In determining the estimated pro forma market value of the Bank, we have employed the comparative company approach and considered the following pricing ratios:price-to-book value per share (“P/B”),price-to-tangible book value per share (“P/TB”),price-to-earnings per share (“P/E”), andprice-to-assets (“P/A”). Table 27 presents the trading market valuation ratios of the Comparative Group and All Public Thrift averages and medians as of February 15, 2019. As shown in Table 27, the median P/B ratio for the Comparative Group was 102.8%. Four members of the Comparative Group were valued at levels under book value (P/B ratio less than 100.0%). The median P/TB ratio for the Comparative Group was 106.5%. Higher equity levels have a restraining impact on P/B and P/TB ratios because the of the accompanying challenge to generate competitive ROE results on such excess capital. Among the Comparative Group members,Mid-Southern Bancorp and Ottawa Bancorp reported the highest equity capital ratios
88
FELDMAN FINANCIAL ADVISORS, INC.
at 24.34% and 18.05% of assets, respectively, along with lower P/B ratios at 95.1% and 86.2%. The median P/E ratio based on LTM earnings for the Comparative Group was 22.2x. On a core earnings basis, the median core P/E ratio of the Comparative Group was 20.8x. Some companies within the All Public Thrift aggregate reported P/E ratios that were either distortedly high due to low levels of profitability and the resulting P/E ratio may be expressed as “NM” ornon-meaningful.
Investors continue to make decisions to purchase thrift conversion stocks and more seasoned thrift issues based upon consideration of core earnings profitability and P/B comparisons. The P/E ratio remains an important valuation ratio in the current thrift stock market. However, as noted above, the P/E ratio is not useful for companies reporting negative or low earnings. The Bank’s LTM earnings and core earnings for the period ended December 31, 2018 amounted to $1.1 million. On a fully converted pro forma basis, after making adjustments forre-investment of net offering proceeds and expensing charges related to the implementation of various stock benefit plans, including the ESOP, restricted stock plan (“RSP”) and stock option plan, the Bank’s pro forma earnings are still equal to approximately $1.1 million. Consequently, additional reliance is on placed on the P/B and P/TB ratios to determine trading valuation benchmarks.
Based on our comparative financial and valuation analyses, we concluded that the Bank should be discounted relative to the trading valuation ratios of the overall Comparative Group. In consideration of the foregoing factors along with the additional adjustments discussed in this chapter, we have determined pro forma P/B and P/TB ratios of 64.7% for the Bank, which reflects an aggregate midpoint of $46.0 million on a fully converted basis for the Valuation Range based on the assumptions summarized in Exhibit IV. Employing a range of 15% above
89
FELDMAN FINANCIAL ADVISORS, INC.
and below the midpoint, the resulting minimum value of $39.1 million reflects a 60.0% P/B ratio and the resulting maximum value of $52.9 million reflects a 68.6% P/B ratio. The adjusted maximum, computed as an additional 15% above the maximum, is positioned at approximately $60.8 million and a P/B ratio of 72.5%. The Bank’s pro forma P/B and P/TB ratios are equivalent since the Bank had no intangible assets as of December 31, 2018. The Bank pro forma P/B ratio of 72.5% at the adjusted maximum is comparable to the median pro forma P/B ratio of 73.6% reported for the four minority stock offerings involving mutual holding companies completed in 2018 and 2019year-to-date as shown in Table 26.
The Bank’s pro forma midpoint P/B and P/TB ratios of 64.7% reflect a discount of 37.1% to the Comparative Group median P/B ratio of 102.8% and a 39.2% discount to the Comparative Group median P/TB ratio of 106.5%. The Bank’s pro forma minimum P/B and P/TB ratios of 60.0% reflect a discount of 41.6% to the Comparative Group median P/B ratio and a 43.7% discount to the Comparative Group median P/TB. The Bank’s pro forma maximum P/B and P/TB ratios of 68.6% reflect discounts of 33.3% and 35.6% to the Comparative Group median P/B and P/TB ratios, respectively. At the adjusted maximum, the Bank’s pro forma P/B and P/TB ratios of 72.5% are positioned at a 29.5% discount to the Comparative Group median P/B and a discount of 31.9% to the Comparative Group median P/TB ratio.
Based on the Valuation Range as indicated above, the Bank’s pro forma P/E ratios reflected P/E ratios measuring 31.3x, 37.0x, 41.7x, and 47.6x at the minimum, midpoint, maximum, and adjusted maximum, respectively, of the Valuation Range. As discussed earlier, the Bank’s pro forma P/E ratios are skewed upward due to its lower earnings base. The Bank’s pro forma P/E ratios represent premiums of 41.0%, 66.7%, 87.8%, and 114.4% at the minimum, midpoint, maximum, and adjusted maximum, respectively, of the Valuation Range as compared to the Comparative Group median P/E ratio of 22.2x.
90
FELDMAN FINANCIAL ADVISORS, INC.
Based on theprice-to-assets valuation metric, the Bank’s pro forma midpoint of the Valuation Range at $46.0 million reflects a corresponding P/A ratio of 10.81%, ranging from 9.32% at the minimum valuation to 12.26% and 13.38% at the maximum and adjusted maximum, respectively. The Bank’s solid capitalization level resulted in a P/A ratio approximately 6.0% above the Comparative Group median at the adjusted maximum of the Valuation Range with a resulting pro forma P/A ratio of 13.88%. However, at the midpoint, the Bank’s pro forma P/A ratio was 10.81% and reflected a discount of 17.4% to the Comparative Group median P/A ratio of 13.09%. While the Bank’s pro forma P/B and P/TB ratios reflect material discounts to the Comparative Group and its pro forma P/E ratios display significant premiums, the Bank’s pro forma P/A ratios exhibit both discounts and premiums to the Comparative Group median across the different levels of the Valuation Range.
Valuation Conclusion
It is our opinion that, as of February 15, 2019, the estimated pro forma market value of the Bank on a fully converted basis was within a Valuation Range of $39,100,000 to $52,900,000 with a midpoint of $46,000,000. The Valuation Range was based upon a 15% decrease from the midpoint to determine the minimum and a 15% increase from the midpoint to establish the maximum. Based on a price per share of $10.00, this Valuation Range equates to total shares outstanding of 3,910,000 at the minimum to 5,290,000 at the maximum with a midpoint of 4,600,000 shares. Assuming an additional 15% increase above the maximum value would result in an adjusted maximum of $60,835,000 or 6,083,500 shares. Table 27 compares the Bank’s pro forma fully converted valuation ratios to the market valuation ratios of the Comparative Group.
91
FELDMAN FINANCIAL ADVISORS, INC.
As part of the Offering, the Company will offer common stock for sale in an amount equal to 44.0% of the aggregate pro forma market value. Thus, based on a price per share of $10.00, the Company will offer a minimum of 1,720,400 shares, a midpoint of 2,024,000 shares, a maximum of 2,327,600 shares, and an adjusted maximum of 2,676,740 shares. The aggregate pro forma market value of the common stock sold in the Offering will range from $17,204,000 at the minimum and $20,240,000 at the midpoint to $23,276,000 at the maximum and $26,767,400 at the adjusted maximum. The shares being sold in the Offering represent 44.0% of the shares of common stock of the Company that will be outstanding following the Offering. After the Offering, 55.0% of the Company’s outstanding shares of common stock will be owned by the MHC and 1.0% will be contributed to the Bank’s charitable foundation, so long as such contribution is approved by the members of the Bank. Table 28 compares the Company’s pro forma minority offering valuation ratios to the market valuation ratios of the Comparative Group.
ExhibitIV-1 displays the assumptions utilized in calculating the pro forma financial consequences on a fully converted basis. ExhibitIV-2 displays the pro forma financial data of the Company at the minimum, midpoint, maximum, and adjusted maximum levels of the Valuation Range. ExhibitIV-3 provides more detailed data and calculations at the maximum level of the Valuation Range. ExhibitIV-4 compares the Bank’s pro forma fully converted valuation ratios with the averages and medians reported by the Comparative Group and All Public Thrifts. ExhibitV-1 displays the assumptions utilized in calculating the pro forma financial consequences of the Offering, assuming a sale of 44.0% of the shares of common stock and the issuance of 1.0% of the shares to the Bank’s charitable foundation. ExhibitV-2 provides the pro forma financial data of the Company at the minimum, midpoint, maximum, and adjusted maximum levels of the Offering.
92
FELDMAN FINANCIAL ADVISORS, INC.
Table 27
Comparative Pro Forma Fully Converted Valuation Analysis
Based on Market Price Data as of February 15, 2019
| Current | Total | Price/ | Price/ | Price/ | Price/ | Price/ | Total | Tang. | Current | |||||||||||||||||||||||||||||||
| Stock | Market | LTM | Core | Book | Tang. | Total | Equity/ | Equity/ | Dividend | |||||||||||||||||||||||||||||||
| Price | Value | EPS | EPS | Value | Book | Assets | Assets | Assets | Yield | |||||||||||||||||||||||||||||||
Company | ($) | ($Mil.) | (x) | (x) | (%) | (%) | (%) | (%) | (%) | (%) | ||||||||||||||||||||||||||||||
Federal Savings Bank(1) | ||||||||||||||||||||||||||||||||||||||||
Pro Forma Minimum | 10.00 | 39.1 | 31.3 | 31.3 | 60.0 | 60.0 | 9.32 | 15.53 | 15.53 | 0.00 | ||||||||||||||||||||||||||||||
Pro Forma Midpoint | 10.00 | 46.0 | 37.0 | 37.0 | 64.7 | 64.7 | 10.81 | 16.71 | 16.71 | 0.00 | ||||||||||||||||||||||||||||||
Pro Forma Maximum | 10.00 | 52.9 | 41.7 | 41.7 | 68.6 | 68.6 | 12.26 | 17.86 | 17.86 | 0.00 | ||||||||||||||||||||||||||||||
Pro Forma Adj. Maximum | 10.00 | 60.8 | 47.6 | 47.6 | 72.5 | 72.5 | 13.88 | 19.15 | 19.15 | 0.00 | ||||||||||||||||||||||||||||||
Comparative Group Average | NA | 53.0 | 23.1 | 21.8 | 104.5 | 108.5 | 13.57 | 13.44 | 13.11 | 1.51 | ||||||||||||||||||||||||||||||
Comparative Group Median | NA | 44.3 | 22.2 | 20.8 | 102.8 | 106.5 | 13.09 | 11.61 | 11.61 | 1.35 | ||||||||||||||||||||||||||||||
All Public Thrift Average(2) | NA | 628.1 | 18.2 | 18.4 | 129.3 | 144.2 | 15.21 | 12.81 | 11.83 | 1.68 | ||||||||||||||||||||||||||||||
All Public Thrift Median(2) | NA | 227.9 | 15.3 | 15.2 | 119.5 | 131.6 | 14.89 | 11.67 | 10.59 | 1.48 | ||||||||||||||||||||||||||||||
Comparative Group | ||||||||||||||||||||||||||||||||||||||||
Elmira Savings Bank | 18.06 | 63.3 | 14.9 | 14.9 | 109.3 | 138.8 | 10.73 | 9.82 | 7.90 | 5.09 | ||||||||||||||||||||||||||||||
FSB Bancorp, Inc. | 17.00 | 32.5 | NM | NM | 105.5 | 105.5 | 9.89 | 9.60 | 9.60 | 0.00 | ||||||||||||||||||||||||||||||
HV Bancorp, Inc. | 15.18 | 31.9 | 39.9 | 31.7 | 109.0 | 109.0 | 10.67 | 9.79 | 9.79 | 0.00 | ||||||||||||||||||||||||||||||
IF Bancorp, Inc. | 20.51 | 69.0 | 23.3 | 24.3 | 94.5 | 94.5 | 11.17 | 11.82 | 11.82 | 1.22 | ||||||||||||||||||||||||||||||
Melrose Bancorp, Inc. | 18.90 | 44.9 | 25.5 | NA | 107.6 | 107.6 | 15.02 | 13.96 | 13.96 | 1.80 | ||||||||||||||||||||||||||||||
Mid-Southern Bancorp, Inc. | 12.70 | 42.7 | 31.0 | 31.0 | 95.1 | 95.1 | 21.30 | 24.34 | 24.34 | 0.63 | ||||||||||||||||||||||||||||||
MSB Financial Corp. | 17.90 | 93.3 | 19.9 | 19.9 | 144.7 | 144.7 | 16.50 | 11.40 | 11.40 | 0.00 | ||||||||||||||||||||||||||||||
Ottawa Bancorp, Inc. | 13.55 | 43.6 | 22.2 | 21.7 | 86.2 | 87.6 | 15.55 | 18.05 | 17.80 | 1.48 | ||||||||||||||||||||||||||||||
PB Bancorp, Inc. | 11.19 | 78.8 | 19.3 | 19.4 | 100.1 | 109.1 | 16.02 | 16.00 | 14.87 | 2.50 | ||||||||||||||||||||||||||||||
WVS Financial Corp. | 16.69 | 29.8 | 11.4 | 11.4 | 93.1 | 93.1 | 8.90 | 9.57 | 9.57 | 2.40 | ||||||||||||||||||||||||||||||
| (1) | Pro forma ratios assume an estimated pro forma fully converted value of $39.1 million at the minimum, $46.0 million at the midpoint, $52.9 million at the maximum, and $60.8 million at the adjusted maximum. |
| (2) | All public thrifts traded on a major exchange, excluding mutual holding companies and companies being acquired in announced merger transactions. |
Source: Federal Savings Bank; S&P Global Market Intelligence; Feldman Financial.
93
FELDMAN FINANCIAL ADVISORS, INC.
Table 28
Comparative Pro Forma Minority Offering Valuation Analysis
Based on Market Price Data as of February 15, 2019
| Current | Total | Price/ | Price/ | Price/ | Price/ | Price/ | Total | Tang. | Current | |||||||||||||||||||||||||||||||
| Stock | Market | LTM | Core | Book | Tang. | Total | Equity/ | Equity/ | Dividend | |||||||||||||||||||||||||||||||
| Price | Value | EPS | EPS | Value | Book | Assets | Assets | Assets | Yield | |||||||||||||||||||||||||||||||
Company | ($) | ($Mil.) | (x) | (x) | (%) | (%) | (%) | (%) | (%) | (%) | ||||||||||||||||||||||||||||||
First Seacoast Bancorp(1) | ||||||||||||||||||||||||||||||||||||||||
Pro Forma Minimum | 10.00 | 39.1 | 35.7 | 35.7 | 85.0 | 85.0 | 9.77 | 11.49 | 11.49 | 0.00 | ||||||||||||||||||||||||||||||
Pro Forma Midpoint | 10.00 | 46.0 | 41.7 | 41.7 | 94.5 | 94.5 | 11.41 | 12.07 | 12.07 | 0.00 | ||||||||||||||||||||||||||||||
Pro Forma Maximum | 10.00 | 52.9 | 47.6 | 47.6 | 103.1 | 103.1 | 13.04 | 12.65 | 12.65 | 0.00 | ||||||||||||||||||||||||||||||
Pro Forma Adj. Maximum | 10.00 | 60.8 | 55.6 | 55.6 | 112.0 | 112.0 | 14.88 | 13.30 | 13.30 | 0.00 | ||||||||||||||||||||||||||||||
Comparative Group Average | NA | 53.0 | 23.1 | 21.8 | 104.5 | 108.5 | 13.57 | 13.44 | 13.11 | 1.51 | ||||||||||||||||||||||||||||||
Comparative Group Median | NA | 44.3 | 22.2 | 20.8 | 102.8 | 106.5 | 13.09 | 11.61 | 11.61 | 1.35 | ||||||||||||||||||||||||||||||
All Public Thrift Average(2) | NA | 628.1 | 18.2 | 18.4 | 129.3 | 144.2 | 15.21 | 12.81 | 11.83 | 1.68 | ||||||||||||||||||||||||||||||
All Public Thrift Median(2) | NA | 227.9 | 15.3 | 15.2 | 119.5 | 131.6 | 14.89 | 11.67 | 10.59 | 1.48 | ||||||||||||||||||||||||||||||
Comparative Group | ||||||||||||||||||||||||||||||||||||||||
Elmira Savings Bank | 18.06 | 63.3 | 14.9 | 14.9 | 109.3 | 138.8 | 10.73 | 9.82 | 7.90 | 5.09 | ||||||||||||||||||||||||||||||
FSB Bancorp, Inc. | 17.00 | 32.5 | NM | NM | 105.5 | 105.5 | 9.89 | 9.60 | 9.60 | 0.00 | ||||||||||||||||||||||||||||||
HV Bancorp, Inc. | 15.18 | 31.9 | 39.9 | 31.7 | 109.0 | 109.0 | 10.67 | 9.79 | 9.79 | 0.00 | ||||||||||||||||||||||||||||||
IF Bancorp, Inc. | 20.51 | 69.0 | 23.3 | 24.3 | 94.5 | 94.5 | 11.17 | 11.82 | 11.82 | 1.22 | ||||||||||||||||||||||||||||||
Melrose Bancorp, Inc. | 18.90 | 44.9 | 25.5 | NA | 107.6 | 107.6 | 15.02 | 13.96 | 13.96 | 1.80 | ||||||||||||||||||||||||||||||
Mid-Southern Bancorp, Inc. | 12.70 | 42.7 | 31.0 | 31.0 | 95.1 | 95.1 | 21.30 | 24.34 | 24.34 | 0.63 | ||||||||||||||||||||||||||||||
MSB Financial Corp. | 17.90 | 93.3 | 19.9 | 19.9 | 144.7 | 144.7 | 16.50 | 11.40 | 11.40 | 0.00 | ||||||||||||||||||||||||||||||
Ottawa Bancorp, Inc. | 13.55 | 43.6 | 22.2 | 21.7 | 86.2 | 87.6 | 15.55 | 18.05 | 17.80 | 1.48 | ||||||||||||||||||||||||||||||
PB Bancorp, Inc. | 11.19 | 78.8 | 19.3 | 19.4 | 100.1 | 109.1 | 16.02 | 16.00 | 14.87 | 2.50 | ||||||||||||||||||||||||||||||
WVS Financial Corp. | 16.69 | 29.8 | 11.4 | 11.4 | 93.1 | 93.1 | 8.90 | 9.57 | 9.57 | 2.40 | ||||||||||||||||||||||||||||||
| (1) | Pro forma ratios assume a sale of 44% of the outstanding shares in a minority stock offering, issuance of 55.0% of the shares to the MHC, and the grant of 1.0% of shares to the Foundation. |
| (2) | All public thrifts traded on a major exchange, excluding mutual holding companies and companies being acquired in announced merger transactions. |
Source: Federal Savings Bank; S&P Global Market Intelligence; Feldman Financial.
94
FELDMAN FINANCIAL ADVISORS, INC.
Exhibit I
Background of Feldman Financial Advisors, Inc.
Overview of Firm
Feldman Financial Advisors provides consulting and advisory services to financial institutions and mortgage companies in the areas of corporate valuations, mergers and acquisitions, strategic planning, branch sales and purchases, developing and implementing regulatory business and capital plans, and expert witness testimony and analysis. Our senior staff members have been involved in the stock conversion process since 1982 and have valued more than 350 converting institutions.
Feldman Financial Advisors was incorporated in February 1996 by a group of consultants who were previously associated with Credit Suisse First Boston and Kaplan Associates. Each of the principals at Feldman Financial Advisors has more than 35 years experience in consulting and all were officers of their prior firm. Our senior staff collectively has worked with more than 1,000 commercial banks, savings institutions, credit unions, insurance companies, and mortgage companies nationwide. The firm’s office is located outside of Washington, D.C. in McLean, Virginia.
Background of Senior Professional Staff
Trent Feldman - President. Trent is a nationally recognized expert in providing strategic advice to and valuing service companies, and advising on mergers and acquisitions. Trent was with Kaplan Associates for 14 years and was one of three founding principals at that firm. Trent also has worked at the Federal Home Loan Bank Board and with the California legislature. Trent holds Bachelors and Masters Degrees from the University of California, Los Angeles.
Peter Williams - Principal. Peter specializes in merger and acquisition analysis,mutual-to-stock conversion valuations, corporate valuations, strategic business plans and fair value accounting analysis. Peter previously was with Kaplan Associates for 13 years. Peter also served as a Corporate Planning Analyst with the Wilmington Trust Company in Delaware. Peter holds a BA in Economics from Yale University and an MBA in Finance and Investments from George Washington University.
I-1
FELDMAN FINANCIAL ADVISORS, INC.
ExhibitII-1
Consolidated Balance Sheets
Federal Savings Bank
As of December 31, 2017 and 2018
(Dollars in Thousands)
| December 31, | ||||||||
| 2018 | 2017 | |||||||
Assets | ||||||||
Cash and due from banks | $ | 5,889 | $ | 5,650 | ||||
Interest-bearing time deposits with other banks | 6,461 | 4,969 | ||||||
Securitiesavailable-for-sale, at fair value | 39,443 | 28,894 | ||||||
Federal Home Loan Bank stock | 3,718 | 3,179 | ||||||
Loans receivable | 321,421 | 307,295 | ||||||
Less: Allowance for loan losses | 2,806 | 2,804 | ||||||
|
|
|
| |||||
Net loans | 318,615 | 304,491 | ||||||
Premises and equipment, net | 5,581 | 5,944 | ||||||
Bank-owned life insurance | 4,156 | 4,037 | ||||||
Accrued interest receivable | 1,164 | 1,078 | ||||||
Other assets | 2,085 | 1,506 | ||||||
|
|
|
| |||||
Total Assets | $ | 387,114 | $ | 359,747 | ||||
|
|
|
| |||||
Liabilities and Equity Capital | ||||||||
Deposits: | ||||||||
Non-interest bearing deposits | $ | 42,262 | $ | 38,867 | ||||
Interest-bearing deposits | 232,184 | 210,694 | ||||||
|
|
|
| |||||
Total Deposits | 274,446 | 249,561 | ||||||
Federal Home Loan Bank advances | 75,737 | 65,762 | ||||||
Repurchase agreements | — | 6,463 | ||||||
Mortgagors’ tax escrow | 761 | 968 | ||||||
Deferred compensation liability | 1,547 | 1,787 | ||||||
Other liabilities | 1,896 | 3,308 | ||||||
|
|
|
| |||||
Total Liabilities | 354,387 | 327,849 | ||||||
|
|
|
| |||||
Retained earnings | 33,192 | 32,112 | ||||||
Accumulated other comprehensive loss | (465 | ) | (214 | ) | ||||
|
|
|
| |||||
Total Equity Capital | 32,727 | 31,898 | ||||||
|
|
|
| |||||
Total Liabilities and Equity Capital | $ | 387,114 | $ | 359,747 | ||||
|
|
|
| |||||
Source: Federal Savings Bank, audited financial statements.
II-1
FELDMAN FINANCIAL ADVISORS, INC.
ExhibitII-2
Consolidated Income Statements
Federal Savings Bank
For the Years Ended December 31, 2017 and 2018
(Dollars in Thousands)
| Year Ended | ||||||||
| December 31, | ||||||||
| 2018 | 2017 | |||||||
Total interest and dividend income | $ | 14,264 | $ | 12,600 | ||||
Total interest expense | 3,145 | 1,820 | ||||||
|
|
|
| |||||
Net interest and dividend income | 11,119 | 10,780 | ||||||
Provision for loan losses | — | 160 | ||||||
|
|
|
| |||||
Net interest income after provision | 11,119 | 10,620 | ||||||
Non-interest income | ||||||||
Fees and service charges | 1,022 | 957 | ||||||
Gain on sale of loans | 32 | 82 | ||||||
Securities gains (losses), net | (1 | ) | 178 | |||||
Income from bank-owned life insurance | 119 | 115 | ||||||
Loan servicing fee income | 131 | 232 | ||||||
Investment services fees | 200 | 146 | ||||||
Other income | 46 | 105 | ||||||
|
|
|
| |||||
Totalnon-interest income | 1,550 | 1,815 | ||||||
Non-interest expense | ||||||||
Salaries and employee benefits | 6,669 | 6,338 | ||||||
Director compensation | 245 | 219 | ||||||
Occupancy and equipment expense | 1,244 | 1,267 | ||||||
Marketing | 548 | 477 | ||||||
Data processing | 1,069 | 958 | ||||||
Deposit insurance | 238 | 195 | ||||||
Professional fees | 421 | 398 | ||||||
Other expenses | 923 | 971 | ||||||
|
|
|
| |||||
Totalnon-interest expense | 11,356 | 10,822 | ||||||
Income before provision for income taxes | 1,313 | 1,613 | ||||||
Provision for income taxes | 232 | 701 | ||||||
|
|
|
| |||||
Net Income | $ | 1,081 | $ | 912 | ||||
|
|
|
| |||||
Source: Federal Savings Bank, audited financial statements.
II-2
FELDMAN FINANCIAL ADVISORS, INC.
ExhibitII-3
Loan Portfolio Composition
Federal Savings Bank
As of December 31, 2016 to 2018
(Dollars in Thousands)
| December 31, | ||||||||||||||||||||||||
| 2018 | 2017 | 2016 | ||||||||||||||||||||||
| Amount | Percent | Amount | Percent | Amount | Percent | |||||||||||||||||||
| (000s) | (%) | (000s) | (%) | (000s) | (%) | |||||||||||||||||||
One- to four-family residential | $ | 201,759 | 62.94 | $ | 188,787 | 61.59 | $ | 163,586 | 59.61 | |||||||||||||||
Commercial real estate | 63,853 | 19.92 | 55,573 | 18.13 | 56,537 | 20.60 | ||||||||||||||||||
Multi-family real estate | 4,927 | 1.54 | 5,315 | 1.73 | 5,083 | 1.85 | ||||||||||||||||||
Acquisition, development and land | 15,580 | 4.86 | 24,924 | 8.13 | 18,026 | 6.57 | ||||||||||||||||||
Commercial business | 21,990 | 6.86 | 18,589 | 6.06 | 16,206 | 5.91 | ||||||||||||||||||
Home equity lines of credit | 11,151 | 3.48 | 12,097 | 3.95 | 13,830 | 5.04 | ||||||||||||||||||
Consumer | 1,295 | 0.40 | 1,224 | 0.40 | 1,151 | 0.42 | ||||||||||||||||||
|
|
|
|
|
|
|
|
|
|
|
| |||||||||||||
Total loans | 320,555 | 100.00 | 306,509 | 100.00 | 274,419 | 100.00 | ||||||||||||||||||
|
|
|
|
|
| |||||||||||||||||||
Net deferred loan costs | 866 | 786 | 0.26 | 702 | 0.26 | |||||||||||||||||||
Allowance for loan losses | (2,806 | ) | (2,804 | ) | (2,677 | ) | ||||||||||||||||||
|
|
|
|
|
| |||||||||||||||||||
Net loans | $ | 318,615 | $ | 304,491 | $ | 272,444 | ||||||||||||||||||
|
|
|
|
|
| |||||||||||||||||||
Source: Federal Saving Bank, financial statements.
II-3
FELDMAN FINANCIAL ADVISORS, INC.
ExhibitII-4
Cash and Investments Composition
Federal Savings Bank
As of December 31, 2016 to 2018
(Dollars in Thousands)
| December 31, | ||||||||||||||||||||||||
| 2018 | 2017 | 2016 | ||||||||||||||||||||||
| Amount | Percent | Amount | Percent | Amount | Percent | |||||||||||||||||||
| (000s) | (%) | (000s) | (%) | (000s) | (%) | |||||||||||||||||||
Cash and due from banks | $ | 5,889 | 10.61 | $ | 5,650 | 13.23 | $ | 7,767 | 16.85 | |||||||||||||||
Interest-bearing time deposits | 6,461 | 11.64 | 4,969 | 11.64 | 3,726 | 8.08 | ||||||||||||||||||
|
|
|
|
|
|
|
|
|
|
|
| |||||||||||||
Total cash and liquidity | 12,350 | 22.25 | 10,619 | 24.87 | 11,493 | 24.93 | ||||||||||||||||||
| Secs.available-for-sale, at fair value: |
| |||||||||||||||||||||||
U.S. Government-sponsored enterprises obligations | 23,727 | 42.74 | 17,895 | 41.92 | 19,786 | 42.92 | ||||||||||||||||||
Residential mortgage-backed securities | 1,327 | 2.39 | 1,626 | 3.81 | — | — | ||||||||||||||||||
Municipal bonds | 14,389 | 25.92 | 9,373 | 21.95 | 12,483 | 27.08 | ||||||||||||||||||
|
|
|
|
|
|
|
|
|
|
|
| |||||||||||||
Total securitiesavailable-for-sale | 39,443 | 71.06 | 28,894 | 67.68 | 32,269 | 70.00 | ||||||||||||||||||
| Other investments: | ||||||||||||||||||||||||
Federal Home Loan Bank stock | 3,718 | 6.70 | 3,179 | 7.45 | 2,338 | 5.07 | ||||||||||||||||||
|
|
|
|
|
|
|
|
|
|
|
| |||||||||||||
Total cash and investments | $ | 55,511 | 100.00 | $ | 42,692 | 100.00 | $ | 46,099 | 100.00 | |||||||||||||||
|
|
|
|
|
|
|
|
|
|
|
| |||||||||||||
Source: Federal Savings Bank, financial statements.
II-4
FELDMAN FINANCIAL ADVISORS, INC.
ExhibitII-5
Deposit Account Composition
Federal Savings Bank
As of December 31, 2016 to 2018
(Dollars in Thousands)
| December 31, | ||||||||||||||||||||||||
| 2018 | 2017 | 2016 | ||||||||||||||||||||||
| Amount | Percent | Amount | Percent | Amount | Percent | |||||||||||||||||||
| (000s) | (%) | (000s) | (%) | (000s) | (%) | |||||||||||||||||||
Non-interest bearing accounts | $ | 42,262 | 15.40 | $ | 38,867 | 15.58 | $ | 39,619 | 16.17 | |||||||||||||||
NOW and demand deposits | 67,318 | 24.52 | 71,933 | 28.82 | 69,333 | 28.27 | ||||||||||||||||||
Money market deposits | 60,952 | 22.21 | 42,471 | 17.02 | 42,994 | 17.53 | ||||||||||||||||||
Regular/other savings deposits | 41,294 | 15.05 | 40,827 | 16.36 | 36,449 | 14.86 | ||||||||||||||||||
Certificates of deposit | 62,620 | 22.82 | 55,463 | 22.22 | 56,821 | 23.17 | ||||||||||||||||||
|
|
|
|
|
|
|
|
|
|
|
| |||||||||||||
Total Deposits | $ | 274,446 | 100.00 | $ | 249,561 | 100.00 | $ | 245,216 | 100.00 | |||||||||||||||
|
|
|
|
|
|
|
|
|
|
|
| |||||||||||||
Source: Federal Saving Bank, financial statements.
II-5
FELDMAN FINANCIAL ADVISORS, INC.
ExhibitII-6
Borrowed Funds Composition
Federal Savings Bank
As of December 31, 2016 to 2018
(Dollars in Thousands)
| At or for the Year Ended December 31, | ||||||||||||
| 2018 | 2017 | 2016 | ||||||||||
Federal Home Loan Bank advances | ||||||||||||
Balance outstanding at end of year | $ | 75,737 | $ | 65,762 | $ | 43,800 | ||||||
Weighted avg. interest rate at the end of year | 2.52 | % | 1.51 | % | 0.91 | % | ||||||
Maximum amount of borrowings outstanding at any month end during the year | $ | 78,462 | $ | 67,112 | $ | 43,800 | ||||||
Average balance outstanding during the year | 71,738 | 54,955 | 28,134 | |||||||||
Weighted avg. interest rate during the year | 2.02 | % | 1.18 | % | 1.09 | % | ||||||
Repurchase agreements | ||||||||||||
Balance outstanding at end of year | $ | — | $ | 6,463 | $ | 6,331 | ||||||
Weighted average interest rate at the end of year | — | 0.14 | % | 0.20 | % | |||||||
Maximum amount of borrowings outstanding at any month end during the year | $ | 6,093 | $ | 6,463 | $ | 10,524 | ||||||
Weighted average interest rate during the year | 0.08 | % | 0.22 | % | 0.16 | % | ||||||
Source: Federal Savings Bank, financial data.
II-6
FELDMAN FINANCIAL ADVISORS, INC.
ExhibitII-7
Office Properties
Federal Savings Bank
As of December 31, 2018
(Dollars in Thousands)
Location | Leased or Owned | Year Acquired or Leased | Net Book Value (000s) | |||||||||
Main Office | ||||||||||||
633 Central Avenue Dover, NH 03820 | Owned | 1890 | $ | 2,067 | ||||||||
Branch Offices | ||||||||||||
6 Eastern Avenue Barrington, NH 03825 | Owned | 1974 | 1,073 | |||||||||
7A Mill Road Durham, NH 03824 | Leased | 1979 | 60 | |||||||||
1650 Woodbury Avenue Portsmouth, NH 03801 | Owned | 1987 | 1,119 | |||||||||
17 Wakefield Street Rochester, NH 03867 | Owned | 2009 | 1,261 | |||||||||
Source: Federal Savings Bank, internal data.
II-7
FELDMAN FINANCIAL ADVISORS, INC.
Exhibit III
Financial and Market Data for All Public Thrifts
Company | State | Ticker | Total Assets ($mil.) | Total Equity/ Assets (%) | Tang. Equity/ Assets (%) | LTM ROA (%) | LTM ROE (%) | Closing Price 2/15/19 ($) | Total Market Value ($mil.) | Price/ LTM EPS (x) | Price/ Core EPS (x) | Price/ Book Value (%) | Price/ Tang. Book (%) | Price/ Total Assets (%) | Div. Yield (%) | |||||||||||||||||||||||||||||||||||||||||||||
All Public Thrifts(1) | ||||||||||||||||||||||||||||||||||||||||||||||||||||||||||||
Axos Financial, Inc. | CA | AX | 9,810 | 10.14 | 9.40 | 1.70 | 17.01 | 32.95 | 2,017.1 | 12.8 | NA | 203.9 | 221.7 | 20.57 | 0.00 | |||||||||||||||||||||||||||||||||||||||||||||
Bancorp 34, Inc. | NM | BCTF | 373 | 12.37 | 12.32 | 0.09 | 0.62 | 15.13 | 48.8 | NM | 31.1 | 111.6 | 112.0 | 13.80 | 0.00 | |||||||||||||||||||||||||||||||||||||||||||||
Broadway Financial Corporation | CA | BYFC | 419 | 11.45 | 11.45 | 0.03 | 0.30 | 1.30 | 23.4 | 65.0 | 39.4 | 74.2 | 74.2 | 8.50 | 0.00 | |||||||||||||||||||||||||||||||||||||||||||||
Capitol Federal Financial, Inc. | KS | CFFN | 9,304 | 14.47 | NA | 0.90 | 6.68 | 13.17 | 1,812.5 | 19.4 | 19.2 | 138.2 | 135.4 | 20.00 | 2.58 | |||||||||||||||||||||||||||||||||||||||||||||
Carver Bancorp, Inc. | NY | CARV | 590 | 8.11 | 8.11 | 0.49 | 6.36 | 3.71 | 13.7 | NM | NM | 494.2 | 494.2 | 2.52 | 0.00 | |||||||||||||||||||||||||||||||||||||||||||||
CBM Bancorp, Inc. | MD | CBMB | 217 | 27.69 | 27.69 | NA | 1.99 | 12.75 | 54.0 | NA | NA | 89.6 | 89.6 | 24.81 | 0.00 | |||||||||||||||||||||||||||||||||||||||||||||
Dime Community Bancshares | NY | DCOM | 6,321 | 9.53 | 8.72 | 0.82 | 8.44 | 20.08 | 724.7 | 14.6 | 14.8 | 120.4 | 132.6 | 11.47 | 2.79 | |||||||||||||||||||||||||||||||||||||||||||||
Eagle Financial Bancorp, Inc. | OH | EFBI | 138 | 20.11 | 20.11 | 0.41 | 1.95 | 15.65 | 23.6 | NA | NA | 91.8 | 91.8 | 18.46 | 0.00 | |||||||||||||||||||||||||||||||||||||||||||||
Elmira Savings Bank | NY | ESBK | 590 | 9.82 | 7.90 | 0.75 | 7.37 | 18.06 | 63.3 | 14.9 | 14.9 | 109.3 | 138.8 | 10.73 | 5.09 | |||||||||||||||||||||||||||||||||||||||||||||
ESSA Bancorp, Inc. | PA | ESSA | 1,863 | 9.92 | 9.18 | 0.61 | 6.21 | 16.00 | 175.9 | 15.7 | 15.2 | 102.3 | 111.5 | 10.15 | 2.50 | |||||||||||||||||||||||||||||||||||||||||||||
First Defiance Financial Corp. | OH | FDEF | 3,182 | 12.56 | 9.63 | 1.52 | 12.03 | 30.25 | 610.9 | 13.4 | 13.3 | 152.7 | 205.7 | 19.17 | 2.51 | |||||||||||||||||||||||||||||||||||||||||||||
First Northwest Bancorp | WA | FNWB | 1,259 | 13.69 | 13.69 | 0.58 | 4.10 | 15.93 | 164.2 | 23.4 | 23.6 | 103.3 | 103.3 | 14.14 | 0.75 | |||||||||||||||||||||||||||||||||||||||||||||
Flagstar Bancorp, Inc. | MI | FBC | 18,531 | 8.47 | 7.52 | 1.04 | 12.57 | 32.49 | 1,876.3 | 10.1 | NA | 119.5 | 136.0 | 10.13 | 0.49 | |||||||||||||||||||||||||||||||||||||||||||||
FS Bancorp, Inc. | WA | FSBW | 1,622 | 11.10 | 10.63 | 2.07 | 18.15 | 52.13 | 227.9 | 8.3 | 10.2 | 130.1 | 136.5 | 14.44 | 1.15 | |||||||||||||||||||||||||||||||||||||||||||||
FSB Bancorp, Inc. | NY | FSBC | 328 | 9.60 | 9.60 | 0.04 | 0.43 | 17.00 | 32.5 | NM | NM | 105.5 | 105.5 | NA | 0.00 | |||||||||||||||||||||||||||||||||||||||||||||
Hingham Institution for Savings | MA | HIFS | 2,409 | 8.83 | 8.83 | 1.32 | 14.97 | 187.20 | 399.3 | 13.5 | 12.5 | 187.8 | 187.8 | 16.58 | 0.79 | |||||||||||||||||||||||||||||||||||||||||||||
HMN Financial, Inc. | MN | HMNF | 712 | 11.67 | 11.54 | 1.14 | 9.88 | 20.25 | 92.8 | 11.8 | NA | 117.8 | 119.3 | 13.75 | 0.00 | |||||||||||||||||||||||||||||||||||||||||||||
Home Federal Bancorp, Inc. | LA | HFBL | 426 | 11.43 | 11.43 | 1.09 | 9.75 | 30.55 | 53.9 | 12.7 | 12.7 | 118.2 | 118.2 | 13.51 | 1.83 | |||||||||||||||||||||||||||||||||||||||||||||
HV Bancorp, Inc. | PA | HVBC | 321 | 9.79 | 9.79 | 0.27 | 2.48 | 15.18 | 31.9 | 39.9 | 31.7 | 109.0 | 109.0 | 10.67 | 0.00 | |||||||||||||||||||||||||||||||||||||||||||||
IF Bancorp, Inc. | IL | IROQ | 664 | 11.82 | 11.82 | 0.50 | 3.94 | 20.51 | 69.0 | 23.3 | 24.3 | 94.5 | 94.5 | 11.17 | 1.22 | |||||||||||||||||||||||||||||||||||||||||||||
Investors Bancorp, Inc. | NJ | ISBC | 26,229 | 11.46 | NA | 0.80 | 6.57 | 12.65 | 3,471.5 | 17.6 | 15.5 | 120.5 | 125.4 | 13.81 | 3.48 | |||||||||||||||||||||||||||||||||||||||||||||
Kearny Financial Corp. | NJ | KRNY | 6,702 | 17.65 | NA | 0.57 | 2.95 | 13.27 | 1,192.2 | 34.0 | 30.1 | 105.2 | 127.3 | 18.57 | 1.51 | |||||||||||||||||||||||||||||||||||||||||||||
Melrose Bancorp, Inc. | MA | MELR | 324 | 13.96 | 13.96 | 0.56 | 3.94 | 18.90 | 44.9 | 25.5 | NA | 107.6 | 107.6 | 15.02 | 1.80 | |||||||||||||||||||||||||||||||||||||||||||||
Meridian Bancorp, Inc. | MA | EBSB | 6,179 | 10.92 | 10.59 | 0.99 | 8.36 | 16.41 | 838.7 | 15.5 | 14.9 | 130.2 | 134.8 | 14.22 | 1.71 | |||||||||||||||||||||||||||||||||||||||||||||
Meta Financial Group, Inc. | SD | CASH | 6,183 | 12.47 | 6.90 | 1.26 | 11.15 | 24.96 | 983.9 | 13.1 | 9.7 | 128.2 | 247.2 | 15.92 | 0.80 | |||||||||||||||||||||||||||||||||||||||||||||
Mid-Southern Bancorp, Inc. | IN | MSVB | 201 | 24.34 | 24.34 | 0.72 | 4.28 | 12.70 | 42.7 | 31.0 | 31.0 | 95.1 | 95.1 | NA | 0.63 | |||||||||||||||||||||||||||||||||||||||||||||
MSB Financial Corp. | NJ | MSBF | 585 | 11.40 | 11.40 | 0.85 | 6.88 | 17.90 | 93.3 | 19.9 | 19.9 | 144.7 | 144.7 | 16.50 | 0.00 | |||||||||||||||||||||||||||||||||||||||||||||
New York Community Bancorp | NY | NYCB | 51,899 | 12.82 | 8.53 | 0.84 | 6.23 | 12.05 | 5,706.1 | 15.3 | NA | 92.7 | 153.5 | 11.10 | 5.64 | |||||||||||||||||||||||||||||||||||||||||||||
Northfield Bancorp, Inc. | NJ | NFBK | 4,408 | 15.12 | 14.35 | 0.95 | 6.17 | 14.62 | 718.2 | 17.2 | 17.1 | 108.9 | 115.7 | 16.46 | 2.74 | |||||||||||||||||||||||||||||||||||||||||||||
Northwest Bancshares, Inc. | PA | NWBI | 9,608 | 13.09 | 10.03 | 1.11 | 8.61 | 18.24 | 1,885.2 | 17.9 | 17.2 | 149.9 | 202.6 | 19.62 | 3.95 | |||||||||||||||||||||||||||||||||||||||||||||
Oritani Financial Corp. | NJ | ORIT | 4,090 | 12.89 | 12.89 | 1.30 | 9.70 | 17.31 | 783.7 | 14.3 | 13.6 | 147.0 | 147.0 | 18.94 | 5.78 | |||||||||||||||||||||||||||||||||||||||||||||
III-1
FELDMAN FINANCIAL ADVISORS, INC.
Exhibit III
Financial and Market Data for All Public Thrifts
Company | State | Ticker | Total Assets ($mil.) | Total Equity/ Assets (%) | Tang. Equity/ Assets (%) | LTM ROA (%) | LTM ROE (%) | Closing Price 2/15/19 ($) | Total Market Value ($mil.) | Price/ LTM EPS (x) | Price/ Core EPS (x) | Price/ Book Value (%) | Price/ Tang. Book (%) | Price/ Total Assets (%) | Div. Yield (%) | |||||||||||||||||||||||||||||||||||||||||
Ottawa Bancorp, Inc. | IL | OTTW | 293 | 18.05 | 17.80 | 0.73 | 3.67 | 13.55 | 43.6 | 22.2 | 21.7 | 86.2 | 87.6 | 15.55 | 1.48 | |||||||||||||||||||||||||||||||||||||||||
PB Bancorp, Inc. | CT | PBBI | 520 | 16.00 | 14.87 | 0.81 | 5.00 | 11.19 | 78.8 | 19.3 | 19.4 | 100.1 | 109.1 | 16.02 | 2.50 | |||||||||||||||||||||||||||||||||||||||||
PCSB Financial Corporation | NY | PCSB | 1,557 | 18.54 | 18.20 | 0.65 | 3.30 | 20.57 | 335.8 | 36.1 | 37.3 | 131.7 | 134.7 | 24.42 | 0.58 | |||||||||||||||||||||||||||||||||||||||||
Provident Financial Holdings, Inc. | CA | PROV | 1,127 | 10.88 | 10.88 | 0.60 | 5.72 | 19.60 | 147.2 | 21.5 | 21.5 | 119.9 | 119.9 | 13.05 | 2.86 | |||||||||||||||||||||||||||||||||||||||||
Provident Financial Services, Inc. | NJ | PFS | 9,726 | 13.97 | 10.11 | 1.22 | 8.93 | 27.21 | 1,818.4 | 15.0 | 15.2 | 132.8 | 191.8 | 18.56 | 3.38 | |||||||||||||||||||||||||||||||||||||||||
Prudential Bancorp, Inc. | PA | PBIP | 1,115 | 11.72 | 11.19 | 0.89 | 6.99 | 18.20 | 161.9 | 18.6 | 17.8 | 123.9 | 130.5 | 14.51 | 1.10 | |||||||||||||||||||||||||||||||||||||||||
Randolph Bancorp, Inc. | MA | RNDB | 590 | 13.25 | NA | (0.63 | ) | (4.26 | ) | 15.07 | 83.4 | NM | NM | 115.5 | NA | 15.30 | 0.00 | |||||||||||||||||||||||||||||||||||||||
Riverview Bancorp, Inc. | WA | RVSB | 1,151 | 11.13 | 8.91 | 1.41 | 13.27 | 7.40 | 167.3 | 10.4 | 10.7 | 130.6 | 167.1 | 14.53 | 2.16 | |||||||||||||||||||||||||||||||||||||||||
Severn Bancorp, Inc. | MD | SVBI | 974 | 10.11 | 10.00 | 1.01 | 9.46 | 8.36 | 106.3 | 12.5 | NA | 110.7 | 112.0 | NA | 1.44 | |||||||||||||||||||||||||||||||||||||||||
Spirit of Texas Bancshares, Inc. | TX | STXB | 1,468 | 13.54 | 11.62 | 0.90 | 7.33 | 21.94 | 265.6 | 21.1 | NA | 133.6 | 159.1 | 18.09 | 0.00 | |||||||||||||||||||||||||||||||||||||||||
Standard AVB Financial Corp. | PA | STND | 972 | 14.19 | NA | 0.90 | 6.55 | 29.80 | 138.0 | 15.9 | NA | 104.0 | 134.1 | 14.76 | 2.97 | |||||||||||||||||||||||||||||||||||||||||
Sterling Bancorp, Inc. | MI | SBT | 3,197 | 10.48 | 10.47 | 2.05 | 20.66 | 10.19 | 540.2 | 8.5 | NA | 161.2 | 161.4 | 16.90 | 0.39 | |||||||||||||||||||||||||||||||||||||||||
Territorial Bancorp Inc. | HI | TBNK | 2,069 | 11.39 | 11.39 | 0.95 | 8.15 | 28.14 | 258.3 | 13.9 | 13.9 | 115.2 | 115.2 | 13.12 | 3.13 | |||||||||||||||||||||||||||||||||||||||||
Timberland Bancorp, Inc. | WA | TSBK | 1,200 | 13.07 | 11.82 | 1.80 | 14.66 | 28.58 | 237.2 | 11.9 | 11.6 | 151.4 | 169.8 | 19.79 | 2.10 | |||||||||||||||||||||||||||||||||||||||||
Triumph Bancorp, Inc. | TX | TBK | 4,560 | 13.96 | 10.03 | 1.33 | 9.24 | 33.10 | 892.0 | 16.3 | 13.6 | 140.1 | 204.0 | 19.56 | 0.00 | |||||||||||||||||||||||||||||||||||||||||
TrustCo Bank Corp NY | NY | TRST | 4,959 | 9.88 | 9.87 | 1.25 | 13.05 | 8.22 | 794.5 | 12.9 | NA | 162.2 | 162.4 | 16.02 | 3.32 | |||||||||||||||||||||||||||||||||||||||||
United Financial Bancorp, Inc. | CT | UBNK | 7,357 | 9.69 | 8.15 | 0.84 | 8.57 | 15.46 | 782.9 | 13.2 | 13.3 | 110.9 | 134.0 | 10.74 | 3.10 | |||||||||||||||||||||||||||||||||||||||||
Waterstone Financial, Inc. | WI | WSBF | 1,915 | 20.87 | 20.84 | 1.64 | �� | 7.58 | 16.54 | 433.2 | 14.9 | 14.9 | 117.8 | 118.0 | 24.58 | 2.90 | ||||||||||||||||||||||||||||||||||||||||
Wellesley Bancorp, Inc. | MA | WEBK | 871 | 7.47 | 7.47 | 0.72 | 9.66 | 32.51 | 78.7 | 13.5 | 13.5 | 126.1 | 126.1 | 9.42 | 0.68 | |||||||||||||||||||||||||||||||||||||||||
Western New England Bancorp | MA | WNEB | 2,119 | 11.19 | 10.50 | 0.78 | 6.82 | 10.08 | 279.1 | 17.7 | 17.6 | 120.7 | 129.6 | 13.51 | 1.98 | |||||||||||||||||||||||||||||||||||||||||
WSFS Financial Corporation | DE | WSFS | 7,249 | 11.32 | NA | 1.92 | 17.63 | 42.77 | 1,341.9 | 10.2 | 12.7 | 163.5 | 222.1 | 18.51 | 1.03 | |||||||||||||||||||||||||||||||||||||||||
WVS Financial Corp. | PA | WVFC | 349 | 9.57 | 9.57 | 0.75 | 7.79 | 16.69 | 29.8 | 11.4 | 11.4 | 93.1 | 93.1 | 8.90 | 2.40 | |||||||||||||||||||||||||||||||||||||||||
Average | 4,355 | 12.81 | 11.83 | 0.92 | 7.73 | 827.69 | 628.1 | 18.2 | 18.4 | 129.3 | 144.2 | 15.21 | 1.68 | |||||||||||||||||||||||||||||||||||||||||||
Median | 1,468 | 11.67 | 10.59 | 0.87 | 7.33 | 17.16 | 227.9 | 15.3 | 15.2 | 119.5 | 131.6 | 14.89 | 1.48 | |||||||||||||||||||||||||||||||||||||||||||
| (1) | Public thrifts traded on NYSE, NYSE American, and NASDAQ; excludes companies subject to pending acquisitions or mutual holding company ownership. |
Source: S&P Global Market Intelligence; Feldman Financial.
III-2
FELDMAN FINANCIAL ADVISORS, INC.
ExhibitIV-1
Pro Forma Assumptions for Fully Converted Valuation Range
| 1. | The total amount of the net offering proceeds was fully invested at the beginning of the applicable period. |
| 2. | The net offering proceeds are invested to yield a return of 2.51%, which represented the yield on five-year U.S. Treasury securities at December 31, 2018. The effective combined federal and state income tax rate was assumed to be 23.5%, resulting in a netafter-tax yield of 1.92%. |
| 3. | It is assumed that 8.0% of the total shares of common stock to be sold in the offering will be acquired by the Bank’s employee stock ownership plan (“ESOP”). Pro forma adjustments have been made to earnings and equity to reflect the impact of the ESOP. The annual expense is estimated based on a20-year loan to the ESOP from the Company. Nore-investment is assumed on proceeds used to fund the ESOP. |
| 4. | It is assumed that that the Bank’s restricted stock plan (“RSP”) will purchase in the open market a number of shares equal to 4.0% of the total shares sold in the offering. Also, it is assumed that these shares are acquired at the initial public offering price of $10.00 per share. Pro forma adjustments have been made to earnings and equity to reflect the impact of the RSP. The annual expense is estimated based on a five-year vesting period. Nore-investment is assumed on proceeds used to fund the RSP. |
| 5. | It is assumed that an additional 10.0% of the total shares sold in the offering will be reserved for issuance by the Bank’s stock option plan. The pro forma net income has been adjusted to reflect the expense associated with the granting of options at an assumed options value of $2.65 per share. It is further assumed that options for all shares reserved under the plan were granted to plan participants at the beginning of the period and 25% werenon-qualified options for income tax purposes, the options would vest at a rate of 20% per year, and compensation expense will be recognized on a straight-line basis over the five-year vesting period |
| 6. | The fair value of stock options has been estimated at $2.65 per option using the Black-Scholes option pricing model with the following assumptions: a grant-date share price and option exercise price of $10.00; dividend yield of 0.00%; an expected option life of 10 years; a risk-free interest rate of 2.69%; and a volatility rate of 9.82% based on an index of publicly traded thrift institutions. |
| 7. | Fixed offering expenses are estimated at $1.2 million. As an additional variable component of offering expenses, sales commission expenses paid to the marketing agent equal 1.0% of the aggregate amount of stock sold in the offering. |
| 8. | No effect has been given to withdrawals from deposit accounts for the purpose of purchasing common stock in the offering. |
| 9. | No effect has been given in the pro forma equity calculation for the assumed earnings on the net proceeds. |
IV-1
FELDMAN FINANCIAL ADVISORS, INC.
ExhibitIV-2
Federal Savings Bank
Pro Forma Fully Converted Valuation Range
Historical Financial Data as of December 31, 2018
(Dollars in Thousands, Except Per Share Data)
| Minimum | Midpoint | Maximum | Adj. Max. | |||||||||||||
Total shares outstanding | 3,909,609 | 4,600,000 | 5,289,471 | 6,082,892 | ||||||||||||
Shares sold in the offering | 3,870,900 | 4,554,000 | 5,237,100 | 6,022,665 | ||||||||||||
Shares issued to charitable foundation | 38,709 | 46,000 | 52,371 | 60,227 | ||||||||||||
Offering price per share | $ | 10.00 | $ | 10.00 | $ | 10.00 | $ | 10.00 | ||||||||
|
|
|
|
|
|
|
| |||||||||
Pro forma market value | $ | 39,096 | $ | 46,000 | $ | 52,895 | $ | 60,829 | ||||||||
|
|
|
|
|
|
|
| |||||||||
Gross offering proceeds | $ | 38,709 | $ | 45,540 | $ | 52,371 | $ | 60,227 | ||||||||
Less: estimated offering expenses | (1,556 | ) | (1,619 | ) | (1,681 | ) | (1,754 | ) | ||||||||
|
|
|
|
|
|
|
| |||||||||
Net offering proceeds | 37,153 | 43,921 | 50,690 | 58,473 | ||||||||||||
Less: cash contribution to foundation | (150 | ) | (150 | ) | (150 | ) | (150 | ) | ||||||||
Less: ESOP purchase | (3,128 | ) | (3,680 | ) | (4,232 | ) | (4,866 | ) | ||||||||
Less: RSP purchase | (1,564 | ) | (1,840 | ) | (2,116 | ) | (2,433 | ) | ||||||||
|
|
|
|
|
|
|
| |||||||||
Net investable proceeds | $ | 32,311 | $ | 38,251 | $ | 44,192 | $ | 51,024 | ||||||||
|
|
|
|
|
|
|
| |||||||||
Net Income: Historical LTM ended 12/31/18 | $ | 1,081 | $ | 1,081 | $ | 1,081 | $ | 1,081 | ||||||||
Pro forma income on net proceeds | 620 | 734 | 848 | 980 | ||||||||||||
Pro forma ESOP adjustment | (120 | ) | (141 | ) | (162 | ) | (186 | ) | ||||||||
Pro forma RSP adjustment | (239 | ) | (282 | ) | (324 | ) | (372 | ) | ||||||||
Pro forma option adjustment | (195 | ) | (229 | ) | (264 | ) | (303 | ) | ||||||||
|
|
|
|
|
|
|
| |||||||||
Pro forma net income [excl. contribution] | $ | 1,147 | $ | 1,163 | $ | 1,179 | $ | 1,200 | ||||||||
|
|
|
|
|
|
|
| |||||||||
Pro forma earnings per share | $ | 0.32 | $ | 0.27 | $ | 0.24 | $ | 0.21 | ||||||||
|
|
|
|
|
|
|
| |||||||||
Core Earnings: Historical LTM ended 12/31/18 | $ | 1,081 | $ | 1,081 | $ | 1,081 | $ | 1,081 | ||||||||
Pro forma income on net proceeds | 620 | 734 | 848 | 980 | ||||||||||||
Pro forma ESOP adjustment | (120 | ) | (141 | ) | (162 | ) | (186 | ) | ||||||||
Pro forma RSP adjustment | (239 | ) | (282 | ) | (324 | ) | (372 | ) | ||||||||
Pro forma option adjustment | (195 | ) | (229 | ) | (264 | ) | (303 | ) | ||||||||
|
|
|
|
|
|
|
| |||||||||
Pro forma core earnings [excl. contribution] | $ | 1,147 | $ | 1,163 | $ | 1,179 | $ | 1,200 | ||||||||
|
|
|
|
|
|
|
| |||||||||
Pro forma core earnings per share | $ | 0.32 | $ | 0.27 | $ | 0.24 | $ | 0.21 | ||||||||
|
|
|
|
|
|
|
| |||||||||
Total Equity | $ | 32,727 | $ | 32,727 | $ | 32,727 | $ | 32,727 | ||||||||
Net offering proceeds | 37,153 | 43,921 | 50,690 | 58,473 | ||||||||||||
Plus: common stock issued to foundation | 387 | 460 | 524 | 602 | ||||||||||||
Less: charitable contribution expense, net | (411 | ) | (467 | ) | (515 | ) | (575 | ) | ||||||||
Less: ESOP purchase | (3,128 | ) | (3,680 | ) | (4,232 | ) | (4,866 | ) | ||||||||
Less: RSP purchase | (1,564 | ) | (1,840 | ) | (2,116 | ) | (2,433 | ) | ||||||||
|
|
|
|
|
|
|
| |||||||||
Pro forma total equity | $ | 65,164 | $ | 71,122 | $ | 77,077 | $ | 83,928 | ||||||||
|
|
|
|
|
|
|
| |||||||||
Pro forma book value per share | $ | 16.67 | $ | 15.46 | $ | 14.57 | $ | 13.80 | ||||||||
|
|
|
|
|
|
|
| |||||||||
Tangible Equity | $ | 32,727 | $ | 32,727 | $ | 32,727 | $ | 32,727 | ||||||||
Net offering proceeds | 37,153 | 43,921 | 50,690 | 58,473 | ||||||||||||
Plus: common stock issued to foundation | 387 | 460 | 524 | 602 | ||||||||||||
Less: charitable contribution expense,after-tax | (411 | ) | (467 | ) | (515 | ) | (575 | ) | ||||||||
Less: ESOP purchase | (3,128 | ) | (3,680 | ) | (4,232 | ) | (4,866 | ) | ||||||||
Less: RSP purchase | (1,564 | ) | (1,840 | ) | (2,116 | ) | (2,433 | ) | ||||||||
|
|
|
|
|
|
|
| |||||||||
Pro forma tangible equity | $ | 65,164 | $ | 71,122 | $ | 77,077 | $ | 83,928 | ||||||||
|
|
|
|
|
|
|
| |||||||||
Pro forma tangible book value per share | $ | 16.67 | $ | 15.46 | $ | 14.57 | $ | 13.80 | ||||||||
|
|
|
|
|
|
|
| |||||||||
Total Assets | $ | 387,114 | $ | 387,114 | $ | 387,114 | $ | 387,114 | ||||||||
Net offering proceeds | 37,153 | 43,921 | 50,690 | 58,473 | ||||||||||||
Plus: common stock issued to foundation | 387 | 460 | 524 | 602 | ||||||||||||
Less: charitable contribution expense,after-tax | (411 | ) | (467 | ) | (515 | ) | (575 | ) | ||||||||
Less: ESOP purchase | (3,128 | ) | (3,680 | ) | (4,232 | ) | (4,866 | ) | ||||||||
Less: RSP purchase | (1,564 | ) | (1,840 | ) | (2,116 | ) | (2,433 | ) | ||||||||
|
|
|
|
|
|
|
| |||||||||
Pro forma total assets | $ | 419,551 | $ | 425,509 | $ | 431,464 | $ | 438,315 | ||||||||
|
|
|
|
|
|
|
| |||||||||
Pro Forma Ratios: | ||||||||||||||||
Price / LTM EPS | 31.25x | 37.04x | 41.67x | 47.62x | ||||||||||||
Price / Core EPS | 31.25x | 37.04x | 41.67x | 47.62x | ||||||||||||
Price / Book Value | 60.00 | % | 64.68 | % | 68.63 | % | 72.46 | % | ||||||||
Price / Tangible Book Value | 60.00 | % | 64.68 | % | 68.63 | % | 72.46 | % | ||||||||
Price / Total Assets | 9.32 | % | 10.81 | % | 12.26 | % | 13.88 | % | ||||||||
Total Equity / Assets | 15.53 | % | 16.71 | % | 17.86 | % | 19.15 | % | ||||||||
Tangible Equity / Assets | 15.53 | % | 16.71 | % | 17.86 | % | 19.15 | % | ||||||||
IV-2
FELDMAN FINANCIAL ADVISORS, INC.
ExhibitIV-3
Pro Forma Fully Converted Analysis at the Maximum Valuation
Federal Savings Bank
Historical Financial Data as of December 31, 2018
Valuation Parameters | Symbol | Data | ||||
Net income — LTM | Y | $ | 1,081,000 | |||
Core earnings — LTM | Y | 1,081,000 | ||||
Net worth | B | 32,727,000 | ||||
Tangible net worth | B | 32,727,000 | ||||
Total assets | A | 387,114,000 | ||||
Expenses in conversion | X | 1,681,390 | ||||
Other proceeds not reinvested | O | 7,027,000 | ||||
ESOP purchase | E | 4,232,000 | ||||
ESOP expense(pre-tax) | F | 211,765 | ||||
RSP purchase | M | 2,116,000 | ||||
RSP expense(pre-tax) | N | 423,529 | ||||
Stock option expense(pre-tax) | Q | 280,370 | ||||
Cash contribution to foundation | C | 150,000 | ||||
Stock contribution to foundation | K | 529,000 | ||||
Option expensetax-deductible | D | 25.00% | ||||
Re-investment rate(after-tax) | R | 1.92% | ||||
Tax rate | T | 23.50% | ||||
Shares for EPS | S | 92.40% | ||||
Pro Forma Valuation Ratios at Maximum Value | ||||||
Price / LTM EPS | P/E | 41.67 | x | |||
Price / Core EPS | P/E | 41.67 | x | |||
Price / Book Value | P/B | 68.63% | ||||
Price / Tangible Book | P/TB | 68.63% | ||||
Price / Assets | P/A | 12.26% | ||||
Pro Forma Calculation at Maximum Value | Based on | |||||||||||
V | = | (P/E /S)*((Y-R*(O+X)-(F+N)*(1-T)-(Q-Q*D*T))) | = | $ | 52,900,000 | [LTM earnings] | ||||||
| 1 - (P/E / S) * R | ||||||||||||
V | = | (P/E /S)*((Y-R*(O+X)-(F+N)*(1-T)-(Q-Q*D*T))) | = | $ | 52,900,000 | [Core earnings] | ||||||
| 1 - (P/E / S) * R | ||||||||||||
V | = | P/B * (B + K - X - E - M -(C+K)*(1-T))) | = | $ | 52,900,000 | [Book value] | ||||||
| 1 -P/B | ||||||||||||
V | = | P/TB * (B + K - X - E - M -(C+K)*(1-T))) | = | $ | 52,900,000 | [Tangible book] | ||||||
| 1 -P/TB | ||||||||||||
V | = | P/A *(A + K - X - E - M -(C+K)*(1-T)) | = | $ | 52,900,000 | [Total assets] | ||||||
| 1 -P/A | ||||||||||||
Pro Forma Valuation Range | ||||||||||||||||||||||
Minimum | = | $ | 46,000,000 | x | 0.85 | = | $ | 39,100,000 | ||||||||||||||
Midpoint | = | $ | 46,000,000 | x | 1.00 | = | $ | 46,000,000 | ||||||||||||||
Maximum | = | $ | 46,000,000 | x | 1.15 | = | $ | 52,900,000 | ||||||||||||||
Adj. Max. | = | $ | 52,900,000 | x | 1.15 | = | $ | 60,835,000 | ||||||||||||||
IV3
FELDMAN FINANCIAL ADVISORS, INC.
ExhibitIV-4
Comparative Valuation Ratio Differential
Pro Forma Fully Converted Valuation
Based on Market Price Data as of February 15, 2019
| Valuation | Federal Savings | Comparative Group | All Public Thrifts (1) | |||||||||||||||||||
Ratio | Symbol | Bank | Average | Median | Average | Median | ||||||||||||||||
Price / LTM EPS | P/E | 23.1 | 22.2 | 18.2 | 15.3 | |||||||||||||||||
Minimum | (x) | 31.3 | 35.5 | % | 41.0 | % | 72.0 | % | 104.6 | % | ||||||||||||
Midpoint | 37.0 | 60.2 | % | 66.7 | % | 103.3 | % | 141.8 | % | |||||||||||||
Maximum | 41.7 | 80.5 | % | 87.8 | % | 129.1 | % | 172.5 | % | |||||||||||||
Adjusted Maximum | 47.6 | 106.1 | % | 114.4 | % | 161.5 | % | 211.1 | % | |||||||||||||
Price / Core EPS | P/E | 21.8 | 20.8 | 18.4 | 15.2 | |||||||||||||||||
Minimum | (x) | 31.3 | 43.6 | % | 50.5 | % | 70.1 | % | 105.9 | % | ||||||||||||
Midpoint | 37.0 | 69.7 | % | 77.9 | % | 101.1 | % | 143.4 | % | |||||||||||||
Maximum | 41.7 | 91.3 | % | 100.5 | % | 126.6 | % | 174.3 | % | |||||||||||||
Adjusted Maximum | 47.6 | 118.3 | % | 128.8 | % | 158.7 | % | 213.2 | % | |||||||||||||
Price / Book Value | P/B | 104.5 | 102.8 | 129.3 | 119.5 | |||||||||||||||||
Minimum | (%) | 60.0 | -42.6 | % | -41.6 | % | -53.6 | % | -49.8 | % | ||||||||||||
Midpoint | 64.7 | -38.1 | % | -37.1 | % | -50.0 | % | -45.9 | % | |||||||||||||
Maximum | 68.6 | -34.4 | % | -33.3 | % | -46.9 | % | -42.6 | % | |||||||||||||
Adjusted Maximum | 72.5 | -30.6 | % | -29.5 | % | -43.9 | % | -39.3 | % | |||||||||||||
Price / Tangible Book | P/TB | 108.5 | 106.5 | 144.2 | 131.6 | |||||||||||||||||
Minimum | (%) | 60.0 | -44.7 | % | -43.7 | % | -58.4 | % | -54.4 | % | ||||||||||||
Midpoint | 64.7 | -40.4 | % | -39.2 | % | -55.1 | % | -50.8 | % | |||||||||||||
Maximum | 68.6 | -36.8 | % | -35.6 | % | -52.4 | % | -47.9 | % | |||||||||||||
Adjusted Maximum | 72.5 | -33.2 | % | -31.9 | % | -49.7 | % | -44.9 | % | |||||||||||||
Price / Total Assets | P/A | 13.57 | 13.09 | 15.21 | 14.89 | |||||||||||||||||
Minimum | (%) | 9.32 | -31.6 | % | -29.0 | % | -38.8 | % | -37.6 | % | ||||||||||||
Midpoint | 10.81 | -20.6 | % | -17.6 | % | -28.9 | % | -27.5 | % | |||||||||||||
Maximum | 12.26 | -9.6 | % | -6.1 | % | -19.1 | % | -17.4 | % | |||||||||||||
Adjusted Maximum | 13.88 | 2.2 | % | 6.1 | % | -8.6 | % | -6.7 | % | |||||||||||||
| (1) | Excludes companies subject to mutual holding company ownership or pending acquisition. |
IV-4
FELDMAN FINANCIAL ADVISORS, INC.
ExhibitV-1
Pro Forma Assumptions for the MHC Minority Stock Offering
| 1. | The MHC will retain ownership of 55.0% of the outstanding shares of common stock of the Company. The Company will sell 44.0% of the shares in the Offering and grant 1.0% of the shares to the Bank’s charitable foundation. In addition, the charitable foundation is funded with a cash contribution of $150,000 from the net offering proceeds. |
| 2. | The MHC will be capitalized with an initial amount of $100,000 upon its formation. |
| 3. | The total amount of the net offering proceeds was fully invested at the beginning of the applicable period. |
| 4. | The net offering proceeds are invested to yield a return of 2.51%, which represented the yield on five-year U.S. Treasury securities at December 31, 2018. The effective combined federal and state income tax rate was assumed to be 23.5%, resulting in a netafter-tax yield of 1.92%. |
| 5. | It is assumed that 3.92% of the total shares of common stock to be outstanding will be acquired by the Bank’s employee stock ownership plan (“ESOP”). Pro forma adjustments have been made to earnings and equity to reflect the impact of the ESOP. The annual expense is estimated based on a20-year loan to the ESOP from the Company. Nore-investment is assumed on proceeds used to fund the ESOP. |
| 6. | It is assumed that that the Bank’s restricted stock plan (“RSP”) will purchase in the open market a number of shares equal to 1.96% of the total shares to be outstanding. Also, it is assumed that these shares are acquired at the initial public offering price of $10.00 per share. Pro forma adjustments have been made to earnings and equity to reflect the impact of the RSP. The annual expense is estimated based on a five-year vesting period. Nore-investment is assumed on proceeds used to fund the RSP. |
| 7. | It is assumed that an additional 4.90% of the total shares to be outstanding will be reserved for issuance by the Bank’s stock option plan. The pro forma net income has been adjusted to reflect the expense associated with the granting of options at an assumed options value of $2.65 per share. It is further assumed that options for all shares reserved under the plan were granted to plan participants at the beginning of the period and 25% werenon-qualified options for income tax purposes, the options would vest at a rate of 20% per year, and compensation expense will be recognized on a straight-line basis over the five-year vesting period |
| 8. | Total offering expenses are estimated to equal a fixed amount of $1.5 million at all levels of the offering range. |
| 9. | No effect has been given to withdrawals from deposit accounts for the purpose of purchasing common stock in the offering. |
| 10. | No effect has been given in the pro forma equity calculation for the assumed earnings on the net proceeds. |
V-I
FELDMAN FINANCIAL ADVISORS, INC.
ExhibitV-2
Federal Savings Bank
Pro Forma MHC Minority Offering Range
Historical Financial Data as of December 31, 2018
(Dollars in Thousands, Except Per Share Data)
| Minimum | Midpoint | Maximum | Adj. Max. | |||||||||||||
Total shares outstanding | 3,910,000 | 4,600,000 | 5,290,000 | 6,083,500 | ||||||||||||
Shares sold in the offering | 1,720,400 | 2,024,000 | 2,327,600 | 2,676,740 | ||||||||||||
Shares issued charitable to foundation | 39,100 | 46,000 | 52,900 | 60,835 | ||||||||||||
Offering price | $ | 10.00 | $ | 10.00 | $ | 10.00 | $ | 10.00 | ||||||||
|
|
|
|
|
|
|
| |||||||||
Pro forma market value | $ | 39,100 | $ | 46,000 | $ | 52,900 | $ | 60,835 | ||||||||
|
|
|
|
|
|
|
| |||||||||
Gross offering proceeds | $ | 17,204 | $ | 20,240 | $ | 23,276 | $ | 26,767 | ||||||||
Less: estimated offering expenses | (1,500 | ) | (1,500 | ) | (1,500 | ) | (1,500 | ) | ||||||||
|
|
|
|
|
|
|
| |||||||||
Net offering proceeds | 15,704 | 18,740 | 21,776 | 25,267 | ||||||||||||
Less: capitalization of MHC | (100 | ) | (100 | ) | (100 | ) | (100 | ) | ||||||||
Less: cash contribution to foundation | (150 | ) | (150 | ) | (150 | ) | (150 | ) | ||||||||
Less: ESOP purchase | (1,533 | ) | (1,803 | ) | (2,074 | ) | (2,385 | ) | ||||||||
Less: RSP purchase | (766 | ) | (902 | ) | (1,037 | ) | (1,192 | ) | ||||||||
|
|
|
|
|
|
|
| |||||||||
Net investable proceeds | $ | 13,155 | $ | 15,785 | $ | 18,415 | $ | 21,440 | ||||||||
|
|
|
|
|
|
|
| |||||||||
Net Income: Historical LTM ended 12/31/18 | $ | 1,081 | $ | 1,081 | $ | 1,081 | $ | 1,081 | ||||||||
Pro forma income on net proceeds | 253 | 303 | 354 | 412 | ||||||||||||
Pro forma ESOP adjustment | (59 | ) | (69 | ) | (79 | ) | (91 | ) | ||||||||
Pro forma RSP adjustment | (117 | ) | (138 | ) | (159 | ) | (182 | ) | ||||||||
Pro forma option adjustment | (96 | ) | (112 | ) | (129 | ) | (149 | ) | ||||||||
|
|
|
|
|
|
|
| |||||||||
Pro forma net income [excl. contribution] | $ | 1,062 | $ | 1,065 | $ | 1,068 | $ | 1,071 | ||||||||
|
|
|
|
|
|
|
| |||||||||
Pro forma earnings per share | $ | 0.28 | $ | 0.24 | $ | 0.21 | $ | 0.18 | ||||||||
|
|
|
|
|
|
|
| |||||||||
Core Earnings: Historical LTM ended 12/31/18 | $ | 1,081 | $ | 1,081 | $ | 1,081 | $ | 1,081 | ||||||||
Pro forma income on net proceeds | 253 | 303 | 354 | 412 | ||||||||||||
Pro forma ESOP adjustment | (59 | ) | (69 | ) | (79 | ) | (91 | ) | ||||||||
Pro forma RSP adjustment | (117 | ) | (138 | ) | (159 | ) | (182 | ) | ||||||||
Pro forma option adjustment | (96 | ) | (112 | ) | (129 | ) | (149 | ) | ||||||||
|
|
|
|
|
|
|
| |||||||||
Pro forma core earnings [excl. contribution] | $ | 1,062 | $ | 1,065 | $ | 1,068 | $ | 1,071 | ||||||||
|
|
|
|
|
|
|
| |||||||||
Pro forma core earnings per share | $ | 0.28 | $ | 0.24 | $ | 0.21 | $ | 0.18 | ||||||||
|
|
|
|
|
|
|
| |||||||||
Total Equity | $ | 32,727 | $ | 32,727 | $ | 32,727 | $ | 32,727 | ||||||||
Net offering proceeds | 15,704 | 18,740 | 21,776 | 25,267 | ||||||||||||
Plus: common stock issued to foundation | 391 | 460 | 529 | 608 | ||||||||||||
Less: capitalization of MHC | (100 | ) | (100 | ) | (100 | ) | (100 | ) | ||||||||
Less: charitable contribution expense,after-tax | (414 | ) | (467 | ) | (519 | ) | (580 | ) | ||||||||
Less: ESOP purchase | (1,533 | ) | (1,803 | ) | (2,074 | ) | (2,385 | ) | ||||||||
Less: RSP purchase | (766 | ) | (902 | ) | (1,037 | ) | (1,192 | ) | ||||||||
|
|
|
|
|
|
|
| |||||||||
Pro forma total equity | $ | 46,009 | $ | 48,655 | $ | 51,302 | $ | 54,345 | ||||||||
|
|
|
|
|
|
|
| |||||||||
Pro forma book value per share | $ | 11.77 | $ | 10.58 | $ | 9.70 | $ | 8.93 | ||||||||
|
|
|
|
|
|
|
| |||||||||
Tangible Equity | $ | 32,727 | $ | 32,727 | $ | 32,727 | $ | 32,727 | ||||||||
Net offering proceeds | 15,704 | 18,740 | 21,776 | 25,267 | ||||||||||||
Plus: common stock issued to foundation | 391 | 460 | 529 | 608 | ||||||||||||
Less: capitalization of MHC | (100 | ) | (100 | ) | (100 | ) | (100 | ) | ||||||||
Less: charitable contribution expense,after-tax | (414 | ) | (467 | ) | (519 | ) | (580 | ) | ||||||||
Less: ESOP purchase | (1,533 | ) | (1,803 | ) | (2,074 | ) | (2,385 | ) | ||||||||
Less: RSP purchase | (766 | ) | (902 | ) | (1,037 | ) | (1,192 | ) | ||||||||
|
|
|
|
|
|
|
| |||||||||
Pro forma tangible equity | $ | 46,009 | $ | 48,655 | $ | 51,302 | $ | 54,345 | ||||||||
|
|
|
|
|
|
|
| |||||||||
Pro forma tangible book value per share | $ | 11.77 | $ | 10.58 | $ | 9.70 | $ | 8.93 | ||||||||
|
|
|
|
|
|
|
| |||||||||
Total Assets | $ | 387,114 | $ | 387,114 | $ | 387,114 | $ | 387,114 | ||||||||
Net offering proceeds | 15,704 | 18,740 | 21,776 | 25,267 | ||||||||||||
Plus: common stock issued to foundation | 391 | 460 | 529 | 608 | ||||||||||||
Less: capitalization of MHC | (100 | ) | (100 | ) | (100 | ) | (100 | ) | ||||||||
Less: charitable contribution expense,after-tax | (414 | ) | (467 | ) | (519 | ) | (580 | ) | ||||||||
Less: ESOP purchase | (1,533 | ) | (1,803 | ) | (2,074 | ) | (2,385 | ) | ||||||||
Less: RSP purchase | (766 | ) | (902 | ) | (1,037 | ) | (1,192 | ) | ||||||||
|
|
|
|
|
|
|
| |||||||||
Pro forma total assets | $ | 400,396 | $ | 403,042 | $ | 405,689 | $ | 408,733 | ||||||||
|
|
|
|
|
|
|
| |||||||||
Pro Forma Ratios: | ||||||||||||||||
Price / LTM EPS | 35.71x | 41.67x | 47.62x | 55.56x | ||||||||||||
Price / Core EPS | 35.71x | 41.67x | 47.62x | 55.56x | ||||||||||||
Price / Book Value | 84.96 | % | 94.52 | % | 103.09 | % | 111.98 | % | ||||||||
Price / Tangible Book Value | 84.96 | % | 94.52 | % | 103.09 | % | 111.98 | % | ||||||||
Price / Total Assets | 9.77 | % | 11.41 | % | 13.04 | % | 14.88 | % | ||||||||
Total Equity / Assets | 11.49 | % | 12.07 | % | 12.65 | % | 13.30 | % | ||||||||
Tangible Equity / Assets | 11.49 | % | 12.07 | % | 12.65 | % | 13.30 | % | ||||||||
V-2