Exhibit 99.3


February 8, 2019
Board of Directors
Pioneer Bancorp, MHC
Pioneer Bancorp, Inc.
Board of Trustees
Pioneer Savings Bank
652 Albany-Shaker Road
Albany, New York 12211
Members of the Boards of Trustees and Directors:
At your request, we have completed and hereby provide an independent appraisal ("Appraisal") of the estimated pro forma market value of the common stock which is to be issued in connection with the stock issuance transaction described below.
This Appraisal is furnished pursuant to the requirements stipulated in the Code of Federal Regulations and has been prepared in accordance with the “Guidelines for Appraisal Reports for the Valuation of Savings and Loan Associations Converting from Mutual to Stock Form of Organization” (the “Valuation Guidelines”) of the Office of Thrift Supervision (“OTS”) and accepted by the Federal Reserve Board (“FRB”), the Office of the Comptroller of the Currency (“OCC”), the Federal Deposit Insurance Corporation (“FDIC”) and the New York State Department of Financial Services (the “Department”), and applicable regulatory interpretations thereof.
Description of Plan of Reorganization and Stock Offering
On January 15, 2019, the Board of Trustees Pioneer Savings Bank adopted a plan of reorganization (the “Reorganization”) pursuant to which Pioneer Savings Bank will reorganize into a two-tier mutual holding company structure. After the Reorganization, Pioneer Bancorp, Inc. (“Pioneer Bancorp” or the “Company”), a Maryland corporation, will be the mid-tier stock holding company and Pioneer Bancorp, MHC (the “MHC”), a New York chartered mutual holding company, will be the top-tier mutual holding company. The Reorganization will be completed as follows:
| (i) | Pioneer Savings Bank will organize a New York-chartered interim stock savings bank as a wholly-owned subsidiary ("Interim One"); |
| (ii) | Interim One will organize a New York-chartered interim stock savings bank as a wholly-owned subsidiary (“Interim Two”); |
| (iii) | Interim One will organize the Company as a wholly-owned subsidiary; |
| (iv) | the Bank will exchange its mutual savings bank organization certificate for a New York stock savings bank organization certificate and thereby become the Stock Bank, and Interim One will become the wholly-owned subsidiary of the Stock Bank; |
| Washington Headquarters | ||
| 4250 North Fairfax Drive | Telephone: (703) 528-1700 | |
| Suite 600 | Fax No.: (703) 528-1788 | |
| Arlington, VA 22203 | Toll-Free No.: (866) 723-0594 | |
| www.rpfinancial.com | E-Mail: mail@rpfinancial.com |
Board of Trustees
Board of Directors
February 8, 2019
Page 2
| (v) | the shares of common stock of Interim One held by the Stock Bank will be cancelled and Interim One will exchange its organization certificate for a New York organization certificate to become the MHC; |
| (vi) | concurrently with steps (iv) and (v), Interim Two will merge with and into the Stock Bank with the Stock Bank as the resulting entity and a subsidiary of the MHC, whereby all stock of the Stock Bank will be issued to the MHC in exchange for liquidation interests in the MHC; and |
| (vii) | the MHC will contribute the capital stock of the Stock Bank to the Company and the Stock Bank will become a wholly-owned subsidiary of the Company. |
For purposes of this document, Pioneer Savings Bank will hereinafter be referred to as “Pioneer Bank” or the “Bank”.
Concurrent with the Reorganization, Pioneer Bancorp will issue a majority of its common stock to the MHC and sell a minority of its common stock to the public. At the completion of the public stock offering, the Company will retain up to 50% of the net stock proceeds. The MHC will own a controlling interest in the Company of at least 51%, and the Company will be the sole subsidiary of the MHC. The Company will own 100% of the Bank’s outstanding stock. The Company’s initial activity will be ownership of its subsidiary, Pioneer Bank, investment of the net cash proceeds retained at the holding company level and extending a loan to the employee stock ownership plan.
Pioneer Bancorp will offer its common stock in a subscription offering to Eligible Account Holders, Tax-Qualified Plans including Pioneer Bank’s employee stock ownership plan (the “ESOP”), Supplemental Eligible Account Holders and Other Depositors as such terms are defined for purposes of applicable regulatory guidelines governing stock offerings by mutual institutions. To the extent that shares remain available for purchase after satisfaction of all subscriptions received in the subscription offering, the shares may be offered for sale to members of the general public in a community offering and a syndicated community offering. At least 50% of the net proceeds from the stock offering will be invested in Pioneer Bank and the balance of the net proceeds will be retained by the Company.
At this time, no other activities are contemplated for the Company other than the ownership of the Bank, funding a loan to the newly-formed ESOP and reinvestment of the proceeds that are retained by the Company. In the future, Pioneer Bancorp may acquire or organize other operating subsidiaries, diversify into other banking-related activities, pay dividends or repurchase its stock, although there are no specific plans to undertake such activities at the present time.
The Plan provides for the establishment of a new charitable foundation, Pioneer Bank Community Foundation (the “Foundation”). The Foundation’s contribution will be funded with 2.0% of the number of shares of common stock issued in the stock issuance and $250,000 of cash funded by the net proceeds retained by the Company. The purpose of the Foundation is to provide financial support to charitable organizations in the communities in which Pioneer Bank operates and to enable those communities to share in the Bank’s long-term growth. The Foundation will be dedicated completely to community activities and the promotion of charitable causes.
Board of Trustees
Board of Directors
February 8, 2019
Page 3
RP® Financial, LC.
RP® Financial, LC. (“RP Financial”) is a financial consulting firm serving the financial services industry nationwide that, among other things, specializes in financial valuations and analyses of business enterprises and securities, including the pro forma valuation for savings institutions converting from mutual-to-stock form. The background and experience of RP Financial is detailed in Exhibit V-1. We believe that, except for the fee we will receive for the Appraisal, we are independent of the Company, Pioneer Bank, the MHC and the other parties engaged by Pioneer Bank, the Company or the MHC to assist in the minority stock offering process.
Valuation Methodology
In preparing our Appraisal, we have reviewed the regulatory applications of the Company, the Bank and the MHC, including the prospectus as filed with the FRB, the FDIC, the Department and the Securities and Exchange Commission (“SEC”). We have conducted a financial analysis of the Company, Pioneer Bank and the MHC that has included a review of audited financial information for the fiscal years ended June 30, 2014 through June 30, 2018, unaudited financial statements as of and for the six months ended December 31, 2018, a review of various unaudited information and internal financial reports through December 31, 2018, and due diligence related discussions with the Bank’s management; Bonadio & Co., LLP, the Bank’s independent auditor; Luse Goreman, PC, the Bank’s counsel for the stock issuance and Sandler O’Neill & Partners, L.P., the Bank’s marketing advisor in connection with the stock offering. All assumptions and conclusions set forth in the Appraisal were reached independently from such discussions. In addition, where appropriate, we have considered information based on other available published sources that we believe are reliable. While we believe the information and data gathered from all these sources are reliable, we cannot guarantee the accuracy and completeness of such information.
We have investigated the competitive environment within which Pioneer Bank operates and have assessed Pioneer Bank’s relative strengths and weaknesses. We have kept abreast of the changing regulatory and legislative environment for financial institutions and analyzed the potential impact on Pioneer Bank and the industry as a whole. We have analyzed the potential effects of the stock offering on Pioneer Bank’s operating characteristics and financial performance as they relate to the pro forma market value of Pioneer Bancorp. We have reviewed the economic and demographic characteristics of the Bank’s primary market area. We have compared Pioneer Bank’s financial performance and condition with selected publicly-traded thrifts in accordance with the Valuation Guidelines, as well as all publicly-traded thrifts and thrift holding companies. We have reviewed the current conditions in the securities markets in general and the market for thrift stocks in particular, including the market for existing thrift issues and initial public offerings by thrifts and thrift holding companies. We have excluded from such analyses thrifts subject to announced or rumored acquisition, and/or institutions that exhibit other unusual characteristics.
The Appraisal is based on Pioneer Bank’s representation that the information contained in the regulatory applications and additional information furnished to us by Pioneer Bank and its independent auditor, legal counsel and other authorized agents are truthful, accurate and complete. We did not independently verify the financial statements and other information provided by Pioneer Bank, or its independent auditor, legal counsel and other authorized agents nor did we independently value the assets or liabilities of Pioneer Bank. The valuation considers Pioneer Bank only as a going concern and should not be considered as an indication of Pioneer Bank’s liquidation value.
Board of Trustees
Board of Directors
February 8, 2019
Page 4
Our appraised value is predicated on a continuation of the current operating environment for Pioneer Bank and for all thrifts and their holding companies. Changes in the local, state and national economy, the legislative and regulatory environment for financial institutions and mutual holding companies, the stock market, interest rates, and other external forces (such as natural disasters or significant world events) may occur from time to time, often with great unpredictability and may materially impact the value of thrift stocks as a whole or the value of Pioneer Bancorp’s stock alone. It is our understanding that there are no current plans for selling control of Pioneer Bancorp following completion of the stock offering. To the extent that such factors can be foreseen, they have been factored into our analysis.
The estimated pro forma market value is defined as the price at which Pioneer Bancorp’s common stock, immediately upon completion of the stock offering, would change hands between a willing buyer and a willing seller, neither being under any compulsion to buy or sell and both having reasonable knowledge of relevant facts.
Valuation Conclusion
Based on the foregoing, it is our opinion that, as of February 8, 2019, the estimated aggregate pro forma market value of the shares to be issued immediately following the minority stock offering, both shares issued publicly as well as to the MHC, equaled $196,428,570 at the midpoint, equal to 19,642,857 shares offered at a per share value of $10.00. Pursuant to conversion guidelines, the 15% offering range indicates a minimum value of $166,964,280 and a maximum value of $225,892,860. Based on the $10.00 per share offering price determined by the Board, this valuation range equates to total shares outstanding of 16,696,428 at the minimum and 22,589,286 at the maximum. In the event the appraised value is subject to an increase, the aggregate pro forma market value may be increased up to a super maximum value of $259,776,790 without a resolicitation. Based on the $10.00 per share offering price, the super maximum value would result in total shares outstanding of 25,977,679. The Board of Directors has established a public offering range such that the public ownership of the Company will constitute a 43.0% ownership interest prior to the issuance of shares to the Foundation. Accordingly, the offering to the public of the minority stock will equal $71,794,650 at the minimum, $84,464,290 at the midpoint, $97,133,930 at the maximum and $111,704,020 at the super maximum of the valuation range. Based on the public offering range and inclusive of the shares issued to the Foundation, equal to 2.0% of the shares issued in the stock issuance, the public ownership of shares will represent 45.0% of the shares issued throughout the valuation range.
Board of Trustees
Board of Directors
February 8, 2019
Page 5
Limiting Factors and Considerations
The valuation is not intended, and must not be construed, as a recommendation of any kind as to the advisability of purchasing shares of the common stock. Moreover, because such valuation is determined in accordance with applicable regulatory guidelines and is necessarily based upon estimates and projections of a number of matters, all of which are subject to change from time to time, no assurance can be given that persons who purchase shares of common stock in the stock offering will thereafter be able to buy or sell such shares at prices related to the foregoing valuation of the estimated pro forma market value thereof. The appraisal reflects only a valuation range as of this date for the pro forma market value of Pioneer Bancorp immediately upon issuance of the stock and does not take into account any trading activity with respect to the purchase and sale of common stock in the secondary market on the date of issuance of such securities or at anytime thereafter following the completion of the stock offering.
RP Financial’s valuation was based on the financial condition and operations of Pioneer Bank as of December 31, 2018, the date of the financial data included in the prospectus.
RP Financial is not a seller of securities within the meaning of any federal and state securities laws and any report prepared by RP Financial shall not be used as an offer or solicitation with respect to the purchase or sale of any securities. RP Financial maintains a policy which prohibits RP Financial, its principals or employees from purchasing stock of its client institutions.
This valuation will be updated as provided for in the conversion regulations and guidelines. These updates will consider, among other things, any developments or changes in the financial performance and condition of Pioneer Bank, management policies, and current conditions in the equity markets for thrift shares, both existing issues and new issues. These updates may also consider changes in other external factors which impact value including, but not limited to: various changes in the legislative and regulatory environment for financial institutions, the stock market and the market for thrift stocks, and interest rates. Should any such new developments or changes be material, in our opinion, to the valuation of the shares, appropriate adjustments to the estimated pro forma market value will be made. The reasons for any such adjustments will be explained in the update at the date of the release of the update. The valuation will also be updated at the completion of Pioneer Bancorp’s stock offering.
| Respectfully submitted, | |
| RP® FINANCIAL, LC. | |
 | |
| Marcus Faust | |
| Managing Director | |
 | |
| Gregory E. Dunn | |
| Director |
| RP® Financial, LC. | TABLE OF CONTENTS |
i
TABLE OF CONTENTS
PIONEER BANCORP, INC.
PIONEER BANK
Albany, New York
| PAGE | |||||
| DESCRIPTION | NUMBER | ||||
| CHAPTER ONE | OVERVIEW AND FINANCIAL ANALYSIS | ||||
| Introduction | I.1 | ||||
| Plan of Reorganization and Stock Offering | I.1 | ||||
| Strategic Overview | I.3 | ||||
| Balance Sheet Trends | I.6 | ||||
| Income and Expense Trends | I.9 | ||||
| Interest Rate Risk Management | I.12 | ||||
| Lending Activities and Strategy | I.13 | ||||
| Asset Quality | I.16 | ||||
| Funding Composition and Strategy | I.16 | ||||
| Subsidiary Activities | 1.17 | ||||
| Legal Proceedings | I.18 | ||||
| CHAPTER TWO | MARKET AREA | ||||
| Introduction | II.1 | ||||
| National Economic Factors | II.1 | ||||
| Market Area Demographics | II.4 | ||||
| Regional Economy | II.6 | ||||
| Unemployment Trends | II.8 | ||||
| Market Area Deposit Characteristics and Competition | II.9 | ||||
| CHAPTER THREE | PEER GROUP ANALYSIS | ||||
| Peer Group Selection | III.1 | ||||
| Financial Condition | III.5 | ||||
| Income and Expense Components | III.8 | ||||
| Loan Composition | III.11 | ||||
| Interest Rate Risk | III.11 | ||||
| Credit Risk | III.14 | ||||
| Summary | III.16 | ||||
| RP® Financial, LC. | TABLE OF CONTENTS |
ii
TABLE OF CONTENTS
PIONEER BANCORP, INC.
PIONEER BANK
Albany, New York
(continued)
| PAGE | ||||||
| DESCRIPTION | NUMBER | |||||
| CHAPTER FOUR | VALUATION ANALYSIS | |||||
| Introduction | IV.1 | |||||
| Appraisal Guidelines | IV.1 | |||||
| RP Financial Approach to the Valuation | IV.1 | |||||
| Valuation Analysis | IV.2 | |||||
| 1. | Financial Condition | IV.3 | ||||
| 2. | Profitability, Growth and Viability of Earnings | IV.4 | ||||
| 3. | Asset Growth | IV.6 | ||||
| 4. | Primary Market Area | IV.6 | ||||
| 5. | Dividends | IV.7 | ||||
| 6. | Liquidity of the Shares | IV.8 | ||||
| 7. | Marketing of the Issue | IV.9 | ||||
| A. | The Public Market | IV.9 | ||||
| B. | The New Issue Market | IV.13 | ||||
| C. | The Acquisition Market | IV.13 | ||||
| 8. | Management | IV.15 | ||||
| 9. | Effect of Government Regulation and Regulatory Reform | IV.16 | ||||
| Summary of Adjustments | IV.16 | |||||
| Valuation Approaches: Fully-Converted Basis | IV.16 | |||||
| Basis of Valuation- Fully-Converted Pricing Ratios | IV.18 | |||||
| 1. | Price-to-Earnings ("P/E") | IV.18 | ||||
| 2. | Price-to-Book ("P/B") | IV.20 | ||||
| 3. | Price-to-Assets ("P/A") | IV.22 | ||||
| Comparison to Publicly-Traded MHCs | IV.23 | |||||
| Comparison to Recent MHC Offerings | IV.25 | |||||
| Valuation Conclusion | IV.27 | |||||
| RP® Financial, LC. | LIST OF TABLES |
iii
LIST OF TABLES
PIONEER BANCORP, INC.
PIONEER BANK
Albany, New York
| TABLE | ||||
| Number | DESCRIPTION | page | ||
| 1.1 | Historical Balance Sheet Data | I.7 | ||
| 1.2 | Historical Income Statements | I.10 | ||
| 2.1 | Summary Demographic/Economic Data | II.5 | ||
| 2.2 | Primary Market Area Employment Sectors | II.7 | ||
| 2.3 | Market Area Largest Employers | II.8 | ||
| 2.4 | Unemployment Trends | II.8 | ||
| 2.5 | Deposit Summary | II.9 | ||
| 2.6 | Market Area Deposit Competitors | II.11 | ||
| 3.1 | Peer Group of Publicly-Traded Thrifts | III.3 | ||
| 3.2 | Balance Sheet Composition and Growth Rates | III.6 | ||
| 3.3 | Income as a Pct. of Avg. Assets and Yields, Costs, Spreads | III.9 | ||
| 3.4 | Loan Portfolio Composition and Related Information | III.12 | ||
| 3.5 | Interest Rate Risk Measures and Net Interest Income Volatility | III.13 | ||
| 3.6 | Credit Risk Measures and Related Information | III.15 | ||
| 4.1 | Market Area Unemployment Rates | IV.7 | ||
| 4.2 | Pricing Characteristics and After-Market Trends | IV.14 | ||
| 4.3 | Fully-Converted Pricing Versus Peer Group | IV.19 | ||
| 4.4 | MHC Market Pricing Versus Peer Group | IV.21 | ||
| 4.5 | Calculation of Implied Per Share Data- Incorporating MHC Second Step Conversion | IV.24 | ||
| 4.6 | MHC Institutions Implied Pricing Ratios, Full Conversion Basis | IV.26 |
| RP® Financial, LC. | OVERVIEW AND FINANCIAL ANALYSIS |
I.1
I. Overview and Financial Analysis
Introduction
Pioneer Savings Bank, established in 1889, is a New York-chartered savings bank headquartered in Albany, New York. Pioneer Savings Bank serves the the Capital Region of New York State, which includes Albany, Rensselaer, Saratoga, Greene, Schenectady and Warren Counties in New York and surrounding markets through 22 full-service banking offices including one which is located in its administrative office building. Pioneer Savings Bank has three wholly-owned subsidiaries, Pioneer Commercial Bank, Pioneer Financial Services, Inc., and Anchor Agency, Inc. (See Subsidiary Activities). A map of Pioneer Savings Bank’s office locations is provided in Exhibit I-1. Pioneer Savings Bank is a member of the Federal Home Loan Bank (“FHLB”) system and its deposits are insured up to the maximum allowable amount by the Federal Deposit Insurance Corporation (“FDIC”). As of December 31, 2018, the Pioneer Savings Bank had total assets of $1.287 billion, total deposits of $1.115 billion and total equity of $126.4 million equal to 9.82% of total assets. Pioneer Savings Bank’s audited financial statements are included by reference as Exhibit I-2.
Plan of Reorganization and Stock Offering
On January 15, 2019, the Board of Trustees of Pioneer Savings Bank adopted a plan of reorganization (the “Reorganization”) pursuant to which Pioneer Savings Bank will reorganize into a two-tier mutual holding company structure. After the Reorganization, Pioneer Bancorp, Inc. (“Pioneer Bancorp” or the “Company”), a Maryland corporation, will be the mid-tier stock holding company and Pioneer Bancorp, MHC (the “MHC”), a New York chartered mutual holding company, will be the top-tier mutual holding company. The Reorganization will be completed as follows:
| (i) | Pioneer Savings Bank will organize a New York-chartered interim stock savings bank as a wholly-owned subsidiary ("Interim One"); |
| (ii) | Interim One will organize a New York-chartered interim stock savings bank as a wholly-owned subsidiary (“Interim Two”); |
| (iii) | Interim One will organize the Company as a wholly-owned subsidiary; |
| (iv) | the Bank will exchange its mutual savings bank organization certificate for a New York stock savings bank organization certificate and thereby become the Stock Bank, and Interim One will become the wholly-owned subsidiary of the Stock Bank; |
| RP® Financial, LC. | OVERVIEW AND FINANCIAL ANALYSIS |
I.2
| (v) | the shares of common stock of Interim One held by the Stock Bank will be cancelled and Interim One will exchange its organization certificate for a New York organization certificate to become the MHC; |
| (vi) | concurrently with steps (iv) and (v), Interim Two will merge with and into the Stock Bank with the Stock Bank as the resulting entity and a subsidiary of the MHC, whereby all stock of the Stock Bank will be issued to the MHC in exchange for liquidation interests in the MHC; and |
| (vii) | the MHC will contribute the capital stock of the Stock Bank to the Company and the Stock Bank will become a wholly-owned subsidiary of the Company. |
For purposes of this document, Pioneer Savings Bank will hereinafter be referred to as “Pioneer Bank” or the “Bank”.
Concurrent with the Reorganization, Pioneer Bancorp will issue a majority of its common stock to the MHC and sell a minority of its common stock to the public. At the completion of the public stock offering, the Company will retain up to 50% of the net stock proceeds. The MHC will own a controlling interest in the Company of at least 51%, and the Company will be the sole subsidiary of the MHC. The Company will own 100% of the Bank’s outstanding stock. The Company’s initial activity will be ownership of its subsidiary, Pioneer Bank, investment of the net cash proceeds retained at the holding company level and extending a loan to the employee stock ownership plan.
Pioneer Bancorp will offer its common stock in a subscription offering to Eligible Account Holders, Tax-Qualified Plans including Pioneer Bank’s employee stock ownership plan (the “ESOP”), Supplemental Eligible Account Holders and Other Depositors as such terms are defined for purposes of applicable regulatory guidelines governing stock offerings by mutual institutions. To the extent that shares remain available for purchase after satisfaction of all subscriptions received in the subscription offering, the shares may be offered for sale to members of the general public in a community offering and a syndicated community offering. At least 50% of the net proceeds from the stock offering will be invested in Pioneer Bank and the balance of the net proceeds will be retained by the Company.
At this time, no other activities are contemplated for the Company other than the ownership of Pioneer Bank, a loan to the newly-formed ESOP and reinvestment of the proceeds that are retained by the Company. In the future, Pioneer Bancorp may use the proceeds it retains from the offering to invest in securities; repurchase shares of its common stock, including repurchases to fund stock-based benefit plans; to finance potential acquisition of financial institutions or financial services companies, although the Bank does not currently have any agreements regarding any specific acquisition transaction; and general corporate purposes.
| RP® Financial, LC. | OVERVIEW AND FINANCIAL ANALYSIS |
I.3
The Reorganization provides for the establishment of a new charitable foundation (the “Foundation”). The Foundation contribution will be funded with 2% of the number of shares of common stock issued in the stock issuance and $250,000 of cash funded by the net proceeds retained by the Company. The purpose of the Foundation is to provide financial support to charitable organizations in the communities in which Pioneer Bank operates and to enable those communities to share in the Bank’s long-term growth. The Foundation will be dedicated completely to community activities and the promotion of charitable causes.
Strategic Overview
Pioneer Bank maintains a local community banking emphasis, with a primary strategic objective of meeting the borrowing and deposit needs of its local customer base. Pioneer Bank’s strategic emphasis in recent years has been to provide full-service community banking products and services. Pioneer Bank is pursuing a strategy of strengthening its community bank franchise dedicated to meeting the banking needs of its business and retail customers in the communities that are served by Pioneer Bank. In recent years, growth strategies have emphasized loan growth driven by growth of commercial real estate, commercial business and 1-4 family permanent mortgage loans. In connection with the implementation of a full service community banking strategy, Pioneer Bank has invested in branches, including by acquiring two branches with $30 million of deposits in August 2016; infrastructure and personnel to manage and facilitate balance sheet growth and revenue diversification strategies.
To further diversify Pioneer Bank’s revenue streams via insurance, employee benefits and wealth management related fee income, in recent years, the Bank undertook three acquisitions. In May 2018, Pioneer Bank acquired substantially all of the operating assets of Ward Financial Management, LTD, a financial services agency to expand wealth management services. Prior to that in July 2017, Pioneer Bank acquired substantially all of the operating assets of Capital Region Strategic Employee Benefit Services LLC of Latham, New York to expand its insurance business by offering related employee benefits products and services. In July 2016, Pioneer Bank acquired Albany, New York based Anchor Agency Inc., an independent insurance agency to offer consumer and commercial insurance products.
| RP® Financial, LC. | OVERVIEW AND FINANCIAL ANALYSIS |
I.4
The Bank’s objective is to fund asset growth through deposit growth, emphasizing growth of lower cost core deposits. Core deposit growth is expected to continue to be facilitated by growth of commercial business lending relationships, pursuant to which Pioneer Bank seeks to establish a full service banking relationship with its commercial business and, to a lesser degree, commercial real estate loan customers through offering a full range of commercial loan and deposit products and services. As a complement to Pioneer Bank’s consumer and business deposit products and services, Pioneer Bank also offers municipal deposit products and thereby gathers deposits from municipalities in the Capital Region. Municipal deposits are on deposit at Pioneer Commercial Bank, a New York State Commercial Bank and wholly-owned subsidiary of Pioneer Bank (See Subsidiary Activities).
The investment portfolio provides supplemental interest income and is considered to be indicative of a low risk investment philosophy. U.S. Government and agency obligations constitute the largest concentration of the investment portfolio, followed by municipal bonds. Other investments held by the Bank include common and preferred stocks and small balances of mortgage-backed and asset-backed securities.
Deposits have consistently served as the primary funding source for Pioneer Bank, with seasonal utilization of short-term FHLB borrowings to provide additional funding during seasonal low periods of the Bank’s municipal deposit base Core deposits, consisting mostly of transaction and money market account deposits, followed by savings account deposits constitute the major portion of Pioneer Bank’s deposit base. Borrowings held by Pioneer Bank as of December 31, 2018 consisted entirely of FHLB advances totaling $30 million.
Pioneer Bank’s earnings base is largely dependent upon net interest income and operating expense levels and to a lesser degree on a combination of service charges on deposits, insurance, wealth management and other income sources. Pioneer Bank’s net interest margin has trended higher in recent years, which has been facilitated by higher yielding loan growth that has provided for a more rapid increases in the yield on earning assets compared to Pioneer Bank’s cost of funds. At the same time, non-interest operating income driven by growth of wealth management and insurance related income has been an increasing contributor to Pioneer Bank’s earnings in recent years. Containment of increases in operating expenses combined with asset growth has served to leverage the Bank’s operating expense ratio in recent years, which along growth of net interest income and non-interest operating income has translated into an improving efficiency ratio.
| RP® Financial, LC. | OVERVIEW AND FINANCIAL ANALYSIS |
I.5
The post-offering business plan of Pioneer Bank is expected to continue to focus on implementing strategic initiatives to further develop and grow its full service community banking franchise. Accordingly, Pioneer Bank will continue to be an independent full service community bank, with a commitment to meeting the consumer and commercial banking needs of individuals and businesses in the Capital region of New York.
Pioneer Bank’s Board of Trustees has elected to complete a public stock offering to sustain growth strategies and to facilitate implementation of its strategic plan. The capital realized from the stock offering will allow for additional growth of the balance sheet. The additional funds realized from the stock offering will provide an alternative funding source to deposits and borrowings in meeting the Bank’s future funding needs, which may facilitate a reduction in Pioneer Bank’s funding costs. Additionally, the Bank’s higher equity-to-assets ratio will enable the Bank to pursue additional expansion opportunities. Such expansion would most likely occur through the establishment of additional banking offices, or acquisition of branches and deposits from other financial institutions operating in the Capital Region; and the expansion of its wealth management and insurance activities through acquisition of businesses with operations in the Capital Region of New York. The Bank will also be in a better position to pursue growth through acquisition of other financial institutions following the stock offering, given its strengthened capital position. The projected uses of proceeds are highlighted below.
| · | The Company. The Company is expected to retain 50% of the net offering proceeds. At present, funds at the Company level, net of the loan to the ESOP, are expected to be primarily invested initially into liquid funds held as a deposit at Pioneer Bank. Over time, the funds may be utilized for various corporate purposes, possibly including acquisitions, infusing additional equity into Pioneer Bank, repurchases of common stock and the payment of cash dividends. |
| · | Pioneer Bank. Approximately 50% of the net conversion proceeds will be infused into Pioneer Bank. Cash proceeds (i.e., net proceeds less deposits withdrawn to fund stock purchases) infused into Pioneer Bank are anticipated to become part of general operating funds and are expected to be primarily utilized to fund loan growth over time. |
Overall, it will be the Bank’s objective to pursue controlled growth that will serve to increase returns, while continuing to emphasize management of the overall risk associated with Pioneer Bank’s operations.
| RP® Financial, LC. | OVERVIEW AND FINANCIAL ANALYSIS |
I.6
Balance Sheet Trends
Table 1.1 shows Pioneer Bank’s historical balance sheet data for the past five and one-half fiscal years. From June 30, 2014 through December 31, 2018, Pioneer Bank’s assets increased at a 10.40% annual rate. Asset growth was largely driven by loan growth, which was primarily funded by deposit growth. A summary of Pioneer Bank’s key operating ratios for the past five and one-half fiscal years is presented in Exhibit I-3.
Pioneer Bank’s loans receivable portfolio increased at an 11.55% annual rate from June 30, 2014 through December 31, 2018. The balance of loans receivable has consistently trended higher over the five and one-half years. The most significant loan growth was realized during the fiscal year ended June 30, 2017, which was primarily attributable to growth of the commercial real estate and commercial business loan portfolios. Pioneer Bank’s higher loan growth rate compared to its asset growth rate served to increase the loans-to-assets ratio from 76.29% at fiscal yearend 2014 to 79.95% at December 31, 2018.
Growth of Pioneer Bank’s loan portfolio since fiscal yearend 2014 has been primarily driven by growth of commercial business, commercial real estate loans and 1-4 family loans, while the overall composition of the loan portfolio since fiscal year end 2014 has shifted somewhat more towards higher concentrations of commercial business loans, 1-4 family permanent mortgage loans and commercial construction loans. From fiscal yearend 2014 through December 31, 2018, commercial real estate loans (non-residential and multi-family loans) decreased from 40.77% of total loans to 36.48% of total loans and commercial business loans increased from 13.90% of total loans to 17.62% of total loans. Over the same time period, the relative concentrations of 1-4 family loans increased from 26.23% of total loans to 28.98% of total loans and home equity loans and lines of credit decreased from 10.48% of total loans to 7.66% of total loans. Commercial construction loans increased from 5.72% of total loans to 7.13% of total loans over the same period, while consumer loans decreased from 2.89% of total loans to 2.13% of total loans.
The intent of Pioneer Bank’s investment policy is to provide liquidity and to generate a favorable return within the context of supporting Pioneer Bank’s overall credit and interest rate risk objectives. It is anticipated that proceeds retained at the holding company level will be invested into liquid funds held as a deposit at Pioneer Bank. Since fiscal yearend 2014, Pioneer Bank’s level of cash and investment securities (inclusive of FHLB stock) ranged from a low of 11.07% of assets at fiscal yearend 2017 to a high of 18.14% of assets at fiscal yearend 2014. As of December 31, 2018, the balance of cash and investments equaled 13.21% of total assets. U.S. government and agency securities securities totaling $83.4 million comprised the most significant component of Pioneer Bank’s investment portfolio at December 31, 2018. Other investments held by Pioneer Bank at December 31, 2018 consisted of municipal bonds ($18.9 million), preferred stocks ($6.0 million), common stocks ($2.8 million), mortgage backed securities ($1.1 million) and asset-backed securities ($144,000). As of December 31, 2018, investments maintained as as available for sale totaled $107.1 million and investments maintained as held to maturity totaled $4.3 million. Investments maintained as available-at December 31, 2018 had a net unrealized loss of $681,000. Exhibit I-4 provides historical detail of Pioneer Bank’s investment portfolio. As of December 31, 2018, Pioneer Bank also held $56.5 million of cash and cash equivalents and $2.2 million of FHLB stock.
| RP® Financial, LC. | OVERVIEW AND FINANCIAL ANALYSIS |
I.7
Table 1.1
Pioneer Bank
Historical Balance Sheet Data
| 06/30/14- 12/31/18 | ||||||||||||||||||||||||||||||||||||||||||||||||||||
| At June 30, | At December 31, | Annual. | ||||||||||||||||||||||||||||||||||||||||||||||||||
| 2014 | 2015 | 2016 | 2017 | 2018 | 2018 | Growth Rate | ||||||||||||||||||||||||||||||||||||||||||||||
| Amount | Pct(1) | Amount | Pct(1) | Amount | Pct(1) | Amount | Pct(1) | Amount | Pct(1) | Amount | Pct(1) | Pct | ||||||||||||||||||||||||||||||||||||||||
| ($000) | (%) | ($000) | (%) | ($000) | (%) | ($000) | (%) | ($000) | (%) | ($000) | (%) | (%) | ||||||||||||||||||||||||||||||||||||||||
| Total Amount of: | ||||||||||||||||||||||||||||||||||||||||||||||||||||
| Assets | $ | 824,620 | 100.00 | % | $ | 881,285 | 100.00 | % | $ | 995,918 | 100.00 | % | $ | 1,134,139 | 100.00 | % | $ | 1,284,128 | 100.00 | % | $ | 1,286,967 | 100.00 | % | 10.40 | % | ||||||||||||||||||||||||||
| Cash and cash equivalents | 58,809 | 7.13 | % | 35,141 | 3.99 | % | 34,518 | 3.47 | % | 40,261 | 3.55 | % | 120,280 | 9.37 | % | 56,456 | 4.39 | % | -0.90 | % | ||||||||||||||||||||||||||||||||
| Investment securities | 89,792 | 10.89 | % | 112,139 | 12.72 | % | 104,762 | 10.52 | % | 84,188 | 7.42 | % | 93,360 | 7.27 | % | 111,419 | 8.66 | % | 4.91 | % | ||||||||||||||||||||||||||||||||
| Loans receivable, net | 629,134 | 76.29 | % | 678,796 | 77.02 | % | 789,010 | 79.22 | % | 932,762 | 82.24 | % | 985,902 | 76.78 | % | 1,028,920 | 79.95 | % | 11.55 | % | ||||||||||||||||||||||||||||||||
| Loans held-for-sale | 576 | 0.07 | % | 1,062 | 0.12 | % | - | 0.00 | % | - | 0.00 | % | - | 0.00 | % | - | 0.00 | % | -100.00 | % | ||||||||||||||||||||||||||||||||
| FHLB stock | 958 | 0.12 | % | 986 | 0.11 | % | 1,584 | 0.16 | % | 1,149 | 0.10 | % | 883 | 0.07 | % | 2,233 | 0.17 | % | 20.69 | % | ||||||||||||||||||||||||||||||||
| Bank-owned life insurance | 17,279 | 2.10 | % | 17,423 | 1.98 | % | 17,527 | 1.76 | % | 17,601 | 1.55 | % | 17,715 | 1.38 | % | 17,780 | 1.38 | % | 0.64 | % | ||||||||||||||||||||||||||||||||
| Goodwill/Other intangibles | - | 0.00 | % | - | 0.00 | % | - | 0.00 | % | 5,740 | 0.51 | % | 10,167 | 0.79 | % | 10,005 | 0.78 | % | NM | |||||||||||||||||||||||||||||||||
| Deposits | $ | 716,487 | 86.89 | % | $ | 769,124 | 87.27 | % | $ | 864,189 | 86.77 | % | $ | 1,010,026 | 89.06 | % | $ | 1,150,262 | 89.58 | % | $ | 1,114,959 | 86.63 | % | 10.33 | % | ||||||||||||||||||||||||||
| FHLB advances and other borrowings | 1,750 | 0.21 | % | 6,758 | 0.77 | % | 17,000 | 1.71 | % | 5,000 | 0.44 | % | 0 | 0.00 | % | 30,000 | 2.33 | % | 88.04 | % | ||||||||||||||||||||||||||||||||
| Equity | $ | 93,158 | 11.30 | % | $ | 93,620 | 10.62 | % | $ | 93,610 | 9.40 | % | $ | 104,013 | 9.17 | % | $ | 118,063 | 9.19 | % | $ | 126,394 | 9.82 | % | 7.02 | % | ||||||||||||||||||||||||||
| Tangible equity | 93,158 | 11.30 | % | 93,620 | 10.62 | % | 93,610 | 9.40 | % | 98,273 | 8.66 | % | 107,896 | 8.40 | % | 116,389 | 9.03 | % | 5.07 | % | ||||||||||||||||||||||||||||||||
| Loans/Deposits | 87.81 | % | 88.26 | % | 91.30 | % | 92.35 | % | 85.71 | % | 92.28 | % | ||||||||||||||||||||||||||||||||||||||||
| Number of offices | 17 | 17 | 18 | 22 | 22 | 22 | ||||||||||||||||||||||||||||||||||||||||||||||
(1) Ratios are as a percent of ending assets.
Sources: Pioneer Bank's prospectus, audited and unaudited financial statements and RP Financial calculations.
| RP® Financial, LC. | OVERVIEW AND FINANCIAL ANALYSIS |
I.8
Pioneer Bank also maintains an investment in bank-owned life insurance (“BOLI”) policies, which cover the lives of certain current and former officers of Pioneer Bank. The life insurance policies earn tax-exempt income through cash value accumulation and death proceeds. As of December 31, 2018, the cash surrender value of Pioneer Bank’s BOLI equaled $17.8 million.
Since fiscal yearend 2014, Pioneer Bank’s funding needs have primarily been addressed through a combination of deposits and internal cash flows and to a much lesser degree borrowings. From fiscal yearend 2014 through December 31, 2018, Pioneer Bank’s deposits increased at a 10.33% annual rate. Deposits as a percent of assets remained fairly stable equaling 86.89% of assets at fiscal yearend 2014 and 86.63% of assets at December 31, 2018. Deposits growth was sustained from fiscal yearend 2014 through fiscal yearend 2018, which was followed by a slight decrease in deposits during the six months ended December 31, 2018. Deposit growth trends in recent years reflect that deposit growth has primarily consisted of core deposits and, to a lesser extent, growth in certificates of deposit (“CDs”). Core deposits comprised 88.87% of total deposits at December 31, 2018, versus 85.81% of total deposits at June 30, 2016.
Borrowings serve as an alternative funding source for Pioneer Bank to provide additional funding during seasonal low periods for the Bank’s municipal deposit base. From fiscal yearend 2014 through December 31, 2018, borrowings increased from $1.8 million or 0.21% of assets to $30.0 million or 2.33% of assets. Borrowings currently held by Pioneer Bank consist of FHLB advances.
| RP® Financial, LC. | OVERVIEW AND FINANCIAL ANALYSIS |
I.9
Pioneer Bank’s equity increased at a 7.02% annual rate from fiscal yearend 2014 through December 31, 2018, which was largely related to retention of earnings. A higher rate of asset growth relative to equity growth since fiscal yearend 2014 provided for a decrease in Pioneer Bank’s equity-to-assets ratio from 11.30% at fiscal yearend 2014 to 9.82% at December 31, 2018. Similarly, Pioneer Bank’s tangible equity-to-assets ratio decreased from 11.30% at fiscal yearend 2014 to 9.03% at December 31, 2018. Goodwill and other intangibles totaled $10.0 million or 0.78% of assets at December 31, 2018. Pioneer Bank maintained capital surpluses relative to all of its regulatory capital requirements at December 31, 2018. The addition of stock proceeds will serve to strengthen Pioneer Bank’s capital position, as well as support growth opportunities. At the same time, the increase in the pro forma capital position may initially depress the ROE.
Income and Expense Trends
Table 1.2 shows Pioneer Bank’s historical income statements for the past five fiscal years and for the twelve months ended December 31, 2018. Pioneer Bank’s reported earnings ranged from a low of $4.4 million or 0.54% of average assets for the fiscal year ended June 30, 2014 to a high of $16.8 million or 1.30% of average assets for the twelve months ended December 31, 2018. Net interest income and operating expenses represent the primary components of Pioneer Bank’s recurring earnings, while non-interest operating income has become an increasingly significant contributor to Pioneer Bank’s earnings. On a net basis, non-operating income and losses have generally not been a significant factor in Pioneer Bank’s earnings over the past five and one-half fiscal years, while loan loss provisions have had a varied impact on the Bank’s earnings over the past five and one-half fiscal years.
During the period covered in Table 1.2, Pioneer Bank’s net interest income to average assets ratio ranged from a low of 3.22% for fiscal year 2016 to a high of 3.62% for the twelve months ended December 31, 2018. The upward trend in Pioneer Bank’s net interest income ratio since 2016 was due to a more significant increase in the interest income ratio compared to interest expense ratio, which was supported by a widening of the Bank’s yield-cost spread realized through a comparatively higher increase in the yield earned on interest-earning assets relative to the increase in the Bank’s cost of funds. Overall, during the past five and one-half years, Pioneer Bank’s interest rate spread ranged from a low of 3.40% for fiscal year 2015 to a high of 3.93% for the six months ended December 31, 2018. Pioneer Bank’s net interest rate spreads, and yields and costs for the past five and one-half fiscal years are set forth in Exhibit I-3 and Exhibit I-5.
| RP® Financial, LC. | OVERVIEW AND FINANCIAL ANALYSIS |
I.10
Table 1.2
Pioneer Bank
Historical Income Statements
| For the Year Ended June 30, | For the 12 Months | |||||||||||||||||||||||||||||||||||||||||||||||
| 2014 | 2015 | 2016 | 2017 | 2018 | Ended 12/31/18 | |||||||||||||||||||||||||||||||||||||||||||
| Amount | Pct(1) | Amount | Pct(1) | Amount | Pct(1) | Amount | Pct(1) | Amount | Pct(1) | Amount | Pct(1) | |||||||||||||||||||||||||||||||||||||
| ($000) | (%) | ($000) | (%) | ($000) | (%) | ($000) | (%) | ($000) | (%) | ($000) | (%) | |||||||||||||||||||||||||||||||||||||
| Interest and dividend income | $ | 28,237 | 3.50 | % | $ | 28,805 | 3.42 | % | $ | 32,161 | 3.39 | % | $ | 37,621 | 3.48 | % | $ | 46,486 | 3.73 | % | $ | 50,536 | 3.91 | % | ||||||||||||||||||||||||
| Interest expense | (1,478 | ) | -0.18 | % | (1,314 | ) | -0.16 | % | (1,648 | ) | -0.17 | % | (2,411 | ) | -0.22 | % | (3,186 | ) | -0.26 | % | (3,758 | ) | -0.29 | % | ||||||||||||||||||||||||
| Net interest income | $ | 26,759 | 3.31 | % | $ | 27,491 | 3.26 | % | $ | 30,513 | 3.22 | % | $ | 35,210 | 3.25 | % | $ | 43,300 | 3.47 | % | $ | 46,778 | 3.62 | % | ||||||||||||||||||||||||
| Provision for loan losses | (890 | ) | -0.11 | % | (962 | ) | -0.11 | % | (1,180 | ) | -0.12 | % | (2,395 | ) | -0.22 | % | (1,970 | ) | -0.16 | % | (2,230 | ) | -0.17 | % | ||||||||||||||||||||||||
| Net interest income after provisions | $ | 25,869 | 3.20 | % | $ | 26,529 | 3.15 | % | $ | 29,333 | 3.09 | % | $ | 32,815 | 3.03 | % | $ | 41,330 | 3.31 | % | $ | 44,548 | 3.45 | % | ||||||||||||||||||||||||
| Gain on sale of loans | $ | 62 | 0.01 | % | $ | 75 | 0.01 | % | $ | 34 | 0.00 | % | $ | 0 | 0.00 | % | $ | 0 | 0.00 | % | $ | 0 | 0.00 | % | ||||||||||||||||||||||||
| Other non-intereset operating income | 7,317 | 0.91 | % | 7,024 | 0.83 | % | 7,480 | 0.79 | % | 11,167 | 1.03 | % | 12,120 | 0.97 | % | 13,270 | 1.03 | % | ||||||||||||||||||||||||||||||
| Operating expense | (27,017 | ) | -3.35 | % | (27,327 | ) | -3.24 | % | (30,272 | ) | -3.19 | % | (35,366 | ) | -3.27 | % | (36,325 | ) | -2.91 | % | (36,906 | ) | -2.86 | % | ||||||||||||||||||||||||
| Net operating income | $ | 6,231 | 0.77 | % | $ | 6,301 | 0.75 | % | $ | 6,575 | 0.69 | % | $ | 8,616 | 0.80 | % | $ | 17,125 | 1.37 | % | $ | 20,912 | 1.62 | % | ||||||||||||||||||||||||
| Non-Operating Income/(Losses) | ||||||||||||||||||||||||||||||||||||||||||||||||
| Net gain (loss) on securities | $ | 283 | 0.04 | % | $ | 317 | 0.04 | % | $ | 140 | 0.01 | % | $ | 519 | 0.05 | % | $ | 812 | 0.07 | % | $ | 10 | 0.00 | % | ||||||||||||||||||||||||
| Net gain (loss) on sale and write-down of OREO | (181 | ) | -0.02 | % | - | - | (41 | ) | 0.00 | % | - | - | - | - | (17 | ) | 0.00 | % | ||||||||||||||||||||||||||||||
| Net gain (loss) disposal of assets | (228 | ) | -0.03 | % | (18 | ) | 0.00 | % | 613 | 0.06 | % | (789 | ) | -0.07 | % | (128 | ) | -0.01 | % | 127 | 0.01 | % | ||||||||||||||||||||||||||
| Net non-operating income(loss) | ($ | 126 | ) | -0.02 | % | $ | 299 | 0.04 | % | $ | 712 | 0.08 | % | ($ | 270 | ) | -0.02 | % | $ | 684 | 0.05 | % | $ | 120 | 0.01 | % | ||||||||||||||||||||||
| Net income before tax | $ | 6,105 | 0.76 | % | $ | 6,600 | 0.78 | % | $ | 7,287 | 0.77 | % | $ | 8,346 | 0.77 | % | $ | 17,809 | 1.43 | % | $ | 21,032 | 1.63 | % | ||||||||||||||||||||||||
| Income tax provision | (1,745 | ) | -0.22 | % | (2,220 | ) | -0.26 | % | (2,289 | ) | -0.24 | % | (2,715 | ) | -0.25 | % | (6,310 | ) | -0.51 | % | (4,235 | ) | -0.33 | % | ||||||||||||||||||||||||
| Net income (loss) | $ | 4,360 | 0.54 | % | $ | 4,380 | 0.52 | % | $ | 4,998 | 0.53 | % | $ | 5,631 | 0.52 | % | $ | 11,499 | 0.92 | % | $ | 16,797 | 1.30 | % | ||||||||||||||||||||||||
| Adjusted Earnings | ||||||||||||||||||||||||||||||||||||||||||||||||
| Net income | $ | 4,360 | 0.54 | % | $ | 4,380 | 0.52 | % | $ | 4,998 | 0.53 | % | $ | 5,631 | 0.52 | % | $ | 11,499 | 0.93 | % | $ | 16,797 | 1.30 | % | ||||||||||||||||||||||||
| Add(Deduct): Non-operating income | 126 | 0.02 | % | (299 | ) | -0.04 | % | (712 | ) | -0.08 | % | 270 | 0.02 | % | (684 | ) | -0.05 | % | (120 | ) | -0.01 | % | ||||||||||||||||||||||||||
| Tax effect (2) | (33 | ) | 0.00 | % | 78 | 0.01 | % | 185 | 0.02 | % | (70 | ) | -0.01 | % | 178 | 0.01 | % | 31 | 0.00 | % | ||||||||||||||||||||||||||||
| Adjusted earnings | $ | 4,453 | 0.55 | % | $ | 4,159 | 0.49 | % | $ | 4,471 | 0.47 | % | $ | 5,831 | 0.54 | % | $ | 10,993 | 0.88 | % | $ | 16,708 | 1.29 | % | ||||||||||||||||||||||||
| Expense Coverage Ratio (3) | 0.99 | x | 1.01 | x | 1.01 | x | 0.99 | x | 1.19 | x | 1.27 | x | ||||||||||||||||||||||||||||||||||||
| Efficiency Ratio (4) | 79.20 | % | 79.02 | % | 79.55 | % | 76.40 | % | 65.54 | % | 61.51 | % | ||||||||||||||||||||||||||||||||||||
| (1) | Ratios are as a percent of average assets. |
| (2) | Assumes a 26.0% effective tax rate. |
| (3) | Expense coverage ratio calculated as net interest income before provisions for loan losses divided by operating expenses. |
| (4) | Efficiency ratio calculated as operating expenses divided by the sum of net interest income before provisions for loan losses plus non-interest operating income. |
Sources: Pioneer Bank's prospectus, audited & unaudited financial statements and RP Financial calculations.
| RP® Financial, LC. | OVERVIEW AND FINANCIAL ANALYSIS |
I.11
Loan loss provisions have had a varied impact on Pioneer Bank’s earnings over the past five and one-half fiscal years. During the period covered in Table 1.2, the amount of loan loss provisions established ranged from low of $890,000 or 0.11% of average assets for fiscal year 2014 to a high of $2.4 million or 0.22% of average assets for fiscal year 2017. For the twelve months ended December 31, 2018, the Bank reported loan loss provisions of $2.2 million or 0.17% of average assets. The increase in loss provisions established in recent years was related to a combination of loan portfolio growth, an increase in non-performing loans and an increase in net charge-offs recorded during the six months ended December 31, 2018. As of December 31, 2018, Pioneer Bank maintained loan loss allowances of $13.6 million, equal to 1.13% of total loans receivable and 115.83% of non-performing loans. Exhibit I-6 sets forth Pioneer Bank’s loan loss allowance activity for the past five and one-half fiscal years.
Non-interest operating income has become a more significant contributor to Pioneer Bank’s earnings in recent years. While bank fees and service charges continue to be the largest contributor to non-interest operating income, insurance and wealth management revenues have become a more significant source of non-interest operating income through acquisition and expansion of those businesses. Throughout the period shown in Table 1.2, non-interest operating income ranged from a from a low of $7.1 million or 0.84% of average assets for fiscal year 2015 to a high of $13.3 million or 1.03% of average assets for the twelve months ended December 31, 2018.
Operating expenses constitute the other major component of Pioneer Bank’s earnings and have decreased as a percentage of average assets in recent years, even though the Bank has been expanding off-balance sheet activities, primarily wealth management and insurance services. Overall, Pioneer Bank’s operating expense to average assets ratio has declined from a high of 3.35% during fiscal year 2014 to a low of 2.86% of average assets during the twelve months ended December 31, 2018.
Overall, during the past five and one-half years, Pioneer Bank’s expense coverage ratios (net interest income divided by operating expenses) ranged from a low of 0.99x for fiscal years 2014 and 2017 to a high of 1.27x for the twelve months ended December 31, 2018. Similarly, Pioneer Bank’s efficiency ratio (operating expenses as a percent of the sum of net interest income and other operating income) reflected an improving trend in core earnings in recent years. The Bank’s efficiency ratio remained in the range of 79% to 80% for fiscal years 2014 through 2016 and then trended lower to equal 61.51% for the twelve months ended December 31, 2018.
| RP® Financial, LC. | OVERVIEW AND FINANCIAL ANALYSIS |
I.12
On a net basis, non-operating income and losses have generally not been a significant factor in Pioneer Bank’s earnings during the period covered in Table 1.2. With the exception of fiscal years 2014 and 2017, realized securities gains and gains on the disposal of other assets more than offset losses on the sale of other real estate owned (“OREO”) and disposal of other assets. Overall, net non-operating income and losses ranged from a net loss of $270,000 or 0.02% of average assets for fiscal year 2017 to a net gain of $711,000 or 0.07% of average assets for fiscal year 2016. For the twelve months ended December 31, 2018, net non-operating income equaled $120,000 or 0.01% of average assets.
Over the past five and one-half years, Pioneer Bank’s effective tax rate ranged from a low of 20.14% during the twelve months ended December 31, 2018 to a high of 35.43% during fiscal year 2018. The relatively high effective tax rate recorded for fiscal year 2018 includes a reduction in the value of Pioneer Bank’s deferred tax assets and a corresponding charge to income tax expense of $1.2 million, as the result of the reduction in Pioneer Bank’s federal marginal tax rate from 34% to 21% in connection with the Tax Cuts and Jobs Act signed into law on December 22, 2017. As set forth in Pioneer Bank’s prospectus, Pioneer Bank’s marginal effective tax rate (state and federal) is 26.0%.
Interest Rate Risk Management
The Bank’s balance sheet is slightly liability sensitive in the short-term (less than one year). While financial institutions in general have been experiencing some interest spread compression during recent periods, due to the average yield earned on interest-earning assets declining more relative to the average rate paid on interest-bearing liabilities, the Bank has been effective in increasing its interest rate spread through increasing the overall yield earned on interest-earning assets while also maintaining a relative stable cost of funds. The increase in yield has been primarily realized through loan growth driven by growth of higher yielding types of loans. As of December 31, 2018, an analysis of the Bank’s net equity value (“NEV”) indicated that in the event of an instantaneous parallel 200 basis point increase in the yield curve NEV would decrease by 6.8%, which was within policy limits (see Exhibit I-7).
| RP® Financial, LC. | OVERVIEW AND FINANCIAL ANALYSIS |
I.13
Pioneer Bank pursues a number of strategies to manage interest rate risk, particularly with respect to seeking to limit the repricing mismatch between interest rate sensitive assets and liabilities. Pioneer Bank manages interest rate risk from the asset side of the balance sheet through emphasizing investing in short-term investment securities with terms of two years or less, maintaining most of the investment portfolio as available for sale and significant lending diversification into other types of lending beyond 1-4 family permanent mortgage loans which consist primarily of adjustable rate or shorter term fixed rate loans. As of June 30, 2018, of Pioneer Bank’s total loans due after June 30, 2019, adjustable rate loans comprised 51.3% of total loans receivable (see Exhibit I-8). On the liability side of the balance sheet, management of interest rate risk has been pursued through emphasizing growth of lower costing and less interest rate sensitive transaction, money market and savings account deposits. Transaction, money market and savings deposits comprised 88.87% of Pioneer Bank’s total deposits at December 31, 2018.
The infusion of stock proceeds will serve to further limit Pioneer Bank’s interest rate risk exposure, as most of the net proceeds will be redeployed into interest-earning assets and the increase in Pioneer Bank’s capital position will lessen the proportion of interest rate sensitive liabilities funding assets.
Lending Activities and Strategy
In recent years and pursuant to Pioneer Bank’s current strategic plan, Pioneer Bank is pursuing a diversified lending strategy emphasizing commercial business and commercial real estate loans as the primary areas of targeted loan growth. Other areas of lending for Pioneer Bank include 1-4 family permanent mortgage loans (which it purchases from a large originator in the Capital Region and uses as collateral for FHLB advances), construction loans, home equity loans and lines of credit and other consumer loans. Exhibit I-9 provides historical detail of Pioneer Bank’s loan portfolio composition for the past five and one-half years and Exhibit I-10 provides the contractual maturity of Pioneer Bank’s loan portfolio by loan type as of December 31, 2018.
| RP® Financial, LC. | OVERVIEW AND FINANCIAL ANALYSIS |
I.14
Commercial Real Estate and Multi-Family Loans. Commercial real estate and multi-family loans consist largely of loans originated by Pioneer Bank, which are generally collateralized by properties in the Capital Region of New York or otherwise involve borrowers and/or guarantors that have ties to the Capital Region. On a limited basis, Pioneer Bank supplements originations of commercial real estate and multi-family loans with purchased loan participations from other banks. Loan participations are subject to the same underwriting criteria and loan approvals as applied to loans originated by Pioneer Bank. Pioneer Bank generally originates commercial real estate and multi-family loans up to a loan-to-value (“LTV”) ratio of 80% and generally requires a minimum debt-coverage ratio of 1.20 times. Commercial real estate and multi-family loans are generally originated for amortization terms of up to 20 years. Commercial real estate and multi-family loans are generally offered as five-year adjustable rate loans with a ten year term, which are typically indexed to the 5-year FHLB of New York amortizing indications, plus a margin subject to an interest rate floor. Properties securing the commercial real estate and multi-family loan portfolio include office buildings, industrial/warehouse and manufacturing facilities, retail plazas, medical office buildings, hotels, restaurants and apartment buildings. At December 31, 2018, Pioneer Bank’s largest commercial real estate loan had an outstanding balance of $9.5 million and was secured by an office building located in the Bank’s primary market area. At December 31, 2018, this loan was performing in accordance with its original terms. At December 31, 2018, Pioneer Bank’s largest multi-family loan had an outstanding balance of $7.6 million and was secured by a property in the Bank’s primary market area. At December 31, 2018, this loan was performing in accordance with its original terms. As of December 31, 2018, Pioneer Bank’s outstanding balance of commercial real estate and multi-family loans totaled $379.5 million equal to 36.48% of total loans outstanding.
1-4 Family Residential Loans. In recent years, Pioneer Bank originated primarily fixed rate and, to a much lesser degree, adjustable rate 1-4 family permanent mortgage loans with terms of up to 30 years. On a selected basis, the Bank sold fixed rate loan originations to the secondary market with servicing retained by the Bank. In January 2016, Pioneer Bank ceased in-house originations of 1-4 family permanent mortgage loans and began purchasing 1-4 family permanent mortgage loans, including the related mortgage servicing rights, from a third- party originator based in the Capital Region. As of December 31, 2018, Pioneer Bank’s outstanding balance of 1-4 family loans totaled $279.8 million equal to 26.90% of total loans outstanding.
Home Equity Loans and Lines of Credit. Pioneer Bank’s 1-4 family lending activities include in-house originated home equity loans and lines of credit. Home equity loans are offered as fixed rate loans with terms of up to 20 years. Home equity lines of credit are indexed to the prime rate as published inThe Wall Street Journal and are offered as interest-only revolving lines of credit with a draw period of up to 10 years followed by a 15 year repayment term. Pioneer Bank will generally originate home equity loans and lines of credit up to a maximum LTV ratio of 80%, inclusive of other liens on the property. As of December 31, 2018, Pioneer Bank’s outstanding balance of home equity loans and lines of credit totaled $79.7 million equal to 7.66% of total loans outstanding.
| RP® Financial, LC. | OVERVIEW AND FINANCIAL ANALYSIS |
I.15
Construction and Land Development Loans. Construction loans originated by Pioneer Bank consist of loans to finance the construction of 1-4 family residences, commercial real estate properties and multi-family properties. Pioneer Bank also originates loans on unimproved land for purposes of development. Construction and land development loans are generally structured as 12 to 24 month interest-only loans with a floating interest rate based on the prime rate as published inThe Wall Street Journal orLIBOR. At the end of the construction phase, the loan generally converts to a permanent commercial real estate mortgage loan or the loan may be payable in full. However, the Bank’s construction loans for the construction of one- to four-family residential developments do not convert to permanent residential real estate loans. Construction loans are generally offered up to a maximum LTV ratio of 75% of the appraised value on a completed basis or the cost of completion, whichever is less. Land development loans on raw land and on improved lots are generally offered up to a maximum LTV ratio of 75%. As of December 31, 2018, Pioneer Bank’s outstanding balance of commercial construction loans totaled $95.8 million equal to 9.21% of total loans outstanding.
Commercial Business Loans. The commercial business loan portfolio is generated through extending loans to businesses operating in the Capital Region of New York. Expansion of commercial business lending activities continues to be a desired area of loan growth for Pioneer Bank, pursuant to which the Bank establishes full servicing banking relationship with its commercial loan customers through offering a full range of commercial loan products that are packaged with lower cost commercial deposit products. Pioneer Bank offers a variety of secured and unsecured commercial business loans that include term loans for equipment financing and business acquisitions, working capital loans, inventory financing and revolving lines of credit. Fixed rate loans are offered for terms of up to ten years and are fully amortizing. Revolving lines of credit are generally extended as floating rate loans indexed toThe Wall Street Journal prime rate or LIBOR. Fixed rate loans are priced based on a spread above the comparable term FHLB Amortizing Advance rate. Fixed rate loans may also be converted to a variable rate through the use of interest rate derivative products (i.e. “swaps”). Swaps are priced on a loan by loan basis. As of December 31, 2018, Pioneer Bank’s outstanding balance of commercial business loans totaled $183.3 million equal to 17.62% of total loans outstanding.
| RP® Financial, LC. | OVERVIEW AND FINANCIAL ANALYSIS |
I.16
Other Consumer Loans. Consumer loans and lines of credit have been a somewhat limited area of lending diversification for Pioneer Bank, with such loans consisting primarily of unsecured personal loans and personal loans secured by investment and deposit accounts and, to a lesser extent, loans on automobiles and overdraft accounts. As of December 31, 2018, Pioneer Bank’s outstanding balance of other consumer loans totaled $22.1 million equal to 2.13% of total loans outstanding.
Asset Quality
Historically, Pioneer Bank’s lending emphasis on lending in local and familiar markets generally supported maintenance of relatively favorable credit quality measures. Over the past five and one-half years, Pioneer Bank’s balance of non-performing assets has been relatively steady, ranging from a high of $11.8 million or 0.92% of assets at December 31, 2018 to a low of $6.3 million or 0.63% of assets at fiscal yearend 2016. As shown in Exhibit I-11, non-performing assets at December 31, 2018 consisted of $8.4 million of non-accruing loans, $3.3 million of accruing loans past due 90 days or more and $55,000 of OREO.
To track Pioneer Bank’s asset quality and the adequacy of valuation allowances, Pioneer Bank has established detailed asset classification policies and procedures. Classified assets are reviewed monthly by senior management and the Board. Pursuant to these procedures, when needed, Pioneer Bank establishes additional valuation allowances to cover anticipated losses in classified or non-classified assets. As of December 31, 2018, Pioneer Bank maintained loan loss allowances of $13.6 million equal to 1.31% of total loans receivable and 115.83% of non-performing loans.
Funding Composition and Strategy
Deposits have consistently served as Pioneer Bank’s primary funding source and at December 31, 2018, deposits accounted for 97.38% of Pioneer Bank’s combined balance of deposits and borrowings. Exhibit I-12 sets forth Pioneer Bank’s deposit composition for the past three and one-half fiscal years. Transaction, savings and money market deposits constituted 88.87% of total deposits at December 31, 2018, as compared to 85.81% of total deposits at June 30, 2016. The increase in the concentration of core deposits comprising total deposits since fiscal yearend 2016 was realized through comparatively stronger growth of core deposits relative to growth of CDs. Since fiscal yearend 2016, non-interest-bearing demand accounts and money market accounts have been the largest sources of core deposit growth for Pioneer Bank and also comprise the two largest concentrations of Pioneer Bank’s core deposits. As of December 31, 2018, non-interest-bearing demand accounts and money market accounts totaled $653.2 million or 65.92% of core deposits.
| RP® Financial, LC. | OVERVIEW AND FINANCIAL ANALYSIS |
I.17
The balance of Pioneer Bank’s deposits consists of CDs, which equaled $124.1 million or 11.13% of total deposits at December 31, 2018 compared to $122.6 million or 14.19% of total deposits at fiscal yearend 2016. As of December 31, 2018, jumbo CDs (CD accounts with balances of $100,000 or more) amounted to $53.9 million or 43.44% of total CDs and $23.1 million or 42.79% of the jumbo CDs were schedules to mature in one year or less. Exhibit I-13 sets forth the maturity schedule of Pioneer Bank’s jumbo CDs as of December 31, 2018.
Borrowings serve as an alternative funding source for Pioneer Bank to facilitate management of funding costs and interest rate risk Borrowings totaled $30.0 million at December 31, 2018 and consisted of FHLB advances. The FHLB advances had a weighted average interest rate of 2.67% during the six months ended December 31, 2018. Exhibit I-14 provides further detail of Pioneer Bank’s borrowings activities during the past three and one-half fiscal years.
Subsidiary Activities
Pioneer Bank currently has three wholly-owned subsidiaries: Pioneer Financial Services, Inc., Anchor Agency, Inc. and Pioneer Commercial Bank.
Pioneer Financial Services, Inc. Pioneer Financial Services, Inc., a New York Corporation and wholly owned subsidiary of Pioneer Bank, provides wealth management services to Pioneer Bank’s customers in partnership with LPL Financial, a registered broker dealer. It had $481.5 million of assets under management at December 31, 2018. Pioneer Financial Services, Inc. operates under the name Pioneer Wealth Management out of Pioneer Bank’s headquarters in Albany, New York, and has licensed representatives available in the Bank’s branch offices. Wealth management services provided by Pioneer Financial Services, Inc. to customers include investment advice, retirement income planning, estate planning, business succession and employer retirement planning.
| RP® Financial, LC. | OVERVIEW AND FINANCIAL ANALYSIS |
I.18
Anchor Agency, Inc. On July 1, 2016, Pioneer Bank completed the acquisition of Anchor Agency, Inc. Anchor Agency, Inc., a New York corporation and wholly-owned subsidiary of Pioneer Bank, is a full-service insurance agency offering personal and commercial insurance, including homeowners, automobile and comprehensive business insurance. Anchor Agency, Inc. works with major national insurance companies, as well as specialty markets. Anchor Agency, Inc. also offers employee benefits products and consulting services under the name Pioneer Benefits Consulting, including group health, dental, disability and life insurance products and human resource management services. Anchor Agency, Inc. operates out of Pioneer Bank’s headquarters in Albany, New York. The expansion into the insurance and employee benefit services business has enabled Pioneer Bank to evolve from a traditional depository institution into a full-service financial services organization.
Pioneer Commercial Bank. Pioneer Commercial Bank is a New York-chartered limited purpose commercial bank. Pioneer Bank incorporated Pioneer Commercial Bank in October 2004 in order to hold municipal deposits. New York State prohibits a savings bank from soliciting and servicing public funds (deposits of counties, cities, towns, school districts, etc.). The use of a limited-purpose commercial bank subsidiary has facilitated the expansion of municipal deposit banking services throughout the service area of Pioneer Bank. At December 31, 2018, Pioneer Commercial Bank held $239.2 million in assets, consisting primarily of cash and municipal obligations. All disclosures in this prospectus relating to Pioneer Bank’s consolidated investments and deposits include the investments and deposits that are held by Pioneer Commercial Bank.
Legal Proceedings
Pioneer Bank is not currently party to any pending legal proceedings that Pioneer Bank’s management believes would have a material adverse effect on Pioneer Bank’s financial condition, results of operations or cash flows.
| RP® Financial, LC. | MARKET AREA |
| II.1 |
II. MARKET AREA
Introduction
Pioneer Bank is headquartered in Albany, New York and currently serves the Albany-Schenectady-Troy metropolitan area (“Albany MSA”) through 22 full-service banking offices. The Bank maintains branch locations in the counties of Albany (9), Rensselaer (4), Saratoga (4), Schenectady (2), Greene (2) and Warren (1). Details regarding the Bank’s office properties are set forth in Exhibit II-1.
With operations in a metropolitan area, the Bank’s competitive environment includes a significant number of commercial banks and other financial services companies, some of which have a regional or national presence and are larger than the Bank in terms of deposits, loans, scope of operations, and number of branches. These institutions also have greater resources at their disposal than the Bank. The Albany MSA has a highly developed economy, with a relatively high concentration of skilled workers.
Future growth opportunities for Pioneer Bank depend on the future growth and stability of the local and regional economy, demographic growth trends and the nature and intensity of the competitive environment. These factors have been briefly examined to help determine the growth potential that exists for the Bank, the relative economic health of the Bank’s market area, and the resultant impact on value.
National Economic Factors
The future success of the Bank’s operations is partially dependent upon various national and local economic trends. In assessing national economic trends over the past few quarters, The July 2018 unemployment rate fell to 3.9%, with the U.S. economy adding 157,000 jobs in July which was less than expected. Manufacturing and service sector activity for July expanded at slower rates, with respective readings of 58.1 and 55.7. July retail sales showed a healthy 0.5% increase, while July U.S. housing starts increased 0.9%. Comparatively, July sales of existing and new homes declined by 0.7% and 1.7%, respectively. The pace of manufacturing activity for August accelerated to a 14-year high, with an index reading of 61.3. Similarly, August service sector expanded at a higher rate, based on an index reading of 58.5. The U.S. economy added 201,000 jobs in August, which was more than expected, and the August unemployment rate held steady at 3.9%. Existing home sales for August were unchanged from the prior month, while new home sales bounced back in August increasing 3.5% compared to July. Manufacturing activity for September expanded at a slower rate with an index reading of 59.8, while September service sector activity accelerated to a 10-year high index reading of 61.6. The September unemployment rate for the U.S. fell to a new generational low of 3.7%, which was the lowest unemployment rate since December 1969. The U.S. economy added 134,000 jobs during September. However, notwithstanding the robust economic data, the housing market continued to languish. September existing home sales declined 3.4%, while September new home sales declined 5.5% and stood at their lowest level in nearly two years. Third quarter GDP increased at an annual rate of 3.5% (subsequently revised to 3.4%), which exceeded expectations.
| RP® Financial, LC. | MARKET AREA |
| II.2 |
Manufacturing and service sector activity for October 2018 expanded at slower rates, with respective readings of 57.7 and 60.3. U.S. employers added 250,000 jobs in October and the October unemployment rate held steady at 3.7%. October retail sales increased 0.8% and, after six straight months of declines, existing home sales for October increased 1.4%. Comparatively, new home sales for October fell 8.9% and October pending home sales declined by 2.6%. November manufacturing activity accelerated to an index reading of 59.3, while service sector activity for November increased to an index reading of 60.7. The U.S. economy added 155,000 jobs in November, while the November unemployment rate held steady at 3.7%. November existing and new home sales increased by1.9% and 16.9%, respectively. Manufacturing activity slowed in December to a reading of 54.1, which was the largest one month drop since the end of 2008. Service sector activity for December edged lower to an index reading of 58.0. The U.S. economy added 312,000 jobs in December, which beat economists’ expectations. The December unemployment rate edged up to 3.9%, as more people entered the labor force. Existing home sales for December fell 6.4%, which was the weakest level since 2015. For all of 2018, existing home sales were the lowest report in three years.
The U.S. economy added 304,000 jobs in January 2019, which exceeded expectations, and the January unemployment rate increased to 4.0% as more people entered the labor force. Manufacturing activity accelerated in January with an index reading of 56.6, while service activity declined for a second consecutive month with an index reading of 56.7.
In terms of interest rates trends over the past few quarters, the 10-year Treasury yield stabilized around 2.85% during the first half of July 2018, with June consumer price data showing U.S. inflation hitting its highest rate in more than six years. In late-July, Treasury yields surged higher as investors dumped government bonds in favor of stocks amid strong second quarter earnings results and signs of U.S. economic growth accelerating. The Federal Reserve concluded its early-August policy meeting keeping its target interest rate unchanged as expected and gave an upbeat assessment of the economy, suggesting another rate increase was likely at its next meeting. The outcome of the Federal Reserve meeting and news of rising federal budget deficits helped to push the 10-year Treasury yield up to 3.0% following the Federal Reserve meeting. For the balance of August, the 10-year Treasury yield edged down to slightly below 3.0%. The favorable employment report for August helped to push the 10-year Treasury yield back above 3.0% in mid-September, as the benchmark rate approached a seven-year high. Long-term Treasury yields stabilized through the end of September, as the Federal Reserve concluded its late-September policy meeting voting to lift interest rates by another quarter point and signaled they would continue to implement a path of gradual rate hikes.
| RP® Financial, LC. | MARKET AREA |
| II.3 |
Long-term Treasury yields hit fresh highs in early-October 2018, as robust economic data and an easing of trade tensions across North America sparked fresh optimism about the global growth outlook. After climbing up to 3.23% with the release of the September employment report, the 10-year Treasury yield edged lower through the end of October and then bounced higher in early-November. The October employment report, which showed that U.S. wages grew at the fastest rate since April 2009, was the primary catalyst that drove Treasury yields higher. The Federal Reserve held rates steady at its early-November policy meeting and suggested another rate increase was likely by the end of the year. Following the Federal Reserve meeting, long-term Treasury yields drifted lower into late-November. The downward trend in long-term Treasury yields continued into December, as doubts over the U.S.-China trade truce renewed concerns about the pace of economic growth. Treasury yields further declined after the Federal Reserve’s mid-December policy meeting concluded with a 0.25% rate increase to its target rate to a range between 2.25% and 2.5%, as investors gravitated toward safe-haven investments in the closing weeks of 2018 amid significant volatility in the stock market.
Long-term Treasury yields continued to edge lower at the start of 2019, as an index reading for manufacturing activity in December posted its largest one month decline since the end of 2008. Stronger-than-expected job growth reported for December served to reverse the downward trend in long-term Treasury yields at the end of the first week of 2019, which was followed by interest rates stabilizing through late-January. Long-term Treasury yields edged lower at the end of January after the Federal Reserve concluded its policy meeting electing to hold their benchmark rate steady and indicated that it was done raising rates for now. As of February 8, 2019, the bond equivalent yields for U.S. Treasury bonds with terms of one and ten years equaled 2.54% and 2.63%, respectively, versus comparable year ago yields of 1.91% and 2.85%. Exhibit II-2 provides historical interest rate trends.
| RP® Financial, LC. | MARKET AREA |
| II.4 |
Based on the consensus outlook of economists surveyed by The Wall Street Journal in January 2019, GDP growth was projected to decrease to 2.2% in 2019. The unemployment rate was forecasted to equal 3.6% in June 2019 and in December 2019. An average of 157,000 jobs were projected to be added per month during 2019. On average, the economists forecasted an increase in the federal funds rate to 2.59% in June 2019 and to 2.75% in December 2019. On average, the economists forecasted that the 10-year Treasury yield would increase to 2.96% in June 2019 and increase to 3.10% by the end of 2019. The surveyed economists also forecasted home prices would rise 3.8% in 2019 and housing starts were forecasted to increase slightly in 2019.
The January 2019 mortgage finance forecast from the Mortgage Bankers Association (the “MBA”) was for 2019 existing home sales to increase by 3.4% from 2018 sales and new home sales were forecasted to increase by 3.8% in 2019 from sales in 2018. The 2019 median sale prices for new and existing homes were forecasted to increase by 2.6% and 4.9%, respectively. Total mortgage production was forecasted to decline in 2019 to $1.613 trillion, compared to $1.643 trillion in 2018. The forecasted decrease in 2019 originations was based on a 4.0% increase in purchase volume and a 16.8% decrease in refinancing volume. Purchase mortgage originations were forecasted to total $1.232 trillion in 2019, versus refinancing volume totaling $381 billion. Housing starts for 2019 were projected to increase by 2.0% to total 1.285 million.
Market Area Demographics
Demographic and economic growth trends, measured by changes in population, number of households, age distribution and median household income, provide key insight into the health of the market area served by Pioneer Bank. Demographic data for the primary market area counties, as well as for New York, and the U.S., is provided in Table 2.1.
Population data indicates growth trends for the primary market area counties have been somewhat varied over the past five years. For the 2014 to 2019 period, Saratoga County and Albany County recorded the strongest population growth rates with annual growth rates of 0.8% and 0.3%, respectively. Comparatively, Green and Warren Counties experienced population shrinkage over the five year period. Five year population growth rates for the U.S. and New York equaled 0.7% and 0.2%, respectively.
| RP® Financial, LC. | MARKET AREA |
| II.5 |
Table 2.1
Pioneer Bank
Summary Demographic/Economic Data
| Year | Growth Rate | |||||||||||||||||||
| 2014 | 2019 | 2024 | 2014-2019 | 2019-2024 | ||||||||||||||||
| (%) | (%) | |||||||||||||||||||
| Population (000) | ||||||||||||||||||||
| USA | 317,199 | 329,236 | 340,950 | 0.7 | % | 0.7 | % | |||||||||||||
| New York | 19,675 | 19,904 | 20,197 | 0.2 | % | 0.3 | % | |||||||||||||
| Saratoga, NY | 224 | 232 | 239 | 0.8 | % | 0.6 | % | |||||||||||||
| Schenectady, NY | 155 | 156 | 157 | 0.1 | % | 0.2 | % | |||||||||||||
| Greene, NY | 48 | 47 | 47 | -0.4 | % | -0.2 | % | |||||||||||||
| Warren, NY | 65 | 64 | 64 | -0.3 | % | 0.0 | % | |||||||||||||
| Albany, NY | 306 | 311 | 315 | 0.3 | % | 0.3 | % | |||||||||||||
| Rensselaer, NY | 160 | 160 | 161 | 0.0 | % | 0.1 | % | |||||||||||||
| Households (000) | ||||||||||||||||||||
| USA | 120,163 | 125,019 | 129,684 | 0.8 | % | 0.7 | % | |||||||||||||
| New York | 7,462 | 7,584 | 7,719 | 0.3 | % | 0.4 | % | |||||||||||||
| Saratoga, NY | 91 | 95 | 99 | 1.0 | % | 0.7 | % | |||||||||||||
| Schenectady, NY | 63 | 63 | 64 | 0.0 | % | 0.2 | % | |||||||||||||
| Greene, NY | 20 | 19 | 19 | -0.2 | % | 0.0 | % | |||||||||||||
| Warren, NY | 28 | 28 | 28 | 0.0 | % | 0.1 | % | |||||||||||||
| Albany, NY | 128 | 130 | 132 | 0.4 | % | 0.4 | % | |||||||||||||
| Rensselaer, NY | 65 | 66 | 67 | 0.2 | % | 0.3 | % | |||||||||||||
| Median Household Income ($) | ||||||||||||||||||||
| USA | 51,579 | 63,174 | 68,744 | 4.1 | % | 1.7 | % | |||||||||||||
| New York | 57,619 | 68,659 | 74,601 | 3.6 | % | 1.7 | % | |||||||||||||
| Saratoga, NY | 69,888 | 83,671 | 91,847 | 3.7 | % | 1.9 | % | |||||||||||||
| Schenectady, NY | 54,620 | 61,896 | 63,016 | 2.5 | % | 0.4 | % | |||||||||||||
| Greene, NY | 50,801 | 55,559 | 58,768 | 1.8 | % | 1.1 | % | |||||||||||||
| Warren, NY | 56,044 | 62,464 | 65,649 | 2.2 | % | 1.0 | % | |||||||||||||
| Albany, NY | 60,750 | 67,889 | 75,044 | 2.2 | % | 2.0 | % | |||||||||||||
| Rensselaer, NY | 62,595 | 70,080 | 77,169 | 2.3 | % | 1.9 | % | |||||||||||||
| Per Capita Income ($) | ||||||||||||||||||||
| USA | 27,721 | 34,902 | 38,568 | 4.7 | % | 2.0 | % | |||||||||||||
| New York | 32,019 | 39,830 | 43,799 | 4.5 | % | 1.9 | % | |||||||||||||
| Saratoga, NY | 35,835 | 44,561 | 49,711 | 4.5 | % | 2.2 | % | |||||||||||||
| Schenectady, NY | 28,614 | 33,053 | 33,747 | 2.9 | % | 0.4 | % | |||||||||||||
| Greene, NY | 28,305 | 32,556 | 34,899 | 2.8 | % | 1.4 | % | |||||||||||||
| Warren, NY | 30,671 | 34,369 | 36,768 | 2.3 | % | 1.4 | % | |||||||||||||
| Albany, NY | 33,787 | 42,013 | 47,260 | 4.5 | % | 2.4 | % | |||||||||||||
| Rensselaer, NY | 32,664 | 38,475 | 43,344 | 3.3 | % | 2.4 | % | |||||||||||||
| 2019 Age Distribution (%) | 0-14 Yrs. | 15-34 Yrs. | 35-54 Yrs. | 55-69 Yrs. | 70+ Yrs. | |||||||||||||||
| USA | 18.6 | 26.9 | 25.3 | 18.5 | 10.7 | |||||||||||||||
| New York | 17.4 | 27.4 | 25.6 | 18.7 | 10.8 | |||||||||||||||
| Saratoga, NY | 16.4 | 23.9 | 26.9 | 21.4 | 11.4 | |||||||||||||||
| Schenectady, NY | 17.7 | 25.8 | 25.2 | 19.7 | 11.6 | |||||||||||||||
| Greene, NY | 13.4 | 23.9 | 24.3 | 23.9 | 14.5 | |||||||||||||||
| Warren, NY | 14.7 | 22.6 | 24.1 | 24.3 | 14.4 | |||||||||||||||
| Albany, NY | 15.2 | 30.6 | 23.9 | 19.3 | 11.1 | |||||||||||||||
| Rensselaer, NY | 16.1 | 27.4 | 24.8 | 20.7 | 11.0 | |||||||||||||||
| 2019 HH Income Dist. (%) | Less Than 25,000 | $25,000 to 50,000 | $50,000 to 100,000 | $100,000+ | ||||||||||||||||
| USA | 19.6 | 21.5 | 29.2 | 29.7 | ||||||||||||||||
| New York | 19.9 | 19.0 | 26.7 | 34.4 | ||||||||||||||||
| Saratoga, NY | 11.5 | 16.3 | 31.4 | 40.8 | ||||||||||||||||
| Schenectady, NY | 19.6 | 22.3 | 31.5 | 26.5 | ||||||||||||||||
| Greene, NY | 21.9 | 24.1 | 30.4 | 23.6 | ||||||||||||||||
| Warren, NY | 18.1 | 22.7 | 32.2 | 27.0 | ||||||||||||||||
| Albany, NY | 18.2 | 19.9 | 28.9 | 32.9 | ||||||||||||||||
| Rensselaer, NY | 15.7 | 20.9 | 30.4 | 33.0 | ||||||||||||||||
Source: S&P Global Market Intelligence.
| RP® Financial, LC. | MARKET AREA |
| II.6 |
Household growth rates for the primary market area counties paralleled population growth trends, with Saratoga County and Albany County displaying the highest household growth rates for the past five years. Also consistent with population growth trends, the number of households declined in Greene County and household growth for Warren County was flat over the past five years. Over the next five years, population and household growth rates for the primary area counties are generally projected to be relatively stable or improve slightly relative to the growth trends recorded over the past five years, although population and household growth rates for Saratoga County are projected to be slightly lower.
Income measures show that the counties of Saratoga, Albany and Rensselaer are relatively affluent markets, with household and per capita income measures that exceed the comparable U.S. measures. Household and per capita income measures for Schenectady and Warren Counties were similar to the U.S. measures, while Green County’s household and per capita income were lower than the U.S. measures. Over the past five years, median household income growth rates for the primary market area counties fell below the U.S. annual growth rate of 4.1%, ranging from a high of 3.7% for Saratoga County to a low of 1.8% for Greene County. Over the next five years, median household income annual growth rates ranged from 0.4% for Schenectady County to 2.0% for Albany County compared to 1.7% for both the U.S. and the State of New York.
A comparison of household income distribution measures provides another indication of the relative affluence of Saratoga, Albany and Rensselaer Counties, which maintained a higher percentage of households with incomes above $100,000 compared to the U.S. Comparatively, Greene, Schenectady and Warren Counties maintained lower percentages of households with incomes above $100,000 compared to the U.S. Age distribution measures for the primary market area counties were fairly similar to the comparable U.S. and New York measures, although Greene and Warren Counties had relatively older populations.
Regional Economy
Comparative employment data shown in Table 2.2 shows that, except for Warren County, employment in education/healthcare/social services followed by services were the largest and second largest employment sectors in all of the primary market area counties, as well as New York. Service jobs constituted the largest employment sector for Warren County, followed by employment in education/healthcare/social services. Wholesale/retail trade jobs were the third largest employment sector for all three of the primary area counties, as well as for New York. Other noteworthy employment sectors for the primary market area counties included manufacturing and government jobs. Overall, the distribution of employment exhibited in the primary market area is indicative of a diverse economic environment.
| RP® Financial, LC. | MARKET AREA |
| II.7 |
Table 2.2
Pioneer Bank
Primary Market Area Employment Sectors
(Percent of Labor Force)
| Saratoga | Schenectady | Greene, NY | Warren, NY | Albany, NY | Rensselaer, NY | |||||||||||||||||||||||
| Employment Sector | New York | County | County | County | County | County | County | |||||||||||||||||||||
| (% of Total Employment) | ||||||||||||||||||||||||||||
| Services | 26.4 | % | 23.9 | % | 23.3 | % | 22.3 | % | 28.1 | % | 25.2 | % | 21.7 | % | ||||||||||||||
| Education,Healthcare, Soc. Serv. | 27.4 | % | 24.7 | % | 28.1 | % | 24.7 | % | 25.8 | % | 27.2 | % | 27.8 | % | ||||||||||||||
| Government | 4.4 | % | 7.1 | % | 8.3 | % | 9.1 | % | 3.9 | % | 12.0 | % | 10.5 | % | ||||||||||||||
| Wholesale/Retail Trade | 13.1 | % | 15.0 | % | 13.7 | % | 13.7 | % | 18.2 | % | 12.1 | % | 12.1 | % | ||||||||||||||
| Finance/Insurance/Real Estate | 7.9 | % | 7.2 | % | 7.4 | % | 5.8 | % | 4.3 | % | 7.4 | % | 5.8 | % | ||||||||||||||
| Manufacturing | 6.3 | % | 9.9 | % | 7.5 | % | 6.9 | % | 8.6 | % | 4.8 | % | 7.2 | % | ||||||||||||||
| Construction | 5.6 | % | 6.3 | % | 4.5 | % | 7.5 | % | 5.5 | % | 4.8 | % | 6.2 | % | ||||||||||||||
| Information | 3.0 | % | 2.0 | % | 2.4 | % | 2.4 | % | 1.5 | % | 2.3 | % | 2.1 | % | ||||||||||||||
| Transportation/Utility | 5.3 | % | 3.3 | % | 4.7 | % | 6.0 | % | 3.9 | % | 3.8 | % | 6.0 | % | ||||||||||||||
| Agriculture | 0.5 | % | 0.6 | % | 0.2 | % | 1.7 | % | 0.2 | % | 0.4 | % | 0.6 | % | ||||||||||||||
| 100.0 | % | 100.0 | % | 100.0 | % | 100.0 | % | 100.0 | % | 100.0 | % | 100.0 | % | |||||||||||||||
Source: S&P Global Market Intelligence.
The market area served by the Bank, characterized primarily as Albany MSA, has a highly developed and diverse economy. Healthcare, defense technology and education jobs constitute major sources of employment in the Bank’s regional market area. Government jobs are also a prominent source of employment, as Albany is the capital of the State of New York. Table 2.3 lists the major employers in the Albany MSA.
| RP® Financial, LC. | MARKET AREA |
| II.8 |
Table 2.3
Pioneer Bank
Market Area Largest Employers
| Employer | Industry | |
| St. Peter's Health Partners | Health care | |
| Albany Medical Center | Academic medical center | |
| Golub Corporation | Retail, supermarkets | |
| General Electric | Gas, steam, wind turbines | |
| Hannaford Supermarkets | Supermarkets | |
| Ellis Medicine | Medical center network | |
| Steward Shops | Convenience stores | |
| Bechtel Marine Propulsion | Research and development | |
| Glen Falls Hospital | Health network | |
| Center for Disability Services Holding Corp. | Disability services |
Source: alloveralbany.com
Unemployment Trends
Comparative unemployment rates for the primary market area counties, as well as for the U.S. and New York, are shown in Table 2.4. December 2018 unemployment rates for the primary market area counties ranged from a low of 3.2% for Saratoga County and Albany County to a high of 4.9% for Warren County. Comparative unemployment rates for the U.S. and New York equal to 3.7% and 3.8%, respectively. Consistent with the national and state trends, all of the primary market area counties reported lower unemployment rates for November 2018 compared to a year ago.
Table 2.4
Pioneer Bank
Unemployment Trends
| December, 2017 | December, 2018 | |||||||
| Region | Unemployment | Unemployment | ||||||
| USA | 3.9 | % | 3.7 | % | ||||
| New York | 4.4 | % | 3.8 | % | ||||
| Saratoga, NY | 4.1 | % | 3.2 | % | ||||
| Schenectady, NY | 4.5 | % | 3.6 | % | ||||
| Greene, NY | 5.6 | % | 4.1 | % | ||||
| Warren, NY | 6.5 | % | 4.9 | % | ||||
| Albany, NY | 4.0 | % | 3.2 | % | ||||
| Rensselaer, NY | 4.3 | % | 3.3 | % | ||||
| Source: S&P Global Market Intelligence. | ||||||||
| RP® Financial, LC. | MARKET AREA |
| II.9 |
Market Area Deposit Characteristics and Competition
The Bank’s deposit base is closely tied to the economic fortunes of the Albany MSA and, in particular, the areas that are nearby to one of Pioneer Bank’s branches. Table 2.5 displays deposit market trends from June 30, 2013 through June 30, 2018 for all commercial bank and savings institution branches located in the market area counties and the State of New York. Consistent with the State of New York, commercial banks maintained a larger market share of deposits than savings institutions in all the primary market area counties with the exception of Greene County. Overall, from June 30, 2013 to June 30, 2018, bank and thrift deposits increased in all of the primary market area counties.
Table 2.5
Pioneer Bank
Deposit Summary
| As of June 30, | ||||||||||||||||||||||||||||
| 2013 | 2018 | Deposit | ||||||||||||||||||||||||||
| Market | No. of | Market | No. of | Growth Rate | ||||||||||||||||||||||||
| Deposits | Share | Branches | Deposits | Share | Branches | 2013-2018 | ||||||||||||||||||||||
| (Dollars in Thousands) | �� | (%) | ||||||||||||||||||||||||||
| New York | $ | 1,120,318,000 | 100.0 | % | 5,382 | $ | 1,647,382,000 | 100.0 | % | 4,956 | 8.0 | % | ||||||||||||||||
| Commercial Banks | 1,048,174,000 | 93.6 | % | 4,427 | 1,581,125,000 | 96.0 | % | 4,254 | 8.6 | % | ||||||||||||||||||
| Savings Institutions | 72,144,000 | 6.4 | % | 947 | 66,257,000 | 4.0 | % | 694 | -1.7 | % | ||||||||||||||||||
| Saratgoga County | $ | 3,681,000 | 100.0 | % | 85 | $ | 4,725,000 | 100.0 | % | 79 | 5.1 | % | ||||||||||||||||
| Commercial Banks | 3,105,000 | 84.4 | % | 64 | 4,059,000 | 85.9 | % | 61 | 5.5 | % | ||||||||||||||||||
| Savings Institutions | 576,000 | 15.6 | % | 21 | 666,000 | 14.1 | % | 18 | 2.9 | % | ||||||||||||||||||
| Pioneer Bank | 81,079 | 2.2 | % | 4 | 163,384 | 3.5 | % | 4 | 15.0 | % | ||||||||||||||||||
| Schnectady County | $ | 2,440,000 | 100.0 | % | 49 | $ | 2,770,000 | 100.0 | % | 45 | 2.6 | % | ||||||||||||||||
| Commercial Banks | 1,429,000 | 58.6 | % | 31 | 1,707,000 | 61.6 | % | 29 | 3.6 | % | ||||||||||||||||||
| Savings Institutions | 1,011,000 | 41.4 | % | 18 | 1,063,000 | 38.4 | % | 16 | 1.0 | % | ||||||||||||||||||
| Pioneer Bank | 90,312 | 3.7 | % | 1 | 131,969 | 4.8 | % | 2 | 7.9 | % | ||||||||||||||||||
| Greene County | $ | 1,072,000 | 99.9 | % | 25 | $ | 1,615,000 | 100.0 | % | 21 | 8.5 | % | ||||||||||||||||
| Commercial Banks | 527,000 | 49.2 | % | 15 | 718,000 | 44.5 | % | 10 | 6.4 | % | ||||||||||||||||||
| Savings Institutions | 544,000 | 50.7 | % | 10 | 897,000 | 55.5 | % | 11 | 10.5 | % | ||||||||||||||||||
| Pioneer Bank | 43,241 | 4.0 | % | 2 | 29,976 | 1.9 | % | 2 | -7.1 | % | ||||||||||||||||||
| Warren County | $ | 1,476,000 | 100.0 | % | 32 | $ | 1,898,000 | 100.0 | % | 31 | 5.2 | % | ||||||||||||||||
| Commercial Banks | 1,418,000 | 96.1 | % | 29 | 1,810,000 | 95.4 | % | 26 | 5.0 | % | ||||||||||||||||||
| Savings Institutions | 58,000 | 3.9 | % | 3 | 88,000 | 4.6 | % | 5 | 8.7 | % | ||||||||||||||||||
| Pioneer Bank | $ | 0 | 0.0 | % | 0 | $ | 14,883 | 0.8 | % | 1 | NA | |||||||||||||||||
| Albany County | $ | 14,066,000 | 100.0 | % | 122 | $ | 19,375,000 | 100.0 | % | 114 | 6.6 | % | ||||||||||||||||
| Commercial Banks | 12,419,000 | 88.3 | % | 84 | 17,898,000 | 92.4 | % | 84 | 7.6 | % | ||||||||||||||||||
| Savings Institutions | 1,647,000 | 11.7 | % | 38 | 1,477,000 | 7.6 | % | 30 | -2.2 | % | ||||||||||||||||||
| Pioneer Bank | 279,232 | 2.0 | % | 7 | 451,390 | 2.3 | % | 9 | 10.1 | % | ||||||||||||||||||
| Rensselaer County | $ | 1,822,000 | 100.0 | % | 44 | $ | 2,105,000 | 100.0 | % | 36 | 2.9 | % | ||||||||||||||||
| Commercial Banks | 1,347,000 | 73.9 | % | 31 | 1,492,000 | 70.9 | % | 25 | 2.1 | % | ||||||||||||||||||
| Savings Institutions | 475,000 | 26.1 | % | 13 | 613,000 | 29.1 | % | 11 | 5.2 | % | ||||||||||||||||||
| Pioneer Bank | $ | 191,342 | 10.5 | % | 3 | $ | 364,047 | 17.3 | % | 4 | 13.7 | % | ||||||||||||||||
Source: FDIC
| RP® Financial, LC. | MARKET AREA |
| II.10 |
The Bank maintains its largest balance of deposits in Albany County, where the Bank is headquartered and maintains its largest branch presence. Based on June 30, 2018 deposit data, Pioneer Bank’s $451.4 million of deposits provided for a 2.3% market share of bank and thrift deposits in Albany County. The Bank’s deposit market share in the primary market area counties ranged from 0.8% in Warren County to 17.3% in Rensselaer County. During the five year period covered in Table 2.5, Pioneer Bank gained deposit market in all of the primary market area counties with the exception of Greene County.
Competition among financial institutions in the Bank’s market area is significant. Among the Bank’s competitors are much larger and more diversified institutions, which have greater resources than maintained by Pioneer Bank. Financial institution competitors in the Bank’s primary market area include other locally based banks, as well as regional, super regional and money center banks. From a competitive standpoint, Pioneer Bank has sought to emphasize its community orientation in the markets served by its branches. Table 2.6 lists the Bank’s largest competitors in the market area counties, based on deposit market share as noted parenthetically.
| RP® Financial, LC. | MARKET AREA |
| II.11 |
Table 2.6
Pioneer Bank
Market Area Deposit Competitors
| Location | Name | Market Share (%) | Rank | |||||||
| Saratoga, NY | Adirondack Trust Company (NY) | 20.29 | ||||||||
| Bank of America Corporation (NC) | 13.97 | |||||||||
| KeyCorp (OH) | 13.73 | |||||||||
| Arrow Financial Corp. (NY) | 10.65 | |||||||||
| TrustCo Bank Corp NY (NY) | 10.64 | |||||||||
| Pioneer SB (NY) | 3.46 | 9 out of 15 | ||||||||
| Schenectady, NY | TrustCo Bank Corp NY (NY) | 33.62 | ||||||||
| KeyCorp (OH) | 16.84 | |||||||||
| Bank of America Corporation (NC) | 14.73 | |||||||||
| Glenville Bank Holding Co. (NY) | 11.75 | |||||||||
| NBT Bancorp Inc. (NY) | 6.41 | |||||||||
| Pioneer SB (NY) | 4.76 | 6 out of 12 | ||||||||
| Greene, NY | Greene County Bncp Inc. (MHC) (NY) | 72.64 | ||||||||
| National Bank of Coxsackie (NY) | 11.54 | |||||||||
| KeyCorp (OH) | 6.71 | |||||||||
| TrustCo Bank Corp NY (NY) | 4.95 | |||||||||
| NBT Bancorp Inc. (NY) | 2.30 | |||||||||
| Pioneer SB (NY) | 1.86 | 6 out of 6 | ||||||||
| Warren, NY | Arrow Financial Corp. (NY) | 51.86 | ||||||||
| Toronto - Dominion Bank | 20.85 | |||||||||
| Citizens Financial Group | 6.62 | |||||||||
| KeyCorp (OH) | 4.80 | |||||||||
| NBT Bancorp Inc. (NY) | 4.14 | |||||||||
| Pioneer SB (NY) | 0.78 | 10 out of 10 | ||||||||
| Albany, NY | KeyCorp (OH) | 50.02 | ||||||||
| Citizens Financial Group Inc. (RI) | 20.63 | |||||||||
| M&T Bank Corp. (NY) | 7.21 | |||||||||
| Bank of America Corporation (NC) | 5.95 | |||||||||
| TrustCo Bank Corp NY (NY) | 5.01 | |||||||||
| Pioneer SB (NY) | 2.33 | 6 out of 20 | ||||||||
| Rensselaer, NY | KeyCorp (OH) | 37.04 | ||||||||
| Pioneer SB (NY) | 17.30 | 2 out of 11 | ||||||||
| TrustCo Bank Corp NY (NY) | 11.81 | |||||||||
| Citizens Financial Group Inc. (RI) | 7.69 | |||||||||
| M&T Bank Corp. (NY) | 7.22 | |||||||||
Source: S&P Global Market Intelligence.
| RP® Financial, LC. | PEER GROUP ANALYSIS |
| III.1 |
III. PEER GROUP ANALYSIS
This chapter presents an analysis of Pioneer Bank’s operations versus a group of comparable savings institutions (the "Peer Group") selected from the universe of all publicly-traded savings institutions in a manner consistent with the regulatory valuation guidelines. The basis of the pro forma market valuation of Pioneer Bank is derived from the pricing ratios of the Peer Group institutions, incorporating valuation adjustments for key differences in relation to the Peer Group. Since no Peer Group can be exactly comparable to Pioneer Bank, key areas examined for differences are: financial condition; profitability, growth and viability of earnings; asset growth; primary market area; dividends; liquidity of the shares; marketing of the issue; management; and effect of government regulations and regulatory reform.
Peer Group Selection
The Peer Group selection process is governed by the general parameters set forth in the regulatory valuation guidelines. Accordingly, the Peer Group is comprised of only those publicly-traded savings institutions whose common stock is either listed on the NYSE or NASDAQ, since their stock trading activity is regularly reported and generally more frequent than non-publicly traded and closely-held institutions. Institutions that are not listed on the NYSE or NASDAQ are inappropriate, since the trading activity for thinly-traded or closely-held stocks are typically highly irregular in terms of frequency and price and thus may not be a reliable indicator of market value. We have also excluded from the Peer Group those companies under acquisition or subject to rumored acquisition and recent conversions, since their pricing ratios are subject to unusual distortion and/or have limited trading history. A recent listing of the universe of all publicly-traded savings institutions is included as Exhibit III-1.
Ideally, the Peer Group, which must have at least 10 members to comply with the regulatory valuation guidelines, should be comprised of publicly-traded MHCs with comparable resources, strategies and financial characteristics as Pioneer Bank. However, there are currently only 14 publicly-traded MHCs in total. Accordingly, in deriving a Peer Group comprised of institutions with relatively comparable characteristics as Pioneer Bank, the companies selected for Pioneer Bank’s Peer Group are all fully-converted companies. The valuation adjustments applied in the Chapter IV analysis will take into consideration differences between Pioneer Bank’s MHC form of ownership relative to the fully-converted Peer Group companies. Also included in Chapter IV is a pricing analysis of the publicly-traded MHCs on a fully-converted basis.
| RP® Financial, LC. | PEER GROUP ANALYSIS |
| III.2 |
From the universe of publicly-traded thrifts, we selected ten institutions with characteristics similar to those of Pioneer Bank. In the selection process, we applied three “screens” to the universe of all public companies that were eligible for consideration:
| o | Screen #1 Mid-Atlantic institutions with assets between $725 million and $2.5 billion, tangible equity-to-assets ratios of greater than 7.50% and positive reported and core earnings. Five companies met the criteria for Screen #1 and all five were included in the Peer Group: ESSA Bancorp, Inc. of Pennsylvania, PCSB Financial Corporation of New York, Prudential Bancorp, Inc. of Pennsylvania, Severn Bancorp, Inc. of Maryland and Standard AVB Financial Corp. of Pennsylvania. Exhibit III-2 provides financial and public market pricing characteristics of all publicly-traded Mid-Atlantic thrifts. |
| o | Screen #2 New England institutions with assets between $725 million and $2.5 billion, tangible equity-to-assets ratios of greater than 7.50% and positive reported and core earnings. Three companies met the criteria for Screen #2 and all three were included in the Peer Group: Hingham Institution for Savings of Massachusetts, Wellesley Bancorp, Inc. of Massachusetts and Western New England Bancorp, Inc. of Massachusetts. Exhibit III-3 provides financial and public market pricing characteristics of all publicly-traded New England thrifts. |
| o | Screen #3 Midwest institutions with assets between $725 million and $2.5 billion, tangible equity-to-assets ratios of greater than 7.50% and positive reported and core earnings. Two companies met the criteria for Screen #3 and both were included in the Peer Group: HMN Financial, Inc. of Minnesota and Waterstone Financial, Inc. of Wisconsin. Exhibit III-4 provides financial and public market pricing characteristics of all publicly-traded Midwest thrifts. |
Table 3.1 shows the general characteristics of each of the ten Peer Group companies and Exhibit III-5 provides summary demographic and deposit market share data for the primary market areas served by each of the Peer Group companies. While there are expectedly some differences between the Peer Group companies and Pioneer Bank, we believe that the Peer Group companies, on average, provide a good basis for valuation subject to valuation adjustments. The following sections present a comparison of Pioneer Bancorp’s financial condition, income and expense trends, loan composition, interest rate risk and credit risk versus the Peer Group as of the most recent publicly available date. Comparative data for all publicly-traded thrifts, and publicly-traded New York thrifts have been included in the Chapter III tables as well.
| RP® Financial, LC. | PEER GROUP ANALYSIS |
| Page III.3 |
Table 3.1
Peer Group of Publicly-Traded Thrifts
As of September 30, 2018
| As of | ||||||||||||||||||||||||||||
| February 8, 2019 | ||||||||||||||||||||||||||||
| Total | Fiscal | Stock | Market | |||||||||||||||||||||||||
| Ticker | Financial Institution | Exchange | Region | City | State | Assets | Offices | Mth End | Price | Value | ||||||||||||||||||
| ($Mil) | ($) | ($Mil) | ||||||||||||||||||||||||||
| ESSA | ESSA Bancorp, Inc. | NASDAQ | 0 | MA | Stroudsburg | PA | $ | 1,834 | 23 | Sep | $ | 15.25 | $ | 168 | ||||||||||||||
| HIFS | Hingham Institution for Savings | NASDAQ | 0 | NE | Hingham | MA | 2,370 | 13 | Dec | $ | 183.95 | $ | 392 | |||||||||||||||
| HMNF | HMN Financial, Inc. | NASDAQ | 0 | MW | Rochester | MN | 737 | 14 | Dec | $ | 19.55 | $ | 90 | |||||||||||||||
| PCSB | PCSB Financial Corporation | NASDAQ | 0 | MA | Yorktown Heights | NY | 1,474 | 17 | Jun | $ | 20.70 | $ | 338 | |||||||||||||||
| PBIP | Prudential Bancorp, Inc. | NASDAQ | 0 | MA | Philadelphia | PA | 1,081 | 11 | Sep | $ | 18.01 | $ | 160 | |||||||||||||||
| SVBI | Severn Bancorp, Inc. | NASDAQ | 0 | MA | Annapolis | MD | 889 | 5 | Dec | $ | 8.85 | $ | 113 | |||||||||||||||
| STND | Standard AVB Financial Corp. | NASDAQ | 0 | MA | Monroeville | PA | 983 | 19 | Dec | $ | 30.49 | $ | 141 | |||||||||||||||
| WSBF | Waterstone Financial, Inc. | NASDAQ | 0 | MW | Wauwatosa | WI | 1,919 | 13 | Dec | $ | 16.24 | $ | 425 | |||||||||||||||
| WEBK | Wellesley Bancorp, Inc. | NASDAQ | 0 | NE | Wellesley | MA | 837 | 6 | Dec | $ | 32.00 | $ | 77 | |||||||||||||||
| WNEB | Western New England Bancorp, Inc. | NASDAQ | 0 | NE | Westfield | MA | 2,151 | 24 | Dec | $ | 9.80 | $ | 271 | |||||||||||||||
| Source: | S&P Global Market Intelligence. |
| RP® Financial, LC. | PEER GROUP ANALYSIS |
| III.4 |
In addition to the selection criteria used to identify the Peer Group companies, a summary description of the key comparable characteristics of each of the Peer Group companies relative to Pioneer Bank’s characteristics is detailed below.
| o | ESSA Bancorp, Inc. of Pennsylvania. Comparable due to similar size of branch network, lending diversification emphasis on commercial real estate loans and similar level of non-performing assets as a percent of assets. |
| o | Hingham Institution for Savings of Massachusetts. Comparable due to similar interest-earning asset composition, similar return on average assets and lending diversification emphasis on commercial real estate loans. |
| o | HMN Financial, Inc. of Minnesota. Comparable due to similar interest-earning asset, similar interest-bearing funding composition, similar net interest income to average assets ratio, relatively high earnings contribution from sources of non-interest operating income, similar combined concentration of mortgage-backed securities and 1-4 family permanent mortgage loans comprising assets, lending diversification emphasis on commercial real estate loans and similar level of non-performing assets as a percent of assets. |
| o | PCSB Financial Corporation of New York. Comparable due to similar asset size, similar interest-bearing funding composition, lending diversification emphasis on commercial real estate loans and similar level of non-performing assets as a percent of assets. |
| o | Prudential Bancorp, Inc. of Pennsylvania. Comparable due to similar asset size, lending diversification emphasis on commercial real estate loans and similar level of non-performing assets as a percent of assets. |
| o | Severn Bancorp, Inc. of Maryland. Comparable due to similar interest-earning asset composition, similar net interest income to average assets ratio, relatively high earnings contribution from sources of non-interest operating income, similar operating expenses as a percent of average assets and lending diversification emphasis on commercial real estate loans, |
| o | Standard AVB Financial Corp. of Pennsylvania. Comparable due to similar size of branch network, similar asset size, similar interest-earning asset composition and lending diversification emphasis on commercial real estate loans. |
| o | Waterstone Financial, Inc. of Wisconsin. Comparable due to similar interest-earning asset composition, similar return on average assets, relatively high earnings contribution from sources of non-interest operating income and lending diversification emphasis on commercial real estate loans. |
| o | Wellesley Bancorp, Inc. of Massachusetts. Comparable due to lending diversification emphasis on commercial real estate loans. |
| o | Western New England Bancorp, Inc. Comparable to similar size of branch network, similar interest-earning asset composition, lending diversification emphasis on commercial real estate loans and similar level of non-performing assets as a percent of assets. |
| RP® Financial, LC. | PEER GROUP ANALYSIS |
| III.5 |
In aggregate, the Peer Group companies maintained a similar level of tangible equity as the industry average (11.95% of assets versus 11.90% for all public companies), generated similar earnings as a percent of average assets (0.96% core ROAA versus 0.89% for all public companies), and earned a slightly higher ROE (8.03% core ROE versus 7.49% for all public companies). Overall, the Peer Group's average P/TB ratio and average core P/E multiple were lower than the respective averages for all publicly-traded thrifts.
| All | ||||||||
| Publicly-Traded | Peer Group | |||||||
| Financial Characteristics (Averages) | ||||||||
| Assets ($Mil) | $ | 4,285 | $ | 1,428 | ||||
| Market capitalization ($Mil) | $ | 619 | $ | 218 | ||||
| Tangible equity/assets (%) | 11.90 | % | 11.95 | % | ||||
| Core return on average assets (%) | 0.89 | 0.96 | ||||||
| Core return on average equity (%) | 7.49 | 8.03 | ||||||
| Pricing Ratios (Averages)(1) | ||||||||
| Core price/earnings (x) | 17.00 | x | 14.38 | x | ||||
| Price/tangible book (%) | 140.56 | % | 129.23 | % | ||||
| Price/assets (%) | 15.02 | 15.54 | ||||||
(1) Based on market prices as of February 8, 2019.
Ideally, the Peer Group companies would be comparable to Pioneer Bank in terms of all of the selection criteria, but the universe of publicly-traded thrifts does not provide for an appropriate number of such companies. However, in general, the companies selected for the Peer Group were fairly comparable to Pioneer Bank, as will be highlighted in the following comparative analysis. Comparative data for all publicly-traded thrifts and publicly-traded New York thrifts have been included in the Chapter III tables as well.
Financial Condition
Table 3.2 shows comparative balance sheet measures for Pioneer Bank and the Peer Group, reflecting the expected similarities and some differences given the selection procedures outlined above. Pioneer Bank’s and the Peer Group's ratios reflect balances as of December 31, 2018 and September 30, 2018, respectively. Pioneer Bank’s equity-to-assets ratio of 9.82% was lower than the Peer Group's average of 12.54%. With the infusion of the net proceeds, the Bank’s pro forma equity-to-assets ratio will exceed the Peer Group’s equity-to-assets ratio. Tangible equity-to-assets ratios for Pioneer Bank and the Peer Group equaled 9.04% and 11.95%, respectively. The Bank’s higher pro forma capital position will be favorable from a risk perspective and in terms of future earnings potential that could be realized through leverage and lower funding costs. At the same time, the Bank’s higher pro forma capitalization may initially depress return on equity. Both Pioneer Bank’s and the Peer Group's capital ratios reflected capital surpluses with respect to the regulatory capital requirements.
| RP® Financial, LC. | PEER GROUP ANALYSIS |
| Page III.6 |
Table 3.2
Balance Sheet Composition and Growth Rates
Comparable Institution Analysis
As of September 30, 2018
| Balance Sheet as a Percent of Assets | Balance Sheet Annual Growth Rates | Regulatory Capital | ||||||||||||||||||||||||||||||||||||||||||||||||||||||||||||||||||||||||||||||||||
| Cash & | MBS & | Net | Borrowed | Sub. | Total | Goodwill | Tangible | MBS, Cash & | Borrows. | Total | Tangible | Tier 1 | Tier 1 | Risk-Based | ||||||||||||||||||||||||||||||||||||||||||||||||||||||||||||||||||||||
| Equivalents | Invest | BOLI | Loans (1) | Deposits | Funds | Debt | Equity | & Intang | Equity | Assets | Investments | Loans | Deposits | &Sub debt | Equity | Equity | Leverage | Risk-Based | Capital | |||||||||||||||||||||||||||||||||||||||||||||||||||||||||||||||||
| Pioneer Bank | NY | 4.39 | % | 8.83 | % | 1.38 | % | 79.95 | % | 86.63 | % | 2.33 | % | 0.00 | % | 9.82 | % | 0.78 | % | 9.04 | % | 8.79 | % | 22.41 | % | 6.76 | % | 6.81 | % | 230.19 | % | 13.87 | % | 11.94 | % | 9.70 | % | 12.04 | % | 13.29 | % | |||||||||||||||||||||||||||||||||||||||||||
| December 31, 2018 | ||||||||||||||||||||||||||||||||||||||||||||||||||||||||||||||||||||||||||||||||||||
| All Thrifts | ||||||||||||||||||||||||||||||||||||||||||||||||||||||||||||||||||||||||||||||||||||
| Averages | 4.66 | % | 13.88 | % | 1.63 | % | 76.31 | % | 74.05 | % | 11.41 | % | 0.46 | % | 12.91 | % | 1.00 | % | 11.90 | % | 7.96 | % | 4.72 | % | 11.81 | % | 9.91 | % | -5.08 | % | 11.75 | % | 10.42 | % | 11.99 | % | 16.86 | % | 18.02 | % | ||||||||||||||||||||||||||||||||||||||||||||
| Medians | 3.19 | % | 10.66 | % | 1.76 | % | 78.14 | % | 75.20 | % | 10.74 | % | 0.00 | % | 11.88 | % | 0.30 | % | 10.78 | % | 5.56 | % | -3.18 | % | 7.75 | % | 6.19 | % | -4.30 | % | 2.49 | % | 2.92 | % | 11.40 | % | 15.18 | % | 16.15 | % | ||||||||||||||||||||||||||||||||||||||||||||
| All NY Thrifts | ||||||||||||||||||||||||||||||||||||||||||||||||||||||||||||||||||||||||||||||||||||
| Averages | 4.93 | % | 13.41 | % | 1.28 | % | 77.06 | % | 75.76 | % | 10.87 | % | 0.67 | % | 11.40 | % | 1.18 | % | 10.22 | % | 1.28 | % | 18.09 | % | 1.28 | % | 3.01 | % | -19.68 | % | 0.39 | % | 0.08 | % | 11.12 | % | 16.78 | % | 18.18 | % | ||||||||||||||||||||||||||||||||||||||||||||
| Medians | 3.38 | % | 10.66 | % | 1.62 | % | 77.43 | % | 78.20 | % | 5.78 | % | 0.00 | % | 9.77 | % | 0.44 | % | 8.71 | % | 1.02 | % | -0.21 | % | 5.94 | % | 4.31 | % | -13.10 | % | 2.76 | % | 2.87 | % | 9.60 | % | 14.06 | % | 15.70 | % | ||||||||||||||||||||||||||||||||||||||||||||
| Comparable Group | ||||||||||||||||||||||||||||||||||||||||||||||||||||||||||||||||||||||||||||||||||||
| Averages | 5.43 | % | 15.33 | % | 1.74 | % | 74.75 | % | 74.35 | % | 11.75 | % | 0.35 | % | 12.54 | % | 0.59 | % | 11.95 | % | 6.33 | % | 8.70 | % | 5.86 | % | 10.21 | % | -10.46 | % | 1.73 | % | 1.87 | % | 11.85 | % | 16.20 | % | 17.10 | % | ||||||||||||||||||||||||||||||||||||||||||||
| Medians | 4.09 | % | 11.84 | % | 1.86 | % | 77.90 | % | 74.32 | % | 12.46 | % | 0.00 | % | 11.03 | % | 0.29 | % | 10.68 | % | 3.98 | % | -0.94 | % | 6.07 | % | 6.40 | % | -12.89 | % | 0.36 | % | 1.10 | % | 11.05 | % | 14.95 | % | 15.66 | % | ||||||||||||||||||||||||||||||||||||||||||||
| Comparable Group | ||||||||||||||||||||||||||||||||||||||||||||||||||||||||||||||||||||||||||||||||||||
| ESSA | ESSA Bancorp, Inc. | PA | 2.40 | % | 20.96 | % | 2.11 | % | 71.17 | % | 72.90 | % | 16.28 | % | 0.00 | % | 9.77 | % | 0.83 | % | 8.94 | % | 2.72 | % | -4.04 | % | 5.53 | % | 4.86 | % | -4.21 | % | -1.94 | % | -1.84 | % | 9.28 | % | 12.70 | % | 13.59 | % | ||||||||||||||||||||||||||||||||||||||||||
| HIFS | Hingham Institution for Savings | MA | 12.51 | % | 2.59 | % | 0.52 | % | 83.38 | % | 72.36 | % | 18.23 | % | 0.00 | % | 8.85 | % | 0.00 | % | 8.85 | % | 7.02 | % | -12.76 | % | 11.67 | % | 18.40 | % | -24.90 | % | 16.71 | % | 16.71 | % | 9.05 | % | 12.49 | % | 13.30 | % | ||||||||||||||||||||||||||||||||||||||||||
| HMNF | HMN Financial, Inc. | MN | 6.52 | % | 10.91 | % | 0.00 | % | 79.76 | % | 88.34 | % | 0.00 | % | 0.00 | % | 10.85 | % | 0.15 | % | 10.70 | % | 2.91 | % | 17.11 | % | 0.44 | % | 3.57 | % | NA | -0.79 | % | -0.68 | % | 10.49 | % | 12.66 | % | 13.91 | % | |||||||||||||||||||||||||||||||||||||||||||
| PCSB | PCSB Financial Corporation | NY | 4.63 | % | 30.10 | % | 1.62 | % | 61.38 | % | 78.20 | % | 1.28 | % | 0.00 | % | 19.66 | % | 0.44 | % | 19.22 | % | 4.45 | % | -0.21 | % | 7.75 | % | 6.60 | % | -47.38 | % | 2.76 | % | 2.87 | % | 13.80 | % | 21.17 | % | 21.68 | % | ||||||||||||||||||||||||||||||||||||||||||
| PBIP | Prudential Bancorp, Inc. | PA | 4.60 | % | 34.56 | % | 2.65 | % | 55.77 | % | 72.54 | % | 14.31 | % | 0.00 | % | 11.88 | % | 0.62 | % | 11.26 | % | 20.19 | % | 53.85 | % | 5.53 | % | 23.31 | % | 35.31 | % | -5.71 | % | -5.90 | % | 11.86 | % | 18.76 | % | 19.59 | % | ||||||||||||||||||||||||||||||||||||||||||
| SVBI | Severn Bancorp, Inc. | MD | 11.26 | % | 6.63 | % | 0.58 | % | 77.66 | % | 78.06 | % | 8.26 | % | 2.32 | % | 10.78 | % | 0.12 | % | 10.66 | % | 10.98 | % | 46.93 | % | 6.60 | % | 16.96 | % | -17.49 | % | 4.20 | % | 4.24 | % | 13.55 | % | 16.85 | % | 18.10 | % | ||||||||||||||||||||||||||||||||||||||||||
| STND | Standard AVB Financial Corp. | PA | 3.57 | % | 15.65 | % | 2.28 | % | 74.08 | % | 73.82 | % | 11.92 | % | 0.00 | % | 13.77 | % | 2.90 | % | 10.87 | % | -0.28 | % | 10.60 | % | -2.59 | % | 1.93 | % | -12.89 | % | 1.52 | % | 2.96 | % | 11.10 | % | 15.94 | % | 16.63 | % | ||||||||||||||||||||||||||||||||||||||||||
| WSBF | Waterstone Financial, Inc. | WI | 3.07 | % | 10.35 | % | 3.50 | % | 80.08 | % | 52.33 | % | 23.50 | % | 0.00 | % | 21.08 | % | 0.03 | % | 21.05 | % | 3.52 | % | -17.43 | % | 8.08 | % | 4.98 | % | 3.59 | % | -1.77 | % | -1.78 | % | 19.92 | % | 26.10 | % | 27.01 | % | ||||||||||||||||||||||||||||||||||||||||||
| WEBK | Wellesley Bancorp, Inc. | MA | 2.90 | % | 8.74 | % | 0.92 | % | 86.12 | % | 80.12 | % | 10.74 | % | 1.17 | % | 7.53 | % | 0.00 | % | 7.53 | % | 8.71 | % | -5.35 | % | 11.12 | % | 15.30 | % | -19.65 | % | 6.74 | % | 6.74 | % | 8.49 | % | 11.41 | % | 12.46 | % | ||||||||||||||||||||||||||||||||||||||||||
| WNEB | Western New England Bancorp, Inc. | MA | 2.88 | % | 12.78 | % | 3.20 | % | 78.14 | % | 74.82 | % | 12.99 | % | 0.00 | % | 11.22 | % | 0.76 | % | 10.46 | % | 3.07 | % | -1.68 | % | 4.48 | % | 6.19 | % | -6.53 | % | -4.46 | % | -4.62 | % | 10.99 | % | 13.95 | % | 14.69 | % | ||||||||||||||||||||||||||||||||||||||||||
(1) Includes loans held for sale.
| Source: | S&P Global Market Intelligence and RP® Financial, LC. calculations. The information provided in this table has been obtained from sources we believe are reliable, but we cannot guarantee the accuracy or completeness of such information. |
Copyright (c) 2019 by RP® Financial, LC.
| RP® Financial, LC. | PEER GROUP ANALYSIS |
| III.7 |
The interest-earning asset compositions for Pioneer Bank and the Peer Group were somewhat similar, with loans constituting the bulk of interest-earning assets for both Pioneer Bank and the Peer Group. Pioneer Bank’s loans-to-assets ratio of 79.95% was higher than the Peer Group ratio of 74.75%. Comparatively, Pioneer Bank’s cash and investments-to-assets ratio of 13.22% was lower than the comparable Peer Group ratio of 20.76%. Overall, Pioneer Bank's interest-earning assets amounted to 93.17% of assets, which was less than the Peer Group ratio of 95.51%. Pioneer Bank’s non-interest earning assets included BOLI equal to 1.38% of assets and goodwill/intangibles equal to 0.78% of assets, while the Peer Group maintained BOLI equal to 1.74% of assets and goodwill/intangibles equal to 0.59% of assets.
Pioneer Bank’s funding liabilities reflected a funding composition that was more weighted toward deposits compared to the Peer Group's funding composition. Pioneer Bank’s deposits equaled 86.63% of assets, as compared to the Peer Group’s ratio of 74.35%. Comparatively, Pioneer Bank maintained a lower level of borrowings to fund assets, as indicated by borrowings-to-assets ratios of 2.33% and 12.10% for Pioneer Bank and the Peer Group, respectively. Total interest-bearing liabilities maintained by Pioneer Bank and the Peer Group, as a percent of assets, equaled 88.96% and 86.45%, respectively.
A key measure of balance sheet strength for a thrift institution is its interest-earnings assets/interest-bearing liabilities (“IEA/IBL”) ratio. Presently, Pioneer Bank’s IEA/IBL ratio is lower than the Peer Group’s ratio, based on IEA/IBL ratios of 104.73% and 110.48%, respectively. The additional capital realized from stock proceeds should serve to provide the Bank with an IEA/IBL ratio that is more comparable to the Peer Group’s ratio, as the increase in capital provided by the infusion of stock proceeds will serve to lower the level of interest-bearing liabilities funding assets and will be primarily deployed into interest-earning assets.
The growth rate section of Table 3.2 shows annual growth rates for key balance sheet items. Pioneer Bank’s growth rates are based on the eighteen months ended December 31, 2018, annualized, whereas the growth rates for the Peer Group are based on the twelve months ended September 30, 2018. Pioneer Bank recorded an 8.79% increase in assets, versus asset growth of 6.33% recorded by the Peer Group. Asset growth for Pioneer Bank was driven by a 6.76% increase in loans and a 22.41% increase in cash and investments. Comparatively, asset growth for the Peer Group was driven by a 5.86% increase in loans and was supplemented with an 8.70% increase in cash and investments.
| RP® Financial, LC. | PEER GROUP ANALYSIS |
| III.8 |
Asset growth for Pioneer Bank was funded by a 6.81% increase in deposits and a 230.19% increase in borrowings. Asset growth for the Peer Group was primarily funded through deposit growth of 10.21%, which also funded a 10.46% reduction in the Peer Group’s borrowings. Pioneer Bank’s tangible equity growth rate equaled 11.94%, which was attributable to retention of earnings. Comparatively, the Peer Group’s tangible capital growth rate equaled 1.87%. The Bank’s post-conversion capital growth rate will initially be constrained by maintenance of a higher pro forma capital position. Additionally, implementation of any stock repurchases and dividend payments, pursuant to regulatory limitations and guidelines, could also slow the Bank’s capital growth rate in the longer term following the stock offering.
Income and Expense Components
Table 3.3 displays statements of operations for Pioneer Bank and the Peer Group. Pioneer Bank’s ratios are based on earnings for the twelve months ended December 31, 2018 and the Peer Group’s ratios are based on earnings for the twelve months ended September 30, 2018. Pioneer Bank and the Peer Group reported net income to average assets ratios of 1.30% and 0.81%, respectively. Pioneer Bank’s higher return was realized through a higher net interest income ratio and a lower effective tax rate, which were partially offset by the Peer Group’s higher ratio of non-interest operating income and lower ratios for loan loss provisions and operating expenses.
The Bank’s higher net interest income to average assets ratio was realized through both a higher interest income ratio and a lower interest expense ratio. The Bank’s higher interest income ratio was supported by maintaining a higher overall yield earned on interest-earning assets (4.26% versus 3.91% for the Peer Group), which was partially offset by the Peer Group’s higher concentration of assets maintained in interest-earning assets. Similarly, the Bank’s lower interest expense ratio was supported by maintaining a lower cost of funds (0.46% versus 0.77% for the Peer Group), which was partially by the Peer Group’s lower level of interest-bearing liabilities funding assets. Overall, Pioneer Bank and the Peer Group reported net interest income to average assets ratios of 3.62% and 3.01%, respectively.
| RP® Financial, LC. | PEER GROUP ANALYSIS |
| Page III.9 |
Table 3.3
Income as Percent of Average Assets and Yields, Costs, Spreads
Comparable Institution Analysis
For the 12 Months Ended September 30, 2018
| Net Interest Income | Non-Interest Income | Non-Op. Items | Yields, Costs, and Spreads | |||||||||||||||||||||||||||||||||||||||||||||||||||||||||||||||||||||
| Loss | NII | Gain | Other | Total | Provision | MEMO: | MEMO: | |||||||||||||||||||||||||||||||||||||||||||||||||||||||||||||||||
| Net | Provis. | After | on Sale of | Non-Int | Non-Int | Net Gains/ | Extrao. | for | Yield | Cost | Yld-Cost | Assets/ | Effective | |||||||||||||||||||||||||||||||||||||||||||||||||||||||||||
| Income | Income | Expense | NII | on IEA | Provis. | Loans | Income | Expense | Losses (1) | Items | Taxes | On IEA | Of IBL | Spread | FTE Emp. | Tax Rate | ||||||||||||||||||||||||||||||||||||||||||||||||||||||||
| (%) | (%) | (%) | (%) | (%) | (%) | (%) | (%) | (%) | (%) | (%) | (%) | (%) | (%) | (%) | ($000) | (%) | ||||||||||||||||||||||||||||||||||||||||||||||||||||||||
| Pioneer Bank | NY | |||||||||||||||||||||||||||||||||||||||||||||||||||||||||||||||||||||||
| December 31, 2018 | 1.30 | % | 3.91 | % | 0.29 | % | 3.62 | % | 0.17 | % | 3.45 | % | 0.00 | % | 1.03 | % | 2.86 | % | 0.01 | % | 0.00 | % | 0.33 | % | 4.26 | % | 0.46 | % | 3.80 | % | $ | 5,027 | 20.14 | % | ||||||||||||||||||||||||||||||||||||||
| All Thrifts | ||||||||||||||||||||||||||||||||||||||||||||||||||||||||||||||||||||||||
| Averages | 0.78 | % | 3.88 | % | 0.81 | % | 3.07 | % | 0.08 | % | 3.00 | % | 0.43 | % | 0.53 | % | 2.78 | % | 0.02 | % | 0.00 | % | 0.40 | % | 3.90 | % | 0.63 | % | 3.27 | % | $ | 7,738 | 36.57 | % | ||||||||||||||||||||||||||||||||||||||
| Medians | 0.75 | % | 3.70 | % | 0.87 | % | 2.97 | % | 0.07 | % | 2.90 | % | 0.02 | % | 0.41 | % | 2.63 | % | 0.00 | % | 0.00 | % | 0.40 | % | 3.87 | % | 0.58 | % | 3.26 | % | $ | 6,173 | 34.48 | % | ||||||||||||||||||||||||||||||||||||||
| All NY Thrifts | ||||||||||||||||||||||||||||||||||||||||||||||||||||||||||||||||||||||||
| Averages | 0.67 | % | 3.57 | % | 0.85 | % | 2.72 | % | 0.05 | % | 2.67 | % | 0.12 | % | 0.35 | % | 2.48 | % | 0.24 | % | 0.00 | % | 0.22 | % | 3.92 | % | 0.61 | % | 3.31 | % | $ | 8,752 | 38.10 | % | ||||||||||||||||||||||||||||||||||||||
| Medians | 0.85 | % | 3.62 | % | 0.92 | % | 2.71 | % | 0.02 | % | 2.70 | % | 0.00 | % | 0.37 | % | 2.23 | % | 0.00 | % | 0.00 | % | 0.23 | % | 3.92 | % | 0.60 | % | 3.27 | % | $ | 6,054 | 33.69 | % | ||||||||||||||||||||||||||||||||||||||
| Comparable Group | ||||||||||||||||||||||||||||||||||||||||||||||||||||||||||||||||||||||||
| Averages | 0.81 | % | 3.83 | % | 0.82 | % | 3.01 | % | 0.05 | % | 2.96 | % | 0.67 | % | 0.39 | % | 2.74 | % | 0.00 | % | 0.00 | % | 0.48 | % | 3.91 | % | 0.77 | % | 3.14 | % | $ | 8,842 | 38.31 | % | ||||||||||||||||||||||||||||||||||||||
| Medians | 0.71 | % | 3.80 | % | 0.92 | % | 2.92 | % | 0.06 | % | 2.91 | % | 0.01 | % | 0.42 | % | 2.23 | % | 0.00 | % | 0.00 | % | 0.43 | % | 3.89 | % | 0.65 | % | 3.13 | % | $ | 6,723 | 39.59 | % | ||||||||||||||||||||||||||||||||||||||
| Comparable Group | ||||||||||||||||||||||||||||||||||||||||||||||||||||||||||||||||||||||||
| ESSA | ESSA Bancorp, Inc. | PA | 0.36 | % | 3.55 | % | 0.90 | % | 2.66 | % | 0.22 | % | 2.44 | % | 0.00 | % | 0.42 | % | 2.17 | % | -0.02 | % | 0.00 | % | 0.31 | % | 3.83 | % | 0.43 | % | 3.40 | % | $ | 6,597 | 46.45 | % | ||||||||||||||||||||||||||||||||||||
| HIFS | Hingham Institution for Savings | MA | 1.42 | % | 3.99 | % | 1.09 | % | 2.90 | % | 0.06 | % | 2.83 | % | 0.00 | % | 0.06 | % | 0.87 | % | 0.06 | % | 0.00 | % | 0.66 | % | 4.06 | % | 1.33 | % | 2.73 | % | $ | 23,706 | 31.72 | % | ||||||||||||||||||||||||||||||||||||
| HMNF | HMN Financial, Inc. | MN | 0.87 | % | 4.07 | % | 0.28 | % | 3.79 | % | -0.06 | % | 3.85 | % | 0.31 | % | 0.76 | % | 3.50 | % | 0.00 | % | 0.00 | % | 0.54 | % | 4.31 | % | 0.66 | % | 3.65 | % | $ | 4,051 | 38.47 | % | ||||||||||||||||||||||||||||||||||||
| PCSB | PCSB Financial Corporation | NY | 0.50 | % | 3.41 | % | 0.49 | % | 2.92 | % | 0.02 | % | 2.90 | % | 0.00 | % | 0.17 | % | 2.23 | % | 0.00 | % | 0.00 | % | 0.34 | % | 3.72 | % | 0.63 | % | 3.09 | % | $ | 8,706 | 40.71 | % | ||||||||||||||||||||||||||||||||||||
| PBIP | Prudential Bancorp, Inc. | PA | 0.72 | % | 3.57 | % | 1.04 | % | 2.53 | % | 0.08 | % | 2.45 | % | 0.00 | % | 0.29 | % | 1.60 | % | -0.04 | % | 0.00 | % | 0.38 | % | 3.29 | % | 0.07 | % | 3.22 | % | $ | 13,505 | 34.38 | % | ||||||||||||||||||||||||||||||||||||
| SVBI | Severn Bancorp, Inc. | MD | 0.69 | % | 4.42 | % | 0.99 | % | 3.43 | % | -0.04 | % | 3.47 | % | 0.29 | % | 0.68 | % | 3.11 | % | 0.00 | % | 0.00 | % | 0.63 | % | 3.62 | % | 0.45 | % | 3.17 | % | $ | 5,098 | 47.70 | % | ||||||||||||||||||||||||||||||||||||
| STND | Standard AVB Financial Corp. | PA | 0.86 | % | 3.72 | % | 0.70 | % | 3.01 | % | 0.07 | % | 2.95 | % | 0.02 | % | 0.42 | % | 2.23 | % | 0.00 | % | 0.00 | % | 0.30 | % | 3.77 | % | 1.16 | % | 2.61 | % | $ | 6,173 | 25.59 | % | ||||||||||||||||||||||||||||||||||||
| WSBF | Waterstone Financial, Inc. | WI | 1.52 | % | 3.87 | % | 0.95 | % | 2.92 | % | -0.06 | % | 2.97 | % | 6.10 | % | 0.41 | % | 7.21 | % | 0.00 | % | 0.00 | % | 0.76 | % | 4.40 | % | 1.43 | % | 2.98 | % | $ | 1,966 | 33.21 | % | ||||||||||||||||||||||||||||||||||||
| WEBK | Wellesley Bancorp, Inc. | MA | 0.57 | % | 3.98 | % | 0.96 | % | 3.01 | % | 0.09 | % | 2.92 | % | 0.01 | % | 0.27 | % | 2.23 | % | 0.00 | % | 0.00 | % | 0.40 | % | 4.10 | % | 0.41 | % | 3.69 | % | $ | 11,774 | 41.61 | % | ||||||||||||||||||||||||||||||||||||
| WNEB | Western New England Bancorp, Inc. | MA | 0.59 | % | 3.74 | % | 0.84 | % | 2.90 | % | 0.10 | % | 2.80 | % | 0.00 | % | 0.42 | % | 2.20 | % | 0.01 | % | 0.00 | % | 0.45 | % | 3.96 | % | 1.12 | % | 2.84 | % | $ | 6,848 | 43.24 | % | ||||||||||||||||||||||||||||||||||||
(1) Net gains/losses includes gain/loss on sale of securities and nonrecurring income and expense.
| Source: | S&P Global Market Intelligence and RP® Financial, LC. calculations. The information provided in this table has been obtained from sources we believe are reliable, but we cannot guarantee the accuracy or completeness of such information. |
Copyright (c) 2019 by RP® Financial, LC.
| RP® Financial, LC. | PEER GROUP ANALYSIS |
| III.10 |
In another key area of core earnings strength, the Bank maintained a slightly higher level of operating expenses than the Peer Group. For the period covered in Table 3.3, the Bank and the Peer Group reported operating expense to average assets ratios of 2.86% and 2.74%, respectively. The Bank’s slightly higher operating expense ratio is indicative of its greater degree of diversification of products and services which generate sources of non-interest operating, including largely off-balance sheet activities related to its wealth management and insurance operations. Consistent with the Bank’s higher operating expense ratio, Pioneer Bank maintained a comparatively higher number of employees relative to its asset size. Assets per full time equivalent employee equaled $5.0 million for the Bank, versus a comparable measure of $8.8 million for the Peer Group. On a post-offering basis, the Bank’s operating expenses can be expected to increase with the addition of stock benefit plans and certain expenses that result from being a publicly-traded company, with such expenses already impacting the Peer Group's operating expenses. At the same time, Pioneer Bank’s capacity to leverage operating expenses will exceed the Peer Group’s leverage capacity following the increase in capital realized from the infusion of net stock proceeds.
When viewed together net interest income and operating expenses provide considerable insight into a thrift's earnings strength, since those sources of income and expenses are typically the most prominent components of earnings and are generally more predictable than losses and gains realized from the sale of assets or other non-recurring activities. In this regard, as measured by their expense coverage ratios (net interest income divided by operating expenses), the Bank’s earnings were more favorable than the Peer Group’s. Expense coverage ratios for Pioneer Bank and the Peer Group equaled 1.27x and 1.10x, respectively.
Sources of non-interest operating income provided a slightly larger contribution to the Peer Group’s earnings, with such income amounting to 1.03% and 1.06% of Pioneer Bank’s and the Peer Group’s average assets, respectively. Taking non-interest operating income into account in comparing the Bank’s and the Peer Group's earnings, Pioneer Bank’s efficiency ratio (operating expenses, as a percent of the sum of non-interest operating income and net interest income) of 61.51% was more favorable than the Peer Group's efficiency ratio of 67.32%.
Loan loss provisions had a slightly larger impact on Pioneer Bank’s earnings, with loan loss provisions established by Pioneer Bank equaling 0.17% of average assets. Comparatively, the Peer Group recorded loan loss provisions equal to 0.05% of average assets.
Net non-operating gains and losses equaled net gains of 0.01% of average assets for Pioneer Bank, versus no impact on the Peer Group’s earnings. Typically, gains and losses generated from the sale of assets and other non-operating activities are viewed as earnings with a relatively high degree of volatility, particularly to the extent that such gains and losses result from the sale of investments or other assets that are not considered to be part of an institution’s core operations. Extraordinary items were not a material factor in either Pioneer Bank’s or the Peer Group's earnings.
| RP® Financial, LC. | PEER GROUP ANALYSIS |
| III.11 |
Taxes had a less significant impact on Pioneer Bank’s earnings, as Pioneer Bank and the Peer Group posted effective tax rates of 20.14% and 38.31%, respectively. As indicated in the prospectus, Pioneer Bank’s effective marginal tax rate is equal to 26.00%.
Loan Composition
Table 3.4 presents data related to Pioneer Bank’s and the Peer Group’s loan portfolio compositions (including the investment in mortgage-backed securities). Pioneer Bank’s loan portfolio composition reflected a lower combined concentration of 1-4 family permanent mortgage loans and mortgage-backed securities in comparison to the Peer Group (21.82% of assets versus 40.95% for the Peer Group), as the Peer Group had higher concentrations of both 1-4 family loans and mortgage-backed securities. Loan servicing intangibles constituted a very minor balance sheet item for both Pioneer Bank and the Peer Group ($263,000 versus $460,000 for the Peer Group).
Overall, diversification into higher risk and higher yielding types of lending was more significant for Pioneer Bank, which was primarily attributable to Pioneer Bank’s significantly higher concentration of commercial business loans (14.24% of assets versus 4.47% for the Peer Group). Commercial real estate loans constituted the most significant type of lending diversification for both Pioneer Bank and the Peer Group (24.54% of assets versus 19.79% for the Peer Group). The Bank also maintained higher concentrations of consumer loans and construction/land loans, while the Peer Group maintained a higher concentration of multi-family loans. In total, construction/land, commercial real estate, multi-family, commercial business and consumer loans comprised 59.09% and 38.30% of Pioneer Bank’s and the Peer Group’s assets, respectively. Overall, Pioneer Bank’s asset composition provided for a higher risk weighted assets-to-assets ratio of 81.50%, versus a comparable Peer Group ratio of 72.08%.
Interest Rate Risk
Table 3.5 reflects various key ratios highlighting the relative interest rate risk exposure of Pioneer Bank versus the Peer Group. In terms of balance sheet composition, Pioneer Bank’s interest rate risk characteristics were considered to be less favorable than the comparable
measures for the Peer Group. Most notably, Pioneer Bank’s tangible equity-to-assets ratio and IEA/IBL ratio were lower than the comparable Peer Group ratios. Additionally, Pioneer Bank maintained a slightly higher ratio of non-interest earning assets as a percent of assets. On a pro forma basis, the infusion of stock proceeds should serve to provide Pioneer Bank with more comparable balance sheet interest rate risk characteristics as maintained by the Peer Group, as the result of the increases that will be realized in the Bank’s equity-to-assets and IEA/IBL ratios following the infusion of stock proceeds.
| RP® Financial, LC. | PEER GROUP ANALYSIS |
| Page III.12 |
Table 3.4
Loan Portfolio Composition and Related Information
Comparable Institution Analysis
As of September 30, 2018
| Portfolio Composition as a Percent of Assets | ||||||||||||||||||||||||||||||||||||||||
| 1-4 | Constr. | Multi- | Commerc. | RWA/ | Servicing | |||||||||||||||||||||||||||||||||||
| MBS | Family | & Land | Family | Comm RE | Business | Consumer | Assets | Assets | ||||||||||||||||||||||||||||||||
| (%) | (%) | (%) | (%) | (%) | (%) | (%) | (%) | ($000) | ||||||||||||||||||||||||||||||||
| Pioneer Bank | ||||||||||||||||||||||||||||||||||||||||
| December 31, 2018 | NY | 0.08 | % | 21.74 | % | 7.44 | % | 4.95 | % | 24.54 | % | 14.24 | % | 7.92 | % | 81.50 | % | $ | 263 | |||||||||||||||||||||
| Comparable Group | ||||||||||||||||||||||||||||||||||||||||
| Averages | 6.07 | % | 34.88 | % | 6.37 | % | 7.67 | % | 19.79 | % | 4.47 | % | 1.17 | % | 72.08 | % | $ | 460 | ||||||||||||||||||||||
| Medians | 4.30 | % | 34.60 | % | 5.05 | % | 3.91 | % | 17.65 | % | 3.60 | % | 0.11 | % | 73.40 | % | $ | 254 | ||||||||||||||||||||||
| Comparable Group | ||||||||||||||||||||||||||||||||||||||||
| ESSA Bancorp, Inc. | PA | 0.00 | % | 36.36 | % | 3.71 | % | 2.74 | % | 14.39 | % | 0.00 | % | 7.91 | % | 72.40 | % | $ | 206 | |||||||||||||||||||||
| Hingham Institution for Savings | MA | 0.00 | % | 43.88 | % | 5.42 | % | 17.08 | % | 17.55 | % | 0.02 | % | 0.02 | % | 70.85 | % | $ | 0 | |||||||||||||||||||||
| HMN Financial, Inc. | MN | 1.11 | % | 21.85 | % | 8.21 | % | 4.59 | % | 31.71 | % | 10.74 | % | 3.09 | % | 82.21 | % | $ | 1,845 | |||||||||||||||||||||
| PCSB Financial Corporation | NY | 16.80 | % | 19.52 | % | 1.99 | % | 6.44 | % | 29.42 | % | 3.39 | % | 0.02 | % | 65.12 | % | $ | 0 | |||||||||||||||||||||
| Prudential Bancorp, Inc. | PA | 18.29 | % | 29.85 | % | 9.79 | % | 3.17 | % | 11.04 | % | 2.34 | % | 0.09 | % | 60.80 | % | $ | 0 | |||||||||||||||||||||
| Severn Bancorp, Inc. | MD | 2.95 | % | 32.84 | % | 14.59 | % | 0.78 | % | 26.33 | % | 3.82 | % | 0.21 | % | 74.39 | % | $ | 482 | |||||||||||||||||||||
| Standard AVB Financial Corp. | PA | 5.76 | % | 46.12 | % | 1.77 | % | 3.44 | % | 17.76 | % | 4.54 | % | 0.13 | % | 67.30 | % | $ | 461 | |||||||||||||||||||||
| Waterstone Financial, Inc. | WI | 5.65 | % | 36.54 | % | 0.47 | % | 30.62 | % | 11.63 | % | 1.73 | % | 0.02 | % | 76.20 | % | $ | 1,212 | |||||||||||||||||||||
| Wellesley Bancorp, Inc. | MA | 1.84 | % | 49.25 | % | 13.04 | % | 4.06 | % | 13.83 | % | 6.81 | % | 0.01 | % | 74.46 | % | $ | 96 | |||||||||||||||||||||
| Western New England Bancorp, Inc. | MA | 8.31 | % | 32.63 | % | 4.68 | % | 3.76 | % | 24.20 | % | 11.30 | % | 0.19 | % | 77.07 | % | $ | 302 | |||||||||||||||||||||
Note: Bank level data
| Sources: | S&P Global Market Intelligence and RP® Financial, LC. calculations. The information provided in this table has been obtained from sources we believe are reilable, but we cannot guarantee the accuracy or completeness of such information. |
Copyright (c) 2019 by RP® Financial, LC.
| RP® Financial, LC. | PEER GROUP ANALYSIS |
| Page III.13 |
Table 3.5
Interest Rate Risk Measures and Net Interest Income Volatility
Comparable Institution Analysis
As of December 31, 2018
| Balance Sheet Measures | ||||||||||||||||||||||||||||||||||||||||||
| Tangible | Non-Earn. | Quarterly Change in Net Interest Income | ||||||||||||||||||||||||||||||||||||||||
| Equity/ | IEA/ | Assets/ | ||||||||||||||||||||||||||||||||||||||||
| Assets | IBL | Assets | 9/30/2018 | 6/30/2018 | 3/31/2018 | 12/31/2017 | 9/30/2017 | 6/30/2017 | ||||||||||||||||||||||||||||||||||
| (%) | (%) | (%) | (change in net interest income is annualized in basis points) | |||||||||||||||||||||||||||||||||||||||
| Pioneer Bank | ||||||||||||||||||||||||||||||||||||||||||
| December 31, 2018 | 9.0 | % | 104.7 | % | 6.8 | % | 11 | 12 | 6 | -6 | 5 | 15 | ||||||||||||||||||||||||||||||
| All NY Thrifts | ||||||||||||||||||||||||||||||||||||||||||
| Average | 10.2 | % | 109.3 | % | 4.6 | % | -7 | 1 | -4 | -1 | 1 | -6 | ||||||||||||||||||||||||||||||
| Median | 8.7 | % | 108.2 | % | 3.8 | % | -6 | -5 | -1 | -2 | 6 | -7 | ||||||||||||||||||||||||||||||
| Comparable Group | ||||||||||||||||||||||||||||||||||||||||||
| Average | 12.0 | % | 110.8 | % | 4.5 | % | -6 | 5 | 0 | 0 | 4 | 8 | ||||||||||||||||||||||||||||||
| Median | 10.7 | % | 108.8 | % | 4.8 | % | -4 | 0 | -2 | 3 | 0 | 7 | ||||||||||||||||||||||||||||||
| Comparable Group | ||||||||||||||||||||||||||||||||||||||||||
| ESSA | ESSA Bancorp, Inc. | PA | 8.9 | % | 106.0 | % | 5.5 | % | -15 | 15 | 1 | 3 | 3 | -2 | ||||||||||||||||||||||||||||
| HIFS | Hingham Institution for Savings | MA | 8.8 | % | 108.7 | % | 1.5 | % | -1 | 1 | -6 | -5 | -4 | -4 | ||||||||||||||||||||||||||||
| HMNF | HMN Financial, Inc. | MN | 10.7 | % | 110.0 | % | 2.8 | % | 21 | 6 | 22 | -27 | -2 | 12 | ||||||||||||||||||||||||||||
| PCSB | PCSB Financial Corporation | NY | 19.2 | % | 120.9 | % | 3.9 | % | -26 | 23 | -1 | 11 | 13 | -18 | ||||||||||||||||||||||||||||
| PBIP | Prudential Bancorp, Inc. | PA | 11.3 | % | 109.3 | % | 5.1 | % | -23 | -8 | -3 | -9 | -5 | 25 | ||||||||||||||||||||||||||||
| SVBI | Severn Bancorp, Inc. | MD | 10.7 | % | 107.8 | % | 4.5 | % | 12 | -5 | 13 | 13 | 17 | 20 | ||||||||||||||||||||||||||||
| STND | Standard AVB Financial Corp. | PA | 10.9 | % | 108.8 | % | 6.7 | % | -4 | -1 | -3 | -7 | 19 | 24 | ||||||||||||||||||||||||||||
| WSBF | Waterstone Financial, Inc. | WI | 21.0 | % | 123.3 | % | 6.5 | % | -3 | -1 | 2 | 12 | -2 | 4 | ||||||||||||||||||||||||||||
| WEBK | Wellesley Bancorp, Inc. | MA | 7.5 | % | 106.2 | % | 2.2 | % | 1 | -2 | -11 | 3 | -4 | 9 | ||||||||||||||||||||||||||||
| WNEB | Western New England Bancorp, Inc. | MA | 10.5 | % | 106.8 | % | 6.2 | % | -26 | 18 | -13 | 10 | 1 | 5 | ||||||||||||||||||||||||||||
| Source: | S&P Global Market Intelligence and RP® Financial, LC. calculations. The information provided in this table has been obtained from sources we believe are reliable, but we cannot guarantee the accuracy or completeness of such information. |
Copyright (c) 2019 by RP® Financial, LC.
| RP® Financial, LC. | PEER GROUP ANALYSIS |
| III.14 |
To analyze interest rate risk associated with the net interest margin, we reviewed quarterly changes in net interest income as a percent of average assets for Pioneer Bank and the Peer Group. In general, the comparative fluctuations in Pioneer Bank’s and the Peer Group’s net interest income ratios implied that a slightly greater degree of interest rate risk was associated with Pioneer Bank’s net interest margin, based on the interest rate environment that prevailed during the period covered in Table 3.5. The stability of Pioneer Bank’s net interest margin should be enhanced by the infusion of stock proceeds, as interest rate sensitive liabilities will be funding a lower portion of Pioneer Bank’s assets and the proceeds will be substantially deployed into interest-earning assets.
Credit Risk
Overall, based on a comparison of credit risk measures, Pioneer Bank’s implied credit risk exposure was viewed to be slightly greater relative to the Peer Group’s implied credit risk exposure. As shown in Table 3.6, Pioneer Bank’s ratios for non-performing assets/assets and non-performing loans/loans equaled 0.92% and 1.13%, respectively, versus comparable measures of 0.77% and 1.02% for the Peer Group. It should be noted that the measures for non-performing assets and non-performing loans in Table 3.6 include accruing loans that are classified as troubled debt restructurings. The Bank’s and the Peer Group’s loss reserves as a percent of non-performing loans equaled 115.83%and 203.65%, respectively. Loss reserves maintained as percent of loans receivable equaled 1.13% for Pioneer Bank, versus 0.88% for the Peer Group. Net loan charge-offs were a larger factor for the Bank, as net loan charge-offs for the Bank and the Peer Group equaled 0.11% and 0.01% of loans, respectively.
| RP® Financial, LC. | PEER GROUP ANALYSIS |
| Page III.15 |
Table 3.6
Credit Risk Measures and Related Information
Comparable Institution Analysis - Bank Level
As of September 30, 2018
| NPAs & | Adj NPAs & | Rsrves/ | |||||||||||||||||||||||||||||||||||
| REO/ | 90+Del/ | 90+Del/ | NPLs/ | Rsrves/ | Rsrves/ | NPAs & | Net Loan | NLCs/ | |||||||||||||||||||||||||||||
| Assets | Assets (1) | Assets (2) | Loans (3) | Loans HFI | NPLs (3) | 90+Del (1) | Chargeoffs (4) | Loans | |||||||||||||||||||||||||||||
| (%) | (%) | (%) | (%) | (%) | (%) | (%) | ($000) | (%) | |||||||||||||||||||||||||||||
| Pioneer Bank | NY | ||||||||||||||||||||||||||||||||||||
| December 31, 2018 | 0.00 | % | 0.92 | % | 0.92 | % | 1.13 | % | 1.31 | % | 115.83 | % | 115.29 | % | $ | 1,167 | 0.11 | % | |||||||||||||||||||
| Comparable Group | |||||||||||||||||||||||||||||||||||||
| Averages | 0.05 | % | 0.77 | % | 0.55 | % | 1.02 | % | 0.88 | % | 203.65 | % | 194.93 | % | $ | 220 | 0.01 | % | |||||||||||||||||||
| Medians | 0.05 | % | 0.73 | % | 0.59 | % | 0.94 | % | 0.87 | % | 115.59 | % | 104.00 | % | $ | 37 | 0.01 | % | |||||||||||||||||||
| Comparable Group | |||||||||||||||||||||||||||||||||||||
| ESSA Bancorp, Inc. | PA | 0.06 | % | 1.00 | % | 0.64 | % | 1.30 | % | 0.89 | % | 68.31 | % | 64.04 | % | $ | 1,681 | 0.13 | % | ||||||||||||||||||
| Hingham Institution for Savings | MA | 0.00 | % | 0.08 | % | 0.02 | % | 0.09 | % | 0.68 | % | 719.32 | % | 719.32 | % | $ | 0 | 0.00 | % | ||||||||||||||||||
| HMN Financial, Inc. | MN | 0.06 | % | 0.86 | % | 0.80 | % | 1.00 | % | 1.48 | % | 148.39 | % | 138.76 | % | $ | 0 | 0.00 | % | ||||||||||||||||||
| PCSB Financial Corporation | NY | 0.05 | % | 0.76 | % | 0.57 | % | 1.16 | % | 0.55 | % | 47.38 | % | 44.15 | % | $ | 689 | 0.08 | % | ||||||||||||||||||
| Prudential Bancorp, Inc. | PA | 0.09 | % | 1.39 | % | 1.33 | % | 2.31 | % | 0.85 | % | 36.80 | % | 34.30 | % | $ | 118 | 0.02 | % | ||||||||||||||||||
| Severn Bancorp, Inc. | MD | 0.03 | % | 1.91 | % | 0.68 | % | 2.38 | % | 1.16 | % | 48.27 | % | 47.46 | % | $ | -405 | -0.06 | % | ||||||||||||||||||
| Standard AVB Financial Corp. | PA | 0.05 | % | 0.31 | % | 0.30 | % | 0.34 | % | 0.62 | % | 184.73 | % | 150.31 | % | $ | 75 | 0.01 | % | ||||||||||||||||||
| Waterstone Financial, Inc. | WI | 0.11 | % | 0.55 | % | 0.45 | % | 0.54 | % | 0.97 | % | 157.56 | % | 125.20 | % | $ | -284 | -0.02 | % | ||||||||||||||||||
| Wellesley Bancorp, Inc. | MA | 0.00 | % | 0.14 | % | 0.14 | % | 0.17 | % | 0.90 | % | 542.99 | % | 542.99 | % | $ | 0 | 0.00 | % | ||||||||||||||||||
| Western New England Bancorp, Inc. | MA | 0.00 | % | 0.69 | % | 0.60 | % | 0.87 | % | 0.72 | % | 82.79 | % | 82.79 | % | $ | 330 | 0.02 | % | ||||||||||||||||||
| (1) | NPAs are defined as nonaccrual loans, accruing loans 90 days plus delinquent, performing TDRs, and OREO. |
| (2) | Adjusted NPAs are defined as nonaccrual loans, accruing loans 90 days plus delinquent and OREO (performing TDRs are excluded). |
| (3) | NPLs are defined as nonaccrual loans, accruing loans 90 days plus delinquent and performing TDRs. |
| (4) | Net loan chargeoffs are shown on a last twelve month basis. |
| Source: | S&P Global Market Intelligence and RP® Financial, LC. calculations. The information provided in this table has been obrained from sources we believe are reliable, but we cannot guarantee the accuracy or completeness of such information. |
Copyright (c) 2019 by RP® Financial, LC.
| RP® Financial, LC. | PEER GROUP ANALYSIS |
| III.16 |
Summary
Based on the above analysis, RP Financial concluded that the Peer Group forms a reasonable basis for determining the pro forma market value of Pioneer Bank. Such general characteristics as asset size, capital position, interest-earning asset composition, funding composition, core earnings measures, loan composition, credit quality and exposure to interest rate risk all tend to support the reasonability of the Peer Group overall from a financial standpoint. Those areas where differences exist will be addressed in the form of valuation adjustments to the extent necessary.
| RP® Financial, LC. | VALUATION ANALYSIS |
IV. VALUATION ANALYSIS
Introduction
This chapter presents the valuation analysis and methodology prepared pursuant to the regulatory guidelines, and valuation adjustments and assumptions used to determine the estimated pro forma market value of the common stock to be issued in conjunction with the Bank’s minority stock offering.
Appraisal Guidelines
The federal regulatory appraisal guidelines required by the OCC, FRB, the FDIC and state banking agencies specify the pro forma market value methodology for estimating the pro forma market value of an institution. Pursuant to this methodology: (1) a peer group of comparable publicly-traded institutions is selected; (2) a financial and operational comparison of the subject company to the peer group is conducted to discern key differences; and (3) a valuation analysis in which the pro forma market value of the subject company is determined based on the market pricing of the peer group as of the date of valuation, incorporating valuation adjustments for key differences. In addition, the pricing characteristics of recent conversions, both at conversion and in the aftermarket, must be considered. Given the unique differences in the pricing characteristics of publicly-traded MHCs relative to fully-converted thrift stocks, we have also reviewed the pricing characteristics of publicly-traded MHCs on a fully-converted basis.
RP Financial Approach to the Valuation
The valuation analysis herein complies with such regulatory approval guidelines. Accordingly, the valuation incorporates a detailed analysis based on the Peer Group, discussed in Chapter III, which constitutes "fundamental analysis" techniques. Additionally, the valuation incorporates a "technical analysis" of recently completed conversions, including closing pricing and aftermarket trading of such offerings. It should be noted that these valuation analyses cannot possibly fully account for all the market forces which impact trading activity and pricing characteristics of a stock on a given day.
| RP® Financial, LC. | VALUATION ANALYSIS |
The pro forma market value determined herein is a preliminary value for the Bank’s to-be-issued stock. Throughout the stock issuance process, RP Financial will: (1) review changes in the Bank’s operations and financial condition; (2) monitor the Bank’s operations and financial condition relative to the Peer Group to identify any fundamental changes; (3) monitor the external factors affecting value including, but not limited to, local and national economic conditions, interest rates and the stock market environment, including the market for thrift stocks; and (4) monitor pending conversion offerings, both regionally and nationally. If material changes should occur prior to the close of the offering, RP Financial will evaluate if updated valuation reports should be prepared reflecting such changes and their related impact on value, if any. RP Financial will also prepare a final valuation update at the closing of the offering to determine if the prepared valuation analysis and resulting range of value continues to be appropriate.
The appraised value determined herein is based on the current market and operating environment for the Bank and for all thrifts. Subsequent changes in the local and national economy, the legislative and regulatory environment, the stock market, interest rates, and other external forces (such as natural disasters or major world events), which may occur from time to time (often with great unpredictability) may materially impact the market value of all thrift stocks, including Pioneer Bank’s value, the market value of the stocks of public MHC institutions, or Pioneer Bank’s value alone. To the extent a change in factors impacting the Bank’s value can be reasonably anticipated and/or quantified, RP Financial has incorporated the estimated impact into its analysis.
Valuation Analysis
A fundamental analysis discussing similarities and differences relative to the Peer Group was presented in Chapter III. The following sections summarize the key differences between the Bank and the Peer Group and how those differences affect the pro forma valuation. Emphasis is placed on the specific strengths and weaknesses of the Bank relative to the Peer Group in such key areas as financial condition, profitability, growth and viability of earnings, asset growth, primary market area, dividends, liquidity of the shares, marketing of the issue, management, and the effect of government regulations and/or regulatory reform. We have also considered the market for thrift stocks, in particular new issues, to assess the impact on value of Pioneer Bank coming to market at this time.
| RP® Financial, LC. | VALUATION ANALYSIS |
| 1. | Financial Condition |
The financial condition of an institution is an important determinant in pro forma market value because investors typically look to such factors as liquidity, capital, asset composition and quality, and funding sources in assessing investment attractiveness. The similarities and differences in the Bank’s and the Peer Group's financial strengths are noted as follows:
| o | Overall A/L Composition. Loans funded by retail deposits were the primary components of both Pioneer Bank’s and the Peer Group's balance sheets. In comparison to the Peer Group, the Bank’s interest-earning asset composition exhibited a higher concentration of loans and a greater degree of diversification into higher risk types of loans. Overall, the Bank’s asset composition provided for a higher yield earned on interest-earning assets and a higher risk weighted assets-to-assets ratio in comparison to the Peer Group’s ratios. Pioneer Bank’s funding composition reflected a higher level of deposits and a lower level of borrowings in comparison to the Peer Group’s ratios, which provided the Bank with a lower cost of funds than maintained by the Peer Group. Overall, as a percent of assets, the Bank maintained a lower level of interest-earning assets and a higher level of interest-bearing liabilities relative to the comparable ratios for the Peer Group, which translated into a lower IEA/IBL ratio for the Bank. After factoring in the impact of the net stock proceeds, the Bank’s IEA/IBL ratio will be more comparable to the Peer Group’s IEA/IBL ratio. On balance, RP Financial concluded that asset/liability composition was a neutral factor in our adjustment for financial condition. |
| o | Credit Quality. The Bank’s ratios for non-performing assets as a percent of assets and non-performing loans as a percent of loans were slightly higher than the comparable ratios for the Peer Group. In comparison to the Peer Group, the Bank maintained lower loss reserves as a percent of non-performing loans and a higher level of loss reserves as a percent of loans. Net loan charge-offs as a percent of loans were higher for the Bank. The Bank’s risk weighted assets-to-assets ratio was somewhat higher than the Peer Group’s ratio. Overall, RP Financial concluded that credit quality was a slightly negative factor in our adjustment for financial condition. |
| o | Balance Sheet Liquidity. The Bank maintained a lower level of cash and investment securities than the Peer Group (13.22% of assets versus 20.76% for the Peer Group). Following the infusion of stock proceeds, the Bank’s cash and investments ratio is expected to increase as a portion of the net proceeds will initially be held in short-term liquid funds. The Bank’s future borrowing capacity was considered to be slightly greater than the Peer Group’s borrowing capacity, based on the lower level of borrowings that is currently funding the Bank’s assets. Overall, RP Financial concluded that balance sheet liquidity was a neutral factor in our adjustment for financial condition. |
| o | Funding Liabilities. The Bank’s interest-bearing funding composition reflected a higher concentration of deposits and a lower concentration of borrowings relative to the comparable Peer Group ratios, which translated into a lower cost of funds for the Bank. The Bank’s ratio of total interest-bearing liabilities as a percent of assets was above the Peer Group’s ratio. Following the stock offering, the increase in the Bank’s capital position will reduce the level of interest-bearing liabilities funding the Bank’s assets to a level that is more comparable to the Peer Group’s ratio of interest-bearing liabilities as a percent of assets. Overall, RP Financial concluded that funding liabilities were a slightly positive factor in our adjustment for financial condition. |
| RP® Financial, LC. | VALUATION ANALYSIS |
| o | Capital. The Peer Group currently operates with a higher equity-to-assets ratio than the Bank. Following the stock offering, Pioneer Bank’s pro forma capital position will exceed the Peer Group's equity-to-assets ratio. On balance, RP Financial concluded that capital strength was a slightly positive factor in our adjustment for financial condition. |
On balance, Pioneer Bank’s balance sheet strength was considered to be comparable to the Peer Group’s balance sheet strength and, thus, no adjustment was applied for the Bank’s financial condition.
| 2. | Profitability, Growth and Viability of Earnings |
Earnings are a key factor in determining pro forma market value, as the level and risk characteristics of an institution's earnings stream and prospects to generate future earnings heavily influence the multiple that the investment community will pay for earnings. The major factors considered in the valuation are described below.
| o | Reported Earnings. The Bank’s reported earnings were higher than the Peer Group’s on a ROAA basis (1.30% of average assets versus 0.81% for the Peer Group). The Bank maintained more favorable ratios for net interest income and effective tax rate, which were partially offset by the Peer Group’s more favorable ratios for loan loss provisions, non-interest operating income and operating expenses. Reinvestment of stock proceeds into interest-earning assets will serve to increase the Bank’s earnings, with the benefit of reinvesting the proceeds expected to be somewhat offset by higher operating expenses associated with operating as a publicly-traded company and the implementation of stock benefit plans. Overall, the Bank’s reported earnings were considered to be more favorable than the Peer Group’s reported earnings and, thus, RP Financial concluded that this was a slightly positive factor in our adjustment for profitability, growth and viability of earnings. |
| o | Core Earnings. Net interest income, operating expenses, non-interest operating income and loan loss provisions were reviewed in assessing the relative strengths and weaknesses of the Bank’s and the Peer Group’s core earnings. In these measures, the Bank operated with a higher net interest income ratio, a higher operating expense ratio and a slightly lower level of non-interest operating income. The Bank’s higher net interest income and operating expense ratios translated into a higher expense coverage ratio in comparison to the Peer Group’s ratio (equal to 1.27x versus 1.10x for the Peer Group). Similarly, the Bank’s efficiency ratio of 61.51% was more favorable than the Peer Group’s efficiency ratio of 67.32%. Loan loss provisions had a larger impact on the Bank’s earnings. Overall, these measures, as well as the expected earnings benefits the Bank should realize from the redeployment of stock proceeds into interest-earning assets and leveraging of post-offering capital, which will be somewhat negated by expenses associated with the stock benefit plans and operating as a publicly-traded company, indicate that the Bank’s pro forma core earnings will remain more favorable than the Peer Group’s core earnings. Therefore, RP Financial concluded that this was a slightly positive factor in our adjustment for profitability, growth and viability of earnings. |
| RP® Financial, LC. | VALUATION ANALYSIS |
| o | Interest Rate Risk. Quarterly changes in the Bank’s and the Peer Group's net interest income to average assets ratios indicated that a slightly greater degree of volatility was associated with the Bank’s net interest margin. Other measures of interest rate risk, such as capital levels, IEA/IBL ratios and levels of non-interest earning assets were more favorable for the Peer Group. On a pro forma basis, the infusion of stock proceeds can be expected to provide the Bank with equity-to-assets and IEA/ILB ratios that are more comparable to the Peer Group’s ratios, as well as enhance the stability of the Bank’s net interest margin. Accordingly, on balance, interest rate risk was a neutral factor in our adjustment for profitability, growth and viability of earnings. |
| o | Credit Risk. Loan loss provisions were a larger factor in the Bank’s earnings (0.17% of average assets versus 0.05% of average assets for the Peer Group). In terms of future exposure to credit quality related losses, the Bank maintained a higher concentration of assets in loans and the Bank’s loan composition reflected a greater degree of diversification into higher risk types of loans. The Bank’s credit quality measures generally implied a slightly greater degree of credit risk exposure relative to the comparable credit quality measures indicated for the Peer Group. Overall, RP Financial concluded that credit risk was a slightly negative factor in our adjustment for profitability, growth and viability of earnings. |
| o | Earnings Growth Potential. Several factors were considered in assessing earnings growth potential. First, the Bank currently maintains a higher interest rate spread than the Peer Group, which would tend to facilitate a continuation of a higher net interest margin for the Bank goring forward. Second, the infusion of stock proceeds will provide the Bank with greater growth potential through leverage than currently maintained by the Peer Group. Third, the Peer Group’s higher ratio of non-interest operating income and the Bank’s higher ratio of operating expenses were viewed as relative disadvantages for the Bank to sustain earnings growth during periods when net interest margins come under pressure as the result of adverse changes in interest rates. Overall, earnings growth potential was considered to be a slightly positive factor in our adjustment for profitability, growth and viability of earnings. |
| o | Return on Equity. Currently, the Bank’s core ROE is higher than the Peer Group’s core ROE. As the result of the increase in capital that will be realized from the infusion of net stock proceeds into the Bank’s equity, the Bank’s pro forma return equity on a core earnings basis will be similar to the Peer Group’s core ROE. Accordingly, this was a neutral factor in the adjustment for profitability, growth and viability of earnings. |
| RP® Financial, LC. | VALUATION ANALYSIS |
On balance, Pioneer Bank’s pro forma earnings strength was considered to be more favorable than the Peer Group’s and, thus, a slight upward adjustment was applied for profitability, growth and viability of earnings.
| 3. | Asset Growth |
Comparative asset growth rates for the Bank and the Peer Group showed an 8.79% increase in the Bank’s assets, versus a 6.33% increase in the Peer Group’s assets. Asset growth for the Bank was sustained by a 6.76% increase in loans and a 22.41% increase in cash and investments. The Peer Group’s asset growth was primarily sustained by a 5.86% increase in loans and also included an 8.70% increase in cash and investments. Overall, the Bank’s recent asset growth trends would tend to be viewed as comparable to slightly more favorable relative to the Peer Group’s asset growth trends in terms of supporting future earnings growth. On a pro forma basis, the Bank’s tangible equity-to-assets ratio will exceed the Peer Group's tangible equity-to-assets ratio, providing the Bank with greater leverage capacity than maintained by the Peer Group. On balance, a slight upward adjustment was applied for asset growth.
| 4. | Primary Market Area |
The general condition of an institution’s market area has an impact on value, as future success is in part dependent upon opportunities for profitable activities in the local market served. Pioneer Bank serves the Capital Region of New York through the headquarters office and 22 full service branches. Operating in a large metropolitan area provides the Bank with growth opportunities, but such growth must be achieved in a highly competitive market environment. The Bank competes against significantly larger institutions that have significantly larger branch networks than maintained by Pioneer Bank.
The Peer Group companies generally operate in markets with larger populations compared to Albany County. Population growth for the primary market area counties served by the Peer Group companies reflected a range of growth rates, but, overall, population growth in the markets served by the Peer Group companies showed comparable growth as Albany County. Albany County has a slightly higher per capita income compared to the primary market area counties served by Peer Group companies and, on average, the Peer Group’s primary market area counties were slightly less affluent markets within their respective states compared to Albany County’s per capita income as a percent of New York’s per capita income (98.9% for the Peer Group versus 105.5% for Albany County). The average and median deposit market shares maintained by the Peer Group companies were higher than the Bank’s market share of deposits in Albany County. Overall, the degree of competition faced by the Peer Group companies was viewed to slightly less than the Bank’s competitive environment in Albany County, while the growth potential in the markets served by the Peer Group companies was for the most part viewed to be comparable to the Bank’s primary market area. Summary demographic and deposit market share data for the Bank and the Peer Group companies is provided in Exhibit III-5. As shown in Table 4.1, the average unemployment rate for the primary market area counties served by the Peer Group companies was slightly above the unemployment rate reflected for Albany County. On balance, we concluded that no adjustment was appropriate for the Bank’s market area.
| RP® Financial, LC. | VALUATION ANALYSIS |
Table 4.1
Market Area Unemployment Rates
Pioneer Bank. and the Peer Group Companies (1)
| December 2018 | ||||||||
| County | Unemployment | |||||||
| Pioneer Bank - NY | Albany | 3.2 | % | |||||
| Peer Group Average | 3.5 | |||||||
| The Peer Group | ||||||||
| ESSA Bancorp, Inc. - PA | Monroe | 5.0 | ||||||
| Hingham Institutions for Savings – MA | Plymouth | 2.8 | ||||||
| HMN Financial, Inc. – MN | Olmsted | 2.5 | ||||||
| PCSB Financial Corporation – NY | Westchester | 3.4 | ||||||
| Prudential Bancorp, Inc. - PA | Philadelphia | 4.9 | ||||||
| Severn Bancorp, Inc. – MD | Ann Arundel | 2.8 | ||||||
| Standard AVB Financial Corp. – PA | Allegheny | 3.7 | ||||||
| Waterstone Financial, Inc. WI | Milwaukee | 3.4 | ||||||
| Wellesley Bancorp, Inc. – MA | Norfolk | 2.4 | ||||||
| Western New England Bancshares – MA | Hampden | 3.8 | ||||||
| (1) | Unemployment rates are not seasonally adjusted. |
Source: U.S. Bureau of Labor Statistics.
| 5. | Dividends |
At this time the Bank has not established a dividend policy. Future declarations of dividends by the Board of Directors will depend upon a number of factors, including investment opportunities, growth objectives, financial condition, profitability, tax considerations, minimum capital requirements, regulatory limitations, stock market characteristics and general economic conditions.
| RP® Financial, LC. | VALUATION ANALYSIS |
Nine out of the ten Peer Group companies pay regular cash dividends, with implied dividend yields ranging from 0.58% to 2.96%. The average dividend yield on the stocks of the Peer Group institutions equaled 1.46% as of February 8, 2019. Comparatively, as of February 8, 2019, the average dividend yield on the stocks of all fully-converted publicly-traded thrifts equaled 2.00%.
Our valuation adjustment for dividends for Pioneer Bank also considered the regulatory policy with regard to payment of dividends to the MHC. Under current FRB policy, any dividends declared by the Bank would be required to be paid to all shareholders. Accordingly, dividends paid by the Bank would increase the amount of assets held by the MHC, after adjusting for applicable income taxes, and, thereby, increase the implied dilution incurred by the minority shareholders in a second-step conversion pursuant to the calculation to account for net assets held by the MHC in a second-step offering.
Overall, while the Bank has not established a definitive dividend policy prior to its stock offering, the Bank will have the capacity to pay a dividend comparable to the Peer Group’s average dividend yield based on the Bank’s pro forma earnings and capitalization. However, dividend payments retained by the MHC would increase the implied dilution to minority shareholders in a second-step offering. Accordingly, on balance, we concluded that a slight downward adjustment was warranted for purposes of the Bank’s dividend policy.
| 6. | Liquidity of the Shares |
The Peer Group is by definition composed of companies that are traded in the public markets. All ten of the Peer Group members trade on the NASDAQ system. Typically, the number of shares outstanding and market capitalization provides an indication of how much liquidity there will be in a particular stock. The market capitalization of the Peer Group companies ranged from $77.4 million to $425.3 million as of February 8, 2019, with average and median market values of $217.6 million and $163.9 million, respectively. The shares issued and outstanding of the Peer Group companies ranged from 2.4 million to 27.7 million, with average and median shares outstanding of 11.7 million and 11.9 million, respectively. The Bank’s stock offering is expected to have a pro forma public market value that will be in the lower end of the Peer Group’s range of market values and will be in middle of the range of shares outstanding reported for the Peer Group companies. Like all of the Peer Group companies, the Bank’s stock will be quoted on the NASDAQ following the stock offering. Overall, we anticipate that the Bank’s stock will have a comparable trading market as the Peer Group companies on average and, therefore, concluded no adjustment was necessary for this factor.
| RP® Financial, LC. | VALUATION ANALYSIS |
| 7. | Marketing of the Issue |
Three separate markets exist for thrift stocks: (1) the after-market for public companies, both fully-converted stock companies and MHCs, in which trading activity is regular and investment decisions are made based upon financial condition, earnings, capital, ROE, dividends and future prospects; (2) the new issue market in which converting thrifts are evaluated on the basis of the same factors but on a pro forma basis without the benefit of prior operations as a publicly-held company and stock trading history; and (3) the thrift acquisition market. All three of these markets were considered in the valuation of the Bank’s to-be-issued stock.
| A. | The Public Market |
The value of publicly-traded thrift stocks is easily measurable, and is tracked by most investment houses and related organizations. Exhibit IV-1 provides pricing and financial data on all publicly-traded thrifts. In general, thrift stock values react to market stimuli such as interest rates, inflation, perceived industry health, projected rates of economic growth, regulatory issues and stock market conditions in general. Exhibit IV-2 displays historical stock market trends for various indices and includes historical stock price index values for thrifts and commercial banks. Exhibit IV-3 displays various stock price indices as of February 8, 2019.
In terms of assessing general stock market conditions, the performance of the overall stock market has been mixed in recent quarters. Strong job growth reflected in June employment report and signs that U.S. trade tensions with Europe may be easing propelled the stock market higher at the start of the third quarter of 2018. Technology stocks led a broader stock market rally in mid-July, with the NASDAQ closing at a new record high. Some favorable second quarter earnings reports continued the upward trend in the broader stock market heading into the second half of July. Comparatively, technology stocks led the stock market lower at the end of July, as some technology companies posted disappointing second quarter earnings. Strong earnings growth by some of America’s biggest companies contributed to a rebound in the stock market in early-August. Energy shares led the broader stock market lower going into mid-August 2018, which was attributed to a decline in oil prices. Upbeat data for the U.S. economy, deal activity and signs of cooperation between the U.S. and China contributed to stocks rallying higher during the second half of August, as the NASDAQ soared past 8000 to a new record high. Comparatively, stocks retreated at the end of August through the first part of September, in which technology shares led the market lower on worries about trade and regulation. Manufacturer and financial shares helped stocks to rebound going into the second half of September, as new tariffs announced by the U.S. and China were less than expected. After the Dow Jones Industrial Average (“DJIA”) and S&P 500 closed at record highs, shares of industrial companies led the market lower in late-September. Heightened trade tensions and the Federal Reserve’s rate hike, along with signaling a continued path of rate hikes, were noted factors that stoked caution among investors.
| RP® Financial, LC. | VALUATION ANALYSIS |
Stocks rebounded at the end of September and the beginning of October 2018, as manufacturer shares led the DJIA to a new record high following completion of a new North American trade pact. A sell-off in Treasury bonds prompted a broader stock market downturn at the end of the first week of October, as investors reacted to the September employment report which showed the national unemployment rate hitting a 50-year low. The sell-off in stocks deepened in the second week of October, with the DJIA recording a two-day decline of 5.2% before rebounding at the end of the week. Volatility continued to prevail in the broader stock market during the second half of October, as investors reacted to mixed third quarter earnings reports and signs of softer global economic growth. Following a sell-off heading into late-October 2018, stocks rebounded sharply higher at the end of October and at the start of November. The rebound in the stock market was led by technology shares, based on some favorable third quarter earnings reports. Stocks continued to surge higher following the mid-term elections, as a congressional power divide eased worries about swift policy changes. Following the mid-term election rally, stocks trended sharply lower through late-November. Factors contributing to the sell-off included U.S.-China trade tensions, concerns about the health of the technology sector, worries about slowing global growth and oil prices dropping to a three-year low. Stocks rebounded in the last week of November, with the DJIA and the S&P 500 erasing their November declines after the Federal Reserve Chairman eased investor worries about aggressively increasing interest rates. A strong retail sales report for the Thanksgiving weekend and a trade truce between the U.S. and China also contributed to the stock market rally at the end of November. Energy shares led the stock market higher at the start of December, as oil prices rounded after an easing of geopolitical concerns. Stocks tumbled lower to close out the first trading week of December, as investors’ doubts about the U.S.-China trade truce and a flattening yield curve raised fears of an economic slowdown. A rally in technology shares helped the broader stock market to edge higher going into mid-December, which was followed by a mid-December sell-off prompted by signs that China’s economy may be slowing. The stock market route deepened going into the second half of December, as investors reacted to the Federal Reserve’s rate hike and possible government shutdown. After four days of sharp declines, the DJIA logged its biggest daily point gain which was led by a rebound in energy shares. The positive trend in the broader stock market continued in the final trading days of 2018, although 2018 was the worst yearly decline for stocks since 2008.
| RP® Financial, LC. | VALUATION ANALYSIS |
Volatility continued to prevail in the broader stock market at the start of 2019. Soft economic data for U.S. December manufacturing activity prompted a sharp sell-off, which was followed a robust rally on strong job growth reported for December. The rally in the broader stock market gained momentum through mid-January, which was supported signs of progress in the U.S.- China trade talks and the Federal Reserve signaling its willingness to slow its pace of interest rate increases. The broad-based stock market rally paused in late-January, as stocks retreated on signs that a slow down in China’s economy was hurting corporate profits in the U.S. Stocks soared higher after the Federal Reserve concluded its end of January policy meeting, in which it elected to hold interest rates steady and stated that is was done raising interest rates for a while. Overall, stocks posted their best January in three years, which was led by the biggest laggards during the fourth quarter sell-off. Strong job growth reflected in the January employment report helped to sustain stock market gains at the start of February, which was followed by a pullback related to China trade tensions. On February 8, 2019, the DJIA closed at 25106.33, an increase of 3.8% from one year ago and an increase of 7.6% year-to-date, and the NASDAQ closed at 7,298.20, an increase of 6.2% from one year ago and an increase of 19.4% year-to-date. The S&P 500 Index closed at 2707.88 on February 8, 2019, an increase of 3.4% from one year ago and an increase of 8.0% year-to-date.
The performance of thrift stocks has also been uneven in recent quarters. The strong jobs report for June boosted thrift stocks at the start of the third quarter of 2018, which was followed by a slight decline in thrift shares ahead of third quarter earnings reports. After trading in a narrow range through the release of second earnings reports, concerns of rising inflation pressured thrift shares lower in late-July and into early-August. After drifting lower during the first half of August, signs of a strong labor market and a pick-up in consumer spending contributed to gains in the thrift sector going into the second half of August. Following the upturn, thrift shares trended lower through the end of August as thrift stocks were negatively impacted by July housing data showing a decline in new and existing home sales. Thrift stocks traded in a narrow range during the first half of September, which was followed by a pullback in thrift stocks through the end of September.
| RP® Financial, LC. | VALUATION ANALYSIS |
The decline in thrift shares became more pronounced in the first week of October 2018, as the shares of mortgage-based lenders were negatively impacted by the rise in long-term Treasury yields and concerns that higher mortgage rates could further deter home buyers in a slumping housing market. Financial shares were among the worst performers in the market sell-off that occurred during second week of October, as investors dumped bank stocks heading into third quarter earnings season. The downturn in thrift stocks continued into the second half of October, as third quarter earnings reports showed a trend of net interest margin compression among mortgage-based lenders. After easing lower through mid-November 2018, comments by the Federal Reserve Chairman signaling a less aggressive approach to raising interest rates spurred a rally in thrift shares at the end of November. Thrift shares reversed course during the first half of December, as financial shares experienced a broad-based sell-off on concerns about the flattening yield curve and slower economic growth translating into weaker demand for bank loans. The sell-off in thrift shares accelerated in the closing weeks of 2018, as financial shares were among the hardest hit in the stock market route that occurred in the second half of December.
The favorable jobs report for December 2018 helped thrift stocks to start 2019 out trending higher. Thrift shares continued to rally through mid-January, as some favorable fourth quarter earnings posted by some large banks served to lift financial shares in general. Expectations that the Federal Reserve would slow down it pace of rate increases helped to sustain the positive trend in thrift shares through the second half of January. The favorable jobs report for January, the Federal Reserve’s indication that it was taking a pause in raising interest rates and consolidation in the banking sector contributed to sustaining the rebound in thrift shares through the first week of February. On February 8, 2019, the SNL Index for all publicly-traded thrifts closed at 864.5, a decrease of 7.1% from one year ago and an increase of 12.0% year-to-date.
| RP® Financial, LC. | VALUATION ANALYSIS |
| B. | The New Issue Market |
In addition to thrift stock market conditions in general, the new issue market for converting thrifts is also an important consideration in determining the Bank’s pro forma market value. The new issue market is separate and distinct from the market for seasoned thrift stocks in that the pricing ratios for converting issues are computed on a pro forma basis, specifically: (1) the numerator and denominator are both impacted by the conversion offering amount, unlike existing stock issues in which price change affects only the numerator; and (2) the pro forma pricing ratio incorporates assumptions regarding source and use of proceeds, effective tax rates, stock plan purchases, etc. which impact pro forma financials, whereas pricing for existing issues are based on reported financials. The distinction between pricing of converting and existing issues is perhaps no clearer than in the case of the price/book ("P/B") ratio in that the P/B ratio of a converting thrift will typically result in a discount to book value whereas in the current market for existing thrifts the P/B ratio often reflects a premium to book value. Therefore, it is appropriate to also consider the market for new issues, both at the time of the conversion and in the aftermarket.
As shown in Table 4.2, two first-step MHC offerings were completed during the past three months. Rhinebeck Bancorp’s first-step offering was closed at the top of its offering range and 1895 Bancorp’s first-step offering closed slightly above the minimum of its offering range. The average closing fully-converted pro forma price/tangible book ratio of the two recent first-step offerings equaled 68.0%. On average, the two recent first-step MHC offerings reflected price appreciation of 7.9% after the first week of trading. As of February 8, 2019, the two recent first-step offerings reflected a 4.6% increase in price on average.
| C. | The Acquisition Market |
Also considered in the valuation was the potential impact on Pioneer Bank’s stock price of recently completed and pending acquisitions of other savings institutions operating in New York. As shown in Exhibit IV-4, there were seven New York thrift acquisitions completed from the beginning of 2014 through year-to-date 2019 and there is currently one acquisition pending for a New York savings institution. To the extent that speculation of a re-mutualization may impact the Bank’s valuation, we have largely taken this into account in selecting companies for the Peer Group which operate in markets that have experienced a comparable level of acquisition activity as the Bank’s market and, thus, are subject to the same type of acquisition speculation that may influence the Bank’s stock. However, since converting thrifts are subject to a three-year regulatory moratorium from being acquired, acquisition speculation in the Bank’s stock would tend to be less compared to the stocks of the Peer Group companies. Furthermore, in comparison to the stocks of the fully-converted Peer Group companies, the degree of acquisition speculation in the Bank’s stock is also viewed to be relatively more limited since there will be fewer potential acquirers for the Bank’s stock as a re-mutualization transaction can only be completed by a mutual institution or an institution in the MHC form of ownership. Additionally, there tends to be less acquisition speculation in the stocks of publicly-traded MHCs in general, given the majority of the shares are held by the MHC rather than public shareholders which own 100% of the shares of the fully-converted Peer Group companies. Accordingly, the Peer Group companies are considered to be subject to a greater degree of acquisition speculation relative to the acquisition speculation that may influence the Bank’s trading price.
* * * * * * * * * * *
| RP® Financial, LC. | VALUATION ANALYSIS |
Table 4.2
Pricing Characteristics and After-Market Trends
Conversions Completed in the Last Three Months
| Institutional Information | Pre-Conversion Data | Offering Information | Contribution to | Insider Purchases | Pro Forma Data | Post-IPO Pricing Trends | ||||||||||||||||||||||||||||||||||||||||||||||||||||||||||||||||||||||||||||||||||||||||||||||||||||||||||||||||||
| Financial Info. | Asset Quality | Char. Found. | % Off Incl. Fdn.+Merger Shares | Pricing Ratios(2)(5) | Financial Charac. | Closing Price: | ||||||||||||||||||||||||||||||||||||||||||||||||||||||||||||||||||||||||||||||||||||||||||||||||||||||||||||||||||
| Excluding Foundation | % of | Benefit Plans | Initial | First | After | After | ||||||||||||||||||||||||||||||||||||||||||||||||||||||||||||||||||||||||||||||||||||||||||||||||||||||||||||||||||
| Conversion | Equity/ | NPAs/ | Res. | Gross | % | % of | Exp./ | Public Off. | Recog. | Stk | Mgmt.& | Div. | Core | Core | Core | IPO | Trading | % | First | % | First | % | Thru | % | ||||||||||||||||||||||||||||||||||||||||||||||||||||||||||||||||||||||||||||||||||||||||||||||||
| Institution | Date | Ticker | Assets | Assets | Assets | Cov. | Proc. | Offer | Mid. | Proc. | Form | Inc. Fdn. | ESOP | Plans | Option | Dirs. | Yield | P/TB | P/E | P/A | ROA | TE/A | ROE | Price | Day | Chg | Week(3) | Chg | Month(4) | Chg | 2/8/2019 | Chg | ||||||||||||||||||||||||||||||||||||||||||||||||||||||||||||||||||||||||||||||||||||||||
| ($Mil) | (%) | (%) | (%) | ($Mil.) | (%) | (%) | (%) | (%) | (%) | (%) | (%) | (%)(1) | (%) | (%) | (x) | (%) | (%) | (%) | (%) | ($) | ($) | (%) | ($) | (%) | ($) | (%) | ($) | (%) | ||||||||||||||||||||||||||||||||||||||||||||||||||||||||||||||||||||||||||||||||||||||||||||
| Standard Conversions | ||||||||||||||||||||||||||||||||||||||||||||||||||||||||||||||||||||||||||||||||||||||||||||||||||||||||||||||||||||||||
| Second Step Conversions | ||||||||||||||||||||||||||||||||||||||||||||||||||||||||||||||||||||||||||||||||||||||||||||||||||||||||||||||||||||||||
| Mutual Holding Companies | ||||||||||||||||||||||||||||||||||||||||||||||||||||||||||||||||||||||||||||||||||||||||||||||||||||||||||||||||||||||||
| Rhinebeck Bancorp, Inc. | 1/17/19 | RBKB-NASDAQ | $ | 820 | 6.96 | % | 1.25 | % | 74 | % | $ | 47.9 | 43 | % | 132 | % | 3.7 | % | N.A. | N.A. | 9.1 | % | 4.6 | % | 11.4 | % | 3.8 | % | 0.00 | % | 74.0 | % | 40.3 | x | 12.2 | % | 0.3 | % | 16.5 | % | 1.8 | % | $ | 10.00 | $ | 11.75 | 17.50 | % | $ | 11.58 | 15.8 | % | $ | 11.44 | 14.4 | % | $ | 11.44 | 14.4 | % | ||||||||||||||||||||||||||||||||||||||||||||||||||||||||||||
| 1895 Bancorp of Wisconsin, Inc. (PyraMax Bank) | 1/9/19 | BCOW-NASDAQ | $ | 483 | 7.82 | % | 0.34 | % | 199 | % | $ | 21.5 | 44 | % | 89 | % | 7.0 | % | C/S | 2.2 | % | 8.7 | % | 4.4 | % | 10.9 | % | 2.1 | % | 0.00 | % | 62.0 | % | NM | 9.3 | % | -0.4 | % | 15.0 | % | -2.5 | % | $ | 10.00 | $ | 9.60 | -4.0 | % | $ | 10.00 | 0.0 | % | $ | 9.48 | -5.2 | % | $ | 9.48 | -5.2 | % | ||||||||||||||||||||||||||||||||||||||||||||||||||||||||||||
| Averages - MHC Conversions: | $ | 651 | 7.39 | % | 0.80 | % | 136 | % | $ | 34.7 | 44 | % | 110 | % | 5.3 | % | N.A. | N.A. | 8.9 | % | 4.5 | % | 11.1 | % | 3.0 | % | 0.00 | % | 68.0 | % | 40.3 | x | 10.7 | % | 0.0 | % | 15.8 | % | -0.4 | % | $ | 10.00 | $ | 10.68 | 6.8 | % | $ | 10.79 | 7.9 | % | $ | 10.46 | 4.6 | % | $ | 10.46 | 4.6 | % | ||||||||||||||||||||||||||||||||||||||||||||||||||||||||||||||
| Medians - MHC Conversions: | $ | 651 | 7.39 | % | 0.80 | % | 136 | % | $ | 34.7 | 44 | % | 110 | % | 5.3 | % | N.A. | N.A. | 8.9 | % | 4.5 | % | 11.1 | % | 3.0 | % | 0.00 | % | 68.0 | % | 40.3 | x | 10.7 | % | 0.0 | % | 15.8 | % | -0.4 | % | $ | 10.00 | $ | 10.68 | 6.8 | % | $ | 10.79 | 7.9 | % | $ | 10.46 | 4.6 | % | $ | 10.46 | 4.6 | % | ||||||||||||||||||||||||||||||||||||||||||||||||||||||||||||||
| Averages - All Conversions: | $ | 651 | 7.39 | % | 0.80 | % | 136 | % | $ | 34.7 | 44 | % | 110 | % | 5.3 | % | N.A. | N.A. | 8.9 | % | 4.5 | % | 11.1 | % | 3.0 | % | 0.00 | % | 68.0 | % | 40.3 | x | 10.7 | % | 0.0 | % | 15.8 | % | -0.4 | % | $ | 10.00 | $ | 10.68 | 6.8 | % | $ | 10.79 | 7.9 | % | $ | 10.46 | 4.6 | % | $ | 10.46 | 4.6 | % | ||||||||||||||||||||||||||||||||||||||||||||||||||||||||||||||
| Medians - All Conversions: | $ | 651 | 7.39 | % | 0.80 | % | 136 | % | $ | 34.7 | 44 | % | 110 | % | 5.3 | % | N.A. | N.A. | 8.9 | % | 4.5 | % | 11.1 | % | 3.0 | % | 0.00 | % | 68.0 | % | 40.3 | x | 10.7 | % | 0.0 | % | 15.8 | % | -0.4 | % | $ | 10.00 | $ | 10.68 | 6.8 | % | $ | 10.79 | 7.9 | % | $ | 10.46 | 4.6 | % | $ | 10.46 | 4.6 | % | ||||||||||||||||||||||||||||||||||||||||||||||||||||||||||||||
Note: * - Appraisal performed by RP Financial; BOLD = RP Financial assisted in the business plan preparation, "NT" - Not Traded; "NA" - Not Applicable, Not Available; C/S-Cash/Stock.
| (1) | As a percent of MHC offering for MHC transactions. |
| (2) | Does not take into account the adoption of SOP 93-6. |
| (3) | Latest price if offering is less than one week old. |
| (4) | Latest price if offering is more than one week but less than one month old. |
| (5) | Mutual holding company pro forma data on full conversion basis. |
| (6) | Simultaneously completed acquisition of another financial institution. |
| (7) | Simultaneously converted to a commercial bank charter. |
| (8) | Former credit union. |
2/8/2019
| RP® Financial, LC. | VALUATION ANALYSIS IV. 15 |
In determining our valuation adjustment for marketing of the issue, we considered trends in both the overall thrift market, the new issue market including the new issue market for MHC shares and the local acquisition market for thrift stocks. Taking these factors and trends into account, RP Financial concluded that no adjustment was appropriate in the valuation analysis for purposes of marketing of the issue.
| 8. | Management |
Pioneer Bank’s management team appears to have experience and expertise in all of the key areas of the Bank’s operations. Exhibit IV-5 provides summary resumes of the Bank’s Board of Trustees and senior management. The financial characteristics of the Bank suggest that the Board and senior management have been effective in implementing an operating strategy that can be well managed by the Bank’s present organizational structure. The Bank currently does not have any senior management positions that are vacant.
Similarly, the returns, capital positions and other operating measures of the Peer Group companies are indicative of well-managed financial institutions, which have Boards and management teams that have been effective in implementing competitive operating strategies. Therefore, on balance, we concluded no valuation adjustment relative to the Peer Group was appropriate for this factor.
| RP® Financial, LC. | VALUATION ANALYSIS IV. 16 |
| 9. | Effect of Government Regulation and Regulatory Reform |
In summary, as a federally-insured savings institution operating in the MHC form of ownership, Pioneer Bank will be operating in substantially the same regulatory environment as the Peer Group members — all of whom are adequately capitalized institutions and are operating with no apparent restrictions. Exhibit IV-6 reflects the Bank’s pro forma regulatory capital ratios. Accordingly, no adjustment has been applied for the effect of government regulation and regulatory reform.
Summary of Adjustments
Overall, based on the factors discussed above, we concluded that the Bank’s pro forma market value should reflect the following valuation adjustments relative to the Peer Group:
| Key Valuation Parameters: | Valuation Adjustment | |
| Financial Condition | No Adjustment | |
| Profitability, Growth and Viability of Earnings | Slight Upward | |
| Asset Growth | Slight Upward | |
| Primary Market Area | No Adjustment | |
| Dividends | Slight Downward | |
| Liquidity of the Shares | No Adjustment | |
| Marketing of the Issue | No Adjustment | |
| Management | No Adjustment | |
| Effect of Government Regulations and Regulatory Reform | No Adjustment |
Valuation Approaches: Fully-Converted Basis
In applying the accepted valuation methodology promulgated by the FDIC, the FRB and the Department, i.e., the pro forma market value approach, we considered the three key pricing ratios in valuing the Bank’s to-be-issued stock — price/earnings ("P/E"), price/book ("P/B"), and price/assets ("P/A") approaches — all performed on a pro forma basis including the effects of the stock proceeds. In computing the pro forma impact of the conversion and the related pricing ratios, we have incorporated the valuation parameters disclosed in the Bank’s prospectus for effective tax rate, stock benefit plan assumptions, the Foundation and offering expenses (summarized in Exhibits IV-9 and IV-10). The assumptions utilized in the pro forma analysis in calculating the Bank’s full conversion value were consistent with the assumptions utilized for the minority stock offering, except expenses were assumed to equal 1.75% of gross proceeds (summarized in Exhibits IV-7 and IV-8).
| RP® Financial, LC. | VALUATION ANALYSIS IV. 17 |
In our estimate of value, we assessed the relationship of the pro forma pricing ratios relative to the Peer Group, recent conversions and publicly-traded MHCs on a fully-converted basis.
RP Financial's valuation placed an emphasis on the following:
| · | P/E Approach. The P/E approach is generally the best indicator of long-term value for a stock. At the same time, recognizing that (1) the earnings multiples will be evaluated on a pro forma fully-converted basis for the Bank; and (2) the Peer Group on average has had the opportunity to realize the benefit of reinvesting net conversion proceeds, we also gave weight to the other valuation approaches. | |
| · | P/B Approach. P/B ratios have generally served as a useful benchmark in the valuation of thrift stocks, particularly in the context of an initial public offering, as the earnings approach involves assumptions regarding the use of proceeds. RP Financial considered the P/B approach to be a valuable indicator of pro forma value taking into account the pricing ratios under the P/E and P/A approaches. We have also modified the P/B approach to exclude the impact of intangible assets (i.e., price/tangible book value or “P/TB”), in that the investment community frequently makes this adjustment in its evaluation of this pricing approach. | |
| · | P/A Approach. P/A ratios are generally a less reliable indicator of market value, as investors typically assign less weight to assets and attribute greater weight to book value and earnings. Furthermore, this approach as set forth in the regulatory valuation guidelines does not take into account the amount of stock purchases funded by deposit withdrawals, thus understating the pro forma P/A ratio. At the same time, the P/A ratio is an indicator of franchise value, and, in the case of highly capitalized institutions, high P/A ratios may limit the investment community's willingness to pay market multiples for earnings or book value when ROE is expected to be low. |
The Bank will adopt “Employers’ Accounting for Employee Stock Ownership Plans” (“ASC 718-40”), which will cause earnings per share computations to be based on shares issued and outstanding excluding unreleased ESOP shares. For purposes of preparing the pro forma pricing analyses, we have reflected all shares issued in the offering, including all ESOP shares, to capture the full dilutive impact, particularly since the ESOP shares are economically dilutive, receive dividends and can be voted. However, we did consider the impact of ASC 718-40 in the valuation.
| RP® Financial, LC. | VALUATION ANALYSIS IV. 18 |
Based on the application of the three valuation approaches, taking into consideration the valuation adjustments discussed above and the dilutive impact of the stock contribution to the Foundation, RP Financial concluded that as of February 8, 2019, the pro forma market value of Pioneer Bank’s full conversion offering equaled $196,428,570 at the midpoint, equal to 19,642,857 shares at $10.00 per share.
Basis of Valuation - Fully-Converted Pricing Ratios
1. Price-to-Earnings ("P/E"). The application of the P/E valuation method requires calculating the Bank’s pro forma market value by applying a valuation P/E multiple (fully-converted basis) to the pro forma earnings base. In applying this technique, we considered both reported earnings and a recurring earnings base, that is, earnings adjusted to exclude any one-time non-operating items, plus the estimated after-tax earnings benefit of the reinvestment of the net proceeds. In deriving Pioneer Bank’s core earnings, the adjustments made to reported earnings were to eliminate the net gain on sale of securities equal to $10,000, the net gain on the disposal of assets equal to $127,000 and the net loss on the sale and write-down of OREO equal to $17,000. As shown below, on a tax effected basis, assuming an effective marginal tax rate of 26.0% for the earnings adjustments, the Bank’s core earnings were determined to equal $16.708 million for the twelve months ended December 31, 2018.
| Amount | ||||
| ($000) | ||||
| Net income | $ | 16,797 | ||
| Deduct: Net gain on sale of securities (1) | (7 | ) | ||
| Deduct: Net gain on disposal of assets (1) | (94 | ) | ||
| Add: Loss on sale and write-down of OREO (1) | 12 | |||
| Core earnings estimate | $ | 16,708 | ||
(1) Tax effected at 26.0%.
Based on Pioneer Bank’s reported and core earnings and incorporating the impact of the pro forma assumptions discussed previously, the Bank’s pro forma reported and core P/E multiples (fully-converted basis) at the $196.4 million midpoint value equaled 11.53 times and 11.59 times, respectively, which provided for discounts of 21.67% and 19.40% relative to the Peer Group's average reported and core P/E multiples of 14.72 times and 14.38 times, respectively (see Table 4.3). In comparison to the Peer Group’s median reported and core earnings multiples which equaled 14.63 times and 14.52 times, respectively, the Bank’s pro forma reported and core P/E multiples (fully-converted basis) at the midpoint value indicated discounts of 21.19% and 20.18%, respectively. The Bank’s pro forma fully-converted P/E ratios based on reported earnings at the minimum and the super maximum equaled 9.83x and 15.20x, respectively, and based on core earnings at the minimum and the super maximum equaled 9.88x and 15.28x, respectively.
| RP® Financial, LC. | VALUATION ANALYSIS IV. 19 |
Table 4.3
Fully-Converted Pricing Versus Peer Group
Pioneer Bank
As of February 8, 2019
| Market | Per Share Data | |||||||||||||||||||||||||||||||||||||||||||||||||||||||||||||||||||||||||||||||||||||||
| Capitalization | Core | Book | Dividends(3) | Financial Characteristics(5) | Offering | |||||||||||||||||||||||||||||||||||||||||||||||||||||||||||||||||||||||||||||||||||
| Price/ | Market | 12 Month | Value/ | Pricing Ratios(2) | Amount/ | Payout | Total | Equity/ | Tang. Eq./ | NPAs/ | Reported | Core | Size | |||||||||||||||||||||||||||||||||||||||||||||||||||||||||||||||||||||||||||
| Share | Value | EPS(1) | Share | P/E | P/B | P/A | P/TB | P/Core | Share | Yield | Ratio(4) | Assets | Assets | T. Assets | Assets | ROAA | ROAE | ROAA | ROAE | ($Mil) | ||||||||||||||||||||||||||||||||||||||||||||||||||||||||||||||||||||
| ($) | ($Mil) | ($) | ($) | (x) | (%) | (%) | (%) | (x) | ($) | (%) | (%) | ($Mil) | (%) | (%) | (%) | (%) | (%) | (%) | (%) | |||||||||||||||||||||||||||||||||||||||||||||||||||||||||||||||||||||
| Pioneer Bank | NY | |||||||||||||||||||||||||||||||||||||||||||||||||||||||||||||||||||||||||||||||||||||||
| Super Maximum | $ | 10.00 | $ | 259.78 | $ | 0.65 | $ | 13.27 | 15.20 | x | 75.36 | % | 17.26 | % | 77.64 | % | 15.28 | x | $ | 0.00 | 0.00 | % | 0.00 | % | $ | 1,505 | 22.89 | % | 22.26 | % | 0.78 | % | 1.14 | % | 4.96 | % | 1.13 | % | 4.93 | % | $ | 254.58 | ||||||||||||||||||||||||||||||||||||||||||||||
| Maximum | $ | 10.00 | $ | 225.89 | $ | 0.75 | $ | 14.07 | 13.23 | x | 71.07 | % | 15.28 | % | 73.42 | % | 13.30 | x | $ | 0.00 | 0.00 | % | 0.00 | % | $ | 1,478 | 21.50 | % | 20.84 | % | 0.80 | % | 1.16 | % | 5.37 | % | 1.15 | % | 5.35 | % | $ | 221.38 | ||||||||||||||||||||||||||||||||||||||||||||||
| Midpoint | $ | 10.00 | $ | 196.43 | $ | 0.86 | $ | 14.91 | 11.53 | x | 67.07 | % | 13.52 | % | 69.44 | % | 11.59 | x | $ | 0.00 | 0.00 | % | 0.00 | % | $ | 1,453 | 20.15 | % | 19.48 | % | 0.81 | % | 1.17 | % | 5.82 | % | 1.17 | % | 5.79 | % | $ | 192.50 | ||||||||||||||||||||||||||||||||||||||||||||||
| Minimum | $ | 10.00 | $ | 166.96 | $ | 1.01 | $ | 15.97 | 9.83 | x | 62.62 | % | 11.70 | % | 65.06 | % | 9.88 | x | $ | 0.00 | 0.00 | % | 0.00 | % | $ | 1,427 | 18.68 | % | 18.00 | % | 0.83 | % | 1.19 | % | 6.37 | % | 1.18 | % | 6.34 | % | $ | 163.63 | ||||||||||||||||||||||||||||||||||||||||||||||
| All Non-MHC Public Companies(6) | ||||||||||||||||||||||||||||||||||||||||||||||||||||||||||||||||||||||||||||||||||||||||
| Averages | $ | 22.01 | $ | 618.58 | $ | 1.56 | $ | 17.59 | 15.92 | x | 125.94 | % | 15.02 | % | 140.56 | % | 17.00 | x | $ | 0.40 | 2.00 | % | 45.56 | % | $ | 4,285 | 12.91 | % | 12.00 | % | 0.79 | % | 0.78 | % | 6.64 | % | 0.89 | % | 7.49 | % | ||||||||||||||||||||||||||||||||||||||||||||||||
| Median | $ | 16.88 | $ | 227.31 | $ | 0.98 | $ | 15.59 | 14.88 | x | 117.19 | % | 14.82 | % | 129.35 | % | 14.63 | x | $ | 0.34 | 1.83 | % | 40.80 | % | $ | 1,191 | 11.88 | % | 10.82 | % | 0.65 | % | 0.75 | % | 6.82 | % | 0.88 | % | 7.37 | % | ||||||||||||||||||||||||||||||||||||||||||||||||
| ALL NY Thrifts | ||||||||||||||||||||||||||||||||||||||||||||||||||||||||||||||||||||||||||||||||||||||||
| Averages | $ | 14.23 | $ | 1,087.38 | $ | 0.41 | $ | 11.29 | 14.39 | x | 159.89 | % | 12.64 | % | 175.08 | % | 15.04 | x | $ | 0.43 | 2.90 | % | 53.16 | % | $ | 9,345 | 11.40 | % | 10.33 | % | 0.65 | % | 0.67 | % | 6.37 | % | 0.55 | % | 4.48 | % | ||||||||||||||||||||||||||||||||||||||||||||||||
| Medians | $ | 17.00 | $ | 337.88 | $ | 0.55 | $ | 14.31 | 14.77 | x | 118.93 | % | 11.21 | % | 143.63 | % | 15.04 | x | $ | 0.42 | 3.11 | % | 42.06 | % | $ | 1,474 | 9.77 | % | 8.93 | % | 0.46 | % | 0.85 | % | 7.24 | % | 0.76 | % | 6.11 | % | ||||||||||||||||||||||||||||||||||||||||||||||||
| Comparable Group | ||||||||||||||||||||||||||||||||||||||||||||||||||||||||||||||||||||||||||||||||||||||||
| Averages | $ | 35.48 | $ | 217.55 | $ | 3.45 | $ | 26.63 | 14.72 | x | 123.16 | % | 15.54 | % | 129.23 | % | 14.38 | x | $ | 0.41 | 1.46 | % | 31.05 | % | $ | 1,428 | 12.54 | % | 12.02 | % | 0.75 | % | 0.81 | % | 6.78 | % | 0.96 | % | 8.03 | % | ||||||||||||||||||||||||||||||||||||||||||||||||
| Medians | $ | 18.78 | $ | 163.91 | $ | 1.08 | $ | 15.63 | 14.63 | x | 117.29 | % | 14.36 | % | 125.03 | % | 14.52 | x | $ | 0.21 | 1.23 | % | 21.05 | % | $ | 1,278 | 11.03 | % | 10.69 | % | 0.66 | % | 0.71 | % | 6.31 | % | 0.93 | % | 7.34 | % | ||||||||||||||||||||||||||||||||||||||||||||||||
| Comparable Group | ||||||||||||||||||||||||||||||||||||||||||||||||||||||||||||||||||||||||||||||||||||||||
| ESSA | ESSA Bancorp, Inc. | PA | $ | 15.25 | $ | 167.65 | $ | 1.05 | $ | 15.63 | 14.95 | x | 97.55 | % | 9.68 | % | 106.23 | % | 14.52 | x | $ | 0.40 | 2.62 | % | 36.27 | % | $ | 1,834 | 9.77 | % | 9.02 | % | 0.64 | % | 0.36 | % | 3.61 | % | 0.60 | % | 6.01 | % | ||||||||||||||||||||||||||||||||||||||||||||||
| HIFS | Hingham Institution for Savings | MA | $ | 183.95 | $ | 392.32 | $ | 14.99 | $ | 99.67 | 13.23 | x | 184.55 | % | 16.29 | % | 184.55 | % | 12.27 | x | $ | 1.48 | 0.80 | % | 13.81 | % | $ | 2,370 | 8.85 | % | 8.85 | % | 0.08 | % | 1.42 | % | 16.55 | % | 1.38 | % | 16.14 | % | ||||||||||||||||||||||||||||||||||||||||||||||
| HMNF | HMN Financial, Inc. | MN | $ | 19.55 | $ | 89.55 | NA | $ | 17.19 | 11.37 | x | 113.70 | % | 13.27 | % | 115.17 | % | NM | $ | 0.00 | 0.00 | % | 0.00 | % | $ | 737 | 10.85 | % | 10.72 | % | 0.93 | % | 0.87 | % | 7.55 | % | 1.03 | % | 8.93 | % | ||||||||||||||||||||||||||||||||||||||||||||||||
| PCSB | PCSB Financial Corporation | NY | $ | 20.70 | $ | 337.88 | $ | 0.55 | $ | 15.62 | NM | 132.54 | % | 24.58 | % | 135.58 | % | NM | $ | 0.12 | 0.58 | % | 21.05 | % | $ | 1,474 | 19.66 | % | 19.30 | % | 0.76 | % | 0.50 | % | 2.51 | % | 0.61 | % | 3.08 | % | ||||||||||||||||||||||||||||||||||||||||||||||||
| PBIP | Prudential Bancorp, Inc. | PA | $ | 18.01 | $ | 160.16 | NA | $ | 14.69 | 18.38 | x | 122.56 | % | 14.36 | % | 129.12 | % | NM | $ | 0.20 | 1.11 | % | 56.12 | % | $ | 1,081 | 11.88 | % | 11.33 | % | 1.39 | % | 0.72 | % | 5.45 | % | 0.95 | % | 7.12 | % | ||||||||||||||||||||||||||||||||||||||||||||||||
| SVBI | Severn Bancorp, Inc. | MD | $ | 8.85 | $ | 112.58 | NA | NA | 13.21 | x | 117.19 | % | NA | 118.55 | % | NM | $ | 0.12 | 1.36 | % | 17.91 | % | $ | 889 | 10.78 | % | 10.67 | % | 1.94 | % | 0.69 | % | 6.30 | % | 0.92 | % | 8.42 | % | ||||||||||||||||||||||||||||||||||||||||||||||||||
| STND | Standard AVB Financial Corp. | PA | $ | 30.49 | $ | 141.22 | NA | $ | 28.65 | 16.22 | x | 106.42 | % | 15.10 | % | 137.21 | % | NM | $ | 0.88 | 2.90 | % | 47.02 | % | $ | 983 | 13.77 | % | 11.19 | % | 0.30 | % | 0.86 | % | 6.33 | % | 0.97 | % | 7.13 | % | ||||||||||||||||||||||||||||||||||||||||||||||||
| WSBF | Waterstone Financial, Inc. | WI | $ | 16.24 | $ | 425.31 | $ | 1.11 | $ | 14.04 | 14.63 | x | 115.65 | % | 24.13 | % | 115.83 | % | 14.63 | x | $ | 0.48 | 2.96 | % | 88.29 | % | $ | 1,919 | 21.08 | % | 21.06 | % | 0.61 | % | 1.52 | % | 6.91 | % | 1.66 | % | 7.55 | % | ||||||||||||||||||||||||||||||||||||||||||||||
| WEBK | Wellesley Bancorp, Inc. | MA | $ | 32.00 | $ | 77.42 | $ | 2.40 | $ | 25.79 | 13.33 | x | 124.08 | % | 9.27 | % | 124.08 | % | 13.33 | x | $ | 0.22 | 0.69 | % | 8.96 | % | $ | 837 | 7.53 | % | 7.53 | % | 0.14 | % | 0.57 | % | 7.59 | % | 0.69 | % | 9.20 | % | ||||||||||||||||||||||||||||||||||||||||||||||
| WNEB | Western New England Bancorp, Inc. | MA | $ | 9.80 | $ | 271.39 | $ | 0.57 | $ | 8.35 | 17.19 | x | 117.39 | % | 13.13 | % | 125.99 | % | 17.12 | x | $ | 0.16 | 1.63 | % | 21.05 | % | $ | 2,151 | 11.22 | % | 10.54 | % | 0.69 | % | 0.59 | % | 5.00 | % | 0.78 | % | 6.67 | % | ||||||||||||||||||||||||||||||||||||||||||||||
| (1) | Core income, on a diluted per-share basis. Core income is net income after taxes and before extraordinary items, less net income attributable to noncontrolling interest, gain on the sale of securities, amortization of intangibles, goodwill and nonrecurring items. |
| (2) | P/E = Price to earnings; P/B = Price to book; P/A = Price to assets; P/TB = Price to tangible book value; and P/Core = Price to core earnings. P/E and P/Core =NM if the ratio is negative or above 35x. |
| (3) | Indicated 12 month dividend, based on last quarterly dividend declared. |
| (4) | Indicated 12 month dividend as a percent of trailing 12 month earnings. |
| (5) | ROAA (return on average assets) and ROAE (return on average equity) are indicated ratios based on trailing 12 month earnings and average equity and assets balances. |
| (6) | Excludes from averages and medians those companies the subject of actual or rumored acquisition activities or unusual operating characteristics. |
| Source: | S&P Global Market Intelligence and RP Financial, LC. calculations. The information provided in this report has been obtained from sources we believe are reliable, but we cannot guarantee the accuracy or completeness of such information. |
Copyright (c) 2019 by RP® Financial, LC.
| RP® Financial, LC. | VALUATION ANALYSIS IV. 20 |
On an MHC reported basis, the Bank’s reported and core P/E multiples at the midpoint value of $196.4 million equaled 11.74 times and 11.81 times, respectively (see Table 4.4). The Bank’s reported and core P/E multiples provided for discounts of 20.24% and 17.87% relative to the Peer Group’s average reported and core P/E multiples of 14.72 times and 14.38 times, respectively. In comparison to the Peer Group’s median reported and core earnings multiples which equaled 14.63 times and 14.52 times, respectively, the Bank’s pro forma reported and core P/E multiples (MHC basis) at the midpoint value indicated discounts of 19.75% and 18.66%, respectively. The Bank’s pro forma MHC P/E ratios based on reported earnings at the minimum and the super maximum equaled 9.98x and 15.54x, respectively, and based on core earnings at the minimum and the super maximum equaled 10.03x and 15.63x, respectively.
2. Price-to-Book ("P/B"). The application of the P/B valuation method requires calculating the Bank’s pro forma market value by applying a valuation P/B ratio, as derived from the Peer Group’s P/B ratio, to Pioneer Bank’s pro forma book value (fully-converted basis). Based on the $196.4 million midpoint valuation, Pioneer Bank’s pro forma P/B and P/TB ratios (fully-converted basis) equaled 67.07% and 69.44%, respectively. In comparison to the average P/B and P/TB ratios for the Peer Group of 123.16% and 129.23%, respectively, the Bank’s ratios reflected a discount of 45.54% on a P/B basis and a discount of 46.27% on a P/TB basis. In comparison to the Peer Group’s median P/B and P/TB ratios of 117.29% and 125.03%, respectively, the Bank’s pro forma P/B and P/TB ratios (fully-converted basis) at the midpoint value reflected discounts of 42.82% and 44.46%, respectively. At the top of the super range, the Bank’s P/B and P/TB ratios (fully-converted basis) equaled 75.36% and 77.64%, respectively. In comparison to the Peer Group’s average P/B and P/TB ratios, the Bank’s P/B and P/TB ratios at the top of the super range reflected discounts of 38.81% and 39.92%, respectively. In comparison to the Peer Group’s median P/B and P/TB ratios, the Bank’s P/B and P/TB ratios at the top of the super range reflected discounts of 35.75% and 37.90%, respectively. RP Financial considered the discounts under the P/B approach to be reasonable, given the nature of the calculation of the P/B ratio which mathematically results in a ratio discounted to book value.
| RP® Financial, LC. | VALUATION ANALYSIS IV. 21 |
Table 4.4
MHC Pricing Versus Peer Group
Pioneer Bank
As of February 8, 2019
| Market | Per Share Data | |||||||||||||||||||||||||||||||||||||||||||||||||||||||||||||||||||||||||||||||||||||||
| Capitalization | Core | Book | Dividends(3) | Financial Characteristics(5) | Offering | |||||||||||||||||||||||||||||||||||||||||||||||||||||||||||||||||||||||||||||||||||
| Price/ | Market | 12 Month | Value/ | Pricing Ratios(2) | Amount/ | Payout | Total | Equity/ | Tang. Eq./ | NPAs/ | Reported | Core | Size | |||||||||||||||||||||||||||||||||||||||||||||||||||||||||||||||||||||||||||
| Share | Value | EPS(1) | Share | P/E | P/B | P/A | P/TB | P/Core | Share | Yield | Ratio(4) | Assets | Assets | T. Assets | Assets | ROAA | ROAE | ROAA | ROAE | ($Mil) | ||||||||||||||||||||||||||||||||||||||||||||||||||||||||||||||||||||
| ($) | ($Mil) | ($) | ($) | (x) | (%) | (%) | (%) | (x) | ($) | (%) | (%) | ($Mil) | (%) | (%) | (%) | (%) | (%) | (%) | (%) | |||||||||||||||||||||||||||||||||||||||||||||||||||||||||||||||||||||
| Pioneer Bank | NY | |||||||||||||||||||||||||||||||||||||||||||||||||||||||||||||||||||||||||||||||||||||||
| Super Maximum | $ | 10.00 | $ | 259.78 | $ | 0.64 | $ | 8.52 | 15.54 | x | 117.37 | % | 18.80 | % | 123.00 | % | 15.63 | x | $ | 0.00 | 0.00 | % | 0.00 | % | $ | 1,392 | 16.02 | % | 15.32 | % | 0.85 | % | 1.21 | % | 7.55 | % | 1.20 | % | 7.51 | % | $ | 111.70 | ||||||||||||||||||||||||||||||||||||||||||||||
| Maximum | $ | 10.00 | $ | 225.89 | $ | 0.74 | $ | 9.24 | 13.51 | x | 108.23 | % | 16.50 | % | 113.64 | % | 13.58 | x | $ | 0.00 | 0.00 | % | 0.00 | % | $ | 1,369 | 15.25 | % | 14.54 | % | 0.86 | % | 1.22 | % | 8.01 | % | 1.21 | % | 7.96 | % | $ | 97.13 | ||||||||||||||||||||||||||||||||||||||||||||||
| Midpoint | $ | 10.00 | $ | 196.43 | $ | 0.85 | $ | 10.07 | 11.74 | x | 99.30 | % | 14.46 | % | 104.60 | % | 11.81 | x | $ | 0.00 | 0.00 | % | 0.00 | % | $ | 1,358 | 14.56 | % | 13.84 | % | 0.87 | % | 1.23 | % | 8.45 | % | 1.22 | % | 8.41 | % | $ | 84.46 | ||||||||||||||||||||||||||||||||||||||||||||||
| Minimum | $ | 10.00 | $ | 166.96 | $ | 1.00 | $ | 11.19 | 9.98 | x | 89.37 | % | 12.39 | % | 94.43 | % | 10.03 | x | $ | 0.00 | 0.00 | % | 0.00 | % | $ | 1,347 | 13.87 | % | 13.14 | % | 0.88 | % | 1.24 | % | 8.95 | % | 1.24 | % | 8.91 | % | $ | 71.79 | ||||||||||||||||||||||||||||||||||||||||||||||
| All Non-MHC Public Companies(6) | ||||||||||||||||||||||||||||||||||||||||||||||||||||||||||||||||||||||||||||||||||||||||
| Averages | $ | 22.01 | $ | 618.58 | $ | 1.56 | $ | 17.59 | 15.92 | x | 125.94 | % | 15.02 | % | 140.56 | % | 17.00 | x | $ | 0.40 | 2.00 | % | 45.56 | % | $ | 4,285 | 12.91 | % | 12.00 | % | 0.79 | % | 0.78 | % | 6.64 | % | 0.89 | % | 7.49 | % | ||||||||||||||||||||||||||||||||||||||||||||||||
| Median | $ | 16.88 | $ | 227.31 | $ | 0.98 | $ | 15.59 | 14.88 | x | 117.19 | % | 14.82 | % | 129.35 | % | 14.63 | x | $ | 0.34 | 1.83 | % | 40.80 | % | $ | 1,191 | 11.88 | % | 10.82 | % | 0.65 | % | 0.75 | % | 6.82 | % | 0.88 | % | 7.37 | % | ||||||||||||||||||||||||||||||||||||||||||||||||
| ALL NY Thrifts | ||||||||||||||||||||||||||||||||||||||||||||||||||||||||||||||||||||||||||||||||||||||||
| Averages | $ | 14.23 | $ | 1,087.38 | $ | 0.41 | $ | 11.29 | 14.39 | x | 159.89 | % | 12.64 | % | 175.08 | % | 15.04 | x | $ | 0.43 | 2.90 | % | 53.16 | % | $ | 9,345 | 11.40 | % | 10.33 | % | 0.65 | % | 0.67 | % | 6.37 | % | 0.55 | % | 4.48 | % | ||||||||||||||||||||||||||||||||||||||||||||||||
| Medians | $ | 17.00 | $ | 337.88 | $ | 0.55 | $ | 14.31 | 14.77 | x | 118.93 | % | 11.21 | % | 143.63 | % | 15.04 | x | $ | 0.42 | 3.11 | % | 42.06 | % | $ | 1,474 | 9.77 | % | 8.93 | % | 0.46 | % | 0.85 | % | 7.24 | % | 0.76 | % | 6.11 | % | ||||||||||||||||||||||||||||||||||||||||||||||||
| Comparable Group | ||||||||||||||||||||||||||||||||||||||||||||||||||||||||||||||||||||||||||||||||||||||||
| Averages | $ | 35.48 | $ | 217.55 | $ | 3.45 | $ | 26.63 | 14.72 | x | 123.16 | % | 15.54 | % | 129.23 | % | 14.38 | x | $ | 0.41 | 1.46 | % | 31.05 | % | $ | 1,428 | 12.54 | % | 12.02 | % | 0.75 | % | 0.81 | % | 6.78 | % | 0.96 | % | 8.03 | % | ||||||||||||||||||||||||||||||||||||||||||||||||
| Medians | $ | 18.78 | $ | 163.91 | $ | 1.08 | $ | 15.63 | 14.63 | x | 117.29 | % | 14.36 | % | 125.03 | % | 14.52 | x | $ | 0.21 | 1.23 | % | 21.05 | % | $ | 1,278 | 11.03 | % | 10.69 | % | 0.66 | % | 0.71 | % | 6.31 | % | 0.93 | % | 7.34 | % | ||||||||||||||||||||||||||||||||||||||||||||||||
| Comparable Group | ||||||||||||||||||||||||||||||||||||||||||||||||||||||||||||||||||||||||||||||||||||||||
| ESSA | ESSA Bancorp, Inc. | PA | $ | 15.25 | $ | 167.65 | $ | 1.05 | $ | 15.63 | 14.95 | x | 97.55 | % | 9.68 | % | 106.23 | % | 14.52 | x | $ | 0.40 | 2.62 | % | 36.27 | % | $ | 1,834 | 9.77 | % | 9.02 | % | 0.64 | % | 0.36 | % | 3.61 | % | 0.60 | % | 6.01 | % | ||||||||||||||||||||||||||||||||||||||||||||||
| HIFS | Hingham Institution for Savings | MA | $ | 183.95 | $ | 392.32 | $ | 14.99 | $ | 99.67 | 13.23 | x | 184.55 | % | 16.29 | % | 184.55 | % | 12.27 | x | $ | 1.48 | 0.80 | % | 13.81 | % | $ | 2,370 | 8.85 | % | 8.85 | % | 0.08 | % | 1.42 | % | 16.55 | % | 1.38 | % | 16.14 | % | ||||||||||||||||||||||||||||||||||||||||||||||
| HMNF | HMN Financial, Inc. | MN | $ | 19.55 | $ | 89.55 | NA | $ | 17.19 | 11.37 | x | 113.70 | % | 13.27 | % | 115.17 | % | NM | $ | 0.00 | 0.00 | % | 0.00 | % | $ | 737 | 10.85 | % | 10.72 | % | 0.93 | % | 0.87 | % | 7.55 | % | 1.03 | % | 8.93 | % | ||||||||||||||||||||||||||||||||||||||||||||||||
| PCSB | PCSB Financial Corporation | NY | $ | 20.70 | $ | 337.88 | $ | 0.55 | $ | 15.62 | NM | 132.54 | % | 24.58 | % | 135.58 | % | NM | $ | 0.12 | 0.58 | % | 21.05 | % | $ | 1,474 | 19.66 | % | 19.30 | % | 0.76 | % | 0.50 | % | 2.51 | % | 0.61 | % | 3.08 | % | ||||||||||||||||||||||||||||||||||||||||||||||||
| PBIP | Prudential Bancorp, Inc. | PA | $ | 18.01 | $ | 160.16 | NA | $ | 14.69 | 18.38 | x | 122.56 | % | 14.36 | % | 129.12 | % | NM | $ | 0.20 | 1.11 | % | 56.12 | % | $ | 1,081 | 11.88 | % | 11.33 | % | 1.39 | % | 0.72 | % | 5.45 | % | 0.95 | % | 7.12 | % | ||||||||||||||||||||||||||||||||||||||||||||||||
| SVBI | Severn Bancorp, Inc. | MD | $ | 8.85 | $ | 112.58 | NA | NA | 13.21 | x | 117.19 | % | NA | 118.55 | % | NM | $ | 0.12 | 1.36 | % | 17.91 | % | $ | 889 | 10.78 | % | 10.67 | % | 1.94 | % | 0.69 | % | 6.30 | % | 0.92 | % | 8.42 | % | ||||||||||||||||||||||||||||||||||||||||||||||||||
| STND | Standard AVB Financial Corp. | PA | $ | 30.49 | $ | 141.22 | NA | $ | 28.65 | 16.22 | x | 106.42 | % | 15.10 | % | 137.21 | % | NM | $ | 0.88 | 2.90 | % | 47.02 | % | $ | 983 | 13.77 | % | 11.19 | % | 0.30 | % | 0.86 | % | 6.33 | % | 0.97 | % | 7.13 | % | ||||||||||||||||||||||||||||||||||||||||||||||||
| WSBF | Waterstone Financial, Inc. | WI | $ | 16.24 | $ | 425.31 | $ | 1.11 | $ | 14.04 | 14.63 | x | 115.65 | % | 24.13 | % | 115.83 | % | 14.63 | x | $ | 0.48 | 2.96 | % | 88.29 | % | $ | 1,919 | 21.08 | % | 21.06 | % | 0.61 | % | 1.52 | % | 6.91 | % | 1.66 | % | 7.55 | % | ||||||||||||||||||||||||||||||||||||||||||||||
| WEBK | Wellesley Bancorp, Inc. | MA | $ | 32.00 | $ | 77.42 | $ | 2.40 | $ | 25.79 | 13.33 | x | 124.08 | % | 9.27 | % | 124.08 | % | 13.33 | x | $ | 0.22 | 0.69 | % | 8.96 | % | $ | 837 | 7.53 | % | 7.53 | % | 0.14 | % | 0.57 | % | 7.59 | % | 0.69 | % | 9.20 | % | ||||||||||||||||||||||||||||||||||||||||||||||
| WNEB | Western New England Bancorp, Inc. | MA | $ | 9.80 | $ | 271.39 | $ | 0.57 | $ | 8.35 | 17.19 | x | 117.39 | % | 13.13 | % | 125.99 | % | 17.12 | x | $ | 0.16 | 1.63 | % | 21.05 | % | $ | 2,151 | 11.22 | % | 10.54 | % | 0.69 | % | 0.59 | % | 5.00 | % | 0.78 | % | 6.67 | % | ||||||||||||||||||||||||||||||||||||||||||||||
| (1) | Core income, on a diluted per-share basis. Core income is net income after taxes and before extraordinary items, less net income attributable to noncontrolling interest, gain on the sale of securities, amortization of intangibles, goodwill and nonrecurring items. |
| (2) | P/E = Price to earnings; P/B = Price to book; P/A = Price to assets; P/TB = Price to tangible book value; and P/Core = Price to core earnings. P/E and P/Core =NM if the ratio is negative or above 35x. |
| (3) | Indicated 12 month dividend, based on last quarterly dividend declared. |
| (4) | Indicated 12 month dividend as a percent of trailing 12 month earnings. |
| (5) | ROAA (return on average assets) and ROAE (return on average equity) are indicated ratios based on trailing 12 month earnings and average equity and assets balances. |
| (6) | Excludes from averages and medians those companies the subject of actual or rumored acquisition activities or unusual operating characteristics. |
| Source: | S&P Global Market Intelligence and RP Financial, LC. calculations. The information provided in this report has been obtained from sources we believe are reliable, but we cannot guarantee the accuracy or completeness of such information. |
Copyright (c) 2019 by RP® Financial, LC.
| RP® Financial, LC. | VALUATION ANALYSIS IV. 22 |
On an MHC reported basis, the Bank’s P/B and P/TB ratios at the $196.4 million midpoint value equaled 99.30% and 104.60%, respectively. In comparison to the average P/B and P/TB ratios indicated for the Peer Group of 123.16% and 129.23%, respectively, Pioneer Bank’s ratios were discounted by 19.37% on a P/B basis and 19.06% on a P/TB basis. In comparison to the Peer Group’s median P/B and P/TB ratios of 117.29% and 125.03%, respectively, the Bank’s pro forma P/B and P/TB ratios (MHC basis) at the midpoint value reflected discounts of 15.34% and 16.34%, respectively. At the top of the super range, the Bank’s P/B and P/TB ratios (MHC basis) equaled 117.37% and 123.00%, respectively. In comparison to the Peer Group’s average P/B and P/TB ratios, the Bank’s P/B and P/TB ratios at the top of the super range reflected discounts of 4.70% and 4.82%, respectively. In comparison to the Peer Group’s median P/B and P/TB ratios, the Bank’s P/B and P/TB ratios at the top of the super range reflected a premium of 0.07% and a discount of 1.62%, respectively.
3. Price-to-Assets ("P/A"). The P/A valuation methodology determines market value by applying a valuation P/A ratio (fully-converted basis) to the Bank’s pro forma asset base, conservatively assuming no deposit withdrawals are made to fund stock purchases. In all likelihood there will be deposit withdrawals, which results in understating the pro forma P/A ratio which is computed herein. At the $196.4 million midpoint of the valuation range, Pioneer Bank’s pro forma P/A ratio (fully-converted basis) equaled 13.52% of pro forma assets. Comparatively, the Peer Group companies exhibited an average P/A ratio of 15.54%, which implies a discount of 13.00% has been applied to the Bank’s pro forma P/A ratio. In comparison to the Peer Group’s median P/A ratio of 14.36%, the Bank’s pro forma P/A ratio (fully-converted basis) at the midpoint value reflects a discount of 5.85%.
On an MHC reported basis, Pioneer Bank’s pro forma P/A ratio at the $196.4 million midpoint value equaled 14.46%. In comparison to the Peer Group's average P/A ratio of 15.54%, Pioneer Bank’s P/A ratio (MHC basis) indicated a discount of 6.95%. In comparison to the Peer Group’s median P/A ratio of 14.36%, the Bank’s pro forma P/A ratio (MHC basis) at the midpoint value reflects a premium of 0.70%.
| RP® Financial, LC. | VALUATION ANALYSIS IV. 23 |
Comparison to Publicly-Traded MHCs
As indicated in Chapter III, we believe there are a number of characteristics of MHC shares that make them different from the shares of fully-converted companies. These factors include: (1) lower aftermarket liquidity in the MHC shares since less than 50% of the shares are available for trading; (2) no opportunity for public shareholders to exercise voting control; (3) the potential pro forma impact of second-step conversions on the pricing of MHC institutions; and (4) the regulatory policies regarding the accounting for net assets held by the MHC in a second-step conversion and, thereby, lessening the attractiveness of paying cash dividends. The above characteristics of MHC shares have provided MHC stocks with different trading characteristics versus fully-converted companies. To account for the unique trading characteristics of MHC shares, RP Financial has placed the financial data and pricing ratios of the publicly-traded MHCs on a fully-converted basis to make them comparable for valuation purposes. Using the per share and pricing information of the publicly-traded MHCs on a fully-converted basis accomplishes a number of objectives. First, such figures eliminate distortions that result when trying to compare institutions that have different public ownership interests outstanding. Secondly, such an analysis provides ratios that are comparable to the pricing information of fully-converted public companies and are directly applicable to determining the pro forma market value range of the 100% ownership interest in Pioneer Bank as an MHC. This technique is validated by the investment community's evaluation of MHC pricing, which also incorporates the pro forma impact of a second-step conversion based on the current market price.
To calculate the fully-converted pricing information for MHCs, the reported financial information for the public MHCs incorporates the following assumptions: (1) all shares owned by the MHC are assumed to be sold at the current trading price in a second step-conversion; (2) the gross proceeds from such a sale are adjusted to reflect reasonable offering expenses and standard stock based benefit plan parameters that would be factored into a second-step conversion of an MHC institution; and (3) net proceeds are assumed to be reinvested at market rates on a tax effected basis. Book value per share and earnings per share figures for the public MHCs were adjusted by the impact of the assumed second step-conversion, resulting in an estimation of book value per share and earnings per share figures on a fully-converted basis. Table 4.5 shows the calculation of per share financial data (fully-converted basis) for each of the 14 publicly-traded MHC institutions.
| RP® Financial, LC. | VALUATION ANALYSIS IV. 24 |
Table 4.5
Calculation of Implied Per Share Data - Incorporating MHC Second Step Conversion
Publicly Traded MHC Institutions
| Per Share | Net | Net | Pro Forma | |||||||||||||||||||||||||||||||||||||||||||||||||||||||||||||
| Current Ownership | TTM NI | Tang. | Share | Gross | Capital | Income | Net Inc./ | Bk Value/ | Tang. Bk. | Assets/ | ||||||||||||||||||||||||||||||||||||||||||||||||||||||
| Ticker | Name | City | State | Exhange | Public | MHC Shares | Total Shares | Reported | Bk Value | Assets | Price | Proceeds(1) | Increase(2) | Increase(3) | Share | Share | Value/Share | Share | ||||||||||||||||||||||||||||||||||||||||||||||
| BCOW | 1895 Bancorp Of Wisconsin, Inc. (MHC) | Greenfield | WI | NASDAQ | 2,194,505 | 2,682,172 | 4,876,677 | $ | (0.74 | ) | $ | 7.74 | $ | 99.01 | $ | 9.48 | $ | 25,437,719 | $ | 21,876,439 | $ | 236,723 | $ | (0.70 | ) | $ | 12.23 | $ | 12.23 | $ | 103.50 | |||||||||||||||||||||||||||||||||
| CLBK | Columbia Financial, Inc. (MHC) | Fair Lawn | NJ | NASDAQ | 53,309,020 | 62,580,155 | 115,889,175 | $ | 0.20 | $ | 8.34 | $ | 57.74 | $ | 15.77 | $ | 986,889,044 | $ | 848,724,578 | $ | 9,183,989 | $ | 0.28 | $ | 15.71 | $ | 15.66 | $ | 65.07 | |||||||||||||||||||||||||||||||||||
| CFBI | Community First Bancshares, Inc. (MHC) | Covington | GA | NASDAQ | 3,443,282 | 4,070,655 | 7,513,937 | $ | 0.06 | $ | 10.17 | $ | 40.72 | $ | 10.33 | $ | 42,049,866 | $ | 36,162,885 | $ | 391,316 | $ | 0.11 | $ | 14.98 | $ | 14.98 | $ | 45.53 | |||||||||||||||||||||||||||||||||||
| FFBW | FFBW, Inc. (MHC) | Brookfield | WI | NASDAQ | 3,059,867 | 3,636,875 | 6,696,742 | $ | 0.16 | $ | 9.00 | $ | 39.23 | $ | 11.22 | $ | 40,791,554 | $ | 35,080,736 | $ | 379,606 | $ | 0.21 | $ | 14.25 | $ | 14.24 | $ | 44.47 | |||||||||||||||||||||||||||||||||||
| GCBC | Greene County Bancorp, Inc. (MHC) | Catskill | NY | NASDAQ | 3,928,550 | 4,609,264 | 8,537,814 | $ | 1.90 | $ | 12.20 | $ | 140.00 | $ | 32.33 | $ | 149,017,505 | $ | 128,155,054 | $ | 1,386,757 | $ | 2.07 | $ | 27.21 | $ | 27.21 | $ | 155.01 | |||||||||||||||||||||||||||||||||||
| HONE | HarborOne Bancorp, Inc. (MHC) | Brockton | MA | NASDAQ | 15,304,485 | 17,281,034 | 32,585,519 | $ | 0.35 | $ | 8.57 | $ | 112.11 | $ | 15.33 | $ | 264,918,251 | $ | 227,829,696 | $ | 2,465,329 | $ | 0.43 | $ | 17.97 | $ | 15.56 | $ | 119.10 | |||||||||||||||||||||||||||||||||||
| KFFB | Kentucky First Federal Bancorp (MHC) | Frankfort | KY | NASDAQ | 3,660,377 | 4,727,938 | 8,388,315 | $ | 0.06 | $ | 6.24 | $ | 38.26 | $ | 7.50 | $ | 35,459,535 | $ | 30,495,200 | $ | 329,986 | $ | 0.10 | $ | 11.60 | $ | 9.87 | $ | 41.90 | |||||||||||||||||||||||||||||||||||
| LSBK | Lake Shore Bancorp, Inc. (MHC) | Dunkirk | NY | NASDAQ | 2,367,789 | 3,636,875 | 6,004,664 | $ | 0.67 | $ | 13.29 | $ | 90.88 | $ | 15.93 | $ | 57,934,691 | $ | 49,823,835 | $ | 539,140 | $ | 0.76 | $ | 21.59 | $ | 21.59 | $ | 99.18 | |||||||||||||||||||||||||||||||||||
| MGYR | Magyar Bancorp, Inc. (MHC) | New Brunswick | NJ | NASDAQ | 2,620,296 | 3,200,450 | 5,820,746 | $ | 0.41 | $ | 8.99 | $ | 110.57 | $ | 11.65 | $ | 37,285,243 | $ | 32,065,309 | $ | 346,976 | $ | 0.47 | $ | 14.50 | $ | 14.50 | $ | 116.08 | |||||||||||||||||||||||||||||||||||
| OFED | Oconee Federal Financial Corp. (MHC) | Seneca | SC | NASDAQ | 1,600,483 | 4,164,415 | 5,764,898 | $ | 0.53 | $ | 14.10 | $ | 86.12 | $ | 24.43 | $ | 101,736,658 | $ | 87,493,526 | $ | 946,761 | $ | 0.70 | $ | 29.80 | $ | 29.28 | $ | 101.30 | |||||||||||||||||||||||||||||||||||
| PDLB | PDL Community Bancorp (MHC) | Bronx | NY | NASDAQ | 8,917,641 | 9,545,387 | 18,463,028 | $ | (0.04 | ) | $ | 9.05 | $ | 53.23 | $ | 12.63 | $ | 120,558,238 | $ | 103,680,085 | $ | 1,121,915 | $ | 0.02 | $ | 14.67 | $ | 14.67 | $ | 58.84 | ||||||||||||||||||||||||||||||||||
| PVBC | Provident Bancorp, Inc. (MHC) | Amesbury | MA | NASDAQ | 4,591,396 | 5,034,323 | 9,625,719 | $ | 0.97 | $ | 13.05 | $ | 101.20 | $ | 23.00 | $ | 115,789,429 | $ | 99,578,909 | $ | 1,077,536 | $ | 1.08 | $ | 23.39 | $ | 23.39 | $ | 111.54 | |||||||||||||||||||||||||||||||||||
| RBKB | Rhinebeck Bancorp, Inc. (MHC) | Poughkeepsie | NY | NASDAQ | 4,787,315 | 6,345,975 | 11,133,290 | $ | 0.39 | $ | 5.17 | $ | 79.26 | $ | 11.44 | $ | 72,597,954 | $ | 62,434,240 | $ | 675,597 | $ | 0.45 | $ | 10.93 | $ | 10.78 | $ | 84.87 | |||||||||||||||||||||||||||||||||||
| TFSL | TFS Financial Corporation (MHC) | Cleveland | OH | NASDAQ | 53,016,032 | 227,119,132 | 280,135,164 | $ | 0.31 | $ | 6.19 | $ | 50.83 | $ | 16.92 | $ | 3,842,855,713 | $ | 3,304,855,914 | $ | 35,761,615 | $ | 0.44 | $ | 18.02 | $ | 17.99 | $ | 62.63 | |||||||||||||||||||||||||||||||||||
| (1) | Gross proceeds calculated as stock price multiplied by the number of shares owned by the MHC (i.e. non-public shares). |
| (2) | Net increase in capital reflects gross proceeds less offering expenses, contra-equity account for leveraged ESOP and Restricted Stock Plan. For MHC's with assets at the MHC level, the net increase in capital also includes consolidation of MHC assets with the capital of the institution concurrent with hypothetical second step. |
| Offering Expense Percent: | 2.00 | % | ||
| ESOP Percent Purchase: | 8.00 | % | ||
| RRP Percent Purchase: | 4.00 | % |
| (3) | Net increase in earnings reflects after-tax reinvestment income (assumes ESOP and RRP do not generate reinvestment income), less after-tax ESOP amortization and RRP vesting. |
| After-Tax Reinvestment Rate: | 3.50 | % | ||
| ESOP Loan Term (Yrs.): | 10 | |||
| Recognition Plan Vesting (Yrs.): | 5 | |||
| Effective Tax Rate: | 34.00 | % |
Source: S&P Global Market Intelligence and RP Financial, LC. calculations.
| RP® Financial, LC. | VALUATION ANALYSIS IV. 25 |
The table below shows a comparative pricing analysis of the publicly-traded MHCs on a fully-converted basis versus the Bank’s Peer Group. In comparison to the Peer Group’s P/TB ratio, the P/TB ratio of the publicly-traded MHCs reflected a discount of 31.38%. In comparison to the Peer Group’s core P/E multiple, the P/E multiple of the publicly-traded MHCs reflected a premium of 85.26%. Detailed pricing characteristics of the fully-converted MHCs is shown in Table 4.6.
| Publicly-Traded | ||||||||
| MHCs | Peer Group | |||||||
| Pricing Ratios (Averages)(1) | ||||||||
| Price/earnings (x) | 27.27 | x | 14.72 | x | ||||
| Price/tangible book (%) | 88.68 | % | 129.23 | % | ||||
| Price/assets (%) | 18.98 | 15.54 | ||||||
(1) Based on market prices as of February 8, 2019.
In comparison to the publicly-traded MHCs, the Bank’s pro forma P/TB ratio (fully-converted basis) of 69.44% at the midpoint of the valuation range reflected a discount of 21.70%. At the top of the super range, the Bank’s P/TB ratio (fully-converted basis) of 77.64% reflected a discount of 10.43%. In comparison to the publicly-traded MHCs, the Bank’s pro forma P/E multiple (fully-converted basis) of 11.53 times at the midpoint of the valuation range reflected a discount of 57.72%. At the top of the super range, the Bank’s P/E multiple (fully-converted basis) of 15.20 times reflected a discount of 44.26%.
It should be noted that in a comparison of the publicly-traded MHCs to Pioneer Bank, the publicly-traded MHCs maintain certain inherent characteristics in support of increasing the attractiveness of their stocks relative to Pioneer Bank’s stock as an MHC that will just be completing an IPO: (1) the seasoned publicly-traded MHCs are viewed as potential candidates to complete a second-step offering; and (2) some of the publicly-traded MHCs have been grandfathered to waive dividend payments to the MHC pursuant to receiving an annual majority vote by the depositors to approve the waiver of dividends.
Comparison to Recent MHC Offerings
As indicated at the beginning of this chapter, RP Financial’s analysis of recent conversion offering pricing characteristics at closing and in the aftermarket has been limited to a “technical” analysis and, thus, the pricing characteristics of recent conversion offerings cannot be a primary determinate of value. Particular focus was placed on the P/TB approach in this analysis, since the P/E multiples do not reflect the actual impact of reinvestment and the source of the stock proceeds (i.e., external funds vs. deposit withdrawals). In comparison to the two recently completed first-step offerings average pro forma P/TB ratio of 68.00%, the Bank’s P/TB ratio of 69.44% at the midpoint value reflects an implied premium of 2.12%. At the top of the super maximum, the Bank’s P/TB ratio of 77.64% reflects an implied premium of 14.18% relative to average closing pro forma P/TB ratio of the two recently completed first-step offerings.
| RP® Financial, LC. | VALUATION ANALYSIS IV. 26 |
Table 4.6
MHC Institutions Implied Pricing Ratios, Full Conversion Basis
Financial Data as of the Most Recent Quarter or Twelve Month Period Available
Prices as of February 8, 2019
| Key Financial Data | ||||||||||||||||||||||||||||||||||||||||||||||||||||||||||||||||||||
| Per Share Data | Pricing Ratios | Dividends | LTM | |||||||||||||||||||||||||||||||||||||||||||||||||||||||||||||||||
| Stock | Mkt | LTM | Tang. | P/E | Price/ | Price/ | Price/ | Ann Div | Div. | Div Pay | Total | Tang. | Reported | |||||||||||||||||||||||||||||||||||||||||||||||||||||||
| Ticker | Company Name | City | State | Exchange | Price | Value | EPS | BV/Sh | LTM | Book | TBk | Assts | Rate | Yield | Ratio | Assets | E/A | ROAA | ROAE | |||||||||||||||||||||||||||||||||||||||||||||||||
| ($) | ($M) | ($) | ($) | (x) | (%) | (%) | (%) | ($) | (%) | (%) | ($000) | (%) | (%) | (%) | ||||||||||||||||||||||||||||||||||||||||||||||||||||||
| Publicly Traded MHCs, Full Conversion Basis - Averages | 15.57 | 606.5 | 0.46 | 17.28 | 27.27 | 86.68 | 88.68 | 18.98 | 0.00 | 0.00 | 0.00 | 2,624,604 | 21.82 | 0.46 | 2.10 | |||||||||||||||||||||||||||||||||||||||||||||||||||||
| Publicly Traded MHCs, Full Conversion Basis - Medians | 13.98 | 134.1 | 0.43 | 15.27 | 25.06 | 83.66 | 84.77 | 20.74 | 0.00 | 0.00 | 0.00 | 810,254 | 22.66 | 0.45 | 2.35 | |||||||||||||||||||||||||||||||||||||||||||||||||||||
| Publicly Traded MHCs, Full Conversion Basis | ||||||||||||||||||||||||||||||||||||||||||||||||||||||||||||||||||||
| BCOW | 1895 Bancorp Of Wisconsin, Inc. (MHC) | Greenfield | WI | NASDAQ | 9.48 | 46.3 | -0.70 | 12.23 | NM | 77.57 | 77.57 | 9.16 | 0.00 | 0.00 | 0.0 | 504,720 | 11.81 | -0.67 | -5.69 | |||||||||||||||||||||||||||||||||||||||||||||||||
| CLBK | Columbia Financial, Inc. (MHC) | Fair Lawn | NJ | NASDAQ | 15.77 | 1,827.6 | 0.28 | 15.66 | NM | 100.37 | 100.69 | 24.24 | 0.00 | 0.00 | 0.0 | 7,540,343 | 24.07 | 0.42 | 1.75 | |||||||||||||||||||||||||||||||||||||||||||||||||
| CFBI | Community First Bancshares, Inc. (MHC) | Covington | GA | NASDAQ | 10.33 | 77.6 | 0.11 | 14.98 | NM | 68.97 | 68.97 | 22.69 | 0.00 | 0.00 | 0.0 | 342,147 | 32.89 | 0.25 | 0.75 | |||||||||||||||||||||||||||||||||||||||||||||||||
| FFBW | FFBW, Inc. (MHC) | Brookfield | WI | NASDAQ | 11.22 | 75.1 | 0.21 | 14.24 | NM | 78.70 | 78.77 | 25.22 | 0.00 | 0.00 | 0.0 | 297,807 | 32.02 | 0.48 | 1.51 | |||||||||||||||||||||||||||||||||||||||||||||||||
| GCBC | Greene County Bancorp, Inc. (MHC) | Catskill | NY | NASDAQ | 32.33 | 276.0 | 2.07 | 27.21 | 15.64 | 118.84 | 118.84 | 20.86 | 0.00 | 0.00 | 0.0 | 1,323,441 | 17.55 | 1.33 | 7.60 | |||||||||||||||||||||||||||||||||||||||||||||||||
| HONE | HarborOne Bancorp, Inc. (MHC) | Brockton | MA | NASDAQ | 15.33 | 499.5 | 0.43 | 15.56 | 36.04 | 85.33 | 98.54 | 12.87 | 0.00 | 0.00 | 0.0 | 3,880,951 | 13.06 | 0.36 | 2.37 | |||||||||||||||||||||||||||||||||||||||||||||||||
| KFFB | Kentucky First Federal Bancorp (MHC) | Frankfort | KY | NASDAQ | 7.50 | 62.9 | 0.10 | 9.87 | NM | 64.65 | 75.98 | 17.90 | 0.00 | 0.00 | 0.0 | 351,449 | 23.56 | 0.23 | 0.83 | |||||||||||||||||||||||||||||||||||||||||||||||||
| LSBK | Lake Shore Bancorp, Inc. (MHC) | Dunkirk | NY | NASDAQ | 15.93 | 95.7 | 0.76 | 21.59 | 21.07 | 73.79 | 73.79 | 16.06 | 0.00 | 0.00 | 0.0 | 595,532 | 21.77 | 0.76 | 3.50 | |||||||||||||||||||||||||||||||||||||||||||||||||
| MGYR | Magyar Bancorp, Inc. (MHC) | New Brunswick | NJ | NASDAQ | 11.65 | 67.8 | 0.47 | 14.50 | 24.81 | 80.35 | 80.35 | 10.04 | 0.00 | 0.00 | 0.0 | 675,650 | 12.49 | 0.40 | 3.24 | |||||||||||||||||||||||||||||||||||||||||||||||||
| OFED | Oconee Federal Financial Corp. (MHC) | Seneca | SC | NASDAQ | 24.43 | 140.8 | 0.70 | 29.28 | 35.14 | 81.99 | 83.44 | 24.12 | 0.00 | 0.00 | 0.0 | 583,974 | 28.90 | 0.69 | 2.33 | |||||||||||||||||||||||||||||||||||||||||||||||||
| PDLB | PDL Community Bancorp (MHC) | Bronx | NY | NASDAQ | 12.63 | 233.2 | 0.02 | 14.67 | NM | 86.10 | 86.10 | 21.46 | 0.00 | 0.00 | 0.0 | 1,086,391 | 24.93 | 0.03 | 0.11 | |||||||||||||||||||||||||||||||||||||||||||||||||
| PVBC | Provident Bancorp, Inc. (MHC) | Amesbury | MA | NASDAQ | 23.00 | 221.4 | 1.08 | 23.39 | 21.28 | 98.33 | 98.33 | 20.62 | 0.00 | 0.00 | 0.0 | 1,073,658 | 20.97 | 0.97 | 4.62 | |||||||||||||||||||||||||||||||||||||||||||||||||
| RBKB | Rhinebeck Bancorp, Inc. (MHC) | Poughkeepsie | NY | NASDAQ | 11.44 | 127.4 | 0.45 | 10.78 | 25.31 | 104.65 | 106.12 | 13.48 | 0.00 | 0.00 | 0.0 | 944,857 | 12.70 | 0.53 | 4.13 | |||||||||||||||||||||||||||||||||||||||||||||||||
| TFSL | TFS Financial Corporation (MHC) | Cleveland | OH | NASDAQ | 16.92 | 4,739.9 | 0.44 | 17.99 | 38.89 | 93.88 | 94.07 | 27.02 | 0.00 | 0.00 | 0.0 | 17,543,534 | 28.72 | 0.69 | 2.41 | |||||||||||||||||||||||||||||||||||||||||||||||||
Source: S&P Global Market Intelligence and RP Financial, LC. calculations.
| RP® Financial, LC. | VALUATION ANALYSIS IV. 27 |
Valuation Conclusion
Based on the foregoing, it is our opinion that, as of February 8, 2019, the estimated aggregate pro forma market value of the shares to be issued immediately following the conversion, both shares issued publicly as well as to the MHC, equaled $196,428,570 at the midpoint, equal to 19,642,857 shares offered at a per share value of $10.00. Pursuant to conversion guidelines, the 15% offering range indicates a minimum value of $166,964,280 and a maximum value of $225,892,860. Based on the $10.00 per share offering price determined by the Board, this valuation range equates to total shares outstanding of 16,696,428 at the minimum and 22,589,286 at the maximum. In the event the appraised value is subject to an increase, the aggregate pro forma market value may be increased up to a super maximum value of $259,776,790 without a resolicitation. Based on the $10.00 per share offering price, the super maximum value would result in total shares outstanding of 25,977,679. The Board of Directors has established a public offering range such that the public ownership of the Bank will constitute a 43.0% ownership interest prior to the issuance of shares to the Foundation. Accordingly, the offering to the public of the minority stock will equal $71,794,650 at the minimum, $84,464,290 at the midpoint, $97,133,930 at the maximum and $111,704,020 at the super maximum of the valuation range. Based on the public offering range and inclusive of the shares issued to the Foundation, equal to 2.0% of the shares issued in the stock issuance, the public ownership of shares will represent 45.0% of the shares issued throughout the valuation range. The pro forma valuation calculations relative to the Peer Group (fully-converted basis) are shown in Table 4.3 and are detailed in Exhibit IV-7 and Exhibit IV-8; the pro forma valuation calculations relative to the Peer Group based on reported financials are shown in Table 4.4 and are detailed in Exhibits IV-9 and IV-10.
EXHIBITS
LIST OF EXHIBITS
| Exhibit Number | Description | |
| I-1 | Map of Office Locations | |
| I-2 | Audited Financial Statements | |
| I-3 | Key Operating Ratios | |
| I-4 | Investment Portfolio Composition | |
| I-5 | Yields and Costs | |
| I-6 | Loan Loss Allowance Activity | |
| I-7 | Interest Rate Risk Analysis | |
| I-8 | Fixed and Adjustable Rate Loans | |
| I-9 | Loan Portfolio Composition | |
| I-10 | Contractual Maturity by Loan Type | |
| I-11 | Non-Performing Assets | |
| I-12 | Deposit Composition | |
| I-13 | Maturity of Jumbo Time Deposits | |
| I-14 | Borrowing Activity | |
| II-1 | Description of Office Properties | |
| II-2 | Historical Interest Rates |
LIST OF EXHIBITS (continued)
| Exhibit Number | Description | |
| III-1 | General Characteristics of Publicly-Traded Institutions | |
| III-2 | Public Market Pricing of Mid-Atlantic Thrift Institutions | |
| III-3 | Public Market Pricing of New England Thrift Institutions | |
| III-4 | Public Market Pricing of Midwest Thrift Institutions | |
| III-5 | Peer Group Market Area Comparative Analysis | |
| IV-1 | Stock Prices: As of February 8, 2019 | |
| IV-2 | Historical Stock Price Indices | |
| IV-3 | Stock Indices as of February 8, 2019 | |
| IV-4 | New York Thrift Acquisitions 2014 - Present | |
| IV-5 | Director and Senior Management Summary Resumes | |
| IV-6 | Pro Forma Regulatory Capital Ratios | |
| IV-7 | Pro Forma Analysis Sheet – Fully Converted Basis | |
| IV-8 | Pro Forma Effect of Conversion Proceeds – Fully Converted Basis | |
| IV-9 | Pro Forma Analysis Sheet – Minority Stock Offering | |
| IV-10 | Pro Forma Effect of Conversion Proceeds – Minority Stock Offering | |
| V-1 | Firm Qualifications Statement |
EXHIBIT I-1
Pioneer Bank
Map of Office Locations
Exhibit I-1
Pioneer Bank
Map of Office Locations
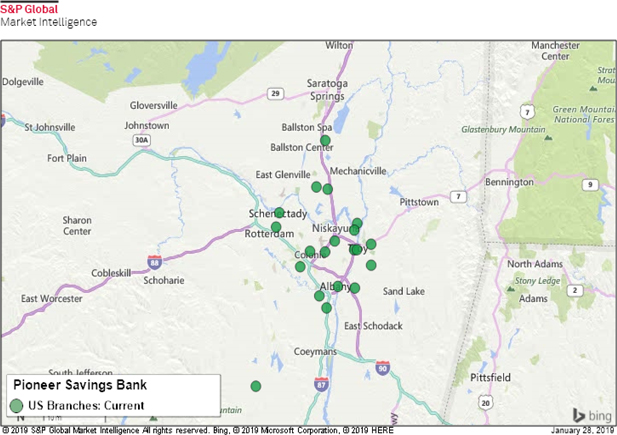
Source: S&P Global Market Intelligence.
EXHIBIT I-2
Pioneer Bank
Audited Financial Statements
[Incorporated by Reference]
EXHIBIT I-3
Pioneer Bank
Key Operating Ratios
Exhibit I-3
Pioneer Bank
Key Operating Ratios
| At or For the Six Months Ended December 31, (1) | At or For the Years Ended June 30, | |||||||||||||||||||||||||||
| 2018 | 2017 | 2018 | 2017 | 2016 | 2015 | 2014 | ||||||||||||||||||||||
| Performance Ratios: | ||||||||||||||||||||||||||||
| Return on average assets | 1.41 | % | 0.64 | % | 0.92 | % | 0.52 | % | 0.53 | % | 0.52 | % | 0.54 | % | ||||||||||||||
| Return on average equity | 15.48 | % | 7.45 | % | 10.51 | % | 5.83 | % | 5.18 | % | 4.59 | % | 4.87 | % | ||||||||||||||
| Interest rate spread (2) | 3.93 | % | 3.64 | % | 3.67 | % | 3.47 | % | 3.43 | % | 3.40 | % | 3.52 | % | ||||||||||||||
| Net interest margin (3) | 4.07 | % | 3.74 | % | 3.78 | % | 3.57 | % | 3.51 | % | 3.46 | % | 3.59 | % | ||||||||||||||
| Non-interest expenses to average assets | 2.81 | % | 2.92 | % | 2.91 | % | 3.27 | % | 3.19 | % | 3.23 | % | 3.32 | % | ||||||||||||||
| Efficiency ratio (4) | 59.99 | % | 66.93 | % | 64.74 | % | 76.70 | % | 78.14 | % | 78.33 | % | 79.43 | % | ||||||||||||||
| Average interest-earning assets to average interest-bearing liabilities | 145.54 | % | 140.35 | % | 141.31 | % | 139.29 | % | 139.05 | % | 136.82 | % | 133.33 | % | ||||||||||||||
| Capital Ratios: | ||||||||||||||||||||||||||||
| Average equity to average assets | 9.41 | % | 8.79 | % | 8.77 | % | 8.93 | % | 10.17 | % | 11.26 | % | 11.01 | % | ||||||||||||||
| Total capital to risk weighted assets | 13.29 | % | 12.60 | % | 12.86 | % | 12.41 | % | 14.10 | % | 15.65 | % | 16.11 | % | ||||||||||||||
| Tier 1 capital to risk weighted assets | 12.04 | % | 11.33 | % | 11.59 | % | 11.18 | % | 12.91 | % | 14.38 | % | 14.72 | % | ||||||||||||||
| Common equity tier 1 capital to risk weighted assets | 12.04 | % | 11.33 | % | 11.59 | % | 11.18 | % | 12.91 | % | 14.38 | % | 14.72 | % | ||||||||||||||
| Tier 1 capital to average assets | 9.70 | % | 9.13 | % | 9.17 | % | 9.60 | % | 10.87 | % | 11.79 | % | 12.04 | % | ||||||||||||||
| Asset Quality Ratios: | ||||||||||||||||||||||||||||
| Allowance for loan losses as a percentage of total loans | 1.31 | % | 1.28 | % | 1.35 | % | 1.25 | % | 1.23 | % | 1.31 | % | 1.43 | % | ||||||||||||||
| Allowance for loan losses as a percentage of non-performing loans | 115.83 | % | 160.05 | % | 142.05 | % | 149.68 | % | 155.44 | % | 143.85 | % | 152.68 | % | ||||||||||||||
| Net charge-offs to average outstanding loans during the period | 0.22 | % | 0.05 | % | 0.03 | % | 0.04 | % | 0.05 | % | 0.16 | % | 0.06 | % | ||||||||||||||
| Non-performing loans as a percentage of total loans | 1.13 | % | 0.80 | % | 0.95 | % | 0.84 | % | 0.79 | % | 0.91 | % | 0.94 | % | ||||||||||||||
| Non-performing loans as a percentage of total assets | 0.91 | % | 0.63 | % | 0.74 | % | 0.70 | % | 0.63 | % | 0.71 | % | 0.72 | % | ||||||||||||||
| Total non-performing assets as a percentage of total assets | 0.92 | % | 0.63 | % | 0.75 | % | 0.70 | % | 0.63 | % | 0.78 | % | 0.77 | % | ||||||||||||||
| Other: | ||||||||||||||||||||||||||||
| Number of offices | 22 | 22 | 22 | 22 | 18 | 17 | 17 | |||||||||||||||||||||
| Number of full-time equivalent employees | 256 | 255 | 259 | 251 | 215 | 230 | 228 | |||||||||||||||||||||
| (1) | Annualized. |
| (2) | Represents the difference between the weighted average yield on average interest-earning assets and the weighted average cost of interest-bearing liabilities. |
| (3) | Represents net interest income as a percentage of average interest-earning assets. |
| (4) | Represents non-interest expenses divided by the sum of net interest income and non-interest income. |
Source: Pioneer Bank’s prospectus.
EXHIBIT I-4
Pioneer Bank
Investment Portfolio Composition
Exhibit I-4
Pioneer Bank
Investment Portfolio Composition
| At December 31, | At June 30, | |||||||||||||||||||||||||||||||
| 2018 | 2018 | 2017 | 2016 | |||||||||||||||||||||||||||||
| Amortized Cost | Estimated Fair Value | Amortized Cost | Estimated Fair Value | Amortized Cost | Estimated Fair Value | Amortized Cost | Estimated Fair Value | |||||||||||||||||||||||||
| (In thousands) | ||||||||||||||||||||||||||||||||
| Securities available for sale: | ||||||||||||||||||||||||||||||||
| U.S. Government and agency obligations | $ | 83,538 | $ | 83,420 | $ | 58,743 | $ | 58,558 | $ | 42,967 | $ | 42,919 | $ | 61,915 | $ | 62,172 | ||||||||||||||||
| Mortgage-backed securities | 126 | 129 | 146 | 150 | 194 | 200 | 249 | 258 | ||||||||||||||||||||||||
| Asset-backed securities | 102 | 144 | 115 | 162 | 140 | 261 | 172 | 292 | ||||||||||||||||||||||||
| Collateralized mortgage obligations | 599 | 962 | 692 | 1,079 | 934 | 1,469 | 1,229 | 1,662 | ||||||||||||||||||||||||
| Municipal obligations | 14,644 | 14,668 | 19,264 | 19,263 | 28,350 | 28,366 | 27,119 | 27,147 | ||||||||||||||||||||||||
| Preferred stocks | 6,007 | 4,640 | 6,007 | 5,749 | 6,019 | 5,963 | 6,840 | 7,002 | ||||||||||||||||||||||||
| Common stocks | 2,809 | 3,181 | 2,541 | 3,102 | 2,762 | 2,797 | 2,478 | 2,418 | ||||||||||||||||||||||||
| Total | $ | 107,825 | $ | 107,144 | $ | 87,508 | $ | 88,063 | $ | 81,366 | $ | 81,975 | $ | 100,002 | $ | 100,951 | ||||||||||||||||
| At December 31, | At June 30, | |||||||||||||||||||||||||||||||
| 2018 | 2018 | 2017 | 2016 | |||||||||||||||||||||||||||||
| Amortized Cost | Estimated Fair Value | Amortized Cost | Estimated Fair Value | Amortized Cost | Estimated Fair Value | Amortized Cost | Estimated Fair Value | |||||||||||||||||||||||||
| (In thousands) | ||||||||||||||||||||||||||||||||
| Securities held to maturity: | ||||||||||||||||||||||||||||||||
| Municipal obligations | $ | 4,275 | $ | 4,292 | $ | 5,297 | $ | 5,326 | $ | 2,213 | $ | 2,259 | $ | 3,811 | $ | 3,811 | ||||||||||||||||
| Total | $ | 4,275 | $ | 4,292 | $ | 5,297 | $ | 5,326 | $ | 2,213 | $ | 2,259 | $ | 3,811 | $ | 3,811 | ||||||||||||||||
Source: Pioneer Bank’s prospectus.
EXHIBIT I-5
Pioneer Bank
Yields and Costs
Exhibit I-5
Pioneer Bank
Yields and Costs
| For the Six Months Ended December 31, | ||||||||||||||||||||||||
| 2018 | 2017 | |||||||||||||||||||||||
| Average Outstanding Balance | Interest | Average Yield/Cost (4) | Average Outstanding Balance | Interest | Average Yield/Cost (4) | |||||||||||||||||||
| (Dollarsin thousands) | ||||||||||||||||||||||||
| Interest-earning assets: | ||||||||||||||||||||||||
| Loans | $ | 1,022,324 | $ | 24,461 | 4.80 | % | $ | 956,389 | $ | 21,150 | 4.43 | % | ||||||||||||
| Securities | 112,174 | 1,269 | 2.26 | % | 78,028 | 574 | 1.46 | % | ||||||||||||||||
| Interest-earning deposits | 58,104 | 572 | 1.96 | % | 78,298 | 522 | 1.33 | % | ||||||||||||||||
| Other | 1,116 | 30 | 5.40 | % | 804 | 36 | 9.08 | % | ||||||||||||||||
| Total interest-earning assets | 1,193,718 | 26,332 | 4.42 | % | 1,113,519 | 22,282 | 4.01 | % | ||||||||||||||||
| Non-interest-earning assets | 112,071 | 102,815 | ||||||||||||||||||||||
| Total assets | $ | 1,305,789 | $ | 1,216,334 | ||||||||||||||||||||
| Interest-bearing liabilities: | ||||||||||||||||||||||||
| Demand deposits | $ | 104,775 | $ | 165 | 0.31 | % | $ | 96,524 | $ | 98 | 0.20 | % | ||||||||||||
| Savings deposits | 244,304 | 63 | 0.05 | % | 240,869 | 62 | 0.05 | % | ||||||||||||||||
| Money market deposits | 331,041 | 780 | 0.47 | % | 322,645 | 568 | 0.35 | % | ||||||||||||||||
| Certificates of deposit | 127,002 | 895 | 1.40 | % | 129,460 | 714 | 1.10 | % | ||||||||||||||||
| Total interest-bearing deposits | 807,122 | 1,903 | 0.47 | % | 789,498 | 1,442 | 0.36 | % | ||||||||||||||||
| Borrowings | 5,163 | 69 | 2.67 | % | 190 | 1 | 1.05 | % | ||||||||||||||||
| Other | 7,904 | 81 | 2.07 | % | 3,837 | 37 | 1.92 | % | ||||||||||||||||
| Total interest-bearing liabilities | 820,189 | 2,053 | 0.49 | % | 793,525 | 1,480 | 0.37 | % | ||||||||||||||||
| Non-interest-bearing liabilities | 362,746 | 315,885 | ||||||||||||||||||||||
| Total liabilities | 1,182,935 | 1,109,410 | ||||||||||||||||||||||
| Total net worth | 122,852 | 106,924 | ||||||||||||||||||||||
| Total liabilities and net worth | $ | 1,305,787 | $ | 1,216,334 | ||||||||||||||||||||
| Net interest income | $ | 24,278 | $ | 20,802 | ||||||||||||||||||||
| Net interest rate spread (1) | 3.93 | % | 3.64 | % | ||||||||||||||||||||
| Net interest-earning assets (2) | $ | 373,529 | $ | 319,994 | ||||||||||||||||||||
| Net interest margin (3) | 4.07 | % | 3.74 | % | ||||||||||||||||||||
| Average interest-earning assets to interest-bearing liabilities | 145.54 | % | 140.33 | % | ||||||||||||||||||||
| (1) | Net interest rate spread represents the difference between the weighted average yield on interest-earning assets and the weighted average rate of interest-bearing liabilities. |
| (2) | Net interest-earning assets represent total interest-earning assets less total interest-bearing liabilities. |
| (3) | Net interest margin represents net interest income divided by average total interest-earning assets. |
| (4) | Annualized. |
Exhibit I-5 (continued)
Pioneer Bank
Yields and Costs
| For the Years Ended June 30, | ||||||||||||||||||||||||||||||||||||
| 2018 | 2017 | 2016 | ||||||||||||||||||||||||||||||||||
| Average Outstanding Balance | Interest | Average Yield/Cost | Average Outstanding Balance | Interest | Average Yield/Cost | Average Outstanding Balance | Interest | Average Yield/Cost | ||||||||||||||||||||||||||||
| (Dollars in thousands) | ||||||||||||||||||||||||||||||||||||
| Interest-earning assets: | ||||||||||||||||||||||||||||||||||||
| Loans | $ | 969,624 | $ | 43,649 | 4.50 | % | $ | 869,816 | $ | 36,174 | 4.16 | % | $ | 740,794 | $ | 30,782 | 4.16 | % | ||||||||||||||||||
| Securities | 82,514 | 1,367 | 1.66 | % | 100,455 | 1,225 | 1.22 | % | 110,667 | 1,234 | 1.11 | % | ||||||||||||||||||||||||
| Interest-earning deposits | 91,941 | 1,408 | 1.53 | % | 14,230 | 117 | 0.82 | % | 16,913 | 69 | 0.41 | % | ||||||||||||||||||||||||
| Other | 816 | 62 | 7.60 | % | 1,953 | 105 | 5.38 | % | 1,944 | 76 | 3.91 | % | ||||||||||||||||||||||||
| Total interest-earning assets | 1,144,895 | 46,486 | 4.06 | % | 986,454 | 37,621 | 3.81 | % | 870,328 | 32,161 | 3.69 | % | ||||||||||||||||||||||||
| Non-interest-earning assets | 102,942 | 95,973 | 78,089 | |||||||||||||||||||||||||||||||||
| Total assets | $ | 1,247,837 | $ | 1,082,427 | $ | 948,417 | ||||||||||||||||||||||||||||||
| Interest-bearing liabilities: | ||||||||||||||||||||||||||||||||||||
| Demand deposits | $ | 106,309 | 249 | 0.23 | % | $ | 56,208 | 79 | 0.14 | % | $ | 43,626 | 31 | 0.07 | % | |||||||||||||||||||||
| Savings deposits | 241,357 | 124 | 0.05 | % | 233,843 | 120 | 0.05 | % | 219,157 | 112 | 0.05 | % | ||||||||||||||||||||||||
| Money market deposits | 328,242 | 1,231 | 0.38 | % | 262,754 | 800 | 0.30 | % | 214,301 | 470 | 0.22 | % | ||||||||||||||||||||||||
| Certificates of deposit | 129,495 | 1,491 | 1.15 | % | 126,988 | 1,156 | 0.91 | % | 117,513 | 821 | 0.70 | % | ||||||||||||||||||||||||
| Total interest-bearing deposits | 805,403 | 3,095 | 0.38 | % | 679,793 | 2,155 | 0.32 | % | 594,597 | 1,434 | 0.24 | % | ||||||||||||||||||||||||
| Borrowings | 151 | 2 | 1.32 | % | 24,666 | 189 | 0.77 | % | 27,872 | 148 | 0.53 | % | ||||||||||||||||||||||||
| Other | 4,623 | 89 | 1.93 | % | 3,722 | 67 | 1.80 | % | 3,425 | 66 | 1.93 | % | ||||||||||||||||||||||||
| Total interest-bearing liabilities | 810,177 | 3,186 | 0.39 | % | 708,181 | 2,411 | 0.34 | % | 625,894 | 1,648 | 0.26 | % | ||||||||||||||||||||||||
| Non-interest-bearing liabilities | 328,261 | 277,600 | 226,077 | |||||||||||||||||||||||||||||||||
| Total liabilities | 1,138,438 | 985,781 | 851,971 | |||||||||||||||||||||||||||||||||
| Total net worth | 109,399 | 96,646 | 96,446 | |||||||||||||||||||||||||||||||||
| Total liabilities and net worth | $ | 1,247,837 | $ | 1,082,427 | $ | 948,417 | ||||||||||||||||||||||||||||||
| Net interest income | $ | 43,300 | $ | 35,120 | $ | 30,513 | ||||||||||||||||||||||||||||||
| Net interest rate spread (1) | 3.67 | % | 3.47 | % | 3.43 | % | ||||||||||||||||||||||||||||||
| Net interest-earning assets (2) | $ | 334,718 | $ | 278,273 | $ | 244,434 | ||||||||||||||||||||||||||||||
| Net interest margin (3) | 3.78 | % | 3.57 | % | 3.51 | % | ||||||||||||||||||||||||||||||
| Average interest-earning assets to interest-bearing liabilities | 141.31 | % | 139.29 | % | 139.05 | % | ||||||||||||||||||||||||||||||
| (1) | Net interest rate spread represents the difference between the weighted average yield on interest-earning assets and the weighted average rate of interest-bearing liabilities. |
| (2) | Net interest-earning assets represent total interest-earning assets less total interest-bearing liabilities. |
| (3) | Net interest margin represents net interest income divided by average total interest-earning assets. |
Source: Pioneer Bank’s prospectus.
EXHIBIT I-6
Pioneer Bank
Loan Loss Allowance Activity
Exhibit I-6
Pioneer Bank
Loan Loss Allowance Activity
| At or for the Six Months Ended December 31, | At or for the Years Ended June 30, | |||||||||||||||||||||||||||
| 2018 | 2017 | 2018 | 2017 | 2016 | 2015 | 2014 | ||||||||||||||||||||||
| (Dollars in thousands) | ||||||||||||||||||||||||||||
| Allowance at beginning of period | $ | 13,510 | $ | 11,820 | $ | 11,820 | $ | 9,794 | $ | 9,011 | $ | 9,103 | $ | 8,588 | ||||||||||||||
| Provision for loan losses | 1,210 | 950 | 1,970 | 2,395 | 1,180 | 962 | 890 | |||||||||||||||||||||
| Charge offs: | ||||||||||||||||||||||||||||
| Commercial real estate | — | 121 | 121 | — | — | — | 4 | |||||||||||||||||||||
| Commercial and industrial | 1,045 | 53 | 53 | 38 | 169 | 757 | 153 | |||||||||||||||||||||
| Commercial construction | — | — | — | — | — | — | — | |||||||||||||||||||||
| One- to four-family residential real estate | — | 1 | — | 148 | 118 | 169 | 84 | |||||||||||||||||||||
| Home equity loans and lines of credit | — | — | 17 | 104 | 57 | 70 | 46 | |||||||||||||||||||||
| Consumer | 90 | 87 | 152 | 165 | 160 | 139 | 194 | |||||||||||||||||||||
| Total charge-offs | 1,135 | 262 | 343 | 455 | 504 | 1,135 | 481 | |||||||||||||||||||||
| Recoveries: | ||||||||||||||||||||||||||||
| Commercial real estate | — | — | — | — | 10 | 7 | 13 | |||||||||||||||||||||
| Commercial and industrial | — | — | — | 5 | 5 | — | 7 | |||||||||||||||||||||
| Commercial construction | — | — | — | — | — | — | — | |||||||||||||||||||||
| One- to four-family residential real estate | — | — | — | — | — | — | 2 | |||||||||||||||||||||
| Home equity loans and lines of credit | — | 2 | 3 | 15 | 14 | 2 | 3 | |||||||||||||||||||||
| Consumer | 15 | 27 | 60 | 66 | 78 | 72 | 81 | |||||||||||||||||||||
| Total recoveries | 15 | 29 | 63 | 86 | 107 | 81 | 106 | |||||||||||||||||||||
| Net charge-offs | 1,120 | 233 | 280 | 369 | 397 | 1,054 | 375 | |||||||||||||||||||||
| Allowance at end of period | $ | 13,600 | $ | 12,537 | $ | 13,510 | $ | 11,820 | $ | 9,974 | $ | 9,011 | $ | 9,103 | ||||||||||||||
| Allowance to non-performing loans | 115.83 | % | 160.05 | % | 142.05 | % | 149.68 | % | 155.44 | % | 143.85 | % | 152.68 | % | ||||||||||||||
| Allowance to total loans outstanding at the end of the period | 1.31 | % | 1.28 | % | 1.35 | % | 1.25 | % | 1.23 | % | 1.31 | % | 1.43 | % | ||||||||||||||
| Net (charge-offs) to average loans outstanding during the period | 0.22 | %(1) | 0.05 | %(1) | 0.03 | % | 0.04 | % | 0.05 | % | 0.16 | % | 0.06 | % | ||||||||||||||
____________________________
(1) Annualized.
Source: Pioneer Bank’s prospectus.
EXHIBIT I-7
Pioneer Bank
Interest Rate Risk Analysis
Exhibit I-7
Pioneer Bank
Interest Rate Risk Analysis
| EVE as a Percentage of Present | ||||||||||||||||||||
| Value of Assets (3) | ||||||||||||||||||||
| Change in Interest | Estimated Increase (Decrease) in | Increase | ||||||||||||||||||
| Rates (basis | Estimated | EVE | EVE | (Decrease) | ||||||||||||||||
| points) (1) | EVE (2) | Amount | Percent | Ratio (4) | (basis points) | |||||||||||||||
| (Dollars in thousands) | ||||||||||||||||||||
| +400 | $ | 166,131 | $ | (23,306 | ) | (12.3 | )% | 13.79 | % | (72 | ) | |||||||||
| +200 | 176,626 | (12,811 | ) | (6.8 | )% | 14.12 | % | (40 | ) | |||||||||||
| — | 189,437 | — | — | % | 14.52 | % | — | |||||||||||||
| -200 | 198,997 | 9,560 | 5.0 | % | 14.70 | % | 18 | |||||||||||||
| (1) | Assumes an immediate uniform change in interest rates at all maturities. |
| (2) | EVE is the discounted present value of expected cash flows from assets, liabilities and off-balance sheet contracts. |
| (3) | Present value of assets represents the discounted present value of incoming cash flows on interest-earning assets. |
| (4) | EVE Ratio represents EVE divided by the present value of assets. |
Source: Pioneer Bank’s
EXHIBIT I-8
Pioneer Bank
Fixed and Adjustable Rate Loans
Exhibit I-8
Pioneer Bank
Fixed and Adjustable Rate Loans
The following table sets forth our fixed and adjustable-rate loans at June 30, 2018 that are contractually due after June 30, 2019.
| Due After June 30, 2019 | ||||||||||||
| Fixed | Adjustable | Total | ||||||||||
| (In thousands) | ||||||||||||
| Commercial: | ||||||||||||
| Commercial real estate | $ | 78,694 | $ | 264,157 | $ | 342,851 | ||||||
| Commercial and industrial | 50,864 | 33,765 | 84,629 | |||||||||
| Commercial construction | 4,636 | 71,937 | 76,573 | |||||||||
| One- to four-family residential real estate | 224,241 | 25,064 | 249,305 | |||||||||
| Home equity loans and lines of credit | 46,302 | 31,862 | 78,164 | |||||||||
| Consumer | 1,738 | 734 | 2,472 | |||||||||
| Total loans | $ | 406,475 | $ | 427,519 | $ | 833,994 | ||||||
Source: Pioneer Bank’s prospectus.
EXHIBIT I-9
Pioneer Bank
Loan Portfolio Composition
Exhibit I-9
Pioneer Bank
Loan Portfolio Composition
| At June 30, | ||||||||||||||||||||||||||||||||||||||||||||||||
| At December 31, 2018 | 2018 | 2017 | 2016 | 2015 | 2014 | |||||||||||||||||||||||||||||||||||||||||||
| Amount | Percent | Amount | Percent | Amount | Percent | Amount | Percent | Amount | Percent | Amount | Percent | |||||||||||||||||||||||||||||||||||||
| (Dollars in thousands) | ||||||||||||||||||||||||||||||||||||||||||||||||
| Commercial: | ||||||||||||||||||||||||||||||||||||||||||||||||
| Commercial real estate | $ | 379,458 | 36.5 | % | $ | 375,852 | 37.7 | % | $ | 399,074 | 42.3 | % | $ | 293,445 | 36.8 | % | $ | 268,369 | 39.1 | % | $ | 260,022 | 40.8 | % | ||||||||||||||||||||||||
| Commercial and industrial | 183,318 | 17.6 | % | 194,183 | 19.5 | % | 179,908 | 19.1 | % | 123,470 | 15.5 | % | 102,588 | 14.9 | % | 88,654 | 13.9 | % | ||||||||||||||||||||||||||||||
| Commercial construction(1) | 95,769 | 9.2 | % | 84,569 | 8.5 | % | 67,928 | 7.2 | % | 96,223 | 12.1 | % | 55,912 | 8.1 | % | 40,423 | 6.3 | % | ||||||||||||||||||||||||||||||
| One- to four-family residential real estate | 279,784 | 26.9 | % | 249,635 | 25.0 | % | 202,733 | 21.5 | % | 197,670 | 24.8 | % | 173,421 | 25.2 | % | 163,334 | 25.6 | % | ||||||||||||||||||||||||||||||
| Home equity loans and line of credit | 79,693 | 7.7 | % | 78,286 | 7.8 | % | 76,132 | 8.1 | % | 69,423 | 8.7 | % | 69,215 | 10.1 | % | 66,801 | 10.5 | % | ||||||||||||||||||||||||||||||
| Consumer | 22,190 | 2.1 | % | 14,977 | 1.5 | % | 18,042 | 1.9 | % | 17,878 | 2.2 | % | 17,562 | 2.6 | % | 18,409 | 2.9 | % | ||||||||||||||||||||||||||||||
| Total loans receivable | 1,040,212 | 100.0 | % | 997,502 | 100.0 | % | 943,817 | 100.0 | % | 798,109 | 100.00 | % | 687,067 | 100.0 | % | 637,643 | 100.0 | % | ||||||||||||||||||||||||||||||
| Less: | ||||||||||||||||||||||||||||||||||||||||||||||||
| Net deferred loan costs | 2,308 | 1,910 | 765 | 695 | 740 | 594 | ||||||||||||||||||||||||||||||||||||||||||
| Allowance for losses | (13,600 | ) | (13,510 | ) | (11,820 | ) | (9,794 | ) | (9,011 | ) | (9,103 | ) | ||||||||||||||||||||||||||||||||||||
| Total loans receivable, net | $ | 1,028,920 | $ | 985,902 | $ | 932,762 | $ | 789,010 | $ | 678,796 | $ | 629,134 | ||||||||||||||||||||||||||||||||||||
| (1) | Represents amounts disbursed at December 31, 2018 and June 30, 2018, 2017, 2016, 2015 and 2014. The undrawn amounts of the commercial construction loans totaled $84.0 million, $68.3 million, $76.8 million, $49.1 million, $21.5 million and $28.7 million at December 31, 2018 and June 30, 2018, 2017, 2016, 2015 and 2014, respectively. |
Source: Pioneer Bank’s prospectus.
EXHIBIT I-10
Pioneer Bank
Contractual Maturity by Loan Type
Exhibit I-10
Pioneer Bank
Contractual Maturity by Loan Type
| June 30, 2018 | Commercial Real Estate | Commercial and Industrial | Commercial Construction | One- to Four- Family Residential | ||||||||||||
| (In thousands) | ||||||||||||||||
| Amounts due in: | ||||||||||||||||
| One year or less | $ | 33,001 | $ | 109,554 | $ | 7,996 | $ | 330,000 | ||||||||
| More than one to five years | 115,694 | 58,546 | 40,887 | 2,657 | ||||||||||||
| More than five years | 227,157 | 26,083 | 35,686 | 246,648 | ||||||||||||
| Total | $ | 375,852 | $ | 194,183 | $ | 84,569 | $ | 249,635 | ||||||||
| June 30, 2018 | Home Equity Loans and Lines of Credit | Consumer | Total | |||||||||
| (In thousands) | ||||||||||||
| Amounts due in: | ||||||||||||
| One year or less | $ | 122 | $ | 12,505 | $ | 163,508 | ||||||
| More than one to five years | 2,447 | 1,964 | 222,196 | |||||||||
| More than five years | 75,717 | 508 | 611,798 | |||||||||
| Total | $ | 78,286 | $ | 14,977 | $ | 997,502 | ||||||
Source: Pioneer Bank’s prospectus.
EXHIBIT I-11
Pioneer Bank
Non-Performing Assets
Exhibit I-11
Pioneer Bank
Non-Performing Assets
| At December 31, | At June 30, | |||||||||||||||||||||||
| 2018 | 2018 | 2017 | 2016 | 2015 | 2014 | |||||||||||||||||||
| (Dollars in thousands) | ||||||||||||||||||||||||
| Non-accrual loans: | ||||||||||||||||||||||||
| Commercial real estate | $ | 2,233 | $ | 2,236 | $ | 2,375 | $ | 1,386 | $ | 1,304 | $ | 932 | ||||||||||||
| Commercial and industrial | 96 | 705 | 3 | 59 | 25 | 1,057 | ||||||||||||||||||
| Commercial construction | — | — | — | — | — | 44 | ||||||||||||||||||
| One- to four-family residential real estate | 4,645 | 3,834 | 3,325 | 2,874 | 2,912 | 2,621 | ||||||||||||||||||
| Home equity loans and lines of credit | 1,433 | 970 | 899 | 955 | 678 | 479 | ||||||||||||||||||
| Consumer | — | — | — | — | — | — | ||||||||||||||||||
| Total non-accrual loans | 8,407 | 7,745 | 6,602 | 5,274 | 4,919 | 5,133 | ||||||||||||||||||
| Accruing loans past due 90 days or more | ||||||||||||||||||||||||
| Commercial real estate | 3,254 | 180 | 225 | 95 | 289 | 61 | ||||||||||||||||||
| Commercial and industrial | 40 | — | 4 | — | — | — | ||||||||||||||||||
| Commercial construction | — | — | — | — | — | — | ||||||||||||||||||
| One- to four-family residential real estate | — | 1,232 | 583 | 395 | 276 | 248 | ||||||||||||||||||
| Home equity loans and lines of credit | 13 | 330 | 129 | 237 | 339 | 52 | ||||||||||||||||||
| Consumer | 27 | 24 | 354 | 300 | 441 | 468 | ||||||||||||||||||
| Total accruing loans past due 90 days or more | 3,334 | 1,766 | 1,295 | 1,027 | 1,345 | 829 | ||||||||||||||||||
| Real estate owned: | ||||||||||||||||||||||||
| Commercial real estate | — | — | — | — | 391 | 347 | ||||||||||||||||||
| Commercial and industrial | — | — | — | — | — | — | ||||||||||||||||||
| Commercial construction | — | — | — | — | — | — | ||||||||||||||||||
| One- to four-family residential real estate | — | — | — | — | 177 | — | ||||||||||||||||||
| Home equity loans and lines of credit | 55 | 72 | — | — | — | — | ||||||||||||||||||
| Consumer | — | — | — | — | — | — | ||||||||||||||||||
| Total real estate owned | 55 | 72 | — | — | 568 | 347 | ||||||||||||||||||
| Total non-performing assets | $ | 11,796 | $ | 9,583 | $ | 7,897 | $ | 6,301 | $ | 6,832 | $ | 6,309 | ||||||||||||
| Total accruing troubled debt restructured loans | $ | — | $ | — | $ | — | $ | 1,418 | $ | 1,518 | $ | 1,588 | ||||||||||||
| Total non-performing loans to total loans | 1.13 | % | 0.95 | % | 0.84 | % | 0.79 | % | 0.91 | % | 0.94 | % | ||||||||||||
| Total non-performing assets to total assets | 0.92 | % | 0.75 | % | 0.70 | % | 0.63 | % | 0.78 | % | 0.77 | % | ||||||||||||
Source: Pioneer Bank’s prospectus.
EXHIBIT I-12
Pioneer Bank
Deposit Composition
Exhibit I-12
Pioneer Bank
Deposit Composition
| At June 30, | ||||||||||||||||||||||||||||||||||||
| At December 31, 2018 | 2018 | 2017 | ||||||||||||||||||||||||||||||||||
| Amount | Percent | Average Rate | Amount | Percent | Average Rate | Amount | Percent | Average Rate | ||||||||||||||||||||||||||||
| (Dollars in thousands) | ||||||||||||||||||||||||||||||||||||
| Non-interest-bearing demand accounts | $ | 356,291 | 32.0 | % | — | $ | 345,048 | 30.0 | % | — | $ | 275,374 | 27.3 | % | — | |||||||||||||||||||||
| Demand accounts | 93,735 | 8.4 | % | 0.37 | % | 97,191 | 8.4 | % | 0.31 | % | 64,422 | 6.4 | % | 0.15 | % | |||||||||||||||||||||
| Savings accounts | 243,970 | 21.9 | % | 0.05 | % | 244,050 | 21.2 | % | 0.05 | % | 243,621 | 24.1 | % | 0.05 | % | |||||||||||||||||||||
| Money market accounts | 296,873 | 26.6 | % | 0.49 | % | 334,884 | 29.1 | % | 0.43 | % | 298,945 | 29.6 | % | 0.33 | % | |||||||||||||||||||||
| Certificates of deposit | 124,090 | 11.1 | % | 1.53 | % | 129,089 | 11.2 | % | 1.29 | % | 127,664 | 12.6 | % | 1.04 | % | |||||||||||||||||||||
| Total | $ | 1,114,959 | 100.0 | % | 0.34 | % | $ | 1,150,262 | 100.0 | % | 0.31 | % | $ | 1,010,026 | 100.0 | % | 0.25 | % | ||||||||||||||||||
| At June 30, | ||||||||||||
| 2016 | ||||||||||||
| Amount | Percent | Average Rate | ||||||||||
| (Dollars in thousands) | ||||||||||||
| Non-interest-bearing demand accounts | $ | 241,243 | 27.9 | % | — | |||||||
| Demand accounts | 47,024 | 5.4 | % | 0.14 | % | |||||||
| Savings accounts | 228,354 | 26.4 | % | 0.05 | % | |||||||
| Money market accounts | 224,927 | 26.0 | % | 0.25 | % | |||||||
| Certificates of deposit | 122,640 | 14.2 | % | 0.82 | % | |||||||
| Total | $ | 864,188 | 100.00 | % | 0.20 | % | ||||||
Source: Pioneer Bank’s prospectus.
EXHIBIT I-13
Pioneer Bank
Maturity of Jumbo Time Deposits
Exhibit I-13
Pioneer Bank
Maturity of Jumbo Time Deposits
As of December 31, 2018, the aggregate amount of all our certificates of deposit in amounts greater than or equal to $100,000 was approximately $53.9 million. The following table sets forth the maturity of these certificates as of December 31, 2018.
At December 31, 2018 | ||||
| (In thousands) | ||||
| Maturity Period: | ||||
| Three months or less | $ | 7,303 | ||
| Over three through six months | 5,605 | |||
| Over six through twelve months | 10,155 | |||
| Over twelve months | 30,833 | |||
| Total | $ | 53,896 | ||
Source: Pioneer Bank’s prospectus.
EXHIBIT I-14
Pioneer Bank
Borrowing Activity
Exhibit I-14
Pioneer Bank
Borrowing Activity
| At or For the Six Months Ended December 31, | At or For the Year Ended June 30, | |||||||||||||||||||
| 2018 | 2017 | 2018 | 2017 | 2016 | ||||||||||||||||
| (Dollars in thousands) | ||||||||||||||||||||
| Balance outstanding at end of period | $ | 30,000 | $ | 5,000 | $ | — | $ | 5,000 | $ | 17,000 | ||||||||||
| Weighted average interest rate at the end of period | 2.64 | % | 1.53 | % | — | 1.13 | % | 0.59 | % | |||||||||||
| Maximum amount of borrowings outstanding at any month end during the period | $ | 30,000 | $ | 5,000 | $ | 5,000 | $ | 57,000 | $ | 41,771 | ||||||||||
| Average balance outstanding during the period | $ | 5,163 | $ | 190 | $ | 151 | $ | 24.666 | $ | 27,872 | ||||||||||
| Weighted average interest rate during the period | 2.67 | % | 1.05 | % | 1.32 | % | 0.77 | % | 0.53 | % | ||||||||||
Source: Pioneer Bank’s prospectus.
EXHIBIT II-1
Description of Office Properties
Exhibit II-1
Pioneer Bank
Description of Office Properties
Properties
As of December 31, 2018, the net book value of our office properties was $35.0 million. The following table sets forth information regarding our offices.
| Location | Leased or Owned | Year Acquired or Leased | Net Book Value of Real Property | |||||
| (In thousands) | ||||||||
| Main Office: | ||||||||
| 652 Albany Shaker Road, Albany, NY 12211 | Owned(1) | 2016 | $ | 16,271 | ||||
| Other Properties: | ||||||||
| 21 Second Street, Troy, NY 12180 | Leased | 2016 | 68 | |||||
| 531 Troy-Schenectady Road, Latham, NY 12110 | Owned | 2008 | 1,989 | |||||
| 2000 Second Avenue, Watervliet, NY 12189 | Leased | 2017 | 149 | |||||
| 1828 Altamont Avenue, Schenectady, NY 12305 | Owned | 2012 | 1,953 | |||||
| 1208 Route 146, Clifton Park, NY 12065 | Leased | 1995 | 15 | |||||
| 10 Kendall Way, Malta, NY 12020 | Owned | 2016 | 1,424 | |||||
| 78 Main Avenue, Wynantskill, NY 12198 | Owned | 2014 | 1,908 | |||||
| 712 Hoosick Street, Brunswick, NY 12180 | Owned | 2015 | 1,734 | |||||
| 329 Glenmont Road, Glenmont, NY 12077 | Leased | 2014 | 240 | |||||
| 142 Saratoga Avenue, Waterford, NY 12188 | Owned | 2015 | 1,277 | |||||
| 1761 Central Avenue, Albany, NY 12205 | Leased | 2018 | — | |||||
| 602 North Greenbush Road, Rensselaer, NY 12144 | Leased | 2017 | 300 | |||||
| 90 State Street, Albany, NY 12207 | Leased | 2013 | 254 | |||||
| 1881-1883 Western Avenue, Albany, NY 12203 | Owned | 2018 | 4,953 | |||||
| 184 Delaware Avenue, Delmar, NY 12054 | Owned | 2010 | 965 | |||||
| 843 Route 146, Clifton Park, NY 12065 | Leased | 2012 | 221 | |||||
| 426 State Street, Schenectady, NY 12305 | Leased | 2014 | 255 | |||||
| 440 Main Street, Cairo, NY 12413 | Owned | 2016 | 365 | |||||
| 11565 NY-32, Greenville, NY 12083 | Leased | 2016 | 42 | |||||
| 739 Upper Glen Street, Queensbury, NY 12804 | Leased | 2017 | 79 | |||||
| 100 Mohawk Street, Cohoes, NY 12047 | Owned | 2017 | 556 | |||||
(1) The property is subject to a ground lease.
Source: Pioneer Bank’s prospectus.
EXHIBIT II-2
Historical Interest Rates
Exhibit II-2
Historical Interest Rates(1)
| Prime | 90 Day | One Year | 10 Year | |||||||||||||||
| Year/Qtr. Ended | Rate | T-Note | T-Note | T-Note | ||||||||||||||
| 2004: | Quarter 1 | 4.00 | % | 0.95 | % | 1.20 | % | 3.86 | % | |||||||||
| Quarter 2 | 4.00 | % | 1.33 | % | 2.09 | % | 4.62 | % | ||||||||||
| Quarter 3 | 4.75 | % | 1.70 | % | 2.16 | % | 4.12 | % | ||||||||||
| Quarter 4 | 5.25 | % | 2.22 | % | 2.75 | % | 4.24 | % | ||||||||||
| 2005: | Quarter 1 | 5.75 | % | 2.80 | % | 3.43 | % | 4.51 | % | |||||||||
| Quarter 2 | 6.00 | % | 3.12 | % | 3.51 | % | 3.98 | % | ||||||||||
| Quarter 3 | 6.75 | % | 3.55 | % | 4.01 | % | 4.34 | % | ||||||||||
| Quarter 4 | 7.25 | % | 4.08 | % | 4.38 | % | 4.39 | % | ||||||||||
| 2006: | Quarter 1 | 7.75 | % | 4.63 | % | 4.82 | % | 4.86 | % | |||||||||
| Quarter 2 | 8.25 | % | 5.01 | % | 5.21 | % | 5.15 | % | ||||||||||
| Quarter 3 | 8.25 | % | 4.88 | % | 4.91 | % | 4.64 | % | ||||||||||
| Quarter 4 | 8.25 | % | 5.02 | % | 5.00 | % | 4.71 | % | ||||||||||
| 2007: | Quarter 1 | 8.25 | % | 5.04 | % | 4.90 | % | 4.65 | % | |||||||||
| Quarter 2 | 8.25 | % | 4.82 | % | 4.91 | % | 5.03 | % | ||||||||||
| Quarter 3 | 7.75 | % | 3.82 | % | 4.05 | % | 4.59 | % | ||||||||||
| Quarter 4 | 7.25 | % | 3.36 | % | 3.34 | % | 3.91 | % | ||||||||||
| 2008: | Quarter 1 | 5.25 | % | 1.38 | % | 1.55 | % | 3.45 | % | |||||||||
| Quarter 2 | 5.00 | % | 1.90 | % | 2.36 | % | 3.99 | % | ||||||||||
| Quarter 3 | 5.00 | % | 0.92 | % | 1.78 | % | 3.85 | % | ||||||||||
| Quarter 4 | 3.25 | % | 0.11 | % | 0.37 | % | 2.25 | % | ||||||||||
| 2009: | Quarter 1 | 3.25 | % | 0.21 | % | 0.57 | % | 2.71 | % | |||||||||
| Quarter 2 | 3.25 | % | 0.19 | % | 0.56 | % | 3.53 | % | ||||||||||
| Quarter 3 | 3.25 | % | 0.14 | % | 0.40 | % | 3.31 | % | ||||||||||
| Quarter 4 | 3.25 | % | 0.06 | % | 0.47 | % | 3.85 | % | ||||||||||
| 2010: | Quarter 1 | 3.25 | % | 0.16 | % | 0.41 | % | 3.84 | % | |||||||||
| Quarter 2 | 3.25 | % | 0.18 | % | 0.32 | % | 2.97 | % | ||||||||||
| Quarter 3 | 3.25 | % | 0.18 | % | 0.32 | % | 2.97 | % | ||||||||||
| Quarter 4 | 3.25 | % | 0.12 | % | 0.29 | % | 3.30 | % | ||||||||||
| 2011: | Quarter 1 | 3.25 | % | 0.09 | % | 0.30 | % | 3.47 | % | |||||||||
| Quarter 2 | 3.25 | % | 0.03 | % | 0.19 | % | 3.18 | % | ||||||||||
| Quarter 3 | 3.25 | % | 0.02 | % | 0.13 | % | 1.92 | % | ||||||||||
| Quarter 4 | 3.25 | % | 0.02 | % | 0.12 | % | 1.89 | % | ||||||||||
| 2012: | Quarter 1 | 3.25 | % | 0.07 | % | 0.19 | % | 2.23 | % | |||||||||
| Quarter 2 | 3.25 | % | 0.09 | % | 0.21 | % | 1.67 | % | ||||||||||
| Quarter 3 | 3.25 | % | 0.10 | % | 0.17 | % | 1.65 | % | ||||||||||
| Quarter 4 | 3.25 | % | 0.05 | % | 0.16 | % | 1.78 | % | ||||||||||
| 2013: | Quarter 1 | 3.25 | % | 0.07 | % | 0.14 | % | 1.87 | % | |||||||||
| Quarter 2 | 3.25 | % | 0.04 | % | 0.15 | % | 2.52 | % | ||||||||||
| Quarter 3 | 3.25 | % | 0.02 | % | 0.10 | % | 2.64 | % | ||||||||||
| Quarter 4 | 3.25 | % | 0.07 | % | 0.13 | % | 3.04 | % | ||||||||||
| 2014: | Quarter 1 | 3.25 | % | 0.05 | % | 0.13 | % | 2.73 | % | |||||||||
| Quarter 2 | 3.25 | % | 0.04 | % | 0.11 | % | 2.53 | % | ||||||||||
| Quarter 3 | 3.25 | % | 0.02 | % | 0.13 | % | 2.52 | % | ||||||||||
| Quarter 4 | 3.25 | % | 0.04 | % | 0.25 | % | 2.17 | % | ||||||||||
| 2015: | Quarter 1 | 3.25 | % | 0.03 | % | 0.26 | % | 1.94 | % | |||||||||
| Quarter 2 | 3.25 | % | 0.01 | % | 0.28 | % | 2.35 | % | ||||||||||
| Quarter 3 | 3.25 | % | 0.00 | % | 0.33 | % | 2.06 | % | ||||||||||
| Quarter 4 | 3.50 | % | 0.16 | % | 0.65 | % | 2.27 | % | ||||||||||
| 2016: | Quarter 1 | 3.50 | % | 0.21 | % | 0.59 | % | 1.78 | % | |||||||||
| Quarter 2 | 3.50 | % | 0.26 | % | 0.45 | % | 1.49 | % | ||||||||||
| Quarter 3 | 3.50 | % | 0.29 | % | 0.59 | % | 1.60 | % | ||||||||||
| Quarter 4 | 3.75 | % | 0.51 | % | 0.85 | % | 2.45 | % | ||||||||||
| 2017: | Quarter 1 | 4.00 | % | 0.76 | % | 1.03 | % | 2.40 | % | |||||||||
| Quarter 2 | 4.25 | % | 1.03 | % | 1.24 | % | 2.31 | % | ||||||||||
| Quarter 3 | 4.25 | % | 1.06 | % | 1.31 | % | 2.33 | % | ||||||||||
| Quarter 4 | 4.50 | % | 1.39 | % | 1.76 | % | 2.40 | % | ||||||||||
| 2018: | Quarter 1 | 4.75 | % | 1.73 | % | 2.09 | % | 2.74 | % | |||||||||
| Quarter 2 | 5.00 | % | 1.93 | % | 2.33 | % | 2.85 | % | ||||||||||
| Quarter 3 | 5.25 | % | 2.19 | % | 2.59 | % | 3.05 | % | ||||||||||
| Quarter 4 | 5.50 | % | 2.45 | % | 2.63 | % | 2.69 | % | ||||||||||
| As of Feb. 8, 2019 | 5.50 | % | 2.43 | % | 2.54 | % | 2.63 | % | ||||||||||
(1) End of period data.
Sources: Federal Reserve and The Wall Street Journal.
EXHIBIT III-1
General Characteristics of Publicly-Traded Institutions
Exhibit III-1
Characteristics of Publicly-Traded Thrifts
February 8, 2019
| As of | ||||||||||||||||||||||||||||||||
| February 8, 2019 | ||||||||||||||||||||||||||||||||
| Total | Fiscal | Conv. | Stock | Market | ||||||||||||||||||||||||||||
| Ticker | Financial Institution | Exchange | Region | City | State | Assets | Offices | Mth End | Date | Price | Value | |||||||||||||||||||||
| ($Mil) | ($) | ($Mil) | ||||||||||||||||||||||||||||||
| AX | Axos Financial, Inc. | NYSE | WE | San Diego | CA | $ | 9,792 | 2 | Jun | 3/14/05 | $ | 32.70 | $ | 2,002 | ||||||||||||||||||
| BCTF | Bancorp 34, Inc. | NASDAQ | SW | Alamogordo | NM | 373 | 4 | Dec | 5/16/00 | 15.12 | 49 | |||||||||||||||||||||
| BYFC | Broadway Financial Corporation | NASDAQ | WE | Los Angeles | CA | 419 | 3 | Dec | 1/8/96 | 1.30 | 35 | |||||||||||||||||||||
| CARV | Carver Bancorp, Inc. | NASDAQ | MA | New York | NY | 615 | 8 | Mar | 10/24/94 | 3.40 | 13 | |||||||||||||||||||||
| CASH | Meta Financial Group, Inc. | NASDAQ | MW | Sioux Falls | SD | 5,835 | 12 | Sep | 9/20/93 | 24.03 | 947 | |||||||||||||||||||||
| CBMB | CBM Bancorp, Inc. | NASDAQ | MA | Baltimore | MD | 217 | 4 | Dec | 9/27/18 | 12.76 | 54 | |||||||||||||||||||||
| CFFN | Capitol Federal Financial, Inc. | NASDAQ | MW | Topeka | KS | 9,450 | 57 | Sep | 3/31/99 | 12.86 | 1,770 | |||||||||||||||||||||
| DCOM | Dime Community Bancshares, Inc. | NASDAQ | MA | Brooklyn | NY | 6,294 | 30 | Dec | 6/26/96 | 19.84 | 716 | |||||||||||||||||||||
| EBSB | Meridian Bancorp, Inc. | NASDAQ | NE | Peabody | MA | 5,775 | 35 | Dec | 1/22/08 | 15.77 | 806 | |||||||||||||||||||||
| EFBI | Eagle Financial Bancorp, Inc. | NASDAQ | MW | Cincinnati | OH | 138 | 3 | Dec | 7/20/17 | 15.65 | 24 | |||||||||||||||||||||
| ESBK | Elmira Savings Bank | NASDAQ | MA | Elmira | NY | 571 | 12 | Dec | 3/1/85 | 18.68 | 65 | |||||||||||||||||||||
| ESSA | ESSA Bancorp, Inc. | NASDAQ | MA | Stroudsburg | PA | 1,834 | 23 | Sep | 3/15/07 | 15.25 | 168 | |||||||||||||||||||||
| FBC | Flagstar Bancorp, Inc. | NYSE | MW | Troy | MI | 18,697 | 161 | Dec | 4/30/97 | 31.70 | 1,831 | |||||||||||||||||||||
| FDEF | First Defiance Financial Corp. | NASDAQ | MW | Defiance | OH | 3,098 | 44 | Dec | 7/19/93 | 29.39 | 594 | |||||||||||||||||||||
| FNWB | First Northwest Bancorp | NASDAQ | WE | Port Angeles | WA | 1,238 | 11 | Dec | 1/29/15 | 15.69 | 162 | |||||||||||||||||||||
| FSBC | FSB Bancorp, Inc. | NASDAQ | MA | Fairport | NY | 327 | 5 | Dec | 8/10/07 | 17.00 | 32 | |||||||||||||||||||||
| FSBW | FS Bancorp, Inc. | NASDAQ | WE | Mountlake Terrace | WA | 1,191 | 13 | Dec | 7/9/12 | 52.00 | 227 | |||||||||||||||||||||
| HFBL | Home Federal Bancorp, Inc. of Louisiana | NASDAQ | SW | Shreveport | LA | 428 | 7 | Jun | 1/18/05 | 30.62 | 54 | |||||||||||||||||||||
| HIFS | Hingham Institution for Savings | NASDAQ | NE | Hingham | MA | 2,370 | 13 | Dec | 12/13/88 | 183.95 | 392 | |||||||||||||||||||||
| HMNF | HMN Financial, Inc. | NASDAQ | MW | Rochester | MN | 737 | 14 | Dec | 6/30/94 | 19.55 | 90 | |||||||||||||||||||||
| HVBC | HV Bancorp, Inc. | NASDAQ | MA | Huntingdon Valley | PA | 302 | 6 | Jun | 1/11/17 | 15.16 | 32 | |||||||||||||||||||||
| IROQ | IF Bancorp, Inc. | NASDAQ | MW | Watseka | IL | 655 | 7 | Jun | 7/7/11 | 20.75 | 70 | |||||||||||||||||||||
| ISBC | Investors Bancorp, Inc. | NASDAQ | MA | Short Hills | NJ | 25,518 | 151 | Dec | 10/11/05 | 12.60 | 3,458 | |||||||||||||||||||||
| KRNY | Kearny Financial Corp. | NASDAQ | MA | Fairfield | NJ | 6,656 | 54 | Jun | 2/23/05 | 12.95 | 1,163 | |||||||||||||||||||||
| MELR | Melrose Bancorp, Inc. | NASDAQ | NE | Melrose | MA | 322 | 1 | Dec | 10/21/14 | 18.02 | 43 | |||||||||||||||||||||
| MSBF | MSB Financial Corp. | NASDAQ | MA | Millington | NJ | 590 | 4 | Dec | 1/4/07 | 17.80 | 93 | |||||||||||||||||||||
| MSVB | Mid-Southern Bancorp, Inc. | NASDAQ | MW | Salem | IN | 199 | 3 | Dec | 4/8/98 | 12.89 | 43 | |||||||||||||||||||||
| NFBK | Northfield Bancorp, Inc. | NASDAQ | MA | Woodbridge | NJ | 4,286 | 40 | Dec | 11/7/07 | 14.59 | 717 | |||||||||||||||||||||
| NWBI | Northwest Bancshares, Inc. | NASDAQ | MA | Warren | PA | 9,575 | 173 | Dec | 11/4/94 | 17.90 | 1,850 | |||||||||||||||||||||
| NYCB | New York Community Bancorp, Inc. | NYSE | MA | Westbury | NY | 51,247 | 256 | Dec | 11/23/93 | 11.98 | 5,673 | |||||||||||||||||||||
| ORIT | Oritani Financial Corp. | NASDAQ | MA | Township of Washington | NJ | 4,110 | 27 | Jun | 1/23/07 | 16.88 | 768 | |||||||||||||||||||||
| OTTW | Ottawa Bancorp, Inc. | NASDAQ | MW | Ottawa | IL | 278 | 3 | Dec | 7/11/05 | 13.53 | 44 | |||||||||||||||||||||
| PBBI | PB Bancorp, Inc. | NASDAQ | NE | Putnam | CT | 520 | 8 | Jun | 10/4/04 | 11.13 | 80 | |||||||||||||||||||||
| PBIP | Prudential Bancorp, Inc. | NASDAQ | MA | Philadelphia | PA | 1,081 | 11 | Sep | 3/29/05 | 18.01 | 160 | |||||||||||||||||||||
| PCSB | PCSB Financial Corporation | NASDAQ | MA | Yorktown Heights | NY | 1,474 | 17 | Jun | 4/20/17 | 20.70 | 338 | |||||||||||||||||||||
| PFS | Provident Financial Services, Inc. | NYSE | MA | Iselin | NJ | 9,710 | 86 | Dec | 1/15/03 | 27.43 | 1,833 | |||||||||||||||||||||
| PROV | Provident Financial Holdings, Inc. | NASDAQ | WE | Riverside | CA | 1,157 | 15 | Jun | 6/27/96 | 18.63 | 140 | |||||||||||||||||||||
| RNDB | Randolph Bancorp, Inc. | NASDAQ | NE | Stoughton | MA | 590 | 7 | Dec | 7/1/16 | 14.75 | 82 | |||||||||||||||||||||
| RVSB | Riverview Bancorp, Inc. | NASDAQ | WE | Vancouver | WA | 1,148 | 19 | Mar | 10/26/93 | 7.47 | 169 | |||||||||||||||||||||
| SBT | Sterling Bancorp, Inc. | NASDAQ | MW | Southfield | MI | 3,197 | 28 | Dec | 11/16/17 | 9.67 | 513 | |||||||||||||||||||||
| STND | Standard AVB Financial Corp. | NASDAQ | MA | Monroeville | PA | 983 | 19 | Dec | 10/6/10 | 30.49 | 141 | |||||||||||||||||||||
| STXB | Spirit of Texas Bancshares, Inc. | NASDAQ | SW | Conroe | TX | 1,102 | 23 | Dec | 5/3/18 | 21.70 | 263 | |||||||||||||||||||||
| SVBI | Severn Bancorp, Inc. | NASDAQ | MA | Annapolis | MD | 889 | 5 | Dec | NA | 8.85 | 113 | |||||||||||||||||||||
| TBK | Triumph Bancorp, Inc. | NASDAQ | SW | Dallas | TX | 4,537 | 51 | Dec | 11/6/14 | 30.41 | 816 | |||||||||||||||||||||
| TBNK | Territorial Bancorp Inc. | NASDAQ | WE | Honolulu | HI | 2,026 | 30 | Dec | 7/13/09 | 27.46 | 252 | |||||||||||||||||||||
| TRST | TrustCo Bank Corp NY | NASDAQ | MA | Glenville | NY | 4,885 | 148 | Dec | NA | 8.01 | 774 | |||||||||||||||||||||
| TSBK | Timberland Bancorp, Inc. | NASDAQ | WE | Hoquiam | WA | 1,018 | 24 | Sep | 1/12/98 | 28.49 | 236 | |||||||||||||||||||||
| UBNK | United Financial Bancorp, Inc. | NASDAQ | NE | Hartford | CT | 7,207 | 55 | Dec | 5/20/05 | 15.13 | 766 | |||||||||||||||||||||
| WEBK | Wellesley Bancorp, Inc. | NASDAQ | NE | Wellesley | MA | 837 | 6 | Dec | 1/25/12 | 32.00 | 77 | |||||||||||||||||||||
| WNEB | Western New England Bancorp, Inc. | NASDAQ | NE | Westfield | MA | 2,151 | 24 | Dec | 12/27/01 | 9.80 | 271 | |||||||||||||||||||||
| WSBF | Waterstone Financial, Inc. | NASDAQ | MW | Wauwatosa | WI | 1,919 | 13 | Dec | 10/4/05 | 16.24 | 425 | |||||||||||||||||||||
| WSFS | WSFS Financial Corporation | NASDAQ | MA | Wilmington | DE | 7,160 | 63 | Dec | 11/26/86 | 42.18 | 1,323 | |||||||||||||||||||||
| WVFC | WVS Financial Corp. | NASDAQ | MA | Pittsburgh | PA | 350 | 6 | Jun | 11/29/93 | 15.75 | 28 | |||||||||||||||||||||
Source: S&P Global Market Intelligence
EXHIBIT III-2
Public Market Pricing of Mid-Atlantic Thrift Institutions
Exhibit III-2
Public Market Pricing of Mid Atlantic Institutions
As of February 8, 2019
| Market | Per Share Data | |||||||||||||||||||||||||||||||||||||||||||||||||||||||||||||||||||||||||||||||||||||
| Capitalization | Core | Book | Dividends(4) | Financial Characteristics(6) | ||||||||||||||||||||||||||||||||||||||||||||||||||||||||||||||||||||||||||||||||||
| Price/ | Market | 12 Month | Value/ | Pricing Ratios(3) | Amount/ | Payout | Total | Equity/ | Tang. Eq./ | NPAs/ | Reported | Core | ||||||||||||||||||||||||||||||||||||||||||||||||||||||||||||||||||||||||||
| Share(1) | Value | EPS(2) | Share | P/E | P/B | P/A | P/TB | P/Core | Share | Yield | Ratio(5) | Assets | Assets | T. Assets | Assets | ROAA | ROAE | ROAA | ROAE | |||||||||||||||||||||||||||||||||||||||||||||||||||||||||||||||||||
| ($) | ($Mil) | ($) | ($) | (x) | (%) | (%) | (%) | (x) | ($) | (%) | (%) | ($Mil) | (%) | (%) | (%) | (%) | (%) | (%) | (%) | |||||||||||||||||||||||||||||||||||||||||||||||||||||||||||||||||||
| All Non-MHC Public Companies(6) | ||||||||||||||||||||||||||||||||||||||||||||||||||||||||||||||||||||||||||||||||||||||
| Averages | $ | 22.01 | $ | 618.58 | $ | 1.56 | $ | 17.59 | 15.92 | 125.9 | % | 15.0 | % | 140.6 | % | 17.00 | $ | 0.40 | $ | 0.02 | 46 | % | $ | 4,355.02 | 12.84 | % | 11.86 | % | 0.97 | % | 0.91 | % | 7.71 | % | 0.88 | % | 7.00 | % | ||||||||||||||||||||||||||||||||||||||||||||||||
| Median | $ | 16.88 | $ | 227.31 | $ | 0.98 | $ | 15.59 | 14.88 | 117.2 | % | 14.8 | % | 129.3 | % | 14.63 | $ | 0.34 | $ | 0.02 | 41 | % | $ | 1,467.97 | 11.67 | % | 10.59 | % | 0.79 | % | 0.87 | % | 7.33 | % | 0.83 | % | 7.13 | % | ||||||||||||||||||||||||||||||||||||||||||||||||
| Comparable Group | ||||||||||||||||||||||||||||||||||||||||||||||||||||||||||||||||||||||||||||||||||||||
| Averages | $ | 17.19 | $ | 886.93 | $ | 0.94 | $ | 14.57 | 16.20 | 132.5 | % | 15.0 | % | 148.7 | % | 17.83 | $ | 0.46 | 2.63 | % | 58 | % | $ | 6,394 | 12.65 | % | 11.52 | % | 1.02 | % | 0.86 | % | 7.05 | % | 0.75 | % | 5.64 | % | ||||||||||||||||||||||||||||||||||||||||||||||||
| Medians | $ | 16.32 | $ | 252.76 | $ | 0.90 | $ | 13.98 | 15.16 | 118.1 | % | 15.4 | % | 133.3 | % | 15.44 | $ | 0.40 | 2.74 | % | 56 | % | $ | 1,710 | 11.43 | % | 10.01 | % | 0.84 | % | 0.84 | % | 6.93 | % | 0.80 | % | 6.64 | % | ||||||||||||||||||||||||||||||||||||||||||||||||
| Comparable Group | ||||||||||||||||||||||||||||||||||||||||||||||||||||||||||||||||||||||||||||||||||||||
| CARV | Carver Bancorp, Inc. | (7) | NY | $ | 3.40 | $ | 12.58 | ($ | 1.15 | ) | $ | 0.85 | NM | 398.97 | % | 2.21 | % | 398.97 | % | NM | $ | 0.00 | 0.00 | % | NA | $ | 615 | 7.85 | % | 7.85 | % | 2.07 | % | 0.54 | % | 7.24 | % | -0.65 | % | -8.73 | % | |||||||||||||||||||||||||||||||||||||||||||||
| CBMB | CBM Bancorp, Inc. | (7) | MD | $ | 12.76 | $ | 54.00 | NA | $ | 14.23 | NM | 89.67 | % | 24.83 | % | 89.67 | % | NM | NA | NA | NA | $ | 217 | 27.69 | % | 27.69 | % | 0.89 | % | NA | 1.99 | % | NA | 3.95 | % | |||||||||||||||||||||||||||||||||||||||||||||||||||
| DCOM | Dime Community Bancshares, Inc. | NY | $ | 19.84 | $ | 716.08 | $ | 1.36 | $ | 16.68 | 14.38 | x | 118.93 | % | 11.33 | % | 131.04 | % | 14.62 | x | $ | 0.56 | 2.82 | % | 40.58 | % | $ | 6,321 | 9.53 | % | 8.72 | % | NA | 0.82 | % | 8.44 | % | 0.80 | % | 8.31 | % | |||||||||||||||||||||||||||||||||||||||||||||
| ESBK | Elmira Savings Bank | NY | $ | 18.68 | $ | 65.47 | $ | 1.21 | $ | 16.52 | 15.44 | x | 113.07 | % | 11.10 | % | 143.63 | % | 15.46 | x | $ | 0.92 | 4.92 | % | 76.03 | % | $ | 590 | 9.82 | % | 7.90 | % | 0.78 | % | 0.75 | % | 7.37 | % | 0.75 | % | 7.38 | % | ||||||||||||||||||||||||||||||||||||||||||||
| ESSA | ESSA Bancorp, Inc. | PA | $ | 15.25 | $ | 167.65 | $ | 1.05 | $ | 15.63 | 14.95 | x | 97.55 | % | 9.68 | % | 106.23 | % | 14.52 | x | $ | 0.40 | 2.62 | % | 36.27 | % | $ | 1,863 | 9.92 | % | 9.18 | % | NA | 0.61 | % | 6.21 | % | 0.63 | % | 6.39 | % | |||||||||||||||||||||||||||||||||||||||||||||
| FSBC | FSB Bancorp, Inc. | NY | $ | 17.00 | $ | 32.45 | $ | 0.07 | NA | NM | 105.48 | % | NA | 105.48 | % | NM | NA | NA | NA | $ | 328 | 9.60 | % | 9.60 | % | NA | 0.04 | % | 0.43 | % | 0.04 | % | 0.43 | % | ||||||||||||||||||||||||||||||||||||||||||||||||||||
| HVBC | HV Bancorp, Inc. | (7) | PA | $ | 15.16 | $ | 31.83 | $ | 0.51 | $ | 13.72 | NM | 110.47 | % | 11.33 | % | 110.47 | % | 29.73 | x | NA | NA | 128.21 | % | $ | 302 | 10.26 | % | 10.26 | % | 0.60 | % | 0.30 | % | 2.59 | % | 0.39 | % | 3.37 | % | ||||||||||||||||||||||||||||||||||||||||||||||
| ISBC | Investors Bancorp, Inc. | NJ | $ | 12.60 | $ | 3,457.83 | $ | 0.82 | $ | 10.50 | 17.50 | x | 120.02 | % | 13.75 | % | 124.88 | % | 15.43 | x | $ | 0.44 | 3.49 | % | 55.56 | % | $ | 26,229 | 11.46 | % | NA | 0.55 | % | 0.80 | % | 6.57 | % | 0.91 | % | 7.45 | % | |||||||||||||||||||||||||||||||||||||||||||||
| KRNY | Kearny Financial Corp. | NJ | $ | 12.95 | $ | 1,163.43 | $ | 0.44 | $ | 12.62 | 33.21 | x | 102.63 | % | 18.12 | % | 124.25 | % | 29.40 | x | $ | 0.20 | 1.54 | % | 82.05 | % | $ | 6,702 | 17.65 | % | NA | NA | 0.57 | % | 2.95 | % | 0.64 | % | 3.35 | % | ||||||||||||||||||||||||||||||||||||||||||||||
| MSBF | MSB Financial Corp. | NJ | $ | 17.80 | $ | 92.73 | $ | 0.90 | $ | 12.37 | 19.78 | x | 143.93 | % | 16.41 | % | 143.93 | % | 19.78 | x | $ | 0.00 | 0.00 | % | 100.56 | % | $ | 585 | 11.40 | % | 11.40 | % | NA | 0.85 | % | 6.88 | % | 0.85 | % | 6.88 | % | |||||||||||||||||||||||||||||||||||||||||||||
| NYCB | New York Community Bancorp, Inc. | NY | $ | 11.98 | $ | 5,672.97 | NA | $ | 12.99 | 15.16 | x | 92.21 | % | 11.04 | % | 152.65 | % | NM | $ | 0.68 | 5.68 | % | 86.08 | % | $ | 51,899 | 12.82 | % | 8.53 | % | NA | 0.84 | % | 6.23 | % | NA | NA | |||||||||||||||||||||||||||||||||||||||||||||||||
| NFBK | Northfield Bancorp, Inc. | NJ | $ | 14.59 | $ | 716.77 | $ | 0.86 | $ | 13.43 | 17.16 | x | 108.66 | % | 16.43 | % | 115.50 | % | 17.04 | x | $ | 0.40 | 2.74 | % | 47.06 | % | $ | 4,408 | 15.12 | % | 14.35 | % | 0.58 | % | 0.95 | % | 6.17 | % | 0.96 | % | 6.21 | % | ||||||||||||||||||||||||||||||||||||||||||||
| NWBI | Northwest Bancshares, Inc. | PA | $ | 17.90 | $ | 1,850.04 | $ | 1.06 | $ | 12.17 | 17.55 | x | 147.10 | % | 19.26 | % | 198.84 | % | 16.91 | x | $ | 0.72 | 4.02 | % | 67.65 | % | $ | 9,608 | 13.09 | % | 10.03 | % | 0.97 | % | 1.11 | % | 8.61 | % | 1.15 | % | 8.94 | % | ||||||||||||||||||||||||||||||||||||||||||||
| ORIT | Oritani Financial Corp. | NJ | $ | 16.88 | $ | 767.92 | $ | 1.27 | $ | 11.78 | 13.95 | x | 143.33 | % | 18.47 | % | 143.33 | % | 13.27 | x | $ | 1.00 | 5.92 | % | 95.04 | % | $ | 4,090 | 12.89 | % | 12.89 | % | NA | 1.30 | % | 9.70 | % | 1.37 | % | 10.20 | % | |||||||||||||||||||||||||||||||||||||||||||||
| PCSB | PCSB Financial Corporation | NY | $ | 20.70 | $ | 337.88 | $ | 0.55 | $ | 15.62 | NM | 132.54 | % | 24.58 | % | 135.58 | % | NM | $ | 0.12 | 0.58 | % | 21.05 | % | $ | 1,557 | 18.54 | % | 18.20 | % | NA | 0.65 | % | 3.30 | % | 0.63 | % | 3.20 | % | |||||||||||||||||||||||||||||||||||||||||||||||
| PFS | Provident Financial Services, Inc. | NJ | $ | 27.43 | $ | 1,833.15 | $ | 1.79 | $ | 20.49 | 15.07 | x | 133.87 | % | 18.71 | % | 193.38 | % | 15.30 | x | $ | 0.92 | 3.35 | % | 57.69 | % | $ | 9,726 | 13.97 | % | 10.11 | % | NA | 1.22 | % | 8.93 | % | 1.20 | % | 8.80 | % | |||||||||||||||||||||||||||||||||||||||||||||
| PBIP | Prudential Bancorp, Inc. | PA | $ | 18.01 | $ | 160.16 | NA | $ | 14.69 | 18.38 | x | 122.56 | % | 14.36 | % | 129.12 | % | NM | $ | 0.20 | 1.11 | % | 56.12 | % | $ | 1,115 | 11.72 | % | 11.19 | % | 1.37 | % | 0.88 | % | 6.98 | % | NA | NA | ||||||||||||||||||||||||||||||||||||||||||||||||
| SVBI | Severn Bancorp, Inc. | MD | $ | 8.85 | $ | 112.58 | NA | NA | 13.21 | x | 117.19 | % | NA | 118.55 | % | NM | $ | 0.12 | 1.36 | % | 17.91 | % | $ | 974 | 10.11 | % | 10.00 | % | 1.73 | % | 1.01 | % | 9.46 | % | NA | NA | ||||||||||||||||||||||||||||||||||||||||||||||||||
| STND | Standard AVB Financial Corp. | PA | $ | 30.49 | $ | 141.22 | NA | $ | 28.65 | 16.22 | x | 106.42 | % | 15.10 | % | 137.21 | % | NM | $ | 0.88 | 2.90 | % | 47.02 | % | $ | 972 | 14.19 | % | NA | NA | 0.90 | % | 6.55 | % | NA | NA | ||||||||||||||||||||||||||||||||||||||||||||||||||
| TRST | TrustCo Bank Corp NY | NY | $ | 8.01 | $ | 774.24 | NA | $ | 5.07 | 12.59 | x | 158.05 | % | 15.61 | % | 158.23 | % | NM | $ | 0.27 | 3.40 | % | 42.06 | % | $ | 4,959 | 9.88 | % | 9.87 | % | NA | 1.25 | % | 13.05 | % | NA | NA | |||||||||||||||||||||||||||||||||||||||||||||||||
| WSFS | WSFS Financial Corporation | DE | $ | 42.18 | $ | 1,323.36 | $ | 3.37 | $ | 26.17 | 10.07 | x | 161.20 | % | 18.26 | % | 219.01 | % | 12.50 | x | $ | 0.44 | 1.04 | % | 10.50 | % | $ | 7,249 | 11.32 | % | NA | 0.66 | % | 1.92 | % | 17.63 | % | 1.55 | % | 14.19 | % | |||||||||||||||||||||||||||||||||||||||||||||
| WVFC | WVS Financial Corp. | PA | $ | 15.75 | $ | 28.17 | NA | $ | 17.18 | 10.79 | x | 91.68 | % | 8.77 | % | 91.68 | % | NM | $ | 0.40 | 2.54 | % | 26.03 | % | $ | 349 | 9.57 | % | 9.57 | % | NA | 0.75 | % | 7.79 | % | NA | NA | |||||||||||||||||||||||||||||||||||||||||||||||||
EXHIBIT III-3
Public Market Pricing of New England Thrift Institutions
Exhibit III-3
Public Market Pricing of New England Institutions
As of February 8, 2019
| Market | Per Share Data | |||||||||||||||||||||||||||||||||||||||||||||||||||||||||||||||||||||||||||||||||||||||
| Capitalization | Core | Book | Dividends(4) | Financial Characteristics(6) | ||||||||||||||||||||||||||||||||||||||||||||||||||||||||||||||||||||||||||||||||||||
| Price/ | Market | 12 Month | Value/ | Pricing Ratios(3) | Amount/ | Payout | Total | Equity/ | Tang. Eq./ | NPAs/ | Reported | Core | ||||||||||||||||||||||||||||||||||||||||||||||||||||||||||||||||||||||||||||
| Share(1) | Value | EPS(2) | Share | P/E | P/B | P/A | P/TB | P/Core | Share | Yield | Ratio(5) | Assets | Assets | T. Assets | Assets | ROAA | ROAE | ROAA | ROAE | |||||||||||||||||||||||||||||||||||||||||||||||||||||||||||||||||||||
| All Non-MHC Public Companies(6) | ||||||||||||||||||||||||||||||||||||||||||||||||||||||||||||||||||||||||||||||||||||||||
| Averages | $ | 22.01 | $ | 618.58 | $ | 1.56 | $ | 17.59 | 15.92 | 125.9 | % | 15.0 | % | 140.6 | % | 17.00 | $ | 0.40 | $ | 0.02 | 46 | % | $ | 4,355.02 | 12.84 | % | 11.86 | % | 0.97 | % | 0.91 | % | 7.71 | % | 0.88 | % | 7.00 | % | ||||||||||||||||||||||||||||||||||||||||||||||||||
| Median | $ | 16.88 | $ | 227.31 | $ | 0.98 | $ | 15.59 | 14.88 | 117.2 | % | 14.8 | % | 129.3 | % | 14.63 | $ | 0.34 | $ | 0.02 | 41 | % | $ | 1,467.97 | 11.67 | % | 10.59 | % | 0.79 | % | 0.87 | % | 7.33 | % | 0.83 | % | 7.13 | % | ||||||||||||||||||||||||||||||||||||||||||||||||||
| Comparable Group | ||||||||||||||||||||||||||||||||||||||||||||||||||||||||||||||||||||||||||||||||||||||||
| Averages | $ | 37.57 | $ | 314.75 | $ | 2.92 | $ | 25.27 | 16.65 | 121.9 | % | 13.6 | % | 129.5 | % | 15.03 | $ | 0.46 | 1.78 | % | 30 | % | $ | 2,546 | 11.46 | % | 10.68 | % | 0.95 | % | 0.67 | % | 6.59 | % | 0.75 | % | 7.52 | % | ||||||||||||||||||||||||||||||||||||||||||||||||||
| Medians | $ | 15.45 | $ | 176.52 | $ | 1.10 | $ | 13.49 | 14.88 | 115.2 | % | 14.0 | % | 126.0 | % | 13.84 | $ | 0.28 | 1.78 | % | 21 | % | $ | 1,495 | 11.05 | % | 10.50 | % | 0.95 | % | 0.76 | % | 7.59 | % | 0.79 | % | 8.51 | % | ||||||||||||||||||||||||||||||||||||||||||||||||||
| Comparable Group | ||||||||||||||||||||||||||||||||||||||||||||||||||||||||||||||||||||||||||||||||||||||||
| HIFS | Hingham Institution for Savings | MA | $ | 183.95 | $ | 392.32 | $ | 14.99 | $ | 99.67 | 13.23 | x | 184.55 | % | 16.29 | % | 184.55 | % | 12.27 | x | $ | 1.48 | 0.80 | % | 13.81 | % | $ | 2,409 | 8.83 | % | 8.83 | % | NA | 1.32 | % | 14.97 | % | 1.42 | % | 16.15 | % | |||||||||||||||||||||||||||||||||||||||||||||||
| MELR | Melrose Bancorp, Inc. | MA | $ | 18.02 | $ | 42.79 | NA | $ | 17.57 | 24.35 | x | 102.55 | % | 14.32 | % | 102.55 | % | NM | $ | 0.34 | 1.89 | % | 45.95 | % | $ | 324 | 13.96 | % | 13.96 | % | NA | 0.56 | % | 3.94 | % | NA | NA | |||||||||||||||||||||||||||||||||||||||||||||||||||
| EBSB | Meridian Bancorp, Inc. | MA | $ | 15.77 | $ | 805.94 | $ | 1.10 | $ | 12.60 | 14.88 | x | 125.15 | % | 13.67 | % | 129.58 | % | 14.34 | x | $ | 0.28 | 1.78 | % | 20.75 | % | $ | 6,179 | 10.92 | % | 10.59 | % | NA | 0.99 | % | 8.36 | % | 1.03 | % | 8.67 | % | |||||||||||||||||||||||||||||||||||||||||||||||
| PBBI | PB Bancorp, Inc. | (7) | CT | $ | 11.13 | $ | 80.34 | $ | 0.55 | $ | 11.19 | 20.61 | x | 99.50 | % | 16.32 | % | 108.28 | % | 20.07 | x | $ | 0.28 | 2.52 | % | 59.26 | % | $ | 520 | 16.41 | % | 15.28 | % | NA | 0.75 | % | 4.65 | % | 0.76 | % | 4.75 | % | ||||||||||||||||||||||||||||||||||||||||||||||
| RNDB | Randolph Bancorp, Inc. | (7) | MA | $ | 14.75 | $ | 81.64 | $ | (0.31 | ) | $ | 13.05 | NM | 113.04 | % | 14.98 | % | NA | NM | NA | NA | NA | $ | 590 | 13.25 | % | NA | 0.95 | % | -0.63 | % | -4.26 | % | -0.29 | % | -1.94 | % | |||||||||||||||||||||||||||||||||||||||||||||||||||
| UBNK | United Financial Bancorp, Inc. | CT | $ | 15.13 | $ | 766.17 | $ | 1.16 | $ | 13.94 | 12.93 | x | 108.54 | % | 10.51 | % | 131.14 | % | 13.01 | x | $ | 0.48 | 3.17 | % | 41.03 | % | $ | 7,357 | 9.69 | % | 8.15 | % | NA | 0.84 | % | 8.57 | % | 0.83 | % | 8.51 | % | |||||||||||||||||||||||||||||||||||||||||||||||
| WEBK | Wellesley Bancorp, Inc. | MA | $ | 32.00 | $ | 77.42 | $ | 2.40 | $ | 25.79 | 13.33 | x | 124.08 | % | 9.27 | % | 124.08 | % | 13.33 | x | $ | 0.22 | 0.69 | % | 8.96 | % | $ | 871 | 7.47 | % | 7.47 | % | NA | 0.72 | % | 9.66 | % | 0.72 | % | 9.66 | % | |||||||||||||||||||||||||||||||||||||||||||||||
| WNEB | Western New England Bancorp, Inc. | MA | $ | 9.80 | $ | 271.39 | $ | 0.57 | $ | 8.35 | 17.19 | x | 117.39 | % | 13.13 | % | 125.99 | % | 17.12 | x | $ | 0.16 | 1.63 | % | 21.05 | % | $ | 2,119 | 11.19 | % | 10.50 | % | NA | 0.78 | % | 6.82 | % | 0.79 | % | 6.84 | % | |||||||||||||||||||||||||||||||||||||||||||||||
| MHC | ||||||||||||||||||||||||||||||||||||||||||||||||||||||||||||||||||||||||||||||||||||||||
| HONE | HarborOne Bancorp, Inc. (MHC) | MA | $ | 15.33 | $ | 483.84 | $ | 0.49 | $ | 10.97 | NM | 139.70 | % | 13.67 | % | 178.98 | % | 31.58 | x | NA | NA | NA | $ | 3,653 | 9.79 | % | 7.81 | % | NA | 0.39 | % | 3.27 | % | 0.53 | % | 4.41 | % | |||||||||||||||||||||||||||||||||||||||||||||||||||
| PVBC | Provident Bancorp, Inc. (MHC) | MA | $ | 23.00 | $ | 212.27 | $ | 1.00 | $ | 13.05 | 23.00 | x | 176.29 | % | 22.73 | % | 176.29 | % | 23.00 | x | NA | NA | NA | $ | 974 | 12.89 | % | 12.89 | % | NA | 1.02 | % | 7.75 | % | 1.02 | % | 7.75 | % | ||||||||||||||||||||||||||||||||||||||||||||||||||
| Under Acquisition | ||||||||||||||||||||||||||||||||||||||||||||||||||||||||||||||||||||||||||||||||||||||||
| BHBK | Blue Hills Bancorp, Inc. | MA | $ | 23.75 | $ | 576.88 | $ | 1.06 | $ | 15.01 | 24.23 | x | 158.21 | % | 22.79 | % | 161.92 | % | 22.51 | x | $ | 0.80 | 3.37 | % | 102.04 | % | $ | 2,806 | 14.40 | % | 14.12 | % | NA | 0.91 | % | 6.10 | % | 0.98 | % | 6.57 | % | |||||||||||||||||||||||||||||||||||||||||||||||
| BLMT | BSB Bancorp, Inc. | MA | $ | 33.30 | $ | 313.42 | $ | 2.55 | $ | 20.64 | 13.65 | x | 161.31 | % | 10.74 | % | 161.31 | % | 13.03 | x | NA | NA | NA | $ | 3,030 | 6.66 | % | 6.66 | % | NA | 0.80 | % | 11.97 | % | 0.84 | % | 12.53 | % | ||||||||||||||||||||||||||||||||||||||||||||||||||
| SIFI | SI Financial Group, Inc. | (7) | CT | $ | 13.43 | $ | 157.40 | $ | 0.87 | $ | 14.13 | 24.42 | x | 95.06 | % | 10.06 | % | 105.24 | % | 15.38 | x | $ | 0.24 | 1.79 | % | 43.64 | % | $ | 1,607 | 10.58 | % | 9.65 | % | 1.17 | % | 0.41 | % | 3.82 | % | 0.65 | % | 6.12 | % | |||||||||||||||||||||||||||||||||||||||||||||
| (1) | Core income, on a diluted per-share basis. Core income is net income after taxes and before extraordinary items, less net income attributable to noncontrolling interest, gain on the sale of securities, amortization of intangibles, goodwill and nonrecurring items. Assumed tax rate is 35%. |
| (2) | P/E = Price to earnings; P/B = Price to book; P/A = Price to assets; P/TB = Price to tangible book value; and P/Core = Price to core earnings. P/E and P/Core =NM if the ratio is negative or above 35x. |
| (3) | Indicated 12 month dividend, based on last quarterly dividend declared. |
| (4) | Indicated 12 month dividend as a percent of trailing 12 month earnings. |
| (5) | ROAA (return on average assets) and ROAE (return on average equity) are indicated ratios based on trailing 12 month earnings and average equity and assets balances. |
| (6) | Excludes from averages and medians those companies the subject of actual or rumored acquisition activities or unusual operating characteristics. |
| (7) | Financial Characteristics as of September, 2018 or the most recent available |
Source: S&P Global Market Intelligence and RP Financial, LC. calculations. The information provided in this report has been obtained from sources we believe are reliable, but we cannot guarantee the accuracy or completeness of such information.
Copyright (c) 2019 by RP® Financial, LC.
EXHIBIT III-4
Public Market Pricing of Midwest Thrift Institutions
Exhibit III-4
Public Market Pricing of Midwest Institutions
As of February 8, 2019
| Market | Per Share Data | |||||||||||||||||||||||||||||||||||||||||||||||||||||||||||||||||||||||||||||||||||||
| Capitalization | Core | Book | Dividends(4) | Financial Characteristics(6) | ||||||||||||||||||||||||||||||||||||||||||||||||||||||||||||||||||||||||||||||||||
| Price/ | Market | 12 Month | Value/ | Pricing Ratios(3) | Amount/ | Payout | Total | Equity/ | Tang. Eq./ | NPAs/ | Reported | Core | ||||||||||||||||||||||||||||||||||||||||||||||||||||||||||||||||||||||||||
| Share(1) | Value | EPS(2) | Share | P/E | P/B | P/A | P/TB | P/Core | Share | Yield | Ratio(5) | Assets | Assets | T. Assets | Assets | ROAA | ROAE | ROAA | ROAE | |||||||||||||||||||||||||||||||||||||||||||||||||||||||||||||||||||
| ($) | ($Mil) | ($) | ($) | (x) | (%) | (%) | (%) | (x) | ($) | (%) | (%) | ($Mil) | (%) | (%) | (%) | (%) | (%) | (%) | (%) | |||||||||||||||||||||||||||||||||||||||||||||||||||||||||||||||||||
| All Non-MHC Public Companies(6) | ||||||||||||||||||||||||||||||||||||||||||||||||||||||||||||||||||||||||||||||||||||||
| Averages | $ | 22.01 | $ | 618.58 | $ | 1.56 | $ | 17.59 | 15.92 | 125.9 | % | 15.0 | % | 140.6 | % | 17.00 | $ | 0.40 | $ | 0.02 | 46 | % | $ | 4,355.02 | 12.84 | % | 11.86 | % | 0.97 | % | 0.91 | % | 7.71 | % | 0.88 | % | 7.00 | % | ||||||||||||||||||||||||||||||||||||||||||||||||
| Median | $ | 16.88 | $ | 227.31 | $ | 0.98 | $ | 15.59 | 14.88 | 117.2 | % | 14.8 | % | 129.3 | % | 14.63 | $ | 0.34 | $ | 0.02 | 41 | % | $ | 1,467.97 | 11.67 | % | 10.59 | % | 0.79 | % | 0.87 | % | 7.33 | % | 0.83 | % | 7.13 | % | ||||||||||||||||||||||||||||||||||||||||||||||||
| Comparable Group | ||||||||||||||||||||||||||||||||||||||||||||||||||||||||||||||||||||||||||||||||||||||
| Averages | $ | 18.75 | $ | 577.21 | $ | 1.27 | $ | 16.79 | 15.94 | 116.0 | % | 16.3 | % | 132.7 | % | 18.46 | $ | 0.25 | 1.32 | % | 44 | % | $ | 4,028 | 15.11 | % | 14.19 | % | 0.75 | % | 1.05 | % | 8.41 | % | 1.07 | % | 7.26 | % | ||||||||||||||||||||||||||||||||||||||||||||||||
| Medians | $ | 16.24 | $ | 425.31 | $ | 0.90 | $ | 17.12 | 13.00 | 115.7 | % | 16.3 | % | 115.8 | % | 16.68 | $ | 0.20 | 1.02 | % | 26 | % | $ | 1,915 | 12.56 | % | 11.68 | % | 0.79 | % | 1.04 | % | 7.58 | % | 0.91 | % | 6.73 | % | ||||||||||||||||||||||||||||||||||||||||||||||||
| Comparable Group | ||||||||||||||||||||||||||||||||||||||||||||||||||||||||||||||||||||||||||||||||||||||
| CFFN | Capitol Federal Financial, Inc. | KS | $ | 12.86 | $ | 1,769.83 | $ | 0.69 | $ | 9.53 | 18.91 | x | 134.98 | % | 19.53 | % | 132.20 | % | 18.73 | x | $ | 0.34 | 2.64 | % | 144.12 | % | $ | 9,304 | 14.47 | % | NA | NA | 0.90 | % | 6.68 | % | 0.91 | % | 6.73 | % | ||||||||||||||||||||||||||||||||||||||||||||||
| EFBI | Eagle Financial Bancorp, Inc. | (7) | OH | $ | 15.65 | $ | 23.60 | NA | $ | 17.05 | NM | 91.81 | % | 18.46 | % | 91.81 | % | NM | NA | NA | NA | $ | 138 | 20.11 | % | 20.11 | % | 0.79 | % | 0.41 | % | 1.95 | % | 0.26 | % | 1.24 | % | |||||||||||||||||||||||||||||||||||||||||||||||||
| FDEF | First Defiance Financial Corp. | OH | $ | 29.39 | $ | 593.56 | $ | 2.27 | $ | 19.81 | 13.00 | x | 148.36 | % | 18.63 | % | 199.85 | % | 12.97 | x | $ | 0.76 | 2.59 | % | 30.09 | % | $ | 3,182 | 12.56 | % | 9.63 | % | 1.00 | % | 1.52 | % | 12.03 | % | 1.52 | % | 12.07 | % | ||||||||||||||||||||||||||||||||||||||||||||
| FBC | Flagstar Bancorp, Inc. | MI | $ | 31.70 | $ | 1,830.66 | NA | $ | 27.19 | 9.88 | x | 116.60 | % | 9.88 | % | 132.66 | % | NM | $ | 0.16 | 0.50 | % | 1.25 | % | $ | 18,531 | 8.47 | % | 7.52 | % | 0.45 | % | 1.04 | % | 12.57 | % | NA | NA | ||||||||||||||||||||||||||||||||||||||||||||||||
| HMNF | HMN Financial, Inc. | MN | $ | 19.55 | $ | 89.55 | NA | $ | 17.19 | 11.37 | x | 113.70 | % | 13.27 | % | 115.17 | % | NM | $ | 0.00 | 0.00 | % | NA | $ | 712 | 11.67 | % | 11.54 | % | NA | 1.14 | % | 9.88 | % | NA | NA | ||||||||||||||||||||||||||||||||||||||||||||||||||
| IROQ | IF Bancorp, Inc. | IL | $ | 20.75 | $ | 69.95 | NA | $ | 21.71 | 23.58 | x | 95.57 | % | 11.30 | % | 95.57 | % | NM | $ | 0.25 | 1.20 | % | 25.57 | % | $ | 664 | 11.82 | % | 11.82 | % | NA | 0.50 | % | 3.95 | % | NA | NA | |||||||||||||||||||||||||||||||||||||||||||||||||
| CASH | Meta Financial Group, Inc. | SD | $ | 24.03 | $ | 947.26 | $ | 2.56 | $ | 19.48 | 12.58 | x | 123.38 | % | 15.32 | % | 238.02 | % | 9.38 | x | $ | 0.20 | 0.83 | % | 9.77 | % | $ | 6,183 | 12.47 | % | 6.90 | % | NA | 1.26 | % | 11.15 | % | 1.70 | % | 15.44 | % | |||||||||||||||||||||||||||||||||||||||||||||
| MSVB | Mid-Southern Bancorp, Inc. | IN | $ | 12.89 | $ | 43.38 | $ | 0.41 | NA | 31.44 | x | 96.54 | % | NA | 96.54 | % | 31.44 | x | $ | 0.08 | 0.62 | % | 9.76 | % | $ | 201 | 24.34 | % | 24.34 | % | NA | 0.72 | % | 4.28 | % | 0.72 | % | 4.28 | % | |||||||||||||||||||||||||||||||||||||||||||||||
| OTTW | Ottawa Bancorp, Inc. | (7) | IL | $ | 13.53 | $ | 43.56 | $ | 0.57 | $ | 15.56 | NM | 86.95 | % | 16.48 | % | 88.44 | % | 23.61 | x | $ | 0.20 | 1.48 | % | 88.33 | % | $ | 278 | 18.96 | % | 18.69 | % | NA | 0.36 | % | 1.77 | % | 0.71 | % | 3.46 | % | |||||||||||||||||||||||||||||||||||||||||||||
| SBT | Sterling Bancorp, Inc. | MI | $ | 9.67 | $ | 512.63 | NA | $ | 6.32 | 8.06 | x | 153.00 | % | 16.04 | % | 153.20 | % | NM | $ | 0.04 | 0.41 | % | 2.50 | % | $ | 3,197 | 10.48 | % | 10.47 | % | NA | 2.05 | % | 20.66 | % | NA | NA | |||||||||||||||||||||||||||||||||||||||||||||||||
| WSBF | Waterstone Financial, Inc. | WI | $ | 16.24 | $ | 425.31 | $ | 1.11 | $ | 14.04 | 14.63 | x | 115.65 | % | 24.13 | % | 115.83 | % | 14.63 | x | $ | 0.48 | 2.96 | % | 88.29 | % | $ | 1,915 | 20.87 | % | 20.84 | % | NA | 1.64 | % | 7.58 | % | 1.64 | % | 7.58 | % | |||||||||||||||||||||||||||||||||||||||||||||
EXHIBIT III-5
Peer Group Market Area Comparative Analysis
Exhibit III-5
Peer Group Market Area Comparative Analysis
| Proj. | Per Capita Income | Deposit | ||||||||||||||||||||||||||||||||
| Population | Pop. | 2013-2019 | 2019-2024 | 2019 | % State | Market | ||||||||||||||||||||||||||||
| Institution | County | 2013 | 2019 | 2024 | % Change | % Change | Amount | Average | Share(1) | |||||||||||||||||||||||||
| ESSA Bancorp, Inc. | Monroe, PA | 169,846 | 168,414 | 169,097 | -0.1 | % | 0.1 | % | 31,740 | 90.0 | % | 29.32 | % | |||||||||||||||||||||
| Hingham Institution for Savings | Plymouth, MA | 500,544 | 519,639 | 535,770 | 0.6 | % | 0.6 | % | 45,313 | 96.8 | % | 10.90 | % | |||||||||||||||||||||
| HMN Financial, Inc. | Olmsted, MN | 147,528 | 157,269 | 164,543 | 1.1 | % | 0.9 | % | 41,587 | 106.5 | % | 6.55 | % | |||||||||||||||||||||
| PCSB Financial Corporation | Westchester, NY | 963,608 | 984,709 | 1,003,537 | 0.4 | % | 0.4 | % | 55,378 | 139.0 | % | 1.04 | % | |||||||||||||||||||||
| Prudential Bancorp, Inc. | Philadelphia, PA | 1,548,343 | 1,590,076 | 1,619,276 | 0.4 | % | 0.4 | % | 28,213 | 80.0 | % | 1.29 | % | |||||||||||||||||||||
| Severn Bancorp, Inc. | Anne Arundel, MD | 552,258 | 579,979 | 602,811 | 0.8 | % | 0.8 | % | 50,705 | 114.7 | % | 4.99 | % | |||||||||||||||||||||
| Standard AVB Financial Corp. | Allegheny, PA | 1,230,931 | 1,219,499 | 1,218,128 | -0.2 | % | 0.0 | % | 39,517 | 112.0 | % | 0.36 | % | |||||||||||||||||||||
| Waterstone Financial, Inc. | Milwaukee, WI | 153,898 | 158,703 | 163,665 | 0.5 | % | 0.6 | % | 29,045 | 62.1 | % | 1.58 | % | |||||||||||||||||||||
| Wellesley Bancorp, Inc. | Norfolk, MA | 680,624 | 705,361 | 726,170 | 0.6 | % | 0.6 | % | 56,601 | 120.9 | % | 2.02 | % | |||||||||||||||||||||
| Western New England Bancorp, Inc. | Hampden, MA | 463,914 | 470,574 | 478,090 | 0.2 | % | 0.3 | % | 31,188 | 66.6 | % | 13.04 | % | |||||||||||||||||||||
| Averages: | 641,149 | 655,422 | 668,109 | 0.4 | % | 0.5 | % | 40,929 | 98.9 | % | 7.11 | % | ||||||||||||||||||||||
| Medians: | 526,401 | 549,809 | 569,291 | 0.5 | % | 0.5 | % | 40,552 | 101.7 | % | 3.51 | % | ||||||||||||||||||||||
| Pioneer Saving Bank | Albany, NY | 302,659 | 310,526 | 314,931 | 0.4 | % | 0.3 | % | 42,013 | 105.5 | % | 2.33 | % | |||||||||||||||||||||
(1) Total institution deposits in headquarters county as percent of total county deposits as of June 30, 2018.
Sources: S&P Global Market Intelligence and the FDIC.
EXHIBIT IV-1
Stock Prices:
As of February 8, 2018
RP® Financial, LC.
Exhibit IV-1A
Weekly Thrift Market Line - Part One
Prices As of February 8, 2019
| Market Capitalization | Price Change Data | Current Per Share Financials | ||||||||||||||||||||||||||||||||||||||||||||||||||||||||
| Price/ | Shares | Market | 52 Week (1) | % Change From | LTM | LTM Core | BV/ | TBV/ | Assets/ | |||||||||||||||||||||||||||||||||||||||||||||||||
| Share(1) | Outstanding | Capitalization | High | Low | Last Wk | Last Wk | 52 Wks (2) | MRY (2) | EPS (3) | EPS (3) | Share | Share (4) | Share | |||||||||||||||||||||||||||||||||||||||||||||
| ($) | (000) | ($Mil) | ($) | ($) | ($) | (%) | (%) | (%) | ($) | ($) | ($) | ($) | ($) | |||||||||||||||||||||||||||||||||||||||||||||
| Financial Institution | ||||||||||||||||||||||||||||||||||||||||||||||||||||||||||
| AX | Axos Financial, Inc. | 32.70 | 61,216 | 2,001.8 | 45.18 | 23.87 | 31.28 | 4.54 | -4.80 | 29.86 | 2.45 | NA | 15.84 | 14.77 | 0.00 | |||||||||||||||||||||||||||||||||||||||||||
| BCTF | Bancorp 34, Inc. | 15.12 | 3,228 | 48.8 | 17.25 | 12.86 | 15.07 | 0.31 | 0.53 | 2.23 | 0.09 | 0.49 | 13.56 | 13.51 | 0.00 | |||||||||||||||||||||||||||||||||||||||||||
| BYFC | Broadway Financial Corporation | 1.30 | 26,762 | 34.8 | 2.54 | 0.95 | 1.35 | -3.70 | -47.37 | 23.81 | 0.02 | 0.03 | 1.75 | 1.75 | 0.00 | |||||||||||||||||||||||||||||||||||||||||||
| CFFN | Capitol Federal Financial, Inc. | 12.86 | 137,623 | 1,769.8 | 14.15 | 11.80 | 12.83 | 0.23 | 2.23 | 0.70 | 0.73 | 0.68 | 9.85 | 9.73 | 0.00 | |||||||||||||||||||||||||||||||||||||||||||
| CARV | Carver Bancorp, Inc. | 3.40 | 3,699 | 12.6 | 11.94 | 2.40 | 3.88 | -12.37 | 22.61 | 14.09 | -0.27 | -1.15 | 0.85 | 0.85 | 0.00 | |||||||||||||||||||||||||||||||||||||||||||
| CBMB | CBM Bancorp, Inc. | 12.76 | 4,232 | 54.0 | 13.25 | 12.02 | 12.67 | 0.71 | NA | 1.92 | NA | NA | 14.23 | 14.23 | 0.00 | |||||||||||||||||||||||||||||||||||||||||||
| DCOM | Dime Community Bancshares, Inc. | 19.84 | 36,093 | 716.1 | 20.85 | 15.48 | 19.72 | 0.61 | 9.31 | 16.84 | 1.45 | 1.32 | 16.49 | 14.97 | 0.00 | |||||||||||||||||||||||||||||||||||||||||||
| EFBI | Eagle Financial Bancorp, Inc. | 15.65 | 1,508 | 23.6 | 16.84 | 14.56 | 15.54 | 0.68 | -2.17 | 3.16 | NA | NA | 17.05 | 17.05 | 0.00 | |||||||||||||||||||||||||||||||||||||||||||
| ESBK | Elmira Savings Bank | 18.68 | 3,504 | 65.5 | 21.00 | 15.77 | 18.84 | -0.83 | -9.34 | 7.07 | 1.31 | 1.65 | 16.42 | 12.90 | 0.00 | |||||||||||||||||||||||||||||||||||||||||||
| ESSA | ESSA Bancorp, Inc. | 15.25 | 10,993 | 167.6 | 16.50 | 14.16 | 15.22 | 0.20 | -0.97 | -2.31 | 0.60 | 1.00 | 15.21 | 13.92 | 0.00 | |||||||||||||||||||||||||||||||||||||||||||
| FDEF | First Defiance Financial Corp. | 29.39 | 20,196 | 593.6 | 35.00 | 22.78 | 28.40 | 3.49 | 11.94 | 19.91 | 2.13 | 2.08 | 19.29 | 14.22 | 0.00 | |||||||||||||||||||||||||||||||||||||||||||
| FNWB | First Northwest Bancorp | 15.69 | 10,310 | 161.8 | 17.65 | 13.56 | 15.27 | 2.75 | -3.92 | 5.80 | 0.47 | 0.56 | 15.18 | 15.18 | 0.00 | |||||||||||||||||||||||||||||||||||||||||||
| FBC | Flagstar Bancorp, Inc. | 31.70 | 57,749 | 1,830.7 | 38.00 | 25.30 | 32.02 | -1.00 | -8.96 | 20.08 | 1.49 | 2.92 | 26.34 | 25.13 | 0.00 | |||||||||||||||||||||||||||||||||||||||||||
| FSBW | FS Bancorp, Inc. | 52.00 | 4,371 | 227.3 | 66.40 | 41.25 | 48.71 | 6.75 | -4.66 | 21.27 | 4.33 | 4.35 | 35.82 | 34.91 | 0.00 | |||||||||||||||||||||||||||||||||||||||||||
| FSBC | FSB Bancorp, Inc. | 17.00 | 1,909 | 32.5 | 18.50 | 15.96 | 16.80 | 1.19 | -0.29 | 0.00 | -0.05 | 0.07 | 16.12 | 16.12 | 0.00 | |||||||||||||||||||||||||||||||||||||||||||
| HIFS | Hingham Institution for Savings | 183.95 | 2,133 | 392.3 | 229.99 | 180.17 | 187.30 | -1.79 | -8.19 | -6.97 | 14.83 | 14.46 | 98.35 | 98.35 | 0.00 | |||||||||||||||||||||||||||||||||||||||||||
| HMNF | HMN Financial, Inc. | 19.55 | 4,580 | 89.5 | 21.90 | 18.05 | 20.25 | -3.46 | 5.68 | -0.36 | 1.32 | 1.56 | 17.35 | 17.12 | 0.00 | |||||||||||||||||||||||||||||||||||||||||||
| HFBL | Home Federal Bancorp, Inc. of Louisiana | 30.62 | 1,770 | 54.2 | 37.30 | 25.64 | 31.25 | -2.02 | 9.14 | 3.94 | 1.97 | 2.31 | 25.32 | 25.32 | 0.00 | |||||||||||||||||||||||||||||||||||||||||||
| HVBC | HV Bancorp, Inc. | 15.16 | 2,100 | 31.8 | 17.50 | 13.75 | 15.12 | 0.24 | 1.07 | 1.20 | 0.39 | 0.51 | 13.72 | 13.72 | 0.00 | |||||||||||||||||||||||||||||||||||||||||||
| IROQ | IF Bancorp, Inc. | 20.75 | 3,371 | 69.9 | 25.04 | 18.70 | 20.40 | 1.72 | 3.70 | 3.13 | 0.46 | 0.82 | 20.94 | 20.94 | 0.00 | |||||||||||||||||||||||||||||||||||||||||||
| ISBC | Investors Bancorp, Inc. | 12.60 | 274,431 | 3,457.8 | 14.41 | 9.94 | 12.74 | -1.10 | -3.45 | 21.15 | 0.57 | 0.79 | 10.39 | 10.09 | 0.00 | |||||||||||||||||||||||||||||||||||||||||||
| KRNY | Kearny Financial Corp. | 12.95 | 89,840 | 1,163.4 | 14.80 | 11.26 | 12.99 | -0.31 | 0.78 | 1.01 | 0.29 | 0.39 | 12.64 | 10.42 | 0.00 | |||||||||||||||||||||||||||||||||||||||||||
| MELR | Melrose Bancorp, Inc. | 18.02 | 2,374 | 42.8 | 20.50 | 16.99 | 18.46 | -2.38 | -9.33 | 0.33 | 0.63 | 0.54 | 17.37 | 17.37 | 0.00 | |||||||||||||||||||||||||||||||||||||||||||
| EBSB | Meridian Bancorp, Inc. | 15.77 | 51,106 | 805.9 | 20.95 | 13.67 | 15.85 | -0.50 | -19.64 | 10.13 | 1.00 | 1.08 | 12.52 | 12.11 | 0.00 | |||||||||||||||||||||||||||||||||||||||||||
| CASH | Meta Financial Group, Inc. | 24.03 | 39,420 | 947.3 | 39.28 | 18.01 | 23.66 | 1.56 | -33.03 | 23.93 | 1.67 | 2.53 | 19.00 | 9.45 | 0.00 | |||||||||||||||||||||||||||||||||||||||||||
| MSVB | Mid-Southern Bancorp, Inc. | 12.89 | 3,366 | 43.4 | 28.55 | 11.55 | 12.30 | 4.80 | -50.42 | 11.41 | 0.64 | 0.84 | 13.35 | 13.35 | 0.00 | |||||||||||||||||||||||||||||||||||||||||||
| MSBF | MSB Financial Corp. | 17.80 | 5,210 | 92.7 | 21.95 | 16.14 | 17.80 | 0.00 | 0.00 | -0.28 | 0.71 | 0.83 | 12.70 | 12.70 | 0.00 | |||||||||||||||||||||||||||||||||||||||||||
| NYCB | New York Community Bancorp, Inc. | 11.98 | 473,537 | 5,673.0 | 14.53 | 8.61 | 11.97 | 0.08 | -9.58 | 27.31 | 0.86 | 0.77 | 12.83 | 7.86 | 0.00 | |||||||||||||||||||||||||||||||||||||||||||
| NFBK | Northfield Bancorp, Inc. | 14.59 | 49,127 | 716.8 | 17.33 | 12.76 | 14.52 | 0.48 | -5.01 | 7.68 | 0.60 | 0.84 | 13.21 | 12.41 | 0.00 | |||||||||||||||||||||||||||||||||||||||||||
| NWBI | Northwest Bancshares, Inc. | 17.90 | 103,354 | 1,850.0 | 18.56 | 15.50 | 17.66 | 1.36 | 9.61 | 5.67 | 0.98 | 0.98 | 12.01 | 8.83 | 0.00 | |||||||||||||||||||||||||||||||||||||||||||
| ORIT | Oritani Financial Corp. | 16.88 | 45,493 | 767.9 | 17.20 | 14.07 | 16.99 | -0.65 | 5.17 | 14.44 | 0.99 | 1.28 | 12.08 | 12.08 | 0.00 | |||||||||||||||||||||||||||||||||||||||||||
| OTTW | Ottawa Bancorp, Inc. | 13.53 | 3,220 | 43.6 | 14.30 | 12.75 | 13.85 | -2.31 | -2.47 | 1.50 | 0.30 | 0.57 | 15.56 | 15.30 | 0.00 | |||||||||||||||||||||||||||||||||||||||||||
| PBBI | PB Bancorp, Inc. | 11.13 | 7,218 | 80.3 | 12.20 | 10.25 | 11.06 | 0.68 | 8.01 | 3.06 | 0.54 | 0.55 | 11.19 | 10.28 | 0.00 | |||||||||||||||||||||||||||||||||||||||||||
| PCSB | PCSB Financial Corporation | 20.70 | 16,323 | 337.9 | 22.34 | 18.16 | 20.28 | 2.07 | 5.24 | 5.83 | 0.43 | 0.42 | 15.96 | 15.60 | 0.00 | |||||||||||||||||||||||||||||||||||||||||||
| PROV | Provident Financial Holdings, Inc. | 18.63 | 7,510 | 139.9 | 19.78 | 14.67 | 17.65 | 5.55 | 3.44 | 20.19 | 0.55 | 0.84 | 16.22 | 16.22 | 0.00 | |||||||||||||||||||||||||||||||||||||||||||
| PFS | Provident Financial Services, Inc. | 27.43 | 66,830 | 1,833.1 | 29.12 | 22.22 | 26.30 | 4.30 | 9.11 | 13.68 | 1.57 | 1.65 | 19.92 | 13.66 | 0.00 | |||||||||||||||||||||||||||||||||||||||||||
| PBIP | Prudential Bancorp, Inc. | 18.01 | 8,893 | 160.2 | 19.87 | 13.92 | 18.27 | -1.42 | 6.88 | 2.33 | 0.78 | 1.02 | 14.29 | 13.55 | 0.00 | |||||||||||||||||||||||||||||||||||||||||||
| RNDB | Randolph Bancorp, Inc. | 14.75 | 5,535 | 81.6 | 17.45 | 13.16 | 15.00 | -1.67 | -5.51 | 4.24 | -0.62 | -0.31 | 13.05 | NA | 0.00 | |||||||||||||||||||||||||||||||||||||||||||
| RVSB | Riverview Bancorp, Inc. | 7.47 | 22,599 | 168.8 | 9.99 | 5.46 | 7.54 | -0.93 | -14.73 | 2.61 | 0.59 | 0.67 | 5.42 | 4.17 | 0.00 | |||||||||||||||||||||||||||||||||||||||||||
| SVBI | Severn Bancorp, Inc. | 8.85 | 12,721 | 112.6 | 9.86 | 7.10 | 8.24 | 7.35 | 15.69 | 10.90 | 0.44 | 0.58 | 7.55 | 7.47 | 0.00 | |||||||||||||||||||||||||||||||||||||||||||
| STXB | Spirit of Texas Bancshares, Inc. | 21.70 | 12,104 | 262.7 | 23.53 | 16.70 | 21.50 | 0.93 | NA | �� | -4.74 | 0.90 | 1.09 | 15.38 | 14.26 | 0.00 | ||||||||||||||||||||||||||||||||||||||||||
| STND | Standard AVB Financial Corp. | 30.49 | 4,632 | 141.2 | 39.45 | 28.75 | 30.31 | 0.59 | 1.43 | 2.04 | 1.79 | 2.00 | 28.16 | 22.22 | 0.00 | |||||||||||||||||||||||||||||||||||||||||||
| SBT | Sterling Bancorp, Inc. | 9.67 | 53,012 | 512.6 | 14.98 | 6.65 | 8.76 | 10.39 | -25.50 | 39.14 | 1.03 | 1.11 | 6.03 | 6.02 | 0.00 | |||||||||||||||||||||||||||||||||||||||||||
| TBNK | Territorial Bancorp Inc. | 27.46 | 9,180 | 252.1 | 31.95 | 24.96 | 27.59 | -0.47 | -8.95 | 5.70 | 1.78 | 2.00 | 24.36 | 24.36 | 0.00 | |||||||||||||||||||||||||||||||||||||||||||
| TSBK | Timberland Bancorp, Inc. | 28.49 | 8,293 | 236.3 | 39.45 | 21.91 | 28.39 | 0.35 | 5.01 | 27.76 | 2.22 | 2.34 | 16.84 | 16.08 | 0.00 | |||||||||||||||||||||||||||||||||||||||||||
| TBK | Triumph Bancorp, Inc. | 30.41 | 26,849 | 816.5 | 44.70 | 27.47 | 30.88 | -1.52 | -20.08 | 2.39 | 1.66 | 2.23 | 23.10 | 15.42 | 0.00 | |||||||||||||||||||||||||||||||||||||||||||
| TRST | TrustCo Bank Corp NY | 8.01 | 96,659 | 774.2 | 9.45 | 6.51 | 7.84 | 2.17 | -4.93 | 16.76 | 0.55 | 0.60 | 4.94 | 4.93 | 0.00 | |||||||||||||||||||||||||||||||||||||||||||
| UBNK | United Financial Bancorp, Inc. | 15.13 | 50,639 | 766.2 | 18.33 | 13.37 | 15.11 | 0.13 | -3.66 | 2.93 | 1.13 | 1.19 | 13.88 | 11.55 | 0.00 | |||||||||||||||||||||||||||||||||||||||||||
| WSBF | Waterstone Financial, Inc. | 16.24 | 26,189 | 425.3 | 18.10 | 15.20 | 16.48 | -1.46 | -4.75 | -3.10 | 1.01 | 1.10 | 13.93 | 13.91 | 0.00 | |||||||||||||||||||||||||||||||||||||||||||
| WEBK | Wellesley Bancorp, Inc. | 32.00 | 2,419 | 77.4 | 34.50 | 27.74 | 30.69 | 4.27 | 12.26 | 15.36 | 1.85 | 2.24 | 24.96 | 24.96 | 0.00 | |||||||||||||||||||||||||||||||||||||||||||
| WNEB | Western New England Bancorp, Inc. | 9.80 | 27,693 | 271.4 | 11.25 | 8.50 | 9.32 | 5.15 | -1.51 | -2.39 | 0.43 | 0.55 | 8.19 | 7.64 | 0.00 | |||||||||||||||||||||||||||||||||||||||||||
| WSFS | WSFS Financial Corporation | 42.18 | 31,374 | 1,323.4 | 57.70 | 33.75 | 42.64 | -1.08 | -11.57 | 11.26 | 2.94 | 3.26 | 25.08 | 19.26 | 0.00 | |||||||||||||||||||||||||||||||||||||||||||
| WVFC | WVS Financial Corp. | 15.75 | 1,788 | 28.2 | 17.90 | 12.25 | 15.65 | 0.64 | -8.70 | 6.64 | 1.30 | 1.38 | 17.64 | 17.64 | 0.00 | |||||||||||||||||||||||||||||||||||||||||||
| MHC | ||||||||||||||||||||||||||||||||||||||||||||||||||||||||||
| BCOW | 1895 Bancorp Of Wisconsin, Inc. (MHC) | 9.48 | 4,877 | 46.3 | 10.50 | 9.16 | 9.45 | 0.32 | NA | NA | NA | NA | NA | NA | 0.00 | |||||||||||||||||||||||||||||||||||||||||||
| CLBK | Columbia Financial, Inc. (MHC) | 15.77 | 115,889 | 1,827.6 | 17.73 | 14.01 | 15.28 | 3.21 | NA | 3.14 | NA | NA | 8.17 | 8.12 | 0.00 | |||||||||||||||||||||||||||||||||||||||||||
| CFBI | Community First Bancshares, Inc. (MHC) | 10.33 | 7,481 | 77.3 | 11.92 | 10.06 | 10.61 | -2.64 | -8.50 | -11.33 | 0.06 | 0.18 | 10.17 | 10.17 | 0.00 | |||||||||||||||||||||||||||||||||||||||||||
| FFBW | FFBW, Inc. (MHC) | 11.22 | 6,453 | 72.4 | 11.79 | 9.50 | 10.65 | 5.32 | 2.80 | 11.83 | 0.06 | 0.17 | 9.00 | 8.99 | 0.00 | |||||||||||||||||||||||||||||||||||||||||||
| GCBC | Greene County Bancorp, Inc. (MHC) | 32.33 | 8,538 | 276.0 | 38.00 | 28.85 | 30.67 | 5.41 | -8.93 | 3.89 | 1.79 | 1.76 | 11.67 | 11.67 | 0.00 | |||||||||||||||||||||||||||||||||||||||||||
| HONE | HarborOne Bancorp, Inc. (MHC) | 15.33 | 31,562 | 483.8 | 20.01 | 14.90 | 15.19 | 0.92 | -15.91 | -3.52 | 0.41 | 0.43 | 10.87 | 10.45 | 0.00 | |||||||||||||||||||||||||||||||||||||||||||
| KFFB | Kentucky First Federal Bancorp (MHC) | 7.50 | 8,367 | 62.8 | 9.00 | 6.52 | 7.55 | -0.66 | -16.67 | 8.54 | 0.15 | 0.09 | 7.99 | 6.27 | 0.00 | |||||||||||||||||||||||||||||||||||||||||||
| LSBK | Lake Shore Bancorp, Inc. (MHC) | 15.93 | 5,862 | 93.4 | 18.00 | 14.64 | 15.93 | 0.00 | -3.16 | 5.78 | 0.57 | 0.59 | 13.03 | 13.03 | 0.00 | |||||||||||||||||||||||||||||||||||||||||||
| MGYR | Magyar Bancorp, Inc. (MHC) | 11.65 | 5,821 | 67.8 | 13.50 | 11.55 | 11.55 | 0.87 | -5.74 | -4.90 | 0.35 | 0.41 | 8.82 | 8.82 | 0.00 | |||||||||||||||||||||||||||||||||||||||||||
| OFED | Oconee Federal Financial Corp. (MHC) | 24.43 | 5,690 | 139.0 | 30.27 | 23.06 | 26.17 | -6.65 | -13.21 | -1.89 | 0.52 | 0.69 | 14.62 | 14.10 | 0.00 | |||||||||||||||||||||||||||||||||||||||||||
| PDLB | PDL Community Bancorp (MHC) | 12.63 | 17,824 | 225.1 | 16.23 | 12.42 | 12.85 | -1.71 | -14.66 | -0.86 | -0.05 | 0.07 | 9.05 | 9.05 | 0.00 | |||||||||||||||||||||||||||||||||||||||||||
| PVBC | Provident Bancorp, Inc. (MHC) | 23.00 | 9,229 | 212.3 | 30.80 | 19.81 | 22.88 | 0.52 | -1.08 | 6.09 | 0.89 | 0.86 | 12.68 | 12.68 | 0.00 | |||||||||||||||||||||||||||||||||||||||||||
| RBKB | Rhinebeck Bancorp, Inc. (MHC) | 11.44 | 11,133 | 127.4 | 11.90 | 11.30 | 11.59 | -1.29 | NA | NA | NA | NA | NA | NA | 0.00 | |||||||||||||||||||||||||||||||||||||||||||
| TFSL | TFS Financial Corporation (MHC) | 16.92 | 275,368 | 4,659.2 | 17.00 | 14.19 | 16.55 | 2.24 | 17.42 | 4.90 | 0.30 | NA | 6.27 | 6.24 | 0.00 | |||||||||||||||||||||||||||||||||||||||||||
| Under Acquisition | ||||||||||||||||||||||||||||||||||||||||||||||||||||||||||
| BNCL | Beneficial Bancorp, Inc. | 15.64 | 72,321 | 1,131.1 | 18.60 | 13.74 | 15.81 | -1.08 | 4.27 | 9.45 | 0.41 | 0.61 | 13.83 | 11.66 | 0.00 | |||||||||||||||||||||||||||||||||||||||||||
| BHBK | Blue Hills Bancorp, Inc. | 23.75 | 24,290 | 576.9 | 25.80 | 19.50 | 23.85 | -0.42 | 21.79 | 11.29 | 0.81 | 0.93 | 14.98 | 14.64 | 0.00 | |||||||||||||||||||||||||||||||||||||||||||
| BLMT | BSB Bancorp, Inc. | 33.30 | 9,413 | 313.4 | 36.50 | 26.64 | 32.72 | 1.76 | 16.21 | 18.66 | 2.18 | 2.46 | 20.29 | 20.29 | 0.00 | |||||||||||||||||||||||||||||||||||||||||||
| SIFI | SI Financial Group, Inc. | 13.43 | 11,720 | 157.4 | 15.60 | 12.26 | 12.93 | 3.87 | -3.38 | 5.50 | 0.55 | 0.87 | 14.13 | 12.76 | 0.00 | |||||||||||||||||||||||||||||||||||||||||||
| (1) | Average of High/Low or Bid/Ask price per share. |
| (2) | Or since offering price if converted of first listed in the past 52 weeks. Percent change figures are actual year-to-date and are not annualized. |
| (3) | EPS (earnings per share) is based on actual trailing 12 month data and is not shown on a pro forma basis. |
| (4) | Excludes intangibles (such as goodwill, value of core deposits, etc.). |
| (5) | ROA (return on assets) and ROE (return on equity) are indicated ratios based on trailing 12 month common earnings and average common equity and total assets balances. |
| (6) | Annualized based on last regular quarterly cash dividend announcement. |
| (7) | Indicated dividend as a percent of trailing 12 month earnings. |
| (8) | Excluded from averages due to actual or rumored acquisition activities or unusual operating characteristics. |
| (9) | For MHC institutions, market value reflects share price multiplied by public (non-MHC) shares. |
Source: S&P Market Intelligence, LC. and RP® Financial, LC. calculations. The information provided in this table has been obtained from sources we believe are reliable, but we cannot guarantee the accuracy or completeness of such information.
Copyright (c) 2019 by RP® Financial, LC.
RP® Financial, LC.
Exhibit IV-1B
Weekly Bank and Thrift Market Line - Part Two
Prices As of February 8, 2019
| Key Financial Ratios | Asset Quality Ratios | Pricing Ratios | Dividend Data (6) | |||||||||||||||||||||||||||||||||||||||||||||||||||||||||||||||
| Equity/ | Tang Equity/ | Reported Earnings | Core Earnings | NPAs/ | Rsvs/ | Price/ | Price/ | Price/ | Price/ | Price/ | Div/ | Dividend | Payout | |||||||||||||||||||||||||||||||||||||||||||||||||||||
| Assets(1) | Assets(1) | ROA(5) | ROE(5) | ROA(5) | ROE(5) | Assets | NPLs | Earnings | Book | Assets | Tang Book | Core Earnings | Share | Yield | Ratio (7) | |||||||||||||||||||||||||||||||||||||||||||||||||||
| (%) | (%) | (%) | (%) | (%) | (%) | (%) | (%) | (x) | (%) | (%) | (%) | (x) | ($) | (%) | (%) | |||||||||||||||||||||||||||||||||||||||||||||||||||
| Financial Institution | ||||||||||||||||||||||||||||||||||||||||||||||||||||||||||||||||||
| AX | Axos Financial, Inc. | 10.22 | 9.60 | 1.68 | 16.86 | NA | NA | 0.40 | 166.31 | 12.67 | 202.31 | 20.41 | 220.06 | NA | NA | NA | NM | |||||||||||||||||||||||||||||||||||||||||||||||||
| BCTF | Bancorp 34, Inc. | 12.37 | 12.32 | 0.09 | 0.62 | 0.46 | 3.33 | 1.43 | 60.52 | NM | 111.50 | 13.79 | 111.94 | 31.12 | 0.00 | 0.00 | NM | |||||||||||||||||||||||||||||||||||||||||||||||||
| BYFC | Broadway Financial Corporation | 11.45 | 11.45 | 0.03 | 0.30 | 0.16 | 1.39 | 2.20 | 37.95 | 65.00 | 74.24 | 8.50 | 74.24 | 39.38 | 0.00 | 0.00 | NM | |||||||||||||||||||||||||||||||||||||||||||||||||
| CFFN | Capitol Federal Financial, Inc. | 14.73 | 14.57 | 0.94 | 7.25 | 0.88 | 6.76 | 0.35 | 27.12 | 18.91 | 134.98 | 19.53 | 132.20 | 18.73 | 0.34 | 2.64 | 144.12 | |||||||||||||||||||||||||||||||||||||||||||||||||
| CARV | Carver Bancorp, Inc. | 7.85 | 7.85 | 0.54 | 7.24 | -0.65 | -8.73 | 2.07 | 38.42 | NM | 398.97 | 2.21 | 398.97 | NM | 0.00 | 0.00 | NM | |||||||||||||||||||||||||||||||||||||||||||||||||
| CBMB | CBM Bancorp, Inc. | 27.69 | 27.69 | NA | 1.99 | NA | 3.95 | 0.89 | 110.18 | NA | 89.67 | 24.83 | 89.67 | NA | NA | NA | NA | |||||||||||||||||||||||||||||||||||||||||||||||||
| DCOM | Dime Community Bancshares, Inc. | 9.59 | 8.78 | 0.86 | 8.97 | 0.76 | 7.94 | 0.11 | 301.95 | 14.38 | 118.93 | 11.33 | 131.04 | 14.62 | 0.56 | 2.82 | 40.58 | |||||||||||||||||||||||||||||||||||||||||||||||||
| EFBI | Eagle Financial Bancorp, Inc. | 20.11 | 20.11 | 0.41 | 1.95 | 0.26 | 1.24 | 0.79 | 136.04 | NA | 91.81 | 18.46 | 91.81 | NA | NA | NA | NA | |||||||||||||||||||||||||||||||||||||||||||||||||
| ESBK | Elmira Savings Bank | 10.08 | 8.09 | 0.85 | 8.06 | 1.06 | 10.08 | 0.79 | 100.00 | 15.44 | 113.07 | 11.10 | 143.63 | 15.46 | 0.92 | 4.92 | 76.03 | |||||||||||||||||||||||||||||||||||||||||||||||||
| ESSA | ESSA Bancorp, Inc. | 9.77 | 9.02 | 0.36 | 3.61 | 0.60 | 6.01 | 0.64 | 110.09 | 14.95 | 97.55 | 9.68 | 106.23 | 14.52 | 0.40 | 2.62 | 36.27 | |||||||||||||||||||||||||||||||||||||||||||||||||
| FDEF | First Defiance Financial Corp. | 12.70 | 9.69 | 1.45 | 11.51 | 1.41 | 11.16 | 1.14 | 82.41 | 13.00 | 148.36 | 18.63 | 199.85 | 12.97 | 0.76 | 2.59 | 30.09 | |||||||||||||||||||||||||||||||||||||||||||||||||
| FNWB | First Northwest Bancorp | 13.89 | 13.89 | 0.40 | 2.78 | 0.48 | 3.33 | 0.51 | 148.27 | 23.07 | 101.74 | 13.92 | 101.74 | 23.27 | 0.12 | 0.76 | 8.82 | |||||||||||||||||||||||||||||||||||||||||||||||||
| FBC | Flagstar Bancorp, Inc. | 8.12 | 7.77 | 0.50 | 5.97 | 0.96 | 11.50 | 0.45 | 171.79 | 9.88 | 116.60 | 9.88 | 132.66 | NA | 0.16 | 0.50 | 1.25 | |||||||||||||||||||||||||||||||||||||||||||||||||
| FSBW | FS Bancorp, Inc. | 11.17 | 10.92 | 1.54 | 13.06 | 1.54 | 13.12 | 0.18 | 554.56 | 8.27 | 129.76 | 14.41 | 136.21 | 10.17 | 0.60 | 1.15 | 9.06 | |||||||||||||||||||||||||||||||||||||||||||||||||
| FSBC | FSB Bancorp, Inc. | 9.57 | 9.57 | -0.03 | -0.30 | 0.04 | 0.43 | 0.03 | NM | NM | 105.48 | NA | 105.48 | 242.86 | NA | NA | NM | |||||||||||||||||||||||||||||||||||||||||||||||||
| HIFS | Hingham Institution for Savings | 8.85 | 8.85 | 1.42 | 16.55 | 1.38 | 16.14 | 0.08 | 719.32 | 13.23 | 184.55 | 16.29 | 184.55 | 12.27 | 1.48 | 0.80 | 13.81 | |||||||||||||||||||||||||||||||||||||||||||||||||
| HMNF | HMN Financial, Inc. | 10.85 | 10.72 | 0.87 | 7.55 | 1.03 | 8.93 | 0.93 | 137.72 | 11.37 | 113.70 | 13.27 | 115.17 | NA | 0.00 | 0.00 | NM | |||||||||||||||||||||||||||||||||||||||||||||||||
| HFBL | Home Federal Bancorp, Inc. of Louisiana | 11.20 | 11.20 | 0.90 | 8.09 | 1.06 | 9.46 | 1.72 | 62.96 | 12.76 | 118.46 | 13.54 | 118.46 | 12.76 | 0.56 | 1.83 | 22.50 | |||||||||||||||||||||||||||||||||||||||||||||||||
| HVBC | HV Bancorp, Inc. | 10.26 | 10.26 | 0.30 | 2.59 | 0.39 | 3.37 | 0.60 | 51.61 | 38.87 | 110.47 | 11.33 | 110.47 | 29.73 | NA | NA | 128.21 | |||||||||||||||||||||||||||||||||||||||||||||||||
| IROQ | IF Bancorp, Inc. | 12.37 | 12.37 | 0.27 | 2.06 | 0.48 | 3.66 | 1.18 | 228.76 | 23.58 | 95.57 | 11.30 | 95.57 | NA | 0.25 | 1.20 | 25.57 | |||||||||||||||||||||||||||||||||||||||||||||||||
| ISBC | Investors Bancorp, Inc. | 11.89 | 11.59 | 0.65 | 5.27 | 0.86 | 6.93 | 0.49 | 196.22 | 17.50 | 120.02 | 13.75 | 124.88 | 15.43 | 0.44 | 3.49 | 55.56 | |||||||||||||||||||||||||||||||||||||||||||||||||
| KRNY | Kearny Financial Corp. | 18.57 | 15.82 | 0.45 | 2.25 | 0.59 | 2.95 | 0.39 | 128.92 | 33.21 | 102.63 | 18.12 | 124.25 | 29.40 | 0.20 | 1.54 | 82.05 | |||||||||||||||||||||||||||||||||||||||||||||||||
| MELR | Melrose Bancorp, Inc. | 13.96 | 13.96 | 0.49 | 3.40 | 0.41 | 2.87 | NA | NA | 24.35 | 102.55 | 14.32 | 102.55 | NA | 0.34 | 1.89 | 45.95 | |||||||||||||||||||||||||||||||||||||||||||||||||
| EBSB | Meridian Bancorp, Inc. | 11.76 | 11.42 | 0.96 | 7.95 | 1.03 | 8.44 | 0.35 | 245.10 | 14.88 | 125.15 | 13.67 | 129.58 | 14.34 | 0.28 | 1.78 | 20.75 | |||||||||||||||||||||||||||||||||||||||||||||||||
| CASH | Meta Financial Group, Inc. | 12.81 | 6.84 | 1.13 | 10.58 | 1.71 | 16.47 | 0.66 | 197.64 | 12.58 | 123.38 | 15.32 | 238.02 | 9.38 | 0.20 | 0.83 | 9.77 | |||||||||||||||||||||||||||||||||||||||||||||||||
| MSVB | Mid-Southern Bancorp, Inc. | 23.90 | 23.90 | 0.57 | 4.04 | 0.71 | 5.03 | 1.77 | 55.15 | 31.44 | 96.54 | NA | 96.54 | 31.44 | 0.08 | 0.62 | 9.76 | |||||||||||||||||||||||||||||||||||||||||||||||||
| MSBF | MSB Financial Corp. | 11.86 | 11.86 | 0.69 | 5.41 | 0.81 | 6.36 | 2.26 | 42.38 | 19.78 | 143.93 | 16.41 | 143.93 | 19.78 | 0.00 | 0.00 | 100.56 | |||||||||||||||||||||||||||||||||||||||||||||||||
| NYCB | New York Community Bancorp, Inc. | 13.26 | 8.93 | 0.93 | 6.74 | 0.84 | 6.11 | 0.15 | 247.77 | 15.16 | 92.21 | 11.04 | 152.65 | NA | 0.68 | 5.68 | 86.08 | |||||||||||||||||||||||||||||||||||||||||||||||||
| NFBK | Northfield Bancorp, Inc. | 15.27 | 14.48 | 0.69 | 4.39 | 0.94 | 6.00 | 0.62 | 104.24 | 17.16 | 108.66 | 16.43 | 115.50 | 17.04 | 0.40 | 2.74 | 47.06 | |||||||||||||||||||||||||||||||||||||||||||||||||
| NWBI | Northwest Bancshares, Inc. | 12.96 | 9.86 | 1.07 | 8.33 | 1.07 | 8.36 | 1.00 | 59.80 | 17.55 | 147.10 | 19.26 | 198.84 | 16.91 | 0.72 | 4.02 | 67.65 | |||||||||||||||||||||||||||||||||||||||||||||||||
| ORIT | Oritani Financial Corp. | 13.70 | 13.70 | 1.07 | 7.91 | 1.38 | 10.20 | 0.27 | 305.25 | 13.95 | 143.33 | 18.47 | 143.33 | 13.27 | 1.00 | 5.92 | 95.04 | |||||||||||||||||||||||||||||||||||||||||||||||||
| OTTW | Ottawa Bancorp, Inc. | 18.96 | 18.69 | 0.36 | 1.77 | 0.71 | 3.46 | NA | NA | 45.10 | 86.95 | 16.48 | 88.44 | 23.61 | 0.20 | 1.48 | 88.33 | |||||||||||||||||||||||||||||||||||||||||||||||||
| PBBI | PB Bancorp, Inc. | 16.41 | 15.28 | 0.75 | 4.65 | 0.76 | 4.75 | NA | NA | 20.61 | 99.50 | 16.32 | 108.28 | 20.07 | 0.28 | 2.52 | 59.26 | |||||||||||||||||||||||||||||||||||||||||||||||||
| PCSB | PCSB Financial Corporation | 19.66 | 19.30 | 0.50 | 2.51 | 0.61 | 3.08 | NA | NA | 36.32 | 132.54 | 24.58 | 135.58 | 37.52 | 0.12 | 0.58 | 21.05 | |||||||||||||||||||||||||||||||||||||||||||||||||
| PROV | Provident Financial Holdings, Inc. | 10.51 | 10.51 | 0.36 | 3.44 | 0.56 | 5.38 | 0.76 | 86.34 | 20.47 | 114.00 | 12.41 | 114.00 | 20.47 | 0.56 | 3.01 | 61.54 | |||||||||||||||||||||||||||||||||||||||||||||||||
| PFS | Provident Financial Services, Inc. | 13.71 | 9.83 | 1.05 | 7.76 | 1.11 | 8.18 | 0.74 | 81.72 | 15.07 | 133.87 | 18.71 | 193.38 | 15.30 | 0.92 | 3.35 | 57.69 | |||||||||||||||||||||||||||||||||||||||||||||||||
| PBIP | Prudential Bancorp, Inc. | 11.88 | 11.33 | 0.72 | 5.45 | 0.95 | 7.12 | 1.39 | 36.80 | 18.38 | 122.56 | 14.36 | 129.12 | NA | 0.20 | 1.11 | 56.12 | |||||||||||||||||||||||||||||||||||||||||||||||||
| RNDB | Randolph Bancorp, Inc. | 13.25 | NA | -0.63 | -4.26 | -0.29 | -1.94 | 0.95 | 70.24 | NM | 113.04 | 14.98 | NA | NM | NA | NA | NM | |||||||||||||||||||||||||||||||||||||||||||||||||
| RVSB | Riverview Bancorp, Inc. | 10.66 | 8.42 | 1.16 | 11.05 | 1.31 | 12.48 | 0.53 | 190.77 | 10.52 | 131.79 | 14.66 | 168.72 | 10.77 | 0.16 | 2.14 | 19.72 | |||||||||||||||||||||||||||||||||||||||||||||||||
| SVBI | Severn Bancorp, Inc. | 10.78 | 10.67 | 0.69 | 6.30 | 0.92 | 8.42 | 1.94 | 47.38 | 13.21 | 117.19 | NA | 118.55 | NA | 0.12 | 1.36 | 17.91 | |||||||||||||||||||||||||||||||||||||||||||||||||
| STXB | Spirit of Texas Bancshares, Inc. | 13.69 | 12.82 | 0.76 | 6.79 | 0.91 | 8.16 | NA | 174.10 | 20.87 | 132.12 | 17.89 | 157.36 | NA | NA | NA | NM | |||||||||||||||||||||||||||||||||||||||||||||||||
| STND | Standard AVB Financial Corp. | 13.77 | 11.19 | 0.86 | 6.33 | 0.97 | 7.13 | 0.30 | 184.96 | 16.22 | 106.42 | 15.10 | 137.21 | NA | 0.88 | 2.90 | 47.02 | |||||||||||||||||||||||||||||||||||||||||||||||||
| SBT | Sterling Bancorp, Inc. | 9.99 | 9.98 | 1.80 | 19.19 | 1.93 | 20.57 | 0.19 | 348.52 | 8.06 | 153.00 | 16.04 | 153.20 | NA | 0.04 | 0.41 | 2.50 | |||||||||||||||||||||||||||||||||||||||||||||||||
| TBNK | Territorial Bancorp Inc. | 11.64 | 11.64 | 0.83 | 7.10 | 0.93 | 7.95 | NA | 77.66 | 13.53 | 112.40 | 12.80 | 112.40 | 13.55 | 0.88 | 3.20 | 57.14 | |||||||||||||||||||||||||||||||||||||||||||||||||
| TSBK | Timberland Bancorp, Inc. | 12.24 | 11.75 | 1.70 | 14.27 | 1.79 | 15.04 | 0.65 | 223.08 | 11.82 | 150.95 | 19.73 | 169.29 | 11.52 | 0.60 | 2.11 | 30.71 | |||||||||||||||||||||||||||||||||||||||||||||||||
| TBK | Triumph Bancorp, Inc. | 13.59 | 9.57 | 1.12 | 8.00 | 1.53 | 10.92 | 0.88 | 72.97 | 14.98 | 128.74 | 17.97 | 187.46 | 12.47 | NA | NA | NM | |||||||||||||||||||||||||||||||||||||||||||||||||
| TRST | TrustCo Bank Corp NY | 9.77 | 9.76 | 1.08 | 11.36 | 1.18 | 12.45 | 0.77 | 127.48 | 12.59 | 158.05 | 15.61 | 158.23 | NA | 0.27 | 3.40 | 42.06 | |||||||||||||||||||||||||||||||||||||||||||||||||
| UBNK | United Financial Bancorp, Inc. | 9.85 | 8.34 | 0.81 | 8.23 | 0.85 | 8.70 | 0.59 | 123.24 | 12.93 | 108.54 | 10.51 | 131.14 | 13.01 | 0.48 | 3.17 | 41.03 | |||||||||||||||||||||||||||||||||||||||||||||||||
| WSBF | Waterstone Financial, Inc. | 21.08 | 21.06 | 1.52 | 6.91 | 1.66 | 7.55 | 0.61 | 138.22 | 14.63 | 115.65 | 24.13 | 115.83 | 14.63 | 0.48 | 2.96 | 88.29 | |||||||||||||||||||||||||||||||||||||||||||||||||
| WEBK | Wellesley Bancorp, Inc. | 7.53 | 7.53 | 0.57 | 7.59 | 0.69 | 9.20 | NA | NA | 13.33 | 124.08 | 9.27 | 124.08 | 13.33 | 0.22 | 0.69 | 8.96 | |||||||||||||||||||||||||||||||||||||||||||||||||
| WNEB | Western New England Bancorp, Inc. | 11.22 | 10.54 | 0.59 | 5.00 | 0.78 | 6.67 | 0.69 | 82.82 | 17.19 | 117.39 | 13.13 | 125.99 | 17.12 | 0.16 | 1.63 | 21.05 | |||||||||||||||||||||||||||||||||||||||||||||||||
| WSFS | WSFS Financial Corporation | 11.16 | 8.80 | 1.37 | 12.62 | 1.53 | 14.18 | 0.76 | 79.73 | 10.07 | 161.20 | 18.26 | 219.01 | 12.50 | 0.44 | 1.04 | 10.50 | |||||||||||||||||||||||||||||||||||||||||||||||||
| WVFC | WVS Financial Corp. | 9.92 | 9.92 | 0.67 | 6.96 | 0.71 | 7.37 | 0.07 | 209.01 | 10.79 | 91.68 | 8.77 | 91.68 | NA | 0.40 | 2.54 | 26.03 | |||||||||||||||||||||||||||||||||||||||||||||||||
| MHC | ||||||||||||||||||||||||||||||||||||||||||||||||||||||||||||||||||
| BCOW | 1895 Bancorp Of Wisconsin, Inc. (MHC) | 7.82 | 7.82 | NA | NA | NA | NA | 0.43 | 154.82 | NA | NA | NA | NA | NA | NA | NA | NA | |||||||||||||||||||||||||||||||||||||||||||||||||
| CLBK | Columbia Financial, Inc. (MHC) | 14.42 | 14.34 | 0.19 | 1.72 | 0.72 | 6.49 | NA | NA | NM | 188.01 | 27.31 | 189.12 | 35.78 | NA | NA | NM | |||||||||||||||||||||||||||||||||||||||||||||||||
| CFBI | Community First Bancshares, Inc. (MHC) | 24.96 | 24.96 | 0.15 | 0.59 | 0.46 | 1.75 | 2.09 | 61.74 | NM | 101.62 | 25.37 | 101.62 | 57.99 | NA | NA | NM | |||||||||||||||||||||||||||||||||||||||||||||||||
| FFBW | FFBW, Inc. (MHC) | 22.18 | 22.15 | 0.16 | 0.73 | 0.44 | 2.05 | 0.40 | 186.69 | 65.98 | 124.43 | 28.59 | 124.61 | 56.66 | NA | NA | NM | |||||||||||||||||||||||||||||||||||||||||||||||||
| GCBC | Greene County Bancorp, Inc. (MHC) | 8.39 | 8.39 | 1.37 | 16.51 | 1.35 | 16.24 | 0.42 | 249.25 | 17.02 | 265.10 | 23.09 | 265.10 | 17.02 | 0.40 | 1.24 | 20.92 | |||||||||||||||||||||||||||||||||||||||||||||||||
| HONE | HarborOne Bancorp, Inc. (MHC) | 12.39 | 11.96 | 0.48 | 3.73 | 0.49 | 3.84 | 1.25 | 55.58 | 42.58 | 139.70 | 13.67 | 178.98 | 31.58 | NA | NA | NM | |||||||||||||||||||||||||||||||||||||||||||||||||
| KFFB | Kentucky First Federal Bancorp (MHC) | 21.27 | 17.49 | 0.38 | 1.75 | 0.20 | 0.92 | NA | NA | NM | 94.17 | 19.60 | 120.28 | NA | 0.40 | 5.33 | 666.67 | |||||||||||||||||||||||||||||||||||||||||||||||||
| LSBK | Lake Shore Bancorp, Inc. (MHC) | 14.43 | 14.43 | 0.68 | 4.55 | 0.70 | 4.71 | 0.94 | 98.40 | 24.14 | 119.86 | 17.53 | 119.86 | NA | 0.40 | 2.51 | 45.45 | |||||||||||||||||||||||||||||||||||||||||||||||||
| MGYR | Magyar Bancorp, Inc. (MHC) | 8.23 | 8.23 | 0.33 | 3.95 | 0.39 | 4.58 | 2.25 | 77.06 | 28.41 | 129.58 | 10.54 | 129.58 | NA | NA | NA | NM | |||||||||||||||||||||||||||||||||||||||||||||||||
| OFED | Oconee Federal Financial Corp. (MHC) | 16.97 | 16.47 | 0.63 | 3.84 | 0.85 | 5.14 | 1.22 | 22.86 | 46.98 | 167.11 | 28.37 | 173.24 | 35.18 | 0.40 | 1.64 | 76.92 | |||||||||||||||||||||||||||||||||||||||||||||||||
| PDLB | PDL Community Bancorp (MHC) | 17.01 | 17.01 | -0.09 | -0.49 | 0.14 | 0.77 | 1.79 | 70.32 | NM | 139.51 | 23.73 | 139.51 | 186.65 | NA | NA | NM | |||||||||||||||||||||||||||||||||||||||||||||||||
| PVBC | Provident Bancorp, Inc. (MHC) | 13.35 | 13.35 | 0.91 | 6.95 | 0.83 | 6.34 | NA | NA | 23.00 | 176.29 | 22.73 | 176.29 | 23.00 | NA | NA | NM | |||||||||||||||||||||||||||||||||||||||||||||||||
| RBKB | Rhinebeck Bancorp, Inc. (MHC) | 6.96 | 6.76 | NA | NA | NA | NA | NA | NA | NA | NA | NA | NA | NA | NA | NA | NA | |||||||||||||||||||||||||||||||||||||||||||||||||
| TFSL | TFS Financial Corporation (MHC) | 12.44 | 12.38 | 0.62 | 4.91 | NA | NA | 1.30 | 23.49 | 56.40 | 271.82 | 33.29 | 273.34 | NA | 1.00 | 5.91 | 280.00 | |||||||||||||||||||||||||||||||||||||||||||||||||
| Under Acquisition | ||||||||||||||||||||||||||||||||||||||||||||||||||||||||||||||||||
| BNCL | Beneficial Bancorp, Inc. | 17.68 | 15.34 | 0.53 | 2.98 | 0.76 | 4.30 | 0.27 | 279.62 | 24.06 | 113.13 | NA | 134.10 | 23.48 | 0.24 | 1.53 | 36.92 | |||||||||||||||||||||||||||||||||||||||||||||||||
| BHBK | Blue Hills Bancorp, Inc. | 14.49 | 14.20 | 0.75 | 5.02 | 0.88 | 5.84 | 0.57 | 163.80 | 24.23 | 158.21 | 22.79 | 161.92 | 22.51 | 0.80 | 3.37 | 102.04 | |||||||||||||||||||||||||||||||||||||||||||||||||
| BLMT | BSB Bancorp, Inc. | 6.66 | 6.66 | 0.74 | 11.00 | 0.83 | 12.35 | 0.19 | 322.35 | 13.65 | 161.31 | 10.74 | 161.31 | 13.03 | NA | NA | NM | |||||||||||||||||||||||||||||||||||||||||||||||||
| SIFI | SI Financial Group, Inc. | 10.58 | 9.65 | 0.41 | 3.82 | 0.65 | 6.12 | 1.17 | 78.51 | 24.42 | 95.06 | 10.06 | 105.24 | 15.38 | 0.24 | 1.79 | 43.64 | |||||||||||||||||||||||||||||||||||||||||||||||||
| (1) | Average of High/Low or Bid/Ask price per share. |
| (2) | Or since offering price if converted of first listed in the past 52 weeks. Percent change figures are actual year-to-date and are not annualized. |
| (3) | EPS (earnings per share) is based on actual trailing 12 month data and is not shown on a pro forma basis. |
| (4) | Exludes intangibles (such as goodwill, value of core deposits, etc.). |
| (5) | ROA (return on assets) and ROE (return on equity) are indicated ratios based on trailing 12 month common earnings and average common equity and total assets balances. |
| (6) | Annualized based on last regular quarterly cash dividend announcement. |
| (7) | Indicated dividend as a percent of trailing 12 month earnings. |
| (8) | Excluded from averages due to actual or rumored acquisition activities or unusual operating characteristics. |
| (9) | For MHC institutions, market value reflects share price multiplied by public (non-MHC) shares. |
Source: S&P Market Intelligence, LC. and RP® Financial, LC. calculations. The information provided in this table has been obtained from sources we believe are reliable, but we cannot guarantee the accuracy or completeness of such information.
Copyright (c) 2019 by RP® Financial, LC.
EXHIBIT IV-2
Historical Stock Price Indices
Exhibit IV-2
Historical Stock Price Indices(1)
| SNL | SNL | ||||||||||||||||||||||||
| NASDAQ | Thrift | Bank | |||||||||||||||||||||||
| Year/Qtr. Ended | DJIA | S&P 500 | Composite | Index | Index | ||||||||||||||||||||
| 2004: | Quarter 1 | 10357.7 | 1126.2 | 1994.2 | 1585.3 | 562.20 | |||||||||||||||||||
| Quarter 2 | 10435.5 | 1140.8 | 2047.8 | 1437.8 | 546.62 | ||||||||||||||||||||
| Quarter 3 | 10080.3 | 1114.6 | 1896.8 | 1495.1 | 556.00 | ||||||||||||||||||||
| Quarter 4 | 10783.0 | 1211.9 | 2175.4 | 1605.6 | 595.10 | ||||||||||||||||||||
| 2005: | Quarter 1 | 10503.8 | 1180.6 | 1999.2 | 1516.6 | 551.00 | |||||||||||||||||||
| Quarter 2 | 10275.0 | 1191.3 | 2057.0 | 1577.1 | 563.27 | ||||||||||||||||||||
| Quarter 3 | 10568.7 | 1228.8 | 2151.7 | 1527.2 | 546.30 | ||||||||||||||||||||
| Quarter 4 | 10717.5 | 1248.3 | 2205.3 | 1616.4 | 582.80 | ||||||||||||||||||||
| 2006: | Quarter 1 | 11109.3 | 1294.8 | 2339.8 | 1661.1 | 595.50 | |||||||||||||||||||
| Quarter 2 | 11150.2 | 1270.2 | 2172.1 | 1717.9 | 601.14 | ||||||||||||||||||||
| Quarter 3 | 11679.1 | 1335.9 | 2258.4 | 1727.1 | 634.00 | ||||||||||||||||||||
| Quarter 4 | 12463.2 | 1418.3 | 2415.3 | 1829.3 | 658.60 | ||||||||||||||||||||
| 2007: | Quarter 1 | 12354.4 | 1420.9 | 2421.6 | 1703.6 | 634.40 | |||||||||||||||||||
| Quarter 2 | 13408.6 | 1503.4 | 2603.2 | 1645.9 | 622.63 | ||||||||||||||||||||
| Quarter 3 | 13895.6 | 1526.8 | 2701.5 | 1523.3 | 595.80 | ||||||||||||||||||||
| Quarter 4 | 13264.8 | 1468.4 | 2652.3 | 1058.0 | 492.85 | ||||||||||||||||||||
| 2008: | Quarter 1 | 12262.9 | 1322.7 | 2279.1 | 1001.5 | 442.5 | |||||||||||||||||||
| Quarter 2 | 11350.0 | 1280.0 | 2293.0 | 822.6 | 332.2 | ||||||||||||||||||||
| Quarter 3 | 10850.7 | 1166.4 | 2082.3 | 760.1 | 414.8 | ||||||||||||||||||||
| Quarter 4 | 8776.4 | 903.3 | 1577.0 | 653.9 | 268.3 | ||||||||||||||||||||
| 2009: | Quarter 1 | 7608.9 | 797.9 | 1528.6 | 542.8 | 170.1 | |||||||||||||||||||
| Quarter 2 | 8447.0 | 919.3 | 1835.0 | 538.8 | 227.6 | ||||||||||||||||||||
| Quarter 3 | 9712.3 | 1057.1 | 2122.4 | 561.4 | 282.9 | ||||||||||||||||||||
| Quarter 4 | 10428.1 | 1115.1 | 2269.2 | 587.0 | 260.8 | ||||||||||||||||||||
| 2010: | Quarter 1 | 10856.6 | 1169.4 | 2398.0 | 626.3 | 301.1 | |||||||||||||||||||
| Quarter 2 | 9744.0 | 1030.7 | 2109.2 | 564.5 | 257.2 | ||||||||||||||||||||
| Quarter 3 | 9744.0 | 1030.7 | 2109.2 | 564.5 | 257.2 | ||||||||||||||||||||
| Quarter 4 | 11577.5 | 1257.6 | 2652.9 | 592.2 | 290.1 | ||||||||||||||||||||
| 2011: | Quarter 1 | 12319.7 | 1325.8 | 2781.1 | 578.1 | 293.1 | |||||||||||||||||||
| Quarter 2 | 12414.3 | 1320.6 | 2773.5 | 540.8 | 266.8 | ||||||||||||||||||||
| Quarter 3 | 10913.4 | 1131.4 | 2415.4 | 443.2 | 198.9 | ||||||||||||||||||||
| Quarter 4 | 12217.6 | 1257.6 | 2605.2 | 481.4 | 221.3 | ||||||||||||||||||||
| 2012: | Quarter 1 | 13212.0 | 1408.5 | 3091.6 | 529.3 | 284.9 | |||||||||||||||||||
| Quarter 2 | 12880.1 | 1362.2 | 2935.1 | 511.6 | 257.3 | ||||||||||||||||||||
| Quarter 3 | 13437.1 | 1440.7 | 3116.2 | 557.6 | 276.8 | ||||||||||||||||||||
| Quarter 4 | 13104.1 | 1426.2 | 3019.5 | 565.8 | 292.7 | ||||||||||||||||||||
| 2013: | Quarter 1 | 14578.5 | 1569.2 | 3267.5 | 602.3 | 318.9 | |||||||||||||||||||
| Quarter 2 | 14909.6 | 1606.3 | 3404.3 | 625.3 | 346.7 | ||||||||||||||||||||
| Quarter 3 | 15129.7 | 1681.6 | 3771.5 | 650.8 | 354.4 | ||||||||||||||||||||
| Quarter 4 | 16576.7 | 1848.4 | 4176.6 | 706.5 | 394.4 | ||||||||||||||||||||
| 2014: | Quarter 1 | 16457.7 | 1872.3 | 4199.0 | 718.9 | 410.8 | |||||||||||||||||||
| Quarter 2 | 16826.6 | 1960.2 | 4408.2 | 723.9 | 405.2 | ||||||||||||||||||||
| Quarter 3 | 17042.9 | 1972.3 | 4493.4 | 697.7 | 411.0 | ||||||||||||||||||||
| Quarter 4 | 17823.1 | 2058.9 | 4736.1 | 738.7 | 432.8 | ||||||||||||||||||||
| 2015: | Quarter 1 | 17776.1 | 2067.9 | 4900.9 | 749.3 | 418.8 | |||||||||||||||||||
| Quarter 2 | 17619.5 | 2063.1 | 4986.9 | 795.7 | 448.4 | ||||||||||||||||||||
| Quarter 3 | 16284.7 | 1920.0 | 4620.2 | 811.7 | 409.4 | ||||||||||||||||||||
| Quarter 4 | 17425.0 | 2043.9 | 5007.4 | 809.1 | 431.5 | ||||||||||||||||||||
| 2016: | Quarter 1 | 17685.1 | 2059.7 | 4869.9 | 788.1 | 381.4 | |||||||||||||||||||
| Quarter 2 | 17930.0 | 2098.9 | 4842.7 | 780.9 | 385.6 | ||||||||||||||||||||
| Quarter 3 | 18308.2 | 2168.3 | 5312.0 | 827.2 | 413.7 | ||||||||||||||||||||
| Quarter 4 | 19762.6 | 2238.8 | 5383.1 | 966.7 | 532.7 | ||||||||||||||||||||
| 2017: | Quarter 1 | 20663.2 | 2362.7 | 5911.7 | 918.9 | 535.8 | |||||||||||||||||||
| Quarter 2 | 21349.6 | 2423.4 | 6140.4 | 897.1 | 552.4 | ||||||||||||||||||||
| Quarter 3 | 22405.1 | 2519.4 | 6496.0 | 939.3 | 573.2 | ||||||||||||||||||||
| Quarter 4 | 24719.2 | 2673..6 | 6903.4 | 937.6 | 617.7 | ||||||||||||||||||||
| 2018: | Quarter 1 | 24103.1 | 2640.9 | 7063.5 | 941.5 | 606.8 | |||||||||||||||||||
| Quarter 2 | 24271.4 | 2718.4 | 7510.3 | 961.2 | 597.8 | ||||||||||||||||||||
| Quarter 3 | 26458.3 | 2914.0 | 8046.4 | 905.6 | 597.8 | ||||||||||||||||||||
| Quarter 4 | 23327.5 | 2506.9 | 6635.3 | 772.0 | 502.9 | ||||||||||||||||||||
| As of Feb. 8, 2019 | 25106.3 | 2707.9 | 7298.2 | 864.5 | 554.9 | ||||||||||||||||||||
| (1) | End of period data. |
Sources: S&P Global Market Intelligence and The Wall Street Journal.
EXHIBIT IV-3
Stock Indices as of February 8, 2018
| Bank & Thrift Daily | Monday, February 11, 2019 |
| Daily Index Values |
| Percentage Change | ||||||||||||||||||||
| Value | 1 Day | 1 Week | YTD | 52 Week | ||||||||||||||||
| Bank | 554.9 | -0.76 | -0.80 | 10.35 | -10.24 | |||||||||||||||
| SNL TARP Participants | 135.8 | -0.54 | 0.73 | 16.19 | 57.79 | |||||||||||||||
| NE Bank | 544.2 | -0.92 | -0.19 | 12.53 | -20.27 | |||||||||||||||
| Mid-Atlc Bank | 532.6 | -0.98 | -1.85 | 8.57 | -10.42 | |||||||||||||||
| SE Bank | 366.4 | -0.19 | 0.51 | 14.62 | -8.23 | |||||||||||||||
| MW Bank | 624.6 | -0.88 | 0.02 | 10.81 | -8.23 | |||||||||||||||
| SW Bank | 1,157.1 | -1.16 | 1.46 | 14.79 | -7.48 | |||||||||||||||
| W Bank | 1,288.1 | -0.91 | -1.63 | 6.44 | -12.91 | |||||||||||||||
| Bank < $500M | 842.7 | 0.16 | 0.60 | 4.61 | -8.67 | |||||||||||||||
| Bank $500M-$1B | 1,117.2 | 0.30 | 1.32 | 6.15 | -0.13 | |||||||||||||||
| Bank $1B-$5B | 1,132.0 | -0.15 | 0.90 | 7.34 | -6.17 | |||||||||||||||
| Bank $5B-$10B | 1,342.4 | -0.75 | 0.87 | 10.26 | -1.62 | |||||||||||||||
| Bank > $10B | 481.1 | -0.78 | -0.91 | 10.47 | -10.76 | |||||||||||||||
| Percentage Change | ||||||||||||||||||||
| Value | 1 Day | 1 Week | YTD | 52 Week | ||||||||||||||||
| Thrift | 864.5 | -0.34 | 0.94 | 11.99 | -7.14 | |||||||||||||||
| Bank/Thrift | 529.8 | -0.75 | -0.76 | 10.39 | -10.47 | |||||||||||||||
| Thrift MHCs | 5,727.1 | 0.03 | 2.06 | 3.48 | 5.44 | |||||||||||||||
| NE Thrift | 2,904.4 | -0.31 | 0.45 | 4.62 | -4.57 | |||||||||||||||
| Mid-Atlc Thrift | 3,361.8 | -0.39 | 0.58 | 14.13 | -1.01 | |||||||||||||||
| SE Thrift | 451.4 | -2.01 | -5.25 | -5.49 | 4.09 | |||||||||||||||
| MW Thrift | 3,018.9 | -0.14 | 1.51 | 9.44 | -3.57 | |||||||||||||||
| SW Thrift | 843.7 | 0.44 | -0.94 | 0.75 | -16.99 | |||||||||||||||
| W Thrift | 160.0 | -0.91 | 3.55 | 23.29 | -6.56 | |||||||||||||||
| Thrift < $250M | 1,373.0 | 0.16 | 2.13 | 5.39 | -1.80 | |||||||||||||||
| Thrift $250M-$500M | 6,174.2 | -0.63 | -1.67 | 1.25 | -5.08 | |||||||||||||||
| Thrift $500M-$1B | 3,529.4 | 0.38 | 0.17 | 4.43 | 3.35 | |||||||||||||||
| Thrift $1B-$5B | 2,694.7 | 0.24 | 1.43 | 8.55 | -24.73 | |||||||||||||||
| Thrift > $5B | 368.7 | -0.54 | 0.90 | 13.71 | -0.69 | |||||||||||||||
| NASDAQ | 7,298.9 | 0.14 | 0.48 | 10.00 | 6.17 | |||||||||||||||
Note: All SNL indexes are market-value weighted; i.e., an institution’s effect on an index is proportional to that institution’s market capitalization. All SNL bank indexes began at 100 on June 30, 1987. On that date, the S&P stood at 304.0. All SNL thrift indexes, except for the SNL MHC Index, began at 100 on March 30, 1984. The SNL MHC Index began at 201.082 on Dec. 31, 1992, the level of the SNL Thrift Index on that date. The SNL Bank and Thrift Index began at 100.00 on June 29, 1987. On March 30, 1984, the S&P 500 stood at 159.2. The SNL TARP Index began at 100.00 on September 29, 2003. On that date, the S&P 500 stood at 1006.6.
NEWSLETTER RESEND: If you do not receive your newsletter, call our Subscriptions Department at +1.434.977.5877.
©2019 by S&P Global Market Intelligence, a subsidiary of S&P Global Inc. All rights reserved. No content (including ratings, credit-related analyses and data, valuations, model, software or other application or output therefrom) or any part thereof (Content) may be modified, reverse engineered, reproduced or distributed in any form by any means, or stored in a database or retrieval system, without the prior written permission of S&P Global Market Intelligence or its affiliates (collectively, S&P). The Content shall not be used for any unlawful or unauthorized purposes. S&P and any third-party providers, as well as their directors, officers, shareholders, employees or agents (collectively S&P Parties) do not guarantee the accuracy, completeness, timeliness or availability of the Content. S&P Parties are not responsible for any errors or omissions (negligent or otherwise), regardless of the cause, for the results obtained from the use of the Content, or for the security or maintenance of any data input by the user. The Content is provided on an “as is” basis. S&P PARTIES DISCLAIM ANY AND ALL EXPRESS OR IMPLIED WARRANTIES, INCLUDING, BUT NOT LIMITED TO, ANY WARRANTIES OF MERCHANTABILITY OR FITNESS FOR A PARTICULAR PURPOSE OR USE, FREEDOM FROM BUGS, SOFTWARE ERRORS OR DEFECTS, THAT THE CONTENT’S FUNCTIONING WILL BE UNINTERRUPTED OR THAT THE CONTENT WILL OPERATE WITH ANY SOFTWARE OR HARDWARE CONFIGURATION. In no event shall S&P Parties be liable to any party for any direct, indirect, incidental, exemplary, compensatory. punitive, special or consequential damages, costs, expenses, legal fees, or losses (including, without limitation, lost income or lost profits and opportunity costs or losses caused by negligence) in connection with any use of the Content even if advised of the possibility of such damages.
Credit-related and other analyses, including ratings, and statements in the Content are statements of opinion as of the date they are expressed and not statements of fact. S&P Global Market Intelligence’s opinions, analyses and rating acknowledgment decisions (described below) are not recommendations to purchase, hold, or sell any securities or to make any investment decisions, and do not address the suitability of any security. S&P Global Market Intelligence assumes no obligation to update the Content following publication in any form or format. The Content should not be relied on and is not a substitute for the skill, judgment and experience of the user, its management, employees, advisors and/or clients when making investment and other business decisions. S&P Global Market Intelligence does not act as a fiduciary or an investment advisor except where registered as such. White S&P Global Market Intelligence has obtained information from sources it believes to be reliable, S&P Global Market Intelligence does not perform an audit and undertakes no duty of due diligence or independent verification of any information it receives.
S&P keeps certain activities of its business units separate from each other in order to preserve the independence and objectivity of their respective activities. As a result, certain business units of S&P may have information that is not available to other S&P business units. S&P has established policies and procedures to maintain the confidentiality of certain non-public information received in connection with each analytical process.
S&P may receive compensation for its ratings and certain analyses, normally from issuers or underwriters of securities or from obligors. S&P reserves the right to disseminate its opinions and analyses. S&P’s public ratings and analyses are made available on its Web sites, www.standardandpoors.com (free of charge), and www.ratingsdirect.com and www.global-creditportal.com (subscription), and may be distributed through other means, including via S&P publications and third-party redistributors. Additional information about our ratings fees is available at www.standardandpoors.com/usratingsfees
Copyright © 2019 by S&P Global Market Intelligence, a division of S&P Global Inc. All rights reserved.
spglobal.com/marketintelligence
EXHIBIT IV-4
New York Acquisitions 2014 - Present
Exhibit IV-4
New York Thrift Acquisitions 2014-Present
| Target Financials at Announcement | Deal Terms and Pricing at Announcement | |||||||||||||||||||||||||||||||||||||||||||||||||||||||||||||||||||||||||
| Total | NPAs/ | Rsrvs/ | Deal | Value/ | Prem/ | |||||||||||||||||||||||||||||||||||||||||||||||||||||||||||||||||||||
| Announce | Complete | Assets | E/A | TE/A | ROAA | ROAE | Assets | NPLs | Value | Share | P/B | P/TB | P/E | P/A | Cdeps | |||||||||||||||||||||||||||||||||||||||||||||||||||||||||||
| Date | Date | Buyer Name | Target Name | ($000) | (%) | (%) | (%) | (%) | (%) | (%) | ($M) | ($) | (%) | (%) | (x) | (%) | (%) | |||||||||||||||||||||||||||||||||||||||||||||||||||||||||
| 9/20/2018 | Pending | Hanover Bancorp Inc. | NY | Chinatown Federal Savings Bank | NY | 131,610 | 19.39 | 19.39 | 0.01 | 0.03 | 2.15 | 27.17 | 13.6 | NA | 131.74 | 131.74 | NM | 11.68 | 3.65 | |||||||||||||||||||||||||||||||||||||||||||||||||||||||
| 3/5/2018 | 9/29/2018 | Seneca-Cayuga Bncp Inc. (MHC) | NY | Medina Savings and Loan Association | NY | 53,925 | 6.90 | 6.90 | 0.06 | 0.95 | 0.31 | 284.85 | NA | NA | NA | NA | NA | NA | NA | |||||||||||||||||||||||||||||||||||||||||||||||||||||||
| 3/15/2017 | 11/10/2017 | Kinderhook Bank Corp. | NY | Patriot Federal Bank | NY | 141,246 | 8.73 | 8.61 | 0.37 | �� | 4.09 | 0.55 | 231.02 | 14.6 | 9.945 | 118.10 | 119.86 | 28.65 | 10.30 | 2.61 | ||||||||||||||||||||||||||||||||||||||||||||||||||||||
| 3/7/2017 | 10/2/2017 | Sterling Bancorp | NY | Astoria Financial Corporation | NY | 14,558,652 | 11.77 | 10.64 | 0.48 | 4.23 | 1.70 | 37.04 | 2229.7 | 21.919 | 140.03 | 158.56 | 35.35 | 15.32 | 9.86 | |||||||||||||||||||||||||||||||||||||||||||||||||||||||
| 12/16/2016 | 8/11/2017 | Wallkill Valley FS&LA | NY | Hometown Bancorp, Inc. (MHC) | NY | 122,950 | 6.73 | 6.44 | -0.03 | -0.38 | NA | NA | 3.1 | 3.010 | 84.60 | 88.68 | NM | 2.49 | -5.42 | |||||||||||||||||||||||||||||||||||||||||||||||||||||||
| 2/24/2015 | 12/4/2015 | Community Bank System Inc. | NY | Oneida Financial Corp. | NY | 798,169 | 12.01 | 9.01 | 0.66 | 5.44 | 0.17 | 326.98 | 142.2 | 19.986 | 146.60 | 202.07 | 27.38 | 17.82 | 11.61 | |||||||||||||||||||||||||||||||||||||||||||||||||||||||
| 9/25/2014 | 4/28/2015 | Putnam County SB | NY | CMS Bancorp, Inc. | NY | 273,045 | 8.72 | 8.72 | 0.25 | 2.91 | NA | NA | 25.4 | 13.250 | 110.58 | 110.58 | 40.15 | 9.29 | 1.72 | |||||||||||||||||||||||||||||||||||||||||||||||||||||||
| 1/30/2014 | 6/30/2014 | Kearny Financial Corp. (MHC) | NJ | Atlas Bank | NY | 110,480 | 13.68 | 13.68 | -0.93 | -6.18 | 0.60 | 109.79 | NA | NA | NA | NA | NA | NA | NA | |||||||||||||||||||||||||||||||||||||||||||||||||||||||
| Average: | 2,023,760 | 10.99 | 10.42 | 0.11 | 1.39 | 0.91 | 169.48 | 121.94 | 135.25 | 32.88 | 11.15 | 4.01 | ||||||||||||||||||||||||||||||||||||||||||||||||||||||||||||||
| Median: | 136,428 | 10.25 | 8.87 | 0.16 | 1.93 | 0.58 | 170.40 | 124.92 | 125.80 | 32.00 | 10.99 | 3.13 | ||||||||||||||||||||||||||||||||||||||||||||||||||||||||||||||
Source: S&P Global Market Intelligence.
EXHIBIT IV-5
Pioneer Bank
Director and Senior Management Summary Resumes
Exhibit IV-5
Pioneer Bank
Director and Senior Management Summary Resumes
The business experience for the past five years of each or our directors is set forth below. Each individual’s biography also contains information regarding his experience, qualifications, attributes or skills that caused the board of directors to determine that he should serve as a director. Unless otherwise indicated, each individual has held his position for the past five years.
Thomas L. Amellhas served as President and Chief Executive Officer of Pioneer Bank since June 2012. Mr. Amell’s banking career spans 30 years working in different areas of banking, including retail and commercial sales management and executive leadership. Before joining Pioneer Bank, Mr. Amell served as President – Commercial Services of State Employees Federal Credit Union. Mr. Amell is actively involved in various organizations, currently serving as Chairman of the Independent Bankers Association of New York State, a member of the board of the New York Bankers Association, a member of the 50 Group, the Chairman of the CEG and a member of the Siena College Board of Trustees. He has also received many awards during his career, including Albany Business Review’s “40 Under 40,” the AMA of New York Capital Region Chapter’s “Marketer of Excellence,” Hudson Valley Community College’s “Otto V. Guenther Career Achievement Award,” the Big Brothers’/Big Sisters’ “Spirits of September Honoree” and 2015 Champion for Children Award from Northern Rivers. Mr. Amell’s extensive knowledge of the banking industry and strong leadership skills provides the board with invaluable insight and guidance into the business and regulatory requirements of today’s banking environment.
Eileen C. Bagnolihas served in various capacities with Pioneer Bank since 1972 until her retirement with Pioneer Bank in June 2013 after a 41-year career. During her tenure, Ms. Bagnoli held positions at Pioneer Bank in retail branch management, marketing, human resources and operations, and served as Chief Executive Officer from June 2010 until June 2013 and as Executive Vice President and Chief Operating Officer from 2003 until June 2010. Ms. Bagnoli was actively involved in the New York Bankers Association as well as the Independent Bankers Association of New York State. She served as a director and past board chair of the Commission on Economic Opportunity and the New York State Higher Education Services Corporation Board and additionally served for over 22 years on the board of the Helping Hands School. In 2008, she was honored for her distinguished career with the "Women of Excellence" award by the Albany-Colonie Regional Chamber of Commerce and in 2010 was the recipient of the Capital District Business Review's Women in Business Outstanding Executive award. Ms. Bagnoli currently serves on the board of WMHT Educational Telecommunications. Ms. Bagnoli’s extensive experience in the local banking industry and involvement in business and civic organizations in the communities in which we serve affords the board valuable insight regarding our business and operations.
Donald E. Fane is the President of Callanan Industries, Inc., a leading supplier of asphaltic concrete, aggregates, ready mix concrete and construction services in New York State. Prior to being named President in 2014, Mr. Fane held the position of Executive Vice President at Callanan. He also serves as President of Clemente Latham Concrete. Mr. Fane is involved in and serves on various local boards including Hudson Valley Community College and the Lansingburgh Boys & Girls Club. He formerly served on the board of Seton Health Foundation, the Historic Troy 20/20 Group and the Troy Savings Bank Music Hall. He is the former Commissioner of the Spiegleltown Fire Company. In 1999, Mr. Fane was bestowed with the "Uncle Sam Citizen of the Year" Award, in 2003 the Troy Police Benevolent Association's "Gold Shield Award" and in 2006 the Rensselaer County Boy Scout's "Good Scout Award." Mr. Fane’s career as a business executive provides the board with knowledge of the challenges facing business in our market area. Further, Mr. Fane, both through his business and as an active member of the community, is knowledgeable of our local customer environment.
Dr. James K. Reed is President and Chief Executive Officer of St. Peter’s Health Partners. Dr. Reed became President and Chief Executive Officer upon the merger of Northeast Health, Seton Health and St. Peter’s Health Care Services. As President and Chief Executive Officer, Dr. Reed oversees the management and growth of the region’s largest and most comprehensive not-for-profit network of high-quality, advanced medical care, primary care, rehabilitation and senior services. Dr. Reed has also held a number of high level finance positions, including Director of Corporate Finance at International Paper Company, and Director of Acquisitions and Divestitures at Union Pacific Corporation. He then went on to become the Chief Medical Officer of Northeast Health, before becoming President and Chief Executive Officer of St. Peter’s Health Partners. Dr. Reed is also a board officer of the Medical Liability Mutual Insurance Company (MLMIC), board and Executive Committee member of the CEG, and board member of HealthNow New York Inc., and Capital Region Chamber of Commerce. Dr. Reed has a proven record of success in managing large and complex organizations and has a special understanding of the health care and technology sectors.
Exhibit IV-5 (continued)
Pioneer Bank
Director and Senior Management Summary Resumes
Edward Reinfurt was the Director of the Empire State Development Division of Science, Technology and Innovation (NYSTAR), retiring from this position in February 2014. Prior to his appointment at NYSTAR, Mr. Reinfurt was Vice President of The Business Council of New York State for 27 years. He also served in the capacity of Director of Government Affairs for both the Carrier Corporation and Associated Industries of New York State. During his career, Mr. Reinfurt has spent considerable time on a wide variety of public policy issues. He was a member of the New York State Department of Health's Committee on Public Health Priorities, the Governor's Task Force to Restructure Employment, Health and Social Services, and the Accountability Team of the Labor and Education Department's joint committee reviewing the New York State's Workforce Development System. Mr. Reinfurt also served as past chair and board member of Northeast Health, Inc. and currently serves as Vice Chairman of "Kids Count" in Watervliet. Mr. Reinfurt’s strong government affairs experience and leadership skills are an invaluable asset to the board of directors.
Madeline Taylor is a consultant to the Association Management Division of Capital Hill Management Services where she is involved in Business Development and Client Relations. Prior to this, Ms. Taylor spent 17 years with the Albany-Colonie Regional Chamber of Commerce where she served in various executive level positions, the last seven years of which were as President and Chief Executive Officer of the Chamber. It is during her tenure as Chamber President Ms. Taylor was credited with spearheading the "Tech Valley" initiative of the Capital Region and became a founding member of the Tech Valley Chamber Coalition. Ms. Taylor has served on the boards of the New York State Economic Development Council, the Empire State Certified Development Corporation, the Albany Academy for Girls, Albany Memorial and Samaritan Hospitals and as a member of the President's Council of Russell Sage College. Ms. Taylor was also appointed by former New York Governor George Pataki to serve on the Board of the Harriman Campus Development Corp. Ms. Taylor has been the recipient of several awards, including being named one of the "100 Women of Excellence" by the Women's Business Council of the Albany-Colonie Chamber, the Marketer of the Year by the American Marketing Association, Distinguished Leadership Award by the National Association for Community Leadership and was featured as a "Woman in the News" by the Women's Press Club of New York State. Ms. Taylor’s business and public policy experience, community service and strong knowledge of the business climate of the New York Capital Region brings extensive insight into the customers who live in our market area and economic developments affecting our market area.
Executive Officers Who Are Not Directors
The following sets forth information regarding our executive officers who are not directors. Age information is as of December 31, 2018. The executive officers of Pioneer Bancorp, Inc. and Pioneer Bank are elected annually.
Joseph A. Fleming, age 55, has served as our Executive Vice President and Chief Lending Officer since December 2004. Prior to the appointment, Mr. Fleming served in various banking positions at Pioneer Bank since 2002.
Susan M. Hollister, age 53, has served as our Executive Vice President and Chief Human Resources Officer since August 5, 2016. Prior to joining Pioneer Bank, Ms. Hollister served as Senior Human Resources Manager for First Niagara Bank in the Eastern New York region from 1993 until August 2016.
Patrick J. Hughes, age 46, has served as our Executive Vice President and Chief Financial Officer since November 2016. Prior to joining Pioneer Bank, Mr. Hughes spent 20 years with UHY Advisors/UHY LLP, a professional services firm and from 2006 until November 2016 he served at the firm as a Managing Director and Partner.
Laura A. Mazzara, age 56, has served as our Executive Vice President and Chief Risk Officer since December 2008 after having previously served in various positions at Pioneer Bank since 1987.
Jesse Tomczak, age 46, has served as our Executive Vice President and Chief Customer Experience Officer since October 2013. Mr. Tomczak previously served as Director of Business Development at State Employees Federal Credit Union.
Frank C. Sarratori, age 54, has served as our Executive Vice President and Chief Administrative Officer, General Counsel and Corporate Secretary since 2013. Prior to 2013, Mr. Sarratori served as Chief Compliance Officer, Corporate Secretary and General Counsel since his date of hire in 2004. Mr. Sarratori currently serves as a trustee of Pioneer Bank.
Source: Pioneer Bank’s prospectus.
EXHIBIT IV-6
Pioneer Bank
Pro Forma Regulatory Capital Ratios
Exhibit IV-6
Pioneer Bank
Pro Forma Regulatory Capital Ratios
Pioneer Bank Historical December 31, 2018 | Pro Forma at December 31, 2018 Based Upon the Sale in the Offering of: | |||||||||||||||||||||||||||||||||||||||
| 7,179,465 Shares | 8,446,429 Shares | 9,713,393 Shares | 11,170,402 Shares (1) | |||||||||||||||||||||||||||||||||||||
| Amount | Percent of Assets (2) | Amount | Percent of Assets (2) | Amount | Percent of Assets (2) | Amount | Percent of Assets (2) | Amount | Percent of Assets (2) | |||||||||||||||||||||||||||||||
| (unaudited) | (Dollars in thousands) | |||||||||||||||||||||||||||||||||||||||
| Equity capital | $ | 126,394 | 9.82 | % | $ | 151,420 | 11.46 | % | $ | 155,965 | 11.74 | % | $ | 160,509 | 12.03 | % | $ | 165,737 | 12.35 | % | ||||||||||||||||||||
| Tier 1 leverage capital | $ | 126,257 | 9.69 | % | $ | 151,283 | 11.31 | % | $ | 155,828 | 11.60 | % | $ | 160,372 | 11.88 | % | $ | 165,600 | 12.20 | % | ||||||||||||||||||||
| Tier 1 leverage requirement | 65,115 | 5.00 | % | 66,857 | 5.00 | % | 67,171 | 5.00 | % | 67,484 | 5.00 | % | 67,845 | 5.00 | % | |||||||||||||||||||||||||
| Excess | $ | 61,143 | 4.69 | % | $ | 84,426 | 6.31 | % | $ | 88,657 | 6.60 | % | $ | 92,888 | 6.88 | % | $ | 97,755 | 7.20 | % | ||||||||||||||||||||
| Tier 1 risk-based capital (3) | $ | 126,257 | 12.04 | % | $ | 151,283 | 14.33 | % | $ | 155,828 | 14.74 | % | $ | 160,372 | 15.15 | % | $ | 165,600 | 15.63 | % | ||||||||||||||||||||
| Tier 1 risk-based requirement | 83,908 | 8.00 | % | 84,466 | 8.00 | % | 84,566 | 8.00 | % | 84,667 | 8.00 | % | 84,782 | 8.00 | % | |||||||||||||||||||||||||
| Excess | $ | 42,349 | 4.04 | % | $ | 66,817 | 6.33 | % | $ | 71,262 | 6.74 | % | $ | 75,705 | 7.15 | % | $ | 80,818 | 7.63 | % | ||||||||||||||||||||
| Total risk-based capital (3) | $ | 139,353 | 13.29 | % | $ | 164,379 | 15.57 | % | $ | 168,924 | 15.98 | % | $ | 173,468 | 16.39 | % | $ | 178,696 | 16.86 | % | ||||||||||||||||||||
| Total risk-based requirement | 104,885 | 10.00 | % | 105,582 | 10.00 | % | 105,708 | 10.00 | % | 105,833 | 10.00 | % | 105,978 | 10.00 | % | |||||||||||||||||||||||||
| Excess | $ | 34,468 | 3.29 | % | $ | 58,797 | 5.57 | % | $ | 63,216 | 5.98 | % | $ | 67,635 | 6.39 | % | $ | 72,718 | 6.86 | % | ||||||||||||||||||||
| Common equity tier 1 capital | $ | 126,257 | 12.04 | % | $ | 151,283 | 14.33 | % | $ | 155,828 | 14.74 | % | $ | 160,372 | 15.15 | % | $ | 165,600 | 15.63 | % | ||||||||||||||||||||
| Common equity tier 1 requirement | 68,176 | 6.50 | % | 68,628 | 6.50 | % | 68,710 | 6.50 | % | 68,792 | 6.50 | % | 68,886 | 6.50 | % | |||||||||||||||||||||||||
| Excess | $ | 58,081 | 5.54 | % | $ | 82,655 | 7.83 | % | $ | 87,118 | 8.24 | % | $ | 91,580 | 8.65 | % | $ | 96,714 | 9.13 | % | ||||||||||||||||||||
| Reconciliation: | ||||||||||||||||||||||||||||||||||||||||
| Net proceeds infused into Pioneer Bank | $ | 34,844 | $ | 41,121 | $ | 47,398 | $ | 54,617 | ||||||||||||||||||||||||||||||||
| Less: Common stock acquired by employee stock ownership plan | (6,545 | ) | (7,700 | ) | (8,855 | ) | (10,183 | ) | ||||||||||||||||||||||||||||||||
| Less: Common stock acquired by stock-based benefit plan | (3,273 | ) | (3,850 | ) | (4,428 | ) | (5,092 | ) | ||||||||||||||||||||||||||||||||
| Pro forma increase in tier 1 and risk-based capital | $ | 25,026 | $ | 29,571 | $ | 34,115 | $ | 39,342 | ||||||||||||||||||||||||||||||||
| (1) | As adjusted to give effect to an increase in the number of shares, which increase could occur due to a 15% increase in the offering range to reflect demand for the shares or changes in market conditions following the commencement of the offering. |
| (2) | Equity and Tier 1 leverage capital levels are shown as a percentage of total average assets. Risk-based capital levels are shown as a percentage of risk-weighted assets. |
| (3) | Pro forma amounts and percentages assume net proceeds are invested in assets that carry a 20% risk weighting. |
Source: Pioneer Bank’s prospectus.
EXHIBIT IV-7
Pioneer Bank
Pro Forma Analysis Sheet – Fully Converted Basis
Exhibit IV-7
PRO FORMA ANALYSIS SHEET - FULLY CONVERTED BASIS
Pioneer Bank
Prices as of February 8, 2019
| Peer Group | New York Companies | All Publicly-Traded | ||||||||||||||||||||||||||||||||
| Price Multiple | Symbol | Subject (1) | Average | Median | Average | Median | Average | Median | ||||||||||||||||||||||||||
| Price-earnings ratio (x) | P/E | 11.53 | x | 24.33 | x | 24.95 | x | 19.04 | x | 13.72 | x | 25.85 | x | 19.67 | x | |||||||||||||||||||
| Price-core earnings ratio (x) | P/Core | 11.59 | x | 21.47 | x | 22.63 | x | 14.19 | x | 14.45 | x | 18.85 | x | 16.73 | x | |||||||||||||||||||
| Price-book ratio (%) | = | P/B | 67.07 | % | 122.32 | % | 133.04 | % | 134.44 | % | 125.57 | % | 138.45 | % | 126.33 | % | ||||||||||||||||||
| Price-tangible book ratio (%) | = | P/TB | 69.44 | % | 121.85 | % | 131.36 | % | 148.89 | % | 136.66 | % | 153.28 | % | 135.95 | % | ||||||||||||||||||
| Price-assets ratio (%) | = | P/A | 13.52 | % | 15.06 | % | 14.82 | % | 12.74 | % | 11.10 | % | 16.80 | % | 17.07 | % | ||||||||||||||||||
| Valuation Parameters | ||||||||||||||
| Pre-Conversion Earnings (Y) | $ | 16,797,000 | ESOP Stock Purchases (E) | 8.00 | % | (5) | ||||||||
| Pre-Conversion Earnings (CY) | $ | 16,708,000 | Cost of ESOP Borrowings (S) | 0.00 | % | (4) | ||||||||
| Pre-Conversion Book Value (B) | $ | 126,394,000 | ESOP Amortization (T) | 20.00 | years | |||||||||
| Pre-Conv. Tang. Book Val. (TB) | $ | 116,389,000 | RRP Amount (M) | 4.00 | % | |||||||||
| Pre-Conversion Assets (A) | $ | 1,286,967,000 | RRP Vesting (N) | 5.00 | years (5) | |||||||||
| Reinvestment Rate (2)(R) | 2.51 | % | Foundation (F) | 2.17 | % | |||||||||
| Est. Conversion Expenses (3)(X) | 1.75 | % | Tax Benefit (Z) | 1,086,428 | ||||||||||
| Tax Rate (TAX) | 26.00 | % | Percentage Sold (PCT) | 100.00 | % | |||||||||
| Shares Tax | $ | 0 | Option (O1) | 10.00 | % | (6) | ||||||||
| Estimated Option Value (O2) | 29.50 | % | (6) | |||||||||||
| Option vesting (O3) | 5.00 | (6) | ||||||||||||
| Option pct taxable (O4) | 25.00 | % | (6) | |||||||||||
| Calculation of Pro Forma Value After Conversion |
| 1. | V= | P/E * (Y) | V= | $196,428,570 | |
| 1 - P/E * PCT * ((1-X-E-M-F)*R*(1-TAX) - (1-TAX)*E/T - (1-TAX)*M/N) - (1-(TAX*O4))*(O1*O2)/O3) | |||||
| 2. | V= | P/Core * (Y) | V= | $196,428,570 | |
| 1 - P/core * PCT * ((1-X-E-M-F)*R*(1-TAX) - (1-TAX)*E/T - (1-TAX)*M/N) - (1-(TAX*O4))*(O1*O2)/O3) | |||||
| 3. | V= | P/B * (B+Z) | V= | $196,428,570 | |
| 1 - P/B * PCT * (1-X-E-M-F) | |||||
| 4. | V= | P/TB * (TB+Z) | V= | $196,428,570 | |
| 1 - P/TB * PCT * (1-X-E-M-F) | |||||
| 5. | V= | P/A * (A+Z) | V= | $196,428,570 | |
| 1 - P/A * PCT * (1-X-E-M-F) |
| Shares | Aggregate | ||||||||||||||||||||||||
| Shares Issued | Price Per | Gross Offering | Issued To | Total Shares | Market Value | ||||||||||||||||||||
| Conclusion | To the Public | Share | Proceeds | Foundation | Issued | of Shares Issued | |||||||||||||||||||
| Supermaximum | 25,458,125 | 10.00 | $ | 254,581,250 | 519,554 | 25,977,679 | $ | 259,776,790 | |||||||||||||||||
| Maximum | 22,137,500 | 10.00 | 221,375,000 | 451,786 | 22,589,286 | 225,892,860 | |||||||||||||||||||
| Midpoint | 19,250,000 | 10.00 | 192,500,000 | 392,857 | 19,642,857 | 196,428,570 | |||||||||||||||||||
| Minimum | 16,362,500 | 10.00 | 163,625,000 | 333,928 | 16,696,428 | 166,964,280 | |||||||||||||||||||
| (1) | Pricing ratios shown reflect the midpoint value. |
| (2) | Net return reflects a reinvestment rate of 2.51 percent and a tax rate of 26.0 percent. |
| (3) | Offering expenses shown at estimated midpoint value. |
| (4) | No cost is applicable since holding company will fund the ESOP loan. |
| (5) | ESOP and MRP amortize over 20 years and 5 years, respectively; amortization expenses tax effected at 26.0 percent. |
| (6) | 10 percent option plan with an estimated Black-Scholes valuation of 29.50 percent of the exercise price, including a 5 year vesting with 25 percent of the options (granted to directors) tax effected at 26.0 percent. |
EXHIBIT IV-8
Pioneer Bank
Pro Forma Effect of Conversion Proceeds – Fully Converted Basis
Exhibit IV-8
PRO FORMA EFFECT OF CONVERSION PROCEEDS
Pioneer Bank
At the Minimum
| 1. | Pro Forma Market Capitalization | $ | 166,964,280 | |||
| Less: Foundation Shares | 3,339,280 | |||||
| 2. | Offering Proceeds | $ | 163,625,000 | |||
| Less: Estimated Offering Expenses | 4,090,625 | |||||
| Net Conversion Proceeds | $ | 159,534,375 | ||||
| 3. | Estimated Additional Income from Conversion Proceeds | |||||
| Net Conversion Proceeds | $ | 159,534,375 | ||||
| Less: Cash Contribution to Foundation | 250,000 | |||||
| Less: Non-Cash Stock Purchases (1) | 20,035,714 | |||||
| Net Proceeds Reinvested | $ | 139,248,661 | ||||
| Estimated net incremental rate of return | 1.86 | % | ||||
| Reinvestment Income | $ | 2,586,405 | ||||
| Less: Shares Tax | 0 | |||||
| Less: Estimated cost of ESOP borrowings (2) | 0 | |||||
| Less: Amortization of ESOP borrowings (3) | 494,214 | |||||
| Less: Amortization of Options (4) | 921,058 | |||||
| Less: Recognition Plan Vesting (5) | 988,429 | |||||
| Net Earnings Impact | $ | 182,703 |
| Net | ||||||||||||||
| Before | Earnings | After | ||||||||||||
| 4. | Pro Forma Earnings | Conversion | Increase | Conversion | ||||||||||
| 12 Months ended December 31, 2018 (reported) | $ | 16,797,000 | $ | 182,703 | $ | 16,979,703 | ||||||||
| 12 Months ended December 31, 2018 (core) | $ | 16,708,000 | $ | 182,703 | $ | 16,890,703 | ||||||||
| Before | Net Cash | Tax Benefit | After | |||||||||||||||
| 5. | Pro Forma Net Worth | Conversion | Proceeds | Of Contribution | Conversion | |||||||||||||
| December 31, 2018 | $ | 126,394,000 | $ | 139,248,661 | $ | 933,213 | $ | 266,575,874 | ||||||||||
| December 31, 2018 (Tangible) | $ | 116,389,000 | $ | 139,248,661 | $ | 933,213 | $ | 256,570,874 | ||||||||||
| Before | Net Cash | Tax Benefit | After | |||||||||||||||
| 6. | Pro Forma Assets | Conversion | Proceeds | Of Contribution | Conversion | |||||||||||||
| December 31, 2018 | $ | 1,286,967,000 | $ | 139,248,661 | $ | 933,213 | $ | 1,427,148,874 | ||||||||||
| (1) | Includes ESOP and RRP stock purchases equal to 8.0 and 4.0 percent of total shares issued, respectively. |
| (2) | ESOP stock purchases are internally financed by a loan from the holding company. |
| (3) | ESOP borrowings are amortized over 20 years, amortization expense is tax-effected at a 26.0 percent rate. |
| (4) | Option valuation based on Black-Scholes model, 5 year vesting, and assumes 25 percent is taxable. |
| (5) | RRP is amortized over 5 years, and amortization expense is tax effected at 26.0 percent. |
Exhibit IV-8
PRO FORMA EFFECT OF CONVERSION PROCEEDS
Pioneer Bank
At the Midpoint
| 1. | Pro Forma Market Capitalization | $ | 196,428,570 | |||
| Less: Foundation Shares | 3,928,570 | |||||
| 2. | Offering Proceeds | $ | 192,500,000 | |||
| Less: Estimated Offering Expenses | 3,368,750 | |||||
| Net Conversion Proceeds | $ | 189,131,250 | ||||
| 3. | Estimated Additional Income from Conversion Proceeds | |||||
| Net Conversion Proceeds | $ | 189,131,250 | ||||
| Less: Cash Contribution to Foundation | 250,000 | |||||
| Less: Non-Cash Stock Purchases (1) | 23,571,428 | |||||
| Net Proceeds Reinvested | $ | 165,309,822 | ||||
| Estimated net incremental rate of return | 1.86 | % | ||||
| Reinvestment Income | $ | 3,070,465 | ||||
| Less: Shares Tax | 0 | |||||
| Less: Estimated cost of ESOP borrowings (2) | 0 | |||||
| Less: Amortization of ESOP borrowings (3) | 581,429 | |||||
| Less: Amortization of Options (4) | 1,083,598 | |||||
| Less: Recognition Plan Vesting (5) | 1,162,857 | |||||
| Net Earnings Impact | $ | 242,581 |
| Net | ||||||||||||||
| Before | Earnings | After | ||||||||||||
| 4. | Pro Forma Earnings | Conversion | Increase | Conversion | ||||||||||
| 12 Months ended December 31, 2018 (reported) | $ | 16,797,000 | $ | 242,581 | $ | 17,039,581 | ||||||||
| 12 Months ended December 31, 2018 (core) | $ | 16,708,000 | $ | 242,581 | $ | 16,950,581 | ||||||||
| Before | Net Cash | Tax Benefit | After | |||||||||||||||
| 5. | Pro Forma Net Worth | Conversion | Proceeds | Of Contribution | Conversion | |||||||||||||
| December 31, 2018 | $ | 126,394,000 | $ | 165,309,822 | $ | 1,086,428 | $ | 292,790,250 | ||||||||||
| December 31, 2018 (Tangible) | $ | 116,389,000 | $ | 165,309,822 | $ | 1,086,428 | $ | 282,785,250 | ||||||||||
| Before | Net Cash | Tax Benefit | After | |||||||||||||||
| 6. | Pro Forma Assets | Conversion | Proceeds | Of Contribution | Conversion | |||||||||||||
| December 31, 2018 | $ | 1,286,967,000 | $ | 165,309,822 | $ | 1,086,428 | $ | 1,453,363,250 | ||||||||||
| (1) | Includes ESOP and RRP stock purchases equal to 8.0 and 4.0 percent of total shares issued, respectively. |
| (2) | ESOP stock purchases are internally financed by a loan from the holding company. |
| (3) | ESOP borrowings are amortized over 20 years, amortization expense is tax-effected at a 26.0 percent rate. |
| (4) | Option valuation based on Black-Scholes model, 5 year vesting, and assumes 25 percent is taxable. |
| (5) | RRP is amortized over 5 years, and amortization expense is tax effected at 26.0 percent. |
Exhibit IV-8
PRO FORMA EFFECT OF CONVERSION PROCEEDS
Pioneer Bank
At the Maximum Value
| 1. | Pro Forma Market Capitalization | $ | 225,892,860 | |||
| Less: Foundation Shares | 4,517,860 | |||||
| 2. | Offering Proceeds | $ | 221,375,000 | |||
| Less: Estimated Offering Expenses | 3,874,063 | |||||
| Net Conversion Proceeds | $ | 217,500,938 | ||||
| 3. | Estimated Additional Income from Conversion Proceeds | |||||
| Net Conversion Proceeds | $ | 217,500,938 | ||||
| Less: Cash Contribution to Foundation | 250,000 | |||||
| Less: Non-Cash Stock Purchases (1) | 27,107,143 | |||||
| Net Proceeds Reinvested | $ | 190,143,794 | ||||
| Estimated net incremental rate of return | 1.86 | % | ||||
| Reinvestment Income | $ | 3,531,731 | ||||
| Less: Shares Tax | 0 | |||||
| Less: Estimated cost of ESOP borrowings (2) | 0 | |||||
| Less: Amortization of ESOP borrowings (3) | 668,643 | |||||
| Less: Amortization of Options (4) | 1,246,138 | |||||
| Less: Recognition Plan Vesting (5) | 1,337,286 | |||||
| Net Earnings Impact | $ | 279,664 |
| Net | |||||||||||||||
| Before | Earnings | After | |||||||||||||
| 4. | Pro Forma Earnings | Conversion | Increase | Conversion | |||||||||||
| 12 Months ended December 31, 2018 (reported) | $ | 16,797,000 | $ | 279,664 | $ | 17,076,664 | |||||||||
| 12 Months ended December 31, 2018 (core) | $ | 16,708,000 | $ | 279,664 | $ | 16,987,664 | |||||||||
| Before | Net Cash | Tax Benefit | After | |||||||||||||||
| 5. | Pro Forma Net Worth | Conversion | Proceeds | Of Contribution | Conversion | |||||||||||||
| December 31, 2018 | $ | 126,394,000 | $ | 190,143,794 | $ | 1,239,644 | $ | 317,777,438 | ||||||||||
| December 31, 2018 (Tangible) | $ | 116,389,000 | $ | 190,143,794 | $ | 1,239,644 | $ | 307,772,438 | ||||||||||
| Before | Net Cash | Tax Benefit | After | |||||||||||||||
| 6. | Pro Forma Assets | Conversion | Proceeds | Of Contribution | Conversion | |||||||||||||
| December 31, 2018 | $ | 1,286,967,000 | $ | 190,143,794 | $ | 1,239,644 | $ | 1,478,350,438 | ||||||||||
| (1) | Includes ESOP and RRP stock purchases equal to 8.0 and 4.0 percent of total shares issued, respectively. |
| (2) | ESOP stock purchases are internally financed by a loan from the holding company. |
| (3) | ESOP borrowings are amortized over 20 years, amortization expense is tax-effected at a 26.0 percent rate. |
| (4) | Option valuation based on Black-Scholes model, 5 year vesting, and assumes 25 percent is taxable. |
| (5) | RRP is amortized over 5 years, and amortization expense is tax effected at 26.0 percent. |
Exhibit IV-8
PRO FORMA EFFECT OF CONVERSION PROCEEDS
Pioneer Bank
At the Super Maximum Value
| 1. | Pro Forma Market Capitalization | $ | 259,776,790 | |||
| Less: Foundation Shares | 5,195,540 | |||||
| 2. | Offering Proceeds | $ | 254,581,250 | |||
| Less: Estimated Offering Expenses | 6,364,531 | |||||
| Net Conversion Proceeds | $ | 248,216,719 | ||||
| 3. | Estimated Additional Income from Conversion Proceeds | |||||
| Net Conversion Proceeds | $ | 248,216,719 | ||||
| Less: Cash Contribution to Foundation | 250,000 | |||||
| Less: Non-Cash Stock Purchases (1) | 31,173,215 | |||||
| Net Proceeds Reinvested | $ | 216,793,504 | ||||
| Estimated net incremental rate of return | 1.86 | % | ||||
| Reinvestment Income | $ | 4,026,723 | ||||
| Less: Shares Tax | 0 | |||||
| Less: Estimated cost of ESOP borrowings (2) | 0 | |||||
| Less: Amortization of ESOP borrowings (3) | 768,939 | |||||
| Less: Amortization of Options (4) | 1,433,059 | |||||
| Less: Recognition Plan Vesting (5) | 1,537,879 | |||||
| Net Earnings Impact | $ | 286,846 |
| Net | ||||||||||||||
| Before | Earnings | After | ||||||||||||
| 4. | Pro Forma Earnings | Conversion | Increase | Conversion | ||||||||||
| 12 Months ended December 31, 2018 (reported) | $ | 16,797,000 | $ | 286,846 | $ | 17,083,846 | ||||||||
| 12 Months ended December 31, 2018 (core) | $ | 16,708,000 | $ | 286,846 | $ | 16,994,846 | ||||||||
| Before | Net Cash | Tax Benefit | After | |||||||||||||||
| 5. | Pro Forma Net Worth | Conversion | Proceeds | Of Contribution | Conversion | |||||||||||||
| December 31, 2018 | $ | 126,394,000 | $ | 216,793,504 | $ | 1,415,840 | $ | 344,603,344 | ||||||||||
| December 31, 2018 (Tangible) | $ | 116,389,000 | $ | 216,793,504 | $ | 1,415,840 | $ | 334,598,344 | ||||||||||
| Before | Net Cash | Tax Benefit | After | |||||||||||||||
| 6. | Pro Forma Assets | Conversion | Proceeds | Of Contribution | Conversion | |||||||||||||
| December 31, 2018 | $ | 1,286,967,000 | $ | 216,793,504 | $ | 1,415,840 | $ | 1,505,176,344 | ||||||||||
| (1) | Includes ESOP and RRP stock purchases equal to 8.0 and 4.0 percent of total shares issued, respectively. |
| (2) | ESOP stock purchases are internally financed by a loan from the holding company. |
| (3) | ESOP borrowings are amortized over 20 years, amortization expense is tax-effected at a 26.0 percent rate. |
| (4) | Option valuation based on Black-Scholes model, 5 year vesting, and assumes 25 percent is taxable. |
| (5) | RRP is amortized over 5 years, and amortization expense is tax effected at 26.0 percent. |
EXHIBIT IV-9
Pioneer Bank
Pro Forma Analysis Sheet – Minority Stock Offering
EXHIBIT IV-9
PRO FORMA ANALYSIS SHEET - MINORITY STOCK OFFERING
Pioneer Bank
February 8, 2019
| Peer Group | New York Companies | All Publicly-Traded | |||||||||||||||||||||||||||||||||||||
| Price Multiple | Symbol | Subject (1) | Average | Median | Average | Median | Average | Median | |||||||||||||||||||||||||||||||
| Price-earnings ratio (x) | P/E | 11.74 | x | 24.33 | x | 24.95 | x | 19.04 | x | 13.72 | x | 25.85 | x | 19.67 | x | ||||||||||||||||||||||||
| Price-core earnings ratio (x) | P/Core | 11.81 | x | 21.47 | x | 22.63 | x | 14.19 | x | 14.45 | x | 18.85 | x | 16.73 | x | ||||||||||||||||||||||||
| Price-book ratio (%) | = | P/B | 99.30 | % | 122.32 | % | 133.04 | % | 134.44 | % | 125.57 | % | 138.45 | % | 126.33 | % | |||||||||||||||||||||||
| Price-tangible book ratio (%) | = | P/TB | 104.60 | % | 121.85 | % | 131.36 | % | 148.89 | % | 136.66 | % | 153.28 | % | 135.95 | % | |||||||||||||||||||||||
| Price-assets ratio (%) | = | P/A | 14.46 | % | 15.06 | % | 14.82 | % | 12.74 | % | 11.10 | % | 16.80 | % | 17.07 | % | |||||||||||||||||||||||
| Valuation Parameters | ||||||||||||||
| Pre-Conversion Earnings (Y)(2) | $ | 16,795,000 | ESOP Stock Purchases (E) | 8.71 | % | (6) | ||||||||
| Pre-Conversion Earnings (CY)(2) | $ | 16,706,000 | Cost of ESOP Borrowings (S) | 0.00 | % | (5) | ||||||||
| Pre-Conversion Book Value (B)(2) | $ | 126,294,000 | ESOP Amortization (T) | 20.00 | years | |||||||||
| Pre-Conv. Tang. Book Value (TB)(2) | $ | 116,289,000 | MRP Amount (M) | 4.36 | % | |||||||||
| Pre-Conversion Assets (A)(2) | $ | 1,286,867,000 | MRP Vesting (N) | 5.00 | years (6) | |||||||||
| Reinvestment Rate (3)(R) | 2.51 | % | Foundation (F) | 4.65 | % | |||||||||
| Est. Conversion Expenses (4)(X) | 2.63 | % | Tax Benefit (Z) | 1,086,428 | ||||||||||
| Tax Rate (TAX) | 26.00 | % | Percentage Sold (PCT) | 45.00 | % | |||||||||
| Option (O1) | 10.89 | % | (7) | |||||||||||
| Estimated Option Value (O2) | 29.20 | % | (7) | |||||||||||
| Option vesting (O3) | 5.00 | (7) | ||||||||||||
| Option pct taxable (O4) | 25.00 | % | (7) | |||||||||||
| Calculation of Pro Forma Value After Conversion | |||||
| 1. | V= | P/E * (Y) | V= | $196,428,570 | |
| 1 - P/E * PCT * ((1-X-E-M-F)*R*(1-TAX) - (1-TAX)*E/T - (1-TAX)*M/N) - (1-(TAX*O4))*(O1*O2)/O3) | |||||
| 2. | V= | P/Core * (Y) | V= | $196,428,570 | |
| 1 - P/core * PCT * ((1-X-E-M-F)*R*(1-TAX) - (1-TAX)*E/T - (1-TAX)*M/N) - (1-(TAX*O4))*(O1*O2)/O3) | |||||
| 3. | V= | P/B * (B+Z) | V= | $196,428,570 | |
| 1 - P/B * PCT * (1-X-E-M-F) | |||||
| 4. | V= | P/TB * (TB+Z) | V= | $196,428,570 | |
| 1 - P/TB * PCT * (1-X-E-M-F) | |||||
| 5. | V= | P/A * (A+Z) | V= | $196,428,570 | |
| 1 - P/A * PCT * (1-X-E-M-F) | |||||
| Aggregate | ||||||||||||||||||||||||||||||||
| Shares | Market Value | |||||||||||||||||||||||||||||||
| Shares Owned by | Shares Issued | Price Per | Gross Offering | Issued to | Total Shares | of Shares Issued | Full Value | |||||||||||||||||||||||||
| Conclusion | The MHC | To the Public | Share | Proceeds | Foundation | Issued Publicly | Publicly | Total Shares | ||||||||||||||||||||||||
| Super Maximum | 14,287,723 | 11,170,402 | 10.00 | $ | 111,704,020 | 519,554 | 11,689,956 | $ | 116,899,560 | 25,977,679 | ||||||||||||||||||||||
| Maximum | 12,424,107 | 9,713,393 | 10.00 | $ | 97,133,930 | 451,786 | 10,165,179 | 101,651,790 | 22,589,286 | |||||||||||||||||||||||
| Midpoint | 10,803,571 | 8,446,429 | 10.00 | $ | 84,464,290 | 392,857 | 8,839,286 | 88,392,860 | 19,642,857 | |||||||||||||||||||||||
| Minimum | 9,183,035 | 7,179,465 | 10.00 | $ | 71,794,650 | 333,928 | 7,513,393 | 75,133,930 | 16,696,428 | |||||||||||||||||||||||
| (1) | Pricing ratios shown reflect the midpoint value. |
| (2) | Adjusted for capitalizing MHC with $100,000. |
| (3) | Net return reflects a reinvestment rate of 2.51 percent, and a tax rate of 26.0 percent. |
| (4) | Offering expenses shown at estimated midpoint value. |
| (5) | No cost is applicable since holding company will fund the ESOP loan. |
| (6) | ESOP and MRP amortize over 20 years and 5 years, respectively; amortization expenses tax effected at 26.0 percent. |
| (7) | 10 percent option plan with an estimated Black-Scholes valuation of 29.20 percent of the exercise price, including a 5 year vesting with 25 percent of the options (granted to directors) tax effected at 26.0 percent. |
EXHIBIT IV-10
Pioneer Bank
Pro Forma Effect of Conversion Proceeds – Minority Stock Offering
Exhibit IV-10
PRO FORMA EFFECT OF CONVERSION PROCEEDS
Pioneer Bank
At the Minimum
| 1. | Pro Forma Market Capitalization | $ | 75,133,930 | |||
| Less: Foundation Shares | 3,339,280 | |||||
| 2. | Offering Proceeds | $ | 71,794,650 | |||
| Less: Estimated Offering Expenses | 2,107,997 | |||||
| Net Conversion Proceeds | $ | 69,686,653 | ||||
| 3. | Estimated Additional Income from Conversion Proceeds | |||||
| Net Conversion Proceeds | $ | 69,686,653 | ||||
| Less: Cash Contribution to Foundation | 250,000 | |||||
| Less: Non-Cash Stock Purchases (1) | 9,817,500 | |||||
| Net Proceeds Reinvested | $ | 59,619,153 | ||||
| Estimated net incremental rate of return | 1.86 | % | ||||
| Reinvestment Income | $ | 1,107,366 | ||||
| Less: Estimated cost of ESOP borrowings (2) | 0 | |||||
| Less: Amortization of ESOP borrowings (3) | 242,165 | |||||
| Less: Amortization of Options (4) | 446,729 | |||||
| Less: Recognition Plan Vesting (5) | 484,330 | |||||
| Net Earnings Impact | $ | (65,858 | ) |
| Net | ||||||||||||||
| Before | Earnings | After | ||||||||||||
| 4. | Pro Forma Earnings | Conversion | Increase | Conversion | ||||||||||
| 12 Months ended December 31, 2018 (reported) | $ | 16,795,000 | $ | (65,858 | ) | $ | 16,729,142 | |||||||
| 12 Months ended December 31, 2018 (core) | $ | 16,706,000 | $ | (65,858 | ) | $ | 16,640,142 | |||||||
| Before | Net Cash | Tax Benefit | After | |||||||||||||||
| 5. | Pro Forma Net Worth | Conversion | Proceeds | Of Contribution | Conversion | |||||||||||||
| December 31, 2018 | $ | 126,294,000 | $ | 59,619,153 | $ | 933,213 | $ | 186,846,366 | ||||||||||
| December 31, 2018 (Tangible) | $ | 116,289,000 | $ | 59,619,153 | $ | 933,213 | $ | 176,841,366 | ||||||||||
| Before | Net Cash | Tax Benefit | After | |||||||||||||||
| 6. | Pro Forma Assets | Conversion | Proceeds | Of Contribution | Conversion | |||||||||||||
| December 31, 2018 | $ | 1,286,867,000 | $ | 59,619,153 | $ | 933,213 | $ | 1,347,419,366 | ||||||||||
| (1) | Includes ESOP and MRP stock purchases equal to 8.71 percent and 4.36 percent of the public shares, respectively. |
| (2) | ESOP stock purchases are internally financed by a loan from the holding company. |
| (3) | ESOP borrowings are amortized over 20 years, amortization expense is tax-effected at a 26.0 percent rate. |
| (4) | Option valuation based on Black-Scholes model, 5 year vesting, and assuming 25 percent taxable. |
| (5) | MRP is amortized over 5 years, and amortization expense is tax effected at 26.0 percent. |
Exhibit IV-10
PRO FORMA EFFECT OF CONVERSION PROCEEDS
Pioneer Bank
At the Midpoint
| 1. | Pro Forma Market Capitalization | $ | 88,392,860 | |||
| Less: Foundation Shares | 3,928,570 | |||||
| 2. | Offering Proceeds | $ | 84,464,290 | |||
| Less: Estimated Offering Expenses | 2,223,143 | |||||
| Net Conversion Proceeds | $ | 82,241,147 | ||||
| 3. | Estimated Additional Income from Conversion Proceeds | |||||
| Net Conversion Proceeds | $ | 82,241,147 | ||||
| Less: Cash Contribution to Foundation | 250,000 | |||||
| Less: Non-Cash Stock Purchases (1) | 11,550,000 | |||||
| Net Proceeds Reinvested | $ | 70,441,147 | ||||
| Estimated net incremental rate of return | 1.86 | % | ||||
| Reinvestment Income | $ | 1,308,374 | ||||
| Less: Estimated cost of ESOP borrowings (2) | 0 | |||||
| Less: Amortization of ESOP borrowings (3) | 284,900 | |||||
| Less: Amortization of Options (4) | 525,564 | |||||
| Less: Recognition Plan Vesting (5) | 569,800 | |||||
| Net Earnings Impact | $ | (71,890 | ) |
| Net | ||||||||||||||
| Before | Earnings | After | ||||||||||||
| 4. | Pro Forma Earnings | Conversion | Increase | Conversion | ||||||||||
| 12 Months ended December 31, 2018 (reported) | $ | 16,795,000 | $ | (71,890 | ) | $ | 16,723,110 | |||||||
| 12 Months ended December 31, 2018 (core) | $ | 16,706,000 | $ | (71,890 | ) | $ | 16,634,110 | |||||||
| Before | Net Cash | Tax Benefit | After | |||||||||||||||
| 5. | Pro Forma Net Worth | Conversion | Proceeds | Of Contribution | Conversion | |||||||||||||
| December 31, 2018 | $ | 126,294,000 | $ | 70,441,147 | $ | 1,086,428 | $ | 197,821,575 | ||||||||||
| December 31, 2018 (Tangible) | $ | 116,289,000 | $ | 70,441,147 | $ | 1,086,428 | $ | 187,816,575 | ||||||||||
| Before | Net Cash | Tax Benefit | After | ||||||||||||
| 6. | Pro Forma Assets | Conversion | Proceeds | Of Contribution | Conversion | ||||||||||
| December 31, 2018 | $ | 1,286,867,000 | $ | 70,441,147 | $ | 1,086,428 | $ | 1,358,394,575 |
| (1) | Includes ESOP and MRP stock purchases equal to 8.71 percent and 4.36 percent of the public shares, respectively. |
| (2) | ESOP stock purchases are internally financed by a loan from the holding company. |
| (3) | ESOP borrowings are amortized over 20 years, amortization expense is tax-effected at a 26.0 percent rate. |
| (4) | Option valuation based on Black-Scholes model, 5 year vesting, and assuming 25 percent taxable. |
| (5) | MRP is amortized over 5 years, and amortization expense is tax effected at 26.0 percent. |
Exhibit IV-10
PRO FORMA EFFECT OF CONVERSION PROCEEDS
Pioneer Bank
At the Maximum
| 1. | Pro Forma Market Capitalization | $ | 101,651,790 | |||
| Less: Foundation Shares | 4,517,860 | |||||
| 2. | Offering Proceeds | $ | 97,133,930 | |||
| Less: Estimated Offering Expenses | 2,338,289 | |||||
| Net Conversion Proceeds | $ | 94,795,641 | ||||
| 3. | Estimated Additional Income from Conversion Proceeds | |||||
| Net Conversion Proceeds | $ | 94,795,641 | ||||
| Less: Cash Contribution to Foundation | 250,000 | |||||
| Less: Non-Cash Stock Purchases (1) | 13,282,501 | |||||
| Net Proceeds Reinvested | $ | 81,263,140 | ||||
| Estimated net incremental rate of return | 1.86 | % | ||||
| Reinvestment Income | $ | 1,509,382 | ||||
| Less: Estimated cost of ESOP borrowings (2) | 0 | |||||
| Less: Amortization of ESOP borrowings (3) | 327,635 | |||||
| Less: Amortization of Options (4) | 604,398 | |||||
| Less: Recognition Plan Vesting (5) | 655,270 | |||||
| Net Earnings Impact | $ | (77,922 | ) |
| Net | ||||||||||||||
| Before | Earnings | After | ||||||||||||
| 4. | Pro Forma Earnings | Conversion | Increase | Conversion | ||||||||||
| 12 Months ended December 31, 2018 (reported) | $ | 16,795,000 | $ | (77,922 | ) | $ | 16,717,078 | |||||||
| 12 Months ended December 31, 2018 (core) | $ | 16,706,000 | $ | (77,922 | ) | $ | 16,628,078 | |||||||
| Before | Net Cash | Tax Benefit | After | |||||||||||||||
| 5. | Pro Forma Net Worth | Conversion | Proceeds | Of Contribution | Conversion | |||||||||||||
| December 31, 2018 | $ | 126,294,000 | $ | 81,263,140 | $ | 1,239,644 | $ | 208,796,784 | ||||||||||
| December 31, 2018 (Tangible) | $ | 116,289,000 | $ | 81,263,140 | $ | 1,239,644 | $ | 198,791,784 | ||||||||||
| Before | Net Cash | Tax Benefit | After | |||||||||||||||
| 6. | Pro Forma Assets | Conversion | Proceeds | Of Contribution | Conversion | |||||||||||||
| December 31, 2018 | $ | 1,286,867,000 | $ | 81,263,140 | $ | 1,239,644 | $ | 1,369,369,784 | ||||||||||
| (1) | Includes ESOP and MRP stock purchases equal to 8.71 percent and 4.36 percent of the public shares, respectively. |
| (2) | ESOP stock purchases are internally financed by a loan from the holding company. |
| (3) | ESOP borrowings are amortized over 20 years, amortization expense is tax-effected at a 26.0 percent rate. |
| (4) | Option valuation based on Black-Scholes model, 5 year vesting, and assuming 25 percent taxable. |
| (5) | MRP is amortized over 5 years, and amortization expense is tax effected at 26.0 percent. |
Exhibit IV-10
PRO FORMA EFFECT OF CONVERSION PROCEEDS
Pioneer Bank
At the Super Maximum Value
| 1. | Pro Forma Market Capitalization | $ | 116,899,560 | |||
| Less: Foundation Shares | 5,195,540 | |||||
| 2. | Offering Proceeds | $ | 111,704,020 | |||
| Less: Estimated Offering Expenses | 2,470,708 | |||||
| Net Conversion Proceeds | $ | 109,233,312 | ||||
| 3. | Estimated Additional Income from Conversion Proceeds | |||||
| Net Conversion Proceeds | $ | 109,233,312 | ||||
| Less: Cash Contribution to Foundation | 250,000 | |||||
| Less: Non-Cash Stock Purchases (1) | 15,274,876 | |||||
| Net Proceeds Reinvested | $ | 93,708,436 | ||||
| Estimated net incremental rate of return | 1.86 | % | ||||
| Reinvestment Income | $ | 1,740,540 | ||||
| Less: Estimated cost of ESOP borrowings (2) | 0 | |||||
| Less: Amortization of ESOP borrowings (3) | 376,780 | |||||
| Less: Amortization of Options (4) | 695,058 | |||||
| Less: Recognition Plan Vesting (5) | 753,561 | |||||
| Net Earnings Impact | $ | (84,858 | ) |
| Net | ||||||||||||||
| Before | Earnings | After | ||||||||||||
| 4. | Pro Forma Earnings | Conversion | Increase | Conversion | ||||||||||
| 12 Months ended December 31, 2018 (reported) | $ | 16,795,000 | $ | (84,858 | ) | $ | 16,710,142 | |||||||
| 12 Months ended December 31, 2018 (core) | $ | 16,706,000 | $ | (84,858 | ) | $ | 16,621,142 | |||||||
| Before | Net Cash | Tax Benefit | After | |||||||||||||||
| 5. | Pro Forma Net Worth | Conversion | Proceeds | Of Contribution | Conversion | |||||||||||||
| December 31, 2018 | $ | 126,294,000 | $ | 93,708,436 | $ | 1,415,840 | $ | 221,418,277 | ||||||||||
| December 31, 2018 (Tangible) | $ | 116,289,000 | $ | 93,708,436 | $ | 1,415,840 | $ | 211,413,277 | ||||||||||
| Before | Net Cash | Tax Benefit | After | |||||||||||||||
| 6. | Pro Forma Assets | Conversion | Proceeds | Of Contribution | Conversion | |||||||||||||
| December 31, 2018 | $ | 1,286,867,000 | $ | 93,708,436 | $ | 1,415,840 | $ | 1,381,991,277 | ||||||||||
| (1) | Includes ESOP and MRP stock purchases equal to 8.71 percent and 4.36 percent of the public shares, respectively. |
| (2) | ESOP stock purchases are internally financed by a loan from the holding company. |
| (3) | ESOP borrowings are amortized over 20 years, amortization expense is tax-effected at a 26.0 percent rate. |
| (4) | Option valuation based on Black-Scholes model, 5 year vesting, and assuming 25 percent taxable. |
| (5) | MRP is amortized over 5 years, and amortization expense is tax effected at 26.0 percent. |
EXHIBIT V-1
RP® Financial, LC.
Firm Qualifications Statement

FIRM QUALIFICATION STATEMENT
RP® Financial (“RP®) provides financial and management consulting, merger advisory and valuation services to the financial services industry nationwide. We offer a broad array of services, high quality and prompt service, hands-on involvement by principals and senior staff, careful structuring of strategic initiatives and sophisticated valuation and other analyses consistent with industry practices and regulatory requirements. Our staff maintains extensive background in financial and management consulting, valuation and investment banking. Our clients include commercial banks, thrifts, credit unions, mortgage companies, insurance companies and other financial services companies.
STRATEGIC PLANNING SERVICES
RP®’s strategic planning services are designed to provide effective feasible plans with quantifiable results. We analyze strategic options to enhance shareholder value, achieve regulatory approval or realize other objectives. Such services involve conducting situation analyses; establishing mission/vision statements, developing strategic goals and objectives; and identifying strategies to enhance franchise and/or market value, capital management, earnings enhancement, operational matters and organizational issues. Strategic recommendations typically focus on: capital formation and management, asset/liability targets, profitability, return on equity and stock pricing. Our proprietary financial simulation models provide the basis for evaluating the impact of various strategies and assessing their feasibility and compatibility with regulations.
MERGER ADVISORY SERVICES
RP®’s merger advisory services include targeting potential buyers and sellers, assessing acquisition merit, conducting due diligence, negotiating and structuring merger transactions, preparing merger business plans and financial simulations, rendering fairness opinions, preparing mark-to-market analyses, valuing intangible assets and supporting the implementation of post-acquisition strategies. Our merger advisory services involve transactions of financially healthy companies and failed bank deals. RP® is also expert in de novo charters and shelf charters. Through financial simulations, comprehensive data bases, valuation proficiency and regulatory familiarity, RP®’s merger advisory services center on enhancing shareholder returns.
VALUATION SERVICES
RP®’s extensive valuation practice includes bank and thrift mergers, thrift mutual-to-stock conversions, goodwill impairment, insurance company demutualizations, ESOPs, subsidiary companies, merger accounting and other purposes. We are highly experienced in performing appraisals which conform to regulatory guidelines and appraisal standards. RP® is the nation’s leading valuation firm for thrift mutual-to-stock conversions, with appraised values ranging up to $4 billion.
OTHER CONSULTING SERVICES
RP® offers other consulting services including evaluating the impact of regulatory changes (TARP, etc.), branching and diversification strategies, feasibility studies and special research. We assist banks/thrifts in preparing CRA plans and evaluating wealth management activities on a de novo or merger basis. Our other consulting services are facilitated by proprietary valuation and financial simulation models.
KEY PERSONNEL (Years of Relevant Experience & Contact Information)
| Ronald S. Riggins, Managing Director (39) | (703) 647-6543 | rriggins@rpfinancial.com |
| William E. Pommerening, Managing Director (35) | (703) 647-6546 | wpommerening@rpfinancial.com |
| Marcus Faust, Managing Director (31) | (703) 647-6553 | mfaust@rpfinancial.com |
| Gregory E. Dunn, Director (36) | (703) 647-6548 | gdunn@rpfinancial.com |
| James P. Hennessey, Director (32) | (703) 647-6544 | jhennessey@rpfinancial.com |
| James J. Oren, Director (32) | (703) 647-6549 | joren@rpfinancial.com |
| Carla Pollard, Senior Vice President (29) | (703) 647-6556 | cpollard@rpfinancial.com |
| Washington Headquarters | |
| 4250 North Fairfax Drive | Telephone: (703) 528-1700 |
| Suite 600 | Fax No.: (703) 528-1788 |
| Arlington, VA 22203 | Toll-Free No.: (866) 723-0594 |
| www.rpfinancial.com | E-Mail: mail@rpfinancial.com |