Exhibit 99.1
Table of Contents
RISK FACTORS
An investment in our Class A Shares involves significant risks. You should carefully consider all of the information in this Introductory Document, including the risks and uncertainties described below, before making an investment in our Class A Shares. Any of the following risks could have a material adverse effect on our business, financial condition, and results of operations. In any such case, the market price of our Class A Shares could decline, and you may lose all or part of your investment.
Risks Relating to Our Business and Operations
We have a relatively short operating history of our current businesses compared to some of our globally established competitors and face significant risks and challenges in a rapidly evolving market, which makes it difficult to effectively assess our future prospects.
We have a relatively short operating history of our current businesses compared to some of our globally established competitors. We launched our investment banking business in 2015, after which we introduced our institutional asset management business and strategic investment business.
You should consider our business and prospects in light of the risks and challenges we encounter or may encounter given the rapidly evolving market in which we operate and our relatively short operating history. These risks and challenges include our ability to, among other things:
· | build a well-recognized and respected brand; |
| |
· | establish and expand our client base, win capital markets and advisory mandates, and increase our AUM; |
| |
· | maintain and enhance our relationships with our business partners; |
| |
· | attract, retain, and motivate talented employees; |
| |
· | anticipate and adapt to changing market conditions and competitive landscape; |
| |
· | manage our future growth; |
| |
· | ensure that the performance of our products and services meets client expectations; |
| |
· | maintain or improve our operational efficiency; |
| |
· | navigate a complex and evolving regulatory environment; |
| |
· | defend ourselves in any legal or regulatory actions against us; |
| |
· | enhance our technology infrastructure and maintain the security of our system and the confidentiality of the information provided and utilized across our system; |
| |
· | avoid and remedy operating errors as a result of human or system errors; |
| |
· | identify and address conflicts of interest; and |
| |
· | identify and appropriately manage our related party transactions. |
If we fail to address any or all of these risks and challenges, our business may be materially and adversely affected.
We have a relatively short history in serving our current institutional client base. As our business develops and as we respond to competition, we may continue to introduce new service offerings, make adjustments to our existing services, or make adjustments to our business operations in general. Any significant change to our business model that does not achieve expected results could have a material and adverse impact on our financial condition and results of operations. It is therefore difficult to effectively assess our future prospects.
Unfavorable financial market and economic conditions in Hong Kong, China, and elsewhere in the world could materially and adversely affect our business, financial condition, and results of operations.
As a financial services firm based in Hong Kong, our businesses are materially affected by conditions in the financial markets and economic conditions in Hong Kong, China, and elsewhere in the world. Financial markets and economic conditions could be negatively impacted by many factors beyond our control, such as inability to access capital markets, control of foreign exchange, changes in exchange rates, rising interest rates or inflation, slowing or negative growth rate, government involvement in allocation of resources, inability to meet financial commitments in a timely manner, terrorism, political uncertainty, civil unrest, fiscal or other economic policy of Hong Kong or other governments, and the timing and nature of any regulatory reform. The current trade frictions between the United States and China may also give rise to uncertainties in global economic conditions and adversely affect general investor confidence. Unfavorable financial market and economic conditions in Hong Kong, China, and elsewhere in the world could negatively affect our clients' business and materially reduce demand for our services and increase price competition among financial services firms seeking such engagements, and thus could materially and adversely affect our business, financial condition, and results of operations. In addition, our profitability could be adversely affected due to our fixed costs and the possibility that we would be unable to reduce our variable costs without reducing revenue or within a timeframe sufficient to offset any decreases in revenue relating to changes in market and economic conditions.
Revenue generated by our investment banking business is directly related to the volume and value of the transactions in which we are involved. Our investment bankers primarily serve clients in raising capital through IPOs and debt offerings. During periods of unfavorable market and economic conditions, our results of operations may be adversely affected by a decrease in the number and value of the IPOs and debt offerings that we underwrite.
During a market or general economic downturn, we may also derive lower revenue from our asset management and strategic investment businesses due to lower mark-to-market or fair value of the assets that we manage and the strategic investments that we made. In addition, due to uncertainty or volatility in the market or in response to difficult market conditions, clients or prospective clients may withdraw funds from, or hesitate to allocate assets to, our asset management business in favor of investments they perceive as offering greater opportunity or lower risk. Difficult market conditions can also materially and adversely affect our ability to launch new products or offer new services in our asset management business, which could negatively affect our ability to increase our AUM and our management fees that are based on the AUM.
The financial services industry is intensely competitive. If we are unable to compete effectively, we may lose our market share and our results of operations and financial condition may be materially and adversely affected.
The financial services industry is intensely competitive, highly fragmented, and subject to rapid change, and we expect it to remain so. We compete both in Hong Kong and globally, and on the basis of a number of factors, including the ability to adapt to evolving financial needs of a broad spectrum of clients, our ability to identify market demands and business opportunities to win client mandates, the quality of our advice, our employees, and deal execution, the range and price of our products and services, our innovation, our reputation, and the strength of our relationships. We expect to continue to invest capital and resources in our businesses in order to grow and develop them to a size where they are able to compete effectively in their markets, have economies of scale, and are themselves able to produce or consolidate significant revenue and profit. We cannot assure you that the planned and anticipated growth of our businesses will be achieved or in what timescale. There may be difficulties securing financing for investment for growth and in recruiting and retaining the skilled human resources required to compete effectively. If we fail to compete effectively against our competitors, our business, financial conditions, results of operations, and prospects will be materially and adversely affected.
Investment banking as our primary business generally requires us to react promptly to the evolving demand of our clients and be able to provide innovative financial solutions tailored to their needs. We may not be able to compete effectively with our competitors at all times and always be able to provide appropriate financial solutions that promptly and accurately address our clients' needs. If this were to happen, our ability to attract new or retain existing clients will suffer, which would materially and adversely affect our revenue and earnings.
We primarily compete with other investment banking firms. We have experienced and may continue to experience intense competition over obtaining investment banking service mandates. We may face pricing pressure as some of our competitors may seek to obtain higher market share by reducing fees and commissions. Some of our competitors include large global financial institutions or state-owned PRC financial institutions operating or headquartered in Hong Kong, many of which have longer operating histories, far broader financial and other resources, and significantly greater name recognition than us and have the ability to offer a wider range of products, which may enhance their competitive position. They also regularly support services we do not provide, such as commercial lending, margin lending and other financial services and products, which puts us at a competitive disadvantage and could result in pricing pressures or lost opportunities, which in turn could materially and adversely affect our results of operations. In addition, we may be at a competitive disadvantage with regard to some of our competitors that have larger customer bases, more professionals, and the ability to provide financing that are often a crucial component of investment banking deals on which we advise.
Historically, competition in the asset management market has been fierce. In recent years, the asset management market in Hong Kong had become more saturated. Banks and brokerage firms have offered low management fees, prolonged commission-free concessions, or extra-low fixed commissions as incentives to attract clients, thus further intensifying the competition in this market. We expect that competition in Hong Kong's asset management market will continue to be intense. We cannot assure you that we can compete effectively against our current and future competitors, or that competitive forces in the market will not alter the industry landscape such that our business objectives would become impractical or impossible. Under the foregoing circumstances, our business and financial condition would be adversely affected.
Our businesses depend on key management executives and professional staff, and our business may suffer if we are unable to recruit and retain them.
Our businesses depend on the skills, reputation, and professional experience of our key management executives, the network of resources and relationships they generate during the normal course of their activities, and the synergies among the diverse fields of expertise and knowledge held by our senior professionals. Therefore, the success of our business depends on the continued services of these individuals. If we lose their services, we may not be able to execute our existing business strategy effectively, and we may have to change our current business direction. These disruptions to our business may take up significant energy and resources of our Company, and materially and adversely affect our future prospects.
Moreover, our business operations depend on our professional staff, our most valuable assets. Their skills, reputation, professional experience, and client relationships are critical elements in obtaining and executing client engagements. We devote considerable resources and incentives to recruiting and retaining these personnel. However, the market for quality professional staff is increasingly competitive. We expect to face significant competition in hiring such personnel. Additionally, as we mature, current compensations scheme to attract employees may not be as effective as in the past. The intense competition may require us to offer more competitive compensation and other incentives to our talent, which could materially and adversely affect our financial condition and results of operations. As a result, we may find it difficult to retain and motivate these employees, and this could affect their decisions about whether or not they continue to work for us. If we do not succeed in attracting, hiring and integrating quality professional staff, or retaining and motivating existing personnel, we may be unable to grow effectively.
We make strategic investments using our own capital, and may not be able to realize any profits from these investments for a considerable period of time, or may lose some or all of the principal amounts of these investments.
We derived a significant portion of our revenue from our strategic investment business. Our dividend and gain related to disposed investment accounted for 6.7%, 13.7% and 9.6% of our total revenue for the years ended 31 December 2017 and 2018 and the nine months ended 30 September 2019, respectively, and our net fair value changes on stock loan, derivative financial instrument and financial assets at fair value through profit or loss accounted for 66.3%, 35.5%, and 49.9% of our total revenue for the corresponding periods, respectively. Our strategic investment portfolio primarily consist of investments in equity and equity-linked securities of public and private companies. Making a sound investment decision requires us to carefully identify and select a target company based on its business, financial condition, operations, and the industry in which it operates. In general, this process involves analytical assessment and estimation of the target company's profitability and sustainability. We may make unsound investment decisions due to fraudulent and concealed, inaccurate or misleading statements from a target company in the course of our due diligence, which could lead us to mistakenly estimate the value of the target company and affect our ability to derive profit from such investments. In addition, our understanding of and judgment on the target company's business and prospects, and the industry in which the target company operates may deviate and result in inaccurate investment decisions.
We make strategic investments in financial and new economy sectors in Asia and are subject to concentration risks. Our investment portfolio may be concentrated in certain sectors, geographic regions, individual investments, or types of securities that may or may not be listed. As at the date of this Introductory Document, we hold investments primarily in four (4) companies under our strategic investment business. Any significant decline in the value of our investment portfolio may therefore adversely impact our business, results of operations, and financial condition.
We also make strategic investments in the highly regulated banking sector in China. Any change in PRC laws, regulations, or policies may adversely affect our equity holding as a foreign investor, our ability to exit from the investment, or the fair value of our equity investment.
In addition, we have limited control over all of our investee companies. Even if we have a board seat in certain investee companies, we do not have the necessary power to mandate or block material corporate actions. If these investee companies fail to carry out business in a compliant manner, incur overly excessive amount of debt or go bankrupt, or the business operations decline, the fair value of our investment in these companies may deteriorate or, in extreme cases, decrease to zero. We are subject to the risk that the majority shareholders or the management of these investee companies may act in a manner that does not serve the investee companies' interests. The general operational risks, such as inadequate or failing internal control of these investee companies, the compliance risks, such as any lack of requisite approvals for investee companies' businesses, and legal risks, such as violation of laws and regulations or fraudulent or otherwise improper activities, may also expose our investments to risks. Furthermore, these investee companies may fail to abide by their agreements with us, for which we may have limited or no recourse. These investee companies may not declare dividend, or even if they do, we may not be able to secure liquidity conveniently until we receive such dividend. If any of the foregoing were to occur, our business, reputation, financial condition and results of operations could be materially and adversely affected.
In recent years, there has been increasing competition for private equity investment opportunities, which may limit the availability of investment opportunities or drive up the price of available investment opportunities, and, as a result, our financial condition and results of operations may be materially and adversely affected.
Our strategic investment business is subject to liquidity risks.
Some of our strategic investments are in the form of securities that are not publicly traded. In many cases, there may be prohibition by contract or by applicable laws from selling such securities for a period of time or there may not be a public market for such securities. Even if the securities are publicly traded, large holdings of securities can often be disposed of only over a substantial length of time, exposing the investment returns to risks of downward movement in market prices during the disposition period. Accordingly, under certain conditions, we may be forced to either sell securities at lower prices than we had expected to realize or defer, potentially for a considerable period of time, sales that we had planned to make. Investing in these securities can involve a high degree of risk, and we may lose some or all of the principal amount of such strategic investments.
Our results of operations and financial condition may be materially affected by fluctuations in the fair value of our equity investments in our investee companies.
Our investments are long-term, strategic in nature to reinforce our ecosystem. We have made significant equity investments in public and private companies and recognize dividend and gain related to disposed investment and net fair value changes on stock loan, derivative financial instrument and financial assets at fair value through profit or loss on our consolidated statements of profit or loss and other comprehensive income. For the years ended 31 December 2017 and 2018 and the nine months ended 30 September 2019, dividend and gain related to disposed investment accounted for 6.7%, 13.7% and 9.6% and net fair value changes on stock loan, derivative financial instrument and financial assets at fair value through profit or loss accounted for 66.3%, 35.5%, and 49.9%, of our total revenue, respectively. Since we intend to hold our investments on a long-term basis, fair value of our equity investments is subject to market fluctuations due to changes in the market prices of securities, interest rates, or other market factors, such as liquidity, or regulatory factors, such as changes in policies affecting the businesses of our investee companies.
Technology has been one of our key sectors of focus and the fair value of our investments in technology companies may be subject to significant valuation fluctuations. For our equity investments in private companies, we measure their fair value based on an assessment of each underlying security, considering rounds of financing, third-party transactions, and market-based information, including comparable company transactions, trading multiples, and changes in market outlook. As at 30 September 2019, the aggregate fair value of our strategic investment portfolio was HK$3.9 billion. Although we do not intend to make frequent trades on investments for profit, the nature of investment and significance of our investment holdings could adversely affect our results of operations and financial condition.
Our investment in Bank of Qingdao is subject to liquidity, concentration, and regulatory risks.
As at 30 September 2019, our strategic investment portfolio reached an aggregate fair value of HK$3.9 billion, of which our investment in the Hong Kong and Shenzhen-listed Bank of Qingdao accounted for 91.9%. As at 30 September 2019, we hold an approximate 8.91% interest in the Bank of Qingdao. We hold a significant stake in Bank of Qingdao and expect it to be a long-term investment, and our Chairman of the Board and Chief Executive Officer also serves as a director of Bank of Qingdao. Given our significant stake in, and affiliation with, Bank of Qingdao, our investment in Bank of Qingdao is subject to liquidity and concentration risk. There may not be a readily available market to sell the shares of Bank of Qingdao. We will need to gradually sell down our holdings subject to market conditions, if we want to liquidate our position in Bank of Qingdao. In addition, the banking sector in China is highly regulated and any change in PRC laws, regulations, or policies may adversely affect our holding in Bank of Qingdao as a foreign investor, our ability to exit from the investment, or the fair value of our equity investment in Bank of Qingdao. Any adverse impact on our investment in Bank of Qingdao could materially and adversely affect our business, results of operations, and financial condition.
A substantial portion of our revenue is derived from investment banking business, which is not a long-term contracted source of revenue and is subject to intense competition, and declines in these engagements could materially and adversely affect our financial condition and results of operations.
We historically have earned a substantial portion of our revenue from fees and commissions paid by our investment banking clients, which usually are payable upon the successful completion of particular transactions. Revenue derived from our investment banking business accounted for 20.1%, 39.9%, and 31.7% of our total revenue for the years ended 31 December 2017 and 2018 and the nine months ended 30 September 2019, respectively. We expect that we will continue to rely on investment banking business for a substantial portion of our revenue for the foreseeable future, and a decline in our engagements could materially and adversely affect our financial condition and results of operations.
In addition, investment banking business typically is not a long-term contracted source of revenue. Each revenue-generating engagement typically is separately awarded and negotiated. Furthermore, many of our clients do not routinely require our services. As a consequence, our engagements with many clients are not likely to be predictable. We may also lose clients each year, including as a result of the sale or merger of a client, or due to a change in a client's senior management and competition from other investment banking firms. As a result, our engagements with clients are constantly changing and our total revenue could fluctuate or decline quickly due to these factors.
Our investment banking business depends on our ability to identify, execute, and complete projects successfully and is subject to various risks associated with underwriting and financial advisory services. We cannot assure you that the income level of our investment banking business can be sustained.
We underwrite securities offerings in Hong Kong, the United States, and other jurisdictions, and are exposed to uncertainties in the regulatory requirements in these jurisdictions. Securities offerings are subject to review and approval by various regulatory authorities, the results and timing of which are beyond our control and may cause substantial delays to, or the termination of, the offering. We receive the payment of fees and commissions in most securities offerings only after the successful completion of the transactions. If a transaction is not completed as scheduled, or at all, for any reason, we may not receive fees and commissions for services that we have provided in a timely manner, or at all, which could materially and adversely affect our results of operations.
Market fluctuations and changes in regulatory policies may adversely affect our investment banking business. Negative market and economic conditions may adversely affect investor confidence, resulting in significant industry-wide decline in the size and number of securities offerings, and market volatility may cause delays to, or even termination of, securities offerings that we underwrite, either of which could adversely affect our revenue from the investment banking business.
In addition, in acting as an underwriter in a securities offering, we may be subject to litigation, securities class action, claims, administrative penalties, regulatory sanctions, fines, or disciplinary actions, or may be otherwise legally liable in Hong Kong, the United States, and other jurisdictions. Our reputation may be affected due to inadequate due diligence, fraud or misconduct committed by issuers or their agents or our staff, misstatements and omissions in disclosure documents, or other illegal or improper activities that occur during the course of the underwriting process, which may adversely affect our business, financial condition, and results of operations. Our investment banking business may also be affected by new rules and regulations, changes in the interpretation or enforcement of existing rules and regulations relating to the underwriting of securities offerings.
As a result, we cannot assure you that the income level of our investment banking business can be sustained.
If we cannot identify or effectively control the various risks involved in the asset management products that we offer or manage under our asset management business or otherwise achieve expected investment returns for our asset management clients, our reputation, client relationships, and asset management business will be adversely affected.
We offer our asset management clients a broad selection of third-party products, including fixed income products and equity products, for which we derive revenue through management fees, performance fees, and brokerage fees. These products often have complex structures and involve various risks, including default risks, interest rate risks, liquidity risks, market volatility and other market risks. In addition, we are subject to risks arising from any potential misconduct or violation of law by the product providers or corporate borrowers. Although the product providers or corporate borrowers of the asset management products we offer are typically directly liable to our clients in the event of a product default, these incidences could adversely affect the performance of the applicable products that we distribute and our reputation. Our success in maintaining our brand image depends, in part, on our ability to effectively control the risks associated with these products. Our asset management team not only needs to understand the nature of the products but also needs to accurately describe the products to, and evaluate them for, our clients. Although we enforce and implement strict risk management policies and procedures, they may not be fully effective in mitigating the risk exposure of our clients in all market environments or against all types of risks. If we fail to identify and effectively control the risks associated with the products that we offer or manage, or fail to disclose such risks to our clients in a sufficiently clear and timely manner, or to timely dispose of such investments in the clients' investment portfolios, our clients may suffer financial loss or other damages. Poor performance of these products and services, negative perceptions of the institutions offering these products and services or failure to achieve expected investment return may impact client confidence in the products we offer them, may impede the capital-raising activities in connection with our asset management business, and reduce our asset under management and revenue generated under this segment.
For discretionary account service we offer to our clients, we have a higher level of discretion in making investments. If we are unable to generate sufficient returns from our investments, including managing leverage risks on behalf of our clients, or even incur losses, our clients may become unwilling to continue to use our services, and our reputation, client relationship, business, and prospects will be materially and adversely affected.
We are subject to extensive and evolving regulatory requirements, non-compliance with which may result in penalties, limitations, and prohibitions on our future business activities or suspension or revocation of our licenses, and consequently may materially and adversely affect our business, financial condition, and results of operations. In addition, we may, from time to time, be subject to regulatory inquiries and investigations by relevant regulatory authorities or government agencies in Hong Kong or other applicable jurisdictions.
The Hong Kong and U.S. financial markets in which we primarily operate are highly regulated. Our business operations are subject to applicable Hong Kong and U.S. laws, regulations, guidelines, circulars, and other regulatory guidance, and many aspects of our businesses depend on obtaining and maintaining approvals, licenses, permits, or qualifications from the relevant regulators. Serious non-compliance with regulatory requirements could result in investigations and regulatory actions, which may lead to penalties, including reprimands, fines, limitations, or prohibitions on our future business activities or, if significant, suspension or revocation of our licenses. Failure to comply with these regulatory requirements could limit the scope of businesses in which we are permitted to engage. Furthermore, additional regulatory approvals, licenses, permits, or qualifications may be required by relevant regulators in the future, and some of our current approvals, licenses, permits, or qualifications are subject to periodic renewal. Although we have not been found by any relevant regulators to be in material non-compliance with any regulatory requirements since we commenced our current businesses in 2015, any such finding or other negative outcome may affect our ability to conduct business, harm our reputation and, consequently, materially and adversely affect our business, financial condition, results of operations, and prospects.
Two of our subsidiaries, AMTD Global Markets Limited and Asia Alternative Asset Partners Limited, are HKSFC-licensed companies subject to various requirements, such as remaining fit and proper at all times, minimum liquid and paid-up capital requirements, notification requirements, submission of audited accounts, submission of financial resources returns and annual returns, continuous professional training, under the Securities and Futures Ordinance (Cap. 571) of Hong Kong and its subsidiary legislation and the codes and the guidelines issued by the HKSFC. If any of these HKSFC licensed companies fails to meet the regulatory capital requirements in Hong Kong, the local regulatory authorities may impose penalties on us or limit the scope of our business, which could, in turn, have a material adverse effect on our financial condition and results of operations. Moreover, the relevant capital requirements may be changed over time or subject to different interpretations by relevant governmental authorities, all of which are out of our control. Any increase of the relevant capital requirements or stricter enforcement or interpretation of the same may adversely affect our business activities. In addition, AMTD Global Markets Limited is a licensed principal intermediary under the Mandatory Provident Fund Schemes Ordinance (Cap. 485) of Hong Kong, a licensed insurance broker company under the Insurance Ordinance (Cap. 41) of Hong Kong. Any non-compliance with applicable regulatory requirements by our Company or any of our subsidiaries may result in penalties, limitations, and prohibitions on our future business activities and thus may materially and adversely affect our business, financial condition, and results of operations.
From time to time, AMTD Global Markets Limited and Asia Alternative Asset Partners Limited may be subject to or required to assist in inquiries or investigations by relevant regulatory authorities or government agencies in Hong Kong or other jurisdictions, including the HKSFC and the SEC, relating to its own activities or activities of third parties such as its clients. The HKSFC conducts on-site reviews and off-site monitoring to ascertain and supervise our business conduct and compliance with relevant regulatory requirements and to assess and monitor, among other things, our financial soundness. We, our Directors, our Executive Officers or our employees, may be subject to such regulatory inquiries and investigations from time to time, regardless of whether we are the target of such regulatory inquiries and investigations. If any misconduct is identified as a result of inquiries, reviews or investigations, the HKSFC may take disciplinary actions that would lead to revocation or suspension of licenses, public or private reprimand or imposition of pecuniary penalties against us, our responsible officers, licensed representatives, directors, or other officers. Any such disciplinary actions taken against us, our responsible officers, licensed representatives, directors, or other officers may have a material and adverse impact on our business operations and financial results. In addition, we are subject to statutory secrecy obligations under the Securities and Futures Ordinance (Cap. 571) of Hong Kong whereby we may not be permitted to disclose details on any HKSFC inquiries, reviews or investigations without the consent of the HKSFC. For further details, see the section entitled "Appendix B – Regulatory Overview —Disciplinary Power of the HKSFC".
Our revenue and profits are highly volatile, and fluctuate significantly from quarter to quarter, which may result in volatility of the price of our Class A Shares.
Our revenue and profits are highly volatile and could fluctuate significantly. For example, the revenue generated from investment banking business is highly dependent on market conditions, regulatory environment and policies, and the decisions and actions of our clients and interested third parties. As a result, our results of operations will likely fluctuate from quarter to quarter based on the timing of when those fees are earned. It may be difficult for us to achieve steady earnings growth on a quarterly basis, which could, in turn, lead to large adverse movements in the price of our Class A Shares or increasing volatility in our Class A Shares price generally.
The due diligence that we undertake in the course of our business operations is inherently limited and may not reveal all facts and issues that may be relevant in connection with such businesses.
In the course of providing investment banking services, asset management services, and making strategic investments, we endeavor to conduct due diligence review that we deem reasonable and appropriate based on relevant regulatory expertise and market standards as well as the facts and circumstances applicable to each deal. When conducting due diligence, we are often required to evaluate critical and complex business, financial, tax, accounting, environmental, regulatory, and legal issues. Outside consultants, such as legal advisors, and accountants may be involved in the due diligence process in varying degrees depending on the transaction type. Nevertheless, when conducting due diligence work and making an assessment, we are limited to the resources available, including information provided by the target company or the issuer and, in some circumstances, third-party investigations. The due diligence work that we conduct with respect to any investment opportunity may not reveal or highlight all relevant facts that may be necessary, helpful, or accurate in evaluating potential risks, which may subject us to potential penalties in the case of securities underwriting, or failure of investment in the case of strategic investment. We may be provided with information that is misleading, false, or inaccurate as a result of mistake, misconduct, or fraud of our employees or third parties. Moreover, such due diligence work will not necessarily result in the successful completion of a transaction, which may adversely affect the performance of our business.
We face additional risks as we offer new products and services, transact with a broader array of clients and counterparties and expose ourselves to new asset classes and geographical markets.
We are committed to providing new products and services in order to strengthen our market position in the financial services industry and client relationships. We expect to expand our product and service offerings as permitted by relevant regulatory authorities, transact with new clients not in our traditional client base and enter into new markets. For further details, see the section entitled "Business—Our Growth Strategies". These activities expose us to new and increasingly challenging risks, including, but not limited to:
· | we may have insufficient experience or expertise in offering new products and services and dealing with inexperienced counterparties and clients may harm our reputation; |
| |
· | we may be subject to stricter regulatory scrutiny, or increasing tolerance of credit risks, market risks, compliance risks, and operational risks; |
| |
· | we may be unable to provide clients with adequate levels of service for our new products and services; |
| |
· | our new products and services may not be accepted by our clients or meet our profitability expectations; |
| |
· | our new products and services may be quickly copied by our competitors so that its attractiveness to our clients may be diluted; and |
| |
· | our internal information technology infrastructure may not be sufficient to support our product and service offerings. |
If we are unable to achieve the expected results with respect to our offering of new products and services, our business, financial condition, and results of operations could be materially and adversely affected.
In addition, we also intend to further expand our business geographically through establishing branch offices in key financial centers in the United States and Southeast Asia, such as New York City and Singapore. See the section entitled "Business—Our Growth Strategies—Expand our footprint globally". Operating business internationally may expose us to additional risks and uncertainties. As we have limited experience in operating our business in United States and other overseas markets, we may be unable to attract a sufficient number of clients, fail to anticipate competitive conditions, or face difficulties in operating effectively in these markets. We may also fail to adapt our business models to the local market due to various legal requirements and market conditions. Compliance with applicable foreign laws and regulations, especially financial regulations, increases the costs and risk exposure of doing business in foreign jurisdictions. In addition, in some cases, compliance with the laws and regulations of one country could nevertheless cause violation of the laws and regulations of another country. Violations of these laws and regulations could materially and adversely affect our brand, international growth efforts, and business.
We may undertake acquisitions, investments, joint ventures, or other strategic alliances, which could present unforeseen integration difficulties or costs and may not enhance our business as we expect.
Our strategy includes plans to grow both organically and through possible acquisitions, joint ventures, or other strategic alliances. Joint ventures and strategic alliances may expose us to new operational, regulatory, and market risks, as well as risks associated with additional capital requirements. We may not be able, however, to identify suitable future acquisition targets or alliance partners. Even if we identify suitable targets or partners, the evaluation, negotiation, and monitoring of the transactions could require significant management attention and internal resources and we may be unable to complete an acquisition or alliance on terms commercially acceptable to us. The costs of completing an acquisition or alliance may be costly and we may not be able to access funding sources on terms commercially acceptable to us. Even when acquisitions are completed, we may encounter difficulties in integrating the acquired entities and businesses, such as difficulties in retention of clients and personnel, challenge of integration and effective deployment of operations or technologies, and assumption of unforeseen or hidden material liabilities or regulatory non-compliance issues. Any of these events could disrupt our business plans and strategies, which in turn could have a material adverse effect on our financial condition and results of operations. Such risks could also result in our failure to derive the intended benefits of the acquisitions, strategic investments, joint ventures, or strategic alliances, and we may be unable to recover our investment in such initiatives. We cannot assure you that we could successfully mitigate or overcome these risks.
Volatile securities market may result in margin sales under our margin loan arrangements for our strategic investment business, which could materially and adversely affect our financial condition and results of operations.
We maintain certain margin loans to finance some of our investments. These margin loan arrangements contain provisions that may not work to our advantage when we encounter difficulties in certain circumstances. For example, these margin loans allow lenders to dispose of the securities at a margin price to stop their losses when the price of the securities we purchased declined to the margin price. Selling the securities at the margin price typically causes significant loss to our investment as the margin price is generally lower than the security price we paid and we no longer have the chance to profit from future rises of security prices. As at 30 September 2019, the aggregate amount of our outstanding margin loans was HK$321.8 million. The securities market in Hong Kong and the United States have recently been volatile, which heightened the risk associated with our margin loan arrangements. Under certain circumstances, we may attempt to renegotiate the terms and conditions of our existing margin loans or to obtain additional financing. We cannot assure you that our renegotiation efforts would be successful or timely or that we would be able to refinance our obligations on acceptable terms or at all. If margin sales happen, our financial condition and results of operations could be materially and adversely affected.
Any negative publicity with respect to us, our Directors, officers, employees, shareholders, or other beneficial owners, our peers, business partners, or our industry in general, may materially and adversely affect our reputation, business, and results of operations.
Our reputation and brand recognition play an important role in earning and maintaining the trust and confidence of our existing and prospective clients. Our reputation and brand are vulnerable to many threats that can be difficult or impossible to control, and costly or impossible to remediate. Negative publicity about us, such as alleged misconduct, other improper activities, or negative rumors relating to our business, shareholders, or other beneficial owners, affiliates, directors, officers, or other employees, can harm our reputation, business, and results of operations, even if they are baseless or satisfactorily addressed. For example, a number of media reported that during his previous employment at a global investment banking firm, our Chairman of the Board and Chief Executive Officer was alleged to have not adhered to such firm's internal policies concerning the disclosure of potential conflicts of interest. We believe that these allegations are based on inaccurate facts and are unfounded and meritless. These allegations, even if unproven or meritless, may lead to inquiries, investigations, or other legal actions against us by any regulatory or government authorities. Any regulatory inquiries or investigations and lawsuits against us, and perceptions of conflicts of interest, inappropriate business conduct by us or perceived wrong doing by any key member of our management team, among other things, could substantially damage our reputation regardless of their merits, and cause us to incur significant costs to defend ourselves. As we reinforce our ecosystem and stay close to our clients and other "AMTD SpiderNet" stakeholders, any negative market perception or publicity on our business partners that we closely cooperate with, or any regulatory inquiries or investigations and lawsuits initiated against them, may also have an impact on our brand and reputation, or subject us to regulatory inquiries or investigations or lawsuits. Moreover, any negative media publicity about the financial services industry in general or product or service quality problems of other firms in the industry in which we operate, including our competitors, may also negatively impact our reputation and brand. If we are unable to maintain a good reputation or further enhance our brand recognition, our ability to attract and retain clients, third-party partners, and key employees could be harmed and, as a result, our business, financial position, and results of operations would be materially and adversely affected.
Our operations may be subject to transfer pricing adjustments by competent authorities.
We may use transfer pricing arrangements to account for business activities between us and our Controlling Shareholder, the different entities within our consolidated group, or other related parties. We cannot assure you that the tax authorities in the jurisdictions where we operate would not subsequently challenge the appropriateness of our transfer pricing arrangements or that the relevant regulations or standards governing such arrangements will not be subject to future changes. If a competent tax authority later finds that the transfer prices and the terms that we have applied are not appropriate, such authority may require us or our subsidiaries to re-assess the transfer prices and re-allocate the income or adjust the taxable income. Any such reallocation or adjustment could result in a higher overall tax liability for us and may adversely affect our business, financial condition, and results of operations.
Our risk management and internal control systems, as well as the risk management tools available to us, may not fully protect us against various risks inherent in our business.
We follow our comprehensive internal risk management framework and procedures to manage our risks, including, but not limited to, reputational, legal, regulatory, compliance, operational, market, liquidity, and credit risks. We have in place various guidelines, policies and procedures which formed the basis of the risk management framework, including our Code of Business Conducts and Ethics, Insider Trading Policy, Anti-Corruption Compliance Policy, Policy and Procedures in relation to Related Persons Transactions, Disclosure Controls and Procedures. All these guidelines, policies and procedures set out the required standards which we expect our employees to adhere to. However, our risk management policies, procedures, and internal controls may not be adequate or effective in mitigating our risks or protecting us against unidentified or unanticipated risks. In particular, some methods of managing risks are based upon observed historical market behaviour and our experience in the financial industry. These methods may fail to predict future risk exposures, which could be significantly greater than those indicated by our historical measures. Other risk management methods depend upon an evaluation of available information regarding operating and market conditions and other matters, which may not be accurate, complete, up-to-date, or properly evaluated. In addition, the capital markets are constantly developing, the information and experience that we rely on for our risk management methods may become quickly outdated as capital markets and regulatory environment continue to evolve. If we experience any material deficiencies or failure in our risk management and internal control systems and procedures, such deficiencies or failure may adversely affect our ability to identify or report our deficiencies or non-compliance. Further, if we fail to maintain an effective system of internal control over financial reporting, we may be unable to accurately report our results of operations, meet our reporting obligations, or prevent fraud. In addition, failure of our employees to effectively enforce such risk management and internal controls procedures, or any of the foregoing risks, may have a material and adverse effect on our business, financial condition and operating results.
Our business is subject to various cyber-security and other operational risks.
We face various cyber-security and other operational risks relating to our businesses on a daily basis. We rely heavily on financial, accounting, communication and other data processing systems as well as the people who operate them to securely process, transmit, and store sensitive and confidential client information, and communicate globally with our staff, clients, partners, and third-party vendors. We also depend on various third-party software and cloud-based storage platforms as well as other information technology systems in our business operations. These systems, including third-party systems, may fail to operate properly or become disabled as a result of tampering or a breach of our network security systems or otherwise, including for reasons beyond our control.
Our clients typically provide us with sensitive and confidential information as part of our business arrangements. We are susceptible of attempts to obtain unauthorized access of such sensitive and confidential client information. We also may be subject to cyber-attacks involving leak and destruction of sensitive and confidential client information and our proprietary information, which could result from an employee's or agent's failure to follow data security procedures or as a result of actions by third parties, including actions by government authorities. Although cyber-attacks have not had a material impact on our operations to date, breaches of our or third-party network security systems on which we rely could involve attacks that are intended to obtain unauthorized access to and disclose sensitive and confidential client information and our proprietary information, destroy data or disable, degrade, or sabotage our systems, often through the introduction of computer viruses and other means, and could originate from a wide variety of sources, including state actors or other unknown third parties. The increase in using mobile technologies can heighten these and other operational risks.
We cannot assure you that we or the third parties on which we rely will be able to anticipate, detect, or implement effective preventative measures against frequently changing cyber-attacks. We may incur significant costs in maintaining and enhancing appropriate protections to keep pace with increasingly sophisticated methods of attack. In addition to the implementation of data security measures, we require our employees to maintain the confidentiality of the proprietary information that we hold. If an employee's failure to follow proper data security procedures results in the improper release of confidential information, or our systems are otherwise compromised, malfunctioning or disabled, we could suffer a disruption of our business, financial losses, liability to clients, regulatory sanctions, and damage to our reputation.
We operate in businesses that are highly dependent on proper processing of financial transactions. In our asset management business, we have to reliably obtain securities and other pricing information, properly execute and process client transactions, and provide reports and other customer service to our clients. The occurrence of trade or other operational errors or the failure to keep accurate books and records can render us liable to disciplinary action by regulatory authorities, as well as to claims by our clients. We also rely on third-party service providers for certain aspects of our business. Any interruption or deterioration in the performance of these third parties or failures of their information systems and technology could impair our operations, affect our reputation, and adversely affect our businesses.
Fraud or misconduct by our Directors, officers, employees, agents, clients, or other third parties could harm our reputation and business and may be difficult to detect and deter.
It is not always possible to detect and deter fraud or misconduct by our Directors, officers, employees, agents, clients, business partners, or other third parties. The precautions that we take to detect and prevent such activity may not be effective in all cases. Fraud or misconduct by any of these persons or entities may cause us to suffer significant reputational harm and financial loss or result in regulatory disciplinary actions. The potential harm to our reputation and to our business caused by such fraud or misconduct is impossible to quantify.
We are subject to a number of obligations and standards arising from our businesses. The violation of these obligations and standards by any of our Directors, officers, employees, agents, clients, or other third parties could materially and adversely affect us and our investors. For example, our businesses require that we properly handle confidential information. If our Directors, officers, employees, agents, clients, or other third parties were to improperly use or disclose confidential information, we could suffer serious harm to our reputation, financial position, and existing and future business relationships. Although we have not identified any material fraud or misconduct by our Directors, officers, employees, agents, clients, or other third parties since we commenced our current businesses in 2015, if any of these persons or entities were to engage in fraud or misconduct or were to be accused of such fraud or misconduct, our business and reputation could be materially and adversely affected.
We may be subject to litigation and regulatory investigations and proceedings and may not always be successful in defending ourselves against such claims or proceedings.
Although we have not been subject to any material lawsuits and arbitration claims in relation to our current business since the commencement in 2015, operating in the financial services industry may subject us to significant risks, including the risk of lawsuits and other legal actions relating to compliance with regulatory requirements in areas such as information disclosure, sales or underwriting practices, product design, fraud and misconduct, and protection of sensitive and confidential client information. From time to time we may be subject to lawsuits and arbitration claims in the ordinary course of our business brought by external parties or disgruntled current or former employees, inquiries, investigations, and proceedings by regulatory and other governmental agencies. Any such claims brought against us, with or without merits, may result in administrative measures, settlements, injunctions, fines, penalties, negative publicities, or other results adverse to us that could have material adverse effect on our reputation, business, financial condition, results of operations, and prospects. Even if we are successful in defending ourselves against these actions, the costs of such defence may be significant.
In market downturns, the number of legal claims and amount of damages sought in litigation and regulatory proceedings may increase. In addition, our affiliates may also encounter litigation, regulatory investigations, and proceedings for the practices in their business operations. Our clients may also be involved in litigation, investigation, or other legal proceedings, some of which may relate to transactions that we have advised, whether or not there has been any fault on our part.
We may not be able to fully detect money laundering and other illegal or improper activities in our business operations on a timely basis or at all, which could subject us to liabilities and penalties.
We are required to comply with applicable anti-money laundering and anti-terrorism laws and other regulations in the jurisdictions where we operate. Although we have adopted policies and procedures aimed at detecting, and preventing being used for, money-laundering activities by criminals or terrorist-related organizations and individuals or improper activities (including but not limited to market manipulation and aiding and abetting tax evasion), such policies and procedures may not completely eliminate instances where our networks may be used by other parties to engage in money laundering and other illegal or improper activities. Furthermore, we primarily comply with applicable anti-money laundering laws and regulations in Hong Kong and we may not fully detect violations of anti-money laundering regulations in other jurisdictions or be fully compliant with the anti-money laundering laws and regulations in other jurisdictions to which we are required. As a publicly listed company in the United States, we are subject to the U.S. Foreign Corrupt Practices Act of 1977 and other laws and regulations in the United States, including regulations administered by the U.S. Department of Treasury's Office of Foreign Asset Control. Although we have not identified any failure to detect material money laundering activities since we commenced our current businesses in 2015, if we fail to fully comply with applicable laws and regulations, the relevant government agencies may impose fines and other penalties on us, which may adversely affect our business.
We regularly encounter potential conflicts of interest, and failure to identify and address such conflicts of interest could adversely affect our business.
We face the possibility of actual, potential, or perceived conflicts of interest in the ordinary course of our business operations. Conflicts of interest may exist between (i) our different businesses; (ii) us and our clients; (iii) our clients; (iv) us and our employees; (v) our clients and our employees, or (vi) us and our Controlling Shareholder and other beneficial owners. As we expand the scope of our business and our client base, it is critical for us to be able to timely address potential conflicts of interest, including situations where two or more interests within our businesses naturally exist but are in competition or conflict. We have put in place extensive internal control and risk management procedures that are designed to identify and address conflicts of interest. However, appropriately identifying and managing actual, potential, or perceived conflicts of interest is complex and difficult, and our reputation and our clients' confidence in us could be damaged if we fail, or appear to fail, to deal appropriately with one or more actual, potential, or perceived conflicts of interest. It is possible that actual, potential, or perceived conflicts of interest could also give rise to client dissatisfaction, litigation, or regulatory enforcement actions. Regulatory scrutiny of, or litigation in connection with, conflicts of interest could have a material adverse effect on our reputation, which could materially and adversely affect our business in a number of ways, including a reluctance of some potential clients and counterparties to do business with us. Any of the foregoing could materially and adversely affect our reputation, business, financial condition, and results of operations.
The current tensions in international economic relations may negatively affect the demand for our services, and our results of operations and financial condition may be materially and adversely affected.
Recently there have been heightened tensions in international economic relations, such as the one between the United States and China. Amid these tensions, the U.S. government has imposed and may impose additional measures on entities in China, including sanctions. As a financial services firm based in Hong Kong, our businesses are materially affected by the financial markets and economic conditions in Hong Kong, China, and elsewhere in the world. Escalations of the tensions that affect trade relations may lead to slower growth in the global economy in general, which in turn could negatively affect our clients' businesses and materially reduce demand for our services, thus potentially negatively affect our business, financial condition, and results of operations.
We may be subject to legal and financial liabilities in connection with the retail financial advisory and insurance brokerage businesses we engaged in previously.
Prior to 2015, we engaged in retail financial advisory and insurance brokerage businesses, which were regulated by the Hong Kong Confederation of Insurance Brokers and the HKSFC. On 23 September 2019, the Hong Kong Insurance Authority took over the regulation of insurance intermediaries from the Hong Kong Confederation of Insurance Brokers.Majority of the operations under such legacy businesses began to terminate in 2015 and the businesses were ultimately disposed of in 2018. Although we no longer carry out retail financial advisory and insurance brokerage businesses, we may be subject to regulatory complaints or claims lodged against us by previous clients in relation to the past services provided by us under the legacy businesses as we were the named insurance broker in certain insurance arrangements between our previous clients and the insurance company under these past businesses. Any action brought against us, with or without merits, may result in administrative measures, settlements, injunctions, fines, penalties, negative publicities, or other results adverse to us, which could have a material adverse effect on our reputation, business, financial condition, results of operations, and prospects. Even if we are successful in defending ourselves against these actions, the costs of such defence may be significant.
We may need additional funding but may not be able to obtain it on favorable terms or at all.
We may require additional funding for further growth and development of our business, including any investments or acquisitions we may decide to pursue. If our existing resources are insufficient to satisfy our requirements, we may seek to issue additional equity or debt securities or obtain new or expanded credit facilities. Our ability to obtain external financing in the future is subject to a variety of uncertainties, including our future financial condition, results of operations, cash flows, share price performance, liquidity of international capital and lending markets, and the Hong Kong financial industry. Pursuant to the terms of the medium term notes issued by our Controlling Shareholder, so long as the notes remain outstanding, our Controlling Shareholder will not and will ensure that none of its subsidiaries, including us, create or have outstanding any mortgage, charge, lien, pledge, or other security interest, upon the whole or any part of its present or future undertaking, assets, or revenues to secure any indebtedness in the form of bonds, notes, debentures, loan stock, or other securities that are, or are intended to be, listed or traded on any stock exchange or over-the-counter or other securities market. This provision may affect our ability to obtain external financing through the issuance of debt securities in the public market. In addition, incurring indebtedness would subject us to increased debt service obligations and could result in operating and financing covenants that would restrict our operations. We cannot assure you that we will be able to secure financing in a timely manner or in amounts or on terms favorable to us, or at all. Any failure to raise needed funds on terms favorable to us, or at all, could severely restrict our liquidity as well as have a material adverse effect on our business, financial condition, and results of operations. Moreover, any issuance of equity or equity-linked securities could result in significant dilution to our existing shareholders.
We may be exposed to legal or regulatory liabilities if we are unable to protect the personal and sensitive data and confidential information of our clients.
We collect, store, and process certain personal and sensitive data from our clients, particularly under our asset management business. We are required to protect the personal and sensitive data and confidential information of our clients under applicable laws, rules, and regulations. While we have taken steps to protect the personal and sensitive data and confidential information of clients that we have access to, our security measures could be breached. The relevant authorities may impose sanctions or issue orders against us if we fail to protect the personal and sensitive data and confidential information of our clients, and we may have to compensate our clients if we fail to do so. We routinely transmit and receive personal and sensitive data and confidential information of our clients through the internet and other electronic means. Any misuse or mishandling of such personal and sensitive data and confidential information could result in legal liabilities, regulatory actions, reputational damage to us, which could in turn materially and adversely affect our business, financial condition, and results of operations.
If our insurance coverage is insufficient, we may be subject to significant costs and business disruption.
Although we carry office, computer, and vehicle insurance for our properties, professional indemnity insurance for certain of our regulated activities, directors and officers insurance, employee compensation insurance, and license holders insurance in connection with our securities dealing business covered by the Type 1 license granted by the HKSFC against fidelity and crime risks, we cannot assure you that we have sufficient insurance to cover all aspects of our business operations. We are in the process of purchasing key-man insurance coverage, and we consider our insurance coverage to be reasonable in light of the nature of our business, but we cannot assure you that our insurance coverage is sufficient to prevent us from any loss or that we will be able to successfully claim our losses under our current insurance policies on a timely basis, or at all. If we incur any loss that is not covered by our insurance policies, or the compensated amount is significantly less than our actual loss, our business, financial condition, and results of operations could be materially and adversely affected.
If we fail to maintain an effective system of internal control over financial reporting, we may be unable to accurately report our results of operations, meet our reporting obligations, or prevent fraud.
We are a public company in the United States and subject to the reporting requirements of the Exchange Act, the Sarbanes-Oxley Act of 2002 and the rules and regulations of the NYSE. Section 404 of the Sarbanes-Oxley Act, or Section 404, will require us to include a report from management on the effectiveness of our internal control over financial reporting in our annual report on Form 20-F beginning with our annual report for the fiscal year ending 31 December 2020. In addition, once we cease to be an "emerging growth company" as such term is defined in the JOBS Act, our independent registered public accounting firm must attest to and report on the effectiveness of our internal control over financial reporting. Our management may conclude that our internal control over financial reporting is not effective. Moreover, even if our management concludes that our internal control over financial reporting is effective, our independent registered public accounting firm, after conducting its own independent testing, may issue an adverse report if it is not satisfied with our internal control or the level at which our control is documented, designed, operated, or reviewed, or if it interprets relevant requirements differently from us.
In addition, our internal control over financial reporting will not prevent or detect all errors and all fraud. A control system, no matter how well designed and operated, can provide only reasonable, not absolute, assurance that the control system's objectives will be met. Because of the inherent limitations in all control systems, no evaluation of controls can provide absolute assurance that misstatements due to error or fraud will not occur or that all control issues and instances of fraud will be detected.
During the course of documenting and testing of our internal control procedures, in order to satisfy the requirements of Section 404, we may identify other weaknesses and deficiencies in our internal control over financial reporting. In addition, if we fail to maintain proper and effective of our internal control over financial reporting, as these standards are modified, supplemented, or amended from time to time, we may not be able to conclude on an ongoing basis that we have effective internal control over financial reporting in accordance with Section 404. If we fail to achieve and maintain an effective internal control environment, we could suffer material misstatements in our financial statements and fail to meet our reporting obligations, which would likely cause investors to lose confidence in our reported financial information. This could in turn limit our access to capital markets, harm our results of operations, and lead to a decline in the trading price of our Class A Shares. Additionally, ineffective internal control over financial reporting could expose us to increased risk of fraud or misuse of corporate assets and subject us to potential delisting from the stock exchange on which we list, regulatory investigations, and civil or criminal sanctions. We may also be required to restate our financial statements from prior periods.
We may face intellectual property infringement claims, which could be time-consuming and costly to defend and may result in the loss of significant rights by us.
Although we have not been subject to any litigation, pending or threatened, alleging infringement of third parties' intellectual property rights, we cannot assure you that such infringement claims will not be asserted against us in the future. Third parties may own copyrights, trademarks, trade secrets, ticker symbols, internet content, and other intellectual properties that are similar to ours in jurisdictions where we currently have no active operations. If we expand our business to or engage in other commercial activities in those jurisdictions using our own copyrights, trademarks, trade secrets, and internet content, we may not be able to use these intellectual properties or face potential lawsuits from those third parties and incur substantial losses if we fail to defend ourselves in those lawsuits. We have policies and procedures in place to reduce the likelihood that we or our employees may use, develop, or make available any content or applications without the proper licenses or necessary third-party consents. However, these policies and procedures may not be effective in completely preventing the unauthorized posting or use of copyrighted material or the infringement of other rights of third parties.
Intellectual property litigation is expensive and time-consuming and could divert resources and management attention from the operation of our business. If there is a successful claim of infringement, we may be required to alter our services, cease certain activities, pay substantial royalties and damages to, and obtain one or more licenses from third parties. We may not be able to obtain those licenses on commercially acceptable terms, or at all. Any of those consequences could cause us to lose revenues, impair our client relationships and harm our reputation.
Any failure to protect our intellectual property could harm our business and competitive position.
We maintain a number of registered domain names and, although we do not currently own any registered trademarks, we may in the future acquire new intellectual property such as trademarks, copyrights, domain names, and know-how. We will rely on a combination of intellectual property laws and contractual arrangements to protect our intellectual property rights. It is possible that third parties may copy or otherwise obtain and use our trademarks without authorization or otherwise infringe on our rights. We may not be able to successfully pursue claims for infringement that interfere with our ability to use our trademarks, website, or other relevant intellectual property or have adverse impact on our brand. We cannot assure you that any of our intellectual property rights would not be challenged, invalidated, or circumvented, or such intellectual property will be sufficient to provide us with competitive advantages. In addition, other parties may misappropriate our intellectual property rights, which would cause us to suffer economic or reputational damages.
The audit report included in this Introductory Document is prepared by an auditor whose work may not be inspected fully by the Public Company Accounting Oversight Board and, as such, you may be deprived of the benefits of such inspection.
Our independent registered public accounting firm that issues the audit report included in this Introductory Document, as auditors of companies that are traded publicly in the United States and a firm registered with the U.S. Public Company Accounting Oversight Board, or the PCAOB, is required by the laws of the United States to undergo regular inspections by the PCAOB to assess its compliance with the laws of the United States and professional standards.
Our auditors have many clients with substantial operations in China, and the PCAOB has been unable to conduct inspections of the work of our auditors and their affiliated independent registered public accounting firms in China, without the approval of the PRC authorities. Thus, our auditors and their affiliated independent registered public accounting firms in China and their audit work are not currently inspected fully by the PCAOB. In May 2013, the PCAOB announced that it had entered into a Memorandum of Understanding on Enforcement Cooperation with the China Securities Regulatory Commission, or the CSRC, and the PRC Ministry of Finance, which establishes a cooperative framework between the parties for the production and exchange of audit documents relevant to investigations undertaken by the PCAOB, the CSRC, or the PRC Ministry of Finance in the United States and China, respectively. The PCAOB continues to be in discussions with the CSRC and the PRC Ministry of Finance to permit joint inspections in China of audit firms that are registered with the PCAOB and audit China-based, U.S.-listed companies. On 7 December 2018, the SEC and the PCAOB issued a joint statement highlighting continued challenges faced by the U.S. regulators in their oversight of financial statement audits of U.S.-listed companies with significant operations in China. However, it remains unclear what further actions, if any, the SEC and PCAOB will take to address the problem.
Inspections of other firms that the PCAOB has conducted outside of China have identified deficiencies in those firms' audit procedures and quality control procedures, which may be addressed as part of the inspection process to improve future audit quality. The lack of PCAOB inspections in China prevents the PCAOB from regularly evaluating our auditors' audit procedures and quality control procedures as they relate to their work, and their affiliated independent registered public accounting firms' work, in China. As a result, investors may be deprived of the benefits of such regular inspections.
The inability of the PCAOB to conduct full inspections of auditors in China makes it more difficult to evaluate the effectiveness of our auditors' audit procedures and quality control procedures as compared to auditors who primarily work in jurisdictions where the PCAOB has full inspection access. Investors may lose confidence in our reported financial information and procedures and the quality of our financial statements.
Fluctuations in the value of Renminbi and regulatory controls on the convertibility and offshore remittance of Renminbi may adversely affect our results of operations and financial condition.
Many of our clients are Chinese nationals, institutions, or corporates, and they are subject to the relevant controls of the PRC government as well as risks relating to foreign currency exchange rate fluctuations. The change in value of Renminbi against Hong Kong dollars and other currencies is affected by various factors, such as changes in political and economic conditions in China. Any significant revaluation of Renminbi may materially and adversely affect the cash flows, revenues, earnings, and financial position of our Chinese clients. In addition, the PRC government imposes controls on the convertibility of Renminbi into foreign currencies and, in certain cases, currency remittance out of China. Since 2016, the PRC government has tightened its foreign exchange policies and stepped up its scrutiny of outbound capital movement. In addition, under the existing regulations on offshore investment, approval from or registration with appropriate government authorities is required when Renminbi is to be converted into foreign currency for the purpose of offshore investment. Revaluation of the Renminbi and PRC laws and regulations in connection with the convertibility of the Renminbi into foreign currencies or offshore remittance of the Renminbi may limit the ability of our Chinese clients to engage our services, especially in our asset management business, which may in turn have a material adverse effect on our results of operations and financial condition.
We may be affected by the currency peg system in Hong Kong.
Since 1983, Hong Kong dollars have been pegged to the U.S. dollars at the rate of approximately HK$7.80 to US$1.00. We cannot assure you that this policy will not be changed in the future. If the pegging system collapses and Hong Kong dollars suffer devaluation, the Hong Kong dollar cost of our expenditures denominated in foreign currency may increase. This would in turn adversely affect the operations and profitability of our business.
Increases in labor costs may adversely affect our business and results of operations.
The economy in Hong Kong and globally has experienced general increases in inflation and labor costs in recent years. As a result, average wages in Hong Kong and certain other regions are expected to continue to increase. In addition, we are required by Hong Kong laws and regulations to pay various statutory employee benefits, including mandatory provident fund to designated government agencies for the benefit of our employees. The relevant government agencies may examine whether an employer has made adequate payments to the statutory employee benefits, and those employers who fail to make adequate payments may be subject to fines and other penalties. We expect that our labor costs, including wages and employee benefits, will continue to increase. Unless we are able to control our labor costs or pass on these increasing labor costs, our financial condition and results of operations may be adversely affected.
We may incur losses or experience disruption of our operations as a result of unforeseen or catastrophic events, including the emergence of a pandemic, terrorist attacks, or natural disasters.
Our business could be materially and adversely affected by catastrophic events or other business continuity problems, such as natural or man-made disasters, pandemics, war, riots, terrorist attacks, or other public safety concerns. If we were to experience a natural or man-made disaster, disruption due to political unrest, or disruption involving electronic communications or other services used by us or third parties with which we conduct business, our operations will partially depend on the availability of our people and office facilities and the proper functioning of our computer, software, telecommunications, transaction processing, and other related systems. A disaster or a disruption in the infrastructure that supports our businesses, a disruption involving electronic communications or other services used by us or third parties with whom we conduct business, or a disruption that directly affects our headquarters, could have a material adverse impact on our ability to continue to operate our business without interruption. Our business could also be adversely affected if our employees are affected by pandemics, including various outbreaks of various public health epidemics. Furthermore, any future outbreak may restrict economic activities in affected regions, resulting in reduced business volume, temporary closure of our offices or otherwise disrupt our business operations and adversely affect our results of operations. In addition, our results of operations could be adversely affected to the extent that any pandemic harms the Chinese or Hong Kong economy in general. The incidence and severity of disasters, pandemics or other business continuity problems are unpredictable, and our inability to timely and successfully recover could materially disrupt our businesses and cause material financial loss, regulatory actions, reputational harm, or legal liability.
Risks Relating to the Restructuring and Our Relationship with the Controlling Shareholder
We have a relatively short history operating as a stand-alone public company.
AMTD International Inc. was incorporated on 4 February 2019 as a wholly-owned subsidiary of our Controlling Shareholder. Our Controlling Shareholder provides us with financial, administrative, human resources, and legal services, and also has provided us with the services of a number of its executives and employees.
In addition, since we became a public company, our management team has been developing the expertise necessary to comply with the numerous regulatory and other requirements applicable to public companies, including requirements relating to corporate governance, listing standards and securities and investor relationships issues. As a stand-alone public company, our management had to evaluate our internal controls system with new thresholds of materiality, and implement necessary changes to our internal controls system. We cannot guarantee that we will be able to do so in a timely and effective manner.
Our financial information included in this Introductory Document may not be representative of our financial condition and results of operations if we had been operating as a stand-alone company.
Prior to our establishment, the operations of our investment banking, asset management, and strategic investments businesses were carried out by companies owned or controlled by our Controlling Shareholder. For all periods presented, our consolidated financial statements include all assets, liabilities, revenues, expenses, and cash flows that were directly attributable to our investment banking, asset management, and strategic investment businesses whether held or incurred by our Controlling Shareholder or by us. Only those assets and liabilities that are specifically identifiable to our businesses are included in our consolidated statements of financial position. With respect to costs of operations of the investment banking, asset management, and strategic investment businesses, an allocation of certain costs and expenses of our Controlling Shareholder were also included. Up to 20 June 2019, these allocations were made using a proportional cost allocation method by considering the proportion of revenues and actual usage metrics, among other things attributable to us for all respective accounting periods; since 20 June 2019, we entered into a Transition Services Agreement with our Controlling Shareholder and received administrative support, marketing and branding support and other services from our Controlling Shareholder at a fixed cost of HK$24 million per annum plus other actual costs incurred arising from the services rendered. We made numerous estimates, assumptions, and allocations in our historical financial statements because our Controlling Shareholder did not account for us, and we did not operate as a stand-alone company for any period prior to our initial public offering on the NYSE. Although our management believes the assumptions underlying our financial statements and the above allocations are reasonable, our financial statements may not necessarily reflect our results of operations, financial position, and cash flows as if we operated as a stand-alone public company during the periods presented. See the section entitled "Share Capital and Shareholders — Our Relationship with AMTD Group Company Limited" for our arrangements with our Controlling Shareholder and "Management's Discussion and Analysis of Financial Condition and Results of Operations" and the notes to our consolidated financial statements included elsewhere in this Introductory Document for our historical cost allocation. In addition, since we have become a stand-alone public company, we have gradually established our own financial, administrative, and other support systems to replace our Controlling Shareholder's systems, the cost of which is significantly different from cost allocation with our Controlling Shareholder for the same services. In addition, our consolidated financial statements for FY2017, FY2018, and 9M2019 are the only consolidated financial statements that we have prepared in accordance with IFRS. Therefore, you should not view our historical results as indicators of our future performance.
We may not continue to receive the same level of support from our Controlling Shareholder.
We have benefitted significantly from our Controlling Shareholder's strong market position and brand recognition, as well as its expertise in investment banking, asset management, and strategic investment businesses. Although we entered into a series of agreements with our Controlling Shareholder relating to our ongoing business operations and service arrangements with our Controlling Shareholder, we cannot assure you we will continue to receive the same level of support from our Controlling Shareholder. Our current clients may react negatively to our restructuring. This effort may not be successful, which could materially and adversely affect our business, financial condition, and results of operations.
Our agreements with our Controlling Shareholders or any of its controlling shareholders may be less favorable to us than similar agreements negotiated between unaffiliated third parties. In particular, our non-competition agreement with our Controlling Shareholder limits the scope of business that we are allowed to conduct.
We entered into a series of agreements with our Controlling Shareholder and the terms of such agreements may be less favorable to us than would be the case if they were negotiated with unaffiliated third parties. Please see the section entitled "Share Capital and Shareholders – Our Relationship with AMTD Group Company Limited" for further details. In particular, under the non-competition agreement we entered into with our Controlling Shareholder, we agree during the non-competition period (which will end on the later of (1) two years after the first date when our Controlling Shareholder ceases to own in aggregate at least 20% of the voting power of our then outstanding securities and (2) the fifth anniversary of the completion of 5 August 2019, being the date of the initial public offering of the ADSs on the NYSE) not to compete with our Controlling Shareholder in the businesses currently conducted by our Controlling Shareholder, except that we may (i) continue to provide to our existing individual clients investment banking and asset management products and services, and (ii) own non-controlling equity interest (i.e. an equity interest below 50%) in any company competing with our Controlling Shareholder. Such contractual limitations significantly affect our ability to diversify our revenue sources and may materially and adversely impact our business and prospects should the growth of our businesses slow down. In addition, pursuant to our master transaction agreement with our Controlling Shareholder, we have agreed to indemnify our Controlling Shareholder for liabilities arising from litigation and other contingencies related to our business and assumed these liabilities as part of our restructuring. See the section entitled "Share Capital and Shareholders — Our relationship with AMTD Group Company Limited – Master Transaction Agreement" for further details. The allocation of assets and liabilities between our Controlling Shareholder and our Company may not reflect the allocation that would have been reached by two unaffiliated parties.
Moreover, so long as our Controlling Shareholder continues to control us, we may not be able to bring a legal claim against our Controlling Shareholder or its controlling shareholders in the event of contractual breach, notwithstanding our contractual rights under the agreements described above and other inter-company agreements entered into from time to time.
We are a "controlled company" within the meaning of the NYSE Listed Company Manual and, as a result, can rely on exemptions from certain corporate governance requirements that provide protection to shareholders of other companies.
Our Controlling Shareholder continues to control a majority of the voting power of our issued outstanding ordinary shares. As a result, we are a "controlled company" within the meaning of the NYSE Listed Company Manual. Under these rules, a listed company of which more than 50% of the voting power for the election of directors is held by an individual, group, or another company is a "controlled company" and will be permitted to elect not to comply with certain corporate governance requirements, including the requirement that a majority of the board of directors consist of independent directors, the requirement that we have a Nominating and Corporate Governance Committee that is composed entirely of independent directors, and the requirement that we have a Compensation Committee that is composed entirely of independent directors. As we have and may continue to rely on some or all of the exemptions available to issuers like us, our shareholders may not have the same protections afforded to stockholders of companies that are subject to all of the corporate governance requirements of the NYSE.
We may have conflicts of interest with our Controlling Shareholders or any of its controlling shareholders and, because of our Controlling Shareholder's controlling ownership interest in our company, we may not be able to resolve such conflicts on terms favorable to us.
Our Controlling Shareholder beneficially owns 79.1% of our outstanding ordinary shares, representing 96.6% of our total voting power. Accordingly, our Controlling Shareholder may have significant influence in determining the outcome of any corporate actions or other matters that require shareholder approval, such as mergers, consolidations, change of our name, and amendments of our Memorandum and Articles of Association.
The concentration of ownership and voting power may cause transactions to occur in a way that may not be beneficial to you as a holder of our Class A Shares and may prevent us from doing transactions that would be beneficial to you. Conflicts of interest may arise between our Controlling Shareholder or any of its controlling shareholders and us in a number of areas relating to our past and ongoing relationships. Potential conflicts of interest that we have identified include the following:
· | Indemnification arrangements with our Controlling Shareholder. We entered into a master transaction agreement under which we agree to indemnify our Controlling Shareholder with respect to lawsuits and other matters relating to our investment banking and asset management businesses, including operations of those businesses when we were a private company and a subsidiary of our Controlling Shareholder. There are no exceptions for such indemnities and such indemnifications relate to transactions that had taken place prior to, on and following, our restructuring and listing on the NYSE (as we and the Controlling Shareholder have obligations, based on the master transaction agreement, that continue after our listing on the NYSE). These indemnification arrangements could result in our having interests that are adverse to those of our Controlling Shareholder, for example, with respect to settlement arrangements in litigation. In addition, under these arrangements, we agreed to reimburse our Controlling Shareholder for liabilities incurred (including legal defense costs) in connection with any third-party claim if it is ultimately determined that we are obligated to indemnify our Controlling Shareholder with respect to such third-party claim. There is no limit on such amount of indemnity under the master transaction agreement. Please see the section entitled "Share Capital and Shareholders – Our Relationship with AMTD Group Company Limited" for further details. |
| |
· | Non-competition arrangements with our Controlling Shareholder. We entered into a non-competition agreement under which our Controlling Shareholder agrees not to compete with us in our investment banking and asset management businesses that are both primarily targeting institutional and corporate clients, except for owning non-controlling equity interest (i.e. an equity interest below 50%) in any company competing with us. We agreed not to compete with our Controlling Shareholder in businesses currently conducted by our Controlling Shareholder, except that we may (i) continue to provide investment banking and asset management products and services to our existing individual clients, and (ii) own non-controlling equity interests in any company competing with our Controlling Shareholder. Please see the section entitled "Share Capital and Shareholders – Our Relationship with AMTD Group Company Limited" for further details. |
| |
· | Employee recruiting and retention. Because both we and our Controlling Shareholder are engaged in financial service-related businesses in Hong Kong, we may compete with our Controlling Shareholder in the hiring of new employees. We entered into a non-competition agreement and have a non-solicitation arrangement with our Controlling Shareholder that restricts us and our Controlling Shareholder from hiring any of each other's employees. |
| |
· | Our board members or executive officers may have conflicts of interest. Our Chairman of the Board and Chief Executive Officer, Calvin Choi, is also the chairman of the board and the chief executive officer of our Controlling Shareholder. Four of our other Directors also serve as directors of or hold executive positions with our Controlling Shareholder or its controlling shareholder, and two of our officers serves important positions with our Controlling Shareholder. As a result, they may not have sufficient capacity to perform their duties in our company. These overlapping relationships could create, or appear to create, conflicts of interest when these persons are faced with decisions with potentially different implications for our Controlling Shareholder and us. |
| |
· | Sale of shares or assets in our company. Subject to certain restrictions under relevant securities laws and stock exchange rules, as well as other relevant restrictions, our Controlling Shareholder may decide to sell all or a portion of our shares that it holds to a third-party, including to one of our competitors, thereby giving that third-party substantial influence over our business and our affairs. In addition, our Controlling Shareholder may decide, or be obligated under any of its applicable debt covenant, to sell all or a portion of our shares or our assets in the event of default of our Controlling Shareholder or any of its controlling shareholders under any applicable debt or other obligations or otherwise becomes insolvent. Such a sale of our shares or our assets could be contrary to the interests of our employees or our other shareholders. In addition, our Controlling Shareholder may also discourage, delay, or prevent a change in control of our company, which could deprive our shareholders of an opportunity to receive a premium for their shares as part of a sale of our company and might reduce the price of our Class A Shares. |
· | Allocation of business opportunities. Business opportunities may arise that both we and our Controlling Shareholder find attractive, and which would complement our respective businesses. Although we entered into a master transaction agreement under which our Controlling Shareholder agrees not to pursue investment opportunities without first presenting them to us, our Controlling Shareholder may discourage, delay, or prevent a profitable investment opportunity before our Board or shareholders and subsequently decide to pursue investment opportunities or take business opportunities for itself, which would prevent us from taking advantage of those opportunities. These actions may be taken even if they are opposed by our other shareholders. |
| |
· | Developing business relationships with our Controlling Shareholder's competitors. So long as our Controlling Shareholder remains as our controlling shareholder, we may be limited in our ability to do business with its competitors, such as other insurance brokerage companies. This may limit our ability to market our services for the best interests of our Company and our other shareholders. |
| |
· | Although our Company is a stand-alone public company, we intend to continue to operate, for as long as our Controlling Shareholder is our controlling shareholder, as an affiliate of our Controlling Shareholder. Our Controlling Shareholder may from time to time make strategic decisions that it believes are in the best interests of its business as a whole, including our Company. These decisions may be different from the decision that we would have made on our own. Our Controlling Shareholder's decisions with respect to us or our business may be resolved in ways that favor our Controlling Shareholder and therefore our Controlling Shareholder's own shareholders, which may not coincide with the interests of our other shareholders. We may not be able to resolve any potential conflicts, and even if we do so, the resolution may be less favorable to us than if we were dealing with a non-controlling shareholder. Even if both parties seek to transact business on terms intended to approximate those that could have been achieved among unaffiliated parties, this may not succeed in practice. |
Risks Relating to Our Class A Shares and this Introduction
We will not be subject to full regulatory oversight from both the NYSE and SGX-ST after our Secondary Listing and certain rules from the SGX-ST Listing Manual will not apply to us.
As our primary listing is on the NYSE and the listing of our Class A Shares on the SGX-ST is a secondary listing, the NYSE will have primary regulatory oversight over our Company. Under the Listing Manual, a foreign issuer having a secondary listing on the SGX-ST, as is our case, need not comply with the SGX-ST's listing rules, provided that it undertakes to:
· | release all information and documents in English to the SGX-ST at the same time as they are released to the NYSE; |
| |
· | inform the SGX-ST of any issue of additional securities in a class already listed on the SGX-ST and the decision of the NYSE; and |
| |
· | to comply with such other listing rules as may be applied by the SGX-ST from time to time. |
Whilst the SGX-ST has imposed certain conditions on us in connection with the listing of our Introduction Class A Shares on the SGX-ST as stated in the section entitled "Our Listing on the SGX-ST – Conditions of our Listing on the SGX-ST", our compliance with such conditions will nonetheless be less than that required of a company primarily listed on the SGX-ST.
For example, we are also not subject to the continuing disclosure obligations under Chapter 9, 10 and 13 of the Listing Manual but will be subject to the relevant laws and regulations governing listed corporations on the NYSE. As we are not required to comply with Chapter 13 of the Listing Manual, accordingly AMTD CDP Depositors will not be entitled to an exit offer under Rule 1309(1) of the Listing Manual in the event of a delisting from the SGX-ST only. Instead, we will make an announcement on SGXNET at the relevant time informing AMTD CDP Depositors on how they can convert their Class A Shares held through CDP to ADSs held by a broker in United States for trading on the NYSE.
As a company incorporated in the Cayman Islands, we are permitted to adopt certain home country practices in relation to corporate governance matters that differ significantly from the NYSE listing standards and the SGX-ST listing standards, and we are not generally subject to the continuing listing requirements of the SGX-ST and Rule 210(10) of the Listing Manual does not apply to our Company due to our Secondary Listing on the SGX-ST; these practices may afford less protection to shareholders than they would enjoy if we complied fully with the NYSE listing standards or SGX-ST listing standards.
As a Cayman Islands company listed on the NYSE, we are subject to the NYSE listing standards. When we complete our Secondary Listing on the SGX-ST, we will also be subject to certain SGX-ST listing standards. However, we are not generally subject to the continuing listing requirements of the SGX-ST and Rule 210(10) of the Listing Manual does not apply to our Company due to our Secondary Listing on the SGX-ST. The NYSE rules permit a foreign private issuer like us to follow the corporate governance practices of its home country. Similarly, the SGX-ST generally relies on the NYSE to regulate our Company. Certain corporate governance practices in the Cayman Islands, which is our home country, may differ significantly from the NYSE listing standards and the SGX-ST listing standards. If we choose to follow home country practices in the future, our shareholders may be afforded less protection than they would otherwise enjoy under the NYSE listing standards applicable to U.S. domestic issuers or the SGX-ST listing standards applicable to Singapore domestic issuers or foreign issuers with a primary listing on the SGX-ST.
The trading price of our Class A Shares may be volatile, which could result in substantial losses to you.
The trading prices of our Class A Shares are likely to be volatile and could fluctuate widely due to factors beyond our control. This may happen due to broad market and industry factors, such as performance and fluctuation in the market prices or underperformance or deteriorating financial results of other listed companies based in Hong Kong and China. The securities of some of these companies have experienced significant volatility since their initial public offerings, including, in some cases, substantial price declines in the trading prices of their securities. The trading performances of other Hong Kong and Chinese companies' securities after their offerings may affect the attitudes of investors towards Hong Kong-based, U.S.-listed companies, which consequently may affect the trading performance of our Class A Shares, regardless of our actual operating performance. In addition, any negative news or perceptions about inadequate corporate governance practices or fraudulent accounting, corporate structure or matters of other Hong Kong and Chinese companies may also negatively affect the attitudes of investors towards Hong Kong and Chinese companies in general, including us, regardless of whether we have conducted any inappropriate activities. Furthermore, securities markets may from time to time experience significant price and volume fluctuations that are not related to our operating performance, which may have a material and adverse effect on the trading price of our Class A Shares.
In addition to the above factors, the price and trading volume of our Class A Shares may be highly volatile due to multiple factors, including the following:
· | regulatory developments affecting us or our industry; |
| |
· | variations in our revenue, profit, and cash flow; |
| |
· | changes in the economic performance or market valuations of other financial services firms; |
| |
· | actual or anticipated fluctuations in our quarterly results of operations and changes or revisions of our expected results; |
| |
· | changes in financial estimates by securities research analysts; |
| |
· | detrimental negative publicity about us, our services, our officers, Directors, Controlling Shareholder, other beneficial owners, our business partners, or our industry; |
| |
· | announcements by us or our competitors of new service offerings, acquisitions, strategic relationships, joint ventures, capital raisings or capital commitments; |
| |
· | additions to or departures of our senior management; |
| |
· | litigation or regulatory proceedings involving us, our officers, Directors, or Controlling Shareholders; |
| |
· | release or expiry of lock-up or other transfer restrictions on our outstanding shares or our Class A Shares; and |
| |
· | sales or perceived potential sales of additional ordinary shares or Class A Shares. |
Any of these factors may result in large and sudden changes in the volume and price at which our Class A Shares trade.
In the past, shareholders of public companies have often brought securities class action suits against those companies following periods of instability in the market price of their securities. If we were involved in a class action suit, it could divert a significant amount of our management's attention and other resources from our business and operations and require us to incur significant expenses to defend the suit, which could harm our results of operations. Any such class action suit, whether or not successful, could harm our reputation and restrict our ability to raise capital in the future. In addition, if a claim is successfully made against us, we may be required to pay significant damages, which could have a material adverse effect on our financial condition and results of operations.
If securities or industry analysts do not publish or publish inaccurate or unfavorable research about our business, or if they adversely change their recommendations regarding our Class A Shares, the market price for our Class A Shares and trading volume could decline.
The trading market for our Class A Shares will depend in part on the research and reports that securities or industry analysts publish about us or our business. If research analysts do not establish and maintain adequate research coverage or if one or more of the analysts who covers us downgrades our Class A Shares or publishes inaccurate or unfavorable research about our business, the market price for our Class A Shares would likely decline. If one or more of these analysts cease coverage of our company or fail to publish reports on us regularly, we could lose visibility in the financial markets, which, in turn, could cause the market price or trading volume for our Class A Shares to decline.
The sale or availability for sale of substantial amounts of our Class A Shares in the public market could adversely affect their market price.
Sales of substantial amounts of our Class A Shares in the public market, or the perception that these sales could occur, could adversely affect the market price of our Class A Shares and could materially impair our ability to raise capital through equity offerings in the future. There are 23,873,655 ADSs (equivalent to 23,873,655 Class A Shares) outstanding as at the date of this Introduction. We cannot predict what effect, if any, market sales of securities held by our significant shareholders or any other shareholder or the availability of these securities for future sale will have on the market price of our Class A Shares.
Our dual-class share structure with different voting rights limit your ability to influence corporate matters and could discourage others from pursuing any change of control transactions that holders of our Class A Shares may view as beneficial.
Under our dual-class share structure, our ordinary shares consist of Class A Shares and Class B ordinary shares. In respect of matters requiring the votes of shareholders, holders of Class B ordinary shares will be entitled to 20 votes per share, while holders of Class A Shares will be entitled to one (1) vote per share based on our dual-class share structure. Each Class B ordinary share is convertible into one Class A Share at any time by the holder thereof, while Class A Shares are not convertible into Class B ordinary shares under any circumstances. Upon any sale, transfer, assignment, or disposition of any Class B ordinary shares by a holder thereof to any person other than our Chairman of the Board and Chief Executive Officer, Calvin Choi, or any other person or entity designated by Calvin Choi, such Class B ordinary shares are automatically and immediately converted into an equal number of Class A Shares.
As at the date of this Introductory Document, our Controlling Shareholder and Infinity Power Investments Limited ("Infinity Power") beneficially own all of our issued and outstanding Class B ordinary shares. These Class B ordinary shares constitute approximately 81.0% of our total issued and outstanding ordinary shares as at the date of this Introductory Document and 98.8% of the aggregate voting power of our total issued and outstanding ordinary shares due to the disparate voting powers associated with our dual-class share structure. See the section entitled "Share Capital and Shareholders". As a result of the dual-class share structure and the concentration of ownership, holders of Class B ordinary shares will have considerable influence over matters such as decisions regarding mergers, consolidations and the sale of all or substantially all of our assets, election of directors and other significant corporate actions. Such holders may take actions that are not in the best interest of us or our other shareholders. This concentration of ownership may discourage, delay or prevent a change in control of our Company, which could have the effect of depriving our other shareholders of the opportunity to receive a premium for their shares as part of a sale of our Company and may reduce the price of our Class A Shares. This concentrated control will limit your ability to influence corporate matters and could discourage others from pursuing any potential merger, takeover or other change of control transactions that holders of Class A Shares may view as beneficial.
The dual-class structure of our ordinary shares may adversely affect the trading market for our Class A Shares.
S&P Dow Jones and FTSE Russell have recently announced changes to their eligibility criteria for inclusion of shares of public companies in certain indices, including the S&P 500, to exclude companies with multiple classes of shares and companies whose public shareholders hold no more than 5% of total voting power from being added to such indices. In addition, several shareholder advisory firms have announced their opposition to the use of multiple class capital structures. As a result, the dual class structure of our ordinary shares may prevent the inclusion of our Class A Shares in such indices and may cause shareholder advisory firms to publish negative commentary about our corporate governance practices or otherwise seek to cause us to change our capital structure. Any such exclusion from indices could result in a less active trading market for our Class A Shares. Any actions or publications by shareholder advisory firms critical of our corporate governance practices or capital structure could also adversely affect the value of our Class A Shares.
The Introduction may not result in an active or liquid market on the SGX-ST for our Class A Shares.
As at the date hereof, there is no public market for our Class A Shares in Singapore. We have received an eligibility-to-list letter from the SGX-ST to have our Introduction Class A Shares listed on the SGX-ST. However, prior to our Company conducting fund-raising through an offering of Class A Shares in the future ("Future Fundraising") (with such Class A Shares to be held through CDP) the ADS on the NYSE will need to be cancelled and withdrawn for delivery of Class A Shares to enable transfer to the CDP for trading of our Class A Shares on the SGX-ST. Further, in the event of Future Fundraising, only when our Company has (i) filed a registration statement with the SEC that has been declared or become effective; and (ii) submitted a supplemental listing application to NYSE for approval, can such Class A Shares be converted to ADSs for trading on NYSE, subject to compliance with applicable U.S. securities laws. In addition, listing and quotation of our Class A Shares also does not guarantee that a trading market for our Class A Shares on the SGX-ST will develop or, if a market does develop further to the aforementioned contemplated transfers or any Future Fundraising, the liquidity of that market for our Class A Shares. Although we currently intend that our Class A Shares will remain listed on the SGX-ST and the NYSE, there is no guarantee of the continued listing of our Class A Shares on the SGX-ST.
Once our Class A Shares are tradable on the SGX-ST, the trading prices of our Class A Shares and/or the ADSs on the SGX-ST and the NYSE, respectively may differ significantly due not only to currency fluctuations but also due to differences in market liquidity for the Class A Shares and/or ADSs respectively, trading participants and investor bases, exchange trading systems, and other factors outside of our control. There is no guarantee that the trading prices of our Class A Shares on the SGX-ST will be equivalent of the trading prices of the ADSs on the NYSE.
The trading prices of our Class A Shares could be subject to fluctuations in response to variations in our results of operations, changes in general economic conditions, changes in accounting principles or other developments affecting us, our clients or our competitors, changes in financial estimates by securities analysts, the operating and stock price performance of other companies and other events or factors, many of which are beyond our control. Volatility in the price of our Class A Shares may be caused by factors outside of our control or may be unrelated or disproportionate to our results of operations. It may be difficult to assess our performance against either domestic or international benchmarks.
Because the amount, timing, and whether or not we distribute dividends at all is entirely at the discretion of our Board, you must rely on price appreciation of our Class A Shares for return on your investment.
Although we currently intend to distribute dividends in the future, the amount, timing, and whether or not we actually distribute dividends at all is entirely at the discretion of our Board.
Our Board has complete discretion as to whether to distribute dividends. In addition, our shareholders may by ordinary resolution declare a dividend, but no dividend may exceed the amount recommended by our Board. In either case, all dividends are subject to certain restrictions under the Cayman Islands law, namely that our Company may only pay dividends out of profits or share premium, and provided that in no circumstances may a dividend be paid if this would result in our Company being unable to pay its debts as they fall due in the ordinary course of business. Even if our Board decides to declare and pay dividends, the timing, amount and form of future dividends, if any, will depend on, among other things, our future results of operations and cash flow, our capital requirements and surplus, the amount of distributions, if any, received by us from our subsidiary, our financial condition, contractual restrictions and other factors deemed relevant by our Board. Accordingly, the return on your investment in our Class A Shares will likely depend entirely upon any future price appreciation of our Class A Shares. Our Class A Shares may not appreciate in value or even maintain its price. Investors may not realize a return on their investment in our Class A Shares and they may even lose their entire investment in our Class A Shares.
AMTD CDP Depositors may be diluted as they may not be able to participate in any additional equity fund-raising or rights issue.
We may in the future require additional equity funding after the Introduction and our Shareholders and AMTD CDP Depositors may face dilution of their shareholdings should we issue new Class A Shares and/or ADSs to obtain such equity funding. Furthermore, if we were to conduct a rights issue in United States only, AMTD CDP Depositors may not be able to participate in such a rights issue. Compliance with securities laws or other regulatory provisions in Singapore may prevent us from offering such rights to AMTD CDP Depositors without us incurring substantial additional costs (over and above any requirements we must comply with in the United States) involved in the offering of such rights to AMTD CDP Depositors, including having to lodge an offer information statement with the MAS. If that is the case and ADSs to be issued pursuant to a rights issue in United States only were offered to our Shareholders at a discount, AMTD CDP Depositors will face dilution of their beneficial shareholdings. Please see the section entitled "Clearance and Settlement" for more information for the mechanism for conversion and transfer of Class A Shares trading on the SGX-ST to ADSs for trading on the NYSE to be eligible to participate in corporate actions offered to our Shareholders.
There are exchange rate risks in trading in our Class A Shares and dividends distributed by us may also be affected.
Investors should note that prior to our Company conducting fund-raising through an offering of Class A Shares in Singapore in the future (with such Class A Shares to be held through CDP), the ADS listed on the NYSE will need to be cancelled and withdrawn for delivery of Class A Shares to enable transfer to the CDP for trading of our Class A Shares on the SGX-ST. However, once our Company conducts fund-raising through an offering of Class A Shares in Singapore in the future (with such Class A Shares to be held through CDP), investors will be able to trade our Class A Shares on the SGX-ST and, subject to compliance with applicable laws, rules and regulations, may be able to convert the Class A Shares to ADSs for trading on the NYSE. Please see the section entitled "Clearance and Settlement" for more information. Transactions in the ADSs on the NYSE will be settled in U.S. dollars and transactions in our Class A Shares on the SGX-ST will be settled in Singapore dollars. However, should you sell the ADSs on the NYSE (to be settled in U.S. dollars), and you decide to convert the proceeds from the sale into Singapore dollars, you will be subject to the prevailing exchange rate between the Singapore dollars and the U.S. dollar at the time you convert the proceeds from your sale into Singapore dollars. Any fluctuation in exchange rates of this nature may have an impact on the proceeds which you receive from the sale of your Class A Shares or, if applicable, ADSs.
We will declare and pay dividends in U.S. dollars and CDP will make the necessary arrangements to convert these dividends into Singapore dollars for onward distribution to AMTD CDP Depositors whose Class A Shares are held through CDP. Any fluctuation in exchange rates of this nature may have an impact on distribution which you receive from the dividends we have declared. All AMTD CDP Depositors will receive the distributions in Singapore dollar equivalent of the U.S. dollar distribution declared, unless you elect to receive the relevant distribution in U.S. dollars by submitting the Currency Election Notice. Please see the section entitled "Exchange Rates and Exchange Controls" and "Dividends" for more information.
Although the ADSs are currently listed on the NYSE, there is no assurance that the ADSs will remain listed on either the NYSE or that our Class A Shares will remain listed on the SGX-ST.
There is no assurance of the continued listing of the ADSs on the NYSE or our Class A Shares on the SGX-ST. We may not be able to continue to satisfy the NYSE listing requirements as well as other relevant rules, regulations and laws in Singapore or in United States, which may result in the ADSs being suspended for trading or delisted on the NYSE. Our eligibility-to-list on the SGX-ST is conditional upon, among other things, the maintenance of our primary listing on the NYSE. Thus, in the event that the ADSs are removed from trading on the NYSE, there is no assurance that our Class A Shares will remain listed on the Official List of the SGX-ST. If the ADSs are suspended from quotation on, or removed from trading on the NYSE and/or our Class A Shares from the SGX-ST, Shareholders and AMTD CDP Depositors, as the case may be, will not be able to trade their ADSs on the NYSE and/or their Class A Shares on the SGX-ST and there is no assurance that ADSs holders and AMTD CDP Depositors will be entitled to compensation or an exit offer, or should they be so entitled, that ADSs holders and AMTD CDP Depositors will receive realisation for their investments that they would have been able to obtain through trading their ADSs on the NYSE or their Class A Shares on the SGX-ST. If the ADS remain listed on the NYSE but our Class A Shares are removed from the Official List of the SGX-ST and in the event that there is no exit offer or that AMTD CDP Depositors choose not to accept an exit offer, AMTD CDP Depositors whose Class A Shares are listed on the Official List of the SGX-ST may have to convert their Class A Shares to ADSs on the NYSE for disposal or trading. Please see the section entitled "Clearance and Settlement" for information on the ADS-Class A Share conversion and trading between the NYSE and the SGX-ST.
Investors may face risks from the conversion of ADSs to Class A Shares or from Class A Shares to ADSs for trading between the SGX-ST and the NYSE.
The ADSs are currently traded on the NYSE. Subject to compliance with U.S. securities laws and the terms of the Deposit Agreement, holders of our Class A Shares may deposit Class A Shares with the ADS Depositary for delivery of the ADSs. Any holder of ADSs may also cancel ADSs to withdraw the Class A Shares underlying the ADSs pursuant to the terms of the Deposit Agreement for trading on the SGX-ST subsequently. In the event that a substantial number of Class A Shares listed on SGX-ST are deposited with the ADS Depositary for delivery of the ADSs subject to compliance with U.S. securities laws, the liquidity and trading price of our Class A Shares on the SGX-ST may be adversely affected.
Investors should note that prior to our Company conducting fund-raising through an offering of Class A Shares in Singapore in the future (with such Class A Shares to be held through CDP), the ADS listed on the NYSE will need to be cancelled and withdrawn for delivery of Class A Shares to enable transfer to the CDP for trading of our Class A Shares on the SGX-ST.
There is no assurance that the exchange between Class A Shares and ADSs for trading on the different exchanges will occur in an orderly and timely fashion, there could be disruptions caused to the transfer by a number of factors, including temporary disruptions to trading and technical difficulties. The time required for the exchange between Class A Shares and ADSs might take several business days and be longer than expected and investors might not be able to settle or effect any sale of their securities during this period. Furthermore, investors may incur additional costs (including exchange fees and stamp duty) in the exchange of Class A Shares into ADSs or vice versa.
There is no direct trading or settlement between the NYSE and the SGX-ST on which the ADSs and the Class A Shares are respectively traded. In addition, the time differences between Singapore and New York and unforeseen market circumstances or other factors may delay the deposit of Class A Shares for delivery of ADSs or the withdrawal of Class A Shares underlying the ADSs. Investors will be prevented from settling or effecting the sale of their securities during such periods of delay. In addition, there is no assurance that any exchange of Class A Shares into ADSs (and vice versa) will be completed in accordance with the timelines investors may anticipate.
Furthermore, the ADS Depositary is entitled to charge holders fees for various services including for the issuance of ADSs upon deposit of Class A Shares, cancelation of ADSs, distributions of cash dividends or other cash distributions, distributions of ADSs pursuant to share dividends or other free share distributions, distributions of securities other than ADSs and annual service fees. As a result, shareholders who exchange Class A Shares into ADSs, and vice versa, may not achieve the level of economic return the shareholders may anticipate. Please see the section entitled "Clearance and Settlement" for more information.
Certain judgments obtained against us by our shareholders may not be enforceable.
We are a company incorporated under the laws of the Cayman Islands. We conduct our operations outside the United States and substantially all of our assets are located outside the United States. In addition, substantially all of our Directors and Executive Officers and the experts named in this Introductory Document reside outside the United States, and most of their assets are located outside the United States. As a result, it may be difficult or impossible for you to bring an action against us or against them in the United States in the event that you believe that your rights have been infringed under the U.S. federal securities laws or otherwise. Even if you are successful in bringing an action of this kind, the laws of the Cayman Islands, Hong Kong, or other relevant jurisdiction may render you unable to enforce a judgment against our assets or the assets of our Directors and Executive Officers. For more information regarding the relevant laws of the Cayman Islands and Hong Kong, see the section entitled "Enforceability of Civil Liabilities".
Holders of Class A Shares listed on the SGX-ST cannot initiate or participate in U.S. securities law class actions that ADS holders may bring against us in U.S.
Holders of Class A Shares listed on the SGX-ST cannot initiate or participate in U.S. securities law class actions that ADS holders may bring against us in a U.S. court. Even if there is a valid basis to bring a complaint against us under the U.S. securities laws, holders of Class A Shares listed on the SGX-ST, being purchasers of foreign-listed ordinary shares, cannot bring or join in any lawsuit against our Company, because under the prevailing case law as at the date of this Introductory Document, Securities Act and Exchange Act claims may be brought in the United States only in connection with the purchase or sale of a security listed on an American stock exchange and the purchase or sale of any other security in the United States. See Morrison v. National Australia Bank Ltd., 561 U.S. 247 (2010); In re Royal Bank of Scotland Grp. PLC Sec. Litig., 765 F. Supp. 2d 327 (S.D.N.Y. 2011); and Absolute Activist Value Master Fund Ltd. v. Ficeto, 677 F.3d 60 (2d Cir. 2012).
You may face difficulties in protecting your interests, and your ability to protect your rights through U.S. courts or Singapore courts may be limited, because we are incorporated under Cayman Islands law.
We are a company incorporated under the laws of the Cayman Islands. Our corporate affairs are governed by our Memorandum and Articles of Association, the Companies Law of the Cayman Islands and the common law of the Cayman Islands. The rights of shareholders to take action against our Directors, actions by our minority shareholders and the fiduciary duties of our Directors to us under the Cayman Islands law are to a large extent governed by the common law of the Cayman Islands. The common law of the Cayman Islands is derived in part from comparatively limited judicial precedent in the Cayman Islands as well as from the common law of England, the decisions of whose courts are of persuasive authority, but are not binding, on a court in the Cayman Islands. The Cayman Islands has a less developed body of securities laws than the United States. Some U.S. states, such as Delaware, have more fully developed and judicially interpreted bodies of corporate law than the Cayman Islands. In addition, the Cayman Islands companies may not have standing to initiate a shareholder derivative action in a federal court of the United States.
Certain corporate governance practices in the Cayman Islands, which is our home country, differ significantly from requirements for companies incorporated in other jurisdictions such as the United States or Singapore. Currently, we do not rely on home country practice with respect to our corporate governance, but instead comply with the applicable Corporate Governance Rules of the NYSE Listed Company Manual. We rely on the exemption applicable to controlled companies under the NYSE Listed Company Manual with respect to the requirements that (a) a majority of the board of directors consist of independent directors (under NYSE Listed Company Manual Section 303A.01); (b) we should have a nominating and corporate governance committee that is composed entirely of independent directors (under NYSE Listed Company Manual Section 303A.04); and (c) we should have a compensation committee that is composed entirely of independent directors (under NYSE Listed Company Manual Section 303A.05). However, if we choose to follow home country practice in the future, our shareholders may be afforded less protection than they otherwise would under rules and regulations applicable to U.S. or Singapore domestic issuers.
As a result of all of the above, public shareholders may have more difficulty in protecting their interests in the face of actions taken by our management, members of our Board, or our Controlling Shareholder than they would as public shareholders of a company incorporated in the United States or Singapore.
Our currently effective Memorandum and Articles of Association contain anti-takeover provisions that could discourage a third-party from acquiring us, which could limit our shareholders' opportunity to sell their shares, including Class A Shares represented by the ADSs, at a premium.
Our currently effective Memorandum and Articles of Association contain provisions to limit the ability of others to acquire control of our Company or cause us to engage in change-of-control transactions. These provisions could have the effect of depriving our shareholders of an opportunity to sell their shares at a premium over prevailing market prices by discouraging third parties from seeking to obtain control of our Company in a tender offer or similar transaction. For example, our Board has the authority, without further action by our shareholders, to create and issue new classes or series of shares (including preferred shares) and to fix their designations, powers, preferences, privileges, and relative participating, optional or special rights and the qualifications, limitations or restrictions, including dividend rights, conversion rights, voting rights, terms of redemption and liquidation preferences, any or all of which may be greater than the rights associated with our ordinary shares, in the form of ADSs or otherwise. Preferred shares could be issued quickly with terms calculated to delay or prevent a change in control of our Company or make removal of management more difficult. If our Board decides to issue preferred shares, the price of our Class A Shares may fall and the voting and other rights of the holders of our ordinary shares may be materially and adversely affected.
We are a foreign private issuer within the meaning of the rules under the Exchange Act, and as such we are exempt from certain provisions applicable to U.S. domestic public companies.
Because we qualify as a foreign private issuer under the Exchange Act, we are exempt from certain provisions of the securities rules and regulations in the United States that are applicable to U.S. domestic issuers, including:
· | the rules under the Exchange Act requiring the filing with the SEC of quarterly reports on Form 10-Q or current reports on Form 8-K; |
| |
· | the sections of the Exchange Act regulating the solicitation of proxies, consents, or authorizations in respect of a security registered under the Exchange Act; |
| |
· | the sections of the Exchange Act requiring insiders to file public reports of their stock ownership and trading activities and liability for insiders who profit from trades made in a short period of time; and |
| |
· | the selective disclosure rules by issuers of material non public information under Regulation FD. |
We will be required to file an annual report on Form 20-F within four months of the end of each fiscal year. In addition, we intend to publish our results on a quarterly basis as press releases, distributed pursuant to the rules and regulations of the NYSE. Press releases relating to financial results and material events will also be furnished to the SEC on Form 6-K. However, the information we are required to file with or furnish to the SEC will be less extensive and less timely compared to that required to be filed with the SEC by U.S. domestic issuers. As a result, you may not be afforded the same protections or information that would be made available to you were you investing in a U.S. domestic issuer.
There can be no assurance that we will not be a passive foreign investment company, or PFIC, for United States federal income tax purposes for any taxable year, which could subject United States investors in the ordinary shares to significant adverse United States income tax consequences.
We will be classified as a passive foreign investment company, or PFIC, for any taxable year if either (i) 75% or more of our gross income for such year consists of certain types of "passive" income, or (ii) 50% or more of the value of our assets (determined on the basis of a quarterly average) during such year produce or are held for the production of passive income (the asset test"). Based upon our current and expected income and assets, including goodwill and the value of the assets held by our strategic investment business, we do not presently expect to be classified as a PFIC for the current taxable year and or the foreseeable future.
While we do not expect to be a PFIC, because the value of our assets for purposes of the asset test may be determined by reference to the market price of our Class A Shares, fluctuations in the market price of our Class A Shares may cause us to become a PFIC classification for the current or subsequent taxable years. The determination of whether we will be or become a PFIC will also depend, in part, on the composition and classification of our income, including the relative amounts of income generated by and the value of assets of our strategic investment business as compared to our other businesses. Because there are uncertainties in the application of the relevant rules, it is possible that the IRS may challenge our classification of certain income and assets as non-passive which may result in our being or becoming a PFIC in the current or subsequent years. In addition, the composition of our income and assets will also be affected by how, and how quickly, we use our liquid assets and the cash raised in fund raising exercises. If we determine not to deploy significant amounts of cash for active purposes, our risk of being a PFIC may substantially increase. Because there are uncertainties in the application of the relevant rules and PFIC status is a factual determination made annually after the close of each taxable year, there can be no assurance that we will not be a PFIC for the current taxable year or any future taxable year.
If we are a PFIC in any taxable year, a U.S. Holder (as defined in "Taxation—United States Federal Income Tax Considerations") may incur significantly increased United States income tax on gain recognized on the sale or other disposition of our ordinary shares and on the receipt of distributions on our ordinary shares to the extent such gain or distribution is treated as an "excess distribution" under the United States federal income tax rules, and such holder may be subject to burdensome reporting requirements. Further, if we are a PFIC for any year during which a U.S. Holder holds our ordinary shares, we will generally continue to be treated as a PFIC for all succeeding years during which such U.S. Holder holds our ordinary shares. For more information see the section entitled "Taxation—United States Federal Income Tax Considerations—Passive Foreign Investment Company Rules".
We incurred increased costs as a result of becoming a public company, and will incur increased costs after we cease to qualify as an emerging growth company.
As a result of becoming public company, we incurred significant legal, accounting and other expenses that we did not incur as a private company. The Sarbanes-Oxley Act of 2002 and the rules subsequently implemented by the SEC and the NYSE detailed requirements concerning corporate governance practices of public companies. As a company with less than US$1.07 billion in net revenues for our last fiscal year, we qualify as an "emerging growth company" pursuant to the JOBS Act. An emerging growth company may take advantage of specified reduced reporting and other requirements that are otherwise applicable generally to public companies. These provisions include exemption from the auditor attestation requirement under Section 404 of the Sarbanes-Oxley Act of 2012 relating to internal controls over financial reporting.
We expect these rules and regulations to increase our legal and financial compliance costs and to make some corporate activities more time-consuming and costly. After we are no longer an "emerging growth company", we expect to incur significant expenses and devote substantial management effort toward ensuring compliance with the requirements of Section 404 of the Sarbanes-Oxley Act of 2002 and the other rules and regulations of the SEC. Our management is and may continue to be required to devote substantial time and attention to our public company reporting obligations and other compliance matters. For example, as a result of becoming a public company, we increased the number of independent directors and adopted policies regarding internal controls and disclosure controls and procedures. It is also became more difficult and more expensive for us to obtain director and officer liability insurance, and we were required to accept reduced policy limits and coverage or incur substantially higher costs to obtain the same or similar coverage. In addition, we incurred additional costs associated with our public company reporting requirements. It was also more difficult for us to find qualified persons to serve on our Board or as Executive Officers. We are currently evaluating and monitoring developments with respect to these rules and regulations, and we cannot predict or estimate with any degree of certainty the amount of additional costs we may incur or the timing of such costs.
Risks Relating to the ADS and this Introduction
The risks factors below set out certain risks relating to the ADS only and does not purport to set out all risk factors relating to the ADS, investors should refer to the NYSE Prospectus for the risks relating to holding ADSs in our Company at the point of filing. Investors should note that the NYSE Prospectus is not necessarily indicative of any risks relating to the ADSs after the filing of the NYSE Prospectus. Any information contained in the NYSE Prospectus is not a part of this Introductory Document.
Our currently effective Memorandum and Articles of Association contain anti-takeover provisions that could discourage a third-party from acquiring us, which could limit our shareholders' opportunity to sell their shares, including Class A Shares represented by the ADSs, at a premium.
Our currently effective Memorandum and Articles of Association contain provisions to limit the ability of others to acquire control of our Company or cause us to engage in change-of-control transactions. These provisions could have the effect of depriving our Shareholders of an opportunity to sell their shares at a premium over prevailing market prices by discouraging third parties from seeking to obtain control of our Company in a tender offer or similar transaction. For example, our Board has the authority, without further action by our Shareholders, to create and issue new classes or series of shares (including preferred shares) and to fix their designations, powers, preferences, privileges, and relative participating, optional or special rights and the qualifications, limitations or restrictions, including dividend rights, conversion rights, voting rights, terms of redemption and liquidation preferences, any or all of which may be greater than the rights associated with our ordinary shares, in the form of ADSs or otherwise. Preferred shares could be issued quickly with terms calculated to delay or prevent a change in control of our Company or make removal of management more difficult. If our Board decides to issue preferred shares, the price of the ADSs may fall and the voting and other rights of the holders of the ADSs may be materially and adversely affected.
ADS holders' right to participate in any future rights offerings may be limited, which may cause dilution to the holdings of the ADS holders.
We may from time to time distribute rights to our Shareholders, including rights to acquire our securities. However, we cannot make rights available to the holders of ADS in the United States unless we register both the rights and the securities to which the rights relate under the Securities Act or an exemption from the registration requirement is available. Under the deposit agreement with the ADS Depositary, it will not make rights available to ADS holders unless both the rights and the underlying securities to be distributed to ADS holders are either registered under the Securities Act or exempt from the registration requirement under the Securities Act. We are under no obligation to file a registration statement with respect to any such rights or securities or to endeavor to cause such a registration statement to be declared effective and we may not be able to establish a necessary exemption from registration under the Securities Act. Accordingly, ADS holders may be unable to participate in our rights offerings in the future and may experience dilution in the holdings of ADS holders.
There can be no assurance that we will not be a passive foreign investment company, or PFIC, for United States federal income tax purposes for any taxable year, which could subject United States investors in the ADSs to significant adverse United States income tax consequences.
We will be classified as a passive foreign investment company, or PFIC, for any taxable year if either (i) 75% or more of our gross income for such year consists of certain types of "passive" income, or (ii) 50% or more of the value of our assets (determined on the basis of a quarterly average) during such year produce or are held for the production of passive income. Based upon our current and expected income and assets, including goodwill and the value of the assets held by our strategic investment business, we do not presently expect to be classified as a PFIC for the current taxable year and or the foreseeable future.
While we do not expect to be a PFIC, because the value of our assets for purposes of the asset test may be determined by reference to the market price of the ADSs, fluctuations in the market price of the ADSs may cause us to become a PFIC classification for the current or subsequent taxable years. The determination of whether we will be or become a PFIC will also depend, in part, on the composition and classification of our income, including the relative amounts of income generated by and the value of assets of our strategic investment business as compared to our other businesses. Because there are uncertainties in the application of the relevant rules, it is possible that the IRS may challenge our classification of certain income and assets as non-passive which may result in our being or becoming a PFIC in the current or subsequent years. In addition, the composition of our income and assets will also be affected by how, and how quickly, we use our liquid assets and the cash raised in fund raising exercises. If we determine not to deploy significant amounts of cash for active purposes, our risk of being a PFIC may substantially increase. Because there are uncertainties in the application of the relevant rules and PFIC status is a factual determination made annually after the close of each taxable year, there can be no assurance that we will not be a PFIC for the current taxable year or any future taxable year.
If we are a PFIC in any taxable year, a U.S. Holder (as defined in "Taxation—United States Federal Income Tax Considerations") may incur significantly increased United States income tax on gain recognized on the sale or other disposition of the ADSs and on the receipt of distributions on the ADSs to the extent such gain or distribution is treated as an "excess distribution" under the United States federal income tax rules, and such holder may be subject to burdensome reporting requirements. Further, if we are a PFIC for any year during which a U.S. Holder holds the ADSs, we will generally continue to be treated as a PFIC for all succeeding years during which such U.S. Holder holds the ADSs. For more information see the section entitled "Taxation—United States Federal Income Tax Considerations—Passive Foreign Investment Company Rules".
CAPITALIZATION AND INDEBTEDNESS
The table below sets out our cash and cash equivalents as well as capitalization and indebtedness of our Group as at 31 January 2020, based on our unaudited management accounts.
The information in this table should be read in conjunction with sections in this Introductory Document titled the "Selected Financial Data and Other Data", "Management's Discussion and Analysis of Financial Condition and Results of Operations", and our consolidated historical financial statements and the notes thereto included in this Introductory Document.
| | As at 31 January 2020(1) | |
| | (unaudited) | |
| | HK$ thousands | |
Cash and bank balances | | | 159,360 | |
| | | | |
Current portion of loans and borrowings. | | | 321,775 | |
Secured and guaranteed | | | 321,775 | |
Unsecured and non-guaranteed | | | — | |
Non-current portion of loans and borrowings | | | 116,540 | |
Secured and guaranteed | | | — | |
Unsecured and non-guaranteed | | | 116,540 | |
Total loans and borrowings | | | 438,315 | |
Share capital. | | | 193 | |
Capital reserve | | | 4,551,301 | |
Retained profits | | | 2,277,722 | |
Total equity. | | | 6,829,216 | |
| | | | |
Total capitalization. | | | 7,267,531 | |
_______________
Note:
(1) Indebtedness includes indirect and contingent indebtedness.
There has been no material variances in total indebtedness and total equity as compared to the amounts as at 31 January 2020.
As at the Latest Practicable Date, we do not have any material contingent liabilities.
Our total indebtedness as at 30 September 2019 was HK$321.8 million, consisting of short-term margin loans drawn down from a revolving margin facility agreement with a local Hong Kong financial institution. Under such facility, drawdowns bear interest at a 1.375% mark-up of the prevailing prime interest rate, and have a maturity of one year, renewable at any time by mutual agreement.
SELECTED FINANCIAL DATA AND OTHER DATA
You should read the following summary consolidated financial information for the periods and as at the dates indicated in conjunction with the section of this Introductory Document entitled "Management's Discussion and Analysis of Financial Condition and Results of Operations" and our consolidated financial statements, the accompanying notes and the related independent auditors' report included in this Introductory Document in "Appendix E – Independent Auditor's Report to the Audited Consolidated Financial Statements for the Years ended 31 December 2017 and 2018 and for the Nine Months ended 30 September 2019, and the Unaudited Interim Condensed Consolidated Financial Statements for the Nine Months ended 30 September 2018". Our financial statements are reported in Hong Kong dollars and are prepared and presented in accordance with IFRS. IFRS reporting practices and accounting principles differ in certain respects from SFRS(I)s.
The following selected consolidated statements of profit or loss and other comprehensive income data and selected consolidated cash flows data for the years ended 31 December 2017 and 2018 and the nine months ended 30 September 2019 and selected consolidated statements of financial position data as at 31 December 2017 and 2018 and nine months ended 30 September 2019 have been derived from our audited consolidated financial statements included elsewhere in this Introductory Document. The following selected consolidated statements of profit or loss and other comprehensive income data and selected consolidated cash flows data for the nine months ended 30 September 2018 and selected consolidated statements of financial position data as at 30 September 2018 have been derived from our unaudited interim condensed consolidated financial statements included elsewhere in this Introductory Document. The unaudited interim condensed consolidated financial statements have been prepared on the same basis as our audited consolidated financial statements and include all adjustments, consisting only of normal and recurring adjustments, that we consider necessary for a fair presentation of our financial position and results of operations for the periods presented. You should read this "Selected Financial Data and Other Data" section together with our consolidated financial statements and the related notes and "Management's Discussion and Analysis of Financial Condition and Results of Operations" included elsewhere in this Introductory Document. Our consolidated financial statements are prepared and presented in accordance with International Financial Reporting Standards, or IFRS, issued by the International Accounting Standard Board, or IASB. Our historical results of operations are not necessarily indicative of results of operations expected for future periods.
SELECTED CONSOLIDATED STATEMENTS OF PROFIT AND LOSS AND OTHER COMPREHENSIVE INCOME DATA
| | For the Year Ended 31 December | | | For the Nine Months Ended 30 September | |
| | 2017 | | | 2018 | | | 2018 | | | 2019 | |
| | HK$ | | | % | | | HK$ | | | % | | | HK$ | | | % | | | HK$ | | | % | |
| | (in thousands, except for percentages and per share data) | |
Revenue | | | | | | | | | | | | | | | | | | | | | | | | | | | | | |
Fee and commission income. | | | 278,976 | | | | 27.0 | | | | 367,538 | | | | 50.8 | | | | 246,623 | | | | (172.4 | ) | | | 422,052 | | | | 40.5 | |
Dividend and gain related to disposed investment | | | 69,509 | | | | 6.7 | | | | 99,228 | | | | 13.7 | | | | 99,228 | | | | (69.4 | ) | | | 100,552 | | | | 9.6 | |
Sub-total. | | | 348,485 | | | | 33.7 | | | | 466,766 | | | | 64.5 | | | | 345,851 | | | | (241.8 | ) | | | 522,604 | | | | 50.1 | |
Net fair value changes on financial assets at fair value through profit or loss and stock loan. | | | 684,679 | | | | 66.3 | | | | 256,460 | | | | 35.5 | | | | (488,891 | ) | | | 341.8 | | | | (288,214 | ) | | | (27.6 | ) |
Net fair value change on derivative financial instrument | | | — | | | | — | | | | — | | | | — | | | | — | | | | — | | | | 807,618 | | | | 77.5 | |
Total revenue | | | 1,033,164 | | | | 100.0 | | | | 723,226 | | | | 100.0 | | | | (143,040 | ) | | | 100.0 | | | | 1,042,008 | | | | 100.0 | |
Other income. | | | 17,915 | | | | 1.7 | | | | 15,393 | | | | 2.1 | | | | 15,387 | | | | (10.8 | ) | | | 7,466 | | | | 0.7 | |
Operating expenses, net. | | | (111,563 | ) | | | (10.8 | ) | | | (52,582 | ) | | | (7.2 | ) | | | (47,046 | ) | | | 32.9 | | | | (74,137 | ) | | | (7.1 | ) |
Staff costs. | | | (102,205 | ) | | | (9.9 | ) | | | (68,025 | ) | | | (9.4 | ) | | | (60,973 | ) | | | 42.6 | | | | (78,102 | ) | | | (7.5 | ) |
Finance costs. | | | (28,725 | ) | | | (2.8 | ) | | | (9,047 | ) | | | (1.3 | ) | | | (6,547 | ) | | | 4.6 | | | | (16,162 | ) | | | (1.6 | ) |
Profit/(Loss) before tax | | | 808,586 | | | | 78.2 | | | | 608,965 | | | | 84.2 | | | | (242,219 | ) | | | 169.3 | | | | 881,073 | | | | 84.5 | |
Income Tax (expense)/credit. | | | (135,214 | ) | | | (13.1 | ) | | | (83,840 | ) | | | (11.6 | ) | | | 51,595 | | | | (36.1 | ) | | | (139,731 | ) | | | (13.4 | ) |
Profit/(Loss) for the year and for the period and total comprehensive income/(loss) for the year and for the period | | | 673,372 | | | | 65.1 | | | | 525,125 | | | | 72.6 | | | | (190,624 | ) | | | 133.2 | | | | 741,342 | | | | 71.1 | |
Attributable to: | | | | | | | | | | | | | | | | | | | | | | | | | | | | | | | | |
Owners of the parent | | | 568,266 | | | | 55.0 | | | | 468,061 | | | | 64.7 | | | | (116,643 | ) | | | 81.5 | | | | 848,711 | | | | 81.4 | |
| | For the Year Ended 31 December | | | For the Nine Months Ended 30 September | |
| | 2017 | | | 2018 | | | 2018 | | | 2019 | |
| | HK$ | | | % | | | HK$ | | | % | | | HK$ | | | % | | | HK$ | | | % | |
Non-controlling interests | | | 105,106 | | | | 10.1 | | | | 57,064 | | | | 7.9 | | | | (73,981 | ) | | | 51.7 | | | | (107,369 | ) | | | (10.3 | ) |
| | | | | | | | | | | | | | | | | | | | | | | | | | | | | | | | |
Profit/(Loss) for the year and for the period and total comprehensive income/(loss) for the year and for the period | | | 673,372 | | | | 65.1 | | | | 525,125 | | | | 72.6 | | | | (190,624 | ) | | | 133.2 | | | | 741,342 | | | | 71.1 | |
Profit/(Loss) and total comprehensive income/(loss) per share attributable to equity holders of the parents | | | | | | | | | | | | | | | | | | | | | | | | | | | | | | | | |
Class A ordinary shares: | | | | | | | | | | | | | | | | | | | | | | | | | | | | | | | | |
Basic | | | — | | | | — | | | | — | | | | — | | | | — | | | | | | | | 4.04 | | | | | |
Diluted | | | — | | | | — | | | | — | | | | — | | | | — | | | | | | | | 4.04 | | | | | |
Class B ordinary shares: | | | | | | | | | | | | | | | | | | | | | | | | | | | | | | | | |
Basic | | | 2.84 | | | | | | | | 2.34 | | | | | | | | (0.58 | ) | | | | | | | 4.04 | | | | | |
Diluted | | | 2.84 | | | | | | | | 2.34 | | | | | | | | (0.58 | ) | | | | | | | 4.04 | | | | | |
After the completion of the restructuring in April 2019, AMTD International Inc. became the holding company of our businesses, which have been operated under the common control of AMTD Group. Accordingly, our financial statements were prepared on a consolidated basis.
SELECTED CONSOLIDATED STATEMENTS OF FINANCIAL POSITION DATA
| | As at 31 December | | | As at 30 September | |
| | 2017 | | | 2018 | | | 2019 | |
| | HK$ | | | HK$ | | | HK$ | |
| | | | | (in thousands) | | | | |
| | | | | | | | | | | | |
Total non-current assets | | | 15,623 | | | | 15,302 | | | | 15,217 | |
Total current assets(1). | | | 6,025,994 | | | | 7,091,887 | | | | 7,071,518 | |
Total assets. | | | 6,041,617 | | | | 7,107,189 | | | | 7,086,735 | |
| | | | | | | | | | | | |
Total non-current liabilities. | | | 130,209 | | | | 163,357 | | | | 242,914 | |
Total current liabilities. | | | 3,242,132 | | | | 3,749,430 | | | | 887,282 | |
Total liabilities | | | 3,372,341 | | | | 3,912,787 | | | | 1,130,196 | |
| | | | | | | | | | | | |
Share capital – Class A | | | — | | | | — | | | | 26 | |
Share capital – Class B | | | 157 | | | | 157 | | | | 157 | |
Capital reserve | | | 1,312,803 | | | | 1,312,803 | | | | 3,768,803 | |
Retained profits | | | 870,781 | | | | 1,338,842 | | | | 2,187,553 | |
Total ordinary share holders' equity | | | 2,183,741 | | | | 2,651,802 | | | | 5,956,539 | |
Non-controlling interests | | | 485,535 | | | | 542,600 | | | | — | |
| | | | | | | | | | | | |
Total equity | | | 2,669,276 | | | | 3,194,402 | | | | 5,956,539 | |
| | | | | | | | | | | | |
Total liabilities and equity | | | 6,041,617 | | | | 7,107,189 | | | | 7,086,735 | |
_____________________
Note:
| (1) | Our total current assets include, among others, bank balances held under segregated accounts in trust custody on behalf of our asset management clients of HK$288.0 million as at 30 September 2019. These segregated bank balances will be removed together with the corresponding client money held on trust recorded in total current liabilities after clients execute trades or make withdrawals. |
SELECTED CONSOLIDATED CASH FLOW DATA
The following table presents our selected consolidated cash flows data for the periods indicated.
| | For the Year Ended 31 December | | | For the Nine Months Ended 30 September | |
| | 2017 | | | 2018 | | | 2018 | | | 2019 | |
| | HK$ | | | HK$ | | | HK$ | | | HK$ | |
| | (in thousands) | |
| | | |
Net cash flows generated from operating activities. | | | 84,327 | | | | 79,112 | | | | 393,730 | | | | 541,254 | |
Net cash flows used in investing activities | | | (139 | ) | | | (14 | ) | | | (14 | ) | | | (2,003,387 | ) |
Net cash flows (used in)/generated from financing activities | | | (67,283 | ) | | | (38,657 | ) | | | (358,156 | ) | | | 2,004,408 | |
Net increase in cash and cash equivalents. | | | 16,905 | | | | 40,441 | | | | 35,560 | | | | 542,275 | |
Cash and cash equivalents at the beginning of the year/period | | | 69,510 | | | | 86,415 | | | | 86,415 | | | | 126,856 | |
Cash and cash equivalents at the end of the year/period | | | 86,415 | | | | 126,856 | | | | 121,975 | | | | 669,131 | |
MANAGEMENT'S DISCUSSION AND ANALYSIS OF FINANCIAL CONDITION AND RESULTS OF OPERATIONS
You should read the following discussion and analysis of our financial condition and results of operations in conjunction with the sections entitled "Risk Factors", "Selected Financial Data and Other Data", and our consolidated financial statements and the related notes included elsewhere in this Introductory Document. This discussion contains forward-looking statements based upon current expectations that involve risks and uncertainties. Our actual results and the timing of selected events may differ materially from those anticipated in these forward-looking statements as a result of various factors, including those described under "Risk Factors" and elsewhere in this Introductory Document. See the section entitled "Forward-Looking Statements". Our consolidated financial statements have been prepared in accordance with IFRS.
Overview
We are a leading Hong Kong-headquartered comprehensive financial institution. According to the CIC Report, we are the No. 1 independent investment banking firm in Asia as measured by both the number and the aggregate offering size of Hong Kong and U.S. IPOs completed in each of 2018 and the nine months ended 30 September 2019, and the largest independent asset management firm in Asia in serving both PRC regional banks and New Economy Companies as measured by AUM as at 30 September 2019.
We operate a full-service platform encompassing three business lines: investment banking, asset management, and strategic investment.
· | Leading Investment Banking Business. We offer a broad range of investment banking services, including equity underwriting, debt underwriting, advisory (on credit rating, financing, and mergers and acquisitions transactions), securities brokerage, institutional sales and distribution, and research, among others. According to the CIC Report, we ranked first among all independent investment banking firms in Asia as measured by both the number and the aggregate offering size of Hong Kong and U.S. IPOs completed in each of 2018 and the nine months ended 30 September 2019, and ranked in the top ten as a bookrunner among all investment banking firms as measured by the number of Hong Kong IPOs priced in each of the two periods. We also ranked in the top ten among all global investment banking firms operating in Asia (excluding China-headquartered investment banking firms) as measured by the aggregate number of high-yield bond offerings by China-based companies and AT1 capital preferred share offerings by PRC regional banks in 2017, 2018 and the nine months ended 30 September 2019 combined. |
| |
· | Top-tier Asset Management Services. We provide professional investment management and advisory services primarily to corporate and other institutional clients. According to the CIC Report, we are one of the five largest HKSFC-licensed asset management firms headquartered in Hong Kong, and also the largest independent asset management firm in Asia in serving both PRC regional banks and New Economy Companies, in each case as measured by AUM. Our AUM was HK$24.4 billion as at 30 September 2019, of which 15.8% was attributable to PRC regional banks and 80.5% was attributable to New Economy Companies. |
| |
· | Proven Strategic Investment Platform. We make long-term strategic investments focusing on Asia's financial and new economy sectors. Through investing in market leaders and technological innovators, we gain access to unique opportunities and resources that complement our other businesses and enhance our "AMTD SpiderNet" ecosystem. For the year ended 31 December 2018, we recorded dividend and gain related to disposed investment of HK$99.2 million. For the nine months ended 30 September 2019, we recorded dividend and gain related to disposed investment of HK$100.6 million. For the year ended 31 December 2018 and the nine months ended 30 September 2019, we recorded net fair value changes on stock loan, derivative financial instrument and financial assets at fair value through profit or loss of HK$256.5 million and HK$519.4 million, respectively, both from our strategic investment business. |
General Factors Affecting Our Results of Operations
Our business and results of operations are affected by a number of general factors affecting the financial services industry in Hong Kong, including:
· | the overall economic environment in Hong Kong, China and other parts of the world; |
| |
· | the conditions and trends of global capital markets; and |
| |
· | government policies and initiatives affecting the financial services industry in Hong Kong and China. |
Unfavorable changes in any of these general conditions could adversely affect demand for our services and materially and adversely affect our results of operations. However, the Hong Kong and PRC governments' development plans and policies, including those relating to the development of the Greater Bay Area, are expected to boost the future development of the financial services industry in Hong Kong.
Specific Factors Affecting Our Results of Operations
Our business lines and revenue mix
Our businesses have different future growth prospects and, as a result, any material changes in the contribution mix of our business lines, whether due to changes in our growth strategies, market conditions, client demand, or other reasons, may affect our results of operations. The results of our investment banking and strategic investment businesses may fluctuate, sometimes significantly, due to market conditions. Positive market conditions may generally result in larger average transaction size of public equity and debt offerings and higher valuation of private companies, which in turn may strengthen the results of our investment banking and strategic investment businesses. On the other hand, these businesses may be affected by negative market conditions and report results below expectation. Our historical results of operations were significantly affected by the revenue contribution of our investment banking and strategic investment businesses. For the years ended 31 December 2017 and 2018 and the nine months ended 30 September 2019, fee and commission income from our investment banking business and asset management business accounted for 27.0%, 50.8%, and 40.5% of our total revenue, respectively; dividend and gain related to disposed investment from our strategic investment business accounted for 6.7%, 13.7%, and 9.6% of our total revenue, respectively; and net fair value changes on stock loan, derivative financial instrument and financial assets at fair value through profit or loss from our strategic investment business accounted for 66.3%, 35.5%, and 49.9% of our total revenue, respectively.
We seek to optimize our revenue mix by increasing the revenue contribution from our asset management business, which is generally perceived to have steady growth potential. We also seek to further expand our investment banking business as we strengthen our brand image in the capital markets. Our future results of operations could be materially affected by our ability to develop and bring new services to market, to deal with new clients and counterparties, to manage new asset classes, and to engage in new markets.
Our ability to expand our investment banking business
The investment banking business is the largest driver for our fee and commission income. Due to the nature of public and private capital raising transactions, transaction value is a principal factor affecting the prospects and results of operations of our investment banking business. The transaction value in turn could be affected by various factors, such as the macroeconomic environment, market conditions, competition, our brand and reputation, and our performance in delivering satisfactory results to clients. Any change in these factors could materially affect our results of operations. For our investment banking business, we charge fees and commissions by a percentage of the underlying transaction value and record them as fee and commission income. Although market practices allow micro-adjustments of fee percentages upward or downward for transactions of smaller or larger sizes, respectively, such micro-adjustments do not negate the significant impact of transaction value on our results of operations. A significant increase or decrease in the aggregate value of underlying transactions during a reporting period could result in a significant increase or decrease in our fee and commission income, which in turn could affect our results of operations. In addition, the results of operations of our investment banking business is also affected by the rate of fees and commissions that we collect in capital raising transactions, which in turn could be affected by our role in the capital raising transactions. As we continue to accumulate investment banking transaction experience and strengthen our brand image, we expect to further increase our exposure to larger, more complex transactions and our contribution to the underwriting syndicate, which may further improve our results of operations.
Our ability to make sound investment decisions
We derive a significant portion of our revenue from our strategic investment business, where we make principal investments using entirely our own capital. For the years ended 31 December 2017 and 2018 and the nine months ended 30 September 2019, dividend and gain related to disposed investment from our strategic investment business accounted for 6.7%, 13.7%, and 9.6% of our total revenue, respectively, and net fair value changes on stock loan, derivative financial instrument and financial assets at fair value through profit or loss from our strategic investment business accounted for 66.3%, 35.5%, and 49.9% of our total revenue, respectively. The fair value of our investment holdings may fluctuate due to market volatility, performance, or other reasons, and the growth of our strategic investment business depends, in part, on our ability to make sound investment decisions. Making a sound investment decision requires us to carefully identify and select a target company based on its business, financial condition, operations, and the industry in which it operates, and could significantly improve our results of operations.
Our ability to attract, retain, and motivate people
It is essential for us to attract, retain, and motivate talent because our businesses are human capital intensive. We believe that it is necessary and customary to invest in people, arguably our most important assets, with attractive compensation packages, as we compete to attract, retain, and motivate qualified employees. Our staff costs for the years ended 31 December 2017 and 2018 and the nine months ended 30 September 2019, were HK$102.2 million, HK$68.0 million, and HK$78.1 million, respectively, representing 9.9%, 9.4%, and 7.5% of our total revenue for the corresponding periods. Our staff costs have historically entirely comprised cash-based compensation and benefits, although we may establish employee equity incentive plans to further invest in our people, for which we may incur share-based compensation expenses that could adversely affect our results of operations. Nevertheless, highly incentivized professionals and other talent could potentially enable us to achieve great business prospects and results of operations.
Our ability to comply with regulatory requirements
Our investment banking and asset management businesses are subject to various regulatory regimes in Hong Kong. Compliance with regulatory requirements will result in higher operating expenses. Two of our subsidiaries, AMTD Global Markets Limited and Asia Alternative Asset Partners Limited, are HKSFC-licensed companies subject to various requirements of minimum paid-up capital and minimum liquidity under the Securities and Futures Ordinance (Cap. 571) of Hong Kong. The relevant capital requirements may be changed over time or subject to different interpretations by relevant governmental authorities, all of which are out of our control. Any increase of the relevant capital requirements or stricter enforcement or interpretation of the same may affect our business activities and liquidity.
Key Components of Results of Operations
Revenue
Our revenue consists of (i) fee and commission income, (ii) dividend and gain related to disposed investment, and (iii) net fair value changes on stock loan, derivative financial instrument and financial assets at fair value through profit or loss. The following table sets forth a breakdown of our revenue in absolute amount and as a percentage of total revenue for the periods presented.
| | For the Year Ended 31 December | | | For the Nine Months Ended 30 September | |
| | 2017 | | | 2018 | | | 2018 | | | 2019 | |
| | HK$ | | | % | | | HK$ | | | % | | | HK$ | | | % | | | HK$ | | | % | |
| | (in thousands, except for percentages) | |
Revenue | | | | | | | | | | | | | | | | | | | | | | | | |
Fee and commission income | | | 278,976 | | | | 27.0 | | | | 367,538 | | | | 50.8 | | | | 246,623 | | | | (172.4 | ) | | | 422,052 | | | | 40.5 | |
Dividend and gain related to disposed investment | | | 69,509 | | | | 6.7 | | | | 99,228 | | | | 13.7 | | | | 99,228 | | | | (69.4 | ) | | | 100,552 | | | | 9.6 | |
Net fair value changes on financial assets at fair value through profit or loss and stock loan | | | 684,679 | | | | 66.3 | | | | 256,460 | | | | 35.5 | | | | (488,891 | ) | | | 341.8 | | | | (288,214 | ) | | | (27.6 | ) |
Net fair value change on derivative financial instrument | | | — | | | | — | | | | — | | | | — | | | | — | | | | — | | | | 807,618 | | | | 77.5 | |
Total | | | 1,033,164 | | | | 100.0 | | | | 723,226 | | | | 100.0 | | | | (143,040 | ) | | | 100.0 | | | | 1,042,008 | | | | 100.0 | |
The following table sets forth a breakdown of our fee and commission income in absolute amount and as a percentage of total fee and commission income for the periods presented.
| | For the Year Ended 31 December | | | For the Nine Months Ended 30 September | |
| | 2017 | | | 2018 | | | 2018 | | | 2019 | |
| | HK$ | | | % | | | HK$ | | | % | | | HK$ | | | % | | | HK$ | | | % | |
| | (in thousands, except for percentages) | |
Fee and Commission Income | | | | | | | | | | | | | | | | | | | | | | | | |
Investment banking fees and commissions | | | 208,163 | | | | 74.6 | | | | 288,591 | | | | 78.5 | | | | 182,342 | | | | 73.9 | | | | 330,617 | | | | 78.3 | |
Asset management fees and other income | | | 70,813 | | | | 25.4 | | | | 78,947 | | | | 21.5 | | | | 64,281 | | | | 26.1 | | | | 91,435 | | | | 21.7 | |
Total | | | 278,976 | | | | 100.0 | | | | 367,538 | | | | 100.0 | | | | 246,623 | | | | 100.0 | | | | 422,052 | | | | 100.0 | |
We derive fee and commission income from two (2) business lines: investment banking and asset management. Investment banking business represents the primary source of our fee and commission income, which we earn primarily from underwriting IPOs and bond offerings and advising on private financing and mergers and acquisitions transactions. We also derive asset management fees and other income from asset management business.
We charge asset management fees on a client-by-client basis with reference to the size of AUM and do not distinguish among product types when determining asset management fee rates. The following table sets forth the rollforward of our AUM for the periods presented.
| | For the Year Ended 31 December | | | For the Nine Months Ended 30 September | |
| | 2017 | | | 2018 | | | 2018 | | | 2019 | |
| | HK$ | | | HK$ | | | HK$ | | | HK$ | |
| | (in thousands) | |
AUM | | | | | | | | | | | | |
Balance at the beginning of the period | | | 8,294,221 | | | | 14,822,265 | | | | 14,822,265 | | | | 18,263,267 | |
Gross inflow(1) | | | 23,570,034 | | | | 26,873,309 | | | | 13,243,700 | | | | 35,099,994 | |
Gross outflow(2) | | | (17,690,026 | ) | | | (22,819,606 | ) | | | (10,053,336 | ) | | | (27,283,732 | ) |
Appreciation / (Depreciation) of clients' portfolio(3) | | | 648,036 | | | | (612,701 | ) | | | (1,157,063 | ) | | | (1,650,909 | ) |
Balance at the end of the period | | | 14,822,265 | | | | 18,263,267 | | | | 16,855,566 | | | | 24,428,620 | |
_______________
Notes:
(1) Gross inflow represents cash and stock deposits.
(2) Gross outflow represents cash and stock withdrawals.
(3) Appreciation/(Depreciation) of clients' portfolio represents net balance of dividend and coupon received, fee charges, and fair value change of clients' portfolio.
Resulting from the expansion of equity capital market business in the fourth quarter of 2018, the significant increase of gross inflow of our Company's AUM when comparing the nine months ended 30 September 2018 ("9M2018") to 9M2019 is mainly attributable to the introduction of new clients with sizable funds and securities inflows arising from new IPO subscriptions.
Regarding the depreciation of clients' portfolio, decline in market prices of several clients' chosen equity investments mainly account for the depreciation in value.
| | For the Year Ended 31 December | | | For the Nine Months Ended 30 September | |
| | 2017 | | | 2018 | | | 2018 | | | 2019 | |
Weighted Average Asset Management Fee Rate(1) | | | 0.55 | % | | | 0.45 | % | | | 0.38 | % | | | 0.42 | % |
_______________
Note:
| (1) | Calculated by dividing total asset management fee income for the period by average AUM for the corresponding period, which is in turn calculated by dividing the sum of AUM at the beginning and end of the relevant period by two. |
The weighted average asset management fee rate decreased from 0.55% in 2017 to 0.45% in 2018, primarily due to significant additional AUM attributable to a PRC bank client subject to below-average asset management fee rate and reduced performance fee income due to challenging global market conditions in 2018. The weighted average asset management fee rate increased from 0.38% for the nine months ended 30 September 2018 to 0.42% for the nine months ended 30 September 2019, primarily due to additional AUM attributable to New Economy Company clients (i.e. businesses that achieve rapid growth through progressive entrepreneurships, technological advancements, and innovative business models) subject to above-average asset management fee rate since the fourth quarter of 2018. On an annualized basis, the annualized weighted average asset management fee rate for the nine months ended 30 September 2019 would have been higher than the weighted average asset management fee rate in 2018.
A breakdown of the total revenue by business segments for the financial period under review is set out below:
Revenue (HK$'000) | | FY2017 | | | FY2018 | | | 9M2018 | | | 9M2019 | |
Investment Banking | | | 208,163 | | | | 288,591 | | | | 182,342 | | | | 330,617 | |
Asset Management | | | 70,813 | | | | 78,947 | | | | 64,281 | | | | 91,435 | |
Total. | | | 278,976 | | | | 367,538 | | | | 246,623 | | | | 422,052 | |
A breakdown of the total revenue from external customers by geographical markets for the financial period under review is set out below:
Revenue (HK$'000) | | FY2017 | | | FY2018 | | | 9M2018 | | | 9M2019 | |
Hong Kong | | | 81,685 | | | | 168,332 | | | | 162,659 | | | | 136,171 | |
China | | | 191,014 | | | | 195,396 | | | | 80,827 | | | | 241,274 | |
United States | | | — | | | | — | | | | — | | | | 32,497 | |
Others | | | 6,277 | | | | 3,810 | | | | 3,137 | | | | 12,110 | |
Total | | | 278,976 | | | | 367,538 | | | | 246,623 | | | | 422,052 | |
Dividend and gain related to disposed investment
We make equity investments with our own capital in companies of our strategic choice, and we intend to hold our strategic investments on a long-term basis. Our dividend and gain related to disposed investment in 2017 primarily consist of a gain of HK$46.9 million attributable to the disposal of our investments in 2017. Our dividend and gain related to disposed investment in 2018 solely consisted of dividend income attributable to our equity holdings in Bank of Qingdao.
Net fair value changes on financial assets at fair value through profit or loss, stock loan and derivative financial instrument.
We record net fair value changes on stock loan, derivative financial instrument and financial assets at fair value through profit or loss with respect to our strategic investments, which primarily include equity investments in Bank of Qingdao and three private companies. For a discussion of fair value measurement of our financial assets, see "—Significant Accounting Policies—Fair Value Measurement" in this section and "—Significant Accounting Policies—Investments and Other Financial Assets" in this section. For a discussion of our investment portfolio, see "Business—Our Services— Strategic Investment—Investment Portfolio".
Other income
Other income consists of (i) bank interest income, (ii) income attributable to the reimbursement of interest expenses paid on behalf of a Controlling Shareholder's subsidiary, and (iii) other non-recurring miscellaneous income.
Operating expenses
Our operating expenses consist of (i) marketing and brand promotional expenses relating to brand building and promotion, (ii) premises costs and office utilities, (iii) traveling expenses for domestic and international travel and business development, (iv) commissions paid to asset management sales personnel and bank charges, (v) office renovation and maintenance expenses, (vi) legal and professional fees for business development, (vii) staff welfare and recruitment expenses, (viii) stamp duty paid in connection with our restructuring, and (ix) other miscellaneous expenses.
The following table sets forth a breakdown of our operating expenses in absolute amount and as a percentage of total operating expenses for the periods presented.
| | For the Year Ended 31 December | | | For the Nine Months Ended 30 September | |
| | 2017 | | | 2018 | | | 2018 | | | 2019 | |
| | HK$ | | | % | | | HK$ | | | % | | | HK$ | | | % | | | HK$ | | | % | |
| | (in thousands, except for percentages) | |
Operating Expenses | | | | | | | | | | | | | | | | | | | | | | | | |
Marketing and brand promotional expenses | | | 26,208 | | | | 23.5 | | | | 11,864 | | | | 22.6 | | | | 14,695 | | | | 31.2 | | | | 10,677 | | | | 14.4 | |
Premises costs and office utilities | | | 25,783 | | | | 23.1 | | | | 15,583 | | | | 29.6 | | | | 14,034 | | | | 29.8 | | | | 15,884 | | | | 21.4 | |
Traveling and business development expenses | | | 18,460 | | | | 16.5 | | | | 10,860 | | | | 20.7 | | | | 6,654 | | | | 14.1 | | | | 10,084 | | | | 13.6 | |
Commissions and bank charges | | | 7,978 | | | | 7.2 | | | | 5,198 | | | | 9.9 | | | | 2,944 | | | | 6.3 | | | | 6,691 | | | | 9.0 | |
Office renovation and maintenance expenses | | | 15,880 | | | | 14.2 | | | | 1,603 | | | | 3.0 | | | | 1,957 | | | | 4.2 | | | | 1,325 | | | | 1.8 | |
Administrative service | | | — | | | | — | | | | — | | | | — | | | | — | | | | — | | | | 6,000 | | | | 8.1 | |
Legal and professional fees | | | 5,772 | | | | 5.2 | | | | 2,439 | | | | 4.6 | | | | 1,617 | | | | 3.4 | | | | 14,254 | | | | 19.2 | |
Staff welfare and staff recruitment expenses | | | 7,637 | | | | 6.9 | | | | 3,660 | | | | 7.0 | | | | 2,528 | | | | 5.4 | | | | 2,215 | | | | 3.0 | |
Others | | | 3,845 | | | | 3.4 | | | | 1,375 | | | | 2.6 | | | | 2,617 | | | | 5.6 | | | | 7,007 | | | | 9.5 | |
Total. | | | 111,563 | | | | 100.0 | | | | 52,582 | | | | 100.0 | | | | 47,046 | | | | 100.0 | | | | 74,137 | | | | 100.0 | |
Staff costs
Staff costs consist of employee salaries, bonuses, and pension scheme contributions. The following table sets forth a breakdown of our staff costs for the periods presented.
| | For the Year Ended 31 December | | | For the Nine Months Ended 30 September | |
| | 2017 | | | 2018 | | | 2018 | | | 2019 | |
| | HK$ | | | HK$ | | | HK$ | | | HK$ | |
| | (in thousands) | |
Staff Costs | | | | | | | | | | | | |
Salaries and bonuses | | | 101,093 | | | | 67,188 | | | | 60,312 | | | | 77,364 | |
Pension scheme contributions | | | 1,112 | | | | 837 | | | | 661 | | | | 738 | |
Total. | | | 102,205 | | | | 68,025 | | | | 60,973 | | | | 78,102 | |
Taxation
We had income tax expenses of HK$135.2 million, HK$83.8 million, and HK$139.7 million for the years ended 31 December 2017 and 2018 and the nine months ended 30 September 2019, respectively. The following summarizes our applicable tax rates in the Cayman Islands and Hong Kong.
Cayman Islands
The Cayman Islands currently levies no taxes on individuals or corporations based upon profits, income, gains, or appreciation. There are no other taxes likely to be material to us levied by the government of the Cayman Islands except for stamp duties, which may be applicable on instruments executed in, or, after execution, brought within the jurisdiction of the Cayman Islands. In addition, the Cayman Islands does not impose withholding tax on dividend payments. There are no reciprocal tax treaties between the Cayman Islands and Singapore.
Hong Kong
Our Hong Kong subsidiaries are subject to 16.5% Hong Kong profit tax on their taxable income generated from operations in Hong Kong. Under the Hong Kong tax laws, our Hong Kong subsidiaries are exempted from the Hong Kong income tax on our foreign-derived income. In addition, payments of dividends from our Hong Kong subsidiaries to us are not subject to any Hong Kong withholding tax.
Results of Operations
The following table sets forth a summary of our consolidated results of operations in absolute amount and as a percentage of our total revenue for the periods presented. This information should be read together with our consolidated financial statements and related notes included elsewhere in this Introductory Document. The results of operations in any period are not necessarily indicative of our future trends.
| | For the Year Ended 31 December | | | For the Nine Months Ended 30 September | |
| | 2017 | | | 2018 | | | 2018 | | | 2019 | |
| | HK$ | | | % | | | HK$ | | | % | | | HK$ | | | % | | | HK$ | | | % | |
| | (in thousands, except for percentages) | |
Revenue | | | | | | | | | | | | | | | | | | | | | | | | |
Fee and commission income | | | 278,976 | | | | 27.0 | | | | 367,538 | | | | 50.8 | | | | 246,623 | | | | (172.4 | ) | | | 422,052 | | | | 40.5 | |
Dividend and gain related to disposed investment | | | 69,509 | | | | 6.7 | | | | 99,228 | | | | 13.7 | | | | 99,228 | | | | (69.4 | ) | | | 100,552 | | | | 9.6 | |
Sub-total | | | 348,485 | | | | 33.7 | | | | 466,766 | | | | 64.5 | | | | 345,851 | | | | (241.8 | ) | | | 522,604 | | | | 50.1 | |
Net fair value changes on financial assets at fair value through profit or loss and stock loan | | | 684,679 | | | | 66.3 | | | | 256,460 | | | | 35.5 | | | | (488,891 | ) | | | 341.8 | | | | (288,214 | ) | | | (27.6 | ) |
Net fair value change on derivative financial instrument | | | — | | | | — | | | | — | | | | — | | | | — | | | | — | | | | 807,618 | | | | 77.5 | |
Total revenue | | | 1,033,164 | | | | 100.0 | | | | 723,226 | | | | 100.0 | | | | (143,040 | ) | | | 100.0 | | | | 1,042,008 | | | | 100.0 | |
Other income | | | 17,915 | | | | 1.7 | | | | 15,393 | | | | 2.1 | | | | 15,387 | | | | (10.8 | ) | | | 7,466 | | | | 0.7 | |
Operating expenses | | | (111,563 | ) | | | (10.8 | ) | | | (52,582 | ) | | | (7.2 | ) | | | (47,046 | ) | | | 32.9 | | | | (74,137 | ) | | | (7.1 | ) |
Staff costs | | | (102,205 | ) | | | (9.9 | ) | | | (68,025 | ) | | | (9.4 | ) | | | (60,973 | ) | | | 42.6 | | | | (78,102 | ) | | | (7.5 | ) |
Finance costs | | | (28,725 | ) | | | (2.8 | ) | | | (9,047 | ) | | | (1.3 | ) | | | (6,547 | ) | | | 4.6 | | | | (16,162 | ) | | | (1.6 | ) |
Profit / (Loss) before tax | | | 808,586 | | | | 78.2 | | | | 608,965 | | | | 84.2 | | | | (242,219 | ) | | | 169.3 | | | | 881,073 | | | | 84.5 | |
Income tax(expense) / credit. | | | (135,214 | ) | | | (13.1 | ) | | | (83,840 | ) | | | (11.6 | ) | | | 51,595 | | | | (36.1 | ) | | | (139,731 | ) | | | (13.4 | ) |
Profit/(Loss) for the year and for the period and total comprehensive income/(loss) for the year and for the period | | | 673,372 | | | | 65.1 | | | | 525,125 | | | | 72.6 | | | | (190,624 | ) | | | 133.2 | | | | 741,342 | | | | 71.1 | |
Segment Information
We report our results of operations in three reportable segments: investment banking, asset management, and strategic investment, which correspond to our business lines.
The following table sets forth certain financial information of our reportable segments for the periods presented.
| | For the Year Ended 31 December | | | For the Nine Months Ended 30 September | |
| | 2017 | | | 2018 | | | 2018 | | | 2019 | |
| | HK$ | | | HK$ | | | HK$ | | | HK$ | |
| | (in thousands) | |
Investment Banking | | | | | | | | | | | | |
Segment revenue. | | | 208,163 | | | | 288,591 | | | | 182,342 | | | | 330,617 | |
Segment results(1) | | | 197,333 | | | | 254,901 | | | | 157,790 | | | | 310,424 | |
Asset Management | | | | | | | | | | | | | | | | |
Segment revenue | | | 70,813 | | | | 79,120 | | | | 64,453 | | | | 91,435 | |
Segment results(1) | | | 48,060 | | | | 57,386 | | | | 47,552 | | | | 78,653 | |
Strategic Investment | | | | | | | | | | | | | | | | |
Segment revenue | | | 754,188 | | | | 355,688 | | | | (389,663 | ) | | | 619,956 | |
Segment results(1) | | | 739,674 | | | | 350,307 | | | | (392,544 | ) | | | 603,794 | |
Total segment results | | | 985,067 | | | | 662,594 | | | (187,202) | | | | 992,871 | |
_______________
Note:
| (1) | The segment results represent segment revenue that excludes (i) staff costs for the applicable segment, (ii) finance costs for our strategic investment business, and (iii) commissions payable to employees under our asset management business. |
For reconciliation of segment revenue to consolidated revenue and reconciliation of segment results to consolidated profit before tax, see note 4 to our consolidated financial statements for the years ended 31 December 2017 and 2018 and for the nine months ended 30 September 2018 and 2019 included elsewhere in this Introductory Document.
Nine Months Ended 30 September 2019 Compared to Nine Months Ended 30 September 2018
Revenue
Our revenue was HK$1,042.0 million for the nine months ended 30 September 2019, compared to a negative amount of HK$143.0 million for the nine months ended 30 September 2018. This is primarily due to a significant fluctuation in our net fair value changes on stock loan, derivative financial instrument and financial assets at fair value through profit or loss under our strategic investment business from negative position to positive position and a significant increase in our fee and commission income under our investment banking and asset management businesses.
Fee and commission income. Our fee and commission income increased significantly from HK$246.6 million for the nine months ended 30 September 2018 to HK$422.1 million for the nine months ended 30 September 2019, primarily due to the robust growth of our investment banking business in terms of the number and size of deals.
· | Investment banking segment. Our fee and commission income from the investment banking segment increased significantly from HK$182.3 million for the nine months ended 30 September 2018 to HK$330.6 million for the nine months ended 30 September 2019, primarily due to an increase in our fees and commissions for equity offerings and financial advisory services from HK$161.6 million to HK$276.0 million for the corresponding periods, which in turn was primarily attributable to increase in the number of equity offerings from 9 to 16 for the corresponding periods, as well as an increase in our fees and commissions for debt offerings from HK$20.8 million to HK$54.6 million for the corresponding periods, which in turn was primarily attributable to an increase in the revenue per debt offering from HK$1.5 million to HK$3.2 million and the number of debt offerings from 14 to17 for the corresponding periods. |
| |
· | Asset management segment. Our fee and commission income from the asset management segment increased by 42.2% from HK$64.3 million for the nine months ended 30 September 2018 to HK$91.4 million for the nine months ended 30 September 2019, primarily due to an increase in our AUM from HK$16.9 billion as at 30 September 2018 to HK$24.4 billion as at 30 September 2019 and an increase in average asset management fee rates, which in turn was primarily attributable to an increase in new asset management clients with higher asset management fee rates in the fourth quarter of 2018. |
Net fair value changes on financial assets at fair value through profit or loss, stock loan and derivative financial instrument. Our net fair value changes on financial assets at fair value through profit or loss, stock loan and derivative financial instrument was HK$519.4 million for the nine months ended 30 September 2019, compared to a negative position of HK$488.9 million for the nine months ended 30 September 2018, primarily due to change in fair value of our investment portfolio in the corresponding periods, which in turn was primarily attributable to the different directions of price movements of the underlying listed securities in our portfolio during the respective periods.
Other income
Our other income decreased by 51.5% from HK$15.4 million for the nine months ended 30 September 2018 to HK$7.5 million for the nine months ended 30 September 2019, primarily due to one-off early termination compensation received from a former employee in 2018 and increase in an interest charged to our Controlling Shareholder for the nine months ended 30 September 2019.
Operating expenses
Our operating expenses increased by 57.6% from HK$47.0 million for the nine months ended 30 September 2018 to HK$74.1 million for the nine months ended 30 September 2019, primarily due to (i) an increase in annual audit and regular professional fees from HK$1.6 million to HK$14.3 million for the respective periods attributable to our Company's initial public offering, (ii) an increase in an administrative support service fee of HK$6.0 million charged by our Company's immediate holding company in accordance with the transitional services agreement entered duly between the two parties as previously disclosed publicly, and (iii) an increase in stamp duty from nil to HK$2.1 million for the respective periods, which in turn was primarily attributable to stamp duty paid in connection with our Company's restructuring prior to the initial public offering.
Staff costs
Staff costs increased by 28.1% from HK$61.0 million for the nine months ended 30 September 2018 to HK$78.1 million for the nine months ended 30 September 2019, primarily due to an increase in staff bonuses including a special bonus for our successful NYSE listing and new talents recruitment and related costs.
Finance costs
Our finance costs increased by 146.9% from HK$6.5 million for the nine months ended 30 September 2018 to HK$16.2 million for the nine months ended 30 September 2019, primarily due to increase in average loan balance along the period to support and fuel the ongoing developments and accelerated international expansion of our Company.
Income tax credit / (expense)
Our income tax expense was HK$139.7 million for the nine months ended 30 September 2019, compared to income tax credit of HK$51.6 million for the nine months ended 30 September 2018, resulting from reversal of deferred tax liabilities relating to accumulated unrealized gain on our investment portfolios.
Profit / (Loss) and total comprehensive income / (loss) for the period
As a result of the foregoing, we had profit and total comprehensive income of HK$741.3 million for the nine months ended 30 September 2019, compared to loss and total comprehensive loss of HK$190.6 million for the nine months ended 30 September 2018.
Year Ended 31 December 2018 Compared to Year Ended 31 December 2017
Revenue
Our revenue decreased by 30.0% from HK$1.0 billion in 2017 to HK$723.2 million in 2018, primarily due to a significant decrease in net fair value changes on financial assets at fair value through profit or loss and stock loan under our strategic investment business, partially offset by an increase in our fee and commission income.
Fee and commission income. Our fee and commission income increased by 31.7% from HK$279.0 million in 2017 to HK$367.5 million in 2018, primarily due to the robust growth of our investment banking business.
· | Investment banking segment. Our fee and commission income from the investment banking segment increased by 38.6% from HK$208.2 million in 2017 to HK$288.6 million in 2018, primarily due to an increase in our fees and commissions for equity offerings from HK$79.0 million in 2017 to HK$182.4 million in 2018, which in turn was primarily attributable to an increase in aggregate transaction value of equity offerings from HK$18.7 billion in 2017 to HK$97.6 billion in 2018 and an increase in the number of equity offerings from 2 in 2017 to 18 in 2018, partially offset by a decrease in our fees and commissions for debt offerings from HK$101.9 million in 2017 to HK$34.6 million in 2018, which in turn was primarily attributable to a decrease in aggregate transaction value of debt offerings from HK$151.5 billion in 2017 to HK$55.9 billion in 2018 and a decrease in the number of debt offerings from 37 in 2017 to 23 in 2018. |
| |
· | Asset management segment. Our fee and commission income from the asset management segment increased by 11.5% from HK$70.8 million in 2017 to HK$78.9 million in 2018, primarily due to an increase in our AUM from HK$14.8 billion as at 31 December 2017 to HK$18.3 billion as at 31 December 2018, which in turn was primarily attributable to an increase in new asset management clients in 2018. |
Dividend and gain related to disposed investment. Our dividend and gain related to disposed investment increased by 42.8% from HK$69.5 million in 2017 to HK$99.2 million in 2018, primarily due to an increase in dividend received from Bank of Qingdao from HK$22.6 million in 2017 to HK$99.2 million in 2018, which in turn was primarily attributable to an increase in our shareholding in Bank of Qingdao in late 2017.
Net fair value changes on financial assets at fair value through profit or loss and stock loan. Our net fair value changes on financial assets at fair value through profit or loss and stock loan decreased by 62.5% from HK$684.7 million in 2017 to HK$256.5 million in 2018, primarily due to slower increase in the fair value of our holdings in 2018 compared to 2017.
Other income
Our other income decreased by 14.1% from HK$17.9 million in 2017 to HK$15.4 million in 2018.
Operating expenses
Our operating expenses decreased by 52.9% from HK$111.6 million in 2017 to HK$52.6 million in 2018, primarily due to (i) a decrease in marketing and brand promotional expenses from HK$26.2 million in 2017 to HK$11.9 million in 2018 and a decrease in traveling and business development expenses from HK$18.5 million in 2017 to HK$10.9 million in 2018, primarily attributable to a more stringent cost control policy in 2018 compared to 2017, (ii) a decrease in premises costs and office utilities from HK$25.8 million in 2017 to HK$15.6 million in 2018 following the introduction of new business initiatives of our Controlling Shareholder in 2018, resulting in the decrease in our share of the office space; (iii) a decrease in office renovation and maintenance expenses
Staff costs
Our staff costs decreased by 33.4% from HK$102.2 million in 2017 to HK$68.0 million in 2018, primarily due to the decrease in the staff bonuses in 2018.
Finance costs
Our finance costs decreased by 68.5% from HK$28.7 million in 2017 to HK$9.0 million in 2018, primarily due to a HK$351.6 million repayment in 2018 of our margin loans brought forward from 2017.
Income tax expense
We incurred income tax expense of HK$135.2 million and HK$83.8 million in 2017 and 2018, respectively. The decrease in our income tax expense resulted from the lower net assessable profit position of certain operating entities in Hong Kong in 2018.
Profit and total comprehensive income for the period
As a result of the foregoing, our profit and total comprehensive income decreased by 22.0% from HK$673.4 million in 2017 to HK$525.1 million in 2018.
Discussion of Certain Key Items on the Consolidated Statements of Financial Position
The following table sets forth certain key information from our consolidated statements of financial position as at the dates indicated. This information should be read together with our consolidated financial statements and the related notes included elsewhere in this Introductory Document.
| | As at 31 December | | | As at 30 September | |
| | 2017 | | | 2018 | | | 2019 | |
| | HK$ | | | HK$ | | | HK$ | |
| | (in thousands) | |
Assets: | | | | | | | | | |
Accounts receivable | | | 93,173 | | | | 161,093 | | | | 170,601 | |
Due from immediate holding company | | | — | | | | 66,142 | | | | 1,951,535 | |
Due from fellow subsidiaries | | | 2,458,703 | | | | 2,596,119 | | | | — | |
Financial assets at fair value through profit or loss | | | 745,629 | | | | 1,953,078 | | | | 1,750,863 | |
Stock loan | | | 2,203,140 | | | | 1,535,680 | | | | 1,376,205 | |
Bank balances—segregated accounts | | | 403,492 | | | | 615,491 | | | | 287,969 | |
Total assets | | | 6,041,617 | | | | 7,107,189 | | | | 7,086,735 | |
| | | | | | | | | | | | |
Liabilities and Equity: | | | | | | | | | | | | |
Clients' monies held on trust | | | 383,304 | | | | 586,891 | | | | 300,429 | |
Margin loans payable | | | 351,610 | | | | 321,999 | | | | 321,776 | |
Due to immediate holding company | | | 1,640,450 | | | | 2,145,792 | | | | — | |
Due to fellow subsidiaries | | | 853,123 | | | | 574,203 | | | | — | |
Total liabilities | | | 3,372,341 | | | | 3,912,787 | | | | 1,130,196 | |
Total equity | | | 2,669,276 | | | | 3,194,402 | | | | 5,956,539 | |
Total liabilities and equity | | | 6,041,617 | | | | 7,107,189 | | | | 7,086,735 | |
Accounts receivable
Our accounts receivable consists of (i) receivable from investment banking services, (ii) clients' receivable relating to asset management services, (iii) receivable from brokers and clearing house relating to asset management services, and (iv) margin loan receivable from customers relating to securities traded.
The following table sets forth a breakdown of our accounts receivable as at the dates indicated.
| | As at 31 December | | | As at 30 September | |
| | 2017 | | | 2018 | | | 2019 | |
| | HK$ | | | HK$ | | | HK$ | |
| | (in thousands) | |
Accounts Receivable | | | | | | | | | |
Receivable from investment banking services | | | 69,555 | | | | 134,856 | | | | 117,151 | |
Clients' receivable | | | 15,748 | | | | 12,849 | | | | 10,127 | |
Receivable from brokers and clearing house | | | 7,870 | | | | 10,813 | | | | 43,323 | |
Margin loan receivable | | | — | | | | 2,575 | | | | — | |
Total | | | 93,173 | | | | 161,093 | | | | 170,601 | |
Our accounts receivable increased slightly from HK$161.1 million as at 31 December 2018 to HK$170.6 million as at 30 September 2019.
Our accounts receivable increased by 72.9% from HK$93.2 million as at 31 December 2017 to HK$161.1 million as at 31 December 2018, primarily due to an increase in receivable from investment banking services from HK$69.6 million as at 31 December 2017 to HK$134.9 million as at 31 December 2018, which was primarily attributable to certain unsettled balances of investment banking projects completed near the end of 2018.
The settlement terms of our accounts receivable vary depending on the type of accounts receivable. The normal settlement terms of receivable from investment banking services are specifically agreed between the contracting parties. Receivable from investment banking services does not bear interest. The normal settlement terms of clients' receivable and receivable from brokers and clearing house relating to asset management services are either two (2) days after the trade date or specifically agreed upon with brokers and clearing houses. Overdue clients' receivable is interest bearing.
The following table sets forth an ageing analysis of accounts receivable as at the dates indicated.
| | As at 31 December | | | As at 30 September | |
| | 2017 | | | 2018 | | | 2019 | |
| | HK$ | | | HK$ | | | HK$ | |
| | (in thousands) | |
Not yet due | | | 49,453 | | | | 95,470 | | | | 100,636 | |
Past due | | | | | | | | | | | | |
— Within 1 month | | | 41,553 | | | | 732 | | | | 42,014 | |
— 1 to 3 months | | | 1,701 | | | | 841 | | | | 20,092 | |
— Over 3 months | | | 466 | | | | 64,050 | | | | 7,859 | |
Total | | | 93,173 | | | | 161,093 | | | | 170,601 | |
The accounts receivable past due for over three months increased significantly from HK$0.5 million as at 31 December 2017 to HK$64.1 million as at 31 December 2018 and decreased significantly to HK$7.9 million as at 30 September 2019, primarily due to the outstanding balance of receivable from investment banking services of HK$60.3 million in 2018 that was fully settled in the first quarter of 2019. There was no impairment or write-off of our accounts receivables for the financial year ended 31 December 2017 and 2018, and the nine-month period ended 30 September 2019.
Financial assets at fair value through profit or loss
Our financial assets at fair value through profit or loss consists of (i) listed equity securities at quoted prices, primarily including our investment in Bank of Qingdao, (ii) unlisted equity securities, and (iii) unlisted debt securities, all of which relate to our strategic investment business. The following table sets forth a breakdown of our financial assets at fair value through profit or loss as at the dates indicated.
| | As at 31 December | | | As at 30 September | |
| | 2017 | | | 2018 | | | 2019 | |
| | HK$ | | | HK$ | | | HK$ | |
| | (in thousands) | |
Financial Assets at Fair Value Through Profit or Loss | | | | | | | | | |
Listed equity securities, at quoted prices | | | 730,000 | | | | 1,671,836 | | | | 1,432,377 | |
Unlisted equity securities | | | 15,629 | | | | 202,926 | | | | 318,486 | |
Unlisted debt securities | | | — | | | | 78,316 | | | | — | |
Total | | | 745,629 | | | | 1,953,078 | | | | 1,750,863 | |
Our financial assets at fair value through profit or loss increased significantly from HK$745.6 million as at 31 December 2017 to HK$2.0 billion as at 31 December 2018, primarily due to an increase in the carrying amount of listed equity securities from HK$730.0 million as at 31 December 2017 to HK$1.7 billion as at 31 December 2018, which in turn was attributable to (i) repayment of certain loaned stock of HK$661.0 million from a shareholder of our Controlling Shareholder during 2018, (ii) appreciation in value of our strategic investment in Bank of Qingdao of HK$207.4 million, and (iii) additional investments of HK$72.1 million made in 2018. As at 30 September 2019, our financial assets at fair value through profit or loss was HK$1.8 billion.
Stock loan
Our stock loan represents certain listed equity securities that we lent to a shareholder of our Controlling Shareholder, in September 2017 in connection with a stock borrowing and lending arrangement.
The fair value of our stock loan decreased by 10.4% from HK$1.5 billion as at 31 December 2018 to HK$1.4 billion as at 30 September 2019, primarily due to depreciation in value of the loaned stock.
The fair value of our stock loan decreased by 30.3% from HK$2.2 billion as at 31 December 2017 to HK$1.5 billion as at 31 December 2018, primarily due to repayment of certain loaned stock of HK$661.0 million from a shareholder of our Controlling Shareholder during 2018.
Bank balances—segregated accounts
Bank balances—segregated accounts represents clients' monies held on trust under custody relating to our asset management and other businesses, and cannot be used to settle our own obligations. Our bank balances—segregated accounts increased by 52.5% from HK$403.5 million as at 31 December 2017 to HK$615.5 million as at 31 December 2018, and decreased by 53.2% to HK$288.0 million as at 30 September 2019, primarily due to an changes in cash components of our asset management business.
Clients' monies held on trust
Clients' monies held on trust represents the balance payable to clients with respective monies held in segregated bank accounts under custody relating to our asset management and other businesses. The clients' monies held on trust increased by 53.1% from HK$383.3 million as at 31 December 2017 to HK$586.9 million as at 31 December 2018, and decreased by 48.8% to HK$300.4 million as at 30 September 2019, primarily due to an changes in cash components of our asset management business.
Margin loans payable
Margin loans payable represents our funding arrangement to acquire certain listed equity securities for trade settlement purposes.
Our margin loans payable decreased by 8.4% from HK$351.6 million as at 31 December 2017 to HK$322.0 million as at 31 December 2018, primarily due to repayment of existing margin loans and incurrence of new margin loans in 2018. As at 30 September 2019, our margin loans payable was HK$321.8 million.
Due from/(to) immediate holding company and fellow subsidiaries
Due from/(to) immediate holding company and fellow subsidiaries represents intercompany balances between our Controlling Shareholder and certain subsidiaries of our Controlling Shareholder, and the changes in balance were a result of the intercompany fund allocation arrangement of our Controlling Shareholder and its subsidiaries.
Liquidity and Capital Resources
Cash Flows
The following table sets forth a summary of our cash flows for the periods presented.
| | For the Year Ended 31 December | | | For the Nine Months Ended 30 September | |
| | 2017 | | | 2018 | | | 2018 | | | 2019 | |
| | HK$ | | | HK$ | | | HK$ | | | HK$ | |
| | (in thousands) | |
Summary Consolidated Cash Flow Data | | | | | | | | | | | | |
Net cash generated from operating activities | | | 84,327 | | | | 79,112 | | | | 393,730 | | | | 541,254 | |
Net cash used in investing activities | | | (139 | ) | | | (14 | ) | | | (14 | ) | | | (2,003,387 | ) |
Net cash (used in)/generated from financing activities | | | (67,283 | ) | | | (38,657 | ) | | | (358,156 | ) | | | 2,004,408 | |
Net increase in cash and cash equivalents | | | 16,905 | | | | 40,441 | | | | 35,560 | | | | 542,275 | |
Cash and cash equivalents at the beginning of year | | | 69,510 | | | | 86,415 | | | | 86,415 | | | | 126,856 | |
Cash and cash equivalents at the end of year | | | 86,415 | | | | 126,856 | | | | 121,975 | | | | 669,131 | |
Net cash generated from operating activities for the nine months ended 30 September 2019 was HK$541.3 million, which consists of our profit before tax of HK$881.0 million as adjusted for non-cash items and the effects of changes in operating assets and liabilities. Adjustments for non-cash items primarily included HK$611.7 million of net fair value changes on financial assets at fair value through profit or loss, stock loan and derivative financial instrument and dividend income in connection with our strategic investment business, partially offset by HK$97.9 million of finance costs relating to our margin loans, and proceeds from sales of financial assets at fair value through profit or loss. The principal items accounting for the changes in operating assets and liabilities were HK$143.2million of increase in other payables and accruals and clients' monies held on trust, partially offset by HK$20.2 million of increase in prepayments, other receivables and other assets.
Net cash generated from operating activities in 2018 was HK$79.1 million, which consists of our profit before tax of HK$609.0 million as adjusted for non-cash items and the effects of changes in operating assets and liabilities. Adjustments for non-cash items primarily included HK$256.5 million of fair value gain on financial assets at fair value through profit or loss and stock loan in connection with our strategic investment business, partially offset by HK$9.0 million of finance costs relating to our margin loans. The principal items accounting for the changes in operating assets and liabilities were (i) HK$699.9 million of decrease in amount with subsidiaries of our Controlling Shareholder attributable to intra-group treasury fund allocation and (ii) HK$67.9 million of increase in accounts receivable relating to the operations of our investment banking business, partially offset by (i) HK$439.2 million of increase in amount with our Controlling Shareholder attributable to intra-group treasury fund allocation and (ii) HK$81.8 million of increase in accounts and other payables and accruals primarily attributable to HK$55.1 million of asset management fee received in advance.
Net cash generated from operating activities in 2017 was HK$84.3 million, which consists of our profit before tax of HK$808.6 million as adjusted for non-cash items and the effects of changes in operating assets and liabilities. Adjustments for non-cash items primarily included HK$684.7 million of fair value gain on financial assets at fair value through profit or loss in connection with our strategic investment business, partially offset by HK$28.7 million of finance costs relating to our margin loans. The principal item accounting for the changes in operating assets and liabilities was (i) HK$284.5 million of increase in amount with our Controlling Shareholder attributable to allocation of costs and expenses by our Controlling Shareholder and (ii) HK$199.9 million of decrease in financial assets at fair value through profit or loss in connection with our strategic investment business, partially offset by HK$460.3 million of decrease in amount with subsidiaries of our Controlling Shareholder attributable to allocation of costs and expenses by our Controlling Shareholder. On 20 June 2019, we entered into the Transition Services Agreement with our Controlling Shareholder, which replaces such previous arrangements of expense allocation between our Company and our Controlling Shareholder. Accordingly such prior arrangements no longer exist since 20 June 2019.
Investing activities
Net cash used in investing activities for the nine months ended 30 September 2019 was HK$2 billion which was attributable to loan made to immediate holding company.
Net cash used in investing activities in 2018 was HK$14 thousand, which was attributable to the purchase of office equipment. Net cash used in investing activities in 2017 was HK$138.7 thousand, which was attributable to the purchase of office equipment.
Financing activities
Net cash generated from financing activities for the nine months ended 30 September 2019 was HK$2 billion, which was due to net fund raised from the U.S. IPO and issuance of warrants.
Net cash used in financing activities in 2018 was HK$38.7 million, which was due to repayment of margin loan payable of HK$29.6 million and HK$9.0 million of repayment of finance costs relating to the margin loan.
Net cash used in financing activities in 2017 was HK$67.3 million, which was due to repayment of margin loan payable of HK$38.6 million and HK$28.7 million of repayment of finance costs relating to the margin loan.
Prior to our initial offering on the NYSE, our principal sources of liquidity to finance our operating and investing activities have been net cash provided by operating activities. As at 30 September 2019, we had HK$669.1 million in cash and cash equivalents, out of which HK$445.3 million was held in U.S. dollars, HK$223.6 million was held in Hong Kong dollars, and the rest was held in other currencies. Our cash and cash equivalents primarily consist of cash on hand and general bank balances excluding segregated clients' bank account balances, which are unrestricted for withdrawal or use.
We believe that our current cash and cash equivalents and our anticipated cash flows from operations will be sufficient to meet our anticipated working capital requirements, capital expenditures, and debt repayment obligations for at least the next 12 months. We may decide to enhance our liquidity position or increase our cash reserves for future operations and investments through additional financing from time to time. The issuance and sale of additional equity would result in further dilution to our shareholders. The incurrence of indebtedness would result in increasing fixed obligations and could result in operating covenants that would restrict our operations.
Regulatory Capital Requirements
Subject to certain exemptions specified under the Securities and Futures (Financial Resources) Rules of Hong Kong (the "HK Financial Resources Rules"), two of our Hong Kong subsidiaries, AMTD Global Markets Limited and Asia Alternative Asset Partners Limited, are securities dealers registered with the HKSFC and thus are required to maintain minimum paid-up share capital in accordance with the HK Financial Resources Rules. The following table sets forth a summary of the key requirements on minimum paid-up share capital under the HK Financial Resources Rules that are applicable to AMTD Global Markets Limited and Asia Alternative Asset Partners Limited.
| Regulated Activities | | Minimum Amount of Paid-up Share |
AMTD Global Markets Limited. | A company licensed for Type 1, Type 2, Type 4, Type 6, and Type 9 regulated activities | | HK$10,000,000 |
Asia Alternative Asset Partners Limited | A company licensed for Type 1, Type 4, and Type 9 regulated activities | | HK$10,000,000 |
In addition, the HK Financial Resources Rules also require a licensed company to maintain minimum liquid capital. The minimum liquid capital requirements under the HK Financial Resources Rules that are applicable to AMTD Global Markets Limited and Asia Alternative Asset Partners Limited are the higher of the amount of (i) and (ii) below:
| Regulated Activities | | Minimum Amount of Liquid Capital |
AMTD Global Markets Limited. | A company licensed for Type 1, Type 2, Type 4, Type 6, and Type 9 regulated activities | | HK$3,000,000 |
Asia Alternative Asset Partners Limited | A company licensed for Type 1, Type 4, and Type 9 regulated activities | | HK$3,000,000 |
| (ii) | in the case of a company licensed for any regulated activities other than Type 3 regulated activities, its variable required liquid capital, which means 5% of the aggregate of (a) its adjusted liabilities, (b) the aggregate of the initial margin requirements in respect of outstanding futures contracts and outstanding options contracts held by it on behalf of its clients, and the aggregate of the amounts of margin required to be deposited in respect of outstanding futures contracts and outstanding options contracts held by it on behalf of its clients, to the extent that such contracts are not subject to the requirement of payment of initial margin requirements. |
Regulatory capital requirements could restrict AMTD Global Markets Limited and Asia Alternative Asset Partners Limited from expanding their businesses and declaring dividends if their net capital do not meet regulatory requirements. As at 31 December 2017 and 2018 and 30 September 2019, aggregate excess regulatory liquid capital was HK$126.2 million, HK$126.7 million, and HK$185.1 million for AMTD Global Markets Limited, and HK$0.7 million, HK$0.9 million, and HK$1.1 million for Asia Alternative Asset Partners Limited, respectively. As at the date of this Introductory Document, AMTD Global Markets Limited and Asia Alternative Asset Partners Limited are in compliance with its regulatory capital requirements.
Capital Expenditures
Our capital expenditures were HK$0.1 million in 2017, HK$14 thousand in 2018, and HK$14 thousand for the nine months ended 30 September 2019. In these periods, our capital expenditures were primarily used for purchases of office equipment in Hong Kong. We will continue to make capital expenditures to meet the expected growth of our business. Please see a detailed description, including the amount invested, of our material expenditure on and divestment of capital investment for FY2017, FY2018, 9M2019 and from 1 October 2019 to the Latest Practicable Date.
Capital Expenditure and Divestments
(HK$'000) | | FY2017 | | | FY2018 | | | 9M2019 | | | 1 October 2019 to the Latest Practicable Date | |
Additions | | | | | | | | | | | | |
Furnitures and fixtures | | | — | | | | — | | | | — | | | | — | |
Computer equipment. | | | 138.7 | | | | 14.2 | | | | 13.7 | | | | — | |
| | | 138.7 | | | | 14.2 | | | | 13.7 | | | | — | |
Disposals | | | | | | | | | | | | | | | | |
Furnitures and fixtures | | | — | | | | — | | | | — | | | | — | |
Computer equipment. | | | — | | | | — | | | | — | | | | — | |
The above capital expenditure was primarily financed by internal generated cash resources.
Contractual Obligations
We did not have any significant capital and other commitments, long-term obligations or guarantees as at the Latest Practicable Date.
Off-Balance Sheet Commitments and Arrangements
We have not entered into any financial guarantees or other commitments to guarantee the payment obligations of any third parties. In addition, except for the warrant we issued to Value Partners in March 2019, we have not entered into any derivative contracts that are indexed to our shares and classified as shareholder's equity or that are not reflected in our consolidated financial statements. For further details on the warrant, see the section entitled "Description of our Share Capital – History of Securities Issuances – Warrant". Furthermore, we do not have any retained or contingent interest in assets transferred to an unconsolidated entity that serves as credit, liquidity, or market risk support to such entity. We do not have any variable interest in any unconsolidated entity that provides financing, liquidity, market risk or credit support to us or engages in leasing, hedging, or product development services with us.
Significant Accounting Policies
We prepare our financial statements in accordance with IFRS issued by the IASB, which requires us to make judgments, estimates, and assumptions. We continually evaluate these estimates and assumptions based on the most recently available information, our own historical experience, and various other assumptions that we believe to be reasonable under the circumstances. Since the use of estimates is an integral component of the financial reporting process, actual results could differ from our expectations as a result of changes in our estimates. Some of our accounting policies require a higher degree of judgment than others in their application and require us to make significant accounting estimates.
The following descriptions of significant accounting policies, judgments, and estimates should be read in conjunction with our consolidated financial statements and other disclosures included in this Introductory Document. When reviewing our financial statements, you should consider (i) our selection of significant accounting policies, (ii) the judgments and other uncertainties affecting the application of such policies, and (iii) the sensitivity of reported results to changes in conditions and assumptions.
Fair Value Measurement
We measure our derivative financial instrument, debt and equity investments at fair value at the end of each reporting period. Fair value is the price that would be received to sell an asset or paid to transfer a liability in an orderly transaction between market participants at the measurement date. The fair value measurement is based on the presumption that the transaction to sell the asset or transfer the liability takes place either in the principal market for the asset or liability, or in the absence of a principal market, in the most advantageous market for the asset or liability. The principal or the most advantageous market must be accessible by us. The fair value of an asset or a liability is measured using the assumptions that market participants would use when pricing the asset or liability, assuming the market participants act in their best economic interest.
We use valuation techniques that are appropriate in the circumstances and for which sufficient data is available to measure fair value, maximizing the use of relevant observable inputs, and minimizing the use of unobservable inputs.
All assets and liabilities for which fair value is measured or disclosed in the consolidated financial statements are categorized within the fair value hierarchy, described as follows, based on the lowest level input that is significant to the fair value measurement as a whole:
· | Level 1—based on quoted prices (unadjusted) in active markets for identical assets or liabilities |
| |
· | Level 2—based on valuation techniques for which the lowest level input that is significant to the fair value measurement is observable, either directly or indirectly |
| |
· | Level 3—based on valuation techniques for which the lowest level input that is significant to the fair value measurement is unobservable |
For assets and liabilities that are recognized in the consolidated financial statements on a recurring basis, we determine whether transfers have occurred between levels in the hierarchy by reassessing categorization (based on the lowest level input that is significant to the fair value measurement as a whole) at the end of each reporting period.
Investments and Other Financial Assets
Initial Recognition and Measurement
Financial assets are classified, at initial recognition, as subsequently measured at amortized cost, fair value through other comprehensive income, and fair value through profit or loss.
The classification of financial assets at initial recognition depends on the financial asset's contractual cash flow characteristics and our business model for managing them. With the exception of trade receivables that do not contain a significant financing component or for which we have applied the practical expedient of not adjusting the effect of a significant financing component, we initially measure a financial asset at its fair value, plus in the case of a financial asset not at fair value through profit or loss, transaction costs. Trade receivables that do not contain a significant financing component or for which we have applied the practical expedient are measured at the transaction price determined under IFRS 15 in accordance with the policies set out in the section entitled "Management's Discussion and Analysis of Financial Condition and Results of Operations — Revenue Recognition".
Our business model for managing financial assets refers to how we manage our financial assets in order to generate cash flows. Our business model determines whether cash flows will result from collecting contractual cash flows, selling the financial assets, or both.
All regular way purchases and sales of financial assets are recognized on the trade date, which is the date that we commit to purchase or sell the asset. Regular way purchases or sales are purchases or sales of financial assets that require delivery of assets within the period generally established by regulation or convention in the marketplace.
Subsequent Measurement
The subsequent measurement of financial assets depends on their classification as follows:
Financial Assets at Fair Value Through Profit or Loss
Financial assets at fair value through profit or loss include financial assets held for trading, financial assets designated upon initial recognition at fair value through profit or loss, or financial assets mandatorily required to be measured at fair value. Financial assets are classified as held for trading if they are acquired for the purpose of selling or repurchasing in the near term. Financial assets with cash flows that are not solely payments of principal and interest are classified and measured at fair value through profit or loss, irrespective of the business model.
Financial assets at fair value through profit or loss are carried in the statement of financial position at fair value with net changes in fair value recognized in profit or loss.
This category includes derivative instruments and equity investments that we had not irrevocably elected to classify at fair value through other comprehensive income. Dividends on equity investments classified as financial assets at fair value profit or loss are also recognized as revenue in profit or loss when the right of payment has been established, it is probable that the economic benefits associated with the dividend will flow to us, and the amount of the dividend can be measured reliably.
Impairment of Financial Assets
We recognize an allowance for expected credit losses for all debt instruments not held at fair value through profit or loss. Expected credit losses are based on the difference between the contractual cash flows due in accordance with the contract and all the cash flows that we expect to receive, discounted at an approximation of the original effective interest rate. The expected cash flows will include cash flows from the sale of collateral held or other credit enhancements that are integral to the contractual terms.
General Approach
Expected credit losses are recognized in two stages. For credit exposures for which there has not been a significant increase in credit risk since initial recognition, expected credit losses are provided for credit losses that result from default events that are possible within the next 12-months (a 12-month expected credit losses). For those credit exposures for which there has been a significant increase in credit risk since initial recognition, a loss allowance is required for credit losses expected over the remaining life of the exposure, irrespective of the timing of the default (a lifetime expected credit loss).
At each reporting date, we assess whether the credit risk on a financial instrument has increased significantly since initial recognition. When making the assessment, we compare the risk of a default occurring on the financial instrument as at the reporting date with the risk of a default occurring on the financial instrument as at the date of initial recognition and considers reasonable and supportable information that is available without undue cost or effort, including historical and forward-looking information.
We consider a financial asset in default when contractual payments are 60-120 days past due. However, in certain cases, we may also consider a financial asset to be in default when internal or external information indicates that we are unlikely to receive the outstanding contractual amounts in full before taking into account any credit enhancements held by us. A financial asset is written off when there is no reasonable expectation of recovering the contractual cash flows.
Financial assets at amortized cost are subject to impairment under the general approach and they are classified within the following stages for measurement of expected credit losses except for trade receivables and contract assets, which apply the simplified approach as detailed below.
· | Stage 1—Financial instruments for which credit risk has not increased significantly since initial recognition and for which the loss allowance is measured at an amount equal to 12-month expected credit losses. |
| |
· | Stage 2—Financial instruments for which credit risk has increased significantly since initial recognition but that are not credit-impaired financial assets and for which the loss allowance is measured at an amount equal to lifetime expected credit losses. |
| |
· | Stage 3—Financial assets that are credit-impaired at the reporting date (but that are not purchased or originated credit-impaired) and for which the loss allowance is measured at an amount equal to lifetime expected credit losses. |
Simplified Approach
For accounts receivable that do not contain a significant financing component or when we apply the practical expedient of not adjusting the effect of a significant financing component, we apply the simplified approach in calculating expected credit losses. Under the simplified approach, we do not track changes in credit risk, but instead recognize a loss allowance based on lifetime expected credit losses at each reporting date. We have established a provision matrix that is based on its historical credit loss experience, adjusted for forward-looking factors specific to the debtors and the economic environment.
For accounts receivable that contain a significant financing component, we choose as our accounting policy to adopt the simplified approach in calculating expected credit losses with policies as described above.
Revenue Recognition
Revenue from Contracts with Customers
Revenue from contracts with customers is recognized when control of goods or services is transferred to the customers at an amount that reflects the consideration to which we expect to be entitled in exchange for those goods or services.
When the consideration in a contract includes a variable amount, the amount of consideration is estimated to which we will be entitled in exchange for transferring the goods or services to the customer. The variable consideration is estimated at contract inception and constrained until it is highly probable that a significant revenue reversal in the amount of cumulative revenue recognized will not occur when the associated uncertainty with the variable consideration is subsequently resolved.
The primary components of revenue are investment banking fee and income and asset management fee.
| (i) | Investment banking fee and income |
| |
| Investment banking service income is composed of underwriting commission, brokerage fee and financial advisory fee. Underwriting commission earned from underwriting equity and debt securities is recognized at the point in time when our performance under the terms of a contractual arrangement is completed, which is typically at the closing of a transaction if there is no uncertainty or contingency related to the amount to be paid. The normal credit term is 60 to 120 days upon the completion of performance. Brokerage fee earned from sales of equity and debt securities from underwriting is recognized at the point in time when the associated service is fulfilled, generally on the trade execution date. Financial advisory fee is recognized as advice is provided to the customer, based on the estimated progress of work and when revenue is not probable of a significant reversal. The majority of the contracts have a duration of 60 to 120 days. |
| (ii) | Asset management fee |
| |
| Asset management fee primarily includes fees associated with asset management, performance-based incentive fee, brokerage and handling fee. Substantially all of the management fee and the performance-based incentive fee are subject to variable consideration based on the underlying AUM of a customer's account. Management fee is recognized when services are performed and the fee becomes known. Performance-based incentive fee is recognized when the performance target is met and the revenue is not probable of a significant reversal. For the years ended 31 December 2017 and 2018 and the nine months ended 30 September 2019, no revenue was related to such variable consideration and recognized from performance obligations satisfied in previous periods. Brokerage and handling fees are recognized at the point in time when the associated service is fulfilled, generally on the trade execution date. |
Revenue from Other Sources
Net fair value changes on financial assets at fair value through profit or loss and stock loan and those held for trading, including realized gains or losses which are recognized on the transaction dates when the relevant debt and equity securities are disposed and unrealized fair value changes which are recognized in the period in which they arise.
Dividend income is recognized when the shareholders' right to receive payment has been established, it is probable that the economic benefits associated with the dividend will flow to us and the amount of the dividend can be measured reliably.
Contract liabilities
A contract liability is the obligation to transfer goods or services to a customer for which we had received a consideration (or an amount of consideration that is due) from the customer. If a customer pays the consideration before we transfer goods or services to the customer, a contract liability is recognized when the payment is made or the payment is due (whichever is earlier). Contract liabilities are recognized as revenue when we perform under the contract.
Since 2018, for certain customers of our asset management service, we require upfront payment of management fee and recorded such upfront fee as contract liabilities in other payables and accruals. Upfront fee is recognized as revenue based on the time elapsed for the service period. Asset management contracts normally cover periods of one to three years.
Related Parties
A party is considered to be related to us if:
| (i) | the party is a person or a close member of that person's family and that person |
| (a) | has control or joint control over us; |
| | |
| (b) | has significant influence over us; or is a member of our key management personnel or of our parent; or |
| (ii) | the party is an entity where any of the following conditions applies: |
| (a) | we and the entity are members of a same group; |
| | |
| (b) | one entity is an associate or joint venture of the other entity (or of a parent, subsidiary, or fellow subsidiary of the other entity); |
| | |
| (c) | we and the entity are joint ventures of the same third-party; |
| | |
| (d) | one entity is a joint venture of a third entity and the other entity is an associate of the third entity; |
| | |
| (e) | the entity is a post-employment benefit plan for the benefit of either our employees or employees of an entity related to us, and the sponsoring employers of the post-employment benefit plan; |
| | |
| (f) | the entity is controlled or jointly controlled by a person identified in (i); |
| | |
| (g) | a person identified in (i)(a) has significant influence over the entity or is a member of the key management personnel of the entity (or of a parent of the entity); and |
| | |
| (h) | the entity, or any member of a group of which it is a part, provides key management personnel services to us or to our parent. |
Internal Control Over Financial Reporting
We are a public company in the United States and subject to the reporting requirements of the Exchange Act, the Sarbanes-Oxley Act of 2002. We have implemented and plan to implement a number of measures to maintain and improve our internal control over financial reporting. We have (i) established clear roles and responsibilities for accounting and financial reporting staff to address complex accounting and financial reporting issues, (ii) enhanced documentation procedures to be followed by accounting and financial reporting staff, and (iii) added resources to establish effective oversight and implement reporting requirements for related party transactions to ensure related accounting treatment and disclosure are accurate, complete and in compliance with IFRS. In addition, we plan to, among others, (i) establish an internal audit department with sufficient resources and experienced personnel to design, review and monitor internal control over financial reporting, (ii) continue to organize regular training for our accounting and reporting staff, especially training related to complex accounting standards and updates on IFRS reporting requirements, and (iii) develop a systematic risk assessment process over financial reporting.
As a company with less than US$1.07 billion in revenue for our last fiscal year, we qualify as an "emerging growth company" pursuant to the JOBS Act. An emerging growth company may take advantage of specified reduced reporting and other requirements that are otherwise applicable generally to public companies. These provisions include exemption from the auditor attestation requirement under Section 404 of the Sarbanes-Oxley Act of 2002 in the assessment of the emerging growth company's internal control over financial reporting.
Holding Company Structure
AMTD International Inc. is a holding company with no material operations of its own. We conduct our operations primarily through our Hong Kong subsidiaries. As a result, our ability to pay dividends depends upon dividends paid by our Hong Kong subsidiaries. If our existing Hong Kong subsidiaries or any newly formed ones incur debt on their own behalf in the future, the instruments governing their debt may restrict their ability to pay dividends to us.
Inflation
To date, inflation in Hong Kong has not materially affected our results of operations. According to the Census and Statistics Department of Hong Kong, the year-over-year percent changes in the consumer price index for December 2017 and 2018 were increases of 1.7% and 2.5%, respectively. Although we have not been materially affected by inflation in the past, we may be affected if Hong Kong experiences higher rates of inflation in the future.
Quantitative and Qualitative Disclosures about Market Risk
Price risk
Equity price risk is the risk that the fair values of equity investments decrease as a result of changes in the levels of equity indices and the value of individual securities.
We are exposed to equity securities price risk because certain investments held by us are classified in the consolidated statements of financial position as financial assets at fair value through profit or loss. Results for the year would increase or decrease as a result of gains or losses on equity securities classified as financial assets at fair value through profit or loss.
As at 30 September 2019, our strategic investment portfolio reached an aggregate fair value of HK$3.9 billion, of which our investment related to Bank of Qingdao accounted for 91.9%. Given our significant stake in, and affiliation with, Bank of Qingdao, our investment in Bank of Qingdao is subject to liquidity and concentration risk.
Foreign exchange risk
Most of our revenues and expenses are denominated in Hong Kong dollars or U.S. dollars. Certain of our transactions are denominated in foreign currencies and therefore we are exposed to foreign currency risk. We do not believe that we currently have any significant direct foreign exchange risk and have not used any derivative financial instruments to hedge exposure to such risk. Although our exposure to foreign exchange risks should be limited in general, the value of your investment in the ADSs and/or Class A Shares will be affected by the exchange rate between U.S. dollars and Hong Kong dollars because the value of our business is mainly denominated in Hong Kong dollars, while the ADSs will be traded in U.S. dollars and our Class A Shares will be traded in Singapore dollars.
In addition, foreign exchange risk also arises from the possibility that fluctuations in foreign exchange rates can impact the value of financial instruments. We are exposed to minimal foreign exchange risk since Hong Kong dollars are pegged against U.S. dollars. The impact of foreign exchange fluctuations in our earnings is included in foreign exchange differences, net in the consolidated statements of cash flows.
To the extent we need to convert U.S. dollars into Hong Kong dollars for our operations, appreciation of Hong Kong dollar against the U.S. dollar would reduce the amount in Hong Kong dollars we receive from the conversion. Conversely, if we decide to convert Hong Kong dollars into U.S. dollars for the purpose of making payments for dividends on our Class A Shares or ADSs, servicing our outstanding debt, or for other business purposes, appreciation of the U.S. dollar against the Hong Kong dollar would reduce the U.S. dollar amounts available to us.
Interest rate risk
Our exposure to interest rate risk primarily relates to the bank balances and loans receivable. We have not been exposed to material risks due to changes in interest rates, and we have not used any derivative financial instruments to manage our interest risk exposure. However, our future interest income may fall short of expectations due to changes in market interest rates.
Credit risk
We have adopted a policy of only dealing with creditworthy counterparties, as a means of mitigating the risk of financial loss from defaults. Our exposure to our counterparties are continuously monitored and the aggregate value of transactions concluded is spread amongst approved counterparties. Our credit exposure is controlled by counterparty limits that are reviewed and approved by our senior management periodically.
We do not have any significant credit risk exposure to any single counterparty or any group of counterparties having similar characteristics. The credit risk on liquid funds is limited because the counterparties are mainly banks with sound credit. The credit risk on our debt instruments is not significant.
Recently Issued Accounting Pronouncements
A list of recently issued accounting pronouncements that are relevant to us is included in Note 2.2 to our consolidated financial statements included elsewhere in this Introductory Document.
CORPORATE STRUCTURE AND OWNERSHIP
Corporate Structure
In January 2003, AMTD Group (formerly known as All Day Enterprises Limited), our Controlling Shareholder, was founded by CK Hutchison Holdings Limited (SEHK: 0001) under the laws of the British Virgin Islands to provide financial services. Subsequently in 2015, L.R. Capital Group became an indirect controlling shareholder of AMTD Group, and in the same year, we commenced our current investment banking, asset management, and strategic investment businesses.
Restructuring
From February to April 2019, we carried out a restructuring to carve out our investment banking, asset management, and strategic investment businesses from our Controlling Shareholder. As part of the restructuring, in February 2019, AMTD International Inc. was incorporated under the laws of the Cayman Islands initially as a wholly-owned subsidiary of our Controlling Shareholder. With respect to our strategic investment business, we incorporated AMTD Investment Inc. under the laws of the Cayman Islands as a wholly-owned subsidiary of our Company in February 2019, and injected assets relating to certain strategic investments into AMTD Investment Inc. in March 2019. With respect to our investment banking and asset management businesses, we submitted an application to the HKSFC in February 2019 for AMTD International Inc. to own 100% of the shares in AMTD International Holding Group Limited, which is the parent of AMTD Securities Limited, AMTD Global Markets Limited, and Asia Alternative Asset Partners Limited. In April 2019, the HKSFC approved our application and we completed our restructuring. As a result, AMTD International Inc. became the holding company of our businesses. The following diagram illustrates the corporate structure of AMTD International Inc. and its subsidiaries as at the Latest Practicable Date:
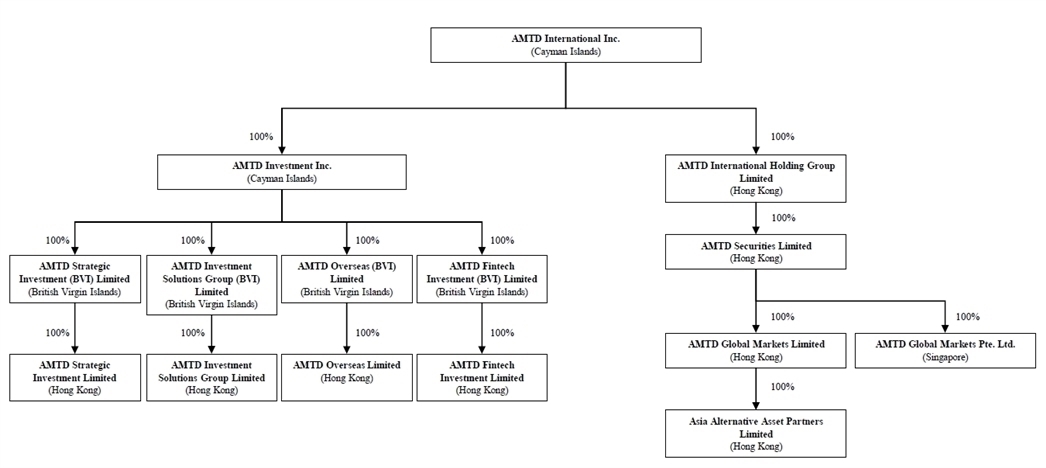
Between April and June 2019, we raised an aggregate of US$63.5 million from a group of investors by issuing Class A Shares and through the exercise of their warrant.
In December 2019, we raised an aggregate of US$115.0 million from a group of investors by issuing Class A Shares and Class B ordinary shares and convertible notes.
For further details, see the section entitled "Description of Share Capital—History of Securities Issuances".
Our Subsidiaries and Business Functions
Investment Banking and Asset Management
AMTD International Holding Group Limited is our holding company for the investment banking and asset management businesses. We currently provide investment banking services and asset management services primarily through AMTD Global Markets Limited, which is an HKSFC-licensed company and an indirectly wholly-owned subsidiary of AMTD International Holding Group Limited.
In addition, we have two companies under our investment banking and asset management businesses: (i) Asia Alternative Asset Partners Limited, an HKSFC-licensed company, and (ii) AMTD Securities Limited, an intermediate holding company.
AMTD Global Markets Limited. AMTD Global Markets Limited was incorporated in December 2002 in Hong Kong under the name of Joyful Crown Development Limited. We changed its name to AMTD Financial Planning Limited in January 2003. In January 2003, AMTD Group, through acquisition of entire share capital, became the sole shareholder of AMTD Financial Planning Limited. In December 2014, AMTD Financial Planning Limited changed its name to AMTD Asset Management Limited. In January 2018, AMTD Asset Management Limited changed its name to AMTD Global Markets Limited, the current name in use. AMTD Global Markets Limited currently holds Type 1 license, Type 2 license, Type 4 license, Type 6 license, and Type 9 license granted by the HKSFC to provide services under the Securities and Futures Ordinance (Cap. 571) of Hong Kong. AMTD Global Markets Limited is also a principal intermediary licensed with the Mandatory Provident Fund Schemes Authority in Hong Kong and a member of the Hong Kong Confederation of Insurance Brokers. For further details, see "Appendix B – Regulatory Overview – Summary of Relevant Hong Kong Laws and Regulations – Licensing Regime Under the HKSFO".
AMTD International Holding Group Limited and AMTD Securities Limited. In June 2011, we incorporated AMTD Asset Management Limited and AMTD Securities Limited under the laws of Hong Kong as holding companies of AMTD Global Markets Limited. In December 2014, AMTD Asset Management Limited changed its name to AMTD Financial Planning Limited and, in March 2019, to AMTD International Holding Group Limited, the current name in use.
Asia Alternative Asset Partners Limited. In April 2016, AMTD Global Markets Limited acquired a 100% stake in Asia Alternative Asset Partners Limited, a company incorporated in Hong Kong in March 2003 under the name of Blooming Cape Limited. Blooming Cape Limited later changed its name to Harcourt Advisory Services Limited in July 2003 and changed its name again to the current name in use in February 2007. Asia Alternative Asset Partners Limited currently holds Type 1 license, Type 4 license and Type 9 license granted by the HKSFC. For further details, see "Appendix B – Regulatory Overview – Summary of Relevant Hong Kong Laws and Regulations – Licensing Regime Under the HKSFO".
AMTD Investment Solutions Group Limited and AMTD Strategic Investment Limited. In July 2016, AMTD Investment Solutions Group Limited was incorporated under the laws of Hong Kong to hold certain investments. In June 2017, we incorporated another subsidiary, AMTD Strategic Investment Limited, under the laws of Hong Kong to hold certain investments.
AMTD Overseas Limited and AMTD Fintech Investment Limited. In December 2016, AMTD Overseas Limited, formerly known as AMTD Europe Holdings Limited, was incorporated under the laws of Hong Kong to hold certain investments. In August 2018, AMTD Fintech Investment Limited was incorporated under the laws of Hong Kong to hold certain investments.
AMTD Global Markets Pte. Ltd. In January 2020, we established a wholly-owned subsidiary in Singapore, namely AMTD Global Markets Pte. Ltd., which is held by AMTD Securities Limited.
The following table sets forth the name change history and licenses held by our Company and subsidiaries.
Entity Name | Name Change History | Licenses |
AMTD International Inc. (incorporated in the Cayman Islands) | • AMTD Inc. (incorporated on February 4, 2019) • AMTD International Inc. (renamed on February 13, 2019) | — |
AMTD International Holding Group Limited (incorporated in Hong Kong) | • AMTD Asset Management Limited (incorporated on June 1, 2011) • AMTD Financial Planning Limited (renamed on December 31, 2014) • AMTD International Holding Group Limited (renamed on March 14, 2019) | — |
AMTD Securities Limited (incorporated in Hong Kong) | AMTD Securities Limited (incorporated on June 1, 2011) | — |
AMTD Global Markets Limited (incorporated in Hong Kong) | • Joyful Crown Development Limited (incorporated on December 13, 2002) • AMTD Financial Planning Limited (renamed on January 24, 2003) • AMTD Asset Management Limited (renamed on December 31, 2014) • AMTD Global Markets Limited (renamed on January 15, 2018) | • Membership of The Hong Kong Confederation of Insurance Brokers (obtained on April 22, 2003) • HKSFC Type 4 regulated activities (obtained on December 3, 2004) • Mandatory Provident Fund Principal Intermediary (registered on May 14, 2008) • HKSFC Type 1 regulated activities (obtained on October 13, 2008) • HKSFC Type 9 regulated activities (obtained on July 22, 2011) • HKSFC Type 2 regulated activities (obtained on March 24, 2016) • HKSFC Type 6 regulated activities (obtained on September 19, 2016) |
Asia Alternative Asset Partners Limited (incorporated in Hong Kong) | • Blooming Cape Limited (incorporated on March 18, 2003) • Harcourt Advisory Services Limited (renamed on July 23, 2003) • Asia Alternative Asset Partners Limited (renamed on February 8, 2007) | • HKSFC Types 4 and 9 regulated activities (obtained on January 11, 2005) • HKSFC Type 1 regulated activities (obtained on June 29, 2007) |
AMTD Investment Inc. (incorporated in the Cayman Islands) | • AMTD Investment Inc (incorporated on February 8, 2019) • AMTD Investment Inc. (renamed on March 7, 2019) | — |
AMTD Investment Solutions Group Limited (incorporated in Hong Kong) | AMTD Investment Solutions Group Limited (incorporated on July 28, 2016) | — |
AMTD Overseas Limited (incorporated in Hong Kong) | • AMTD Europe Holdings Limited (incorporated on December 16, 2016) • AMTD Overseas Limited (renamed on March 15, 2018) | — |
AMTD Strategic Investment Limited (incorporated in Hong Kong) | AMTD Strategic Investment Limited (incorporated on June 26, 2017) | — |
AMTD Fintech Investment Limited (incorporated in Hong Kong) | AMTD Fintech Investment Limited (incorporated on August 31, 2018) | — |
AMTD Investment Solutions Group (BVI) Limited (incorporated in the British Virgin Islands) | AMTD Investment Solutions Group (BVI) Limited (incorporated on March 13, 2019) | — |
AMTD Overseas (BVI) Limited (incorporated in the British Virgin Islands) | AMTD Overseas (BVI) Limited (incorporated on March 12, 2019) | — |
AMTD Strategic Investment (BVI) Limited (incorporated in the British Virgin Islands) | AMTD Strategic Investment (BVI) Limited (incorporated on March 14, 2019) | — |
AMTD Fintech Investment (BVI) Limited (incorporated in the British Virgin Islands) | AMTD Fintech Investment (BVI) Limited (incorporated on March 13, 2019) | — |
AMTD Global Markets Pte. Ltd. (incorporated in Singapore) | AMTD Global Markets Pte. Ltd. (incorporated on January 16, 2020) | — |
Strategic Investment
AMTD Investment Inc. is our holding company for the strategic investment business. We currently hold our strategic investments through (i) AMTD Investment Solutions Group Limited, (ii) AMTD Strategic Investment Limited, (iii) AMTD Overseas Limited, and (iv) AMTD Fintech Investment Limited.
In addition, we have four intermediate holding companies under our strategic investment business: (i) AMTD Investment Solutions Group (BVI) Limited, (ii) AMTD Strategic Investment (BVI) Limited, (iii) AMTD Overseas (BVI) Limited, and (iv) AMTD Fintech Investment (BVI) Limited.
Implications of Being an Emerging Growth Company
As a company with less than US$1.07 billion in revenue for our last fiscal year, we qualify as an "emerging growth company" pursuant to the Jumpstart Our Business Startups Act of 2012, as amended, or the JOBS Act. An emerging growth company may take advantage of specified reduced reporting and other requirements compared to those that are otherwise applicable generally to public companies. These provisions include exemption from the auditor attestation requirement under Section 404 of the Sarbanes-Oxley Act of 2002 in the assessment of the emerging growth company's internal control over financial reporting. The JOBS Act also provides that an emerging growth company does not need to comply with any new or revised financial accounting standards until such date that a private company is otherwise required to comply with such new or revised accounting standards. We do not plan to "opt out" of such exemptions afforded to an emerging growth company.
We will remain an emerging growth company until the earliest of (i) the last day of the fiscal year during which we have total annual gross revenues of at least US$1.07 billion; (ii) the last day of our fiscal year following the fifth anniversary of the completion of 5 August 2019, being the date of the initial public offering of our Company on the NYSE; (iii) the date on which we have, during the preceding three-year period, issued more than US$1.0 billion in non-convertible debt; or (iv) the date on which we are deemed to be a "large accelerated filer" under the Securities Exchange Act of 1934, as amended, or the Exchange Act, which would occur if the market value of the ADSs that are held by non-affiliates exceeds US$700 million as at the last business day of our most recently completed second fiscal quarter. Once we cease to be an emerging growth company, we will not be entitled to the exemptions provided in the JOBS Act discussed above.
Implications of Being a Controlled Company
Our Controlling Shareholder beneficially owns 79.1% of our total issued and outstanding ordinary shares, representing 96.6% of the total voting power. As a result, we are a "controlled company" as defined under the NYSE Listed Company Manual because our Controlling Shareholder holds more than 50% of the voting power for the election of directors. As a "controlled company", we are permitted to elect not to comply with certain corporate governance requirements. We elect to rely on exemptions with respect to the requirement that a majority of the board of directors consist of independent directors, the requirement that we have a nominating and corporate governance committee that is composed entirely of independent directors, and the requirement that we have a compensation committee that is composed entirely of independent directors.
Implications of Being a Foreign Private Issuer
We are a foreign private issuer within the meaning of the rules under the Exchange Act, and as such we are exempt from certain provisions of the securities rules and regulations in the United States that are applicable to U.S. domestic issuers. Moreover, the information we are required to file with or furnish to the SEC will be less extensive and less timely compared to that required to be filed with the SEC by U.S. domestic issuers. In addition, as a company incorporated in the Cayman Islands, we are permitted to adopt certain home country practices in relation to corporate governance matters that differ significantly from the NYSE corporate governance listing standards. These practices may afford less protection to shareholders than they would enjoy if we complied fully with the NYSE corporate governance listing standards. Currently, we do not rely on home country practices with respect to our corporate governance.
Corporate Information
Our principal executive office is located at 23/F Nexxus Building, 41 Connaught Road Central, Hong Kong. Our telephone number at this address is +852 3163-3389 and our facsimile number is+852 3163-3289. Our registered office in the Cayman Islands is located at Cricket Square, Hutchins Drive, P.O. Box 2681, Grand Cayman, KY1-1111, Cayman Islands. Our agent for service of process in the United States is Puglisi & Associates, located at 850 Library Avenue, Suite 204, Newark, DE 19711.
Recipients of this Introductory Document should contact us for any inquiries through the address and telephone number of our principal executive office. Our website is www.amtdinc.com and our email address is enquiry@amtdinc.com. The information contained on our website is not a part of this Introductory Document.
BUSINESS
OVERVIEW
We are a leading Hong Kong-headquartered comprehensive financial institution. According to the CIC Report, we are the No. 1 independent investment banking firm in Asia as measured by both the number and the aggregate offering size of Hong Kong and U.S. IPOs completed in each of 2018 and the nine months ended 30 September 2019, and the largest independent asset management firm in Asia in serving both PRC regional banks and New Economy Companies as measured by AUM as at 30 September 2019.
We are one of the few financial institutions with extensive financial industry knowledge and experience across Greater China that is majority-owned and managed by local Hong Kong entrepreneurs and professionals. This genuine "Hong Kong-owned" identity positions us to play an instrumental role in connecting local clients from Hong Kong and China with global capital markets. Furthermore, we see increasing business needs and opportunities for these clients to connect with Southeast Asia through Singapore as the gateway. Compared to other global and Chinese market players in Hong Kong, we believe that we benefit from greater execution efficiency, superior local market and industry know-how, and unparalleled access to the sizeable capital of Asia's tycoon families.
Our global capital markets expertise, coupled with deep roots in Asia, have propelled us to become one of the "go-to" financial institutions in Hong Kong, fulfilling the complex financial needs of our clients across all phases of their growth and development. Our clientele includes PRC banks, privately-owned companies primarily in new economy sectors, and Hong Kong-based blue-chip conglomerates, among others.
We operate a full-service platform encompassing three business lines: investment banking, asset management, and strategic investment.
· | Leading Investment Banking Business. We offer a broad range of investment banking services, including equity underwriting, debt underwriting, advisory (on credit rating, financing, and mergers and acquisitions transactions), securities brokerage, institutional sales and distribution, and research, among others. According to the CIC Report, we ranked first among all independent investment banking firms in Asia as measured by both the number and the aggregate offering size of Hong Kong and U.S. IPOs completed in each of 2018 and the nine months ended 30 September 2019, and ranked in the top ten as a bookrunner among all investment banking firms as measured by the number of Hong Kong IPOs priced in each of the two periods. We also ranked in the top ten among all global investment banking firms operating in Asia (excluding China-headquartered investment banking firms) as measured by the aggregate number of high-yield bond offerings by China-based companies and AT1 capital preferred share offerings by PRC regional banks in 2017, 2018 and the nine months ended 30 September 2019 combined. |
| |
· | Top-tier Asset Management Services. We provide professional investment management and advisory services primarily to corporate and other institutional clients. According to the CIC Report, we are one of the five largest HKSFC-licensed asset management firms headquartered in Hong Kong, and also the largest independent asset management firm in Asia in serving both PRC regional banks and New Economy Companies, in each case as measured by AUM as at 30 September 2019. Our AUM was HK$24.4 billion as at 30 September 2019, of which 15.8% was attributable to PRC regional banks and 80.5% was attributable to New Economy Companies. |
| |
· | Proven Strategic Investment Platform. We make long-term strategic investments focusing on Asia's financial and new economy sectors. Through investing in market leaders and technological innovators, we gain access to unique opportunities and resources that complement our other businesses and enhance our "AMTD SpiderNet" ecosystem. For the year ended 31 December 2018, we recorded dividend and gain related to disposed investment of HK$99.2 million. For the nine months ended 30 September 2019, we recorded dividend and gain related to disposed investment of HK$100.6 million. For the year ended 31 December 2018 and the nine months ended 30 September 2019, we recorded net fair value changes on stock loan, derivative financial instrument and financial assets at fair value through profit or loss of HK$256.5 million and HK$519.4 million, respectively, both from our strategic investment business. |
The following diagram illustrates our business structure.

_______________
Notes:
| (1) | Executive management committee is responsible for (i) overseeing our operational and business activities, (ii) managing risks across all business units and mid-to-back office functions, and (iii) implementing and executing policies and strategies as determined by our Board. |
| |
| (2) | Investment banking executive committee is responsible for (i) approving acceptance of new business mandates, (ii) the overall review and management of potential risks and conflicts that may arise from new business mandates, and (iii) reviewing and approving the execution of investment banking transactions. |
| |
| (3) | Investment committee is responsible for (i) reviewing and approving the investment-related activities across asset classes, (ii) providing parameters and guidance to the investment team, and (iii) post-investment management. |
We align ourselves with clients, shareholders, business partners, and investee companies to build an ever-extending, inter-connected network that creates value for all stakeholders, or the "AMTD SpiderNet" ecosystem. We believe that our "AMTD SpiderNet" ecosystem is the bedrock of our success. We actively help stakeholders in our ecosystem to explore business collaboration opportunities among themselves and provide financial solutions or additional resources needed to facilitate such collaboration. This, in turn, results in enduring relationships within the network, and expand the network by attracting corporations, industry associations, and other institutions seeking business opportunities and efficient channels of resources. This unique "AMTD SpiderNet" ecosystem, coupled with our ability to provide innovative and bespoke solutions, is a key growth driver of our overall businesses.
Our Competitive Strengths
We believe that our proven track record of success and distinctive brand coupled with the following strengths give us significant competitive advantage.
Premier investment banking and asset management platform in Asia
According to the CIC Report, we are the No. 1 independent investment banking firm in Asia as measured by both the number and the aggregate offering size of Hong Kong and U.S. IPOs completed in each of 2018 and the nine months ended 30 September 2019, and also ranked in the top ten as a bookrunner among all investment banking firms as measured by the number of Hong Kong IPOs priced in each of the two periods. We also ranked in the top ten among all global investment banking firms operating in Asia (excluding China-headquartered investment banking firms) as measured by the aggregate number of high-yield bonds issued by China-based companies and AT1 capital preferred share offerings completed by PRC regional banks in 2017, 2018 and the nine months ended 30 September 2019 combined.
From the inception of our investment banking business in October 2015 to February 2020, we completed 52 equity offerings in Hong Kong and the United States as an underwriter or financial advisor, with an aggregate offering size of US$23.7 billion, including through the exercise of over-allotment options. Also during the same period, we completed 107 debt offerings, including offerings of high-yield bonds, investment grade bonds, unrated bonds, and AT1 capital preferred shares, with an aggregate offering size of US$41.8 billion.
We are the largest independent asset management firm in Asia in serving both PRC regional banks and New Economy Companies in terms of AUM as at 30 September 2019, and one of the five largest HKSFC-licensed asset management firms headquartered in Hong Kong, in each case as measured by AUM as at 30 September 2019, according to the CIC Report. As at 30 September 2019, our AUM was HK$24.4 billion, of which 15.8% is attributable to PRC regional banks and 80.5% is attributable to New Economy Companies.
We believe that we can expand our industry-leading positions by leveraging our "AMTD SpiderNet" ecosystem, high-calibre professionals, comprehensive business coverage, and unparalleled access to the sizable capital of Asia's tycoon families.
Fast-rising and active "super-connector" with unique brand identity
We believe that we have established a unique identity as an industry leader that is majority-owned and managed by Hong Kong entrepreneurs and professionals. This uniquely positions us as one of the most influential "super-connectors" in the region, bridging Hong Kong and China-based corporate and other institutional clients with global markets. We have played a prominent role in numerous international events and initiatives to promote Hong Kong and "super-connect" China and the rest of the world through our extensive "AMTD SpiderNet" ecosystem.
Since 2017, we have strategically positioned ourselves in Asia to optimize our role as a "super-connector". For instance, we have acted as a grand sponsor and keynote speaker of the 2017, 2018 and 2019 Singapore Fintech Festival, the world's then largest financial technology conference together with several other top-notch global enterprises. Our Chairman of the Board and Chief Executive Officer, Calvin Choi, was invited to be a guest speaker during the 10th anniversary celebration of Singapore Exchange Limited in Beijing, China. In early 2019, we were invited by the ASEAN Bankers Association, the Monetary Authority of Singapore, and the International Finance Corporation to become the first and one of the only two corporate founding members of the ASEAN Financial Innovation Network (AFIN), which was founded primarily to foster financial technology development in ASEAN countries focusing on financial inclusion. In Indonesia, we introduced our Controlling Shareholder to invest in a fast-growing online consumer finance platform, Awan Tunai. Through these strategic collaborations, we have established regional footprints and connections across Southeast Asia, which creates new opportunities for all stakeholders in our "AMTD SpiderNet".
Furthermore, we are the only global strategic partner associate of the World Economic Forum among Hong Kong-headquartered financial institutions as at the date of this Introductory Document. In the 2018, 2019 and 2020 Forums in Davos, Switzerland, we established the "AMTD House", which was the first corporate center set up by a Hong Kong enterprise in its history, and further established "AMTD Hotel" in the World Economic Forum 50th AM held in January 2020 in Davos. We also hosted various AMTD-branded industry initiatives and social events that were attended by many high-ranking government officials, renowned academics, and prominent business leaders from around the world. We were also the sole strategic partner of and, together with the Hong Kong government, co-hosted the world's first cross-border financial technology conference, Hong Kong Fintech Week 2018 and 2019, which focused on Hong Kong's key role in the Greater Bay Area's financial technology industry. We also co-hosted the second Start-up Express Pitching Final with Hong Kong Trade Development Council and Our Hong Kong Foundation as the sole strategic partner in May 2019.
We initiated and established Regional Banks+ Strategic Cooperation Alliance through partnering with seven leading regional banks from China, Hong Kong and the United States, and the Greater Bay Young Entrepreneurs Association by partnering with a number of leading new economy start-up companies headquartered in China's Greater Bay Area, which includes Hong Kong, Macau, and nine cities in Guangdong province of China. We proactively seek opportunities to spearhead a variety of initiatives because we believe it allows us to establish our unique brand identity on a global scale, creating new business opportunities, expanding our client reach, and enhancing and enriching our connectivity within the "AMTD SpiderNet" ecosystem. For further details, see the section entitled "Business—Our Partnership Approach—'AMTD SpiderNet' Enhanced by Our 'Super-Connector' Role".
Unique "AMTD SpiderNet" ecosystem fostering rapid multi-dimensional expansion
Our diverse and enriching initiatives and network of connections, together with our large client base to whom we provide a broad range of financial services, have resulted in multi-faceted relationships and the formation of our "AMTD SpiderNet" ecosystem—an ever-extending network in which we, together with our clients, shareholders, business partners, and investee companies, actively explore business collaboration opportunities. We do not regard any single stakeholder, service, or sector as an individual and isolated opportunity. Rather, we strive to connect and fulfill the needs and interests of multiple stakeholders in our ecosystem, especially those that might not be apparent or yield immediate returns in the first instance. By embracing the "AMTD SpiderNet" culture, we go beyond servicing one client offering one product at a time. Instead, we empower innovation and collaboration among multiple stakeholders by making full use of the uniqueness of our "AMTD SpiderNet", and uncover and create value for everyone, resulting in greater synergies, and stronger connections and economic benefits for us and all of our stakeholders.
For example, (i) Xiaomi Corporation engaged us as their joint bookrunner in its US$5.4 billion Hong Kong IPO in June 2018, (ii) Xiaomi Corporation's wholly-owned subsidiary is a joint-venture partner of our Controlling Shareholder in establishing a financial platform, Gravitation Fintech HK Limited, which holds one of the only eight licensed virtual banks in Hong Kong as at the date of this Introductory Document, (iii) Xiaomi Corporation is a principal shareholder of Up Fintech Holding Limited, the parent company of Tiger Brokers, with whom we have a strategic partnership to expand our investment banking coverage network. As a result of our effort and overall coordination, Xiaomi Corporation placed a sole order through us to further invest in the U.S. IPO of Up Fintech Holding Limited, in which we acted as one of the lead banks and joint bookrunners and (iv) Xiaomi Corporation became our shareholder. Furthermore, in January 2020, Xiaomi Finance, a subsidiary of Xiaomi Corporation, and our Controlling Shareholder, together with SP Group and Funding Societies jointly announced the formation of an exclusive strategic partnership and submission of an application to Monetary Authority of Singapore for a digital wholesale banking license on 31 December 2019. The digital banking licenses are expected to allow entities, including non-bank players to conduct digital banking businesses in Singapore. In addition, Xiaomi Finance and our Controlling Shareholder, together with Singapore Management University and the Institute of Systems Science at the National University of Singapore signed a memorandum of understanding during World Economic Forum 50th AM to form a long-term partnership to set up the 'Singapore Digital Finance Leadership Programme'. For further details, see the section entitled "Business—Our Partnership Approach—'AMTD SpiderNet' Enhanced by Our 'Super-Connector' Role".
Comprehensive one-stop financial solutions platform with broad revenue mix
We operate a comprehensive platform providing one-stop financial solutions, including equity and debt underwriting, mergers and acquisitions as well as strategy advisory, asset management, investment advisory, research and corporate access, securities brokerage, and sales and trading support. Our broad spectrum of financial services expertise and "total solutions" know-how position us well to better advise our clients through all phases of their financial and business life cycle and in any economic environment or market conditions. Our broad range of services also enable us to create multiple touchpoints with our clients, which deepen our relationship with them and allow us to identify additional potential business opportunities for both ourselves and others in our "AMTD SpiderNet". While we continue to offer multiple one-stop solutions to our clients, our client penetration, client retention, client loyalty, and lifetime client value are all greatly enhanced.
Our comprehensive services across a variety of sectors, product and service types, and client background increase diversity to our sources of revenue, which we believe provides us with greater financial stability throughout all phases of market cycles.
Market leadership in providing financial services to PRC regional banks and New Economy Companies
We are a leading financial services provider for PRC regional banks, helping them gain access to international capital markets and promote their internationalization strategy. Since the inception of our investment banking business in October 2015, we have participated in seven out of the thirteen Hong Kong IPOs of PRC regional banks, with an aggregate offering size of over US$6.2 billion. We also acted as joint global coordinators, a prominent and influential role in the syndicate teams in six of the transactions. According to the CIC Report, we ranked fifth in terms of the number of IPOs of PRC regional banks completed during 2017, 2018 and the nine months ended 30 September 2019 combined, and was the only Hong Kong-headquartered investment banking firm among the top ten players. Since the inception of our investment banking business in October 2015, we have participated in five out of seven AT1 capital preferred share offerings of PRC regional banks, with an aggregate offering size of US$6.7 billion. According to the CIC Report, we ranked first in terms of deal count and transaction value of AT1 capital preferred share offerings of PRC regional banks among all underwriters during 2017, 2018 and the nine months ended 30 September 2019 combined. Among these offerings, we acted as joint global coordinators, a prominent and influential role in the syndicate teams, for four out of five transactions.
Leveraging our leading position, excellent track record, and in-depth professional knowledge in the sector, we have also secured asset management mandates from multiple PRC regional banks. We are the largest independent asset management firm in Asia for PRC regional banks as measured by AUM as at 30 September 2019 according to the CIC Report.
We are a principal shareholder of Bank of Qingdao, which is dual-listed in Hong Kong and China. Our chairman of the Board and Chief Executive Officer, Calvin Choi, also serves as a director of Bank of Qingdao. In 2018, Calvin Choi led the establishment of Regional Banks+ Strategic Cooperation Alliance, with four PRC regional banks as founding members and joined by three more regional banks across China, Hong Kong and the United States in 2019, and was selected as chairman of this alliance by its founding members. Rooted in China, this alliance is dedicated to empowering traditional financial businesses with financial technology, and developing a unique model of technology finance, smart finance, inclusive finance, and green finance in a cooperative and innovative way.
In addition, we believe that we are one of the most active participants and promoters of the new economy sector. We acted as a joint bookrunner in the Hong Kong IPOs of Xiaomi Corporation and Meituan Dianping, the two largest IPOs in the technology sector globally from 2014 to 2018 as well as the first two Hong Kong IPOs in which the issuers adopted weighted voting right structures. We have since then participated actively in a number of IPOs of New Economy Companies and ranked first among all investment banking firms as measured by the number of Hong Kong IPOs underwritten in the new economy sector in the nine months ended 30 September 2019, according to the CIC Report.
We also made strategic investments in three pioneers in the new economy sector, namely Royole, a global leader in flexible displays, flexible sensors, and related smart devices; 58 Finance, a leading financial technology platform and Assured Asset Management, a HKSFC-licensed asset management services provider specializing in fixed income, alternative, and private equity investments.
We actively promote the development of the technology and financial technology sector. We were the sole strategic partner of the Hong Kong Fintech Week 2018 and 2019. In 2017, 2018 and 2019, we acted as a grand sponsor and keynote speaker of the Singapore Fintech Festival. In January 2020, AMTD co-established the "Singapore Digital Finance Leadership Programme" to hone the management and leadership capabilities of the aspiring digital finance leaders across Asia. In order to support incubating the next-generation of talent in the financial technology sector, we launched Hong Kong's first university-industry collaborative financial technology center with Hong Kong Polytechnic University in 2018 to provide financial technology education and training programs to students and professionals. In 2017, we also established an innovation hub in Hong Kong with the University of Waterloo, which aims to bring together leading academic researchers and industry professionals to share their knowledge and experience on big data, blockchain, internet of things, smart cities, and financial technology to enhance education and innovation. For further details, see the section entitled "Business—Our Partnership Approach—'AMTD SpiderNet' Enhanced by Our "Super-Connector" Role".
Seasoned management team backed by industry leaders and professional talents
Our management team comprises visionary executives with extensive experience in investment banking, financial, and professional services. We believe that the global vision, reputation, professional experience, and the deep connections of our management team bring us unparalleled competitive advantages in identifying business opportunities, providing innovative solutions, and securing prime investment opportunities. Calvin Choi, our Chairman of the Board and Chief Executive Officer, is a seasoned investment banker and was awarded "2019 Asia Fintech Leader" by the Singapore FinTech Association. He was also named as a "Young Global Leader" at the 2017 World Economic Forum and selected by the Institutional Investor magazine as one of the "2016 Fintech Finance 35". Our vice chairman, Marcellus Wong, is a member of the Joint Liaison Committee on Taxation, who advises the Hong Kong government on taxation issues, the former president of the Taxation Institute of Hong Kong, and had been consistently named by Euromoney as one of the "world's leading tax advisers" in Hong Kong and China. Our executive officers have on average 20 years of working experience in the investment banking and financial services industries. They form the backbone of our talent pool and are the foundation upon which we have built our success.
Our management team receives strong support from a global advisory committee that comprises key executives from our shareholders, widely recognized entrepreneurial leaders, and leaders in the investment banking and financial industry and academia, many of whom have previously served in banking, taxation, insurance sectors, world-class universities and government authorities. The global advisory committee meets periodically to advise our management on principal policies and strategies, and guides us to conduct our businesses in adherence to strict legal and compliance standards and to uphold industry best practices. Our management team oversees and maintains a team of talented and experienced investment banking and financial services professionals, enabling us to provide seamless execution with in-depth sector knowledge and product expertise that are more commonly found in international investment banking firms and global financial institutions.
Under the guidance of our senior management team, and benefiting from the expertise and extensive connections of the global advisory committee members and our committed professional team, we are growing rapidly while tapping into the extraordinary possibilities by fully engaging all members of our management, global advisory committee, and our professional team to enrich the "AMTD SpiderNet" ecosystem.
Our Growth Strategies
Our business model and competitive strengths provide us with multiple avenues for growth. We intend to execute the following key strategies in the next three to five years:
Expand our footprint in major capital markets globally
We aspire to become a global provider of comprehensive financial services and intend to expand our footprint to stay ahead of our clients' global ambition and financing needs. We plan to establish offices in key financial centers in the United States and Southeast Asia, such as New York City and Singapore, to reinforce our one-stop solutions strategy to target primarily corporate and institutional clients in need of global financial services. Meanwhile, we will continue to seek investment opportunities in selected markets globally to strengthen our access to cutting-edge technologies and financial solutions.
We plan to evaluate and selectively pursue strategic alliance, investments, and acquisition opportunities outside Hong Kong to optimize our talent pool, broaden our service offerings, expand our client reach, and strengthen relationships with our business partners. We may invest in or acquire businesses in overseas markets that hold licenses or permits in particular sectors of interest to us, in order to increase our client base and enhance our service capabilities.
Diversify the mix of our service capabilities
We seek to remain ahead of the evolving and increasingly complex needs of our clients and continue to broaden our service capabilities. We plan to gain further access to the Singapore and U.S. equity markets by establishing capabilities and obtaining requisite licenses in light of the continuing high demand from China-based companies for capital from the Singapore and U.S. markets. We are in the process of applying for a capital markets services license for the conduct of certain regulated activities including dealing in capital markets, including securities and units in a collective investment scheme, advising on corporate finance matters, fund management, providing custodial services and product financing in Singapore. By selectively investing in additional capabilities, we will continue to serve clients' needs and create monetization opportunities within our ecosystem. In addition, a broadened mix of service capabilities will also help diversify our revenue sources to withstand market fluctuations.
Further strengthen our "AMTD SpiderNet" ecosystem
We plan to further strengthen the depth and breadth of our "AMTD SpiderNet" ecosystem. Our proven track record across multiple businesses provides multifaceted benefits of the "AMTD SpiderNet" for our shareholders, business partners, clients, and investee, forming an ecosystem as strong as the quality and depth of its contributing stakeholders. We will continue to identify opportunities to drive the scale and reach of the ecosystem, facilitate cross-selling efforts, and exploit growth and cooperation possibilities. We will continue to increase our industry initiative and social efforts to ensure the healthy and sustainable development of our "AMTD SpiderNet".
Continue to invest in technology and people
We will continue to invest in technology that will benefit our business partners and clients, both to echo our endorsement and support for technological innovation and to facilitate the execution of our growth strategies. We believe that our people are our most valuable asset and form the cornerstone of our business, and we will continue to invest in attracting and retaining experienced and well-connected professionals at all levels and across all functions to support our growth and ensure quality services to our clients. In particular, we are investing to grow our investment banking team to meet our intensifying business needs. At the same time, we plan to ensure that our compliance and risk management teams are adequately expanded to properly monitor and mitigate potential risks.
Our Partnership Approach
"AMTD SpiderNet" Empowered by One-Stop Solutions
We discover and selectively engage a broad range of promising clients with diverse backgrounds and at various stages of development. We offer comprehensive financial services to fulfill the needs of our clients throughout their lifecycles. We stay close to our clients to understand and anticipate their needs. Our services are tailored with a collaborative overlay, providing clients with one-stop solutions.
With each business opportunity, we consider ourselves a business partner for the prospective client, rather than merely a service agency of a particular product or service. We strive to unlock and maximize the extraordinary value embedded in each relationship and to expand opportunities for collaboration and partnership both between us and our clients, as well as among clients. This forms the foundation of our "AMTD SpiderNet" ecosystem and defines our shared firm-wide core values and culture.
Case Study: Bank of Qingdao
Bank of Qingdao is the largest regional bank in Shandong province of China and is listed on the main board of the SEHK, and the small and medium enterprise board of the Shenzhen Stock Exchange, or SZSE. We served Bank of Qingdao in its Hong Kong IPO and offshore AT1 capital preferred share offering, and also provide it with discretionary asset management services. We later invested in Bank of Qingdao and obtained a seat on its board of directors. It is also a business partner in the joint establishment of Regional Banks+ Strategic Cooperation Alliance.
# | One-stop Solution or Event | Role in AMTD SpiderNet |
1 | Joint global coordinator and joint bookrunner—US$580 million Hong Kong IPO | Client |
2 | Joint global coordinator and joint bookrunner—US$1.2 billion AT1 capital preferred share offering | Client |
3 | Discretionary asset management services provider | Client |
4 | Strategic investment with a board seat | Investee Company |
5 | Joint establishment of Regional Banks+ Strategic Cooperation Alliance | Business Partner |
Case Study: Zhongyuan Bank
Zhongyuan Bank is listed on the SEHK and the largest regional bank in Henan province of China. After we served as the sole financial advisor in its July 2017 Hong Kong IPO, we maintained regular communication with this client which led to a number of business opportunities. We were involved in this client's overseas business development and have built a strong relationship with the client, which we believe led to subsequent service engagements and business introduction.
# | One-stop Solution or Event | Role in AMTD SpiderNet |
1 | Sole financial advisor—US$1.2 billion Hong Kong IPO | Client |
2 | Joint global coordinator and joint bookrunner—US$1.4 billion AT1 capital preferred share offering | Client |
3 | Introduced us to ZH International Holdings Limited; we acted as the sole placing agent in its US$200 million bond offering | Business Partner |
4 | Introduced us to Zhengzhou Zhongrui Industrial Group Co., Ltd.; we acted as a joint global coordinator and joint bookrunner in its US$85 million bond offering | Business Partner |
5 | Introduced us to China Chunlai Education Group Co., Ltd.; we acted as a joint global coordinator and joint bookrunner in its US$79 million Hong Kong IPO | Business Partner |
6 | Introduced us to Tangshan Financial Holding Group; we acted as a joint placing agent in its US$50 million bond offering | Business Partner |
7 | We introduced our Controlling Shareholder to jointly establish Yuanyin International Limited, a financial services platform, together with a number of Zhongyuan Bank's stakeholders | Business Partner |
8 | Joint establishment of Regional Banks+ Strategic Cooperation Alliance | Business Partner |
Case Study: New World Development
New World Development is an SEHK-listed conglomerate focusing on real estate development, infrastructure, department stores, and hotel operations. Our history of serving and doing business with New World Development also attests to our ability to offer one-stop financial solutions for Asia's tycoon families.
# | One-stop Solution or Event | Role in AMTD SpiderNet |
1 | We, as a joint bookrunner of Meituan Dianping in its IPO project in September 2018, introduced New World Development's affiliate to make an anchor investment in the transaction | Client and Business Partner |
2 | Joint bookrunner—US$310 million green bond of New World China Land, a subsidiary of New World Development, for which we were awarded "Best Green Bond—Real Estate" by The Asset Triple A in 2018 | Client |
3 | New World Development introduced us to one of its investment portfolio companies DayDayCook, and our Controlling Shareholder and New World Development jointly participated in the later round of capital raising as investors | Business Partner |
Case Study: Xiaomi Corporation
Xiaomi Corporation is an internet company with smartphones and smart hardware connected by an IoT platform as its core. After our engagement as a joint bookrunner in its Hong Kong IPO in June 2018, we have developed substantial business relationships with Xiaomi Corporation.
# | One-stop Solution or Event | Role in AMTD SpiderNet |
1 | Xiaomi Corporation's wholly-owned subsidiary is a joint-venture partner of our Controlling Shareholder in jointly establishing a financial platform, Gravitation Fintech HK Limited, which holds one of the only eight licensed virtual banks in Hong Kong as at the date of this Introductory Document | Business Partner |
2 | Joint bookrunner—US$5.4 billion Hong Kong IPO in June 2018 | Client |
3 | Xiaomi Corporation is one of the principal shareholders of Tiger Brokers, with which we have a strategic partnership to expand our investment banking coverage network. As a result of our effort and overall coordination, Xiaomi Corporation placed a sole order through us to further invest in the U.S. IPO of the parent company of Tiger Brokers, in which we acted as one of the lead banks and joint bookrunners | Client |
4 | Xiaomi Corporation became our shareholder | Shareholder |
5 | In January 2020, Xiaomi Finance, a subsidiary of Xiaomi Corporation, and our Controlling Shareholder, together with SP Group and Funding Societies jointly announced the formation of an exclusive strategic partnership and submission of an application to Monetary Authority of Singapore for a digital wholesale banking license on 31 December 2019 | Business Partner |
6 | Xiaomi Finance and our Controlling Shareholder, together with Singapore Management University and the Institute of Systems Science at the National University of Singapore signed a memorandum of understanding during World Economic Forum 50th AM to form a long-term partnership to set up the 'Singapore Digital Finance Leadership Programme' | Business Partner |
Case Study: China Minsheng Banking Corp., Ltd., Hong Kong Branch
China Minsheng Banking Corp., Ltd. is a PRC joint stock commercial bank. China Minsheng Banking Corp., Ltd., Hong Kong Branch is our long-term client and an active stakeholder in the "AMTD SpiderNet" ecosystem. Since the commencement of our investment banking business in 2015, we have participated in all of its offshore senior U.S. dollar-denominated bond issuances, and participated in the loan-backed note offering of Minsheng Financial Leasing Co., Ltd., a majority-owned subsidiary of China Minsheng Banking Co., Ltd.
# | One-stop Solution or Event | Role in AMTD SpiderNet |
1 | Joint bookrunner—US$500 million bond offering | Client |
2 | Joint bookrunner—US$450 million bond offering | Client |
3 | Joint bookrunner—US$350 million bond offering | Client |
4 | Joint bookrunner—US$450 million bond offering | Client |
5 | Joint bookrunner—US$250 million bond offering | Client |
6 | Joint bookrunner—US$400 million bond offering | Client |
7 | Joint bookrunner—US$600 million bond offering | Client |
8 | We entered into strategic cooperation agreement with China Minsheng Banking Corp., Ltd., Hong Kong Branch | Business Partner |
9 | We introduced our Controlling Shareholder to provide group medical and life insurance and wellness program to China | Client |
10 | We introduced China Minsheng Banking Corp., Ltd., Hong Kong Branch to extend credit facility to our Controlling Shareholder | Business Partner |
11 | We acted as an arranger of the first asset-backed securities offering in Hong Kong for China Minsheng Banking Corp., Ltd., Hong Kong Branch | Business Partner |
12 | We acted as a joint global coordinator and joint bookrunner in the US$450 million loan-backed note offering of Minsheng Financial Leasing Co., Ltd., a majority-owned subsidiary of China Minsheng Banking Corp., Ltd. | Business Partner |
"AMTD SpiderNet" Enhanced by Our "Super-Connector" Role
World Economic Forum Annual Meeting
As the only Hong Kong-headquartered financial institution among the World Economic Forum's global strategic partner associates, we established an "AMTD House" in its annual meeting in Davos, Switzerland in January 2018, making us the first Hong Kong company to establish a corporate center at the World Economic Forum. We also held the first "Hong Kong Night" in Davos and invited the Chief Executive of the Hong Kong government to officiate and deliver a keynote speech. Over 300 global political, business, academic, and media representatives attended the event.
In January 2019, we organized the first "AMTD Greater Bay Night" in Davos which was officiated by government leaders from the PRC and Hong Kong government. In the World Economic Forum 50th AM, we also hosted "Smart Asia: Connecting Greater Bay Area with ASEAN", during which government leaders from Hong Kong, Singapore and Guangzhou delivered keynote speeches, and further established "AMTD Hotel". We also hosted the "Greater Bay Entrepreneurship Day" for the second consecutive year during the World Economic Forum 50th AM, which is our annual event where we provide a platform for young entrepreneurs from the Greater Bay Area and ASEAN markets to collaborate with leaders and elites in political, business, academia, media from different countries and regions. Our presence in the World Economic Forum has further added international richness into the "AMTD SpiderNet", as it brings AMTD and the "AMTD SpiderNet" ecosystem to the international spotlight and connects us with prominent global business leaders.
Singapore Fintech Festival
We acted as a grand sponsor and keynote speaker of the Singapore Fintech Festival in 2017, 2018 and 2019, which was the world's largest financial technology conference attracting over 40,000 government officials, regulatory representatives, and representatives of financial institutions and technology companies from over 100 countries. The Singapore Fintech Festival adds to our "AMTD SpiderNet" insights and resources from stakeholders who focus on Southeast Asia financial technology developments.
Hong Kong Fintech Week
Hong Kong Fintech Week is the world's first cross-border financial technology event, taking place in Hong Kong and Shenzhen, China, attracting over 8,000 senior executives and over 200 speakers. We organized and participated in this event in both 2018 and 2019 as the sole strategic partner, together with the Hong Kong government, to showcase Hong Kong's growing financial technology community. During Hong Kong Fintech Week 2018, we announced the establishment of Regional Banks+ Strategic Cooperation Alliance with a goal of empowering traditional financial services with financial technology, and developing a unique model of financial services through technology, smart finance, inclusive finance, and green finance in a cooperative and innovative way.
This event enriches the "AMTD SpiderNet" with further resources from global financial technology industry especially corporates and investors that focus on investing in China and Hong Kong.
Start-up Express Pitching Final
We co-hosted the second Start-up Express Pitching Final with Hong Kong Trade Development Council and Our Hong Kong Foundation as the sole strategic partner in May 2019, in which 10 finalists were selected from 20 semi-finalists that originally started with over 160 applicants, and our Chairman of the Board and Chief Executive Officer, Calvin Choi, was invited to be one of the panel judges. Through Start-up Express, we help Hong Kong start-up companies with innovative and unique products or services to expand into China and Asian markets.
Cultivation and Training of Future Leaders and Talents
During the World Economic Forum 50th AM, we formed a long-term partnership with Xiaomi Finance, Singapore Management University and the Institute of Systems Science at the National University of Singapore to establish the "Singapore Digital Finance Leadership Programme" to hone the management and leadership capabilities of the aspiring digital finance leaders across Asia.
In April 2018, together with Hong Kong Polytechnic University, we launched AMTD Fintech Center, the first industry-university collaborative center in Hong Kong to provide financial technology education and professional training programs. We believe that future talents and the academic society should occupy an important space in the "AMTD SpiderNet". Meanwhile, as an industry leader in promoting financial technology, we believe that we have a responsibility to enhance Hong Kong's capabilities as an international and leading financial technology hub and assist in cultivating talent in the field of financial technology in the Greater Bay Area.
We also established a strategic partnership with the University of Waterloo in Canada in December 2017 to jointly promote the research and development of innovative technology and support the cultivation and education of innovative talents. We jointly established the University of Waterloo-AMTD Innovation Hub to encourage the creative and innovative talents at the University of Waterloo to come to Hong Kong, advancing the exchange and connection between the innovative technology of North America and Asia. In early 2019, we established a post-doctorate fellowship program with the University of Waterloo to support distinguished research into artificial intelligence, quantum computing, and other advanced technology as well as possible commercial applications.
Our Services
Investment Banking
Since October 2015, we have operated our investment banking business through one of our wholly-owned subsidiaries, AMTD Global Markets Limited, which is licensed by HKSFC to engage in certain activities regulated under the Securities and Futures Ordinance (Cap. 571) of Hong Kong, such as dealing in securities and future contracts, advising on securities and corporate finance, and providing asset management services. For further details, see "Appendix B – Regulatory Overview – Summary of Relevant Hong Kong Laws and Regulations — Licensing Regime Under the HKSFO". Under our investment banking business, we provide our clients with a full suite of corporate finance services, including underwriting equity and debt offerings, credit rating advisory, and advising on various financing and mergers and acquisitions transactions.
Our investment banking business provides a one-stop solution for corporate and other institutional clients, both benefiting from and enhancing the synergies within our "AMTD SpiderNet" ecosystem. To this end, we deliver our investment banking services with the following features.
· | Full service capabilities. We offer our clients a full suite of services for capital markets transactions, covering equity and debt offerings, credit rating advisory, other financing transactions, and merger and acquisitions. Based on our full product coverage, we are able to serve clients and develop long-term relationships through multiple engagements. |
| |
· | Client focus. We focus on client needs and always strive to explore long-term business collaboration rather than completing individual transactions, because we recognize that our clients are the foundation of our "AMTD SpiderNet" ecosystem and our relationship with them is key to our sustainable development and success. Leveraging our strong client relationship and our unique "AMTD SpiderNet" ecosystem, we are able to create synergies and proactively develop innovative products and services based on specific client needs to be serviced by our own abilities or those of our partners in the "AMTD SpiderNet" ecosystem. |
| |
· | Industry expertise. Our services are enriched by our experience and expertise in certain important industries, allowing us to better understand and anticipate clients' circumstances and needs. We have particular expertise in the PRC regional bank and new economy sectors. |
| |
· | Senior level participation. In addition to managing and maintaining client relationships, our senior professionals also actively participate in deal execution to ensure seamless execution and satisfactory client experience. |
We derive underwriting commissions and financial advisory fees from our investment banking business. We generally charge fees and commissions based on a percentage of transaction value. This percentage is negotiated and determined by a number of factors including (i) the type of transaction, the size of the transaction, (iii) the complexity of the transaction, (iv) state of the market, and (v) client relationship dynamic.
Global Markets
We are licensed to provide underwriting services for equity and debt offerings in Hong Kong. For details of our various licenses relating to our underwriting services, see "— Licenses, Permits and Approvals" in this section. Our underwriting capabilities have accelerated rapidly since October 2015.
From the inception of our investment banking business in October 2015 to February 2020, we completed 52 equity offerings in Hong Kong and the United States as an underwriter or financial advisor, with an aggregate transaction value of US$23.7 billion, including through the exercise of over-allotment options. During the same period, we also completed 107 debt offerings, with an aggregate transaction value of US$41.8 billion.
We have quickly built up a solid track record and established our market position and brand recognition for China-based issuers in Hong Kong, the United States, and the other international capital markets. According to the CIC Report, we ranked first among all independent investment banking firms in Asia as measured by both the number and the aggregate offering size of Hong Kong and U.S. IPOs completed in each of 2018 and the nine months ended 30 September 2019, and ranked in the top ten as a bookrunner among all investment banking firms as measured by the number of Hong Kong IPOs priced in each of the two periods. We ranked in the top ten among international investment banking firms operating in Asia (excluding China-headquartered investment banking firms), as measured by the number of high-yield bond offerings by China-based issuers and AT1 capital preferred share offerings completed by PRC regional banks in 2017, 2018 and the nine months ended 30 September 2019 combined.
In line with market practice, we generally split fees and commissions with other underwriters in capital markets transactions based on (i) the percentages of our underwriting commitment, (ii) our other contributions to the transaction, (iii) trading profits from IPO stabilization actions in the aftermarket, (iv) commercial negotiations on a case by case basis, and (v) the strength of the client relationship. We may also charge brokerage fees to investors that subscribe to products that we distribute, which is usually 1% of the investment amount being sourced by us in Hong Kong IPOs and on a negotiated basis in other types of offerings.
Our equity and debt product offerings are distributed through our sales and channels team. For further details, see "— Our Services — Sales and Channels" in this section.
Global Advisory and Execution
We advise on both public and private financing and mergers and acquisitions transactions, covering companies at all stages of development. Many of our advisory services involve tailored solutions in which we leverage our experience and the strength of our "AMTD SpiderNet" ecosystem to propose unique and innovative structures. We are able to introduce quality investors through our sales and channels team and potential strategic investors through our "AMTD SpiderNet" ecosystem.
In conjunction with any financial advisory role, we will advise on the capital structure and assist in long-term capital planning. We believe that providing financial advisory services to growth-stage clients allows us to build relationships with our clients at an early stage and paves the way for us to provide a variety of additional services with higher fee returns through global markets as our relationship with the client deepens and as the client's business and financing needs evolve.
The following table sets forth a breakdown of our investment banking revenue by fee type for the periods presented.
| | For the Year Ended 31 December | | | For the Nine Months Ended 30 September | |
| | 2017 | | | 2018 | | | 2018 | | | 2019 | |
| | HK$ | | | % | | | HK$ | | | % | | | HK$ | | | % | | | HK$ | | | % | |
| | (in thousands, except for percentages) | |
Investment Banking Revenue | | | | | | | | | | | | | | | | | | | | | | | | |
Underwriting commissions and brokerage fees. | | | 150,650 | | | | 72.4 | | | | 217,003 | | | | 75.2 | | | | 111,354 | | | | 61.1 | | | | 278,235 | | | | 84.2 | |
Financial advisory fees. | | | 57,513 | | | | 27.6 | | | | 71,588 | | | | 24.8 | | | | 70,988 | | | | 38.9 | | | | 52,382 | | | | 15.8 | |
Total | | | 208,163 | | | | 100.0 | | | | 288,591 | | | | 100.0 | | | | 182,342 | | | | 100.0 | | | | 330,617 | | | | 100.0 | |
Sales and Channels
We have an experienced sales and channels team, which supports product distribution activities across our businesses. The sales and channels function focuses on institutional clients and is an important element of our overall distribution capabilities. Our institutional sales team actively participates in our investment banking transactions by introducing institutional clients to the various products that we offer, and provides institutional investors with value-added corporate access services. In addition, we also provide a comprehensive trading platform for clients to trade various types of products available on the market, such as equity, fixed income, and mutual fund instruments.
Research
We have an experienced research team focusing on industry and company research as this plays a critical part in defining our professional standpoints and demonstrating our industry insights. Our research team presents original ideas on company-specific valuations and research analyses, as well as from industry and thematic perspectives. Our analysts hold an independent position on the research landscape, with coverage universe established through cooperation with key client-servicing businesses and utilizing our firm-wide "AMTD SpiderNet".
Our research team covers a broad range of sectors, such as banking, financial technology, hardware, internet, real estate, and education sectors. Our research team is based in Hong Kong and focuses on research coverage on listed companies in Asia. Our research analysts provide investment insights, suggestions on valuation methodologies, and industry know-how to our institutional investor base across the world.
Our independent research capabilities constitute a key building element of our one-stop professional services and supports to institutional investors. By obtaining first-hand professional investment advices across various sectors, investors can establish referencing foundations for making investment decisions. Being viewed as a professional advisor, we believe that this encourages institutional investors to trust our investment banking team and potentially participate in offerings that our investment banking team underwrites or advises on.
Asset Management
Through our asset management business, we provide professional investment management, advisory, and brokerage services primarily to PRC banks, corporate and other institutional clients, and family offices. We help manage offshore liquidity for many of our China-based clients, allowing them to tap the flexibility and diversity of investment products available only in the offshore markets. Our goal in the asset management business is to produce superior risk-adjusted investment returns and provide investment solutions customized for our clients' unique needs. We are the one of the five largest HKSFC-licensed, Hong Kong-headquartered asset management firms, as measured by AUM as at 30 September 2019, according to the CIC Report. We are also the largest independent asset management firm in Asia in serving both PRC regional banks and New Economy Companies, in each case as measured by AUM as at 30 September 2019.
Our asset management services include discretionary account services and non-discretionary account services. As at the Latest Practicable Date, our asset management services are conducted on a single client basis through their respective designated accounts. Through our discretionary account services, we manage assets with diverse risk and return profiles, providing clients with comprehensive, customized investment strategies based on our understanding of their investment needs, risk tolerance, investment goals, and expected return. Non-discretionary account services are managed pursuant to clients' agreed methodology, conditions, requirements, and restrictions.
Where appropriate, we look to deploy our synergies and introduce clients to the broader network and resources within our "AMTD SpiderNet" ecosystem. Based on their specific needs and risk tolerance levels, our clients have exclusive access to products with tailor-made features to meet their financial and investment needs and optimize their asset allocation.
Our AUM increased by 23.6% from HK$14.8 billion as at 31 December 2017 to HK$18.3 billion as at 31 December 2018, and further increased by 33.8% to HK$24.4 billion as at 30 September 2019. As at 30 September 2019, 49.5% of the AUM was invested in fixed income products, 46.2% in equity products, and 4.3% in other products. As at the same date, our top ten clients accounted for 63.5% of the AUM; 96.3% of the AUM was managed on behalf of corporate and other institutional clients, including banks, pension funds, insurance companies, and family offices; and 3.7% of the AUM was managed on behalf of individual client relationships, which are principally with high-net-worth individuals.
We derive revenues from our asset management business primarily through (i) recurring management fees based on a fixed percentage of our AUM, which is negotiated on a case-by-case basis, (ii) performance-based income from assets with discretionary management, which usually is a split of the excess returns above a certain pre-agreed threshold, and (iii) trading and other fee income derived through the provision of services to our clients across various businesses.
The following table sets forth a breakdown of our asset management revenue by fee type for the periods presented.
| | For the Year Ended 31 December | | | For the Nine Months Ended 30 September | |
| | 2017 | | | 2018 | | | 2018 | | | 2019 | |
| | HK$ | | | % | | | HK$ | | | % | | | HK$ | | | % | | | HK$ | | | % | |
| | (in thousands, except for percentages) | |
Asset Management Revenue | | | | | | | | | | | | | | | | | | | | | | | | |
Management and performance fees. | | | 47,774 | | | | 67.5 | | | | 43,465 | | | | 55.1 | | | | 30,249 | | | | 47.1 | | | | 74,162 | | | | 81.1 | |
Brokerage, handling and other fees | | | 23,039 | | | | 32.5 | | | | 35,482 | | | | 44.9 | | | | 34,032 | | | | 52.9 | | | | 17,273 | | | | 18.9 | |
Total | | | 70,813 | | | | 100.0 | | | | 78,947 | | | | 100.0 | | | | 64,281 | | | | 100.0 | | | | 91,435 | | | | 100.0 | |
Strategic Investment
We commenced our strategic investment business in 2015. Our strategic investment business focuses on long-term equity investments using our own capital. We view it as a natural extension of our other businesses, allowing us to deepen our relationship with clients by participating in their value creation and engaging them into the "AMTD SpiderNet".
Investment Approach
We typically source investment opportunities identified through "AMTD SpiderNet", and focus on investing in innovative internet platforms, financial technology companies, other New Economy Companies, and other financial institutions. Our buy-side resources allow us to stay close to the market and provide early access to leading players in key industries that benefit from China's globalization developments and rapid growth in innovation industry.
· | Leveraging "AMTD SpiderNet". We leverage "AMTD SpiderNet" throughout the investment process to source investments, evaluate opportunities, and provide value added solutions to the investees after our investment. Our portfolio companies are our strategic partners. |
| |
· | Value investment. We focus on long-term value creation from our investment and how the investments can contribute to our stakeholder of the "AMTD SpiderNet", rather than looking for short-term returns. Therefore, we do not trade our investments frequently in the secondary market for profit. We have not disposed of any portion of the strategic investments in our current portfolio since the acquisition. |
| |
· | Synergy with portfolio companies. We have an experienced team for post-investment value creation. We have a board seat in most of our portfolio companies and we devote a lot of our resources to work closely with their management to advise on their strategy, capital markets plan, and support them in their execution process. |
Investment Process
After a potential target with strategic significance is identified, our investment professionals assess the suitability and prospects of investing in the target considering a wide range of factors, including the track record of the target's management team, the target's operating market, macroeconomic conditions, market cycle and industry background, business model, and other quantitative financial analyses. We also engage professional third parties, such as financial advisors, accountants, and lawyers, to conduct due diligence investigations prior to making an investment, as may be required on a case-by-case basis.
Although we make investment decisions on a case-by-case basis, we are generally interested in businesses that possess the following attributes:
· | management team with strong track record and complementary industry expertise; |
| |
· | high growth potential with sustainability; |
| |
· | core competitive advantage in the relevant sector; and |
| |
· | potential for significant synergies with our existing businesses. |
We make strategic investment decisions through our investment committee, which consists of key management team members covering finance, operations, legal and compliance, investments, and examines and assesses investment proposals following consultations with senior management. All investment proposals will be presented to our investment committee following the satisfactory completion of assessment and due diligence investigation. Our investment committee also assesses, reviews, and modifies our investment strategies from time to time based on accumulated deal execution experience and the latest developments in the financial market, economic conditions, and government policies. Our investment committee is different and separate from our Controlling Shareholder.
We closely monitor our investee companies in accordance with the guidelines set by investment committee. Specifically, we track the business development, our holding positions, unrealized profit or loss, and our risk exposure of each investee. We will escalate any significant incidents in our investees to the investment committee and, for material incidents, to our Board.
Investment Portfolio
Our strategic investment portfolio is comprised of Bank of Qingdao, Royole, 58 Finance, and Assured Asset Management.
As at 30 September 2019, our investment portfolio reached an aggregate fair value of HK$3.9 billion, in which our strategic investment in the Hong Kong and Shenzhen-listed Bank of Qingdao accounted for 91.9% and investment in other innovative and fintech companies accounted for 8.1%.
Through investment in financial institutions with stable annual dividend distribution, we are able to connect more business partners in this sector, such as members of Regional Banks+ Strategic Cooperation Alliance, providing the most efficient and effective professional financial solutions and promoting cooperation among them, which will in return contribute to our growth and create value through synergies.
We also expand our investments in new economy sectors globally for the discovery and incubation of outstanding enterprises with innovative technology, committing to serving as a "super-connector" to connect different capital market participants, innovation companies, and to match their needs in the area of capital and technology.
Bank of Qingdao
Bank of Qingdao is the largest city commercial bank in Shandong province and among the first batch of city commercial banks established in China. Its business covers three major areas including corporate banking, retail banking, and financial markets. Bank of Qingdao is headquartered in Qingdao, with 14 branches in Shandong Province, and will continuously expand its business network to all major cities in Shandong province as at the end of 2018. Bank of Qingdao is highly recognized by customers for its excellent professional and differentiated services. It won the "Banking Information Technology Risk Management Research Achievement Award" issued by China Banking and Insurance Regulatory Commission in the past four years. Meanwhile, it also obtained numerous awards, such as second prize of the 18th national business management modernization innovation achievement, "Best Small and Medium-sized Bank" (Golden Dragon Award), "Best Management Innovation Bank" (Golden Cicada Award), and "Best City Commercial Bank" (Golden Diamond Award). Moreover, the Bank of Qingdao is among China's top 500 service enterprises.
Bank of Qingdao was listed on the main board of the Stock Exchange of Hong Kong Limited (SEHK: 3866) in December 2015 and completed its A share listing on the Shenzhen Stock Exchange in January 2019 (SZSE: 002948), being the second "A+H" dual-listed Chinese city commercial bank.
Royole
Royole is a world leader in flexible displays, flexible sensors, and related smart devices. It focuses on creating the next-generation human-computer interaction and product research, development, manufacturing, and sales. Royole began its operations in the Silicon Valley, Hong Kong, and Shenzhen. During the past six years it has obtained multiple rounds of investment from well-known domestic and foreign venture capital institutions. Royole has built an international team of over 2,000 talents from over 20 countries and regions around the world, and has become one of the fastest-growing technology unicorns in the world. Royole currently owns over 3,000 core technology intellectual property rights and sells products to over 20 countries and regions. In 2018, Royole launched the volume production of quasi-G6 for fully flexible displays and the world's first commercial foldable smartphone with a fully flexible display, FlexPai.
58 Finance
58 Finance is a leading financial technology platform that was incubated by 58.com Inc. (NYSE: WUBA) and spun off in 2017. 58.com Inc. is currently the largest online classifieds platform in China as measured by traffic and revenues. Its ecosystem covers housing, cars, and other life services, and provides a rich client base and synergy for 58 Finance. Since its inception, 58 Finance's car financing business has grown rapidly. Under the impetus of other internet giants in the financial sector, 58 Finance has been well received in the capital market. 58 Finance targets to extend the life cycle of customers using its full scope of capacities and to create a multi-scenario, multi-asset, as well as multi-product integrated financial services platform.
Assured Asset Management
Assured Asset Management is a HKSFC-licensed asset management services provider specializing in fixed income, alternative, and private equity investments. Its management team possesses extensive experience in risk management, private equity, asset management, and financial technology. It is amongst the first global tech-enabled asset management platforms connecting professional and institutional investors from Asia with global assets through innovative fintech. Assured Asset Management is headquartered in Hong Kong with representative offices in Singapore and Taiwan.
Risk Management
Committee Supervision
We have established a comprehensive and robust risk management system to manage risks across our business lines and ensure compliance with relevant laws and regulations.
Our executive management committee oversees risk management, and reports to the Board directly.
The investment committee formulates key policies and procedures in relation to our strategic investments and investments made for and on behalf of our clients under our asset management business. Our investment committee authorizes our investment team to execute these policies and procedures. Our investment committee meets regularly to evaluate the risks and merits of significant potential investments, provide feedback to the investment team, and issue final approval for the investments.
The investment banking executive committee reviews the terms and assesses the risks of our investment banking business. The investment banking executive committee meets regularly to evaluate the risks and merits of significant potential business opportunities, provide comments to the investment banking team, and approve the acceptance of new business mandates and execution of investment banking transactions.
Both the investment committee and investment banking executive committee report to the executive management committee.
Conflicts of Interest Management
As a diversified financial institution, we may encounter situations in which we have conflicting legitimate interests. We recognize the importance of managing these conflicting interests to protect the interests of our clients as well as our Directors, officers, and employees. We regularly implement Chinese walls to limit conflicts of interest by controlling the flow of material non-public information within our organization. A Chinese wall is a barrier prohibiting the transfer of information in order to ensure that material non-public information that is obtained by one department is not released to any other department. It is intended to separate personnel who make investment decisions (whether for our Company or for and on behalf of our clients) from those who are in possession of material non-public information. We have developed and implemented the following policies and procedures to safeguard material non-public information and prevent improper trading.
· | We have established Chinese walls among our business functions, including investment banking, asset management, research, and strategic investments, to prevent the internal flow of material non-public information. |
| |
· | We maintain segregated accounts to hold our clients' funds and our own funds and manage and settle these funds separately. |
| |
· | We prohibit senior managers of our business departments from concurrently managing or participating in our back-office departments including operations, compliance, and control and finance departments. |
| |
· | We have adopted security measures, including encryption technologies, to protect our client data, and have established physical segregation and password-protected access among departments to enforce our Chinese wall policies. |
In order to minimize the risks for collusion and improper business activities, we have adopted the following policies.
· | Our business departments, including investment banking, asset management, and strategic investment, operate independently. We do not allow any of our employees to work for multiple business departments, and any transfer or secondment of our employees among business departments must be justified with valid business reasons, and be reviewed and approved by the senior management team or Board, depending on the seniority of the proposed transferee. |
| |
· | Our employees in our back-office departments, including information technology, finance, compliance and control, and operations, are prohibited from working in any business departments. |
| |
· | We manage our asset management business and strategic investments separately through different employees and maintain separate investment decision-making procedures, trading strategies, and segregated client and proprietary bank accounts. |
Research and Development
Due to the nature of our business, we do not engage in traditional research and development activities which may be more applicable to companies in manufacturing or technology industries.
Order Book
Due to the nature of our business, we do not maintain an order book. We receive new business mandates from time to time.
Intellectual Property
As at the date of this Introductory Document, we do not own any registered trademarks. We are licensed by our Controlling Shareholder to use certain trademarks. We maintain seven registered domain names, including amtdinc.com. Our business or profitability is not materially dependent on any patent or license industrial, commercial or financial contract (including a contract with a customer or supplier) or new manufacturing process.
Properties and Fixed Assets
As at the Latest Practicable Date, our Group does not own any properties.
As at the Latest Practicable Date, our Group leases our principal executive office in Hong Kong from the AMTD Group pursuant to the Transitional Services Agreement entered into with AMTD Group. The size of such leased properties is approximately 18,260 square feet and the tenure of such lease is 18 months. We plan to renew our lease from time to time as needed.
We intend to add new premises or expand our existing premises as we add employees and expand our organization. We believe that suitable additional or alternative space will be available in the future on commercially reasonable terms to accommodate our foreseeable future expansion.
Fixed Assets
We own fixed assets comprising our office equipment. As at 30 September 2019, our fixed assets had a net book value of approximately HK$45 thousand.
Competition
The financial services industry is intensely competitive, and we expect it to remain so. While we are based in Hong Kong, we compete both globally and on a regional basis.
We compete on the basis of a number of factors, including strength of client relationships, reputation, industry expertise, and deal execution skills.
With respect to our investment banking and asset management businesses, our competitors are other investment banking firms and financial advisory firms. Our primary competitors in these businesses are international investment banking firms and other large financial institutions, many of which have greater financial and other resources as well as scale and are capable of offering a wider range of products and services, such as loans, deposit-taking, and a full range of investment banking services. Some of our competitors also have the ability to support investment banking (including financial advisory services) with revenues derived from commercial banking, insurance, and other financial services in an effort to gain market share. In addition, we operate these businesses in a highly competitive environment and the barriers to entry into these businesses are low. Nevertheless, we believe that we have a unique competitive edge and are capable of expanding rapidly by leveraging our "AMTD SpiderNet" network, relationships and comprehensive capabilities.
With respect to our strategic investment business, we believe that we do not compete with other private equity funds, specialized investment funds, hedge fund sponsors, financial institutions and other players. Our investments have been made primarily for strategic reasons rather than for pure financial gain, and the funds for the investments are entirely our own.
We face intense competition for the recruiting and retention of qualified, experienced professionals. Our ability to continue to compete effectively in our businesses will depend upon our ability to attract new employees and retain and motivate our existing employees.
For additional details regarding competitive landscape of industries in which we operate, see the section entitled "Industry Overview". For additional information concerning the competitive risks that we face, see the section entitled "Risk Factors—Risks Relating to Our Business and Industry—The financial services industry is intensely competitive. If we are unable to compete effectively, we may lose our market share and our results of operations and financial condition may be materially and adversely affected".
Licenses, Permits and Approvals
A description of the material licenses, permits and approvals in relation to the business of our Group as at the Latest Practicable Date is set out below.
Due to the licensing requirements of the HKSFC, AMTD Global Markets Limited and Asia Alternative Asset Partners Limited are required to obtain necessary licenses to conduct their business in Hong Kong and their business and responsible personnel are subject to the relevant laws and regulations and the respective rules of the HKSFC. AMTD Global Markets Limited currently holds a Type 1 license for dealing in securities, a Type 2 license for dealing in futures contracts, a Type 4 license for advising on securities, a Type 6 license for advising on corporate finance, and a Type 9 license for asset management. Asia Alternative Asset Partners Limited currently holds a Type 1 license for dealing in securities, a Type 4 license for advising on securities, and a Type 9 license for asset management. See "Appendix B – Regulatory Overview – Summary of Relevant Hong Kong Laws and Regulations – Licensing Regime Under the HKSFO". These licenses have no expiry date and will remain valid unless they are suspended, revoked or cancelled by the HKSFC. We pay standard governmental annual fees to the HKSFC and are subject to continued regulatory obligations and requirements, including the maintenance of minimum paid-up share capital and liquid capital, maintenance of segregated accounts, and submission of audited accounts and other required documents, among others. All financial institutions regulated by the HKSFC are subject to regular and ad-hoc inspection by the HKSFC. Our Group, has not been a subject of specific ad-hoc inspections during the track record period. The latest routine inspection conducted by the HKSFC in 2017 did not receive any adverse or negative findings. Based on HKSFC public record, there has also been no disciplinary or enforcement actions against our Group in the past five (5) years. See "Appendix B – Regulatory Overview – Summary of Relevant Hong Kong Laws and Regulations — Licensing Regime Under the HKSFO". AMTD Global Markets Limited is also a SEHK participant.
AMTD Global Markets Limited is also licensed with Mandatory Provident Fund Schemes Authority as a principal intermediary for engaging in the business of our Mandatory Provident Fund schemes in Hong Kong. As at the Latest Practicable Date, AMTD Global Markets Limited is the sponsor of AMTD MPF Scheme, which is a master trust scheme registered with the Mandatory Provident Fund Schemes Authority and authorized by the Securities and Futures Commission.
AMTD Global Markets Limited is also licensed with Insurance Authority as an insurance broker company for which it may carry on general and long-term business (including linked long-term business).
Seasonality
Our business can also fluctuate where there are holiday seasons such as Golden Week, Chinese New Year and Christmas or during the course of a calendar year for other reasons. Consequently, our financial results for any particular period will not necessarily be indicative of our results for the full year or future periods.
Employees
We had 29, 31, 40 and 40 employees as at 31 December 2017, 2018, 2019 and 30 September 2019 respectively. All of our employees are based in Hong Kong.
The following tables sets forth the number of our employees by function as at 31 December 2019.
Function | | As at 31 December 2019 | | | Percentage | |
Executive Officers | | | 7 | | | | 17.5 | % |
Licensed Professionals | | | 25 | | | | 62.5 | % |
Supporting Staff. | | | 8 | | | | 20.0 | % |
Total | | | 40 | | | | 100.0 | % |
Our success depends on our ability to attract, retain, and motivate qualified employees. We offer employees competitive salaries, performance-based cash bonuses, comprehensive training and development programs, and other fringe benefits and incentives. We believe that we maintain a good working relationship with our employees, and we have not experienced any material labor disputes or work stoppages. None of our employees are represented by labor unions, and no collective bargaining agreement has been put in place.
We do not experience any significant seasonal fluctuations in our number of employees. We do not employ a significant number of temporary employees.
As required by Hong Kong laws and regulations, we participate in a pension scheme under the rules and regulations of the Mandatory Provident Fund Scheme Ordinance, or MPF Scheme, for all employees in Hong Kong. The contributions to the MPF Scheme are based on a minimum statutory contribution requirement of 5% of eligible employees' relevant aggregate income up to a maximum of HK$1,500 per employee per month. The assets of this pension scheme are held separately from those of our Group in independently administered funds. Other than the contributions, we have no further obligation for the payment of retirement and other post-retirement benefits of our employees in Hong Kong.
We enter into standard employment agreements with our employees. We also enter into standard confidentiality and non-compete agreements with our senior management in accordance with market practice.
We intend to add new premises or expand our existing premises as we add employees and expand our organization. We believe that suitable additional or alternative space will be available in the future on commercially reasonable terms to accommodate our foreseeable future expansion.
AMTD SpiderMan Share Incentive Plan
In June 2019, our Board approved the AMTD SpiderMan Share Incentive Plan, which we refer to as the Plan in this Introductory Document to attract and retain the best available personnel, provide additional incentives to employees, Directors and consultants, and promote the success of our business. The maximum aggregate number of ordinary shares that may be issued under the Plan is initially 20,000,000 Class A Shares and on 1 January of each year after the effective date of the Plan, will automatically increase to the number of shares that is equal to ten percent (10%) of the total issued and outstanding share capital of our Company as at 31 December of the preceding year. In addition, on 1 January of each year after the effective date of the Plan, the aggregate number of shares that may be issued under the Plan shall automatically increase by the number of shares representing 1.0% of the total issued and outstanding share capital of our Company as at 31 December of the preceding year, or such less number as our Board shall determine. As at the date of this Introductory Document, no awards have been granted under the Plan.
The following paragraphs summarize the principal terms of the Plan.
Type of Awards
The Plan permits the awards of options, restricted share units, restricted shares, or other types of award approved by the plan administrator.
Plan Administration
Our Board or a committee appointed by the Board will administer the Plan. The plan administrator will determine the participants to receive awards, the type and number of awards to be granted to each participant, and the terms and conditions of each grant.
Award Agreement
Awards granted under the Plan are evidenced by an award agreement that sets forth the terms, conditions and limitations for each award, which may include the term of the award, the provisions applicable in the event that the grantee's employment or service terminates, and our authority to unilaterally or bilaterally amend, modify, suspend, cancel or rescind the award.
Eligibility
We may grant awards to our Directors, employees and consultants.
Vesting Schedule
In general, the plan administrator determines the vesting schedule, which is specified in the relevant award agreement.
Exercise of Options
The plan administrator determines the exercise price for each award, which is stated in the relevant award agreement. Options that are vested and exercisable will terminate if they are not exercised prior to the time as the plan administrator determines at the time of grant. However, the maximum exercisable term is ten years from the date of grant.
Transfer Restrictions
Awards may not be transferred in any manner by the participant other than in accordance with the exceptions provided in the Plan or the relevant award agreement or otherwise determined by the plan administrator, such as transfers by will or the laws of descent and distribution.
Termination and Amendment of the Plan
Unless terminated earlier, the Plan has a term of ten years from the date of effectiveness of the Plan. Our Board has the authority to terminate, amend, suspend or modify the Plan in accordance with our articles of association. However, without the prior written consent of the participant, no such action may adversely affect in any material way any award previously granted pursuant to the Plan.
Insurance
We contribute to Mandatory Provident Fund in Hong Kong and provide employee compensation, life, business travel, and medical insurance for our employees. We have also purchased office, computer, and vehicle insurance for our properties. In accordance with the Securities and Futures (Insurance) Rules of Hong Kong, we have purchased and maintained insurance for any loss incurred by us due to any loss to our clients' assets in our custody that is caused by fraudulent conduct of our employees, robbery, theft or other misconduct. In accordance with Code of Conduct for Licensed Insurance Brokers issued by Insurance Authority, we have purchased and maintained insurance for professional indemnity arising from conducting of insurance brokerage business. We have also purchased director and officer's liability insurance for designated Directors and officers, and we are in the process of purchasing key-man insurance.
We do not maintain general third-party liability insurance, nor do we maintain property insurance. We consider our insurance coverage to be adequate and in line with that of other companies in the same industry of similar size in Hong Kong. See the section entitled "Risk Factors — Risks Relating to Our Business and Industry — If our insurance coverage is insufficient, we may be subject to significant costs and business disruption".
Legal Proceedings
From time to time we, our subsidiaries and joint ventures are party to litigation, arbitration or administrative proceedings. However, we are not and have not been, and none of our subsidiaries or joint ventures is or has been, a party to any litigation, arbitration or administrative proceedings during the 12 months immediately preceding the date of this Introductory Document that we believe would, individually or taken as a whole, have a material adverse effect on our business, financial condition or results of operations, and, in so far as we are aware, no such litigation, arbitration or administrative proceedings are pending or threatened.
Litigation or any other legal or administrative proceeding, regardless of the outcome, is likely to result in substantial costs and diversion of our resources, including our management's time and attention. For potential impact of legal or administrative proceedings on us, see the section entitled "Risk Factors — Risks Relating to Our Business and Industry — We may be subject to litigation and regulatory investigations and proceedings and may not always be successful in defending ourselves against such claims or proceedings" and "Risk Factors—Risks Relating to Our Business and Industry — We may face intellectual property infringement claims, which could be time-consuming and costly to defend and may result in the loss of significant rights by us".
Other Matters
AMTD Global Markets Limited ("AMTDGM"), our wholly-owned subsidiary, was penalized by the Hong Kong Confederation of Insurance Brokers ("HKCIB") four (4) times from 2016 to 2019 in relation to the retail advisory business distributing investment-linked products for failure to do everything possible to satisfy the insurance requirements of client and to place the interests of client before all other considerations, as well as failure to ensure that its technical representative is a fit and proper person. HKCIB issued fines to AMTDGM ranging from HK$50,000 to HK$250,000.
AMTD Group, our Controlling Shareholder, was founded by CK Hutchison Holdings Limited in 2003. The management teams of AMTD Group as well as AMTDGM were appointed by CK Hutchison Holdings Limited. In late 2015, L.R. Capital acquired a majority stake in AMTD Group and the then management team was replaced by a new (the current) management team in 2016.
Three (3) of four (4) of the cases for which the AMTDGM had been penalized by HKCIB were in relation to matters of similar nature whereby the previous management team and its insurance staff had not carried out their work in accordance with regulatory standards. Three (3) separate cases occurred in 2011, 2012 and 2014, and were recorded as each case arose from a separate complaint. These cases concluded in April 2016, September 2016 and April 2019, respectively. These cases concluded in fines of HK$150,000, HK$50,000 and HK$250,000, respectively, on AMTDGM. Since the current management team had assumed its position in 2016, it had enhanced the internal control processes within our Group in order to prevent the reoccurrence of such lapses in proper procedures in future.
Additionally, AMTD Group had terminated its retail advisory business distributing investment-linked products in May 2016, and has not been involved in the sale of investment-linked assurance schemes to new individual clients since but have instead focused only on corporate and institutional clients. Accordingly, our Company, which is part of the AMTD Group group of companies, is currently not involved in such retail advisory business or the sale of investment-linked assurance schemes to any new individual clients.
In 2018, HKCIB had conducted a regular inspection on AMTDGM and the result was a clean report with no identified issues or follow-up items. In addition, the profit from insurance brokerage business constitutes around 1% of net profit to AMTDGM, which is immaterial.
INDUSTRY OVERVIEW
Overview of the Financial Services Industry in Hong Kong
The financial services industry plays a pivotal role in Hong Kong's economy. In 2018, the added value of the financial services industry amounted to US$64.6 billion, representing 19.2% of Hong Kong's gross domestic product, or GDP. The competitive low-rate tax regime, stringent and transparent regulatory systems, and a free flow of capital and information in Hong Kong all contribute to lower operational costs and high efficiency for financial institutions, and has enhanced Hong Kong's position as one of the world's leading financial centers that provides a wide range of comprehensive financial products and services.
Capital markets and asset management have experienced faster growth among all sectors in the financial services market. In 2019, Hong Kong was the world's largest IPO market with US$40.1 billion funds raised, representing an annual growth rate of 8.6%. Hong Kong is also the largest offshore center for China-based companies issuing U.S. dollar-denominated bonds and one of Asia's leading asset management centers. Driven by the opening up of China's financial market and initiatives such as the "Belt and Road Initiative", an increasing number of China-based companies are actively going abroad and thus generating tremendous demand for financial services. Moreover, Hong Kong is also attractive for Asia-Pacific companies to meet their diversified demands in both financing and investment for growth and expansion.
Hong Kong's financial services industry is highly regulated. The total number of HKSFC-licensed companies increased from 3,907 in 2015 to 5,807 in 2019. Key market players in Hong Kong's financial services industry can be categorized into Hong Kong-headquartered companies, subsidiaries of China-based companies, and subsidiaries or branches of global companies, which are characterised by the geographical locations where the majority of their management teams and headquarters are based, being Hong Kong, China, and other countries and regions, respectively. Global and China-based companies traditionally dominate Hong Kong's financial service industry.
Total Addressable Market
Capital Markets
Equity capital markets in Hong Kong and the United States
Equity capital markets in Hong Kong and the United States are the most attractive overseas listing venues for China-based companies, especially for the New Economy Companies. The New Economy Companies generally refer to businesses that achieve rapid growth through progressive entrepreneurships, technological advancements, and innovative business models. In 2018, Hong Kong's IPO market was the top global listing venue as measured by the amount of capital raised. Driven by abundant transactions of traditional economy and unicorn companies, as well as investor enthusiasm, total capital raised by China-based companies in Hong Kong and the U.S. equity capital markets reached US$44.0 billion in 2018, representing an increase of 165.5% from 2017. At the same time, the continuous growth of the New Economy Companies in China has generated substantial demand for capital. In 2013, the amount of IPO proceeds raised by New Economy Companies in China only accounted for 7.3% of the total IPO proceeds in the Hong Kong and U.S. equity capital markets. Such percentage has grown rapidly since then and reached 57.1% in 2018. It is projected that IPO transactions in both markets will maintain a strong position between 2019 and 2023, according to the CIC Report.
The following diagram illustrates the growth of IPOs by China-based companies in Hong Kong and the United States in terms of the capital raised for the periods presented.
Capital Raised by China-based Companies Through IPOs in Hong Kong and the United States, 2013-2023E
Source: SEHK, SEC, CIC
Debt capital markets in Hong Kong
Hong Kong is a mature market for bonds that are denominated in domestic and foreign currencies. The size of the debt capital markets in Hong Kong, as measured by the total capital raised in the SEHK, increased from US$74.2 billion in 2013 to US$152.7 billion in 2018, representing a compound annual growth rate, or CAGR, of 15.5%. In 2018, the debt capital markets experienced a decline as a result of regulatory restrictions imposed on PRC issuers, such as lower overseas debt issuance quotas assigned by the National Development and Reform Commission and stricter approval requirements by the China Securities Regulatory Commission.
With the expectation of a slower interest rate hike in the United States, the overall economic growth in Asia, and continued financial reforms in China, more PRC and foreign enterprises are expected to seek debt refinancing opportunities in Hong Kong. According to the CIC Report, the total capital raised in the debt capital markets in Hong Kong is estimated to reach US$235.3 billion by 2023, representing a CAGR of 6.6% from 2019 to 2023. Financial institutions and real estate developers are the major issuers in the debt capital markets in Hong Kong. In 2018, the capital raised by financial institutions and real estate developers represent 37.8% and 16.1%, respectively, of the total capital raised in the debt capital markets in Hong Kong. From 2013 to 2018, financial institutions demonstrated the strongest debt refinancing needs with the amount of capital raised increasing at a CAGR of 42.1%. Driven by the demand for better capital adequacy positions by commercial banks, there were several mega-sized debt offering transactions from 2013 to 2018, such as additional tier one capital preferred shares, or AT1 capital preferred shares, issued by Postal Savings Bank of China. The following diagram illustrates the growth of the debt capital markets in terms of capital raised for the periods presented.
Capital Raised in the Debt Capital Market by Industry, Hong Kong, 2013-2023E
Source: SEHK and CIC
Note: The Hong Kong debt capital markets products include government bonds, corporate bonds, and AT1 capital preferred shares issued in the SEHK.
Asset Management
The market of HKSFC-licensed asset management firms as measured by AUM increased from US$1.30 trillion in 2013 to US$1.85 trillion in 2018, representing a CAGR of 7.4%.
These asset management firms dominated the market with approximately 88.3% market share in the asset management industry in Hong Kong in 2018. In terms of client type, corporate and other institutional investors accounted for approximately 70% of the AUM of the asset management industry in Hong Kong in 2018.
For Hong Kong-headquartered companies, AUM increased from US$92.6 billion in 2013 to US$129.2 billion in 2018, representing a CAGR of 6.9%. According to the CIC Report, Hong Kong's asset management industry is expected to continue to experience steady growth over the next five years, driven by factors such as the steady growth of the number of China-based companies raising capital in the Hong Kong capital markets and the amount of capital they raise, as well as their increasing demand for offshore asset diversification and appreciation. As a result, the market size of the asset management industry in Hong Kong is expected to reach US$2.58 trillion by 2023, representing a CAGR of 6.9% from 2018. The following diagram illustrates the AUM of the asset management industry in Hong Kong for the periods presented.
AUM of the HKSFC-Licensed Asset Management Industry, Hong Kong, 2013-2023E
Source: HKSFC, CIC
Note: The players in the asset management industry in Hong Kong primarily include HKSFC-licensed asset management companies, registered banks, and non-HKSFC-licensed insurance companies. HKSFC-licensed asset management companies consist of independent non-bank and non-insurance companies and licensed insurance companies. The market size represents the AUM of HKSFC-licensed asset management companies in Hong Kong. In 2018, HKSFC-licensed asset management companies had a market share of approximately 88.3% in Hong Kong's asset management industry, as measured by AUM.
Investment
The total investment amounts in China's equity investment market, excluding IPO activities, increased from US$56.1 billion in 2013 to US$209.2 billion in 2018, representing a robust CAGR of 30.1%. Such number is estimated to reach US$474.5 billion by 2023, according to the CIC Report. The New Economy Companies have been playing a significant role in driving the structural economic transformation in China. According to the CIC Report, the gross merchandise value of the New Economy Companies in China increased to US$3.4 trillion in 2017, representing a robust CAGR of 35.1% from 2013 to 2017. Boosted by the financing demands of the New Economy Companies, equity investments in the New Economy Companies increased from US$22.6 billion in 2013 to US$122.1 billion in 2018, representing a robust CAGR of 40.2%. Such number is estimated to reach US$304.9 billion by 2023, accounting for over 60% of the total equity investment market in China, according to the CIC Report. The following diagram illustrates the growth of the equity investment market in China for the periods presented.
Total Investment Amount of Equity Investment Market and the New Economy Market, China, 2013-2023E
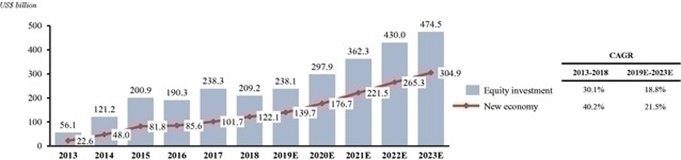
Source: CIC
Leveraging extensive industry expertise and capital markets resources, investment banking firms are able to help investee companies improve corporate governance structures and diversify financing channels. As a result of these advantages, investment banking firms have been playing an important role in the equity investment market for both traditional economies and emerging economies.
Market Drivers
Favorable Policies and Increasing Demand for Financing Services by China-based Companies
The PRC government emphasizes the importance of private companies through a number of mandates, such as reducing the value-added tax rate, establishing a national fund to increase the convenience of financing, and encouraging innovative private companies to go public.
Strong financing needs from financial institution groups and real estate developers
Traditional financial and real estate industries in China developed rapidly through financing and acquisition activities. In the Hong Kong capital markets, total capital raised by China-based financial institutions and real estate developers through equity and debt financings increased from US$51.1 billion in 2013 to US$110.3 billion in 2018. The corresponding percentage to the total capital raised from equity and debt markets increased from approximately 30% in 2013 to approximately 49% in 2018. Considering the increasing capital requirements for commercial banks and the upcoming peak of the property mortgage repayment, it is estimated that the capital raised by companies in these two industries would reach US$141.3 billion and account for 48.4% of the total capital raised from equity and debt markets by 2023, according to the CIC Report.
Market Shares of the Total Capital Raised by China-based Financial Institutions and Real Estate
Developers in Hong Kong, 2013-2023E

Source: CSRC, SEHK, CIC
Note: The decline of the market share of total capital raised by China-based financial institutions and real estate developers in 2018 was mainly attributed to stringent regulations to their debt refinancing activities in China and a larger amount of IPO proceeds raised by the New Economy Companies in China, which accounted for 48.9% of the total IPO proceeds in the SEHK.
The unfavorable conditions of the current stock market in China have raised growing concerns on the increasing underpriced or unapproved IPOs and undervalued secondary offerings, resulting in more capital raised overseas by traditional China-based companies. Many China-based companies also opt to issue more offshore U.S. dollar-denominated bonds in Asian markets, such as Hong Kong and Singapore. The number of offshore U.S. dollar-denominated bond offerings by China-based companies surged with a CAGR of 35.1% from 2013 to 2018. Bond offerings, especially those with a size less than US$100 million, increased rapidly. Smaller-size bond offerings as a percentage of total U.S. dollar-denominated bond offerings by China-based companies increased from 3.6% in 2013 to 19.0% in 2018, according to the CIC Report.
Tremendous demand of the booming New Economy Companies in China
China has been playing an important role in the development of the internet, digital technologies, and business model innovations. According to the CIC Report, in 2017, there were more than 85,000 emerging New Economy Companies in China with an estimated combined valuation of US$3.6 trillion, of which over 8,000 received more than US$101.7 billion investments in the same period. Driven by the evolving and highly competitive business environment in China, the New Economy Companies have been growing rapidly through investing in technologies and innovations, initiating marketing campaigns, and recruiting talent, among others. The booming of the New Economy Companies indicates strong growth potential for the capital markets in China, especially the equity investment markets and the equity capital markets. In terms of investment amount, activities of the equity investment market and the equity capital markets for the New Economy Companies as a percentage of the total market increased from 44.9% and 3.4% in 2013 to 53.5% and 9.0% in 2017, respectively.
Imperative refinancing needs of China-based financial institution groups and real estate developers
Due to tightened credit policies, the government's deleveraging efforts, and the slowdown of economic growth in China, the traditional economy is facing structural challenges.
Meanwhile, strengthened "supply-side structural reform" is accelerating the shifting of economic growth model, which generates an increasing demand for diversified financing. In particular, commercial banks and real estate developers are in imperative need of stable and cost-efficient funding channels in both onshore and offshore markets due to their strong reliance on capital and liquidity.
Capital raised by financial institutions has been growing steadily along with their endogenous business growth. In particular, the number of commercial banks in China grew from 630 in 2013 to 1,566 in 2018. With growing influence in the financial industry and economic system, financial institutions have recurring financing needs to meet tightening capital adequacy requirements and are encouraged to issue low-risk bonds favored by the institutional investors due to their risk appetite. According to the China Banking Insurance Regulatory Commission, there are over 1,500 regional banks, including city commercial banks and rural commercial banks, whose total assets accounted for 23.4% of the total banking assets in 2018. For recurring refinancing purposes, they tend to leverage financings such as IPOs and AT1 capital preferred share offerings to maintain capital adequacy and improve balance sheets.
As one of the pillar industries in China, the real estate market has experienced a rapid growth with total investment increasing from US$1.3 trillion in 2013 to US$1.8 trillion in 2018. Due to tightened credit and loan policies in recent years, many real estate developers have been under liquidity pressure and seeking equity and debt financing in overseas markets. Hong Kong is especially favored by real estate developers in China due to a less stringent regulatory environment and a diversified investor base. Lower interest rates and relaxed monetary policies in 2015 and 2016 encouraged real estate developers in China to finance their land acquisitions through debt offerings. A large number of three-year to five-year real-estate bonds were issued in 2015 and 2016, leading to a peak debt repayment period from 2018 to 2021. According to the CIC Report, as a result of limited external financing channels, real estate developers in China are expected to issue over US$150 billion bonds overseas between 2019 and 2021 to meet their repayment obligations.
Proximity to China, the Innate Advantage for Hong Kong
The "Greater Bay Area Initiative" is expected to further enhance Hong Kong's unique advantages
By integrating Hong Kong, Macau, and the nine cities in Guangdong province, the Greater Bay Area Initiative formulated by the PRC government aims to build a world-class city cluster to serve as a crucial connecting point for the "Belt and Road Initiative". The "Greater Bay Area Initiative" demonstrates a huge growth potential by harnessing each city's core competitiveness, including Hong Kong's expertise in financial and professional services, Shenzhen's technological innovation capabilities, and Guangzhou's manufacturing strength. The completion of the Hong Kong-Zhuhai-Macao Bridge and the Express Rail Link further improved the logistical infrastructure in the Greater Bay Area and increased the flow of capital, talents, goods, and services. China-based companies are believed to be able to further benefit from Hong Kong's leading international financial center for fundraising, asset management, and other financial services.
Hong Kong's strategic location as a two-way gateway between China and global markets
As at December 31, 2018, nearly half of Hong Kong-listed companies are China-based. Hong Kong has been the most important hub to connect China-based companies with global markets:
· | Dominant gateway to China. Hong Kong continues to contribute a significant part of China's outbound and inbound investment. In 2018, Hong Kong originated and intermediated approximately 60.7% and 66.7% of China's outbound direct investment and inbound foreign direct investment, respectively. |
| |
· | Connectivity of capital markets. The Shanghai-Hong Kong Stock Connect and the Shenzhen-Hong Kong Stock Connect have enhanced the capital flows between China and Hong Kong. The initiation of the China-Hong Kong Bond Connect in 2017 is expected to further increase the capital flows between China and Hong Kong. |
| |
· | Offshore Renminbi clearing center. Serving as the world's largest offshore Renminbi clearing center, Renminbi transactions in Hong Kong accounted for approximately 79.0% of the total Renminbi transactions worldwide in 2018. With the ongoing process of Renminbi internationalization, the number of Renminbi-denominated financial assets is expected to grow, which will enrich the types of investable underlying assets. In addition, the expansion of the Qualified Foreign Institution Investor (QFII), Renminbi QFII (RQFII), and Qualified Domestic Institutional Investor ("QDII") quotas have also increased the flow of capital into and out of Hong Kong, further enhancing the position of the offshore Renminbi clearing center. |
A number of initiatives and reforms have been implemented by the Hong Kong authorities to embrace the new economy deals. For example, the "New Hong Kong Dual-Class and Biotech Companies Listing Regime", introduced in April 2018, improved the inclusion of the equity capital markets for pre-profit or pre-revenue biotech issuers and the New Economy Companies with weighted voting rights structure, and established a new concessionary secondary listing route for companies in emerging sectors. In addition, a series of initiatives such as a stamp duty waiver for all exchange traded funds, an extension of profit tax exemption to offshore private equity funds, and the issued "Code on Open-ended Fund Companies" have been implemented to further enhance Hong Kong's position as a global full-service asset management center.
Limitation of the A Share Stock Market
Several limitations and high thresholds of the A share market, such as prolonged reviewing and approval process and profitability requirements have detered many competitive China-based companies including emerging New Economy Companies to get listed in A share market. As a result, overseas capital markets have become attractive alternatives for China-based companies, especially the New Economy Companies. According to the CIC Report, in 2018, 61 New Economy Companies in China chose the Hong Kong market and the U.S. market for their IPOs, accounting for 68.5% of the total number of deals and 76.4% of the total capital raised for the new economy IPOs.
As policy focus shifts to deeper structural reforms, a series of reform agendas have been made since 2017 across many sectors including financial, state-owned enterprises, and social welfare. However, progresses such as increasing equity and bond inflows and easing cross-border Renminbi flows have not been fully reflected in the market performance. As uncertainties with respect to the recovery of the A Share stock market continue to exist, limited financing choices in China are expected to generate substantial tailwinds to offshore markets, especially the Hong Kong market.
Overseas Assets Allocation by Investors in China
In the past, the penetration rate of global asset allocation among investors in China was significantly lower than the average rate in the developed countries. However, due to an evolving risk appetite and an increasing demand for portfolio diversification, the investment preference of investors in China has started to shift towards a more internationalized asset allocation mode. According to the CIC Report, the total amount of outbound direct investments increased from US$123.1 billion in 2014 to US$143.0 billion in 2018, representing a CAGR of 3.8%. Meanwhile, the amount of QDII quota increased from US$84.2 billion in 2013 to US$104.0 billion in the nine months ended 30 September 2019. Factors contributing to this trend also include the increasing proportion of financial assets to the total assets, the lack of attractive investment opportunities in China's domestic market, and the relatively stable and higher returns of overseas markets.
New initiatives in virtual banking to digitalize the traditional financial services market
Virtual banks, unlike traditional banks, deliver retail banking services primarily through the internet or other digital channels rather than physical branches. According to the CIC Report, the emergence of virtual banks effectively reduces service fees, enhances customer experience, and improves financial inclusion especially for Small and medium sized enterprises and end-customers. On 9 May, 2019, the Hong Kong Monetary Authority announced the approval of eight virtual bank licenses for fintech companies in Hong Kong, among which, AMTD Group partnering with Xiaomi Corporation was approved as a license holder. The Revised Guideline on Authorization of Virtual Banks, a faster payment system (FPS) for banks and stored value facilities, among other initiatives, are expected to continue to promote the development of virtual banking.
MANAGEMENT
MANAGEMENT REPORTING STRUCTURE

DIRECTORS
Under Cayman Islands law, our Directors owe fiduciary duties to us, including acting in good faith and with a view to our best interests. Our Directors must also exercise their powers only for a proper purpose. Our Directors also owe to our Company a duty to act with skill and care. English and Commonwealth courts have moved towards an objective standard with regard to the required skill and care and these authorities are likely to be followed in the Cayman Islands. In fulfilling their duty of care to us, our Directors must ensure compliance with our Memorandum and Articles of Association and the class rights vested thereunder in the holders of the shares. A shareholder may in certain limited exceptional circumstances have the right to seek damages in our name if a duty owed by our Directors is breached.
Our Board has all the powers necessary for managing, and for directing and supervising, our business affairs. The functions and powers of our Board include, among others:
· | convening shareholders' annual general meetings and reporting its work to shareholders at such meetings; |
| |
· | declaring dividends and distributions; |
| |
· | appointing officers and determining the term of office of the officers; |
| |
· | exercising the borrowing powers of our Company and mortgaging the property of our Company; and |
| |
· | approving the transfer of shares in our Company, including the registration of such shares in our share register. |
Our Board is entrusted with the responsibility for our overall management and direction.
A Director is not required to hold any shares in our Company to qualify to serve as a Director. Subject to the rules of the relevant stock exchange and disqualification by the chairman of the Board, a Director may vote with respect to any contract, proposed contract, or arrangement in which he or she is materially interested. A Director may exercise all the powers of our Company to borrow money, mortgage its business, property and uncalled capital and issue debentures or other securities whenever money is borrowed or as security for any obligation of our Company or of any third-party.
The following table sets forth information regarding our Directors.
Name | | Age | | Address | | Occupation | | Date of Appointment as Director |
Calvin Choi. | | 41 | | 23/F Nexxus Building, 41 Connaught Road Central, Hong Kong | | Chairman and Executive Director of the Board and Chief Executive Officer | | February 2019 |
Marcellus Wong | | 66 | | 23/F Nexxus Building, 41 Connaught Road Central, Hong Kong | | Vice Chairman of the Board, Chairman of the Executive Management Committee | | February 2019 |
Andrew Chiu | | 31 | | 23/F Nexxus Building, 41 Connaught Road Central, Hong Kong | | Non-Executive Director, Vice Chairman of the Board | | December 2019 |
Raymond Yung. | | 60 | | 23/F Nexxus Building, 41 Connaught Road Central, Hong Kong | | Non-Executive Director | | July 2019 |
Yu Gao. | | 46 | | 40/F, International Commerce Centre, 1 Austin Road West, Kowloon, Hong Kong | | Independent Director | | March 2019 |
Feridun Hamdullahpur | | 65 | | University of Waterloo, 200 University Avenue, West Waterloo, Ontario, Canada N2L3G1 | | Independent Director | | March 2019 |
Experience of our Board
As our Company is listed on the NYSE, all of our Directors have experience as a director of at least one public listed company in United States. In addition, Calvin Choi, Marcellus Wong, Andrew Chiu and Yu Gao are also directors of other public listed companies.
Our Directors have been briefed on the roles and responsibilities of a director of a public listed company in Singapore prior to the listing of our Company on the Main Board of the SGX-ST.
Information on the key business and working experience of our Directors is set out below:
Calvin Choi
Calvin Choi is our Chairman of the Board and Chief Executive Officer, and has nearly 20 years of experience in investment banking, international capital markets, and professional auditing sectors. Since February 2016, Calvin Choi has served as the chairman of the board of directors and chief executive officer of our Controlling Shareholder.
Since October 2016, Calvin Choi has been a non-executive director of Bank of Qingdao Co., Ltd. (SEHK: 3866 and SZSE: 002948), a company listed on the main board of the Stock Exchange of Hong Kong Limited and on the main board of the Shenzhen Stock Exchange. Calvin Choi worked at UBS from October 2010 to January 2016, his most recent role there being managing director of the investment bank division. From January 2009 to October 2010, Calvin Choi worked at PricewaterhouseCoopers Hong Kong, his most recent role there being director of corporate finance division. From July 2005 to December 2008, Calvin Choi worked at Citigroup, his most recent role there being China chief specialist and the head of China strategic alliance unit of Citi Corporate and Investment Bank. From 2001 to 2005, Calvin Choi worked at PricewaterhouseCoopers Hong Kong and Arthur Andersen & Co. (Hong Kong), his most recent position there being senior manager.
In 2019, he was awarded "2019 Asia Fintech Leader" by the Singapore FinTech Association. He was also named as a Young Global Leader by the World Economic Forum in 2017 and selected by the Institutional Investor magazine as one of the "2016 Fintech Finance 35" globally in 2016. Calvin Choi currently holds various positions with a range of organizations, including vice chairman of the Greater Bay Area Homeland Youth Community Foundation, member of the Cyberport Advisory Panel, member of Hong Kong SAR's Prisoners' Education Trust Fund Investment Advisory Committee, director of ASEAN Financial Innovation Network (AFIN), founder and chairman of Greater Bay Young Entrepreneurs Association, founder and chairman of the Regional Banks+ Strategic Cooperation Alliance, founder and chairman of AMTD Foundation, vice chairman of Hong Kong Federation of Professions, and board director of One Child Network & Support Inc.
Calvin Choi also holds directorships in several privately-owned companies. Please see "Appendix F – List of Past and Present Principal Directorships" for further details of Calvin Choi's past and present principal directorships in the last five years preceding the date of this Introductory Document. Calvin Choi is currently a certified bank auditor and a certified public accountant in the United States. Calvin Choi graduated from the University of Waterloo in Canada in June 2001 with a Bachelor of Arts (Honors) degree in Chartered Accountancy Studies. Calvin Choi also completed the executive education-transformational leadership program at the Saïd Business School of the University of Oxford.
Marcellus Wong
Marcellus Wong is our Vice Chairman of the Board, chairman of the executive management committee, and member of the investment committee, and has over 40 years of experience in accounting and taxation. Marcellus Wong has been serving as the vice chairman of the board of directors of our Controlling Shareholder since October 2015.
Marcellus Wong holds a number of other positions including, since June 2015, independent non-executive director of SEHK-listed Xinte Energy Co., Ltd. (SEHK: 1799); since January 2015, senior advisor of L.R. Capital Group; from July 2012 to June 2017, senior advisor of PricewaterhouseCoopers; and, since November 2001, a member of the Joint Liaison Committee on Taxation that advises the government of Hong Kong on tax issues. Meanwhile, Marcellus Wong served as a council member of the Taxation Institute of Hong Kong from 1995 to 2017, president from 1996 to 1999, and has served as chairman of advisory board since 2017. He was the president of CPA Australia-Hong Kong China Division from 2004 to 2005 and has served as its honorary adviser of Greater China region since July 2014.
Prior to joining our Controlling Shareholder, Marcellus Wong served as a member of the Working Group on the Long-Term Fiscal Planning of the government of Hong Kong from June 2013 to January 2015. Marcellus Wong joined PricewaterhouseCoopers in February 1990 and, prior to his retirement in June 2012, served as a partner and compliance leader in Hong Kong and China as well as risk and quality leader for its tax practice in the Asia-Pacific region. From July 1977 to January 1990, Marcellus Wong served as a tax assessor at the Inland Revenue Department of the government of Hong Kong. Between 1999 and 2012, Marcellus Wong had been consistently named by Euromoney as one of the "world's leading tax advisers" in Hong Kong and China.
Marcellus Wong also holds directorships in several privately-owned companies. Please see "Appendix F – List of Past and Present Principal Directorships" for further details of Marcellus Wong's past and present principal directorships in the last five years preceding the date of this Introductory Document. Marcellus Wong graduated from the Hong Kong Polytechnic (currently known as The Hong Kong Polytechnic University) with a higher diploma in accountancy in October 1977, and also obtained a Bachelor of Laws degree through the external program from the University of London in the United Kingdom in August 1989. Marcellus Wong was admitted as a fellow of the Hong Kong Institute of Certified Public Accountants in December 1987, an associate of the Hong Kong Institute of Chartered Secretaries in July 1996, a fellow of CPA Australia in October 2001, and a fellow of the Taxation Institute of Hong Kong in March 2004.
Andrew Chiu
Andrew Chiu is our vice chairman of the Board since December 2019. Andrew Chiu is the son of Tan Sri Dato' David Chiu, chairman of Far East Consortium International Limited (SEHK: 35). Andrew Chiu is the founder and executive chairman of Land Pacific Limited, Deacon House International Limited, Ariana Capital Investment Limited and Ariana Social Community Limited, all of which operate property development, hotel businesses and proprietary investment. Andrew Chiu has served various positions since he joined Far East Consortium International Limited in 2009 and is currently assistant to the chairman.
Andrew Chiu currently serves as a director in each of Ju Ching Chu English College Limited, i-Cable Communications Limited (SEHK: 1097), and Malaysia Land Properties Sdn Bhd, and Land & General Berhad, a company listed on the Bursa Malaysia. Andrew Chiu also holds directorships in several privately owned companies. Please see "Appendix F – List of Past and Present Principal Directorships" for further details of Andrew Chiu's past and present principal directorships in the last five years preceding the date of this Introductory Document.
Andrew Chiu is a member of Hong Kong Beijing Association, vice chairman of Federation of HK Jiangsu Community Organizations, a member of Shenzhen Overseas Friendship Association, a member of The Real Estate Developers Association of Hong Kong, and a member of Hong Kong General Chamber of Commerce.
Raymond Yung
Raymond Yung is our Director, and has over 39 years of experience in advising financial institutions in Hong Kong and China. Raymond Yung has served as chief executive officer of L.R. Capital Group, an indirect controlling shareholder of our Controlling Shareholder, since 2016. Raymond Yung sits on the board of Citibank (Hong Kong) Limited. Raymond Yung has extensive experience in the operational, risk management, internal controls, and financial reform of many large-scale financial institutions.
Prior to joining L.R. Capital Group, Raymond Yung headed PricewaterhouseCoopers's financial services practice in China for over ten years. From September 1992 to June 2002, Raymond Yung led Arthur Andersen's financial services group in Hong Kong. Raymond Yung was the lead engagement partner for the restructuring and IPO of eleven licensed banks which were merged to form the BOC Hong Kong (Holdings) Limited in 2002. Between 1991 and 1992, Raymond Yung was appointed as a special advisor to the deputy chief executive of the Hong Kong Monetary Authority in relation to internal controls and accounting matters, and was subsequently appointed to serve on its banking advisory committee.
Currently, Raymond Yung also holds directorships in two privately owned companies, EMQ Limited and AMTD Foundation Limited. He used to be an independent non-executive director of SEHK-listed Guangzhou Rural Commercial Bank Co., Ltd (SEHK: 1551) from December 2017 to January 2020 as well. Raymond Yung is a member of the Hong Kong Institute of Certified Public Accountants and a certified accountant registered with the UK Chartered Association of Certified Accountants and CPA Australia. Raymond Yung graduated from The Hong Kong Polytechnic University with a higher diploma in accountancy in November 1980.
INDEPENDENT DIRECTORS
Yu Gao
Yu Gao is our Independent Director. Yu Gao has served as a director of our Controlling Shareholder since October 2014. Yu Gao joined Morgan Stanley Asia Limited in August 2005 and primarily focuses on private equity investment transactions in China. He is currently a managing director, head of China investment operations and Co-CIO for Morgan Stanley private equity Asia. Prior to joining Morgan Stanley, he worked in Citigroup's Asia-Pacific investment banking division, and Donaldson, Lufkin & Jenrette's debt capital markets group in New York.
Yu Gao has served as a non-executive director of SEHK-listed China Feihe Limited (SEHK: 6186) since June 2013, a non-executive director of SEHK-listed Home Control International Limited (SEHK: 1747) since April 2015 and chairman of the board since June 2019, a non-executive director of SEHK-listed Sparkle Roll Group Limited (SEHK: 970) since September 2010. From July 2007 to May 2013, he was a non-executive director of SEHK-listed China Dongxiang (Group) Co., Ltd. (SEHK: 3818) and has been an independent non-executive director since May 2013.
Yu Gao has served as a director of Shandong Buchang Pharmaceutical Co., Ltd. (SSE: 603858) since March 2012. From August 2006 to August 2014, he was a non-executive director of SEHK-listed Belle International Holdings Limited (SEHK: 1880) and has been an independent non-executive director from August 2014 to July 2017. Yu Gao was also a director of Tongkun Group Co., Ltd. (SSE: 601233), a company listed on Shanghai Stock Exchange, or SSE, from April 2011 to March 2015. Yu Gao also holds directorships in several privately-owned companies. Please see "Appendix F – List of Past and Present Principal Directorships" for further details of Yu Gao's past and present principal directorships in the last five years preceding the date of this Introductory Document.
Yu Gao received dual Bachelor's degrees in Engineering and Economics from Tsinghua University in China in July 1997 and a master of science degree in engineering-economic systems and operations research from Stanford University in the United States in September 1999.
Feridun Hamdullahpur
Dr. Feridun Hamdullahpur is our Independent Director. Dr. Hamdullahpur has served as a director of our Controlling Shareholder since January 2019. Dr. Hamdullahpur has served as the sixth president and vice-chancellor of the University of Waterloo since 2010. Prior to that, he served as a vice-president academic and provost at the University of Waterloo from September 2009 to September 2010. Dr. Hamdullahpur has served as a member of the strategic advisory board of Sorbonne University since 2014, and member of the international advisory board of King Abdulaziz University since 2017. He has served as chair of the Waterloo Global Science Initiative since 2016. In 2015, Dr. Hamdullahpur was appointed chair of the Leadership Council for Digital Infrastructure in Canada. Dr. Hamdullahpur was named a fellow of the Canadian Academy of Engineering in July 2014. Dr. Hamdullahpur was awarded the Queen Elizabeth II Diamond Jubilee Medal in January 2013 in acknowledgement of his leadership in education and innovation. Dr. Hamdullahpur graduated from the Technical University of Nova Scotia with a bachelor's degree in chemical engineering in 1976 and a master's degree in mechanical engineering from Istanbul Technical University in 1979. Dr. Hamdullahpur received his Ph.D. in chemical engineer from the Technical University of Nova Scotia in 1985.
Independent Directors
One of the key roles of the Directors of our Company, including our Independent Directors, is to formulate the strategic direction of the businesses of our Group in order to achieve our business objectives. We seek to appoint to our Board persons who have distinguished themselves in their respective fields and who are able to contribute to our business objectives. Our Company's current Board comprises six (6) Directors of whom two (2) are Independent Directors as determined in accordance with the requirements of Section 303A of the Corporate Governance Rules of the NYSE. However, our Company will undertake to appoint one (1) independent director resident in Singapore within three (3) months after the date of the Secondary Listing.
Independence of our Independent Directors
Our Independent Directors have passed the following independence tests as laid out in Section 303A of the Corporate Governance Rules of the NYSE:
(a) | (i) | No director qualifies as "independent" unless the board of directors affirmatively determines that the director has no material relationship with the listed company (either directly or as a partner, shareholder or officer of an organization that has a relationship with the company). |
| | |
| (ii) | In addition, in affirmatively determining the independence of any director who will serve on the compensation committee of the listed company's board of directors, the board of directors must consider all factors specifically relevant to determining whether a director has a relationship to the listed company which is material to that director's ability to be independent from management in connection with the duties of a compensation committee member, including, but not limited to: |
| (A) | the source of compensation of such director, including any consulting, advisory or other compensatory fee paid by the listed company to such director; and |
| | |
| (B) | whether such director is affiliated with the listed company, a subsidiary of the listed company or an affiliate of a subsidiary of the listed company. |
| (b) In addition, a director is not independent if: |
| (i) | The director is, or has been within the last three years, an employee of the listed company, or an immediate family member is, or has been within the last three years, an executive officer, of the listed company. |
| | |
| (ii) | The director has received, or has an immediate family member who has received, during any twelve-month period within the last three years, more than $120,000 in direct compensation from the listed company, other than director and committee fees and pension or other forms of deferred compensation for prior service (provided such compensation is not contingent in any way on continued service). |
| | |
| (iii) | (A) The director is a current partner or employee of a firm that is the listed company's internal or external auditor; (B) the director has an immediate family member who is a current partner of such a firm; (C) the director has an immediate family member who is a current employee of such a firm and personally works on the listed company's audit; or (D) the director or an immediate family member was within the last three years a partner or employee of such a firm and personally worked on the listed company's audit within that time. |
| | |
| (iv) | The director or an immediate family member is, or has been with the last three years, employed as an executive officer of another company where any of the listed company's present executive officers at the same time serves or served on that company's compensation committee. |
| | |
| (v) | The director is a current employee, or an immediate family member is a current executive officer, of a company that has made payments to, or received payments from, the listed company for property or services in an amount which, in any of the last three fiscal years, exceeds the greater of $1 million, or 2% of such other company's consolidated gross revenues. |
Past and present principal directorships of our Directors
The past and present principal directorships held by our Directors in the last five years preceding the date of this Introductory Document are set out in "Appendix F – List of Past and Present Principal Directorships".
None of the Independent Directors of our Company sits on the board of our Subsidiaries that are based in jurisdictions other than Singapore.
Interests in our Securities
As at the date of this Introductory Document, one of our Directors holds Class A Shares and one of our Directors holds Class B ordinary shares of our Company. For further details as to our Directors' interests in our securities, including the ADSs and Class A Shares, see the section entitled "Share Capital and Shareholders – Current Shareholders".
Service Agreements
None of our Directors has entered, or proposes to enter, into service agreements with us or any subsidiary or subsidiary entity of our Group which provides for benefits upon termination of employment.
We have entered into employment agreements with our senior Executive Officers. Pursuant to these agreements, we are entitled to terminate a senior Executive Officer's employment for cause at any time without remuneration for certain acts of the officer, such as being convicted of any criminal conduct, any act of gross or willful misconduct or any serious, willful, grossly negligent or persistent breach of any employment agreement provision, or engaging in any conduct which may make the continued employment of such officer detrimental to our Company. Each Executive Officer agrees that we shall own all the intellectual property developed by such officer during his or her employment.
We have entered into indemnification agreements with each of our Directors and Executive Officers. Under these agreements, we agree to indemnify them against certain liabilities and expenses that they incur in connection with claims made by reason of their being a Director or Executive Officer of our Company.
Term of office
Our officers are elected by and serve at the discretion of the Board. Our Directors are not subject to a term of office and hold office until such time as they are removed from office by ordinary resolution of the shareholders or by the Board. A Director will be removed from office automatically if, among other things, the Director (i) becomes bankrupt or makes any arrangement or composition with his creditors; or (ii) is found by our Company to be or becomes of unsound mind.
CORPORATE GOVERNANCE
Our Directors recognize the importance of corporate governance and the maintenance of high standards of accountability to our shareholders.
Our Board has established three committees: (i) the Audit Committee; (ii) the Nominating and Corporate Governance Committee; and (iii) the Compensation Committee.
Audit Committee
Our Audit Committee consists of Calvin Choi, Yu Gao, and Dr. Feridun Hamdullahpur, and is chaired by Yu Gao. Yu Gao and Dr. Feridun Hamdullahpur each satisfies the "independence" requirements of Section 303A of the Corporate Governance Rules of the NYSE and meet the independence standards under Rule 10A-3 under the Exchange Act. We have determined that Yu Gao qualifies as an "audit committee financial expert". The Audit Committee will oversee our accounting and financial reporting processes and the audits of the financial statements of our Company. The Audit Committee will be responsible for, among other things:
· | selecting the independent registered public accounting firm and pre-approving all auditing and non-auditing services permitted to be performed by the independent registered public accounting firm; |
| |
· | reviewing with the independent registered public accounting firm any audit problems or difficulties and management's response; |
| |
· | reviewing and approving all proposed related party transactions, as defined in Item 404 of Regulation S-K under the Securities Act; |
| |
· | discussing the annual audited financial statements with management and the independent registered public accounting firm; |
| |
· | reviewing major issues as to the adequacy of our internal controls and any special audit steps adopted in light of material control deficiencies; |
| |
· | annually reviewing and reassessing the adequacy of our Audit Committee charter; |
| |
· | meeting separately and periodically with management and the independent registered public accounting firm; and |
| |
· | reporting regularly to the Board. |
All decisions at any meeting of the Audit Committee shall be decided by a majority of votes of the members present and voting and such decision shall at all times exclude the vote, approval or recommendation of any member who has a conflict of interest in the subject matter under consideration.
Apart from the duties listed above, the Audit Committee is required to discuss matters which may involve any suspected fraud or irregularity, or suspected infringement of any law, rule or regulation which has or is likely to have a material impact on our operating results or financial position with external auditors and report such matters to the Board at an appropriate time.
Our Board, after making all reasonable enquiries, with the concurrence of our Audit Committee, is of the opinion that our internal controls and risks management systems are adequate and effective to address the financial, operational, compliance and information technology risks.
Our Audit Committee has considered the suitability of Cliff Li for his role as Group Chief Financial Officer. Our Audit Committee, after having (a) conducted interviews and/or otherwise met our Group Chief Financial Officer over several occasions; (b) considered the qualifications and past working experience of our Group Chief Financial Officer (as described below); (c) noted our Group Chief Financial Officer's abilities, familiarity and diligence in relation to our financial matters and information; (d) noted the absence of negative feedback on our Group Chief Financial Officer from his previous employers; (e) noted the team that supports and reports to him including their past working experience and qualifications and (f) made all reasonable enquiries, and to the best of its knowledge and belief, is of the view that our Group Chief Financial Officer has the competence, character and integrity expected of a chief financial officer of a listed issuer.
Cliff Li, our Group Chief Financial Officer, has confirmed that he is adequately familiar with our business and operations and is familiar with our Group's accounting processes and policies. See the section entitled "Management – Executive Officers – Cliff Li".
Nominating and Corporate Governance Committee
Our Nominating and Corporate Governance Committee consists of Calvin Choi, Yu Gao, and Dr. Feridun Hamdullahpur, and is chaired by Dr. Feridun Hamdullahpur. Yu Gao and Dr. Feridun Hamdullahpur each satisfies the "independence" requirements of Section 303A of the Corporate Governance Rules of the NYSE.
The Nominating and Corporate Governance Committee will assist the Board in selecting individuals qualified to become our Directors and in determining the composition of the Board and its committees. The Nominating and Corporate Governance Committee will be responsible for, among other things:
· | recommending nominees to the Board for election or re-election to the Board, or for appointment to fill any vacancy on the Board; |
| |
· | reviewing annually with the Board the current composition of the Board with regards to characteristics such as independence, age, skills, experience and availability of service to us; |
| |
· | selecting and recommending to the Board the names of Directors to serve as members of the Audit Committee and the Compensation Committee, as well as of the Nominating and Corporate Governance Committee itself; and |
| |
· | monitoring compliance with our code of business conduct and ethics, including reviewing the adequacy and effectiveness of our procedures to ensure proper compliance. |
| |
· | undertake generally such other functions and duties as may be required by law or the Listing Manual, and by amendments made thereto from time to time. |
Each member of the Nominating and Corporate Governance Committee is required to abstain from voting, approving or making a recommendation on any resolutions of the Nominating and Corporate Governance Committee in which he has a conflict of interest in the subject matter under consideration. All decisions at any meeting of the Nominating and Corporate Governance Committee shall be decided by a majority of votes of the members present and voting and such decision shall at all times exclude the vote, approval or recommendation of any member who has a conflict of interest in the subject matter under consideration.
Dual appointments
Calvin Choi, our Chairman of the Board and Chief Executive Officer, is also the chairman of the board of directors and chief executive officer of AMTD Group with similar responsibilities. We do not believe that there is a conflict of interest for his dual-appointment as we have in place the AMTD-SpiderNet ecosystem which aligns the interests of our Company, our shareholders, our business partners and our investee companies. We believe that Calvin Choi's position as chairman and chief executive in both our Company and AMTD Group is beneficial for both companies as he will be able to consider the overall strategies on a consolidated basis and better utilize resources from both our Company and AMTD Group. Cliff Li, our Group Chief Financial Officer and assistant to the Chief Executive Officer, is also the assistant to the chief executive officer / the chief financial officer of AMTD Group. Separate records are maintained for AMTD Group and our Company, and separate teams are responsible for the preparation of the financial statements of both AMTD Group and our Company. In addition, our Company is the core revenue engine of AMTD Group, contributing over 50% of the total revenue of AMTD Group. We believe it is beneficial for both our Company and AMTD Group to have the same chief financial officer in order to achieve efficiency for financial reporting. Our Company does not foresee any conflict of interest between Cliff Li's roles in our Company and AMTD Group.
The Nominating and Corporate Governance Committee and the Board are of the view that view that our Directors and Executive Officers who hold dual-appointments on both our Company and AMTD Group, namely, Calvin Choi, Marcellus Wong and Yu Gao are able to devote sufficient time to the management of our Company. In addition, majority of the management's time will rest with our Company instead of AMTD Group with the management's attention to be focused on our Company first, before AMTD Group.
Compensation Committee
Our Compensation Committee consists of Calvin Choi, Marcellus Wong, Yu Gao, and Dr. Feridun Hamdullahpur, and will be chaired by Calvin Choi. Yu Gao and Dr. Feridun Hamdullahpur each satisfies the "independence" requirements of Section 303A of the Corporate Governance Rules of the NYSE. The Compensation Committee will assist the Board in reviewing and approving the compensation structure, including all forms of compensation, relating to our Directors and Executive Officers. Our Chief Executive Officer may not be present at any committee meeting during which his compensation is deliberated upon. The Compensation Committee will be responsible for, among other things:
· | reviewing the total compensation package for our Executive Officers and making recommendations to the Board with respect to it; |
| |
· | reviewing the compensation of our non-employee Directors and making recommendations to the Board with respect to it; and |
| |
· | periodically reviewing and approving any long-term incentive compensation or equity plans, programs or similar arrangements, annual bonuses, and employee pension and welfare benefit plans. |
All decisions at any meeting of the Compensation Committee shall be decided by a majority of votes of the members present and voting and such decision shall at all times exclude the vote, approval or recommendation of any member who has a conflict of interest in the subject matter under consideration.
EXECUTIVE OFFICERS
Our Executive Officers are responsible for our day-to-day management and operations as well as the implementation and execution of our Group's operational policies. The following table sets forth information regarding our Executive Officers (who are not also Directors).
Name | | Age | | Address | | Position within our Group |
William Fung | | 39 | | 23/F Nexxus Building, 41 Connaught Road Central, Hong Kong | | Chief Investment Officer and Head of Asset Management |
Cliff Li | | 33 | | 23/F Nexxus Building, 41 Connaught Road Central, Hong Kong | | Chief Financial Officer and Assistant to the Chief Executive Officer |
Derek Chung | | 38 | | 23/F Nexxus Building, 41 Connaught Road Central, Hong Kong | | Chief Strategy and Business Development Officer and Head of Investment Banking |
Tim Fang | | 37 | | 23/F Nexxus Building, 41 Connaught Road Central, Hong Kong | | Head of Global Markets |
Gabriel Ming Lin Cheung | | 33 | | 23/F Nexxus Building, 41 Connaught Road Central, Hong Kong | | Head of Advisory and Equity Capital Markets |
Experience of our Executive Officers
William Fung
William Fung is our Chief Investment Officer and Head of Asset Management, and has over 15 years of experience in global capital markets including investing, syndicating, and executing capital markets transactions for Asian as well as global issuers. William Fung has served as the managing director of the chief investment office of AMTD Global Markets Limited since March 2016 and has served as the group vice president of our Controlling Shareholder since October 2019. From September 2009 to February 2016, William Fung worked at UBS AG Hong Kong as an executive director. Prior to that, he worked at Nomura International (Hong Kong) Limited from September 2008 to September 2009. From January 2005 to September 2008, William Fung worked at Lehman Brothers Asia Limited. Prior to that, William Fung also practiced professional engineering in the United States for approximately one year.
Currently, William Fung holds directorships in AMTD Global Markets Limited, AMTD Wealth Management Solutions Group Limited and Asia Alternative Asset Partners Limited. William Fung received a Bachelor of Science degree in Industrial Engineering from Purdue University in May 2002 and a Master of Science degree in Financial Engineering from the University of Michigan in December 2004.
Cliff Li
Cliff Li has served as our Chief Financial Officer of our Group and assistant to the chief executive officer of our Controlling Shareholder since December 2019. Cliff Li is specialized in financial reporting and has more than nine years of external auditing experience focusing on financial institutions including investment banks, asset management companies and private equity funds. He joined AMTD in August 2016 and was previously the group financial controller before being promoted to the current management position. Prior to joining AMTD, Cliff Li worked as Audit Manager of Deloitte Touche Tohmatsu.
Currently, Cliff Li holds directorships in AMTD Digital Investments Holdings Limited, AMTD Properties (HK) Limited, Dense Globe Investments Limited, Fine Cosmos Development Limited, DHI Downtown Pte. Ltd. and DHI Holdings (S) Pte. Ltd. He previously held directorships in AMTD Digital Inc., AMTD Digital Financial Holdings Limited, AMTD Digital Media Holdings Limited, and AMTD Digital Connectors Holdings Limited in the past five years. Cliff Li is also a certified public accountant in Australia. He holds a Bachelor of Commerce degree in Accounting and Finance from the University of Melbourne.
Derek Chung
Derek Chung is our Chief Strategy and Business Development Officer and Head of Investment Banking since January 2020. Derek Chung has over 15 years of experience in investment banking, including originating, advising and execution capital markets and M&A transactions for corporate clients across Asia. Prior to joining AMTD, Derek Chung worked for Deutsche Bank between 2016 and 2019, most recently serving as managing director, head of financial institutions group, Asia, where he was responsible for the coverage of traditional financial institution and financial technology corporate finance clients across Asia. Prior to serving at Deutsche Bank, Derek Chung worked at the investment banking division of Goldman Sachs between 2004 and 2016. Derek Chung is a qualified principal for Hong Kong IPO sponsor work.
Currently, Derek Chung also holds directorships in two privately owned companies, Tian Zhi Media Limited and No Jokes Entertainment Limited. He holds a Bachelor of Science degree in Electrical and Computer Engineering and a Master of Engineering degree in Financial Engineering, both from Cornell University.
Tim Fang
Tim Fang is our Head of Global Markets, and has over 13 years of experience in global capital markets including originating, structuring, and executing capital markets transactions for financial institutions, corporates and sovereigns or quasi-sovereign clients across Asia-Pacific and Australia. Tim Fang has served as the managing director and the co-head of debt capital markets of our AMTD Global Markets Limited since March 2018. From February 2010 to March 2018, he was an executive director and the head of financial institutions debt capital markets Asia at UBS AG Hong Kong. Prior to that, Tim Fang was an associate director of debt capital markets at UBS AG Australia from February 2007 to February 2010.
Currently, Tim Fang also holds directorship in AMTD Global Markets Limited. Tim Fang received a Bachelor degree of Engineering (Honors) and a Bachelor degree of Commerce from the University of Melbourne in March 2007.
Gabriel Ming Lin Cheung
Gabriel Ming Lin Cheung is our Head of Advisory and Equity Capital Markets, and has more than nine years of experience in investment banking and equity capital markets. Since January 2017, Gabriel Cheung has been serving as the head of advisory and equity capital markets of AMTD Global Markets Limited, where he served as vice president from December 2015 to December 2016. From September 2014 to December 2015, Gabriel Cheung was an associate at Deutsche Bank AG Hong Kong branch. Prior to that, he worked at UBS AG Hong Kong branch with the latest position as associate director from July 2010 to September 2014. Gabriel Cheung received a Master degree in Engineering, Economics, and Management from University of Oxford in July 2010.
Past and present principal directorships of our Executive Officers
The past and present principal directorships held by our Executive Officers in the last five years preceding the date of this Introductory Document are set out in "Appendix F – List of Past and Present Principal Directorships".
ARRANGEMENT OR UNDERSTANDING
None of our Directors or Executive Officers has any arrangement or understanding with any of our substantial shareholders, customers or suppliers or other person pursuant to which such Director or Executive Officer was appointed as a Director or as an Executive Officer.
FAMILY RELATIONSHIP
One of the substantial shareholders (as defined in the SFA) of our Company, Danny Choi, is the father of Calvin Choi, our Chairman of the Board and Chief Executive Officer.
Save as disclosed above, none of our Directors or Executive Officers have any family relationships with one another or our substantial shareholders (as defined in the SFA).
REMUNERATION
The aggregate remuneration (including salary, bonus, Directors' fees, allowances and benefits-in-kind) paid to the Board in FY2018 and FY2019 and the estimated remuneration (excluding bonus and benefits-in-kind) to be paid in FY2020 are HK$3,701,556, HK$7,263,159, and HK$8,820,000, respectively.
The aggregate remuneration (including salary, bonus, allowances and benefits-in-kind) paid to the Executive Officers in FY2018, FY2019 and the estimated aggregate remuneration (excluding bonus and benefits-in-kind) to be paid to the Executive Officers in FY2020 are HK$15,833,342, HK$36,113,047, and HK$38,000,000.
Our Group did not employ any person who is an immediate family member of our Directors or Chief Executive Officer for each of FY2017, FY2018 and 9M2019.
RELATED PARTY TRANSACTIONS
For purposes of this section, the following definitions will apply:
"Related Party" means:
| (a) | a person or a close member of that person's family and that person; |
| (i) | has control or joint control over us; |
| | |
| (ii) | has significant influence over us; or |
| | |
| (iii) | is a member of our key management personnel or of our parent; or |
| (b) | the party is an entity where any of the following conditions applies: |
| (i) | we and the entity are members of a same group; |
| | |
| (ii) | one entity is an associate or joint venture of the other entity (or of a parent, subsidiary, or fellow subsidiary of the other entity); |
| | |
| (iii) | we and the entity are joint ventures of the same third-party; |
| | |
| (iv) | one entity is a joint venture of a third entity and the other entity is an associate of the third entity; |
| | |
| (v) | the entity is a post-employment benefit plan for the benefit of either our employees or employees of an entity related to us, and the sponsoring employers of the post-employment benefit plan; |
| | |
| (vi) | the entity is controlled or jointly controlled by a person identified in (i); |
| | |
| (vii) | a person identified in (i)(a) has significant influence over the entity or is a member of the key management personnel of the entity (or of a parent of the entity); and |
| | |
| (viii) | the entity, or any member of a group of which it is a part, provides key management personnel services to us or to our parent. |
The SEC reporting requirements and the Corporate Governance Rules of the NYSE as stipulated in item 7.B of Form 20-F for related party transactions and conflict of interests require the disclosure of any transactions(1) or loans(2) for the preceding three (3) financial years up to the date of the document, between the company and (a) enterprises that directly or indirectly through one or more intermediaries, control or are controlled by, or are under common control with, the company; (b) associates; (c) individuals owning, directly or indirectly, an interest in the voting power of the company that gives them significant influence over the company, and close members of any such individual's family; (d) key management personnel, that is, those persons having authority and responsibility for planning, directing and controlling the activities of the company, including directors and senior management of companies and close members of such individuals' families; and (e) enterprises in which a substantial interest in the voting power is owned, directly or indirectly, by any person described in (c) or (d) or over which such a person is able to exercise significant influence.
This includes enterprises owned by directors or major shareholders of the company and enterprises that have a member of key management in common with the company. Close members of an individual's family are those that may be expected to influence, or be influenced by, that person in their dealings with the company. An associate is an unconsolidated enterprise in which the company has a significant influence, or which has significant influence over the company. Significant influence over an enterprise is the power to participate in the financial and operating policy decisions of the enterprise but is less than control over those policies. Shareholders beneficially owning a 10% interest in the voting power of the company are presumed to have a significant influence on the company.
1. The nature and extent of any transactions or presently proposed transactions which are material to the company or the related party, or any transactions that are unusual in their nature or conditions, involving goods, services, or tangible or intangible assets, to which the company or any of its parent or subsidiaries was a party.
2. The amount of outstanding loans (including guarantees of any kind) made by the company, its parent or any of its subsidiaries to or for the benefit of any of the persons listed above. The disclosure should include the largest amount outstanding during the period covered, the amount outstanding as at the latest practicable date, the nature of the loan and the transaction in which it was incurred, and the interest rate on the loan. In addition, if the company, its parent or any of its subsidiaries is a foreign bank (as defined in 17 CFR 240.13k-1, meaning an institution that engages directly in the business of banking and is regulated as a bank in its home jurisdiction that is other than the United States) that has made a loan to which Instruction 2 of this Item does not apply, identify the director, senior management member, or other related party required to be described by this Item who received the loan, and describe the nature of the loan recipient's relationship to the foreign bank.
Further, all related party transactions between the controlling shareholder and the company must be approved by the audit committee of the company. After obtaining approval from the audit committee, the board will discuss such matters. In any board meeting, each director, including the members of the audit committee have to declare their interest in the matter to be discussed (if any). If a director voted in his capacity as a member of the board, he shall refrain from voting at the board of the controlling shareholder, and vice versa.
In general, transactions between our Group and any of our interested persons would constitute related party transactions.
Save as disclosed in these sections, there are no material transactions undertaken by us with our related parties and their respective associates for the financial years ended 31 December 2017, 2018, the nine months ended 30 September 2019 and for the period from 1 October 2019 until the Latest Practicable Date ("Relevant Period"). For further information on our continuing listing obligations in relation to Chapter 9 of the Listing Manual, please see the section entitled "Our Listing on the SGX-ST – Conditions of our Listing on the SGX-ST".
Private Placements
See the section entitled "Description of Share Capital—History of Securities Issuances".
Employment Agreements and Indemnification Agreements
See the section entitled "Management—Service Agreements".
Agreements with Our Controlling Shareholder
We entered into agreements with our Controlling Shareholder with respect to our ongoing relationship in June 2019. See the section entitled "Share Capital and Shareholders — Our Relationship with AMTD Group Company Limited".
Transactions with Our Controlling Shareholder
For the years ended 31 December 2017 and 2018 and the nine months ended 30 September 2019, our Controlling Shareholder recharged staff costs, premises costs, office utilities and office renovation, and certain other operating expenses to us. For the years ended 31 December 2017 and 2018 and the nine months ended 30 September 2019, the total amount of our recharge from our Controlling Shareholder for the aforementioned costs and expenses was HK$108.7 million, HK$20.5 million, and HK$33.9 million, respectively. Our Controlling Shareholder ceased recharging the aforementioned costs and expenses since 30 June 2019 and charged an annual administrative fee instead. For the nine months ended 30 September 2019, the total amount of administrative fee charged by our Controlling Shareholder was HK$6.0 million.
We provided our Controlling Shareholder with underwriting services in its bond offerings in 2017 and 2019. For the years ended 31 December 2017 and 2018 and the nine months ended 30 September 2019, the amount of underwriting fees and commissions that we charged our Controlling Shareholder was HK$31.2 million, nil, and HK$26.4 million, respectively.
In September 2017, we entered into a stock borrowing and lending agreement with a shareholder of our Controlling Shareholder, pursuant to which we lent listed equity shares in Bank of Qingdao to the shareholder of our Controlling Shareholder. As at 31 December 2017 and 2018 and 30 September 2019, the value of the listed equity shares were HK$2.2 billion, HK$1.5 billion and HK$1.4 billion, respectively. The unrealized gain on the stock loan was HK$539.7 million and HK$98.4 million for the years ended 31 December 2017 and 2018, respectively. And the unrealized loss for nine months ended 30 September 2019 was HK$159.0 million. The stock loan is repayable on demand and interest free. The shareholder of our Controlling Shareholder pledged the listed equity share to a third-party as collateral as at 31 December 2017 and 2018 and 30 September 2019.
Based on our management's assessment, no allowance for potential credit losses from the above transactions was provided for the years ended 31 December 2017 and 2018 and nine months ended 30 September 2019.
Other Transactions with Related Parties
We provided subsidiaries of our controlling beneficial owner with underwriting services in its bond offerings in 2018. For the years ended 31 December 2017 and 2018 and the nine months ended 30 September 2019, the amount of financial advisory fees that we charged these subsidiaries of our controlling beneficial owner was nil, HK$71.0 million, and HK$15.7 million, respectively. Before our restructuring and listing on the NYSE, treasury functions were established at under our Controlling Shareholder only and inter-company fund transfers were carried out among the entities within our Controlling Shareholder's group of companies and the entities which are now part of our Group. The treasury function manages available funds at our Controlling Shareholder level only and allocates the funds to various entities within Controlling Shareholder's group of companies for their operations. On 5 August 2019, we entered into an inter-company financing agreement which allows us to charge interest at a rate of 2% per annum on the outstanding balances due from our Controlling Shareholder. Under such agreement, we are entitled to request for repayment on demand to fulfil our ongoing operating capital requirements. As at 30 September 2019, the amount of outstanding balance due from our Controlling Shareholder was HK$2.0 billion. Interest income of HK$5.9 million was accrued for the nine months ended 30 September 2019.
In December 2018, we acquired certain securities held by a subsidiary of our Controlling Shareholder for HK$72.1 million. These securities were fully disposed during the nine months ended 30 September 2019, resulting in a gain of HK$8.2 million.
We had a custody arrangement with a subsidiary of our Controlling Shareholder to procure a margin loan to acquire, and hold on its behalf, certain equity securities invested by this subsidiary of our Controlling Shareholder, and we used these equity securities as collateral to secure the margin loan. The subsidiary of our Controlling Shareholder is the beneficial owner of these equity securities and recorded these equity securities as its financial assets on its consolidated statements of financial position as at 31 December 2017. As at 31 December 2017, our total margin loan payable was HK$351.6 million, which was partially secured by these equity securities with a fair value of HK$489.6 million. The subsidiary of our Controlling Shareholder bears all costs and expenses in connection with custody, acquisition, and disposal of the equity securities. For the years ended 31 December 2017 and 2018, we recorded other income from this subsidiary of our Controlling Shareholder of HK$15.3 million and HK$3.7 million, respectively, representing the reimbursement of interest expenses of the related margin loan. The margin loan was fully repaid in May 2018.
SHARECAPITAL AND SHAREHOLDERS
OUR SHARE CAPITAL
As at the date of incorporation, the issued and paid up capital of our Company was US$1 comprising one ordinary share. As at the date of this Introductory Document, we have two classes of shares in the capital of our Company. As at the date of this Introductory Document, the issued and paid up capital of our Company was $24,561 comprising 23,873,655 ADSs, 46,758,851 Class A Shares and 198,852,628 Class B ordinary shares. Our authorised share capital is US$1,000,000 divided into (i) 8,000,000,000 Class A Shares of a par value of US$0.0001 each, and (ii) 2,000,000,000 Class B ordinary shares of a par value of US$0.0001 each. All of our shares are issued as fully paid. As at the date of this Introductory Document, there are 198,852,628 Class B ordinary shares and 46,758,851 Class A Shares issued and outstanding.
Our Company's Class A Shares have been approved for listing on 31 July 2019. Out of the 46,758,851 Class A Shares issued and outstanding, 23,873,655 Class A Shares underlying the ADSs are registered with the SEC. The remaining 22,885,196 Class A Shares are held by shareholders in their own names within the register of members maintained by the Cayman Share Registrar with such Class A Shares not being represented by ADS which are listed and traded on the NYSE.
The rights and privileges of our shares are stated in our Memorandum and Articles of Association. There are no founder, management or deferred shares reserved for issue for any purpose.
There are no restrictions on the free transferability of Class A Shares except where required by law and Articles of Association of our Company or the Listing Manual.
To the best of the knowledge of our Directors, no person has been, or is entitled to be, given an option to subscribe for or purchase any securities of our Company or our subsidiaries.
SUBSTANTIAL SHAREHOLDING REPORTING OBLIGATIONS – SINGAPORE
We are not a "corporation" as defined in Section 130 of the SFA. Accordingly, our Company and AMTD CDP Depositors will not be subject to the provisions of Division 1 of Part VII of the SFA regulating substantial shareholding reporting obligations.
PRINCIPAL SHAREHOLDING REPORTING OBLIGATIONS – UNITED STATES
The principal shareholders of our Company are required to file beneficial ownership report on Schedule 13D or Schedule 13G with the SEC. Our Company is required to disclose principal shareholding information in our annual report on Form 20-F to be filed annually with the SEC.
Current Shareholders
The table below sets out the names of each substantial shareholder of our Company, which means a shareholder who is known by us to beneficially own 5.0% or more of our total issued shares (including Class A Shares and class B Shares) and each of our Directors who has an interest in the shares (including Class A Shares and Class B Shares), and the number and percentage of shares in which each of them has an interest (whether direct or deemed).
All ADSs owned and to be acquired by our substantial shareholders and Directors carry the same voting rights as the ADSs. As at the date of this Introductory Document, our issued and paid-up ordinary share capital was US$24,561. The calculations in the table below are based on (i) 245,611,479 ordinary shares outstanding, consisting of 198,852,628 outstanding Class B ordinary shares and 46,758,851 outstanding Class A Shares.
Beneficial ownership is determined in accordance with the rules and regulations of the SEC. In computing the number of shares beneficially owned by a person and the percentage ownership of that person, we have included shares that the person has the right to acquire within 60 days, including through the exercise of any option, warrant, or other right or the conversion of any other security. These shares, however, are not included in the computation of the percentage ownership of any other person.
The shareholdings of our Directors and substantial shareholders are set out in the table below:
| | Ordinary Shares Owned as at the Latest Practicable Date | |
Name | | No. of Class A Shares | | | No. of Class B Shares | | | % of Beneficial Ownership(5) | | | %of Aggregate Voting Power(6) | |
Directors and Chief Executive Officer | | | | | | | | | | | | |
Calvin Choi(1) | | | — | | | | 67,682,577 | | | | 27.6 | % | | | 33.6 | % |
Marcellus Wong(2) | | | — | | | | 1,651,122 | | | | 0.7 | % | | | 0.8 | % |
Raymond Yung(3) | | | — | | | | 1,651,122 | | | | 0.7 | % | | | 0.8 | % |
Andrew Chiu | | | 4,526,627 | | | | — | | | | 1.8 | % | | | 0.1 | % |
Yu Gao | | | — | | | | — | | | | — | | | | — | |
Feridun Hamdullahpur | | | — | | | | — | | | | — | | | | — | |
| | | | | | | | | | | | | | | | |
Executive Officers | | | | | | | | | | | | | | | | |
William Fung | | | — | | | | — | | | | — | | | | — | |
Cliff Li | | | — | | | | — | | | | — | | | | — | |
Derek Chung | | | — | | | | — | | | | — | | | | — | |
Tim Fang | | | — | | | | — | | | | — | | | | — | |
Gabriel Ming Lin Cheung. | | | — | | | | — | | | | — | | | | — | |
| | | | | | | | | | | | | | | | |
Controlling Shareholder | | | | | | | | | | | | | | | | |
AMTD Group (4) | | | — | | | | 194,326,001 | | | | 79.1 | % | | | 96.6 | % |
| | | | | | | | | | | | | | | | |
Other Shareholders: | | | 42,232,224 | | | | — | | | | 14.9 | % | | | 1.1 | % |
Notes:
| (1) | Calvin Choi indirectly holds 32.5% of issued and outstanding share capital of AMTD Group, our Controlling Shareholder, through Infinity Power, a British Virgin Islands company wholly owned by Calvin Choi. The registered address of Infinity Power is Vistra Corporate Services Center, Wickhams Cay II, Road Town, Tortola, VG1110, British Virgin Islands. AMTD Group and Infinity Power own 79.1% and 1.8% of our Company's issued and outstanding ordinary shares respectively. Calvin Choi may be deemed to beneficially own the corresponding proportion of our issued and outstanding shares held by our Controlling Shareholder and all of our issued and outstanding shares held by Infinity Power, or 67,682,577 Class B ordinary shares. |
| |
| (2) | Marcellus Wong holds 1.5% of issued and outstanding share capital of L.R. Capital Group, a Cayman Islands company and an indirect controlling beneficial owner of AMTD Group, our Controlling Shareholder. He may be deemed to beneficially own the corresponding proportion of our issued and outstanding shares held by our Controlling Shareholder. |
| |
| (3) | Raymond Yung holds 1.5% of issued and outstanding share capital of L.R. Capital Group, a Cayman Islands company and an indirect controlling beneficial owner of AMTD Group, our Controlling Shareholder. He may be deemed to beneficially own the corresponding proportion of our issued and outstanding shares held by our Controlling Shareholder. |
| |
| (4) | AMTD Group is a British Virgin Islands company, with its registered address at the offices of Vistra (BVI) Limited, Vistra Corporate Services Centre, Wickhams Cay II, Road Town, Tortola, VG1110, British Virgin Islands. The shareholders of AMTD Group include L.R. Capital Financial Holdings Limited, a Cayman Islands company, and Infinity Power, a British Virgin Islands company wholly owned by Calvin Choi, which own 61.6% and 32.5% of the total outstanding shares of AMTD Group, respectively. L.R. Capital Financial Holdings Limited is ultimately controlled by L.R. Capital Group, a Cayman Islands company. The board of directors of L.R. Capital Group consists of one member, namely Lin Cong. |
| |
| (5) | For each person and group included in this column, percentage ownership is calculated by dividing the number of shares beneficially owned by such person or group by the sum of the total number of shares outstanding. The total number of ordinary shares outstanding as at the date of this Introductory Document is 245,611,479. |
| |
| (6) | For each person and group included in this column, percentage of voting power is calculated by dividing the voting power beneficially owned by such person or group by the voting power of all of our Class A and Class B ordinary shares as a single class. Each holder of Class B ordinary shares is entitled to 20 votes per share, subject to certain conditions, and each holder of our Class A ordinary shares is entitled to one (1) vote per share on all matters submitted to them for a vote. Our Class A ordinary shares and Class B ordinary shares vote together as a single class on all matters submitted to a vote of our shareholders, except as may otherwise be required by law. Our Class B ordinary shares are convertible at any time by the holder thereof into Class A ordinary shares on a one-for-one basis. |
As at the date of this Introductory Document, none of our outstanding ordinary shares were held by record holders in the United States.
Significant Changes in Percentage of Ownership
Save as discussed in "Description of Share Capital—History of Securities Issuances", there were no significant changes in the percentage ownership of our Company held by our Directors, Chief Executive Officer and substantial shareholder since the date of incorporation and up to the Latest Practicable Date.
Moratorium
In December 2019, we have issued 7,307,692 Class A Shares and 4,526,627 Class B ordinary shares, in the form of private placement. In accordance to the share purchase agreements entered into by the private placement investors with our Company, the shares acquired by the private placement investors are subject to a lock-up period of 180 days from the date of our Company's announcement on 23 December 2019 made in respect of the private placement.
Change in Control of our Company
Save as disclosed in this section, to the best of our knowledge, our Company is not indirectly or directly owned or controlled, whether severally or jointly, by any government or other natural or legal person.
We are not currently aware of any arrangements, the operation of which may at a subsequent date result in a change of control of our Company.
Our Relationship with AMTD Group Company Limited
As at the date of this Introductory Document, our Company is 79.1%-owned by AMTD Group Company Limited ("AMTD Group"). Historically, AMTD Group has provided us with business premises, financial, accounting, administrative, legal, and human resources services, as well as the services of a number of its executive officers and other employees, the costs of which were allocated to us based on actual usage or proportion of revenues and infrastructure usage attributable to our business, among other things. We have begun to invest in our own financial, accounting, and legal functions separate from those of AMTD Group, and we will further establish other support systems of our own or contract with third parties to provide them to us after we become a stand-alone public company. We entered into agreements with AMTD Group with respect to our ongoing relationship in June 2019. These agreements include a master transaction agreement, a transitional services agreement, and a non-competition agreement. The following are summaries of these agreements.
Master Transaction Agreement
Pursuant to the master transaction agreement, we are responsible for all financial liabilities associated with the current and historical investment banking, asset management, and strategic investment businesses and operations that have been conducted by or transferred to us, and AMTD Group is responsible for financial liabilities associated with all of AMTD Group's other current and historical businesses and operations, in each case regardless of the time those liabilities arise. The master transaction agreement also contains indemnification provisions under which we and AMTD Group agree to indemnify each other with respect to breaches of the master transaction agreement or any related inter-company agreement, including the transitional services agreement and the non-competition agreement. Under the master transaction agreement, we also agree to indemnify AMTD Group, our Controlling Shareholder with respect to lawsuits and other matters relating to our investment banking and asset management businesses, including operations of those businesses when we were a private company and a subsidiary of our Controlling Shareholder. There are no exceptions for such indemnities and such indemnifications relate to transactions that had taken place prior to, on and following, our restructuring and listing on the NYSE. These indemnification arrangements could result in our having interests that are adverse to those of our Controlling Shareholder, for example, with respect to settlement arrangements in litigation. In addition, under these arrangements, we agreed to reimburse our Controlling Shareholder for liabilities incurred (including legal defense costs) in connection with any third-party claim if it is ultimately determined that we are obligated to indemnify our Controlling Shareholder with respect to such third-party claim. There is no limit on such amount of indemnity under the master transaction agreement.
In addition, we agree to indemnify AMTD Group, its subsidiaries and each of their directors, officers and employees against liabilities arising from misstatements or omissions in the NYSE Prospectus or the registration statement of which it forms a part, except for misstatements or omissions relating to information that AMTD Group or any of its subsidiaries provided to us specifically for inclusion in the NYSE Prospectus or the registration statement of which it forms a part. AMTD Group will indemnify us including each of our subsidiaries, Directors, officers and employees against liabilities arising from misstatements or omissions with respect to information that AMTD Group or any of its subsidiaries provided to us specifically for inclusion in the NYSE Prospectus, the registration statement of which the NYSE Prospectus forms a part of, or our annual reports or other SEC filings following the completion of our offering on the NYSE in 2019.
The master transaction agreement also contains a general release, under which the parties will release each other, including each party's subsidiaries, directors, officers and employees from any liabilities arising from events occurring on or before the initial filing date of the registration statement of which the NYSE Prospectus forms a part, including in connection with the activities to implement this offering. The general release does not apply to liabilities allocated between the parties under the master transaction agreement, the transitional services agreement, and the non-competition agreement.
The master transaction agreement sets forth the investment opportunity referral procedures, pursuant to which AMTD Group agrees to first present investment opportunities to us for consideration within a specified period and to refrain from pursuing these investment opportunities. AMTD Group agrees to pursue these investment opportunities for itself only after we forego pursuing these investment opportunities or upon expiration of the specified period should we fail to respond, with the exception of subsequent investments by AMTD Group in its existing investee companies. When determining whether or not to pursue an investment opportunity, members of our investment committee that have overlapping duties as directors or officers in AMTD Group will abstain from participating in the investment decision-making and approval process. Accordingly, through the master transaction agreement, we will be given the aforementioned investment opportunity referral procedures, which we believe mitigates potential conflicts of interest between us and the AMTD Group.
Furthermore, under the master transaction agreement, we agree to use our reasonable best efforts to select the same independent registered public accounting firm, or auditor, used by AMTD Group and provide to AMTD Group as much prior notice as reasonably practical of any change in our auditor until the first fiscal year end occurring after AMTD Group no longer owns in aggregate at least 20% of the voting power of our then outstanding shares.
Pursuant to the master transaction agreement, we are licensed by AMTD Group to use certain of its intellectual properties for free.
The master transaction agreement will automatically terminate on the date that is two years after the first date upon which AMTD Group ceases to own in aggregate at least 20% of the voting power of our then outstanding shares. This agreement can be terminated earlier or extended by mutual written consent of the parties. The termination of this agreement will not affect the validity and effectiveness of the transitional services agreement and the non-competition agreement.
Transitional Services Agreement
Under the transitional services agreement, AMTD Group agrees that, during the service period, as described below, AMTD Group will provide us with various corporate support services, including but not limited to:
| · | administrative support; |
| | |
| · | marketing and branding support; |
| | |
| · | technology support; and |
| | |
| · | provision of office space and facilities. |
AMTD Group may also provide us with additional services that we and AMTD Group may identify from time to time in the future.
The price to be paid for the services provided under the transitional service agreement is determined according to the terms of the agreement. Under the agreement, the price of administrative support services is charged at a fixed rate as stipulated in the agreement. The prices for marketing and branding support services, technology support services and the provisions of office space and facilities are determined based on the actual amount of services provided, and office space and facilities used. All such prices are charged and payable on an annual basis. The transitional service agreement provides that the performance of a service according to the agreement will not subject the provider of such service to any liability whatsoever except as directly caused by the gross negligence or willful misconduct of the service provider. Liability for gross negligence or willful misconduct is limited to the lower of the price paid for the particular service or the cost of the service's recipient performing the service itself or hiring a third-party to perform the service. Under the transitional services agreement, the service provider of each service is indemnified by the recipient against all third-party claims relating to provision of services or the recipient's material breach of a third-party agreement, except where the claim is directly caused by the service provider's gross negligence or willful misconduct.
The service period under the transitional services agreement commences on the date the registration statement, of which the NYSE Prospectus forms a part of, is filed publicly with the SEC and will end on the earlier of (i) the date we or AMTD Group terminates the agreement, or (ii) the date that is 18 months after the first public filing date. We may terminate the transitional services agreement with respect to either all or part of the services by giving 30-day prior written notice to AMTD Group and paying a termination fee equal to the direct costs incurred by AMTD Group in connection with its provision of services at the time of the early termination. AMTD Group may terminate this agreement with respect to either all or part of the services by giving us a 30-day prior written notice if AMTD Group ceases to own in aggregate at least 20% of the voting power of our then outstanding securities or ceases to be the largest beneficial owner of our then outstanding voting securities, without considering holdings of institutional investors that have acquired our securities in the ordinary course of their business and not with the purpose or the effect of changing or influencing control of our Company. We believe that the transitional services agreement clearly sets out the agreed scope of terms and conditions of the corporate services to be provided.
Non-competition Agreement
Our non-competition agreement with AMTD Group provides for a non-competition period beginning upon the completion of our offering on the NYSE in 2019 and ending on the later of (i) two years after the first date when AMTD Group ceases to own in aggregate at least 20% of the voting power of our then outstanding shares and (ii) the fifth anniversary of the completion of our offering on the NYSE in 2019. This agreement can be terminated earlier by mutual written consent of the parties.
AMTD Group has agreed not to compete with us during the non-competition period in our investment banking and asset management businesses that are both primarily targeting institutional and corporate clients, except for owning non-controlling equity interest (i.e. an equity interest below 50%) in any company competing with us. We have agreed not to compete with AMTD Group during the non-competition period in the businesses currently conducted by AMTD Group, except (i) for continuing to provide investment banking and asset management products and services to our existing individual clients, and (ii) for owning non-controlling equity interest in any company competing with AMTD Group.
The non-competition agreement also provides for a mutual non-solicitation obligation that neither AMTD Group nor we may, during the non-competition period, hire, or solicit for hire, any active employees of, or individuals providing consulting services to the other party, or any former employees of, or individuals providing consulting services to the other party within six months of the termination of their employment or consulting services, without the other party's consent, except for solicitation activities through generalized non-targeted advertisement not directed to such employees or individuals that do not result in a hiring within the non-competition period. We believe that the non-competition agreement mitigates any potential conflicts of interest that may arise should the AMTD Group invests in or engages in businesses that may be in competition with our business.
APPENDIX E
INDEPENDENT AUDITOR'S REPORT TO THE AUDITED CONSOLIDATED FINANCIAL
STATEMENTS FOR THE YEARS ENDED 31 DECEMBER 2017 AND 2018 AND FOR THE
NINE MONTHS ENDED 30 SEPTEMBER 2019, AND THE UNAUDITED INTERIM
CONDENSED CONSOLIDATED FINANCIAL STATEMENTS FOR THE NINE MONTHS
ENDED 30 SEPTEMBER 2018
AMTD INTERNATIONAL INC.
INDEX TO CONSOLIDATED FINANCIAL STATEMENTS
Independent auditor's report
To the members of AMTD International Inc.
Opinion
We have audited the consolidated financial statements of AMTD International Inc. (the "Company") and its subsidiaries (collectively the "Group"), which comprise the consolidated statements of financial position as at 31 December 2017 and 2018 and 30 September 2019, and the consolidated statements of profit or loss and other comprehensive income, consolidated statements of changes in equity and consolidated statements of cash flows for each of the financial years ended 31 December 2017 and 2018 and for the nine months ended 30 September 2019, and notes to the consolidated financial statements, including a summary of significant accounting policies, as set out on pages 3 to 74.
In our opinion, the accompanying consolidated financial statements of the Group are properly drawn up in accordance with International Financial Reporting Standards ("IFRSs") issued by the International Accounting Standards Board so as to give a true and fair view of the consolidated financial position of the Group as at 31 December 2017 and 2018 and 30 September 2019, and of its consolidated financial performance, consolidated changes in equity and consolidated cash flows of the Group for each of the financial years ended 31 December 2017 and 2018 and for the nine months ended 30 September 2019.
Basis for Opinion
We conducted our audit in accordance with International Standards on Auditing ("ISAs") issued by the International Auditing and Assurance Standards Board. Our responsibilities under those standards are further described in the Auditor’s Responsibilities for the Audit of the Consolidated Financial Statements section of our report. We are independent of the Group in accordance with International Code of Ethics for Professional Accountants (including International Independence Standards), and we have fulfilled our other ethical responsibilities in accordance with the International Code of Ethics for Professional Accountants (including International Independence Standards). We believe that the audit evidence we have obtained is sufficient and appropriate to provide a basis for our opinion.
Responsibilities of Management and Directors for the Consolidated Financial Statements
Management is responsible for the preparation of consolidated financial statements that give a true and fair view in accordance with IFRSs, and for devising and maintaining a system of internal accounting controls sufficient to provide a reasonable assurance that assets are safeguarded against loss from unauthorised use or disposition; and transactions are properly authorised and that they are recorded as necessary to permit the preparation of true and fair financial statements and to maintain accountability of assets.
In preparing the consolidated financial statements, management is responsible for assessing the Group's ability to continue as a going concern, disclosing, as applicable, matters related to going concern and using the going concern basis of accounting unless management either intends to liquidate the Group or to cease operations, or has no realistic alternative but to do so.
The directors' responsibilities include overseeing the Group's financial reporting process.
Auditor's Responsibilities for the Audit of the Consolidated Financial Statements
Our objectives are to obtain reasonable assurance about whether the consolidated financial statements as a whole are free from material misstatement, whether due to fraud or error, and to issue an auditor's report that includes our opinion. Reasonable assurance is a high level of assurance, but is not a guarantee that an audit conducted in accordance with ISAs will always detect a material misstatement when it exists. Misstatements can arise from fraud or error and
are considered material if, individually or in the aggregate, they could reasonably be expected to influence the economic decisions of users taken on the basis of these consolidated financial statements.
Independent auditor's report (continued)
To the members of AMTD International Inc.
Auditor’s Responsibilities for the Audit of the Consolidated Financial Statements (continued)
As part of an audit in accordance with ISAs, we exercise professional judgement and maintain professional scepticism throughout the audit. We also:
· | Identify and assess the risks of material misstatement of the consolidated financial statements, whether due to fraud or error, design and perform audit procedures responsive to those risks, and obtain audit evidence that is sufficient and appropriate to provide a basis for our opinion. The risk of not detecting a material misstatement resulting from fraud is higher than for one resulting from error, as fraud may involve collusion, forgery, intentional omissions, misrepresentations, or the override of internal control. |
| |
· | Obtain an understanding of internal control relevant to the audit in order to design audit procedures that are appropriate in the circumstances, but not for the purpose of expressing an opinion on the effectiveness of the Group's internal control. |
| |
· | Evaluate the appropriateness of accounting policies used and the reasonableness of accounting estimates and related disclosures made by management. |
| |
· | Conclude on the appropriateness of management's use of the going concern basis of accounting and, based on the audit evidence obtained, whether a material uncertainty exists related to events or conditions that may cast significant doubt on the Group's ability to continue as a going concern. If we conclude that a material uncertainty exists, we are required to draw attention in our auditor's report to the related disclosures in the consolidated financial statements or, if such disclosures are inadequate, to modify our opinion. Our conclusions are based on the audit evidence obtained up to the date of our auditor's report. However, future events or conditions may cause the Group to cease to continue as a going concern. |
| |
· | Evaluate the overall presentation, structure and content of the consolidated financial statements, including the disclosures, and whether the consolidated financial statements represent the underlying transactions and events in a manner that achieves fair presentation. |
| |
· | Obtain sufficient appropriate audit evidence regarding the financial information of the entities or business activities within the Group to express an opinion on the consolidated financial statements. We are responsible for the direction, supervision and performance of the group audit. We remain solely responsible for our audit opinion. |
We communicate with those charged with governance regarding, among other matters, the planned scope and timing of the audit and significant audit findings, including any significant deficiencies in internal control that we identify during our audit.
Restriction on Distribution and Use
This report is made solely to you as a body and for the inclusion in the introductory document to be issued in connection with the secondary listing of the Class A ordinary shares of the Company on the Main Board of the Singapore Exchange Securities Trading Limited by way of introduction.
/s/ Ernst & Young
Independent Auditors
Hong Kong
31 March 2020
AMTD INTERNATIONAL INC.
CONSOLIDATED STATEMENTS OF PROFIT OR LOSS AND
OTHER COMPREHENSIVE INCOME
FOR THE YEARS ENDED 31 DECEMBER 2017 AND 2018
AND FOR THE NINE MONTHS ENDED 30 SEPTEMBER 2018 AND 2019
| | | | | Year ended 31 December | | | Nine months ended 30 September | |
| | Notes | | | 2017 | | | 2018 | | | 2018 | | | 2019 | |
| | | | | HK$ | | | HK$ | | | HK$ | | | HK$ | |
| | | | | | | | | | | (Unaudited) | | | | |
REVENUE | | | | | | | | | | | | | | | |
Fee and commission income | | | | | | 278,976,203 | | | | 367,538,115 | | | | 246,622,869 | | | | 422,052,516 | |
Dividend and gain related to disposed investment | | | | | | 69,508,298 | | | | 99,227,724 | | | | 99,227,724 | | | | 100,551,728 | |
| | | | | | 348,484,501 | | | | 466,765,839 | | | | 345,850,593 | | | | 522,604,244 | |
| | | | | | | | | | | | | | | | | | | |
Net fair value change on financial assets at fair value through profit or loss and stock loan | | | | | | 684,679,252 | | | | 256,460,295 | | | | (488,890,720 | ) | | | (288,214,130 | ) |
Net fair value change on derivative financial instrument | | 14 | | | | — | | | | — | | | | — | | | | 807,618,000 | |
| | 5 | | | | 1,033,163,753 | | | | 723,226,134 | | | | (143,040,127 | ) | | | 1,042,008,114 | |
| | | | | | | | | | | | | | | | | | | |
Other income | | 5 | | | | 17,914,166 | | | | 15,392,775 | | | | 15,387,129 | | | | 7,466,148 | |
Operating expenses, net | | 6 | | | | (111,563,188 | ) | | | (52,582,107 | ) | | | (47,045,850 | ) | | | (74,136,643 | ) |
Staff costs | | 7 | | | | (102,204,502 | ) | | | (68,024,513 | ) | | | (60,973,034 | ) | | | (78,102,347 | ) |
Finance costs | | 8 | | | | (28,724,758 | ) | | | (9,047,063 | ) | | | (6,546,500 | ) | | | (16,162,042 | ) |
PROFIT/(LOSS) BEFORE TAX | | | | | | 808,585,471 | | | | 608,965,226 | | | | (242,218,382 | ) | | | 881,073,230 | |
Income tax (expense)/credit | | 9 | | | | (135,213,625 | ) | | | (83,839,597 | ) | | | 51,594,722 | | | | (139,730,587 | ) |
| | | | | | | | | | | | | | | | | | | |
PROFIT/(LOSS) FOR THE YEAR AND FOR THE PERIOD AND TOTAL COMPREHENSIVE INCOME FOR THE YEAR AND FOR THE PERIOD | | | | | | 673,371,846 | | | | 525,125,629 | | | | (190,623,660 | ) | | | 741,342,643 | |
| | | | | | | | | | | | | | | | | | | |
Attributable to: | | | | | | | | | | | | | | | | | | | |
Owners of the parent | | | | | | 568,266,428 | | | | 468,061,079 | | | | (116,643,176 | ) | | | 848,711,074 | |
Non-controlling interests | | | | | | 105,105,418 | | | | 57,064,550 | | | | (73,980,484 | ) | | | (107,368,431 | ) |
| | | | | | 673,371,846 | | | | 525,125,629 | | | | (190,623,660 | ) | | | 741,342,643 | |
| | | | | | | | | | | | | | | | | | | |
EARNINGS/(LOSS) PER SHARE ATTRIBUTABLE TO ORDINARY EQUITY HOLDERS OF THE PARENT | | | | | | | | | | | | | | | | | | | |
Class A ordinary shares: | | | | | | | | | | | | | | | | | | | |
Basic, profit/(loss) for the year and for the period attributable to ordinary equity holders of the parent | | 10 | | | | — | | | | — | | | | — | | | | 4.04 | |
Diluted, profit/(loss) for the year and for the period attributable to ordinary equity holders of the parent | | 10 | | | | — | | | | — | | | | — | | | | 4.04 | |
| | | | | | | | | | | | | | | | | | | |
Class B ordinary shares: | | | | | | | | | | | | | | | | | | | |
Basic, profit/(loss) for the year and for the period attributable to ordinary equity holders of the parent | | 10 | | | | 2.84 | | | | 2.34 | | | | (0.58 | ) | | | 4.04 | |
Diluted, profit/(loss) for the year and for the period attributable to ordinary equity holders of the parent | | 10 | | | | 2.84 | | | | 2.34 | | | | (0.58 | ) | | | 4.04 | |
The accompanying notes are an integral part of the consolidated financial statements.
AMTD INTERNATIONAL INC.
CONSOLIDATED STATEMENTS OF FINANCIAL POSITION
AS AT 31 DECEMBER 2017 AND 2018
AND FOR THE NINE MONTHS ENDED 30 SEPTEMBER 2019
| | | | | 31 December | | | 30 September | |
| | Notes | | | 2017 | | | 2018 | | | 2019 | |
| | | | | HK$ | | | HK$ | | | HK$ | |
| | | | | | | | | | | | |
Assets | | | | | | | | | | | | |
Current assets | | | | | | | | | | | | |
Accounts receivable | | 11 | | | | 93,172,716 | | | | 161,093,054 | | | | 170,601,380 | |
Prepayments, other receivables and other assets | | 12 | | | | 23,203,443 | | | | 33,343,859 | | | | 53,511,853 | |
Due from a related company | | 24(b)(iii) | | | | 4,092,519 | | | | 4,085,019 | | | | 4,085,019 | |
Due from immediate holding company | | 24(b)(i) | | | | — | | | | 66,141,756 | | | | 1,951,534,980 | |
Due from fellow subsidiaries | | 24(b)(i) | | | | 2,458,702,841 | | | | 2,596,118,859 | | | | — | |
Financial assets at fair value through profit or loss | | 13 | | | | 745,629,400 | | | | 1,953,078,309 | | | | 1,750,862,599 | |
Stock loan | | 13 | | | | 2,203,140,000 | | | | 1,535,679,600 | | | | 1,376,205,180 | |
Tax recoverable | | | | | | 8,146,249 | | | | — | | | | — | |
Derivative financial instrument | | 14 | | | | — | | | | — | | | | 807,618,000 | |
Cash and bank balances—general accounts | | 15 | | | | 86,415,282 | | | | 126,855,518 | | | | 669,130,849 | |
Bank balances—segregated accounts | | 15 | | | | 403,491,699 | | | | 615,491,200 | | | | 287,968,500 | |
Total current assets | | | | | | 6,025,994,149 | | | | 7,091,887,174 | | | | 7,071,518,360 | |
| | | | | | | | | | | | | | | |
Non-current assets | | | | | | | | | | | | | | | |
Property, plant and equipment | | 16 | | | | 451,833 | | | | 131,206 | | | | 45,437 | |
Intangible assets | | 17 | | | | 15,171,170 | | | | 15,171,170 | | | | 15,171,170 | |
Total non-current assets | | | | | | 15,623,003 | | | | 15,302,376 | | | | 15,216,607 | |
Total assets | | | | | | 6,041,617,152 | | | | 7,107,189,550 | | | | 7,086,734,967 | |
| | | | | | | | | | | | | | | |
Equity and liabilities | | | | | | | | | | | | | | | |
Current liabilities | | | | | | | | | | | | | | | |
Clients' monies held on trust | | | | | | 383,304,389 | | | | 586,891,255 | | | | 300,429,276 | |
Accounts payable | | 18 | | | | 7,128,142 | | | | 15,310,871 | | | | 6,725,012 | |
Margin loans payable | | 19 | | | | 351,609,630 | | | | 321,999,549 | | | | 321,775,552 | |
Other payables and accruals | | 20 | | | | 6,516,678 | | | | 80,123,688 | | | | 182,275,576 | |
Due to fellow subsidiaries | | 24(b)(i) | | | | 853,123,095 | | | | 574,202,907 | | | | — | |
Due to immediate holding company | | 24(b)(i) | | | | 1,640,450,071 | | | | 2,145,792,209 | | | | — | |
Tax payable | | | | | | — | | | | 25,109,794 | | | | 76,076,332 | |
Total current liabilities | | | | | | 3,242,132,005 | | | | 3,749,430,273 | | | | 887,281,748 | |
| | | | | | | | | | | | | | | |
Non-current liabilities | | | | | | | | | | | | | | | |
Deferred tax liabilities | | 21 | | | | 130,208,677 | | | | 163,357,177 | | | | 242,913,577 | |
Total liabilities | | | | | | 3,372,340,682 | | | | 3,912,787,450 | | | | 1,130,195,325 | |
| | | | | | | | | | | | | | | |
Equity | | | | | | | | | | | | | | | |
Share capital | | | | | | | | | | | | | | | |
Class A ordinary shares (par value of US$0.0001 per share as at 31 December 2017 and 2018 and 30 September 2019; nil, nil and 8,000,000,000 shares authorized as at 31 December 2017 and 2018 and 30 September 2019, respectively; nil, nil and 33,777,159 shares as at 31 December 2017 and 2018 and 30 September 2019, respectively) | | 22 | | | | — | | | | — | | | | 26,440 | |
AMTD INTERNATIONAL INC.
CONSOLIDATED STATEMENTS OF FINANCIAL POSITION (CONTINUED)
AS AT 31 DECEMBER 2017 AND 2018
AND FOR THE NINE MONTHS ENDED 30 SEPTEMBER 2019
| | | | | 31 December | | | 30 September | |
| | Notes | | | 2017 | | | 2018 | | | 2019 | |
| | | | | HK$ | | | HK$ | | | HK$ | |
| | | | | | | | | | | | |
Class B ordinary shares (par value of US$0.0001 per share as at 31 December 2017 and 2018 and 30 September 2019; nil, nil and 2,000,000,000 shares authorized as at 31 December 2017 and 2018 and 30 September 2019, respectively; nil, nil and 200,000,001 shares as at 31 December 2017 and 2018 and 30 September 2019, respectively) | | 22 | | | | 156,998 | | | | 156,998 | | | | 156,998 | |
Capital reserve | | 22 | | | | 1,312,802,675 | | | | 1,312,802,676 | | | | 3,768,803,001 | |
Retained profits | | | | | | 870,781,050 | | | | 1,338,842,129 | | | | 2,187,553,203 | |
Total ordinary shareholders' equity | | | | | | 2,183,740,723 | | | | 2,651,801,803 | | | | 5,956,539,642 | |
Non-controlling interests | | | | | | 485,535,747 | | | | 542,600,297 | | | | — | |
Total equity | | | | | | 2,669,276,470 | | | | 3,194,402,100 | | | | 5,956,539,642 | |
Total liabilities and equity | | | | | | 6,041,617,152 | | | | 7,107,189,550 | | | | 7,086,734,967 | |
The accompanying notes are an integral part of the consolidated financial statements.
AMTD INTERNATIONAL INC.
CONSOLIDATED STATEMENTS OF CHANGES IN EQUITY
FOR THE YEARS ENDED 31 DECEMBER 2017 AND 2018
AND FOR THE NINE MONTHS ENDED 30 SEPTEMBER 2018 AND 2019
| | Share capital | | | Capital reserve | | | Retained profits | | | Total | | | Non-controlling interests | | | Total equity | |
| | HK$ | | | HK$ | | | HK$ | | | HK$ | | | HK$ | | | HK$ | |
| | | | | | | | | | | | | | | | | | |
At 1 January 2017 | | | 156,998 | | | | 33,333,003 | | | | 302,514,622 | | | | 336,004,623 | | | | — | | | | 336,004,623 | |
Capital injection to a subsidiary | | | — | | | | 1 | | | | — | | | | 1 | | | | — | | | | 1 | |
Deemed contributions | | | — | | | | 1,279,469,671 | | | | — | | | | 1,279,469,671 | | | | 380,430,329 | | | | 1,659,900,000 | |
Profit for the year and total comprehensive income for the year | | | — | | | | — | | | | 568,266,428 | | | | 568,266,428 | | | | 105,105,418 | | | | 673,371,846 | |
At 31 December 2017 | | | 156,998 | | | | 1,312,802,675 | | | | 870,781,050 | | | | 2,183,740,723 | | | | 485,535,747 | | | | 2,669,276,470 | |
| | | | | | | | | | | | | | | | | | | | | | | | |
At 1 January 2018 | | | 156,998 | | | | 1,312,802,675 | | | | 870,781,050 | | | | 2,183,740,723 | | | | 485,535,747 | | | | 2,669,276,470 | |
Capital injection to a subsidiary | | | — | | | | 1 | | | | — | | | | 1 | | | | — | | | | 1 | |
Profit for the year and total comprehensive income for the year | | | — | | | | — | | | | 468,061,079 | | | | 468,061,079 | | | | 57,064,550 | | | | 525,125,629 | |
At 31 December 2018 | | | 156,998 | | | | 1,312,802,676 | | | | 1,338,842,129 | | | | 2,651,801,803 | | | | 542,600,297 | | | | 3,194,402,100 | |
| | | | | | | | | | | | | | | | | | | | | | | | |
At 1 January 2018 | | | 156,998 | | | | 1,312,802,675 | | | | 870,781,050 | | | | 2,183,740,723 | | | | 485,535,747 | | | | 2,669,276,470 | |
Capital injection to a subsidiary | | | — | | | | 1 | | | | — | | | | 1 | | | | — | | | | 1 | |
Loss for the period and total comprehensive income for the period (unaudited) | | | — | | | | — | | | | (116,643,176 | ) | | | (116,643,176 | ) | | | (73,980,484 | ) | | | (190,623,660 | ) |
At 30 September 2018 (unaudited) | | | 156,998 | | | | 1,312,802,676 | | | | 754,137,874 | | | | 2,067,097,548 | | | | 411,555,263 | | | | 2,478,652,811 | |
| | | | | | | | | | | | | | | | | | | | | | | | |
At 1 January 2019 | | | 156,998 | | | | 1,312,802,676 | | | | 1,338,842,129 | | | | 2,651,801,803 | | | | 542,600,297 | | | | 3,194,402,100 | |
Deemed disposal of non-controlling interest (i) | | | — | | | | 435,231,866 | | | | — | | | | 435,231,866 | | | | (435,231,866 | ) | | | — | |
Exercise of warrants | | | 1,308 | | | | 94,196,292 | | | | — | | | | 94,197,600 | | | | — | | | | 94,197,600 | |
Pre-IPO financing | | | 6,451 | | | | 419,375,698 | | | | — | | | | 419,382,149 | | | | — | | | | 419,382,149 | |
Initial public offering | | | 18,681 | | | | 1,507,196,460 | | | | — | | | | 1,507,215,141 | | | | — | | | | 1,507,215,141 | |
Capital injection to a subsidiary | | | — | | | | 9 | | | | — | | | | 9 | | | | — | | | | 9 | |
Profit for the period and total comprehensive income for the period | | | — | | | | — | | | | 848,711,074 | | | | 848,711,074 | | | | (107,368,431 | ) | | | 741,342,643 | |
At 30 September 2019 | | | 183,438 | | | | 3,768,803,001 | | | | 2,187,553,203 | | | | 5,956,539,642 | | | | — | | | | 5,956,539,642 | |
| (i) | AMTD ISG and AMTD SI were indirectly held by AMTD Group for 79.13% before the Reorganisation (see note 1.2). In March 2019, due to the Reorganisation, the non-controlling shareholders surrendered their indirect interests in AMTD ISG and AMTD SI amounting to HK$435,231,866 which represented 20.87% of the total net assets of AMTD ISG and AMTD SI. Thereafter AMTD ISG and AMTD SI became wholly-owned subsidiaries of the Company. The non-controlling interests were reclassified into capital reserves as a deemed disposal of non-controlling interests. |
The accompanying notes are an integral part of the consolidated financial statements.
AMTD INTERNATIONAL INC.
CONSOLIDATED STATEMENTS OF CASH FLOWS
FOR THE YEARS ENDED 31 DECEMBER 2017 AND 2018
AND FOR THE NINE MONTHS ENDED 30 SEPTEMBER 2018 AND 2019
| | | | | Year ended 31 December | | | Nine months ended 30 September |
| | Notes | | | 2017 | | | 2018 | | | 2018 | | | 2019 | |
| | | | | HK$ | | | HK$ | | | HK$ | | | HK$ | |
| | | | | | | | | | | (Unaudited) | | | | |
CASH FLOWS FROM OPERATING ACTIVITIES | | | | | | | | | | | | | | | |
Profit/(loss) before tax | | | | | | 808,585,471 | | | | 608,965,226 | | | | (242,218,382 | ) | | | 881,073,230 | |
Adjustments for: | | | | | | | | | | | | | | | | | | | |
Interest income | | 5 | | | | (158,863 | ) | | | (7,681 | ) | | | (2,127 | ) | | | (6,633,304 | ) |
Finance costs | | 8 | | | | 28,724,758 | | | | 9,047,063 | | | | 6,546,500 | | | | 16,162,042 | |
Depreciation | | 6 | | | | 379,132 | | | | 334,841 | | | | 267,309 | | | | 99,479 | |
Dividend income | | 5 | | | | (22,564,600 | ) | | | (99,227,724 | ) | | | (99,227,724 | ) | | | (92,316,548 | ) |
Gain related to disposed investment | | 5 | | | | (46,943,698 | ) | | | — | | | | — | | | | (8,235,180 | ) |
Net fair value changes on financial assets at fair value through profit or loss and stock loan | | 5 | | | | (684,679,252 | ) | | | (256,460,295 | ) | | | 488,890,720 | | | | 288,214,130 | |
Net fair value changes on derivative financial instrument | | 14 | | | | — | | | | — | | | | — | | | | (807,618,000 | ) |
| | | | | | 83,342,948 | | | | 262,651,430 | | | | 154,256,296 | | | | 270,745,849 | |
| | | | | | | | | | | | | | | | | | | |
Increase in accounts receivable | | | | | | (169,351 | ) | | | (67,920,338 | ) | | | (268,676,845 | ) | | | (9,508,326 | ) |
Increase in prepayments, other receivables and other assets | | | | | | (3,769,215 | ) | | | (10,140,416 | ) | | | (1,214,710 | ) | | | (20,167,994 | ) |
(Increase)/decrease in due from a related company | | | | | | (2,104,418 | ) | | | 7,500 | | | | 7,500 | | | | — | |
(Decrease)/increase in other payables and accruals | | | | | | (3,063,112 | ) | | | 73,607,010 | | | | 12,107,356 | | | | 102,151,888 | |
Increase/(decrease) in clients' monies held on trust | | | | | | 3,130,108 | | | | (8,412,635 | ) | | | (2,075,542 | ) | | | 41,060,721 | |
Increase/(decrease) in amount with immediate holding company | | | | | | 284,494,845 | | | | 439,200,382 | | | | (351,779,064 | ) | | | — | |
(Decrease)/increase in amount with fellow subsidiaries | | | | | | (460,296,468 | ) | | | (699,864,420 | ) | | | 542,222,835 | | | | — | |
Decrease in financial assets at fair value through profit or loss | | | | | | 199,909,698 | | | | — | | | | — | | | | 81,711,180 | |
Increase/(decrease) in accounts payables | | | | | | 4,714,789 | | | | 8,182,729 | | | | 219,574,676 | | | | (8,585,859 | ) |
Cash from/(used in) operations | | | | | | 106,189,824 | | | (2,688,758) | | | | 304,422,502 | | | | 457,407,459 | |
Profits tax paid | | | | | | (44,586,669 | ) | | | (17,435,053 | ) | | | (9,922,772 | ) | | | (9,207,649 | ) |
Dividend received | | | | | | 22,564,600 | | | | 99,227,724 | | | | 99,227,724 | | | | 92,316,548 | |
Interest received | | | | | | 158,863 | | | | 7,681 | | | | 2,127 | | | | 737,426 | |
| | | | | | | | | | | | | | | | | | | |
Net cash flows generated from operating activities | | | | | | 84,326,618 | | | | 79,111,594 | | | | 393,729,581 | | | | 541,253,784 | |
| | | | | | | | | | | | | | | | | | | |
CASH FLOWS FROM INVESTING ACTIVITIES | | | | | | | | | | | | | | | | | | | |
Purchase of items of property, plant and equipment | | 16 | | | | (138,704 | ) | | | (14,214 | ) | | | (14,214 | ) | | | (13,710 | ) |
Advance to immediate holding company | | | | | | — | | | | — | | | | — | | | | (2,003,373,593 | ) |
| | | | | | | | | | | | | | | | | | | |
Net cash flows used in investing activities | | | | | | (138,704 | ) | | | (14,214 | ) | | | (14,214 | ) | | | (2,003,387,303 | ) |
AMTD INTERNATIONAL INC.
CONSOLIDATED STATEMENTS OF CASH FLOWS (CONTINUED)
FOR THE YEARS ENDED 31 DECEMBER 2017 AND 2018
AND FOR THE NINE MONTHS ENDED 30 SEPTEMBER 2018 AND 2019
| | | | | Year ended 31 December | | | Nine months ended 30 September | |
| | Notes | | | 2017 | | | 2018 | | | 2018 | | | 2019 | |
| | | | | HK$ | | | HK$ | | | HK$ | | | HK$ | |
| | | | | | | | | | | (Unaudited) | | | | |
CASH FLOWS FROM FINANCING ACTIVITIES | | | | | | | | | | | | | | | |
Proceeds from issue of shares | | | | | | — | | | | — | | | | — | | | | 1,984,861,264 | |
Share issue expenses | | | | | | — | | | | — | | | | — | | | | (58,263,975 | ) |
Proceeds from issue of warrants | | | | | | — | | | | — | | | | — | | | | 94,197,600 | |
Repayment of margin loans | | | | | | (38,557,701 | ) | | | (351,610,081 | ) | | | (351,609,630 | ) | | | (223,997 | ) |
Proceeds from margin loans | | | | | | — | | | | 322,000,000 | | | | — | | | | — | |
Financing costs paid | | | | | | (28,724,758 | ) | | | (9,047,063 | ) | | | (6,546,500 | ) | | | (16,162,042 | ) |
| | | | | | | | | | | | | | | | | | | |
Net cash flows (used in)/generated from financing activities | | | | | | (67,282,459 | ) | | | (38,657,144 | ) | | | (358,156,130 | ) | | | 2,004,408,850 | |
| | | | | | | | | | | | | | | | | | | |
NET INCREASE IN CASH AND CASH EQUIVALENTS | | | | | | 16,905,455 | | | | 40,440,236 | | | | 35,559,237 | | | | 542,275,331 | |
Cash and cash equivalents at beginning of year/period | | | | | | 69,509,827 | | | | 86,415,282 | | | | 86,415,282 | | | | 126,855,518 | |
| | | | | | | | | | | | | | | | | | | |
CASH AND CASH EQUIVALENTS AT END OF YEAR/PERIOD | | | | | | 86,415,282 | | | | 126,855,518 | | | | 121,974,519 | | | | 669,130,849 | |
| | | | | | | | | | | | | | | | | | | |
ANALYSIS OF BALANCES OF CASH AND CASH EQUIVALENTS | | | | | | | | | | | | | | | | | | | |
Cash and bank balances | | 15 | | | | 86,415,282 | | | | 126,855,518 | | | | 121,974,519 | | | | 669,130,849 | |
The accompanying notes are an integral part of the consolidated financial statements.
AMTD INTERNATIONAL INC.
NOTES TO THE CONSOLIDATED FINANCIAL STATEMENTS
FOR THE YEARS ENDED 31 DECEMBER 2017 AND 2018
AND FOR THE NINE MONTHS ENDED 30 SEPTEMBER 2018 AND 2019
1.1 | CORPORATE INFORMATION |
| |
| AMTD International Inc. (the ''Company'') (formerly known as AMTD Inc.) is a limited liability company incorporated in Cayman Islands on 4 February 2019. The Company is an investment holding company. The Company and its subsidiaries (collectively referred to as the "Group") is involved in investment banking, the provision of financial advisory services, assets management services and strategic investments. The Company's immediate holding company is AMTD Group Company Limited (''AMTD Group''), a private company incorporated in the British Virgin Islands (''BVI''). The directors consider that the Company's ultimate holding company is L.R. Capital Management Company (Cayman) Limited, a private company incorporated in the Cayman Islands. Information about subsidiaries Particulars of the Company's principal subsidiaries are as follows: |
| | | | | | | Percentage | | | | |
| | | | | Issued | | of equity | | | | |
| | | | | and | | attributable | | | | |
| | | Place of | | registered | | to the Company | | | Principal | |
| Name | | incorporation | | share capital | | Direct | | | Indirect | | | activities | |
| | | | | | | | | | | | | | |
| AMTD International | | Hong Kong | | HK$500,000 | | | 100 | % | | | - | | | Investment holding | |
| Holding Group Limited | | ( HK ) | | | | | | | | | | | | | |
| (formerly known as | | | | | | | | | | | | | | | |
| AMTD Financial Planning Limited) | | | | | | | | | | | | | | | |
| (''AMTD IHG'') | | | | | | | | | | | | | | | |
| | | | | | | | | | | | | | | | |
| AMTD Securities | | HK | | HK$1 | | | - | | | | 100 | % | | Investment holding | |
| Limited | | | | | | | | | | | | | | | |
| | | | | | | | | | | | | | | | |
| AMTD Global Markets | | HK | | HK$1,561,610,980 | | | - | | | | 100 | % | | Provision of | |
| Limited (formerly known as | | | | | | | | | | | | | | investment banking, | |
| AMTD Asset Management | | | | | | | | | | | | | | financial advisory | |
| Limited) ("AMTD GM") | | | | | | | | | | | | | | services and asset | |
| | | | | | | | | | | | | | | management | |
| | | | | | | | | | | | | | | services | |
| | | | | | | | | | | | | | | | |
| Asia Alternative Asset | | HK | | HK$5,000,000 | | | - | | | | 100 | % | | Provision of | |
| Partners Limited | | | | | | | | | | | | | | investment | |
| ("AMTD AAAPL") | | | | | | | | | | | | | | advisory services | |
| | | | | | | | | | | | | | | | |
| AMTD Strategic Investment | | HK | | HK$1 | | | - | | | | 100 | % | | Provision of | |
| Limited ("AMTD SI") | | | | | | | | | | | | | | strategic | |
| | | | | | | | | | | | | | | investment | |
| | | | | | | | | | | | | | | | |
| AMTD Investment Solutions | | HK | | HK$1 | | | - | | | | 100 | % | | Provision of | |
| Group Limited ("AMTD ISG") | | | | | | | | | | | | | | strategic | |
| | | | | | | | | | | | | | | investment | |
AMTD INTERNATIONAL INC.
NOTES TO THE CONSOLIDATED FINANCIAL STATEMENTS (CONTINUED)
FOR THE YEARS ENDED 31 DECEMBER 2017 AND 2018
AND FOR THE NINE MONTHS ENDED 30 SEPTEMBER 2018 AND 2019
| 1.1 | CORPORATE INFORMATION (CONTINUED) |
| |
| Information about subsidiaries (continued) Particulars of the Company's principal subsidiaries are as follows (continued): |
| | | | | | | Percentage | | | | |
| | | | | Issued | | of equity | | | | |
| | | | | and | | attributable | | | | |
| | | Place of | | registered | | to the Company | | | Principal | |
| Name | | incorporation | | share capital | | Direct | | | Indirect | | | activities | |
| | | | | | | | | | | | | | |
| AMTD Overseas Limited | | HK | | HK$1 | | | - | | | | 100 | | | Provision of | |
| (formerly known as AMTD | | | | | | | | | | | | | | strategic | |
| Europe Holdings Limited) | | | | | | | | | | | | | | investment | |
| (''AMTD Overseas'') | | | | | | | | | | | | | | | |
| | | | | | | | | | | | | | | | |
| AMTD Fintech | | HK | | HK$1 | | | - | | | | 100 | | | Provision of | |
| Investment Limited | | | | | | | | | | | | | | strategic | |
| (''AMTD FI'') | | | | | | | | | | | | | | investment | |
| | | | | | | | | | | | | | | | |
| AMTD | | Cayman Islands | | US$1 | | | 100 | | | | - | | | Investment | |
| Investment Inc. | | | | | | | | | | | | | | holding | |
| (''AMTD Investment'') | | | | | | | | | | | | | | | |
| | | | | | | | | | | | | | | | |
| AMTD Strategic | | BVI | | US$1 | | | - | | | | 100 | | | Investment | |
| Investment (BVI) Limited | | | | | | | | | | | | | | holding | |
| | | | | | | | | | | | | | | | |
| AMTD Investment | | BVI | | US$1 | | | - | | | | 100 | | | Investment | |
| Solutions Group (BVI) | | | | | | | | | | | | | | holding | |
| Limited | | | | | | | | | | | | | | | |
| | | | | | | | | | | | | | | | |
| AMTD Overseas | | BVI | | US$1 | | | - | | | | 100 | | | Investment | |
| (BVI) Limited | | | | | | | | | | | | | | holding | |
| | | | | | | | | | | | | | | | |
| AMTD Fintech | | BVI | | US$1 | | | - | | | | 100 | | | Investment | |
| Investment (BVI) Limited | | | | | | | | | | | | | | holding | |
| 1.2 | REORGANISATION |
| |
| In order to facilitate the Company's initial public offering at the New York Stock Exchange, AMTD Group completed a Reorganisation (the "Reorganisation") whereby, certain operating and their respective immediate holding entities under AMTD Group's common control, were ultimately contributed to the Company: |
| · | On 8 February 2019, AMTD Investment was incorporated in Cayman Islands and directly held by the Company; |
| | |
| · | From 12 March 2019 to 14 March 2019, four wholly-owned subsidiaries were incorporated in the BVI and were held indirectly by the Company through AMTD Investment; |
AMTD INTERNATIONAL INC.
NOTES TO THE CONSOLIDATED FINANCIAL STATEMENTS (CONTINUED)
FOR THE YEARS ENDED 31 DECEMBER 2017 AND 2018
AND FOR THE NINE MONTHS ENDED 30 SEPTEMBER 2018 AND 2019
| 1.2 | REORGANISATION (CONTINUED) |
| · | On 18 March 2019, the Company entered into sale and purchase agreements with AMTD Group and its subsidiaries which held the shares of AMTD ISG, AMTD SI, AMTD Overseas and AMTD FI (collectively referred to as the "transferred entities"), pursuant to which AMTD Group and its subsidiaries agreed to contribute 100% of the share capital of the transferred entities to the Company for a total of 199,990,000 newly issued Class B ordinary shares of the Company. For AMTD ISG and AMTD SI with non-controlling interests, all shareholders had passed a resolution to provide consent to enter the sale and purchase agreements that involved the two entities and agreed that shareholders other than AMTD Group would not receive any consideration from the disposal of the two entities. The Company issued 199,990,000 Class B ordinary shares and holds the equity interests of AMTD ISG, AMTD SI, AMTD Overseas and AMTD FI indirectly through the four newly set up BVI entities. |
| | |
| · | On 11 April 2019, the Securities and Futures Commission ("SFC") approved the shareholder change of AMTD IHG, which holds two licensed subsidiaries (AMTD GM and AMTD AAAPL) governed by the SFC in Hong Kong, from AMTD Group to the Company. The sale and purchase agreement with respect to the transfer of AMTD IHG became effective automatically upon the approval from the SFC. AMTD Group transferred 100% of share capital of AMTD IHG to the Company. In return, the Company issued one Class B ordinary share to AMTD Group. |
| The Reorganisation was completed on 11 April 2019. Through the Reorganisation, the Company became the holding company of the companies now comprising the Group. Accordingly, for the purpose of preparation of the consolidated financial statements of the Group, the Company is considered as the holding company of the companies now comprising the Group throughout the years ended 31 December 2017 and 2018 and the nine months ended 30 September 2018 and 2019. |
| 2.1 | BASIS OF PRESENTATION |
| |
| Basis of preparation and transition to IFRSs Through the Reorganisation, the Company became the holding company of the contributed businesses now comprising the Group, which were under the common control of the controlling shareholder before and after the Reorganisation. Accordingly, the financial statements were prepared on a consolidated basis by applying the principles of the pooling of interest method as if the Reorganisation had been completed at the beginning of the reporting period. The consolidated statements of profit or loss and other comprehensive income, changes in equity and cash flows of the Group for the relevant periods included the results and cash flows of all companies now comprising the Group from the earliest date presented or since the date when the subsidiaries and/or businesses first came under the common control of the controlling shareholder, whenever the period is shorter. The consolidated statements of financial position of the Group as at 31 December 2017 and 2018 and 30 September 2019 have been prepared to present the assets and liabilities of the subsidiaries and/or businesses using the existing book values from the controlling shareholder's perspective. No adjustments are made to reflect fair values, or to recognise any new assets or liabilities as a result of the Reorganisation. Equity interests in subsidiaries and/or businesses held by parties other than the controlling shareholder, and changes therein, prior to the Reorganisation are presented as non-controlling interests in equity applying the principles of the pooling of interest method. All intra-group transactions and balances have been eliminated on consolidation. |
AMTD INTERNATIONAL INC.
NOTES TO THE CONSOLIDATED FINANCIAL STATEMENTS (CONTINUED)
FOR THE YEARS ENDED 31 DECEMBER 2017 AND 2018
AND FOR THE NINE MONTHS ENDED 30 SEPTEMBER 2018 AND 2019
| 2.1 | BASIS OF PRESENTATION (CONTINUED) |
| |
| The Group's consolidated financial statements have been prepared in accordance with International Financial Reporting Standards (''IFRSs'') of the International Accounting Standards Board (''IASB'') and the Interpretations of the International Financial Reporting Interpretations Committee (''IFRIC''). |
| |
| The Group has applied IFRS for the first time to the consolidated financial statements for the years ended 31 December 2017 and 2018 and for the nine months ended 30 September 2018 and 2019. All IFRSs issued by the IASB, effective at the time of preparing these consolidated financial statements have been applied. |
| |
| The Group prepared the consolidated financial statements that comply with IFRS applicable as at 30 September 2019 and 31 December 2018, together with the comparatives for the year ended 31 December 2017, as described in the summary of significant accounting policies. The Group did not use any optional exemptions with regard to full retrospective application of IFRS set out within IFRS 1. |
| |
| The consolidated financial statements have been prepared on a historical cost basis, except for financial assets at fair value through profit or loss and derivative financial instrument which are measured at fair value. The consolidated financial statements are presented in Hong Kong Dollars (''HK$'') unless otherwise stated. |
| |
| Basis of consolidation |
| The consolidated financial statements include the financial statements of the Company and its subsidiaries for the years ended 31 December 2017 and 2018 and for the nine months ended 30 September 2018 and 2019. A subsidiary is an entity, directly or indirectly, controlled by the Company. Control is achieved when the Group is exposed, or has rights, to variable returns from its involvement with the investee and has the ability to affect those returns through its power over the investee (i.e., existing rights that give the Group the current ability to direct the relevant activities of the investee). |
| |
| The financial statements of the subsidiaries are prepared for the same reporting period as the Company, using consistent accounting policies. The results of subsidiaries are consolidated from the date on which the Group obtains control, and continue to be consolidated until the date that such control ceases. |
| |
| Profit or loss is attributed to the owners of the parent of the Group and to the non-controlling interests, even if this results in the non-controlling interests having a deficit balance. All intra-group assets and liabilities, equity, income, expenses and cash flows relating to transactions between members of the Group are eliminated in full on consolidation. |
| |
| The Group reassesses whether or not it controls an investee if facts and circumstances indicate that there are changes to one or more of the three elements of control described above. |
AMTD INTERNATIONAL INC.
NOTES TO THE CONSOLIDATED FINANCIAL STATEMENTS (CONTINUED)
FOR THE YEARS ENDED 31 DECEMBER 2017 AND 2018
AND FOR THE NINE MONTHS ENDED 30 SEPTEMBER 2018 AND 2019
| 2.2 | ISSUED BUT NOT YET EFFECTIVE INTERNATIONAL FINANCIAL REPORTING STANDARDS |
| |
| New standards early adopted by the Group Amendments to IFRS 3 Definition of a Business In October 2018, IASB issued the amendment to IFRS 3, Definition of a Business, which is effective for business combinations for which the acquisition date is on or after the beginning of the first annual reporting period beginning on or after 1 January 2020 and to asset acquisitions that occur on or after the beginning of that period. Amendments to IFRS 3 clarify and provide additional guidance on the definition of a business. The amendments clarify that for an integrated set of activities and assets to be considered a business, it must include, at a minimum, an input and a substantive process that together significantly contribute to the ability to create output. A business can exist without including all of the inputs and processes needed to create outputs. The amendments remove the assessment of whether market participants are capable of acquiring the business and continue to produce outputs. Instead, the focus is on whether acquired inputs and acquired substantive processes together significantly contribute to the ability to create outputs. The amendments have also narrowed the definition of outputs to focus on goods or services provided to customers, investment income or other income from ordinary activities. Furthermore, the amendments provide guidance to assess whether an acquired process is substantive and introduce an optional fair value concentration test to permit a simplified assessment of whether an acquired set of activities and assets is not a business. The Group has early adopted the amendments. The Company acquired the intangible assets included in the consolidated financial statements through the acquisition of a subsidiary in 2015. The acquisition was determined to be and accounted for as an asset acquisition as the intangible assets met the fair value concentration test. New and revised IFRS not yet adopted by the Group Amendments to IAS 1 and IAS 8 Amendments to IAS 1 and IAS 8 provide a new definition of material. The new definition states that information is material if omitting, misstating or obscuring it could reasonably be expected to influence decisions that the primary users of general purpose financial statements make on the basis of those financial statements. The amendments clarify that materiality will depend on the nature or magnitude of information. A misstatement of information is material if it could reasonably be expected to influence decisions made by the primary users. The Group expects to adopt the amendments prospectively from 1 January 2020. The amendments are not expected to have any significant impact on the Group's consolidated financial statements. |
| 2.3 | SUMMARY OF SIGNIFICANT ACCOUNTING POLICIES |
| |
| New standards and interpretations adopted by the Group IFRIC Interpretation 23 Uncertainty over Income Tax TreatmentsThe interpretation addresses the accounting for income taxes (current and deferred) when tax treatments involve uncertainty that affects the application of IAS 12 Income Taxes (often referred to as “uncertain tax positions”). It does not apply to taxes or levies outside the scope of IAS 12, nor does it specifically include requirements relating to interest and penalties associated with uncertain tax treatments. (i) whether an entity considers uncertain tax treatments separately; (ii) the assumptions an entity makes about the examination of tax treatments by taxation authorities; (iii) how an entity determines taxable profits or tax losses, tax bases, unused tax losses, unused tax credits and tax rates; and (iv) how an entity considers changes in facts and circumstances. Upon adoption of the interpretation, the Group considered whether it has any uncertain tax positions arising from the transfer pricing on its intergroup sales. Based on the Group’s tax compliance and transfer pricing study, the Group determined that it is probable that its transfer pricing policy will be accepted by the tax authorities. Accordingly, the interpretation did not have any impact on the financial position or performance of the Group. An entity has to determine whether to consider each uncertain tax treatments separately or together with one or more other uncertain tax treatments. The approach that better predicts the resolution of the uncertainty needs to be followed. The interpretation is effective for annual reporting periods beginning on or after 1 January 2019, but certain transition reliefs are available. The Group has applied the interpretation from its effective date. The adoption of the interpretation did not have any material impact on the Company's consolidated financial statements. |
AMTD INTERNATIONAL INC. NOTES TO THE CONSOLIDATED FINANCIAL STATEMENTS (CONTINUED) FOR THE YEARS ENDED 31 DECEMBER 2017 AND 2018 AND FOR THE NINE MONTHS ENDED 30 SEPTEMBER 2018 AND 2019 |
| 2.3 | SUMMARY OF SIGNIFICANT ACCOUNTING POLICIES (CONTINUED) |
| |
| New standards and interpretations adopted by the Group (continued) IFRS 16 Leases IFRS 16, which supersedes IAS 17 Leases, introduces a single lessee accounting model and requires a lessee to recognise assets and liabilities for all leases with a term of more than 12 months, unless the underlying asset is of low value. Specifically, under IFRS 16, a lessee is required to recognise a right-of-use asset representing its right to use the underlying leased asset and a lease liability representing its obligation to make lease payments. Accordingly, a lessee should recognise depreciation of the right-of-use asset and interest on the lease liability, and also classifies cash repayments of the lease liability into a principal portion and an interest portion and presents them in the consolidated statements of cash flows. Also, the right-of-use asset and the lease liability are initially measured on a present value basis. The measurement includes non-cancellable lease payments and also includes payments to be made in optional periods if the lessee is reasonably certain to exercise an option to extend the lease, or not to exercise an option to terminate the lease. This accounting treatment is significantly different from the lessee accounting for leases that are classified as operating leases under the predecessor standard, IAS 17. In respect of the lessor accounting, IFRS 16 substantially carries forward the lessor accounting requirements in IAS 17. Accordingly, a lessor continues to classify its leases as operating leases or finance leases, and to account for those two types of leases differently. The adoption of IFRS 16 did not have any impact on the consolidated financial statements of the Group as the companies within the Group did not enter into any lease contracts under their name. Several other amendments and interpretations apply for the first time in 2019, but do not have an impact on the consolidated financial statements of the Group. Fair value measurement The Group measures its derivative financial instrument, debt and equity investments at fair value at the end of each reporting period. Fair value is the price that would be received to sell an asset or paid to transfer a liability in an orderly transaction between market participants at the measurement date. The fair value measurement is based on the presumption that the transaction to sell the asset or transfer the liability takes place either in the principal market for the asset or liability, or in the absence of a principal market, in the most advantageous market for the asset or liability. The principal or the most advantageous market must be accessible by the Group. The fair value of an asset or a liability is measured using the assumptions that market participants would use when pricing the asset or liability, assuming that market participants act in their economic best interest. A fair value measurement of a non-financial asset takes into account a market participant’s ability to generate economic benefits by using the asset in its highest and best use or by selling it to another market participant that would use the asset in its highest and best use. The Group uses valuation techniques that are appropriate in the circumstances and for which sufficient data are available to measure fair value, maximising the use of relevant observable inputs and minimising the use of unobservable inputs. |
AMTD INTERNATIONAL INC. NOTES TO THE CONSOLIDATED FINANCIAL STATEMENTS (CONTINUED) FOR THE YEARS ENDED 31 DECEMBER 2017 AND 2018 AND FOR THE NINE MONTHS ENDED 30 SEPTEMBER 2018 AND 2019 |
2.3 | SUMMARY OF SIGNIFICANT ACCOUNTING POLICIES (CONTINUED) |
| |
| Fair value measurement (continued) All assets and liabilities for which fair value is measured or disclosed in the consolidated financial statements are categorised within the fair value hierarchy, described as follows, based on the lowest level input that is significant to the fair value measurement as a whole: Level 1 — based on quoted prices (unadjusted) in active markets for identical assets or liabilities Level 2 — based on valuation techniques for which the lowest level input that is significant to the fair value measurement is observable, either directly or indirectly Level 3 — based on valuation techniques for which the lowest level input that is significant to the fair value measurement is unobservable For assets and liabilities that are recognised in the consolidated financial statements on a recurring basis, the Group determines whether transfers have occurred between levels in the hierarchy by reassessing categorization (based on the lowest level input that is significant to the fair value measurement as a whole) at the end of each reporting period. Impairment of non-financial assets Where an indication of impairment exists, or when annual impairment testing for an asset is required (other than financial assets), the asset's recoverable amount is estimated. An asset's recoverable amount is the higher of the asset's or cash-generating unit's value in use and its fair value less costs of disposal, and is determined for an individual asset, unless the asset does not generate cash inflows that are largely independent of those from other assets or groups of assets, in which case the recoverable amount is determined for the cash-generating unit to which the asset belongs. An impairment loss is recognised only if the carrying amount of an asset exceeds its recoverable amount. In assessing value in use, the estimated future cash flows are discounted to their present value using a pre-tax discount rate that reflects current market assessments of the time value of money and the risks specific to the asset. An impairment loss is charged to profit or loss in the period in which it arises in those expense categories consistent with the function of the impaired asset. An assessment is made at the end of each reporting period as to whether there is an indication that previously recognised impairment losses may no longer exist or may have decreased. If such an indication exists, the recoverable amount is estimated. A previously recognised impairment loss of an asset other than goodwill is reversed only if there has been a change in the estimates used to determine the recoverable amount of that asset, but not to an amount higher than the carrying amount that would have been determined (net of any depreciation) had no impairment loss been recognised for the asset in prior years. A reversal of such an impairment loss is credited to profit or loss in the period in which it arises, (only if there are revalued assets in the consolidated financial statements) unless the asset is carried at a revalued amount, in which case the reversal of the impairment loss is accounted for in accordance with the relevant accounting policy for that revalued asset. |
AMTD INTERNATIONAL INC.
NOTES TO THE CONSOLIDATED FINANCIAL STATEMENTS (CONTINUED)
FOR THE YEARS ENDED 31 DECEMBER 2017 AND 2018
AND FOR THE NINE MONTHS ENDED 30 SEPTEMBER 2018 AND 2019
2.3 | SUMMARY OF SIGNIFICANT ACCOUNTING POLICIES (CONTINUED) |
| |
| Related parties A party is considered to be related to the Group if: |
| (a) | the party is a person or a close member of that person's family and that person |
| | (i) | has control or joint control over the Group; |
| | (ii) | has significant influence over the Group; or |
| | (iii) | is a member of the key management personnel of the Group or of a parent of the Group; |
| or | | |
| (b) | the party is an entity where any of the following conditions applies: |
| | (i) | the entity and the Group are members of the same group; |
| | (ii) | one entity is an associate or joint venture of the other entity (or of a parent, subsidiary or fellow subsidiary of the other entity); |
| | (iii) | the entity and the Group are joint ventures of the same third party; |
| | (iv) | one entity is a joint venture of a third entity and the other entity is an associate of the third entity; |
| | (v) | the entity is a post-employment benefit plan for the benefit of employees of either the Group or an entity related to the Group; and the sponsoring employers of the post-employment benefit plan; |
| | (vi) | the entity is controlled or jointly controlled by a person identified in (a); |
| | (vii) | a person identified in (a)(i) has significant influence over the entity or is a member of the key management personnel of the entity (or of a parent of the entity); and |
| | (viii) | the entity, or any member of a group of which it is a part, provides key management personnel services to the Group or to the parent of the Group. |
| | | |
| Property, plant and equipment and depreciation Property, plant and equipment are stated at cost less accumulated depreciation and any impairment losses. The cost of an item of property, plant and equipment comprises its purchase price and any directly attributable costs of bringing the asset to its working condition and location for its intended use. Expenditure incurred after items of property, plant and equipment have been put into operation, such as repairs and maintenance, is normally charged to profit or loss in the year in which it is incurred. In situations where the recognition criteria are satisfied, the expenditure for a major inspection is capitalised in the carrying amount of the asset as a replacement. Where significant parts of property, plant and equipment are required to be replaced at intervals, the Group recognises such parts as individual assets with specific useful lives and depreciates them accordingly. Depreciation is calculated on a straight-line basis to write off the cost or valuation of each item of property, plant and equipment to its residual value over its estimated useful life. The principal annual rates used for this purpose are as follows: |
| Furniture and fixtures | 20% |
| Computer equipment | 331⁄3% |
| | |
| Where parts of an item of property, plant and equipment have different useful lives, the cost of that item is allocated on a reasonable basis among the parts and each part is depreciated separately. Residual values, useful lives and the depreciation method are reviewed, and adjusted if appropriate, at least at each financial year end. An item of property, plant and equipment including any significant part initially recognised is derecognised upon disposal or when no future economic benefits are expected from its use or disposal. Any gain or loss on disposal or retirement recognised in profit or loss in the year the asset is derecognised is the difference between the net sales proceeds and the carrying amount of the relevant asset. |
AMTD INTERNATIONAL INC.
NOTES TO THE CONSOLIDATED FINANCIAL STATEMENTS (CONTINUED)
FOR THE YEARS ENDED 31 DECEMBER 2017 AND 2018
AND FOR THE NINE MONTHS ENDED 30 SEPTEMBER 2018 AND 2019
| 2.3 | SUMMARY OF SIGNIFICANT ACCOUNTING POLICIES (CONTINUED) |
| |
| Intangible assets (other than goodwill) Intangible assets acquired separately are measured on initial recognition at cost. The cost of intangible assets acquired in a business combination or asset acquisition is the fair value at the date of acquisition. The useful lives of intangible assets are assessed to be either finite or indefinite. Intangible assets with indefinite useful lives are tested for impairment annually either individually or at the cash-generating unit level. Such intangible assets are not amortised. The useful life of an intangible asset with an indefinite life is reviewed annually to determine whether the indefinite life assessment continues to be supportable. If not, the change in the useful life assessment from indefinite to finite is accounted for on a prospective basis. Licenses Purchased licenses are stated at cost less any impairment losses and have indefinite useful life. Investments and other financial assets Initial recognition and measurement Financial assets are classified, at initial recognition, and subsequently measured at amortised cost, and fair value through profit or loss. The classification of financial assets at initial recognition depends on the financial asset's contractual cash flow characteristics and the Group's business model for managing them. With the exception of accounts receivable that do not contain a significant financing component or for which the Group has applied the practical expedient of not adjusting the effect of a significant financing component, the Group initially measures a financial asset at its fair value, plus in the case of a financial asset not at fair value through profit or loss, transaction costs. Accounts receivable that do not contain a significant financing component or for which the Group has applied the practical expedient are measured at the transaction price determined under IFRS 15 in accordance with the policies set out for "Revenue recognition" below. Financial assets with cash flows that are not SPPI are classified and measured at fair value through profit or loss, irrespective of the business model. In order for a financial asset to be classified and measured at amortised cost or fair value through other comprehensive income, it needs to give rise to cash flows that are solely payments of principal and interest ("SPPI") on the principal amount outstanding. The Group's business model for managing financial assets refers to how it manages its financial assets in order to generate cash flows. The business model determines whether cash flows will result from collecting contractual cash flows, selling the financial assets, or both. Financial assets classified and measured at amortised cost are held within a business model with the objective to hold financial assets in order to collect contractual cash flows, while financial assets classified and measured at fair value through other comprehensive income are held within a business model with the objective of both holding to collect contractual cash flows and selling. Financial assets which are not held within the aforementioned business models are classified and measured at fair value through profit or loss. All regular way purchases and sales of financial assets are recognised on the trade date, that is, the date that the Group commits to purchase or sell the asset. Regular way purchases or sales are purchases or sales of financial assets that require delivery of assets within the period generally established by regulation or convention in the marketplace. |
AMTD INTERNATIONAL INC.
NOTES TO THE CONSOLIDATED FINANCIAL STATEMENTS (CONTINUED)
FOR THE YEARS ENDED 31 DECEMBER 2017 AND 2018
AND FOR THE NINE MONTHS ENDED 30 SEPTEMBER 2018 AND 2019
| 2.3 | SUMMARY OF SIGNIFICANT ACCOUNTING POLICIES (CONTINUED) |
| | |
| Investments and other financial assets (continued) Subsequent measurement The subsequent measurement of financial assets depends on their classification as follows: Financial assets at amortised cost (debt instruments) Financial assets at amortised cost are subsequently measured using the effective interest method and are subject to impairment. Gains and losses are recognised in the consolidated statements of profit or loss when the asset is derecognised, modified or impaired. Financial assets at fair value through profit or loss Financial assets at fair value through profit or loss are carried in the consolidated statements of financial position at fair value with net changes in fair value recognised in profit or loss. This category includes derivative instruments and equity investments which the Group had not irrevocably elected to classify at fair value through other comprehensive income. Dividends on equity investments classified as financial assets at fair value through profit or loss are also recognised as other income in the consolidated statements of profit or loss when the right of payment has been established, it is probable that the economic benefits associated with the dividend will flow to the Group and the amount of the dividend can be measured reliably. Derecognition of financial assets A financial asset (or, where applicable, a part of a financial asset or part of a group of similar financial assets) is primarily derecognised (i.e., removed from the Group’s consolidated statement of financial position) when |
| • | the rights to receive cash flows from the asset have expired; or |
| • | the Group has transferred its rights to receive cash flows from the asset or has assumed an obligation to pay the received cash flows in full without material delay to a third party under a "pass-through" arrangement; and either (a) the Group has transferred substantially all the risks and rewards of the asset, or (b) the Group has neither transferred nor retained substantially all the risks and rewards of the asset, but has transferred control of the asset. |
| | |
| When the Group has transferred its rights to receive cash flows from an asset or has entered into a "pass-through" arrangement, it evaluates if, and to what extent, it has retained the risk and rewards of ownership of the asset. When it has neither transferred nor retained substantially all the risks and rewards of the asset nor transferred control of the asset, the Group continues to recognise the transferred asset to the extent of the Group's continuing involvement. In that case, the Group also recognises an associated liability. The transferred asset and the associated liability are measured on a basis that reflects the rights and obligations that the Group has retained. Continuing involvement that takes the form of a guarantee over the transferred asset is measured at the lower of the original carrying amount of the asset and the maximum amount of consideration that the Group could be required to repay. |
AMTD INTERNATIONAL INC.
NOTES TO THE CONSOLIDATED FINANCIAL STATEMENTS (CONTINUED)
FOR THE YEARS ENDED 31 DECEMBER 2017 AND 2018
AND FOR THE NINE MONTHS ENDED 30 SEPTEMBER 2018 AND 2019
| 2.3 | SUMMARY OF SIGNIFICANT ACCOUNTING POLICIES (CONTINUED) |
| | |
| Impairment of financial assets The Group recognises an allowance for expected credit losses ("ECLs") for all debt instruments not held at fair value through profit or loss. ECLs are based on the difference between the contractual cash flows due in accordance with the contract and all the cash flows that the Group expects to receive, discounted at an approximation of the original effective interest rate. The expected cash flows will include cash flows from the sale of collateral held or other credit enhancements that are integral to the contractual terms. General approach ECLs are recognised in two stages. For credit exposures for which there has not been a significant increase in credit risk since initial recognition, ECLs are provided for credit losses that result from default events that are possible within the next 12-months (a 12-month ECL). For those credit exposures for which there has been a significant increase in credit risk since initial recognition, a loss allowance is required for credit losses expected over the remaining life of the exposure, irrespective of the timing of the default (a lifetime ECL). At each reporting date, the Group assesses whether the credit risk on a financial instrument has increased significantly since initial recognition. When making the assessment, the Group compares the risk of a default occurring on the financial instrument as at the reporting date with the risk of a default occurring on the financial instrument as at the date of initial recognition and considers reasonable and supportable information that is available without undue cost or effort, including historical and forward-looking information. The Group considers a financial asset in default when contractual payments are 60-120 days past due. However, in certain cases, the Group may also consider a financial asset to be in default when internal or external information indicates that the Group is unlikely to receive the outstanding contractual amounts in full before taking into account any credit enhancements held by the Group. A financial asset is written off when there is no reasonable expectation of recovering the contractual cash flows. Financial assets at amortised cost are subject to impairment under the general approach and they are classified within the following stages for measurement of ECLs except for accounts receivable which apply the simplified approach as detailed below. |
| | |
| Stage 1 — | Financial instruments for which credit risk has not increased significantly since initial recognition and for which the loss allowance is measured at an amount equal to 12-month ECLs |
| Stage 2 — | Financial instruments for which credit risk has increased significantly since initial recognition but that are not credit-impaired financial assets and for which the loss allowance is measured at an amount equal to lifetime ECLs |
| Stage 3 — | Financial assets that are credit-impaired at the reporting date (but that are not purchased or originated credit-impaired) and for which the loss allowance is measured at an amount equal to lifetime ECLs |
| | |
| Simplified approach For accounts receivable that do not contain a significant financing component or when the Group applies the practical expedient of not adjusting the effect of a significant financing component, the Group applies the simplified approach in calculating ECLs. Under the simplified approach, the Group does not track changes in credit risk, but instead recognises a loss allowance based on lifetime ECLs at each reporting date. The Group has established a provision matrix that is based on its historical credit loss experience, adjusted for forward-looking factors specific to the debtors and the economic environment. For accounts receivable that contain a significant financing component, the Group chooses as its accounting policy to adopt the simplified approach in calculating ECLs with policies as described above. |
AMTD INTERNATIONAL INC.
NOTES TO THE CONSOLIDATED FINANCIAL STATEMENTS (CONTINUED)
FOR THE YEARS ENDED 31 DECEMBER 2017 AND 2018
AND FOR THE NINE MONTHS ENDED 30 SEPTEMBER 2018 AND 2019
| 2.3 | SUMMARY OF SIGNIFICANT ACCOUNTING POLICIES (CONTINUED) |
| |
| Financial liabilities Initial recognition and measurement Financial liabilities are classified, at initial recognition, as financial liabilities at amortised cost or at fair value through profit or loss (warrants and derivative financial instruments), as appropriate. All financial liabilities are recognised initially at fair value and, in the case of financial liabilities at amortised cost , net of directly attributable transaction costs. The Group’s financial liabilities include clients’ monies held on trust, accounts payable, margin loan payable, financial liabilities included in other payables and accruals, amount due to fellow subsidiaries and immediate holding company. Subsequent measurement The subsequent measurement of financial liabilities depends on their classification as follows: Financial liabilities at amortised cost After initial recognition, interest-bearing loans and borrowings are subsequently measured at amortised cost, using the effective interest rate method unless the effect of discounting would be immaterial, in which case they are stated at cost. Gains and losses are recognised in profit or loss when the liabilities are derecognised as well as through the effective interest rate amortisation process. Amortised cost is calculated by taking into account any discount or premium on acquisition and fees or costs that are an integral part of the effective interest rate. The effective interest rate amortisation is included in finance costs in profit or loss. Derecognition of financial liabilities A financial liability is derecognised when the obligation under the liability is discharged or cancelled, or expires. When an existing financial liability is replaced by another from the same lender on substantially different terms, or the terms of an existing liability are substantially modified, such an exchange or modification is treated as a derecognition of the original liability and a recognition of a new liability, and the difference between the respective carrying amounts is recognised in profit or loss. Warrants The warrants, as part of financial liabilities, are recognised initially at fair value. They are classified as financial liabilities at fair value through profit or loss as they are derivative financial instruments entered into by the Group that are not designated as hedging instruments in hedge relationships as defined by IFRS 9. Gains or losses on liabilities at fair value through profit and loss are recognised in profit or loss. Derivative financial instrument Derivative financial instrument is initially recognised at fair value on the date on which a derivative contract is entered into and is subsequently remeasured at fair value. Derivative financial instrument is carried as an asset when the fair value is positive and as a liability when the fair value is negative. Any gain or loss arising from changes in fair value of the derivative financial instrument is taken directly to profit or loss. |
AMTD INTERNATIONAL INC.
NOTES TO THE CONSOLIDATED FINANCIAL STATEMENTS (CONTINUED)
FOR THE YEARS ENDED 31 DECEMBER 2017 AND 2018
AND FOR THE NINE MONTHS ENDED 30 SEPTEMBER 2018 AND 2019
| 2.3 | SUMMARY OF SIGNIFICANT ACCOUNTING POLICIES (CONTINUED) |
| |
| Derivative financial instrument (continued) Day 1 profit or loss If the fair value of the derivative financial instrument at initial recognition differs from the transaction price and the fair value is not evidenced by a quoted price in an active market for an identical asset or liability (i.e. a Level 1 input) or a valuation technique that uses only data from observable markets, the difference between the fair value at initial recognition and the transaction price is the deferred and is only recognised as a gain or loss during the term of the derivative financial instrument using a systematic basis that reflects a change in a factor (including time) that market participants would take into account when pricing the derivative financial instrument. Cash and cash equivalents For the purpose of the consolidated statements of cash flows, cash and cash equivalents comprise cash on hand and demand deposits, and short term highly liquid investments that are readily convertible into known amounts of cash, are subject to an insignificant risk of changes in value, and have a short maturity of generally within three months when acquired, less bank overdrafts which are repayable on demand and form an integral part of the Group's cash management. For the purpose of the consolidated statements of financial position, cash and cash equivalents comprise cash on hand and at banks, including term deposits, and assets similar in nature to cash, which are not restricted as to use. Provisions A provision is recognised when a present obligation (legal or constructive) has arisen as a result of a past event and it is probable that a future outflow of resources will be required to settle the obligation, provided that a reliable estimate can be made of the amount of the obligation. When the effect of discounting is material, the amount recognised for a provision is the present value at the end of the reporting period of the future expenditures expected to be required to settle the obligation. The increase in the discounted present value amount arising from the passage of time is included in finance costs in profit or loss. Income tax Income tax comprises current and deferred tax. Income tax relating to items recognised outside profit or loss is recognised outside profit or loss, either in other comprehensive income or directly in equity. Current tax assets and liabilities are measured at the amount expected to be recovered from or paid to the taxation authorities, based on tax rates (and tax laws) that have been enacted or substantively enacted by the end of the reporting period, taking into consideration interpretations and practices prevailing in the countries in which the Group operates. Deferred tax is provided, using the liability method, on all temporary differences at the end of the reporting period between the tax bases of assets and liabilities and their carrying amounts for financial reporting purposes. |
AMTD INTERNATIONAL INC.
NOTES TO THE CONSOLIDATED FINANCIAL STATEMENTS (CONTINUED)
FOR THE YEARS ENDED 31 DECEMBER 2017 AND 2018
AND FOR THE NINE MONTHS ENDED 30 SEPTEMBER 2018 AND 2019
| 2.3 | SUMMARY OF SIGNIFICANT ACCOUNTING POLICIES (CONTINUED) |
| | |
| Income tax (continued) Deferred tax liabilities are recognised for all taxable temporary differences, except: |
| | |
| • | when the deferred tax liability arises from the initial recognition of goodwill or an asset or liability in a transaction that is not a business combination and, at the time of the transaction, affects neither the accounting profit nor taxable profit or loss; and |
| | |
| • | in respect of taxable temporary differences associated with investments in subsidiaries, associates and joint ventures, when the timing of the reversal of the temporary differences can be controlled and it is probable that the temporary differences will not reverse in the foreseeable future. |
| | |
| Deferred tax assets are recognised for all deductible temporary differences, and the carryforward of unused tax credits and any unused tax losses. Deferred tax assets are recognised to the extent that it is probable that taxable profit will be available against which the deductible temporary differences, the carryforward of unused tax credits and unused tax losses can be utilised, except: |
| | |
| • | when the deferred tax asset relating to the deductible temporary differences arises from the initial recognition of an asset or liability in a transaction that is not a business combination and, at the time of the transaction, affects neither the accounting profit nor taxable profit or loss; and |
| | |
| • | in respect of deductible temporary differences associated with investments in subsidiaries, associates and joint ventures, deferred tax assets are only recognised to the extent that it is probable that the temporary differences will reverse in the foreseeable future and taxable profit will be available against which the temporary differences can be utilised. |
| | |
| The carrying amount of deferred tax assets is reviewed at the end of each reporting period and reduced to the extent that it is no longer probable that sufficient taxable profit will be available to allow all or part of the deferred tax asset to be utilised. Unrecognised deferred tax assets are reassessed at the end of each reporting period and are recognised to the extent that it has become probable that sufficient taxable profit will be available to allow all or part of the deferred tax asset to be recovered. Deferred tax assets and liabilities are measured at the tax rates that are expected to apply to the period when the asset is realised or the liability is settled, based on tax rates (and tax laws) that have been enacted or substantively enacted by the end of the reporting period. Deferred tax assets and deferred tax liabilities are offset if and only if the Group has a legally enforceable right to set off current tax assets and current tax liabilities and the deferred tax assets and deferred tax liabilities relate to income taxes levied by the same taxation authority on either the same taxable entity or different taxable entities which intend either to settle current tax liabilities and assets on a net basis, or to realise the assets and settle the liabilities simultaneously, in each future period in which significant amounts of deferred tax liabilities or assets are expected to be settled or recovered. |
AMTD INTERNATIONAL INC.
NOTES TO THE CONSOLIDATED FINANCIAL STATEMENTS (CONTINUED)
FOR THE YEARS ENDED 31 DECEMBER 2017 AND 2018
AND FOR THE NINE MONTHS ENDED 30 SEPTEMBER 2018 AND 2019
| 2.3 | SUMMARY OF SIGNIFICANT ACCOUNTING POLICIES (CONTINUED) |
| | |
| Revenue recognition Revenue from contracts with customers Revenue from contracts with customers is recognised when control of goods or services is transferred to the customers at an amount that reflects the consideration to which the Group expects to be entitled in exchange for those goods or services. When the consideration in a contract includes a variable amount, the amount of consideration is estimated to which the Group will be entitled in exchange for transferring the goods or services to the customer. The variable consideration is estimated at contract inception and constrained until it is highly probable that a significant revenue reversal in the amount of cumulative revenue recognised will not occur when the associated uncertainty with the variable consideration is subsequently resolved. The primary components of fee and commission income are investment banking fee and income and asset management fee. |
| | |
| (a) | Investment banking fee and income Investment banking service income is composed of underwriting commission, brokerage fee and financial advisory fee. Underwriting commission earned from underwriting equity and debt securities is recognised at the point in time when the Group's performance under the terms of a contractual arrangement is completed, which is typically at the closing of a transaction if there is no uncertainty or contingency related to the amount to be paid. The normal credit term is 60 to 120 days upon the completion of performance. Brokerage fee earned from sales of equity and debt securities from underwriting is recognised at the point in time when the associated service is fulfilled, generally on the trade execution date. Financial advisory fee is recognised as advice is provided to the customer, based on the estimated progress of work and when revenue is not probable of a significant reversal. The majority of the contracts have a duration of 60 to 120 days. For investment banking service, each contract contains only one performance obligation. |
| | |
| (b) | Asset management fee Asset management fee primarily includes fees associated with asset management, performance-based incentive fee, brokerage and handling fee. Substantially all of the management fee and the performance-based incentive fee are subject to variable consideration based on the underlying assets under management, i.e. AUM of a customer's account. Management fee is recognised when services are performed and the fee becomes known. Performance-based incentive fee is recognised when the performance target is met and the revenue is not probable of a significant reversal. For the years ended 31 December 2017 and 2018 and for the nine months ended 30 September 2018 and 2019, the Company did not have any revenue related to such variable consideration and recognised from performance obligations satisfied in previous periods. Brokerage and handling fees are recognised at the point in time when the associated service is fulfilled, generally on the trade execution date. For asset management services, when a single contract contains two performance obligations, the stand-alone selling prices of each of the distinct services underlying the performance obligations (i.e. management fee and performance-based incentive fee for asset management service and brokerage and handling fee for transaction processing service) are stated separately in the contract. These are the observable prices of services when the Company sells each of them separately. |
AMTD INTERNATIONAL INC.
NOTES TO THE CONSOLIDATED FINANCIAL STATEMENTS (CONTINUED)
FOR THE YEARS ENDED 31 DECEMBER 2017 AND 2018
AND FOR THE NINE MONTHS ENDED 30 SEPTEMBER 2018 AND 2019
| 2.3 | SUMMARY OF SIGNIFICANT ACCOUNTING POLICIES (CONTINUED) |
| |
| Revenue recognition (continued) Revenue from other sources Fair value changes on financial assets at fair value through profit or loss and stock loan is recognised in the period in which they arise. Gain/loss recognised for the financial assets at fair value through profit or loss disposed during the current period is defined as gain/loss related to disposed investment, whereas gain/loss recognised for those financial assets at fair value through profit or loss in the consolidated statements of financial position held at the end of the reporting period is defined as net fair value changes on financial assets at fair value through profit or loss and stock loan. Dividend income is recognised when the shareholders' right to receive payment has been established, it is probable that the economic benefits associated with the dividend will flow to the Group and the amount of the dividend can be measured reliably. Contract liabilities A contract liability is recognised when the a payment is made received or the a payment is due (whichever is earlier) from a customer before the Group transfers the related goods or services. Contract liabilities are recognised as revenue when the Group performs under the contract (i.e., transfers control of the related goods or services to the customer). From 2018, for certain customers of asset management service, the Company requires upfront payment of management fee and recorded such upfront fee as contract liabilities in other payables and accruals. Upfront fee is recognised as revenue based on the time elapsed for the service period. Asset management contracts normally cover periods of one to three years. Employee benefits Retirement benefit cost The Group operates a defined contribution Mandatory Provident Fund retirement benefit scheme (the "MPF Scheme") under the Mandatory Provident Fund Schemes Ordinance for all of its employees. Contributions are made based on a percentage of the employees' basic salaries and are charged to profit or loss as they become payable in accordance with the rules of the MPF Scheme. The assets of the MPF Scheme are held separately from those of the Group in an independently administered fund. The Group's employer contributions vest fully with the employees when contributed into the MPF Scheme. Foreign currencies These financial statements are presented in Hong Kong dollars, which is the Company's functional currency. Each entity in the Group determines its own functional currency and items included in the financial statements of each entity are measured using that functional currency. Foreign currency transactions recorded by the entities in the Group are initially recorded using their respective functional currency rates prevailing at the dates of the transactions. Monetary assets and liabilities denominated in foreign currencies are translated at the functional currency rates of exchange ruling at the end of the reporting period. Differences arising on settlement or translation of monetary items are recognised in profit or loss. Non-monetary items that are measured in terms of historical cost in a foreign currency are translated using the exchange rates at the dates of the initial transactions. Non-monetary items measured at fair value in a foreign currency are translated using the exchange rates at the date when the fair value was measured. The gain or loss arising on translation of a non-monetary item measured at fair value is treated in line with the recognition of the gain or loss on change in fair value of the item (i.e., translation difference on the item whose fair value gain or loss is recognised in other comprehensive income or profit or loss is also recognised in other comprehensive income or profit or loss, respectively). |
AMTD INTERNATIONAL INC. NOTES TO THE CONSOLIDATED FINANCIAL STATEMENTS (CONTINUED) FOR THE YEARS ENDED 31 DECEMBER 2017 AND 2018 AND FOR THE NINE MONTHS ENDED 30 SEPTEMBER 2018 AND 2019 |
| 2.3 | SUMMARY OF SIGNIFICANT ACCOUNTING POLICIES (CONTINUED) |
| |
| Foreign currencies (continued) In determining the exchange rate on initial recognition of the related asset, expense or income on the derecognition of a non-monetary asset or non-monetary liability relating to an advance consideration, the date of initial transaction is the date on which the Group initially recognises the non-monetary asset or non-monetary liability arising from the advance consideration. If there are multiple payments or receipts in advance, the Group determines the transaction date for each payment or receipt of the advance consideration. |
| |
| 3. | SIGNIFICANT ACCOUNTING ESTIMATES AND JUDGEMENTS |
| |
| The preparation of the Group's financial statements requires management to make judgements, estimates and assumptions that affect the reported amounts of revenues, expenses, assets and liabilities, and their accompanying disclosures, and the disclosure of contingent liabilities. Uncertainty about these assumptions and estimates could result in outcomes that could require a material adjustment to the carrying amounts of the assets or liabilities affected in the future. Judgements In the process of applying the Group's accounting policies, management has made the following judgements, apart from those involving estimations, which have the most significant effect on the amounts recognised in the consolidated financial statements: Income tax Significant judgements on the future tax treatment of certain transactions are required in determining income tax provisions. The Group carefully evaluates tax implications of transactions and tax provisions are recorded accordingly. The tax treatment of such transactions is reconsidered periodically to take into account all changes in tax legislation. Estimation uncertainty The key assumptions concerning the future and other key sources of estimation uncertainty at the end of the reporting period, that have a significant risk of causing a material adjustment to the carrying amounts of assets and liabilities within the next financial year, are described below: Provision for expected credit losses on accounts receivable The Group uses a provision matrix to calculate ECLs for accounts receivable. The provision rates are based on days past due for groupings of various customer segments that have similar loss patterns (i.e., by customer type and reference rating). The provision matrix is initially based on the Group's historical observed default rates. The Group will calibrate the matrix to adjust the historical credit loss experience with forward-looking information. For instance, if forecast economic conditions (i.e., market risk and price risk) are expected to deteriorate over the next year which can lead to an increased number of defaults in the capital markets sector, the historical default rates are adjusted. At each reporting date, the historical observed default rates are updated and changes in the forward-looking estimates are analysed. The assessment of the correlation among historical observed default rates, forecast economic conditions and ECLs is a significant estimate. The amount of ECLs is sensitive to changes in circumstances and forecast economic conditions. The Group's historical credit loss experience and forecast of economic conditions may also not be representative of customer's actual default in the future. The information about the ECLs on the Group's accounts receivable is disclosed in Note 11 and Note 27 to the consolidated financial statements. |
AMTD INTERNATIONAL INC.
NOTES TO THE CONSOLIDATED FINANCIAL STATEMENTS (CONTINUED)
FOR THE YEARS ENDED 31 DECEMBER 2017 AND 2018
AND FOR THE NINE MONTHS ENDED 30 SEPTEMBER 2018 AND 2019
| 3. | SIGNIFICANT ACCOUNTING ESTIMATES AND JUDGEMENTS (CONTINUED) |
| |
| Estimation uncertainty (continued) Fair value of unlisted debt securities and unlisted equity investments As at 31 December 2018 and 30 September 2019, the fair values of unlisted debt and equity investments-Investment C (Note 13) and Investment E were based on the prices of recent transactions of the same instruments with the same rights of the same issuers that occurred within 12 months without adjustment. The valuation relies on management’s judgement about whether there have been any events occurred from the date of last transaction and the year end that could significantly affect the prices. As at 31 December 2017, the fair value of unlisted equity investment-Investment D (Note 13) was based on the prices of recent transactions occured within 12 months without adjustment. As at 31 December 2018, the fair value of unlisted equity investment-Investment D has been estimated using an equity value allocation (“EVA”) valuation technique based on assumptions that are supported by observable recent transactions with similar risk characteristics. The valuation requires management to estimate the expected equity volatility and hence they are subject to uncertainty. As at 30 September 2019, the fair value of the unlisted equity investment-Investment D was estimated using an EVA valuation technique relying on the hybrid method, considering two scenarios in a probability weighted expected return method (“PWERM”) framework, and using the option pricing method (“OPM”) to allocate value in one of the scenarios. The valuation requires the management to consider two scenarios in its PWERM analysis which was non-IPO exit event and IPO exit event and hence they were subject to uncertainty. The input of the equity value of unlisted equity investment-Investment D was estimated using market approach. The Group classifies the fair value of these investments as Level 3. Fair value of warrants The fair value of the warrants was estimated using binomial option pricing model which requires the management to estimate volatility of the fair value of the equity securities. The Group classifies the fair value of warrants as Level 3. Fair value of derivative financial instrument The fair value of the derivative financial instrument was estimated using the Monte Carlo Simulation (“MCS”) and was determined based on significant observable and unobservable inputs including the current stock price, dividend yield, risk-free rate, volatility of the underlying equity securities and the credit rating of the counterparty on the valuation date. MCS is a financial model that is commonly used to simulate variables that are highly unpredictable. The valuations performed using the MCS require management to estimate the volatility of the underlying equity securities and the credit rating of the counterparty and hence the valuations are subject to estimation uncertainty. The Group classifies the fair value of derivative financial instrument as Level 3. |
AMTD INTERNATIONAL INC.
NOTES TO THE CONSOLIDATED FINANCIAL STATEMENTS (CONTINUED)
FOR THE YEARS ENDED 31 DECEMBER 2017 AND 2018
AND FOR THE NINE MONTHS ENDED 30 SEPTEMBER 2018 AND 2019
| 4. | OPERATING SEGMENT INFORMATION |
| | |
| For management purposes, the Group is organised into business units based on their products and services and has three reportable operating segments as follows: |
| | |
| (a) | The investment banking segment assists customers in raising funds through equity and debt financing, providing underwriting for initial public offerings ("IPOs"), private placements and debt issuances and providing financial advisory services (including but not limited to domestic and cross border advisory services for merger and acquisitions). |
| | |
| (b) | The asset management segment provides a wide range of asset management products and services, including in relation to listed equity, fixed income securities, hedge funds, structured products, foreign exchange, private equities, alternative investments, discretionary account services, investment advisory services and external asset management services. |
| | |
| (c) | The strategic investment segment engages in proprietary investments and management of investment portfolio mainly focuses on financial services and asset classes in Hong Kong and China. |
| | |
| Management monitors the results of the Group's operating segments separately for the purpose of making decisions about resources allocation and performance assessment. Segment performance is evaluated based on reportable segment result, which is a measure of adjusted profit/loss before tax from operations. The adjusted result before tax from operations is measured after allocation of controllable costs of specialized staff, commission paid to asset management segment and finance costs to strategic investment segment consistently with the Group's profit before tax from operations. Other corporate income and expenses such as staff costs not directly attributable to segment, office rental and administrative expenses are excluded from such measurement. Segment assets exclude property, plant and equipment, tax recoverable, amounts due from fellow subsidiaries and immediate holding company, prepayments, other receivables and other assets, cash and bank balances and other unallocated head office and corporate assets as these assets are managed on a group basis. Segment liabilities exclude amounts due to fellow subsidiaries and immediate holding company, tax payable, deferred tax liabilities and other unallocated head office and corporate liabilities as these liabilities are managed on a group basis. |
AMTD INTERNATIONAL INC.
NOTES TO THE CONSOLIDATED FINANCIAL STATEMENTS (CONTINUED)
FOR THE YEARS ENDED 31 DECEMBER 2017 AND 2018
AND FOR THE NINE MONTHS ENDED 30 SEPTEMBER 2018 AND 2019
| 4. | OPERATING SEGMENT INFORMATION (CONTINUED) |
| |
| Segment revenue and results |
| |
| Year ended 31 December 2017 |
| | | Investment | | | Asset | | | Strategic | | | | |
| | | banking | | | management | | | investment | | | Total | |
| | | HK$ | | | HK$ | | | HK$ | | | HK$ | |
Segment revenue (Note 5) | | | | | | | | | | | | | |
Revenue | | | | | | | | | | | | | |
| —from external customers | | | | 208,162,829 | | | | 70,813,374 | | | | — | | | | 278,976,203 | |
| —others | | | | — | | | | — | | | | 754,187,550 | | | | 754,187,550 | |
| | | | | | | | | | | | | | | | 1,033,163,753 | |
| | | | | | | | | | | | | | | | | |
Segment results | | | | 197,333,389 | | | | 48,059,488 | | | | 739,674,246 | | | | 985,067,123 | |
Other income | | | | | | | | | | | | | | | | 17,674,605 | |
Unallocated finance costs | | | | | | | | | | | | | | | | (15,285,311 | ) |
Corporate and other unallocated expenses | | | | | | | | | | | | | | | | (178,870,946 | ) |
Profit before tax | | | | | | | | | | | | | | | | 808,585,471 | |
Other segment information | | | | | | | | | | | | | | | | | |
Depreciation | | | | | | | | | | | | | | | | 379,132 | |
Capital expenditure* | | | | | | | | | | | | | | | | 138,704 | |
| * | Capital expenditure consists of additions of property, plant and equipment. |
AMTD INTERNATIONAL INC.
NOTES TO THE CONSOLIDATED FINANCIAL STATEMENTS (CONTINUED)
FOR THE YEARS ENDED 31 DECEMBER 2017 AND 2018
AND FOR THE NINE MONTHS ENDED 30 SEPTEMBER 2018 AND 2019
| 4. | OPERATING SEGMENT INFORMATION (CONTINUED) |
| |
| Segment revenue and results (continued) Year ended 31 December 2018 |
| | | Investment | | | Asset | | | Strategic | | | | |
| | | banking | | | management | | | investment | | | Total | |
| | | HK$ | | | HK$ | | | HK$ | | | HK$ | |
Segment revenue (Note 5) | | | | | | | | | | | | | |
Revenue | | | | | | | | | | | | | |
| —from external customers | | | | 288,591,129 | | | | 78,946,986 | | | | — | | | | 367,538,115 | |
| —others | | | | — | | | | — | | | | 355,688,019 | | | | 355,688,019 | |
Intersegment | | | | — | | | | 172,809 | | | | — | | | | 172,809 | |
| | | | 288,591,129 | | | | 79,119,795 | | | | 355,688,019 | | | | 723,398,943 | |
| | | | | | | | | | | | | | | | | |
Reconciliation | | | | | | | | | | | | | | | | | |
Intersegment | | | | | | | | | | | | | | | | (172,809 | ) |
| | | | | | | | | | | | | | | | 723,226,134 | |
| | | | | | | | | | | | | | | | | |
Segment results | | | | 254,901,096 | | | | 57,385,943 | | | | 350,306,996 | | | | 662,594,035 | |
Other income | | | | | | | | | | | | | | | | 15,372,350 | |
Unallocated finance costs | | | | | | | | | | | | | | | | (3,666,040 | ) |
Corporate and other unallocated expenses | | | | | | | | | | | | | | | | (65,335,119 | ) |
Profit before tax | | | | | | | | | | | | | | | | 608,965,226 | |
Other segment information | | | | | | | | | | | | | | | | | |
Depreciation | | | | | | | | | | | | | | | | 334,841 | |
Capital expenditure* | | | | | | | | | | | | | | | | 14,214 | |
| * | Capital expenditure consists of additions of property, plant and equipment. |
AMTD INTERNATIONAL INC.
NOTES TO THE CONSOLIDATED FINANCIAL STATEMENTS (CONTINUED)
FOR THE YEARS ENDED 31 DECEMBER 2017 AND 2018
AND FOR THE NINE MONTHS ENDED 30 SEPTEMBER 2018 AND 2019
| 4. | OPERATING SEGMENT INFORMATION (CONTINUED) |
| |
| Segment revenue and results (continued) |
| |
| Nine months ended 30 September 2019 |
| | | Investment | | | Asset | | | Strategic | | | | |
| | | banking | | | management | | | investment | | | Total | |
| | | HK$ | | | HK$ | | | HK$ | | | HK$ | |
Segment revenue (Note 5) | | | | | | | | | | | | | |
Revenue | | | | | | | | | | | | | |
| —from external customers | | | | 330,617,139 | | | | 91,435,377 | | | | — | | | | 422,052,516 | |
| —others | | | | — | | | | — | | | | 619,955,598 | | | | 619,955,598 | |
| | | | | 330,617,139 | | | | 91,435,377 | | | | 619,955,598 | | | | 1,042,008,114 | |
| | | | | | | | | | | | | | | | | | |
Segment results | | | | 310,423,771 | | | | 78,653,485 | | | | 603,793,556 | | | | 992,870,812 | |
| | | | | | | | | | | | | | | | | | |
Other income | | | | | | | | | | | | | | | | 7,466,148 | |
Corporate and other unallocated expenses | | | | | | | | | | | | | | | | (119,263,730 | ) |
Profit before tax | | | | | | | | | | | | | | | | 881,073,230 | |
Other segment information | | | | | | | | | | | | | | | | | |
Depreciation | | | | | | | | | | | | | | | | 99,479 | |
Capital expenditure* | | | | | | | | | | | | | | | | 13,710 | |
| * | Capital expenditure consists of additions to property, plant and equipment. |
AMTD INTERNATIONAL INC.
NOTES TO THE CONSOLIDATED FINANCIAL STATEMENTS (CONTINUED)
FOR THE YEARS ENDED 31 DECEMBER 2017 AND 2018
AND FOR THE NINE MONTHS ENDED 30 SEPTEMBER 2018 AND 2019
| 4. | OPERATING SEGMENT INFORMATION (CONTINUED) |
| |
| Segment revenue and results (continued) |
| |
| Nine months ended 30 September 2018 |
| | | Investment | | | Asset | | | Strategic | | | | |
| | | banking | | | management | | | investment | | | Total | |
| | | HK$ | | | HK$ | | | HK$ | | | HK$ | |
| | | (Unaudited) | | | (Unaudited) | | | (Unaudited) | | | (Unaudited) | |
Segment revenue (Note 5) | | | | | | | | | | | | | |
Revenue | | | | | | | | | | | | | |
| —from external customers | | | | 182,342,155 | | | | 64,280,714 | | | | — | | | | 246,622,869 | |
| —others | | | | — | | | | — | | | | (389,662,996 | ) | | | (389,662,996 | ) |
Intersegment | | | | — | | | | 172,809 | | | | — | | | | 172,809 | |
| | | | | 182,342,155 | | | | 64,453,523 | | | | (389,662,996 | ) | | | (142,867,318 | ) |
| | | | | | | | | | | | | | | | | | |
Reconciliation | | | | | | | | | | | | | | | | | |
Intersegment | | | | | | | | | | | | | | | | (172,809 | ) |
| | | | | | | | | | | | | | | | | (143,040,127 | ) |
| | | | | | | | | | | | | | | | | | |
Segment results | | | | 157,789,775 | | | | 47,551,801 | | | | (392,543,456 | ) | | | (187,201,880 | ) |
| | | | | | | | | | | | | | | | | | |
Other income | | | | | | | | | | | | | | | | 15,367,411 | |
Unallocated finance costs | | | | | | | | | | | | | | | | (3,666,040 | ) |
Corporate and other unallocated expenses | | | | | | | | | | | | | | | | (66,717,873 | ) |
Loss before tax | | | | | | | | | | | | | | | | (242,218,382 | ) |
Other segment information | | | | | | | | | | | | | | | | | |
Depreciation | | | | | | | | | | | | | | | | 267,309 | |
Capital expenditure* | | | | | | | | | | | | | | | | 14,214 | |
| * | Capital expenditure consists of additions to property, plant and equipment. |
AMTD INTERNATIONAL INC.
NOTES TO THE CONSOLIDATED FINANCIAL STATEMENTS (CONTINUED)
FOR THE YEARS ENDED 31 DECEMBER 2017 AND 2018
AND FOR THE NINE MONTHS ENDED 30 SEPTEMBER 2018 AND 2019
| 4. | OPERATING SEGMENT INFORMATION (CONTINUED) |
| |
| Segment assets and liabilities |
| | 31 December | | | 30 September | |
| | 2017 | | | 2018 | | | 2019 | |
| | HK$ | | | HK$ | | | HK$ | |
| | | | | | | | | |
Segment assets | | | | | | | | | |
Investment banking | | | 69,555,369 | | | | 134,855,898 | | | | 117,112,006 | |
Asset management | | | 443,470,928 | | | | 712,011,344 | | | | 491,589,546 | |
Strategic investments | | | 2,948,769,400 | | | | 3,494,527,773 | | | | 3,934,685,779 | |
Total segment assets | | | 3,461,795,697 | | | | 4,341,395,015 | | | | 4,543,387,331 | |
Unallocated corporate assets | | | 2,579,821,455 | | | | 2,765,794,535 | | | | 2,543,347,636 | |
Total assets | | | 6,041,617,152 | | | | 7,107,189,550 | | | | 7,086,734,967 | |
| | | | | | | | | | | | |
Segment liabilities | | | | | | | | | | | | |
Investment banking | | | — | | | | 15,000,000 | | | | 11,250,000 | |
Asset management | | | 393,269,077 | | | | 663,698,964 | | | | 426,407,124 | |
Strategic investments | | | 351,609,630 | | | | 321,999,549 | | | | 321,775,552 | |
Total segment liabilities | | | 744,878,707 | | | | 1,000,698,513 | | | | 759,432,676 | |
Unallocated corporate liabilities | | | 2,627,461,975 | | | | 2,912,088,937 | | | | 370,762,649 | |
Total liabilities | | | 3,372,340,682 | | | | 3,912,787,450 | | | | 1,130,195,325 | |
| The unallocated segment assets and liabilities mainly consist of amounts due from and due to related companies, respectively, which are not directly attributable to individual segments. Geographical information The following table sets forth the Group’s revenue from external customers by geographical areas based on the location of the customers: Year ended 31 December 2017 |
| | Investment | | | Asset | | | | |
| | banking | | | management | | | Total | |
| | HK$ | | | HK$ | | | HK$ | |
Hong Kong | | | 70,332,752 | | | | 11,352,777 | | | | 81,685,529 | |
Mainland China | | | 137,830,077 | | | | 53,184,060 | | | | 191,014,137 | |
Others | | | — | | | | 6,276,537 | | | | 6,276,537 | |
| | | 208,162,829 | | | | 70,813,374 | | | | 278,976,203 | |
AMTD INTERNATIONAL INC.
NOTES TO THE CONSOLIDATED FINANCIAL STATEMENTS (CONTINUED)
FOR THE YEARS ENDED 31 DECEMBER 2017 AND 2018
AND FOR THE NINE MONTHS ENDED 30 SEPTEMBER 2018 AND 2019
| 4. | OPERATING SEGMENT INFORMATION (CONTINUED) |
| |
| Geographical information (continued) Year ended 31 December 2018 |
| | Investment | | | Asset | | | | |
| | banking | | | management | | | Total | |
| | HK$ | | | HK$ | | | HK$ | |
Hong Kong | | | 128,880,466 | | | | 39,451,207 | | | | 168,331,673 | |
Mainland China | | | 158,780,244 | | | | 36,615,872 | | | | 195,396,116 | |
Others | | | 930,419 | | | | 2,879,907 | | | | 3,810,326 | |
| | | 288,591,129 | | | | 78,946,986 | | | | 367,538,115 | |
| | | | | | | | | | | | |
Nine months ended 30 September 2019 | | | | | | | | | | | | |
| | | | | | | | | | | | |
| | Investment | | | Asset | | | | | |
| | banking | | | management | | | Total | |
| | HK$ | | | HK$ | | | HK$ | |
| | | | | | | | | | | | |
Hong Kong | | | 109,689,692 | | | | 26,481,786 | | | | 136,171,478 | |
Mainland China | | | 183,136,933 | | | | 58,136,906 | | | | 241,273,839 | |
United States | | | 30,342,514 | | | | 2,154,684 | | | | 32,497,198 | |
Others | | | 7,448,000 | | | | 4,662,001 | | | | 12,110,001 | |
| | | 330,617,139 | | | | 91,435,377 | | | | 422,052,516 | |
| | | | | | | | | | | | |
Nine months ended 30 September 2018 | | | | | | | | | | | | |
| | | | | | | | | | | | |
| | Investment | | | Asset | | | | | |
| | banking | | | management | | | Total | |
| | HK$ | | | HK$ | | | HK$ | |
| | (Unaudited) | | | (Unaudited) | | | (Unaudited) | |
| | | | | | | | | | | | |
Hong Kong | | | 128,233,538 | | | | 34,425,300 | | | | 162,658,838 | |
Mainland China | | | 53,178,199 | | | | 27,649,208 | | | | 80,827,407 | |
Others | | | 930,418 | | | | 2,206,206 | | | | 3,136,624 | |
| | | 182,342,155 | | | | 64,280,714 | | | | 246,622,869 | |
| The Group’s revenue is derived solely from its operations in Hong Kong based on the location in which contracts were executed and services were rendered. |
| |
| As at 31 December 2017 and 2018 and 30 September 2019, non-current assets, for the purpose of geographical information, consisting of property, plant and equipment and intangible assets, were all located in Hong Kong. |
| |
| Information about a major customer |
| |
| During the years ended 31 December 2017 and 2018 and the nine months ended 30 September 2018 and 2019, no revenue derived from a single external customer accounted for 10% or more of the total revenue of the Group. |
AMTD INTERNATIONAL INC.
NOTES TO THE CONSOLIDATED FINANCIAL STATEMENTS (CONTINUED)
FOR THE YEARS ENDED 31 DECEMBER 2017 AND 2018
AND FOR THE NINE MONTHS ENDED 30 SEPTEMBER 2018 AND 2019
| 5. | REVENUE AND OTHER INCOME |
| An analysis of revenue is as follows: |
| | Year ended 31 December | | | Nine months ended 30 September | |
| | 2017 | | | 2018 | | | 2018 | | | 2019 | |
| | HK$ | | | HK$ | | | HK$ | | | HK$ | |
| | | | | | | | (Unaudited) | | | | |
Revenue from contracts with customers | | | | | | | | | | | | |
Investment banking | | | | | | | | | | | | |
Investment banking fee and income | | | 208,162,829 | | | | 288,591,129 | | | | 182,342,155 | | | | 330,617,139 | |
Asset management | | | | | | | | | | | | | | | | |
Management fee and performance-based incentive fee | | | 47,774,685 | | | | 43,465,186 | | | | 30,249,000 | | | | 74,161,842 | |
Brokerage and handling fees | | | 16,270,055 | | | | 31,393,570 | | | | 30,198,057 | | | | 16,419,386 | |
Others | | | 6,768,634 | | | | 4,088,230 | | | | 3,833,657 | | | | 854,149 | |
| | | 70,813,374 | | | | 78,946,986 | | | | 64,280,714 | | | | 91,435,377 | |
| | | 278,976,203 | | | | 367,538,115 | | | | 246,622,869 | | | | 422,052,516 | |
Revenue from other sources | | | | | | | | | | | | | | | | |
Strategic investment | | | | | | | | | | | | | | | | |
Dividend income | | | 22,564,600 | | | | 99,227,724 | | | | 99,227,724 | | | | 92,316,548 | |
Gain related to disposed investment | | | 46,943,698 | | | | — | | | | — | | | | 8,235,180 | |
| | | 69,508,298 | | | | 99,227,724 | | | | 99,227,724 | | | | 100,551,728 | |
Net fair value changes on financial assets at fair value through profit or loss and stock loan | | | | | | | | | | | | | | | | |
-from listed equity shares, at quoted price | | | 684,660,652 | | | | 202,304,000 | | | | (526,358,000 | ) | | | (325,458,000 | ) |
-from unlisted debt securities | | | — | | | | 86,000 | | | | — | | | | — | |
-from unlisted equity shares | | | 18,600 | | | | 54,070,295 | | | | 37,467,280 | | | | 37,243,870 | |
Total net fair value changes on financial assets at fair value through profit or loss and stock loan | | | 684,679,252 | | | | 256,460,295 | | | | (488,890,720 | ) | | | (288,214,130 | ) |
| | | | | | | | | | | | | | | | |
Net fair value changes on derivative financial instrument | | | | | | | | | | | | | | | | |
-from derivative financial instrument | | | — | | | | — | | | | — | | | | 807,618,000 | |
| | | — | | | | — | | | | — | | | | 807,618,000 | |
| | | | | | | | | | | | | | | | |
| | | 1,033,163,753 | | | | 723,226,134 | | | | (143,040,127 | ) | | | 1,042,008,114 | |
AMTD INTERNATIONAL INC.
NOTES TO THE CONSOLIDATED FINANCIAL STATEMENTS (CONTINUED)
FOR THE YEARS ENDED 31 DECEMBER 2017 AND 2018
AND FOR THE NINE MONTHS ENDED 30 SEPTEMBER 2018 AND 2019
| 5. | REVENUE AND OTHER INCOME (CONTINUED) |
| (i) | Disaggregated revenue information |
| | |
| | The Company assesses revenues based upon the nature or type of goods or services it provides and the operating segments of the related businesses. For more information on the operating segments, see Note 4, ''Operating Segment Information''. The following tables present disaggregated revenue information: |
| | |
| | Year ended 31 December 2017 |
| | Investment | | | Asset | | | Strategic | | | | |
Segments | | banking | | | management | | | investment | | | Total | |
| | HK$ | | | HK$ | | | HK$ | | | HK$ | |
Investment banking | | | | | | | | | | | | |
Underwriting commission and | | | | | | | | | | | | |
brokerage fee | | | 150,649,829 | | | | — | | | | — | | | | 150,649,829 | |
Financial advisory fee | | | 57,513,000 | | | | — | | | | — | | | | 57,513,000 | |
| | | | | | | | | | | | | | | | |
Asset management | | | | | | | | | | | | | | | | |
Management fee and performance | | | | | | | | | | | | | | | | |
-based incentive fee | | | — | | | | 47,774,685 | | | | — | | | | 47,774,685 | |
Brokerage and handling fee | | | — | | | | 16,270,055 | | | | — | | | | 16,270,055 | |
| | | | | | | | | | | | | | | | |
Strategic investment | | | | | | | | | | | | | | | | |
Net fair value changes on financial assets | | | | | | | | | | | | | | | | |
at fair value through profit or loss and | | | | | | | | | | | | | | | | |
stock loan | | | — | | | | — | | | | 684,679,252 | | | | 684,679,252 | |
Gain related to disposed investment | | | — | | | | — | | | | 46,943,698 | | | | 46,943,698 | |
Dividend income | | | — | | | | — | | | | 22,564,600 | | | | 22,564,600 | |
| | | | | | | | | | | | | | | | |
Others | | | — | | | | 6,768,634 | | | | — | | | | 6,768,634 | |
Total | | | 208,162,829 | | | | 70,813,374 | | | | 754,187,550 | | | | 1,033,163,753 | |
| | | | | | | | | | | | | | | | |
| | | | | | Investment | | | Asset | | | | | |
Segments | | | | | | banking | | | management | | | Total | |
| | | | | | HK$ | | | HK$ | | | HK$ | |
| | | | | | | | | | | | | | | | |
Timing of revenue recognition | | | | | | | | | | | | | | | | |
Services transferred at a point in time | | | | | | | 150,649,829 | | | | 23,038,689 | | | | 173,688,518 | |
Services transferred over time | | | | | | | 57,513,000 | | | | 47,774,685 | | | | 105,287,685 | |
Total revenue from contracts with customers | | | | | | | 208,162,829 | | | | 70,813,374 | | | | 278,976,203 | |
AMTD INTERNATIONAL INC.
NOTES TO THE CONSOLIDATED FINANCIAL STATEMENTS (CONTINUED)
FOR THE YEARS ENDED 31 DECEMBER 2017 AND 2018
AND FOR THE NINE MONTHS ENDED 30 SEPTEMBER 2018 AND 2019
| 5. | REVENUE AND OTHER INCOME (CONTINUED) |
| |
| (i) | Disaggregated revenue information (continued) |
| | |
| Year ended 31 December 2018 |
| | Investment | | | Asset | | | Strategic | | | | |
Segments | | banking | | | management | | | investment | | | Total | |
| | HK$ | | | HK$ | | | HK$ | | | HK$ | |
| | | | | | | | | | | | |
Investment banking | | | | | | | | | | | | |
Underwriting commission and | | | | | | | | | | | | |
brokerage fee | | | 217,002,789 | | | | — | | | | — | | | | 217,002,789 | |
Financial advisory fee | | | 71,588,340 | | | | — | | | | — | | | | 71,588,340 | |
| | | | | | | | | | | | | | | | |
Asset management | | | | | | | | | | | | | | | | |
Management fee and performance | | | | | | | | | | | | | | | | |
-based incentive fee | | | — | | | | 43,465,186 | | | | — | | | | 43,465,186 | |
Brokerage and handling fee | | | — | | | | 31,393,570 | | | | — | | | | 31,393,570 | |
| | | | | | | | | | | | | | | | |
Strategic investment | | | | | | | | | | | | | | | | |
Net fair value changes on financial assets | | | | | | | | | | | | | | | | |
at fair value through profit or loss and | | | | | | | | | | | | | | | | |
stock loan | | | — | | | | — | | | | 256,460,295 | | | | 256,460,295 | |
Dividend income | | | — | | | | — | | | | 99,227,724 | | | | 99,227,724 | |
| | | | | | | | | | | | | | | | |
Others | | | — | | | | 4,088,230 | | | | — | | | | 4,088,230 | |
Total | | | 288,591,129 | | | | 78,946,986 | | | | 355,688,019 | | | | 723,226,134 | |
| | | | | | | | | | | | | | | | |
| | | | | | Investment | | | Asset | | | | | |
Segments | | | | | | banking | | | management | | | Total | |
| | | | | | HK$ | | | HK$ | | | HK$ | |
| | | | | | | | | | | | | | | | |
Timing of revenue recognition | | | | | | | | | | | | | | | | |
Services transferred at a point in time | | | | | | | 217,002,789 | | | | 35,481,800 | | | | 252,484,589 | |
Services transferred over time | | | | | | | 71,588,340 | | | | 43,465,186 | | | | 115,053,526 | |
Total revenue from contracts with customers | | | | | | | 288,591,129 | | | | 78,946,986 | | | | 367,538,115 | |
AMTD INTERNATIONAL INC.
NOTES TO THE CONSOLIDATED FINANCIAL STATEMENTS (CONTINUED)
FOR THE YEARS ENDED 31 DECEMBER 2017 AND 2018
AND FOR THE NINE MONTHS ENDED 30 SEPTEMBER 2018 AND 2019
| 5. | REVENUE AND OTHER INCOME (CONTINUED) |
| |
| (i) | Disaggregated revenue information (continued) |
| |
| Nine months ended 30 September 2019 |
| | Investment | | | Asset | | | Strategic | | | | |
Segments | | banking | | | management | | | investment | | | Total | |
| | HK$ | | | HK$ | | | HK$ | | | HK$ | |
| | | | | | | | | | | | |
Investment banking | | | | | | | | | | | | |
Underwriting commission and brokerage | | | 278,235,139 | | | | — | | | | — | | | | 278,235,139 | |
Financial advisory fee | | | 52,382,000 | | | | — | | | | — | | | | 52,382,000 | |
| | | | | | | | | | | | | | | | |
Asset management | | | | | | | | | | | | | | | | |
Management fee and performance- | | | | | | | | | | | | | | | | |
based incentive fee | | | — | | | | 74,161,842 | | | | — | | | | 74,161,842 | |
| | | | | | | | | | | | | | | | |
Brokerage and handling fees | | | — | | | | 16,419,386 | | | | — | | | | 16,419,386 | |
| | | | | | | | | | | | | | | | |
Strategic investment | | | | | | | | | | | | | | | | |
Net fair value changes on financial assets | | | | | | | | | | | | | | | | |
at fair value through profit or loss and | | | | | | | | | | | | | | | | |
stock loan | | | — | | | | — | | | | (288,214,130 | ) | | | (288,214,130 | ) |
Net fair value changes on derivative | | | | | | | | | | | | | | | | |
financial instruments | | | — | | | | — | | | | 807,618,000 | | | | 807,618,000 | |
Gain related to disposed investment | | | — | | | | — | | | | 8,235,180 | | | | 8,235,180 | |
Dividend income | | | — | | | | — | | | | 92,316,548 | | | | 92,316,548 | |
| | | | | | | | | | | | | | | | |
Others | | | — | | | | 854,149 | | | | — | | | | 854,149 | |
| | | | | | | | | | | | | | | | |
Total | | | 330,617,139 | | | | 91,435,377 | | | | 619,955,598 | | | | 1,042,008,114 | |
| | | | | | | | | | | | | | | | |
| | | | | | Investment | | | Asset | | | | | |
Segments | | | | | | banking | | | management | | | Total | |
| | | | | | HK$ | | | HK$ | | | HK$ | |
| | | | | | | | | | | | | | | | |
Timing of revenue recognition | | | | | | | | | | | | | | | | |
Services transferred at a point in time | | | | | | | 278,235,139 | | | | 17,273,535 | | | | 295,508,674 | |
Services transferred over time | | | | | | | 52,382,000 | | | | 74,161,842 | | | | 126,543,842 | |
Total revenue from contracts with customers | | | | | | | 330,617,139 | | | | 91,435,377 | | | | 422,052,516 | |
AMTD INTERNATIONAL INC.
NOTES TO THE CONSOLIDATED FINANCIAL STATEMENTS (CONTINUED)
FOR THE YEARS ENDED 31 DECEMBER 2017 AND 2018
AND FOR THE NINE MONTHS ENDED 30 SEPTEMBER 2018 AND 2019
| 5. | REVENUE AND OTHER INCOME (CONTINUED) |
| |
| (i) | Disaggregated revenue information (continued) |
| | |
| Nine months ended 30 September 2018 |
| | Investment | | | Asset | | | Strategic | | | | |
Segments | | banking | | | management | | | investment | | | Total | |
| | HK$ | | | HK$ | | | HK$ | | | HK$ | |
| | (Unaudited) | | | (Unaudited) | | | (Unaudited) | | | (Unaudited) | |
| | | | | | | | | | | | |
Investment banking | | | | | | | | | | | | |
Underwriting commission and brokerage | | | 111,353,815 | | | | — | | | | — | | | | 111,353,815 | |
Financial advisory fee | | | 70,988,340 | | | | — | | | | — | | | | 70,988,340 | |
| | | | | | | | | | | | | | | | |
Asset management | | | | | | | | | | | | | | | | |
Management fee and performance- | | | | | | | | | | | | | | | | |
based incentive fee | | | — | | | | 30,249,000 | | | | — | | | | 30,249,000 | |
| | | | | | | | | | | | | | | | |
Brokerage and handling fees | | | — | | | | 30,198,057 | | | | — | | | | 30,198,057 | |
| | | | | | | | | | | | | | | | |
Strategic investment | | | | | | | | | | | | | | | | |
Net fair value changes on financial assets | | | | | | | | | | | | | | | | |
at fair value through profit or loss and | | | | | | | | | | | | | | | | |
stock loan | | | — | | | | — | | | | (488,890,720 | ) | | | (488,890,720 | ) |
Dividend income | | | — | | | | — | | | | 99,227,724 | | | | 99,227,724 | |
| | | | | | | | | | | | | | | | |
Others | | | — | | | | 3,833,657 | | | | — | | | | 3,833,657 | |
Total | | | 182,342,155 | | | | 64,280,714 | | | | (389,662,996 | ) | | | (143,040,127 | ) |
| | | | | | | | | | | | | | | | |
| | | | | | Investment | | | Asset | | | | | |
Segments | | | | | | banking | | | management | | | Total | |
| | | | | | HK$ | | | HK$ | | | HK$ | |
| | | | | | (Unaudited) | | | (Unaudited) | | | (Unaudited) | |
| | | | | | | | | | | | | | | | |
Timing of revenue recognition | | | | | | | | | | | | | | | | |
Services transferred at a point in time | | | | | | | 111,353,815 | | | | 34,031,714 | | | | 145,385,529 | |
Services transferred over time | | | | | | | 70,988,340 | | | | 30,249,000 | | | | 101,237,340 | |
Total revenue from contracts with customers | | | | | | | 182,342,155 | | | | 64,280,714 | | | | 246,622,869 | |
AMTD INTERNATIONAL INC.
NOTES TO THE CONSOLIDATED FINANCIAL STATEMENTS (CONTINUED)
FOR THE YEARS ENDED 31 DECEMBER 2017 AND 2018
AND FOR THE NINE MONTHS ENDED 30 SEPTEMBER 2018 AND 2019
5. | REVENUE AND OTHER INCOME (CONTINUED) |
| (ii) | Performance obligations |
| The Company started to receive advances from its customers of asset management in 2018. The transaction prices allocated to the remaining performance obligations (unsatisfied or partially unsatisfied) as at 31 December 2018 and 30 September 2019 are as follows: |
| | 31 December | | | 30 September | |
| | 2018 | | | 2019 | |
| | HK$ | | | HK$ | |
| | | | | | |
Within one year | | | 37,165,868 | | | | 73,779,383 | |
More than one year | | | 17,945,950 | | | | 41,723,451 | |
| | | 55,111,818 | | | | 115,502,834 | |
| The remaining performance obligations expected to be recognised in more than one year relate to upfront fee that are to be satisfied within two years. All the other remaining performance obligations are expected to be recognised within one year. |
| |
| Other income |
| | Year ended 31 December | | | Nine months ended 30 September | |
| | 2017 | | | 2018 | | | 2018 | | | 2019 | |
| | HK$ | | | HK$ | | | HK$ | | | HK$ | |
| | | | | | | | (Unaudited) | | | | |
| | | | | | | | | | | | |
Bank interest income | | | 158,863 | | | | 7,681 | | | | 2,127 | | | | 737,426 | |
Interest income from the immediate holding company (Note 24(b)(i)) | | | — | | | | — | | | | — | | | | 5,895,878 | |
Other income from a fellow subsidiary (Note 24(b)(iv)) | | | 15,285,311 | | | | 3,666,040 | | | | 3,666,040 | | | | — | |
Management fee income from a fellow subsidiary | | | 2,231,559 | | | | — | | | | — | | | | — | |
Others | | | 238,433 | | | | 11,719,054 | | | | 11,718,962 | | | | 832,844 | |
| | | 17,914,166 | | | | 15,392,775 | | | | 15,387,129 | | | | 7,466,148 | |
AMTD INTERNATIONAL INC.
NOTES TO THE CONSOLIDATED FINANCIAL STATEMENTS (CONTINUED)
FOR THE YEARS ENDED 31 DECEMBER 2017 AND 2018
AND FOR THE NINE MONTHS ENDED 30 SEPTEMBER 2018 AND 2019
6. | OPERATING EXPENSES/(INCOME), NET |
| |
| Operating expenses and foreign exchange differences included in the consolidated statement of profit or loss and other comprehensive income are as follows: |
| | Year ended 31 December | | | Nine months ended 30 September | |
| | 2017 | | | 2018 | | | 2018 | | | 2019 | |
| | HK$ | | | HK$ | | | HK$ | | | HK$ | |
| | | | | | | | (Unaudited) | | | | |
| | | | | | | | | | | | |
Operating expenses | | | | | | | | | | | | |
Marketing and brand promotional expenses | | | 26,207,524 | | | | 11,864,097 | | | | 14,694,557 | | | | 10,677,201 | |
| | | | | | | | | | | | | | | | |
Premises costs and office utilities | | | | | | | | | | | | | | | | |
—Premises costs | | | 18,361,737 | | | | 9,465,094 | | | | 7,821,074 | | | | 8,422,847 | |
—Office utilities | | | 7,421,124 | | | | 6,117,640 | | | | 6,212,803 | | | | 7,461,439 | |
| | | 25,782,861 | | | | 15,582,734 | | | | 14,033,877 | | | | 15,884,286 | |
Traveling and business development expenses | | | 18,460,191 | | | | 10,860,318 | | | | 6,653,571 | | | | 10,083,324 | |
Commissions and bank charges | | | 7,978,311 | | | | 5,197,984 | | | | 2,944,456 | | | | 6,690,988 | |
Office renovation and maintenance expenses | | | 15,880,216 | | | | 1,603,484 | | | | 1,957,100 | | | | 1,325,184 | |
Administrative service fee | | | — | | | | — | | | | — | | | | 6,000,000 | |
| | | | | | | | | | | | | | | | |
Legal and professional fees | | | | | | | | | | | | | | | | |
—Auditor's remuneration | | | 503,240 | | | | 789,000 | | | | — | | | | 7,352,870 | |
—Other legal and professional fees | | | 5,268,795 | | | | 1,650,070 | | | | 1,617,375 | | | | 6,901,625 | |
| | | 5,772,035 | | | | 2,439,070 | | | | 1,617,375 | | | | 14,254,495 | |
Staff welfare and staff recruitment expenses | | | 7,637,277 | | | | 3,659,523 | | | | 2,528,294 | | | | 2,214,834 | |
Others | | | | | | | | | | | | | | | | |
—Depreciation | | | 379,132 | | | | 334,841 | | | | 267,309 | | | | 99,479 | |
—Foreign exchange differences, net | | | (206,072 | ) | | | 382,757 | | | | 1,888,077 | | | | — | |
—Other expenses | | | 3,671,713 | | | | 657,299 | | | | 461,234 | | | | 6,906,852 | |
| | | 3,844,773 | | | | 1,374,897 | | | | 2,616,620 | | | | 7,006,331 | |
| | | 111,563,188 | | | | 52,582,107 | | | | 47,045,850 | | | | 74,136,643 | |
| | Year ended 31 December | | | Nine months ended 30 September | |
| | 2017 | | | 2018 | | | 2018 | | | 2019 | |
| | HK$ | | | HK$ | | | HK$ | | | HK$ | |
| | | | | | | | (Unaudited) | | | | |
| | | | | | | | | | | | |
Salaries and bonuses | | | 101,092,455 | | | | 67,187,493 | | | | 60,312,286 | | | | 77,364,565 | |
Pension scheme contributions (defined contribution schemes) | | | 1,112,047 | | | | 837,020 | | | | 660,748 | | | | 737,782 | |
| | | 102,204,502 | | | | 68,024,513 | | | | 60,973,034 | | | | 78,102,347 | |
AMTD INTERNATIONAL INC.
NOTES TO THE CONSOLIDATED FINANCIAL STATEMENTS (CONTINUED)
FOR THE YEARS ENDED 31 DECEMBER 2017 AND 2018
AND FOR THE NINE MONTHS ENDED 30 SEPTEMBER 2018 AND 2019
8. | FINANCE COSTS |
| |
| An analysis of finance costs from operations is as follows: |
| | Year ended 31 December | | | Nine months ended 30 September | |
| | 2017 | | | 2018 | | | 2018 | | | 2019 | |
| | HK$ | | | HK$ | | | HK$ | | | HK$ | |
| | | | | | | | (Unaudited) | | | | |
| | | | | | | | | | | | |
Interests on margin loans payable | | | 28,724,758 | | | | 9,047,063 | | | | 6,546,500 | | | | 16,162,042 | |
9. | INCOME TAX |
| |
| Hong Kong profits tax has been provided at the rate of 16.5% (2018: 16.5%; 2017: 16.5%) on the estimated assessable profits arising in Hong Kong: |
| | | | | | Year ended 31 December | | | Nine months ended 30 September | |
| | | Note | | | 2017 | | | 2018 | | | 2018 | | | 2019 | |
| | | | | | HK$ | | | HK$ | | | HK$ | | | HK$ | |
| | | | | | | | | | | | (Unaudited) | | | | |
Hong Kong profits tax | | | | | | | | | | | | | | | | |
Charge for the year/period | | | | | | | 19,988,157 | | | | 43,127,820 | | | | 25,331,576 | | | | 50,966,538 | |
Overprovision in prior year | | | | | | | — | | | | (2,359,495 | ) | | | — | | | | — | |
Deferred tax | | | 21 | | | | 112,969,008 | | | | 33,148,500 | | | | (86,849,070 | ) | | | 79,556,400 | |
The People's Republic of China withholding tax | | | | | | | | | | | | | | | | | | | | |
Charge for the year/period | | | | | | | 2,256,460 | | | | 9,922,772 | | | | 9,922,772 | | | | 9,207,649 | |
| | | | | | | 135,213,625 | | | | 83,839,597 | | | (51,594,722) | | | | 139,730,587 | |
| A reconciliation of tax expense and profit before tax at the Hong Kong statutory tax rate in which the Group's major operating subsidiaries are domiciled is as follows: |
| | Year ended 31 December | | | Nine months ended 30 September | |
| | 2017 | | | 2018 | | | 2018 | | | 2019 | |
| | HK$ | | | HK$ | | | HK$ | | | HK$ | |
| | | | | | | | (Unaudited) | | | | |
| | | | | | | | | | | | |
Profit/(loss) before tax | | | 808,585,471 | | | | 608,965,226 | | | | (242,218,382 | ) | | | 881,073,230 | |
Tax at statutory tax rate of 16.5% | | | 133,416,603 | | | | 100,479,262 | | | | (39,966,033 | ) | | | 145,377,082 | |
Tax effect of non-taxable income | | | (3,834,400 | ) | | | (25,554,680 | ) | | | (23,160,491 | ) | | | (22,172,944 | ) |
Tax effect of non-deductible expenses | | | 3,308,966 | | | | 1,355,050 | | | | 1,614,720 | | | | 5,733,841 | |
Tax effect of unrecognised temporary difference | | | 13,522 | | | | 16,553 | | | | 17,722 | | | | 218,134 | |
Tax effect of tax loss not recognised | | | 64,264 | | | | 10,797 | | | | 1,047 | | | | 1,381,607 | |
Overprovision in prior year | | | — | | | | (2,359,495 | ) | | | | | | | | |
Utilization of tax losses previously not recognised | | | (11,790 | ) | | | (30,662 | ) | | | (24,459 | ) | | | (14,782 | ) |
Withholding tax on the dividend income | | | 2,256,460 | | | | 9,922,772 | | | | 9,922,772 | | | | 9,207,649 | |
Income tax expense | | | 135,213,625 | | | | 83,839,597 | | | | (51,594,722 | ) | | | 139,730,587 | |
AMTD INTERNATIONAL INC.
NOTES TO THE CONSOLIDATED FINANCIAL STATEMENTS (CONTINUED)
FOR THE YEARS ENDED 31 DECEMBER 2017 AND 2018
AND FOR THE NINE MONTHS ENDED 30 SEPTEMBER 2018 AND 2019
10. | EARNINGS/(LOSS) PER SHARE ATTRIBUTABLE TO ORDINARY EQUITY HOLDERS OF THE PARENT |
| |
| Basic and diluted earnings/(loss) per share for each of the periods presented are calculated as follows: |
| | Year ended 31 December | | | Nine months ended 30 September | |
| | 2017 | | | 2018 | | | 2018 | | | 2019 | |
| | HK$ | | | HK$ | | | HK$ | | | HK$ | |
| | | | | | | | (Unaudited) | | | | |
| | | | | | | | | | | | |
Basic earnings per share: | | | | | | | | | | | | |
Numerator: | | | | | | | | | | | | |
Profit attributable to ordinary equity holders of the parent used in the basic earnings per share calculation (HK$)-basic Class A | | | — | | | | — | | | | — | | | | 39,793,383 | |
Profit/(loss) attributable to ordinary equity holders of the parent used in the basic earnings/(loss) per share calculation (HK$)-basic Class B | | | 568,266,428 | | | | 468,061,079 | | | | (116,643,176 | ) | | | 808,917,691 | |
| | | | | | | | | | | | | | | | |
Denominator: | | | | | | | | | | | | | | | | |
Weighted average number of Class A ordinary shares outstanding—basic | | | — | | | | — | | | | — | | | | 9,838,673 | |
Weighted average number of Class B ordinary shares outstanding—basic | | | 200,000,001 | | | | 200,000,001 | | | | 200,000,001 | | | | 200,000,001 | |
| | | | | | | | | | | | | | | | |
Basic earnings per share (HK$) Class A | | | — | | | | — | | | | — | | | | 4.04 | |
Basic earnings/(loss) per share (HK$) Class B | | | 2.84 | | | | 2.34 | | | | (0.58 | ) | | | 4.04 | |
| | | | | | | | | | | | | | | | |
Diluted earnings per share: | | | | | | | | | | | | | | | | |
Numerator: | | | | | | | | | | | | | | | | |
Profit attributable to ordinary equity holders of the parent used in the diluted earnings per share calculation (HK$)-diluted Class A | | | — | | | | — | | | | — | | | | 39,793,383 | |
Profit/(loss) attributable to ordinary equity holders of the parent used in the diluted earnings/(loss) per share calculation (HK$)-diluted Class B | | | 568,266,428 | | | | 468,061,079 | | | | (116,643,176 | ) | | | 808,917,691 | |
| | | | | | | | | | | | | | | | |
Denominator: | | | | | | | | | | | | | | | | |
Weighted average number of Class A ordinary shares outstanding—diluted | | | — | | | | — | | | | — | | | | 9,839,400 | |
Weighted average number of Class B ordinary shares outstanding—diluted | | | 200,000,001 | | | | 200,000,001 | | | | 200,000,001 | | | | 200,014,772 | |
| | | | | | | | | | | | | | | | |
Diluted earnings per share (HK$) Class A | | | — | | | | — | | | | — | | | | 4.04 | |
Diluted earnings/(loss) per share (HK$) Class B | | | 2.84 | | | | 2.34 | | | | (0.58 | ) | | | 4.04 | |
AMTD INTERNATIONAL INC.
NOTES TO THE CONSOLIDATED FINANCIAL STATEMENTS (CONTINUED)
FOR THE YEARS ENDED 31 DECEMBER 2017 AND 2018
AND FOR THE NINE MONTHS ENDED 30 SEPTEMBER 2018 AND 2019
10. | EARNINGS/(LOSS) PER SHARE ATTRIBUTABLE TO ORDINARY EQUITY HOLDERS OF THE PARENT (CONTINUED) |
| | Number of shares | |
| | Year ended 31 December | | | Nine months ended 30 September | |
| | 2017 | | | 2018 | | | 2018 | | | 2019 | |
| | HK$ | | | HK$ | | | HK$ | | | HK$ | |
| | | | | | | | (Unaudited) | | | | |
| | | | | | | | | | | | |
Shares: | | | | | | | | | | | | |
Weighted average number of Class A ordinary shares in issue during the year used in the basic earnings per share calculation | | | — | | | | — | | | | — | | | | 9,838,673 | |
Effect of dilution – weighted average number of ordinary shares: | | | | | | | | | | | | | | | | |
Warrants | | | — | | | | — | | | | — | | | | 727 | |
| | — | | | — | | | — | | | | 9,839,400 | |
| | | | | | | | | | | | | | | | |
Weighted average number of Class B ordinary shares in issue during the year used in the basic earnings per share calculation | | | 200,000,001 | | | | 200,000,001 | | | | 200,000,001 | | | | 200,000,001 | |
Effect of dilution – weighted average number of ordinary shares: | | | | | | | | | | | | | | | | |
Warrants | | | — | | | | — | | | | — | | | | 14,771 | |
| | | 200,000,001 | | | | 200,000,001 | | | | 200,000,001 | | | | 200,014,772 | |
| The Company’s ordinary shares are divided into Class A ordinary shares and Class B ordinary shares. Holders of Class A ordinary shares and Class B ordinary shares have the same rights except for voting and conversion rights. Each Class A ordinary share is entitled to one vote and is not convertible into Class B ordinary share under any circumstances. Each Class B ordinary share is entitled to twenty votes, subject to certain conditions, and is convertible into one Class A ordinary share at any time by the holder thereof. |
| |
| The basic earnings per share attributable to Class B ordinary equity holders is calculated by dividing the profit for the year/period attributable to ordinary equity holders of the parent by the number of Class B ordinary shares after the Reorganisation as mentioned in Note 1.2. |
| |
| The diluted earnings per share is based on the profit for the year/period attributable to ordinary equity holders of the parent. The weighted average number of ordinary shares used in the calculation is the number of ordinary shares in issue during the year/period, as used in the basic earnings per share calculation, and the weighted average number of warrants assumed to have been exercised at average market price of ordinary shares during the warrants existing period. |
| |
| In addition to the transactions detailed elsewhere in the consolidated financial statements, there have been no other transactions involving Class A and Class B ordinary shares between the reporting date and the date of authorisation of these financial statements. |
AMTD INTERNATIONAL INC.
NOTES TO THE CONSOLIDATED FINANCIAL STATEMENTS (CONTINUED)
FOR THE YEARS ENDED 31 DECEMBER 2017 AND 2018
AND FOR THE NINE MONTHS ENDED 30 SEPTEMBER 2018 AND 2019
| | | | | | 31 December | | | 30 September | |
| | | Notes | | | 2017 | | | 2018 | | | 2019 | |
| | | | | | HK$ | | | HK$ | | | HK$ | |
| | | | | | | | | | | | | |
Receivable from investment banking services | | | (i) | | | | 69,555,369 | | | | 134,855,898 | | | | 117,151,006 | |
Receivable from brokers and clearing house | | | (ii) | | | | 7,869,727 | | | | 10,813,497 | | | | 43,323,624 | |
Clients' receivables | | | (ii) | | | | 15,747,620 | | | | 12,848,608 | | | | 10,126,750 | |
Margin loan receivable | | | (iii) | | | | — | | | | 2,575,051 | | | | — | |
| | | | | | | 93,172,716 | | | | 161,093,054 | | | | 170,601,380 | |
| Notes: |
| | |
| (i) | The normal settlement terms of receivables from investment banking services are specific terms mutually agreed between the contracting parties. Receivable from investing banking services is non-interest bearing. |
| | |
| (ii) | The normal settlement terms of clients’ receivables and receivable from brokers and clearing houses arising from asset management services are 2 days after trade date or at specific terms agreed with brokers and clearing houses. Overdue clients’ receivable is interest-bearing. As at 30 September 2019, the Group’s clients’ receivables of HK$281,285 are due from fellow subsidiaries, which are repayable on similar credit terms to those offered to the major customers of the Group. The Group did not have any clients’ receivables due from fellow subsidiaries as at 31 December 2018. |
| | |
| (iii) | As at 31 December 2018, the Group had collateral of listed shares with fair value amounted to HK$3,808,116 in margin financing business. Margin loan receivable is interest-bearing. |
| | |
| As at 31 December 2018 and 30 September 2019, the Group's receivable from investment banking services of HK$70,875,980 and HK$15,681,400, respectively, are due from fellow subsidiaries and its immediate holding company, which are repayable on similar credit terms to those offered to the major customers of the Group (Note 24(b)(ii)). The Group seeks to maintain strict control over its outstanding receivables and has a credit control team to minimise credit risk. Overdue balances are reviewed regularly by senior management. Except for the margin loan receivable, the Group does not hold any collateral over its accounts receivable. An ageing analysis of the accounts receivable as at the end of the reporting periods, based on the invoice date, net of loss allowance is as follows: |
| | 31 December | | | 30 September | |
| | 2017 | | | 2018 | | | 2019 | |
| | HK$ | | | HK$ | | | HK$ | |
| | | | | | | | | |
Not yet due | | | 49,453,064 | | | | 95,469,641 | | | | 100,635,981 | |
Past due | | | | | | | | | | | | |
Within 1 month | | | 41,552,582 | | | | 732,497 | | | | 42,014,235 | |
1 to 3 months | | | 1,700,642 | | | | 840,942 | | | | 20,092,435 | |
Over 3 months | | | 466,428 | | | | 64,049,974 | | | | 7,858,729 | |
| | | 93,172,716 | | | | 161,093,054 | | | | 170,601,380 | |
| As at 31 December 2017 and 2018 and 30 September 2019, accounts receivable was due from a number of reputable corporate clients, brokers and individual clients. |
AMTD INTERNATIONAL INC.
NOTES TO THE CONSOLIDATED FINANCIAL STATEMENTS (CONTINUED)
FOR THE YEARS ENDED 31 DECEMBER 2017 AND 2018
AND FOR THE NINE MONTHS ENDED 30 SEPTEMBER 2018 AND 2019
11. | ACCOUNTS RECEIVABLE (CONTINUED) |
| |
| Margin loan receivable are assessed for impairment under stage 1 of general approach. Where applicable, an impairment analysis is performed at each reporting date by considering the probability of default of comparable companies with published credit ratings. Their recoverability was assessed with reference to the credit status of the debtors. The expected credit losses as at 31 December 2017 and 2018 and 30 September 2019 are considered to be minimal and no loss allowance of margin loan receivable was provided. |
| |
| An impairment analysis of clients' receivables, receivable from brokers and clearing house, and receivable from investment banking services is performed at each reporting date using a provision matrix to measure expected credit losses. The provision rates are based on days past due for groupings of various segments with similar loss patterns (i.e., by customer type and reference rating). The calculation reflects the probability-weighted outcome, the time value of money and reasonable and supportable information that is available at the reporting date about past events, current conditions and forecasts of future economic conditions. |
| | | | | Past due | | | | |
| | | | | Less than | | | 1 to 3 | | | Over | | | | |
As at 31 Decemebr 2017 | | Current | | | 1 month | | | months | | | 3 months | | | Total | |
Expected credit loss rate | | | 0.06 | % | | | 0.08 | % | | | 0.08 | % | | | 0.06 | % | | | 0.07 | % |
Gross carrying amount (HK$'000) | | | 49,453 | | | | 41,553 | | | | 1,701 | | | | 466 | | | | 93,173 | |
| | | | | | | | | | | | | | | | | | | | |
| | | | | | Past due | | | | | |
| | | | | | Less than | | | 1 to 3 | | | Over | | | | | |
As at 31 December 2018 | | Current | | | 1 month | | | months | | | 3 months | | | Total | |
Expected credit loss rate. | | | 0.13 | % | | | — | | | | 0.10 | % | | | 0.22 | % | | | 0.17 | % |
Gross carrying amount (HK$'000) | | | 95,470 | | | | 719 | | | | 828 | | | | 61,501 | | | | 158,518 | |
| | | | | | | | | | | | | | | | | | | | |
| | | | | | Past due | | | | | |
| | | | | | Less than | | | 1 to 3 | | | Over | | | | | |
As at 30 September 2019 | | Current | | | 1 month | | | months | | | 3 months | | | Total | |
Expected credit loss rate. | | | 0.11 | % | | | 0.09 | % | | | 0.09 | % | | | 0.10 | % | | | 0.10 | % |
Gross carrying amount (HK$'000) | | | 100,636 | | | | 42,014 | | | | 20,092 | | | | 7,859 | | | | 170,601 | |
| The expected credit losses as at 31 December 2017 and 2018 and 30 September 2019 were immaterial and no loss allowance for account receivable was provided. |
AMTD INTERNATIONAL INC.
NOTES TO THE CONSOLIDATED FINANCIAL STATEMENTS (CONTINUED)
FOR THE YEARS ENDED 31 DECEMBER 2017 AND 2018
AND FOR THE NINE MONTHS ENDED 30 SEPTEMBER 2018 AND 2019
12. | PREPAYMENTS, OTHER RECEIVABLES AND OTHER ASSETS |
| | 31 December | | | 30 September | |
| | 2017 | | | 2018 | | | 2019 | |
| | HK$ | | | HK$ | | | HK$ | |
| | | | | | | | | |
Prepayments | | | 21,371,334 | | | | 27,301,254 | | | | 43,051,114 | |
Deposits | | | 456,150 | | | | 451,759 | | | | 469,362 | |
Other receivables | | | 1,375,959 | | | | 5,590,846 | | | | 9,991,377 | |
| | | 23,203,443 | | | | 33,343,859 | | | | 53,511,853 | |
| Deposits and other receivables mainly represent rental deposits and deposits with event organisers. Where applicable, an impairment analysis is performed at each reporting date by considering the probability of default of comparable companies with published credit ratings. |
| |
| As at 31 December 2017 and 2018 and 30 September 2019, the probability of default applied ranged from 0.05% to 0.60% and the loss given default was estimated to be 45%. The recoverability was assessed with reference to the credit status of the debtors, and the expected credit loss as at 31 December 2017 and 2018 and 30 September 2019 is considered to be minimal. |
| |
| None of the above assets is either past due or impaired. The financial assets included in the above balances relate to receivables for which there was no recent history of default. |
| |
13. | FINANCIAL ASSETS AT FAIR VALUE THROUGH PROFIT OR LOSS AND STOCK LOAN |
| | 31 December | | | 30 September | |
| | 2017 | | | 2018 | | | 2019 | |
| | HK$ | | | HK$ | | | HK$ | |
| | | | | | | | | |
Financial assets at fair value through profit or loss | | | 745,629,400 | | | | 1,953,078,309 | | | | 1,750,862,599 | |
Stock loan | | | 2,203,140,000 | | | | 1,535,679,600 | | | | 1,376,205,180 | |
| | | 2,948,769,400 | | | | 3,488,757,909 | | | | 3,127,067,779 | |
| | | | | | | | | | | | |
Listed equity shares, at quoted price | | | | | | | | | | | | |
—Investment A | | | 2,933,140,000 | | | | 3,134,040,000 | | | | 2,808,582,000 | |
—Investment B | | | — | | | | 73,476,000 | | | | — | |
Total listed equity shares, at quoted price | | | 2,933,140,000 | | | | 3,207,516,000 | | | | 2,808,582,000 | |
| | | | | | | | | | | | |
Unlisted debt securities | | | | | | | | | | | | |
—Investment C | | | — | | | | 78,316,000 | | | | — | |
| | | | | | | | | | | | |
Unlisted equity shares | | | | | | | | | | | | |
—Investment C | | | — | | | | — | | | | 75,755,550 | |
—Investment D | | | 15,629,400 | | | | 47,417,581 | | | | 47,472,679 | |
—Investment E | | | — | | | | 155,508,328 | | | | 195,257,550 | |
Total unlisted equity shares | | | 15,629,400 | | | | 202,925,909 | | | | 318,485,779 | |
| | | 2,948,769,400 | | | | 3,488,757,909 | | | | 3,127,067,779 | |
AMTD INTERNATIONAL INC.
NOTES TO THE CONSOLIDATED FINANCIAL STATEMENTS (CONTINUED)
FOR THE YEARS ENDED 31 DECEMBER 2017 AND 2018
AND FOR THE NINE MONTHS ENDED 30 SEPTEMBER 2018 AND 2019
13. | FINANCIAL ASSETS AT FAIR VALUE THROUGH PROFIT OR LOSS AND STOCK LOAN (CONTINUED) |
| |
| The above unlisted investments at 31 December 2017 and 2018 and 30 September 2019 were equity shares investments and debt securities issued by enterprises. The Group has not elected to recognise equity share investments at the fair value gain or loss through other comprehensive income. Debt securities were mandatorily classified as financial assets at fair value through profit or loss as their contractual cash flows are not solely payments of principal and interest or are managed on fair value basis. Financial assets at fair value through profit or loss are categorised into levels 1 and 3. |
| |
| As at 31 December 2017 and 2018 and 30 September 2019, the Group's listed equity investments with a carrying amount of HK$730,000,000, HK$1,598,360,400 and HK$1,432,376,820, respectively, were pledged against its margin loans payable. |
| |
| On 17 September 2017, the Group entered into a stock borrowing and lending agreement ("stock loan") with the intermediate holding company, pursuant to which the Group lent certain listed equity investment in Investment A to the intermediate holding company. The stock loan is repayable on demand and interest free. |
| |
| The intermediate holding company pledged the listed equity shares to a third party as collateral for loan facilities maturing in 2022. In November 2018, the Group demanded and partially recovered some of the listed equity investments with carrying amounts of HK$660,983,400. |
| |
| As at 31 December 2017 and 2018 and 30 September 2019, the fair values of the listed equity shares under the stock loan were HK$2,203,140,000, HK$1,535,679,600 and HK$1,376,205,180, respectively. In addition, the unrealized gain on the stock loan were HK$539,660,652 and HK$98,441,000 for the years ended 31 December 2017 and 2018, respectively, and the unrealized loss on the stock loan was HK$395,358,000 and HK$159,474,420 for the nine months ended 30 September 2018 and 2019, respectively. |
| |
14. | DERIVATIVE FINANCIAL INSTRUMENT |
| On 1 April 2019, two subsidiaries of the Group entered into “Upside Participation and Profit Distribution Agreements” (the “Agreements”) with a counterparty in relation to the movement of the share price of the entirety of the listed shares of Investment A (Note 13) the Group owns (“Underlying Assets”). The Agreements have an original term of 12 months and can be extended for any further period or terminated at any time upon mutual agreement of the contracting parties. Pursuant to the Agreements: |
| (a) | The counterparty is entitled to 25% (the “Sharing Percentage”) of the gain of the Underlying Assets if the quoted market price or disposal price of the Underlying Assets is higher than HK$8.1 per share (the “Underlying Price”); |
| | |
| (b) | The counterparty shall pay a sum equivalent to the loss if the quoted market price or disposal price of the Underlying Assets is lower than Underlying Price (“Participation Cost”); and |
| | |
| (c) | Dividend or cash distributions generated from the Underlying Assets during the term of the Agreements shall be received by AMTD for its sole benefit and shall not be included in the computation of the Profit or the Participation Cost. |
| | |
| Further addendums to the Agreements were entered into on 30 June, 1 July, 30 September and 31 December 2019 (the “Addendums”), where: |
| · | On 30 June 2019, the term of the Agreements was modified from 12 months to 3 months and could be roll-forward for an additional three-month period upon mutual agreement between the contracting parties provided that the Underlying Assets are not fully disposed by the Group on the termination date. |
| | |
| · | On 1 July 2019, the Agreements were extended for a 3-month period to 30 September 2019 and the Underlying Price was modified from HK$8.1 to HK$9.0 and the Sharing Percentage was modified from 25% to 40%. |
AMTD INTERNATIONAL INC.
NOTES TO THE CONSOLIDATED FINANCIAL STATEMENTS (CONTINUED)
FOR THE YEARS ENDED 31 DECEMBER 2017 AND 2018
AND FOR THE NINE MONTHS ENDED 30 SEPTEMBER 2018 AND 2019
14. | DERIVATIVE FINANCIAL INSTRUMENT (CONTINUED) |
| · | On 30 September 2019, the Agreements were extended for another three-month period to 31 December 2019. |
| | |
| · | On 31 December 2019, the Agreements were further extended for an additional three months till 31 March 2020. Refer to Note 28 on Subsequent Events. |
| The Agreements together with the Addendums satisfied the definition of derivative financial instrument in accordance with IFRS 9 and were stated at fair value with any subsequent changes recognised in profit or loss. In addition, since the transaction price of the derivative financial instrument differed from the fair value at origination and the fair value was based on a valuation technique using inputs not observable, and therefore, the difference between the transaction price and the fair value (Day 1 profit or loss) was deferred and amortized during the term of the Agreements. |
| The table below shows the movement of: |
| | |
| (i) | the profit or loss not recognised when the derivative financial instrument was initially recognised (Day 1 profit or loss); |
| (ii) | net carrying amount presented in the consolidated statements of financial position; and |
| (iii) | net fair value change on derivative financial instrument presented in the consolidated statements of profit or loss and other comprehensive income |
| | Fair value using valuation technique | | | Day 1 (profit)/loss | | | Net carrying amount | | | Net change in fair value recognized in profit or loss | |
| | HK$ | | | HK$ | | | HK$ | | | HK$ | |
| | | | | | | | | | | | |
As at 1 January 2019 | | | — | | | | — | | | | — | | | | — | |
Initial transaction on 1 April 2019 | | | 355,294,216 | | | | (355,294,216 | ) | | | — | | | | — | |
| | | | | | | | | | | | | | | | |
Recognised in profit and loss prior to contract renegotiation on 1 July 2019 | | | | | | | | | | | | | | | | |
- Changes in fair value | | | 106,129,339 | | | | — | | | | 106,129,339 | | | | 106,129,339 | |
- Recognition of day 1 profit or loss | | | — | | | | 88,338,180 | | | | 88,338,180 | | | | 88,338,180 | |
| | | | | | | | | | | | | | | | |
As at 30 June 2019 | | | 461,423,555 | | | | (266,956,036 | ) | | | 194,467,519 | | | | 194,467,519 | |
| | | | | | | | | | | | | | | | |
Contract renegotiation on 1 July 2019 | | | 115,758,384 | | | | (115,758,384 | ) | | | — | | | | — | |
| | | | | | | | | | | | | | | | |
As at 1 July 2019 | | | 577,181,939 | | | | (382,714,420 | ) | | | 194,467,519 | | | | 194,467,519 | |
| | | | | | | | | | | | | | | | |
Recognised in profit and loss prior to contract renegotiation on 30 September 2019 | | | | | | | | | | | | | | | | |
- Changes in fair value | | | 230,436,061 | | | | — | | | | 230,436,061 | | | | 230,436,061 | |
- Recognition of day 1 profit or loss | | | — | | | | 382,714,420 | | | | 382,714,420 | | | | 382,714,420 | |
| | | | | | | | | | | | | | | | |
As at 30 September 2019 | | | 807,618,000 | | | | — | | | | 807,618,000 | | | | 807,618,000 | |
| | | | | | | | | | | | | | | | |
Contract renegotiation on 30 September 2019 | | | 1,538,635 | | | | (1,538,635 | ) | | | — | | | | — | |
| | | | | | | | | | | | | | | | |
As at 30 September 2019 | | | 809,156,635 | | | | (1,538,635 | ) | | | 807,618,000 | | | | 807,618,000 | |
AMTD INTERNATIONAL INC.
NOTES TO THE CONSOLIDATED FINANCIAL STATEMENTS (CONTINUED)
FOR THE YEARS ENDED 31 DECEMBER 2017 AND 2018
AND FOR THE NINE MONTHS ENDED 30 SEPTEMBER 2018 AND 2019
15. | CASH AND BANK BALANCES |
| | 31 December | | | 30 September | |
| | 2017 | | | 2018 | | | 2019 | |
| | HK$ | | | HK$ | | | HK$ | |
| | | | | | | | | |
Cash and cash equivalents: | | | | | | | | | |
- Cash on hand | | | 31,031 | | | | 31,031 | | | | 31,031 | |
- General bank accounts | | | 86,384,251 | | | | 126,824,487 | | | | 669,099,818 | |
Total cash and cash equivalents | | | 86,415,282 | | | | 126,855,518 | | | | 669,130,849 | |
Segregated clients' bank accounts balances: | | | | | | | | | | | | |
- Insurance brokerage business and others | | | 20,568,024 | | | | 29,395,158 | | | | 19,457,606 | |
- Asset management business | | | 382,923,675 | | | | 586,096,042 | | | | 268,510,894 | |
Total segregated clients' bank accounts balances | | | 403,491,699 | | | | 615,491,200 | | | | 287,968,500 | |
Total cash and bank balances | | | 489,906,981 | | | | 742,346,718 | | | | 957,099,349 | |
| Cash at banks earns interest at floating rates based on daily bank deposit rates for all the periods. The bank balances are deposited with creditworthy banks with no recent history of default. |
| |
| The Group maintains segregated bank accounts with corporate banks to hold clients' monies on trust under custody arising from its asset management and other business. The Group has classified the clients' monies as bank balances-segregated accounts under the assets section of the consolidated statements of financial position and recognised the corresponding amounts as clients' monies held on trust to respective clients on the basis that it is legally liable for any possible loss or misappropriation of the clients' monies. The Group is not allowed to use the clients' monies to settle its own obligations. |
| |
16. | PROPERTY, PLANT AND EQUIPMENT |
| | Furniture and fixtures | | | Computer equipment | | | Total | |
| | HK$ | | | HK$ | | | HK$ | |
| | | | | | | | | |
Cost: | | | | | | | | | |
At 1 January 2017 | | | 11,090 | | | | 3,907,006 | | | | 3,918,096 | |
Additions | | | - | | | | 138,704 | | | | 138,704 | |
At 31 December 2017 and 1 January 2018 | | | 11,090 | | | | 4,045,710 | | | | 4,056,800 | |
Additions | | | - | | | | 14,214 | | | | 14,214 | |
At 31 December 2018 and 1 January 2019 | | | 11,090 | | | | 4,059,924 | | | | 4,071,014 | |
Additions | | | - | | | | 13,710 | | | | 13,710 | |
At 30 September 2019 | | | 11,090 | | | | 4,073,634 | | | | 4,084,724 | |
| | | | | | | | | | | | |
Accumulated depreciation: | | | | | | | | | | | | |
At 1 January 2017 | | | 1,842 | | | | 3,223,993 | | | | 3,225,835 | |
Charge for the year | | | 2,218 | | | | 376,914 | | | | 379,132 | |
At 31 December 2017 and 1 January 2018 | | | 4,060 | | | | 3,600,907 | | | | 3,604,967 | |
Charge for the year | | | 2,218 | | | | 332,623 | | | | 334,841 | |
At 31 December 2018 and 1 January 2019 | | | 6,278 | | | | 3,933,530 | | | | 3,939,808 | |
Charge for the period | | | 1,664 | | | | 97,815 | | | | 99,479 | |
At 30 September 2019 | | | 7,942 | | | | 4,031,345 | | | | 4,039,287 | |
AMTD INTERNATIONAL INC.
NOTES TO THE CONSOLIDATED FINANCIAL STATEMENTS (CONTINUED)
FOR THE YEARS ENDED 31 DECEMBER 2017 AND 2018
AND FOR THE NINE MONTHS ENDED 30 SEPTEMBER 2018 AND 2019
16. | PROPERTY, PLANT AND EQUIPMENT (CONTINUED) |
| | Furniture and fixtures | | | Computer equipment | | | Total | |
| | HK$ | | | HK$ | | | HK$ | |
| | | | | | | | | |
Carrying amount: | | | | | | | | | |
At 30 September 2019 | | | 3,148 | | | | 42,289 | | | | 45,437 | |
At 31 December 2018 | | | 4,812 | | | | 126,394 | | | | 131,206 | |
At 31 December 2017 | | | 7,030 | | | | 444,803 | | | | 451,833 | |
At 1 January 2017 | | | 9,248 | | | | 683,013 | | | | 692,261 | |
| | HK$ | |
| | | |
Net carrying amount as at 31 December 2017 and 2018 | | | |
and 30 September 2019 | | | 15,171,170 | |
| The intangible assets represented securities trading licenses and trading right with indefinite useful lives because they are expected to contribute to the net cash flows of the Group indefinitely and therefore, are not amortized. The recoverable amount of the intangible assets is determined by reference to the market evidence of recent transaction prices for similar licensed corporations. |
| |
18. | ACCOUNTS PAYABLE |
| | | | | 31 December | | | 30 September | |
| | | Notes | | | 2017 | | | 2018 | | | 2019 | |
| | | | | | HK$ | | | HK$ | | | HK$ | |
| | | | | | | | | | | | | |
Payables to clearing house and brokers | | | (i) | | | | 2,857,658 | | | | 3,153,820 | | | | 648,649 | |
Clients' payables | | | (ii) | | | | 4,270,484 | | | | 12,157,051 | | | | 6,076,363 | |
| | | | | | | 7,128,142 | | | | 15,310,871 | | | | 6,725,012 | |
| Note: |
| |
| (i) | As at 31 December 2017 and 2018 and 30 September 2019, payables to clearing house and brokers and clients' payable arising from assets management business are repayable 2 days after trade date or at pre-agreed specified terms. |
| | |
| An ageing analysis of the accounts payable as at the end of the reporting period is as follows: |
| | 31 December | | | 30 September | |
| | 2017 | | | 2018 | | | 2019 | |
| | HK$ | | | HK$ | | | HK$ | |
| | | | | | | | | |
Within 1 month/repayable on demand | | | 7,128,142 | | | | 15,310,871 | | | | 6,725,012 | |
| The balances of accounts payable are unsecured and non-interest-bearing. |
AMTD INTERNATIONAL INC.
NOTES TO THE CONSOLIDATED FINANCIAL STATEMENTS (CONTINUED)
FOR THE YEARS ENDED 31 DECEMBER 2017 AND 2018
AND FOR THE NINE MONTHS ENDED 30 SEPTEMBER 2018 AND 2019
19. | MARGIN LOANS PAYABLE |
| |
| As at 31 December 2017 and 2018 and 30 September 2019, the balances are interest-bearing at a rate of 3.00% to 5.25% per annum (“p.a.”), 6.75% p.a. and 6.75% p.a., respectively, and secured by the Group’s financial assets at fair value through profit or loss of HK$730,000,000, HK$1,598,360,400, and HK$1,432,376,820, respectively (Note 13). |
| |
20. | OTHER PAYABLES AND ACCRUALS |
| | | | | | 31 December | | | 30 September | |
| | | Notes | | | 2017 | | | 2018 | | | 2019 | |
| | | | | | HK$ | | | HK$ | | | HK$ | |
| | | | | | | | | | | | | |
Accruals and other payables | | | | | | | 6,516,678 | | | | 25,011,870 | | | | 66,772,740 | |
Contract liabilities | | | (i) | | | | — | | | | 55,111,818 | | | | 115,502,836 | |
| | | | | | | 6,516,678 | | | | 80,123,688 | | | | 182,275,576 | |
| Note: |
| | |
| (i) | Contract liabilities include upfront fees received to deliver asset management services. The Company started to receive advances from its customers of asset management services in 2018. |
| |
| Movements in contract liabilities during the years ended 31 December 2017 and 2018 and the nine months ended 30 September 2019 are as follows: |
| | HK$ | |
| | | |
At 1 January 2017, 31 December 2017 and 1 January 2018 | | | — | |
Deferred revenue received during the year | | | 58,344,702 | |
Revenue recognised during the year | | | (3,232,884 | ) |
At 31 December 2018 | | | 55,111,818 | |
Deferred revenue received during the period | | | 109,319,290 | |
Revenue recognised during the period | | | (48,928,272 | ) |
At 30 September 2019 | | | 115,502,836 | |
AMTD INTERNATIONAL INC.
NOTES TO THE CONSOLIDATED FINANCIAL STATEMENTS (CONTINUED)
FOR THE YEARS ENDED 31 DECEMBER 2017 AND 2018
AND FOR THE NINE MONTHS ENDED 30 SEPTEMBER 2018 AND 2019
21. | DEFERRED TAX LIABILITIES |
| |
| The movements in deferred tax liabilities during the years are as follows: |
| | Unrealized gain | |
| | on investment | |
| | HK$ | |
| | | |
At 1 January 2017 | | | 17,239,669 | |
Deferred tax charged to profit or loss during the year (Note 9) | | | 112,969,008 | |
At 31 December 2017 and 1 January 2018 | | | 130,208,677 | |
Deferred tax charged to profit or loss during the year (Note 9) | | | 33,148,500 | |
At 31 December 2018 and 1 January 2019 | | | 163,357,177 | |
Deferred tax charged to profit or loss during the period (Note 9) | | | 79,556,400 | |
At 30 September 2019 | | | 242,913,577 | |
| As at 31 December 2017 and 2018 and 30 September 2019, the Group had estimated tax losses arising in Hong Kong of HK$1,196,380, HK$1,041,831 and HK$6,405,387 subject to the agreement by the Hong Kong Inland Revenue Department, that are available indefinitely for offsetting against future taxable profits of the companies in which the losses arose. Deferred tax assets have not been recognised in respect of the unutilised tax losses arising in Hong Kong as it is not considered probable that taxable profits would be available against which the tax losses can be utilised. |
22. | SHARE CAPITAL AND CAPITAL RESERVE |
Share Capital | | | |
Authorized | | | |
Class A ordinary shares | | | 8,000,000,000 | |
Class B ordinary shares | | | 2,000,000,000 | |
Issued and fully paid: | | | | |
Class A ordinary shares | | | 33,777,159 | |
Class B ordinary shares | | | 200,000,001 | |
| As described in Note 1.2, the issued capital of the Company is presented as if the shares after completion of the Reorganisation were issued since inception. The carrying amount of the issued capital of HK$156,998 (equivalent to US$20,000) represents nominal amount of the 200,000,001 Class B ordinary shares at US$0.0001 per share issued by the Company. |
| |
| All issued shares to the contributing shareholder of AMTD IHG, AMTD ISG, AMTD SI, AMTD Overseas and AMTD FI during the Reorganisation are Class B ordinary shares. |
| |
| Between 26 April 2019 and 19 June 2019, the Company issued 8,236,838 Class A ordinary shares to third parties investors for an aggregate consideration of US$53.5 million for the pre-IPO financing. |
| |
| During the period, the Company issued a warrant for an aggregate consideration of US$2 million. Each warrant entitles the holder thereof to subscribe for one ordinary share at a subscription price of US$7.2. On 10 April 2019, the warrant holder exercised the warrants in full and paid an additional amount of US$10 million for 1,666,666 Class A ordinary shares. At the end of the reporting period, the Company had no warrants outstanding. |
| |
| On 5 August 2019, the Company completed its Initial Public Offering (“IPO”) on the New York Stock Exchange under the symbol of “HKIB”. The Company issued an aggregate 23,873,655 American Depositary Shares (“ADSs”), representing 23,873,655 Class A Ordinary Shares for total net proceeds of HK$1,926.6 million. |
AMTD INTERNATIONAL INC.
NOTES TO THE CONSOLIDATED FINANCIAL STATEMENTS (CONTINUED)
FOR THE YEARS ENDED 31 DECEMBER 2017 AND 2018
AND FOR THE NINE MONTHS ENDED 30 SEPTEMBER 2018 AND 2019
22. | SHARE CAPITAL AND CAPITAL RESERVE (CONTINUED) |
| |
| Each Class A ordinary share shall entitle the holder thereof to one vote on all matters subject to vote at general meetings of the Company, and each Class B ordinary share shall entitle the holder thereof to twenty votes on all matters subject to vote at general meetings of the Company. Each Class B ordinary share is convertible into one Class A ordinary share at any time by the holder thereof. Each Class A ordinary share is not convertible into Class B ordinary shares under any circumstances. Except for the voting rights and the conversion rights, the Class A ordinary shares and the Class B ordinary shares shall rank pari passu with one another and shall have the same rights, preferences, privileges and restrictions. |
| |
| As at 30 September 2019, the Company had ordinary shares outstanding comprising of 33,777,159 Class A ordinary shares and 200,000,001 Class B ordinary shares, respectively. No Class B ordinary shares were converted into Class A ordinary shares during the nine months ended 30 September 2019. |
| | |
| Capital reserve |
| | | Notes | | | HK$ | |
| | | | | | | |
As at 1 January 2017 | | | (i) | | | | 33,333,003 | |
Capital injection to a subsidiary | | | | | | | 1 | |
Deemed contributions | | | (ii) | | | | 1,279,469,671 | |
As at 31 December 2017 | | | | | | | 1,312,802,675 | |
Capital injection to a subsidiary | | | | | | | 1 | |
As at 31 December 2018 | | | | | | | 1,312,802,676 | |
Deemed disposal of non-controlling interests | | | | | | | 435,231,866 | |
Exercise of warrants | | | (iii) | | | | 94,196,292 | |
Pre-IPO financing | | | (iv) | | | | 419,375,698 | |
Initial public offering | | | | | | | 1,507,196,460 | |
Capital injection to subsidiaries | | | | | | | 9 | |
As at 30 September 2019 | | | | | | | 3,768,803,001 | |
| Notes: |
| | |
| (i) | In prior year, when the immediate holding company restructured its organization, the equity interest of AMTD GM was transferred between two companies within its group. The amount of consideration in excess of the net asset value of AMTD GM on the transaction date was recorded in capital reserve. |
| | |
| (ii) | For the year ended 31 December 2017, the intermediate holding company of AMTD ISG and AMTD SI issued new shares representing equity interest of 20.87% to independent investors. It was accounted for as an equity transaction with the non-controlling interests and a decrease in equity attributable to owners of the Company, and recorded in capital reserve, based on the proportionate share of the subsidiaries net assets of HK$34,009,199 upon issuance of new shares. |
| | |
| | Besides, a balance of HK$1,313,478,870 due to the former holding company of a subsidiary was waived and recorded as deemed contribution. |
| | |
| (iii) | The Company issued a warrant for an aggregate consideration of US$2 million. Each warrant entitles the holder thereof to subscribe for one ordinary share at a subscription price of US$7.2. On 10 April 2019, the warrant holder exercised the warrants in full and paid an additional amount of US$10 million for 1,666,666 Class A ordinary shares. |
| | |
| (iv) | Between 26 April 2019 and 19 June 2019, the Company issued 8,236,838 Class A ordinary shares to third parties investors for an aggregate consideration of US$53.5 million for the pre-IPO financing. |
AMTD INTERNATIONAL INC.
NOTES TO THE CONSOLIDATED FINANCIAL STATEMENTS (CONTINUED)
FOR THE YEARS ENDED 31 DECEMBER 2017 AND 2018
AND FOR THE NINE MONTHS ENDED 30 SEPTEMBER 2018 AND 2019
23. | NOTES TO THE CONSOLIDATED STATEMENTS OF CASH FLOWS |
| (a) | Major non-cash transactions |
| | |
| | During the years ended 31 December 2017 and 2018 and the nine months ended 30 September 2018, the Group purchased financial assets at fair value through profit or loss of HK$1,675,510,800 and HK$203,607,914 and HK$203,607,914, respectively, by way of current accounts with fellow subsidiaries. No such item occurred in the period ended 30 September 2019. |
| | |
| | During the year ended 31 December 2017, the repayment of margin loans payable of HK$248,183,452 was directly settled by sales proceeds upon the disposal of financial assets at fair value through profit or loss. |
| | |
| (b) | Changes in liabilities arising from financing activities |
| | Margin loans | |
| | payable | |
| | HK$ | |
| | | |
At 1 January 2017 | | | 638,350,783 | |
Cash flow changes from financing activities | | | (38,557,701 | ) |
Released from disposal of financial assets | | | | |
at fair value through profit or loss | | | (248,183,452 | ) |
Interest expenses | | | 28,724,758 | |
Interest paid | | | (28,724,758 | ) |
At 31 December 2017 | | | 351,609,630 | |
Cash flow changes from financing activities | | | (29,610,081 | ) |
Interest expenses | | | 9,047,063 | |
Interest paid | | | (9,047,063 | ) |
At 31 December 2018 | | | 321,999,549 | |
Cash flow changes from financing activities | | | (223,997 | ) |
Interest expense | | | 16,162,042 | |
Interest paid | | | (16,162,042 | ) |
At 30 September 2019 | | | 321,775,552 | |
| | | | |
| | Margin loans | |
| | payable | |
| | HK$ | |
| | | | |
At 31 December 2017 | | | 351,609,630 | |
Repayment (unaudited) | | | (351,609,630 | ) |
Interest expenses (unaudited) | | | 6,546,500 | |
Interest paid (unaudited) | | | (6,546,500 | ) |
At 30 September 2018 (unaudited) | | | — | |
AMTD INTERNATIONAL INC.
NOTES TO THE CONSOLIDATED FINANCIAL STATEMENTS (CONTINUED)
FOR THE YEARS ENDED 31 DECEMBER 2017 AND 2018
AND FOR THE NINE MONTHS ENDED 30 SEPTEMBER 2018 AND 2019
23. | NOTES TO THE CONSOLIDATED STATEMENTS OF CASH FLOWS (CONTINUED) |
| (c) | Changes in the movement of balances with related parties |
| | Year ended 31 December 2017 | |
| | | | | | | | Immediate | |
| | Related | | | Fellow | | | holding | |
| | company | | | subsidiaries | | | company | |
| | HK$ | | | HK$ | | | HK$ | |
| | | | | | | | | |
Operating activities | | | (2,104,418 | ) | | | (663,904,382 | ) | | | 284,494,845 | |
Financing activities | | | — | | | | 203,607,914 | | | | — | |
Net cash (outflow)/inflow | | | (2,104,418 | ) | | | (460,296,468 | ) | | | 284,494,845 | |
| | | | | | | | | | | | |
| | Year ended 31 December 2018 | |
| | | | | | | | | | Immediate | |
| | Related | | | Fellow | | | holding | |
| | company | | | subsidiaries | | | company | |
| | HK$ | | | HK$ | | | HK$ | |
| | | | | | | | | | | | |
Operating activities | | | 7,500 | | | | (2,375,375,220 | ) | | | 439,200,382 | |
Financing activities | | | — | | | | 1,675,510,800 | | | | — | |
Net cash inflow/(outflow) | | | 7,500 | | | | (699,864,420 | ) | | | 439,200,382 | |
| | | | | | | | | | | | |
| | Nine months ended 30 September 2019 | |
| | | | | | | | | | Immediate | |
| | Related | | | Fellow | | | holding | |
| | company | | | subsidiaries | | | company | |
| | HK$ | | | HK$ | | | HK$ | |
| | | | | | | | | | | | |
Investing activities | | | — | | | | — | | | | (2,003,373,593 | ) |
Net cash outflow | | | — | | | | — | | | | (2,003,373,593 | ) |
| | | | | | | | | | | | |
| | Nine months ended 30 September 2018 | |
| | | | | | | | | | Immediate | |
| | Related | | | Fellow | | | holding | |
| | company | | | subsidiaries | | | company | |
| | HK$ | | | HK$ | | | HK$ | |
| | (Unaudited) | | | (Unaudited) | | | (Unaudited) | |
| | | | | | | | | | | | |
Operating activities | | | 7,500 | | | | 338,614,921 | | | | (351,779,064 | ) |
Financing activities | | | — | | | | 203,607,914 | | | | — | |
Net cash inflow/(outflow) | | | 7,500 | | | | 542,222,835 | | | | (351,779,064 | ) |
AMTD INTERNATIONAL INC.
NOTES TO THE CONSOLIDATED FINANCIAL STATEMENTS (CONTINUED)
FOR THE YEARS ENDED 31 DECEMBER 2017 AND 2018
AND FOR THE NINE MONTHS ENDED 30 SEPTEMBER 2018 AND 2019
24. | RELATED PARTY TRANSACTIONS |
| (a) | In addition to the transactions disclosed elsewhere in these consolidated financial statements, the Group had the following transactions with related parties during the years/periods: |
| | | | | Year ended 31 December | | | Nine months ended 30 September | |
| | | Notes | | | 2017 | | | 2018 | | | 2018 | | | 2019 | |
| | | | | | HK$ | | | HK$ | | | HK$ | | | HK$ | |
| | | | | | | | | | | | (Unaudited) | | | | |
| | | | | | | | | | | | | | | | |
Underwriting services rendered to immediate holding company | | | (i) | | | | 31,221,600 | | | | — | | | | — | | | | 26,420,072 | |
Financial advisory services rendered to fellow subsidiaries | | | (i) | | | | — | | | | 70,988,340 | | | | 70,988,340 | | | | 15,691,000 | |
Management fee income from a fellow subsidiary | | | (i) | | | | 2,231,559 | | | | — | | | | — | | | | — | |
Investment advisory fee paid to a fellow subsidiary | | | (i) | | | | 15,000 | | | | 180,000 | | | | 135,000 | | | | 135,000 | |
Insurance commission paid to a fellow subsidiary | | | (i) | | | | 81,606 | | | | 57,063 | | | | — | | | | 50,478 | |
Management services fee paid to immediate holding company | | | (i) | | | | — | | | | — | | | | — | | | | 112,500 | |
Asset management services rendered to a fellow subsidiary | | | (i) | | | | — | | | | 5,784,775 | | | | 5,743,276 | | | | 457,431 | |
Acquisition of investment from a fellow subsidiary | | | (ii) | | | | — | | | | 72,072,000 | | | | — | | | | — | |
Administrative service fee paid to immediate holding company | | | (iii) | | | | — | | | | — | | | | — | | | | 6,000,000 | |
Recharge from/(to) immediate holding company | | | | | | | | | | | | | | | | | | | | |
—Staff costs | | | | | | | 66,163,850 | | | | 11,678,050 | | | | 18,760,329 | | | | 17,936,752 | |
—Premises cost | | | | | | | 17,910,916 | | | | 9,329,432 | | | | 7,721,080 | | | | 5,300,986 | |
—Office renovation | | | | | | | 14,118,570 | | | | 1,250,906 | | | | 1,676,425 | | | | 869,214 | |
—Other operating expenses / (income), net | | | | | | | 10,512,120 | | | | (1,753,759 | ) | | | 4,723,794 | | | | 9,798,649 | |
| | | (iii) | | | | 108,705,456 | | | | 20,504,629 | | | | 32,881,628 | | | | 33,905,601 | |
| Notes: |
| | |
| (i) | The terms of these services were comparable to the fee and conditions offered to the major customers of the Group. |
| | |
| (ii) | The transaction represented the transfer of 234,000 ordinary shares of a listed company from its fellow subsidiary based on the market price as at 12 December 2018. |
| | |
| (iii) | During the years ended 31 December 2017 and 2018, staff costs, office renovation and other operating expenses (e.g. advertisement and promotional expense) were recharged by the immediate holding company based on the proportion of the Company's revenue to the consolidated revenue of the immediate holding company, net of expenses incurred by the Group. Premises cost was recharged based on actual usage. Starting from the third quarter of year 2019, the immediate holding company charged a fixed service fee of HK$6,000,000 per quarter in place of previous recharging arrangement. |
| | |
| (iv) | As at 30 June 2018, the Group transferred the retail insurance brokerage business to fellow subsidiaries at net asset value of HK$775,955, including accounts and other receivables of HK$1,366,402 and accounts and other payables of HK$590,447 through current accounts. The fellow subsidiaries were disposed by the immediate holding company to a third party on the same date. |
AMTD INTERNATIONAL INC.
NOTES TO THE CONSOLIDATED FINANCIAL STATEMENTS (CONTINUED)
FOR THE YEARS ENDED 31 DECEMBER 2017 AND 2018
AND FOR THE NINE MONTHS ENDED 30 SEPTEMBER 2018 AND 2019
24. | RELATED PARTY TRANSACTIONS (CONTINUED) |
| (a) | In addition to the transactions disclosed elsewhere in these consolidated financial statements, the Group had the following transactions with related parties during the years/periods (continued): |
| (v) | Subsequent to 30 September 2019, the Founder and Executive Chairman of the counterparty with which the Group has entered into the Agreements (Note 14), was appointed as a Director and Vice Chairman to the Board of Directors of the Company (Note 28). |
| (b) | Outstanding balances with related parties: |
| (i) | As at 1 January 2017, the Group had an outstanding balance due from a fellow subsidiary of HK$130,000,000 which was unsecured, bears interest of 2.5% per annum and repayable on demand. Interest receivable at 1 January 2017 amounted to HK$3,223,360 was included in due from fellow subsidiaries. During the year ended 31 December 2017, the outstanding balance of HK$130,000,000 became interest free. As at 31 December 2017, the outstanding balance of HK$130,000,000 and interest receivable of HK$3,223,360 were unsecured, interest free and repayable on demand and were included in amounts due from fellow subsidiaries. During the year ended 31 December 2018, the balances due from the fellow subsidiary were fully settled. |
| | |
| | During the year ended 31 December 2017, the Group advanced HK$70,332,300 (equivalent to US$9,000,000), which was unsecured, interest free and repayable on demand, to a fellow subsidiary. At 31 December 2017, the outstanding balance of HK$70,332,300 was included in amounts due from fellow subsidiaries. During the year ended 31 December 2018, such balance was fully settled. |
| | |
| | As at 31 December 2017 and 2018, the Group's outstanding balances due from its fellow subsidiaries and immediate holding company arising from intercompany advances were unsecured, interest free and repayable on demand, except for the balances described above. |
| | |
| | As at 31 December 2017 and 2018, the Group's outstanding balances due to its fellow subsidiaries and immediate holding company arising from intercompany advances were unsecured, interest free and repayable on demand. |
| | |
| | As at 30 September 2019, the Group’s outstanding balance with its immediate holding company carried an interest at 2% per annum and was repayable on demand. The Group did not have any outstanding balances with its fellow subsidiaries as at 30 September 2019. As at 31 December 2017 and 2018 and 30 September 2019, there was no provision of credit loss on amounts due from fellow subsidiaries and immediate holding company. |
| | |
| (ii) | As at 31 December 2018 and 30 September 2019, the Group had an outstanding accounts receivable balance due from its fellow subsidiaries of HK$70,875,980 and HK$15,681,400, respectively. The balances arose from the provision of investment banking services and the balances were non-interest bearing with settlement terms mutually agreed by both parties. |
| | |
| | As at 30 September 2019, the Group had an outstanding accounts receivable balance due from its fellow subsidiaries of HK$281,285. The balances arose from the provision of asset management services and the overdue balance was interest bearing and repayable on similar credit terms to those offered to other customers of the Group. |
AMTD INTERNATIONAL INC.
NOTES TO THE CONSOLIDATED FINANCIAL STATEMENTS (CONTINUED)
FOR THE YEARS ENDED 31 DECEMBER 2017 AND 2018
AND FOR THE NINE MONTHS ENDED 30 SEPTEMBER 2018 AND 2019
24. | RELATED PARTY TRANSACTIONS (CONTINUED) |
| (b) | Outstanding balances with related parties (continued): |
| (iii) | As at 31 December 2017 and 2018 and 30 September 2019, the Group had an outstanding balance due from a related company associated with a major shareholder of HK$4,092,519, HK$4,085,019 and HK$4,085,019, respectively. This balance was unsecured, interest free and repayable on demand. As at 31 December 2017 and 2018 and 30 September 2019, there was no provision of credit loss on amount due from the related company. |
| | |
| (iv) | As at 31 December 2017, the Group held listed equity shares with fair value of HK$489,600,000 through a share custody entrustment agreement with a fellow subsidiary. The fellow subsidiary was the beneficiary owner of the shares and therefore the fellow subsidiary recorded the listed equity shares as its financial assets. The listed equity shares were used to secure part of the Group’s margin loans payable as at 31 December 2017. |
| | |
| | The fellow subsidiary shall bear all costs and expenses in connection with the custody, acquisition and disposal of the listed equity shares. The Group recorded other income from a fellow subsidiary of HK$15,285,311 and HK$3,666,040 for the years ended 31 December 2017 and 2018, respectively, in connection with the reimbursement of interest expenses of the related margin loans payable. As at 31 December 2018 and 30 September 2019, the Group did not hold any listed equity shares through the share custody entrustment agreement. |
| (c) | Compensation of key management personnel of the Group: |
| | Year ended 31 December | | | Nine months ended 30 September | |
| | 2017 | | | 2018 | | | 2018 | | | 2019 | |
| | HK$ | | | HK$ | | | HK$ | | | HK$ | |
| | | | | | | | (Unaudited) | | | | |
| | | | | | | | | | | | |
Short-term employee benefits | | | 8,745,651 | | | | 19,473,470 | | | | 20,912,111 | | | | 36,114,574 | |
Other long-term benefit | | | 53,624 | | | | 61,428 | | | | 54,426 | | | | 72,000 | |
| | | 8,799,275 | | | | 19,534,898 | | | | 20,966,537 | | | | 36,186,574 | |
AMTD INTERNATIONAL INC.
NOTES TO THE CONSOLIDATED FINANCIAL STATEMENTS (CONTINUED)
FOR THE YEARS ENDED 31 DECEMBER 2017 AND 2018
AND FOR THE NINE MONTHS ENDED 30 SEPTEMBER 2018 AND 2019
25. | FINANCIAL INSTRUMENTS BY CATEGORY |
| |
| The carrying amounts of each of the categories of financial instruments as at the end of the reporting period are as follows: |
| |
| As at 31 December 2017 |
| |
| Financial assets |
| | Financial assets at | | | | | | | |
| | fair value through | | | | | | | |
| | profit or loss | | | | | | | |
| | Mandatorily | | | | | | | |
| | required to be | | | Financial assets at | | | | |
| | measured at | | | amortised | | | | |
| | fair value | | | cost | | | Total | |
| | HK$ | | | HK$ | | | HK$ | |
Accounts receivable | | | — | | | | 93,172,716 | | | | 93,172,716 | |
Financial assets included in prepayments, | | | | | | | | | | | | |
other receivables and other assets | | | — | | | | 1,832,109 | | | | 1,832,109 | |
Due from a related company | | | — | | | | 4,092,519 | | | | 4,092,519 | |
Due from fellow subsidiaries | | | — | | | | 2,458,702,841 | | | | 2,458,702,841 | |
Financial assets at fair value through profit or loss | | | 745,629,400 | | | | — | | | | 745,629,400 | |
Stock loan | | | 2,203,140,000 | | | | — | | | | 2,203,140,000 | |
Cash and bank balances—general accounts | | | — | | | | 86,415,282 | | | | 86,415,282 | |
Bank balances—segregated accounts | | | — | | | | 403,491,699 | | | | 403,491,699 | |
| | | 2,948,769,400 | | | | 3,047,707,166 | | | | 5,996,476,566 | |
| | Financial | |
| | liabilities at | |
| | amortised cost | |
| | HK$ | |
| | | |
Clients' monies held on trust | | | 383,304,389 | |
Accounts payable | | | 7,128,142 | |
Margin loans payable | | | 351,609,630 | |
Financial liabilities included in other payables and accruals | | | 6,516,678 | |
Due to fellow subsidiaries | | | 853,123,095 | |
Due to immediate holding company | | | 1,640,450,071 | |
| | | 3,242,132,005 | |
AMTD INTERNATIONAL INC.
NOTES TO THE CONSOLIDATED FINANCIAL STATEMENTS (CONTINUED)
FOR THE YEARS ENDED 31 DECEMBER 2017 AND 2018
AND FOR THE NINE MONTHS ENDED 30 SEPTEMBER 2018 AND 2019
25. | FINANCIAL INSTRUMENTS BY CATEGORY (CONTINUED) |
| |
| The carrying amounts of each of the categories of financial instruments as at the end of the reporting period are as follows (continued): |
| |
| As at 31 December 2018 |
| |
| Financial assets |
| | Financial assets at | | | | | | | |
| | fair value through | | | | | | | |
| | profit or loss | | | | | | | |
| | Mandatorily | | | Financial | | | | |
| | required to be | | | assets at | | | | |
| | measured at | | | amortised | | | | |
| | fair value | | | cost | | | Total | |
| | HK$ | | | HK$ | | | HK$ | |
| | | | | | | | | | | | |
Accounts receivable | | | — | | | | 161,093,054 | | | | 161,093,054 | |
Financial assets included in prepayment, | | | | | | | | | | | | |
other receivables and other assets | | | — | | | | 6,042,605 | | | | 6,042,605 | |
Due from a related company | | | — | | | | 4,085,019 | | | | 4,085,019 | |
Due from immediate holding company | | | — | | | | 66,141,756 | | | | 66,141,756 | |
Due from fellow subsidiaries | | | — | | | | 2,596,118,859 | | | | 2,596,118,859 | |
Financial assets at fair value through profit or loss | | | 1,953,078,309 | | | | — | | | | 1,953,078,309 | |
Stock loan | | | 1,535,679,600 | | | | — | | | | 1,535,679,600 | |
Cash and bank balances—general accounts | | | — | | | | 126,855,518 | | | | 126,855,518 | |
Bank balances—segregated accounts | | | — | | | | 615,491,200 | | | | 615,491,200 | |
| | | 3,488,757,909 | | | | 3,575,828,011 | | | | 7,064,585,920 | |
Financial liabilities
| | Financial | |
| | liabilities at | |
| | amortised cost | |
| | HK$ | |
| | | | |
Clients' monies held on trust | | | 586,891,255 | |
Accounts payable | | | 15,310,871 | |
Margin loans payable | | | 321,999,549 | |
Financial liabilities included in other payables and accruals | | | 25,011,870 | |
Due to fellow subsidiaries | | | 574,202,907 | |
Due to immediate holding company | | | 2,145,792,209 | |
| | | 3,669,208,661 | |
AMTD INTERNATIONAL INC.
NOTES TO THE CONSOLIDATED FINANCIAL STATEMENTS (CONTINUED)
FOR THE YEARS ENDED 31 DECEMBER 2017 AND 2018
AND FOR THE NINE MONTHS ENDED 30 SEPTEMBER 2018 AND 2019
25. | FINANCIAL INSTRUMENTS BY CATEGORY (CONTINUED) |
| |
| The carrying amounts of each of the categories of financial instruments as at the end of the reporting period are as follows (continued): |
| |
| As at 30 September 2019 Financial assets |
| | Financial assets at | | | | | | | |
| | fair value through | | | | | | | |
| | profit or loss | | | | | | | |
| | Mandatorily | | | Financial | | | | |
| | required to be | | | assets at | | | | |
| | measured at | | | amortised | | | | |
| | fair value | | | cost | | | Total | |
| | HK$ | | | HK$ | | | HK$ | |
| | | | | | | | | | | | |
Accounts receivable | | | — | | | | 170,601,380 | | | | 170,601,380 | |
Financial assets included in prepayment, | | | | | | | | | | | | |
other receivables and other assets | | | — | | | | 10,460,739 | | | | 10,460,739 | |
Due from a related company | | | — | | | | 4,085,019 | | | | 4,085,019 | |
Due from immediate holding company | | | — | | | | 1,951,534,980 | | | | 1,951,534,980 | |
Financial assets at fair value through profit or loss | | | 1,750,862,599 | | | | — | | | | 1,750,862,599 | |
Stock loan | | | 1,376,205,180 | | | | — | | | | 1,376,205,180 | |
Derivative financial instrument | | | 807,618,000 | | | | — | | | | 807,618,000 | |
Cash and bank balances—general accounts | | | — | | | | 669,130,849 | | | | 669,130,849 | |
Bank balances—segregated accounts | | | — | | | | 287,968,500 | | | | 287,968,500 | |
| | | 3,934,685,779 | | | | 3,093,781,467 | | | | 7,028,467,246 | |
Financial liabilities
| | Financial | |
| | liabilities at | |
| | amortised cost | |
| | HK$ | |
| | | |
Clients' monies held on trust | | | 300,429,276 | |
Accounts payable | | | 6,725,012 | |
Margin loans payable | | | 321,775,552 | |
Financial liabilities included in other payables and accruals | | | 28,722,438 | |
| | | 657,652,278 | |
AMTD INTERNATIONAL INC.
NOTES TO THE CONSOLIDATED FINANCIAL STATEMENTS (CONTINUED)
FOR THE YEARS ENDED 31 DECEMBER 2017 AND 2018
AND FOR THE NINE MONTHS ENDED 30 SEPTEMBER 2018 AND 2019
26. | FAIR VALUE AND FAIR VALUE HIERARCHY OF FINANCIAL INSTRUMENTS |
| |
| The carrying amounts and fair values of the Group’s financial instruments, other than those with carrying amounts that reasonably approximate to fair values, are as follows: |
| | Carrying amounts | | | Fair values | |
| | 31 December | | | 30 September | | | 31 December | | | 30 September | |
| | 2017 | | | 2018 | | | 2019 | | | 2017 | | | 2018 | | | 2019 | |
| | HK$ | | | HK$ | | | HK$ | | | HK$ | | | HK$ | | | HK$ | |
| | | | | | | | | | | | | | | | | | |
Financial assets | | | | | | | | | | | | | | | | | | |
Financial assets at fair value through profit or loss | | | 745,629,400 | | | | 1,953,078,309 | | | | 1,750,862,599 | | | | 745,629,400 | | | | 1,953,078,309 | | | | 1,750,862,599 | |
Derivative financial instrument | | | — | | | | — | | | | 807,618,000 | | | | — | | | | — | | | | 809,156,635 | |
Stock loan | | | 2,203,140,000 | | | | 1,535,679,600 | | | | 1,376,205,180 | | | | 2,203,140,000 | | | | 1,535,679,600 | | | | 1,376,205,180 | |
| | | 2,948,769,400 | | | | 3,488,757,909 | | | | 3,934,685,779 | | | | 2,948,769,400 | | | | 3,488,757,909 | | | | 3,936,224,414 | |
| Management has assessed that the fair values of cash and cash balances, accounts receivable, financial assets included in prepayments, other receivables and other assets, accounts payable, financial liabilities included in other payables and accruals, clients' monies held on trust, margin loans payable, and balances with a related company, fellow subsidiaries and immediate holding company, approximate to their carrying amounts largely due to the short-term maturities of these instruments or repayable on demand. |
| |
| The Group's finance department headed by the finance director is responsible for determining the policies and procedures for the fair value measurement of financial instruments. The finance director reports directly to the chief financial officer. At each reporting date, finance department analyses the movements in the values of financial instruments and determines the major inputs applied in the valuation. The valuation is reviewed and approved by the chief financial officer. |
| |
| The valuation procedures applied include consideration of recent transactions in the same security or financial |
| instrument, recent financing of the investee companies, economic and market conditions, current and projected financial performance of the investee companies, and the investee companies' management team as well as potential future strategies to realize the investments. |
| |
| The fair values of the financial assets and liabilities are included at the amount at which the instrument could be exchanged in a current transaction between willing parties, other than in a forced or liquidation sale. The following methods and assumptions were used to estimate the fair values: |
| |
| As at 31 December 2017 and 2018 and 30 September 2019, the fair values of listed equity investments, including the stock loan, were based on quoted market prices. |
| |
| As at 31 December 2018 and 30 September 2019, the fair values of unlisted debt and equity investments-Investment C and Investment E were based on the prices of recent transactions of the same instruments with the same rights of the same issuers that occurred within 12 months without adjustment. |
AMTD INTERNATIONAL INC.
NOTES TO THE CONSOLIDATED FINANCIAL STATEMENTS (CONTINUED)
FOR THE YEARS ENDED 31 DECEMBER 2017 AND 2018
AND FOR THE NINE MONTHS ENDED 30 SEPTEMBER 2018 AND 2019
26. | FAIR VALUE AND FAIR VALUE HIERARCHY OF FINANCIAL INSTRUMENTS (CONTINUED) |
| |
| As at 31 December 2017, the fair value of unlisted equity investment-Investment D was based on the prices of recent transactions occured within 12 months without adjustment. As at 31 December 2018, the fair value of unlisted equity investment-Investment D has been estimated using an EVA valuation technique based on assumptions that are supported by observable recent transactions with similar risk characteristics. The valuation requires management to estimate the expected equity volatility and hence they are subject to uncertainty. |
| |
| As at 30 September 2019, the fair value of the unlisted equity investment-Investment D was estimated using an EVA valuation technique relying on the hybrid method, considering two scenarios in a probability weighted expected return method (“PWERM”) framework, and using the option pricing method (“OPM”) to allocate value in one of the scenarios. The valuation requires the management to consider two scenarios in its PWERM analysis which was non-IPO exit event and IPO exit event and hence they were subject to uncertainty. The input of the equity value of unlisted equity investment-Investment D was estimated using market approach. |
| |
| The fair value of the warrants was estimated using binomial option pricing model which requires the management to estimate the volatility of the fair value of the equity securities. |
| |
| The fair value of the derivative financial instrument was estimated using the MCS and was determined based on significant observable and unobservable inputs including the current stock price, dividend yield, risk-free rate, volatility of the underlying equity securities and the credit rating of the counterparty on the valuation date. MCS is a financial model that is commonly used to simulate variables that are highly unpredictable. The valuations performed using the MCS require management to estimate the volatility of the underlying equity securities and the credit rating of the counterparty and hence the valuations are subject to estimation uncertainty. The Group classifies the fair value of derivative financial instrument as Level 3. The management believed that the estimated fair values resulting from the valuation technique were reasonable. The accounting policy of the day 1 profit or loss arising from the difference between the transaction price and the fair value upon initial recognition is disclosed in Note 2.3 to the consolidated financial statements. |
| |
| Below is summary of significant unobservable inputs to valuation of financial instruments together with a quantitative sensitivity analysis as at 31 December 2018: |
| | Valuation technique | | Significant unobservable input | | Range | | Sensitivity of value to the input |
| | | | | | | | |
Unlisted equity investments | | EVA | | Equity volatility | | 56.72% | | 5% increase/ decrease in volatility results in decrease/ increase in fair value by 0.27%/0.15% |
AMTD INTERNATIONAL INC.
NOTES TO THE CONSOLIDATED FINANCIAL STATEMENTS (CONTINUED)
FOR THE YEARS ENDED 31 DECEMBER 2017 AND 2018
AND FOR THE NINE MONTHS ENDED 30 SEPTEMBER 2018 AND 2019
26. | FAIR VALUE AND FAIR VALUE HIERARCHY OF FINANCIAL INSTRUMENTS (CONTINUED) |
| |
| Below is summary of significant unobservable inputs to valuation of financial instruments together with a quantitative sensitivity analysis as at 30 September 2019: |
| | Valuation technique | | Significant unobservable input | | Range | | Sensitivity of value to the input |
| | | | | | | | |
Unlisted equity investment | | Multiple/ EVA | | Equity volatility | | 32.78% | | 5% increase/ decrease in volatility results in decrease/ increase in fair value by 0.03%-0.17%/ 0.00%-0.09% |
| | | | | | | | |
Warrants | | Binominal option pricing model | | Equity volatility | | 47.56%-48.37% | | 10% increase/ decrease in volatility results in decrease/ increase in fair value by 2.49%-3.46%/ 2.03%-3.46% |
| | | | | | | | |
Derivative financial instrument | | MCS | | Calculated volatility of underlying Assets | | 41.13%-45.46% | | 5% increase/ decrease in volatility results in increase/ decrease in fair value by 1.02%/1.24% |
| | | | | | |
| | Credit rating | | BB | | One rank level increase in credit rating of Company from BB to BBB results in increase in fair value by 0.01% |
| | | | | |
| | | | | One rank level decrease in credit rating of Company from BB to B results in decrease in fair value by 0.28% |
AMTD INTERNATIONAL INC.
NOTES TO THE CONSOLIDATED FINANCIAL STATEMENTS (CONTINUED)
FOR THE YEARS ENDED 31 DECEMBER 2017 AND 2018
AND FOR THE NINE MONTHS ENDED 30 SEPTEMBER 2018 AND 2019
26. | FAIR VALUE AND FAIR VALUE HIERARCHY OF FINANCIAL INSTRUMENTS (CONTINUED) |
| |
| Fair Value Hierarchy |
| |
| The following tables illustrate the fair value measurement hierarchy of the Group's financial instruments: |
| |
| Assets measured at fair value: |
| | Fair value measurement using | |
| | Quoted prices | | | Significant | | | Significant | | | | |
| | in active | | | observable | | | unobservable | | | | |
| | markets | | | inputs | | | inputs | | | | |
| | (Level 1) | | | (Level 2) | | | (Level 3) | | | Total | |
| | HK$ | | | HK$ | | | HK$ | | | HK$ | |
| | | | | | | | | | | | |
As at 31 December 2017 | | | | | | | | | | | | |
| | | | | | | | | | | | |
Financial assets at fair value | | | | | | | | | | | | |
through profit or loss | | | 730,000,000 | | | | — | | | | 15,629,400 | | | | 745,629,400 | |
Stock loan | | | 2,203,140,000 | | | | — | | | | — | | | | 2,203,140,000 | |
| | | 2,933,140,000 | | | | — | | | | 15,629,400 | | | | 2,948,769,400 | |
| | | | | | | | | | | | | | | | |
As at 31 December 2018 | | | | | | | | | | | | | | | | |
| | | | | | | | | | | | | | | | |
Financial assets at fair value | | | | | | | | | | | | | | | | |
through profit or loss | | | 1,671,836,400 | | | | — | | | | 281,241,909 | | | | 1,953,078,309 | |
Stock loan | | | 1,535,679,600 | | | | — | | | | — | | | | 1,535,679,600 | |
| | | 3,207,516,000 | | | | — | | | | 281,241,909 | | | | 3,488,757,909 | |
| | | | | | | | | | | | | | | | |
As at 30 September 2019 | | | | | | | | | | | | | | | | |
| | | | | | | | | | | | | | | | |
Financial assets at fair value | | | | | | | | | | | | | | | | |
through profit or loss | | | 1,432,376,820 | | | | — | | | | 318,485,861 | | | | 1,750,862,681 | |
Stock loan | | | 1,376,205,180 | | | | — | | | | — | | | | 1,376,205,180 | |
Derivative financial instrument | | | — | | | | — | | | | 807,618,000 | | | | 807,618,000 | |
| | | 2,808,582,000 | | | | — | | | | 1,126,103,861 | | | | 3,934,685,861 | |
| During the years ended 31 December 2017 and 2018 and 30 September 2019, there were no transfers of fair value measurements between Level 1 and Level 2 and no transfers into or out of Level 3. |
| |
| The movements in fair value measurements within Level 3 during the years/period are as follow: |
| | Year ended 31 December | | | Nine months ended 30 September | |
| | 2017 | | | 2018 | | | 2019 | |
| | | HK$ | | | HK$ | | | HK$ | |
| | | | | | | | | | |
Unlisted debt securities and unlisted equity shares at fair value through profit or loss: | | | | | | | | | |
At 1 January | | | — | | | | 15,629,400 | | | | 281,241,909 | |
Total unrealized gain recognised in profit or loss | | | 18,600 | | | | 54,156,295 | | | | 37,243,870 | |
Purchase | | | 15,610,800 | | | | 211,456,214 | | | | — | |
At 31 December/30 September | | | 15,629,400 | | | | 281,241,909 | | | | 318,485,779 | |
AMTD INTERNATIONAL INC.
NOTES TO THE CONSOLIDATED FINANCIAL STATEMENTS (CONTINUED)
FOR THE YEARS ENDED 31 DECEMBER 2017 AND 2018
AND FOR THE NINE MONTHS ENDED 30 SEPTEMBER 2018 AND 2019
26. | FAIR VALUE AND FAIR VALUE HIERARCHY OF FINANCIAL INSTRUMENTS (CONTINUED) |
| |
| The movements in fair value measurements within Level 3 during the years/period are as follow (continued): |
| | Nine months ended 30 September 2019 | |
| | HK$ | |
| | | |
Warrants at fair value through profit or loss: | | | |
At 1 January | | | — | |
Issued | | | 15,699,600 | |
Exercised | | | (15,699,600 | ) |
At 30 September | | — | |
| | Nine months ended 30 September 2019 | |
| | HK$ | |
| | | |
Derivative financial instrument: | | | |
At 1 January | | | — | |
Recognition of day 1 profit generated on 1 April 2019 | Note 14 | | 355,294,216 | |
Recognition of day 1 profit generated on 1 July 2019 | Note 14 | | 115,758,384 | |
Other fair value gains recognised in profit or loss | Note 14 | | 336,565,400 | |
At 30 September | | | 807,618,000 | |
27. | FINANCIAL RISK MANAGEMENT OBJECTIVES AND POLICIES |
| |
| The Group has various financial assets and liabilities such as financial assets at fair value through profit or loss, stock loan, accounts receivable, accounts payable, financial assets included in prepayments, other receivables and other assets, financial liabilities included in other payables and accruals, clients' monies held on trust, margin loans payable, amounts with a related company, fellow subsidiaries and immediate holding company which primarily arise directly from its operations. |
| |
| The main risks arising from the Group's financial instruments are price risk, foreign currency risk, credit risk and liquidity risk. Management manages and monitors these risks to ensure appropriate measures are implemented on a timely and effective manner. |
| |
| Price risk |
| Equity price risk is the risk that the fair values of equity investments decrease as a result of changes in the levels of equity indices and the value of individual securities. |
| |
| The Group is exposed to equity securities price risk because certain investments held by the Group are classified in the consolidated statements of financial position as financial assets at fair value through profit or loss. Result for the year would increase/decrease as a result of gains/losses on equity securities classified as financial assets at fair value through profit or loss. |
| |
| At 31 December 2017 and 2018 and 30 September 2019, if there had been a 5% increase/decrease in the market value of financial assets at fair value through profit or loss and stock loan with all other variables held constant, the Group's profit before tax would have been approximately HK$146,657,000, HK$160,375,800 and HK$140,429,100 higher/lower. |
| |
| The Group had concentration risk in its strategic investments segment as 25%, 46% and 46% of financial assets at fair values through profit or loss at 31 December 2017 and 2018 and 30 September 2019, respectively, and 100% of stock loan at 31 December 2017 and 2018 and 30 September 2019 were investments in listed equity shares in Investment A. |
AMTD INTERNATIONAL INC.
NOTES TO THE CONSOLIDATED FINANCIAL STATEMENTS (CONTINUED)
FOR THE YEARS ENDED 31 DECEMBER 2017 AND 2018
AND FOR THE NINE MONTHS ENDED 30 SEPTEMBER 2018 AND 2019
27. | FINANCIAL RISK MANAGEMENT OBJECTIVES AND POLICIES (CONTINUED) |
| |
| Price risk (continued) |
| On 1 April 2019, the Group entered Agreements with the counterparty in relation to the movement of the share price of the entirety of the listed shares of Investment A the Group owns (“Underlying Assets”) to reduce the changes in fair value of financial assets of the Group. The Agreements were modified and renewed several times as disclosed in Note 14. The derivative financial instrument is initially recognised at fair value and are subsequently remeasured at fair value. Any gains or losses arising from changes in fair value of derivative financial instrument are taken directly to profit or loss. During the nine months ended 30 September 2019, changes in the fair value of the derivative financial instrument of HK$807,618,000, were charged to profit or loss. |
| |
| Foreign currency risk |
| Certain transactions of the Group are denominated in foreign currencies which are different from the functional currency of the Group, i.e. HK$, and therefore the Group is exposed to foreign currency risk. The Group currently does not have a foreign currency hedging policy. However, management monitors foreign exchange exposure and will consider hedging significant foreign exchange exposure should the need arise. As HK$ is currently pegged to United States dollars ("US$"), management considers that there is no significant foreign currency risk arising from the Group's monetary assets and the liability denominated in US$. |
| |
| The Group's key currency risk exposure primarily arises from accounts receivable and bank balances denominated in Australian Dollar ("AUD"), Euro ("EUR"), Renminbi ("RMB") and New Taiwan Dollar ("NTD"). The sensitivity at the end of the reporting period to a reasonably possible change in the AUD, EUR, RMB and NTD exchange rate, with all other variables held constant, of the Group's profit before tax is as followings: |
| |
| Foreign currency sensitivity |
| If AUD had appreciated/depreciated by 5% with all other variables held constant, the impact on the Group's profit before tax would be HK$84,996, HK$3,536, nil and HK$3,402 for the years ended 31 December 2017 and 2018 and for the nine months ended 30 September 2018 and 2019, respectively. |
| |
| If EUR had appreciated/depreciated by 5% with all other variables held constant, the impact on the Group's profit before tax for the year would be HK$4,903 for the year ended 31 December 2017. |
| |
| If RMB had appreciated/depreciated by 5% with all other variables held constant, the impact on the Group's profit before tax would be HK$13,163, HK$12,405, HK$12,723 and HK$12,978 for the years ended 31 December 2017 and 2018 and for the nine months ended 30 September 2018 and 2019, respectively. |
| |
| If NTD had appreciated/depreciated by 5% with all other variables held constant, the impact on the Group's profit before tax would be HK$277,654, HK$74,959, HK$60,258 and HK$287,051 for the years ended 31 December 2017 and 2018 and for the nine months ended 30 September 2018 and 2019, respectively. |
| |
| In management's opinion, the sensitivity analysis is unrepresentative of the inherent foreign exchange risk during the years ended 31 December 2017 and 2018 and the nine months ended 30 September 2018 and 2019. |
AMTD INTERNATIONAL INC.
NOTES TO THE CONSOLIDATED FINANCIAL STATEMENTS (CONTINUED)
FOR THE YEARS ENDED 31 DECEMBER 2017 AND 2018
AND FOR THE NINE MONTHS ENDED 30 SEPTEMBER 2018 AND 2019
27. | FINANCIAL RISK MANAGEMENT OBJECTIVES AND POLICIES (CONTINUED) |
| |
| Credit risk |
| Credit risk refers to the risk that a counterparty will default on its contractual obligations resulting in financial loss to the Group. The Group has adopted a policy of only dealing with creditworthy counterparties, as a means of mitigating the risk of financial loss from defaults. The Group's exposure of its counterparties is continuously monitored and the aggregate value of transactions concluded is spread amongst approved counterparties. Credit exposure is controlled by counterparty limits that are reviewed and approved by the management periodically. |
| |
| The Group has credit risk exposure in relation the Agreements entered into with a counterparty amounting to HK$807,618,000 as at 30 September 2019 (Note 14). On 20 December 2019, the Group entered into a pledge agreement with the same counterparty pursuant to which the counterparty pledged certain listed securities to the Group as collateral (Note 28). |
| |
| The carrying amount of financial assets recorded in the consolidated financial statements, grossed up for any allowances for losses, represents the Group's maximum exposure to credit risk. |
| |
| The credit risk on liquid funds is limited because the counterparties are mainly banks and insurance companies with sound credit. |
AMTD INTERNATIONAL INC.
NOTES TO THE CONSOLIDATED FINANCIAL STATEMENTS (CONTINUED)
FOR THE YEARS ENDED 31 DECEMBER 2017 AND 2018
AND FOR THE NINE MONTHS ENDED 30 SEPTEMBER 2018 AND 2019
27. | FINANCIAL RISK MANAGEMENT OBJECTIVES AND POLICIES (CONTINUED) |
| |
| Credit risk (continued) |
| Maximum exposure and staging as at 31 December 2017 and 2018 and 30 September 2019 |
| The table below shows the credit quality and the maximum exposure to expected credit loss (“ECL”) based on the Group's credit policy, which is mainly based on past due information unless other information is available without undue cost or effort, and the staging classification as at 31 December 2017 and 2018 and 30 September 2019. The amounts presented are gross carrying amounts for financial assets at amortised cost. |
| |
| As at 31 December 2017 |
| | | 12-month | | | | | | | | | | | | | |
| | | ECLs | | | Lifetime ECLs | | | | |
| | | Stage 1 | | | Stage 2 | | | Stage 3 | | | Simplified approach | | | | |
| | | HK$ | | | HK$ | | | HK$ | | | HK$ | | | HK$ | |
Accounts receivable* | | | | — | | | | — | | | | — | | | | 93,172,716 | | | | 93,172,716 | |
Financial assets included in prepayments, | | | | | | | | | | | | | | | | | | | | | |
other receivables and other assets | | | | | | | | | | | | | | | | | | | | | |
| —Normal** | | | | 1,832,109 | | | | — | | | | — | | | | — | | | | 1,832,109 | |
| —Doubtful** | | | | — | | | | — | | | | — | | | | — | | | | — | |
Due from a related company | | | | | | | | | | | | | | | | | | | | | |
| —Normal** | | | | 4,092,519 | | | | — | | | | — | | | | — | | | | 4,092,519 | |
| —Doubtful** | | | | — | | | | — | | | | — | | | | — | | | | — | |
Due from fellow subsidiaries | | | | | | | | | | | | | | | | | | | | | |
| —Normal** | | | | 2,458,702,841 | | | | — | | | | — | | | | — | | | | 2,458,702,841 | |
| —Doubtful** | | | | — | | | | — | | | | — | | | | — | | | | — | |
Bank balances-segregated accounts | | | | | | | | | | | | | | | | | | | | | |
| —Not yet past due | | | | 403,491,699 | | | | — | | | | — | | | | — | | | | 403,491,699 | |
Cash and bank balances-general accounts | | | | | | | | | | | | | | | | | | | | | |
| —Not yet past due | | | | 86,415,282 | | | | — | | | | — | | | | — | | | | 86,415,282 | |
| | | | | | | | | | | | | | | | | | | | | | |
| | | | | 2,954,534,450 | | | | — | | | | — | | | | 93,172,716 | | | | 3,047,707,166 | |
| * | For accounts receivable to which the Group applies the simplified approach for impairment, information based on the provision matrix is disclosed in Note 11 to the consolidated financial statements. |
| | |
| ** | The credit quality of the financial assets included in prepayments, other receivables and other assets, due from a related company and due from fellow subsidiaries is considered to be "normal" when they are not past due and there is no information indicating that the financial assets had a significant increase in credit risk since initial recognition. Otherwise, the credit quality of the financial assets is considered to be "doubtful". |
AMTD INTERNATIONAL INC.
NOTES TO THE CONSOLIDATED FINANCIAL STATEMENTS (CONTINUED)
FOR THE YEARS ENDED 31 DECEMBER 2017 AND 2018
AND FOR THE NINE MONTHS ENDED 30 SEPTEMBER 2018 AND 2019
27. | FINANCIAL RISK MANAGEMENT OBJECTIVES AND POLICIES (CONTINUED) |
| |
| Credit risk (continued) |
| Maximum exposure and staging as at 31 December 2017 and 2018 and 30 September 2019 (continued) |
| |
| As at 31 December 2018 |
| | 12-month ECLs | | | Lifetime ECLs | | | | |
| | | | | | | | | | | Simplified | | | | |
| | Stage 1 | | | Stage 2 | | | Stage 3 | | | approach | | | | |
| | HK$ | | | HK$ | | | HK$ | | | HK$ | | | HK$ | |
| | | | | | | | | | | | | | | |
Accounts receivable* | | | — | | | | — | | | | — | | | | 158,518,003 | | | | 158,518,003 | |
Accounts receivable | | | | | | | | | | | | | | | | | | | | |
—Normal** | | | 2,575,051 | | | | — | | | | — | | | | — | | | | 2,575,051 | |
—Doubtful** | | | — | | | | — | | | | — | | | | — | | | | — | |
Financial assets included in prepayments, | | | | | | | | | | | | | | | | | | | | |
other receivables and other assets | | | | | | | | | | | | | | | | | | | | |
—Normal** | | | 6,042,605 | | | | — | | | | — | | | | — | | | | 6,042,605 | |
—Doubtful** | | | — | | | | — | | | | — | | | | — | | | | — | |
Due from a related company | | | | | | | | | | | | | | | | | | | | |
—Normal** | | | 4,085,019 | | | | — | | | | — | | | | — | | | | 4,085,019 | |
—Doubtful** | | | — | | | | — | | | | — | | | | — | | | | — | |
Due from immediate holding company | | | | | | | | | | | | | | | | | | | | |
—Normal** | | | 66,141,756 | | | | — | | | | — | | | | — | | | | 66,141,756 | |
—Doubtful** | | | — | | | | — | | | | — | | | | — | | | | — | |
Due from fellow subsidiaries | | | | | | | | | | | | | | | | | | | | |
—Normal** | | | 2,596,118,859 | | | | — | | | | — | | | | — | | | | 2,596,118,859 | |
—Doubtful** | | | — | | | | — | | | | — | | | | — | | | | — | |
Bank balances-segregated accounts | | | | | | | | | | | | | | | | | | | | |
—Not yet past due | | | 615,491,200 | | | | — | | | | — | | | | — | | | | 615,491,200 | |
Cash and bank balances-general accounts | | | | | | | | | | | | | | | | | | | | |
—Not yet past due | | | 126,855,518 | | | | — | | | | — | | | | — | | | | 126,855,518 | |
| | | | | | | | | | | | | | | | | | | | |
| | | 3,417,310,008 | | | | — | | | | — | | | | 158,518,003 | | | | 3,575,828,011 | |
______________________
* | For accounts receivable to which the Group applies the simplified approach for impairment, information based on the provision matrix is disclosed in Note 11 to the consolidated financial statements. |
| |
** | The credit quality of the financial assets included in prepayments, other receivables and other assets, due from a related company, due from immediate holding company and due from fellow subsidiaries is considered to be "normal" when they are not past due and there is no information indicating that the financial assets had a significant increase in credit risk since initial recognition. Otherwise, the credit quality of the financial assets is considered to be "doubtful". |
AMTD INTERNATIONAL INC.
NOTES TO THE CONSOLIDATED FINANCIAL STATEMENTS (CONTINUED)
FOR THE YEARS ENDED 31 DECEMBER 2017 AND 2018
AND FOR THE NINE MONTHS ENDED 30 SEPTEMBER 2018 AND 2019
27. | FINANCIAL RISK MANAGEMENT OBJECTIVES AND POLICIES (CONTINUED) |
| |
| Credit risk (continued) |
| Maximum exposure and staging as at 31 December 2017 and 2018 and 30 September 2019 (continued) |
| |
| As at 30 September 2019 |
| | | 9-month ECLs | | | Lifetime ECLs | | | | |
| | | Stage 1 | | | Stage 2 | | | Stage 3 | | | Simplified approach | | | | |
| | | HK$ | | | HK$ | | | HK$ | | | HK$ | | | HK$ | |
| | | | | | | | | | | | | | | | |
Accounts receivable* | | | | — | | | | — | | | | — | | | | 170,601,380 | | | | 170,601,380 | |
Financial assets included in prepayments, | | | | | | | | | | | | | | | | | | | | | |
other receivables and other assets | | | | | | | | | | | | | | | | | | | | | |
| —Normal** | | | | 10,460,739 | | | | — | | | | — | | | | — | | | | 10,460,739 | |
| —Doubtful** | | | | — | | | | — | | | | — | | | | — | | | | — | |
Due from a related company | | | | | | | | | | | | | | | | | | | | | |
| —Normal** | | | | 4,085,019 | | | | — | | | | — | | | | — | | | | 4,085,019 | |
| —Doubtful** | | | | — | | | | — | | | | — | | | | — | | | | — | |
Due from immediate holding company | | | | | | | | | | | | | | | | | | | | | |
| —Normal** | | | | 1,951,534,980 | | | | — | | | | — | | | | — | | | | 1,951,534,980 | |
| —Doubtful** | | | | — | | | | — | | | | — | | | | — | | | | — | |
Bank balances-segregated accounts | | | | | | | | | | | | | | | | | | | | | |
| —Not yet past due | | | | 669,130,849 | | | | — | | | | — | | | | — | | | | 669,130,849 | |
Cash and bank balances-general accounts | | | | | | | | | | | | | | | | | | | | | |
| —Not yet past due | | | | 287,968,500 | | | | — | | | | — | | | | — | | | | 287,968,500 | |
| | | | | | | | | | | | | | | | | | | | | | |
| | | | | 2,923,180,087 | | | | — | | | | — | | | | 170,601,380 | | | | 3,093,781,467 | |
| * | For accounts receivable to which the Group applies the simplified approach for impairment, information based on the provision matrix is disclosed in Note 11 to the consolidated financial statements. |
| | |
| ** | The credit quality of the financial assets included in prepayments, other receivables and other assets, due from a related company and due from immediate holding company is considered to be "normal" when they are not past due and there is no information indicating that the financial assets had a significant increase in credit risk since initial recognition. Otherwise, the credit quality of the financial assets is considered to be "doubtful". |
| | |
| Liquidity risk |
| The Group aims to maintain cash and credit lines to meet its liquidity requirements. The Group finances its working capital requirements through a combination of funds generated from operations, loans and equity financing. The following tables detail the Group’s remaining contractual maturity for its financial liabilities. The tables have been drawn up based on the undiscounted cash flows of financial liabilities based on the earliest date on which the Group can be required to pay. |
AMTD INTERNATIONAL INC.
NOTES TO THE CONSOLIDATED FINANCIAL STATEMENTS (CONTINUED)
FOR THE YEARS ENDED 31 DECEMBER 2017 AND 2018
AND FOR THE NINE MONTHS ENDED 30 SEPTEMBER 2018 AND 2019
27. | FINANCIAL RISK MANAGEMENT OBJECTIVES AND POLICIES (CONTINUED) |
| |
| Liquidity risk (continued) |
| | 31 December 2017 | |
| | Weighted | | | On demand | | | | | | | | | | |
| | average | | | or less than | | | 3 months | | | 1 to 5 | | | | |
| | interest rate | | | 3 months | | | to 1 year | | | years | | | Total | |
| | % | | | HK$ | | | HK$ | | | HK$ | | | HK$ | |
| | | | | | | | | | | | | | | | | | | | |
Accounts payable | | | N/A | | | | 7,128,142 | | | | — | | | | — | | | | 7,128,142 | |
Margin loans payable | | | 5.25 | % | | | 351,609,630 | | | | — | | | | — | | | | 351,609,630 | |
Clients' monies held on trust | | | N/A | | | | 383,304,389 | | | | — | | | | — | | | | 383,304,389 | |
Financial liabilities included in | | | | | | | | | | | | | | | | | | | | |
other payables and accruals | | | N/A | | | | 6,516,678 | | | | — | | | | — | | | | 6,516,678 | |
Due to fellow subsidiaries | | | N/A | | | | 853,123,095 | | | | — | | | | — | | | | 853,123,095 | |
Due to immediate holding company | | | N/A | | | | 1,640,450,071 | | | | — | | | | — | | | | 1,640,450,071 | |
| | | | | | | 3,242,132,005 | | | | — | | | | — | | | | 3,242,132,005 | |
| | 31 December 2018 | |
| | Weighted | | | On demand | | | | | | | | | | |
| | average | | | or less than | | | 3 months | | | 1 to 5 | | | | |
| | interest rate | | | 3 months | | | to 1 year | | | years | | | Total | |
| | % | | | HK$ | | | HK$ | | | HK$ | | | HK$ | |
| | | | | | | | | | | | | | | |
Accounts payable | | | N/A | | | | 15,310,871 | | | | — | | | | — | | | | 15,310,871 | |
Margin loans payable | | | 6.75 | % | | | 321,999,549 | | | | — | | | | — | | | | 321,999,549 | |
Clients' monies held on trust | | | N/A | | | | 586,891,255 | | | | — | | | | — | | | | 586,891,255 | |
Financial liabilities included in | | | | | | | | | | | | | | | | | | | | |
other payables and accruals | | | N/A | | | | 25,011,870 | | | | — | | | | — | | | | 25,011,870 | |
Due to fellow subsidiaries | | | N/A | | | | 574,202,907 | | | | — | | | | — | | | | 574,202,907 | |
Due to immediate holding company | | | N/A | | | | 2,145,792,209 | | | | — | | | | — | | | | 2,145,792,209 | |
| | | | | | | 3,669,208,661 | | | | — | | | | — | | | | 3,669,208,661 | |
| | 30 September 2019 | |
| | Weighted | | | On demand | | | | | | | | | | |
| | average | | | or less than | | | 3 months | | | 1 to 5 | | | | |
| | interest rate | | | 3 months | | | to 1 year | | | years | | | Total | |
| | % | | | HK$ | | | HK$ | | | HK$ | | | HK$ | |
| | | | | | | | | | | | | | | |
Accounts payable | | | N/A | | | | 6,725,012 | | | | — | | | | — | | | | 6,725,012 | |
Margin loans payable | | | 6.75 | % | | | 321,775,552 | | | | — | | | | — | | | | 321,775,552 | |
Clients' monies held on trust | | | N/A | | | | 300,429,276 | | | | — | | | | — | | | | 300,429,276 | |
Financial liabilities included in | | | | | | | | | | | | | | | | | | | | |
other payables and accruals | | | N/A | | | | 28,722,438 | | | | — | | | | — | | | | 28,722,438 | |
| | | | | | | 657,652,278 | | | | — | | | | — | | | | 657,652,278 | |
AMTD INTERNATIONAL INC.
NOTES TO THE CONSOLIDATED FINANCIAL STATEMENTS (CONTINUED)
FOR THE YEARS ENDED 31 DECEMBER 2017 AND 2018
AND FOR THE NINE MONTHS ENDED 30 SEPTEMBER 2018 AND 2019
27. | FINANCIAL RISK MANAGEMENT OBJECTIVES AND POLICIES (CONTINUED) |
| |
| Capital risk management |
| The Group manages its capital to ensure that the Group will be able to continue as a going concern while maximising the return to stakeholders through the optimisation of the debt and equity balance. |
| |
| The capital structure of the Group consists of debt which includes amounts due to the immediate holding company, equity attributable to equity holders of the Group, comprising issued share capital, retained profits and capital reserves, as disclosed in consolidated statements of changes in equity. |
| |
| As AMTD GM and AMTD AAAPL are licensed corporations under the Hong Kong Securities and Futures Ordinances, the Group is subject to statutory capital requirement and is required to maintain adequate financial resources to support its business. The Securities and Futures (Financial Resources) Rules require a licensed corporation to maintain liquid capital which is not less than its required liquid capital. |
| |
| In addition, AMTD GM is a member of the Hong Kong Confederation of Insurance Brokers, which is required to maintain a minimum capital and net assets value of not less than HK$100,000. |
| |
| There were no changes on the Group's approach to capital risk management during the years ended 31 December 2017 and 2018 and the nine months ended 30 September 2019. |
| |
28. | SUBSEQUENT EVENTS |
| |
| In December 2019, the Company issued (i) an aggregate of 7,307,692 Class A ordinary shares and 4,526,627 Class B ordinary shares, both with par value US$0.0001 per share, for an aggregate amount of US$100 million (representing a per share price of US$8.45) to Value Partners Greater China High Yield Income Fund, Ariana Capital Investment Limited and Infinity Power Investments Limited, and (ii) convertible note due 2023 in an aggregate principal amount of US$15 million to Value Partners Greater China High Yield Income Fund, each in the form of private placement. Infinity Power Investments Limited is a British Virgin Islands company wholly owned by Mr. Calvin Choi, Chairman and Chief Executive Officer of the Company. |
| |
| On 20 December 2019, the Founder and Executive Chairman of the counterparty with which the Group has entered into the Agreement (Note 14), was appointed as a Director and Vice Chairman to the Board of Directors of the Company. |
| |
| On 20 December 2019, the Group entered into a pledge agreement with the counterparty with which the Group has entered into the Agreement (Note 14). Pursuant to the pledge agreement, the counterparty pledged certain listed securities to the Group as collateral. As at 20 December 2019, the market value of the listed securities pledged to the Group amounted to approximately HK$957,828,792 (Note 27). |
| |
| On 31 December 2019, the Agreements were extended for an additional three-month period ending on 31 March 2020 (Note 14). |
| |
| The emergence and wide spread of the novel Coronavirus (“COVID-19”) in China since the beginning of 2020 has affected business and economic activities in Mainland China and the rest of the world. The Group will monitor the developments of the COVID-19 situation closely, assess and respond proactively to minimize any adverse impacts on the financial position and operating results of the Group. The situation is fluid and challenging facing all the industries of the society and therefore an estimate of its financial effect on the Group cannot be made at this stage. |
| |
| In preparing the consolidated financial statements, the Group has evaluated events and transactions for potential recognition and disclosure through 31 March 2020, the date of the consolidated financial statements were available to be issued. |
AMTD INTERNATIONAL INC.
NOTES TO THE CONSOLIDATED FINANCIAL STATEMENTS (CONTINUED)
FOR THE YEARS ENDED 31 DECEMBER 2017 AND 2018
AND FOR THE NINE MONTHS ENDED 30 SEPTEMBER 2018 AND 2019
29. | APPROVAL OF CONSOLIDATED FINANCIAL STATEMENTS |
| |
| The consolidated financial statements were approved and authorised for issue by the Board of Directors on 31 March 2020. |
APPENDIX F
LIST OF PAST AND PRESENT PRINCIPAL DIRECTORSHIPS
The list of present and past principal directorships or equivalent position held by our Directors and Executive Officers in the last five years preceding the date of this document (excluding those held in our Company) is as follows:
Name | | Present | | Past |
(A) Directors | | | | |
| | | | |
(1) Calvin Choi | | 1. AMTD Group Company Limited 2. AMTD Foundation Limited 3. Bank of Qingdao Co., Ltd. 4. One Child Network & Support Inc. 5. Windy Hill Pte. Ltd. 6. Ariana Square Capital Group Limited 7. DDC Enterprise Ltd 8. Grand Leader Technology Limited 9. Infinity Power Investments Limited 10. ASEAN Financial Innovation Network Ltd. 11. AMTD Property Development Group 12. DHI Holdings (S) Pte. Ltd. 13. DHI Downtown Pte. Ltd. 14. Cosmic Gold Limited 15. Easy Advance Developments Limited 16. AMTD Digital Inc. 17. Gravitation Fintech HK Limited 18. Infinity Power Investments Pte. Ltd. 19. Singa Group Pte. Ltd. 20. AMTD Digital Holdings Pte. Ltd. | | 1. AMTD Properties (HK) Limited 2. AMTD Asia Holdings Limited 3. AMTD Asia Limited 4. AMTD Strategic Capital Group 5. AMTD Investments Limited 6. AMTD Investment Solutions Limited 7. AMTD Principal Investment Solutions Group Limited 8. AMTD Risk Solutions Limited 9. AMTD Risk Solutions Group Limited 10. AMTD Wealth Management Solutions Limited 11. AMTD Wealth Management Solutions Group Limited 12. AMTD Strategic Capital Limited 13. AMTD Direct Limited 14. AMTD Overseas Holdings Limited 15. AMTD International Limited 16. AMTD China (Holdings) Limited 17. AMTD Risk Consulting Limited |
| | | | |
(2) Marcellus Wong. | | 1. AMTD Group Company Limited | | 1. L.R. Capital Management Company (Cayman) Limited |
| | | | |
| | 2. Xinte Energy Co., Ltd. | | 2. L.R. Capital Financial Holdings Limited |
| | | | |
| | 3. AMTD Digital Investments Holdings Limited | | 3. AMTD Risk Consulting Limited |
| | | | |
| | 4. AMTD Digital Financial Holdings Limited | | 4. AMTD Global Markets Limited |
Name | | Present | | Past |
| | | | |
| | 5. AMTD Digital Media Holdings Limited 6. AMTD Digital Connectors Holdings Limited 7. AMTD Consumer Finance Limited 8. AMTD Global Markets Pte. Ltd. 9. Dense Globe Investments Limited 10. Fine Cosmos Development Limited 11. AMTD Strategic Investment (BVI) Limited 12. AMTD Fintech Investment (BVI) Limited 13. AMTD Investment Solutions Group (BVI) Limited 14. AMTD Overseas (BVI) Limited 15. AMTD Investment Inc. 16. AMTD Direct Investment III Limited 17. AMTD Direct Investment IV Limited 18. AMTD Direct Investment I Limited 19. AMTD Direct Investment II Limited 20. AMTD Fintech Investment Limited 21. AMTD Biomedical Investment Limited 22. AMTD Strategic Investment Limited 23. AMTD Strategic Capital Group 24. AMTD Wealth Management Solutions Limited 25. AMTD Overseas Limited 26. AMTD Overseas (Holdings) Limited 27. AMTD International Limited 28. AMTD Foundation Limited | | 5. Asia Alternative Asset Partners Limited 6. Tras Street Commercial Property Holdings Pte. Ltd. 7. 40 Tras Street Property Pte. Ltd. 8. TP Investments Holdings Pte. Ltd. 9. TP Properties Investments Pte. Ltd. 10. Duxton Property Investments Pte. Ltd. 11. Duxton 3 Properties Investments Pte. Ltd. 12. Ann Siang Property Holdings Pte. Ltd. 13. Club Street property Holdings Pte. Ltd. 14. C-4 Investments Pte. Ltd. 15. China Minsheng New Energy Investment Group Co. Ltd. |
Name | | Present | | Past |
| | | | |
| | 29. AMTD Fintech Investment Limited 30. AMTD Investment Solutions Group Limited 31. AMTD Risk Solutions Limited 32. AMTD Investment Solutions Limited 33. AMTD Principal Investment Solutions Group Limited 34. AMTD Asia (Holdings) Limited 35. AMTD Asia Limited 36. AMTD Investments Limited 37. AMTD Strategic Capital Limited 38. AMTD Risk Solutions Group Limited 39. AMTD International Holding Group Limited 40. AMTD Securities Limited 41. Hope Key Investments Limited 42. Allied Will Limited 43. Allied Winner Corporation Limited 44. Adventure International Company Limited | | |
| | | | |
(3) Andrew Chiu. | | 1. Aiton International Limited 2. Alvord Global Limited 3. Ample Luxury International Limited 4. Ariana Consultants Limited 5. Ariana Capital Investment Limited 6. Ariana Shipping Consortium Limited 7. Ariana Social Community (Property) Limited (Formerly known as Ariana Social Community Property Limited) 8. Ariana Social Community Limited 9. Ariana Social Community Management Limited | | — |
Name | | Present | | Past |
| | | | |
| | 10. Bryce International Limited 11. Cheer Noble Limited 12. Courage Dragon Limited 13. Deacon House International Limited 14. Dragon Topper Development Limited 15. Easy Expert Limited 16. Expert Vision Trading Limited 17. Far East Intercontinental Ltd 18. Far East Organization (International) Limited 19. Fast Noble Limited 20. First Topper Limited 21. Gold Prime Group Limited 22. Goldmate Development Ltd 23. Ju Ching Chu English College Ltd 24. Jumbo Way Limited 25. King Peak Limited 26. Land Pacific Asia Limited 27. Land Pacific Limited 28. Lucky Delta Limited 29. New Acme Holdings Limited 30. Pacific Creator Limited 31. Pacific Shiner Limited 32. Pacific Worth Limited 33. Partner Joy Ltd 34. Precious Jade Limited 35. Precious Pearl Group Limited 36. Rainbow Garden Holdings Limited 37. Regent Billion Limited 38. Shui On Loong Development Co Ltd 39. Sonia Development Ltd 40. Star Noble Limited | | |
Name | | Present | | Past |
| | | | |
| | 41. Vast World Investment Co Ltd 42. Vital Time International Limited 43. Cable Communications Limited 44. Ark Hospitality Sdn Bhd 45. Ark Suites And Residences Sdn Bhd 46. Ivory Milestone Sdn Bhd 47. Malaysia Land Properties Sdn Bhd 48. Mayland Success Sdn Bhd 49. Mayland Supreme Sdn Bhd 50. Nautical Frontier Sdn Bhd 51. Land Pacific Development Sdn Bhd 52. Millennium Junction Sdn Bhd 53. Sapphire Pendent Sdn Bhd 54. Sapphire Eagel Sdn Bhd 55. Land & General Berhad 56. Country Garden Properties (Malaysia) Sdn Bhd | | |
| | | | |
(4) Raymond Yung | | 1. Citibank (Hong Kong) Limited 2. EMQ Limited 3. AMTD Foundation Limited | | 1. Guangzhou Rural Commercial Bank Co., Ltd |
| | | | |
(5) Yu Gao | | 1. AMTD Group Company Limited 2. Anhui One & Only Holding Co., Ltd. 3. Baijia International Group Limited 4. Baiyi Hospital Management (Hangzhou) Co., Limited 5. Beijing Xin Caiju Information Consulting Co., Ltd. 6. Chariot Group Holding (Cayman) Limited 7. Chariot Group Company (Cayman) Limited | | 1. Asia Global Investment Co. Ltd 2. AMTD Asia Limited 3. AMTD Asia (Holdings) Limited 4. AMTD Strategic Capital Group 5. Beijing Gang Rui Feng Business Co., Ltd. 6. Belle International Holdings Limited 7. Changdi Private Equity I Fortune TJ Limited 8. Chariot Group (Delaware) Inc. |
Name | | Present | | Past |
| | | | |
| | 8. Chariot Holding (Cayman) Limited 9. Chariot Company (Cayman) Limited 10. China Dongxiang (Group) Co., Ltd. (3818.HK) 11. Coinage International Company Limited 12. Diamond Infant Formula Holding Limited 13. Feihe China Nutrition Company 14. Flying Crane International Inc. 15. Hangzhou Baijia Hospital Management Company Limited 16. HCIL Master Option Limited 17. Home Control International Limited 18. Home Control Singapore Pte. Ltd. 19. Beijing Huangjihuang Trading Co., Ltd. 20. Royal Dynasty International Holding Company Limited 21. I-Services Network Solution Limited 22. Kaiser Leasing (Cayman) Limited 23. Kaiser Leasing (HK) Company Limited 24. Kaiser Leasing Holding Limited 25. MoCloud Investment Management (Hangzhou) Company Limited 26. North Haven Private Equity Asia Gas Holdings Limited 27. Morgan Stanley (China) Private Equity Investment Management Co., Ltd. 28. North Haven Private Equity Asia Hotpot Holding Limited 29. North Haven Private Equity Asia Cuisine Holding Limited | | 9. Gas Investment China Co., Ltd. 10. Harmony Gas Holdings Limited 11. Idea Thrive Limited 12. Image Private Equity Holding Limited 13. Jiangxi Jiangli Sci&Tech Co., Ltd 14. Morgan Stanley Global Emerging Markets Holdings (Cayman) Ltd. 15. MS Dairy Holdings 16. MS Dairy Holdings II, Limited 17. MS Fiber Holding Limited 18. North Haven Strategic Holdings Company Limited 19. North Haven Private Equity Asia IV Affluence Limited 20. North Haven Financial Services Strategic Investments Company Limited 21. New Prosper Holdings Limited 22. North Haven Private Equity Asia Harbor Company Limited 23. Crane Medical Hong Kong Limited 24. Crane Pharmaceutical Hong Kong Limited 25. North Haven Private Equity Asia Harbor Holding Limited 26. Prosperity Gas Holdings Limited 27. Changdi Private Equity I Fortune Limited 28. Sichuan Ni&Co Guorun New Materials Co., Ltd 30. Simmer Pot Holding Company Limited 31. Sino Gas International Holdings, Inc. 32. Tongkun Group Co., Ltd. |
Name | | Present | | Past |
| | | | |
| | 30. North Haven Private Equity Asia IMF Holding Limited 31. North Haven Private Equity Asia Champion Holding Limited 32. North Haven Private Equity Asia Healthcare Holding Limited 33. North Haven Private Equity Asia Hospital Holding Limited 34. North Haven TCM Holding Limited 35. NHPEA Idea (HK) Limited 36. NHPEA Idea (HK2) Limited 37. NHPEA IV Diamond Holding (Cayman) Limited 38. NHPEA Ortho Holding HK Limited 39. NHPEA Ortho Company HK Limited 40. North Haven Private Equity Asia Fortune Company Limited 41. North Haven Private Equity Asia Fortune Holding Limited 42. North Haven Private Equity Asia Kappa (HK) Limited 43. North Haven Private Equity Asia Baby Care Holding Limited 44. North Haven Private Equity Asia Baby Care Company Limited 45. MS Resources (HK) Limited 46. New Fortune II Hong Kong Limited 47. New Fortune II Cayman Limited 48. Nissos Holdings (CY) Limited 49. China Feihe Limited 50. Changdi Private Equity I Fortune Limited 51. Shandong Buchang Pharmaceutical Co., Ltd | | |
Name | | Present | | Past |
| | | | |
| | 52. Shenzhen ZTE Jinyun Technology Co., Ltd 53. Sparkle Roll Group Limited (970.HK) 54. Tianjin North Haven Kappa Enterprise Management Consulting Company Limited 55. Yancheng Haipurun Membrane Technology Co., Ltd. 56. Coinage Hong Kong Company Limited | | |
| | | | |
(6) Feridun Hamdullahpur | | 1. AMTD Group Company Limited | | |
| | | | |
(B) Executive Officers | | | | |
| | | | |
(1) Calvin Choi | | Please refer above. | | Please refer above. |
| | | | |
(2) Marcellus Wong. | | Please refer above. | | Please refer above. |
| | | | |
(3) William Fung | | 1. AMTD Global Markets Limited 2. AMTD Wealth Management Solutions Group Limited 3. Asia Alternative Asset Partners Limited | | |
| | | | |
(4) Cliff Li | | 1. AMTD Digital Investments Holdings Limited 2. AMTD Properties (HK) Limited 3. Dense Globe Investments Limited 4. Fine Cosmos Development Limited 5. DHI Downtown Pte. Ltd. 6. DHI Holdings (S) Pte. Ltd. | | 1. AMTD Digital Inc. 2. AMTD Digital Financial Holdings Limited 3. AMTD Digital Media Holdings Limited 4. AMTD Digital Connectors Holdings Limited |
| | | | |
(5) Derek Chung. | | 1. Tian Zhi Media Limited 2. No Jokes Entertainment Limited | | |
| | | | |
(6) Tim Fang | | 1. AMTD Global Markets Limited | | |
| | | | |
(7) Gabriel Ming Lin Cheung | | | | |
[This page is intentionally left blank]