| 2023 Half Year Results Presentation Douglas Thompson Managing Director & CEO Gerhard Ziems Group Chief Financial Officer 8 August 2023 All units in U.S. dollars and metric tonnes, unless otherwise stated |
| HY23 Results Presentation 2 Important Notices and Disclaimer The material contained in this presentation is intended to be general background information on Coronado Global Resources (Coronado) and its activities. The information is supplied in summary form and is therefore not necessarily complete. It is not intended that it be relied upon as advice to investors or potential investors, who should consider seeking independent professional advice depending upon their specific investment objectives, financial situation or particular needs. The material contained in this presentation may include information derived from publicly available sources that have not been independently verified. No representation or warranty is made as to the accuracy, completeness or reliability of the information. All amounts are in United States dollars unless otherwise indicated. The presentation of certain financial information may not be compliant with financial captions in the primary financial statements prepared under US GAAP. Refer to Coronado’s Quarterly Report on Form 10-Q for the quarterly period ended 30 June 2023 available at www.coronadoglobal.com for details of the basis primary financial statements prepared under US GAAP. This presentation contains statements that constitute “forward-looking statements” within the meaning of Section 27A of the US Securities Act of 1933 and Section 21E of the US Securities Exchange Act of 1934. Forward looking statements are statements about matters that are not historical facts. Forward-looking statements appear in a number of places in this presentation and include statements regarding our intent, belief or current expectations with respect to our business and operations, market conditions and results of operations. This report contains forward-looking statements concerning our business, operations, financial performance and condition, the coal, steel and other industries, as well as our plans, objectives and expectations for our business, operations, financial performance and condition. Forward-looking statements may be identified by words such as “may”, “could”, “believes”, “estimates”, “expects”, “intends”, “plans”, “considers”, “forecasts”, “targets” and other similar words that involve risk and uncertainties. Forward-looking statements provide management's current expectations or predictions of future conditions, events or results. All statements that address operating performance, events or developments that we expect or anticipate will occur in the future are forward-looking statements. They may include estimates of revenues, income, earnings per share, cost savings, capital expenditures, dividends, share repurchases, liquidity, capital structure, market share, industry volume, or other financial items, descriptions of management’s plans or objectives for future operations, or descriptions of assumptions underlying any of the above. All forward-looking statements speak only as of the date they are made and reflect the company's good faith beliefs, assumptions and expectations, but they are not guarantees of future performance or events. Furthermore, the Company disclaims any obligation to publicly update or revise any forward-looking statement, except as required by law. By their nature, forward-looking statements are subject to risks and uncertainties that could cause actual results to differ materially from those suggested by the forward-looking statements. Factors that might cause such differences include, but are not limited to, a variety of economic, competitive and regulatory factors, many of which are beyond the Company's control, as described in our Annual Report on Form 10-K filed with the ASX and SEC on 22 February 2023 (AEST), our Quarterly Report on Form 10-Q filed with the ASX and SEC on 9 May 2023 (AEST) and our Quarterly Report on Form 10-Q filed with the ASX and SEC on 8 August 2023 (AEST), as well as additional factors we may disclose from time to time in other filings with the ASX and SEC. You may get such filings for free at our website at www.coronadoglobal.com. You should understand that it is not possible to predict or identify all such factors and, consequently, you should not consider any such list to be a complete set of all potential risks or uncertainties. In this presentation, references to ore reserves (Reserves) are compliant with the Australasian Code for Reporting of Exploration Results, Mineral Resources and Ore Reserves 2012 (JORC Code) and are measured in accordance with the JORC Code. Information in this presentation relating to Coal Reserves and Coal Resources is extracted from information published by Coronado and available on the Coronado and ASX websites (2022 JORC Statement also released to the ASX on 22 February 2023). For details of the Coal Reserves and Coal Resources estimates and the Competent Persons statements, refer to relevant Australian and U.S. Operations sections in the 2022 JORC Statement. As an SEC registrant, our SEC disclosures of resources and reserves follow the requirements of subpart 1300 of Regulation S-K under the US Securities Exchange Act of 1934. Accordingly, our estimates of resources and reserves in this presentation and in our other ASX disclosures may be different than our estimates of resources and reserves as reported in our Annual Report on Form 10-K for the year ended 31 December 2022 and in other reports that we are required to file with the SEC. |
| Presentation Title 3 CEO Address Douglas Thompson Managing Director & CEO HY23 Results Presentation 3 |
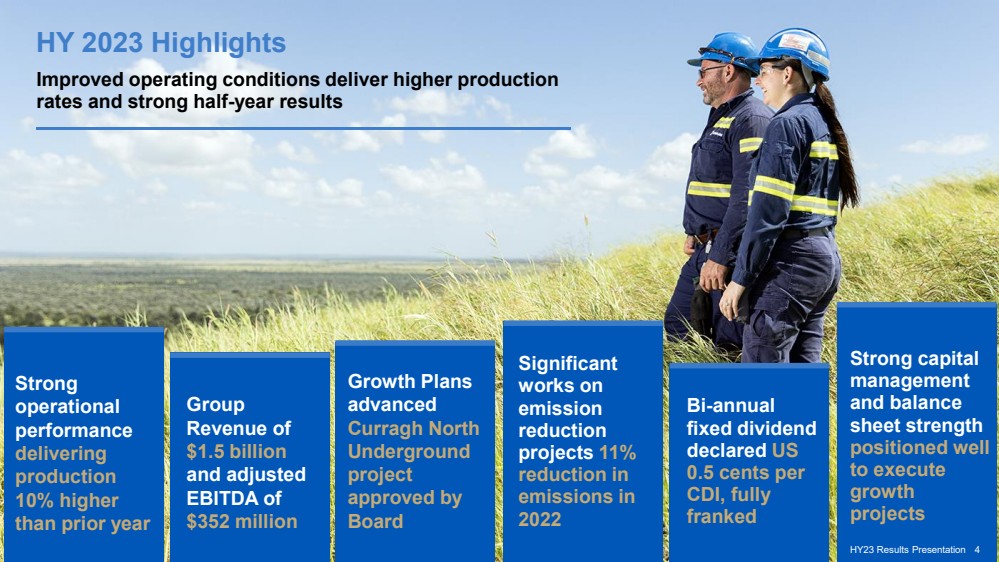
| Strong operational performance delivering production 10% higher than prior year Growth Plans advanced Curragh North Underground project approved by Board Group Revenue of $1.5 billion and adjusted EBITDA of $352 million Significant works on emission reduction projects 11% reduction in emissions in 2022 Bi-annual fixed dividend declared US 0.5 cents per CDI, fully franked Strong capital management and balance sheet strength positioned well to execute growth projects HY 2023 Highlights Improved operating conditions deliver higher production rates and strong half-year results HY23 Results Presentation 4 |
| HY23 Results Presentation 5 A leading international producer of high - quality metallurgical coal, an essential element in the production of steel. HY23 Results Presentation 5 |

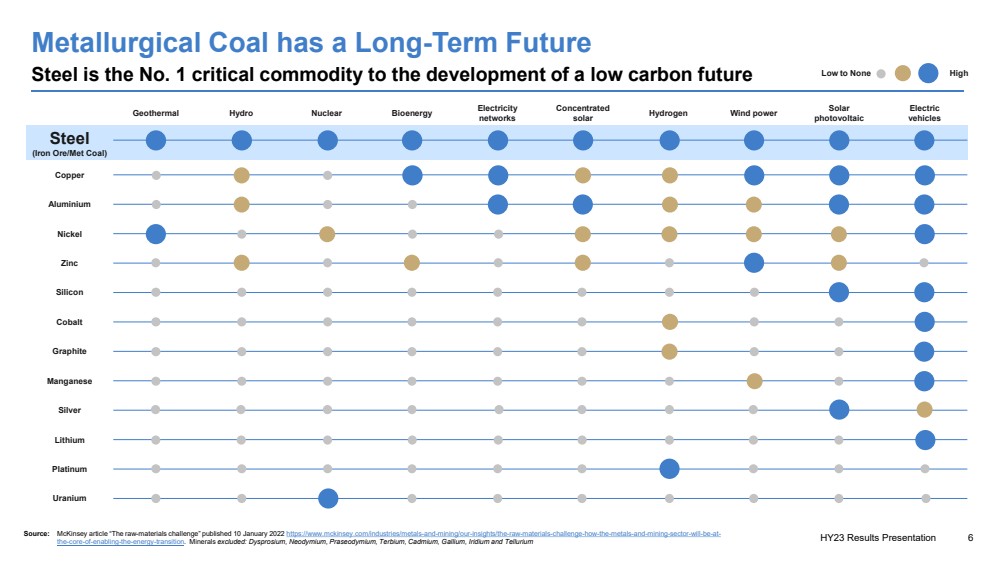
| HY23 Results Presentation 6 Geothermal Hydro Nuclear Bioenergy Electricity networks Concentrated solar Hydrogen Wind power Solar photovoltaic Electric vehicles Steel (Iron Ore/Met Coal) Copper Aluminium Nickel Zinc Silicon Cobalt Graphite Manganese Silver Lithium Platinum Uranium Low to None High Source: McKinsey article “The raw-materials challenge” published 10 January 2022 https://www.mckinsey.com/industries/metals-and-mining/our-insights/the-raw-materials-challenge-how-the-metals-and-mining-sector-will-be-at-the-core-of-enabling-the-energy-transition. Minerals excluded: Dysprosium, Neodymium, Praseodymium, Terbium, Cadmium, Gallium, Iridium and Tellurium Metallurgical Coal has a Long-Term Future Steel is the No. 1 critical commodity to the development of a low carbon future |
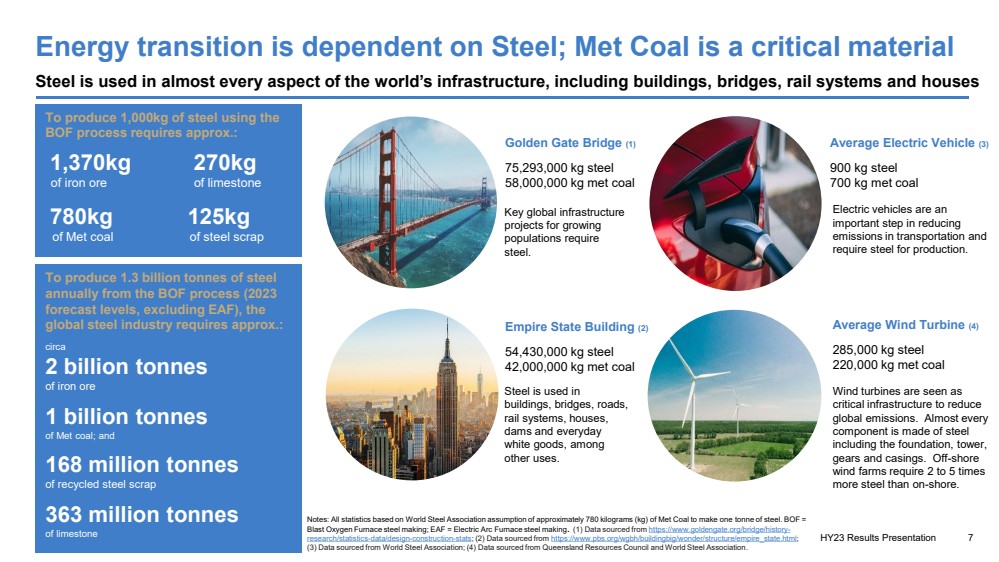
| HY23 Results Presentation 7 Energy transition is dependent on Steel; Met Coal is a critical material Steel is used in almost every aspect of the world’s infrastructure, including buildings, bridges, rail systems and houses To produce 1,000kg of steel using the BOF process requires approx.: 1,370kg 270kg of iron ore of limestone 780kg 125kg of Met coal of steel scrap To produce 1.3 billion tonnes of steel annually from the BOF process (2023 forecast levels, excluding EAF), the global steel industry requires approx.: circa 2 billion tonnes of iron ore 1 billion tonnes of Met coal; and 168 million tonnes of recycled steel scrap 363 million tonnes of limestone Notes: All statistics based on World Steel Association assumption of approximately 780 kilograms (kg) of Met Coal to make one tonne of steel. BOF = Blast Oxygen Furnace steel making; EAF = Electric Arc Furnace steel making. (1) Data sourced from https://www.goldengate.org/bridge/history-research/statistics-data/design-construction-stats; (2) Data sourced from https://www.pbs.org/wgbh/buildingbig/wonder/structure/empire_state.html; (3) Data sourced from World Steel Association; (4) Data sourced from Queensland Resources Council and World Steel Association. Golden Gate Bridge (1) 75,293,000 kg steel 58,000,000 kg met coal Empire State Building (2) 54,430,000 kg steel 42,000,000 kg met coal Average Electric Vehicle (3) 900 kg steel 700 kg met coal Average Wind Turbine (4) 285,000 kg steel 220,000 kg met coal Key global infrastructure projects for growing populations require steel. Steel is used in buildings, bridges, roads, rail systems, houses, dams and everyday white goods, among other uses. Electric vehicles are an important step in reducing emissions in transportation and require steel for production. Wind turbines are seen as critical infrastructure to reduce global emissions. Almost every component is made of steel including the foundation, tower, gears and casings. Off-shore wind farms require 2 to 5 times more steel than on-shore. |
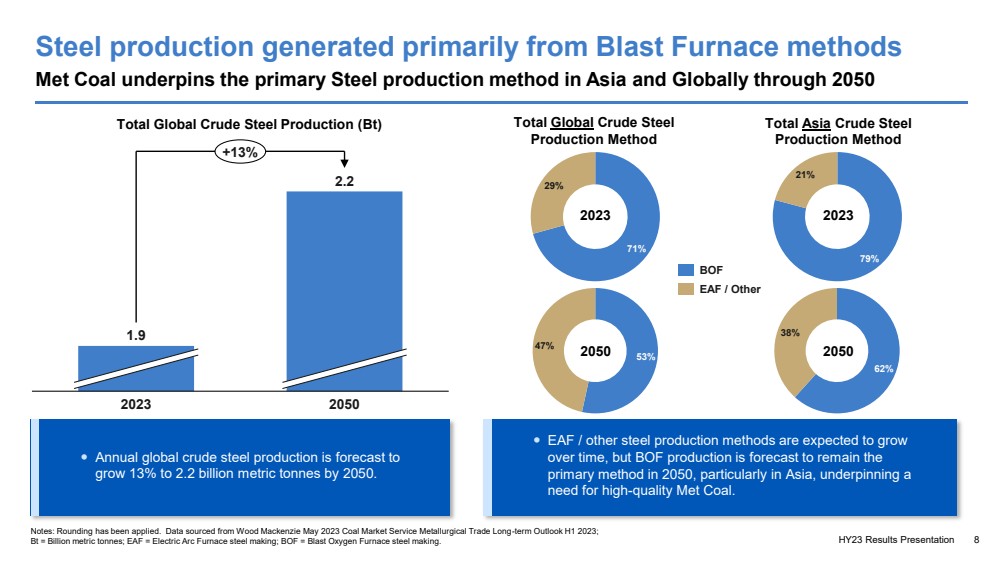
| Steel production generated primarily from Blast Furnace methods Met Coal underpins the primary Steel production method in Asia and Globally through 2050 HY23 Results Presentation 8 EAF / other steel production methods are expected to grow over time, but BOF production is forecast to remain the primary method in 2050, particularly in Asia, underpinning a need for high-quality Met Coal. Annual global crude steel production is forecast to grow 13% to 2.2 billion metric tonnes by 2050. Notes: Rounding has been applied. Data sourced from Wood Mackenzie May 2023 Coal Market Service Metallurgical Trade Long-term Outlook H1 2023; Bt = Billion metric tonnes; EAF = Electric Arc Furnace steel making; BOF = Blast Oxygen Furnace steel making. Total Global Crude Steel Production (Bt) Total Asia Crude Steel Production Method 2023 2050 1.9 2.2 +13% Total Global Crude Steel Production Method 71% 29% BOF EAF / Other 53% 47% 2023 2050 79% 21% 62% 38% 2023 2050 |
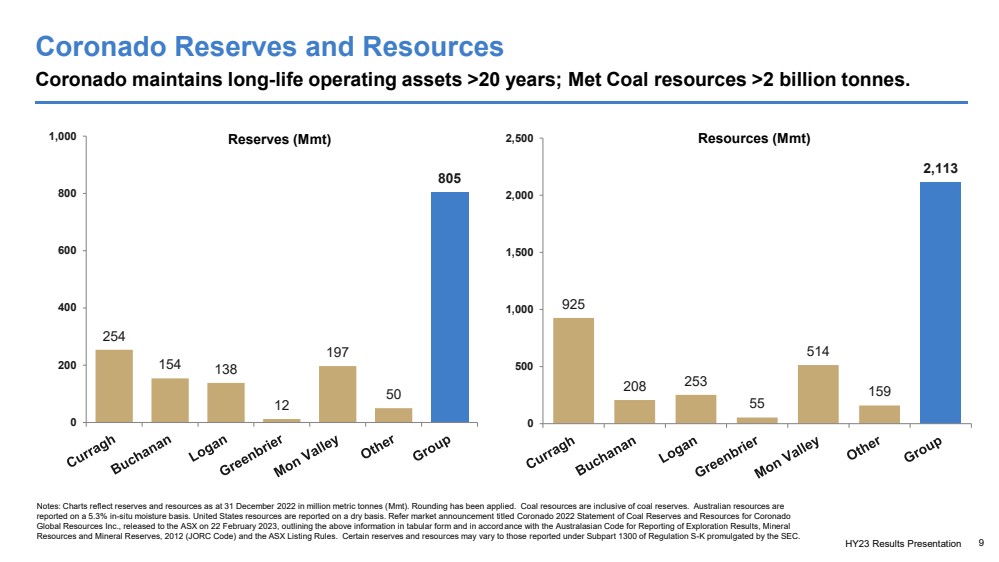
| HY23 Results Presentation 9 Coronado Reserves and Resources Coronado maintains long-life operating assets >20 years; Met Coal resources >2 billion tonnes. Notes: Charts reflect reserves and resources as at 31 December 2022 in million metric tonnes (Mmt). Rounding has been applied. Coal resources are inclusive of coal reserves. Australian resources are reported on a 5.3% in-situ moisture basis. United States resources are reported on a dry basis. Refer market announcement titled Coronado 2022 Statement of Coal Reserves and Resources for Coronado Global Resources Inc., released to the ASX on 22 February 2023, outlining the above information in tabular form and in accordance with the Australasian Code for Reporting of Exploration Results, Mineral Resources and Mineral Reserves, 2012 (JORC Code) and the ASX Listing Rules. Certain reserves and resources may vary to those reported under Subpart 1300 of Regulation S-K promulgated by the SEC. 254 154 138 12 197 50 805 0 200 400 600 800 1,000 925 208 253 55 514 159 2,113 0 500 1,000 1,500 2,000 Reserves (Mmt) 2,500 Resources (Mmt) |
| Safety is the most important aspect of our operations and our highest priority HY23 Results Presentation 10 |

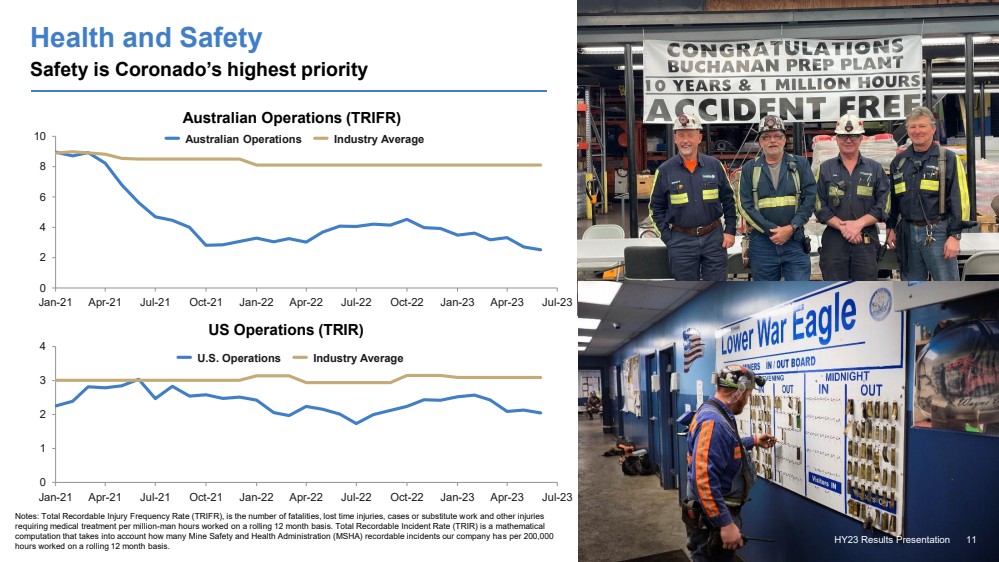
| FY22 Results Presentation 11 Health and Safety Safety is Coronado’s highest priority Notes: Total Recordable Injury Frequency Rate (TRIFR), is the number of fatalities, lost time injuries, cases or substitute work and other injuries requiring medical treatment per million-man hours worked on a rolling 12 month basis. Total Recordable Incident Rate (TRIR) is a mathematical computation that takes into account how many Mine Safety and Health Administration (MSHA) recordable incidents our company has per 200,000 hours worked on a rolling 12 month basis. Australian Operations (TRIFR) US Operations (TRIR) 0 2 4 6 8 10 Jan-21 Apr-21 Jul-21 Oct-21 Jan-22 Apr-22 Jul-22 Oct-22 Jan-23 Apr-23 Jul-23 Australian Operations Industry Average 0 1 2 3 4 Jan-21 Apr-21 Jul-21 Oct-21 Jan-22 Apr-22 Jul-22 Oct-22 Jan-23 Apr-23 Jul-23 U.S. Operations Industry Average HY23 Results Presentation 11 |
| HY23 Results Presentation 12 Financial Performance Gerhard Ziems Group Chief Financial Officer HY23 Results Presentation 12 |
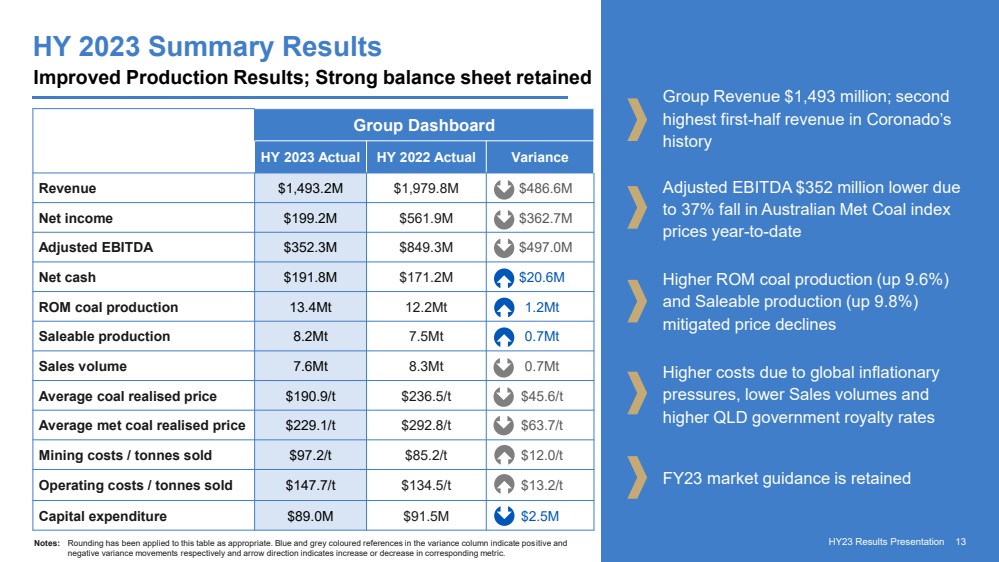
| HY23 Results Presentation 13 HY 2023 Summary Results Group Revenue $1,493 million; second highest first-half revenue in Coronado’s history Adjusted EBITDA $352 million lower due to 37% fall in Australian Met Coal index prices year-to-date Higher ROM coal production (up 9.6%) and Saleable production (up 9.8%) mitigated price declines Higher costs due to global inflationary pressures, lower Sales volumes and higher QLD government royalty rates FY23 market guidance is retained Improved Production Results; Strong balance sheet retained Group Dashboard HY 2023 Actual HY 2022 Actual Variance Revenue $1,493.2M $1,979.8M $486.6M Net income $199.2M $561.9M $362.7M Adjusted EBITDA $352.3M $849.3M $497.0M Net cash $191.8M $171.2M $20.6M ROM coal production 13.4Mt 12.2Mt 1.2Mt Saleable production 8.2Mt 7.5Mt 0.7Mt Sales volume 7.6Mt 8.3Mt 0.7Mt Average coal realised price $190.9/t $236.5/t $45.6/t Average met coal realised price $229.1/t $292.8/t $63.7/t Mining costs / tonnes sold $97.2/t $85.2/t $12.0/t Operating costs / tonnes sold $147.7/t $134.5/t $13.2/t Capital expenditure $89.0M $91.5M $2.5M Notes: Rounding has been applied to this table as appropriate. Blue and grey coloured references in the variance column indicate positive and negative variance movements respectively and arrow direction indicates increase or decrease in corresponding metric. HY23 Results Presentation 13 |
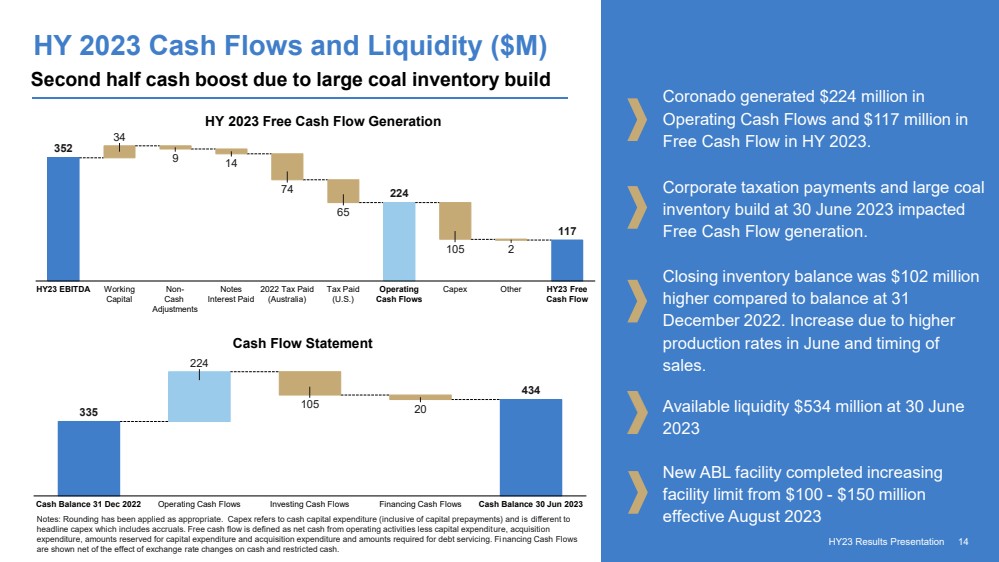
| HY23 Results Presentation 14 HY 2023 Cash Flows and Liquidity ($M) Coronado generated $224 million in Operating Cash Flows and $117 million in Free Cash Flow in HY 2023. Corporate taxation payments and large coal inventory build at 30 June 2023 impacted Free Cash Flow generation. Closing inventory balance was $102 million higher compared to balance at 31 December 2022. Increase due to higher production rates in June and timing of sales. New ABL facility completed increasing facility limit from $100 - $150 million effective August 2023 Second half cash boost due to large coal inventory build 352 224 117 34 9 14 74 65 105 2 HY23 EBITDA Working Capital Non-Cash Adjustments Notes Interest Paid 2022 Tax Paid (Australia) Tax Paid (U.S.) Operating Cash Flows Capex Other HY23 Free Cash Flow HY 2023 Free Cash Flow Generation 335 434 224 105 20 Cash Balance 31 Dec 2022 Operating Cash Flows Investing Cash Flows Financing Cash Flows Cash Balance 30 Jun 2023 Cash Flow Statement Notes: Rounding has been applied as appropriate. Capex refers to cash capital expenditure (inclusive of capital prepayments) and is different to headline capex which includes accruals. Free cash flow is defined as net cash from operating activities less capital expenditure, acquisition expenditure, amounts reserved for capital expenditure and acquisition expenditure and amounts required for debt servicing. Financing Cash Flows are shown net of the effect of exchange rate changes on cash and restricted cash. Available liquidity $534 million at 30 June 2023 HY23 Results Presentation 14 |
| HY23 Results Presentation 15 Coronado declares its biannual fully franked fixed dividend of $8.4 million (US 0.5 cents/CDI) The declaration of the biannual fully franked fixed dividend does not require a matching Senior Secured Notes purchase offer. Coronado continues to pursue organic and in-organic growth opportunities, and in order to provide the Company with maximum flexibility to achieve this strategy, only declares the biannual fixed dividend at this time. Subject to the delivery of our strategic growth plans, on-going operational performance and market conditions, the Board may determine to declare special dividends in future periods. HY 2023 Fixed Biannual Dividend 8 August 2023 Declaration of $8.4 million. (US 0.5 cents/CDI) fully franked dividend per dividend policy Key Dates 29 August 2023 Dividend record date 19 September 2023 Dividend payment date HY23 Results Presentation 15 |

| Metallurgical Coal Markets HY23 Results Presentation 16 |
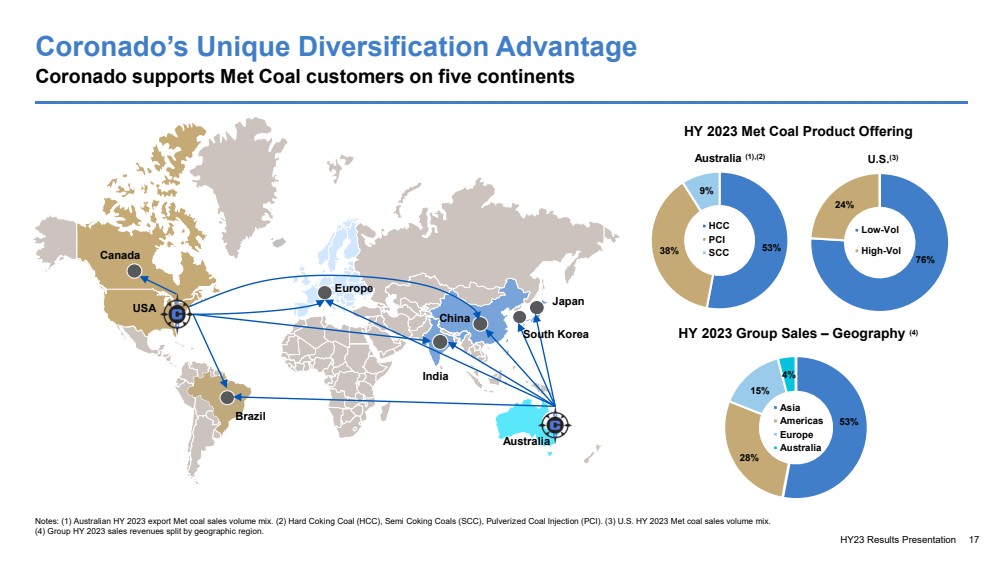
| Coronado’s Unique Diversification Advantage Coronado supports Met Coal customers on five continents HY23 Results Presentation 17 Notes: (1) Australian HY 2023 export Met coal sales volume mix. (2) Hard Coking Coal (HCC), Semi Coking Coals (SCC), Pulverized Coal Injection (PCI). (3) U.S. HY 2023 Met coal sales volume mix. (4) Group HY 2023 sales revenues split by geographic region. Europe Japan India Brazil China USA Australia South Korea 38% 53% 9% HCC PCI SCC 76% 24% Low-Vol High-Vol Australia (1),(2) U.S.(3) 53% 28% 15% 4% Asia Americas Europe Australia HY 2023 Met Coal Product Offering HY 2023 Group Sales – Geography (4) Canada |
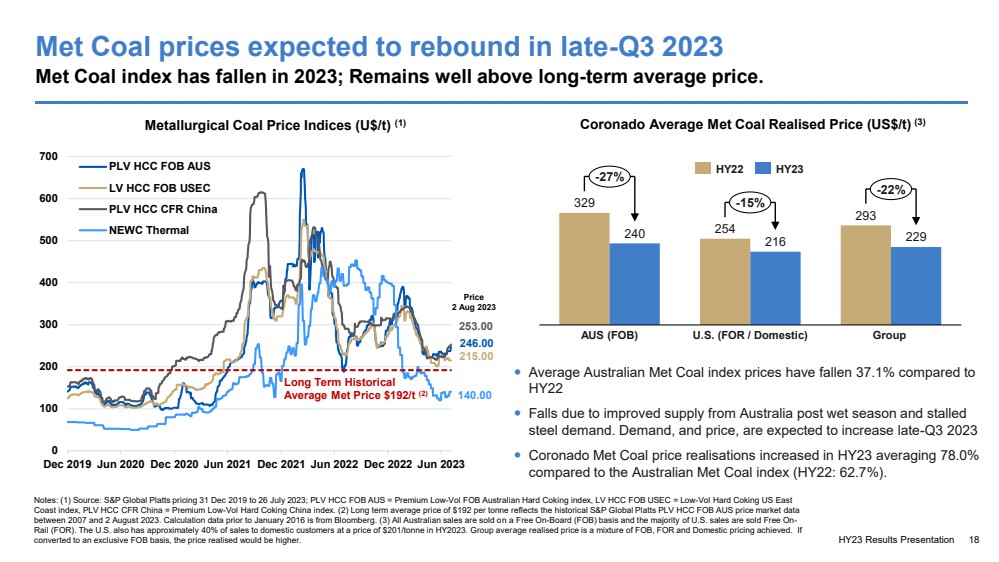
| Met Coal prices expected to rebound in late-Q3 2023 Met Coal index has fallen in 2023; Remains well above long-term average price. HY23 Results Presentation Notes: (1) Source: S&P Global Platts pricing 31 Dec 2019 to 26 July 2023; PLV HCC FOB AUS = Premium Low-Vol FOB Australian Hard Coking index, LV HCC FOB USEC = Low-Vol Hard Coking US East Coast index, PLV HCC CFR China = Premium Low-Vol Hard Coking China index. (2) Long term average price of $192 per tonne reflects the historical S&P Global Platts PLV HCC FOB AUS price market data between 2007 and 2 August 2023. Calculation data prior to January 2016 is from Bloomberg. (3) All Australian sales are sold on a Free On-Board (FOB) basis and the majority of U.S. sales are sold Free On-Rail (FOR). The U.S. also has approximately 40% of sales to domestic customers at a price of $201/tonne in HY2023. Group average realised price is a mixture of FOB, FOR and Domestic pricing achieved. If converted to an exclusive FOB basis, the price realised would be higher. 246.00 215.00 253.00 140.00 0 100 200 300 400 500 600 700 Dec 2019 Jun 2020 Dec 2020 Jun 2021 Dec 2021 Jun 2022 Dec 2022 Jun 2023 PLV HCC FOB AUS LV HCC FOB USEC PLV HCC CFR China NEWC Thermal Long Term Historical Average Met Price $192/t (2) Average Australian Met Coal index prices have fallen 37.1% compared to HY22 Falls due to improved supply from Australia post wet season and stalled steel demand. Demand, and price, are expected to increase late-Q3 2023 Coronado Met Coal price realisations increased in HY23 averaging 78.0% compared to the Australian Met Coal index (HY22: 62.7%). Price 2 Aug 2023 Metallurgical Coal Price Indices (U$/t) (1) 329 254 293 240 216 229 AUS (FOB) U.S. (FOR / Domestic) Group -27% -15% -22% HY22 HY23 Coronado Average Met Coal Realised Price (US$/t) (3) 18 |
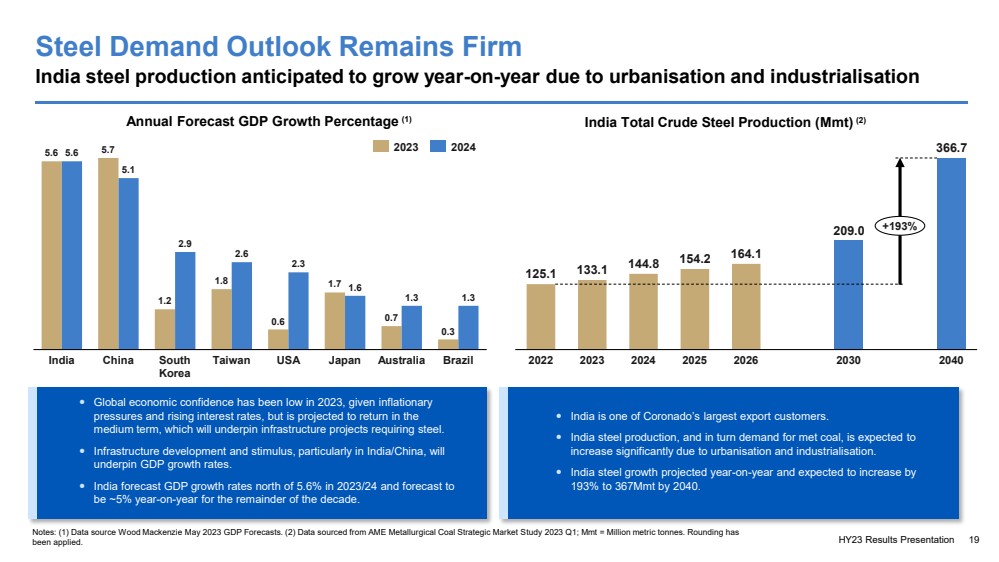
| Steel Demand Outlook Remains Firm India steel production anticipated to grow year-on-year due to urbanisation and industrialisation HY23 Results Presentation 19 Notes: (1) Data source Wood Mackenzie May 2023 GDP Forecasts. (2) Data sourced from AME Metallurgical Coal Strategic Market Study 2023 Q1; Mmt = Million metric tonnes. Rounding has been applied. Global economic confidence has been low in 2023, given inflationary pressures and rising interest rates, but is projected to return in the medium term, which will underpin infrastructure projects requiring steel. Infrastructure development and stimulus, particularly in India/China, will underpin GDP growth rates. India forecast GDP growth rates north of 5.6% in 2023/24 and forecast to be ~5% year-on-year for the remainder of the decade. India is one of Coronado’s largest export customers. India steel production, and in turn demand for met coal, is expected to increase significantly due to urbanisation and industrialisation. India steel growth projected year-on-year and expected to increase by 193% to 367Mmt by 2040. 5.6 5.7 1.2 1.8 0.6 1.7 0.7 0.3 5.6 5.1 2.9 2.6 2.3 1.6 1.3 1.3 India China South Korea Taiwan USA Japan Australia Brazil 2023 2024 Annual Forecast GDP Growth Percentage (1) 125.1 133.1 144.8 154.2 164.1 209.0 366.7 2022 2023 2024 2025 2026 2030 2040 +193% India Total Crude Steel Production (Mmt) (2) |
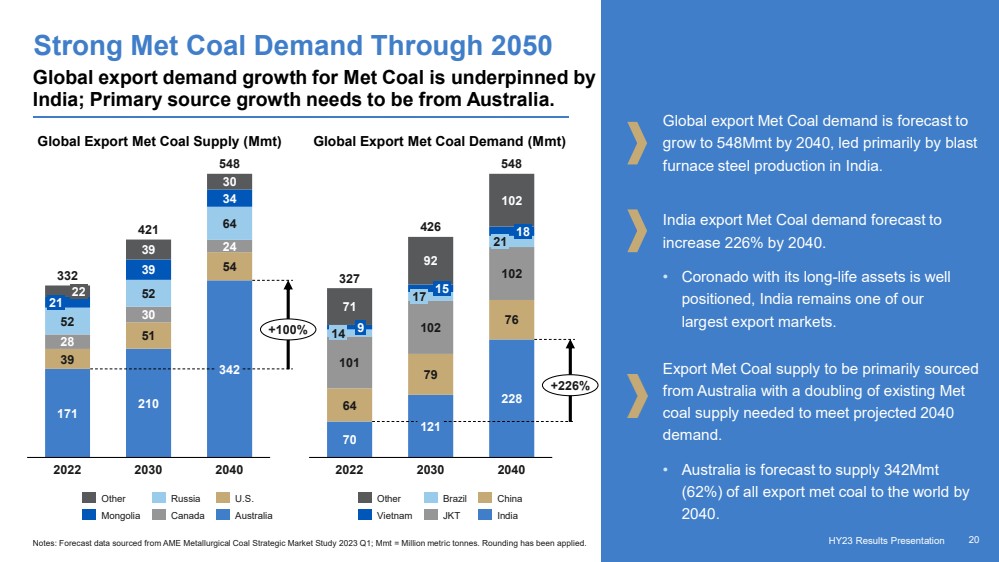
| HY23 Results Presentation 20 Strong Met Coal Demand Through 2050 Global export Met Coal demand is forecast to grow to 548Mmt by 2040, led primarily by blast furnace steel production in India. India export Met Coal demand forecast to increase 226% by 2040. • Coronado with its long-life assets is well positioned, India remains one of our largest export markets. Global export demand growth for Met Coal is underpinned by India; Primary source growth needs to be from Australia. Export Met Coal supply to be primarily sourced from Australia with a doubling of existing Met coal supply needed to meet projected 2040 demand. • Australia is forecast to supply 342Mmt (62%) of all export met coal to the world by 2040. Global Export Met Coal Supply (Mmt) Global Export Met Coal Demand (Mmt) 171 210 342 39 51 54 28 30 24 52 52 64 39 34 39 30 2022 2030 2040 332 421 548 21 22 +100% Other Mongolia Russia Canada U.S. Australia 70 121 228 64 79 76 101 102 102 71 92 102 9 14 2022 15 17 2030 18 21 2040 327 426 548 +226% Other Vietnam Brazil JKT China India Notes: Forecast data sourced from AME Metallurgical Coal Strategic Market Study 2023 Q1; Mmt = Million metric tonnes. Rounding has been applied. HY23 Results Presentation 20 |
| Presentation Title 21 Organic Growth Projects Douglas Thompson Managing Director & CEO HY23 Results Presentation 21 |
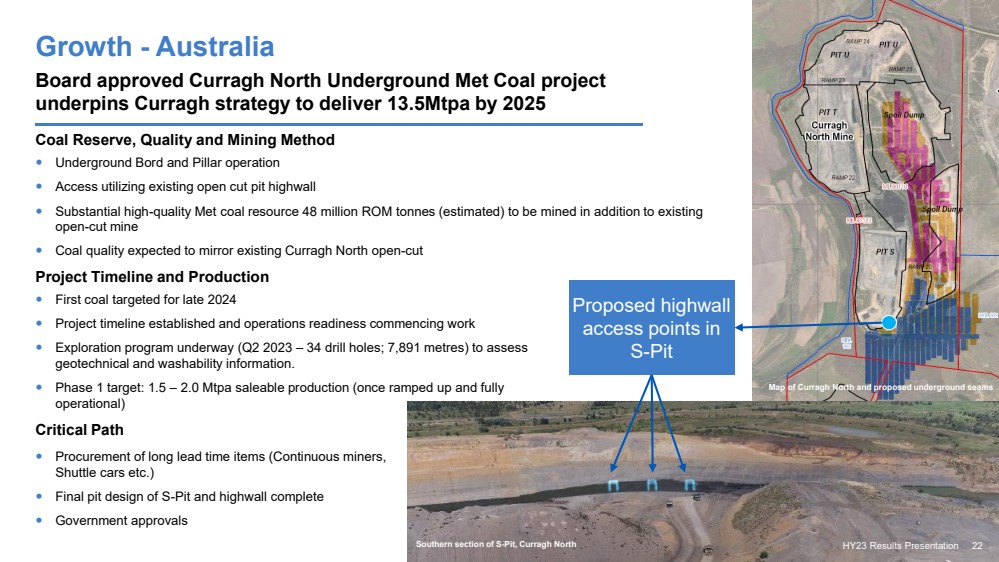
| Growth - Australia Board approved Curragh North Underground Met Coal project underpins Curragh strategy to deliver 13.5Mtpa by 2025 Coal Reserve, Quality and Mining Method Underground Bord and Pillar operation Access utilizing existing open cut pit highwall Substantial high-quality Met coal resource 48 million ROM tonnes (estimated) to be mined in addition to existing open-cut mine Coal quality expected to mirror existing Curragh North open-cut 2023 Annual General Meeting 22 Proposed highwall access points in S-Pit Project Timeline and Production First coal targeted for late 2024 Project timeline established and operations readiness commencing work Exploration program underway (Q2 2023 – 34 drill holes; 7,891 metres) to assess geotechnical and washability information. Phase 1 target: 1.5 – 2.0 Mtpa saleable production (once ramped up and fully operational) Critical Path Procurement of long lead time items (Continuous miners, Shuttle cars etc.) Final pit design of S-Pit and highwall complete Government approvals Southern section of S-Pit, Curragh North HY23 Results Presentation 22 Map of Curragh North and proposed underground seams |
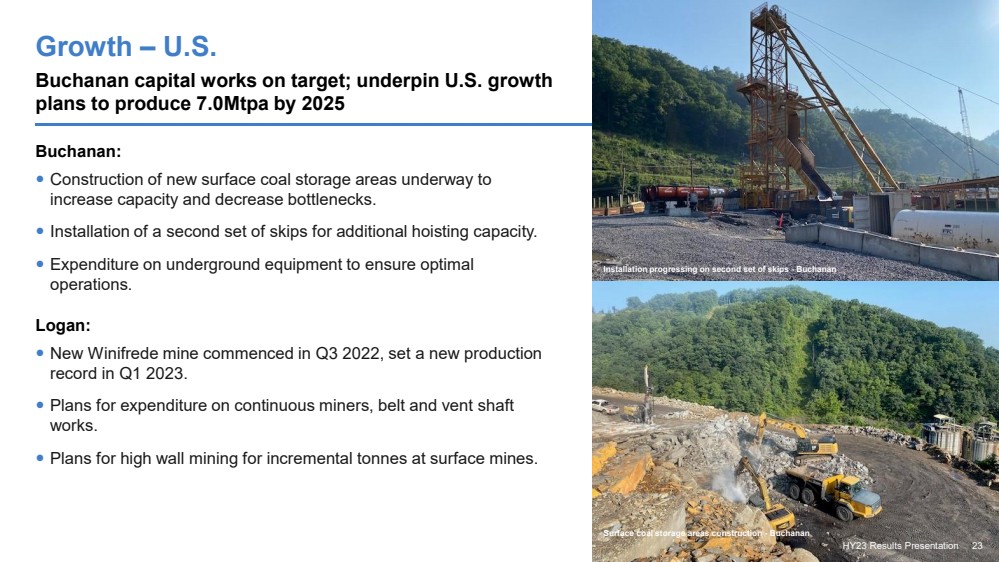
| Growth – U.S. Buchanan capital works on target; underpin U.S. growth plans to produce 7.0Mtpa by 2025 HY23 Results Presentation 23 Buchanan: Construction of new surface coal storage areas underway to increase capacity and decrease bottlenecks. Installation of a second set of skips for additional hoisting capacity. Expenditure on underground equipment to ensure optimal operations. Logan: New Winifrede mine commenced in Q3 2022, set a new production record in Q1 2023. Plans for expenditure on continuous miners, belt and vent shaft works. Plans for high wall mining for incremental tonnes at surface mines. Installation progressing on second set of skips - Buchanan Surface coal storage areas construction - Buchanan |
| Emissions Reduction and Sustainability HY23 Results Presentation 24 |
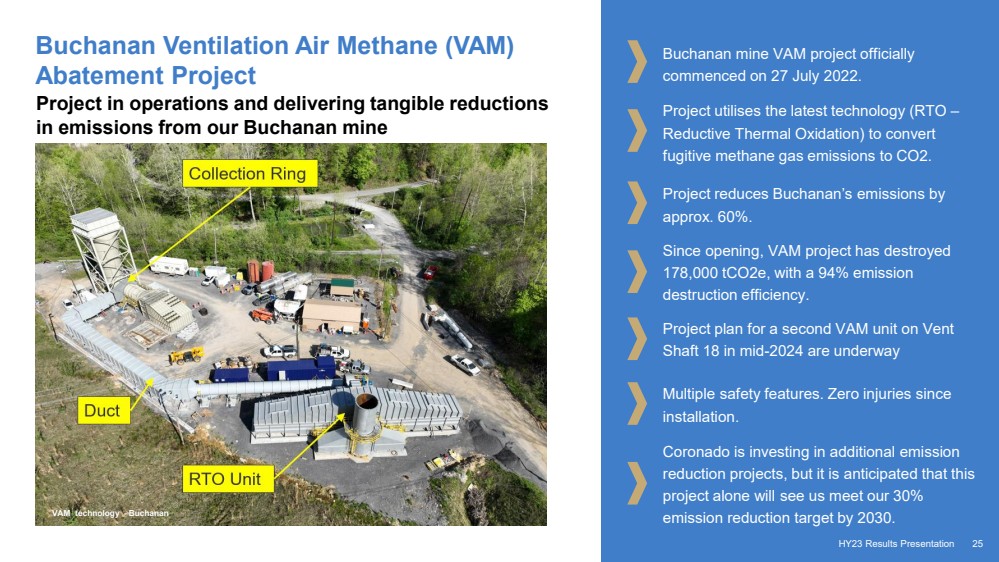
| Buchanan Ventilation Air Methane (VAM) Abatement Project Buchanan mine VAM project officially commenced on 27 July 2022. Project utilises the latest technology (RTO – Reductive Thermal Oxidation) to convert fugitive methane gas emissions to CO2. Project reduces Buchanan’s emissions by approx. 60%. Since opening, VAM project has destroyed 178,000 tCO2e, with a 94% emission destruction efficiency. Project plan for a second VAM unit on Vent Shaft 18 in mid-2024 are underway Multiple safety features. Zero injuries since installation. Coronado is investing in additional emission reduction projects, but it is anticipated that this project alone will see us meet our 30% emission reduction target by 2030. 25 Project in operations and delivering tangible reductions in emissions from our Buchanan mine HY23 Results Presentation VAM technology - Buchanan |
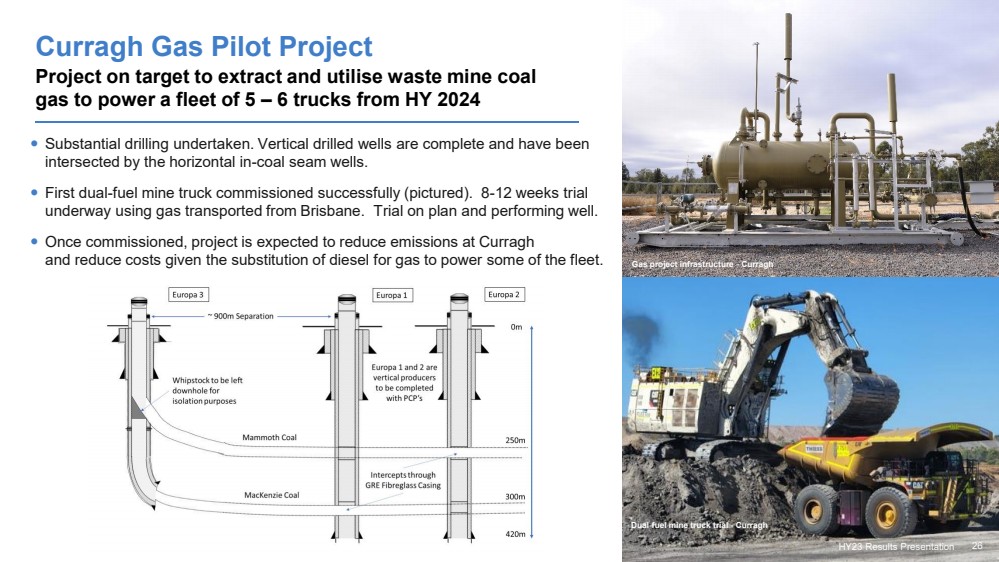
| Curragh Gas Pilot Project Project on target to extract and utilise waste mine coal gas to power a fleet of 5 – 6 trucks from HY 2024 Substantial drilling undertaken. Vertical drilled wells are complete and have been intersected by the horizontal in-coal seam wells. First dual-fuel mine truck commissioned successfully (pictured). 8-12 weeks trial underway using gas transported from Brisbane. Trial on plan and performing well. Once commissioned, project is expected to reduce emissions at Curragh and reduce costs given the substitution of diesel for gas to power some of the fleet. HY23 Results Presentation 26 Gas project infrastructure - Curragh Dual-fuel mine truck trial - Curragh |
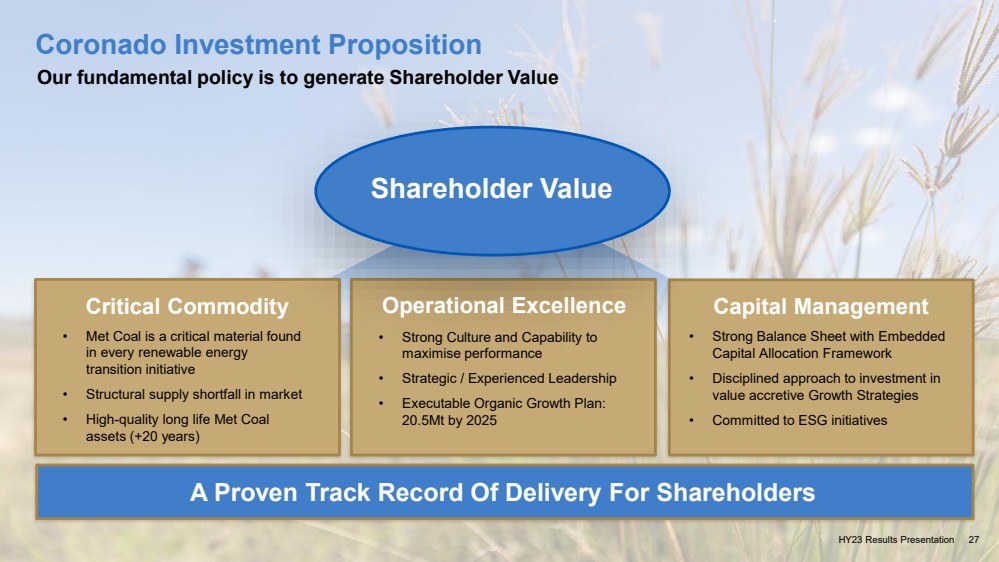
| Coronado Investment Proposition Our fundamental policy is to generate Shareholder Value Shareholder Value Critical Commodity Operational Excellence Capital Management • Strong Culture and Capability to maximise performance • Strategic / Experienced Leadership • Executable Organic Growth Plan: 20.5Mt by 2025 • Met Coal is a critical material found in every renewable energy transition initiative • Structural supply shortfall in market • High-quality long life Met Coal assets (+20 years) A Proven Track Record Of Delivery For Shareholders • Strong Balance Sheet with Embedded Capital Allocation Framework • Disciplined approach to investment in value accretive Growth Strategies • Committed to ESG initiatives HY23 Results Presentation 27 |
| HY23 Results Presentation 28 Questions HY23 Results Presentation 28 |
| HY23 Results Presentation 29 Reconciliation of Non -GAAP measures This report discusses results of the Company’s operations and includes references to and analysis of certain non -GAAP measures, which are financial measures not recognized in accordance with U .. S .. GAAP .. Non -GAAP financial measures are used by the Company and investors to measure operating performance. Management uses a variety of financial and operating metrics to analyze performance. These metrics are significant in assessing operating results and profitability .. These financial and operating metrics include : (i) safety and environmental statistics ; (ii) Adjusted EBITDA, (iii) total sales volumes and average realised price per Mt sold, which we define as total coal revenues divided by total sales volume ; (iv) Metallurgical coal sales volumes and average realized Metallurgical coal price per tonne sold, which we define as metallurgical coal revenues divided by metallurgical sales volume ; (v) Mining costs per Mt sold, which we define as mining cost of coal revenues divided by sales volumes (excluding non -produced coal) for the respective segment ; (vi) Operating costs per Mt sold, which we define as operating costs divided by sales volumes for the respective segment. Investors should be aware that the Company’s presentation of Adjusted EBITDA and other non -GAAP measures may not be comparable to similarly titled financial measures used by other companies .. We define Net Cash as cash and cash equivalents (excluding restricted cash) less the outstanding aggregate principal amount of the 10 ..750 % senior secured notes due 2026 .. Reconciliations of certain forward -looking non -GAAP financial measures, including our 2023 Mining Cost per Tonne Sold guidance, to the most directly comparable GAAP financial measures are not provided because the Company is unable to provide such reconciliations without unreasonable effort, due to the uncertainty and inherent difficulty of predicting the occurrence and the financial impact of items impacting comparability and the periods in which such items may be recognised. For the same reasons, the Company is unable to address the probable significance of the unavailable information, which could be material to future results. HY23 Results Presentation 29 |
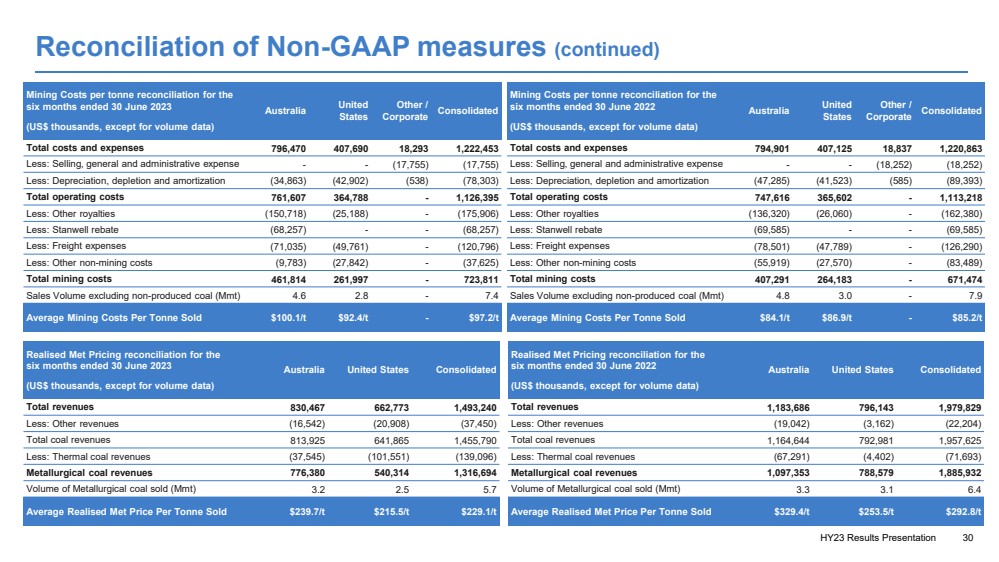
| HY23 Results Presentation 30 Reconciliation of Non-GAAP measures (continued) Mining Costs per tonne reconciliation for the six months ended 30 June 2023 (US$ thousands, except for volume data) Australia United States Other / Corporate Consolidated Total costs and expenses 796,470 407,690 18,293 1,222,453 Less: Selling, general and administrative expense - - (17,755) (17,755) Less: Depreciation, depletion and amortization (34,863) (42,902) (538) (78,303) Total operating costs 761,607 364,788 - 1,126,395 Less: Other royalties (150,718) (25,188) - (175,906) Less: Stanwell rebate (68,257) - - (68,257) Less: Freight expenses (71,035) (49,761) - (120,796) Less: Other non-mining costs (9,783) (27,842) - (37,625) Total mining costs 461,814 261,997 - 723,811 Sales Volume excluding non-produced coal (Mmt) 4.6 2.8 - 7.4 Average Mining Costs Per Tonne Sold $100.1/t $92.4/t - $97.2/t Mining Costs per tonne reconciliation for the six months ended 30 June 2022 (US$ thousands, except for volume data) Australia United States Other / Corporate Consolidated Total costs and expenses 794,901 407,125 18,837 1,220,863 Less: Selling, general and administrative expense - - (18,252) (18,252) Less: Depreciation, depletion and amortization (47,285) (41,523) (585) (89,393) Total operating costs 747,616 365,602 - 1,113,218 Less: Other royalties (136,320) (26,060) - (162,380) Less: Stanwell rebate (69,585) - - (69,585) Less: Freight expenses (78,501) (47,789) - (126,290) Less: Other non-mining costs (55,919) (27,570) - (83,489) Total mining costs 407,291 264,183 - 671,474 Sales Volume excluding non-produced coal (Mmt) 4.8 3.0 - 7.9 Average Mining Costs Per Tonne Sold $84.1/t $86.9/t - $85.2/t Realised Met Pricing reconciliation for the six months ended 30 June 2023 (US$ thousands, except for volume data) Australia United States Consolidated Total revenues 830,467 662,773 1,493,240 Less: Other revenues (16,542) (20,908) (37,450) Total coal revenues 813,925 641,865 1,455,790 Less: Thermal coal revenues (37,545) (101,551) (139,096) Metallurgical coal revenues 776,380 540,314 1,316,694 Volume of Metallurgical coal sold (Mmt) 3.2 2.5 5.7 Average Realised Met Price Per Tonne Sold $239.7/t $215.5/t $229.1/t Realised Met Pricing reconciliation for the six months ended 30 June 2022 (US$ thousands, except for volume data) Australia United States Consolidated Total revenues 1,183,686 796,143 1,979,829 Less: Other revenues (19,042) (3,162) (22,204) Total coal revenues 1,164,644 792,981 1,957,625 Less: Thermal coal revenues (67,291) (4,402) (71,693) Metallurgical coal revenues 1,097,353 788,579 1,885,932 Volume of Metallurgical coal sold (Mmt) 3.3 3.1 6.4 Average Realised Met Price Per Tonne Sold $329.4/t $253.5/t $292.8/t |
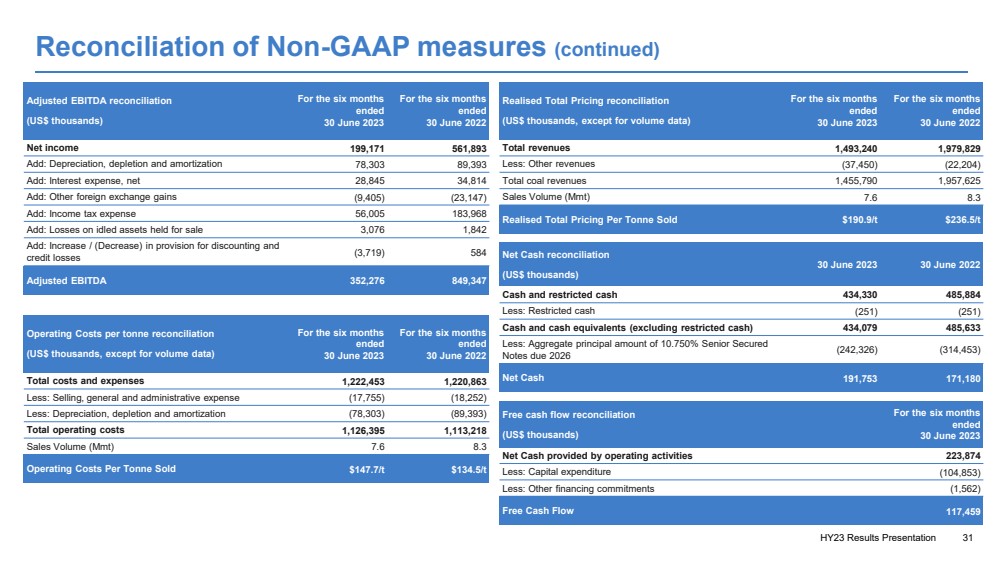
| HY23 Results Presentation 31 Reconciliation of Non-GAAP measures (continued) Adjusted EBITDA reconciliation (US$ thousands) For the six months ended 30 June 2023 For the six months ended 30 June 2022 Net income 199,171 561,893 Add: Depreciation, depletion and amortization 78,303 89,393 Add: Interest expense, net 28,845 34,814 Add: Other foreign exchange gains (9,405) (23,147) Add: Income tax expense 56,005 183,968 Add: Losses on idled assets held for sale 3,076 1,842 Add: Increase / (Decrease) in provision for discounting and credit losses (3,719) 584 Adjusted EBITDA 352,276 849,347 Net Cash reconciliation (US$ thousands) 30 June 2023 30 June 2022 Cash and restricted cash 434,330 485,884 Less: Restricted cash (251) (251) Cash and cash equivalents (excluding restricted cash) 434,079 485,633 Less: Aggregate principal amount of 10.750% Senior Secured Notes due 2026 (242,326) (314,453) Net Cash 191,753 171,180 Operating Costs per tonne reconciliation (US$ thousands, except for volume data) For the six months ended 30 June 2023 For the six months ended 30 June 2022 Total costs and expenses 1,222,453 1,220,863 Less: Selling, general and administrative expense (17,755) (18,252) Less: Depreciation, depletion and amortization (78,303) (89,393) Total operating costs 1,126,395 1,113,218 Sales Volume (Mmt) 7.6 8.3 Operating Costs Per Tonne Sold $147.7/t $134.5/t Realised Total Pricing reconciliation (US$ thousands, except for volume data) For the six months ended 30 June 2023 For the six months ended 30 June 2022 Total revenues 1,493,240 1,979,829 Less: Other revenues (37,450) (22,204) Total coal revenues 1,455,790 1,957,625 Sales Volume (Mmt) 7.6 8.3 Realised Total Pricing Per Tonne Sold $190.9/t $236.5/t Free cash flow reconciliation (US$ thousands) For the six months ended 30 June 2023 Net Cash provided by operating activities 223,874 Less: Capital expenditure (104,853) Less: Other financing commitments (1,562) Free Cash Flow 117,459 |
| Investors Andrew Mooney Vice President Investor Relations & Communications +61 458 666 639 amooney@coronadoglobal.com investors@coronadoglobal.com Registered Office Coronado Global Resources Inc. Level 33, Central Plaza One 345 Queen Street Brisbane, QLD, Australia, 4000 GPO Box 51, Brisbane QLD, Australia, 4000 +61 7 3031 7777 +61 7 3229 7401 coronadoglobal.com Media Helen McCombie Citadel Magnus +61 411 756 248 hmccombie@citadelmagnus.com Contacts |