QUARTERLY REPORT JUNE 2024 OPERATIONS Australia TRIFR of 1.29 and U.S. TRIR of 2.26 as at 30 June 2024, with both regions below their respective industry averages. Substantial reduction in June quarter cost base following the completion of optimisation works at the Curragh Complex. Total mining costs for the Group decreased by $101 million (unaudited) quarter-on-quarter. Production and cost improvements are primarily due to the demobilisation of 4 fleets at Curragh in late March (~30 major pieces of equipment) following the completion of historical pre-strip deficit works and improved productivities in dragline utilisation and drill and blast performance. In the September quarter, Curragh will demobilise another contractor fleet (~13 pieces of equipment) further reducing costs and increasing overall productivities. Removal of this additional fleet is not expected to impact current or future production plans for Curragh. Improved yield rates in Buchanan southern panels were achieved in the June quarter as planned. Our organic growth investments continue to be assessed at multiples substantially lower than recent market opportunities, which we expect will create significant value for our Shareholders. Installation and testing of Buchanans 2nd VAM emissions reduction unit is complete and on-line. FINANCIAL AND CORPORATE Group Revenue of $674 million for the June quarter; H1 Group Revenue of $1,342 million. Group Capital Expenditure of $64 million for the June quarter; H1 Capital Expenditure $137 million. Year-to-date expenditure primarily for next stage organic growth projects (Mammoth Underground / Buchanan) funded from operational cashflows without the need for raising additional debt or equity. Closing cash balance of $265 million at 30 June 2024. GROUP PERFORMANCE SUMMARY Quarter Year to date Jun24 Mar24 Change Jun24 Jun23 Change ROM Production (Mt) 7.4 6.0 24% 13.4 13.4 0% Saleable Production (Mt) 4.1 3.4 22% 7.5 8.2 (9%) Sales Volumes (Mt) 4.1 3.7 8% 7.8 7.6 2% Realised Met Coal Price (US$/t) 194.7 204.3 (5%) 199.3 229.1 (13%) HIGHLIGHTS Strong production delivery with Group ROM coal production 7.4 Mt (up 23.8%), Group Saleable production 4.1 Mt (up 21.5%) compared to the March quarter. Group Average Mining Costs per tonne sold were $91.1/t, down 27.5% compared to the prior March quarter of $125.6/t. Group Sales volumes were 4.1 Mt, up 8.3% compared to the March quarter. Group Realised Price Per Tonne of Met coal sold was $194.7/t reflecting an improved 80.4% realisation on the Australian PLV index price. Organic growth projects at Buchanan and Curragh (Mammoth Underground) remain on budget and schedule. Regulatory approvals for Mammoth submitted. Coronado reaffirms FY24 market guidance. |
QUARTERLY REPORT JUNE 2024 QUARTERLY REPORT: JUNE 2024 2 MESSAGE FROM THE CEO DOUGLAS THOMPSON, CHIEF EXECUTIVE OFFICER The Coronado team delivered materially improved production, sales, cost and revenue results for the quarter ended 30 June 2024. I am proud to report Group ROM coal production of 7.4Mt (up 24%), Saleable production of 4.1Mt (up 22%), Sales Volumes of 4.1Mt (up 8%), Average Mining Costs per tonne sold of $91.1/t (down 27%) and total revenues of $674 million (up 1%), compared to the prior March quarter. These results have not come easy and reflect 18 months of hard work from everyone in our Company to drive our business forward and produce positive results. However, the job is not finished. We continue to press for further operational and cost gains in the coming quarters via productivity improvements and the development of our organic growth pipeline. I am excited for the benefits ahead for Shareholders as we progress our Mammoth Underground project and expansion works at Buchanan, both of which have extremely positive prospects and continue to be developed from the operational cashflows of the business, without the need for raising additional debt or equity from the market. Q2 2024 Operational Overview As reported in prior public announcements, on 31 May 2024 (U.S. Eastern time), the Company temporarily suspended operations at the Buchanan mine following the fatality involving one of its employees, Mr Brock Jackson, at the commencement of the evening shift. Coronado is deeply saddened by this tragic event and extends its deepest sympathies and sincere condolences to the family, friends and colleagues of Mr Jackson. A full investigation into the incident continues, and until that investigation has concluded, we cannot provide any further comments other than continuing to support the family and coworkers of Mr Jackson. The Buchanan mine resumed operations on 3 June 2024 (U.S. Eastern time) and there are no directives or restrictions on the mine. During the quarter at Curragh, production and cost rates were significantly improved due to the completion of the historical pre-strip waste deficit works and the subsequent removal of four fleets in late March 2024, combined with improved productivities from our dragline fleet, improved drill and blast performance and the resultant benefits of bringing forward CHPP maintenance plans to the first quarter. June quarter ROM production for Curragh was 3.8Mt (up 39%) and Saleable production was 2.7Mt (up 23%) compared to the March quarter. Average Mining Costs Per Tonne Sold for Curragh in the June quarter were $81.7/tonne, reflecting a 36% improvement from the prior quarter, and the lowest cost per tonne quarter for the mine since Q1 2022. Curragh also experienced less interruption in the June quarter with lower rainfall reported, however heavy rainfall in late June did see ~100kt of coal production move into July. At our U.S. operations, production and cost improvements were also noted. June quarter ROM production was 3.6Mt (up 11%), Saleable production was 1.4Mt (up 18%) and Average Mining Costs Per Tonne Sold was $110.0/tonne (down 10%). Production and cost improvements were realised at both our Buchanan and Logan mines. Yields increased as planned as we continued to mine into the southern panels at Buchanan. The successful reopening of the Powellton mine at Logan also resulted in higher production rates this quarter, in addition to the highwall mining activities at the surface operations. Coronado continued to maintain healthy liquidity levels in the quarter. As at 30 June 2024, the Company had Available Liquidity of $414 million. Looking ahead to the September quarter, I can report that July performance thus far has been strong. At Curragh, we are currently demobilising an additional contractor fleet that will further improve the cost structure of the business and drive further productivity improvements. Demobilisation of this fleet is expected to complete in September. In the U.S., our planned transition of mining to the northern panels at Buchanan will start this quarter, driving further yield improvements. Therefore, given the strong June quarter results, and forward plans, we reaffirm our previously announced FY24 guidance. Metallurgical Coal Markets In the June quarter, the average PLV HCC FOB AUS index price was $242/t, a decrease of 21% over the prior quarter. The index price decrease was primarily due to a combination of increased supply in Australia, post the wet weather events, and soft seaborne demand. Price increases were noted in early July following production issues at peer Met Coal mines in Australia and the U.S. Coronado expects that in the September quarter prices will remain strong on the back of Indian restocking appetite after the monsoon season. In the same period, Met Coal supply is expected to be restricted given the mine production issues at some of our peers and railway maintenance occurring across the Queensland network. |
QUARTERLY REPORT JUNE 2024 QUARTERLY REPORT: JUNE 2024 3 OPERATIONS QUARTERLY SEGMENT PRODUCTION AND SALES SUMMARY Summary Information (unaudited) Jun Q24 Mar Q24 Change Jun 2024 YTD Jun 2023 YTD Change ROM production Mt 7.4 6.0 23.8% 13.4 13.4 0.0% Australia Mt 3.8 2.7 39.1% 6.5 6.5 0.6% USA Mt 3.6 3.3 11.0% 6.9 6.9 (0.5%) Saleable production Mt 4.1 3.4 21.5% 7.5 8.2 (8.9%) Australia Mt 2.7 2.2 23.4% 4.8 5.0 (3.7%) USA Mt 1.4 1.2 18.3% 2.7 3.2 (17.2%) % Met Coal % 81.5% 78.4% 3.1% 80.1% 80.6% (0.5%) Sales Volumes Mt 4.1 3.7 8.3% 7.8 7.6 2.2% Australia Mt 2.7 2.5 7.0% 5.2 4.7 12.1% USA Mt 1.4 1.2 10.8% 2.6 3.0 (13.3%) Sales Mix Met Coal % 81.0% 78.7% 2.3% 79.9% 75.3% 4.6% Thermal Coal % 19.0% 21.3% (2.3%) 20.1% 24.7% (4.6%) Export Sales % 70.5% 69.0% 1.5% 69.8% 72.5% (2.7%) Domestic Sales % 29.5% 31.0% (1.5%) 30.2% 27.5% 2.7% AU- Realised Met Price (FOB) US$/t 216.2 225.2 (4.0%) 220.5 239.7 (8.0%) PLV HCC FOB AUS Index Price US$/t 242.3 308.4 (21.4%) 275.6 293.8 (6.2%) % of PLV HCC FOB AUS Index % 89.2% 73.0% 16.2% 80.0% 81.6% (1.6%) US - Realised Met Price (FOR) US$/t 161.7 170.9 (5.4%) 166.0 215.5 (23.0%) % of PLV HCC FOB AUS Index % 66.7% 55.4% 11.3% 60.2% 73.4% (13.2%) Group - Realised Met Price (combination of FOB / FOR) US$/t 194.7 204.3 (4.7%) 199.3 229.1 (13.0%) % of PLV HCC FOB AUS Index % 80.4% 66.2% 14.2% 72.3% 78.0% (5.7%) Note: Coronado reports its production and financial information on a geographical segment basis. Please refer to the Appendix for operation specific production and sales data. Some numerical figures in the above table have been subject to rounding adjustments. Accordingly, numerical figures shown as totals may not equal the sum of the figures that follow them. In Q1 2024, Coronado revised its production reporting methodology such that the clean equivalent of ROM coal inventory on hand at period end is not included as part of Saleable production. Comparative Saleable production figures have not been updated for this revised methodology. ROM coal production for the Group in the June quarter was 7.4 Mt, 23.8% higher than the preceding March quarter. Saleable production for the Group in the June quarter was 4.1 Mt, 21.5% higher than the March quarter. AUSTRALIAN OPERATIONS (CURRAGH COMPLEX) The Australian operations had a strong June quarter delivering improved production and sales volumes as well as materially lower costs. The Curragh Complex delivered ROM coal production of 3.8 Mt and Saleable production of 2.7 Mt, reflecting increases over the prior March quarter of 39.1% and 23.4%, respectively. These significantly improved results are multi-faceted but are principally due to the completion of the historical pre-strip waste deficit works and the subsequent removal of four fleets in late March 2024, combined with improved productivity from our dragline fleet and improved drill and blast performance. The dragline fleet continues to meet improvement targets with the ratio of waste moved by draglines compared to truck/excavator at 44% (up from 37%). Waste movements in the June quarter and year-to-date are in line with plan. During the quarter, Curragh also experienced less interruption to production with lower rainfall reported quarter-on-quarter. However, heavy rainfall late in June did see approximately 100kt of coal production deferred to July. Curragh railings to port were also temporarily impacted by a traffic accident on the Blackwater line in late June that resulted in a rail outage for approximately 5 days. The cost structure at Curragh has materially improved quarter-on-quarter following the fleet removals, productivity improvements, and contractor rationalisation works. The Australian segment Average Mining Cost Per Tonne Sold has improved by 36% quarter-on-quarter (Jun Q: $81.7/tonne; Mar Q: $126.9/tonne) due to the operational improvements previously mentioned combined with higher production. This improvement equates to approximately a $101 million gross mining cost improvement in the quarter (unaudited) and is the lowest cost per tonne rate for Curragh since the March 2022 quarter. |
QUARTERLY REPORT JUNE 2024 QUARTERLY REPORT: JUNE 2024 4 Coronado is targeting further cost and productivity improvements in the September quarter with the planned removal of an additional contractor fleet (~13 pieces of equipment). Removal of this additional fleet is not expected to impact current or future production plans at Curragh. Upon full demobilisation, that will take the number of fleets removed from Curragh to five, plus the introduction of a new Komatsu PC7000 excavator which is increasing coal delivery and contributing to the overall productivity gains at the site. Operationally, Curragh finished the June quarter in a strong position with elevated stockpiles. The positive momentum achieved in the June quarter has flowed into July as we strive for continued strong production and a further improved cost base following the removal of the additional fleet. U.S. OPERATIONS (BUCHANAN AND LOGAN) Similar to the Australian business, our U.S. operations also performed well in the June quarter, delivering improved production and sales volumes, and lower costs per tonne. The U.S. operations delivered ROM production of 3.6 Mt and Saleable production of 1.4 Mt, reflecting increases over the prior March quarter of 11.0% and 18.3% respectively. June quarter ROM and Saleable production was higher at Buchanan as the mine continued to mine the newly developed southern panels. During the quarter, mining conditions improved, and yield improvements started to materialise as expected. Subsequently, Buchanan ROM production was up 11.1% and Saleable production was up 21.2% quarter-on-quarter. The mine continues to experience improved skip efficiencies following maintenance works earlier in the year. Conveyor belt systems continue to work well and skip counts continue to operate at their best rates in two years. In the September quarter, it is currently planned that development of the next panel in the northern district will be ready for mining, and for a portion of time, we will be running both longwall sections at the same time. This is expected to further increase product yields from Buchanan given the northern district is a higher yielding section. At Logan, ROM and Saleable production in the June quarter were up 10.9% and 14.2% respectively, compared to the prior March quarter. These production improvements are due to the reestablishment of mining in the Powellton mine and incremental tonnages coming from the highwall mining works at the surface operations. The U.S. operations noted a significant improvement in costs per tonne in the June quarter, principally due to the higher production rates achieved. The U.S. segment Average Mining Cost Per Tonne Sold has improved by 10% quarter-on-quarter (Jun Q: $110.0/tonne; Mar Q: $122.9/tonne). HEALTH AND SAFETY The Group TRIR as of 30 June 2024 was 1.01, compared to 1.18 as of 30 June 2023, reflecting a 14% year-on-year improvement. In Australia, the 12-month rolling average TRIFR as of 30 June 2024 was 1.29, compared to 2.52 as of 30 June 2023, reflecting a 49% year-on-year improvement and the lowest Australia TRIFR since April 2018. In the U.S., the 12-month rolling average TRIR as of 30 June 2024 was 2.26, compared to 2.56 as of 30 June 2023. During the March quarter, the Powellton mine (part of the Logan Complex) continued to realize excellence in safety by achieving 3-year Lost Time Injury-free. 0 2 4 6 8 10 TRIFR per million hours Australian Operations TRIFR Australian Operations Industry Average 0 1 2 3 4 TRIR per 200,000 hours U.S. Operations TRIR U.S. Operations Industry Average |
QUARTERLY REPORT JUNE 2024 QUARTERLY REPORT: JUNE 2024 5 SALES VOLUMES, REALISATION AND MIX Sales volumes for the Group in the June quarter were 4.1 Mt, 8.3% higher than in the March quarter. Sales volumes from the Australian and U.S. operations were 2.7 Mt (7.0% higher) and 1.4 Mt (10.8% higher), respectively. Sales volumes for the Group in H1 2024 were 7.8 Mt, 2.2% higher than in H1 2023. Sales volumes from the Australian and U.S. operations year-to-date were 5.2 Mt (12.1% higher) and 2.6 Mt (13.3% lower), respectively. The Group Realised Price Per Tonne of Met Coal Sold for the June quarter (mixture of FOB / FOR / Domestic pricing) was $194.7 per tonne, a decrease of 4.7% from the March quarter. Australias Realised Price Per Tonne of Met Coal Sold for the June quarter was $216.2 per tonne (FOB, 4.0% lower) and for the U.S. operations was $161.7 per tonne (mostly FOR / Domestic fixed, 5.4% lower). The June quarter Group Realised Price Per Tonne of Met Coal Sold (mixture of FOB / FOR / Domestic pricing) of $194.7 per tonne equates to an 80.4% realisation on the June quarter average PLV HCC FOB AUS price index of $242.3 per tonne. As a percentage of total Sales volumes for the June quarter, export sales were 70.5%. Coronados proportion of Met Coal sales revenue as a percentage of total coal revenues in the June quarter was 96.2%. As a percentage of total Sales volumes year-to-date, export sales were 69.8%. Coronados proportion of Met Coal sales revenue as a percentage of total coal revenues year-to-date was 95.7%. The percentage of Met Coal sales was higher than prior year (H1 2023: 90.4%) due to the delivery in prior year of certain U.S. thermal coal contracts negotiated when thermal coal pricing was at elevated levels, and switching was prevalent. 70.5% 12.6% 16.9% Jun Q24 Sales Volumes Mix Export US Domestic AUS Domestic 96.2% 3.8% Jun Q24 Revenue Mix Metallurgical Coal Thermal Coal 69.8% 12.4% 17.8% June YTD Sales Volumes Mix Export US Domestic AUS Domestic 95.7% 4.3% June YTD Revenue Mix Metallurgical Coal Thermal Coal |
QUARTERLY REPORT JUNE 2024 QUARTERLY REPORT: JUNE 2024 6 FINANCIAL AND CORPORATE June quarter Group revenue was $673.8 million, reflecting a 0.9% increase over the preceding March quarter Group revenue of $668.1 million. H1 2024 Group revenue was $1,342 million, down 10.1% compared to H1 2023 revenues of $1,493 million. Lower revenues year-to-date reflect the 6.2% fall in PLV HCC FOB AUS index prices combined with lower annual U.S. domestic contract pricing compared to H1 2023. June quarter Average Mining Costs Per Tonne Sold for the Group were $91.1 per tonne, 27.5% lower than the preceding March quarter ($125.6 per tonne). The lower costs quarter-on-quarter are attributable to the demobilisation of four fleets from Curragh at the end of March combined with higher Sales volumes in the quarter. H1 2024 Average Mining Costs Per Tonne Sold for the Group were $107.7 per tonne. The Company expects costs to be further reduced in the coming quarters following the demobilisation of an additional contractor fleet at Curragh in the September quarter, combined with planned higher production volumes aligned with full year guidance metrics. June quarter Capital Expenditure of $64.5 million was down 10.8% compared to the prior March quarter ($72.3 million). H1 2024 Capital Expenditure of $136.8 million was up 53.5% compared to H1 2023 ($89.1 million). The increase in Capital Expenditure year-to-date is due to the investment in organic growth projects at both our U.S. and Australian operations that are directly funded from operating cashflows generated within the business. As at 30 June 2024, the Company had a Net Debt position of $4.7 million (31 March 2024: Net Debt $17.6 million), consisting of a closing cash balance (excluding restricted cash) of $264.4 million, $242.3 million aggregate principal amount of 10.750% Senior Secured Notes due 2026, and $26.8 million in interest bearing liabilities associated with the Curragh housing arrangements. Coronado had Available Liquidity of $414.4 million as of 30 June 2024, comprising cash and cash equivalents (excluding restricted cash), unrestricted short-term deposits and undrawn available borrowings under its ABL Facility. On 16 May 2024, Coronado successfully completed the sale and leaseback of certain accommodation assets associated with its Curragh mine in Blackwater Queensland. Coronado agreed to terms with Minumbra Blackwater Pty Ltd, a reputable regional infrastructure provider, to a long-term service agreement and sale and leaseback for two camps and 125 houses for an upfront cash payment of A$75 million, inclusive of borrowings of A$40 million recorded as Interest Bearing Liabilities. The transaction did not satisfy the sale criteria under ASC 606 – Revenues from Contracts with Customers and was deemed a financing arrangement. Implementation of these arrangements improves Coronados liquidity at 30 June 2024, and also ensures a superior service offering to employees and contractors via a single specialised and experienced operator. Coronado announced on 25 June 2024 (AEST) the Companys controlling stockholder, Energy & Minerals Group (EMG), had terminated the proposed transaction with Sev.en Global Investments a.s. (SGI) to acquire all of EMGs interest in Coronado. As per the media release from EMG, attached to Coronados announcement on 25 June 2024 (AEST), the agreement between EMG and SGI was terminated by EMG due to the inability of SGI to obtain the necessary regulatory approvals prior to an outside date for completion. Coronado announced on 15 July 2024 (AEST) that the charges against its subsidiary, Coronado Curragh Pty Ltd (CCPL) (as the operator of the Curragh Complex), as set out in the complaint issued by the Office of Workplace Health and Safety Prosecutor, in relation to the death of an employee in an incident in January 2020 were formally dismissed in the Brisbane Magistrates Court, signifying the conclusion of the proceedings against CCPL. Coronado reaffirms previously announced FY24 guidance for Saleable production (16.4 – 17.2 Mt); Average Mining Costs Per Tonne Sold ($95 - $99/t), and Capital Expenditure ($220 million - $250 million). Coronado will release its 2024 Half Year results to the market on 6 August 2024 (AEST). |
QUARTERLY REPORT JUNE 2024 QUARTERLY REPORT: JUNE 2024 7 METALLURGICAL COAL MARKET OUTLOOK MET COAL PRICING The benchmark PLV HCC FOB AUS average index price for the June 2024 quarter was $242 per tonne (March 2024 quarter: $308 per tonne), while the benchmark LV HCC FOB USEC average index price for the June 2024 quarter was $218 per tonne (March 2024 quarter: $256 per tonne). Source: S&P Global Platts 31 December 2019 to 12 July 2024. The global economic environment and resultant steel demand outlook continue to see steady growth, with a number of new stimulus policies announced in the June 2024 quarter boosting Chinas steel demand recovery. Coronado expects that in the September 2024 quarter, prices will remain strong on the back of Indian restocking appetite after the monsoon season. In the same period, Met Coal supply is expected to be restricted with mine production issues from our peers and railway maintenance occurring across the Queensland network. The SGX forward curve, as at 12 July 2024, is projecting PLV HCC FOB AUS average index pricing of $255 per tonne for the remainder of FY24. These pricing projections continue to suggest a higher pricing environment for longer, and a forward pricing environment well above the long-term average price of $199 per tonne. LOGISTICS Rail maintenance across all major Queensland coal networks has been scheduled for July 2024. Maintenance on the Blackwater system, which services the Curragh Complex, is expected to see rail services reduced to a single track for up to two weeks at the end of July/early August. This maintenance program is contributing to the restricted Met coal supply from Queensland as well as pushing PCI coal relativities higher against the Australian PLV index. Rail and port operations associated with our U.S. operations continue to perform as expected. 221.00 248.00 245.00 134.00 0.00 100.00 200.00 300.00 400.00 500.00 600.00 700.00 USD Price per Metric Tonne Metallurgical Coal Price Indices (US$/t) PLV HCC FOB AUS LV HCC FOB USEC PLV HCC CFR China NEWC Thermal Long Term Historical Average Met Price $199/t |
QUARTERLY REPORT JUNE 2024 QUARTERLY REPORT: JUNE 2024 8 DEVELOPMENT PROJECTS AND EXPLORATION MAMMOTH UNDERGROUND The Mammoth Underground Project (part of the Curragh Complex) remains on schedule, subject to regulatory approvals. During the June quarter, Coronado submitted the relevant statutory approvals on time and the approval process is progressing to schedule. All procurement activities are progressing as planned, including all equipment orders placed and delivery schedules agreed upon with providers before project commencement. Mammoth has a full leadership team in place supporting the construction of the project and expressions of interest for staff and workforce have been released to the market. Responses received thus far have been extremely pleasing. In June, Coronado completed all necessary earthworks in S-Pit, and highwall stablisation works have commenced in preparation for portal development. All engagements with the regulators and community have continued to be positive. Mammoth has substantial high-quality Met coal reserves of 41 million ROM tonnes, with coal quality expected to mirror what is being mined at the existing Curragh North open cut. Once fully operational, the project is on target to deliver an incremental 1.5 – 2.0 Mtpa Saleable production in its first phase. Subject to receipt of regulatory approvals, first coal from Mammoth is expected in December 2024. BUCHANAN EXPANSION Organic growth plans at our U.S. operations remain on target. Capital works at Buchanan continued during the quarter to invest in the construction of a new surface raw coal storage area to increase the mines storage capacity, ultimately reducing the risk of bottlenecks and allowing the longwall equipment to run at a higher capacity. In the June quarter, excavation works continued with the completion of access roads and bridge extensions, in addition to grading, compaction and surveying of the stockpile area. The scheduled date for the new stockpile facility remains on plan for April 2025. The Buchanan mine is also progressing with the construction of a second set of skips to increase the mines hoisting capacity to the surface. As at 30 June 2024, the shaft excavation works and concrete lining works were completed, with next stage works continuing as planned. Full completion of the project is expected in May 2025. EMISSIONS REDUCTION PROJECTS CURRAGH GAS PILOT PROJECT Coronado continued to make progress on its Gas Pilot Project at Curragh during the quarter. The project is targeting the capture and beneficial use of open-cut waste mine coal gas from our operations, with downstream use cases for power generation and as a diesel substitute in mining fleets continuing to be explored. Production of Europa 1 & Europa 2 wells commenced in January 2024, and Coronado is continuing to monitor gas flow from these wells to build a data record and our understanding of performance. During the June quarter, Coronado commenced its second gas converted truck trial to assess the performance of a 793F engine with upgraded conversions. Early results are positive and in line with our expectations. The trial will run for 8 weeks. BUCHANAN EMISSIONS REDUCTION Given the proven success of the Ventilation Air Methane (VAM) unit at Vent Shaft 16 to reduce emissions, Coronado undertook a commitment to install a second VAM unit at Vent Shaft 18. The construction of the second VAM unit was completed in April, with testing conducted in May and June. Coronado is pleased to announce that the new VAM unit at Vent Shaft 18 was approved for operations by the Virginia Energy, Oil and Gas Board on 18 June 2024 and is now fully operational and actively reducing emissions at our Buchanan mine. The establishment of this second VAM unit is expected to further reduce Coronados emissions, as part of our strategic path to a 30% Group emission reduction target by 2030. Coronado considers itself as an industry leader in implementing this emission reduction technology. |
QUARTERLY REPORT JUNE 2024 QUARTERLY REPORT: JUNE 2024 9 APPENDIX QUARTERLY PRODUCTION AND SALES PERFORMANCE BY MINE Summary Information (unaudited) Jun Q24 Mar Q24 Change Jun 2024 YTD Jun 2023 YTD Change ROM Production Mt 7.4 6.0 23.8% 13.4 13.4 0.0% Curragh Mt 3.8 2.7 39.1% 6.5 6.5 0.6% Buchanan Mt 1.9 1.7 11.1% 3.5 3.7 (5.6%) Logan Mt 1.8 1.6 10.9% 3.3 3.2 5.5% Saleable Production Mt 4.1 3.4 21.5% 7.5 8.2 (8.9%) Curragh Mt 2.7 2.2 23.4% 4.8 5.0 (3.7%) Buchanan Mt 0.9 0.7 21.2% 1.6 2.0 (22.9%) Logan Mt 0.6 0.5 14.2% 1.1 1.2 (7.2%) Sales Volumes Mt 4.1 3.7 8.3% 7.8 7.6 2.2% Curragh Mt 2.7 2.5 7.0% 5.2 4.7 12.1% Buchanan Mt 0.8 0.7 12.7% 1.6 2.1 (23.4%) Logan Mt 0.5 0.5 9.7% 1.0 0.9 8.1% Some numerical figures in the above table have been subject to rounding adjustments. Accordingly, numerical figures shown as totals may not equal the sum of the figures that follow them. The Greenbrier mine is currently idle. ABOUT CORONADO GLOBAL RESOURCES INC. Coronado Global Resources Inc, or Coronado, is a leading international producer of high-quality Metallurgical Coal, an essential element in steel production. Our coals, transformed in the steelmaking process, support the manufacture of everyday steel-based products, including renewable energy infrastructure, that enrich lives around the world. Coronado was listed on the ASX on 23 October 2018. Coronado has a portfolio of operating mines and development projects in Queensland, Australia, and Pennsylvania, Virginia and West Virginia in the United States. Coronado is one of the largest Metallurgical Coal producers globally by export volume, serving customers on five continents. Coronado is committed to operating in an ethical and sustainable manner and supporting the communities in which we operate. The management team has extensive global experience with blue-chip resource companies. It has a successful track record of building and operating coal mining operations in Australia, the United States and globally. This operational experience is supplemented with a strong knowledge base of domestic and international coal markets and their key drivers. All values quoted in this report are in US dollars unless otherwise stated. All production and sales tonnages are in metric tonnes unless otherwise stated. All information contained within this release is unaudited. CONTACTS Coronado Global Resources Inc. ARBN: 628 199 468 Registered Office: Level 33, Central Plaza One, 345 Queen Street, Brisbane QLD 4000 Australia. T: +61 7 3031 7777 | E: investors@coronadoglobal.com | www.coronadoglobal.com Investors Media Andrew Mooney Helen McCombie Vice President Investor Relations and Communications Morrow Sodali T: +61 458 666 639 T: +61 411 756 248 E: amooney@coronadoglobal.com E: h.mccombie@morrowsodali.com |
QUARTERLY REPORT JUNE 2024 QUARTERLY REPORT: JUNE 2024 10 CAUTIONARY NOTICE REGARDING FORWARD-LOOKING STATEMENTS This report contains forward-looking statements concerning our business, operations, financial performance and condition, the coal, steel and other industries, and our plans, objectives and expectations for our business, operations, financial performance and condition. Forward-looking statements may be identified by words such as "may", "could", "believes", "estimates", "expects", "intends", “plans”, "considers", “forecasts”, “anticipates”, “targets” and other similar words that involve risk and uncertainties. Forward-looking statements provide management's current expectations or predictions of future conditions, events or results. All statements that address operating performance, events or developments that we expect or anticipate will occur in the future are forward-looking statements. They may include estimates of revenues, income, earnings per share, cost savings, capital expenditures, dividend payments, share repurchases, liquidity, capital structure, market share, industry volume, or other financial items, descriptions of managements plans or objectives for future operations, or descriptions of assumptions underlying any of the above. All forward-looking statements speak only as of the date they are made and reflect the Company's good faith beliefs, assumptions and expectations, but they are not a guarantee of future performance or events. Furthermore, the Company disclaims any obligation to publicly update or revise any forward-looking statement, except as required by law. By their nature, forward-looking statements are subject to risks and uncertainties that could cause actual results to differ materially from those suggested by the forward-looking statements. Factors that might cause such differences include, but are not limited to, a variety of economic, competitive and regulatory factors, many of which are beyond the Company's control, that are described in our Annual Report on Form 10-K for the fiscal year ended 31 December 2023 filed with the ASX and SEC on 20 February 2024, as well as additional factors we may describe from time to time in other filings with the ASX and SEC. You may get such filings for free at our website at www.coronadoglobal.com. You should understand that it is not possible to predict or identify all such factors and, consequently, you should not consider any such list to be a complete set of all potential risks or uncertainties. RECONCILIATION OF NON-GAAP FINANCIAL MEASURES This report includes a discussion of results of operations and references to and analysis of certain non-GAAP measures (as described below) which are financial measures not recognised in accordance with U.S. GAAP. Non-GAAP financial measures are used by the Company and investors to measure operating performance. Non-GAAP financial measures used in this report include (i) Realised Price Per Tonne of Met Coal Sold, which we define as Met Coal revenues divided by metallurgical sales volume; (ii) Average Mining Costs Per Tonne Sold, which we define as mining costs divided by sales volumes; and (iii) Net (Debt) / Cash, which we define as cash and cash equivalents (excluding restricted cash), less the outstanding aggregate principal amount of 10.750% Senior Secured Notes due 2026 and less other interest bearing liabilities. We evaluate our mining cost on a cost per metric tonne basis. Mining costs is based on reported cost of coal revenues, which is shown on our statement of operations and comprehensive income exclusive of freight expense, Stanwell rebate, other royalties, depreciation, depletion and amortization and selling, general and administrative expenses, adjusted for other items that do not relate directly to the costs incurred to produce coal at the mine. Reconciliations of certain forward-looking non-GAAP financial measures, including market guidance, to the most directly comparable GAAP financial measures are not provided because the Company is unable to provide such reconciliations without unreasonable effort, due to the uncertainty and inherent difficulty of predicting the occurrence and the financial impact of items impacting comparability and the periods in which such items may be recognised. For the same reasons, the Company is unable to address the probable significance of the unavailable information, which could be material to future results. A reconciliation of Net (Debt) / Cash is shown below for each of the periods presented in this report: 30 June 2024 31 March 2024 (In US$000, except for volume data, unaudited) Total Consolidated Total Consolidated Cash and restricted cash 264,691 224,944 Less: Restricted cash (251) (251) Cash and cash equivalents (excluding restricted cash) 264,439 224,693 Less: Aggregate principal amount of 10.750% Senior Secured Notes due 2026 (242,326) (242,326) Less: Loan – Curragh housing (26,783) - Net (Debt) / Cash (4,670) (17,633) |
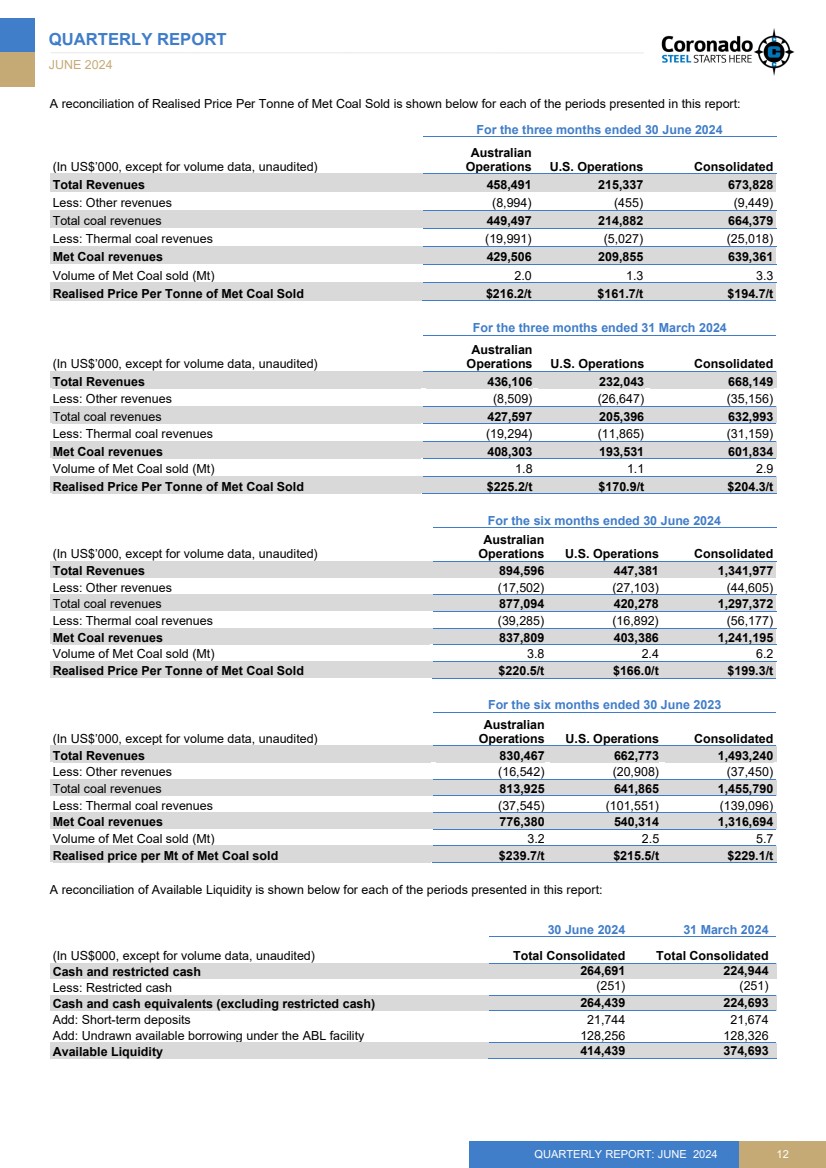
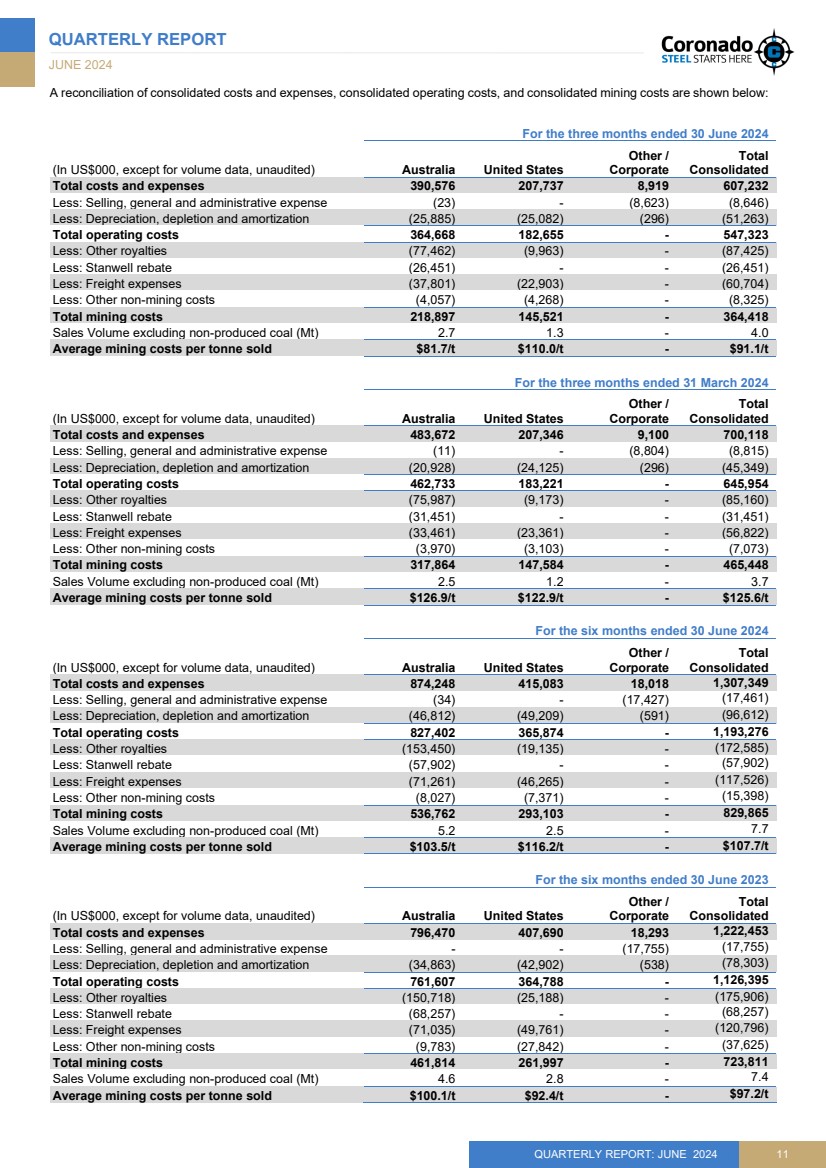
QUARTERLY REPORT JUNE 2024 QUARTERLY REPORT: JUNE 2024 11 A reconciliation of consolidated costs and expenses, consolidated operating costs, and consolidated mining costs are shown below: For the three months ended 30 June 2024 (In US$000, except for volume data, unaudited) Australia United States Other / Corporate Total Consolidated Total costs and expenses 390,576 207,737 8,919 607,232 Less: Selling, general and administrative expense (23) - (8,623) (8,646) Less: Depreciation, depletion and amortization (25,885) (25,082) (296) (51,263) Total operating costs 364,668 182,655 - 547,323 Less: Other royalties (77,462) (9,963) - (87,425) Less: Stanwell rebate (26,451) - - (26,451) Less: Freight expenses (37,801) (22,903) - (60,704) Less: Other non-mining costs (4,057) (4,268) - (8,325) Total mining costs 218,897 145,521 - 364,418 Sales Volume excluding non-produced coal (Mt) 2.7 1.3 - 4.0 Average mining costs per tonne sold $81.7/t $110.0/t - $91.1/t For the three months ended 31 March 2024 (In US$000, except for volume data, unaudited) Australia United States Other / Corporate Total Consolidated Total costs and expenses 483,672 207,346 9,100 700,118 Less: Selling, general and administrative expense (11) - (8,804) (8,815) Less: Depreciation, depletion and amortization (20,928) (24,125) (296) (45,349) Total operating costs 462,733 183,221 - 645,954 Less: Other royalties (75,987) (9,173) - (85,160) Less: Stanwell rebate (31,451) - - (31,451) Less: Freight expenses (33,461) (23,361) - (56,822) Less: Other non-mining costs (3,970) (3,103) - (7,073) Total mining costs 317,864 147,584 - 465,448 Sales Volume excluding non-produced coal (Mt) 2.5 1.2 - 3.7 Average mining costs per tonne sold $126.9/t $122.9/t - $125.6/t For the six months ended 30 June 2024 (In US$000, except for volume data, unaudited) Australia United States Other / Corporate Total Consolidated Total costs and expenses 874,248 415,083 18,018 1,307,349 Less: Selling, general and administrative expense (34) - (17,427) (17,461) Less: Depreciation, depletion and amortization (46,812) (49,209) (591) (96,612) Total operating costs 827,402 365,874 - 1,193,276 Less: Other royalties (153,450) (19,135) - (172,585) Less: Stanwell rebate (57,902) - - (57,902) Less: Freight expenses (71,261) (46,265) - (117,526) Less: Other non-mining costs (8,027) (7,371) - (15,398) Total mining costs 536,762 293,103 - 829,865 Sales Volume excluding non-produced coal (Mt) 5.2 2.5 - 7.7 Average mining costs per tonne sold $103.5/t $116.2/t - $107.7/t For the six months ended 30 June 2023 (In US$000, except for volume data, unaudited) Australia United States Other / Corporate Total Consolidated Total costs and expenses 796,470 407,690 18,293 1,222,453 Less: Selling, general and administrative expense - - (17,755) (17,755) Less: Depreciation, depletion and amortization (34,863) (42,902) (538) (78,303) Total operating costs 761,607 364,788 - 1,126,395 Less: Other royalties (150,718) (25,188) - (175,906) Less: Stanwell rebate (68,257) - - (68,257) Less: Freight expenses (71,035) (49,761) - (120,796) Less: Other non-mining costs (9,783) (27,842) - (37,625) Total mining costs 461,814 261,997 - 723,811 Sales Volume excluding non-produced coal (Mt) 4.6 2.8 - 7.4 Average mining costs per tonne sold $100.1/t $92.4/t - $97.2/t |
QUARTERLY REPORT JUNE 2024 QUARTERLY REPORT: JUNE 2024 12 A reconciliation of Realised Price Per Tonne of Met Coal Sold is shown below for each of the periods presented in this report: For the three months ended 30 June 2024 (In US$000, except for volume data, unaudited) Australian Operations U.S. Operations Consolidated Total Revenues 458,491 215,337 673,828 Less: Other revenues (8,994) (455) (9,449) Total coal revenues 449,497 214,882 664,379 Less: Thermal coal revenues (19,991) (5,027) (25,018) Met Coal revenues 429,506 209,855 639,361 Volume of Met Coal sold (Mt) 2.0 1.3 3.3 Realised Price Per Tonne of Met Coal Sold $216.2/t $161.7/t $194.7/t For the three months ended 31 March 2024 (In US$000, except for volume data, unaudited) Australian Operations U.S. Operations Consolidated Total Revenues 436,106 232,043 668,149 Less: Other revenues (8,509) (26,647) (35,156) Total coal revenues 427,597 205,396 632,993 Less: Thermal coal revenues (19,294) (11,865) (31,159) Met Coal revenues 408,303 193,531 601,834 Volume of Met Coal sold (Mt) 1.8 1.1 2.9 Realised Price Per Tonne of Met Coal Sold $225.2/t $170.9/t $204.3/t For the six months ended 30 June 2024 (In US$000, except for volume data, unaudited) Australian Operations U.S. Operations Consolidated Total Revenues 894,596 447,381 1,341,977 Less: Other revenues (17,502) (27,103) (44,605) Total coal revenues 877,094 420,278 1,297,372 Less: Thermal coal revenues (39,285) (16,892) (56,177) Met Coal revenues 837,809 403,386 1,241,195 Volume of Met Coal sold (Mt) 3.8 2.4 6.2 Realised Price Per Tonne of Met Coal Sold $220.5/t $166.0/t $199.3/t For the six months ended 30 June 2023 (In US$000, except for volume data, unaudited) Australian Operations U.S. Operations Consolidated Total Revenues 830,467 662,773 1,493,240 Less: Other revenues (16,542) (20,908) (37,450) Total coal revenues 813,925 641,865 1,455,790 Less: Thermal coal revenues (37,545) (101,551) (139,096) Met Coal revenues 776,380 540,314 1,316,694 Volume of Met Coal sold (Mt) 3.2 2.5 5.7 Realised price per Mt of Met Coal sold $239.7/t $215.5/t $229.1/t A reconciliation of Available Liquidity is shown below for each of the periods presented in this report: 30 June 2024 31 March 2024 (In US$000, except for volume data, unaudited) Total Consolidated Total Consolidated Cash and restricted cash 264,691 224,944 Less: Restricted cash (251) (251) Cash and cash equivalents (excluding restricted cash) 264,439 224,693 Add: Short-term deposits 21,744 21,674 Add: Undrawn available borrowing under the ABL facility 128,256 128,326 Available Liquidity 414,439 374,693 |
QUARTERLY REPORT JUNE 2024 QUARTERLY REPORT: JUNE 2024 13 GLOSSARY A$ Australian dollar currency Met Coal Metallurgical quality coal ABL Facility Asset Based Lending facility Mt Million tonnes, metric AEST Australian Eastern Standard Time Net (Debt) / Cash Refer Non-GAAP Financial Measures section AU / AUS Australia NEWC Thermal index price Thermal Coal Free On Board Newcastle (Australia) benchmark index price ASX Australian Securities Exchange One Curragh Plan The planned improvement initiatives at the Companys Curragh Mine Complex in Australia. Available Liquidity Refer Non-GAAP Financial Measures section PCI Pulverised Coal Injection PLV HCC FOB AUS index price Premium Low-Volatile Hard Coking Coal Free On Board Australian benchmark index price Average Mining Costs Per Tonne Sold Refer Non-GAAP Financial Measures section PLV HCC CFR China index price Premium Low-Volatile Hard Coking Coal (including cost of freight) to China benchmark index price Prime Waste Overburden removed (excluding rehandled waste) to gain access to the ore body Capital Expenditure Expenditure included as a component of Investing Activities within the Coronado Consolidated Statement of Cash Flows Realised Price Per Tonne of Met Coal Sold Refer Non-GAAP Financial Measures section CDI Chess Depositary Interest ROM Run of Mine, coal mined unwashed CHPP Coal Handling Preparation Plant Saleable production Coal available to sell, either washed or bypassed Closing Cash Cash and Cash Equivalents (excluding restricted cash) at the end of the quarter Sales volumes Sales to third parties EBITDA Earnings before interest, tax, depreciation, and amortization SGX Forward Curve Singapore Exchange Australian Coking Coal futures quotes FOB Free On Board in the vessel at the port Strip Ratio Ratio of overburden removed to coal mined (ROM) FOR Free on Rail in the railcar at the mine tCO2e Tonnes of Carbon Dioxide equivalent emissions Free Cash Flow Net Cash from Operating Activities less cash taxes, Capital Expenditure, Acquisition Expenditure, amounts reserved for Capital / Acquisition Expenditure and amounts required for Fixed Dividends and Debt Servicing. Total Waste Overburden removed (including rehandled waste) to gain access to the ore body FY Full Year 1 January to 31 December TRIFR TRIR Total Reportable Injury Frequency Rate, is the number of fatalities, lost time injuries, cases or substitute work and other injuries requiring medical treatment per million hours worked on a rolling 12-month basis (used in Australia) Total Reportable Incident Rate, is a mathematical computation that takes into account how many Mine Safety and Health Administration (MSHA) recordable incidents our Company has per 200,000 hours worked on a rolling 12-month basis (used in the U.S. and for the Group) Group Result for all Coronado Global Resources entities in Australia and the United States H1 First six months of calendar year HCC Hard coking coal HVA High Vol A HVB High Vol B US$ United States dollar currency Kt Thousand tonnes, metric US$ United States dollar currency LTI Lost Time Injury U.S. United States of America LV HCC FOB USEC index price Low-Volatile Hard Coking Coal Free On Board United States East Coast benchmark index price VWAP Volume Weighted Average Realised Price Mbcms Million Bank Cubic Metres of waste movement YTD Year-to-date for the period ending 30 June 2024 |