UNITED STATES
SECURITIES AND EXCHANGE COMMISSION
Washington, D.C. 20549
_____________________
FORM 6-K
REPORT OF FOREIGN PRIVATE ISSUER PURSUANT TO RULE 13a-16 OR
15d-16 UNDER THE SECURITIES EXCHANGE ACT OF 1934
For the month of November 2019
Commission File Number: 001-38954
_____________________
LINX S.A.
(Exact Name as Specified in its Charter)
N/A
(Translation of registrant’s name into English)
Avenida Doutora Ruth Cardoso, 7,221
05425-902 São Paulo, SP
Federative Republic of Brazil
(Address of principal executive offices)
Indicate by check mark whether the registrant files or will file annual reports under cover of Form 20-F or Form 40-F.
Form 20-F: ý Form 40-F: o
Indicate by check mark if the registrant is submitting the Form 6-K in paper as permitted by Regulation S-T Rule 101(b)(1)):o
Indicate by check mark if the registrant is submitting the Form 6-K in paper as permitted by Regulation S-T Rule 101(b)(7)):o
![]()
3Q19 RESULTS
São Paulo, November 13, 2019.Linx S.A. (B3: LINX3 and NYSE: LINX), announces its consolidated results for the third quarter of 2019 (3Q19). Our operating and financial information is presented based on consolidated figures, as per the Brazilian Corporate Law (Lei das S.A.) and accounting practices issued by the Accounting Pronouncements Committee (CPC) and International Financial Reporting Standards (IFRS).
CONFERENCE CALL
Thursday, November 14 | 09:00 a.m. (EST), 11:00 a.m. (BR) | Phone: +1 646 828.8246 or +1 800 492.3904 | Code: LINX
HIGHLIGHTS
Subscription revenue |
| Adjusted EBITDA and adjusted EBITDA margin |
+13.7%YOy |
| +13.1%YOy |
Subscription revenue was BRL 181.9 million, a 13.7% increase comparing to 3Q18. |
| Adjusted EBITDA grew 13.1% compared to 3Q18. |
80% |
| +10BPS |
Subscription revenue represents80% of gross revenues. |
| Adjusted EBITDA margin reach 24.0% on the quarter, +10 bps compared to 3Q18. |
|
|
|
Adjusted net income |
| Customer retention rate |
BRL 19.6miLlION |
| 99.0% |
Adjusted net income was BRL 19.6 million in 3Q19, BRL 5.4 million higher than 3Q18. |
| Customer retention rate in 3Q19 was 99.0%, in line with the last quarter. |
1
![]()

TO OUR SHAReholders,
In 3Q19, we highlight that the cross selling of financial services (Linx Pay Hub) and Linx Digital, both natively integrated with our end-to-end platform, remained the Company's main growth driver, partially offsetting the net stores closures in our customer base due to the current macroeconomic situation in Brazil.
This quarter, we signed with Vivara (the largest jewelry chain in Brazil) and InBrands (one of the main apparel retail companies) to integrate their online and offline channels through the OMS, which will allow both brands to offer an OmniChannel experience to their consumers. As a result, we ended the quarter with 13 customers at different stages of deployment. In addition, we increased our platform's differential by partnering with Delivery Center (delivery company that uses hubs for distribution from shopping malls) which will allow the retailer to deliver the order within one hour.
Additionally, Linx Pay Hub offerings continue to grow, mainly supported by the adoption of the TEF, the continuous increase of our portfolio of differentiated solutions and 100% integrated with the other products offered by the Company, as well as strategic partnerships such as those signed with the Mercado Pago and AME to reinforce the strategy related to wallet integration (QR Linx).
In 3Q19, Linx Digital and Linx Pay Hub accounted for approximately 12% of Total recurring revenue. This is due to the acquisition of Millennium which was allocated as part of Linx Core, increasing its representativeness in subscription revenue.
As a result of the Company's IPO on the New York Stock Exchange related costs and the write-off of a non-operating subsidiary (Synthesis Brasil), both purely accounting, non-recurring events and recognized in this quarter, Linx reported an accounting loss in the period. That said, net income adjusted for these non-recurring events was BRL 19.6 million, up 38.5% over the same period last year.
We remind you that Linx Day will take place on December 5th in São Paulo at Shopping JK's Cinépolis. Registration for the event is required. We will also have webcast with simultaneous translation into English. Links are available on our website: ir.linx.com.br.
As always, we thank you for your trust and remain at your service.
Team Linx
#soulinx
2
![]()
recent events
AFRAC award
On October 9, 2019, the Brazilian Retail Automation Association (AFRAC) held the AFRAC Excellence Award, recognizing companies that act as technology providers in the retail automation segment for their innovation, relevance and ethical conduct. Among the award-winning companies with totally innovative cases that already transform the consumer experience at the point of sale, Linx was the biggest winner in 5 categories: food service software, apparel software, ERP software, pharmacy software and retail startup (Hiper, acquired in April 2019).
Acquisition of SetaDigital
On October 16, 2019, we signed a share purchase and sale agreement to acquire SetaDigital, a reference in ERP and POS solutions for the footwear sector. The rationale for the acquisition is to reinforce the apparel vertical with a highly specialized footwear retail product and to offer products related to financial services (Linx Pay Hub) and Linx Digital to approximately 2,100 SetaDigital clients.
New idc research
For the first time, IDC released its study on thee-commerce market, with results for 2018. According to the study, the Company achieved 12.2% market share, an increase of 450 basis points compared to the previous year, consolidating its position as the second largest player in the market.
In the same year Linx grew more than twice the market leader, while the other players decreased their participation or remained practically stable.
These data demonstrate the results of our investments in Linx Digital. Over the past five years, we have invested over BRL 280.0 million between acquisitions and R&D to develop digital services natively integrated with our end-to-end platform. This enables our customers' digitization process through our e-commerce platform, enabling a personalized shopping experience through Linx Impulse (search, recommendation and retargeting), as well as enabling retailers to become OmniChannel through our OMS solution.
We continue to see a strong propensity for retailers to become OmniChannel. In this quarter, OMS had 13 clients in different stages of implementation following the signing of new contracts over the period (Vivara and InBrands). In September, we reinforced this platform through a partnership with Delivery Center, allowing the retailer to offer their customers order delivery within one hour.
3
![]()
operating and financial results
operating performance
At the end of 3Q19, our customerretention rate reached 99.0%. Additionally, ourlargest client represented 1.5% of subscription revenue and thetop 100 represented 36.5%. The high customer retention rate and low customer concentration reflect our broad, diversified and loyal customer base.
operating revenues
(BRL ‘000) | 3Q19 | 3Q18 | YoY | 2Q19 | QoQ | 9M19 | 9M18 | Δ% |
Total recurring revenue¹ | 190,562 | 171,275 | 11.3% | 188,201 | 1.3% | 559,278 | 498,162 | 12.3% |
Subscription revenue¹ | 181,872 | 159,986 | 13.7% | 178,246 | 2.0% | 529,888 | 470,201 | 12.7% |
Royalties¹ | 8,690 | 11,289 | -23.0% | 9,954 | -12.7% | 29,390 | 27,961 | 5.1% |
Consulting service revenue¹ | 36,542 | 27,308 | 33.8% | 30,794 | 18.7% | 89,312 | 76,233 | 17.2% |
Gross operating revenues | 227,104 | 198,583 | 14.4% | 218,995 | 3.7% | 648,590 | 574,395 | 12.9% |
Sales taxes² | (23,154) | (19,472) | 18.9% | (21,880) | 5.8% | (64,783) | (56,453) | 14.8% |
Cancellations and rebates | (7,048) | (4,802) | 46.8% | (4,464) | 57.9% | (17,449) | (14,478) | 20.5% |
Net operating revenues | 196,902 | 174,309 | 13.0% | 192,651 | 2.2% | 566,358 | 503,464 | 12.5% |
2- Includes Social integration program – PIS, Social security financing contribution – COFINS, Service tax – ISS, INSS and others.
Subscription revenue reached BRL 181.9 million in 3Q19, representing 80% of gross operating revenue, +13.7% over 3Q18 and +2.0% over 2Q19, on a comparable basis. These increases demonstrate the resilience of the SaaS subscription revenue-based business model and the operations of Linx Digital and Linx Pay Hub, solutions 100% integrated with the end-to-end platform. We highlight that 50% of subscription revenue already comes from all cloud offers (in 2013, it was 30%).
Royalty revenue totaled BRL 8.7 million in 3Q19, -23.0% over 3Q18 and -12.7% over 2Q19. These declines reflect the increased contribution of SaaS offerings to the Company's new sales. Importantly, the new SaaS offerings (cloud-based and subscription revenue generators) do not charge royalties, for the most part.
Consulting service revenue reached BRL 36.5 million in the quarter, +33.8% compared to 3Q18 and +18.7% compared to 2Q19. These increases mainly reflect the larger number and size of implementation projects in the period, mainly related to new clients and to OMS.
Deferred short- and long-term revenues on the balance sheet (consulting service revenue already billed but not recognized as the service has not yet been provided) totaled BRL 43.4 million at the end of 3Q19. In the following months, as the services are rendered, these revenues will be duly recognized.
4
![]()
operating expenses
(BRL ‘000) | 3Q19 | 3Q18 | YoY | 2Q19 | QoQ | 9M19 | 9M18 | Δ% |
Net operating revenues | 196,902 | 174,309 | 13.0% | 192,651 | 2.2% | 566,358 | 503,464 | 12.5% |
Cost of services provided | (55,304) | (49,140) | 12.5% | (49,039) | 12.8% | (151,266) | (143,961) | 5.1% |
% NOR | 28.1% | 28.2% | -10 bps | 25.5% | 260 bps | 26.7% | 28.6% | -190 bps |
General and administrative expenses (ex-depreciation and amortization) | (30,313) | (38,872) | -22.0% | (37,837) | -19.9% | (100,840) | (107,653) | -6.3% |
% NOR | 15.4% | 22.3% | -690 bps | 19.6% | -420 bps | 17.8% | 21.4% | -360 bps |
Depreciation and amortization | (30,545) | (20,596) | 48.3% | (31,590) | -3.3% | (86,483) | (58,000) | 49.1% |
% NOR | 15.5% | 11.8% | 370 bps | 16.4% | -90 bps | 15.3% | 11.5% | 370 bps |
Selling expenses | (36,918) | (28,277) | 30.6% | (36,081) | 2.3% | (108,324) | (78,927) | 37.2% |
% NOR | 18.7% | 16.2% | 250 bps | 18.7% | 0 bps | 19.1% | 15.7% | 340 bps |
Research and development | (25,532) | (20,008) | 27.6% | (20,113) | 26.9% | (64,017) | (54,264) | 18.0% |
% NOR | 13.0% | 11.5% | 150 bps | 10.4% | 250 bps | 11.3% | 10.8% | 50 bps |
Other operating revenues (expenses) | (8,718) | (1,387) | n.a. | 6,420 | n.a. | 3,892 | 5,712 | -31.9% |
% NOR | 4.4% | 0.8% | 360 bps | 3.3% | 110 bps | 0.7% | 1.1% | -40 bps |
Cost of services provided reached BRL 55.3 million in 3Q19, +12.5% over 3Q18 and +12.8% over 2Q19. These increases are mainly explained by higher link expenses due to the increase in revenues from SaaS and financial services initiatives, as well as the increase in cost incorporation due to the acquisitions of Hiper and Millennium in 2Q19 and 3Q19, respectively. As a result, gross margin was 71.9% in 3Q19, -10 bps and +260 bps in comparison with 3Q18 and 2Q19, respectively.
General and administrative expenses (excluding depreciation and amortization) decreased by 690 bps and 420 bps as a percentage of NOR, compared to 3Q18 and 2Q19, respectively. These developments are explained by: (i) write-off of provisions related to the Company's Long Term Incentive Plans and (ii) accounting reclassifications between “general and administrative expenses” and “selling expenses” arising from the reevaluation of the nature of expenses allocated on this line.
Depreciation and amortization expenses increased 370 bps as a percentage of NOR compared to 3Q18. This evolution was mainly due to IFRS16. Additionally, the increase over 3Q18 was driven by the higher amortization of goodwill generated by the companies acquired in the period. The intangible amortization schedule (PPA) and fiscal goodwill amortization is in attachment V. Compared to 2Q19, depreciation and amortization expenses decreased 90 bps.
In 3Q19,selling expenses, as a percentage of NOR, increased by 250 bps compared to 3Q18 mainly due to the reclassifications between the above mentioned “general and administrative expenses” and “selling expenses”. In addition, we have continued to intensify investments in our sales teams last year, mainly involving the Linx Core and Franchise teams to reinforce the cross selling of new offers connected to Linx Digital and financial services (Linx Pay Hub). Compared to 2Q19, selling and marketing expenses remained stable.
Research and development (R&D) expenses, when compared as a percentage of NOR, increased by 150 bps and 250 bps compared to 3Q18 and 2Q19 respectively, mainly due to the consolidation of the acquired companies in the period, in addition to the investments intensified in this last year in R&D teams to strengthen portfolio of new offerings primarily connected to Linx Digital and financial services (Linx Pay Hub).
In 3Q19, BRL 8.7 million werecapitalized as investment in R&D, of which BRL 0.9 million is linked to financial services solutions. Major investments in innovation are related to our products integrated with the Linx Pay Hub and Linx Digital portfolio of services, reinforcing our position as a leading provider of a 100% integrated end-to-end platform that
5
![]()
enables the retailer to become OmniChannel. In addition, Linx has invested to enter new markets, seeking new customer profiles by investing in future Big Data and intelligence opportunities.
EBITDA and EBITDA margin
(BRL ‘000) | 3Q19 | 3Q18 | YoY | 2Q19 | QoQ | 9M19 | 9M18 | Δ% |
Net income | (171) | 9,037 | n.a. | 12,468 | n.a. | 29,477 | 53,837 | -45.2% |
(+) Current income and social contribution taxes | (698) | 4,581 | n.a. | 3,219 | n.a. | 8,914 | 16,473 | -45.9% |
(+) Net financial income (expenses) | 10,441 | 2,411 | n.a. | 8,724 | 19.7% | 20,929 | (3,939) | n.a. |
(+) Depreciation and amortization | 30,545 | 20,596 | 48.3% | 31,590 | -3.3% | 86,483 | 58,000 | 49.1% |
EBITDA | 40,117 | 36,625 | 9.5% | 56,001 | -28.4% | 145,803 | 124,371 | 17.2% |
Net operating revenues | 196,902 | 174,309 | 13.0% | 192,651 | 2.2% | 566,358 | 503,464 | 12.5% |
EBITDA margin | 20.4% | 21.0% | -70 bps | 29.1% | -870 bps | 25.7% | 24.7% | 120 bps |
Net earn-outs reversion1 | - | - | n.a. | (8,100) | n.a. | (11,800) | (7,664) | 54.0% |
Termination of Chaordic USA operations | - | 1,027 | n.a. | - | n.a. | - | 1,027 | n.a. |
Organizational restructuring | - | 4,069 | n.a. | - | n.a. | - | 4,069 | n.a. |
NYSE IPO expenses | 5,005 | - | n.a. | - | n.a. | 5,005 | - | n.a. |
Write-off of Synthesis Brasil² | 2,069 | - | n.a. | - | n.a. | 2,069 | - | n.a. |
Adjusted EBITDA | 47,190 | 41,722 | 13.1% | 47,901 | -1.5% | 141,077 | 121,803 | 15.8% |
Adjusted EBITDA margin | 24.0% | 23.9% | 10 bps | 24.9% | -90 bps | 24.9% | 24.2% | 80 bps |
1- Of the total purchase price we pay for the acquired companies, a portion is paid through earn-outs subject to the achievement of financial and operating targets. When those targets are not achieved by the acquired companies, there is an earn-out reversion in the period.
2- The write-off refers to Synthesis Brasil's operation that transfered the respective CNPJ to Linx Pay.
This quarter, we had non-recurring expenses totaling BRL 7.1 million, arising from the public offering of Linx shares, which ended July 26, 2019 and adjustments related to the write-off of Synthesis Brasil. Accordingly,adjusted EBITDA reached BRL 47.2 million in the quarter, +13.1% and -1.5% over 3Q18 and 2Q19 adjusted EBITDA, respectively.
Adjusted EBITDA margin was 24.0% in the quarter, +10 bps over 3Q18. This evolution is mainly explained by the adoption of IFRS16, as well as the operating leverage of investments made in acquisitions in previous quarters and in the structures of Linx Pay Hub and Linx Digital, which continue to increase their addressable market in new markets and geographies. Compared to 2Q19, adjusted EBITDA margin decreased 90 bps mainly due to the consolidation of recently acquired Millennium.
net financial income (Expenses)
(BRL ‘000) | 3Q19 | 3Q18 | YoY | 2Q19 | QoQ | 9M19 | 9M18 | Δ% |
Net financial income (expenses) | (10,441) | (2,411) | n.a. | (8,724) | 19.7% | (20,929) | 3,939 | n.a. |
Financial income | 23,814 | 10,942 | n.a. | 6,785 | n.a. | 40,883 | 38,908 | 5.1% |
Financial expenses | (34,255) | (13,353) | n.a. | (15,509) | n.a. | (61,812) | (34,969) | 76.8% |
Linx's net financial income (expenses) reached -BRL 10.4 million in 3Q19, -BRL 8.0 million and -BRL 1.7 million over 3Q18 and 2Q19, respectively. These variations mainly reflect the effect of BRL 12.7 million of negative exchange variation on the portion of funds raised abroad with the global offering made in June this year. On the other hand, we had higher income from financial investments compared to the increase in net cash in the period.
6
![]()
INCOME AND SOCIAL CONTRIBUTION TAX
(BRL ‘000) | 3Q19 | 3Q18 | 2Q19 | 9M19 | 9M18 |
Net income before income tax | (869) | 13,618 | 15,687 | 38,391 | 70,310 |
Combined statutory rates | 34% | 34% | 34% | 34% | 34% |
Income and social contribution taxes | |||||
Calculated at combined statutory rates | 295 | (4,630) | (5,334) | (13,053) | (23,905) |
Permanent differences | |||||
Permanent additions | (600) | 3,745 | 260 | (221) | 3,745 |
Law 11.196/05 (Research and development subsidies) | 2,359 | 1,468 | 4,086 | 8,569 | 6,297 |
Tax loss (compensation and composition) | - | 663 | 399 | - | 663 |
Profits accrued abroad | (2,183) | - | - | (2,183) | - |
Income and social contribution taxes (presumed profit regime) | (138) | 923 | 772 | (13) | 2,548 |
Effects of tax rates of subsidiaries abroad | (310) | (5,655) | (2,068) | (1,429) | (4,238) |
Provision for license revenues (IFRS15) and expectations of losses (IFRS09) | - | - | 2,386 | - | - |
Other net differences | 1,275 | (1,095) | (3,721) | (584) | (1,583) |
Deferred and social contribution taxes | 1,529 | (1,790) | (609) | (3,448) | (10,422) |
Current and social contribution taxes | (831) | (2,791) | (2,610) | (5,466) | (6,051) |
Current income and social contribution rate | 0% | 20% | 17% | 14% | 9% |
Total income and social contribution rate | 0% | 34% | 21% | 23% | 23% |
Current income tax and social contribution, which effectively affected the Company's cash, were negative in the period in the amount of BRL 831 thousand. Thus, both the current effective rate and the total effective rate, which includes deferred and current taxes, were 0% in the quarter, mainly due to the negative exchange variation on the portion of funds raised abroad with the global share offering held in June this year.
net income
(BRL ‘000) | 3Q19 | 3Q18 | YoY | 2Q19 | QoQ | 9M19 | 9M18 | Δ% |
Net income | (171) | 9,037 | n.a. | 12,468 | n.a. | 29,477 | 53,837 | -45.2% |
Net reversal of earn-outs¹ | - | - | n.a. | (8,100) | n.a. | (11,800) | (7,664) | 54.0% |
Termination of Chaordic USA operations | - | 1,027 | n.a. | - | n.a. | - | 1,027 | n.a. |
Organizational restructuring | - | 4,069 | n.a. | - | n.a. | - | 4,069 | n.a. |
NYSE IPO expenses | 5,005 | - | n.a. | - | n.a. | 5,005 | - | n.a. |
Write-off of Synthesis Brasil² | 2,069 | - | n.a. | - | n.a. | 2,069 | - | n.a. |
Effect of exchange rate variation on IPO resources | 12,679 | - | n.a. | - | n.a. | 12,679 | - | n.a. |
Adjusted net income | 19,581 | 14,134 | 38.5% | 4,368 | n.a. | 37,429 | 51,270 | -27.0% |
1- Of the total purchase price we pay for the acquired companies, a portion is paid through earn-outs subject to the achievement of financial and operating targets. When those targets are not achieved by the acquired companies, there is an earn-out reversion in the period.
2- The write-off refers to Synthesis Brasil's operation that transfered the respective CNPJ to Linx Pay.
Adjusted net income was BRL 19.6 million in 3Q19, BRL 5.4 million and BRL 15.2 million over 3Q18 and 2Q19, respectively. These developments reflect the performance of cross selling, Linx Pay Hub and Linx Digital, despite the net store closure that remains in our customer base in view of the current macroeconomic situation in the markets in which we operate. In addition, we had the impact of positive deferred income tax due to the effect of foreign earnings in 3Q19.
7
![]()
CASH GENERATION AND NET CASH
In 3Q19, the Company'scash reached a balance of BRL 1,074.4 million, a sharp increase over the previous quarter due to the inflow of funds raised abroad with the global share offering made in June. Additionally, the average return on cash in the quarter was 100.3% of CDI.
The Company'sgross debt ended 3Q19 at BRL 459.5 million, -3.3% over 2Q19, consisting of loans with BNDES in the amount of BRL 219.3 million, accounts payable for acquisitions of assets and subsidiaries totaling BRL 126.5 million, leasing related to IFRS16 in the amount of BRL 113.5 million, since it is necessary to measure and recognize at present value the Company's leases and other loans of BRL 226 thousand. The average cost of debt in the quarter was 106.2% of the CDI.
The Company'snet cash in 3Q19 was BRL 615.0 million. For an overview of total cash flow movements (cash and cash equivalents + short-term investments), see the statement of total cash flow in attachment IV.
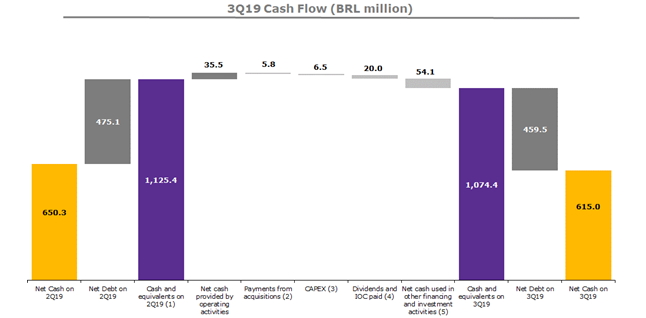
Notes:
(1) The sum of Cash and Financial Investments.
(2) Includes acquisition of companies less net cash and payment of acquisition of subsidiary.
(3) Involves acquisition of property, plant and equipment, acquisition of intangible assets and right of use.
(4) Includes share issuance expenses as a result of the global offering finalized in June 2019.
(5) Income and payments on loans and financing, financial charges, treasury shares and exchange variation on cash and cash equivalents.
Forward-looking statements
This press release contains forward-looking statements within the meaning of Section 27A of the Securities Act of 1933, as amended, and Section 21E of the Securities Exchange Act of 1934, as amended. Forward-looking statements generally relate to future events or our future financial or operating performance. In some cases, you can identify forward looking statements because they contain words such as “may,” “will,” “should,” “expects,” “plans,” “anticipates,” “going to,” “could,” “intends,” “target,” “projects,” “contemplates,” “believes,” “estimates,” “predicts,” “potential” or “continue” or the negative of these words or other similar terms or expressions that concern our expectations, strategy, priorities, plans or intentions. Forward-looking statements in this release include, but are not limited to, statements regarding our future profitability and timing for profitability, our future financial and operating performance, including our outlook for the third quarter and full year 2019, demand for our products and services and the markets in which we operate and the future of our industry. Our expectations and beliefs regarding these matters may not materialize, and actual results in future periods are subject to risks and uncertainties that could cause actual results to differ materially from those projected, including risks regarding our ability to forecast our business, our competition, fluctuations in the markets in which we operate, our ability to attract and retain customers and our partner relationships. The forward-looking statements contained in this release are also subject to other risks and uncertainties, including those more fully described in our filings with the Securities and Exchange Commission (“SEC”), including our prospectus filed pursuant to Rule 424(b) under the Securities Act of 1933, as amended, on June 27, 2019. The forward-looking statements in this release are based on information available to us as of the date hereof, and we disclaim any obligation to update any forward-looking statements, except as required by law.
8
![]()
ATTACHMENT I – INCOME STATEMENT
(BRL ‘000) | 3Q19 | 3Q18 | YoY | 2Q19 | QoQ | 9M19 | 9M18 | Δ% |
Total recurring revenue | 190,562 | 171,275 | 11.3% | 188,201 | 1.3% | 559,278 | 498,162 | 12.3% |
Subscription revenue¹ | 181,872 | 159,986 | 13.7% | 178,246 | 2.0% | 529,888 | 470,201 | 12.7% |
Royalties¹ | 8,690 | 11,289 | -23.0% | 9,954 | -12.7% | 29,390 | 27,961 | 5.1% |
Consulting service revenue¹ | 36,542 | 27,308 | 33.8% | 30,794 | 18.7% | 89,312 | 76,233 | 17.2% |
Gross operating revenues | 227,104 | 198,583 | 14.4% | 218,995 | 3.7% | 648,590 | 574,395 | 12.9% |
Sales taxes² | (23,154) | (19,472) | 18.9% | (21,880) | 5.8% | (64,783) | (56,453) | 14.8% |
Cancellations and rebates | (7,048) | (4,802) | 46.8% | (4,464) | 57.9% | (17,449) | (14,478) | 20.5% |
Net operating revenues | 196,902 | 174,309 | 13.0% | 192,651 | 2.2% | 566,358 | 503,464 | 12.5% |
Cost of services provided | (70,596) | (49,140) | 43.7% | (63,417) | 11.3% | (194,012) | (143,961) | 34.8% |
Gross profit | 126,306 | 125,169 | 0.9% | 129,234 | -2.3% | 372,346 | 359,503 | 3.6% |
Operating expenses | (116,734) | (109,140) | 7.0% | (104,823) | 11.4% | (313,026) | (293,132) | 6.8% |
General and administrative expenses | (45,566) | (59,468) | -23.4% | (55,049) | -17.2% | (144,577) | (165,653) | -12.7% |
Selling expenses | (36,918) | (28,277) | 30.6% | (36,081) | 2.3% | (108,324) | (78,927) | 37.2% |
Research and development | (25,532) | (20,008) | 27.6% | (20,113) | 26.9% | (64,017) | (54,264) | 18.0% |
Other operating revenues (expenses) | (8,718) | (1,387) | n.a. | 6,420 | n.a. | 3,892 | 5,712 | -31.9% |
Income before financial income (expenses) and taxes | 9,572 | 16,029 | -40.3% | 24,411 | -60.8% | 59,320 | 66,371 | -10.6% |
Net financial income (expenses) | (10,441) | (2,411) | n.a. | (8,724) | 19.7% | (20,929) | 3,939 | n.a. |
Financial revenues | 23,814 | 10,942 | n.a. | 6,785 | n.a. | 40,883 | 38,908 | 5.1% |
Financial expenses | (34,255) | (13,353) | n.a. | (15,509) | n.a. | (61,812) | (34,969) | 76.8% |
Income before taxes | (869) | 13,618 | n.a. | 15,687 | n.a. | 38,391 | 70,310 | -45.4% |
Deferred income and social contribution taxes | 1,529 | (1,790) | n.a. | (609) | n.a. | (3,448) | (10,422) | -66.9% |
Current income and social contribution taxes | (831) | (2,791) | -70.2% | (2,610) | -68.2% | (5,466) | (6,051) | -9.7% |
Net income | (171) | 9,037 | n.a. | 12,468 | n.a. | 29,477 | 53,837 | -45.2% |
1- Subscription revenue for 3Q18 was adjusted from BRL 159,986 thousand to BRL 171,275 thousand and consulting service revenue was adjusted from BRL 38,597 thousand to BRL 27,308 thousand due to the reclassification of royalties revenues, which were reallocated from consulting service to subscription revenue, in accordance with IFRS15. We implemented this change in our financial statements beginning in January 2019 as a result of our adoption of IFRS15. The reclassification of royalt revenues, which were reallocated from consulting service revenue to subscription revenue, was BRL 11,289 thousand in 3Q18.
2- Includes Social integration program – PIS, Social security financing contribution – COFINS, Service tax – ISS, INSS and others.
9
![]()
attachment II – Balance Sheet
Assets (BRL ‘000) | 9/30/2019 | 12/31/2018 |
Cash and cash equivalents | 28,652 | 49,850 |
Short-term interests bank deposits | 1,045,886 | 413,374 |
Accounts receivable | 225,257 | 167,102 |
Recoverable taxes | 29,610 | 35,094 |
Other receivables | 27,798 | 43,407 |
Current assets | 1,357,203 | 708,827 |
Accounts receivable in the long term | 3,747 | 3,280 |
Deferred taxes | 9,972 | 4,449 |
Other credits | 23,486 | 7,213 |
Long-term assets | 37,205 | 14,942 |
Property, plant and equipment | 78,412 | 74,273 |
Intangible assets | 1,000,657 | 849,634 |
Right of use | 113,401 | - |
Non-current assets | 1,229,675 | 938,849 |
Total assets | 2,586,878 | 1,647,676 |
Liabilities + Shareholders equity (BRL ‘000) | 9/30/2019 | 12/31/2018 |
Suppliers | 18,191 | 13,623 |
Loans and financing | 40,561 | 40,720 |
Leasing | 14,426 | - |
Labor obligations | 62,336 | 43,801 |
Taxes and contributions payable | 29,329 | 13,455 |
Income and social contribution payable | 1,877 | 1,206 |
Accounts payable from acquisition of subsidiaries | 52,758 | 57,099 |
Deferred revenue | 34,755 | 40,053 |
Anticipation of dividends | - | 2,764 |
Other liabilities | 35,916 | 7,979 |
Current liabilities | 290,149 | 220,700 |
Loans and financing | 178,963 | 209,261 |
Leasing | 99,062 | - |
Labor obligations | 1,526 | - |
Accounts payable from acquisition of subsidiaries | 73,755 | 55,388 |
Deferred tax liabilities | 81,476 | 72,635 |
Deferred revenue | 8,630 | 19,195 |
Other liabilities | 23,593 | 10,960 |
Provision for contingencies | 4,384 | 2,328 |
Non-current liabilities | 471,389 | 369,767 |
Social capital | 645,447 | 488,467 |
Capital reserve | 974,676 | 369,879 |
Profit reserve | 180,841 | 179,457 |
Net income | 29,477 | - |
Proposed additional dividends | - | 22,236 |
Other comprehensive income | (5,101) | (2,830) |
Total shareholders´ equity | 1,825,340 | 1,057,209 |
Total liabilities + Shareholders equity | 2,586,878 | 1,647,676 |
10
![]()
Attachment iII – total cash flow
(BRL ‘000) | 3Q19 | 3Q18 | 2Q19 | 9M19 | 9M18 |
Cash flows from operating activities | |||||
Net income for the period | (171) | 9,037 | 12,468 | 29,477 | 53,837 |
Adjustments to reconciliate net income to cash provided by operating activities | |||||
Depreciation and amortization | 30,545 | 20,596 | 31,590 | 86,483 | 58,000 |
Allowance for doubtful accounts | 1,148 | 891 | (621) | 1,056 | 1,648 |
Provision for present value adjustment | 2,887 | 2,377 | 1,869 | 6,287 | (6,472) |
Stock option plan | (2,417) | 133 | 7,693 | 7,573 | 1,061 |
Financial charges | 9,357 | 6,140 | 9,494 | 26,493 | 18,422 |
Provision for disposal of assets | 1,010 | 1,449 | 867 | 2,306 | 9,787 |
Deferred taxes | (1,529) | 1,790 | 609 | 3,448 | 10,422 |
Current taxes | 831 | 2,791 | 2,610 | 5,466 | 6,051 |
Other operating revenues / Earn-out | - | - | (8,941) | (18,173) | (8,997) |
Provision for contingency | 551 | (1,019) | 451 | 2,336 | (201) |
IAS 29 Effects | (451) | - | (194) | (126) | - |
Others | - | (141) | - | - | (1,168) |
Decrease (increase) of assets | |||||
Trade accounts receivable | (18,390) | (11,312) | (34,315) | (58,829) | (38,450) |
Recoverable taxes | 677 | 5,073 | 1,262 | 5,354 | (5,986) |
Other credits and judicial deposits | (13,150) | (10,234) | 10,318 | (11,853) | (17,579) |
Increase (decrease) in liabilities | |||||
Suppliers | 2,725 | (275) | 579 | 2,048 | 5,276 |
Labor obligations | (2,946) | 4,082 | 9,845 | 17,606 | 12,905 |
Taxes and contributions payable | 19,834 | (162) | (3,906) | 13,805 | (1,681) |
Deferred revenue | (5,464) | (3,906) | (5,918) | (15,863) | (7,037) |
Other accounts payable | 11,696 | 428 | 7,197 | 28,010 | (1,816) |
Income and social contribution taxes | (1,112) | (5,270) | (1,225) | (3,430) | (5,270) |
Net cash provided by (used in) operating activities | 35,631 | 22,468 | 41,732 | 129,474 | 82,752 |
Cash flows from investment activities | |||||
Acquisition of PP&E | (2,689) | (10,169) | (4,912) | (12,371) | (20,122) |
Acquisition of intangible assets | (3,815) | (14,513) | (42,359) | (64,616) | (40,054) |
Acquisition of subsidiaries, net of cash | - | - | (73,885) | (73,885) | (75,218) |
Net cash provided by (used in) investment activities | (6,504) | (24,682) | (121,156) | (150,872) | (135,394) |
Cash flows from financing activities | |||||
Income from loans and financing | 63 | - | - | 63 | 44,468 |
Payments of principal from loans and financing | (4,054) | (10,912) | (14,058) | (32,007) | (30,907) |
Leasing payments | (11,413) | - | - | (11,413) | - |
Pre-payments for right of use | (7,420) | - | - | (7,420) | - |
Financial charges paid | (3,576) | (2,358) | (6,132) | (13,559) | (6,862) |
Payment of acquired subsidiaries | (5,792) | (6,523) | (13,412) | (29,885) | (45,393) |
Dividends and IOC paid | - | (11,000) | (25,000) | (25,000) | (34,000) |
Capital increase | - | 993 | 156,618 | 156,980 | 2,435 |
Capital reserve (treasury shares) | (26,403) | (39,127) | - | (26,403) | (39,127) |
Goodwill on subscription of shares | 7,472 | - | 674,982 | 682,454 | - |
Shares issuance expenses | (27,534) | - | (31,293) | (58,827) | - |
Net cash provided by (used in) financing activities | (78,657) | (68,927) | 741,705 | 634,983 | (109,386) |
Exchange variation on cash and cash equivalents | (1,344) | (1,485) | (53) | (2,271) | (2,275) |
Increase (decrease) in cash and cash equivalents | (50,874) | (72,626) | 662,228 | 611,314 | (164,303) |
Statement of increase (decrease) in cash and cash equivalents | |||||
At the beginning of the period | 1,125,412 | 460,047 | 463,184 | 463,224 | 551,724 |
At the end of the period | 1,074,538 | 387,421 | 1,125,412 | 1,074,538 | 387,421 |
Increase (decrease) in cash and cash equivalents | (50,874) | (72,626) | 662,228 | 611,314 | (164,303) |
11
![]()
ATTACHMENT IV – CASH FLOW
(BRL ‘000) | 3Q19 | 3Q18 | 2Q19 | 9M19 | 9M18 |
Cash flows from operating activities | |||||
Net income for the period | (171) | 9,037 | 12,468 | 29,477 | 53,837 |
Adjustments to reconciliate net income to cash provided by operating activities | |||||
Depreciation and amortization | 30,545 | 20,596 | 31,590 | 86,483 | 58,000 |
Allowance for doubtful accounts | 1,148 | 891 | (621) | 1,056 | 1,648 |
Provision for present value adjustment | 2,887 | 2,377 | 1,869 | 6,287 | (6,472) |
Stock option plan | (2,417) | 133 | 7,693 | 7,573 | 1,061 |
Financial charges | 9,357 | 6,140 | 9,494 | 26,493 | 18,422 |
Provision for disposal of assets | 1,010 | 1,449 | 867 | 2,306 | 9,787 |
Deferred taxes | (1,529) | 1,790 | 609 | 3,448 | 10,422 |
Current taxes | 831 | 2,791 | 2,610 | 5,466 | 6,051 |
Interest earnings from bank deposits | (15,207) | (6,376) | (5,896) | (27,629) | (21,781) |
Other operating revenues / Earn-out | - | - | (8,941) | (18,173) | (8,997) |
Provision for contingency | 551 | (1,019) | 451 | 2,336 | (201) |
IAS 29 Effects | (451) | - | (194) | (126) | - |
Others | - | (141) | - | - | (1,168) |
Decrease (increase) of assets | |||||
Trade accounts receivable | (18,390) | (11,312) | (34,315) | (58,829) | (38,450) |
Recoverable taxes | 677 | 5,073 | 1,262 | 5,354 | (5,986) |
Other credits and judicial deposits | (13,150) | (10,234) | 10,318 | (11,853) | (17,579) |
Increase (decrease) in liabilities | |||||
Suppliers | 2,725 | (275) | 579 | 2,048 | 5,276 |
Labor obligations | (2,946) | 4,082 | 9,845 | 17,606 | 12,905 |
Taxes and contributions payable | 19,834 | (162) | (3,906) | 13,805 | (1,681) |
Deferred revenue | (5,464) | (3,906) | (5,918) | (15,863) | (7,037) |
Other accounts payable | 11,604 | 428 | 7,197 | 27,918 | (1,816) |
Income and social contribution taxes | (1,112) | (5,270) | (1,225) | (3,430) | (5,270) |
Net cash provided by (used in) operating activities | 20,332 | 16,092 | 35,836 | 101,753 | 60,971 |
Cash flows from investment activities | |||||
Acquisition of PP&E | (2,689) | (10,169) | (4,912) | (12,371) | (20,122) |
Acquisition of intangible assets | (3,815) | (14,513) | (42,359) | (64,616) | (40,054) |
Acquisition of subsidiaries, net of cash | - | - | (73,885) | (73,885) | (75,218) |
Financial investments | (956,102) | (157,597) | (117,623) | (1,191,239) | (391,636) |
Redemption of interest and financial investments | 217,273 | 237,848 | 245,000 | 586,448 | 581,654 |
Net cash provided by (used in) investment activities | (745,333) | 55,569 | 6,221 | (755,663) | 54,624 |
Cash flows from financing activities | |||||
Income from loans and financing | 63 | - | - | 63 | 44,468 |
Payments of principal from loans and financing | (4,054) | (10,912) | (14,058) | (32,007) | (30,907) |
Leasing payments | (11,413) | - | - | (11,413) | - |
Pre-payments for right of use | (7,420) | - | - | (7,420) | - |
Financial charges paid | (3,576) | (2,358) | (6,132) | (13,559) | (6,862) |
Payment of acquired subsidiaries | (5,792) | (6,523) | (13,412) | (29,885) | (45,393) |
Dividends and IOC paid | - | (11,000) | (25,000) | (25,000) | (34,000) |
Capital increase | - | 993 | 156,618 | 156,980 | 2,435 |
Goodwill on subscription of shares | (26,403) | (39,127) | - | (26,403) | (39,127) |
Capital reserve (treasury shares) | 7,472 | - | 674,982 | 682,454 | - |
Shares issuance expenses | (27,534) | - | (31,293) | (58,827) | - |
Net cash provided by (used in) financing activities | (78,657) | (68,927) | 741,705 | 634,983 | (109,386) |
Exchange variation on cash and cash equivalents | (1,344) | (1,485) | (53) | (2,271) | (2,275) |
Increase (decrease) in cash and cash equivalents | (805,002) | 1,249 | 783,709 | (21,198) | 3,934 |
Statement of increase (decrease) in cash and cash equivalents | |||||
At the beginning of the period | 833,654 | 45,603 | 49,945 | 49,850 | 42,918 |
At the end of the period | 28,652 | 46,852 | 833,654 | 28,652 | 46,852 |
Increase (decrease) in cash and cash equivalents | (805,002) | 1,249 | 783,709 | (21,198) | 3,934 |
12
![]()
ATTACHMENT V – SCHEDULE OF ACQUISTIONS INTANGIBLES (PPA) AND FiscalGoodwill
Quarter | Amount (BRL) | Quarter | Amount (BRL) | |
4Q19 | (7,872,303) | 4Q19 | (16,676,309) | |
1Q20 | (7,426,575) | 1Q20 | (16,237,546) | |
2Q20 | (7,426,575) | 2Q20 | (15,736,022) | |
3Q20 | (7,134,792) | 3Q20 | (14,732,974) | |
4Q20 | (6,716,620) | 4Q20 | (14,732,974) | |
1Q21 | (6,507,789) | 1Q21 | (14,658,021) | |
2Q21 | (6,477,458) | 2Q21 | (13,965,521) | |
3Q21 | (6,304,086) | 3Q21 | (13,619,271) | |
4Q21 | (5,863,791) | 4Q21 | (13,619,271) | |
1Q22 | (5,545,213) | 1Q22 | (13,619,271) | |
2Q22 | (5,516,481) | 2Q22 | (13,619,271) | |
3Q22 | (5,321,846) | 3Q22 | (12,477,478) | |
4Q22 | (4,593,207) | 4Q22 | (12,477,478) | |
1Q23 | (3,729,023) | 1Q23 | (10,973,158) | |
2Q23 | (3,338,528) | 2Q23 | (9,632,707) | |
3Q23 | (2,716,045) | 3Q23 | (8,420,132) | |
4Q23 | (2,555,279) | 4Q23 | (7,019,964) | |
1Q24 | (2,555,279) | 1Q24 | (6,724,841) | |
2Q24 | (2,201,578) | 2Q24 | (4,165,531) | |
3Q24 | (1,809,876) | 3Q24 | (4,165,531) | |
4Q24 | (1,436,281) | 4Q24 | (2,386,916) | |
1Q25 | (1,390,398) | 1Q25 | (1,959,099) | |
2Q25 | (1,300,033) | 2Q25 | (1,103,466) | |
3Q25 | (1,300,033) | 3Q25 | (1,103,466) | |
4Q25 | (717,422) | 4Q25 | (367,822) | |
1Q26 | (717,422) | 1Q26 | - | |
2Q26 | (717,422) | 2Q26 | - | |
3Q26 | (528,192) | 3Q26 | - | |
4Q26 | (487,258) | 4Q26 | - |
13
![]()
ATTACHMENT VI – PROFORMA SUBSCRIPTION AND CONSULTING SERVICE REVENUES (IFRS15)
(BRL ‘000) | 1Q18 | 2Q18 | 3Q18 | 4Q18 |
Total recurring revenue¹ | 162,362 | 164,525 | 171,275 | 182,638 |
Subscription revenue¹ | 154,513 | 155,702 | 159,986 | 170,151 |
Royalties¹ | 7,849 | 8,823 | 11,289 | 12,487 |
Consulting service revenue¹ | 19,561 | 29,364 | 27,308 | 27,117 |
Gross operating revenue | 181,923 | 193,889 | 198,583 | 209,755 |
1- Subscription revenue and consulting service revenue were adjusted due to the reclassification of royalties revenues, which were reallocated from consulting service to
subscription revenue, in accordance with IFRS15. We implemented this change in our financial statements beginning in January 2019 as a result of our adoption of IFRS15.
14
![]()
GLossARY
Consulting service revenue:revenue from implementation services of our systems, including installation, customization, training and other services related to our products. These revenue components are characterized by their one-time or non-recurring nature. Consulting service revenue are recognized on our statement of income when delivered, in the case of installation, customization and training. If the amount billed exceeds the services performed for any given period, the differenceis presented as deferred revenues on the statement of financial position.
Customer retention rate: is the rate at which billings from existing subscribed customers at the beginning of the period continue as billings during the end of such applicable period not adjusted for (x) any increases or decreases in billings for pricing changes or (y) additional products or services provided to these existing subscribed customers.
EBITDA: We calculate EBITDA as net income plus: (1) net financial income (expense); (2) income tax and social contribution and (3) depreciation and amortization. Since our calculation of EBITDA does not consider net financial income (expense), income tax and social contribution and depreciation and amortization, EBITDA serves as an indicator of our overall financial performance, which is not affected by changes in interest rates, income or social contribution tax rates or levels of depreciation and amortization. Consequently, we believe that EBITDA, when considered in conjunction with other accounting and financial information available, serves as a comparative tool to measure our operating performance, as well as to guide certain administrative decisions. We believe that EBITDA provides the reader with a better understanding not only of our financial performance, but also on our ability to pay interest and principal on our debt and to incur additional debt to finance our capital expenditures and our working capital. We calculate EBITDA and EBITDA margin in accordance with CVM rules. For the sake of comparability, on Adjusted EBITDA we highlight from EBITDA non-recurring expenses during the period.
EBITDA margin: We calculate EDITDA margin by dividing EBITDA for the period by net operating revenues for the same period.
IDC research: engaged annually by Linx since 2012, IDC (International Data Corporation) provides an overview of the Brazilian retail software market. As a methodology, IDC internal studies and interviews with various market players are used. Founded in 1964, IDC is a wholly-owned subsidiary of International Data Group (IDG), the world's leading media, data and marketing services company that activates and engages the most influential technology buyers.
Lei do Bem: Law 11,196/05 - We benefit from tax incentives for technological research and development of technological innovations, provided by Law 11,196 of 2005, known as the Lei do Bem. Among the benefits that we enjoy is accelerated depreciation, by deduction as a cost or an operating expense in the computation period in which they are made, the expenditures related exclusively to technological research and technological innovation development, which explains a large part of our expenditures in depreciation and amortization. We also benefit from the deduction, for purposes of calculating net income, of the sum of expenditures made during the period in technological research and technological innovation development, classified as operating expenses by legislation on Corporate Income Tax.
Linx Digital or Digital: convergence of all channels used by the company with its customer, integrating the customer experience between online and offline world. In the case of Linx, it concentrates Linx Omni (OMS), Linx Commerce (the ecommerce platform) and Linx Impulse (search, recommendation, reengagement and retargeting tools).
Linx Pay Hub, Pay Hub or financil services: it involves initiatives such as TEF, Linx Pay (sub-acquiring), Linx Antecipa (prepayment of receivables), QR Linx, and new products aligned to the strategic positioning of Linx in this area.
OMS:by using Linx Omni OMS technology, retailers can meet orders originating from any channel, regardless of where the product is located. Our OMS product offers multi-channel purchasing processes that integrate stores, franchises and distribution centers, thereby providing a single channel for our customers that decreases inventory shortage, generates more consumer traffic and increased sales. Our OMS product is divided into two modules:
15
![]()
•Omni OMS module:A smart cloud-based suite of communication channels facilitates the interaction between business operations and applicable tax and accounting regulations. The Omni OMS module is responsible for integrating all systems associated with the OMS, such as the retailer's ERP, customer service, logistics, ecommerce platform and mobile solutions, among others.
•Omni in-store: This module is connected to a physical store's POS software, helping transform the store into a distribution center. The instore module allows the store operator to confirm that a customer has placed an order and monitor the necessary steps to ship or reserve the product, including: choice of packaging, labeling, separation for pickup and interaction with the carrier for delivery, among others.
Through our OMS product, retailers are able to manage the following functionalities: ship from store, ship to home, ship to store, pick-up in store, click & collect, return in store, showrooming.
SaaS (Software as a Service):cloud-based solutions that have a recurring subscription revenue model. Examples of SaaS solutions include ERP software in the cloud, Electronic Funds Transfer (TEF), Electronic Fiscal Receipt (NFC-e), OMS, advertising and re-engagement.
TEF: electronic funds transfer is a middleware between POS (point of sale) software and the retail acquirer that allows our customers to direct credit and debit card transactions to their merchant acquirer of choice (credit and debit card processor), among other functionalities. This entirely electronic payment solution is also fully integrated with our ERP (enterprise resource planning) software. Through TEF, we have a unique opportunity to capture a significant volume of debit and credit card transactions pass through the cloud gateways managed by Linx. We actively seek to expand our electronic payment mechanisms. With the increase in debit and credit card transactions, as well as the adoption of cloudbased software, the importance of and demand for these solutions has increased. We offer TEF services as a complementary solution to our software solutions and our primary strategy is on cross-selling to our existing customer base. Customers using our TEF solutions may experience improved performance, stability and availability of our other software solutions.
Total recurring revenue: comprises revenue for service-related monthly subscription fees we charge our customers for (1) the right to use our software and (2) fees we charge for continuous technology support, helpdesk services, software hosting services, support teams and connectivity service. Fees charged in (1) and (2) above are bundled in one contract having a duration of generally twelve months, subject to automatic renewal. Fees related to subscription revenue are nonrefundable and paid monthly. Subscription revenue is recognized in our statement of income ratably as the services are performed, commencing with the date the service is made available to customers and all other revenue recognition criteria have been satisfied. If a start-up fee is charged, in 2017 and 2016, this upfront fee was recognized upon commencement of the service upon adoption IFRS15, this fee is recognized over the average customer life for which this performance obligation is provided. The majority of our revenue is derived from our customers’ monthly use of our systems.
16
SIGNATURES
Pursuant to the requirements of the Securities Exchange Act of 1934, the registrant has duly caused this report to be signed on its behalf by the undersigned, thereunto duly authorized.
Date: November 14, 2019
Linx S.A.
By: /s/ Alexandre Kelemen
Name: Alexandre Kelemen
Title: Investor Relations Officer