UNITED STATES
SECURITIES AND EXCHANGE COMMISSION
Washington, D.C. 20549
_____________________
FORM 6-K
REPORT OF FOREIGN PRIVATE ISSUER PURSUANT TO RULE 13a-16 OR
15d-16 UNDER THE SECURITIES EXCHANGE ACT OF 1934
For the month of April 2021
Commission File Number: 001-38954
_____________________
LINX S.A.
(Exact Name as Specified in its Charter)
N/A
(Translation of registrant’s name into English)
Avenida Doutora Ruth Cardoso, 7,221
05425-902 São Paulo, SP
Federative Republic of Brazil
(Address of principal executive offices)
Indicate by check mark whether the registrant files or will file annual reports under cover of Form 20-F or Form 40-F.
Form 20-F: ý Form 40-F: o
Indicate by check mark if the registrant is submitting the Form 6-K in paper as permitted by Regulation S-T Rule 101(b)(1)): o
Indicate by check mark if the registrant is submitting the Form 6-K in paper as permitted by Regulation S-T Rule 101(b)(7)): o
 |
re
São Paulo, April 19, 2021. Linx S.A. (B3: LINX3 and NYSE: LINX), announces its consolidated results for the fourth quarter of 2020 (4Q20). Our operating and financial information is presented based on consolidated figures, as per the Brazilian Corporate Law (Lei das S.A.) and accounting practices issued by the Accounting Pronouncements Committee (CPC) and International Financial Reporting Standards (IFRS).
highlights
| Gross Revenue | Recurring Revenue (RR) |
| BRL 1.0 Billion 2020 | +11.4% YOY | BRL 847.8 million 2020 |+16.8% yoy |
| Adjusted EBITDA | Adjusted EBITDA Margin |
| BRL 200.6 million 2020| +3.2% YOy | 22.9% 2020 | -180 bps YoY |
| Organic Growth | Customer Retention Rate |
| 7.6% YoY 4Q20 | 99.2% 4Q20 |
| Linx Core | +7% YoY Total rr |
| Delivery App: Total RR has grown 135% since the acquisition by Linx in Feb/20| 85% larger customer base since then |
| Hiper: Total RR grew 42% vs 12M19 | 40% larger customer base vs Dec/19 | Hiperadores network 40% bigger in 2020 |
| Big Retail: SR 11% higher vs 4Q19 | activation of cross solutions 56% higher vs 2019 |
| Millennium: SR grew 25% vs 4Q19 | 94% growth in e-commerce projects vs Dec/19 |
| Linx Franchisees: 409 franchisees in Dec/20 | 30% of new activations in 4Q20 | Same Franchisee Sale: +26% vs 12M19 |
| Linx Digital | +42% YoY total rr |
| Linx Commerce: Total RR 64% higher vs 4Q19 | since Apr/20, we had the volume of a Black Friday every month |
| GMV: platform volume 73% higher in 2020 vs 2019 | BRL 2.3 billion in volume traded in 2020 |
| Linx Impulse: Total RR grew 36% vs 4Q19 | 67% of Linx Digital´s Total RR | ADS volume was 50% higher vs 3Q20 |
| OMNI OMS: 20 clients in 4Q20 | 5,600 stores for roll-out | Total RR 29% higher vs 4Q19 | 10% of Linx Digital´s Total RR |
| Partnerships: 300 retailers published inventories on marketplaces since the announcement of signed partnerships (excluding Hiper) |
| Linx Digital Partners: agencies homologation for selling Linx Digital solutions, 33 partners in 4Q20 |
| Linx Pay | +26% YoY total rr |
| TEF: 49% of Linx Pay´s Total RR | 62% higher traded volume in 2020 vs 2019 |
| Payment link: more than 14,000 registered customers |
| Gateway: Total RR grew 15% vs 3Q20 | 3,400 customers using Linx's payment solution for e-commerce |
| QR Code and Pix: 13,000 customers already integrated with Linx's ERP | 615% larger customer base vs Dec/19 |
| TPV: 4.5x higher in 2020 vs 2019 |
| Unusual operating losses: amounting to BRL 40 million arising from a commercial partner of Linx Pay, entirely accounted for in 4Q20 |
conference call April 20 | 10 a.m. (EDT) or 11 a.m. (BRT) | +1 412 717.9627 or +1 844 204.8942 | Password: LINX | Click here
investor relations ir.linx.com.br | ir@linx.com.br
| 1 |
| |
TO OUR SHAREHOLDERS
2020 was a year of many news and challenges for all of us, the pandemic caused by the Coronavirus brought a new world reality and several social and economic consequences. Among these consequences, we had the temporary closure of stores for industries considered to be non-essential. This movement occurred in all states of Brazil for certain periods, while e-commerce has advanced throughout the national territory, becoming in many cases the main opportunity for the continuity of the business.
Faced with this scenario, Linx once again demonstrated its innovation DNA by creating alternatives so that retailers could remain active and relevant, even with the doors closed. Solutions such as Fast-Farma, Payments Link, mobile POS, e-commerce platform and the possibility of integration with marketplaces and payment gateway fully integrated with our ERP had high adoption rates and allowed stores to continue operating.
According to data from the Monthly Survey of Commerce (PMC) by IBGE, despite the volume of sales having a negative result in the last two months of the year, the accumulated for 2020 closed with an increase of 1.2%. It is the fourth consecutive time that retail has increased annually. With the decline in December, retail sales were equal to the level of February, the pre-pandemic period in Brazil. Still in this context, e-commerce grew 41% in 2020 compared to the previous year, reaching a record value of BRL 87.4 billion in sales according to the Webshoppers survey by e-bit/Nielsen.
As a result, Linx Digital now represents 14.6% of total recurring revenue in 2020, while Linx Pay also grew and was responsible for 13.5% of total recurring revenue in the same year. It is important to note that despite the restrictive measures to the retail operation, Linx Core grew by 8.1% in 2020 when compared to 2019.
We still do not register material impacts on churn, due to the differentiated profile of its customer base, in addition to the low representativeness of the monthly fees charged on retailers' billings. The volume of postponements in the quarter reached BRL 64 million, of which 98% of invoices with an extended term were up to date, an even better level than that registered in 3Q20.
Our Opportunities Committee continues to monitor the impacts of COVID-19. In addition to the various cash protection measures that have been taken since the beginning of the pandemic, Linx implemented a home office for 100% of its employees in mid-March 2020 and, to date, there is no forecast of return to the offices.
On November 17, 2020, our shareholders voted in favor of the incorporation of Linx by STNE. Only CADE's final pronouncement on the transaction is now needed, when detailed information on the next steps will then be released.
As described in Subsequent Events, during the process of preparing the financial statements for the year 2020, we identified unusual operating losses arising from a commercial partner of Linx Pay, which were fully accounted for in 4Q20, which were fully accounted for in 4Q20. It is important to note that this fact does not have any impact on the transaction with STNE.
Finally, we reaffirm our commitment to the long term, guaranteeing the safety of our team, the service to our clients and suppliers, and consequently, to the business.
Alberto Menache & Linx Team
#soulinx
| 2 |
| |
SUBSEQUENT Events
CADE
As informed in the Material Fact of March 19, 2021, within the scope of the business combination of Linx and STNE Participações SA, subject of the Association Agreement signed on August 11, 2020, the Brazilian Administrative Council for Economic Defense - CADE made available in its website the order of the General Superintendence making public the Technical Opinion no. 4/2021/CGAA2/SGA1/SG (SEI no. 0880478), recommending the approval, without restrictions, of the Concentration Act no. 08700.003969/2020-17.
On April 7, 2021, Linx informed through a Notice to the Market that the aforementioned Technical Opinion of the General Superintendence of CADE was appealed and will be analyzed by the Administrative Tribunal of CADE.
The Company will keep its shareholders and the market in general informed about the progress of said process and the final decision that may be rendered by the Administrative Tribunal of CADE. Until this final approval takes place, the Companies will continue to operate independently.
LINX PAY
As informed in the Material Fact of March 29, 2021, as part of the process of preparing its financial statements for the fiscal year 2020, Linx found that its subsidiary, Linx Pay Meios de Pagamento Ltda., presented unusual operational losses, as a consequence of the atypical cancelation of transactions by third parties when using payment machines commercialized by a commercial partner of Linx Pay. Such unusual operational losses did not arise from Linx Core and Linx Digital clients.
Based on the results of the investigations, the Company recognized losses of BRL 40 million which were entirely accounted for in the fourth quarter of 2020. The vulnerabilities that originated the operational losses have already been addressed by Linx. As per the terms and conditions of the Association Agreement entered with Stone, there is no impact in the combination of businesses due to the identified operational losses.
| 3 |
| |
operating and financial results
operating performance
At the end of 4Q20, Linx achieved a customer retention rate of 99.2%, in line with the previous quarter despite the COVID-19 scenario.
Linx´s largest customer represented 1.3% of the recurring revenue in the quarter, this position was held by a retailer in the Pharma vertical. In addition, the 100 largest customers represented 25.1% of the recurring revenue in 4Q20. The high customer retention rate and the low concentration of customers reflect our broad, diversified and loyal customer base.
OPERATING REVENUE
| BRL ‘000 | 4Q20 | 4Q19 | YoY | 3Q20 | QoQ | 2020 | 2019 | Δ% |
| Total recurring revenue | 231,474 | 203,343 | 13.8% | 219,789 | 5.3% | 866,569 | 762,621 | 13.6% |
| Subscription revenue | 228,140 | 195,897 | 16.5% | 215,520 | 5.9% | 847,745 | 725,785 | 16.8% |
| Royalties | 3,334 | 7,446 | -55.2% | 4,269 | -21.9% | 18,824 | 36,836 | -48.9% |
| Consulting service revenue | 39,234 | 52,758 | -25.6% | 33,078 | 18.6% | 140,956 | 142,070 | -0.8% |
| Gross Operating Revenues | 270,708 | 256,101 | 5.7% | 252,867 | 7.1% | 1,007,525 | 904,691 | 11.4% |
| Sales taxes¹ | (28,268) | (26,017) | 8.7% | (25,565) | 10.6% | (102,044) | (90,800) | 12.4% |
| Cancellations and rebates | (9,019) | (8,283) | 8.9% | (6,328) | 42.5% | (29,104) | (25,732) | 13.1% |
| Net Operating Revenues | 233,421 | 221,801 | 5.2% | 220,974 | 5.6% | 876,377 | 788,159 | 11.2% |
1- Includes Social integration program – PIS, Social security financing contribution – COFINS, Service tax – ISS, INSS and others.
Subscription revenue reached BRL 228.2 million in 4Q20, representing 84% of gross operating revenue, +16.5% vs 4Q19 and +5.9% vs 3Q20, despite the continuous effects of COVID-19. These increases demonstrate the resilience of the business model based on recurring revenue (SaaS), in addition to the importance of offering an end-to-end platform that guarantees multiple entry points for Linx solutions, something that was intensified with the acceleration of the digital transformation process for retailers since March 2020. We highlight that more than 60% of recurring revenue comes from offers entirely in the cloud. The fastest growing offers are: Linx Impulse and Linx Commerce.
In 4Q20, the organic growth of subscription revenue was 7.6%, in line with the 7.5% growth registered in the previous quarter. This performance mainly reflects the continuous process of accelerating digital transformation that increases adherence to Linx's end-to-end platform solutions even in a more challenging economic scenario since March 2020.
Royalties revenue reached BRL 3.3 million in 4Q20, -55.2% vs 4Q19 and -21.9% vs 3Q20. As in previous quarters, these declines reflect the increased contribution of SaaS offers to the Company's new sales. In the quarter, the biggest impacts were on the verticals of Food Service, Gas Stations and Apparel. It is important to note that the new SaaS offers, which generate subscription revenue and are cloud based, do not charge royalties, mostly.
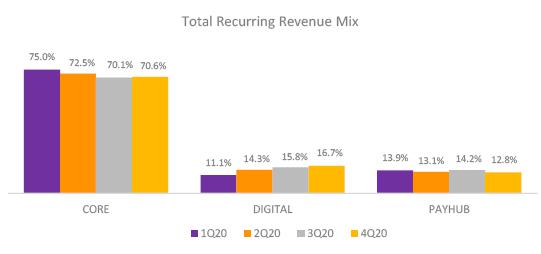
In 4Q20, total recurring revenue reached BRL 231.5 million, +13.8% vs 4Q19 and +5.3% vs 3Q20. In the quarter, Linx Core represented 70.6% of total recurring revenue, while Linx Digital and Linx Pay Hub reached 16.7% and 12.8%, respectively. The positive variation in relation to 3Q20 is explained by the continuous demand for solutions that in many cases guaranteed the continuity of operations of different retailer profiles in the context of COVID-19.
| 4 |
| |
Consulting service revenue reached BRL 39.2 million in 4Q20, -25.6% vs 4Q19, reflecting the lower volume and size of implementation projects with a more challenging scenario for retailers. In relation to 3Q20, consulting service revenue increased by 18.6%. In addition to Napse's performance in the period, this evolution is mainly explained by the greater hiring of digitization solutions, such as ERP for e-commerce and the online sales solution for supermarkets.
Deferred short- and long-term revenues on the balance sheet (consulting service revenue already billed, but not recognized, given that the service has not yet been provided) totaled BRL 26.7 million at the end of 4Q20. In the following months, as the services are provided, these revenues will be duly recognized.
Operating expenses
| BRL ‘000 | 4Q20 | 4Q19 | YoY | 3Q20 | QoQ | 2020 | 2019 | Δ% |
| Net Operating Revenues | 233,421 | 221,801 | 5.2% | 220,974 | 5.6% | 876,377 | 788,159 | 11.2% |
| Cost of services provided | (62,251) | (61,371) | 1.4% | (54,377) | 14.5% | (225,681) | (212,637) | 6.1% |
| % NOR | 26.7% | 27.7% | -100 bps | 24.6% | 210 bps | 25.8% | 27.0% | -120 bps |
General and administrative expenses (ex-depreciation and amortization) | (70,035) | (58,894) | 18.9% | (49,787) | 40.7% | (208,214) | (159,734) | 30.4% |
| % NOR | 30.0% | 26.6% | 350 bps | 22.5% | 750 bps | 23.8% | 20.3% | 350 bps |
| Depreciation and amortization | (40,936) | (33,177) | 23.4% | (43,894) | -6.7% | (160,109) | (119,660) | 33.8% |
| % NOR | 17.5% | 15.0% | 260 bps | 19.9% | -230 bps | 18.3% | 15.2% | 310 bps |
| Selling expenses | (42,888) | (36,411) | 17.8% | (40,254) | 6.5% | (158,927) | (144,735) | 9.8% |
| % NOR | 18.4% | 16.4% | 200 bps | 18.2% | 20 bps | 18.1% | 18.4% | -20 bps |
| Research and development | (29,709) | (29,053) | 2.3% | (26,655) | 11.5% | (111,059) | (93,070) | 19.3% |
| % NOR | 12.7% | 13.1% | -40 bps | 12.1% | 70 bps | 12.7% | 11.8% | 90 bps |
| Other operating revenues (expenses) | (46,596) | 18,895 | n.a. | (5,266) | 784.8% | (59,086) | 22,787 | n.a. |
| % NOR | 20.0% | 8.5% | -2850 bps | 2.4% | 1760 bps | 6.7% | 2.9% | -960 bps |
Note: We highlight the account “Depreciation and amortization” (BRL 11,903 thousand), making the “Cost of services provided” to be presented as BRL 62,251 thousand in 4Q20 (BRL 74,154 thousand less BRL 11,903 thousand). The same concept was applied in the other compared quarters.
The cost of services provided reached BRL 62.3 million in 4Q20, -100 bps as a percentage of NOR vs 4Q19. This evolution is mainly explained by the cash preservation measures adopted as of the second half of March 2020 in the face of the COVID-19 scenario, among which the following stand out: (i) initiatives linked to the staff and their benefits; and (ii) reduction of travel and accommodation expenses. Compared to 3Q20, the cost of services provided increased 210 bps as a percentage of NOR due to: (i) increase in personnel, mainly linked to the vertical of Gas Stations and Linx Pay; (ii) higher advertising costs linked to Linx Impulse; and (iii) higher volume of implementation carried out by Linx franchisees, also responsible for 30% of new activations in the quarter. As a result, the gross margin was 73.3% in 4Q20, +100 bps vs 4Q19 and -210 bps vs 3Q20.
| 5 |
| |
General and administrative expenses (ex-depreciation and amortization) increased 350 bps and 750 bps as a percentage of NOR compared to 4Q19 and 3Q20, respectively. Such developments are mainly explained by: (i) non-recurring expenses as a result of Linx's proposal for STNE in Aug/20; (ii) consolidation of the costs of Mercadapp and Humanus, acquired in 4Q20 and 3Q20 respectively, in addition to PingPag and Neemo, both acquired in 1Q20; and (iii) expenses related to the project to adapt to the SOX rules. The annual comparison was also impacted by the reversal of management's provision of long-term incentives.
Depreciation and amortization expenses presented and increase of 260 bps as a percentage of NOR vs 4Q19. This evolution occurred mainly due to the higher amortization of software developed and depreciation of equipment, in addition to the amortization of intangible assets resulting from the acquisition of companies in the period. In relation to 3Q20, depreciation and amortization expenses decreased by 230 bps as a percentage of NOR, mainly reflecting the amortization of technology and software developed. The amortization schedule for acquisitions intangible assets (PPA) and tax goodwill can be found in Attachment V.
Sales and marketing expenses, when compared as a percentage of NOR, showed an increase of 200 bps vs 4Q19, largely due to the continuous investment in the commercial teams to reinforce the cross-sell of new offers, connected mainly to the portfolio of Linx Digital and Linx Pay Hub solutions. In this context, we ended the quarter with 409 Franchisees and continued with the approval of Agencies for the sale of Linx Digital solutions, reaching 33 partners by the end of the period. These effects were partially offset by cash preservation measures adopted as of March 2020. In relation to 3Q20, sales and marketing expenses remained stable, increasing 20 bps as a percentage of NOR.
Research and development (R&D) expenses, when compared as a percentage of NOR, remained stable in relation to 4Q19, decreasing 40 bps in the period. Compared to 3Q20, research and development expenses increased by 70 bps as a percentage of NOR, largely due to the increased investment in R&D teams to reinforce the portfolio of new offers, mainly from Linx Digital and Linx Pay Hub. It is worth mentioning that these effects were partially offset by the cash preservation initiatives adopted by the Company as of Mar/20.
The allowance for loan losses, allocated to Other operating income (expenses), reached BRL 42.6 million in 4Q20 or 18.2% of net revenue. Accumulated for the year, the allowance for loan losses was BRL 57.3 million or 6.5% of net revenue. These data also reflect the full provision for operating losses of Linx Pay detailed in the item “Subsequent Events”. Excluding this effect, the allowance for loan losses on net revenue would be 1.2% in 4Q20 and 2.0% in the year. We reinforce that Linx constitutes the allowance for loan losses monthly considering the history of losses by maturity and expected losses for securities receivable from customers that comprise the accounts receivable outstanding. Additionally, in the COVID-19 scenario, negotiation requests involving invoice maturities increased and they were analyzed on a case-by-case basis, according to the relationship with the client, totaling BRL 64 million in postponement of payments in December, of which 98% of invoices with an extended term were up to date, a percentage even higher than the 96% in 3Q20.
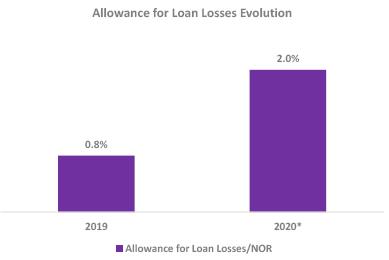
(*) Allowance for Loan Losses/NOR excluding full provision for operating losses of Linx Pay in 4Q20
| 6 |
| |
In 4Q20, BRL 7.0 million was capitalized as an investment with R&D, -17.1% and -12.9% vs 4Q19 and 3Q20, respectively. In the quarter, Linx Core represented 80.5% of capitalized R&D, while Linx Pay and Linx Digital reached 10.2% and 9.3%, respectively. This amount is mainly linked to innovation initiatives to adapt Linx ERPs to the omnichannel concept, in addition to investments in new solutions to strengthen the Linx Pay Hub financial services portfolio and the e-commerce platform. Consolidating our position as the main supplier of an end-to-end platform, 100% integrated and that allows the retailer to become omnichannel. Furthermore, Linx has invested to enter new markets, seeking new customer profiles when investing in future opportunities related to Big Data and Intelligence.
NET FINANCIAL RESULT
| BRL ‘000 | 4Q20 | 4Q19 | YoY | 3Q20 | QoQ | 2020 | 2019 | Δ% |
| Net financial result | (10,829) | 3,752 | n.a. | (13,078) | -17.2% | (37,101) | (17,177) | 116.0% |
| Financial revenues | 12,263 | 23,077 | -46.9% | 9,872 | 24.2% | 44,678 | 70,103 | -36.3% |
| Financial expenses | (23,092) | (19,325) | 19.5% | (22,950) | 0.6% | (81,779) | (87,280) | -6.3% |
Linx's net financial result reached -BRL 10.8 million in 4Q20, -BRL 14.6 million vs 4Q19. This variation is mainly explained by the gradual reduction in the CDI over the period, a lower volume of financial investments and a higher volume of discounts granted to clients in the current macroeconomic scenario. In relation to 3Q20, the net financial result recorded a variation of +BRL 2.3 million due to the impact of exchange variation on cloud contracts and non-capitalization of interest from contracts with BNDES as a result of the suspension of payments during 3Q20.
NET INCOME (LOSS)
| BRL ‘000 | 4Q20 | 4Q19 | YoY | 3Q20 | QoQ | 2020 | 2019 | Δ% |
| Net income (loss) | (65,913) | 9,399 | n.a. | (7,909) | 733.4% | (80,074) | 38,876 | n.a. |
| Linx Pay Unusual Operating Losses¹ | 39,975 | - | n.a. | - | n.a. | 39,975 | - | n.a. |
| Stone Operation Expenses2 | 13,945 | - | n.a. | 6,689 | 20,634 | - | n.a. | |
| Stock options plan | 3,063 | - | n.a. | 3,968 | -22.8% | 10,094 | - | n.a. |
| NYSE IPO expenses3 | 788 | 1,380 | -42.9% | 552 | 42.7% | 2,773 | 6,386 | -56.6% |
| Net earn-out reversion4 | 6 | (19,249) | n.a. | (712) | n.a. | (1,743) | (31,049) | -94.4% |
| M&A expenses5 | - | 825 | n.a. | 445 | n.a. | 2,299 | 825 | 178.7% |
| Organizational restructuring6 | - | - | n.a. | - | n.a. | 5,091 | - | n.a. |
| Donation for the Salvando Vidas project7 | - | - | n.a. | - | n.a. | 1,000 | - | n.a. |
| Write-off of Synthesis Brasil8 | - | - | n.a. | - | n.a. | - | 2,069 | n.a. |
| Extraordinary LTI | - | 15,337 | n.a. | - | n.a. | - | 15,337 | n.a. |
| Adjusted net income (loss) | (8,136) | 7,691 | n.a. | 3,033 | n.a. | 49 | 32,444 | -99.8% |
Observation: The adjustments presented here do not consider the impacts of income tax and social contribution on Net income (loss), they are presented in accordance with the amounts presented in this document for the purpose of comparability. Notes: (1) Unusual operating losses of Linx Pay Meios de Pagamentos Ltda, as a consequence of the cancellation of atypical transactions by third parties in the use of machines sold by a Linx Pay commercial partner. Losses were fully accounted for in 4Q20. (2) Legal and financial advisory expenses arising from STNE´s proposal for Linx. (3) Expenses related to Linx's IPO on the NYSE and consultancy to adapt to SOX rules. (4) Of the total purchase price we pay for the acquired companies, a portion is paid through earn-outs, subject to the achievement of financial and operational goals. When these goals are not achieved by the acquired companies, there is a reversal of earn-out in the period. (5) Expenses related to the due diligence process of acquired companies. (6) Organizational restructuring carried out at the beginning of the year and in June 2020. (7) Donation to the BNDES Saving Lives Project. The amount collected is applied to the front line of coping with the pandemic of COVID-19, that is, in the acquisition of material, supplies and protective equipment for doctors, nurses and other health professionals who work in hospitals. (8) The write-off refers to the closing of Synthesis Brasil's operation to transfer the respective CNPJ to Linx Pay.
The adjusted net loss was BRL 8.1 million in 4Q20, -BRL 15.8 million vs 4Q19 and -BRL 11.2 million vs 3Q20. These variations are mainly explained by: (i) negative impact on the financial result with the gradual reduction of the CDI in the period and the greater volume of discounts granted to customers; (ii) higher advertising and implementation costs; (iii) effects of the acquisitions of companies and the consolidation of the respective cost structures; and (iv) lower sequential expansion of net operating revenue due to the more challenging period generated by the pandemic.
| 7 |
| |
EBITDA AND EBITDA MARGIN
| BRL ‘000 | 4Q20 | 4Q19 | YoY | 3Q20 | QoQ | 2020 | 2019 | Δ% |
| Net income (loss) | (65,913) | 9,399 | n.a. | (7,909) | n.a. | (80,074) | 38,876 | n.a. |
| (+) Income and social contribution taxes | (3,910) | 16,143 | n.a. | (4,428) | -11.7% | (3,726) | 25,057 | n.a. |
| (+) Net financial result | 10,829 | (3,752) | n.a. | 13,078 | -17.2% | 37,101 | 17,177 | 116.0% |
| (+) Depreciation and amortization | 40,936 | 33,177 | 23.4% | 43,894 | -6.7% | 160,109 | 119,660 | 33.8% |
| EBITDA | (18,058) | 54,967 | n.a. | 44,635 | n.a. | 113,410 | 200,770 | -43.5% |
| Net Operating Revenues | 233,421 | 221,801 | 5.2% | 220,974 | 5.6% | 876,377 | 788,159 | 11.2% |
| EBITDA Margin | -7.7% | 24.8% | -3260 bps | 20.2% | -2800 bps | 12.9% | 25.5% | -1250 bps |
| Linx Pay Unusual Operating Losses¹ | 39,975 | - | n.a. | - | n.a. | 39,975 | - | n.a. |
| Stone Operation Expenses2 | 13,945 | - | n.a. | 6,689 | 108.5% | 20,634 | - | n.a. |
| Stock options plan | 3,063 | - | n.a. | 3,968 | -22.8% | 10,094 | - | n.a. |
| Anticipation and assignment of receivables3 | 2,270 | - | n.a. | 1,867 | 21.6% | 7,019 | - | n.a. |
| NYSE IPO expenses4 | 788 | 1,380 | -42.9% | 552 | 42.7% | 2,773 | 6,386 | -56.6% |
| Net earn-out reversion5 | 6 | (19,249) | n.a. | (712) | n.a. | (1,743) | (31,049) | -94.4% |
| M&A expenses6 | - | 825 | n.a. | 445 | n.a. | 2,299 | 825 | 178.7% |
| Organizational restructuring7 | - | - | n.a. | - | n.a. | 5,091 | - | n.a. |
| Donation for the Salvando Vidas project8 | - | - | n.a. | - | n.a. | 1,000 | - | n.a. |
| Write-off of Synthesis Brasil9 | - | n.a. | - | n.a. | - | 2,069 | n.a. | |
| Extraordinary LTI | - | 15,337 | n.a. | n.a. | - | 15,337 | n.a. | |
| Adjusted EBITDA | 41,989 | 53,260 | -21.2% | 57,444 | -26.9% | 200,552 | 194,338 | 3.2% |
| Adjusted EBITDA margin | 18.0% | 24.0% | -610 bps | 26.0% | -810 bps | 22.9% | 24.7% | -180 bps |
Notes: (1) Unusual operating losses of Linx Pay Meios de Pagamentos Ltda, as a consequence of the cancellation of atypical transactions by third parties in the use of machines sold by a Linx Pay commercial partner. Losses were fully accounted for in 4Q20. (2) Legal and financial advisory expenses arising from STNE´s proposal for Linx. (3) Impact of the anticipation and assignment of receivables offered by Linx Pay Hub, considering that this revenue is allocated to the Financial Result, below EBITDA. (4) Expenses related to Linx's IPO on the NYSE and consultancy to adapt to SOX rules. (5) Of the total purchase price we pay for the acquired companies, a portion is paid through earn-outs, subject to the achievement of financial and operational goals. When these goals are not achieved by the acquired companies, there is a reversal of earn-out in the period. (6) Expenses related to the due diligence process of acquired companies. (7) Organizational restructuring carried out at the beginning of the year and in June 2020. (8) Donation to the BNDES Saving Lives Project. The amount collected is applied to the front line of coping with the pandemic of COVID-19, that is, in the acquisition of material, supplies and protective equipment for doctors, nurses and other health professionals who work in hospitals. (9) The write-off refers to the closing of Synthesis Brasil's operation to transfer the respective CNPJ to Linx Pay.
In this quarter, we had non-recurring expenses totaling BRL 60.0 million, mainly involving: (i) calculation of Linx Pay's unusual operating losses; (ii) legal and financial advisory expenses arising from STNE's proposal for Linx; (iii) the Company's stock option plan; (iv) impact of revenue from prepayment and assignment of receivables offered by the Linx Pay Hub, amount allocated to the financial result. Accordingly, adjusted EBITDA reached BRL 42.0 million in the quarter, -21.2% and -26.9% in relation to adjusted EBITDA in 4Q19 and 3Q20, respectively.
The adjusted EBITDA margin was 18.0% in the quarter, -610 bps vs 4Q19 and -810 bps vs 3Q20. These developments are mainly explained by: (i) continuous investment in the teams to reinforce the cross-sell of offers connected mainly to Linx Digital and Linx Pay Hub; (ii) higher volume of implementation carried out by Linx franchisees, responsible for 30% of new activations in 4Q20; (iii) discounts granted to customers in view of the current macroeconomic scenario; and (iv) lower sequential expansion of net operating revenue due to the more challenging period generated by the pandemic, despite the continuous digital transformation process of retailers.
| 8 |
| |
CASH GENERATION AND NET CASH
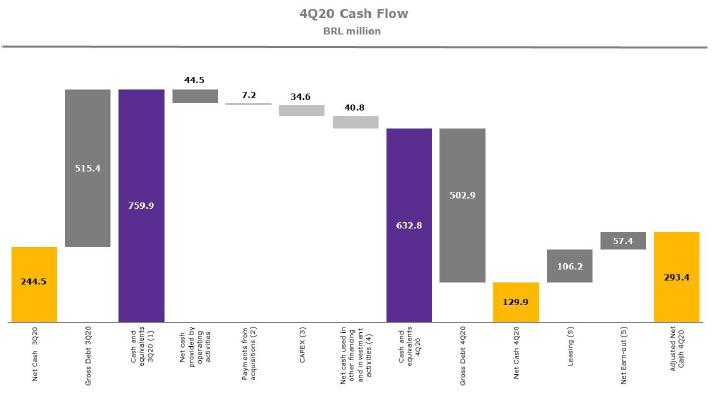
In 4Q20, the Company´s cash balance and financial investments reached BRL 632.8 million, BRL 347.5 million below 4Q19 mainly due to the disbursement resulting from the five acquisitions of companies and the execution of the share buyback program.
The Company's gross debt ended 4Q20 at BRL 503.0 million, -2.4% vs 3Q20, comprising loans with BNDES in the amount of BRL 296.0 million, accounts payable for acquisitions of assets and subsidiaries in a total of BRL 100.8 million, lease amounting to BRL 106.2 million, since it is necessary to measure and recognize the Company's leases at present value.
The Company's net cash in 4Q20 was BRL 129.9 million. Excluding the leasing-related amount from gross debt, resulting from IFRS16, and the net earn-out of accounts payable for acquisitions, Linx's adjusted net cash would be BRL 293.4 million. For an overview of changes in total cash flow (cash and equivalents + short-term investments), the statement of total cash flow can be found in Attachment III.
Notes: (1) Comprises the sum of the balances of Cash and Financial Investments. (2) Includes acquisition of companies less net cash and payment for the acquisition of subsidiaries. (3) It involves the acquisition of property, plant and equipment, the acquisition of intangible assets and the sale of property, plant and equipment. (4) Income and payments for loans and financing, lease payments, advances for future capital increase, financial charges, capital reserve and exchange variation on cash and cash equivalents and dividends and interest on capital paid. (5) For the calculation of the adjusted net cash, we highlight from the gross debt the leasing, resulting from IFRS16, and the net earn-out of accounts payable for acquisitions, excluding the portion retained for possible contingencies.
| 9 |
| |
ATTACHMENT I – INCOME STATEMENT
| BRL ‘000 | 4Q20 | 4Q19 | YoY | 3Q20 | QoQ | 2020 | 2019 | Δ% |
| Total recurring revenue | 231,474 | 203,343 | 13.8% | 219,789 | 5.3% | 866,569 | 762,621 | 13.6% |
| Subscription revenue | 228,140 | 195,897 | 16.5% | 215,520 | 5.9% | 847,745 | 725,785 | 16.8% |
| Royalties | 3,334 | 7,446 | -55.2% | 4,269 | -21.9% | 18,824 | 36,836 | -48.9% |
| Consulting service revenue | 39,234 | 52,758 | -25.6% | 33,078 | 18.6% | 140,956 | 142,070 | -0.8% |
| Gross operating revenues | 270,708 | 256,101 | 5.7% | 252,867 | 7.1% | 1,007,525 | 904,691 | 11.4% |
| Sales taxes¹ | (28,268) | (26,017) | 8.7% | (25,565) | 10.6% | (102,044) | (90,800) | 12.4% |
| Cancellations and rebates | (9,019) | (8,283) | 8.9% | (6,328) | 42.5% | (29,104) | (25,732) | 13.1% |
| Net operating revenues | 233,421 | 221,801 | 5.2% | 220,974 | 5.6% | 876,377 | 788,159 | 11.2% |
| Cost of services provided | (74,154) | (78,103) | -5.1% | (70,463) | 5.2% | (283,262) | (272,115) | 4.1% |
| Gross profit | 159,267 | 143,698 | 10.8% | 150,511 | 5.8% | 593,115 | 516,044 | 14.9% |
| Operating expenses | (218,261) | (121,908) | 79.0% | (149,770) | 45.7% | (639,814) | (434,934) | 47.1% |
| General and administrative expenses | (99,068) | (75,339) | 31.5% | (77,595) | 27.7% | (310,742) | (219,916) | 41.3% |
| Selling expenses | (42,888) | (36,411) | 17.8% | (40,254) | 6.5% | (158,927) | (144,735) | 9.8% |
| Research and development | (29,709) | (29,053) | 2.3% | (26,655) | 11.5% | (111,059) | (93,070) | 19.3% |
| Other operating revenues (expenses) | (46,596) | 18,895 | n.a. | (5,266) | 784.8% | (59,086) | 22,787 | n.a. |
| Income before financial income (expenses) and taxes | (58,994) | 21,790 | n.a. | 741 | n.a. | (46,699) | 81,110 | n.a. |
| Net financial result | (10,829) | 3,752 | n.a. | (13,078) | -17.2% | (37,101) | (17,177) | 116.0% |
| Financial revenues | 12,263 | 23,077 | -46.9% | 9,872 | 24.2% | 44,678 | 70,103 | -36.3% |
| Financial expenses | (23,092) | (19,325) | 19.5% | (22,950) | 0.6% | (81,779) | (87,280) | -6.3% |
| Income (loss) before taxes | (69,823) | 25,542 | n.a. | (12,337) | 466.0% | (83,800) | 63,933 | n.a. |
| Deferred income and social contribution taxes | 7,188 | (10,215) | n.a. | 6,561 | 9.6% | 15,277 | (13,663) | n.a. |
| Current income and social contribution taxes | (3,278) | (5,928) | -44.7% | (2,133) | 53.7% | (11,551) | (11,394) | 1.4% |
| Net income (loss) | (65,913) | 9,399 | n.a. | (7,909) | 733.4% | (80,074) | 38,876 | n.a. |
1- Social integration program – PIS, Social security financing contribution – COFINS, Service tax – ISS, INSS and others.
| 10 |
| |
ATTACHMENT II – BALANCE SHEET
| Assets (BRL ‘000) | 12/31/2020 | 12/31/2019 |
| Cash and cash equivalents | 45,562 | 75,898 |
| Short-term interest earnings bank deposits | 584,778 | 902,289 |
| Accounts receivable | 477,217 | 276,626 |
| Recoverable taxes | 37,702 | 22,648 |
| Other receivables | 48,762 | 22,509 |
| Current assets | 1,194,021 | 1,299,970 |
| Long-term interest earnings bank deposits | 2,467 | 2,073 |
| Accounts receivable in the long term | 16,100 | 11,485 |
| Recoverable taxes | 4,341 | 5,166 |
| Deferred taxes | 14,891 | 3,357 |
| Other credits | 25,853 | 26,338 |
| Long-term assets | 63,652 | 48,419 |
| Property, plant and equipment | 109,057 | 82,201 |
| Intangible assets | 1,209,948 | 1,009,314 |
| Right of use | 101,655 | 124,039 |
| Non-current assets | 1,484,312 | 1,263,973 |
| Total assets | 2,678,333 | 2,563,943 |
| Liabilities + Shareholders equity (BRL ‘000) | 12/31/2020 | 12/31/2019 |
| Suppliers | 49,678 | 24,007 |
| Accounts payable merchants | 250,618 | 80,436 |
| Loans and financing | 69,775 | 40,836 |
| Leasing | 29,382 | 47,478 |
| Labor obligations | 63,067 | 51,080 |
| Taxes and contribution payable | 19,582 | 23,127 |
| Income and social contribution taxes | 4,998 | 3,823 |
| Accounts payable from acquisition of subsidiaries | 57,346 | 43,432 |
| Deferred revenue | 23,938 | 36,360 |
| Dividends payable | 60 | 9,719 |
| Other liabilities | 19,482 | 9,549 |
| Current liabilities | 587,926 | 369,847 |
| Loans and financing | 226,199 | 168,937 |
| Leasing | 76,797 | 78,604 |
| Labor obligations | 2,687 | 1,977 |
| Accounts payable from acquisition of subsidiaries | 43,440 | 39,637 |
| Deferred tax liabilities | 81,415 | 84,206 |
| Deferred revenue | 2,729 | 6,434 |
| Provision for contingencies | 28,929 | 19,588 |
| Other liabilities | 8,147 | 4,869 |
| Non-current liabilities | 470,343 | 404,252 |
| Social capital | 645,447 | 645,447 |
| Capital reserve | 1,153,554 | 1,165,605 |
| Treasury Shares | (299,856) | (225,954) |
| Profit reserve | 124,134 | 200,596 |
| Proposed additional dividends | - | 10,281 |
| Other comprehensive income | (3,215) | (6,131) |
| Total shareholders’ equity | 1,620,064 | 1,789,844 |
| Total liabilities + shareholders’ equity | 2,678,333 | 2,563,943 |
| 11 |
| |
ATTACHMENT III – TOTAL CASH FLOW ¹
| BRL ‘000 | 4Q20 | 4Q19 | 3Q20 | 2020 | 2019 |
| Cash flows from operating activities | |||||
| Net income (loss) for the period | (65,913) | 9,399 | (7,909) | (80,074) | 38,876 |
| Adjustments to reconciliate net income to cash provided by operating activities | |||||
| Depreciation and amortization | 40,488 | 33,177 | 43,741 | 157,822 | 119,660 |
| Addition to allowance for loan losses | (388) | 2,304 | 1,113 | 5,936 | 3,360 |
| Addition (reversal) of adjustment to present value | 1,033 | 2,806 | 2,714 | 6,802 | 9,093 |
| Stock option plan | 3,574 | 16,060 | 3,683 | 6,213 | 23,633 |
| Financial charges | 12,208 | 5,205 | 8,914 | 38,576 | 31,698 |
| Losses (gains) on write-off/disposal of assets | 5,559 | (1,793) | (1,580) | 5,700 | 266 |
| Deferred taxes | (7,188) | 10,215 | (6,561) | (15,277) | 13,663 |
| Current taxes | 11,551 | 11,394 | - | 11,551 | 11,394 |
| Other operating revenues / Earn-out | (7,632) | (21,210) | (743) | (10,640) | (39,383) |
| Provision for contingency | 5,688 | 516 | 3,040 | 9,341 | 2,852 |
| Effect of hyperinflation (IAS 29) | 1,594 | 765 | 588 | 4,136 | 639 |
| Decrease (increase) in assets | |||||
| Trade accounts receivable | (74,193) | (61,503) | (82,541) | (209,723) | (120,332) |
| Recoverable taxes | (1,173) | 926 | (3,576) | (14,229) | 6,280 |
| Accounts payable merchants | 170,182 | 78,196 | - | 170,182 | 78,196 |
| Other credits and judicial deposits | (12,887) | 2,029 | 4,961 | (16,278) | (9,824) |
| Increase (decrease) in liabilities | |||||
| Suppliers | 11,111 | 4,991 | 7,668 | 18,600 | 7,039 |
| Labor obligations | (29,213) | (11,576) | 13,749 | 11,795 | 6,030 |
| Taxes and contributions payable | (7,656) | (11,981) | (2,195) | (11,825) | 7,290 |
| Deferred income | (3,085) | (591) | (3,173) | (16,127) | (16,454) |
| Income and social contribution taxes paid | (1,454) | (3,997) | (367) | (4,130) | (7,427) |
| Other accounts payable | (96,744) | (23,644) | 91,731 | (3,678) | 6,020 |
| Net cash provided by operating activities | (44,538) | 41,688 | 73,257 | 64,673 | 172,569 |
| Cash flows from investing activities | |||||
| Acquisition of PP&E | (10,432) | (6,467) | (12,988) | (44,438) | (18,838) |
| Acquisition of intangible assets | (23,651) | (15,059) | (17,987) | (80,788) | (79,675) |
| Acquisition of subsidiaries, net of cash | (5,922) | (23,385) | (11,420) | (147,251) | (97,270) |
| Disposal of PP&E | (467) | (247) | 467 | - | - |
| Net cash used in financing activities | (40,472) | (45,158) | (41,928) | (272,477) | (195,783) |
| Cash flows from financing activities | |||||
| Proceeds from loans and financing | - | (63) | 118,281 | 107,937 | - |
| Payments of loans and financing | (19,999) | (10,167) | (10,346) | (30,345) | (42,174) |
| Leasing payment | (8,559) | (7,432) | (13,315) | (57,251) | (18,845) |
| Pre-payments for right of use | - | 577 | - | - | (6,843) |
| Advance for future capital increase | - | - | (300) | - | - |
| Financial charges paid | (8,379) | (3,337) | - | (13,854) | (16,896) |
| Payments of acquisitions of subsidiaries | (1,265) | (18,208) | (4,203) | (41,109) | (48,093) |
| Dividends paid | - | - | (26) | (19,940) | (25,000) |
| Capital increase | - | - | - | - | 156,980 |
| Goodwill on subscription of shares | - | - | - | - | 682,454 |
| Treasury shares | - | (51,178) | 7,833 | (92,166) | (77,581) |
| Share issuance expense | - | 93 | - | - | (58,734) |
| Net cash used in financing activities | (38,202) | (89,715) | 97,924 | (146,728) | 545,268 |
| Exchange variation on cash and cash equivalents | (3,885) | (1,093) | 427 | 7,079 | (3,364) |
| Decrease in cash and cash equivalents | (127,097) | (94,278) | 129,680 | (347,453) | 518,690 |
| Statement of decrease in cash and cash equivalents | |||||
| At the beginning of the period | 759,904 | 1,074,538 | 630,224 | 980,260 | 461,570 |
| At the end of the period | 632,807 | 980,260 | 759,904 | 632,807 | 980,260 |
| Decrease in cash and cash equivalents | (127,097) | (94,278) | 129,680 | (347,453) | 518,690 |
Notes: (1) The total cash flow consolidates the cash balance and financial investments for managerial purposes, Therefore, it is not an accounting view of the statement, (2) The difference between the "Recoverable taxes" and "Exchange variation on cash and cash equivalents" lines between the "Total Cash Flow" and "Cash Flow and Equivalents" is due to the fact that we consider 100% of the balance of Financial Investments as “Cash and cash equivalents”, resulting in the effect on the movement of the lines mentioned above.
| 12 |
| |
ATTACHMENT IV – CASH FLOW
| BRL ‘000 | 4Q20 | 4Q19 | 3Q20 | 2020 | 2019 |
| Cash flows from operating activities | |||||
| Net (loss) income for the period | (65,913) | 9,399 | (7,909) | (80,074) | 38,876 |
| Adjustments to reconciliate net income to cash provided by operating activities | |||||
| Depreciation and amortization | 40,488 | 33,177 | 43,741 | 157,822 | 119,660 |
| Addition to allowance for loan losses | (388) | 2,304 | 1,113 | 5,936 | 3,360 |
| Addition (reversal) of adjustment to present value | 1,033 | 2,806 | 2,714 | 6,802 | 9,093 |
| Stock option plan | 3,574 | 16,060 | 3,683 | 6,213 | 23,633 |
| Financial charges | 12,208 | 5,205 | 8,914 | 38,576 | 31,698 |
| Losses (gains) on write-off/disposal of assets | 5,559 | (1,793) | (1,580) | 5,700 | 266 |
| Deferred taxes | (7,188) | 10,215 | (6,561) | (15,277) | 13,663 |
| Current taxes | 11,551 | 11,394 | - | 11,551 | 11,394 |
| Interest earnings from bank deposits | (3,111) | (11,004) | (2,446) | (16,756) | (38,633) |
| Other operating revenues / Earn-out | (7,632) | (21,210) | (743) | (10,640) | (39,383) |
| Provision for contingency | 5,688 | 516 | 3,040 | 9,341 | 2,852 |
| Effect of hyperinflation (IAS 29) | 1,594 | 765 | 588 | 4,136 | 639 |
| Increase (decrease) in assets | - | ||||
| Trade accounts receivable | (74,193) | (61,503) | (82,541) | (209,723) | (120,332) |
| Recoverable taxes | (343) | 926 | (3,488) | (10,757) | 6,280 |
| Accounts payable merchants | 170,182 | 78,196 | - | 170,182 | 78,196 |
| Other credits and judicial deposits | (12,887) | 2,029 | 4,961 | (16,278) | (9,824) |
| Increase (decrease) in liabilities | - | ||||
| Suppliers | 11,111 | 4,991 | 7,668 | 18,600 | 7,039 |
| Labor obligations | (29,213) | (11,576) | 13,749 | 11,795 | 6,030 |
| Taxes and contributions payable | (7,656) | (11,981) | (2,195) | (11,825) | 7,290 |
| Deferred income | (3,085) | (591) | (3,173) | (16,127) | (16,454) |
| Income and social contribution taxes paid | (1,454) | (3,997) | (367) | (4,130) | (7,427) |
| Other accounts payable | (96,744) | (23,643) | 91,731 | (3,678) | 4,275 |
| Net cash provided by operating activities | (46,819) | 30,685 | 70,899 | 51,389 | 132,191 |
| Cash flows from investing activities | |||||
| Acquisition of PP&E | (10,432) | (6,467) | (12,988) | (44,438) | (18,838) |
| Acquisition of intangible assets | (23,651) | (15,059) | (17,987) | (80,788) | (79,675) |
| Acquisition of subsidiaries, net of cash and cash equivalents acquired | (5,922) | (23,385) | (11,420) | (147,251) | (97,270) |
| Disposal of PP&E | (467) | (247) | 467 | - | - |
| Financial investments | (201,241) | (237,609) | (264,372) | (740,328) | (1,428,848) |
| Redemption of interest and financial investments | 328,753 | 390,136 | 141,404 | 1,071,018 | 976,584 |
| Net cash used in investing activities | 87,040 | 107,369 | (164,896) | 58,213 | (648,047) |
| Cash flows from financing activities | |||||
| Proceeds from loans and financing | - | (63) | 118,281 | 107,937 | - |
| Payments of loans and financing | (19,999) | (10,167) | (10,346) | (30,345) | (42,174) |
| Leasing payment | (8,559) | (7,432) | (13,315) | (57,251) | (18,845) |
| Pre-payments for right of use | - | 577 | - | - | (6,843) |
| Advance for future capital increase | - | - | (300) | - | - |
| Financial charges paid | (8,379) | (3,337) | - | (13,854) | (16,896) |
| Payments of acquisitions of subsidiaries | (1,265) | (18,208) | (4,203) | (41,109) | (48,093) |
| Dividends paid | - | - | (26) | (19,940) | (25,000) |
| Capital increase | - | - | - | - | 156,980 |
| Goodwill on subscription of shares | - | - | - | - | 682,454 |
| Treasury shares | - | (51,178) | 7,833 | (92,166) | (77,581) |
| Share issuance expense | - | 93 | - | - | (58,734) |
| Net cash used in financing activities | (38,202) | (89,715) | 97,924 | (146,728) | 545,268 |
| Exchange variation on cash and cash equivalents | (3,887) | (1,093) | 427 | 6,790 | (3,364) |
| Decrease in cash and cash equivalents | (1,868) | 47,246 | 4,354 | (30,336) | 26,048 |
| Statement of decrease in cash and cash equivalents | |||||
| At the beginning of the period | 47,430 | 28,652 | 43,076 | 75,898 | 49,850 |
| At the end of the period | 45,562 | 75,898 | 47,430 | 45,562 | 75,898 |
| Decrease in cash and cash equivalents | (1,868) | 47,246 | 4,354 | (30,336) | 26,048 |
| 13 |
| |
ATTACHMENT V – ACQUISITION AND FISCAL GOODWILL AMORTIZATION SCHEDULE
| Quarter | BRL | Quarter | BRL | |
| 1Q21 | (9,797,393) | 1Q21 | (14,658,021) | |
| 2Q21 | (9,767,062) | 2Q21 | (13,965,521) | |
| 3Q21 | (9,616,653) | 3Q21 | (13,619,271) | |
| 4Q21 | (9,222,283) | 4Q21 | (13,619,271) | |
| 1Q22 | (8,903,705) | 1Q22 | (13,619,271) | |
| 2Q22 | (8,874,973) | 2Q22 | (13,619,271) | |
| 3Q22 | (8,680,338) | 3Q22 | (12,477,478) | |
| 4Q22 | (7,951,699) | 4Q22 | (12,477,478) | |
| 1Q23 | (7,087,515) | 1Q23 | (10,973,158) | |
| 2Q23 | (6,697,020) | 2Q23 | (9,632,707) | |
| 3Q23 | (6,074,537) | 3Q23 | (8,420,132) | |
| 4Q23 | (5,913,771) | 4Q23 | (7,019,964) | |
| 1Q24 | (5,913,771) | 1Q24 | (6,724,841) | |
| 2Q24 | (5,461,991) | 2Q24 | (4,165,531) | |
| 3Q24 | (4,874,134) | 3Q24 | (4,165,531) | |
| 4Q24 | (4,354,148) | 4Q24 | (2,386,916) | |
| 1Q25 | (3,378,650) | 1Q25 | (1,959,099) | |
| 2Q25 | (2,885,417) | 2Q25 | (1,103,466) | |
| 3Q25 | (2,824,582) | 3Q25 | (1,103,466) | |
| 4Q25 | (2,608,862) | 4Q25 | (367,822) | |
| 1Q26 | (2,561,837) | 1Q26 | - | |
| 2Q26 | (2,561,837) | 2Q26 | - | |
| 3Q26 | (2,372,607) | 3Q26 | - | |
| 4Q26 | (2,331,673) | 4Q26 | - |
| 14 |
| |
GLOSSARY
Delivery app: Personalized delivery through the integration of the establishment's delivery application and its e-commerce platform, offering the consumer an omnichannel experience.
EBITDA: We calculate EBITDA as net income plus: (1) net financial revenue (expense); (2) income tax and social contribution and (3) depreciation and amortization. Therefore, EBITDA serves as an indicator of our overall financial performance, which is not affected by changes in interest rates, income or social contribution, tax rates or levels of depreciation and amortization. Consequently, we believe that EBITDA, when considered in conjunction with other available accounting and financial information, serves as a comparative tool to measure our operating performance, as well as to guide certain administrative decisions. We believe that EBITDA provides the reader with a better understanding not only of our financial performance, but also of our ability to pay interest and principal on our debt and incur additional debt to finance our investments and working capital. We calculate EBITDA and EBITDA margin in accordance with CVM rules. For the sake of comparability, in Adjusted EBITDA, we highlight EBITDA non-recurring expenses in the period.
Gateway: online gateway for payments in e-commerce.
Payment Link: Enables retailers to offer customers a secure link to pay for their purchases via messaging applications. The tool is fully integrated with the retailer's POS, eliminating the need for a website to make non-face-to-face sale.
Linx Digital or Digital: convergence of all channels used by the company with its customer, integrating the customer experience between online and offline world. In the case of Linx, it concentrates Linx Omni (OMS), Linx Commerce (the e-commerce platform) and Linx Impulse (search, recommendation, reengagement and retargeting tools).
Linx Pay Hub, Pay Hub or financial services: it involves initiatives such as TEF, Linx Pay (sub-acquiring), Linx Antecipa (anticipation and assignment of receivables), QR Linx, and new products aligned to the strategic positioning of Linx in this area.
EBITDA margin: we calculate the EBITDA margin by dividing EBITDA for the period by net operating revenue for the same period.
OMS: by using Linx Omni OMS technology, retailers can meet orders originating from any channel, regardless of where the product is located. Our OMS product offers multi-channel purchasing processes that integrate stores, franchises and distribution centers, thereby providing a single channel for our customers that decreases inventory shortage, generates more consumer traffic and increased sales. Our OMS product is divided into two modules:
• Omni OMS: A smart cloud-based suite of communication channels facilitates the interaction between business operations and applicable tax and accounting regulations. The Omni OMS module is responsible for integrating all systems associated with the OMS, such as the retailer's ERP, customer service, logistics, ecommerce platform and mobile solutions, among others.
• Omni in-store: This module is connected to a brick and mortar store's POS software, helping transform the store into a distribution center. The instore module allows the store operator to confirm that a customer has placed an order and monitor the necessary steps to ship or reserve the product, including choice of packaging, labeling, separation for pickup and interaction with the carrier for delivery, among others.
Through our OMS product, retailers can manage the following functionalities: ship from store, ship to home, ship to store, pick-up in store, click & collect, return in store, showrooming.
Consulting service revenue: revenue from implementation services of our solutions, including installation, customization, training and other services related to our products. These revenue components are characterized by their one-time or non-recurring nature. Consulting service revenue are recognized on our statement of income when delivered, in the case of installation, customization and training. If the amount billed exceeds the services performed for any given period, the difference is presented as deferred revenues on the statement of financial position.
Total recurring revenue: comprises revenue from monthly subscription fees that we charge our customers (1) for using our software; and (2) the fees we charge for ongoing technical support, helpdesk services, software hosting services, support teams and connectivity services. The fees in (1) and (2), above, are charged together in a single contract, with an average duration of twelve months, subject to automatic renewal, Subscription-related revenues are non-refundable and are paid monthly. Subscription revenues are reported as they are performed, beginning on the date the service is made available to customers and all other income recognition criteria have been identified. Subscription revenues for services made available to customers in 2017 and 2016 have been recognized since the beginning of the service. Since the adoption of IFRS 15, the fee is recognized over the average time the service is offered to the customer. Most of the revenue derives from customers' monthly use of services.
| 15 |
| |
SaaS (Software as a Service): cloud-based solutions that have a recurring subscription revenue model. Examples of SaaS solutions include ERP software in the cloud, Electronic Funds Transfer (TEF), Electronic Fiscal Receipt (NFC-e), OMS, advertising and re-engagement.
Customer retention rate: the rate at which billings from existing subscribed customers at the beginning of the period continue as billings during the end of such applicable period not adjusted for (x) any increases or decreases in billings for pricing changes or (y) additional products or services provided to these existing subscribed customers.
TEF: electronic funds transfer is a middleware between POS (point of sale) software and the retail acquirer that allows our customers to direct credit and debit card transactions to their merchant acquirer of choice (credit and debit card processor), among other functionalities. This electronic payment solution is also fully integrated with our ERP (Enterprise resource planning) software. Through TEF, we have a unique opportunity to capture a significant volume of debit and credit card transactions pass through the cloud gateways managed by Linx. We actively seek to expand our electronic payment mechanisms. With the increase in debit and credit card transactions, as well as the adoption of cloud-based software, the importance of and demand for these solutions has increased. We offer TEF services as a complementary solution to our software solutions and our primary strategy is on cross-selling to our existing customer base. Customers using our TEF solutions may experience improved performance, stability and availability of our other software solutions.
Forward-looking statements
This earnings release contains forward-looking statements within the meaning of Section 27A of the Securities Act of 1933, as amended, and Section 21E of the Securities Exchange Act of 1934, as amended. Forward-looking statements generally relate to future events or our future financial or operating performance. In some cases, you can identify forward looking statements because they contain words such as “may,” “will,” “should,” “expects,” “plans,” “anticipates,” “going to,” “could,” “intends,” “target,” “projects,” “contemplates,” “believes,” “estimates,” “predicts,” “potential” or “continue” or the negative of these words or other similar terms or expressions that concern our expectations, strategy, priorities, plans or intentions. Forward-looking statements in this release include, but are not limited to, statements regarding our future profitability and timing for profitability, our future financial and operating performance, including our outlook for the full year of 2020, demand for our products and services and the markets in which we operate and the future of our industry. Our expectations and beliefs regarding these matters may not materialize, and actual results in future periods are subject to risks and uncertainties that could cause actual results to differ materially from those projected, including risks regarding our ability to forecast our business, our competition, fluctuations in the markets in which we operate, our ability to attract and retain customers and our partner relationships. The forward-looking statements contained in this release are also subject to other risks and uncertainties, including those more fully described in our filings with the Securities and Exchange Commission (“SEC”). The forward-looking statements in this release are based on information available to us as of the date hereof, and we disclaim any obligation to update any forward-looking statements, except as required by law.
| 16 |
SIGNATURES
Pursuant to the requirements of the Securities Exchange Act of 1934, the registrant has duly caused this report to be signed on its behalf by the undersigned, thereunto duly authorized.
Date: April 20, 2021
Linx S.A.
By: /s/ Ramatis Rodrigues
Name: Ramatis Rodrigues
Title: Investor Relations Officer