UNITED STATES
SECURITIES AND EXCHANGE COMMISSION
WASHINGTON, D.C. 20549
FORM N-CSR
CERTIFIED SHAREHOLDER REPORT OF REGISTERED
MANAGEMENT INVESTMENT COMPANIES
| Investment Company Act file number: | 811-23439 |
| Exact name of registrant as specified in charter: | ETF Opportunities Trust |
| Address of principal executive offices: | 8730 Stony Point Parkway,
Suite 205
Richmond, VA 23235
|
| Name and address of agent for service | The Corporation Trust Co.,
Corporation Trust Center,
1209 Orange St.,
Wilmington, DE 19801 With Copy to: Practus, LLP
11300 Tomahawk Creek Parkway,
Suite 310
Leawood, KS 66211
|
| Registrant’s telephone number, including area code: | (804) 267-7400 |
| Date of fiscal year end: | July 31 |
| Date of reporting period: | July 31, 2024 |
| | |
| | |
| | American Conservative Values ETF |
| | |
ITEM 1.(a). Reports to Stockholders.
American Conservative Values ETF Tailored Shareholder Report
American Conservative Values ETF Tailored Shareholder Report
annual Shareholder Report July 31, 2024 American Conservative Values ETF Ticker: ACVF (Listed on NYSE Arca, Inc.) |
This annual shareholder report contains important information about the American Conservative Values ETF for the period of August 1, 2023 to July 31, 2024. You can find additional information about the Fund at acvetfs.com/acvf-fund-material/. You can also request this information by contacting us at (888) 909-6030. Distributed by Foreside Fund Services, LLC.
What were the Fund costs for the past year?
(based on a hypothetical $10,000 investment)
| Costs of a $10,000 investment | Costs paid as a percentage of a $10,000 investment |
|---|
American Conservative Values ETF | $83 | 0.75% |
How did the Fund perform last year?
The Fund returned 20.93% (NAV) for the year ended July 31, 2024 vs 22.15% for the S&P 500® Index and 21.50% for the Russell 1000 Total Return Index. The Fund invests substantially all of its assets in a portfolio of Large-Cap US equities and performance was affected by the boycotting of securities with a high active share (28%) of the S&P 500® benchmark. During the reporting period equity markets were significantly influenced by shifting expectations around inflation and interest rates, with stocks rallying particularly (the Magnificent Seven) on growing confidence that slowing inflation will allow for rate cuts towards the end of 2024.
What key factors affected the Fund's performance?
The performance of our boycotts compared to what companies we overweight or replaced them with in the portfolio will always be the most significant driver of our relative returns to benchmarks. To minimize the resulting active risk, we remain broadly diversified and attempt to control multiply risk factors such as size, sector and style. In aggregate, the Fund's 37 Boycotts, which represented approximately 28% of the S&P 500® detracted -6.35% from performance while what we did own contributed +6.05% to the one-year return.
Cumulative Performance
(based on a hypothetical $10,000 investment)
| American Conservative Values ETF - $17,825 | S&P 500® Index - $17,893 |
10/28/20 | 10000 | 10000 |
07/31/21 | 13560 | 13590 |
07/31/22 | 12990 | 12960 |
07/31/23 | 14740 | 14650 |
07/31/24 | 17830 | 17890 |
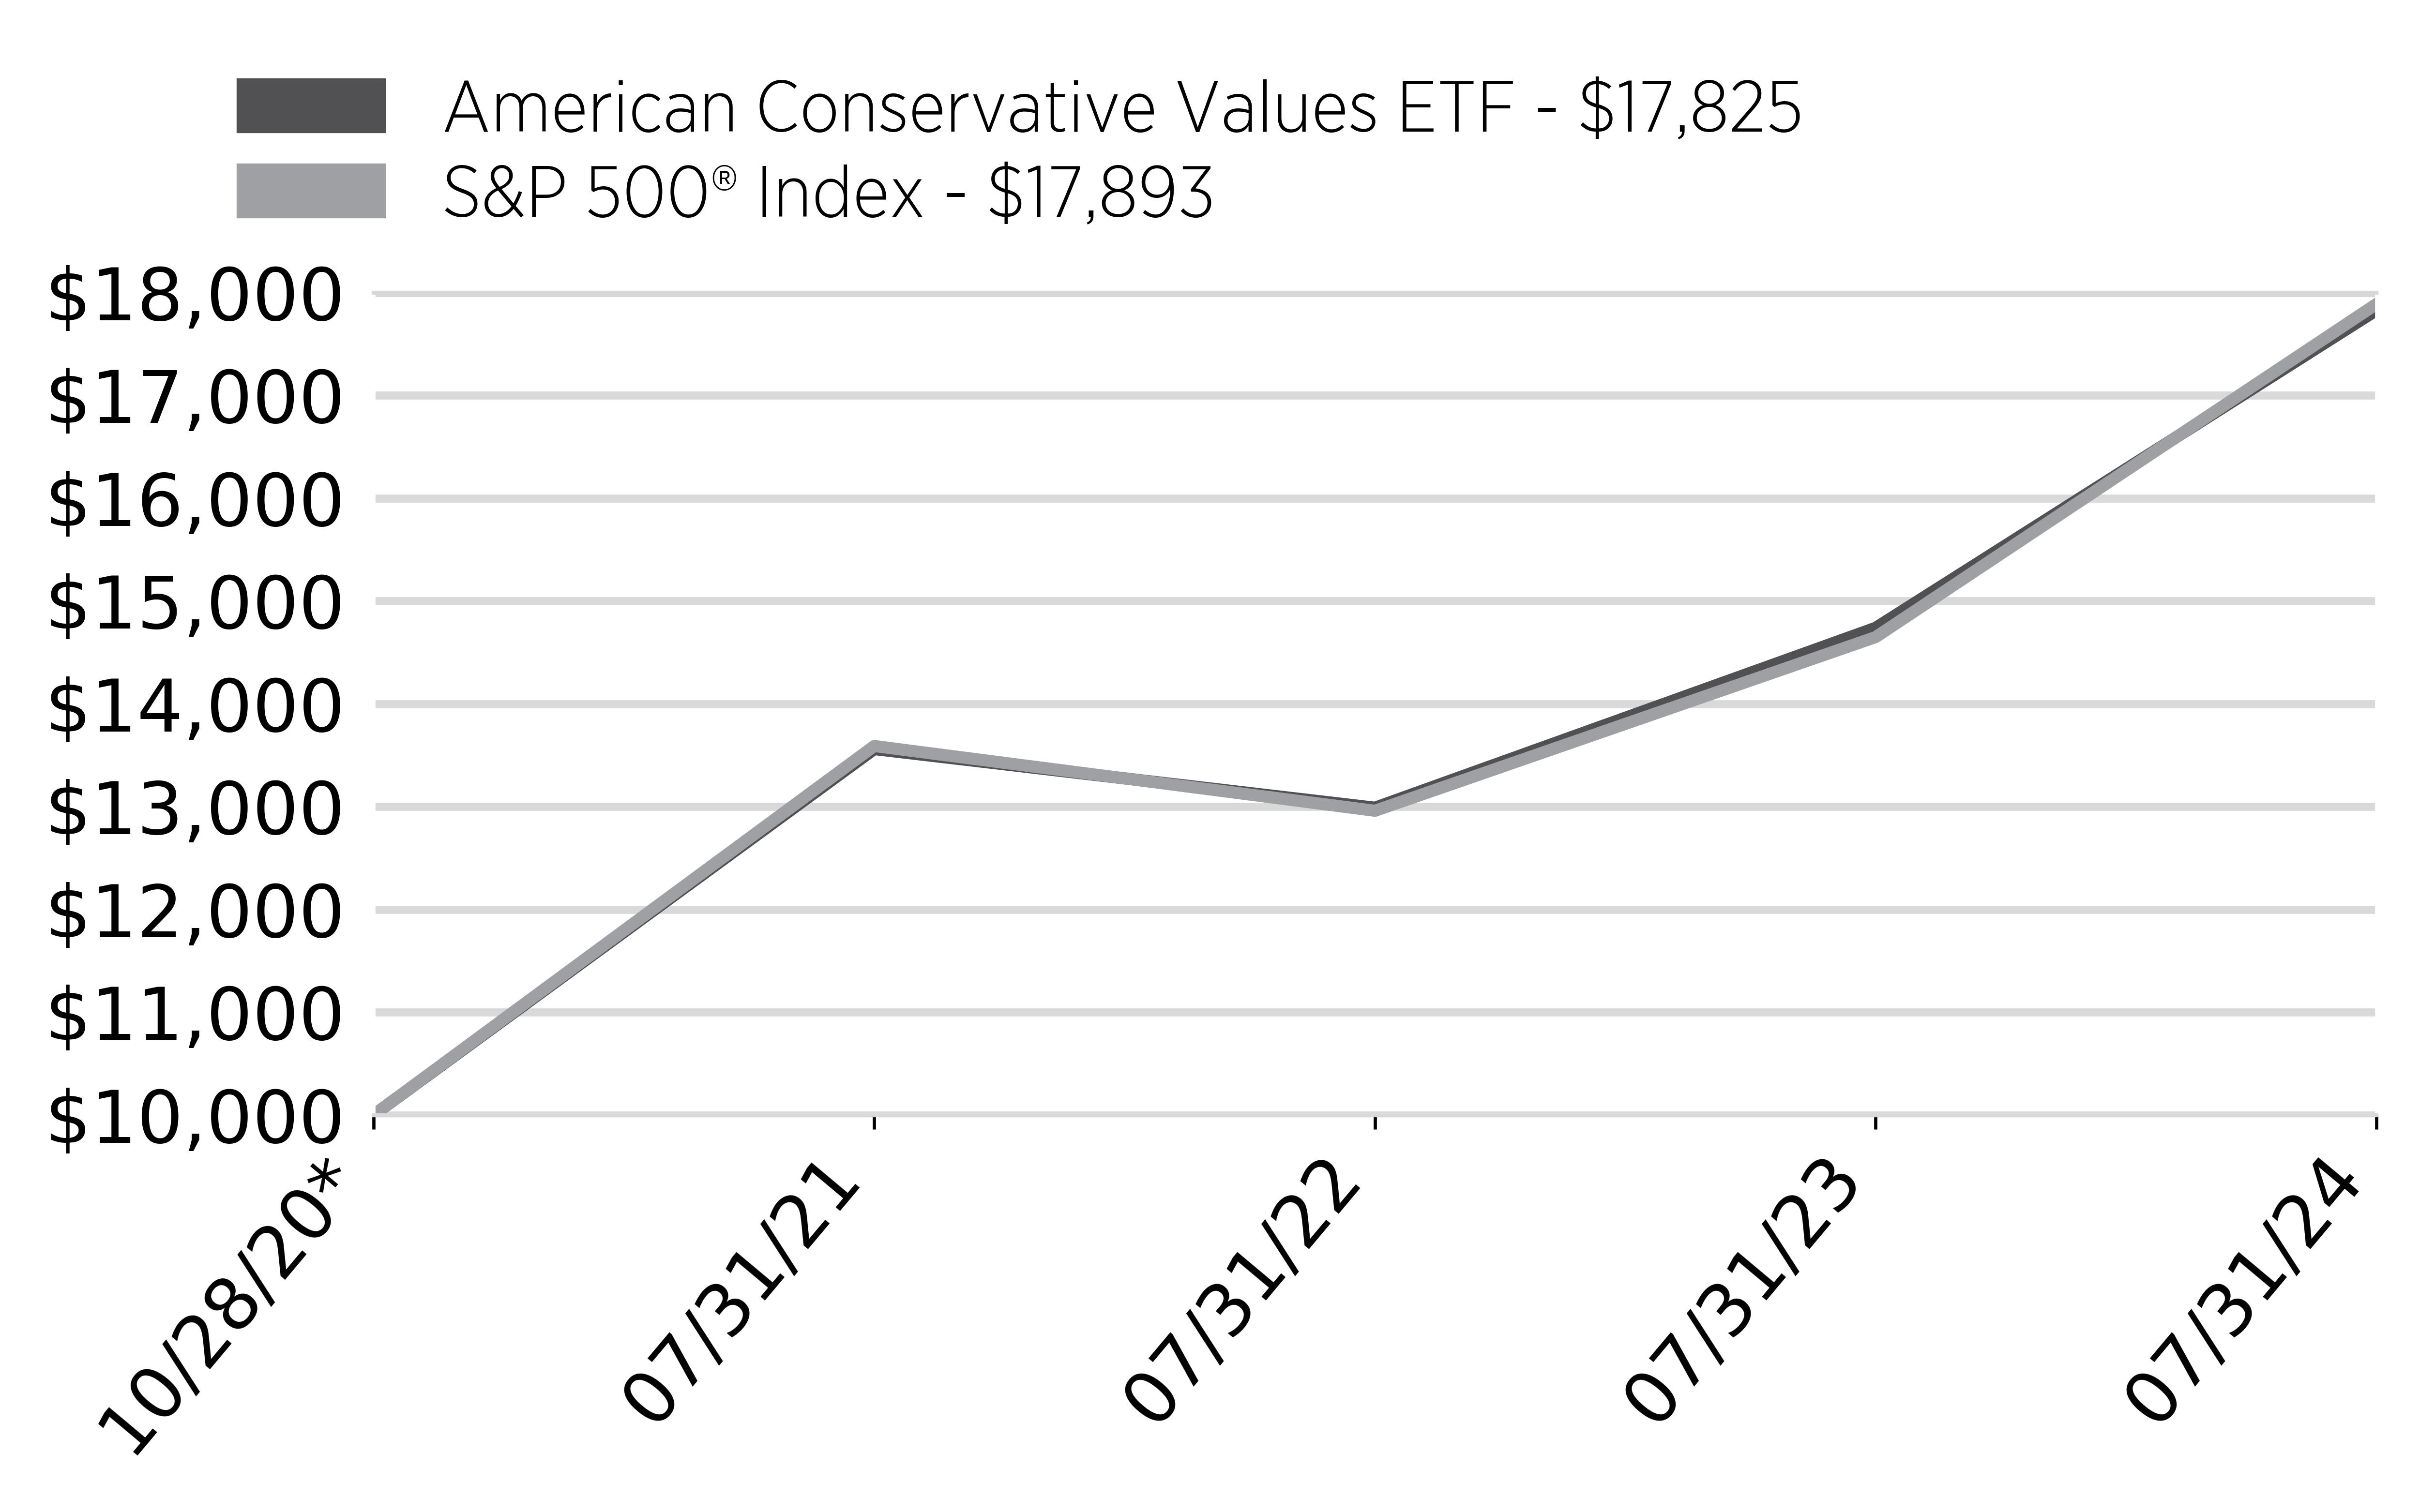
* Inception
Annual Performance
| 1 Year | Average Annual Total Returns Since Inception (10/28/20) |
|---|
American Conservative Values ETF - NAV | 20.93% | 16.65% |
American Conservative Values ETF - Market | 21.07% | 16.66% |
S&P 500® Index | 22.15% | 16.75% |
The market price used to calculate the market return is determined by using the midpoint between the bid/ask spread on the exchange on which the shares of a Fund are listed for trading, as of the time that a Fund's NAV is calculated. Market returns do not include brokerage commissions. If brokerage commissions were included market returns would be lower.The S&P 500® Index is a broad-based unmanaged index of 500 stocks, which is widely recognized as representative of the equity market in general.
The fund's past performance is not a good predictor of how the fund will perform in the future. The graph and table do not reflect the deduction of taxes that a shareholder would pay on fund distributions or redemption of fund shares.
American Conservative Values ETF Tailored Shareholder Report
American Conservative Values ETF Tailored Shareholder Report
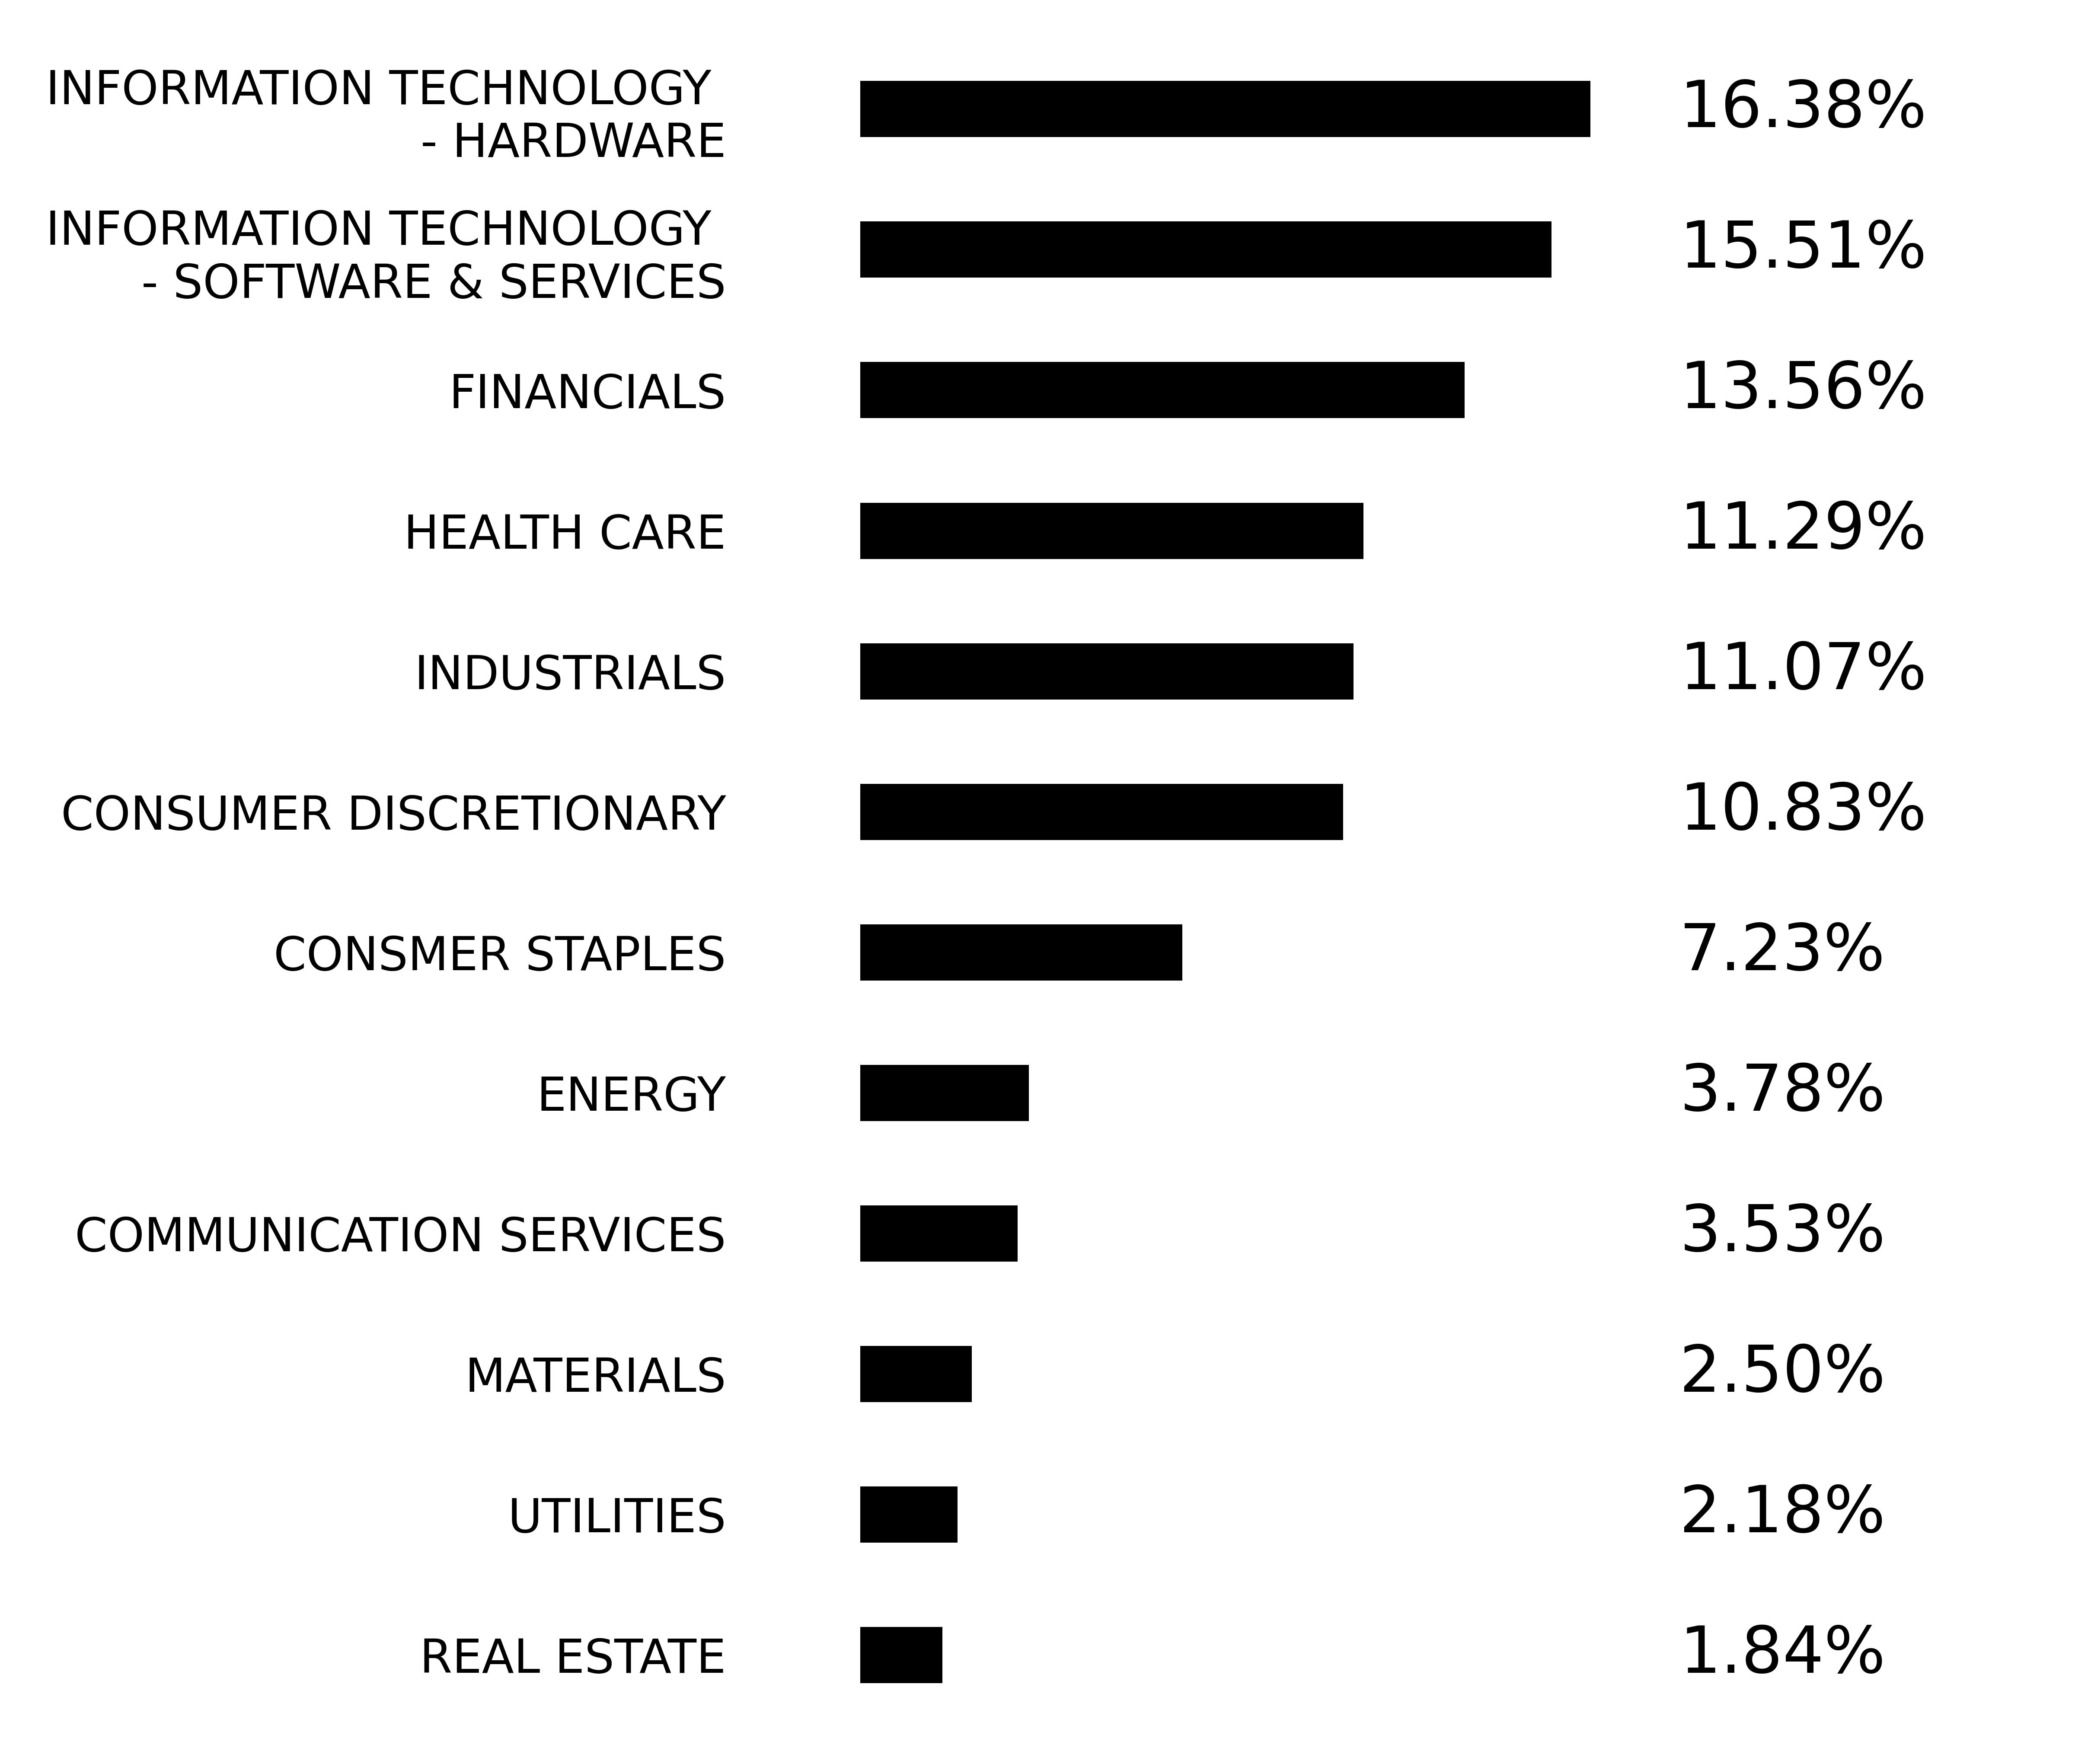
Sector Breakdown
Sector | % |
COMMUNICATION SERVICES | 3.53% |
CONSUMER DISCRETIONARY | 10.83% |
CONSMER STAPLES | 7.23% |
ENERGY | 3.78% |
FINANCIALS | 13.56% |
HEALTH CARE | 11.29% |
INDUSTRIALS | 11.07% |
INFORMATION TECHNOLOGY - HARDWARE | 16.38% |
INFORMATION TECHNOLOGY - SOFTWARE & SERVICES | 15.51% |
MATERIALS | 2.50% |
REAL ESTATE | 1.84% |
UTILITIES | 2.18% |
Top Ten Holdings | |
|---|
Nvidia Corp. | 6.94% |
Microsoft Corp. | 4.87% |
Berkshire Hathaway Class B | 2.81% |
Broadcom, Inc. | 2.02% |
Home Depot, Inc. | 1.73% |
Costco Wholesale Corp. | 1.65% |
Mastercard, Inc. Class A | 1.64% |
The Procter & Gamble Co. | 1.60% |
Eli Lilly & Co. | 1.60% |
Exxon Mobil Corp. | 1.55% |
Key Fund Statistics
(as of July 31, 2024)
| |
|---|
Fund Size (Thousands) | $99,293 |
Number of Holdings | 368 |
Total Advisory Fee Paid | $565,214 |
Portfolio Turnover Rate | 12.98% |
For additional information about the Fund; including its prospectus, financial information, holdings and proxy information, visit acvetfs.com/acvf-fund-material/.
What did the Fund invest in?
(% of Net Assets as of July 31, 2024)
ITEM 1.(b). No notice transmitted to stockholders in reliance on Rule 30e-3 under the Investment Company Act of 1940 contained disclosures specified by paragraph (c)(3) of that rule.
(a) The registrant, as of the end of the period covered by this report, has adopted a code of ethics that applies to the registrant’s principal executive officer, principal financial officer, principal accounting officer or controller, or persons performing similar functions, regardless of whether these individuals are employed by the registrant or a third party.
(c) There have been no amendments, during the period covered by this report, to a provision of the code of ethics that applies to the registrant’s principal executive officer, principal financial officer, principal accounting officer or controller, or persons performing similar functions, regardless of whether these individuals are employed by the registrant or a third party, and that relates to any element of the code of ethics description.
(d) The registrant has not granted any waivers, including an implicit waiver, from a provision of the code of ethics that applies to the registrant’s principal executive officer, principal financial officer, principal accounting officer or controller, or persons performing similar functions, regardless of whether these individuals are employed by the registrant or a third party, that relates to one or more of the items set forth in paragraph (b) of this item’s instructions.
(e) Not applicable.
(f) The code of ethics is attached hereto as exhibit 19(a)(1).
| ITEM 3. | AUDIT COMMITTEE FINANCIAL EXPERT. |
(a)(1) The registrant does not have an audit committee financial expert serving on its audit committee.
(a)(2) Not applicable.
(a)(3) At this time, the registrant believes that the collective experience provided by the members of the audit committee together offer the registrant adequate oversight for the registrant’s level of financial complexity.
| ITEM 4. | PRINCIPAL ACCOUNTANT FEES AND SERVICES. |
(a) Audit Fees. The aggregate fees billed for each of the last two fiscal years for professional services rendered by the principal accountant for the audit of the registrant’s annual financial statements or services that are normally provided by the accountant in connection with statutory and regulatory filings or engagements for those fiscal years are $15,400 for 2024 and $15,400 for 2023.
(b) Audit-Related Fees. The aggregate fees billed in each of the last two fiscal years for assurance and related services by the principal accountant that are reasonably related to the performance of the audit of the registrant’s financial statements and are not reported under paragraph (a) of this Item are $0 for 2024 and $0 for 2023.
(c) Tax Fees. The aggregate fees billed in each of the last two fiscal years for professional services rendered by the principal accountant for tax compliance, tax advice, and tax planning are $3,300 for 2024 and $3,300 for 2023. The nature of the services comprising these fees include preparation of excise filings and income tax returns and assistance with calculation of required income, capital gain and excise distributions.
(d) All Other Fees. The aggregate fees billed in each of the last two fiscal years for products and services provided by the principal accountant, other than the services reported in paragraphs (a) through (c) of this Item are and $0 for 2024 and $0 for 2023.
(e)(1) Disclose the audit committee’s pre-approval policies and procedures described in paragraph (c)(7) of Rule 2-01 of Regulation S-X.
Pursuant to its charter, the registrant’s Audit Committee must pre-approve all audit and non-audit services to be provided to the registrant. The Audit Committee also pre-approves any non-audit services provided by the registrant’s principal accountant to the adviser or any entity controlling, controlled by, or under common control with the investment adviser that provides ongoing services to the registrant, if the engagement relates directly to the operations and financial reporting of the registrant.
(e)(2) The percentage of services described in each of paragraphs (b) through (d) of this Item that were approved by the audit committee pursuant to paragraph (c)(7)(i)(C) of Rule 2-01 of Regulation S-X are as follows:
(b) NA
(c) 0%
(d) NA
(f) The percentage of hours expended on the principal accountant’s engagement to audit the registrant’s financial statements for the most recent fiscal year that were attributed to work performed by persons other than the principal accountant’s full-time, permanent employees was zero percent (0%).
(g) The aggregate non-audit fees billed by the registrant’s accountant for services rendered to the registrant, and rendered to the registrant’s investment adviser (not including any sub-adviser whose role is primarily portfolio management and is subcontracted with or overseen by another investment adviser), and any entity controlling, controlled by, or under common control with the adviser that provides ongoing services to the registrant for each of the last two fiscal years of the registrant was $0 for 2024 and $0 for 2023.
(h) Not applicable.
(i) Not applicable.
(j) Not applicable.
| ITEM 5. | AUDIT COMMITTEE OF LISTED REGISTRANTS. |
| (a) | The registrant has an audit committee which was established by the Board of Trustees of the registrant in accordance with Section 3(a)(58)(A) of the Securities Exchange Act of 1934, as amended. Each of the registrant’s Trustees serves as a member of its Audit Committee. |
| (a) | The Registrant’s Schedule of Investments is included as part of the Financial Statements and Financial Highlights filed under Item 7 of this Form. |
| ITEM 7. | FINANCIAL STATEMENTS AND FINANCIAL HIGHLIGHTS FOR OPEN-END MANAGEMENT INVESTMENT COMPANIES. |
FINANCIAL STATEMENTS
For the Year Ended July 31, 2024
American Conservative Values ETF
1
FINANCIAL STATEMENTS | JULY 31, 2024
American Conservative Values ETF
Schedule of InvestmentsJuly 31, 2024
See Notes to Financial Statements
| | | | | | |
| | | Shares | | Value | |
99.70% | COMMON STOCKS | | | | | |
| | | | | | |
3.53% | COMMUNICATION SERVICES | | | | | |
| Charter Communications, Inc.(A) | | 1,151 | | $437,058
| |
| Electronic Arts, Inc. | | 1,840 | | 277,730 | |
| Fox Corp. Class A | | 3,235 | | 123,059 | |
| Fox Corp. Class B | | 3,053 | | 108,168 | |
| Live Nation Entertainment(A) | | 858 | | 82,531 | |
| News Corp. Class A | | 4,665 | | 128,661 | |
| News Corp. Class B | | 4,262 | | 121,424 | |
| Omnicom Group, Inc. | | 3,122 | | 306,081 | |
| Paramount Global Class B | | 13,698 | | 156,431 | |
| Pinterest, Inc.(A) | | 3,501 | | 111,857 | |
| Spotify Technology SA ADR(A) | | 1,114 | | 383,149 | |
| Take-Two Interactive(A) | | 1,270 | | 191,173 | |
| The Interpublic Group | | 6,835 | | 219,882 | |
| T-Mobile US, Inc. | | 4,683 | | 853,617 | |
| | | | | 3,500,821 | |
| | | | | | |
10.83% | CONSUMER DISCRETIONARY | | | | | |
| Advance Auto Parts | | 192 | | 12,159 | |
| Airbnb, Inc.(A) | | 3,031 | | 423,006 | |
| Aptiv plc ADR(A) | | 763 | | 52,945 | |
| Autozone, Inc.(A) | | 95 | | 297,701 | |
| Bath & Body Works, Inc. | | 842 | | 30,944 | |
| Best Buy Co., Inc. | | 668 | | 57,795 | |
| Booking Holdings, Inc. | | 204 | | 757,862 | |
| Borg-Warner, Inc. | | 854 | | 30,155 | |
| DR Horton, Inc. | | 764 | | 137,467 | |
| Darden Restaurants, Inc. | | 385 | | 56,322 | |
| Domino’s Pizza, Inc. | | 96 | | 41,155 | |
| DoorDash, Inc.(A) | | 1,957 | | 216,679 | |
| eBay, Inc. | | 1,601 | | 89,032 | |
| Etsy, Inc.(A) | | 1,147 | | 74,716 | |
| Expedia Group, Inc.(A) | | 1,985 | | 253,425 | |
| Ford Motor Co. | | 11,866 | | 128,390 | |
| Garmin Ltd. ADR | | 2,346 | | 401,753 | |
| Genuine Parts Co. | | 480 | | 70,613 | |
| Hasbro, Inc. | | 194 | | 12,505 | |
| Hilton Worldwide Holdings, Inc. | | 763 | | 163,793 | |
| Home Depot, Inc. | | 4,656 | | 1,714,153 | |
| Kohl’s Corp. | | 3,540 | | 76,676 | |
2
FINANCIAL STATEMENTS | JULY 31, 2024
American Conservative Values ETF
Schedule of Investments - continuedJuly 31, 2024
See Notes to Financial Statements
| | | | | | |
| | | Shares | | Value | |
| Las Vegas Sands Corp. | | 1,145 | | $45,422
| |
| Lennar Corp. | | 570 | | 100,850 | |
| Lithia Motors, Inc. | | 395 | | 109,150 | |
| LKQ Corp. | | 570 | | 23,655 | |
| Marriott International Class A | | 1,815 | | 412,550 | |
| McDonald’s Corp. | | 3,646 | | 967,648 | |
| MGM Resorts International(A) | | 2,385 | | 102,483 | |
| O’Reilly Automotive, Inc.(A) | | 416 | | 468,557 | |
| Phinia, Inc. | | 177 | | 7,912 | |
| Polo Ralph Lauren Corp. | | 95 | | 16,681 | |
| Pool Corp. | | 96 | | 35,908 | |
| Pulte Group, Inc. | | 289 | | 38,148 | |
| PVH Corp. | | 191 | | 19,480 | |
| Ross Stores, Inc. | | 2,342 | | 335,445 | |
| Royal Caribbean Cruises ADR | | 478 | | 74,912 | |
| Skechers U.S.A., Inc.(A) | | 2,076 | | 135,210 | |
| Tapestry, Inc. | | 574 | | 23,012 | |
| Tesla, Inc.(A) | | 6,264 | | 1,453,686 | |
| TJX Companies, Inc. | | 7,824 | | 884,268 | |
| Tractor Supply Co. | | 744 | | 195,910 | |
| Ulta Beauty, Inc.(A) | | 96 | | 35,029 | |
| Under Armour, Inc. Class C(A) | | 7,792 | | 52,908 | |
| Under Armour, Inc. Class A(A) | | 6,857 | | 47,793 | |
| Wynn Resorts Ltd. | | 284 | | 23,521 | |
| Yum! Brands, Inc. | | 297 | | 39,451 | |
| | | | | 10,748,835 | |
| | | | | | |
7.23% | CONSUMER STAPLES | | | | | |
| Altria Group, Inc. | | 4,477 | | 219,418 | |
| Archer-Daniels-Midland Co. | | 1,487 | | 92,209 | |
| Brown-Forman Corp. Class B | | 581 | | 26,238 | |
| Church & Dwight Co. | | 478 | | 46,849 | |
| The Clorox Co. | | 89 | | 11,742 | |
| Colgate-Palmolive Co. | | 2,487 | | 246,686 | |
| Constellation Brands, Inc. | | 759 | | 186,076 | |
| Costco Wholesale Corp. | | 1,992 | | 1,637,424 | |
| Dollar General Corp. | | 873 | | 105,100 | |
| Dollar Tree, Inc.(A) | | 473 | | 49,353 | |
| Estee Lauder Cos. Class A | | 478 | | 47,614 | |
| General Mills, Inc. | | 1,146 | | 76,942 | |
| Kimberly-Clark Corp. | | 667 | | 90,078 | |
| The Kraft Heinz Co. | | 1,812 | | 63,801 | |
3
FINANCIAL STATEMENTS | JULY 31, 2024
American Conservative Values ETF
Schedule of Investments - continuedJuly 31, 2024
See Notes to Financial Statements
| | | | | | |
| | | Shares | | Value | |
| Kroger Co. | | 667 | | $36,352
| |
| McCormick & Co., Inc.(B) | | 382 | | 29,418 | |
| Mondelez International Inc. Class A | | 10,615 | | 725,535 | |
| Monster Beverage Corp.(A) | | 3,618 | | 186,146 | |
| PepsiCo, Inc. | | 5,886 | | 1,016,336 | |
| Philip Morris International, Inc. | | 5,007 | | 576,606 | |
| The Procter & Gamble Co. | | 9,880 | | 1,588,309 | |
| Sysco Corp. | | 456 | | 34,952 | |
| The Hershey Company | | 289 | | 57,072 | |
| Walgreens Boots Alliance, Inc. | | 2,478 | | 29,414 | |
| | | | | 7,179,670 | |
| | | | | | |
3.78% | ENERGY | | | | | |
| Baker Hughes Co. | | 1,998 | | 77,363 | |
| Chevron Corp. | | 4,949 | | 794,166 | |
| ConocoPhillips | | 2,098 | | 233,298 | |
| EOG Resources, Inc. | | 1,048 | | 132,886 | |
| Exxon Mobil Corp. | | 12,982 | | 1,539,535 | |
| Halliburton Co. | | 1,901 | | 65,927 | |
| Hess Corp. | | 286 | | 43,878 | |
| Kinder Morgan, Inc. | | 4,380 | | 92,549 | |
| Marathon Petroleum Corp. | | 1,908 | | 337,754 | |
| Occidental Petroleum Corp. | | 1,909 | | 116,105 | |
| Oneok, Inc. | | 854 | | 71,164 | |
| Schlumberger Ltd. ADR | | 3,615 | | 174,568 | |
| Williams Cos., Inc. | | 1,807 | | 77,593 | |
| | | | | 3,756,786 | |
| | | | | | |
13.56% | FINANCIALS | | | | | |
| Aflac, Inc. | | 572 | | 54,557 | |
| Allstate Corp. | | 267 | | 45,689 | |
| American International Group | | 672 | | 53,243 | |
| Ameriprise Financial, Inc. | | 386 | | 166,007 | |
| Aon plc ADR | | 478 | | 157,028 | |
| Arthur J Gallagher & Co. | | 193 | | 54,714 | |
| Bank Of New York Mellon | | 928 | | 60,385 | |
| Berkshire Hathaway Class B(A) | | 6,366 | | 2,791,491 | |
| Blackstone, Inc. | | 2,478 | | 352,248 | |
| Capital One Financial | | 958 | | 145,041 | |
| CBOE Global Markets, Inc. | | 1,011 | | 185,529 | |
| Chubb Ltd. ADR | | 1,428 | | 393,642 | |
| Cincinnati Financial Corp. | | 385 | | 50,289 | |
4
FINANCIAL STATEMENTS | JULY 31, 2024
American Conservative Values ETF
Schedule of Investments - continuedJuly 31, 2024
See Notes to Financial Statements
| | | | | | |
| | | Shares | | Value | |
| Citigroup, Inc. | | 7,027 | | $455,912
| |
| Citizens Financial Group | | 1,617 | | 68,997 | |
| CME Group, Inc. | | 2,116 | | 409,890 | |
| Discover Financial Services | | 2,110 | | 303,819 | |
| Fidelity National Information
Services, Inc. | | 1,616 | | 124,157 | |
| Fifth Third Bancorp | | 2,667 | | 112,921 | |
| Fiserv, Inc.(A) | | 4,007 | | 655,425 | |
| Franklin Resources, Inc. | | 568 | | 12,990 | |
| Global Payments, Inc. | | 1,703 | | 173,093 | |
| Hartford Financial Services Group, Inc. | | 669 | | 74,205 | |
| Huntington Bancshares | | 2,954 | | 44,162 | |
| Intercontinental Exchange | | 2,647 | | 401,179 | |
| Invesco Ltd. ADR | | 291 | | 5,023 | |
| Keycorp | | 2,001 | | 32,276 | |
| KKR & Co., Inc. | | 1,587 | | 195,915 | |
| Loews Corp. | | 468 | | 37,417 | |
| MarketAxess Holdings, Inc. | | 96 | | 21,459 | |
| Marsh & McLennan Cos, Inc. | | 1,236 | | 275,097 | |
| Mastercard, Inc. Class A | | 3,516 | | 1,630,404 | |
| MetLife, Inc. | | 3,331 | | 255,987 | |
| Moody’s Corporation | | 947 | | 432,287 | |
| Morgan Stanley | | 2,662 | | 274,745 | |
| MSCI, Inc. | | 98 | | 52,994 | |
| Northern Trust Corp. | | 761 | | 67,463 | |
| The PNC Financial Services Group, Inc. | | 1,723 | | 312,035 | |
| Principal Financial Group, Inc. | | 383 | | 31,218 | |
| Prudential Financial, Inc. | | 386 | | 48,374 | |
| Raymond James Financial | | 573 | | 66,468 | |
| Regions Financial Corp. | | 3,426 | | 76,640 | |
| Rocket Cos, Inc.(A) | | 7,025 | | 113,735 | |
| S&P 500 Global, Inc. | | 1,316 | | 637,905 | |
| State Street Corp. | | 1,143 | | 97,121 | |
| Synchrony Financial | | 193 | | 9,802 | |
| T Rowe Price Group, Inc. | | 669 | | 76,406 | |
| The Charles Schwab Corp. | | 2,596 | | 169,233 | |
| The Travelers Companies, Inc. | | 199 | | 43,072 | |
| Truist Financial Corp. | | 4,568 | | 204,144 | |
| US Bancorp | | 5,498 | | 246,750 | |
| Wells Fargo & Co. | | 10,439 | | 619,450 | |
| Willis Towers Watson plc ADR | | 289 | | 81,579 | |
| | | | | 13,461,612 | |
5
FINANCIAL STATEMENTS | JULY 31, 2024
American Conservative Values ETF
Schedule of Investments - continuedJuly 31, 2024
See Notes to Financial Statements
| | | | | | |
| | | Shares | | Value | |
11.29% | HEALTH CARE | | | | | |
| Abbott Laboratories | | 4,741 | | $502,262
| |
| Abbvie, Inc. | | 4,858 | | 900,285 | |
| Agilent Technologies, Inc. | | 478 | | 67,589 | |
| Amgen, Inc. | | 1,332 | | 442,850 | |
| Becton Dickinson & Co. | | 669 | | 161,269 | |
| Biogen, Inc.(A) | | 116 | | 24,731 | |
| Boston Scientific Corp.(A) | | 3,521 | | 260,131 | |
| Bristol-Myers Squibb Co. | | 6,471 | | 307,761 | |
| Cardinal Health, Inc. | | 567 | | 57,171 | |
| Cencora, Inc. | | 573 | | 136,305 | |
| Centene Corp.(A) | | 1,045 | | 80,381 | |
| The Cigna Group | | 1,883 | | 656,546 | |
| The Cooper Companies, Inc.(A) | | 384 | | 35,839 | |
| CVS Health Corp. | | 3,336 | | 201,261 | |
| Danaher Corp. | | 2,182 | | 604,589 | |
| Dexcom, Inc.(A) | | 768 | | 52,086 | |
| Edwards Lifescience Corp.(A) | | 1,337 | | 84,298 | |
| Elevance Health, Inc. | | 891 | | 474,039 | |
| Eli Lilly & Co. | | 1,971 | | 1,585,216 | |
| Embecta Corp. | | 112 | | 1,755 | |
| Fortrea Holdings, Inc.(A) | | 192 | | 5,297 | |
| GE Healthcare Technologies | | 871 | | 73,713 | |
| Gilead Sciences, Inc. | | 1,059 | | 80,548 | |
| Grail, Inc.(A) | | 64 | | 984 | |
| HCA Healthcare, Inc. | | 283 | | 102,743 | |
| Hologic, Inc.(A) | | 286 | | 23,340 | |
| Humana, Inc. | | 664 | | 240,109 | |
| Idexx Laboratories, Inc.(A) | | 98 | | 46,660 | |
| Illumina, Inc.(A) | | 382 | | 46,833 | |
| Incyte Corp.(A) | | 291 | | 18,935 | |
| Intuitive Surgical, Inc.(A) | | 1,254 | | 557,541 | |
| Iqvia Holdings, Inc.(A) | | 381 | | 93,814 | |
| Labcorp Holdings, Inc. | | 192 | | 41,364 | |
| McKesson Corp. | | 478 | | 294,936 | |
| Medtronic plc ADR | | 3,501 | | 281,200 | |
| Merck & Company, Inc. | | 7,138 | | 807,522 | |
| Mettler-Toledo International, Inc.(A) | | 1 | | 1,521 | |
| Regeneron Pharmaceuticals, Inc.(A) | | 291 | | 314,044 | |
| ResMed, Inc. | | 193 | | 41,157 | |
| Solventum Corp.(A) | | 187 | | 11,011 | |
| Stryker Corp. | | 857 | | 280,625 | |
6
FINANCIAL STATEMENTS | JULY 31, 2024
American Conservative Values ETF
Schedule of Investments - continuedJuly 31, 2024
See Notes to Financial Statements
| | | | | | |
| | | Shares | | Value | |
| Thermo Fisher Scientific, Inc. | | 1,040 | | $637,874
| |
| Veeva Systems, Inc. Class A(A) | | 184 | | 35,315 | |
| Vertex Pharmaceuticals(A) | | 674 | | 334,115 | |
| Zimmer Biomet Holdings | | 296 | | 32,960 | |
| Zoetis, Inc. | | 945 | | 170,138 | |
| | | | | 11,210,663 | |
| | | | | | |
11.07% | INDUSTRIALS | | | | | |
| 3M Co. | | 751 | | 95,790 | |
| American Airlines Group(A) | | 4,950 | | 52,668 | |
| Ametek, Inc. | | 379 | | 65,749 | |
| Automatic Data Processing, Inc. | | 1,336 | | 350,860 | |
| The Boeing Co.(A) | | 1,316 | | 250,830 | |
| Broadridge Financial
Solutions, Inc. | | 288 | | 61,632 | |
| Builders FirstSource, Inc.(A) | | 869 | | 145,445 | |
| Canadian Pacific Kansas City
Southern ADR | | 1,914 | | 160,431 | |
| Carrier Global Corp. | | 1,048 | | 71,379 | |
| Caterpillar, Inc. | | 1,427 | | 494,027 | |
| CH Robinson Worldwide, Inc. | | 291 | | 25,914 | |
| Cintas Corp. | | 477 | | 364,399 | |
| Copart, Inc.(A) | | 10,080 | | 527,486 | |
| CSX Corp. | | 5,708 | | 200,351 | |
| Cummins, Inc. | | 478 | | 139,480 | |
| Deere & Co. | | 1,085 | | 403,598 | |
| Eaton Corp. plc | | 1,792 | | 546,184 | |
| Emerson Electric Co. | | 1,712 | | 200,492 | |
| Equifax, Inc. | | 287 | | 80,179 | |
| Expeditors International of
Washington, Inc. | | 384 | | 47,931 | |
| Fastenal Co. | | 1,431 | | 101,243 | |
| FedEx Corp. | | 573 | | 173,189 | |
| Fortive Corporation | | 671 | | 48,211 | |
| GE Vernova LLC(A) | | 667 | | 118,886 | |
| General Dynamics Corp. | | 280 | | 83,639 | |
| General Electric Co. | | 2,669 | | 454,264 | |
| Grainger WW, Inc. | | 97 | | 94,751 | |
| Honeywell International | | 2,179 | | 446,150 | |
| JB Hunt Transport Services, Inc. | | 96 | | 16,622 | |
| Illinois Tool Works, Inc. | | 573 | | 141,691 | |
| Ingersoll Rand, Inc. | | 764 | | 76,706 | |
7
FINANCIAL STATEMENTS | JULY 31, 2024
American Conservative Values ETF
Schedule of Investments - continuedJuly 31, 2024
See Notes to Financial Statements
| | | | | | |
| | | Shares | | Value | |
| Jacobs Solutions, Inc. | | 284 | | $41,563
| |
| Johnson Controls International ADR | | 2,480 | | 177,419 | |
| L3Harris Technologies, Inc. | | 574 | | 130,235 | |
| Lockheed Martin Corp. | | 663 | | 359,293 | |
| Norfolk Southern Corp. | | 205 | | 51,160 | |
| Northrop Grumman Corp. | | 383 | | 185,495 | |
| Old Dominion Freight | | 386 | | 81,129 | |
| Otis Worldwide Corp. | | 568 | | 53,676 | |
| PACCAR, Inc. | | 1,311 | | 129,343 | |
| Parker-Hannifin Corp. | | 288 | | 161,614 | |
| Paychex, Inc. | | 954 | | 122,131 | |
| Paycom Software, Inc. | | 96 | | 16,012 | |
| Quanta Services, Inc. | | 96 | | 25,476 | |
| RB Global, Inc. ADR | | 1,965 | | 156,473 | |
| Republic Services, Inc. | | 1,899 | | 369,014 | |
| Rockwell Automation, Inc. | | 96 | | 26,750 | |
| RTX Corp. | | 3,808 | | 447,402 | |
| Southwest Airlines Co. | | 1,906 | | 51,348 | |
| Trane Technologies plc ADR | | 475 | | 158,783 | |
| Transdigm Group, Inc. | | 96 | | 124,245 | |
| Uber Technologies, Inc.(A) | | 7,689 | | 495,710 | |
| Union Pacific Corp. | | 1,707 | | 421,168 | |
| United Airlines Holdings(A) | | 667 | | 30,295 | |
| UPS, Inc. Class B | | 1,704 | | 222,150 | |
| Veralto Corp. | | 734 | | 78,215 | |
| Verisk Analytics, Inc. | | 1,201 | | 314,362 | |
| Wabtec Corp. | | 379 | | 61,076 | |
| Waste Management, Inc. | | 2,122 | | 430,045 | |
| Xylem, Inc. | | 193 | | 25,766 | |
| | | | | 10,987,525 | |
| | | | | | |
16.38% | INFORMATION TECHNOLOGY - HARDWARE | | | |
| Advanced Micro Devices(A) | | 4,279 | | 618,230 | |
| Amphenol Corp. Class A | | 3,040 | | 195,350 | |
| Analog Devices, Inc. | | 2,251 | | 520,836 | |
| Broadcom, Inc. | | 12,472 | | 2,004,001 | |
| Cisco Systems, Inc. | | 28,949 | | 1,402,579 | |
| Corning, Inc. | | 1,813 | | 72,538 | |
| HP, Inc. | | 4,459 | | 160,925 | |
| Intel Corp. | | 13,845 | | 425,595 | |
| Jabil, Inc. | | 1,343 | | 151,316 | |
| Keysight Technologies, Inc.(A) | | 382 | | 53,316 | |
8
FINANCIAL STATEMENTS | JULY 31, 2024
American Conservative Values ETF
Schedule of Investments - continuedJuly 31, 2024
See Notes to Financial Statements
| | | | | | |
| | | Shares | | Value | |
| Lam Research Corp. | | 567 | | $522,343
| |
| Microchip Technology, Inc. | | 954 | | 84,696 | |
| Micron Technology, Inc. | | 3,412 | | 374,706 | |
| Motorola Solutions, Inc. | | 1,796 | | 716,460 | |
| Nvidia Corp. | | 58,890 | | 6,891,308 | |
| NXP Semiconductors NV ADR | | 836 | | 220,002 | |
| Qualcomm, Inc. | | 3,504 | | 634,049 | |
| Roper Technologies, Inc. | | 866 | | 471,754 | |
| TE Connectivity Ltd. ADR | | 956 | | 147,539 | |
| Texas Instruments, Inc. | | 2,934 | | 597,979 | |
| | | | | 16,265,522 | |
| | |
15.51% | INFORMATION TECHNOLOGY -
SOFTWARE & SERVICES | |
| Accenture plc Class A ADR | | 2,563 | | 847,379 | |
| Adobe, Inc.(A) | | 1,985 | | 1,095,024 | |
| Ansys, Inc.(A) | | 556 | | 174,378 | |
| Applied Materials, Inc. | | 3,059 | | 649,120 | |
| Arista Networks, Inc.(A) | | 1,902 | | 659,138 | |
| Autodesk, Inc.(A) | | 1,043 | | 258,163 | |
| Cadence Design Systems(A) | | 1,618 | | 433,074 | |
| CDW Corp. | | 289 | | 63,034 | |
| Cognizant Tech Solutions | | 3,337 | | 252,544 | |
| CrowdStrike Holdings, Inc.(A) | | 498 | | 115,516 | |
| F5, Inc.(A) | | 936 | | 190,607 | |
| Fair Isaac Corp.(A) | | 175 | | 280,000 | |
| Fortinet, Inc.(A) | | 1,895 | | 109,986 | |
| Gartner Group, Inc.(A) | | 380 | | 190,452 | |
| Hewlett-Packard Enterprise | | 11,310 | | 225,182 | |
| Intuit, Inc. | | 1,398 | | 904,995 | |
| KLA Corp. | | 508 | | 418,120 | |
| Manhattan Associates, Inc.(A) | | 588 | | 150,163 | |
| Microsoft Corp. | | 11,563 | | 4,837,380 | |
| Oracle Corp. | | 6,721 | | 937,243 | |
| Palo Alto Networks, Inc.(A) | | 1,298 | | 421,500 | |
| Seagate Technology Holdings plc ADR | | 470 | | 48,020 | |
| ServiceNow, Inc.(A) | | 979 | | 797,288 | |
| Synopsys, Inc.(A) | | 961 | | 536,546 | |
| Tyler Technologies, Inc.(A) | | 91 | | 51,698 | |
| Verisign, Inc.(A) | | 2,015 | | 376,825 | |
| Workday, Inc. Class A(A) | | 833 | | 189,191 | |
| Zebra Technologies Corp.(A) | | 567 | | 199,125 | |
| | | | | 15,411,691 | |
9
FINANCIAL STATEMENTS | JULY 31, 2024
American Conservative Values ETF
Schedule of Investments - continuedJuly 31, 2024
See Notes to Financial Statements
| | | | | | |
| | | Shares | | Value | |
2.50% | MATERIALS | | | | | |
| Air Products and Chemicals, Inc. | | 576 | | $151,978
| |
| Albemarle Corp. | | 96 | | 8,992 | |
| Amcor plc ADR | | 4,287 | | 45,142 | |
| Ball Corporation | | 954 | | 60,894 | |
| Celanese Corp. Class A | | 97 | | 13,692 | |
| Corteva, Inc. | | 1,908 | | 107,039 | |
| Dow, Inc. | | 759 | | 41,343 | |
| Dupont de Nemours, Inc. | | 649 | | 54,321 | |
| Ecolab, Inc. | | 671 | | 154,793 | |
| FMC Corp. | | 97 | | 5,661 | |
| Freeport-McMoran, Inc. | | 4,573 | | 207,659 | |
| International Paper Co. | | 1,335 | | 62,051 | |
| International Flavors & Fragrance, Inc. | | 191 | | 19,001 | |
| LyondellBasell Industries NV ADR | | 569 | | 56,593 | |
| The Mosaic Co. | | 761 | | 22,655 | |
| Linde plc ADR | | 2,005 | | 909,268 | |
| Newmont Goldcorp Corp. | | 1,809 | | 88,768 | |
| Nucor Corp. | | 663 | | 108,029 | |
| Packaging Corp. of America | | 193 | | 38,575 | |
| PPG Industries, Inc. | | 573 | | 72,760 | |
| The Sherwin-Williams Co. | | 574 | | 201,359 | |
| Smurfit Kappa Group plc ADR | | 478 | | 21,434 | |
| Sylvamo Corp. | | 104 | | 7,666 | |
| Vulcan Materials Co. | | 96 | | 26,353 | |
| | | | | 2,486,026 | |
| | | | | | |
1.84% | REAL ESTATE | | | | | |
| Alexandria Real Estate Equities,
Inc. REIT | | 193 | | 22,637 | |
| American Tower Corporate REIT | | 1,048 | | 230,979 | |
| AvalonBay Communities, Inc. REIT | | 289 | | 59,222 | |
| CBRE Group, Inc.(A) | | 1,143 | | 128,828 | |
| Crown Castle, Inc. | | 1,051 | | 115,694 | |
| Digital Realty Trust, Inc. REIT | | 668 | | 99,859 | |
| Equinix, Inc. | | 290 | | 229,169 | |
| Equity Residential REIT | | 859 | | 59,812 | |
| Extra Space Storage, Inc. REIT | | 97 | | 15,483 | |
| Host Hotels & Resorts, Inc. REIT | | 1,136 | | 19,891 | |
| Mid-America Apartment
Communities REIT | | 97 | | 13,558 | |
| Prologis, Inc. | | 3,062 | | 385,965 | |
10
FINANCIAL STATEMENTS | JULY 31, 2024
American Conservative Values ETF
Schedule of Investments - continuedJuly 31, 2024
See Notes to Financial Statements
| | | | | | |
| | | Shares | | Value | |
| Public Storage REIT | | 477 | | $141,154
| |
| Realty Income Corp. REIT | | 464 | | 26,648 | |
| SBA Communications Corp. | | 88 | | 19,320 | |
| Simon Property Group, Inc. REIT | | 474 | | 72,731 | |
| Ventas, Inc. REIT | | 567 | | 30,867 | |
| Welltower, Inc. REIT | | 954 | | 106,133 | |
| Weyerhaeuser Co. REIT | | 1,521 | | 48,307 | |
| | | | | 1,826,257 | |
| | | | | | | |
2.18% | UTILITIES | | | | | |
| AES Corp. | | 567 | | 10,087 | |
| Ameren Corp. | | 84 | | 6,659 | |
| American Electric Power, Inc. | | 390 | | 38,267 | |
| American Water Works Co. | | 193 | | 27,475 | |
| CenterPoint Energy, Inc. | | 952 | | 26,418 | |
| Consolidated Edison, Inc. | | 94 | | 9,167 | |
| Constellation Energy Corp. | | 383 | | 72,693 | |
| Dominion Energy, Inc. | | 551 | | 29,456 | |
| DTE Energy Co. | | 386 | | 46,525 | |
| Duke Energy Corp. | | 1,223 | | 133,636 | |
| Edison International | | 753 | | 60,248 | |
| Eversource Energy | | 763 | | 49,526 | |
| Exelon Corp. | | 930 | | 34,596 | |
| FirstEnergy Corp. | | 1,241 | | 52,010 | |
| NextEra Energy, Inc. | | 7,401 | | 565,362 | |
| Public Service Enterprise Group, Inc. | | 1,048 | | 83,599 | |
| Sempra Energy | | 410 | | 32,825 | |
| The Southern Company | | 9,196 | | 768,050 | |
| WEC Energy Group | | 576 | | 49,571 | |
| Xcel Energy, Inc. | | 1,144 | | 66,672 | |
| | | | | 2,162,842 | |
| | | | | | |
99.70% | TOTAL COMMON STOCKS | | | | | |
| (Cost: $80,867,230) | | 98,998,250 | |
| | | | | | |
99.70% | TOTAL INVESTMENTS | | | | | |
| (Cost: $80,867,230) | | 98,998,250 | |
0.30% | Other assets, net of liabilities | | 294,473 | |
100.00% | NET ASSETS | | $99,292,723
| |
(A)Non-income producing
(B)Non voting shares
ADR - Security represented is held by the custodian in the form of American Depositary Receipts.
REIT - Real Estate Investment Trust
11
FINANCIAL STATEMENTS | JULY 31, 2024
See Notes to Financial Statements
American Conservative Values ETF
Statement of Assets and LiabilitiesJuly 31, 2024
| | | |
ASSETS | | | |
Investments at value (cost of $80,867,230) (Note 1) | | $98,998,250
| |
Cash | | 294,426 | |
Receivable for capital stock sold | | 1,045,186 | |
Dividends receivable | | 57,047 | |
TOTAL ASSETS | | 100,394,909 | |
| | | |
LIABILITIES | | | |
Payable for securities purchased | | 1,040,393 | |
Accrued advisory fees | | 61,793 | |
TOTAL LIABILITIES | | 1,102,186 | |
NET ASSETS | | $99,292,723
| |
| | | |
Net Assets Consist of: | | | |
Paid-in capital | | $83,372,890
| |
Distributable earnings (accumulated deficit) | | 15,919,833 | |
Net Assets | | $99,292,723
| |
| | | |
NET ASSET VALUE PER SHARE | | | |
Net Assets | | $99,292,723
| |
Shares Outstanding (unlimited number of shares of beneficial
interest authorized without par value) | | 2,375,000 | |
Net Asset Value and Offering Price Per Share | | $41.81
| |
12
FINANCIAL STATEMENTS | JULY 31, 2024
American Conservative Values ETF
Statement of OperationsYear Ended July 31, 2024
See Notes to Financial Statements
| | | |
INVESTMENT INCOME | | | |
Dividend income (net of foreign tax withheld of $536) | | $1,148,893
| |
Total investment income | | 1,148,893 | |
| | | |
EXPENSES | | | |
Investment advisory fees (Note 2) | | 565,214 | |
Total expenses | | 565,214 | |
Net investment income (loss) | | 583,679 | |
| | | |
REALIZED AND UNREALIZED GAIN (LOSS) ON INVESTMENTS | | | |
Net realized gain (loss) on investments(1) | | 2,403,253 | |
Change in unrealized appreciation (depreciation) of investments | | 12,047,457 | |
Net realized and unrealized gain (loss) on investments | | 14,450,710 | |
| | | |
INCREASE (DECREASE) IN NET ASSETS FROM OPERATIONS | | $15,034,389
| |
(1)Included realized gains (losses) as a result of in-kind transactions (Note 3).
13
FINANCIAL STATEMENTS | JULY 31, 2024
See Notes to Financial Statements
American Conservative Values ETF
Statements of Changes in Net Assets
| | | | | |
| | Year ended
July 31, 2024 | | Year ended
July 31, 2023 | |
INCREASE (DECREASE) IN NET ASSETS FROM | | | | | |
| | | | | |
OPERATIONS | | | | | |
Net investment income (loss) | | $583,679
| | $358,050
| |
Net realized gain (loss) on investments | | 2,403,253 | | (924,709 | ) |
Change in unrealized appreciation (depreciation)
of investments | | 12,047,457 | | 6,552,689 | |
Increase (decrease) in net assets from operations | | 15,034,389 | | 5,986,030 | |
| | | | | |
DISTRIBUTIONS TO SHAREHOLDERS | | | | | |
Distributions from earnings | | (565,179 | ) | (355,171 | ) |
Decrease in net assets from distributions | | (565,179 | ) | (355,171 | ) |
| | | | | |
CAPITAL STOCK TRANSACTIONS (NOTE 5) | | | | | |
Proceeds from shares issued | | 38,258,227 | | 18,432,924 | |
Shares redeemed | | (10,035,347 | ) | — | |
Increase (decrease) in net assets from capital
stock transactions | | 28,222,880 | | 18,432,924 | |
| | | | | |
NET ASSETS | | | | | |
Increase (decrease) during year | | 42,692,090 | | 24,063,783 | |
Beginning of year | | 56,600,633 | | 32,536,850 | |
End of year | | $99,292,723
| | $56,600,633
| |
14
FINANCIAL STATEMENTS | JULY 31, 2024
See Notes to Financial Statements
American Conservative Values ETF
Financial HighlightsSelected Per Share Data Throughout Each Period
| | | | | | | | | |
| | Years ended July 31, | | October 28,
2020(2)
through
July 31, 2021 | |
2024 | | 2023 | | 2022 |
Net asset value, beginning
of period | | $34.83
| | $30.99
| | $32.55
| | $25.00
| |
Investment activities | | | | | | | | | |
Net investment income
(loss)(1) | | 0.29 | | 0.29 | | 0.25 | | 0.19 | |
Net realized and unrealized gain (loss) on investments | | 6.97 | | 3.83 | | (1.58 | ) | 7.53 | |
Total from investment activities | | 7.26 | | 4.12 | | (1.33 | ) | 7.72 | |
| | | | | | | | | |
Distributions | | | | | | | | | |
Net investment income | | (0.28 | ) | (0.28 | ) | (0.21 | ) | (0.17 | ) |
Net realized gain | | — | | — | | (0.02 | ) | — | |
Total distributions | | (0.28 | ) | (0.28 | ) | (0.23 | ) | (0.17 | ) |
Net asset value, end of period | | $41.81
| | $34.83
| | $30.99
| | $32.55
| |
| | | | | | | | | |
Total Return(3) | | 20.93 | % | 13.45 | % | (4.06 | %) | 30.96 | % |
| | | | | | | | | |
Ratios/Supplemental Data | | | | | | | | | |
Ratios to average net assets(4) | | | | | | | | | |
Expenses | | 0.75 | % | 0.75 | % | 0.75 | % | 0.75 | % |
Net investment income (loss) | | 0.77 | % | 0.94 | % | 0.77 | % | 0.82 | % |
Portfolio turnover rate(5) | | 12.98 | % | 9.27 | % | 3.70 | % | 6.04 | % |
Net assets, end of period (000’s) | | $99,293
| | $56,601
| | $32,537
| | $13,965
| |
(1)Per share amounts caluculated using the average shares outstanding during the period.
(2)Commencement of Operations.
(3)Total return is for the period indicated and has not been annualized for periods less than one year.
(4)Ratios to average net assets have been annualized.
(5)Portfolio turnover rate is for the period indicated, excludes the effect of securities received or delivered from processing in-kind creations or redemptions, and has not been annualized for periods less than one year.
15
FINANCIAL STATEMENTS | JULY 31, 2024
American Conservative Values ETF
Notes to Financial StatementsJuly 31, 2024
NOTE 1 – ORGANIZATION AND SIGNIFICANT ACCOUNTING POLICIES
The American Conservative Values ETF (the “Fund”) is a diversified series of ETF Opportunities Trust, a Delaware statutory trust (the “Trust”) which was organized on March 18, 2019 and is registered under the Investment Company Act of 1940, as amended (the “1940 Act”) as an open-end management investment company. The offering of the Fund’s shares is registered under the Securities Act of 1933, as amended. The Fund commenced operations on October 28, 2020.
The Fund’s objective is to seek to achieve long-term capital appreciation with capital preservation as a secondary objective.
The following is a summary of significant accounting policies consistently followed by the Fund. The policies are in conformity with accounting principles generally accepted in the United States of America (“GAAP”). The Fund follows the investment company accounting and reporting guidance of the Financial Accounting Standards Board (“FASB”) Accounting Standards Codification Topic 946 “Financial Services – Investment Companies”.
Security Valuation
The Fund records its investments at fair value. Generally, the Fund’s domestic securities are valued each day at the last quoted sales price on each security’s primary exchange. Securities traded or dealt in upon one or more securities exchanges for which market quotations are readily available and not subject to restrictions against resale shall be valued at the last quoted sales price on the primary exchange or, in the absence of a sale on the primary exchange, at the mean between the current bid and ask prices on such exchange. Securities primarily traded in the NASDAQ National Market System for which market quotations are readily available shall be valued using the NASDAQ Official Closing Price. If market quotations are not readily available, securities will be valued at their fair market value as determined in good faith under procedures set by the Trust’s Board of Trustees (the “Board”). Although the Board is ultimately responsible for fair value determinations under Rule 2a-5 of the 1940 Act, the Board has delegated day-to-day responsibility for oversight of the valuation of the Fund’s assets to Ridgeline Research LLC (the “Advisor”) as the Valuation Designee pursuant to the Fund’s policies and procedures. Securities that are not traded or dealt in any securities exchange (whether domestic or foreign) and for which over-the-counter market quotations are readily available generally shall be valued at the last sale price or, in the absence of a sale, at the mean between the current bid and ask price on such over-the-counter market.
16
FINANCIAL STATEMENTS | JULY 31, 2024
American Conservative Values ETF
Notes to Financial Statements - continuedJuly 31, 2024
The Fund has a policy that contemplates the use of fair value pricing to determine the net asset value (“NAV”) per share of the Fund when market prices are unavailable as well as under special circumstances, such as: (i) if the primary market for a portfolio security suspends or limits trading or price movements of the security; and (ii) when an event occurs after the close of the exchange on which a portfolio security is principally traded, but prior to the time as of which the Fund's NAV is calculated, that is likely to have changed the value of the security. Since most of the Fund’s investments are traded on U.S. securities exchanges, it is anticipated that the use of fair value pricing will be limited.
When the Fund uses fair value pricing to determine the NAV per share of the Fund, securities will not be priced on the basis of quotations from the primary market in which they are traded, but rather may be priced by another method that the Valuation Designee believes accurately reflects fair value. Any method used will be approved by the Board and results will be monitored to evaluate accuracy. The Fund’s policy is intended to result in a calculation of the Fund’s NAV that fairly reflects security values as of the time of pricing.
The Fund has adopted fair valuation accounting standards that establish an authoritative definition of fair value and set out a hierarchy for measuring fair value. These standards require additional disclosures about the various inputs used to develop the measurements of fair value. These inputs are summarized in the three broad levels listed below.
Various inputs are used in determining the value of the Fund’s investments. GAAP established a three-tier hierarchy of inputs to establish a classification of fair value measurements for disclosure purposes. Level 1 includes quoted prices in active markets for identical securities. Level 2 includes other significant observable market-based inputs (including quoted prices for similar securities, interest rates, prepayment speeds, credit risk, etc.). Level 3 includes significant unobservable inputs (including the Fund’s own assumptions in determining fair value of investments).
The inputs or methodology used for valuing securities are not necessarily an indication of the risk associated with investing in those securities.
17
FINANCIAL STATEMENTS | JULY 31, 2024
American Conservative Values ETF
Notes to Financial Statements - continuedJuly 31, 2024
The following is a summary of the level of inputs used to value the Fund’s investments as of July 31, 2024:
| | | | | | | | | |
| | Level 1
Quoted Prices | | Level 2
Other Significant Observable Inputs | | Level 3
Significant Unobservable Inputs | | Total | |
Common Stocks | | $98,998,250
| | $—
| | $—
| | $98,998,250
| |
| | $98,998,250
| | $—
| | $—
| | $98,998,250
| |
Refer to the Fund’s Schedule of Investments for a listing of the securities by type and sector.
The Fund held no Level 3 securities at any time during the year ended July 31, 2024.
Security Transactions and Income
Security transactions are accounted for on the trade date. The cost of securities sold is determined generally on specific identification basis to calculate realized gains and losses from security transactions for book and tax purposes. Dividends are recorded on the ex-dividend date. Interest income is recorded on an accrual basis. Withholding taxes on foreign dividends have been provided for in accordance with the Fund’s understanding of the applicable country’s tax rules.
Accounting Estimates
In preparing financial statements in conformity with GAAP, management makes estimates and assumptions that affect the reported amounts of assets and liabilities and disclosures of contingent assets and liabilities at the date of the financial statements, as well as the reported amounts of investment income and expenses during the reporting period. Actual results could differ from those estimates.
Federal Income Taxes
The Fund has complied and intends to continue to comply with the requirements of the Internal Revenue Code applicable to regulated investment companies and to distribute all of its taxable income to its shareholders. The Fund also intends to distribute sufficient net investment income and net capital gains, if any, so that it will not be subject to excise tax on undistributed income and gains. Therefore, no federal income tax or excise provision is required.
18
FINANCIAL STATEMENTS | JULY 31, 2024
American Conservative Values ETF
Notes to Financial Statements - continuedJuly 31, 2024
Management has concluded that no liability for unrecognized tax benefits should be recorded related to uncertain tax positions taken in the Fund’s tax returns. The Fund has no examinations in progress and management is not aware of any tax positions for which it is reasonably possible that the total amounts of unrecognized tax benefits will significantly change in the next twelve months. Interest and penalties, if any, associated with any federal or state income tax obligations are recorded as income tax expense as incurred.
Reclassification of Capital Accounts
GAAP requires that certain components of net assets relating to permanent differences be reclassified between financial and tax reporting. For the year ended July 31, 2024, such reclassifications were as follows:
| | | |
Distributable earnings | | $(3,381,144
| ) |
Paid-in capital | | 3,381,144 | |
The permanent difference reclassifications are attributable primarily to realized gains from in-kind transactions.
Dividends and Distributions
Dividends from net investment income, if any, are declared and paid quarterly by the Fund. The Fund distributes its net realized capital gains, if any, to shareholders annually. The Fund may also pay a special distribution at the end of a calendar year to comply with federal tax requirements. All distributions are recorded on the ex-dividend date.
Creation Units
The Fund issues and redeems shares to certain institutional investors (typically market makers or other broker-dealers) only in large blocks of at least 25,000 shares known as “Creation Units.” Purchasers of Creation Units (“Authorized Participants”) will be required to pay Citibank, N.A. (the “Custodian”) a fixed transaction fee (“Creation Transaction Fee”) in connection with creation orders that is intended to offset the transfer and other transaction costs associated with the issuance of Creation Units. The standard Creation Transaction Fee will be the same regardless of the number of Creation Units purchased by an investor on the applicable Business Day. The Creation Transaction Fee charged by the Custodian for each creation order is $1,500. Authorized Participants wishing to redeem shares will be required to pay to the Custodian a fixed transaction fee
19
FINANCIAL STATEMENTS | JULY 31, 2024
American Conservative Values ETF
Notes to Financial Statements - continuedJuly 31, 2024
(“Redemption Transaction Fee”) to offset the transfer and other transaction costs associated with the redemption of Creation Units. The standard Redemption Transaction Fee will be the same regardless of the number of Creation Units redeemed by an investor on the applicable Business Day. The Redemption Transaction Fee charged by the Custodian for each redemption order is $1,500.
Except when aggregated in Creation Units, shares are not redeemable securities. Shares of the Fund may only be purchased or redeemed by Authorized Participants. An Authorized Participant is either (i) a broker-dealer or other participant in the clearing process through the Continuous Net Settlement System of the National Securities Clearing Corporation or (ii) a Depository Trust Company (“DTC”) participant and, in each case, must have executed an agreement with the Fund’s principal underwriter (the “Distributor”) with respect to creations and redemptions of Creation Units (“Participation Agreement”). Most retail investors will not qualify as Authorized Participants or have the resources to buy and sell whole Creation Units. Therefore, they will be unable to purchase or redeem the shares directly from the Fund. Rather, most retail investors will purchase shares in the secondary market with the assistance of a broker and will be subject to customary brokerage commissions or fees. The following table discloses the Creation Unit breakdown based on the NAV as of July 31, 2024:
| | | | | | | |
| | Creation
Unit Shares | | Creation Transaction Fee | | Value | |
American Conservative Values ETF | | 25,000 | | $1,500
| | $1,045,250
| |
To the extent contemplated by a participant agreement, in the event an Authorized Participant has submitted a redemption request in proper form but is unable to transfer all or part of the shares comprising a Creation Unit to be redeemed to the Distributor, on behalf of the Fund, by the time as set forth in a participant agreement, the Distributor may nonetheless accept the redemption request in reliance on the undertaking by the Authorized Participant to deliver the missing shares as soon as possible, which undertaking shall be secured by the Authorized Participant’s delivery and maintenance of collateral equal to a percentage of the value of the missing shares as specified in the participant agreement. A participant agreement may permit the Fund to use such collateral to purchase the missing shares, and could subject an Authorized Participant to liability for any shortfall between the cost of the Fund acquiring such shares and the value of the collateral. Amounts are disclosed as Segregated Cash Balance from Authorized Participants for Deposit Securities and Collateral Payable upon Return of Deposit Securities on the Statement of Assets and Liabilities, when applicable.
20
FINANCIAL STATEMENTS | JULY 31, 2024
American Conservative Values ETF
Notes to Financial Statements - continuedJuly 31, 2024
Officers and Trustees Indemnification
Under the Trust’s organizational documents, its officers and trustees are indemnified against certain liabilities arising out of the performance of their duties to the Fund. In addition, in the normal course of business, the Fund enters into contracts with its vendors and others that provide for general indemnifications. The Fund’s maximum exposure under these arrangements is unknown, as this would involve future claims that may be made against the Fund. However, based on experience, the Fund expects that risk of loss to be remote.
NOTE 2 – INVESTMENT ADVISORY AND DISTRIBUTION AGREEMENTS AND OTHER TRANSACTIONS WITH AFFILIATES
The Advisor currently provides investment advisory services pursuant to an investment advisory agreement (the “Advisory Agreement”). Under the terms of the Advisory Agreement, the Advisor manages the investment portfolio of the Fund, subject to the policies adopted by the Trust’s Board of Trustees. Under the Advisory Agreement, the Advisor, at its own expense and without reimbursement from the Trust, furnishes office space and all necessary office facilities, equipment and executive personnel necessary for managing the assets of the Fund. Under the Advisory Agreement, the Advisor assumes and pays all ordinary expenses of the Fund, except the fee paid to the Advisor pursuant to the Investment Advisory Agreement, distribution fees or expenses under a 12b-1 plan (if any), interest expenses, taxes, acquired fund fees and expenses, brokerage commissions and any other portfolio transaction related expenses and fees arising out of transactions effected on behalf of the Fund, credit facility fees and expenses, including interest expenses, and litigation and indemnification expenses and other extraordinary expenses not incurred in the ordinary course of the Fund’s business.
For its services with respect to the Fund, the Advisor is entitled to receive an annual advisory fee, calculated daily and payable monthly as a percentage of the Fund’s average daily net assets, at the rate of 0.75%.
The Advisor has retained Vident Asset Management (the “Sub-Advisor”), to serve as sub-advisor for the Fund. The Sub-Advisor is responsible for trading portfolio securities on behalf of the Fund, including selecting broker-dealers to execute purchase and sale transactions as instructed by the Advisor, subject to the supervision of the Advisor and the Board.
For the services it provides to the Fund, the Sub-Advisor is compensated by the Advisor from the advisory fees paid by the Fund to the Advisor. Fees to the
21
FINANCIAL STATEMENTS | JULY 31, 2024
American Conservative Values ETF
Notes to Financial Statements - continuedJuly 31, 2024
Sub-Advisor are calculated daily and paid monthly, based on the daily net assets of the Fund at the following rate: 0.05% on the first $250 million in net assets; 0.04% on the next $250 million in net assets; and 0.03% on any net assets in excess of $500 million (subject to a minimum of $30,000 per year).
The Sub-Advisor was formed in 2016. The Sub-Advisor registered with the U.S. Securities and Exchange Commission as an investment advisor and commenced operations in 2019. Pursuant to a purchase agreement signed on March 24, 2023, Vident Capital Holdings, LLC (“VA Holdings”), a subsidiary of MM VAM, LLC, acquired the Sub-Advisor (the “Transaction”). MM VAM, LLC is an entity controlled by Casey Crawford. The Transaction closed on July 14, 2023 (the “Closing Date”). As of the Closing Date, Mr. Crawford controls the Sub-Advisor through VA Holdings. Under the 1940 Act, the Transaction resulted in a change of control of the Sub-Advisor, which in turn resulted in the assignment and termination of the investment Sub-Advisory Agreement between the Trust, the Advisor, and the Sub-Advisor (the “Former Sub-Advisory Agreement”). To avoid a lapse in sub-advisory services to the Fund, the Sub-Advisor and the Trust entered into an Interim Sub-Advisory Agreement, pursuant to the requirements of Section 15(f) and Rule 15a-4 of the 1940 Act, prior to the Transaction.
Pursuant to the Interim Sub-Advisory Agreement, the Sub-Advisor provided sub-advisory services to the Fund until shareholders approved the New Sub-Advisory Agreement. At a meeting held on October 6, 2023, the Fund’s shareholders voted to approve the New Sub-Advisory Agreement. At the meeting, Fund shareholders approved the New Sub-Advisory Agreement, and Vident Asset Management is the new sub-advisor.
Fund Administrator
Commonwealth Fund Services, Inc. (“CFS”) acts as the Fund’s administrator. As administrator, CFS supervises all aspects of the operations of the Fund except those performed by the Advisor and the Sub-Advisor. For its services, fees to CFS are computed daily and paid monthly based on the average daily net assets of the Fund, subject to a minimum of $25,000 per year. The Advisor pays these fees.
Custodian and Transfer Agent
Citibank, N.A. serves as the Fund’s Custodian and Transfer Agent pursuant to a Global Custodial and Agency Services Agreement. For its services, Citibank, N.A. is entitled to a fee. The Advisor pays these fees monthly.
22
FINANCIAL STATEMENTS | JULY 31, 2024
American Conservative Values ETF
Notes to Financial Statements - continuedJuly 31, 2024
Fund Accountant
Citi Fund Services, Ohio, Inc. serves as the Fund’s Fund Accountant pursuant to a Services Agreement. The Advisor pays these fees monthly.
Distributor
Foreside Fund Services, LLC serves as the Fund’s principal underwriter pursuant to an ETF Distribution Agreement. The Advisor pays the fees for these services monthly.
Trustees and Officers
Each Trustee who is not an “interested person” of the Trust receives compensation for their services to the Fund. Each Trustee receives an annual retainer fee, paid quarterly. Trustees are reimbursed for any out-of-pocket expenses incurred in connection with attendance at meetings. The Advisor pays these costs. For the period ended July 31, 2024, the Advisor paid $7,938 in Trustee compensation.
Certain officers of the Trust are also officers and/or directors of CFS. Additionally, Practus, LLP serves as legal counsel to the Trust. John H. Lively, Secretary of the Trust, is Managing Partner of Practus, LLP. J. Stephen King, Jr., Assistant Secretary of the Trust, is a partner of Practus, LLP. Gino E. Malaspina, Assistant Secretary of the Trust, serves as Counsel of Practus, LLP. Tom Carter, Vice President of the Trust, is President of the Advisor. Neither the officers and/or directors of CFS, Mr. Lively, Mr. King, Mr. Malaspina or Mr. Carter receive any special compensation from the Trust or the Fund for serving as officers of the Trust.
NOTE 3 – INVESTMENTS
The costs of purchases and proceeds from the sales of securities other than in-kind transactions for the year ended July 31, 2024, were as follows:
| |
Purchases | Sales |
$10,097,287 | $9,873,761 |
The costs of purchases and proceeds from the sales of in-kind transactions associated with creations and redemptions for the year ended July 31, 2024, were as follows:
| | |
Purchases | Sales | Realized Gain |
$38,053,874 | $10,207,030 | $3,381,172 |
23
FINANCIAL STATEMENTS | JULY 31, 2024
American Conservative Values ETF
Notes to Financial Statements - continuedJuly 31, 2024
NOTE 4 – DISTRIBUTIONS TO SHAREHOLDERS AND TAX COMPONENTS OF CAPITAL
Distributions are determined on a tax basis and may differ from net investment income and realized capital gains for financial reporting purposes. Differences may be permanent or temporary. Permanent differences are reclassified among capital accounts in the financial statements to reflect their tax character. Temporary differences arise when certain items of income, expense, gain or loss are recognized in different periods for financial statement and tax purposes; these differences will reverse at some time in the future. Differences in classification may also result from the treatment of short-term gains as ordinary income for tax purposes.
The tax character of distributions during the years ended July 31, 2024 and 2023, respectively, were as follows:
| | | | | |
| | Year ended July 31, 2024 | | Year ended July 31, 2023 | |
Distributions paid from: | | | | | |
Ordinary income | | $565,179
| | $355,171
| |
| | $565,179
| | $355,171
| |
As of July 31, 2024, the components of distributable earnings (accumulated deficits) on a tax basis were as follows:
| | | |
Accumulated undistributed net investment income (loss) | | $39,359
| |
Other accumulated losses | | (2,249,215 | ) |
Net unrealized appreciation (depreciation) on investments | | 18,129,689 | |
| | $15,919,833
| |
As of July 31, 2024, the Fund had a capital loss carryforward of $2,249,215, of which $494,390 is considered short term and $1,754,825 is considered long term. These losses may be carried forward indefinitely.
Cost of securities for Federal Income tax purpose and the related tax-based net unrealized appreciation (depreciation) consists of:
| | | |
Cost | Gross Unrealized Appreciation | Gross Unrealized Depreciation | Total Unrealized Appreciation (Depreciation) |
$80,868,562 | $19,809,331 | $(1,679,642) | $18,129,689 |
The difference between book basis and tax basis net unrealized appreciation (depreciation) is attributable primarily to the deferral of wash sale losses.
24
FINANCIAL STATEMENTS | JULY 31, 2024
American Conservative Values ETF
Notes to Financial Statements - continuedJuly 31, 2024
NOTE 5 – TRANSACTIONS IN SHARES OF BENEFICIAL INTEREST
Shares of the Fund are listed for trading on the NYSE Arca, Inc. (the “Exchange”), and trade at market prices rather than at NAV. Shares of the Fund may trade at a price that is greater than, at, or less than NAV. The Fund will issue and redeem shares at NAV only in large blocks of 25,000 shares (each block of shares is called a “Creation Unit”). Creation Units are issued and redeemed for cash and/or in-kind for securities. Individual shares may only be purchased and sold in secondary market transactions through brokers. Except when aggregated in Creation Units, the shares are not redeemable securities of the Fund.
All orders to create Creation Units must be placed with the Fund’s distributor or transfer agent either (1) through the Continuous Net Settlement System of the NSCC (“Clearing Process”), a clearing agency that is registered with the U.S. Securities and Exchange Commission (“SEC”), by a “Participating Party,” i.e., a broker-dealer or other participant in the Clearing Process; or (2) outside the Clearing Process by a DTC Participant. In each case, the Participating Party or the DTC Participant must have executed an agreement with the Distributor with respect to creations and redemptions of Creation Units (“Participation Agreement”); such parties are collectively referred to as “APs” or “Authorized Participants.” Investors should contact the Distributor for the names of Authorized Participants. All Fund shares, whether created through or outside the Clearing Process, will be entered on the records of DTC for the account of a DTC Participant.
Shares of beneficial interest transactions for the Fund were:
| | | | | |
| | Year ended
July 31, 2024 | | Year ended
July 31, 2023 | |
Shares sold | | 1,025,000 | | 575,000 | |
Shares redeemed | | (275,000 | ) | — | |
Net increase (decrease) | | 750,000 | | 575,000 | |
NOTE 6 – RISKS OF INVESTING IN THE FUND
It is important that you closely review and understand the risks of investing in the Fund. The Fund’s NAV and investment return will fluctuate based upon changes in the value of its portfolio securities. You could lose money on your investment in the Fund, and the Fund could underperform other investments. There is no guarantee that the Fund will meet its investment objective. An investment in the Fund is not a deposit of a bank and is not insured or guaranteed by the FDIC or any other government agency. A complete description of the principal risks is included in the Fund’s prospectus under the heading “Principal Risks.”
25
FINANCIAL STATEMENTS | JULY 31, 2024
American Conservative Values ETF
Notes to Financial Statements - continuedJuly 31, 2024
NOTE 7 – SUBSEQUENT EVENTS
Management has evaluated all transactions and events subsequent to the date of the Statement of Assets and Liabilities through the date on which these financial statements were issued. Except as already included in the notes to these financial statements, no additional items require disclosure.
26
FINANCIAL STATEMENTS | JULY 31, 2024
American Conservative Values ETF
Supplemental Information (unaudited)July 31, 2024
Changes in and disagreements with accountants for open-end management investment companies.
Not applicable.
Proxy disclosures for open-end management investment companies.
Not applicable.
Remuneration paid to Directors, Officers, and others of open-end management investment companies.
See Note 2 which includes remuneration paid to Trustees.
Advisory Agreement Renewal
Not applicable.
27
FINANCIAL STATEMENTS | JULY 31, 2024
American Conservative Values ETF
Report of Independent Registered Public Accounting Firm
American Conservative Values ETF
Report of Independent Registered Public Accounting Firm
To the Shareholders of American Conservative Values ETF and
Board of Trustees of ETF Opportunities Trust
Opinion on the Financial Statements
We have audited the accompanying statement of assets and liabilities, including the schedule of investments, of American Conservative Values ETF (the “Fund”), a series of ETF Opportunities Trust, as of July 31, 2024, the related statement of operations for the year then ended, the statements of changes in net assets for each of the two years in the period then ended, the financial highlights for the years ended July 31, 2024, 2023, and 2022 and for the period from October 28, 2020 (commencement of operations) through July 31, 2021, and the related notes (collectively referred to as the “financial statements”). In our opinion, the financial statements present fairly, in all material respects, the financial position of the Fund as of July 31, 2024, the results of its operations for the year then ended, the changes in net assets for each of the two years in the period then ended, and the financial highlights for the years ended July 31, 2024, 2023, and 2022 and for the period October 28, 2020 (commencement of operations) through July 31, 2021, in conformity with accounting principles generally accepted in the United States of America.
Basis for Opinion
These financial statements are the responsibility of the Fund’s management. Our responsibility is to express an opinion on the Fund’s financial statements based on our audits. We are a public accounting firm registered with the Public Company Accounting Oversight Board (United States) (“PCAOB”) and are required to be independent with respect to the Fund in accordance with the U.S. federal securities laws and the applicable rules and regulations of the Securities and Exchange Commission and the PCAOB.
We conducted our audits in accordance with the standards of the PCAOB. Those standards require that we plan and perform the audit to obtain reasonable assurance about whether the financial statements are free of material misstatement whether due to error or fraud.
Our audits included performing procedures to assess the risks of material misstatement of the financial statements, whether due to error or fraud, and performing procedures that respond to those risks. Such procedures included examining, on a test basis, evidence regarding the amounts and disclosures in the financial statements. Our procedures included confirmation of securities owned as of July 31, 2024, by correspondence with the custodian and brokers;
28
FINANCIAL STATEMENTS | JULY 31, 2024
American Conservative Values ETF
Report of Independent Registered Public Accounting Firm - continued
when replies were not received from brokers, we performed other auditing procedures. Our audits also included evaluating the accounting principles used and significant estimates made by management, as well as evaluating the overall presentation of the financial statements. We believe that our audits provide a reasonable basis for our opinion.
We have served as the Fund’s auditor since 2019.
COHEN & COMPANY, LTD.
Cleveland, Ohio
September 27, 2024
| ITEM 8. | CHANGES IN AND DISAGREEMENTS WITH ACCOUNTANTS FOR OPEN-END MANAGEMENT INVESTMENT COMPANIES. |
Not applicable.
| ITEM 9. | PROXY DISCLOSURES FOR OPEN-END MANAGEMENT INVESTMENT COMPANIES. |
Not applicable.
| ITEM 10. | REMUNERATION PAID TO DIRECTORS, OFFICERS, AND OTHERS OF OPEN-END MANAGEMENT INVESTMENT COMPANIES. |
| (1) | The amount of regular compensation paid for all trustees for the period covered by the report is included in Item 7 in Note 2 of the Notes to Financial Statements. |
| | |
| (2) | Not applicable. |
| | |
| (3) | The registrant’s Chief Compliance Officer and Assistant Chief Compliance Officer are not compensated directly by the registrant for their service. However, the Assistant Chief Compliance Officer is the Managing Member of Watermark Solutions, LLC (“Watermark”), which provides certain compliance services to the registrant, including the provision of the Chief Compliance Officer and the Assistant Chief Compliance Officer. The Assistant Chief Compliance Officer is the Managing Member of Watermark, and the Chief Compliance Officer is the Managing Member of Fit Compliance, LLC, which has been retained by Watermark to provide the Chief Compliance Officer’s services. Payments for Watermark’s services were made by the fund’s investment adviser. |
| | |
| (4) | During the period covered by this report, the investment adviser paid Watermark $9,110 for the services described in Item 10 (3) above. |
| ITEM 11. | STATEMENT REGARDING BASIS FOR APPROVAL OF INVESTMENT ADVISORY CONTRACT. |
Not applicable.
| ITEM 12. | DISCLOSURE OF PROXY VOTING POLICIES AND PROCEDURES FOR CLOSED-END MANAGEMENT INVESTMENT COMPANIES. |
Not applicable because it is not a closed-end management investment company.
| ITEM 13. | PORTFOLIO MANAGERS OF CLOSED-END MANAGEMENT INVESTMENT COMPANIES. |
Not applicable because it is not a closed-end management investment company.
| ITEM 14. | PURCHASES OF EQUITY SECURITIES BY CLOSED-END MANAGEMENT INVESTMENT COMPANY AND AFFILIATED PURCHASERS. |
Not applicable because it is not a closed-end management investment company.
| ITEM 15. | SUBMISSION OF MATTERS TO A VOTE OF SECURITY HOLDERS. |
There have been no material changes to the procedures by which shareholders may recommend nominees to the registrant’s board of trustees.
| ITEM 16. | CONTROLS AND PROCEDURES. |
(a) The registrant’s principal executive and principal financial officers, or persons performing similar functions, have concluded that the registrant’s disclosure controls and procedures (as defined in Rule 30a-3(c) under the Investment Company Act of 1940, as amended (the “1940 Act”) (17 CFR 270.30a-3(c))) are effective, as of a date within 90 days of the filing date of the report that includes the disclosure required by this paragraph, based on their evaluation of these controls and procedures required by Rule 30a-3(b) under the 1940 Act (17 CFR 270.30a-3(b)) and Rules 13a-15(b) or 15d-15(b) under the Securities Exchange Act of 1934, as amended (17 CFR 240.13a-15(b) or 240.15d- 15(b)).
(b) There were no changes in the registrant’s internal control over financial reporting (as defined in Rule 30a-3(d) under the 1940 Act (17 CFR 270.30a-3(d)) that occurred during the period covered by this report that have materially affected, or are reasonably likely to materially affect, the registrant’s internal control over financial reporting.
| ITEM 17. | DISCLOSURE OF SECURITIES LENDING ACTIVITIES FOR CLOSED-END MANAGEMENT INVESTMENT COMPANIES. |
Not applicable because it is not a closed-end management investment company.
| ITEM 18. | RECOVERY OF ERRONEOUSLY AWARDED COMPENSATION. |
Not applicable.
| (a)(2) | Any policy required by the listing standards adopted pursuant to Rule 10D-1 under the Exchange Act of 1934: Not applicable. |
(a)(3)(1) Any written solicitation to purchase securities under Rule 23c-1 under the Investment Company Act of 1940 – Not applicable.
(a)(3)(2) Change in the registrant’s independent public accountant – Not applicable.
SIGNATURES
Pursuant to the requirements of the Securities Exchange Act of 1934 and the Investment Company Act of 1940, the registrant has duly caused this report to be signed on its behalf by the undersigned, thereunto duly authorized.
Registrant: ETF Opportunities Trust
| By (Signature and Title)*: | /s/ Karen Shupe |
| | Karen Shupe
Principal Executive Officer
|
| Date: October 8, 2024 | |
Pursuant to the requirements of the Securities Exchange Act of 1934 and the Investment Company Act of 1940, this report has been signed below by the following persons on behalf of the registrant and in the capacities and on the dates indicated.
| By (Signature and Title)*: | /s/ Karen Shupe |
| | Karen Shupe
Principal Executive Officer
|
| Date: October 8, 2024 | |
| | |
| By (Signature and Title)*: | /s/ Ann MacDonald |
| | Ann MacDonald
Principal Financial Officer
|
| Date: October 8, 2024 | |
* Print the name and title of each signing officer under his or her signature.