Exhibit 99.3

MANAGEMENT’S DISCUSSION AND ANALYSIS
FOR THE YEAR ENDED DECEMBER 31, 2020
Date of Report: March 22, 2021
This Management’s Discussion and Analysis (“MD&A”) is intended to help the reader understand the significant factors that have affected the performance of Maverix Metals Inc. and its subsidiaries (collectively “Maverix”, “we”, “us”, “our” or the “Company”) and such factors that may affect its future performance. This MD&A should be read in conjunction with the Company’s audited consolidated financial statements for the year ended December 31, 2020 and related notes thereto (the “Consolidated Financial Statements”) which have been prepared in accordance with International Financial Reporting Standards (“IFRS”), as issued by the International Accounting Standards Board (“IASB”).
Readers are cautioned that the MD&A contains forward-looking statements and that actual events may vary from management’s expectations. Readers are encouraged to read the “Forward-Looking Statements” at the end of this MD&A and to consult Maverix’s Consolidated Financial Statements which are available on SEDAR at www.sedar.com and on Form 40-F filed with the United States Securities and Exchange Commission on EDGAR at www.sec.gov.
Effective January 1, 2020, the Company elected to change its presentation currency from the Canadian dollar (“CAD”) to the United States dollar (“USD”). The Company applied the change to USD presentation currency retrospectively and restated the comparative financial information as if the new presentation currency had always been the Company’s presentation currency. All amounts in this MD&A are expressed in USD, unless identified otherwise.
Table of Contents
| Description of the Business | 3 |
| Highlights and Key Accomplishments for Three Months and Year Ended December 31, 2020 | 3 |
| COVID-19 Pandemic | 5 |
| Outlook for 2021 | 6 |
| Portfolio of Royalty, Stream and Other Interests Owned by Maverix at December 31, 2020 | 6 |
| Summary of Annual Results | 10 |
| Summary of Quarterly Results | 13 |
| Non-IFRS and Other Measures | 17 |
| Liquidity and Capital Resources | 18 |
| Off-Balance Sheet Arrangements | 20 |
| Related Party Transactions | 20 |
| Critical Accounting Judgements and Estimates | 20 |
| Financial Instruments | 20 |
| Outstanding Share Data | 21 |
| Risks and Uncertainties | 21 |
| Disclosure Controls and Procedures | 24 |
| Internal Controls Over Financial Reporting | 24 |
| Forward-Looking Statements | 25 |
| Technical and Third-Party Information | 25 |
Description of the Business
Maverix is a resource-based company that seeks to acquire and manage royalties and metal purchase agreements (a “Stream” or “Streams”) on projects that are in an advanced stage of development or on operating mines producing precious or other metals. Royalty interests (“Royalty” or collectively, “Royalties”) are non-operating interests in mining projects that provide Maverix with the right to a percentage of the gross revenue from the metals produced from the project (a “Gross Revenue Royalty” or “GRR”) or, the net revenue after the deduction of specified costs (a “Net Smelter Returns Royalty” or “NSR” royalty). Under a Stream interest, Maverix makes an upfront payment to acquire the Stream and then receives the right to purchase, at a fixed or variable price per unit based on the spot price of the precious or other metal, a percentage of a mine’s production for the life of mine or a specified time period.
The Company’s business strategy is to acquire existing Royalty and Stream interests, or to finance production, development, or in some circumstances, exploration stage projects in exchange for Royalty or Stream interests. In the ordinary course of business, Maverix engages in a continual review of opportunities to acquire existing Royalty or Stream interests, or to create new Royalties or Streams on operating mines, development projects and exploration projects. The Company currently has over 100 Royalties and Streams, of which 13 of the underlying mines are paying, excluding royalty payments from industrial minerals and power assets.
Highlights and Key Accomplishments for Three Months and Year Ended December 31, 2020
Financial and Operating:
| · | Record revenue of $16.6 million and $51.7 million for the three months and year ended December 31, 2020; |
| | | |
| · | Record operating cash flow excluding working capital changes of $11.51 million and $36.51 million for the three months and year ended December 31, 2020; |
| | | |
| · | Record operating cash flows of $33.0 million for the year ended December 31, 2020; |
| | | |
| · | Record Gold Equivalent Ounces (“GEOs”) sold of 8,8361 and 28,9161 for the three months and year ended December 31, 2020; |
| | | |
| · | Cash operating margin of $1,6911 and $1,6131 per GEO sold for the three months and year ended December 31, 2020; |
| | | |
| · | Average cash cost of $1841 and $1741 per GEO sold for the three months and year ended December 31, 2020; |
| | | |
| · | Record net income of $23.7 million, including a one-time gain on an amendment of a royalty interest, for the year ended December 31, 2020; and |
| · | Adjusted net income of $6.31 million and $15.61 million for the three months and year ended December 31, 20201. |
TMAC Acquired by Agnico Eagle2
In February 2021, TMAC Resources Inc. (“TMAC”) announced it had concluded the previously announced plan of arrangement pursuant to which Agnico Eagle Mines Limited (“Agnico Eagle”) acquired all the issued and outstanding common shares of TMAC at a price of C$2.20 per share (the “Transaction”). TMAC is the owner of the Hope Bay mine, where the Company previously held a 2.5% NSR royalty interest.
TMAC had the right to buy back 1.5% of the NSR royalty interest held by the Company for a cash payment of $50.0 million in the event of a change in control transaction of TMAC (as defined in the royalty agreement) that was announced prior to June 30, 2021 (the “Hope Bay Buyback”). Concurrent with the closing of the Transaction, Agnico notified the Company that it would exercise the Hope Bay Buyback. The Company has received the $50.0 million payment and retained a 1% NSR royalty interest on the Hope Bay mine that is not subject to any reductions.
Acquisition of Royalty Portfolio from Newmont
In October 2020, the Company completed the acquisition of a portfolio of 11 gold royalties (the “Royalty Portfolio”) from Newmont Corporation (“Newmont”) for upfront consideration of $75.0 million and contingent payments of up to $15.0 million (the “Acquisition”).
1 Refer to section on non-IFRS and other measures of this MD&A.
2 Refer to TMAC’s news release dated February 2, 2021 on www.sedar.com, under TMAC’s SEDAR profile.
Acquisition highlights include:
| · | Addition of High Quality Gold Royalties Based in the Americas: The Royalty Portfolio consists of gold assets located in Mexico, USA, Canada and Guatemala, ranging from in construction to exploration stage; |
| · | Growth Pipeline Enhanced with Near Term Cash Flow and Accretive to Net Asset Value per Share: Production at the Camino Rojo project, located in Zacatecas, Mexico, is expected to commence late in 2021 and Bluestone Resources Inc. (“Bluestone”) continues to advance engineering and optimization work at the Cerro Blanco project, located in Jutiapa, Guatemala; |
| · | Focused Counterparties Well Positioned to Advance Projects: The operations underlying the Royalty Portfolio include flagship assets for each of Orla Mining Ltd. (“Orla”), Bluestone, Corvus Gold Inc., and KORE Mining Ltd.; and |
| · | Newmont Relationship Strengthened: Newmont increased its ownership in Maverix to 30% of the outstanding common shares of the Company, re-affirming its endorsement of Maverix by taking additional equity. |
Royalty Portfolio:
| Asset | Operator | Location | Stage | Royalty |
| Camino Rojo (1) | Orla Mining Ltd. | Zacatecas, Mexico | Construction | 2.0% NSR |
| Cerro Blanco | Bluestone Resources Inc. | Jutiapa, Guatemala | Development | 1.0% NSR |
| Mother Lode | Corvus Gold Inc. | Nevada, USA | Development | 1.0% – 2.0% NSR |
| Imperial | KORE Mining Ltd. | California, USA | Development | 1.0% NSR |
| Ana Paula (1) | Argonaut Gold Inc. | Guerrero, Mexico | Development | 2.0% NSR |
| Trenton Canyon | SSR Mining Inc. | Nevada, USA | Exploration | 0.5% NSR |
| Buffalo Valley | SSR Mining Inc. | Nevada, USA | Exploration | 0.5% NSR |
| Cristina (1) | Criscora, S.A. de C.V. | Chihuahua, Mexico | Exploration | 2.0% NSR |
| Algoma-Talisman | Red Pine Exploration Inc. | Ontario, Canada | Exploration | 2.0% NSR |
| Sprogge | Seabridge Gold Inc. | Yukon, Canada | Exploration | 0.63% NSR |
| Yecora (1) | Cirscora, S.A. de C.V. | Sonora, Mexico | Exploration | 1.0% NSR |
| (1) | Transfer was subject to the authorization of the Federal Economic Competition Commission in Mexico (Comisión Federal de Competencia Económica), which was subsequently received on March 18, 2021, and such transfers are pending as of the date of this MD&A. |
Maverix issued to Newmont a total of 12,000,000 common shares of the Company and paid $15.0 million in cash upon closing the Acquisition. In addition, Maverix has agreed to make contingent cash payments of up to $15.0 million if certain production milestones at certain underlying assets are achieved within five years of closing the Acquisition.
Certain of the royalties that were due to be transferred were subject to certain restrictions on transfer, including a right of first refusal (“ROFR”) that permitted the underlying property owner the right to repurchase the specific royalty for cash consideration and, in the case of royalties on projects located in Mexico, the authorization of the Federal Economic Competition Commission in Mexico (Comisión Federal de Competencia Económica). The Company has committed to dispose the 1.0% NSR royalty on the Yecora project for cash consideration of $1.5 million.
Amendment of Beta Hunt Royalty Interests
In September 2020, the Company and Karora Resources Inc. (“Karora”) announced the closing of the agreement to reduce the gold royalties at Karora’s Beta Hunt mine from 7.5% to 4.75%, effective July 1, 2020, in exchange for total cash consideration of $18.0 million (the “Beta Hunt Royalty Amendment”). The total consideration of $18.0 million included $13.0 million for the reduction of the Company’s royalty interest in the Beta Hunt mine and a $5.0 million one-time bonus royalty payable in two equal instalments of $2.5 million. The Beta Hunt Royalty Amendment will allow both the Company and Karora shareholders to benefit from a renewed focus on exploration, development and potential future production growth at the Beta Hunt mine. Upon closing, the Company received $15.5 million. The remaining $2.5 million was received in January 2021.
Secondary Offering and Exercise of Warrants by Pan American
In May 2020, the Company and Pan American Silver Corp. (“Pan American”) announced they entered into an agreement with a syndicate of underwriters, pursuant to which Pan American undertook an overnight marketed public offering of 9,000,000 common shares of the Company held by Pan American (the “Secondary Offering”). In addition, Pan American granted the underwriters an over-allotment option to purchase up to an additional 1,350,000 common shares of the Company held by Pan American on the same terms and conditions as the Secondary Offering. Concurrently, Pan American also notified the Company of its intention to exercise 8,250,000 common share purchase warrants upon closing of the Secondary Offering.
In June 2020, the Company and Pan American announced the closing of the Secondary Offering, including the exercise in full of the over-allotment option. Concurrent with the closing of the Secondary Offering, Pan American exercised 8,250,000 warrants of the Company and the Company received $15.6 million in gross proceeds.
Quarterly Dividends Declared
On February 18, 2021, the Board of Directors of the Company declared a quarterly dividend of $0.01 per common share payable on March 15, 2021 to shareholders of record as of the close of business on February 26, 2021.
COVID-19 Pandemic
The Company continues to monitor and assess potential impacts of the novel coronavirus, also known as COVID-19, on its employees and business. In response to the COVID-19 pandemic, the Company closed its office, implemented a travel ban, and directed all of its employees to work remotely. No employees have contracted COVID-19 as of the date of this report.
Though the current COVID-19 global health pandemic is significantly impacting the global economy commodity, and financial markets, as at the date of this MD&A, Maverix is only aware of two operations in which it has a Royalty or Stream interest that were temporarily suspended during 2020, being the La Colorada and San Jose mines. Both mines have since resumed operations.
There are a number of potential impacts that could restrict our operating partners’ ability to operate as a result of the COVID-19 pandemic. Mining operations in which Maverix holds a Royalty or Stream interest could be suspended for precautionary purposes or as governments declare states of emergency or take other actions in an effort to combat the spread of COVID-19. Refer to the “Risks and Uncertainties” section of this MD&A.
Outlook for 20211
In 2021, Maverix expects 27,000 to 30,000 attributable GEOs2 at approximately a 90% cash margin2 with approximately 99% of expected revenue derived from gold and silver.
Portfolio of Royalty, Stream and Other Interests Owned by Maverix at December 31, 2020
As at December 31, 2020, the Company owned over 100 Royalties, Streams and other interests. Maverix has thirteen Royalties and Streams that are currently paying, including three in Australia, three in the United States, two in Mexico, two in Canada, and one in each Honduras, Burkina Faso and Russia. In addition, the Company owns a number of Royalties and Streams on development and exploration/evaluation stage projects in North America, South America, and Australia, amongst others. The Company uses “evaluation stage” to describe exploration stage properties that contain mineralized material and on which operators are engaged in the search for reserves. We do not conduct mining operations on the properties in which we hold Royalty and Stream interests, and we are not required to contribute to capital costs, exploration costs, environmental costs or other operating costs on those properties.
Primary Properties:
The following table summarizes Maverix’s principal Stream interests:
| Asset | Location | Operator | Status | MMX Attributable Production | MMX Purchase Price |
| El Mochito | Honduras | Kirungu Corporation | Paying | 22.5% of silver(1) | 25% of silver spot price |
| La Colorada | Mexico | Pan American Silver Corp. | Paying | 100% of gold | Lesser of (i) US$650 per ounce and (ii) spot price |
| Moss | USA | Northern Vertex Mining Corp. | Paying | 100% of silver(2) | 20% of silver spot price |
(1) If 3.0 million ounces of silver are delivered to Maverix prior to April 1, 2022, Maverix’s silver purchase entitlement will be 20% of life of mine silver production.
(2) After 3.5 million ounces of silver are delivered, Maverix’s silver purchase entitlement will be 50% of the remaining life of mine silver production.
1 Statements made in this section contain forward-looking information. Reference should be made to the “Cautionary Statement on Forward Looking Information” section at the end of this MD&A. For a description of material factors that could cause our actual results to differ materially from the forward-looking statements, please see the “Risk Factors” section in the most recent Annual Information Form filed with the Canadian securities regulatory authorities on www.sedar.com.
2 Refer to section on non-IFRS and other measures of this MD&A.
The following table summarizes Maverix’s principal Royalty interests:
| Asset | Location | Operator | Status | Royalty Interest |
| Beta Hunt | Australia | Karora Resources Inc. | Paying | 3.25% GRR, and 1.5% NSR Royalties on all Gold production; and 1.5% total NSR Royalties on all Nickel production |
| Camino Rojo | Mexico | Orla Mining Ltd. | Development | 2.0% NSR Royalty (1) |
| Cerro Blanco | Guatemala | Bluestone Resources Inc. | Development | 1.0 NSR Royalty |
| Cerro Casale | Chile | Barrick Gold Corporation and Newmont Corporation | Development | 1.25% GRR on 25% of Revenues(2) |
| Converse | USA | Waterton Global Resource Management | Development | 5.0% NSR Royalty(3) |
DeLamar (DeLamar) | USA | Integra Resources Corp. | Development | 2.5% NSR Royalty(4) |
| Florida Canyon | USA | Argonaut Gold Inc. | Paying | 3.0% NSR Royalty |
Goldfield (Gemfield) | USA | Waterton Global Resource Management | Development | 5.0% NSR Royalty on the Gemfield deposit |
| Hasbrouck-Three Hills | USA | West Vault Mining Inc. | Development | 1.25% NSR Royalty |
| Hope Bay | Canada | Agnico Eagle Mines Limited | Paying | 1.0%(5) NSR Royalty |
| Karma | Burkina Faso | Endeavour Mining Corporation | Paying | 2.0% NSR Royalty on 85.5% of total production |
| Kensington | USA | Coeur Mining, Inc. | Operating | 2.5% NSR(6) |
| McCoy-Cove | USA | Premier Gold Mines Ltd. | Development | 3.5% NSR Royalty(7) |
| Monument Bay | Canada | Yamana Gold Inc. | Advanced Exploration | 1.5% NSR Royalty |
Moose River (Touquoy) | Canada | St Barbara Limited | Paying | 1.0% NSR Royalty on the Touquoy deposit |
| Morondo | Cote d’Ivoire | Montage Gold Corp. | Exploration | 2.0% NSR Royalty |
| Mt Carlton | Australia | Evolution Mining Ltd. | Paying | 2.5% NSR Royalty |
| Omolon | Russia | Polymetal International plc | Paying | 2.0% GRR Royalty(3) |
| Railroad | USA | Gold Standard Ventures Corp. | Development | 2.0% NSR Royalty(3) |
| Relief Canyon | USA | Americas Gold and Silver Corp. | Operating | 2.0% NSR Royalty(3) |
San Jose (Taviche Oeste) | Mexico | Fortuna Silver Mines Inc. | Paying | 1.5% NSR Royalty on production from the Taviche Oeste concessions |
| Silvertip | Canada | Coeur Mining, Inc. | Suspended | 2.5% NSR Royalty |
| Vivien | Australia | Ramelius Resources Ltd. | Paying | 3.5% GRR |
(1) Royalty is on oxide and transitional ore only.
(2) Royalty commences after US$10M payable under the agreement.
(3) Royalty covers a portion of the existing mineral resource.
(4) NSR royalty covers a portion of the existing resource and decreases to a 1.0% NSR Royalty after CAD$10 million in royalties have been paid.
(5) Agnico exercised the Hope Bay Buyback subsequent to December 31, 2020.
(6) NSR royalty not payable until after a recoupment period.
(7) 2.0% of the NSR royalty only covers a portion of the deposit.
Significant Portfolio Updates - Paying and Operating Assets:
Hope Bay
Agnico announced that it plans to continue mining at the Doris deposit in 2021 with quarterly production expected to be approximately 18,000 to 20,000 ounces of gold. Agnico plans to ramp up a property wide exploration program in 2021 with 39,800 metres of drilling planned for exploration targets around the Doris, Madrid and Boston deposits and other targets along the 80 kilometre long greenstone belt. Agnico has disclosed that it believes that Hope Bay has the potential to be a 250,000 to 300,000 ounce per year operation and that it will continue to evaluate optimal mining and milling strategies for future production.
For more information, please refer to agnicoeagle.com and see the news release dated February 11, 2021.
Beta Hunt
Karora Resources Inc. (“Karora”) announced an updated mineral resource and reserve estimate for Beta Hunt. Gold reserves increased by 176,000 ounces and measured and indicated resources increased by 111,000 ounces, increases of 57% and 12%, respectively, over the November 2019 estimates. Karora continues to aggressively explore Beta Hunt and in 2020 was focused on infill and extensional drilling of the A Zone and Western Flanks. The updated mineral resource does not include the recently discovered high grade Larkin Zone discovered south of the Alpha Isla Fault, which requires further drilling and is expected to be included in the 2021 update. Karora also announced an updated nickel measured and indicated resource at Beta Hunt, the first since 2016, of 16,100 tonnes of nickel at a grade of 2.9%.
For more information, please refer to www.karoraresources.com and see the news release dated December 16, 2020.
Moss
Northern Vertex Mining Corp. (“Northern Vertex”) completed a business combination with Eclipse Gold Mining Corp. and a concurrent C$20 million equity financing (the “Financing”). As part of the Financing, the Company agreed to exercise 19.5 million share purchase warrants at C$0.40 per common share of Northern Vertex and sell the underlying common shares received in the Financing for C$0.50 per common share. The Financing closed on January 14, 2021 and the business combination closed on February 16, 2021, upon which the Company received $7.7 million in proceeds for the sale of the Northern Vertex common shares. Northern Vertex is currently undertaking a 13,700 metre Phase II infill drilling and resource expansion program at the Moss mine and an updated mineral resource estimate is expected in 2021. A key priority is delineating the East/West strike length of the Ruth Vein, which is located adjacent to the Moss open pit, and has been mapped for over 2 kilometres on surface.
For more information, please refer to www.northernvertex.com and see the news releases dated February 16, 2021, January 14, 2021, and November 3, 2020.
Florida Canyon
Argonaut Gold Inc. (“Argonaut Gold”) announced it completed the business combination with Alio Gold Inc., the owner of the Florida Canyon mine where the Company holds a 3% NSR Royalty. On July 3, 2020, Argonaut Gold announced the results of an updated life of mine plan for the Florida Canyon mine, which included average production of 77,000 gold ounces over 9.5 years.
For more information, please refer to www.argonautgold.com and see the news releases dated July 1, 2020 and July 3, 2020.
Relief Canyon
Americas Gold and Silver Corporation announced that commercial production was achieved at its Relief Canyon mine in Nevada, USA, and that full ramp up of the operation is targeted for mid-May 2021.
For more information, please refer to www.americas-gold.com and see the news release dated January 11, 2021.
Significant Portfolio Updates - Development and Exploration Assets:
Camino Rojo
Orla announced the results of an updated feasibility study for the Camino Rojo oxide gold project after the recently completed layback agreement with Fresnillo plc. The updated feasibility study highlights a 54% increase in contained gold mineral reserves and an updated mine life of over 10 years with an average gold production rate of 94,000 ounces per annum. The mine is currently in construction with first production planned for late 2021.
For more information, please refer to www.orlamining.com and see the news release dated January 11, 2021.
Cerro Blanco
Bluestone announced the findings of a preliminary economic assessment (“PEA”) that highlights an optimized project which doubles the gold resource ounces and production profile. The recent completion of advanced engineering and optimization work has significantly enhanced the understanding of the project and presented an opportunity to capitalize on its near-surface, high-grade mineralization through an open pit scenario. The PEA highlights an initial 11 year life of mine with production of approximately 2.4 million ounces of gold and 10.2 million ounces of silver and measured and indicated resources of 3.0 million ounces of gold and 13.2 million ounces of silver (61.5 million tonnes at 1.5 grams per tonne gold and 6.7 grams per tonne silver).
For more information, please refer to www.bluestoneresources.ca and see the news release dated February 28, 2021.
Silvertip
Coeur Mining, Inc. (“Coeur”) significantly increased the size of its resource base at Silvertip following the execution of the largest and most successful exploration program in the history of the property. Silver, zinc and lead measured and indicated resources increased by approximately 50%, 45% and 50%, respectively. Similarly, silver, zinc and lead inferred resources grew by approximately 46%, 69% and 37%, respectively.
Coeur highlighted key outcomes of the internal pre-feasibility study for Silvertip during its virtual investor day in December 2020. Notably, the Company developed a new flowsheet that would help support a potential expansion to a throughput rate of 1,750 tonnes per day. Coeur is now progressing the project through a more comprehensive front-end engineering and design phase for the revised flowsheet, while also continuing to build on the momentum of its exploration program. Coeur also plans to continue evaluating opportunities to accelerate certain non-mill related capital projects in 2021, including a new water treatment plant, to help mitigate construction risk should a restart of the project be approved during the second half of the year.
For more information, please refer to www.coeur.com and see the news release dated February 17, 2021.
Hasbrouck-Three Hills
West Vault Mining Inc. (“West Vault”) announced receipt from the Bureau of Land Management of a Decision Record and Finding of No Significant Impact for the Hasbrouck mine, signifying the completion of federal permitting, and the final major permitting step to allow construction. The Hasbrouck mine is planned as phase two of the Hasbrouck gold project, with phase 1 being the fully permitted Three Hills mine. The Hasbrouck gold project is one of only a few shovel-ready gold projects in the southwest United States.
For more information, please refer to www.westvaultmining.com and see the news release dated November 5, 2020.
McCoy-Cove
Premier Gold Mines Limited (“Premier”) announced that they have entered into a definitive agreement whereby Equinox Gold Corp. will acquire all outstanding shares of Premier. Concurrently, Premier will spin-out to its shareholders shares of a newly created US-focused gold production and development company called i-80 Gold Corp. (“i-80”), which will include the McCoy-Cove project in Nevada, USA as a core asset. On January 18, 2021, Premier announced an updated PEA for McCoy-Cove which outlined an 8-year mine life producing an average of 102,000 ounces of gold per annum. The PEA assumes mining of mineral resources in the Helen and Gap deposits only and potential exists to increase mineral resources as both the deposits remain open for expansion. The focus for the remainder of 2021 and 2022 includes laboratory and economic evaluations of alternative processing methods, optimizing the mine plan with the hydrological model, completion of baseline studies needed to commence an Environment Impact Statement, and beginning development of an exploration decline to support underground diamond drilling to upgrade and increase mineral resources. Completion of these activities and a feasibility study is expected to occur in 2023 to 2024. On March 18, 2021, Premier announced that i-80 completed a private placement offering for gross proceeds of approximately C$80.4 million. The proceeds from the offering are expected to be used by i-80 for working capital and general corporate purposes, to pay for exploration and development expenses related to i-80's mining projects, and to fund the cash portion of the purchase price for the acquisition of the Getchell project in Nevada from affiliates of Waterton Global Resource Management, Inc.
For more information, please refer to Premier’s news releases dated December 16, 2020, January 18, 2021 and March 18, 2021 on www.sedar.com, under Premier’s SEDAR profile.
Morondo
Montage Gold Corp. (“Montage”) announced an updated mineral resource at its Morondo gold project in Cote d’Ivoire. The inferred mineral resource at the Kone deposit was increased significantly to 123 million tonnes grading 0.80 gram per tonne at a 0.40 gram per tonne cut-off grade. A 35,000 metre drill program is currently underway targeting further growth in resources and infill drilling. Montage expects to release a preliminary economic assessment in April 2021 and a feasibility study before the end of 2021.
For more information, please refer to www.montagegoldcorp.com and see the news release dated January 28, 2021.
Summary of Annual Results
Year Ended (in thousands, except for GEO and per share amounts) | | December 31, 2020 | | | December 31, 2019 | | | December 31, 2018 | |
| Statement of Income (Loss) and Comprehensive Income (Loss) | | | | | | | | | | | | |
| Royalty revenue | | $ | 32,689 | | | $ | 21,797 | | | $ | 21,117 | |
| Sales | | | 18,992 | | | | 11,915 | | | | 5,163 | |
| Total revenue | | | 51,681 | | | | 33,712 | | | | 26,280 | |
| Cash flow from operating activities | | | 33,000 | | | | 20,961 | | | | 17,063 | |
| Net income (loss) | | | 23,719 | | | | (7,667 | ) | | | 2,092 | |
| Basic earnings (loss) per share | | | 0.19 | | | | (0.07 | ) | | | 0.02 | |
| Diluted earnings (loss) per share | | | 0.17 | | | | (0.07 | ) | | | 0.02 | |
| Dividends declared per share | | $ | 0.04 | | | $ | 0.01 | | | $ | 0.00 | |
| | | | | | | | | | | | | |
| Non-IFRS and Other Measures1 | | | | | | | | | | | | |
| Adjusted net income | | $ | 15,624 | | | $ | 6,958 | | | $ | 2,674 | |
| Adjusted basic earnings per share | | $ | 0.12 | | | $ | 0.06 | | | $ | 0.03 | |
| Total GEOs sold | | | 28,916 | | | | 24,021 | | | | 20,886 | |
| Average realized gold price per GEO | | $ | 1,787 | | | $ | 1,403 | | | $ | 1,258 | |
| Average cash cost per GEO | | | 174 | | | | 163 | | | | 125 | |
| Cash flow from operating activities, excluding changes in non-cash working capital | | $ | 36,527 | | | $ | 23,468 | | | $ | 18,405 | |
| | | | | | | | | | | | | |
| Statement of Financial Position | | | | | | | | | | | | |
| Total assets | | $ | 379,607 | | | $ | 315,135 | | | $ | 215,205 | |
| Total non-current liabilities | | $ | 32,000 | | | $ | 69,000 | | | $ | 12,300 | |
Year Ended December 31, 2020 Compared to the Year Ended December 31, 2019
For the year ended December 31, 2020, net income and cash flow from operations were $23.7 million and $33.0 million, respectively, compared with a net loss and cash flow from operations of $7.7 million and $21.0 million, respectively, for the year ended December 31, 2019. The change is attributable to a combination of factors including:
| | · | In September 2020, the company completed the Beta Hunt Royalty Amendment. As a result, the Company recognized a gain on the amendment of its Beta Hunt royalty interest of $9.3 million, current income tax expense of $4.3 million, income taxes paid of $1.5 million and an increase in working capital from the receipt of $2.5 million of the $5.0 million one-time bonus royalty. Further, Karora discovered the Father’s Day Vein, a high-grade gold discovery area at the Beta Hunt mine in September 2018 and subsequently announced the temporary six-month suspension of bulk mining production, which resulted in lower royalty revenue and cash flows for the year ended December 31, 2019; |
| | | |
| · | Production at the Moss mine has continued to ramp up, resulting in an increase in both sales and cash flows of $5.9 million and $4.7 million, respectively; |
| · | In August 2019, the Company purchased the 1.5% NSR Royalty and 0.25% NSR Royalty (collectively the “Additional Hope Bay Royalties”) in addition to the Company’s existing 1.0% NSR Royalty on the Hope Bay mine. The acquisition of the Additional Hope Bay Royalties contributed to the increase in both royalty revenue and cash flows of $2.2 million and $1.2 million, respectively; |
1 Refer to section on non-IFRS and other measures of this MD&A.
| · | In December 2019, the Company acquired a paying royalty on the Omolon mine which provided an increase in both royalty revenue and cash flows of $4.2 million and $3.2 million, respectively; |
| · | A 27% increase in the average realized gold price per GEO; |
| · | Net income increased by $1.9 million due to the revaluation of warrants held by the Company recorded in other income; and |
| · | Net income and cash flows were increased by $0.7 million and $0.5 million, respectively, due to the appreciation of the Australian dollar against the US dollar during 2020. |
Partially offset by:
| · | Decrease in royalty revenue of $0.5 million and cash flow of $1.1 million from the Mt Carlton mine as a consequence of the ore body becoming narrower and more irregular than it had previously been; |
| · | Decrease in both sales and cash flow of $0.9 million and $0.7 million from Silvertip as mining and processing activities were suspended in early 2020 due to deteriorating zinc and lead market conditions; |
| · | Both net income and cash flow from operations were reduced by $1.1 million from the cost of acquiring more gold and silver under the Company’s Stream agreements with respect to increased sales; |
| · | Net income decreased by $4.8 million due to the increase in depletion charges associated with the increase in total revenue and GEOs sold during the year; |
| · | Both net income and cash flow from operations were reduced by an increase in cash administration and project evaluation expenses of $1.5 million due to the increase in activities required to acquire and then manage the Company’s growing portfolio of assets; |
| · | During the year ended December 31, 2019, net income was decreased by the recognition of a non-cash impairment of $14.2 million on our Amulsar royalty interest; and |
| · | Net income was reduced by an increase in finance expense of $0.6 million due to additional amounts drawn on the Company’s credit facility during late 2019 and 2020, and partially repaid during 2020. |
For the year ended December 31, 2020, total revenue was $51.7 million and GEOs were 28,9161 compared with total revenue of $33.7 million and GEOs of 24,0211 for the year ended December 31, 2019.
1 Refer to section on non-IFRS and other measures of this MD&A.
The following table summarizes the Company’s total revenues and GEOs for the year ended December 31, 2020 and 2019:
| | | | | Year Ended December 31, 2020 | | | Year Ended December 31, 2019 | |
| (in thousands, except for GEO amounts) | | Primary Product | | Royalty Revenue ($) | | | Sales ($) | | | GEOs1 | | | Royalty Revenue ($) | | | Sales ($) | | | GEOs1 | |
| Beta Hunt | | Gold | | | 8,635 | | | | - | | | | 4,871 | | | | 4,786 | | | | - | | | | 3,353 | |
| El Mochito | | Silver | | | - | | | | 3,716 | | | | 2,012 | | | | - | | | | 3,626 | | | | 2,579 | |
| Florida Canyon | | Gold | | | 2,551 | | | | - | | | | 1,433 | | | | 2,101 | | | | - | | | | 1,492 | |
| Hope Bay | | Gold | | | 5,355 | | | | - | | | | 3,027 | | | | 3,124 | | | | - | | | | 2,208 | |
| Karma | | Gold | | | 2,946 | | | | - | | | | 1,666 | | | | 2,305 | | | | - | | | | 1,647 | |
| La Colorada | | Gold | | | - | | | | 6,347 | | | | 3,608 | | | | - | | | | 5,216 | | | | 3,758 | |
| Moose River | | Gold | | | 1,586 | | | | - | | | | 905 | | | | 1,124 | | | | - | | | | 807 | |
| Moss | | Silver | | | - | | | | 8,929 | | | | 4,954 | | | | - | | | | 3,073 | | | | 2,152 | |
| Mt Carlton | | Gold | | | 2,469 | | | | - | | | | 1,388 | | | | 2,941 | | | | - | | | | 2,137 | |
| Omolon | | Gold | | | 4,792 | | | | | | | | 2,598 | | | | 562 | | | | - | | | | 381 | |
| San Jose | | Silver | | | 1,989 | | | | - | | | | 1,118 | | | | 1,471 | | | | - | | | | 1,061 | |
| Silvertip | | Silver | | | - | | | | - | | | | - | | | | 941 | | | | - | | | | 684 | |
| Vivien | | Gold | | | 1,839 | | | | - | | | | 1,032 | | | | 2,070 | | | | - | | | | 1,497 | |
| Other | | Various | | | 527 | | | | - | | | | 304 | | | | 372 | | | | - | | | | 265 | |
| Consolidated total | | | | | 32,689 | | | | 18,992 | | | | 28,916 | | | | 21,797 | | | | 11,915 | | | | 24,021 | |
1 Refer to section on non-IFRS and other measures of this MD&A.
Summary of Quarterly Results
Quarter Ended (in thousands of USD, except for GEO and per share amounts) | | December 31, 2020 | | | September 30, 2020 | | | June 30,
2020 | | | March 31,
2020 | |
| Statement of Income and Comprehensive Income | | | | | | | | | | | | | | | | |
| Royalty revenue | | $ | 10,140 | | | $ | 8,689 | | | $ | 7,784 | | | $ | 6,076 | |
| Sales | | | 6,429 | | | | 6,162 | | | | 3,187 | | | | 3,214 | |
| Total revenue | | | 16,569 | | | | 14,851 | | | | 10,971 | | | | 9,290 | |
| Cash flow from operating activities | | | 7,746 | | | | 13,792 | | | | 6,616 | | | | 4,846 | |
| Net income | | | 5,346 | | | | 14,437 | | | | 3,076 | | | | 860 | |
| Basic earnings per share | | | 0.04 | | | | 0.11 | | | | 0.03 | | | | 0.01 | |
| Diluted earnings per share | | | 0.04 | | | | 0.11 | | | | 0.02 | | | | 0.01 | |
| Dividends declared per share | | $ | 0.01 | | | $ | 0.01 | | | $ | 0.01 | | | $ | 0.01 | |
| | | | | | | | | | | | | | | | | |
| Non-IFRS and Other Measures1 | | | | | | | | | | | | | | | | |
| Adjusted net income | | $ | 6,282 | | | $ | 5,336 | | | $ | 3,010 | | | $ | 996 | |
| Adjusted basic earnings per share | | $ | 0.05 | | | $ | 0.04 | | | $ | 0.02 | | | $ | 0.01 | |
| Total GEOs sold | | | 8,836 | | | | 7,797 | | | | 6,412 | | | | 5,871 | |
| Average realized gold price per GEO | | $ | 1,875 | | | $ | 1,905 | | | $ | 1,711 | | | $ | 1,582 | |
| Average cash cost per GEO | | | 184 | | | | 195 | | | | 139 | | | | 167 | |
| Cash flow from operating activities, excluding changes in non-cash working capital | | $ | 11,474 | | | $ | 10,841 | | | $ | 8,479 | | | $ | 5,733 | |
| | | | | | | | | | | | | | | | | |
| Statement of Financial Position | | | | | | | | | | | | | | | | |
| Total assets | | $ | 379,607 | | | $ | 325,396 | | | $ | 340,190 | | | $ | 307,420 | |
| Total non-current liabilities | | $ | 32,000 | | | $ | 35,000 | | | $ | 76,000 | | | $ | 66,000 | |
Quarter Ended (in thousands of USD, except for GEO and per share amounts) | | December 31, 2019 | | | September 30, 2019 | | | June 30,
2019 | | | March 31,
2019 | |
| Statement of (Loss) Income and (Loss) Comprehensive Income | | | | | | | | | | | | | | | | |
| Royalty revenue | | $ | 6,741 | | | $ | 6,469 | | | $ | 4,418 | | | $ | 4,169 | |
| Sales | | | 3,758 | | | | 4,085 | | | | 2,573 | | | | 1,499 | |
| Total revenue | | | 10,499 | | | | 10,554 | | | | 6,991 | | | | 5,668 | |
| Cash flow from operating activities | | | 7,456 | | | | 6,034 | | | | 5,343 | | | | 2,128 | |
| Net (loss) income | | | (11,237 | ) | | | 1,803 | | | | 610 | | | | 1,158 | |
| Basic (loss) earnings per share | | | (0.10 | ) | | | 0.02 | | | | 0.01 | | | | 0.01 | |
| Diluted (loss) earnings per share | | | (0.10 | ) | | | 0.02 | | | | 0.01 | | | | 0.01 | |
| Dividends declared per share | | $ | 0.01 | | | $ | 0.00 | | | $ | 0.00 | | | $ | 0.00 | |
| | | | | | | | | | | | | | | | | |
| Non-IFRS and Other Measures1 | | | | | | | | | | | | | | | | |
| Adjusted net income | | $ | 3,008 | | | $ | 1,797 | | | $ | 831 | | | $ | 1,323 | |
| Adjusted basic earnings per share | | $ | 0.03 | | | $ | 0.02 | | | $ | 0.01 | | | $ | 0.01 | |
| Total GEOs sold | | | 7,096 | | | | 7,208 | | | | 5,359 | | | | 4,358 | |
| Average realized gold price per GEO | | $ | 1,480 | | | $ | 1,464 | | | $ | 1,305 | | | $ | 1,301 | |
| Average cash cost per GEO | | | 171 | | | | 169 | | | | 156 | | | | 152 | |
| Cash flow from operating activities, excluding changes in non-cash working capital | | $ | 7,869 | | | $ | 7,655 | | | $ | 4,050 | | | $ | 3,894 | |
| | | | | | | | | | | | | | | | | |
| Statement of Financial Position | | | | | | | | | | | | | | | | |
| Total assets | | $ | 315,135 | | | $ | 257,736 | | | $ | 217,064 | | | $ | 220,512 | |
| Total non-current liabilities | | $ | 69,000 | | | $ | 51,000 | | | $ | 12,500 | | | $ | 16,800 | |
1 Refer to section on non-IFRS and other measures of this MD&A.
Changes in sales, net income and cash flow from operating activities from quarter to quarter are affected primarily by fluctuations in production at the underlying mines, the timing of shipments, changes in the price of commodities, as well as acquisitions of Royalties and Streams and the commencement of operations of mines under construction. For more information, refer to the quarterly commentary below.
Three Months Ended December 31, 2020 Compared to the Three Months Ended December 31, 2019
For the three months ended December 31, 2020, the Company had net income of $5.3 million and cash flow from operations of $7.7 million compared with net loss and cash flow from operations of $11.2 million and $7.5 million for the three months ended December 31, 2019. The increase in net income and cash flow were attributable to a combination of factors including:
| · | Production at the Moss mine has continued to ramp up, resulting in an increase in both sales and cash flows of $2.1 million and $1.7 million, respectively; |
| · | An increase in both royalty revenue and cash flow of $1.6 million and $2.4 million due to a full quarter of royalty revenue from the Omolon mine which was acquired in December 2019; |
| · | An increase in royalty revenue of $0.6 million from each of the Hope Bay and El Mochito mines due to increased attributable production; and |
| · | A 27% increase in the average realized gold price per GEO. |
Partially offset by:
| · | Decrease in both sales and cash flow of $0.2 million and $0.2 million from Silvertip as mining and processing activities were suspended in early 2020 due to deteriorating zinc and lead market conditions; |
| · | Both net income and cash flow from operations were reduced by $0.4 million from the cost of acquiring more gold and silver under the Company’s Stream agreements with respect to increased sales; |
| · | Net income decreased by $2.6 million due to the increase in depletion charges associated with the increase in total revenue for the period; |
| · | Both net income and cash flow from operations were reduced by an increase in cash administration and project evaluation expenses of $0.5 million due to the increase in activities required to acquire and then manage the Company’s growing portfolio of assets; |
| · | Cash flow from operations was reduced by a one-time income tax payment of $1.5 million for the Beta Hunt Royalty Amendment; |
| · | During the three months ended December 31, 2019, net income was decreased by the recognition of a non-cash impairment of $14.2 million on our Amulsar royalty; and |
| · | Net income decreased by $0.9 million due to the revaluation of warrants held by the Company recorded in other income. |
For the three months ended December 31, 2020, the Company had record quarterly revenue of $16.6 million and record quarterly GEOs of 8,8361 compared with total revenue of $10.5 million and GEOs of 7,0961 for the three months ended December 31, 2019.
The following table summarizes the Company’s total revenues and GEOs for the three months ended December 31, 2020 and 2019:
| | | | | Three months ended December 31, 2020 | | | Three months ended December 31, 2019 | |
| (in thousands of USD, except for GEO amounts) | | Primary Product | | Royalty Revenue ($) | | | Sales ($) | | | GEOs1 | | | Royalty Revenue ($) | | | Sales ($) | | | GEOs1 | |
| Beta Hunt | | Gold | | | 2,479 | | | | - | | | | 1,323 | | | | 1,856 | | | | - | | | | 1,255 | |
| El Mochito | | Silver | | | - | | | | 1,543 | | | | 824 | | | | - | | | | 936 | | | | 632 | |
| Florida Canyon | | Gold | | | 762 | | | | - | | | | 406 | | | | 976 | | | | - | | | | 660 | |
| Hope Bay | | Gold | | | 1,376 | | | | - | | | | 734 | | | | 816 | | | | - | | | | 551 | |
| Karma | | Gold | | | 852 | | | | - | | | | 455 | | | | 732 | | | | - | | | | 495 | |
| La Colorada | | Gold | | | - | | | | 1,710 | | | | 905 | | | | - | | | | 1,741 | | | | 1,178 | |
| Moose River | | Gold | | | 422 | | | | - | | | | 225 | | | | 277 | | | | - | | | | 187 | |
| Moss | | Silver | | | - | | | | 3,176 | | | | 1,694 | | | | - | | | | 1,081 | | | | 731 | |
| Mt Carlton | | Gold | | | 721 | | | | - | | | | 385 | | | | 406 | | | | - | | | | 273 | |
| Omolon | | Gold | | | 2,185 | | | | - | | | | 1,166 | | | | 562 | | | | - | | | | 381 | |
| San Jose | | Silver | | | 638 | | | | - | | | | 341 | | | | 357 | | | | - | | | | 241 | |
| Silvertip | | Silver | | | - | | | | - | | | | - | | | | 180 | | | | - | | | | 121 | |
| Vivien | | Gold | | | 609 | | | | - | | | | 325 | | | | 401 | | | | - | | | | 270 | |
| Other | | Various | | | 96 | | | | - | | | | 53 | | | | 178 | | | | - | | | | 121 | |
| Consolidated total | | | | | 10,140 | | | | 6,429 | | | | 8,836 | | | | 6,741 | | | | 3,758 | | | | 7,096 | |
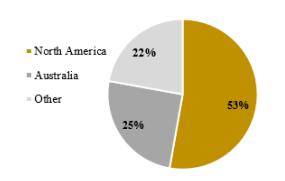
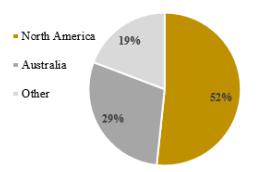
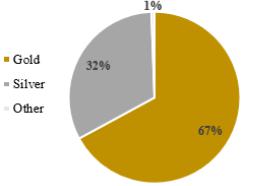
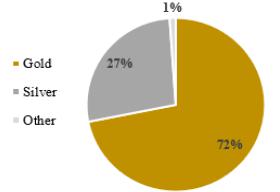
| Q4 2020 Royalty Revenue and Sales by Region | Q4 2019 Royalty Revenue and Sales by Region |

| 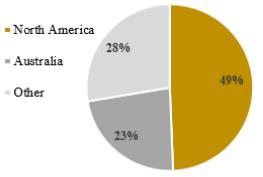 |
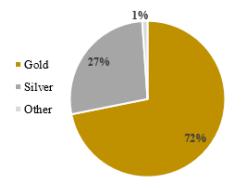
| Q4 2020 GEOs by Product | Q4 2019 GEOs by Product |
|  |
1 Refer to section on non-IFRS and other measures of this MD&A.
For the Three Months Ended December 31, 2020 Compared to Other Quarters Presented
When comparing net income of $5.3 million and cash flow from operations of $7.7 million for the three months ended December 31, 2020 with net income (loss) and operating cash flows for other quarters presented in the table of Summary of Quarterly Results above, the following items impact comparability of the analysis:
| · | In September 2020, the company completed the Beta Hunt Royalty Amendment. As a result, the Company recognized a gain on the amendment of its Beta Hunt royalty interest of $9.3 million and current income tax expense and taxes paid of $4.3 million. Further, Karora discovered the Father’s Day Vein in 2018, resulting in the Company recognizing royalty revenue of $2.4 million and $2.1 million for the three months ended September 30, 2018 and December 31, 2018, respectively. Subsequent to the discovery of the Father’s Day Vein, Karora announced the temporary suspension of bulk mining to focus on exploration and delineation drilling and has now ramped up production at the mine; |
| · | The Company recognized an increase in net income of $2.9 million due to revaluation of warrants held during the three months ended September 30, 2020; |
| · | The Company recognized a non-cash impairment of $14.2 million on its Amulsar royalty interest during the three months ended December 31, 2019; |
| · | The Company acquired silver streams on the Moss mine in December 2018 and the El Mochito mine in March 2019, the additional 1.5% NSR royalty on Hope Bay in August 2019 and the Kinross royalty portfolio in December 2019, all of which contributed full quarters of royalty or stream income subsequent to their acquisitions; |
| · | A number of underlying mines on which the Company has a Royalty or Stream interest have continued to ramp up or began production over the past years, including the Florida Canyon mine, the Moss mine, and the El Mochito mine; and |
| · | Net income being reduced by $0.3 million related to the initial listing costs for the NYSE American and TSX during the three months ended June 30, 2019. |
Change in Total Assets
Total assets increased by $54.2 million from September 30, 2020 to December 31, 2020 primarily resulting from the acquisition of the Royalty Portfolio from Newmont, which was financed by the issuance of common shares of the Company and a cash payment of $15.0 million. The net increase in total assets from the acquisition of the Royalty Portfolio was partially offset by the cash consideration paid of $15.0 million, a $3.0 million repayment under the Company’s credit facility and depletion of the Company’s royalty, stream and other interests.
Total assets decreased by $14.8 million from June 30, 2020 to September 30, 2020 primarily resulting from the repayment of $41.0 million under the Company’s credit facility, depletion of the Company’s royalty, stream and other interests and amendment of the Company’s royalty interest in the Beta Hunt mine. The decrease in total assets was partially offset by funds received on closing of the Beta Hunt Royalty Amendment and increase in the carrying value of investments due to fair value adjustments.
Total assets increased by $32.8 million from March 31, 2020 to June 30, 2020 primarily resulting from an increase in cash on hand from $15.6 million in gross proceeds received from the warrant exercise, the drawdown of an additional $10.0 million under the credit facility and the results of operations for the quarter. The net increase in total assets was partially offset by depletion of the Company’s royalty, stream and other interests.
Total assets decreased by $7.7 million from December 31, 2019 to March 31, 2020 primarily resulting from the partial repayment of outstanding amounts under the credit facility using right of first refusal proceeds which were receivable at December 31, 2019, a decrease in carrying value of investments due to disposal and fair value adjustments and depletion of the Company’s royalty, stream and other interests. The net decrease in total assets was partially offset by an increase in cash on hand from drawing down $10.0 million under the credit facility.
Total assets increased by $57.4 million from September 30, 2019 to December 31, 2019 primarily resulting from the acquisition of the Kinross Portfolio, which was financed by the issuance of common shares of the Company, cash flow from operations and drawdown of an additional $18.0 million from the credit facility. The net increase in total assets from the acquisition of the Kinross royalty portfolio was partially offset by impairment of the Company’s royalty interest on the Amulsar mine and depletion of the Company’s royalty, stream and other interests.
Total assets increased by $40.7 million from June 30, 2019 to September 30, 2019 primarily resulting from the acquisition of the additional 1.5% NSR royalty on the Hope Bay mine and the acquisition of common shares in conjunction with the royalty acquisition.
Total assets decreased by $3.4 million from March 31, 2019 to June 30, 2019 primarily resulting from the partial repayment of outstanding amounts under the credit facility using operating cash flow and depletion of the Company’s royalty, stream and other interests.
Non-IFRS and Other Measures
The Company has included, throughout this document, certain performance measures, including (i) adjusted net income and adjusted basic earnings per share, (ii) Average realized gold price per GEO, (iii) Average cash cost per GEO, (iv) cash operating margin, and (v) operating cash flows excluding changes in non-cash working capital. The presentation of these non-IFRS and other measures are intended to provide additional information and should not be considered in isolation or as a substitute for measures of performance prepared in accordance with IFRS. These non-IFRS and other measures do not have any standardized meaning prescribed by IFRS, and other companies may calculate these measures differently.
| i. | Adjusted net income and adjusted basic earnings per share are calculated by excluding the effects of other income/expenses, impairment charges, gains/(losses) on sale or amendment of royalty and streams and unusual non-recurring items. The Company believes that in addition to measures prepared in accordance with IFRS, certain investors use this information to evaluate the results of the underlying business of the Company. Management believes that this is a useful measure of the Company’s performance because it adjusts for items which may not relate to or have a disproportionate effect on the period in which they are recognized, impact the comparability of our core operating results from period to period, are not always reflective of the underlying operating performance of our business and/or are not necessarily indicative of future operating results. |
The table below provides a reconciliation of the adjusted net income and adjusted earnings per share:
| | | Three months ended December 31, 2020 | | | Three months ended December 31, 2019 | | | Year ended December 31, 2020 | | | Year ended December 31, 2019 | |
| Net income | | $ | 5,346 | | | $ | (11,237 | ) | | $ | 23,719 | | | $ | (7,667 | ) |
| Gain on royalty amendment | | | - | | | | - | | | | (9,291 | ) | | | - | |
| Impairment of royalty interests | | | - | | | | 14,241 | | | | - | | | | 14,241 | |
| Other expense (income) | | | 936 | | | | 4 | | | | (1,904 | ) | | | 100 | |
| Initial listing costs – NYSE American and TSX | | | - | | | | - | | | | - | | | | 284 | |
| Effect of taxes on adjusting items | | | - | | | | - | | | | 3,100 | | | | - | |
| Adjusted net income | | $ | 6,282 | | | $ | 3,008 | | | $ | 15,624 | | | $ | 6,958 | |
| Divided by: | | | | | | | | | | | | | | | | |
| Basic weighted average number of common shares | | | 136,763,092 | | | | 109,654,174 | | | | 126,730,500 | | | | 108,363,047 | |
| Equals: | | | | | | | | | | | | | | | | |
| Adjusted basic earnings per share | | $ | 0.05 | | | $ | 0.03 | | | $ | 0.12 | | | $ | 0.06 | |
| ii. | Average realized gold price per GEO is calculated by dividing the Company’s total revenue by the GEOs sold. The Company presents average realized gold price per GEO as it believes that certain investors use this information to evaluate the Company’s performance in comparison to other royalty and streaming companies in the precious metals mining industry that present results on a similar basis. The table below provides a reconciliation of average realized price per GEO: |
| | | Three months ended December 31, 2020 | | | Three months ended December 31, 2019 | | | Year ended December 31, 2020 | | | Year ended December 31, 2019 | |
| Total revenue | | $ | 16,569 | | | $ | 10,499 | | | $ | 51,681 | | | $ | 33,712 | |
| | | | | | | | | | | | | | | | | |
| Divided by: | | | | | | | | | | | | | | | | |
| GEOs sold1[10] | | | 8,836 | | | | 7,096 | | | | 28,916 | | | | 24,021 | |
| Equals: | | | | | | | | | | | | | | | | |
| Average realized gold price per GEO | | $ | 1,875 | | | $ | 1,480 | | | $ | 1,787 | | | $ | 1,403 | |
| iii. | Average cash cost per GEO is calculated by dividing the Company’s cost of sales, excluding depletion, by the GEOs sold. The Company presents average cash cost per GEO as it believes that certain investors use this information to evaluate the Company’s performance in comparison to other royalty and streaming companies in the precious metals mining industry who present results on a similar basis. The table below provides a reconciliation of average cash cost per GEO: |
| | | Three months ended December 31, 2020 | | | Three months ended December 31, 2019 | | | Year ended December 31, 2020 | | | Year ended December 31, 2019 | |
| Cash cost of sales is comprised of: | | | | | | | | | | | | | | | | |
| Cost of sales, excluding depletion | | $ | 1,628 | | | $ | 1,215 | | | $ | 5,020 | | | $ | 3,927 | |
| Divided by: | | | | | | | | | | | | | | | | |
| GEOs sold | | | 8,836 | | | | 7,096 | | | | 28,916 | | | | 24,021 | |
| Equals: | | | | | | | | | | | | | | | | |
| Average cash cost per GEO | | $ | 184 | | | $ | 171 | | | $ | 174 | | | $ | 163 | |
| iv. | Cash operating margin is calculated by subtracting the average cash cost per GEO from the average realized gold price per GEO. The Company presents cash operating margin as it believes that certain investors use this information to evaluate the Company’s performance in comparison to other royalty and streaming companies in the precious metals mining industry that present results on a similar basis. |
| | | |
| | v. | The Company has also used the non-IFRS measure of operating cash flows excluding changes in non-cash working capital. This measure is calculated by adding back the decrease or subtracting the increase in changes in non-cash working capital to or from cash provided by operating activities. |
Liquidity and Capital Resources
As at December 31, 2020, the Company had cash and cash equivalents of $7.8 million (December 31, 2019: $4.8 million) and working capital of $35.1 million (December 31, 2019: $19.9 million). As at December 31, 2020, the Company had $88.0 million available under its credit facility. In February 2021 after receiving $50.0 million from the Hope Bay Buyback, the Company repaid the $32.0 million outstanding under the credit facility at December 31, 2020, leaving the full $120.0 million available.
Cash flow from operations
For the year ended December 31, 2020, cash flow from operations was $33.0 million, compared with $21.0 million for the year ended December 31, 2019, with the increase primarily attributable to the Company’s growing portfolio of cash flowing Royalties and Streams and a 27% increase in the realized gold price per GEO, as previously discussed in more detail.
1The Company’s royalty revenue and silver sales are converted to a GEO basis by dividing the royalty revenue plus silver sales for a period by the average gold price based on the LBMA Gold Price PM Fix per ounce for the same respective period. Total GEOs sold includes the GEOs from the Company’s royalty revenue and silver sales plus the gold ounces sold from the Company’s gold Stream.
Cash flow used in investing activities
For the year ended December 31, 2020, the Company had net cash outflows of $0.6 million from investing activities primarily due to cash consideration for the Newmont Royalty Portfolio, the purchase of investments and the income taxes paid of $2.8 million from the Beta Hunt Royalty Amendment. This was partially offset by $12.0 million in ROFR proceeds received in connection with the acquisition of the Kinross royalty portfolio and net proceeds from the closing of the Beta Hunt Royalty Amendment. During the year ended December 31, 2019, the Company had net cash outflows from investing activities of $76.3 million primarily from the cash portion of the consideration for the Kinross royalty portfolio and the purchase of the additional 1.5% NSR royalty on the Hope Bay mine and the El Mochito Stream.
Cash flow (used in) from financing activities
During the year ended December 31, 2020, the Company had net cash outflows from financing activities of $29.5 million, which was primarily the result of Company repaying $57.0 million of its credit facility, dividend payments of $6.4 million and financing costs associated with our credit facility of $2.3 million. The net cash outflows were partially offset by the drawdown of $20.0 million from the Company’s credit facility and net proceeds received from the exercise of warrants by Pan American and stock options. During the year ended December 31, 2019, the Company had net cash inflows from financing activities of $55.2 million, which was primarily the result of drawdowns on the credit facility to fund or partially fund the cash consideration paid for the acquisition of the Kinross Portfolio, the Additional Royalty and Bonus Royalty on the Hope Bay mine and the El Mochito Stream. The cash inflows were partially offset by repayment of the Company’s credit facility and financing costs associated with amending the Company’s credit facility agreement.
Liquidity
We believe our current financial resources and funds generated from operations will be adequate to cover anticipated expenditures for general and administration and project evaluation costs and anticipated minimal capital expenditures for the foreseeable future. Our long-term capital requirements are primarily affected by our ongoing activities related to the acquisition or creation of Royalties and Streams.
The Company currently, and generally at any time, has acquisition opportunities in various stages of active review. In the event of the acquisition of one or more significant Royalties or Streams, we may seek additional debt or equity financing as necessary.
Purchase Commitments:
In connection with its Streams, the Company has committed to purchase the following:
| | | Percent of life of mine production | | | Per ounce cash payment: Lesser of amount below and the then prevailing market price (unless otherwise noted) | |
| Gold Stream interests | | | | | | | | |
| La Bolsa | | | 5 | % | | $ | 450 | |
| La Colorada | | | 100 | % | | $ | 650 | |
| | | | | | | | | |
| Silver Stream interests | | | | | | | | |
| El Mochito | | | 22.5 | %(1) | | | 25% of silver spot price | |
| Moss | | | 100 | %(2) | | | 20% of silver spot price | |
| (1) | If 3.0 million ounces of silver are delivered to Maverix prior to April 1, 2022, Maverix’s silver purchase entitlement will be 20% of life of mine silver production. |
| (2) | After 3.5 million ounces of silver are delivered, Maverix’s silver purchase entitlement will be 50% of the remaining life of mine silver production. |
In connection with the acquisition of the Silvertip Royalty in 2017, the Company may issue an additional 1,400,000 common shares of the Company when the Silvertip mine achieves commercial production and a cumulative throughput of 400,000 tonnes of ore through the processing plant is achieved.
Off-Balance Sheet Arrangements
The Company does not utilize off-balance sheet arrangements.
Related Party Transactions
Key management personnel are those persons having authority and responsibility for planning, directing and controlling the activities, including any director of the Company. Compensation for key management personnel of the Company was as follows:
| | | Year ended
December 31, 2020 | | | Year ended
December 31, 2019 | |
| Compensation and benefits | | $ | 3,632 | | | $ | 2,530 | |
| Share-based compensation | | | 1,532 | | | | 1,471 | |
| Total compensation | | $ | 5,164 | | | $ | 4,001 | |
During the years ended December 31, 2020 and 2019, the Company purchased $2.3 million and $2.4 million, respectively, of refined gold from Pan American at a price of $650 per ounce purchased under its La Colorada gold Stream agreement. As a consequence of its shareholding and other factors, Pan American is deemed to have significant influence over the Company.
The Company completed the acquisition of the Newmont Royalty Portfolio during the year ended December 31, 2020. As a consequence of its shareholding and other factors, Newmont is deemed to have significant influence over the Company.
Critical Accounting Judgements and Estimates
The preparation of the consolidated financial statements in conformity with IFRS requires the Company’s management to make judgments, estimates and assumptions that affect the amounts reported in the consolidated financial statements. Estimates and assumptions are based on management’s best knowledge of the relevant facts and circumstances. However, actual results may differ from those estimates included in the consolidated financial statements.
The Company’s significant accounting policies and estimates are disclosed in Notes 2 and 3 of the Consolidated Financial Statements.
Financial Instruments
The Company has exposure to a variety of financial risks from its use of financial instruments. This note presents information about the Company's exposure to each of these risks, the Company's objectives, policies and processes for measuring and managing risk, and the Company's management of capital.
Capital Risk Management
The Company’s primary objective when managing capital is to maximize returns for its shareholders by growing its asset base through accretive acquisitions of royalties, streams and other interests, while optimizing its capital structure by balancing debt and equity. At December 31, 2020, the capital structure of the Company consists of $341.0 million (December 31, 2019: $241.7 million) of total equity, comprising share capital, reserves, accumulated other comprehensive income, and retained earnings (deficit), and $32.0 million (December 31, 2019: $69.0 million) drawn under the Company’s credit facility. The Company was not subject to any externally imposed capital requirements with the exception of complying with certain covenants under the credit facility. The Company is in compliance with its debt covenants as at December 31, 2020.
Credit Risk
Credit risk is the risk of potential loss to the Company if the counterparty to a financial instrument fails to meet its contractual obligations. The Company's credit risk is primarily attributable to its liquid financial assets including cash and cash equivalents and accounts receivables in the ordinary course of business. In order to mitigate its exposure to credit risk, the Company maintains its cash and cash equivalents in several high-quality financial institutions and closely monitors its accounts receivable balances. The Company’s accounts receivable are subject to the credit risk of the counterparties who own and operate the mines underlying Maverix’s royalty portfolio.
Currency Risk
Financial instruments that affect the Company’s net income due to currency fluctuations include cash and cash equivalents, accounts receivable, investments, trade payables and other denominated in Canadian and Australian dollars. Based on the Company’s Canadian and Australian dollar denominated monetary assets and liabilities at December 31, 2020, a 10% increase (decrease) of the value of the Canadian and Australian dollar relative to the US dollar would increase (decrease) net income by $0.3 million and other comprehensive income by $1.8 million, respectively.
Liquidity Risk
Liquidity risk is the risk that the Company will not be able to meet its financial obligations as they come due. The Company’s approach to managing liquidity is to ensure it will have sufficient liquidity to meet liabilities when due. In managing liquidity risk, the Company considers anticipated cash flows from operations and its holding of cash and cash equivalents. As at December 31, 2020, the Company had cash and cash equivalents of $7.8 million (December 31, 2019: $4.8 million) and working capital of $35.1 million (December 31, 2019: $19.9 million). In addition, at December 31, 2020 the Company had $88.0 million available under its credit facility. In February 2021, the Company repaid the $32.0 million outstanding under the credit facility at December 31, 2020, leaving the full $120.0 million available.
Other Risks
The Company is exposed to equity price risk as a result of holding common shares in other mining companies. The combined fair market value as at December 31, 2020 is $18.2 million (December 31, 2019: $7.1 million). The equity prices of investments are impacted by various underlying factors including commodity prices and the volatility in global markets as a result of COVID-19 and the daily exchange traded volume of the equity may not be sufficient for the Company to liquidate its position in a short period of time without potentially affecting the market value of the equity. Based on the Company’s investments held as at December 31, 2020, a 10% increase (decrease) in the equity prices of these investments would increase (decrease) other comprehensive income by $1.8 million.
Outstanding Share Data
As at March 22, 2021, the Company had 141,007,812 outstanding common shares, 3,479,533 outstanding share purchase options outstanding with a weighted average exercise price of CAD$4.34, 192,694 outstanding restricted share units, and 10,000,000 outstanding share purchase warrants with a weighted average exercise price of $2.84.
Risks and Uncertainties
A few of the primary risk factors affecting the Company are set forth below. For a full discussion of risk factors, please refer to the section “Risk Factors” contained in the Company’s Annual Information Form (“AIF”) available under the Company’s profile on SEDAR at www.sedar.com and on EDGAR at www.sec.gov.
Public Health Crises, including the COVID-19 Pandemic may Significantly Impact Maverix
Maverix’s business, operations and financial condition could be materially adversely affected by public health crises, including epidemics, pandemics and or other health crises, such as the outbreak of COVID-19. The current COVID-19 global health pandemic is significantly impacting the global economy and commodity and financial markets. The full extent and impact of the COVID-19 pandemic is unknown and to date has included extreme volatility in financial markets, a slowdown in economic activity, extreme volatility in commodity prices (including precious metals) and has raised the prospect of a global recession. The international response to COVID-19 has led to significant restrictions on travel, temporary business closures, quarantines, global stock market volatility and a general reduction in consumer activity, globally. Public health crises, such as the COVID-19 outbreak, can result in operating, supply chain and project development delays that can materially adversely affect the operations of third parties in which Maverix has an interest. Mining operations in which Maverix holds an interest could be suspended for precautionary purposes or as governments declare states of emergency or other actions are taken in an effort to combat the spread of COVID-19. If the operation or development of one or more of the properties in which Maverix holds a royalty, stream or other interest and from which it receives or expects to receive significant revenue is suspended, it may have a material adverse impact on Maverix’s profitability, results of operations, financial condition and the trading price of Maverix’s securities.
The risks to Maverix’s business include without limitation, the risk of breach of material contracts and customer agreements, employee health, workforce productivity, increased insurance premiums, limitations on travel, the availability of industry experts and personnel, prolonged restrictive measures put in place in order to control an outbreak of contagious disease or other adverse public health developments globally and other factors that will depend on future developments beyond Maverix’s control, which may have a material and adverse effect on Maverix’s business, financial condition and results of operations. In addition, Maverix may experience business interruptions as a result of suspended or reduced operations at the mines in which Maverix has an interest, relating to the COVID-19 outbreak or such other events that are beyond the control of Maverix, which could in turn have a material adverse impact on Maverix’s business, operating results, financial condition and the market for its securities. As at the date of this MD&A, the duration of any business disruptions and related financial impact of the COVID-19 outbreak cannot be reasonably estimated. It is unknown whether and how Maverix may be affected if such pandemic, such as the COVID-19 outbreak, persists for an extended period of time.
Maverix Has No Control Over Mining Operations
Maverix is not directly involved in the operation of mines. The revenue Maverix may derive from its portfolio of Royalty and Stream assets is based on production from third party mine owners and operators. Maverix will enter into precious metal purchase agreements to purchase a certain percentage of precious metals or other metals produced by certain mines and operations and Maverix expects to receive payments under Royalty agreements from certain mines and operations, however, Maverix will not have a direct interest in the operation or ownership of those mines and projects. The owners and operators generally will have the power to determine the manner in which the properties are exploited, including decisions to expand, continue or reduce, suspend or discontinue production from a property, decisions about the marketing of products extracted from the property and decisions to advance exploration efforts and conduct development of non-paying properties. The interests of third-party owners and operators and those of Maverix in respect of a relevant project or property may not always be aligned. The inability of Maverix to control the operations for the properties in which it has a Royalty, Stream or other interest may result in a material adverse effect on the profitability of Maverix, the results of operations of Maverix and its financial condition. Except in a limited set of circumstances as specified in a specific Royalty or Stream, Maverix will not receive compensation if a specific mine or operation fails to achieve or maintain production or if the specific mine or operation is closed or discontinued. In addition, mining operations in respect of which Maverix holds an indirect interest may not commence commercial production and there can be no assurance that such mines or project will achieve profitable and continued production levels. In addition, the owners or operators may take action contrary to policies or objectives of Maverix; be unable or unwilling to fulfill their obligations under their agreements with Maverix; have difficulty obtaining or be unable to obtain the financing necessary to move projects forward; or experience financial, operational or other difficulties, including insolvency, which could limit the owner or operator’s ability to perform its obligations under arrangements with Maverix. Maverix is also subject to the risk that a specific mine or project may be put on care and maintenance or have its operations suspended, on both a temporary or permanent basis.
The owners or operators of the projects or properties in which Maverix holds an interest may from time to time announce transactions, including the sale or transfer of the projects or of the operator itself, over which Maverix has little or no control. If such transactions are completed it may result in a new operator controlling the project, who may or may not operate the project in a similar manner to the current operator which may positively or negatively impact Maverix. If any such transaction is announced, there is no certainty that such transaction will be completed, or completed as announced, and any consequences of such non-completion on Maverix may be difficult or impossible to predict.
Changes in Commodity Prices that underlie Royalty, Stream or Other Interests
The price of Maverix’s Common Shares may be significantly affected by declines in commodity prices. The revenue derived by Maverix from its asset portfolio will be significantly affected by changes in the market price of commodities that underlie the Royalty, Stream or other investments or interests of Maverix. Maverix’s revenue is particularly sensitive to the changes in the price of gold and silver. The cash flows and revenues derived by Maverix from its asset portfolio are dependent on the price of gold and gold production from those assets. The price of gold and other commodities fluctuates daily and are affected by factors beyond the control of Maverix, including levels of supply and demand, industrial development, inflation and interest rates, the U.S. dollar’s strength and geopolitical events. External economic factors that affect commodity prices can be influenced by changes in international investment patterns, monetary systems and political developments.
All commodities, by their nature, are subject to wide price fluctuations and future material price declines will result in a decrease in revenue or, in the case of severe prolonged declines that cause a suspension or termination of production by relevant operators, a complete cessation of revenue from Royalties, Streams or working interests applicable to one or more relevant commodities. While Maverix has focused on assembling a portfolio of assets that provide primary exposure to gold and silver production and prices, the commodity market trends are cyclical in nature and a general downturn in commodity prices could result in a significant decrease in overall revenue.
Third Party Reporting
Maverix relies on public disclosure and other information regarding specific mines or projects that is received from the owners or operators of the mines or other independent experts. The information received may be susceptible to being imprecise as the result of it being compiled by certain third parties. The disclosure created by Maverix may be inaccurate if the information received contains inaccuracies or omissions, which could create a material adverse effect on Maverix. In addition, a Royalty or Stream agreement may require an owner or operator to provide Maverix with production and operating information that may, depending on the completeness and accuracy of such information, enable Maverix to detect errors in the calculation of Royalty or Stream amounts owed. As a result, the ability of Maverix to detect payment errors through its associated internal controls and procedures is limited, and the possibility exists that Maverix will need to make retroactive adjustments. Of the Royalty or Stream agreements that Maverix enters into, some may provide Maverix the right to audit the operational calculations and production data for associated payments; however, such audits may occur many months following the recognition by Maverix of the applicable revenue and may require Maverix to adjust its revenue in later periods. As a holder of an interest in a Royalty or Stream, Maverix will have limited access to data on the operations or to the actual properties underlying the Royalty or Stream. This limited access to data or disclosure regarding operations could affect the ability of Maverix to assess the performance of the Royalty or Stream. This could result in delays in cash flow from that which is anticipated by Maverix based on the stage of development of the properties covered by the assets within the portfolio of Maverix.
Environmental Risks
All phases of mine operation or development are subject to governmental regulation including environmental regulation in the various jurisdictions in which they operate. Environmental legislation is evolving in a manner which will require stricter standards and enforcement, increased fines and penalties for non-compliance, more stringent environmental assessments of proposed projects and heightened responsibility for companies and their officers, directors and employees. There is no assurance that future changes in environmental regulation, if any, will not adversely affect the mines and projects in which Maverix has an interest and consequently, the results of Maverix’s operations. Also, unknown environmental hazards may exist on the properties at present which were caused by previous or existing owners or operators of the properties and which could impair the commercial success, levels of production and continued feasibility and project development and mining operations on these properties. One or more of the mining companies may become liable for such environmental hazards caused by previous owners or operators of the properties.
Failure to comply with applicable laws, regulations and permitting requirements may result in enforcement actions thereunder, including orders issued by regulatory or judicial authorities causing operations to cease or be curtailed, and may include corrective measures requiring capital expenditures, installation of additional equipment or remedial actions. Parties engaged in mining operations or in the exploration or development of mineral properties may be required to compensate those suffering loss or damage by reason of the mining activities and may have civil or criminal fines or penalties imposed for violations of applicable laws or regulations. The occurrence of any environmental violation or enforcement action may have an adverse impact on the operations at the mines and projects in which Maverix has an interest in, Maverix’s reputation and could adversely affect Maverix’s results of operations.
Disclosure Controls and Procedures
The Company’s management, with the participation of its Chief Executive Officer (“CEO”) and its Chief Financial Officer (“CFO”), have evaluated the effectiveness of the Company’s disclosure controls and procedures, as defined in the rules of the U.S. Securities Exchange Commission and Canadian Securities Administrators. Based upon the results of that evaluation, the Company’s CEO and CFO have concluded that, as of December 31, 2020, the Company’s disclosure controls and procedures were effective to provide reasonable assurance that the information required to be disclosed by the Company in reports it files is recorded, processed, summarized and reported, within the appropriate time periods and is accumulated and communicated to management, including the CEO and CFO, as appropriate to allow timely decisions regarding required disclosure.
Internal Controls Over Financial Reporting
Management of the Company is responsible for establishing and maintaining effective internal control over financial reporting as such term is defined in National Instrument 52-109 – Certification of Disclosure in Issuer’s Annual and Interim Filings in Canada (“NI 52-109”) and under the Securities Exchange Act of 1934, as amended, in the United States. The Company’s internal control over financial reporting is designed to provide reasonable assurance regarding the reliability of the Company’s financial reporting for external purposes in accordance with IFRS as issued by the IASB. The Company’s internal control over financial reporting includes:
| · | maintaining records, that in reasonable detail, accurately and fairly reflect our transactions and dispositions of the assets of the Company; |
| · | providing reasonable assurance that transactions are recorded as necessary for preparation of the consolidated financial statements in accordance with IFRS as issued by the IASB; |
| · | providing reasonable assurance that receipts and expenditures are made in accordance with authorizations of management and the directors of the Company; and |
| · | providing reasonable assurance that unauthorized acquisition, use or disposition of Company assets that could have a material effect on the Company’s consolidated financial statements would be prevented or detected on a timely basis. |
The Company’s internal control over financial reporting may not prevent or detect all misstatements because of inherent limitations. Additionally, projections of any evaluation of effectiveness to future periods are subject to the risk that controls may become inadequate because of changes in conditions or deterioration in the degree of compliance with the Company’s policies and procedures. Management assessed the effectiveness of the Company’s internal control over financial reporting as of December 31, 2020 based on the criteria set forth in Internal Control — Integrated Framework (2013) issued by the Committee of Sponsoring Organizations of the Treadway Commission (COSO). Based on this assessment, management has concluded that, as of December 31, 2020 the Company’s internal control over financial reporting is effective and no material weaknesses were identified.
There were no changes to the Company’s internal controls over financial reporting during the year ended December 31, 2020 that have materially affected, or are likely to materially affect, the Company’s internal control over financial reporting or disclosure controls and procedures.
Limitation of Controls and Procedures
The CEO and CFO, in consultation with management, believe that any disclosure controls and procedures or internal control over financial reporting, no matter how well conceived and operated, can provide only reasonable, not absolute, assurance that the objectives of the control system are met. Further, the design of a control system must reflect the fact that there are resource constraints, and the benefits of controls must be considered relative to their costs. Because of the inherent limitations in all control systems, they cannot provide absolute assurance that all control issues and instances of fraud, if any, within the Company have been prevented or detected. These inherent limitations include the realities that judgments in decision-making can be faulty, and that breakdowns can occur because of simple error or mistake. Additionally, controls can be circumvented by the individual acts of some persons, by collusion of two or more people, or by unauthorized override of the controls. The design of any system of controls also is based in part upon certain assumptions about the likelihood of future events, and there can be no assurance that any design will succeed in achieving its stated goals under all potential future conditions. Accordingly, because of the inherent limitations in a cost-effective control system, misstatements due to error or fraud may occur and not be detected.
Forward-Looking Statements
This MD&A contains “forward-looking information” or "forward-looking statements" within the meaning of applicable securities legislation. Forward-looking information is provided as of the date of this MD&A and Maverix does not intend to and does not assume any obligation to update forward-looking information, except as required by applicable law. For this reason and the reasons set forth below, investors should not place undue reliance on forward-looking statements.
Generally, forward-looking information can be identified by the use of forward-looking terminology such as “plans”, “expects” or “does not expect”, “is expected”, “budget, “scheduled”, “estimates”, “forecasts”, “intends”, “anticipates” or “does not anticipate”, or “believes” or variations of such words and phrases or statements that certain actions, events or results “may”, “could”, “would”, “might” or “will be taken”, “occur” or “be achieved”. Forward-looking information is based on reasonable assumptions that have been made by Maverix as at the date of such information and is subject to known and unknown risks, uncertainties and other factors that may cause the actual results, level of activity, limited to: the impact of general business and economic conditions; the absence of control over mining operations from which Maverix will purchase precious metals or from which it will receive stream or royalty payments, and risks related to those mining operations, including risks related to international operations, government and environmental regulation, delays in mine construction and operations, actual results of mining and current exploration activities, conclusions of economic evaluations and changes in project parameters as plans are refined; problems related to the ability to market precious metals or other metals; industry conditions, including commodity price fluctuations, interest and exchange rate fluctuations; interpretation by government entities of tax laws or the implementation of new tax laws; the volatility of the stock market; competition; risks related Maverix’s dividend policy; the potential impact of epidemics, pandemics or other public health crises, including the current outbreak of novel coronavirus (COVID-19), on the Company's business, operations and financial condition; also, those risk factors discussed in this MD&A and under the heading “Risk Factors” in the Company’s AIF for the year ended December 31, 2020 available at www.sedar.com and www.sec.gov.
Forward-looking information in this MD&A includes disclosure regarding payments to Maverix pursuant to Royalties and Streams by owners or operators of the underlying mining operations or projects. Forward-looking statements are based on a number of material assumptions, which management of Maverix believe to be reasonable, including, but not limited to, the continuation of mining operations in respect of which Maverix will receive Royalty payments or from which it will purchase precious or other metals, that commodity prices will not experience a material adverse change, mining operations that underlie Royalties or Streams will operate in accordance with disclosed parameters and such other assumptions as may be set out herein.
Although Maverix has attempted to identify important factors that could cause actual results to differ materially from those contained in forward-looking information, there may be other factors that cause results to not be as anticipated, estimated or intended. There can be no assurance that such information will prove to be accurate, as actual results and future events could differ materially from those anticipated in such information. Accordingly, readers should not place undue reliance on forward-looking information. Readers of this MD&A should carefully review the risk factors set out in this MD&A and those risk factors that are set out in the AIF under the heading “Risk Factors”.
Technical and Third-Party Information
Brendan Pidcock, P.Eng., Vice President Technical Services for Maverix and a qualified person as defined under NI 43-101 has reviewed and approved the written scientific and technical disclosure contained in this document.
Except where otherwise stated, the disclosure in this MD&A relating to properties and operations in which Maverix holds Royalty, Stream or other interests is based on information publicly disclosed by the owners or operators of these properties and information/data available in the public domain as at the date hereof, and none of this information has been independently verified by Maverix. Specifically, as a Royalty or Stream holder, Maverix has limited, if any, access to properties on which it holds Royalties, Streams, or other interests in its asset portfolio. The Company may from time to time receive operating information from the owners and operators of the mining properties, which it is not permitted to disclose to the public. Maverix is dependent on, (i) the operators of the mining properties and their qualified persons to provide information to Maverix, or (ii) on publicly available information to prepare disclosure pertaining to properties and operations on the properties on which the Company holds Royalty, Stream or other interests, and generally has limited or no ability to independently verify such information. Although the Company does not have any knowledge that such information may not be accurate, there can be no assurance that such third-party information is complete or accurate. Some reported public information in respect of a mining property may relate to a larger property area than the area covered by Maverix’s Royalty, Stream or other interest. Maverix’s Royalty, Stream or other interests may cover less than 100% of a specific mining property and may only apply to a portion of the publicly reported mineral reserves, mineral resources and or production from a mining property.