Life is Complex.
Nuveen makes things e-simple.
It only takes a minute to sign up for e-Reports. Once enrolled, you’ll receive an e-mail as soon as your Nuveen Fund information is ready—no more waiting for delivery by regular mail. Just click on the link within the e-mail to see the report and save it on your computer if you wish.
Free e-Reports
right to your e-mail!
www.investordelivery.com
If you receive your Nuveen Fund
dividends and statements from your
financial advisor or brokerage account.
or
www.nuveen.com/client-access
If you receive your Nuveen Fund
dividends and statements directly from
Nuveen.
NOT FDIC INSURED MAY LOSE
VALUE NO BANK GUARANTEE
Table of Contents
| | |
Chair’s Letter to Shareholders | 4 |
| | |
Portfolio Managers’ Comments | 5 |
| | |
Fund Leverage | 10 |
| | |
Common Share Information | 12 |
| | |
Risk Considerations | 15 |
| | |
Performance Overview and Holding Summaries | 16 |
| | |
Shareholder Meeting Report | 24 |
| | |
Report of Independent Registered Public Accounting Firm | 25 |
| | |
Portfolios of Investments | 26 |
| | |
Statement of Assets and Liabilities | 132 |
| | |
Statement of Operations | 133 |
| | |
Statement of Changes in Net Assets | 134 |
| | |
Statement of Cash Flows | 136 |
| | |
Financial Highlights | 138 |
| | |
Notes to Financial Statements | 144 |
| | |
Additional Fund Information | 161 |
| | |
Glossary of Terms Used in this Report | 162 |
| | |
Reinvest Automatically, Easily and Conveniently | 164 |
| | |
Annual Investment Management Agreement Approval Process | 165 |
| | |
Board Members & Officers | 178 |
3
Chair’s Letter
to Shareholders
Dear Shareholders,
Financial markets have been receiving mixed messages over the past year. The global economy has bifurcated, split between a slumping manufacturing sector and a resilient consumer. Confidence has been weakened among corporate managements, who are wary of trade frictions and moderating global growth, but has remained elevated among consumers, who have benefited from tight labor markets and growing wages. As the economic cycle advances toward its later stage, corporate profits are shrinking and earnings forecasts are being downgraded. A waning growth outlook has held interest rates near historically low levels, while stock market indexes have overcome periodic volatility to touch historical highs.
While we continue to anticipate slower economic growth and increased market volatility, we note that recession fears have receded from earlier in the year. The U.S. economy held steady in the third quarter, and nearer-term economic indicators have provided upside surprises. Consumer confidence remains underpinned by low unemployment and modest wage growth. Looser financial conditions, in part driven by the Federal Reserve’s three interest rate cuts in 2019, have revived momentum in the housing market and should continue to encourage borrowing by consumers and businesses. Outside the U.S., Germany avoided a recession in the second half of 2019 and other eurozone economic indicators are pointing to stabilization and improving sentiment. Consumers in Europe and Japan, like those in the U.S., have remained supported by jobs growth and rising wages. Although the outcomes of trade, Brexit and other geopolitical concerns continue to be uncertain, some clarity on these issues could be a potential source of upside.
At Nuveen, we still see investment opportunities in the maturing economic environment, but we are taking a selective approach. If you’re concerned about where the markets are headed from here, we encourage you to work with your financial advisor to review your time horizon, risk tolerance and investment goals. On behalf of the other members of the Nuveen Fund Board, we look forward to continuing to earn your trust in the months and years ahead.
Sincerely,
Terence J. Toth
Chair of the Board
December 23, 2019
4
Portfolio Managers’ Comments
Nuveen AMT-Free Municipal Credit Income Fund (NVG)
Nuveen Municipal Credit Income Fund (NZF)
Nuveen Municipal High Income Opportunity Fund (NMZ)
Nuveen Municipal Credit Opportunities Fund (NMCO)
These Funds feature portfolio management by Nuveen Asset Management, LLC (NAM), an affiliate of Nuveen, LLC. Portfolio managers John V. Miller, CFA, Steve M. Hlavin, Paul L. Brennan, CFA, Scott R. Romans, PhD and discuss U.S. economic and municipal market conditions, key investment strategies and the twelve-month performance of NVG, NZF and NMZ and the performance of NMCO in the abbreviated reporting period since its inception on September 16, 2019. Paul has managed NVG since 2006, Scott assumed portfolio management responsibility for NZF in 2016, John has managed NMZ since its inception in 2003 and John and Steve have managed NMCO since its inception.
During May and October 2019, the Board of Trustees and Shareholders approved the merger of the Nuveen Connecticut Quality Municipal Income Fund (NTC) to the acquiring Fund, the Nuveen AMT-Free Municipal Credit Income Fund (NVG). The merger was completed prior to the open of business on November 18, 2019 (subsequent to the close of this reporting period).
What factors affected the U.S. economy and the national municipal market during the twelve-month reporting period ended October 31, 2019?
The U.S. economy reached the tenth year of expansion since the previous recession ended in June 2009, marking the longest expansion in U.S. history. In the third quarter of 2019, gross domestic product (GDP) grew at an annualized rate of 2.1%, according to the “second” estimate by the Bureau of Economic Analysis. GDP measures the value of goods and services produced by the nation’s economy less the value of the goods and services used up in production, adjusted for price changes. Growth in consumer spending and the housing sector helped offset a decline in business investment during the July to September 2019 period. By comparison, annualized GDP growth was 2.0% in the second quarter and 3.1% in the first quarter.
Consumer spending, the largest driver of the economy, remained well supported by low unemployment, wage gains and tax cuts. As reported by the Bureau of Labor Statistics, the unemployment rate fell to 3.6% in October 2019 from 3.8% in October 2018 and job gains averaged around 174,000 per month for the past twelve months. As the jobs market has tightened, average hourly earnings grew at an annualized rate of 3.0% in October 2019. However, falling energy prices dampened inflation over the past twelve months. The Bureau of Labor Statistics said the Consumer Price Index (CPI) increased 1.8% over the twelve-month reporting period ended October 31, 2019 before seasonal adjustment.
This material is not intended to be a recommendation or investment advice, does not constitute a solicitation to buy, sell or hold a security or an investment strategy and is not provided in a fiduciary capacity. The information provided does not take into account the specific objectives or circumstances of any particular investor, or suggest any specific course of action. Investment decisions should be made based on an investor’s objectives and circumstances and in consultation with his or her advisors.Certain statements in this report are forward-looking statements. Discussions of specific investments are for illustration only and are not intended as recommendations of individual investments. The forward-looking statements and other views expressed herein are those of the portfolio managers as of the date of this report. Actual future results or occurrences may differ significantly from those anticipated in any forward-looking statements, and the views expressed herein are subject to change at any time, due to numerous market and other factors. The Funds disclaim any obligation to update publicly or revise any forward-looking statements or views expressed herein.
The ratings disclosed are the lowest rating given by one of the following national rating agencies: Standard & Poor’s Group (S&P), Moody’s Investors Service, Inc. (Moody’s) or Fitch, Inc. (Fitch). Credit ratings are subject to change. AAA, AA, A and BBB are investment grade ratings, while BB, B, CCC, CC, C and D are below investment grade ratings. Holdings designated N/R are not rated by these national rating agencies.
Bond insurance guarantees only the payment of principal and interest on the bond when due, and not the value of the bonds themselves, which will fluctuate with the bond market and the financial success of the issuer and the insurer. Insurance relates specifically to the bonds in the portfolio and not to the share prices of a Fund. No representation is made as to the insurers’ ability to meet their commitments.
Refer to the Glossary of Terms Used in this Report for further definition of the terms used within this section.
5
Portfolio Managers’ Comments (continued)
Low mortgage rates and low inventory drove home prices moderately higher in this reporting period, despite declining new home sales and housing starts. The S&P CoreLogic Case-Shiller U.S. National Home Price Index, which covers all nine U.S. census divisions, was up 3.2% year-over-year in September 2019 (most recent data available at the time this report was prepared). The 10-City and 20-City Composites reported year-over-year increases of 1.5% and 2.1%, respectively.
As data pointed to slower momentum in the overall economy, the Federal Reserve (Fed) notably shifted its stance. Although the Fed had indicated in December 2018 that there could be two more rate hikes in 2019, global growth concerns kept the central bank on the sidelines. As expected by the markets, the Fed left rates unchanged throughout the first half of 2019 while speculation increased that the Fed’s next move would be a rate cut. At the July 2019, September 2019 and October 2019 policy committee meetings, the Fed announced a 0.25% cut to its main policy rate. Markets registered disappointment with the Fed’s explanation that the rate cuts were a “mid-cycle adjustment,” rather than a prolonged easing period, and its signal that there would be no additional rate cuts in 2019. Also in the latter half of 2019, the Fed announced it would stop shrinking its bond portfolio sooner than scheduled, as well as began buying short-term Treasury bills to help money markets operate smoothly and maintain short-term borrowing rates at low levels. Fed Chairman Powell emphasized that the Treasury bill purchases were not a form of quantitative easing.
During the twelve-month reporting period, geopolitical news remained a prominent market driver. Tariff and trade policy topped the list of concerns, most prominently the U.S.-China relations. After several rounds of talks and a series of tariff increases, President Trump and President Xi agreed to another temporary trade truce in late June 2019 that halted additional tariff increases. Tensions increased markedly after the July 2019 negotiations ended without an agreement, with both China and the U.S. increasing import duties. After setting new trade meetings in September and October 2019, tariff waivers were announced on a selected group of U.S. and Chinese goods and the two sides signaled progress toward a partial trade deal. The U.S., Mexico and Canada Agreement (USMCA) trade deal replacing the North American Free Trade Agreement had yet to be ratified by the national congresses (subsequent to the close of the reporting period, the trade deal was passed by the House of Representatives), while President Trump rescinded the threat to impose tariffs on Mexico if the country didn’t take more action to curb illegal immigration. With the U.S. House of Representatives opening an impeachment inquiry into President Trump, ratification of the USMCA deal was expected to be delayed. The Trump administration delayed imposing auto tariffs on the European Union (EU), as it continued to focus more on the China trade negotiations, but duties on $7.5 billion worth of EU goods including wine and cheese went into effect in October 2019 in retaliation for a dispute over aircraft subsidies. Global manufacturing and export data continued to show evidence of trade-related slumps, which increased worries that the slowdown would spread into other segments of the global economy.
In the U.K., Prime Minister Theresa May was unable to secure a Brexit deal before the original March 29, 2019 deadline and resigned as of June 7, 2019. The EU extended the deadline to October 31, 2019, which Prime Minister May’s successor, Boris Johnson, was unable to meet after a series of political maneuvers failed to secure an approval for his exit plan. In October 2019, the EU approved a “flextension” to January 31, 2020 and a U.K. general election was scheduled for December (subsequent to the close of the reporting period, on December 19, 2019, the British Parliament passed the Brexit Bill). In Italy, investors worried about another potential budget clash between the eurosceptic coalition government and the EU. However, following the unexpected resignation of the prime minister in August 2019, the newly formed coalition government appeared to take a less antagonistic stance. Europe also contended with the “yellow vest” protests in France, immigration policy concerns, Russian sanctions and political risk in Turkey.
Elections around the world also remained a source of uncertainty. Markets continued to closely monitor the new administrations in Brazil and Mexico, as well as Argentina’s presidential election. Incumbent candidate President Macri, seen as market-friendly, suffered a surprising defeat in the August 2019 primary, and the Peronist ticket of Alberto Fernandez/Cristina Fernandez de Kirchner won as expected in the October 2019 election. Europe’s traditional centrist parties lost seats in the Parliamentary elections and populist parties saw marginal gains. The ruling parties in India and South Africa maintained their majorities, where slower economic growth could complicate their respective reform mandates.
Municipal bonds delivered strong performance over the twelve-month reporting period. The significant decline in interest rates was the main driver of higher municipal bond prices, with positive technical and fundamental conditions also supporting credit spread tightening. At the start of the reporting period, the prevailing economic outlook was generally positive and the Fed had been increasing its main policy interest rate, driving the 10-year U.S. Treasury yield to a high of 3.24% in November 2018. However, sentiment shifted sharply at the end of 2018, causing a reversal in market conditions. Interest rates declined significantly over the remainder of the reporting period on signs of a weaker macroeconomic environment, more dovish central bank policy, geopolitical tensions (especially regarding trade) and bouts of equity market volatility. The U.S. Treasury yield curve flattened overall, with a
6
portion of the curve temporarily inverting from late August 2019 to late September 2019. The municipal yield curve also flattened overall, particularly from the 2-year to 20-year segment. Despite concerns about the broader economic outlook, credit conditions remained favorable for municipal credits. State tax revenues have increased across the 50 states and a healthy housing market added to local government tax revenues. Defaults in 2019 so far have been mainly confined to idiosyncratic situations.
Municipal bond gross issuance nationwide totaled $378.2 billion in this reporting period, a 6.9% decrease from the issuance for the twelve-month reporting period ended October 31, 2018. Nevertheless, the overall low level of interest rates encouraged issuers to continue to actively refund their outstanding debt. In these transactions the issuers are issuing new bonds and taking the bond proceeds and redeeming (calling) old bonds. These refunding transactions have ranged from 30% to 60% of total issuance over the past few years. Thus, the net issuance (all bonds issued less bonds redeemed) is actually much lower than the gross issuance. So, while gross issuance volume has been adequate, the net has not and this was an overall positive technical factor on municipal bond investment performance in recent years. Although the pace of refundings is slowing, net negative issuance is expected to continue. Notably, taxable municipal bond issuance has increased meaningfully in 2019. The Tax Cut and Jobs Act of 2017 prohibits municipal issuers from issuing new tax-exempt bonds to pre-refund existing tax-exempt bonds. However, municipalities have taken advantage of the low interest rate environment and the strong demand for yield to issue taxable municipal debt, enabling them to save on net interest costs.
Demand for municipal bonds has been robust. Cash flows into municipal bond funds have been consistently positive year-to-date in 2019. Low interest rates in the U.S. and globally have continued to drive investors toward higher after-tax yielding assets, including U.S. municipal bonds. Additionally, as tax payers have begun to assess the impact of the 2017 tax law, which caps the state and local tax (SALT) deduction for individuals, there has been increased demand for tax-exempt municipal bonds in 2019 to date, especially in states with high income and/or property taxes.
What key strategies were used to manage NVG, NZF and NMZ during the twelve-month reporting period and NMCO during the abbreviated reporting period ended October 31, 2019?
Each Fund’s primary investment objective is to provide current income exempt from regular federal income tax by investing primarily in a portfolio of municipal obligations issued by state and local government authorities or certain U.S. territories.
Municipal bond performance was strongly positive in the reporting period. Municipal yields fell across all maturities and the yield curve flattened, which resulted in the outperformance of longer maturity bonds over shorter maturity bonds. Positive credit conditions and strong demand for higher yielding assets and tax-exempt income helped credit spreads remain stable to improving.
During this time, we continued to take a bottom-up approach to discovering sectors that appeared undervalued as well as individual credits that we believed had the potential to perform well over the long term. Our trading activity continued to focus on pursuing the Funds’ investment objectives. Generally speaking, throughout this reporting period, the Funds maintained their overall positioning strategies in terms of duration and yield curve positioning, credit quality exposures and sector allocations.
In NVG, trading activity was relatively muted compared to historical norms. We considered the portfolio to be well positioned for the market conditions and, given the low interest rate environment, the opportunity set was generally less appealing. Additionally, call activity has lessened, reducing the need to reinvest cash into new names. As a result of a lower portfolio turnover in this reporting period, the duration of the underlying portfolio drifted lower (which was beneficial when interest rates rose slightly at the end of the period) and the effective leverage ratio declined. Nevertheless, we continued to trade opportunistically when attractive deals were available. Our purchases skewed slightly toward higher quality bonds as relative value opportunities were fewer among lower rated and longer duration bonds. We bought several hospital bonds (Indiana University, University of Alabama, Mosaic Health System, Essentia and Trinity), higher education (Stanford University), Puerto Rico sales tax bonds (known as COFINAs), Puerto Rico Aqueduct and Sewer Authority (PRASA) and Chicago Board of Education.
NZF added lower rated (mainly single A, BBB and BB) credits in the fourth quarter of 2018 when interest rates were higher and credit spreads were wider relative to the rest of the reporting period. Most of these additions were in hospital and health care bonds. As interest rates declined and credit spreads contracted toward the end of 2018 and throughout 2019, those opportunities dissipated. In February-March 2019, we began to rotate NZF out of tobacco settlement bonds and into Puerto Rico bonds. While the Fund’s tobacco holdings performed well in the past, we believe the credit outlook has become less favorable amid declining consumption trends and disruptive new technologies (vaping/e-cigarettes). The prospects for certain Puerto Rico credits, however, appeared more
7
attractive. PRASA has maintained sufficiently strong operations to avoid default and is expected to receive federal infrastructure funding in the coming years. COFINAs were the first major credit to exit the bankruptcy-like restructuring process and were restructured with improved security features. We purchased both PRASA and COFINA bonds during this reporting period, using the proceeds from trimming the tobacco exposure. Outside of the tobacco-Puerto Rico repositioning, the proceeds of called and maturing bonds funded most of NZF’s buying activity. We also sold some high grade “placeholder” bonds that were bought when interest rates were low and some short dated bonds that were near to rolling out of the portfolio to fund buying in new opportunities.
For NMZ, we continued to emphasize longer duration securities and maintaining the portfolio’s overall duration near its benchmark target, while seeking to add value through individual credit selection and earning high income from high yield bonds. NMZ continued to invest along its longstanding themes of project finance and improving credit stories when spreads were attractive to do so, while supporting the Fund’s income earnings. This resulted in relatively higher exposure to sectors such as hospitals, real estate-backed, charter schools and Illinois-related, and lower exposure to sectors such as tobacco securitization, Puerto Rico and senior living facilities/continuing care retirement communities. During this reporting period, we had a significant opportunity to put cash to work from the proceeds of called and maturing bonds. We bought Virgin Trains USA (formerly known as Brightline), a high-speed passenger rail system in southeastern Florida. In early 2019, Virgin Trains USA issued a large bond offering to finance the train line’s extension to Orlando, and the bond was available at attractive credit spread levels. The industrial development (IDR) revenue sector was another source of opportunity for NMZ, as attention to environmental impact has garnered more investment interest. We added a project finance bond offering an attractive tax exempt yield for Fulcrum Sierra Biofuels, a project that converts municipal solid waste into transportation fuels.
As of October 31, 2019, the Funds continued to use inverse floating rate securities. We employ inverse floaters for a variety of reasons, including duration management and income and total return enhancement. As part of our duration management strategies, NVG entered into interest rate swap agreements to help reduce price volatility risk due to movements in U.S. interest rates relative to the Fund’s benchmark. While the interest rate swaps detracted modestly from performance due to falling interest rates during this reporting period, they enabled the Fund to invest in longer duration bonds that were key contributors to performance and that helped support the Fund’s dividend. The swap position was eliminated from NVG prior to the end of the reporting period.
NMCO began operations in mid-September 2019, and since then we have worked to fully invest the Fund’s portfolio in high yielding, low- to medium-quality municipal securities (rated Baa/BBB or lower or comparable quality) that support high income earnings and offer total return potential. Consistent with the Fund’s 12-year term (terminating in 2031), NMCO sought to invest in newly and recently issued project finance revenue bonds across a range of sectors. By the end of the reporting period, NMCO held more than 75% of the portfolio in high yield bonds rated BBB and below.
How did NVG, NZF and NMZ perform during the twelve-month reporting period and NMCO perform in the abbreviated reporting period ended October 31, 2019?
The tables in each Fund’s Performance Overview and Holding Summaries section of this report provide the Funds’ total returns for the one-year, five-year, ten-year and since inception periods ended October 31, 2019. Each Fund’s total returns at net asset value (NAV) are compared with the performance of a corresponding market index.
For the twelve months ended October 31, 2019, the total returns at NAV for NVG, NZF and NMZ outperformed the return for the national S&P Municipal Bond Index. NVG and NZF outperformed the return for the secondary benchmark (composed of 60% S&P Municipal Bond Investment Grade Index and 40% S&P Municipal Bond High Yield Index), and NMZ outperformed the return on the S&P Municipal Yield Index. For the abbreviated reporting period, the total returns at NAV for NMCO underperformed the return of the S&P Municipal Yield Index.
The main drivers of NVG and NZF’s relative performance were yield curve and duration positioning, credit quality allocations and sector allocations. NVG and NZF were favorably positioned for the interest rate environment during this reporting period. The two Funds were positioned with longer durations than the benchmark, with overweights to longer duration bonds and underweights to shorter duration bonds, which was advantageous because longer bonds outperformed.
Credit ratings allocations were positive contributors to NVG and NZF’s performance but the contribution was smaller than that of duration and yield curve positioning. Both Funds emphasized medium and lower grade credit qualities over high quality bonds, which was
8
advantageous as lower rated bonds outperformed the highest grade (AAA and AA rated) paper. As interest rates fell during the reporting period, investors sought higher yields among lower rated credits, which contributed to spread tightening in the lower rated segments. NZF’s exposure to non-rated bonds was a mild detractor from performance, but the favorable positioning across the rest of the credit spectrum more than offset the small negative impact.
Sector positioning also added modestly to performance for NVG and NZF. NVG’s overweight allocations to the health care, tobacco settlement and higher education sectors were the most favorable to performance, with security selection also beneficial in each of these sectors. An underweight to the slightly outperforming aggregate tax supported sectors wasn’t noteworthy in terms of performance impact, but our security selection was strong, led by positions in Illinois and Chicago debt, New Jersey debt and American Dream Meadowlands, a retail and entertainment mega complex in New Jersey. NVG also benefited from its security selection in public power credits including Santee Cooper Electric and Oglethorpe Power. However, an overweight to the pre-refunded sector detracted as these bonds lagged due to their short duration and high credit quality. In NZF, overweight allocations to the dedicated tax sector, which includes COFINAs, and the health care sectors were advantageous as both sectors performed well. However, NZF’s underweight to the “other transportation” sector slightly detracted as the sector outperformed.
NMZ’s performance, which is primarily compared to the S&P Municipal Yield Index, continued to be driven by our bottom-up credit selection. Price appreciation, stable credit spreads and the enhanced income from NMZ’s holdings contributed to the Fund’s relative outperformance over the benchmark in this reporting period. Among NMZ’s top contributors to performance were Illinois and Chicago credits. A change in the political and governmental environments at both the state of Illinois and the city of Chicago boosted investor confidence in the state’s financial health, the funding of the Chicago Public Schools system and the overall cooperation between the city and the state. NMZ’s holdings in Chicago O’Hare airport, Chicago Board of Education and Illinois Financing Authority for Presence Health Network were beneficiaries of the improved outlook and were also among the largest positions in the Fund. Real estate development bonds were another source of outperformance. New York Liberty 3 World Trade Center bonds, financing an 85-story office tower in Manhattan, benefited from narrowing credit spreads as the project nears completion and occupancy rates reached a critical level that should enable the project to meet its debt obligation. The American Dream Meadowlands mega-mall and entertainment complex is another real estate development project that recently opened its first phase, which has supported positive investor sentiment. The health care sector also delivered strong results, as we avoided the troubled senior living facilities segment and instead owned strong performing hospitals such as the aforementioned Presence Health in Chicago, Northwestern Memorial Health (also in Chicago) and Loma Linda University Medical Center in California. Loma Linda has incurred significant debt with the multi-billion dollar reconstruction of its flagship facility, but the strength of the hospital’s reputation has underpinned the bond’s strong performance. In addition, the Loma Linda credits benefited from a generally positive outlook for the state of California and the increased scarcity value of tax exempt California debt amid the tax law changes. One of NMZ’s special situation/turnaround bonds was also a notable contributor. FirstEnergySolutions, which has been undergoing a bankruptcy reorganization, appreciated on continued progress in its debt restructuring and a favorable regulatory ruling in the state of Ohio.
There were few material detractors among NMZ’s holdings in this reporting period. Tri-Valley Learning Corp., a California charter school, had a modest negative impact as the school filed for bankruptcy and has been liquidating its assets. We consider the situation to be highly idiosyncratic and it does not alter our fundamental view of the charter school sector as a longstanding source of attractive opportunities.
During the abbreviated reporting period for NMCO, interest rates began to trend higher. Yields on high grade municipal bonds rose while yields on high yield municipal bonds were unchanged, causing credit spreads to contract on average. Although NMCO remained in the invest-up period during this time, the Fund benefited from strong results in the tobacco securitization and IDR sectors, as well as positions in FirstEnergy Solutions and U.S. Steel. Conversely, Puerto Rico Electric Power Authority (PREPA) bond prices fell due to negative headlines about the debt restructuring agreement, detracting from NMCO’s performance in the abbreviated reporting period. However, the outperformance of the aforementioned holdings more than offset the negative impact from PREPA.
In addition, the use of regulatory leverage was an important factor affecting performance of NVG, NZF and NMZ. Leverage is discussed in more detail later in the Fund Leverage section of this report.
9
Fund Leverage
IMPACT OF THE FUNDS’ LEVERAGE STRATEGIES ON PERFORMANCE
One important factor impacting the returns of the Funds’ common shares relative to their comparative benchmarks was the Funds’ use of leverage through their issuance of preferred shares and/or investments in inverse floating rate securities, which represent leveraged investments in underlying bonds. The Funds use leverage because our research has shown that, over time, leveraging provides opportunities for additional income. The opportunity arises when short-term rates that the Fund pays on its leveraging instruments are lower than the interest the Fund earns on its portfolio of long-term bonds that it has bought with the proceeds of that leverage. This has been particularly true in the recent market environment where short-term rates have been low by historical standards.
However, use of leverage can expose Fund common shares to additional price volatility. When a Fund uses leverage, the Fund’s common shares will experience a greater increase in their net asset value if the municipal bonds acquired through the use of leverage increase in value, but will also experience a correspondingly larger decline in their net asset value if the bonds acquired through leverage decline in value, which will make the shares’ net asset value more volatile, and total return performance more variable, over time.
In addition, common share income in levered funds will typically decrease in comparison to unlevered funds when short-term interest rates increase and increase when short-term interest rates decrease. In recent quarters, fund leverage expenses have generally tracked the overall movement of short-term tax-exempt interest rates. While fund leverage expenses are somewhat higher than their all-time lows after the 2007-2009 financial crisis, which has contributed to a reduction in common share net income and long-term total return potential, leverage nevertheless continues to provide the opportunity for incremental common share income. Management believes that the potential benefits from leverage continue to outweigh the associated increase in risk and volatility previously described.
Leverage had a positive impact on the total return performance of NVG, NZF and NMZ over the reporting period. Leverage from inverse floating rate securities had a negligible impact on the total return performance of NMCO over the reporting period.
As of October 31, 2019, the Funds’ percentages of leverage are as shown in the accompanying table.
| | | | | |
| NVG | NZF | NMZ | NMCO |
Effective Leverage* | 37.42% | 37.24% | 37.34% | 3.43% |
Regulatory Leverage* | 34.32% | 36.66% | 8.24% | 0.00% |
| |
| * Effective Leverage is a Fund’s effective economic leverage, and includes both regulatory leverage and the leverage effects of certain derivative and other investments in a Fund’s portfolio that increase the Fund’s investment exposure. Currently, the leverage effects of Tender Option Bond (TOB) inverse floater holdings are included in effective leverage values, in addition to any regulatory leverage. Regulatory leverage consists of preferred shares issued or borrowings of a Fund. Both of these are part of a Fund’s capital structure. A Fund, however, may from time to time borrow on a typically transient basis in connection with its day-to-day operations, primarily in connection with the need to settle portfolio trades. Such incidental borrowings are excluded from the calculation of a Fund’s effective leverage ratio. Regulatory leverage is subject to asset coverage limits set forth in the Investment Company Act of 1940. |
10
THE FUNDS’ REGULATORY LEVERAGE
As of October 31, 2019, the following Funds have issued and outstanding preferred shares as shown in the accompanying table.
NMCO did not use regulatory leverage during the reporting period.
| | | | | | | | | | |
| | | | | Variable Rate | | | | |
| | Variable Rate | | | Remarketed | | | | |
| | Preferred* | | | Preferred** | | | | |
| | Shares Issued | | | Shares Issued at | | | | |
| | at Liquidation | | | at Liquidation | | | | |
| | Preference | | | Preference | | | Total | |
NVG | | $ | 205,400,000 | | | $ | 1,611,600,000 | | | $ | 1,817,000,000 | |
NZF | | $ | 1,172,000,000 | | | $ | 196,000,000 | | | $ | 1,368,000,000 | |
NMZ | | $ | 87,000,000 | | | $ | — | | | $ | 87,000,000 | |
| | |
| * Preferred shares of the Fund featuring a floating rate dividend based on a predetermined formula or spread to an index rate. Includes the following preferred shares AMTP, iMTP, MFP-VRM and VRDP in Special Rate Mode, where applicable. See Notes to Financial Statements, Note 5 – Fund Shares, Preferred Shares for further details. |
** Preferred shares of the Fund featuring floating rate dividends set by a remarketing agent via a regular remarketing. Includes the following preferred shares VRDP not in Special Rate Mode, MFP- VRRM and MFP-VRDM, where applicable. See Notes to Financial Statements, Note 5 – Fund Shares, Preferred Shares for further details.
|
Refer to Notes to Financial Statements, Note 5 – Fund Shares, Preferred Shares and Note 9 – Subsequent Events, MFP Shares and VRDP Shares for further details on preferred shares and each Funds’ respective transactions.
11
Common Share Information
COMMON SHARE DISTRIBUTION INFORMATION
The following information regarding the Funds’ distributions is current as of October 31, 2019. Each Fund’s distribution levels may vary over time based on each Fund’s investment activity and portfolio investments value changes.
During the current reporting period, each Fund’s distributions to common shareholders were as shown in the accompanying table.
| | | | | | | | | | |
| | Per Common Share Amounts | |
| Monthly Distributions (Ex-Dividend Date) | | NVG | | | NZF | | | NMZ | |
November 2018 | | $ | 0.0655 | | | $ | 0.0660 | | | $ | 0.0565 | |
December | | | 0.0655 | | | | 0.0660 | | | | 0.0565 | |
January | | | 0.0655 | | | | 0.0660 | | | | 0.0565 | |
February | | | 0.0655 | | | | 0.0660 | | | | 0.0565 | |
March | | | 0.0655 | | | | 0.0660 | | | | 0.0595 | |
April | | | 0.0655 | | | | 0.0660 | | | | 0.0595 | |
May | | | 0.0655 | | | | 0.0660 | | | | 0.0595 | |
June | | | 0.0655 | | | | 0.0660 | | | | 0.0595 | |
July | | | 0.0655 | | | | 0.0660 | | | | 0.0595 | |
August | | | 0.0655 | | | | 0.0660 | | | | 0.0595 | |
September | | | 0.0655 | | | | 0.0660 | | | | 0.0595 | |
October 2019 | | | 0.0655 | | | | 0.0660 | | | | 0.0595 | |
| Total Distributions from Net Investment Income | | $ | 0.7860 | | | $ | 0.7920 | | | $ | 0.7020 | |
| Total Distributions from Long Term Capital Gains* | | $ | 0.0275 | | | $ | — | | | $ | — | |
| Total Distributions | | $ | 0.8135 | | | $ | 0.7920 | | | $ | 0.7020 | |
| | |
| Yields | | | | | | | | | | | | |
Market Yield** | | | 4.78 | % | | | 4.94 | % | | | 5.02 | % |
Taxable-Equivalent Yield** | | | 8.03 | % | | | 8.31 | % | | | 8.38 | % |
| | |
* | Distribution paid in December 2018. |
** | Market Yield is based on the Fund’s current annualized monthly dividend divided by the Fund’s current market price as of the end of the reporting period. Taxable-Equivalent Yield represents the yield that must be earned on a fully taxable investment in order to equal the yield of the Fund on an after-tax basis. It is based on an income tax rate of 40.8%. The Taxable-Equivalent Yield also takes into account the percentage of the Fund’s income generated and paid by the Fund (based on payments made during the previous calendar year) that was not exempt from federal income tax. Separately, if the comparison were instead to investments that generate qualified dividend income, which is taxable at a rate lower than an individual’s ordinary graduated tax rate, the fund’s Taxable-Equivalent Yield would be lower. |
Each Fund seeks to pay regular monthly dividends out of its net investment income at a rate that reflects its past and projected net income performance. To permit each Fund to maintain a more stable monthly dividend, the Fund may pay dividends at a rate that may be more or less than the amount of net income actually earned by the Fund during the period. Distributions to common shareholders are determined on a tax basis, which may differ from amounts recorded in the accounting records. In instances where the monthly dividend exceeds the earned net investment income, the Fund would report a negative undistributed net ordinary income. Refer to Note 6 — Income Tax Information for additional information regarding the amounts of undistributed net ordinary income and undistributed net long-term capital gains and the character of the actual distributions paid by the Fund during the period.
12
On October 29, 2019, NMCO declared its initial distribution of $0.0640 per share to shareholders of record on November 15, 2019 (subsequent to the close of this reporting period), which was paid on December 2, 2019.
All monthly dividends paid by each Fund during the current reporting period were paid from net investment income. If a portion of the Fund’s monthly distributions is sourced or comprised of elements other than net investment income, including capital gains and/or a return of capital, shareholders will be notified of those sources. For financial reporting purposes, the per share amounts of each Fund’s distributions for the reporting period are presented in this report’s Financial Highlights. For income tax purposes, distribution information for each Fund as of its most recent tax year end is presented in Note 6 — Income Tax Information within the Notes to Financial Statements of this report.
CHANGE IN METHOD OF PUBLISHING NUVEEN CLOSED-END FUND DISTRIBUTION AMOUNTS
Beginning on or about November 1, 2019, the Nuveen Closed-End Funds will be discontinuing the practice of announcing Fund distribution amounts and timing via press release. Instead, information about the Nuveen Closed-End Funds’ monthly and quarterly periodic distributions to shareholders will be posted and can be found on Nuveen’s enhanced closed-end fund resource page, which is at www.nuveen.com/closed-end-fund-distributions, along with other Nuveen closed-end fund product updates. Shareholders can expect regular distribution information to be posted on www.nuveen.com on the first business day of each month. To ensure that our shareholders have timely access to the latest information, a subscribe function can be activated at this link here, or at this web page (www.nuveen.com/en-us/people/about-nuveen/for-the-media).
COMMON SHARE EQUITY SHELF PROGRAM
During the current reporting period, NMZ was authorized by the Securities and Exchange Commission to issue additional common shares through an equity shelf program (Shelf Offering). Under this program, NMZ, subject to market conditions, may raise additional capital from time to time in varying amounts and offering methods at a net price at or above the Fund’s NAV per common share. The total amount of common shares authorized under this Shelf Offering, are as shown in the accompanying table.
| | |
| | NMZ |
Additional authorized common shares | 15,700,000* |
| | |
* Represents additional authorized common shares for the period April 11, 2019 through October 31, 2019.
|
During the current reporting period, NMZ sold common shares through its Shelf Offering at a weighted average premium to its NAV per common share as shown in the accompanying table.
| | |
| | NMZ |
Common shares sold through Shelf Offering | 4,928,383 |
Weighted average premium to NAV per common share sold | 1.26% |
Refer to Notes to Financial Statements, Note 5 – Fund Shares, Common Shares Equity Shelf Programs and Offering Costs for further details on Shelf Offerings and the Fund’s transactions.
13
Common Share Information (continued)
COMMON SHARE REPURCHASES
During August 2019, the Funds’ Board of Trustees reauthorized an open-market share repurchase program, allowing NVG, NZF and NMZ to repurchase an aggregate of up to approximately 10% of its outstanding common shares.
As of October 31, 2019, and since the inception of the Funds’ repurchase programs, the Funds have cumulatively repurchased and retired their outstanding common shares as shown in the accompanying table.
| | | | |
| NVG | NZF | NMZ |
Common shares cumulatively repurchased and retired | 202,500 | 47,500 | — |
Common shares authorized for repurchase | 20,255,000 | 14,215,000 | 6,485,000 |
During the current reporting period, the Funds did not repurchase any of their outstanding common shares.
OTHER COMMON SHARE INFORMATION
As of October 31, 2019, and during the current reporting period, the Funds’ common share prices were trading at a premium/(discount) to their common share NAVs as shown in the accompanying table.
| | | | | | | | | | | | | |
| | NVG | | | NZF | | | NMZ | | | NMCO | |
Common share NAV | | $ | 17.17 | | | $ | 16.63 | | | $ | 14.04 | | | $ | 15.08 | |
Common share price | | $ | 16.45 | | | $ | 16.03 | | | $ | 14.22 | | | $ | 15.39 | |
Premium/(Discount) to NAV | | | (4.19 | )% | | | (3.61 | )% | | | 1.28 | % | | | 2.06 | % |
12-month average premium/(discount) to NAV | | | (6.93 | )% | | | (5.93 | )% | | | (1.74 | )% | | | 3.58 | %* |
| |
* For the period September 16, 2019 (commencement of operations) through October 31, 2019. |
14
Risk Considerations
Fund shares are not guaranteed or endorsed by any bank or other insured depository institution, and are not federally insured by the Federal Deposit Insurance Corporation.
Nuveen AMT-Free Municipal Credit Income Fund (NVG)
Investing in closed-end funds involves risk; principal loss is possible. There is no guarantee the Fund’s investment objectives will be achieved. Closed-end fund shares may frequently trade at a discount or premium to their net asset value. Debt or fixed income securities such as those held by the Fund, are subject to market risk, credit risk, interest rate risk, derivatives risk, liquidity risk, and income risk. As interest rates rise, bond prices fall. Lower credit debt securities may be more likely to fail to make timely interest or principal payments. Leverage increases return volatility and magnifies the Fund’s potential return and its risks; there is no guarantee a fund’s leverage strategy will be successful. These and other risk considerations such as inverse floater risk and tax risk are described in more detail on the Fund’s web page at www.nuveen.com/NVG.
Nuveen Municipal Credit Income Fund (NZF)
Investing in closed-end funds involves risk; principal loss is possible. There is no guarantee the Fund’s investment objectives will be achieved. Closed-end fund shares may frequently trade at a discount or premium to their net asset value. Debt or fixed income securities such as those held by the Fund, are subject to market risk, credit risk, interest rate risk, derivatives risk, liquidity risk, and income risk. As interest rates rise, bond prices fall. Lower credit debt securities may be more likely to fail to make timely interest or principal payments. Leverage increases return volatility and magnifies the Fund’s potential return and its risks; there is no guarantee a fund’s leverage strategy will be successful. These and other risk considerations such as inverse floater risk and tax risk are described in more detail on the Fund’s web page at www.nuveen.com/NZF.
Nuveen Municipal High Income Opportunity Fund (NMZ)
Investing in closed-end funds involves risk; principal loss is possible. There is no guarantee the Fund’s investment objectives will be achieved. Closed-end fund shares may frequently trade at a discount or premium to their net asset value. Debt or fixed income securities such as those held by the Fund, are subject to market risk, credit risk, interest rate risk, derivatives risk, liquidity risk, and income risk. As interest rates rise, bond prices fall. Lower credit debt securities may be more likely to fail to make timely interest or principal payments. Leverage increases return volatility and magnifies the Fund’s potential return and its risks; there is no guarantee a fund’s leverage strategy will be successful. These and other risk considerations such as inverse floater risk and tax risk are described in more detail on the Fund’s web page at www.nuveen.com/NMZ.
Nuveen Municipal Credit Opportunities Fund (NMCO)
Investing in closed-end funds involves risk; principal loss is possible. There is no guarantee the Fund’s investment objectives will be achieved. Closed-end fund shares may frequently trade at a discount or premium to their net asset value. Debt or fixed income securities such as those held by the Fund, are subject to market risk, credit risk, interest rate risk, derivatives risk, liquidity risk, and income risk. As interest rates rise, bond prices fall. Lower credit debt securities may be more likely to fail to make timely interest or principal payments. Leverage increases return volatility and magnifies the Fund’s potential return and its risks; there is no guarantee a fund’s leverage strategy will be successful. These and other risk considerations such as inverse floater risk and tax risk are described in more detail on the Fund’s web page at www.nuveen.com/NMCO.
Investment Policy Update
While there are no such limits imposed by applicable regulations, certain Nuveen Closed-End Funds formerly had investment policies that placed limits on a Fund’s ability to invest in illiquid securities. All exchange-listed Nuveen Closed-End Funds now have no formal limit on their ability to invest in such illiquid securities, but each Fund’s portfolio management team will monitor such investments in the regular, overall management of the Fund’s portfolio securities.
15
| | |
| NVG | Nuveen AMT-Free Municipal Credit Income Fund Performance Overview and Holding Summaries as of October 31, 2019 |
| | | | |
Refer to the Glossary of Terms Used in this Report for further definition of the terms used within this section. |
| |
| Average Annual Total Returns as of October 31, 2019 |
|
| Average Annual |
| 1-Year | 5-Year | 10-Year |
NVG at Common Share NAV | 16.52% | 6.59% | 7.17% |
NVG at Common Share Price | 29.47% | 9.19% | 7.89% |
S&P Municipal Bond Index | 9.07% | 3.55% | 4.49% |
NVG Custom Blended Fund Performance Benchmark | 9.72% | 4.35% | 4.90% |
Past performance is not predictive of future results. Current performance may be higher or lower than the data shown. Returns do not reflect the deduction of taxes that shareholders may have to pay on Fund distributions or upon the sale of Fund shares. Returns at NAV are net of Fund expenses, and assume reinvestment of distributions. Comparative index return information is provided for the Fund’s shares at NAV only. Indexes are not available for direct investment.
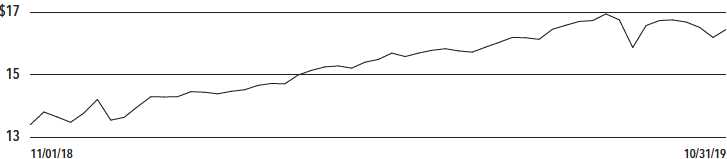
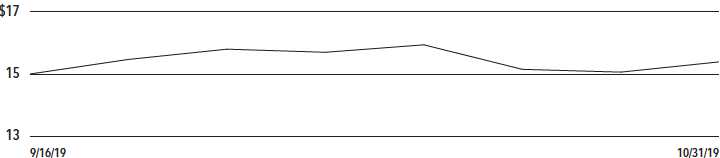
Common Share Price Performance — Weekly Closing Price
16
This data relates to the securities held in the Fund’s portfolio of investments as of the end of the reporting period. It should not be construed as a measure of performance for the Fund itself. Holdings are subject to change.
The ratings disclosed are the lowest rating given by one of the following national rating agencies: Standard & Poor’s Group, Moody’s Investors Service, Inc. or Fitch, Inc. Credit ratings are subject to change. AAA, AA, A and BBB are investment grade ratings; BB, B, CCC, CC, C and D are below-investment grade ratings. Holdings designated N/R are not rated by these national rating agencies.
| | |
| Fund Allocation | |
| (% of net assets) | |
Long-Term Municipal Bonds | 155.3% |
Other Assets Less Liabilities | 2.1% |
| Net Assets Plus Floating Rate Obligations, | |
| MFP Shares, net of deferred offering | |
| costs & VRDP Shares, net of deferred | |
| offering costs | 157.4% |
Floating Rate Obligations | (5.3)% |
MFP Shares, net of deferred | |
offering costs | (11.6)% |
VRDP Shares, net of deferred | |
offering costs | (40.5)% |
| Net Assets | 100% |
|
| Portfolio Credit Quality | |
| (% of total investment exposure) | |
U.S. Guaranteed | 8.8% |
AAA | 2.6% |
AA | 13.9% |
A | 27.3% |
BBB | 19.3% |
BB or Lower | 16.7% |
N/R (not rated) | 11.4% |
| Total | 100% |
| | |
| Portfolio Composition | |
| (% of total investments) | |
Health Care | 20.5% |
Tax Obligation/Limited | 18.0% |
Transportation | 12.4% |
Tax Obligation/General | 9.6% |
U.S. Guaranteed | 9.6% |
Education and Civic Organizations | 8.8% |
Utilities | 7.3% |
Consumer Staples | 6.2% |
Other | 7.6% |
| Total | 100% |
| | |
| States and Territories | |
| (% of total municipal bonds) | |
Illinois | 16.4% |
California | 10.0% |
Texas | 7.3% |
Ohio | 6.9% |
Colorado | 6.5% |
Pennsylvania | 5.2% |
New Jersey | 3.9% |
Florida | 3.3% |
New York | 3.2% |
Wisconsin | 2.6% |
Georgia | 2.3% |
Indiana | 2.1% |
Iowa | 2.1% |
South Carolina | 1.8% |
Arizona | 1.8% |
Massachusetts | 1.7% |
Missouri | 1.5% |
Michigan | 1.5% |
Other | 19.9% |
| Total | 100% |
17
| | |
| NZF | Nuveen Municipal Credit Income Fund |
| Performance Overview and Holding Summaries as of October 31, 2019 |
| | | | |
Refer to the Glossary of Terms Used in this Report for further definition of the terms used within this section.
|
| |
Average Annual Total Returns as of October 31, 2019
|
|
| Average Annual |
| 1-Year | 5-Year | 10-Year |
NZF at Common Share NAV | 15.90% | 6.42% | 7.49% |
NZF at Common Share Price | 27.08% | 9.06% | 8.14% |
S&P Municipal Bond Index | 9.07% | 3.55% | 4.49% |
NZF Custom Blended Fund Performance Benchmark | 9.72% | 4.35% | 4.90% |
Past performance is not predictive of future results. Current performance may be higher or lower than the data shown. Returns do not reflect the deduction of taxes that shareholders may have to pay on Fund distributions or upon the sale of Fund shares. Returns at NAV are net of Fund expenses, and assume reinvestment of distributions. Comparative index return information is provided for the Fund’s shares at NAV only. Indexes are not available for direct investment.
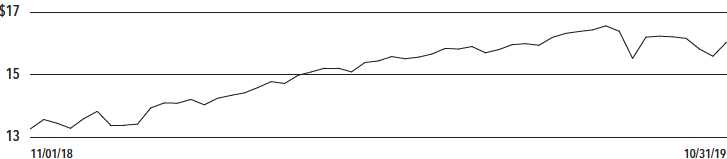
Common Share Price Performance — Weekly Closing Price
18
This data relates to the securities held in the Fund’s portfolio of investments as of the end of the reporting period. It should not be construed as a measure of performance for the Fund itself. Holdings are subject to change.
The ratings disclosed are the lowest rating given by one of the following national rating agencies: Standard & Poor’s Group, Moody’s Investors Service, Inc. or Fitch, Inc. Credit ratings are subject to change. AAA, AA, A and BBB are investment grade ratings; BB, B, CCC, CC, C and D are below-investment grade ratings. Holdings designated N/R are not rated by these national rating agencies.
| | |
| Fund Allocation | |
| (% of net assets) | |
Long-Term Municipal Bonds | 156.5% |
Investment Companies | 0.1% |
Corporate Bonds | 0.0% |
Other Assets Less Liabilities | 2.1% |
| Net Assets Plus Floating Rate | |
| Obligations, MFP Shares, net of | |
| deferred offering costs & VRDP | |
| Shares, net of deferred offering costs | 158.7% |
Floating Rate Obligations | (1.0)% |
MFP Shares, net of deferred | |
offering costs | (27.1)% |
VRDP Shares, net of deferred | |
offering costs | (30.6)% |
| Net Assets | 100% |
|
| Portfolio Credit Quality | |
| (% of total investment exposure) | |
U.S. Guaranteed | 7.7% |
AAA | 1.6% |
AA | 11.8% |
A | 24.2% |
BBB | 24.9% |
BB or Lower | 17.1% |
N/R (not rated) | 12.6% |
N/A (not applicable) | 0.1% |
| Total | 100% |
| | |
| Portfolio Composition | |
| (% of total investments) | |
Tax Obligation/Limited | 19.1% |
Transportation | 17.6% |
Tax Obligation/General | 15.2% |
Health Care | 14.8% |
U.S. Guaranteed | 9.1% |
Utilities | 7.4% |
Education and Civic Organizations | 5.5% |
Other | 11.3% |
| Total | 100% |
| | |
| States and Territories | |
| (% of total municipal bonds) | |
Illinois | 19.2% |
California | 15.2% |
Texas | 9.3% |
New York | 8.6% |
Colorado | 4.6% |
Florida | 4.2% |
Pennsylvania | 3.8% |
New Jersey | 3.5% |
Ohio | 2.4% |
Indiana | 2.3% |
Puerto Rico | 2.2% |
Oklahoma | 1.7% |
Arizona | 1.7% |
South Carolina | 1.5% |
Other | 19.8% |
| Total | 100% |
19
| | |
| NMZ | Nuveen Municipal High Income Opportunity Fund Performance Overview and Holding Summaries as of October 31, 2019 |
| | | | |
Refer to the Glossary of Terms Used in this Report for further definition of the terms used within this section.
| |
| | | |
Average Annual Total Returns as of October 31, 2019
| |
|
| Average Annual |
| 1-Year | 5-Year | 10-Year |
NMZ at Common Share NAV | 15.75% | 6.72% | 9.52% |
NMZ at Common Share Price | 27.45% | 7.87% | 8.97% |
S&P Municipal Yield Index | 11.45% | 5.90% | 6.99% |
S&P Municipal Bond High Yield Index | 10.89% | 5.89% | 7.42% |
S&P Municipal Bond Index | 9.07% | 3.55% | 4.49% |
Past performance is not predictive of future results. Current performance may be higher or lower than the data shown. Returns do not reflect the deduction of taxes that shareholders may have to pay on Fund distributions or upon the sale of Fund shares. Returns at NAV are net of Fund expenses, and assume reinvestment of distributions. Comparative index return information is provided for the Fund’s shares at NAV only. Indexes are not available for direct investment.
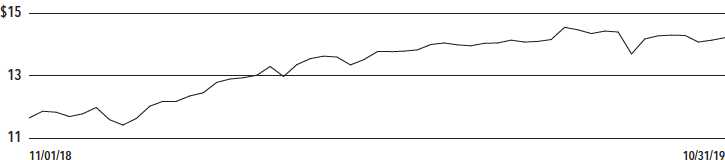
Common Share Price Performance — Weekly Closing Price
20
This data relates to the securities held in the Fund’s portfolio of investments as of the end of the reporting period. It should not be construed as a measure of performance for the Fund itself. Holdings are subject to change.
The ratings disclosed are the lowest rating given by one of the following national rating agencies: Standard & Poor’s Group, Moody’s Investors Service, Inc. or Fitch, Inc. Credit ratings are subject to change. AAA, AA, A and BBB are investment grade ratings; BB, B, CCC, CC, C and D are below-investment grade ratings. Holdings designated N/R are not rated by these national rating agencies.
| | |
| Fund Allocation | |
| (% of net assets) | |
Long-Term Municipal Bonds | 141.7% |
Common Stocks | 0.7% |
Corporate Bonds | 0.4% |
Short-Term Municipal Bonds | 1.9% |
Other Assets Less Liabilities | 3.9% |
| Net Assets Plus Floating Rate | |
| Obligations & AMTP Shares, | |
| net of deferred offering costs | 148.6% |
Floating Rate Obligations | (39.6)% |
AMTP Shares, net of deferred | |
offering costs | (9.0)% |
| Net Assets | 100% |
| | |
| Portfolio Credit Quality | |
| (% of total investment exposure) | |
U.S. Guaranteed | 5.2% |
AAA | 1.6% |
AA | 13.6% |
A | 14.9% |
BBB | 18.5% |
BB or Lower | 16.5% |
N/R (not rated) | 29.2% |
N/A (not applicable) | 0.5% |
| Total | 100% |
| | |
| Portfolio Composition | |
| (% of total investments) | |
Tax Obligation/Limited | 24.1% |
Health Care | 17.4% |
Transportation | 13.0% |
Education and Civic Organizations | 12.6% |
Tax Obligation/General | 8.1% |
Utilities | 5.6% |
Industrials | 4.5% |
Other | 14.7% |
| Total | 100% |
| | |
| States and Territories | |
| (% of total municipal bonds) | |
Illinois | 17.0% |
California | 13.4% |
Florida | 9.3% |
New York | 6.2% |
Ohio | 5.6% |
Colorado | 5.3% |
Kentucky | 4.7% |
Wisconsin | 4.3% |
New Jersey | 3.9% |
Texas | 3.3% |
Puerto Rico | 2.7% |
Tennessee | 2.6% |
Arizona | 1.8% |
Other | 19.9% |
| Total | 100% |
21
| | |
| NMCO | Nuveen Municipal Credit Opportunities Fund |
| Performance Overview and Holding Summaries as of October 31, 2019 |
| | |
Refer to the Glossary of Terms Used in this Report for further definition of the terms used within this section. |
| | |
| Cumulative Total Returns as of October 31, 2019 |
|
| Since |
| Inception |
NMCO at Common Share NAV | 0.53% |
NMCO at Common Share Price | 2.60% |
S&P Municipal Yield Index | 0.86% |
Since inception returns are from 9/16/19. Past performance is not predictive of future results. Current performance may be higher or lower than the data shown. Returns do not reflect the deduction of taxes that shareholders may have to pay on Fund distributions or upon the sale of Fund shares. Returns at NAV are net of Fund expenses, and assume reinvestment of distributions. Comparative index return information is provided for the Fund’s shares at NAV only. Indexes are not available for direct investment.
Common Share Price Performance — Weekly Closing Price
22
This data relates to the securities held in the Fund’s portfolio of investments as of the end of the reporting period. It should not be construed as a measure of performance for the Fund itself. Holdings are subject to change.
The ratings disclosed are the lowest rating given by one of the following national rating agencies: Standard & Poor’s Group, Moody’s Investors Service, Inc. or Fitch, Inc. Credit ratings are subject to change. AAA, AA, A and BBB are investment grade ratings; BB, B, CCC, CC, C and D are below-investment grade ratings. Holdings designated N/R are not rated by these national rating agencies.
| | |
| Fund Allocation | |
| (% of net assets) | |
Long-Term Municipal Bonds | 86.4% |
Exchange-Traded Funds | 4.7% |
Short-Term Municipal Bonds | 11.7% |
Other Assets Less Liabilities | 0.7% |
| Net Assets Plus Floating | |
| Rate Obligations | 103.5% |
Floating Rate Obligations | (3.5)% |
| Net Assets | 100% |
|
| Portfolio Credit Quality | |
| (% of total investment exposure) | |
AAA | 11.4% |
A | 4.0% |
BBB | 19.8% |
BB or Lower | 18.3% |
N/R (not rated) | 41.9% |
N/A (not applicable) | 4.6% |
| Total | 100% |
| | |
| Portfolio Composition | |
| (% of total investments) | |
Health Care | 13.9% |
Tax Obligation/Limited | 13.6% |
Transportation | 12.8% |
Industrials | 12.4% |
Utilities | 11.0% |
Consumer Staples | 10.0% |
Tax Obligation/General | 7.4% |
Other | 18.9% |
| Total | 100% |
| | |
| States and Territories | |
| (% of total municipal bonds) | |
Florida | 10.5% |
Ohio | 10.0% |
Illinois | 9.7% |
New York | 8.6% |
Puerto Rico | 6.9% |
California | 4.9% |
Alabama | 4.6% |
Georgia | 4.1% |
New Jersey | 4.0% |
Indiana | 3.8% |
Mississippi | 3.8% |
Arizona | 3.3% |
Texas | 3.3% |
Arkansas | 3.1% |
Other | 19.4% |
| Total | 100% |
23
Shareholder Meeting Report
The annual meeting of shareholders was held in the offices of Nuveen on August 7, 2019 for NMZ, NVG and NZF; at this meeting the shareholders were asked to elect Board Members.
| | | | | | | |
| NMZ
| NVG | NZF |
| Common and | | Common and | | Common and | |
| Preferred | | Preferred | Preferred | Preferred | Preferred |
| shares voting | | shares voting | shares voting | shares voting | shares voting |
| together | Preferred | together | together | together | together |
| as a class | Shares | as a class | as a class | as a class | as a class |
| Approval of the Board Members was reached as follows: | | | | |
Judith M. Stockdale | | | | | | |
| For | 58,197,717 | — | 175,316,145 | — | 125,817,383 | — |
| Withhold | 2,786,713 | — | 8,331,434 | — | 5,344,813 | — |
| Total | 60,984,430 | — | 183,647,579 | — | 131,162,196 | — |
Carole E. Stone | | | | | | |
| For | 58,251,285 | — | 175,439,543 | — | 125,923,271 | — |
| Withhold | 2,733,145 | — | 8,208,036 | — | 5,238,925 | — |
| Total | 60,984,430 | — | 183,647,579 | — | 131,162,196 | — |
Margaret L. Wolff | | | | | | |
| For | 58,462,101 | — | 175,742,400 | — | 126,097,780 | — |
| Withhold | 2,522,329 | — | 7,905,179 | — | 5,064,416 | — |
| Total | 60,984,430 | — | 183,647,579 | — | 131,162,196 | — |
William C. Hunter | | | | | | |
| For | — | 870 | — | 205,470 | — | 13,680 |
| Withhold | — | — | — | 10,700 | — | — |
| Total | — | 870 | — | 216,170 | — | 13,680 |
Albin F. Moschner | | | | | | |
| For | — | 870 | — | 216,170 | — | 13,680 |
| Withhold | — | — | — | — | — | — |
| Total | — | 870 | — | 216,170 | — | 13,680 |
24
Report of Independent Registered Public Accounting Firm
To the Shareholders and Board of Trustees of
Nuveen AMT-Free Municipal Credit Income Fund
Nuveen Municipal Credit Income Fund
Nuveen Municipal High Income Opportunity Fund
Nuveen Municipal Credit Opportunities Fund
Opinion on the Financial Statements
We have audited the accompanying statements of assets and liabilities of Nuveen AMT-Free Municipal Credit Income Fund, Nuveen Municipal Credit Income Fund, Nuveen Municipal High Income Opportunity Fund, and Nuveen Municipal Credit Opportunities Fund (the “Funds”), including the portfolios of investments, as of October 31, 2019, the related statements of operations for the year then ended (period from September 16, 2019 (commencement of operations) to October 31, 2019 for Nuveen Municipal Credit Opportunities Fund), the statements of cash flows of Nuveen AMT-Free Municipal Credit Income Fund, Nuveen Municipal Credit Income Fund, and Nuveen Municipal High Income Opportunity Fund for the year then ended, the statements of changes in net assets for each of the years in the two-year period then ended (period from September 16, 2019 to October 31, 2019 for Nuveen Municipal Credit Opportunities Fund), and the related notes (collectively, the “financial statements”) and the financial highlights for each of the years in the five-year period then ended (period from September 16, 2019 to October 31, 2019 for Nuveen Municipal Credit Opportunities Fund). In our opinion, the financial statements and financial highlights present fairly, in all material respects, the financial position of the Funds as of October 31, 2019, the results of their operations for the year then ended (period from September 16, 2019 to October 31, 2019 for Nuveen Municipal Credit Opportunities Fund), the cash flows of Nuveen AMT-Free Municipal Credit Income Fund, Nuveen Municipal Credit Income Fund, and Nuveen Municipal High Income Opportunity Fund for the year then ended, the changes in their net assets for each of the years in the two-year period then ended (period from September 16, 2019 to October 31, 2019 for Nuveen Municipal Credit Opportunities Fund), and the financial highlights for each of the years in the five-year period then ended (period from September 16, 2019 to October 31, 2019 for Nuveen Municipal Credit Opportunities Fund), in conformity with U.S. generally accepted accounting principles.
Basis for Opinion
These financial statements and financial highlights are the responsibility of the Funds’ management. Our responsibility is to express an opinion on these financial statements and financial highlights based on our audits. We are a public accounting firm registered with the Public Company Accounting Oversight Board (United States) (PCAOB) and are required to be independent with respect to the Funds in accordance with the U.S. federal securities laws and the applicable rules and regulations of the Securities and Exchange Commission and the PCAOB.
We conducted our audits in accordance with the standards of the PCAOB. Those standards require that we plan and perform the audit to obtain reasonable assurance about whether the financial statements and financial highlights are free of material misstatement, whether due to error or fraud. Our audits included performing procedures to assess the risks of material misstatement of the financial statements and financial highlights, whether due to error or fraud, and performing procedures that respond to those risks. Such procedures included examining, on a test basis, evidence regarding the amounts and disclosures in the financial statements and financial highlights. Such procedures also included confirmation of securities owned as of October 31, 2019, by correspondence with custodians and brokers or other appropriate auditing procedures. Our audits also included evaluating the accounting principles used and significant estimates made by management, as well as evaluating the overall presentation of the financial statements and financial highlights. We believe that our audits provide a reasonable basis for our opinion.
/s/ KPMG LLP
We have served as the auditor of one or more Nuveen investment companies since 2014.
Chicago, Illinois
December 27, 2019
25
| | |
| NVG | Nuveen AMT-Free Municipal Credit Income Fund Portfolio of Investments October 31, 2019 |
| | | | | | |
| Principal | | | Optional Call | | |
| Amount (000) | | Description (1) | Provisions (2) | Ratings (3) | Value |
| | LONG-TERM INVESTMENTS – 155.3% (100.0% of Total Investments) | | | |
| | MUNICIPAL BONDS – 155.3% (100.0% of Total Investments) | | | |
| | Alabama – 2.0% (1.3% of Total Investments) | | | |
| $ 3,645 | | Alabama Private Colleges and University Facilities Authority, Limited Obligation Bonds, | 9/25 at 100.00 | N/R | $ 3,927,961 |
| | University of Mobile Project, Series 2015A, 6.000%, 9/01/45, 144A | | | |
| 22,655 | | Lower Alabama Gas District, Alabama, Gas Project Revenue Bonds, Series 2016A, | No Opt. Call | A3 | 32,044,138 |
| | 5.000%, 9/01/46 | | | |
| 8,100 | | Mobile Spring Hill College Educational Building Authority, Alabama, Revenue Bonds, | 4/25 at 100.00 | N/R | 8,649,180 |
| | Spring Hill College Project, Series 2015, 5.875%, 4/15/45 | | | |
| | Opelika Utilities Board, Alabama, Utility Revenue Bonds, Series 2011B: | | | |
| 1,250 | | 4.000%, 6/01/29 – AGM Insured | 6/21 at 100.00 | Aa3 | 1,298,925 |
| 1,000 | | 4.250%, 6/01/31 – AGM Insured | 6/21 at 100.00 | Aa3 | 1,041,790 |
| | The Improvement District of the City of Mobile – McGowin Park Project, Sales Tax Revenue | | | |
| | Bonds, Alabama, Series 2016A: | | | |
| 1,000 | | 5.250%, 8/01/30 | 8/26 at 100.00 | N/R | 1,058,620 |
| 1,300 | | 5.500%, 8/01/35 | 8/26 at 100.00 | N/R | 1,376,024 |
| 5,970 | | Tuscaloosa County Industrial Development Authority, Alabama, Gulf Opportunity Zone | 5/29 at 100.00 | N/R | 6,880,485 |
| | Bonds, Hunt Refining Project, Refunding Series 2019A, 5.250%, 5/01/44, 144A | | | |
| 12,000 | | UAB Medicine Finance Authority, Alabama, Revenue Bonds, Series 2019B, 4.000%, 9/01/44 | 9/29 at 100.00 | AA– | 13,319,880 |
| 56,920 | | Total Alabama | | | 69,597,003 |
| | Alaska – 0.6% (0.4% of Total Investments) | | | |
| | Northern Tobacco Securitization Corporation, Alaska, Tobacco Settlement Asset-Backed | | | |
| | Bonds, Series 2006A: | | | |
| 7,010 | | 5.000%, 6/01/32 | 11/19 at 100.00 | B3 | 7,019,534 |
| 12,635 | | 5.000%, 6/01/46 | 11/19 at 100.00 | B3 | 12,652,184 |
| 19,645 | | Total Alaska | | | 19,671,718 |
| | Arizona – 2.8% (1.8% of Total Investments) | | | |
| 4,230 | | Apache County Industrial Development Authority, Arizona, Pollution Control Revenue | 3/22 at 100.00 | A– | 4,450,087 |
| | Bonds, Tucson Electric Power Company, Series 20102A, 4.500%, 3/01/30 | | | |
| 1,475 | | Arizona Industrial Development Authority, Arizona, Education Facility Revenue Bonds, | 7/27 at 100.00 | BB | 1,600,773 |
| | Basis Schools, Inc Projects, Series 2017D, 5.000%, 7/01/47, 144A | | | |
| 3,260 | | Arizona Industrial Development Authority, Education Facility Revenue Bonds, Caurus | 6/28 at 100.00 | N/R | 3,460,783 |
| | Academy Project, Series 2018A, 6.375%, 6/01/39, 144A | | | |
| 10,000 | | Arizona Sports and Tourism Authority, Tax Revenue Bonds, Multipurpose Stadium Facility | 7/22 at 100.00 | A | 10,659,100 |
| | Project, Refunding Senior Series 2012A, 5.000%, 7/01/31 | | | |
| 3,000 | | Arizona State, Certificates of Participation, Department of Administration Series 2010B, | 4/20 at 100.00 | Aa3 | 3,044,130 |
| | 5.000%, 10/01/29 – AGC Insured | | | |
| 7,070 | | Arizona State, State Lottery Revenue Bonds, Series 2010A, 5.000%, 7/01/29 (Pre-refunded | 1/20 at 100.00 | Aa3 (4) | 7,112,491 |
| | 1/01/20) – AGC Insured | | | |
| 3,325 | | Cahava Springs Revitalization District, Cave Creek, Arizona, Special Assessment Bonds, | 7/27 at 100.00 | N/R | 3,426,146 |
| | Series 2017A, 7.000%, 7/01/41, 144A | | | |
| 7,780 | | Phoenix Civic Improvement Corporation, Arizona, Airport Revenue Bonds, Junior Lien | 7/20 at 100.00 | A+ (4) | 7,976,834 |
| | Series 2010A, 5.000%, 7/01/40 (Pre-refunded 7/01/20) | | | |
| | Phoenix Civic Improvement Corporation, Arizona, Revenue Bonds, Civic Plaza Expansion | | | |
| | Project, Series 2005B: | | | |
| 6,000 | | 5.500%, 7/01/37 – FGIC Insured | No Opt. Call | AA | 8,819,220 |
| 8,755 | | 5.500%, 7/01/39 – FGIC Insured | No Opt. Call | AA | 13,023,062 |
26
| | | | | | |
| Principal | | | Optional Call | | |
| Amount (000) | | Description (1) | Provisions (2) | Ratings (3) | Value |
| | Arizona (continued) | | | |
| | Phoenix Industrial Development Authority, Arizona, Education Facility Revenue Bonds, | | | |
| | Basis Schools, Inc Projects, Series 2016A: | | | |
| $ 620 | | 5.000%, 7/01/35, 144A | 7/25 at 100.00 | BB | $ 671,305 |
| 1,025 | | 5.000%, 7/01/46, 144A | 7/25 at 100.00 | BB | 1,092,414 |
| 2,065 | | Phoenix Industrial Development Authority, Arizona, Multifamily Housing Revenue Bonds, | 7/24 at 101.00 | N/R | 2,093,538 |
| | Deer Valley Veterans Assisted Living Project, Series 2016A, 5.125%, 7/01/36 | | | |
| | Pima County Industrial Development Authority, Arizona, Education Facility Revenue and | | | |
| | Refunding Bonds, Edkey Charter Schools Project, Series 2013: | | | |
| 490 | | 6.000%, 7/01/33 | 7/20 at 102.00 | BB– | 494,224 |
| 610 | | 6.000%, 7/01/43 | 7/20 at 102.00 | BB– | 610,146 |
| 350 | | 6.000%, 7/01/48 | 7/20 at 102.00 | BB– | 348,093 |
| 1,425 | | Pima County Industrial Development Authority, Arizona, Education Facility Revenue Bonds, | 7/20 at 102.00 | BB– | 1,459,229 |
| | Edkey Charter Schools Project, Series 2014A, 7.375%, 7/01/49 | | | |
| | Pima County Industrial Development Authority, Arizona, Education Facility Revenue Bonds, | | | |
| | Edkey Charter Schools Project, Series 2016: | | | |
| 1,130 | | 5.250%, 7/01/36 | 7/26 at 100.00 | BB– | 1,066,031 |
| 1,850 | | 5.375%, 7/01/46 | 7/26 at 100.00 | BB– | 1,691,770 |
| 2,135 | | 5.500%, 7/01/51 | 7/26 at 100.00 | BB– | 1,964,008 |
| 885 | | Pima County Industrial Development Authority, Arizona, Education Facility Revenue Bonds, | 2/24 at 100.00 | N/R | 924,099 |
| | San Tan Montessori School Project, Series 2016, 6.500%, 2/01/48, 144A | | | |
| 3,050 | | Pima County Industrial Development Authority, Arizona, Education Facility Revenue Bonds, | 2/28 at 100.00 | N/R | 3,327,001 |
| | San Tan Montessori School Project, Series 2017, 6.750%, 2/01/50, 144A | | | |
| 105 | | Pima County Industrial Development Authority, Arizona, Education Revenue Bonds, Noah | 7/20 at 102.00 | BB– | 107,591 |
| | Webster Schools ? Pima Project, Series 2014A, 7.250%, 7/01/39 | | | |
| 1,000 | | Pima County Industrial Development Authority, Arizona, Revenue Bonds, Tucson Electric | 10/20 at 100.00 | A– | 1,030,470 |
| | Power Company, Series 2010A, 5.250%, 10/01/40 | | | |
| | Salt Verde Financial Corporation, Arizona, Senior Gas Revenue Bonds, Citigroup Energy | | | |
| | Inc Prepay Contract Obligations, Series 2007: | | | |
| 6,820 | | 5.000%, 12/01/32 | No Opt. Call | BBB+ | 8,846,972 |
| 2,745 | | 5.000%, 12/01/37 | No Opt. Call | BBB+ | 3,695,484 |
| 800 | | The Industrial Development Authority of the County of Maricopa, Arizona, Education | 7/26 at 100.00 | Baa3 | 891,264 |
| | Revenue Bonds, Reid Traditional School Projects, Series 2016, 5.000%, 7/01/47 | | | |
| 2,000 | | Yavapai County Industrial Development Authority, Arizona, Hospital Revenue Bonds, | 8/23 at 100.00 | A2 | 2,262,000 |
| | Yavapai Regional Medical Center, Series 2013A, 5.250%, 8/01/33 | | | |
| 84,000 | | Total Arizona | | | 96,148,265 |
| | Arkansas – 0.3% (0.2% of Total Investments) | | | |
| | Arkansas Development Finance Authority, Tobacco Settlement Revenue Bonds, Arkansas | | | |
| | Cancer Research Center Project, Series 2006: | | | |
| 2,500 | | 0.000%, 7/01/36 – AMBAC Insured | No Opt. Call | Aa2 | 1,541,900 |
| 20,460 | | 0.000%, 7/01/46 – AMBAC Insured | No Opt. Call | Aa2 | 8,288,551 |
| 22,960 | | Total Arkansas | | | 9,830,451 |
| | California – 15.6% (10.0% of Total Investments) | | | |
| | Alameda Corridor Transportation Authority, California, Revenue Bonds, Refunding | | | |
| | Subordinate Lien Series 2004A: | | | |
| 45 | | 0.000%, 10/01/20 – AMBAC Insured | No Opt. Call | Baa2 | 44,210 |
| 2,120 | | 0.000%, 10/01/20 – AMBAC Insured (ETM) | No Opt. Call | Aaa | 2,097,846 |
| 6,135 | | Alhambra Unified School District, Los Angeles County, California, General Obligation | No Opt. Call | AA | 4,864,380 |
| | Bonds, Capital Appreciation Series 2009B, 0.010%, 8/01/30 – AGC Insured | | | |
| 12,550 | | Anaheim Public Financing Authority, California, Lease Revenue Bonds, Public Improvement | No Opt. Call | A2 | 8,287,016 |
| | Project, Series 1997C, 0.010%, 9/01/35 – AGM Insured | | | |
| 4,100 | | Antelope Valley Healthcare District, California, Revenue Bonds, Series 2016A, | 3/26 at 100.00 | Ba3 | 4,368,468 |
| | 5.000%, 3/01/41 | | | |
27
| | | | | |
| NVG | Nuveen AMT-Free Municipal Credit Income Fund | |
| Portfolio of Investments (continued) | | | |
|
| October 31, 2019 | | | |
|
|
|
|
| Principal | | | Optional Call | | |
| Amount (000) | | Description (1) | Provisions (2) | Ratings (3) | Value |
| | California (continued) | | | |
| $ 5,000 | | Bay Area Toll Authority, California, Revenue Bonds, San Francisco Bay Area Toll Bridge, | 4/23 at 100.00 | A1 (4) | $ 5,668,500 |
| | Series 2013S-4, 5.000%, 4/01/38 (Pre-refunded 4/01/23) | | | |
| | California County Tobacco Securitization Agency, Tobacco Settlement Asset-Backed Bonds, | | | |
| | Los Angeles County Securitization Corporation, Series 2006A: | | | |
| 3,275 | | 5.450%, 6/01/28 | 11/19 at 100.00 | B2 | 3,324,878 |
| 2,975 | | 5.650%, 6/01/41 | 11/19 at 100.00 | B2 | 2,995,825 |
| 22,965 | | California Educational Facilities Authority, Revenue Bonds, Stanford University Series | No Opt. Call | AAA | 34,653,037 |
| | 2016U-7, 5.000%, 6/01/46 (UB) (5) | | | |
| 15,850 | | California Educational Facilities Authority, Revenue Bonds, Stanford University Series | No Opt. Call | AAA | 24,323,727 |
| | 2019V-1, 5.000%, 5/01/49 | | | |
| | California Educational Facilities Authority, Revenue Bonds, Stanford University Series, | | | |
| | Tender Option Bond Trust Series 2018-XF2737: | | | |
| 10,000 | | California Health Facilities Financing Authority, Revenue Bonds, Lucile Salter Packard | 8/22 at 100.00 | A+ | 10,771,400 |
| | Children’s Hospital, Series 2012A, 5.000%, 8/15/51 | | | |
| 1,600 | | California Health Facilities Financing Authority, Revenue Bonds, Saint Joseph Health | 7/23 at 100.00 | AA– | 1,796,576 |
| | System, Series 2013A, 5.000%, 7/01/37 | | | |
| 6,665 | | California Health Facilities Financing Authority, Revenue Bonds, Stanford Hospitals and | 8/25 at 100.00 | AA– | 7,602,432 |
| | Clinics, Series 2015A, 5.000%, 8/15/54 (UB) (5) | | | |
| | California Health Facilities Financing Authority, Revenue Bonds, Stanford Hospitals and | | | |
| | Clinics, Tender Option Bond Trust 2016-XG0049: | | | |
| 1,555 | | 8.266%, 8/15/51, 144A (IF) (5) | 8/22 at 100.00 | AA– | 1,849,393 |
| 1,650 | | 8.272%, 8/15/51, 144A (IF) (5) | 8/22 at 100.00 | AA– | 1,962,659 |
| 4,075 | | 8.272%, 8/15/51, 144A (IF) (5) | 8/22 at 100.00 | AA– | 4,847,172 |
| 5,000 | | California Health Facilities Financing Authority, Revenue Bonds, Sutter Health, Series | 8/23 at 100.00 | A+ | 5,492,650 |
| | 2013A, 5.000%, 8/15/52 | | | |
| | California Municipal Finance Authority, Charter School Revenue Bonds, Palmdale Aerospace | | | |
| | Academy Project, Series 2016A: | | | |
| 3,065 | | 5.000%, 7/01/31, 144A | 7/26 at 100.00 | BB | 3,452,079 |
| 1,000 | | 5.000%, 7/01/36, 144A | 7/26 at 100.00 | BB | 1,109,660 |
| 555 | | 5.000%, 7/01/41, 144A | 7/26 at 100.00 | BB | 609,568 |
| 195 | | 5.000%, 7/01/46, 144A | 7/26 at 100.00 | BB | 213,320 |
| | California Municipal Finance Authority, Education Revenue Bonds, American Heritage | | | |
| | Foundation Project, Series 2016A: | | | |
| 260 | | 5.000%, 6/01/36 | 6/26 at 100.00 | BBB– | 299,224 |
| 435 | | 5.000%, 6/01/46 | 6/26 at 100.00 | BBB– | 493,529 |
| 2,335 | | California Municipal Finance Authority, Revenue Bonds, Eisenhower Medical Center, Series | 7/20 at 100.00 | Baa2 (4) | 2,407,081 |
| | 2010A, 5.750%, 7/01/40 (Pre-refunded 7/01/20), 144A | | | |
| 5,425 | | California Pollution Control Financing Authority, Water Furnishing Revenue Bonds, San | 1/29 at 100.00 | Baa3 | 6,494,484 |
| | Diego County Water Authority Desalination Project Pipeline, Refunding Series 2019, 5.000%, | | | |
| | 11/21/45, 144A | | | |
| 2,050 | | California Public Finance Authority, Revenue Bonds, Henry Mayo Newhall Hospital, Series | 10/26 at 100.00 | BBB– | 2,314,716 |
| | 2017, 5.000%, 10/15/47 | | | |
| 735 | | California School Finance Authority, Charter School Revenue Bonds, Downtown College Prep – | 6/26 at 100.00 | N/R | 789,405 |
| | Obligated Group, Series 2016, 5.000%, 6/01/46, 144A | | | |
| 715 | | California School Finance Authority, Charter School Revenue Bonds, Rocketship Education | 6/25 at 100.00 | N/R | 764,392 |
| | Obligated Group, Series 2016A, 5.000%, 6/01/36, 144A | | | |
| 570 | | California School Finance Authority, Charter School Revenue Bonds, Rocketship Education | 6/26 at 100.00 | N/R | 613,559 |
| | Obligated Group, Series 2017A, 5.125%, 6/01/47, 144A | | | |
| 80 | | California State, General Obligation Bonds, Series 2002, 5.000%, 10/01/32 – | 12/19 at 100.00 | AA– | 80,235 |
| | NPFG Insured | | | |
| 5 | | California State, General Obligation Bonds, Series 2004, 5.000%, 4/01/31 – | 12/19 at 100.00 | AA– | 5,015 |
| | AMBAC Insured | | | |
28
| | | | | | |
| Principal | | | Optional Call | | |
| Amount (000) | | Description (1) | Provisions (2) | Ratings (3) | Value |
| | California (continued) | | | |
| | California State, General Obligation Bonds, Various Purpose Series 2010: | | | |
| $ 3,500 | | 5.250%, 3/01/30 | 3/20 at 100.00 | AA– | $ 3,547,145 |
| 10,000 | | 5.500%, 11/01/35 | 11/20 at 100.00 | AA– | 10,432,800 |
| 12,710 | | California Statewide Communities Development Authority, California, Revenue Bonds, Loma | 12/24 at 100.00 | BB– | 14,167,710 |
| | Linda University Medical Center, Series 2014A, 5.500%, 12/01/54 | | | |
| 65,505 | | California Statewide Communities Development Authority, California, Revenue Bonds, Loma | 6/26 at 100.00 | BB– | 73,932,873 |
| | Linda University Medical Center, Series 2016A, 5.250%, 12/01/56, 144A | | | |
| 10,130 | | California Statewide Communities Development Authority, California, Revenue Bonds, Loma | 6/28 at 100.00 | BB– | 11,886,947 |
| | Linda University Medical Center, Series 2018A, 5.500%, 12/01/58, 144A | | | |
| 4,000 | | California Statewide Communities Development Authority, Revenue Bonds, Huntington | 7/24 at 100.00 | A– | 4,217,080 |
| | Memorial Hospital, Refunding Series 2014B, 4.000%, 7/01/39 | | | |
| 7,000 | | California Statewide Communities Development Authority, Revenue Bonds, Sutter Health, | 8/20 at 100.00 | A+ (4) | 7,274,120 |
| | Series 2011A, 6.000%, 8/15/42 (Pre-refunded 8/15/20) | | | |
| | California Statewide Community Development Authority, Revenue Bonds, Daughters of | | | |
| | Charity Health System, Series 2005A: | | | |
| 1,535 | | 5.750%, 7/01/30 | 12/19 at 100.00 | CC | 1,531,700 |
| 4,430 | | 5.750%, 7/01/35 | 12/19 at 100.00 | CC | 4,404,483 |
| 5,000 | | Clovis Unified School District, Fresno County, California, General Obligation Bonds, | No Opt. Call | Baa2 (4) | 4,633,550 |
| | Series 2001A, 0.000%, 8/01/25 – FGIC Insured (ETM) | | | |
| 3,400 | | Coachella Valley Unified School District, Riverside County, California, General | No Opt. Call | A2 | 2,407,948 |
| | Obligation Bonds, Election 2005 Series 2010C, 0.000%, 8/01/33 – AGM Insured | | | |
| 14,375 | | Corona-Norco Unified School District, Riverside County, California, General Obligation | No Opt. Call | AA | 7,693,787 |
| | Bonds, Capital Appreciation, Election 2006 Refunding Series 2009C, 0.000%, 8/01/39 – | | | |
| | AGM Insured | | | |
| | El Rancho Unified School District, Los Angeles County, California, General Obligation | | | |
| | Bonds, Election 2010 Series 2011A: | | | |
| 2,615 | | 0.000%, 8/01/31 – AGM Insured (6) | 8/28 at 100.00 | A1 | 2,940,594 |
| 3,600 | | 0.000%, 8/01/34 – AGM Insured (6) | 8/28 at 100.00 | A1 | 4,029,588 |
| | Foothill/Eastern Transportation Corridor Agency, California, Toll Road Revenue Bonds, | | | |
| | Refunding Senior Lien Series 2015A: | | | |
| 3,960 | | 0.000%, 1/15/34 – AGM Insured | No Opt. Call | BBB– | 2,698,186 |
| 5,000 | | 0.010%, 1/15/35 – AGM Insured | No Opt. Call | BBB– | 3,303,700 |
| | Foothill/Eastern Transportation Corridor Agency, California, Toll Road Revenue Bonds, | | | |
| | Refunding Series 2013A: | | | |
| 910 | | 0.000%, 1/15/42 (6) | 1/31 at 100.00 | BBB– | 955,573 |
| 3,610 | | 5.750%, 1/15/46 | 1/24 at 100.00 | BBB– | 4,175,759 |
| 6,610 | | 6.000%, 1/15/49 | 1/24 at 100.00 | BBB– | 7,744,606 |
| 4,445 | | Foothill/Eastern Transportation Corridor Agency, California, Toll Road Revenue Bonds, | 7/29 at 100.00 | BBB– | 4,659,427 |
| | Refunding Term Rate Sub-Series 2013B-1, 3.500%, 1/15/53 | | | |
| 2,425 | | Fullerton Public Financing Authority, California, Tax Allocation Revenue Bonds, Series | 3/20 at 100.00 | A | 2,455,701 |
| | 2005, 5.000%, 9/01/27 – AMBAC Insured | | | |
| | Golden State Tobacco Securitization Corporation, California, Tobacco Settlement | | | |
| | Asset-Backed Bonds, Series 2018A-1: | | | |
| 9,795 | | 5.000%, 6/01/47 | 6/22 at 100.00 | N/R | 10,073,178 |
| 6,240 | | 5.250%, 6/01/47 | 6/22 at 100.00 | N/R | 6,442,738 |
| 10,250 | | Golden State Tobacco Securitization Corporation, California, Tobacco Settlement | 6/22 at 100.00 | N/R | 10,541,100 |
| | Asset-Backed Bonds, Series 2018A-2, 5.000%, 6/01/47 | | | |
| | Kern Community College District, California, General Obligation Bonds, Safety, Repair & | | | |
| | Improvement, Election 2002 Series 2006: | | | |
| 5,600 | | 0.000%, 11/01/24 – AGM Insured | No Opt. Call | AA | 5,185,488 |
| 5,795 | | 0.000%, 11/01/25 – AGM Insured | No Opt. Call | AA | 5,256,355 |
| 1,195 | | Lincoln Public Financing Authority, Placer County, California, Twelve Bridges Limited | 9/21 at 100.00 | AA | 1,263,820 |
| | Obligation Revenue Bonds, Refunding Series 2011A, 4.375%, 9/02/25 – AGM Insured | | | |
29
| | | | | |
| NVG | Nuveen AMT-Free Municipal Credit Income Fund | |
| Portfolio of Investments (continued) | | | |
|
| October 31, 2019 | | | |
|
|
|
|
| Principal | | | Optional Call | | |
| Amount (000) | | Description (1) | Provisions (2) | Ratings (3) | Value |
| | California (continued) | | | |
| $ 7,575 | | Mount San Antonio Community College District, Los Angeles County, California, General | 8/35 at 100.00 | AA | $ 7,428,802 |
| | Obligation Bonds, Election of 2008, Series 2013A, 0.000%, 8/01/43 (6) | | | |
| 3,310 | | M-S-R Energy Authority, California, Gas Revenue Bonds, Citigroup Prepay Contracts, | No Opt. Call | BBB+ | 5,188,127 |
| | Series 2009B, 6.500%, 11/01/39 | | | |
| | Oceanside Unified School District, San Diego County, California, General Obligation | | | |
| | Bonds, Capital Appreciation, 2008 Election Series 2009A: | | | |
| 605 | | 0.000%, 8/01/26 – AGC Insured (ETM) | No Opt. Call | Aa3 (4) | 547,017 |
| 5,300 | | 0.000%, 8/01/26 – AGC Insured | No Opt. Call | Aa3 | 4,725,745 |
| 2,220 | | 0.000%, 8/01/28 – AGC Insured | No Opt. Call | Aa3 | 1,879,874 |
| 1,485 | | Ontario Redevelopment Financing Authority, San Bernardino County, California, Revenue | 1/20 at 100.00 | N/R (4) | 1,600,681 |
| | Bonds, Redevelopment Project 1, Series 1993, 5.850%, 8/01/22 – NPFG Insured (ETM) | | | |
| 3,905 | | Orange County, California, Special Tax Bonds, Community Facilities District 2015-1 | 8/25 at 100.00 | N/R | 4,215,955 |
| | Esencia Village, Series 2015A, 4.250%, 8/15/38 | | | |
| 5,000 | | Palomar Pomerado Health Care District, California, Certificates of Participation, Series | 11/20 at 100.00 | Ba1 (4) | 5,243,000 |
| | 2010, 6.000%, 11/01/30 (Pre-refunded 11/01/20) | | | |
| 3,700 | | Palomar Pomerado Health, California, General Obligation Bonds, Capital Appreciation, | No Opt. Call | BB+ | 3,297,181 |
| | Election of 2004, Series 2007A, 0.000%, 8/01/25 – NPFG Insured | | | |
| 7,875 | | Palomar Pomerado Health, California, General Obligation Bonds, Series 2009A, 7.000%, | 8/29 at 100.00 | BB+ | 10,896,480 |
| | 8/01/38 – AGC Insured | | | |
| 9,145 | | Pittsburg Redevelopment Agency, California, Tax Allocation Bonds, Los Medanos Community | No Opt. Call | A | 7,038,541 |
| | Development Project, Series 1999, 0.000%, 8/01/30 – AMBAC Insured | | | |
| 4,150 | | Placentia-Yorba Linda Unified School District, Orange County, California, Certificates | 10/21 at 100.00 | A2 | 4,557,654 |
| | of Participation, Refunding Series 2011, 6.250%, 10/01/28 – AGM Insured | | | |
| 670 | | Riverside County Transportation Commission, California, Toll Revenue Senior Lien Bonds, | 6/23 at 100.00 | BBB | 750,320 |
| | Series 2013A, 5.750%, 6/01/48 | | | |
| | San Clemente, California, Special Tax Revenue Bonds, Community Facilities District | | | |
| | 2006-1 Marblehead Coastal, Series 2015: | | | |
| 490 | | 5.000%, 9/01/40 | 9/25 at 100.00 | N/R | 555,150 |
| 915 | | 5.000%, 9/01/46 | 9/25 at 100.00 | N/R | 1,031,974 |
| 4,000 | | San Francisco Airports Commission, California, Revenue Bonds, San Francisco | 5/23 at 100.00 | A+ | 4,448,480 |
| | International Airport, Governmental Purpose, Second Series 2013B, 5.000%, 5/01/43 | | | |
| 66,685 | | San Joaquin Hills Transportation Corridor Agency, Orange County, California, Senior Lien | No Opt. Call | AA+ (4) | 65,774,750 |
| | Toll Road Revenue Bonds, Series 1993, 0.000%, 1/01/21 (ETM) | | | |
| | San Joaquin Hills Transportation Corridor Agency, Orange County, California, Toll Road | | | |
| | Revenue Bonds, Refunding Senior Lien Series 2014A: | | | |
| 2,680 | | 5.000%, 1/15/44 | 1/25 at 100.00 | BBB | 3,042,792 |
| 8,275 | | 5.000%, 1/15/50 | 1/25 at 100.00 | BBB | 9,326,670 |
| 7,210 | | San Joaquin Hills Transportation Corridor Agency, Orange County, California, Toll Road | No Opt. Call | Baa2 | 6,764,278 |
| | Revenue Bonds, Refunding Series 1997A, 0.000%, 1/15/23 – NPFG Insured | | | |
| 3,250 | | San Mateo County Community College District, California, General Obligation Bonds, | No Opt. Call | AAA | 2,617,810 |
| | Series 2006C, 0.000%, 9/01/30 – NPFG Insured | | | |
| 4,325 | | San Ysidro School District, San Diego County, California, General Obligation Bonds, 1997 | No Opt. Call | AA | 2,862,674 |
| | Election Series 2012G, 0.000%, 8/01/34 – AGM Insured | | | |
| 5,690 | | San Ysidro School District, San Diego County, California, General Obligation Bonds, | 8/25 at 41.10 | A2 | 1,999,238 |
| | Refunding Series 2015, 0.000%, 8/01/42 | | | |
| | Santa Ana Financing Authority, California, Lease Revenue Bonds, Police Administration | | | |
| | and Housing Facility, Series 1994A: | | | |
| 5,625 | | 6.250%, 7/01/24 | No Opt. Call | Baa2 | 6,361,819 |
| 5,625 | | 6.250%, 7/01/24 (ETM) | No Opt. Call | Baa2 (4) | 6,402,712 |
| 3,500 | | Saugus Union School District, Los Angeles County, California, General Obligation Bonds, | No Opt. Call | A+ | 3,325,140 |
| | Series 2006, 0.000%, 8/01/23 – FGIC Insured | | | |
| 610 | | Temecula Public Financing Authority, California, Special Tax Bonds, Community Facilities | 9/27 at 100.00 | N/R | 655,964 |
| | District 16-01, Series 2017, 6.250%, 9/01/47, 144A | | | |
30
| | | | | | |
| Principal | | | Optional Call | | |
| Amount (000) | | Description (1) | Provisions (2) | Ratings (3) | Value |
| | California (continued) | | | |
| | Tobacco Securitization Authority of Northern California, Tobacco Settlement Asset-Backed | | | |
| | Bonds, Series 2005A-1: | | | |
| $ 860 | | 4.750%, 6/01/23 | 11/19 at 100.00 | BBB | $ 864,111 |
| 1,600 | | 5.500%, 6/01/45 | 11/19 at 100.00 | B– | 1,606,224 |
| | Tobacco Securitization Authority of Southern California, Tobacco Settlement Asset-Backed | | | |
| | Bonds, San Diego County Tobacco Asset Securitization Corporation, Senior Series 2006A: | | | |
| 480 | | 4.750%, 6/01/25 | 11/19 at 100.00 | A3 | 480,504 |
| 2,865 | | 5.125%, 6/01/46 | 11/19 at 100.00 | B– | 2,868,266 |
| 516,245 | | Total California | | | 540,810,325 |
| | Colorado – 10.1% (6.5% of Total Investments) | | | |
| 850 | | Aviation Station North Metropolitan District 2, Denver County, Colorado, Limited Tax | 9/24 at 103.00 | N/R | 911,880 |
| | General Obligation Bonds, Refunding & Improvement Series 2019A, 5.000%, 12/01/39 | | | |
| | Base Village Metropolitan District 2, Colorado, General Obligation Bonds, Refunding | | | |
| | Series 2016A: | | | |
| 890 | | 5.500%, 12/01/36 | 12/21 at 103.00 | N/R | 938,327 |
| 1,175 | | 5.750%, 12/01/46 | 12/21 at 103.00 | N/R | 1,238,051 |
| 1,100 | | Belleview Station Metropolitan District 2, Denver City and County, Colorado, General | 12/21 at 103.00 | N/R | 1,154,098 |
| | Obligation Bonds, Limited Tax Convertible to Unlimited Tax Refunding & Improvement Series | | | |
| | 2017, 5.000%, 12/01/36 | | | |
| 700 | | Brighton Crossing Metropolitan District 4, Colorado, General Obligation Bonds, Limited | 12/22 at 103.00 | N/R | 741,580 |
| | Tax Convertible to Unlimited Tax, Series 2017A, 5.000%, 12/01/47 | | | |
| 3,410 | | Canyons Metropolitan District 5, Douglas County, Colorado, Limited Tax General | 12/22 at 103.00 | N/R | 3,590,457 |
| | Obligation and Special Revenue Bonds, Refunding & Improvement Series 2017A, 6.125%, 12/01/47 | | | |
| 1,690 | | Canyons Metropolitan District 6, Douglas County, Colorado, Limited Tax General | 12/22 at 103.00 | N/R | 1,744,722 |
| | Obligation and Special Revenue Bonds, Refunding & Improvement Series 2017A, 6.125%, 12/01/47 | | | |
| | Centerra Metropolitan District 1, Loveland, Colorado, Special Revenue Bonds, Refunding & | | | |
| | Improvement Series 2017: | | | |
| 1,140 | | 5.000%, 12/01/37, 144A | 12/22 at 103.00 | N/R | 1,211,501 |
| 5,465 | | 5.000%, 12/01/47, 144A | 12/22 at 103.00 | N/R | 5,756,995 |
| 195 | | Central Platte Valley Metropolitan District, Colorado, General Obligation Bonds, | 12/23 at 100.00 | BB | 210,239 |
| | Refunding Series 2014, 5.000%, 12/01/43 | | | |
| 1,200 | | Clear Creek Station Metropolitan District 2, Adams County, Colorado, Limited Tax General | 12/22 at 103.00 | N/R | 1,257,516 |
| | Obligation Refunding & Improvement Series 2017A, 5.000%, 12/01/47 | | | |
| 930 | | Colorado Educational and Cultural Facilities Authority, Charter School Revenue Bonds, | 8/26 at 100.00 | A+ | 957,621 |
| | Flagstaff Academy Project, Refunding Series 2016, 3.625%, 8/01/46 | | | |
| 1,165 | | Colorado Educational and Cultural Facilities Authority, Charter School Revenue Bonds, | 12/24 at 100.00 | A+ | 1,310,590 |
| | The Classical Academy Project, Refunding Series 2015A, 5.000%, 12/01/38 | | | |
| 3,675 | | Colorado Educational and Cultural Facilities Authority, Charter School Revenue Bonds, | 6/26 at 100.00 | A+ | 3,810,019 |
| | Vanguard School Project, Refunding & Improvement Series 2016, 3.750%, 6/15/47 | | | |
| 1,750 | | Colorado Educational and Cultural Facilities Authority, Charter School Revenue Bonds, | 6/26 at 100.00 | A+ | 1,767,675 |
| | Weld County School District 6 – Frontier Academy, Refunding & Improvement Series 2016, | | | |
| | 3.250%, 6/01/46 | | | |
| | Colorado Health Facilities Authority, Colorado, Health Facilities Revenue Bonds, The | | | |
| | Evangelical Lutheran Good Samaritan Society Project, Refunding Series 2017: | | | |
| 2,460 | | 5.000%, 6/01/42 (Pre-refunded 6/01/27) | 6/27 at 100.00 | N/R (4) | 3,066,341 |
| 23,470 | | 5.000%, 6/01/47 (Pre-refunded 6/01/27) | 6/27 at 100.00 | N/R (4) | 29,254,886 |
| 3,000 | | Colorado Health Facilities Authority, Colorado, Revenue Bonds, Catholic Health | 2/21 at 100.00 | BBB+ (4) | 3,139,650 |
| | Initiatives, Series 2011A, 5.000%, 2/01/41 (Pre-refunded 2/01/21) | | | |
| 11,520 | | Colorado Health Facilities Authority, Colorado, Revenue Bonds, Catholic Health | 1/23 at 100.00 | BBB+ (4) | 12,934,771 |
| | Initiatives, Series 2013A, 5.250%, 1/01/45 (Pre-refunded 1/01/23) | | | |
31
| | | | | |
| NVG | Nuveen AMT-Free Municipal Credit Income Fund | |
| Portfolio of Investments (continued) | | | |
|
| October 31, 2019 | | | |
|
|
|
|
| Principal | | | Optional Call | | |
| Amount (000) | | Description (1) | Provisions (2) | Ratings (3) | Value |
| | Colorado (continued) | | | |
| | Colorado Health Facilities Authority, Colorado, Revenue Bonds, CommonSpirit Health, | | | |
| | Series 2019A-2: | | | |
| $ 1,310 | | 4.000%, 8/01/49 | 8/29 at 100.00 | BBB+ | $ 1,401,726 |
| 3,320 | | 4.000%, 8/01/49 (UB) (5) | 8/29 at 100.00 | BBB+ | 3,552,466 |
| | Colorado Health Facilities Authority, Colorado, Revenue Bonds, Covenant Retirement | | | |
| | Communities Inc, Refunding Series 2012B: | | | |
| 1,640 | | 5.000%, 12/01/22 | No Opt. Call | A– | 1,806,968 |
| 2,895 | | 5.000%, 12/01/23 | 12/22 at 100.00 | A– | 3,179,955 |
| 4,200 | | 5.000%, 12/01/24 | 12/22 at 100.00 | A– | 4,616,262 |
| | Colorado Health Facilities Authority, Colorado, Revenue Bonds, Evangelical Lutheran Good | | | |
| | Samaritan Society Project, Series 2013: | | | |
| 765 | | 5.500%, 6/01/33 (Pre-refunded 6/01/23) | 6/23 at 100.00 | N/R (4) | 879,192 |
| 1,575 | | 5.625%, 6/01/43 (Pre-refunded 6/01/23) | 6/23 at 100.00 | N/R (4) | 1,816,967 |
| | Colorado Health Facilities Authority, Colorado, Revenue Bonds, Evangelical Lutheran Good | | | |
| | Samaritan Society Project, Series 2013A: | | | |
| 1,410 | | 5.000%, 6/01/32 (Pre-refunded 6/01/25) | 6/25 at 100.00 | N/R (4) | 1,688,827 |
| 2,000 | | 5.000%, 6/01/33 (Pre-refunded 6/01/25) | 6/25 at 100.00 | N/R (4) | 2,395,500 |
| 5,855 | | 5.000%, 6/01/40 (Pre-refunded 6/01/25) | 6/25 at 100.00 | N/R (4) | 7,012,826 |
| 6,820 | | 5.000%, 6/01/45 (Pre-refunded 6/01/25) | 6/25 at 100.00 | N/R (4) | 8,168,655 |
| 2,035 | | Colorado Health Facilities Authority, Colorado, Revenue Bonds, Frasier Meadows Project, | 5/27 at 100.00 | BB+ | 2,290,454 |
| | Refunding & Improvement Series 2017A, 5.250%, 5/15/47 | | | |
| 11,830 | | Colorado Health Facilities Authority, Colorado, Revenue Bonds, Sisters of Charity of | 1/20 at 100.00 | AA– | 11,901,098 |
| | Leavenworth Health Services Corporation, Series 2010A, 5.000%, 1/01/40 | | | |
| 4,105 | | Colorado International Center Metropolitan District 14, Denver, Colorado, Limited Tax | 12/23 at 103.00 | N/R | 4,488,284 |
| | General Obligation Bonds, Refunding & Improvement Series 2018, 5.875%, 12/01/46 | | | |
| 500 | | Copperleaf Metropolitan District 2, Arapahoe County, Colorado, General Obligation Bonds, | 12/20 at 103.00 | N/R | 523,855 |
| | Refunding Limited Tax Convertible to Unlimited Tax Series 2015, 5.750%, 12/01/45 | | | |
| 500 | | Copperleaf Metropolitan District 2, Colorado, General Obligation Limited Tax Bonds, | 12/20 at 103.00 | N/R | 523,810 |
| | Series 2006, 5.250%, 12/01/30 | | | |
| 1,480 | | Cornerstar Metropolitan District, Arapahoe County, Colorado, General Obligation Bonds, | 12/22 at 103.00 | N/R | 1,568,726 |
| | Limited Tax Convertible to Unlimited Tax, Refunding Series 2017A, 5.250%, 12/01/47 | | | |
| 1,275 | | Cornerstar Metropolitan District, Arapahoe County, Colorado, General Obligation Bonds, | 12/22 at 103.00 | N/R | 1,349,536 |
| | Limited Tax Convertible to Unlimited Tax, Refunding Series 2017B, 5.250%, 12/01/47 | | | |
| 500 | | Crystal Crossing Metropolitan District, Colorado, General Obligation Limited Tax Bonds, | 12/25 at 100.00 | N/R | 525,435 |
| | Refunding Series 2016, 5.250%, 12/01/40 | | | |
| 10,640 | | Denver City and County, Colorado, Airport System Revenue Bonds, Subordinate Lien Series | 11/23 at 100.00 | A | 11,918,502 |
| | 2013B, 5.000%, 11/15/43 | | | |
| 505 | | Denver Connection West Metropolitan District, City and County of Denver, Colorado, | 12/22 at 103.00 | N/R | 528,513 |
| | Limited Tax General Obligation Bonds, Convertible to Unlimited Tax Series 2017A, 5.375%, 8/01/47 | | | |
| | Denver Urban Renewal Authority, Colorado, Tax Increment Revenue Bonds, 9th and Colorado | | | |
| | Urban Redevelopment Area, Series 2018A: | | | |
| 1,005 | | 5.250%, 12/01/39, 144A | 12/23 at 103.00 | N/R | 1,075,852 |
| 2,310 | | 5.250%, 12/01/39, 144A | 12/23 at 103.00 | N/R | 2,472,855 |
| 11,700 | | E-470 Public Highway Authority, Colorado, Senior Revenue Bonds, Capital Appreciation | No Opt. Call | A | 6,056,271 |
| | Series 2010A, 0.000%, 9/01/41 | | | |
| | E-470 Public Highway Authority, Colorado, Senior Revenue Bonds, Series 1997B: | | | |
| 35,995 | | 0.000%, 9/01/23 – NPFG Insured | No Opt. Call | A | 33,872,015 |
| 6,525 | | 0.010%, 9/01/26 – NPFG Insured | No Opt. Call | A | 5,710,093 |
| | E-470 Public Highway Authority, Colorado, Senior Revenue Bonds, Series 2000B: | | | |
| 17,030 | | 0.010%, 9/01/25 – NPFG Insured | No Opt. Call | A | 15,315,420 |
| 9,915 | | 0.000%, 9/01/32 – NPFG Insured | No Opt. Call | A | 7,103,503 |
| 43,090 | | 0.000%, 9/01/33 – NPFG Insured | No Opt. Call | A | 29,866,972 |
32
| | | | | | |
| Principal | | | Optional Call | | |
| Amount (000) | | Description (1) | Provisions (2) | Ratings (3) | Value |
| | Colorado (continued) | | | |
| | E-470 Public Highway Authority, Colorado, Toll Revenue Bonds, Series 2004A: | | | |
| $ 20,000 | | 0.010%, 9/01/27 – NPFG Insured | No Opt. Call | A | $ 16,991,800 |
| 1,150 | | 0.000%, 9/01/28 – NPFG Insured | No Opt. Call | A | 946,772 |
| 7,000 | | 0.010%, 9/01/34 – NPFG Insured | No Opt. Call | A | 4,688,600 |
| 500 | | Erie Highlands Metropolitan District No 1 (In the Town of Erie), Weld County, Colorado, | 12/20 at 103.00 | N/R | 519,990 |
| | General Obligation Limited Tax Bonds, Series 2015A, 5.750%, 12/01/45 | | | |
| 500 | | Flatiron Meadows Metropolitan District, Boulder County, Colorado, General Obligation | 12/21 at 103.00 | N/R | 516,230 |
| | Limited Tax Bonds, Series 2016, 5.125%, 12/01/46 | | | |
| 590 | | Foothills Metropolitan District, Fort Collins, Colorado, Special Revenue Bonds, Series | 12/24 at 100.00 | N/R | 623,158 |
| | 2014, 6.000%, 12/01/38 | | | |
| 825 | | Forest Trace Metropolitan District 3, Aurora City, Arapahoe County, Colorado, General | 12/21 at 103.00 | N/R | 860,219 |
| | Obligation Bonds, Limited Tax Convertible to Unlimited Tax, Series 2016A, 5.000%, 12/01/46 | | | |
| 1,355 | | Great Western Park Metropolitan District 2, Broomfield City and County, Colorado, | 12/21 at 100.00 | N/R | 1,400,284 |
| | General Obligation Bonds, Series 2016A, 5.000%, 12/01/46 | | | |
| 750 | | Green Gables Metropolitan District No 1, Jefferson County, Colorado, General Obligation | 12/21 at 103.00 | N/R | 784,905 |
| | Bonds, Series 2016A, 5.300%, 12/01/46 | | | |
| 700 | | Harmony Technology Park Metropolitan District 2, Fort Collins, Colorado, General | 12/22 at 103.00 | N/R | 728,966 |
| | Obligation Bonds, Limited Tax Convertible to Unlimited Tax Series 2017, 5.000%, 9/01/47 | | | |
| 3,740 | | Jefferson Center Metropolitan District 1, Arvada, Jefferson County, Colorado, Revenue | 12/20 at 103.00 | N/R | 3,823,514 |
| | Bonds, Refunding Series 2015, 5.500%, 12/01/45 | | | |
| | Johnstown Plaza Metropolitan District, Colorado, Special Revenue Bonds, Series 2016A: | | | |
| 2,325 | | 5.250%, 12/01/36 | 12/21 at 103.00 | N/R | 2,376,801 |
| 8,955 | | 5.375%, 12/01/46 | 12/21 at 103.00 | N/R | 9,157,473 |
| | Lambertson Farms Metropolitan District 1, Colorado, Revenue Bonds, Refunding & | | | |
| | Improvement Series 2015: | | | |
| 1,005 | | 5.750%, 12/15/46 | 12/23 at 100.00 | N/R | 1,048,959 |
| 5,355 | | 6.000%, 12/15/50 | 12/23 at 100.00 | N/R | 5,628,694 |
| 980 | | Leyden Rock Metropolitan District No 10, In the City of Arvada, Colorado, Limited Tax | 12/21 at 103.00 | N/R | 1,029,029 |
| | General Obligation Bonds, Refunding and Improvement Series 20016A, 5.000%, 12/01/45 | | | |
| 500 | | Littleton Village Metropolitan District No 2, Colorado, Limited Tax General Obligation | 12/20 at 103.00 | N/R | 520,230 |
| | and Special Revenue Bonds, Series 2015, 5.375%, 12/01/45 | | | |
| 860 | | Mountain Shadows Metropolitan District, Colorado, General Obligation Limited Tax Bonds, | 12/25 at 100.00 | N/R | 910,207 |
| | Refunding Series 2016, 5.000%, 12/01/35 | | | |
| 5,155 | | North Range Metropolitan District 1, Adams County, Colorado, General Obligation Bonds, | 12/25 at 100.00 | Baa1 | 5,349,756 |
| | Series 2016B, 3.500%, 12/01/45 | | | |
| | North Range Metropolitan District No 2 , In the City of Commerce City, Adams County, | | | |
| | Colorado , Limited Tax General Obligation and Special Revenue and Improvement Bonds, Refunding | | | |
| | Series 2017A: | | | |
| 1,000 | | 5.625%, 12/01/37 | 12/22 at 103.00 | N/R | 1,055,920 |
| 1,000 | | 5.750%, 12/01/47 | 12/22 at 103.00 | N/R | 1,056,510 |
| 585 | | Overlook Metropolitan District in the Town of Parker, Douglas County, Colorado, General | 12/21 at 103.00 | N/R | 598,203 |
| | Obligation Limited Tax Bonds, Series 2016A, 5.500%, 12/01/46 | | | |
| | Park 70 Metropolitan District, Aurora, Colorado, General Obligation Bonds, Limited Tax | | | |
| | Refunding & Improvement Series 2016: | | | |
| 660 | | 5.000%, 12/01/36 | 12/26 at 100.00 | Baa3 | 741,022 |
| 1,060 | | 5.000%, 12/01/46 | 12/26 at 100.00 | Baa3 | 1,176,547 |
| 660 | | Park Creek Metropolitan District, Colorado, Senior Limited Property Tax Supported | 12/25 at 100.00 | A | 744,176 |
| | Revenue Bonds, Refunding Series 2015A, 5.000%, 12/01/45 | | | |
| 880 | | Park Creek Metropolitan District, Colorado, Senior Limited Property Tax Supported | 12/20 at 100.00 | A2 (4) | 926,050 |
| | Revenue Refunding Bonds, Series 2011, 6.125%, 12/01/41 (Pre-refunded 12/01/20) – AGM Insured | | | |
| 5,435 | | Poudre Tech Metro District, Colorado, Unlimited Property Tax Supported Revenue Bonds, | 12/20 at 100.00 | AA | 5,607,235 |
| | Refunding & Improvement Series 2010A, 5.000%, 12/01/39 – AGM Insured | | | |
33
| | | | | |
| NVG | Nuveen AMT-Free Municipal Credit Income Fund | |
| Portfolio of Investments (continued) | | | |
|
| October 31, 2019 | | | |
|
|
|
|
| Principal | | | Optional Call | | |
| Amount (000) | | Description (1) | Provisions (2) | Ratings (3) | Value |
| | Colorado (continued) | | | |
| $ 2,760 | | Prairie Center Metropolitan District No 3, In the City of Brighton, Adams County, | 12/26 at 100.00 | N/R | $ 2,922,288 |
| | Colorado, Limited Property Tax Supported Primary Improvements Revenue Bonds, Refunding Series | | | |
| | 2017A, 5.000%, 12/15/41, 144A | | | |
| | Reata South Metropolitan District, Douglas County, Colorado, Limited Tax General | | | |
| | Obligation Bonds, Refunding Series 2018: | | | |
| 1,310 | | 5.375%, 12/01/37 | 12/23 at 103.00 | N/R | 1,372,277 |
| 2,765 | | 5.500%, 12/01/47 | 12/23 at 103.00 | N/R | 2,901,812 |
| 1,180 | | Regional Transportation District, Colorado, Certificates of Participation, Series 2010A, | 6/20 at 100.00 | AA– | 1,205,866 |
| | 5.375%, 6/01/31 | | | |
| | Regional Transportation District, Colorado, Denver Transit Partners Eagle P3 Project | | | |
| | Private Activity Bonds, Series 2010: | | | |
| 6,500 | | 6.500%, 1/15/30 | 7/20 at 100.00 | Baa3 | 6,690,255 |
| 3,750 | | 6.000%, 1/15/41 | 7/20 at 100.00 | Baa3 | 3,846,862 |
| 1,280 | | Sierra Ridge Metropolitan District 2, Douglas County, Colorado, General Obligation | 12/21 at 103.00 | N/R | 1,345,549 |
| | Bonds, Limited Tax Series 2016A, 5.500%, 12/01/46 | | | |
| 930 | | SouthGlenn Metropolitan District, Colorado, Special Revenue Bonds, Refunding Series | 12/21 at 103.00 | N/R | 977,839 |
| | 2016, 5.000%, 12/01/46 | | | |
| 1,000 | | St Vrain Lakes Metropolitan District No 2, Weld County, Colorado, Limited Tax General | 12/22 at 103.00 | N/R | 1,052,880 |
| | Obligation Bonds, Series 2017A, 5.000%, 12/01/37 | | | |
| | Sterling Ranch Community Authority Board, Douglas County, Colorado, Limited Tax | | | |
| | Supported Revenue Bonds, Senior Series 2015A: | | | |
| 500 | | 5.500%, 12/01/35 | 12/20 at 103.00 | N/R | 523,040 |
| 1,000 | | 5.750%, 12/01/45 | 12/20 at 103.00 | N/R | 1,045,100 |
| 500 | | Table Mountain Metropolitan District, Jefferson County, Colorado, Limited Tax General | 12/21 at 103.00 | N/R | 527,750 |
| | Obligation Bonds, Series 2016A, 5.250%, 12/01/45 | | | |
| 500 | | The Village at Dry Creek Metropolitan District No 2, In the City of Thornton, Adams | 9/24 at 103.00 | N/R | 514,160 |
| | County, Colorado, Limited Tax General Obligation and Special Revenue Bonds, Series 2019, | | | |
| | 4.375%, 12/01/44 | | | |
| 8,500 | | University of Colorado Hospital Authority, Colorado, Revenue Bonds, Series 2012A, | 11/22 at 100.00 | Aa3 | 9,268,910 |
| | 5.000%, 11/15/42 | | | |
| 364,515 | | Total Colorado | | | 352,613,295 |
| | Connecticut – 0.4% (0.3% of Total Investments) | | | |
| | Connecticut Health and Educational Facilities Authority, Revenue Bonds, Healthcare | | | |
| | Facility Expansion Church Home of Hartford Inc Project, Series 2016A: | | | |
| 590 | | 5.000%, 9/01/46, 144A | 9/26 at 100.00 | BB | 642,911 |
| 740 | | 5.000%, 9/01/53, 144A | 9/26 at 100.00 | BB | 803,092 |
| 10,105 | | Connecticut Health and Educational Facilities Authority, Revenue Bonds, Quinnipiac | 7/25 at 100.00 | A– | 10,858,631 |
| | University, Refunding Series 2015L, 4.125%, 7/01/41 | | | |
| 3,250 | | Connecticut Health and Educational Facilities Authority, Revenue Bonds, Wesleyan | 7/20 at 100.00 | AA (4) | 3,333,297 |
| | University, Series 2010G, 5.000%, 7/01/39 (Pre-refunded 7/01/20) | | | |
| 14,685 | | Total Connecticut | | | 15,637,931 |
| | Delaware – 0.2% (0.1% of Total Investments) | | | |
| 2,615 | | Delaware Economic Development Authority, Exempt Facility Revenue Bonds, Indian River | 10/20 at 100.00 | Baa3 | 2,694,104 |
| | Power LLC Project, Series 2010, 5.375%, 10/01/45 | | | |
| | Kent County, Delaware, Student Housing & Dining Facility Revenue Bonds, Collegiate | | | |
| | Housing Foundation – Dover LLC Delaware State University Project, Series 2018A: | | | |
| 2,585 | | 5.000%, 7/01/53 | 1/28 at 100.00 | BB+ | 2,867,696 |
| 1,000 | | 5.000%, 7/01/58 | 1/28 at 100.00 | BB+ | 1,101,880 |
| 6,200 | | Total Delaware | | | 6,663,680 |
| | District of Columbia – 1.4% (0.9% of Total Investments) | | | |
| 3,780 | | District of Columbia Student Dormitory Revenue Bonds, Provident Group – Howard | 10/22 at 100.00 | BB+ | 3,896,311 |
| | Properties LLC Issue, Series 2013, 5.000%, 10/01/45 | | | |
34
| | | | | | |
| Principal | | | Optional Call | | |
| Amount (000) | | Description (1) | Provisions (2) | Ratings (3) | Value |
| | District of Columbia (continued) | | | |
| $ 5,095 | | District of Columbia Tobacco Settlement Corporation, Tobacco Settlement Asset-Backed | No Opt. Call | Baa1 | $ 5,823,585 |
| | Bonds, Series 2001, 6.500%, 5/15/33 | | | |
| 186,000 | | District of Columbia Tobacco Settlement Corporation, Tobacco Settlement Asset-Backed | 12/19 at 19.53 | N/R | 35,529,720 |
| | Bonds, Series 2006A, 0.000%, 6/15/46 | | | |
| 1,500 | | District of Columbia, Revenue Bonds, Ingleside at Rock Creek Project, Series 2017A, | 7/24 at 103.00 | N/R | 1,609,860 |
| | 5.000%, 7/01/42 | | | |
| 3,000 | | Metropolitan Washington Airports Authority, Virginia, Dulles Toll Road Revenue Bonds, | 10/28 at 100.00 | A– | 3,620,070 |
| | Dulles Metrorail & Capital Improvement Projects, Refunding First Senior Lien Series 2019A, | | | |
| | 5.000%, 10/01/44 | | | |
| 199,375 | | Total District of Columbia | | | 50,479,546 |
| | Florida – 5.1% (3.3% of Total Investments) | | | |
| 990 | | Bexley Community Development District, Pasco County, Florida, Special Assessment Revenue | 5/26 at 100.00 | N/R | 1,032,144 |
| | Bonds, Series 2016, 4.700%, 5/01/36 | | | |
| 19,000 | | Cape Coral, Florida, Water and Sewer Revenue Bonds, Refunding Series 2011, 5.000%, | 10/21 at 100.00 | A (4) | 20,391,560 |
| | 10/01/41 (Pre-refunded 10/01/21) – AGM Insured | | | |
| | Capital Trust Agency, Florida, Revenue Bonds, Babcock Neighborhood School Inc, | | | |
| | Series 2018: | | | |
| 1,290 | | 6.100%, 8/15/38, 144A | 8/28 at 100.00 | N/R | 1,351,443 |
| 1,045 | | 6.200%, 8/15/48, 144A | 8/28 at 100.00 | N/R | 1,094,554 |
| | Capital Trust Agency, Florida, Revenue Bonds, Odyssey Charter School Project, | | | |
| | Series 2017A: | | | |
| 1,065 | | 5.375%, 7/01/37, 144A | 7/27 at 100.00 | BB | 1,154,875 |
| 1,470 | | 5.500%, 7/01/47, 144A | 7/27 at 100.00 | BB | 1,581,985 |
| 4,325 | | Capital Trust Agency, Florida, Revenue Bonds, Provision CARES Proton Therapy Center, | 6/28 at 100.00 | N/R | 4,727,052 |
| | Orlando Project, Series 2018, 7.500%, 6/01/48, 144A | | | |
| | Capital Trust Agency, Florida, Revenue Bonds, Renaissance Charter School Project, | | | |
| | Series 2017A: | | | |
| 6,050 | | 5.125%, 6/15/37, 144A | 6/27 at 100.00 | N/R | 6,496,792 |
| 1,890 | | 5.250%, 6/15/47, 144A | 6/27 at 100.00 | N/R | 2,013,020 |
| 880 | | Capital Trust Agency, Florida, Revenue Bonds, Viera Charter School Project, Series | 10/27 at 100.00 | Ba2 | 946,827 |
| | 2017A, 5.000%, 10/15/37, 144A | | | |
| 4,670 | | City of Miami Beach, Florida, Stormwater Revenue Bonds, Series 2015, 5.000%, 9/01/41 | 9/25 at 100.00 | AA– | 5,425,419 |
| 1,025 | | Cityplace Community Development District, Florida, Special Assessment and Revenue | No Opt. Call | A | 1,170,007 |
| | Bonds, Refunding Series 2012, 5.000%, 5/01/26 | | | |
| 1,480 | | Collier County Educational Facilities Authority, Florida, Revenue Bonds, Hodges | 11/23 at 100.00 | BB+ | 1,620,674 |
| | University, Refunding Series 2013, 6.125%, 11/01/43 | | | |
| | Creekside at Twin Creeks Community Development District, Florida, Special Assessment | | | |
| | Bonds, Area 1 Project, Series 2016A-1: | | | |
| 245 | | 5.250%, 11/01/37 | 11/28 at 100.00 | N/R | 263,718 |
| 320 | | 5.600%, 11/01/46 | 11/28 at 100.00 | N/R | 348,336 |
| 25 | | Creekside at Twin Creeks Community Development District, Florida, Special Assessment | No Opt. Call | N/R | 27,405 |
| | Bonds, Area 1 Project, Series 2016A-2, 5.625%, 11/01/35 | | | |
| | Davie, Florida, Educational Facilities Revenue Bonds, Nova Southeastern University | | | |
| | Project, Series 2013A: | | | |
| 3,445 | | 6.000%, 4/01/42 | 4/23 at 100.00 | Baa1 | 3,871,422 |
| 1,720 | | 5.625%, 4/01/43 | 4/23 at 100.00 | Baa1 | 1,907,067 |
| 4,000 | | Davie, Florida, Water and Sewerage Revenue Bonds, Series 2011, 5.000%, 10/01/41 – | 10/21 at 100.00 | A1 | 4,267,600 |
| | AGM Insured | | | |
35
| | | | | |
| NVG | Nuveen AMT-Free Municipal Credit Income Fund | |
| Portfolio of Investments (continued) | | | |
|
| October 31, 2019 | | | |
|
|
|
|
| Principal | | | Optional Call | | |
| Amount (000) | | Description (1) | Provisions (2) | Ratings (3) | Value |
| | Florida (continued) | | | |
| | Downtown Doral Community Development District, Florida, Special Assessment Bonds, | | | |
| | Series 2015: | | | |
| $ 280 | | 5.250%, 5/01/35 | 5/26 at 100.00 | N/R | $ 295,739 |
| 315 | | 5.300%, 5/01/36 | 5/26 at 100.00 | N/R | 332,678 |
| 475 | | 5.500%, 5/01/45 | 5/26 at 100.00 | N/R | 505,500 |
| 655 | | 5.500%, 5/01/46 | 5/26 at 100.00 | N/R | 697,058 |
| | Florida Development Finance Corporation, Educational Facilities Revenue Bonds, Classical | | | |
| | Preparatory Incorporated Project, Series 2017A: | | | |
| 255 | | 6.000%, 6/15/37, 144A | 6/26 at 100.00 | N/R | 255,668 |
| 665 | | 6.125%, 6/15/46, 144A | 6/26 at 100.00 | N/R | 657,632 |
| 415 | | Florida Development Finance Corporation, Educational Facilities Revenue Bonds, Classical | 6/26 at 100.00 | N/R | 416,087 |
| | Preparatory Incorporated Project, Series 2018A, 6.000%, 6/15/37, 144A | | | |
| | Florida Development Finance Corporation, Educational Facilities Revenue Bonds, Downtown | | | |
| | Doral Charter Upper School Project, Series 2017C: | | | |
| 2,375 | | 5.650%, 7/01/37, 144A | 7/27 at 101.00 | N/R | 2,453,589 |
| 3,735 | | 5.750%, 7/01/47, 144A | 7/27 at 101.00 | N/R | 3,852,802 |
| | Florida Development Finance Corporation, Educational Facilities Revenue Bonds, Florida | | | |
| | Charter Foundation Inc Projects, Series 2016A: | | | |
| 1,485 | | 6.250%, 6/15/36, 144A | 6/26 at 100.00 | N/R | 1,695,009 |
| 2,075 | | 4.750%, 7/15/36, 144A | 7/26 at 100.00 | N/R | 2,119,011 |
| 4,250 | | 6.375%, 6/15/46, 144A | 6/26 at 100.00 | N/R | 4,828,637 |
| 1,335 | | 5.000%, 7/15/46, 144A | 7/26 at 100.00 | N/R | 1,367,708 |
| | Florida Development Finance Corporation, Educational Facilities Revenue Bonds, | | | |
| | Renaissance Charter School Income Projects, Series 2015A: | | | |
| 3,090 | | 6.000%, 6/15/35, 144A | 6/25 at 100.00 | N/R | 3,419,116 |
| 3,450 | | 6.125%, 6/15/46, 144A | 6/25 at 100.00 | N/R | 3,777,612 |
| 550 | | Florida Development Finance Corporation, Educational Facilities Revenue Bonds, | 6/24 at 100.00 | N/R | 592,048 |
| | Renaissance Charter School, Inc Projects, Series 2014A, 6.125%, 6/15/44 | | | |
| 4,430 | | Florida Development Finance Corporation, Educational Facilities Revenue Bonds, Southwest | 6/27 at 100.00 | N/R | 4,690,351 |
| | Charter Foundation Inc Projects, Series 2017A, 6.125%, 6/15/47, 144A | | | |
| 1,435 | | Grand Bay at Doral Community Development District, Miami-Dade County, Florida, Special | 5/26 at 100.00 | N/R | 1,491,840 |
| | Assessment Bonds, South Parcel Assessment Area Project, Series 2016, 4.750%, 5/01/36 | | | |
| | Indian Trace Development District, Florida, Water Management Special Benefit Assessment | | | |
| | Bonds, Series 2005: | | | |
| 1,645 | | 5.000%, 5/01/25 – NPFG Insured | 1/20 at 100.00 | Baa2 | 1,666,582 |
| 1,830 | | 5.000%, 5/01/27 – NPFG Insured | 1/20 at 100.00 | Baa2 | 1,851,814 |
| 600 | | Jacksonville, Florida, Better Jacksonville Sales Tax Revenue Bonds, Refunding Series | 10/22 at 100.00 | A2 | 657,114 |
| | 2012, 5.000%, 10/01/30 | | | |
| 2,215 | | Jacksonville, Florida, Educational Facilities Revenue Bonds, Jacksonville University | 6/28 at 100.00 | N/R | 2,454,043 |
| | Project, Series 2018B, 5.000%, 6/01/53, 144A | | | |
| 1,000 | | Lakeland, Florida, Hospital System Revenue Bonds, Lakeland Regional Health, Refunding | 11/21 at 100.00 | A2 | 1,067,510 |
| | Series 2011, 5.000%, 11/15/25 | | | |
| 625 | | Lakewood Ranch Stewardship District, Florida, Special Assessment Revenue Bonds, Del Webb | 5/27 at 100.00 | N/R | 672,656 |
| | Project, Series 2017, 5.000%, 5/01/37, 144A | | | |
| 4,125 | | Martin County Health Facilities Authority, Florida, Hospital Revenue Bonds, Martin | 11/24 at 100.00 | N/R (4) | 4,863,664 |
| | Memorial Medical Center, Series 2015, 5.000%, 11/15/45 (Pre-refunded 11/15/24) | | | |
| | Miami Dade County Industrial Development Authority, Florida, Educational Facilities | | | |
| | Revenue Bonds, South Florida Autism Charter School Project, Series 2017: | | | |
| 1,080 | | 5.875%, 7/01/37, 144A | 7/27 at 100.00 | N/R | 1,114,474 |
| 1,920 | | 6.000%, 7/01/47, 144A | 7/27 at 100.00 | N/R | 1,979,174 |
| 5,965 | | Miami Dade County, Florida, Rickenbacker Causeway Revenue Bonds, Series 2014, | 10/24 at 100.00 | BBB+ | 6,669,765 |
| | 5.000%, 10/01/43 | | | |
| 2,130 | | Miami Health Facilities Authority, Florida, Health Facilities Revenue Bonds, Miami | 7/27 at 100.00 | BBB | 2,401,745 |
| | Jewish Health System Inc Project, Series 2017, 5.125%, 7/01/46 | | | |
36
| | | | | | |
| Principal | | | Optional Call | | |
| Amount (000) | | Description (1) | Provisions (2) | Ratings (3) | Value |
| | Florida (continued) | | | |
| $ 1,545 | | Miami, Florida, Special Obligation Non-Ad Valorem Revenue Bonds, Refunding Series 2011A, | 2/21 at 100.00 | A+ (4) | $ 1,637,685 |
| | 6.000%, 2/01/31 (Pre-refunded 2/01/21) – AGM Insured | | | |
| 5,000 | | Miami-Dade County Expressway Authority, Florida, Toll System Revenue Bonds, Series | 7/24 at 100.00 | A3 | 5,580,350 |
| | 2014A, 5.000%, 7/01/44 | | | |
| 2,500 | | Miami-Dade County, Florida, Aviation Revenue Bonds, Miami International Airport, Series | 10/20 at 100.00 | A2 (4) | 2,596,300 |
| | 2010A-1, 5.375%, 10/01/41 (Pre-refunded 10/01/20) | | | |
| 2,500 | | Miami-Dade County, Florida, Aviation Revenue Bonds, Miami International Airport, Series | 10/20 at 100.00 | A (4) | 2,587,850 |
| | 2010B, 5.000%, 10/01/30 (Pre-refunded 10/01/20) | | | |
| 2,400 | | Miami-Dade County, Florida, Special Obligation Bonds, Refunding Subordinate Series | 10/22 at 100.00 | A2 | 2,624,352 |
| | 2012B, 5.000%, 10/01/37 | | | |
| 6,305 | | Miami-Dade County, Florida, Water and Sewer System Revenue Bonds, Series 2013A, | 10/22 at 100.00 | A+ | 6,906,623 |
| | 5.000%, 10/01/42 | | | |
| 4,785 | | Northern Palm Beach County Improvement District, Florida, Water Control and Improvement | 8/26 at 100.00 | N/R | 5,268,189 |
| | Bonds, Development Unit 53, Series 2015, 5.350%, 8/01/35 | | | |
| 4,270 | | Orange County Health Facilities Authority, Florida, Hospital Revenue Bonds, Orlando | 4/22 at 100.00 | A2 | 4,558,481 |
| | Health, Inc, Series 2012A, 5.000%, 10/01/42 | | | |
| 230 | | Palm Beach County Health Facilities Authority, Florida, Revenue Bonds, Sinai Residences | 6/22 at 102.00 | N/R | 257,018 |
| | of Boca Raton Project, Series 2014A, 7.250%, 6/01/34 | | | |
| 825 | | Reunion West Community Development District, Florida, Special Assessment Bonds, Area 3 | 11/26 at 100.00 | N/R | 868,098 |
| | Project, Series 2016, 5.000%, 11/01/46 | | | |
| | Six Mile Creek Community Development District, Florida, Capital Improvement Revenue | | | |
| | Bonds, Assessment Area 2, Series 2016: | | | |
| 225 | | 4.750%, 11/01/28 | 11/27 at 100.00 | N/R | 234,725 |
| 375 | | 5.375%, 11/01/36 | 11/27 at 100.00 | N/R | 398,370 |
| 925 | | South Fork III Community Development District, Florida, Special Assessment Revenue | 5/27 at 100.00 | N/R | 1,001,285 |
| | Bonds, Refunding Series 2016, 5.375%, 5/01/37 | | | |
| 1,200 | | St Lucie County, Florida, Utility System Revenue Refunding Bonds, Series 1993, 5.500%, | No Opt. Call | N/R (4) | 1,295,628 |
| | 10/01/21 – FGIC Insured (ETM) | | | |
| 4,100 | | Tampa, Florida, Health System Revenue Bonds, Baycare Health System, Series 2012A, | 5/22 at 100.00 | Aa2 | 4,438,988 |
| | 5.000%, 11/15/33 | | | |
| 945 | | Tampa, Florida, Healthcare System Revenue Bonds, Allegany Health System – St Joseph’s | 1/20 at 100.00 | Aaa | 990,625 |
| | Hospital, Series 1993, 5.125%, 12/01/23 – NPFG Insured (ETM) | | | |
| 10,095 | | Tampa-Hillsborough County Expressway Authority, Florida, Revenue Bonds, Refunding Series | 7/22 at 100.00 | A2 (4) | 11,092,790 |
| | 2012B, 5.000%, 7/01/42 (Pre-refunded 7/01/22) | | | |
| 2,000 | | Volusia County Educational Facilities Authority, Florida, Revenue Bonds, Embry-Riddle | 10/21 at 100.00 | A– (4) | 2,145,420 |
| | Aeronautical University, Inc Project, Refunding Series 2011, 5.000%, 10/15/29 (Pre-refunded | | | |
| | 10/15/21) – AGM Insured | | | |
| 5,000 | | Volusia County Educational Facilities Authority, Florida, Revenue Bonds, Stetson | 6/25 at 100.00 | A– | 5,697,000 |
| | University Inc Project, Series 2015, 5.000%, 6/01/40 | | | |
| 164,565 | | Total Florida | | | 178,718,303 |
| | Georgia – 3.5% (2.3% of Total Investments) | | | |
| 5,715 | | Burke County Development Authority, Georgia, Pollution Control Revenue Bonds, Oglethorpe | 2/28 at 100.00 | BBB+ | 6,100,648 |
| | Power Corporation Vogtle Project, Series 2017C, 4.125%, 11/01/45 | | | |
| 10,835 | | Burke County Development Authority, Georgia, Pollution Control Revenue Bonds, Oglethorpe | 2/28 at 100.00 | BBB+ | 11,566,146 |
| | Power Corporation Vogtle Project, Series 2017D, 4.125%, 11/01/45 | | | |
| 2,825 | | Cherokee County Water and Sewerage Authority, Georgia, Revenue Bonds, Refunding Series | 8/20 at 100.00 | AA | 2,874,099 |
| | 2007, 4.000%, 8/01/26 | | | |
| 1,250 | | DeKalb County Hospital Authority, Georgia, Anticipation Certificates Revenue Bonds, | 9/20 at 100.00 | N/R (4) | 1,298,663 |
| | DeKalb Medical Center, Inc Project, Series 2010, 6.000%, 9/01/30 (Pre-refunded 9/01/20) | | | |
| 2,000 | | Fairburn, Georgia, General Obligation Bonds, Series 2011, 5.750%, 12/01/31 (Pre-refunded | 12/21 at 100.00 | A2 (4) | 2,188,080 |
| | 12/01/21) – AGM Insured | | | |
37
| | | | | |
| NVG | Nuveen AMT-Free Municipal Credit Income Fund | |
| Portfolio of Investments (continued) | | | |
|
| October 31, 2019 | | | |
|
|
|
|
| Principal | | | Optional Call | | |
| Amount (000) | | Description (1) | Provisions (2) | Ratings (3) | Value |
| | Georgia (continued) | | | |
| | Fulton County Development Authority, Georgia, Revenue Bonds, Piedmont Healthcare, Inc | | | |
| | Project, Series 2019A: | | | |
| $ 3,500 | | 3.000%, 7/01/44 (WI/DD, Settling 11/07/19) | 7/29 at 100.00 | A1 | $ 3,443,510 |
| 7,500 | | 4.000%, 7/01/49 (WI/DD, Settling 11/07/19) | 7/29 at 100.00 | A1 | 8,204,700 |
| | Gainesville and Hall County Hospital Authority, Georgia, Revenue Anticipation | | | |
| | Certificates, Northeast Georgia Health Services Inc, Series 2010B: | | | |
| 1,180 | | 5.250%, 2/15/37 | 2/20 at 100.00 | AA– | 1,192,579 |
| 3,820 | | 5.250%, 2/15/37 (Pre-refunded 2/15/20) | 2/20 at 100.00 | N/R (4) | 3,863,968 |
| 960 | | 5.125%, 2/15/40 | 2/20 at 100.00 | AA– | 969,763 |
| 3,090 | | 5.125%, 2/15/40 (Pre-refunded 2/15/20) | 2/20 at 100.00 | N/R (4) | 3,124,515 |
| 15,305 | | Gainesville and Hall County Hospital Authority, Georgia, Revenue Anticipation | 2/25 at 100.00 | AA– | 17,908,840 |
| | Certificates, Northeast Georgia Health Services Inc, Series 2014A, 5.500%, 8/15/54 | | | |
| | Georgia Housing and Finance Authority, Single Family Mortgage Bonds, Series 2018A: | | | |
| 6,760 | | 3.950%, 12/01/43 | 6/27 at 100.00 | AAA | 7,275,382 |
| 5,000 | | 4.000%, 12/01/48 | 6/27 at 100.00 | AAA | 5,354,350 |
| 10,825 | | Georgia Municipal Electric Authority, Plant Vogtle Units 3 & 4 Project J Bonds, Series | 7/25 at 100.00 | Baa3 | 11,843,741 |
| | 2015A, 5.000%, 7/01/60 | | | |
| 1,300 | | Macon-Bibb County Urban Development Authority, Georgia, Revenue Bonds, Academy for | 6/27 at 100.00 | N/R | 1,342,757 |
| | Classical Education, Series 2017, 5.750%, 6/15/37, 144A | | | |
| 4,000 | | Marietta Development Authority, Georgia, University Facilities Revenue Bonds, Life | 11/27 at 100.00 | Ba3 | 4,501,160 |
| | University, Inc Project, Refunding Series 2017A, 5.000%, 11/01/37, 144A | | | |
| | Municipal Electric Authority of Georgia Plant Vogtle Units 3&4 Project J Bonds, | | | |
| | Series 2019A: | | | |
| 8,680 | | 5.000%, 1/01/49 | 7/28 at 100.00 | Baa3 | 9,930,614 |
| 4,000 | | 5.000%, 1/01/59 | 7/28 at 100.00 | Baa3 | 4,506,960 |
| 1,000 | | Private Colleges and Universities Authority, Georgia, Revenue Bonds, Mercer University, | 10/22 at 100.00 | Baa1 | 1,094,670 |
| | Refunding Series 2012C, 5.250%, 10/01/27 | | | |
| 10,090 | | Private Colleges and Universities Authority, Georgia, Revenue Bonds, Mercer University, | 10/25 at 100.00 | Baa1 | 11,302,313 |
| | Series 2015, 5.000%, 10/01/40 | | | |
| 1,710 | | Valdosta and Lowndes County Hospital Authority, Georgia, Revenue Certificates, South | 10/21 at 100.00 | AA– (4) | 1,832,214 |
| | Georgia Medical Center Project, Series 2011B, 5.000%, 10/01/41 (Pre-refunded 10/01/21) | | | |
| 111,345 | | Total Georgia | | | 121,719,672 |
| | Guam – 0.0% (0.0% of Total Investments) | | | |
| 650 | | Guam Government Waterworks Authority, Water and Wastewater System Revenue Bonds, Series | 7/23 at 100.00 | BBB– | 714,279 |
| | 2013, 5.500%, 7/01/43 | | | |
| | Hawaii – 0.4% (0.2% of Total Investments) | | | |
| 1,500 | | Hawaii Department of Budget and Finance, Special Purpose Revenue Bonds, Chaminade | 1/25 at 100.00 | Ba3 | 1,534,785 |
| | University of Honolulu, Series 2015A, 5.000%, 1/01/45, 144A | | | |
| 5,000 | | Hawaii Department of Budget and Finance, Special Purpose Revenue Bonds, Hawaii Pacific | 7/23 at 100.00 | A1 | 5,587,400 |
| | Health Obligated Group, Series 2013A, 5.500%, 7/01/43 | | | |
| 170 | | Hawaii Department of Budget and Finance, Special Purpose Revenue Bonds, Hawaii Pacific | 7/23 at 100.00 | BB | 181,516 |
| | University, Series 2013A, 6.875%, 7/01/43 | | | |
| 5,075 | | Hawaii Department of Budget and Finance, Special Purpose Revenue Bonds, Queens Health | 7/25 at 100.00 | A1 | 5,426,545 |
| | Systems, Series 2015A, 4.000%, 7/01/40 | | | |
| 11,745 | | Total Hawaii | | | 12,730,246 |
| | Idaho – 0.8% (0.5% of Total Investments) | | | |
| | Idaho Health Facilities Authority, Revenue Bonds, Kootenai Health Project, Series 2014: | | | |
| 3,300 | | 4.375%, 7/01/34, 144A | 7/24 at 100.00 | A | 3,530,439 |
| 12,495 | | 4.750%, 7/01/44, 144A | 7/24 at 100.00 | A | 13,346,659 |
| 1,250 | | Idaho Health Facilities Authority, Revenue Bonds, Madison Memorial Hospital Project, | 9/26 at 100.00 | BB+ | 1,397,700 |
| | Refunding Series 2016, 5.000%, 9/01/37 | | | |
38
| | | | | | |
| Principal | | | Optional Call | | |
| Amount (000) | | Description (1) | Provisions (2) | Ratings (3) | Value |
| | Idaho (continued) | | | |
| $ 8,730 | | Idaho Health Facilities Authority, Revenue Bonds, Saint Luke’s Health System Project, | 3/22 at 100.00 | A– | $ 9,190,333 |
| | Series 2012A, 5.000%, 3/01/47 | | | |
| 1,000 | | Idaho Health Facilities Authority, Revenue Bonds, Saint Luke’s Health System Project, | 3/24 at 100.00 | A– | 1,048,160 |
| | Series 2014A, 4.125%, 3/01/37 | | | |
| 26,775 | | Total Idaho | | | 28,513,291 |
| | Illinois – 25.5% (16.4% of Total Investments) | | | |
| 675 | | Bolingbrook, Illinois, General Obligation Bonds, Refunding Series 2013A, 5.000%, 1/01/25 | 7/23 at 100.00 | A2 | 757,681 |
| 67,135 | | Chicago Board of Education, Illinois, Dedicated Capital Improvement Tax Revenue Bonds, | 4/27 at 100.00 | A | 80,206,856 |
| | Series 2016, 6.000%, 4/01/46 | | | |
| 1,000 | | Chicago Board of Education, Illinois, Dedicated Capital Improvement Tax Revenue Bonds, | 4/27 at 100.00 | A | 1,117,910 |
| | Series 2017, 5.000%, 4/01/46 | | | |
| | Chicago Board of Education, Illinois, General Obligation Bonds, Dedicated Revenues | | | |
| | Series 2011A: | | | |
| 6,210 | | 5.500%, 12/01/39 | 12/21 at 100.00 | B2 | 6,511,744 |
| 1,865 | | 5.000%, 12/01/41 | 12/21 at 100.00 | B2 | 1,935,049 |
| 5,205 | | Chicago Board of Education, Illinois, General Obligation Bonds, Dedicated Revenues | 12/22 at 100.00 | B2 | 5,486,903 |
| | Series 2012A, 5.000%, 12/01/42 | | | |
| 8,400 | | Chicago Board of Education, Illinois, General Obligation Bonds, Dedicated Revenues, | 12/27 at 100.00 | BB– | 10,749,060 |
| | Refunding Series 2017B, 7.000%, 12/01/42, 144A | | | |
| | Chicago Board of Education, Illinois, General Obligation Bonds, Dedicated Revenues, | | | |
| | Refunding Series 2017H: | | | |
| 5,835 | | 5.000%, 12/01/36 | 12/27 at 100.00 | BB– | 6,625,934 |
| 4,940 | | 5.000%, 12/01/46 | 12/27 at 100.00 | BB– | 5,512,200 |
| 6,055 | | Chicago Board of Education, Illinois, General Obligation Bonds, Dedicated Revenues, | 12/28 at 100.00 | BB– | 6,805,638 |
| | Refunding Series 2018D, 5.000%, 12/01/46 | | | |
| 38,905 | | Chicago Board of Education, Illinois, General Obligation Bonds, Dedicated Revenues, | 12/25 at 100.00 | BB– | 47,318,206 |
| | Series 2016A, 7.000%, 12/01/44 | | | |
| 14,805 | | Chicago Board of Education, Illinois, General Obligation Bonds, Dedicated Revenues, | 12/26 at 100.00 | BB– | 17,866,526 |
| | Series 2016B, 6.500%, 12/01/46 | | | |
| 19,585 | | Chicago Board of Education, Illinois, General Obligation Bonds, Dedicated Revenues, | 12/27 at 100.00 | BB– | 24,947,961 |
| | Series 2017A, 7.000%, 12/01/46, 144A | | | |
| 1,345 | | Chicago Board of Education, Illinois, Unlimited Tax General Obligation Bonds, Dedicated | No Opt. Call | BB– | 953,148 |
| | Tax Revenues, Series 1998B-1, 0.000%, 12/01/30 – NPFG Insured | | | |
| 2,235 | | Chicago Transit Authority, Illinois, Capital Grant Receipts Revenue Bonds, Federal | 6/21 at 100.00 | A2 | 2,361,479 |
| | Transit Administration Section 5307 Urbanized Area Formula Funds, Refunding Series 2011, | | | |
| | 5.250%, 6/01/26 – AGM Insured | | | |
| 1,100 | | Chicago Transit Authority, Illinois, Sales Tax Receipts Revenue Bonds, Series 2011, | 12/21 at 100.00 | A3 | 1,159,730 |
| | 5.250%, 12/01/40 | | | |
| 12,215 | | Chicago Transit Authority, Illinois, Sales Tax Receipts Revenue Bonds, Series 2014, | 12/24 at 100.00 | AA | 13,699,122 |
| | 5.250%, 12/01/49 | | | |
| 7,700 | | Chicago, Illinois, General Airport Revenue Bonds, O’Hare International Airport, Third | 1/20 at 100.00 | A2 | 7,747,663 |
| | Lien Refunding Series 2010C, 5.250%, 1/01/35 – AGC Insured | | | |
| | Chicago, Illinois, General Obligation Bonds, City Colleges, Series 1999: | | | |
| 1,500 | | 0.000%, 1/01/31 – NPFG Insured | No Opt. Call | BBB– | 1,062,195 |
| 32,670 | | 0.000%, 1/01/32 – FGIC Insured | No Opt. Call | BBB– | 22,270,159 |
| 12,360 | | 0.000%, 1/01/37 – FGIC Insured | No Opt. Call | BBB– | 6,871,048 |
| 960 | | Chicago, Illinois, General Obligation Bonds, Project & Refunding Series 2007A, 5.000%, | 12/19 at 100.00 | Ba1 | 963,024 |
| | 1/01/27 – AMBAC Insured | | | |
| 2,500 | | Chicago, Illinois, General Obligation Bonds, Project & Refunding Series 2014A, | 1/24 at 100.00 | Ba1 | 2,740,650 |
| | 5.250%, 1/01/33 | | | |
| 17,605 | | Chicago, Illinois, General Obligation Bonds, Project & Refunding Series 2017A, | 1/27 at 100.00 | BBB– | 20,904,177 |
| | 6.000%, 1/01/38 | | | |
39
| | | | | |
| NVG | Nuveen AMT-Free Municipal Credit Income Fund | |
| Portfolio of Investments (continued) | | | |
|
| October 31, 2019 | | | |
|
|
|
|
| Principal | | | Optional Call | | |
| Amount (000) | | Description (1) | Provisions (2) | Ratings (3) | Value |
| | Illinois (continued) | | | |
| $ 935 | | Chicago, Illinois, General Obligation Bonds, Project and Refunding Series 2009C, | 12/19 at 100.00 | Ba1 | $ 937,253 |
| | 5.000%, 1/01/34 | | | |
| 1,000 | | Chicago, Illinois, General Obligation Bonds, Project Series 2011A, 5.250%, 1/01/35 | 1/21 at 100.00 | Ba1 | 1,026,870 |
| 10,200 | | Chicago, Illinois, General Obligation Bonds, Project Series 2012A, 5.000%, 1/01/33 | 1/22 at 100.00 | Ba1 | 10,668,282 |
| 2,605 | | Chicago, Illinois, General Obligation Bonds, Refunding Series 2016C, 5.000%, 1/01/38 | 1/26 at 100.00 | BBB– | 2,869,876 |
| 3,000 | | Chicago, Illinois, Wastewater Transmission Revenue Bonds, Second Lien Series 2008C, | 1/25 at 100.00 | A | 3,332,490 |
| | 5.000%, 1/01/39 | | | |
| 10,000 | | Cook County Community College District 508, Illinois, General Obligation Bonds, Chicago | 12/23 at 100.00 | BBB | 10,625,800 |
| | City Colleges, Series 2013, 5.250%, 12/01/43 | | | |
| | DeKalb, Kane, LaSalle, Lee, Ogle, Winnebago and Boone Counties Community College | | | |
| | District 523, Illinois, General Obligation Bonds, Kishwaukee Community College, Series 2011B: | | | |
| 2,500 | | 0.010%, 2/01/33 | 2/21 at 44.26 | AA– | 1,082,625 |
| 2,000 | | 0.010%, 2/01/34 | 2/21 at 41.04 | AA– | 802,840 |
| | Illinois Educational Facilities Authority, Revenue Bonds, Field Museum of Natural | | | |
| | History, Series 2002RMKT: | | | |
| 2,500 | | 4.450%, 11/01/36 | 11/25 at 102.00 | A2 | 2,766,575 |
| 3,400 | | 5.500%, 11/01/36 | 11/23 at 100.00 | A | 3,780,766 |
| 3,075 | | Illinois Educational Facilities Authority, Revenue Bonds, Robert Morris College, Series | 12/19 at 100.00 | Baa2 | 3,084,287 |
| | 2000, 5.800%, 6/01/30 – NPFG Insured | | | |
| | Illinois Finance Authority, Charter School Revenue Bonds, Intrinsic Charter Schools | | | |
| | Belmont School Project, Series 2015A: | | | |
| 1,700 | | 5.750%, 12/01/35, 144A | 12/25 at 100.00 | N/R | 1,806,233 |
| 115 | | 6.000%, 12/01/45, 144A | 12/25 at 100.00 | N/R | 121,696 |
| 6,500 | | Illinois Finance Authority, Recovery Zone Facility Revenue Bonds, Navistar International | 10/20 at 100.00 | B1 | 6,711,575 |
| | Corporation Project, Series 2010, 6.750%, 10/15/40 | | | |
| | Illinois Finance Authority, Revenue Bonds, Ascension Health/fkaPresence Health Network, | | | |
| | Series 2016C: | | | |
| 80 | | 4.000%, 2/15/41 (Pre-refunded 2/15/27) | 2/27 at 100.00 | N/R (4) | 93,383 |
| 39,595 | | 4.000%, 2/15/41 | 2/27 at 100.00 | Aa2 | 43,434,923 |
| 6,750 | | Illinois Finance Authority, Revenue Bonds, Centegra Health System, Series 2012, | 9/22 at 100.00 | AA+ | 7,318,147 |
| | 5.000%, 9/01/38 | | | |
| | Illinois Finance Authority, Revenue Bonds, Centegra Health System, Series 2014A: | | | |
| 1,485 | | 5.000%, 9/01/34 | 9/24 at 100.00 | AA+ | 1,699,063 |
| 19,025 | | 5.000%, 9/01/42 | 9/24 at 100.00 | AA+ | 21,501,674 |
| 1,750 | | Illinois Finance Authority, Revenue Bonds, Ingalls Health System, Series 2013, | 5/22 at 100.00 | Baa2 | 1,802,395 |
| | 4.250%, 5/15/43 | | | |
| 15,805 | | Illinois Finance Authority, Revenue Bonds, Mercy Health Corporation, Series 2016, | 6/26 at 100.00 | A3 | 17,983,561 |
| | 5.000%, 12/01/46 | | | |
| 1,630 | | Illinois Finance Authority, Revenue Bonds, Northwestern Memorial HealthCare, Series | 8/22 at 100.00 | Aa2 | 1,767,702 |
| | 2013, 5.000%, 8/15/37 | | | |
| 1,435 | | Illinois Finance Authority, Revenue Bonds, Rehabilitation Institute of Chicago, Series | 7/23 at 100.00 | A– | 1,616,714 |
| | 2013A, 6.000%, 7/01/43 | | | |
| | Illinois Finance Authority, Revenue Bonds, Rosalind Franklin University Research | | | |
| | Building Project, Series 2017C: | | | |
| 1,000 | | 5.000%, 8/01/42 | 8/27 at 100.00 | BBB+ | 1,134,040 |
| 1,000 | | 5.000%, 8/01/46 | 8/27 at 100.00 | BBB+ | 1,130,410 |
| 1,000 | | 5.000%, 8/01/47 | 8/27 at 100.00 | BBB+ | 1,130,510 |
| | Illinois Finance Authority, Revenue Bonds, Silver Cross Hospital and Medical Centers, | | | |
| | Refunding Series 2015C: | | | |
| 560 | | 5.000%, 8/15/35 | 8/25 at 100.00 | Baa1 | 636,244 |
| 6,140 | | 5.000%, 8/15/44 | 8/25 at 100.00 | Baa1 | 6,867,897 |
| 8,960 | | Illinois Finance Authority, Revenue Bonds, The Carle Foundation, Series 2011A, 6.000%, | 8/21 at 100.00 | A2 | 9,608,166 |
| | 8/15/41 – AGM Insured | | | |
40
| | | | | | |
| Principal | | | Optional Call | | |
| Amount (000) | | Description (1) | Provisions (2) | Ratings (3) | Value |
| | Illinois (continued) | | | |
| | Illinois Finance Authority, Revenue Bonds, The University of Chicago Medical Center, | | | |
| | Series 2011C: | | | |
| $ 1,150 | | 5.500%, 8/15/41 (Pre-refunded 2/15/21) | 2/21 at 100.00 | AA– (4) | $ 1,211,721 |
| 4,500 | | 5.500%, 8/15/41 (Pre-refunded 2/15/21) (UB) (5) | 2/21 at 100.00 | AA– (4) | 4,741,515 |
| 20,000 | | Illinois Finance Authority, Revenue Bonds, University of Chicago, Refunding Series | 10/25 at 100.00 | AA– | 23,055,600 |
| | 2015A, 5.000%, 10/01/46 (UB) (5) | | | |
| 19,975 | | Illinois Finance Authority, Revenue Bonds, University of Chicago, Series 2012A, | 10/21 at 100.00 | AA– | 21,065,235 |
| | 5.000%, 10/01/51 | | | |
| 3,665 | | Illinois Sports Facility Authority, State Tax Supported Bonds, Refunding Series 2014, | 6/24 at 100.00 | BBB– | 4,136,539 |
| | 5.250%, 6/15/31 – AGM Insured | | | |
| | Illinois State, General Obligation Bonds, February Series 2014: | | | |
| 3,200 | | 5.250%, 2/01/32 | 2/24 at 100.00 | BBB– | 3,497,888 |
| 2,000 | | 5.250%, 2/01/33 | 2/24 at 100.00 | BBB– | 2,182,740 |
| 1,575 | | 5.250%, 2/01/34 | 2/24 at 100.00 | BBB– | 1,716,907 |
| 7,500 | | 5.000%, 2/01/39 | 2/24 at 100.00 | BBB– | 8,041,350 |
| 5,000 | | Illinois State, General Obligation Bonds, June Series 2016, 4.000%, 6/01/35 | 6/26 at 100.00 | BBB– | 5,148,500 |
| | Illinois State, General Obligation Bonds, May Series 2014: | | | |
| 510 | | 5.000%, 5/01/36 | 5/24 at 100.00 | BBB– | 551,351 |
| 3,245 | | 5.000%, 5/01/39 | 5/24 at 100.00 | BBB– | 3,491,101 |
| | Illinois State, General Obligation Bonds, November Series 2016: | | | |
| 11,800 | | 5.000%, 11/01/40 | 11/26 at 100.00 | BBB– | 13,033,336 |
| 13,200 | | 5.000%, 11/01/41 | 11/26 at 100.00 | BBB– | 14,551,548 |
| | Illinois State, General Obligation Bonds, November Series 2017D: | | | |
| 1,540 | | 5.000%, 11/01/27 | No Opt. Call | BBB– | 1,766,426 |
| 30,560 | | 5.000%, 11/01/28 | 11/27 at 100.00 | BBB– | 34,981,421 |
| 5,000 | | Illinois State, General Obligation Bonds, October Series 2016, 5.000%, 2/01/29 | 2/27 at 100.00 | BBB– | 5,690,900 |
| 2,625 | | Illinois State, General Obligation Bonds, Refunding Series 2010, 5.000%, 1/01/24 | 1/20 at 100.00 | BBB– | 2,636,261 |
| | Illinois State, General Obligation Bonds, Refunding Series 2012: | | | |
| 3,425 | | 5.000%, 8/01/23 | No Opt. Call | BBB– | 3,755,341 |
| 1,190 | | 5.000%, 8/01/25 | 8/22 at 100.00 | BBB– | 1,268,719 |
| | Illinois State, General Obligation Bonds, Series 2013: | | | |
| 2,000 | | 5.250%, 7/01/31 | 7/23 at 100.00 | BBB– | 2,165,820 |
| 2,990 | | 5.500%, 7/01/38 | 7/23 at 100.00 | BBB– | 3,245,107 |
| 5,000 | | Illinois Toll Highway Authority, Toll Highway Revenue Bonds, Senior Lien Series 2013A, | 1/23 at 100.00 | A1 | 5,494,850 |
| | 5.000%, 1/01/35 | | | |
| 18,920 | | Illinois Toll Highway Authority, Toll Highway Revenue Bonds, Senior Lien Series 2015A, | 7/25 at 100.00 | A1 | 21,760,270 |
| | 5.000%, 1/01/40 | | | |
| 10,000 | | Illinois Toll Highway Authority, Toll Highway Revenue Bonds, Senior Lien Series 2019A, | 7/29 at 100.00 | A1 | 12,136,900 |
| | 5.000%, 1/01/44 | | | |
| 1,395 | | Illinois Toll Highway Authority, Toll Highway Revenue Bonds, Tender Option Bond Trust | 1/23 at 100.00 | A1 | 1,921,124 |
| | 2015-XF0051, 14.263%, 1/01/38, 144A (IF) | | | |
| 7,400 | | Macon County School District 61 Decatur, Illinois, General Obligation Bonds, Alternate | 1/21 at 100.00 | A2 | 7,693,632 |
| | Revenue Source Series 2011A, 5.250%, 1/01/37 – AGM Insured | | | |
| 17,500 | | Metropolitan Pier and Exposition Authority, Illinois, McCormick Place Expansion Project | 6/22 at 100.00 | BBB– | 18,318,300 |
| | Bonds, Refunding Series 2012B, 5.000%, 6/15/52 | | | |
| 540 | | Metropolitan Pier and Exposition Authority, Illinois, McCormick Place Expansion Project | 12/25 at 100.00 | BBB– | 586,845 |
| | Bonds, Refunding Series 2015B, 5.000%, 6/15/52 | | | |
| | Metropolitan Pier and Exposition Authority, Illinois, McCormick Place Expansion Project | | | |
| | Bonds, Series 2015A: | | | |
| 2,890 | | 0.000%, 12/15/52 | No Opt. Call | BBB– | 821,800 |
| 5,185 | | 5.000%, 6/15/53 | 12/25 at 100.00 | BBB– | 5,631,791 |
| 5,700 | | 5.500%, 6/15/53 | 12/25 at 100.00 | BBB– | 6,347,178 |
41
| | | | | |
| NVG | Nuveen AMT-Free Municipal Credit Income Fund | |
| Portfolio of Investments (continued) | | | |
|
| October 31, 2019 | | | |
|
|
|
|
| Principal | | | Optional Call | | |
| Amount (000) | | Description (1) | Provisions (2) | Ratings (3) | Value |
| | Illinois (continued) | | | |
| | Metropolitan Pier and Exposition Authority, Illinois, McCormick Place Expansion Project | | | |
| | Refunding Bonds, Series 2010A: | | | |
| $ 3,650 | | 5.500%, 6/15/50 (Pre-refunded 6/15/20) | 6/20 at 100.00 | BBB– (4) | $ 3,746,105 |
| 11,365 | | 5.500%, 6/15/50 | 6/20 at 100.00 | Ba1 | 11,524,337 |
| | Metropolitan Pier and Exposition Authority, Illinois, Revenue Bonds, McCormick Place | | | |
| | Expansion Project, Capital Appreciation Refunding Series 2010B-1: | | | |
| 25,000 | | 0.010%, 6/15/44 – AGM Insured | No Opt. Call | BBB– | 10,608,250 |
| 43,200 | | 0.000%, 6/15/45 – AGM Insured | No Opt. Call | BBB– | 17,672,256 |
| 10,000 | | 0.010%, 6/15/46 – AGM Insured | No Opt. Call | BBB– | 3,930,500 |
| 41,205 | | Metropolitan Pier and Exposition Authority, Illinois, Revenue Bonds, McCormick Place | 6/20 at 100.00 | Ba1 | 41,658,255 |
| | Expansion Project, Refunding Series 2010B-2, 5.000%, 6/15/50 | | | |
| 8,750 | | Metropolitan Pier and Exposition Authority, Illinois, Revenue Bonds, McCormick Place | No Opt. Call | BBB | 6,977,600 |
| | Expansion Project, Series 1994B, 0.000%, 6/15/28 – NPFG Insured | | | |
| | Metropolitan Pier and Exposition Authority, Illinois, Revenue Bonds, McCormick Place | | | |
| | Expansion Project, Series 2002A: | | | |
| 18,085 | | 0.000%, 12/15/24 – NPFG Insured | No Opt. Call | BBB– | 16,088,778 |
| 20,045 | | 0.000%, 12/15/35 – AGM Insured | No Opt. Call | BBB– | 12,266,939 |
| 465 | | Morton Grove, Illinois, Tax Increment Revenue Bonds, Sawmill Station Redevelopment | 1/26 at 100.00 | N/R | 471,859 |
| | Project, Senior Lien Series 2019, 5.000%, 1/01/39 | | | |
| 1,846 | | Plano, Illinois, Special Tax Bonds, Special Service Area 1 & 2 Lakewood Springs Project, | 3/24 at 100.00 | AA | 2,038,409 |
| | Refunding Series 2014, 5.000%, 3/01/34 – AGM Insured | | | |
| 2,600 | | Regional Transportation Authority, Cook, DuPage, Kane, Lake, McHenry and Will Counties, | No Opt. Call | A2 | 3,583,190 |
| | Illinois, General Obligation Bonds, Series 2000A, 6.500%, 7/01/30 – NPFG Insured | | | |
| 3,900 | | Rosemont Village, Illinois, General Obligation Bonds, Corporate Purpose Series 2011A, | 12/20 at 100.00 | A2 (4) | 4,087,005 |
| | 5.600%, 12/01/35 (Pre-refunded 12/01/20) – AGM Insured | | | |
| 7,025 | | Southwestern Illinois Development Authority, Health Facility Revenue Bonds, Memorial | 11/23 at 100.00 | N/R (4) | 8,754,133 |
| | Group, Inc, Series 2013, 7.625%, 11/01/48 (Pre-refunded 11/01/23) | | | |
| 4,000 | | Southwestern Illinois Development Authority, School Revenue Bonds, Triad School District | No Opt. Call | Baa2 | 3,487,880 |
| | 2, Madison County, Illinois, Series 2006, 0.000%, 10/01/25 – NPFG Insured | | | |
| 12,125 | | Springfield, Illinois, Electric Revenue Bonds, Senior Lien Series 2015, 5.000%, 3/01/40 – | 3/25 at 100.00 | A2 | 13,684,154 |
| | AGM Insured | | | |
| | Will County Community Unit School District 201U, Crete-Monee, Illinois, General | | | |
| | Obligation Bonds, Capital Appreciation Series 2004: | | | |
| 780 | | 0.000%, 11/01/22 – NPFG Insured (ETM) | No Opt. Call | Baa2 (4) | 745,235 |
| 2,550 | | 0.000%, 11/01/22 – NPFG Insured | No Opt. Call | Baa2 | 2,408,143 |
| 6,415 | | Will County School District 122, New Lenox, Illinois, General Obligation Bonds, Capital | No Opt. Call | Aa3 | 5,812,182 |
| | Appreciation School Series 2004D, 0.000%, 11/01/24 – AGM Insured | | | |
| | Williamson & Johnson Counties Community Unit School District 2, Marion, Illinois, | | | |
| | General Obligation Bonds, Series 2011: | | | |
| 930 | | 7.000%, 12/01/21 – AGM Insured | 12/20 at 100.00 | A2 | 981,773 |
| 1,035 | | 7.000%, 12/01/22 – AGM Insured | 12/20 at 100.00 | A2 | 1,091,066 |
| 1,155 | | 7.000%, 12/01/23 – AGM Insured | 12/20 at 100.00 | A2 | 1,217,740 |
| 1,065 | | 7.000%, 12/01/26 – AGM Insured | 12/20 at 100.00 | A2 | 1,120,849 |
| 2,085 | | 7.250%, 12/01/29 (Pre-refunded 12/01/20) – AGM Insured | 12/20 at 100.00 | A2 (4) | 2,217,898 |
| 2,295 | | 7.250%, 12/01/30 (Pre-refunded 12/01/20) – AGM Insured | 12/20 at 100.00 | A2 (4) | 2,441,283 |
| 881,301 | | Total Illinois | | | 885,179,895 |
| | Indiana – 3.2% (2.1% of Total Investments) | | | |
| | Allen County, Indiana, Economic Development Revenue Bonds, Fort Wayne Project, Senior | | | |
| | Series 2017A-1: | | | |
| 500 | | 6.625%, 1/15/34, 144A | 1/24 at 104.00 | N/R | 552,285 |
| 675 | | 6.750%, 1/15/43, 144A | 1/24 at 104.00 | N/R | 741,110 |
| 1,605 | | Chesterton, Indiana, Economic Development Revenue Bonds, Storypoint Chesterton Project, | 1/24 at 104.00 | N/R | 1,724,877 |
| | Series 2016, 6.250%, 1/15/43, 144A | | | |
42
| | | | | | |
| Principal | | | Optional Call | | |
| Amount (000) | | Description (1) | Provisions (2) | Ratings (3) | Value |
| | Indiana (continued) | | | |
| $ 2,640 | | Crown Point Multi-School Building Corporation, Indiana, First Mortgage Bonds, Crown | No Opt. Call | Baa2 | $ 2,477,006 |
| | Point Community School Corporation, Series 2000, 0.000%, 1/15/24 – NPFG Insured | | | |
| 12,045 | | Indiana Finance Authority, Educational Facilities Revenue Bonds, Valparaiso University | 10/24 at 100.00 | A3 | 13,387,536 |
| | Project, Series 2014, 5.000%, 10/01/44 | | | |
| 365 | | Indiana Finance Authority, Environmental Improvement Revenue Bonds, United States Steel | 6/20 at 100.00 | B3 | 371,033 |
| | Corporation Project, Refunding Series 2010, 6.000%, 12/01/26 | | | |
| 125 | | Indiana Finance Authority, Environmental Improvement Revenue Bonds, United States Steel | No Opt. Call | B3 | 125,378 |
| | Corporation Project, Refunding Series 2011, 6.000%, 12/01/19 | | | |
| 10,290 | | Indiana Finance Authority, Hospital Revenue Bonds, Community Health Network Project, | 5/23 at 100.00 | A | 11,206,016 |
| | Series 2012A, 5.000%, 5/01/42 | | | |
| 10,000 | | Indiana Finance Authority, Hospital Revenue Bonds, Indiana University Health Obligation | 12/29 at 100.00 | AA | 11,108,700 |
| | Group, Fixed Rate Series 2019A, 4.000%, 12/01/49 | | | |
| 5,000 | | Indiana Finance Authority, Revenue Bonds, Trinity Health Care Group, Refunding Series | 12/20 at 100.00 | AA– (4) | 5,196,800 |
| | 2010B, 5.000%, 12/01/37 (Pre-refunded 12/01/20) | | | |
| 13,880 | | Indiana Finance Authority, Wastewater Utility Revenue Bonds, CWA Authority Project, | 10/21 at 100.00 | A1 | 14,757,077 |
| | Series 2011B, 5.000%, 10/01/41 | | | |
| 17,970 | | Indiana Finance Authority, Wastewater Utility Revenue Bonds, CWA Authority Project, | 10/24 at 100.00 | A+ | 20,461,900 |
| | Series 2014A, 5.000%, 10/01/44 | | | |
| 5,000 | | Indianapolis Local Public Improvement Bond Bank Bonds, Indiana, Revenue Bonds, PILOT | 1/20 at 100.00 | AA (4) | 5,030,450 |
| | Infrastructure Project, Series 2010F, 5.000%, 1/01/35 (Pre-refunded 1/01/20) – AGM Insured | | | |
| | Indianapolis Local Public Improvement Bond Bank, Indiana, Series 1999E: | | | |
| 10,000 | | 0.000%, 2/01/26 – AMBAC Insured | No Opt. Call | AA– | 9,012,600 |
| 20,000 | | 0.000%, 2/01/28 – AMBAC Insured | No Opt. Call | AA– | 17,049,400 |
| 110,095 | | Total Indiana | | | 113,202,168 |
| | Iowa – 3.2% (2.1% of Total Investments) | | | |
| 10,000 | | Iowa Finance Authority, Health Facilities Revenue Bonds, UnityPoint Health Project, | 2/23 at 100.00 | A1 | 10,858,200 |
| | Series 2013A, 5.250%, 2/15/44 | | | |
| 10,690 | | Iowa Finance Authority, Iowa, Midwestern Disaster Area Revenue Bonds, Iowa Fertilizer | 12/23 at 100.00 | B– | 11,640,127 |
| | Company Project, Series 2013, 5.250%, 12/01/25 | | | |
| 18,290 | | Iowa Finance Authority, Iowa, Midwestern Disaster Area Revenue Bonds, Iowa Fertilizer | 11/19 at 105.00 | B– | 19,225,351 |
| | Company Project, Series 2016, 5.875%, 12/01/27, 144A | | | |
| 21,280 | | Iowa Finance Authority, Iowa, Midwestern Disaster Area Revenue Bonds, Iowa Fertilizer | 12/22 at 105.00 | B+ | 23,055,603 |
| | Company Project, Series 2013B, 5.250%, 12/01/50 (Mandatory Put 12/01/37) | | | |
| 5,700 | | Iowa Finance Authority, Senior Housing Revenue Bonds, PHS Council Bluffs, Inc Project, | 8/23 at 102.00 | N/R | 6,030,999 |
| | Series 2018, 5.250%, 8/01/55 | | | |
| | Iowa Tobacco Settlement Authority, Asset Backed Settlement Revenue Bonds, Series 2005C: | | | |
| 8,285 | | 5.375%, 6/01/38 | 12/19 at 100.00 | B– | 8,286,657 |
| 2,200 | | 5.500%, 6/01/42 | 12/19 at 100.00 | B– | 2,200,418 |
| 21,420 | | 5.625%, 6/01/46 | 12/19 at 100.00 | B– | 21,423,856 |
| 8,400 | | Iowa Tobacco Settlement Authority, Tobacco Asset-Backed Revenue Bonds, Series 2005B, | 12/19 at 100.00 | B– | 8,410,836 |
| | 5.600%, 6/01/34 | | | |
| 106,265 | | Total Iowa | | | 111,132,047 |
| | Kansas – 0.6% (0.4% of Total Investments) | | | |
| | Kansas Development Finance Authority, Revenue Bonds, Sisters of Charity of Leavenworth | | | |
| | Health Services Corporation, Series 2010A: | | | |
| 1,240 | | 5.000%, 1/01/40 | 1/20 at 100.00 | AA– | 1,247,552 |
| 8,140 | | 5.000%, 1/01/40 (Pre-refunded 1/01/20) | 1/20 at 100.00 | N/R (4) | 8,186,886 |
| 1,000 | | Lenexa, Kansas, Health Care Facilities Revenue Bonds, Lakeview Village Inc, Series | 5/27 at 100.00 | BB+ | 1,118,890 |
| | 2017A, 5.000%, 5/15/43 | | | |
43
| | | | | |
| NVG | Nuveen AMT-Free Municipal Credit Income Fund | |
| Portfolio of Investments (continued) | | | |
|
| October 31, 2019 | | | |
|
|
|
|
| Principal | | | Optional Call | | |
| Amount (000) | | Description (1) | Provisions (2) | Ratings (3) | Value |
| | Kansas (continued) | | | |
| | Wyandotte County-Kansas City Unified Government, Kansas, Sales Tax Special Obligation | | | |
| | Bonds, Vacation Village Project Area 1 and 2A, Series 2015: | | | |
| $ 4,595 | | 5.000%, 9/01/27 | 9/25 at 100.00 | N/R | $ 4,998,257 |
| 2,380 | | 5.750%, 9/01/32 | 9/25 at 100.00 | N/R | 2,617,714 |
| 2,495 | | 6.000%, 9/01/35 | 9/25 at 100.00 | N/R | 2,730,154 |
| 19,850 | | Total Kansas | | | 20,899,453 |
| | Kentucky – 2.1% (1.4% of Total Investments) | | | |
| 4,565 | | Christian County, Kentucky, Hospital Revenue Bonds, Jennie Stuart Medical Center, Series | 2/26 at 100.00 | BB+ | 5,122,341 |
| | 2016, 5.500%, 2/01/44 | | | |
| 5,150 | | Kentucky Bond Development Corporation, Tax Increment Revenue Bonds, Summit Lexington | No Opt. Call | N/R | 5,130,688 |
| | Project, Series 2016A, 4.400%, 10/01/24 | | | |
| 10,000 | | Kentucky Economic Development Finance Authority, Hospital Revenue Bonds, Owensboro | 6/27 at 100.00 | BB+ | 11,474,500 |
| | Health, Refunding Series 2017A, 5.000%, 6/01/37 | | | |
| 5,240 | | Kentucky Economic Development Finance Authority, Hospital Revenue Bonds, Owensboro | 6/20 at 100.00 | BB+ (4) | 5,382,423 |
| | Medical Health System, Series 2010A, 6.000%, 6/01/30 (Pre-refunded 6/01/20) | | | |
| 6,015 | | Kentucky Economic Development Finance Authority, Hospital Revenue Bonds, Owensboro | 6/20 at 100.00 | BB+ (4) | 6,191,360 |
| | Medical Health System, Series 2010B, 6.375%, 3/01/40 (Pre-refunded 6/01/20) | | | |
| | Kentucky Economic Development Finance Authority, Revenue Bonds, Next Generation Kentucky | | | |
| | Information Highway Project, Senior Series 2015A: | | | |
| 4,345 | | 5.000%, 7/01/37 | 7/25 at 100.00 | Baa2 | 4,902,159 |
| 7,370 | | 5.000%, 7/01/40 | 7/25 at 100.00 | Baa2 | 8,105,231 |
| 10,245 | | 5.000%, 1/01/45 | 7/25 at 100.00 | Baa2 | 11,222,475 |
| | Kentucky Public Transportation Infrastructure Authority, First Tier Toll Revenue Bonds, | | | |
| | Downtown Crossing Project, Convertible Capital Appreciation Series 2013C: | | | |
| 4,360 | | 0.000%, 7/01/43 (6) | 7/31 at 100.00 | Baa3 | 4,728,115 |
| 8,510 | | 0.000%, 7/01/46 (6) | 7/31 at 100.00 | Baa3 | 9,247,477 |
| | Kentucky Public Transportation Infrastructure Authority, First Tier Toll Revenue Bonds, | | | |
| | Downtown Crossing Project, Series 2013A: | | | |
| 2,390 | | 5.750%, 7/01/49 | 7/23 at 100.00 | Baa3 | 2,677,636 |
| 480 | | 6.000%, 7/01/53 | 7/23 at 100.00 | Baa3 | 543,216 |
| 68,670 | | Total Kentucky | | | 74,727,621 |
| | Louisiana – 1.3% (0.8% of Total Investments) | | | |
| 2,875 | | Ascension Parish Industrial development Board, Louisiana, Revenue Bonds, Impala | 7/23 at 100.00 | N/R | 3,129,955 |
| | Warehousing (US) LLC Project, Series 2013, 6.000%, 7/01/36 | | | |
| 4,330 | | Jefferson Parish Hospital District1, Louisiana, Hospital Revenue Bonds, West Jefferson | 1/21 at 100.00 | A2 (4) | 4,564,686 |
| | Medical Center, Refunding Series 2011A, 6.000%, 1/01/39 (Pre-refunded 1/01/21) – AGM Insured | | | |
| 5,000 | | Lafayette Public Trust Financing Authority, Louisiana, Revenue Bonds, Ragin’ Cajun | 10/20 at 100.00 | AA (4) | 5,195,900 |
| | Facilities Inc Housing & Parking Project, Series 2010, 5.500%, 10/01/41 (Pre-refunded | | | |
| | 10/01/20) – AGM Insured | | | |
| | Louisiana Public Facilities Authority, Hospital Revenue Bonds, Franciscan Missionaries | | | |
| | of Our Lady Health System, Series 1998A: | | | |
| 135 | | 5.750%, 7/01/25 – AGM Insured (ETM) (UB) | No Opt. Call | A2 (4) | 167,584 |
| 9,865 | | 5.750%, 7/01/25 – AGM Insured (UB) | No Opt. Call | A2 | 11,211,375 |
| 11,000 | | Louisiana Public Facilities Authority, Revenue Bonds, Loyola University Project, | 10/33 at 100.00 | BBB | 10,928,280 |
| | Refunding Series 2017, 0.000%, 10/01/46 (6) | | | |
| | Louisiana Public Facilities Authority, Revenue Bonds, Ochsner Clinic Foundation Project, | | | |
| | Series 2015: | | | |
| 1,000 | | 4.250%, 5/15/40 | 5/25 at 100.00 | A3 | 1,074,430 |
| 6,970 | | 5.000%, 5/15/47 | 5/25 at 100.00 | A3 | 7,811,279 |
| 1,000 | | New Orleans, Louisiana, Sewerage Service Revenue Bonds, Refunding Series 2014, | 6/24 at 100.00 | A– | 1,079,540 |
| | 4.250%, 6/01/34 | | | |
| 42,175 | | Total Louisiana | | | 45,163,029 |
44
| | | | | | |
| Principal | | | Optional Call | | |
| Amount (000) | | Description (1) | Provisions (2) | Ratings (3) | Value |
| | Maine – 1.1% (0.7% of Total Investments) | | | |
| $ 7,530 | | Maine Health and Higher Educational Facilities Authority Revenue Bonds, Eastern Maine | 7/23 at 100.00 | Ba1 | $ 8,086,994 |
| | Medical Center Obligated Group Issue, Series 2013, 5.000%, 7/01/43 | | | |
| | Maine Health and Higher Educational Facilities Authority Revenue Bonds, Eastern Maine | | | |
| | Medical Center Obligated Group Issue, Series 2016A: | | | |
| 5,450 | | 4.000%, 7/01/41 | 7/26 at 100.00 | Ba1 | 5,694,596 |
| 10,215 | | 4.000%, 7/01/46 | 7/26 at 100.00 | Ba1 | 10,626,256 |
| 1,050 | | Maine Health and Higher Educational Facilities Authority, Revenue Bonds, Maine General | 7/21 at 100.00 | Ba3 | 1,125,117 |
| | Medical Center, Series 2011, 6.750%, 7/01/41 | | | |
| 10,000 | | Maine Health and Higher Educational Facilities Authority, Revenue Bonds, Mainehealth | 7/24 at 100.00 | A+ | 11,209,400 |
| | Issue, Series 2015, 5.000%, 7/01/39 | | | |
| 34,245 | | Total Maine | | | 36,742,363 |
| | Maryland – 1.3% (0.9% of Total Investments) | | | |
| 1,000 | | Howard County, Maryland, Special Obligation Bonds, Downtown Columbia Project, Series | 2/26 at 100.00 | N/R | 1,061,650 |
| | 2017A, 4.375%, 2/15/39, 144A | | | |
| 2,500 | | Maryland Health and Higher Educational Facilities Authority, Revenue Bonds, Adventist | 1/22 at 100.00 | Baa3 | 2,733,700 |
| | Healthcare, Series 2011A, 6.000%, 1/01/26 | | | |
| 13,315 | | Maryland Health and Higher Educational Facilities Authority, Revenue Bonds, Adventist | 1/27 at 100.00 | Baa3 | 15,584,409 |
| | Healthcare, Series 2016A, 5.500%, 1/01/46 | | | |
| 10,000 | | Maryland Health and Higher Educational Facilities Authority, Revenue Bonds, LifeBridge | 7/25 at 100.00 | A+ | 11,254,700 |
| | Health System, Series 2015, 5.000%, 7/01/47 | | | |
| 1,500 | | Maryland Health and Higher Educational Facilities Authority, Revenue Bonds, Peninsula | 7/24 at 100.00 | A3 | 1,686,285 |
| | Regional Medical Center Issue, Refunding Series 2015, 5.000%, 7/01/45 | | | |
| 3,010 | | Maryland Health and Higher Educational Facilities Authority, Revenue Bonds, University | 7/22 at 100.00 | A– | 3,237,405 |
| | of Maryland Medical System Issue, Series 2013A, 5.000%, 7/01/43 | | | |
| | Prince George’s County Revenue Authority, Maryland, Special Obligation Bonds, | | | |
| | Suitland-Naylor Road Project, Series 2016: | | | |
| 2,000 | | 4.750%, 7/01/36, 144A | 1/26 at 100.00 | N/R | 2,129,700 |
| 2,300 | | 5.000%, 7/01/46, 144A | 1/26 at 100.00 | N/R | 2,459,597 |
| | Rockville Mayor and Council, Maryland, Economic Development Revenue Bonds, Series 2017B: | | | |
| 1,335 | | 4.250%, 11/01/37 | 11/24 at 103.00 | BB | 1,427,329 |
| 1,250 | | 4.500%, 11/01/43 | 11/24 at 103.00 | BB | 1,339,187 |
| 2,650 | | 5.000%, 11/01/47 | 11/24 at 103.00 | BB | 2,916,087 |
| 40,860 | | Total Maryland | | | 45,830,049 |
| | Massachusetts – 2.7% (1.7% of Total Investments) | | | |
| 9,500 | | Massachusetts Department of Transportation, Metropolitan Highway System Revenue Bonds, | 1/20 at 100.00 | AA | 9,557,855 |
| | Commonwealth Contract Assistance Secured, Series 2010B, 5.000%, 1/01/35 | | | |
| 3,125 | | Massachusetts Department of Transportation, Metropolitan Highway System Revenue Bonds, | 1/20 at 100.00 | A2 | 3,144,031 |
| | Refunding Senior Lien Series 2010B, 5.000%, 1/01/37 | | | |
| | Massachusetts Development Finance Agency Revenue Bonds, Lawrence General Hospital Issue, | | | |
| | Series 2014A: | | | |
| 2,245 | | 5.250%, 7/01/34 | 7/24 at 100.00 | BB | 2,494,330 |
| 6,195 | | 5.500%, 7/01/44 | 7/24 at 100.00 | BB | 6,859,414 |
| | Massachusetts Development Finance Agency Revenue Refunding Bonds, NewBridge on the | | | |
| | Charles, Inc Issue, Series 2017: | | | |
| 8,200 | | 4.125%, 10/01/42, 144A | 10/22 at 105.00 | BB+ | 8,620,660 |
| 2,810 | | 5.000%, 10/01/47, 144A | 10/22 at 105.00 | BB+ | 3,094,175 |
| 10,000 | | Massachusetts Development Finance Agency, Revenue Bonds, CareGroup Issue, Series | 7/28 at 100.00 | A3 | 11,757,000 |
| | 2018J-2, 5.000%, 7/01/53 | | | |
| | Massachusetts Development Finance Agency, Revenue Bonds, Emerson College, Series 2015: | | | |
| 4,020 | | 4.500%, 1/01/45 | 1/25 at 100.00 | Baa2 | 4,299,671 |
| 2,950 | | 5.000%, 1/01/45 | 1/25 at 100.00 | Baa2 | 3,269,750 |
45
| | | | | |
| NVG | Nuveen AMT-Free Municipal Credit Income Fund | |
| Portfolio of Investments (continued) | | | |
|
| October 31, 2019 | | | |
|
|
|
|
| Principal | | | Optional Call | | |
| Amount (000) | | Description (1) | Provisions (2) | Ratings (3) | Value |
| | Massachusetts (continued) | | | |
| $ 4,035 | | Massachusetts Development Finance Agency, Revenue Bonds, Emmanuel College, Series 2016A, | 10/26 at 100.00 | Baa2 | $ 4,242,359 |
| | 4.000%, 10/01/46 | | | |
| 6,000 | | Massachusetts Development Finance Authority, Revenue Bonds, WGBH Educational Foundation, | No Opt. Call | AA– | 8,912,400 |
| | Series 2002A, 5.750%, 1/01/42 – AMBAC Insured | | | |
| 5,330 | | Massachusetts Health and Educational Facilities Authority, Revenue Bonds, Harvard | 12/19 at 100.00 | AAA | 5,401,102 |
| | University, Tender Option Bond Trust 2016-XL0017, 11.295%, 12/15/34, 144A (Pre-refunded | | | |
| | 12/15/19) (IF) (5) | | | |
| 1,000 | | Massachusetts Health and Educational Facilities Authority, Revenue Bonds, Massachusetts | 7/20 at 100.00 | N/R (4) | 1,027,080 |
| | Eye and Ear Infirmary, Series 2010C, 5.375%, 7/01/35 (Pre-refunded 7/01/20) | | | |
| 7,405 | | Massachusetts Health and Educational Facilities Authority, Revenue Bonds, Massachusetts | No Opt. Call | AAA | 10,556,420 |
| | Institute of Technology, Series 2002K, 5.500%, 7/01/32 (UB) (5) | | | |
| 2,800 | | Massachusetts Housing Finance Agency, Housing Bonds, Series 2014D, 3.875%, 12/01/39 | 6/24 at 100.00 | AA– | 2,932,832 |
| 4,560 | | Massachusetts School Building Authority, Dedicated Sales Tax Revenue Bonds, Senior | 5/23 at 100.00 | Aa2 | 5,081,618 |
| | Series 2013A, 5.000%, 5/15/43 | | | |
| 425 | | Massachusetts Water Pollution Abatement Trust, Revenue Bonds, MWRA Loan Program, | 12/19 at 100.00 | AAA | 426,471 |
| | Subordinate Series 1999A, 5.750%, 8/01/29 | | | |
| 1,245 | | Springfield Water and Sewer Commission, Massachusetts, General Revenue Bonds, Refunding | 11/20 at 100.00 | A3 (4) | 1,294,613 |
| | Series 2010B, 5.000%, 11/15/30 (Pre-refunded 11/15/20) – AGC Insured | | | |
| 81,845 | | Total Massachusetts | | | 92,971,781 |
| | Michigan – 2.3% (1.5% of Total Investments) | | | |
| 5,490 | | Detroit City School District, Wayne County, Michigan, Unlimited Tax School Building and | No Opt. Call | AA | 6,889,456 |
| | Site Improvement Bonds, Series 2001A, 6.000%, 5/01/29 – AGM Insured (UB) | | | |
| 3,665 | | Detroit Downtown Development Authority, Michigan, Tax Increment Revenue Bonds, Catalyst | 7/24 at 100.00 | AA | 4,070,129 |
| | Development Project, Series 2018A, 5.000%, 7/01/48 – AGM Insured | | | |
| 2,985 | | Detroit Water and Sewerage Department, Michigan, Sewage Disposal System Revenue Bonds, | 7/22 at 100.00 | A2 | 3,239,710 |
| | Refunding Senior Lien Series 2012A, 5.250%, 7/01/39 | | | |
| | Kalamazoo Hospital Finance Authority, Michigan, Hospital Revenue Refunding Bonds, | | | |
| | Bronson Methodist Hospital, Remarketed Series 2006: | | | |
| 895 | | 5.250%, 5/15/36 – AGM Insured | 5/20 at 100.00 | A2 | 914,207 |
| 1,105 | | 5.250%, 5/15/36 (Pre-refunded 5/15/20) – AGM Insured | 5/20 at 100.00 | A2 (4) | 1,128,415 |
| | Michigan Finance Authority, Hospital Revenue Bonds, Sparrow Obligated Group, Refunding | | | |
| | Series 2015: | | | |
| 4,495 | | 4.000%, 11/15/35 | 5/25 at 100.00 | A+ | 4,848,936 |
| 2,550 | | 4.000%, 11/15/36 | 5/25 at 100.00 | A+ | 2,748,492 |
| 10,000 | | Michigan Finance Authority, Michigan, Revenue Bonds, Trinity Health Credit Group, | 6/26 at 100.00 | AA– | 11,599,800 |
| | Refunding Series 2016MI, 5.000%, 12/01/45 (UB) (5) | | | |
| | Michigan Finance Authority, Revenue Bonds, Trinity Health Credit Group, Refunding | | | |
| | Series 2011MI: | | | |
| 10 | | 5.000%, 12/01/39 (Pre-refunded 12/01/21) | 12/21 at 100.00 | N/R (4) | 10,774 |
| 3,240 | | 5.000%, 12/01/39 | 12/21 at 100.00 | AA– | 3,461,260 |
| 4,000 | | Michigan Public Power Agency, AFEC Project Revenue Bonds, Series 2012A, 5.000%, 1/01/43 | 1/22 at 100.00 | BBB+ | 4,207,600 |
| | Michigan State Building Authority, Revenue Bonds, Facilities Program, Refunding | | | |
| | Series 2011-II-A: | | | |
| 2,750 | | 5.375%, 10/15/36 | 10/21 at 100.00 | AA– | 2,953,912 |
| 8,260 | | 5.375%, 10/15/41 | 10/21 at 100.00 | AA– | 8,864,632 |
| 13,855 | | Michigan State Hospital Finance Authority, Revenue Bonds, Trinity Health Care Group, | 6/22 at 100.00 | AA– | 14,888,722 |
| | Series 2009C, 5.000%, 12/01/48 | | | |
| 3,050 | | Michigan Tobacco Settlement Finance Authority, Tobacco Settlement Asset-Backed Revenue | 11/19 at 100.00 | B2 | 3,082,940 |
| | Bonds, Series 2008A, 6.875%, 6/01/42 | | | |
46
| | | | | | |
| Principal | | | Optional Call | | |
| Amount (000) | | Description (1) | Provisions (2) | Ratings (3) | Value |
| | Michigan (continued) | | | |
| | Wayne County Airport Authority, Michigan, Revenue Bonds, Detroit Metropolitan Wayne | | | |
| | County Airport, Series 2015D: | | | |
| $ 3,550 | | 5.000%, 12/01/40 | 12/25 at 100.00 | A | $ 4,115,444 |
| 3,600 | | 5.000%, 12/01/45 | 12/25 at 100.00 | A | 4,157,244 |
| 73,500 | | Total Michigan | | | 81,181,673 |
| | Minnesota – 1.7% (1.1% of Total Investments) | | | |
| | Baytown Township, Minnesota Charter School Lease Revenue Bonds, Saint Croix Preparatory | | | |
| | Academy, Refunding Series 2016A: | | | |
| 155 | | 4.000%, 8/01/36 | 8/26 at 100.00 | BB+ | 159,143 |
| 440 | | 4.000%, 8/01/41 | 8/26 at 100.00 | BB+ | 446,477 |
| 2,000 | | Brooklyn Park, Minnesota, Charter School Lease Revenue Bonds, Prairie Seeds Academy | 3/25 at 100.00 | BB– | 2,063,960 |
| | Project, Refunding Series 2015A, 5.000%, 3/01/34 | | | |
| 1,720 | | Deephaven, Minnesota, Charter School Lease Revenue Bonds, Eagle Ridge Academy Project, | 7/25 at 100.00 | BB+ | 1,875,574 |
| | Series 2015A, 5.500%, 7/01/50 | | | |
| | Duluth Economic Development Authority, Minnesota, Health Care Facilities Revenue Bonds, | | | |
| | Essentia Health Obligated Group, Series 2018A: | | | |
| 9,560 | | 4.250%, 2/15/43 | 2/28 at 100.00 | A– | 10,603,187 |
| 27,325 | | 4.250%, 2/15/48 | 2/28 at 100.00 | A– | 30,177,730 |
| 1,410 | | Minneapolis, Minnesota, Charter School Lease Revenue Bonds, Hiawatha Academies Project, | 7/24 at 102.00 | N/R | 1,503,328 |
| | Series 2016A, 5.000%, 7/01/47 | | | |
| 1,000 | | Minneapolis-Saint Paul Housing and Redevelopment Authority, Minnesota, Health Care | 8/20 at 100.00 | A2 | 1,021,770 |
| | Revenue Bonds, Children’s Health Care, Series 2004A-1 Remarketed, 4.625%, 8/15/29 – AGM Insured | | | |
| | Saint Cloud, Minnesota, Charter School Lease Revenue Bonds, Stride Academy Project, | | | |
| | Series 2016A: | | | |
| 405 | | 5.000%, 4/01/36 | 4/26 at 100.00 | N/R | 273,006 |
| 605 | | 5.000%, 4/01/46 | 4/26 at 100.00 | N/R | 406,034 |
| 2,500 | | Saint Paul Housing and Redevelopment Authority, Minnesota, Health Care Facility Revenue | 7/25 at 100.00 | A2 | 2,707,175 |
| | Bonds, HealthPartners Obligated Group, Refunding Series 2015A, 4.000%, 7/01/35 | | | |
| 200 | | Saint Paul Housing and Redevelopment Authority, Minnesota, Multifamily Housing Revenue | 4/23 at 100.00 | N/R | 205,364 |
| | Bonds, 2700 University at Westgate Station, Series 2015B, 4.250%, 4/01/25 | | | |
| | St Paul Housing and Redevelopment Authority, Minnesota, Hospital Revenue Bonds, | | | |
| | HealthEast Inc, Series 2015A: | | | |
| 900 | | 5.250%, 11/15/35 (Pre-refunded 11/15/20) | 11/20 at 100.00 | N/R (4) | 937,215 |
| 2,785 | | 5.000%, 11/15/40 (Pre-refunded 11/15/25) | 11/25 at 100.00 | N/R (4) | 3,379,013 |
| 3,190 | | 5.000%, 11/15/44 (Pre-refunded 11/15/25) | 11/25 at 100.00 | N/R (4) | 3,870,395 |
| 54,195 | | Total Minnesota | | | 59,629,371 |
| | Mississippi – 0.2% (0.1% of Total Investments) | | | |
| 5,445 | | Mississippi Development Bank, Special Obligation Bonds, Gulfport Water and Sewer System | No Opt. Call | A2 | 6,149,365 |
| | Project, Series 2005, 5.250%, 7/01/24 – AGM Insured | | | |
| | Missouri – 2.4% (1.5% of Total Investments) | | | |
| 2,960 | | Chesterfield Valley Transportation Development District, Missouri, Transportation Sales | 5/23 at 100.00 | A– | 3,057,502 |
| | Tax Revenue Bonds, Series 2015, 3.625%, 5/15/31 | | | |
| | Kansas City Industrial Development Authority, Missouri, Sales Tax Revenue Bonds, Ward | | | |
| | Parkway Center Community Improvement District, Senior Refunding & Improvement Series 2016: | | | |
| 400 | | 5.000%, 4/01/36, 144A | 4/26 at 100.00 | N/R | 419,176 |
| 1,520 | | 5.000%, 4/01/46, 144A | 4/26 at 100.00 | N/R | 1,572,957 |
| 15,000 | | Kansas City Municipal Assistance Corporation, Missouri, Leasehold Revenue Bonds, Series | No Opt. Call | A1 | 12,389,100 |
| | 2004B-1, 0.000%, 4/15/28 – AMBAC Insured | | | |
| 4,345 | | Kirkwood Industrial Development Authority, Missouri, Retirement Community Revenue Bonds, | 5/27 at 100.00 | BB | 4,841,460 |
| | Aberdeen Heights Project, Refunding Series 2017A, 5.250%, 5/15/50 | | | |
47
| | | | | |
| NVG | Nuveen AMT-Free Municipal Credit Income Fund | |
| Portfolio of Investments (continued) | | | |
|
| October 31, 2019 | | | |
|
|
|
|
| Principal | | | Optional Call | | |
| Amount (000) | | Description (1) | Provisions (2) | Ratings (3) | Value |
| | Missouri (continued) | | | |
| | Liberty, Missouri, Special Obligation Tax Increment and Special Districts Bonds, Liberty | | | |
| | Commons Project, Series 2015A: | | | |
| $ 1,575 | | 5.750%, 6/01/35, 144A | 6/25 at 100.00 | N/R | $ 1,610,280 |
| 1,055 | | 6.000%, 6/01/46, 144A | 6/25 at 100.00 | N/R | 1,084,561 |
| 2,460 | | Missouri Health and Educational Facilities Authority, Educational Facilities Revenue | 5/23 at 100.00 | BBB | 2,662,335 |
| | Bonds, Saint Louis College of Pharmacy, Series 2013, 5.500%, 5/01/43 | | | |
| | Missouri Health and Educational Facilities Authority, Educational Facilities Revenue | | | |
| | Bonds, Saint Louis College of Pharmacy, Series 2015B: | | | |
| 1,410 | | 5.000%, 5/01/40 | 11/23 at 100.00 | BBB | 1,508,926 |
| 2,000 | | 5.000%, 5/01/45 | 11/23 at 100.00 | BBB | 2,133,260 |
| 7,040 | | Missouri Health and Educational Facilities Authority, Health Facilities Revenue Bonds, | 11/23 at 100.00 | A2 | 7,677,050 |
| | CoxHealth, Series 2013A, 5.000%, 11/15/48 | | | |
| 2,250 | | Missouri Health and Educational Facilities Authority, Health Facilities Revenue Bonds, | 2/22 at 100.00 | A1 | 2,392,200 |
| | Heartland Regional Medical Center, Series 2012, 5.000%, 2/15/43 | | | |
| | Missouri Health and Educational Facilities Authority, Health Facilities Revenue Bonds, | | | |
| | Mosaic Health System, Series 2019A: | | | |
| 6,330 | | 4.000%, 2/15/44 | 2/29 at 100.00 | A1 | 6,980,597 |
| 13,545 | | 4.000%, 2/15/49 | 2/29 at 100.00 | A1 | 14,827,711 |
| 1,010 | | Plaza at Noah’s Ark Community Improvement District, Saint Charles, Missouri, Tax | 5/21 at 100.00 | N/R | 1,022,968 |
| | Increment and Improvement District Revenue Bonds, Series 2015, 5.000%, 5/01/30 | | | |
| 405 | | Saint Louis County Industrial Development Authority, Missouri, Revenue Bonds, Friendship | 9/23 at 100.00 | BB+ | 450,635 |
| | Village of Sunset Hills, Series 2013A, 5.875%, 9/01/43 | | | |
| | Saint Louis County Industrial Development Authority, Missouri, Revenue Bonds, Saint | | | |
| | Andrew’s Resources for Seniors, Series 2015A: | | | |
| 1,550 | | 5.000%, 12/01/35 | 12/25 at 100.00 | N/R | 1,705,589 |
| 455 | | 5.125%, 12/01/45 | 12/25 at 100.00 | N/R | 496,956 |
| 4,125 | | Saint Louis, Missouri, Airport Revenue Bonds, Lambert-St Louis International Airport, | No Opt. Call | A | 5,488,642 |
| | Series 2005, 5.500%, 7/01/29 – NPFG Insured | | | |
| 15,350 | | Springfield Public Building Corporation, Missouri, Lease Revenue Bonds, Jordan Valley | No Opt. Call | N/R | 10,572,466 |
| | Park Projects, Series 2000A, 0.000%, 6/01/30 – AMBAC Insured | | | |
| 84,785 | | Total Missouri | | | 82,894,371 |
| | Montana – 0.1% (0.1% of Total Investments) | | | |
| | Kalispell, Montana, Housing and Healthcare Facilities Revenue Bonds, Immanuel Lutheran | | | |
| | Corporation, Series 2017A: | | | |
| 1,175 | | 5.250%, 5/15/37 | 5/25 at 102.00 | N/R | 1,278,952 |
| 375 | | 5.250%, 5/15/47 | 5/25 at 102.00 | N/R | 404,265 |
| 3,000 | | Montana Facility Finance Authority, Hospital Revenue Bonds, Benefis Health System | 1/21 at 100.00 | A2 (4) | 3,156,150 |
| | Obligated Group, Series 2011A, 5.750%, 1/01/31 (Pre-refunded 1/01/21) – AGM Insured | | | |
| 4,550 | | Total Montana | | | 4,839,367 |
| | Nebraska – 1.2% (0.8% of Total Investments) | | | |
| 10,665 | | Central Plains Energy Project, Nebraska, Gas Project 3 Revenue Bonds, Refunding | No Opt. Call | BBB+ | 14,723,779 |
| | Crossover Series 2017A, 5.000%, 9/01/42 | | | |
| 4,435 | | Central Plains Energy Project, Nebraska, Gas Project 3 Revenue Bonds, Series 2012, | 9/22 at 100.00 | BBB+ | 4,815,124 |
| | 5.000%, 9/01/32 | | | |
| 1,330 | | Douglas County Hospital Authority 2, Nebraska, Health Facilities Revenue Bonds, Nebraska | 11/25 at 100.00 | A | 1,509,444 |
| | Methodist Health System, Refunding Series 2015, 5.000%, 11/01/45 | | | |
| | Douglas County Hospital Authority 3, Nebraska, Health Facilities Revenue Bonds, Nebraska | | | |
| | Methodist Health System, Refunding Series 2015: | | | |
| 2,090 | | 4.125%, 11/01/36 | 11/25 at 100.00 | A | 2,270,325 |
| 2,325 | | 5.000%, 11/01/48 | 11/25 at 100.00 | A | 2,633,062 |
| 4,010 | | Lincoln County Hospital Authority 1, Nebraska, Hospital Revenue and Refunding Bonds, | 11/21 at 100.00 | A– | 4,212,665 |
| | Great Plains Regional Medical Center Project, Series 2012, 5.000%, 11/01/42 | | | |
48
| | | | | | |
| Principal | | | Optional Call | | |
| Amount (000) | | Description (1) | Provisions (2) | Ratings (3) | Value |
| | Nebraska (continued) | | | |
| $ 3,980 | | Nebraska Investment Finance Authority, Single Family Housing Revenue Bonds, Series | 9/27 at 100.00 | AA+ | $ 4,266,082 |
| | 2018C, 3.750%, 9/01/38 | | | |
| 6,800 | | Scotts Bluff County Hospital Authority 1, Nebraska, Hospital Revenue Bonds, Regional | 2/27 at 100.00 | BBB | 7,603,012 |
| | West Medical Center Project, Refunding & Improvement Series 2016A, 5.250%, 2/01/37 | | | |
| 35,635 | | Total Nebraska | | | 42,033,493 |
| | Nevada – 2.1% (1.3% of Total Investments) | | | |
| | Clark County, Nevada, Passenger Facility Charge Revenue Bonds, Las Vegas-McCarran | | | |
| | International Airport, Series 2010A: | | | |
| 24,020 | | 5.250%, 7/01/39 – AGM Insured | 1/20 at 100.00 | Aa3 | 24,163,159 |
| 14,515 | | 5.250%, 7/01/42 | 1/20 at 100.00 | A+ | 14,599,477 |
| 410 | | Director of the State of Nevada Department of Business and Industry, Charter School | 12/25 at 100.00 | BB | 446,396 |
| | Lease Revenue Bonds, Somerset Academy, Series 2018A, 5.000%, 12/15/38, 144A | | | |
| 23,605 | | Las Vegas Convention and Visitors Authority, Nevada, Convention Center Expansion Revenue | 7/28 at 100.00 | A+ | 25,754,471 |
| | Bonds, Series 2018B, 4.000%, 7/01/49 | | | |
| 1,000 | | Las Vegas, Nevada, Sales Tax Increment Revenue Bonds, Symphony Park Tourism Improvement | 6/21 at 100.00 | N/R | 990,250 |
| | District, Series 2016, 4.375%, 6/15/35, 144A | | | |
| 500 | | Nevada State Director of the Department of Business and Industry, Charter School Revenue | 7/25 at 100.00 | BB+ | 540,020 |
| | Bonds, Doral Academy of Nevada, Series 2017A, 5.000%, 7/15/37, 144A | | | |
| 4,000 | | Reno, Nevada, Subordinate Lien Sales Tax Revenue Refunding Bonds, ReTrac-Reno | 12/28 at 100.00 | A3 | 4,411,560 |
| | Transportation Rail Access Corridor Project, Series 2018A, 4.000%, 6/01/43 | | | |
| 4,500 | | Reno, Nevada, Subordinate Lien Sales Tax Revenue Refunding Capital Appreciation Bonds, | 7/38 at 31.26 | N/R | 648,765 |
| | ReTrac-Reno Transportation Rail Access Corridor Project, Series 2018C, 0.010%, 7/01/58, 144A | | | |
| 72,550 | | Total Nevada | | | 71,554,098 |
| | New Hampshire – 0.2% (0.1% of Total Investments) | | | |
| 5,000 | | National Finance Authority, New Hampshire, Resource Recovery Revenue Bonds, Covanta | 7/23 at 100.00 | B | 5,265,150 |
| | Project, Refunding Series 2018B, 4.625%, 11/01/42, 144A | | | |
| 500 | | New Hampshire Health and Education Facilities Authority, Revenue Bonds, Kendal at | 10/26 at 100.00 | BBB+ | 555,040 |
| | Hanover, Series 2016, 5.000%, 10/01/40 | | | |
| 5,500 | | Total New Hampshire | | | 5,820,190 |
| | New Jersey – 6.0% (3.9% of Total Investments) | | | |
| | New Jersey Economic Development Authority, School Facilities Construction Bonds, | | | |
| | Refunding Series 2016BBB: | | | |
| 34,310 | | 5.500%, 6/15/29 | 12/26 at 100.00 | BBB+ | 41,178,519 |
| 2,110 | | 5.500%, 6/15/30 | 12/26 at 100.00 | BBB+ | 2,521,218 |
| | New Jersey Economic Development Authority, School Facilities Construction Bonds, | | | |
| | Series 2005N-1: | | | |
| 6,835 | | 5.500%, 9/01/24 – AMBAC Insured | No Opt. Call | BBB+ | 7,973,779 |
| 5,000 | | 5.500%, 9/01/28 – NPFG Insured | No Opt. Call | BBB+ | 6,268,600 |
| 11,990 | | New Jersey Economic Development Authority, School Facilities Construction Bonds, Series | 6/25 at 100.00 | BBB+ | 13,585,150 |
| | 2015WW, 5.250%, 6/15/40 | | | |
| 600 | | New Jersey Health Care Facilities Financing Authority, New Jersey, Revenue Bonds, Saint | 7/21 at 100.00 | BB+ | 635,670 |
| | Peters University Hospital, Refunding Series 2011, 6.000%, 7/01/26 | | | |
| 1,500 | | New Jersey Health Care Facilities Financing Authority, New Jersey, Revenue Bonds, Saint | 12/19 at 100.00 | BB+ | 1,504,755 |
| | Peters University Hospital, Series 2007, 5.750%, 7/01/37 | | | |
| 3,310 | | New Jersey Health Care Facilities Financing Authority, Revenue Bonds, Barnabas Health, | 7/24 at 100.00 | A1 | 3,782,138 |
| | Refunding Series 2014A, 5.000%, 7/01/44 | | | |
| 2,015 | | New Jersey Transportation Trust Fund Authority, Transportation System Bonds, Capital | No Opt. Call | BBB+ | 1,691,754 |
| | Appreciation Series 2010A, 0.000%, 12/15/26 | | | |
| 2,150 | | New Jersey Transportation Trust Fund Authority, Transportation System Bonds, Refunding | No Opt. Call | BBB+ | 2,239,182 |
| | Series 2006A, 5.250%, 12/15/20 | | | |
49
| | | | | |
| NVG | Nuveen AMT-Free Municipal Credit Income Fund | |
| Portfolio of Investments (continued) | | | |
|
| October 31, 2019 | | | |
|
|
|
|
| Principal | | | Optional Call | | |
| Amount (000) | | Description (1) | Provisions (2) | Ratings (3) | Value |
| | New Jersey (continued) | | | |
| $ 20,000 | | New Jersey Transportation Trust Fund Authority, Transportation System Bonds, Refunding | No Opt. Call | A– | $ 13,701,400 |
| | Series 2006C, 0.000%, 12/15/33 – AGM Insured | | | |
| 9,940 | | New Jersey Transportation Trust Fund Authority, Transportation System Bonds, Series | 6/21 at 100.00 | BBB+ | 10,360,959 |
| | 2011B, 5.000%, 6/15/42 | | | |
| 20,040 | | New Jersey Transportation Trust Fund Authority, Transportation System Bonds, Series | 6/24 at 100.00 | BBB+ | 21,859,632 |
| | 2014AA, 5.000%, 6/15/44 | | | |
| | New Jersey Transportation Trust Fund Authority, Transportation System Bonds, | | | |
| | Series 2015AA: | | | |
| 13,680 | | 4.750%, 6/15/38 | 6/25 at 100.00 | BBB+ | 14,895,742 |
| 5,245 | | 5.250%, 6/15/41 | 6/25 at 100.00 | BBB+ | 5,933,354 |
| 8,230 | | 5.000%, 6/15/45 | 6/25 at 100.00 | BBB+ | 9,119,087 |
| 33,200 | | New Jersey Turnpike Authority, Revenue Bonds, Refunding Series 2005D-1, 5.250%, 1/01/26 – | No Opt. Call | A2 | 40,633,480 |
| | AGM Insured | | | |
| | New Jersey Turnpike Authority, Revenue Bonds, Tender Option Bond Trust 2016-XF1057: | | | |
| 120 | | 14.027%, 1/01/43, 144A (Pre-refunded 7/01/22) (IF) (5) | 7/22 at 100.00 | N/R (4) | 165,516 |
| 80 | | 14.027%, 1/01/43, 144A (IF) (5) | 7/22 at 100.00 | A2 | 110,344 |
| 1,135 | | Rutgers State University, New Jersey, Revenue Bonds, Refunding Series 2013L, | 5/23 at 100.00 | A+ | 1,259,805 |
| | 5.000%, 5/01/43 | | | |
| 3,000 | | Tobacco Settlement Financing Corporation, New Jersey, Tobacco Settlement Asset-Backed | 6/28 at 100.00 | BBB+ | 3,489,570 |
| | Bonds, Series 2018A, 5.250%, 6/01/46 | | | |
| 3,410 | | Tobacco Settlement Financing Corporation, New Jersey, Tobacco Settlement Asset-Backed | 6/28 at 100.00 | BB+ | 3,759,423 |
| | Bonds, Series 2018B, 5.000%, 6/01/46 | | | |
| 1,330 | | Washington Township Board of Education, Mercer County, New Jersey, General Obligation | No Opt. Call | A2 | 1,607,810 |
| | Bonds, Series 2005, 5.250%, 1/01/26 – AGM Insured | | | |
| 189,230 | | Total New Jersey | | | 208,276,887 |
| | New Mexico – 0.1% (0.0% of Total Investments) | | | |
| | Santa Fe, New Mexico, Retirement Facilities Revenue Bonds, EL Castillo Retirement | | | |
| | Residences Project, Series 2019A: | | | |
| 670 | | 5.000%, 5/15/44 (WI/DD, Settling 11/07/19) | 5/26 at 103.00 | BB+ | 741,677 |
| 1,200 | | 5.000%, 5/15/49 (WI/DD, Settling 11/07/19) | 5/26 at 103.00 | BB+ | 1,320,960 |
| 1,870 | | Total New Mexico | | | 2,062,637 |
| | New York – 4.9% (3.2% of Total Investments) | | | |
| 12,060 | | Build NYC Resource Corporation, New York, Revenue Bonds, Albert Einstein College of | 9/25 at 100.00 | N/R | 13,749,606 |
| | Medicine, Inc, Series 2015, 5.500%, 9/01/45, 144A | | | |
| 2,250 | | Dormitory Authority of the State of New York, Insured Revenue Bonds, Mount Sinai School | No Opt. Call | Baa2 | 2,540,812 |
| | of Medicine, Series 1994A, 5.150%, 7/01/24 – NPFG Insured | | | |
| 9,700 | | Dormitory Authority of the State of New York, Revenue Bonds, Columbia University, Series | No Opt. Call | AAA | 15,041,014 |
| | 2017A, 5.000%, 10/01/47 (UB) (5) | | | |
| 4,070 | | Dormitory Authority of the State of New York, Revenue Bonds, Icahn School of Medicine at | 7/25 at 100.00 | A– | 4,658,848 |
| | Mount Sinai, Refunding Series 2015A, 5.000%, 7/01/45 | | | |
| 7,225 | | Dormitory Authority of the State of New York, Revenue Bonds, Non State Supported Debt, | 7/20 at 100.00 | AA | 7,405,842 |
| | Cornell University, Series 2010A, 5.000%, 7/01/35 | | | |
| | Dormitory Authority of the State of New York, Revenue Bonds, Orange Regional Medical | | | |
| | Center Obligated Group, Series 2015: | | | |
| 2,700 | | 5.000%, 12/01/40, 144A | 6/25 at 100.00 | BBB– | 3,048,327 |
| 5,600 | | 5.000%, 12/01/45, 144A | 6/25 at 100.00 | BBB– | 6,287,456 |
| 2,695 | | Hempstead Town Local Development Corporation, New York, Education Revenue Bonds, The | 2/27 at 100.00 | N/R | 2,964,365 |
| | Academy Charter School Project, Series 2017A, 6.240%, 2/01/47 | | | |
| 2,965 | | Hempstead Town Local Development Corporation, New York, Education Revenue Bonds, The | 2/28 at 100.00 | N/R | 3,386,623 |
| | Academy Charter School Project, Series 2018A, 6.760%, 2/01/48 | | | |
50
| | | | | | |
| Principal | | | Optional Call | | |
| Amount (000) | | Description (1) | Provisions (2) | Ratings (3) | Value |
| | New York (continued) | | | |
| | Hudson Yards Infrastructure Corporation, New York, Revenue Bonds, Senior Fiscal 2012 | | | |
| | Series 2011A: | | | |
| $ 105 | | 5.250%, 2/15/47 (Pre-refunded 2/15/21) | 2/21 at 100.00 | Aa2 (4) | $ 110,510 |
| 2,295 | | 5.250%, 2/15/47 | 2/21 at 100.00 | AA– | 2,406,147 |
| 325 | | 5.750%, 2/15/47 | 2/21 at 100.00 | AA– | 342,849 |
| 525 | | 5.750%, 2/15/47 (Pre-refunded 2/15/21) | 2/21 at 100.00 | Aa2 (4) | 555,881 |
| 6,075 | | Long Island Power Authority, New York, Electric System Revenue Bonds, Series 2011A, | 5/21 at 100.00 | A2 (4) | 6,432,939 |
| | 5.000%, 5/01/36 (Pre-refunded 5/01/21) – AGM Insured | | | |
| 10,000 | | Long Island Power Authority, New York, Electric System Revenue Bonds, Series 2012A, | 9/22 at 100.00 | A | 10,890,300 |
| | 5.000%, 9/01/42 | | | |
| 4,315 | | Monroe County Industrial Development Corporation, New York, FHA Insured Mortgage Revenue | 2/21 at 100.00 | AA | 4,540,588 |
| | Bonds, Unity Hospital of Rochestor Project, Series 2010, 5.500%, 8/15/40 | | | |
| 1,000 | | Nassau County Local Economic Assistance Corporation, New York, Revenue Bonds, Catholic | 7/24 at 100.00 | Baa1 | 1,121,590 |
| | Health Services of Long Island Obligated Group Project, Series 2014, 5.000%, 7/01/31 | | | |
| 4,050 | | New York City Industrial Development Agency, New York, Revenue Bonds, Yankee Stadium | 12/19 at 100.00 | A3 | 4,070,250 |
| | Project PILOT, Series 2009A, 7.000%, 3/01/49 – AGC Insured | | | |
| 11,570 | | New York City Municipal Water Finance Authority, New York, Water and Sewer System Second | 6/25 at 100.00 | AA+ | 13,444,571 |
| | General Resolution Revenue Bonds, Series 2015, 5.000%, 6/15/46 (UB) (5) | | | |
| 5 | | New York City, New York, General Obligation Bonds, Fiscal Series 2005M, 5.000%, 4/01/26 – | 12/19 at 100.00 | AA | 5,015 |
| | FGIC Insured | | | |
| 28,615 | | New York Liberty Development Corporation, New York, Liberty Revenue Bonds, 3 World Trade | 11/24 at 100.00 | N/R | 31,577,797 |
| | Center Project, Class 1 Series 2014, 5.000%, 11/15/44, 144A | | | |
| 2,560 | | New York Liberty Development Corporation, New York, Liberty Revenue Bonds, Bank of | 3/29 at 100.00 | Baa2 | 2,612,582 |
| | America Tower at One Bryant Park Project, Second Priority Refunding Series 2019 Class 3, | | | |
| | 2.800%, 9/15/69 | | | |
| 6,500 | | New York State Mortgage Agency, Homeowner Mortgage Revenue Bonds, Series 211, | 4/27 at 100.00 | Aa1 | 6,856,395 |
| | 3.750%, 10/01/43 | | | |
| 5,655 | | Onondaga Civic Development Corporation, New York, Revenue Bonds, Saint Joseph’s Hospital | 7/22 at 100.00 | N/R (4) | 6,229,605 |
| | Health Center Project, Series 2012, 5.000%, 7/01/42 (Pre-refunded 7/01/22) | | | |
| | Port Authority of New York and New Jersey, Special Project Bonds, JFK International Air | | | |
| | Terminal LLC Project, Eighth Series 2010: | | | |
| 8,550 | | 5.500%, 12/01/31 | 12/20 at 100.00 | BBB+ | 8,943,043 |
| 3,155 | | 6.000%, 12/01/36 | 12/20 at 100.00 | BBB+ | 3,315,653 |
| | TSASC Inc, New York, Tobacco Asset-Backed Bonds, Series 2006: | | | |
| 5,000 | | 5.000%, 6/01/45 | 6/27 at 100.00 | CCC+ | 4,991,200 |
| 3,110 | | 5.000%, 6/01/48 | 6/27 at 100.00 | N/R | 3,095,818 |
| 152,675 | | Total New York | | | 170,625,626 |
| | North Carolina – 0.6% (0.4% of Total Investments) | | | |
| 10,000 | | North Carolina Medical Care Commission, Health Care Facilities Revenue Bonds, Duke | 6/22 at 100.00 | AA | 10,824,800 |
| | University Health System, Series 2012A, 5.000%, 6/01/42 | | | |
| 4,715 | | North Carolina Medical Care Commission, Health Care Facilities Revenue Bonds, Vidant | 6/22 at 100.00 | A+ (4) | 5,172,968 |
| | Health, Refunding Series 2012A, 5.000%, 6/01/36 (Pre-refunded 6/01/22) | | | |
| 2,150 | | North Carolina Medical Care Commission, Health Care Facilities Revenue Bonds, WakeMed, | 10/22 at 100.00 | A2 | 2,329,396 |
| | Refunding Series 2012A, 5.000%, 10/01/38 | | | |
| 2,150 | | North Carolina Medical Care Commission, Retirement Facilities First Mortgage Revenue | 7/27 at 100.00 | N/R | 2,354,336 |
| | Bonds, Aldersgate United Retirement Community Inc, Refunding Series 2017A, 5.000%, 7/01/47 | | | |
| 1,690 | | North Carolina Turnpike Authority, Monroe Expressway Toll Revenue Bonds, Series 2017A, | 7/26 at 100.00 | Baa3 | 1,917,744 |
| | 5.000%, 7/01/54 | | | |
| 20,705 | | Total North Carolina | | | 22,599,244 |
| | North Dakota – 2.2% (1.4% of Total Investments) | | | |
| 9,950 | | Cass County, North Dakota, Health Care Facilities Revenue Bonds, Essential Health | 2/28 at 100.00 | A– | 10,820,127 |
| | Obligated Group, Series 2018B, 4.250%, 2/15/48 | | | |
51
| | | | | |
| NVG | Nuveen AMT-Free Municipal Credit Income Fund | |
| Portfolio of Investments (continued) | | | |
|
| October 31, 2019 | | | |
|
|
|
|
| Principal | | | Optional Call | | |
| Amount (000) | | Description (1) | Provisions (2) | Ratings (3) | Value |
| | North Dakota (continued) | | | |
| | Grand Forks, North Dakota, Health Care System Revenue Bonds, Altru Health System | | | |
| | Obligated Group, Series 2012: | | | |
| $ 7,000 | | 5.000%, 12/01/29 | 12/21 at 100.00 | Baa2 | $ 7,433,090 |
| 3,000 | | 5.000%, 12/01/32 | 12/21 at 100.00 | Baa2 | 3,175,890 |
| 2,245 | | 5.000%, 12/01/35 | 12/21 at 100.00 | Baa2 | 2,371,798 |
| 4,525 | | Grand Forks, North Dakota, Health Care System Revenue Bonds, Altru Health System | 12/27 at 100.00 | Baa2 | 5,169,360 |
| | Obligated Group, Series 2017A, 5.000%, 12/01/42 | | | |
| 1,000 | | Grand Forks, North Dakota, Senior Housing & Nursing Facilities Revenue Bonds, Valley | 12/26 at 100.00 | N/R | 1,072,520 |
| | Homes and Services Obligated Group, Series 2017, 5.000%, 12/01/36 | | | |
| | Ward County Health Care, North Dakota, Revenue Bonds, Trinity Obligated Group, | | | |
| | Series 2017C: | | | |
| 10,000 | | 5.000%, 6/01/38 | 6/28 at 100.00 | BBB– | 11,489,700 |
| 28,000 | | 5.000%, 6/01/53 | 6/28 at 100.00 | BBB– | 31,421,600 |
| 1,085 | | Williston Parks and Recreation District, North Dakota, Sales Tax & Gross Revenue Bonds, | No Opt. Call | B | 1,108,393 |
| | Series 2012A, 5.000%, 3/01/21 | | | |
| 2,535 | | Williston, North Dakota, Multifamily Housing Revenue Bonds, Eagle Crest Apartments LLC | 9/23 at 100.00 | N/R | 1,115,400 |
| | Project, Series 2013, 7.750%, 9/01/38 (7) | | | |
| 69,340 | | Total North Dakota | | | 75,177,878 |
| | Ohio – 10.7% (6.9% of Total Investments) | | | |
| 4,185 | | Akron, Bath and Copley Joint Township Hospital District, Ohio, Hospital Revenue Bonds, | 5/22 at 100.00 | A1 | 4,463,302 |
| | Children’s Hospital Medical Center, Improvement & Refunding Series 2012, 5.000%, 11/15/42 | | | |
| | Allen County, Ohio, Hospital Facilities Revenue Bonds, Catholic Health Partners, | | | |
| | Refunding and Improvement Series 2012A: | | | |
| 2,740 | | 4.000%, 5/01/33 | 5/22 at 100.00 | A2 | 2,849,518 |
| 1,930 | | 5.000%, 5/01/33 | 5/22 at 100.00 | A2 | 2,083,281 |
| 3,405 | | 5.000%, 5/01/42 | 5/22 at 100.00 | A2 | 3,643,554 |
| 100,000 | | Buckeye Tobacco Settlement Financing Authority, Ohio, Tobacco Settlement Asset-Backed | 11/19 at 9.11 | N/R | 4,350,000 |
| | Revenue Bonds, Second Subordinate Capital Appreciation Turbo Term Series 2007C, 0.000%, 6/01/52 | | | |
| | Buckeye Tobacco Settlement Financing Authority, Ohio, Tobacco Settlement Asset-Backed | | | |
| | Revenue Bonds, Senior Lien, Series 2007A-2: | | | |
| 36,565 | | 5.125%, 6/01/24 | 11/19 at 100.00 | CCC+ | 36,615,460 |
| 14,210 | | 5.375%, 6/01/24 | 11/19 at 100.00 | CCC+ | 14,225,631 |
| 20,320 | | 5.875%, 6/01/30 | 11/19 at 100.00 | CCC+ | 20,375,677 |
| 26,655 | | 5.750%, 6/01/34 | 11/19 at 100.00 | CCC+ | 26,688,585 |
| 2,715 | | 6.000%, 6/01/42 | 11/19 at 100.00 | B– | 2,730,475 |
| 22,960 | | 5.875%, 6/01/47 | 11/19 at 100.00 | B– | 23,107,403 |
| 10,000 | | Buckeye Tobacco Settlement Financing Authority, Ohio, Tobacco Settlement Asset-Backed | 6/22 at 100.00 | Caa3 | 10,243,900 |
| | Revenue Bonds, Senior Lien, Series 2007A-3, 6.250%, 6/01/37 | | | |
| 1,000 | | Butler County Port Authority, Ohio, Revenue Bonds, StoryPoint Fairfield Project, Senior | 1/24 at 104.00 | N/R | 1,090,440 |
| | Series 2017A-1, 6.250%, 1/15/34, 144A | | | |
| | Centerville, Ohio Health Care Improvement Revenue Bonds, Graceworks Lutheran Services, | | | |
| | Refunding & Improvement Series 2017: | | | |
| 2,750 | | 5.250%, 11/01/37 | 11/27 at 100.00 | N/R | 3,052,610 |
| 3,200 | | 5.250%, 11/01/47 | 11/27 at 100.00 | N/R | 3,503,360 |
| | Cleveland Heights-University Heights City School District, Ohio, General Obligation | | | |
| | Bonds, School Improvement Series 2014: | | | |
| 3,345 | | 5.000%, 12/01/51 | 6/23 at 100.00 | A1 | 3,679,567 |
| 4,965 | | 5.000%, 12/01/51 (Pre-refunded 6/01/23) | 6/23 at 100.00 | N/R (4) | 5,619,536 |
| 5,000 | | County of Lucas, Ohio, Hospital Revenue Bonds, ProMedica Healthcare Obligated Group, | 11/28 at 100.00 | Baa3 | 5,786,350 |
| | Series 2018A, 5.250%, 11/15/48 | | | |
| 37,150 | | Cuyahoga County, Ohio, Certificates of Participation, Convention Hotel Project, Series | 6/24 at 100.00 | A1 | 39,332,934 |
| | 2014, 4.375%, 12/01/44 (UB) (5) | | | |
52
| | | | | | |
| Principal | | | Optional Call | | |
| Amount (000) | | Description (1) | Provisions (2) | Ratings (3) | Value |
| | Ohio (continued) | | | |
| | Darke County, Ohio, Hospital Facilities Revenue Bonds, Wayne Healthcare Project, | | | |
| | Series 2019A: | | | |
| $ 1,165 | | 4.000%, 9/01/40 | 9/29 at 100.00 | BB+ | $ 1,225,161 |
| 1,750 | | 4.000%, 9/01/45 | 9/29 at 100.00 | BB+ | 1,823,045 |
| 2,000 | | 5.000%, 9/01/49 | 9/29 at 100.00 | BB+ | 2,292,260 |
| 7,870 | | Franklin County, Ohio, Hospital Revenue Bonds, Nationwide Children’s Hospital Project, | 5/22 at 100.00 | Aa2 | 8,419,326 |
| | Improvement Series 2012A, 5.000%, 11/01/42 | | | |
| 4,440 | | Franklin County, Ohio, Revenue Bonds, Trinity Health Credit Group, Series 2017A, | 12/27 at 100.00 | AA– | 4,579,949 |
| | 3.250%, 12/01/42 | | | |
| 6,425 | | JobsOhio Beverage System, Ohio, Statewide Liquor Profits Revenue Bonds, Senior Lien | 1/23 at 100.00 | Aa3 | 7,056,449 |
| | Series 2013A, 5.000%, 1/01/38 (UB) (5) | | | |
| | JobsOhio Beverage System, Ohio, Statewide Senior Lien Liquor Profits Revenue Bonds, | | | |
| | Tender Option Bond Trust 2016-XG0052: | | | |
| 390 | | 14.527%, 1/01/38, 144A (IF) (5) | 1/23 at 100.00 | Aa3 | 542,143 |
| 1,750 | | 14.618%, 1/01/38, 144A (IF) (5) | 1/23 at 100.00 | Aa3 | 2,437,558 |
| 625 | | 14.625%, 1/01/38, 144A (IF) (5) | 1/23 at 100.00 | Aa3 | 870,694 |
| 1,250 | | 14.625%, 1/01/38, 144A (IF) (5) | 1/23 at 100.00 | Aa3 | 1,741,388 |
| 1,725 | | 14.625%, 1/01/38, 144A (IF) (5) | 1/23 at 100.00 | Aa3 | 2,403,115 |
| 2,000 | | 14.625%, 1/01/38, 144A (IF) (5) | 1/23 at 100.00 | Aa3 | 2,786,220 |
| 2,885 | | Lucas County, Ohio, Hospital Revenue Bonds, ProMedica Healthcare Obligated Group, Series | 11/21 at 100.00 | Baa3 (4) | 3,160,748 |
| | 2011A, 6.000%, 11/15/41 (Pre-refunded 11/15/21) | | | |
| | Middletown City School District, Butler County, Ohio, General Obligation Bonds, | | | |
| | Refunding Series 2007: | | | |
| 4,380 | | 5.250%, 12/01/27 – AGM Insured | No Opt. Call | A2 | 5,556,950 |
| 6,000 | | 5.250%, 12/01/31 – AGM Insured | No Opt. Call | A2 | 7,928,760 |
| 12,000 | | Muskingum County, Ohio, Hospital Facilities Revenue Bonds, Genesis HealthCare System | 2/23 at 100.00 | Ba2 | 12,803,400 |
| | Obligated Group Project, Series 2013, 5.000%, 2/15/48 | | | |
| 8,500 | | Ohio Air Quality Development Authority, Ohio, Air Quality Development Revenue Bonds, | No Opt. Call | N/R | 7,501,250 |
| | FirstEnergy Generation Corporation Project, Series 2009A, 0.000%, 8/01/20 (7) | | | |
| 1,050 | | Ohio Air Quality Development Authority, Ohio, Pollution Control Revenue Bonds, | No Opt. Call | N/R | 926,625 |
| | FirstEnergy Generation Corporation Project, Refunding Series 2009B, 3.100%, 3/01/23 (7) | | | |
| 2,020 | | Ohio Air Quality Development Authority, Ohio, Pollution Control Revenue Bonds, | No Opt. Call | N/R | 1,782,650 |
| | FirstEnergy Nuclear Generation Corporation Project, Refunding Series 2010B, 3.750%, 6/01/33 | | | |
| | (Mandatory Put 6/01/20) (7) | | | |
| 1,000 | | Ohio Air Quality Development Authority, Ohio, Pollution Control Revenue Bonds, | No Opt. Call | N/R | 882,500 |
| | FirstEnergy Nuclear Generation Project, Refunding Series 2006B, 0.000%, 1/01/34 (7) | | | |
| 20,765 | | Ohio Air Quality Development Authority, Ohio, Pollution Control Revenue Bonds, | No Opt. Call | N/R | 22,270,462 |
| | FirstEnergy Nuclear Generation Project, Refunding Series 2009A, 4.375%, 6/01/33 (Mandatory | | | |
| | Put 6/01/22) (7) | | | |
| 4,975 | | Ohio Turnpike Commission, Turnpike Revenue Bonds, Infrastructure Project, Junior Lien | 2/23 at 100.00 | A+ | 5,476,928 |
| | Series 2013A-1, 5.000%, 2/15/48 | | | |
| 1,240 | | Ohio Turnpike Commission, Turnpike Revenue Bonds, Infrastructure Projects, Junior Lien | 2/31 at 100.00 | A+ | 1,405,590 |
| | Convertible Series 2013A-3, 0.000%, 2/15/36 (6) | | | |
| 1,130 | | Ohio Water Development Authority, Pollution Control Revenue Refunding Bonds, FirstEnergy | No Opt. Call | N/R | 997,225 |
| | Nuclear Generating Corporation Project, Series 2006B, 0.000%, 12/01/33 (7) | | | |
| 20,405 | | Ohio Water Development Authority, Pollution Control Revenue Refunding Bonds, FirstEnergy | No Opt. Call | N/R | 21,884,362 |
| | Nuclear Generating Corporation Project, Series 2009A, 4.375%, 6/01/33 (Mandatory Put | | | |
| | 6/01/22) (7) | | | |
| 20,480 | | Ohio Water Development Authority, Pollution Control Revenue Refunding Bonds, FirstEnergy | No Opt. Call | N/R | 21,964,800 |
| | Nuclear Generating Corporation Project, Series 2010B, 4.375%, 6/01/33 (Mandatory Put | | | |
| | 6/01/22) (7) | | | |
| 1,610 | | Ohio Water Development Authority, Pollution Control Revenue Refunding Bonds, FirstEnergy | No Opt. Call | N/R | 1,420,825 |
| | Nuclear Generating Corporation Project, Series 2010C, 0.000%, 6/01/33 (7) | | | |
53
| | | | | |
| NVG | Nuveen AMT-Free Municipal Credit Income Fund | |
| Portfolio of Investments (continued) | | | |
|
| October 31, 2019 | | | |
|
|
|
|
| Principal | | | Optional Call | | |
| Amount (000) | | Description (1) | Provisions (2) | Ratings (3) | Value |
| | Ohio (continued) | | | |
| | Southeastern Ohio Port Authority, Hospital Facilities Revenue Bonds, Memorial Health | | | |
| | System Obligated Group Project, Refunding and Improvement Series 2012: | | | |
| $ 1,095 | | 5.750%, 12/01/32 | 12/22 at 100.00 | BB– | $ 1,194,349 |
| 870 | | 6.000%, 12/01/42 | 12/22 at 100.00 | BB– | 939,165 |
| 1,615 | | Toledo Lucas County Port Authority, Ohio, Revenue Bonds, StoryPoint Waterville Project, | 1/24 at 104.00 | N/R | 1,751,968 |
| | Series 2016A-1, 6.125%, 1/15/34, 144A | | | |
| 1,330 | | Tuscarawas County Economic Development and Finance Alliance, Ohio, Higher Education | 3/25 at 100.00 | N/R | 1,417,607 |
| | Facilities Revenue Bonds, Ashland University, Refunding & Improvement Series 2015, | | | |
| | 6.000%, 3/01/45 | | | |
| 2,000 | | University of Akron, Ohio, General Receipts Bonds, Federally Taxable Build America | 1/20 at 100.00 | A1 | 2,010,760 |
| | Bonds, Series 2010B, 5.000%, 1/01/29 – AGM Insured | | | |
| 449,835 | | Total Ohio | | | 372,895,815 |
| | Oklahoma – 0.7% (0.4% of Total Investments) | | | |
| 1,225 | | Fort Sill Apache Tribe of Oklahoma Economic Development Authority, Gaming Enterprise | 8/21 at 100.00 | N/R | 1,353,625 |
| | Revenue Bonds, Fort Sill Apache Casino, Series 2011A, 8.500%, 8/25/26, 144A | | | |
| 3,500 | | Grand River Dam Authority, Oklahoma, Revenue Bonds, Series 2010A, 5.250%, 6/01/40 | 6/20 at 100.00 | A1 (4) | 3,582,390 |
| | (Pre-refunded 6/01/20) | | | |
| | Oklahoma City Water Utilities Trust, Oklahoma, Water and Sewer Revenue Bonds, | | | |
| | Series 2011: | | | |
| 1,500 | | 5.000%, 7/01/40 | 7/21 at 100.00 | AAA | 1,587,660 |
| 1,000 | | 5.375%, 7/01/40 | 7/21 at 100.00 | AAA | 1,066,950 |
| | Oklahoma Development Finance Authority, Health System Revenue Bonds, OU Medicine | | | |
| | Project, Series 2018B: | | | |
| 5,290 | | 5.500%, 8/15/52 | 8/28 at 100.00 | BB+ | 6,348,952 |
| 5,530 | | 5.500%, 8/15/57 | 8/28 at 100.00 | BB+ | 6,594,470 |
| 2,340 | | Tulsa County Industrial Authority, Oklahoma, Senior Living Community Revenue Bonds, | 11/25 at 102.00 | BBB– | 2,650,869 |
| | Montereau, Inc Project, Refunding Series 2017, 5.250%, 11/15/45 | | | |
| 20,385 | | Total Oklahoma | | | 23,184,916 |
| | Oregon – 0.2% (0.1% of Total Investments) | | | |
| | Multnomah County Hospital Facilities Authority, Oregon, Revenue Bonds, Mirabella South | | | |
| | Waterfront, Refunding Series 2014A: | | | |
| 1,000 | | 5.400%, 10/01/44 | 10/24 at 100.00 | N/R | 1,090,150 |
| 800 | | 5.500%, 10/01/49 | 10/24 at 100.00 | N/R | 873,816 |
| | Oregon Department of Administrative Services, State Lottery Revenue Bonds, Series 2011A: | | | |
| 555 | | 5.250%, 4/01/31 | 4/21 at 100.00 | Aa2 | 585,614 |
| 3,445 | | 5.250%, 4/01/31 (Pre-refunded 4/01/21) | 4/21 at 100.00 | N/R (4) | 3,638,712 |
| 5,800 | | Total Oregon | | | 6,188,292 |
| | Pennsylvania – 8.0% (5.2% of Total Investments) | | | |
| 14,855 | | Allegheny County Hospital Development Authority, Pennsylvania, Revenue Bonds, Allegheny | 4/28 at 100.00 | A | 15,951,448 |
| | Health Network Obligated Group Issue, Series 2018A, 4.000%, 4/01/44 | | | |
| 3,335 | | Allegheny County Sanitary Authority, Pennsylvania, Sewer Revenue Bonds, Refunding Series | 12/20 at 100.00 | A1 | 3,457,528 |
| | 2010, 5.000%, 6/01/40 – AGM Insured | | | |
| 2,540 | | Allentown Neighborhood Improvement Zone Development Authority, Pennsylvania, Tax Revenue | 5/27 at 100.00 | Ba3 | 2,838,831 |
| | Bonds, City Center Refunding Project, Series 2017, 5.000%, 5/01/42, 144A | | | |
| 1,245 | | Beaver County Industrial Development Authority, Pennsylvania, Pollution Control Revenue | No Opt. Call | N/R | 1,098,712 |
| | Bonds, FirstEnergy Nuclear Generation Project, Refunding Series 2005A, 4.000%, 1/01/35 | | | |
| | (Mandatory Put 7/01/21) (7) | | | |
| 7,750 | | Beaver County Industrial Development Authority, Pennsylvania, Pollution Control Revenue | No Opt. Call | N/R | 8,311,875 |
| | Refunding Bonds, FirstEnergy Generation Project, Series 2008B, 4.250%, 10/01/47 (Mandatory | | | |
| | Put 4/01/21) (7) | | | |
54
| | | | | | |
| Principal | | | Optional Call | | |
| Amount (000) | | Description (1) | Provisions (2) | Ratings (3) | Value |
| | Pennsylvania (continued) | | | |
| | Beaver County Industrial Development Authority, Pennsylvania, Pollution Control Revenue | | | |
| | Refunding Bonds, FirstEnergy Nuclear Generation Project, Series 2006A: | | | |
| $ 13,235 | | 4.375%, 1/01/35 (Mandatory Put 7/01/22) (7) | No Opt. Call | N/R | $ 14,194,537 |
| 3,145 | | 3.500%, 4/01/41 (Mandatory Put 6/01/20) (7) | No Opt. Call | N/R | 2,775,462 |
| 1,240 | | Beaver County Industrial Development Authority, Pennsylvania, Pollution Control Revenue | No Opt. Call | N/R | 1,094,300 |
| | Refunding Bonds, FirstEnergy Nuclear Generation Project, Series 2006B, 3.500%, 12/01/35 | | | |
| | (Mandatory Put 6/01/20) (7) | | | |
| 13,445 | | Berks County Industrial Development Authority, Pennsylvania, Health System Revenue | 11/27 at 100.00 | Baa2 | 15,268,949 |
| | Bonds, Tower Health Project, Series 2017, 5.000%, 11/01/50 | | | |
| | Bucks County Industrial Development Authority, Pennsylvania, Revenue Bonds, School Lane | | | |
| | Charter School Project, Series 2016: | | | |
| 2,410 | | 5.125%, 3/15/36 | 3/27 at 100.00 | BBB– | 2,761,474 |
| 6,420 | | 5.125%, 3/15/46 | 3/27 at 100.00 | BBB– | 7,231,745 |
| | Chester County Health and Education Facilities Authority, Pennsylvania, Health System | | | |
| | Revenue Bonds, Jefferson Health System, Series 2010A: | | | |
| 1,580 | | 5.000%, 5/15/40 (Pre-refunded 5/15/20) | 5/20 at 100.00 | AA (4) | 1,612,248 |
| 4,435 | | 5.000%, 5/15/40 (Pre-refunded 5/15/20) | 5/20 at 100.00 | N/R (4) | 4,524,321 |
| 10,850 | | Commonwealth Financing Authority, Pennsylvania, State Appropriation Lease Bonds, Master | 6/28 at 100.00 | A1 | 12,004,006 |
| | Settlement, Series 2018, 4.000%, 6/01/39 – AGM Insured (UB) (5) | | | |
| 1,000 | | Cumberland County Municipal Authority, Pennsylvania, Revenue Bonds, Diakon Lutheran | 1/25 at 100.00 | BBB+ | 1,119,930 |
| | Social Ministries Project, Series 2015, 5.000%, 1/01/29 | | | |
| 7,665 | | Dauphin County General Authority, Pennsylvania, Health System Revenue Bonds, Pinnacle | 6/22 at 100.00 | A+ | 8,216,880 |
| | Health System Project, Series 2012A, 5.000%, 6/01/42 | | | |
| 8,750 | | Delaware River Port Authority, New Jersey and Pennsylvania, Revenue Bonds, Series | 1/20 at 100.00 | AA (4) | 8,803,988 |
| | 2010E, 5.000%, 1/01/40 (Pre-refunded 1/01/20) – AGM Insured | | | |
| 3,000 | | Dubois Hospital Authority, Pennsylvania, Hospital Revenue Bonds, Penn Highlands | 1/28 at 100.00 | A– | 3,501,090 |
| | Healthcare, Series 2018, 5.000%, 7/15/48 | | | |
| 1,250 | | Lancaster County Hospital Authority, Pennsylvania, Revenue Bonds, Landis Homes | 7/25 at 100.00 | BBB– | 1,344,775 |
| | Retirement Community Project, Refunding Series 2015A, 5.000%, 7/01/45 | | | |
| 1,500 | | Lehigh County Authority, Pennsylvania, Water and Sewer Revenue Bonds, Allentown | 12/23 at 100.00 | A | 1,683,585 |
| | Concession, Series 2013A, 5.125%, 12/01/47 | | | |
| | Montgomery County Industrial Development Authority, Pennsylvania, FHA Insured Mortgage | | | |
| | Revenue Bonds, New Regional Medical Center Project, Series 2010: | | | |
| 7,970 | | 5.250%, 8/01/33 (Pre-refunded 8/01/20) | 8/20 at 100.00 | N/R (4) | 8,214,121 |
| 5,295 | | 5.375%, 8/01/38 (Pre-refunded 8/01/20) | 8/20 at 100.00 | N/R (4) | 5,462,057 |
| | Montgomery County Industrial Development Authority, Pennsylvania, Health System Revenue | | | |
| | Bonds, Albert Einstein Healthcare Network Issue, Series 2015A: | | | |
| 10,480 | | 5.250%, 1/15/45 | 1/25 at 100.00 | Ba1 | 11,690,335 |
| 1,200 | | 5.250%, 1/15/46 | 1/25 at 100.00 | Ba1 | 1,337,472 |
| 11,810 | | Pennsylvania Economic Development Financing Authority, Exempt Facilities Revenue | 9/25 at 100.00 | B3 | 12,770,862 |
| | Refunding Bonds, PPL Energy Supply, LLC Project, Series 2009A, 6.400%, 12/01/38 | | | |
| 13,500 | | Pennsylvania Turnpike Commission, Oil Franchise Tax Revenue Bonds, Senior Series 2018A, | 12/28 at 100.00 | Aa3 | 16,632,000 |
| | 5.250%, 12/01/44 | | | |
| 3,705 | | Pennsylvania Turnpike Commission, Turnpike Revenue Bonds, Series 2015A-1, | 6/25 at 100.00 | A+ | 4,234,185 |
| | 5.000%, 12/01/45 | | | |
| 6,450 | | Pennsylvania Turnpike Commission, Turnpike Revenue Bonds, Series 2018A-2, | 12/28 at 100.00 | A1 | 7,854,423 |
| | 5.000%, 12/01/43 | | | |
| 11,000 | | Pennsylvania Turnpike Commission, Turnpike Revenue Bonds, Subordinate Series 2009C, | 6/26 at 100.00 | A2 | 13,966,370 |
| | 6.250%, 6/01/33 – AGM Insured | | | |
| 15,000 | | Pennsylvania Turnpike Commission, Turnpike Revenue Bonds, Subordinate Series 2015B-1, | 12/25 at 100.00 | A3 | 17,220,750 |
| | 5.000%, 12/01/45 | | | |
| 5,000 | | Pennsylvania Turnpike Commission, Turnpike Revenue Bonds, Subordinate Series 2019A, | 12/29 at 100.00 | A3 | 5,466,750 |
| | 4.000%, 12/01/49 | | | |
55
| | | | | |
| NVG | Nuveen AMT-Free Municipal Credit Income Fund | |
| Portfolio of Investments (continued) | | | |
| October 31, 2019 | | | |
|
|
|
| Principal | | | Optional Call | | |
| Amount (000) | | Description (1) | Provisions (2) | Ratings (3) | Value |
| | Pennsylvania (continued) | | | |
| $ 10,305 | | Philadelphia Hospitals and Higher Education Facilities Authority, Pennsylvania, Hospital | 7/22 at 100.00 | Ba1 | $ 11,177,524 |
| | Revenue Bonds, Temple University Health System Obligated Group, Series 2012A, 5.625%, 7/01/42 | | | |
| | Philadelphia, Pennsylvania, Airport Revenue Bonds, Series 2010A: | | | |
| 5,000 | | 5.000%, 6/15/35 – AGM Insured | 6/20 at 100.00 | A2 | 5,100,250 |
| 17,850 | | 5.000%, 6/15/40 – AGM Insured | 6/20 at 100.00 | A2 | 18,196,825 |
| 7,055 | | Pittsburgh and Allegheny County Sports and Exhibition Authority, Pennsylvania, Hotel | 8/20 at 100.00 | A2 | 7,227,918 |
| | Room Excise Tax Revenue Bonds, Refunding Series 2010, 5.000%, 2/01/35 – AGM Insured | | | |
| 5,180 | | Pittsburgh and Allegheny County Sports and Exhibition Authority, Pennsylvania, Sales Tax | 8/20 at 100.00 | A1 | 5,309,604 |
| | Revenue Bonds, Refunding Series 2010, 5.000%, 2/01/31 – AGM Insured | | | |
| | Scranton, Pennsylvania, Sewer Authority Revenue Bonds, Series 2011A: | | | |
| 1,125 | | 5.250%, 12/01/31 (Pre-refunded 12/01/21) – AGM Insured | 12/21 at 100.00 | AA (4) | 1,220,265 |
| 1,000 | | 5.500%, 12/01/35 (Pre-refunded 12/01/21) – AGM Insured | 12/21 at 100.00 | AA (4) | 1,089,800 |
| 5,790 | | Susquehanna Area Regional Airport Authority, Pennsylvania, Airport System Revenue Bonds, | 1/23 at 100.00 | BB+ | 5,996,761 |
| | Series 2012B, 4.000%, 1/01/33 | | | |
| 254,365 | | Total Pennsylvania | | | 277,963,956 |
| | Puerto Rico – 1.3% (0.8% of Total Investments) | | | |
| | Puerto Rico Aqueduct and Sewerage Authority, Revenue Bonds, Senior Lien Series 2008A: | | | |
| 1,727 | | 6.000%, 7/01/38 | 12/19 at 100.00 | C | 1,750,746 |
| 9,425 | | 6.000%, 7/01/44 | 12/19 at 100.00 | C | 9,554,594 |
| | Puerto Rico Aqueduct and Sewerage Authority, Revenue Bonds, Senior Lien Series 2012A: | | | |
| 2,200 | | 5.125%, 7/01/37 | 7/22 at 100.00 | C | 2,301,750 |
| 4,705 | | 5.250%, 7/01/42 | 7/22 at 100.00 | C | 4,934,369 |
| 8,315 | | 6.000%, 7/01/47 | 7/22 at 100.00 | C | 8,865,869 |
| 590 | | Puerto Rico Highway and Transportation Authority, Highway Revenue Bonds, Series 2004J, | 12/19 at 100.00 | Baa2 | 604,933 |
| | 5.000%, 7/01/29 – NPFG Insured | | | |
| 4,412 | | Puerto Rico Sales Tax Financing Corporation, Sales Tax Revenue Bonds, Restructured | 7/28 at 100.00 | N/R | 4,642,748 |
| | 2018A-1, 5.000%, 7/01/58 | | | |
| 723 | | Puerto Rico Sales Tax Financing Corporation, Sales Tax Revenue Bonds, Restructured | 7/28 at 100.00 | N/R | 733,621 |
| | Cofina Project Series 2019B-2, 4.536%, 7/01/53 | | | |
| 3,635 | | Puerto Rico Sales Tax Financing Corporation, Sales Tax Revenue Bonds, Taxable | 7/28 at 100.00 | N/R | 3,753,974 |
| | Restructured Cofina Project Series 2019A-2, 4.784%, 7/01/58 | | | |
| | Puerto Rico Urgent Interest Fund Corp (COFINA), National Custodial Taxable Trust Unit, | | | |
| | Series 2007A Sr. Bond: | | | |
| 11,910 | | 0.000%, 8/01/47 | No Opt. Call | N/R | 3,151,874 |
| 23,564 | | 0.000%, 8/01/54 | No Opt. Call | N/R | 4,309,789 |
| 71,206 | | Total Puerto Rico | | | 44,604,267 |
| | Rhode Island – 1.2% (0.8% of Total Investments) | | | |
| 1,000 | | Rhode Island Health and Educational Building Corporation, Revenue Bonds, Care New | 9/23 at 100.00 | N/R (4) | 1,177,670 |
| | England Health System, Series 2013A, 6.000%, 9/01/33 (Pre-refunded 9/01/23) | | | |
| 292,435 | | Rhode Island Tobacco Settlement Financing Corporation, Tobacco Settlement Asset-Backed | 11/19 at 14.61 | CCC– | 39,162,895 |
| | Bonds, Series 2007A, 0.000%, 6/01/52 | | | |
| 293,435 | | Total Rhode Island | | | 40,340,565 |
| | South Carolina – 2.8% (1.8% of Total Investments) | | | |
| 7,600 | | Piedmont Municipal Power Agency, South Carolina, Electric Revenue Bonds, Series 2004A-2, | No Opt. Call | A– | 5,755,404 |
| | 0.000%, 1/01/31 – AMBAC Insured | | | |
| 2,705 | | Saint Peters Parish/Jasper County Public Facilities Corporation, South Carolina, | 4/21 at 100.00 | A2 (4) | 2,859,077 |
| | Installment Purchase Revenue Bonds, County Office Building Projects, Series 2011A, 5.250%, | | | |
| | 4/01/44 (Pre-refunded 4/01/21) – AGC Insured | | | |
56
| | | | | | |
| Principal | | | Optional Call | | |
| Amount (000) | | Description (1) | Provisions (2) | Ratings (3) | Value |
| | South Carolina (continued) | | | |
| | South Carolina Jobs-Economic Development Authority, Health Facilities Revenue Bonds, | | | |
| | Lutheran Homes of South Carolina Inc, Refunding Series 2017B: | | | |
| $ 1,000 | | 5.000%, 5/01/37 | 5/23 at 104.00 | N/R | $ 1,081,210 |
| 750 | | 5.000%, 5/01/42 | 5/23 at 104.00 | N/R | 805,215 |
| 1,250 | | South Carolina Jobs-Economic Development Authority, Hospital Revenue Bonds, Palmetto | 8/21 at 100.00 | AA (4) | 1,364,275 |
| | Health, Refunding Series 2011A, 6.500%, 8/01/39 (Pre-refunded 8/01/21) – AGM Insured | | | |
| 4,000 | | South Carolina Jobs-Economic Development Authority, Hospital Revenue Bonds, Prisma | 5/28 at 100.00 | A | 4,667,600 |
| | Health Obligated Group, Series 2018A, 5.000%, 5/01/48 | | | |
| | South Carolina Public Service Authority, Santee Cooper Revenue Obligations, Refunding & | | | |
| | Improvement Series 2015A: | | | |
| 11,170 | | 5.000%, 12/01/50 | 6/25 at 100.00 | A– | 12,649,690 |
| 34,000 | | 5.000%, 12/01/50 (UB) (5) | 6/25 at 100.00 | A– | 38,503,980 |
| 5,000 | | South Carolina Public Service Authority, Santee Cooper Revenue Obligations, Refunding | 12/24 at 100.00 | A– | 5,636,000 |
| | Series 2014C, 5.000%, 12/01/46 | | | |
| 1,310 | | South Carolina Public Service Authority, Santee Cooper Revenue Obligations, Series | 12/23 at 100.00 | A– | 1,462,628 |
| | 2013A, 5.125%, 12/01/43 | | | |
| 10,285 | | South Carolina Public Service Authority, Santee Cooper Revenue Obligations, Series | 6/24 at 100.00 | A– | 11,675,943 |
| | 2014A, 5.500%, 12/01/54 | | | |
| 10,250 | | Spartanburg Regional Health Services District, Inc, South Carolina, Hospital Refunding | 4/22 at 100.00 | A3 | 10,991,280 |
| | Revenue Bonds, Series 2012A, 5.000%, 4/15/32 | | | |
| 89,320 | | Total South Carolina | | | 97,452,302 |
| | South Dakota – 0.8% (0.5% of Total Investments) | | | |
| 15,000 | | South Dakota Health and Educational Facilities Authority, Revenue Bonds, Avera Health, | 7/27 at 100.00 | A1 | 17,575,050 |
| | Refunding Series 2017, 5.000%, 7/01/46 | | | |
| 3,765 | | South Dakota Health and Educational Facilities Authority, Revenue Bonds, Regional | 9/27 at 100.00 | A1 | 4,448,385 |
| | Health, Refunding Series 2017, 5.000%, 9/01/40 | | | |
| 4,350 | | South Dakota Health and Educational Facilities Authority, Revenue Bonds, Avera Health, | 7/21 at 100.00 | A1 | 4,574,808 |
| | Series 2012A, 5.000%, 7/01/42 | | | |
| 23,115 | | Total South Dakota | | | 26,598,243 |
| | Tennessee – 1.0% (0.7% of Total Investments) | | | |
| 12,895 | | Chattanooga Health, Educational and Housing Facility Board, Tennessee, Revenue Bonds, | 1/23 at 100.00 | BBB+ (4) | 14,457,358 |
| | Catholic Health Initiatives, Series 2013A, 5.250%, 1/01/45 (Pre-refunded 1/01/23) | | | |
| 1,685 | | Chattanooga Health, Educational and Housing Facility Board, Tennessee, Revenue Bonds, | 8/29 at 100.00 | BBB+ | 1,824,097 |
| | CommonSpirit Health, Series 2019A-1, 4.000%, 8/01/44 | | | |
| 1,850 | | Chattanooga-Hamilton County Hospital Authority, Tennessee, Hospital Revenue Bonds, | 10/24 at 100.00 | Baa2 | 2,054,388 |
| | Erlanger Health System, Refunding Series 2014A, 5.000%, 10/01/39 | | | |
| 2,000 | | Knox County Health, Educational and Housing Facility Board, Tennessee, Hospital Revenue | 2/29 at 100.00 | A | 2,161,180 |
| | Bonds, East Tennessee Children’s Hospital, Series 2019, 4.000%, 11/15/48 | | | |
| 2,645 | | Memphis/Shelby County Economic Development Growth Engine Industrial Development Board, | 7/27 at 100.00 | N/R | 2,941,214 |
| | Tennessee, Tax Increment Revenue Bonds, Graceland Project, Senior Series 2017A, 5.500%, 7/01/37 | | | |
| 3,560 | | Metropolitan Government of Nashville-Davidson County Health and Educational Facilities | 6/27 at 100.00 | N/R | 2,136,000 |
| | Board, Tennessee, Revenue Bonds, Knowledge Academy Charter School, Series 2017A, 0.000%, | | | |
| | 6/15/37, 144A (7) | | | |
| 10,000 | | The Health and Educational Facilities Board of the City of Franklin, Tennessee, Revenue | 6/27 at 100.00 | N/R | 11,133,200 |
| | Bonds, Provision Cares Proton Therapy Center, Nashville Project, Series 2017A, 7.500%, | | | |
| | 6/01/47, 144A | | | |
| 34,635 | | Total Tennessee | | | 36,707,437 |
57
| | | | | |
| NVG | Nuveen AMT-Free Municipal Credit Income Fund | |
| Portfolio of Investments (continued) | | | |
|
| October 31, 2019 | | | |
|
|
|
|
| Principal | | | Optional Call | | |
| Amount (000) | | Description (1) | Provisions (2) | Ratings (3) | Value |
| | Texas – 11.3% (7.3% of Total Investments) | | | |
| $ 735 | | Arlington Higher Education Finance Corporation, Texas, Education Revenue Bonds, Wayside | 8/21 at 100.00 | BB+ | $ 746,863 |
| | Schools, Series 2016A, 4.375%, 8/15/36 | | | |
| 3,635 | | Aubrey, Denton County, Texas, Special Assessment Revenue Bonds, Jackson Ridge Public | 9/23 at 103.00 | N/R | 3,887,742 |
| | Improvement District Phase 1 Project, Series 2015, 7.250%, 9/01/45 | | | |
| 3,105 | | Aubrey, Denton County, Texas, Special Assessment Revenue Bonds, Jackson Ridge Public | 9/23 at 103.00 | N/R | 3,307,632 |
| | Improvement District Phases 2-3 Major Improvements Project, Series 2015, 8.250%, 9/01/40 | | | |
| 5,480 | | Austin, Texas, Electric Utility System Revenue Bonds, Refunding Series 2015A, 5.000%, | 11/25 at 100.00 | Aa3 | 6,386,611 |
| | 11/15/45 (UB) (5) | | | |
| 2,500 | | Board of Managers, Joint Guadalupe County-Seguin City Hospital, Texas, Hospital Mortgage | 12/25 at 100.00 | BB | 2,679,725 |
| | Revenue Bonds, Refunding & Improvement Series 2015, 5.000%, 12/01/45 | | | |
| 2,380 | | Celina, Texas, Special Assessment Revenue Bonds, Sutton Fields II Public Improvement | 3/23 at 103.00 | N/R | 2,491,122 |
| | District Neighborhood Improvement Area 1 Project, Series 2015, 7.250%, 9/01/45 | | | |
| 4,225 | | Celina, Texas, Special Assessment Revenue Bonds, Sutton Fields II Public Improvement | 3/23 at 103.00 | N/R | 4,414,829 |
| | District Neighborhood Improvement Areas 2-5 Major Improvement Project, Series 2015, | | | |
| | 8.250%, 9/01/40 | | | |
| 395 | | Celina, Texas, Special Assessment Revenue Bonds, Wells South Public Improvement District | 9/24 at 100.00 | N/R | 417,807 |
| | Neighborhood Improvement Area 1 Project, Series 2015, 6.250%, 9/01/45 | | | |
| | Central Texas Regional Mobility Authority, Revenue Bonds, Senior Lien Series 2011: | | | |
| 1,500 | | 5.750%, 1/01/31 (Pre-refunded 1/01/21) | 1/21 at 100.00 | Baa1 (4) | 1,578,075 |
| 1,700 | | 6.250%, 1/01/46 (Pre-refunded 1/01/21) | 1/21 at 100.00 | Baa1 (4) | 1,798,022 |
| 13,685 | | Central Texas Regional Mobility Authority, Revenue Bonds, Senior Lien, Series 2015A, | 7/25 at 100.00 | Baa1 | 15,454,470 |
| | 5.000%, 1/01/45 | | | |
| 6,375 | | Central Texas Regional Mobility Authority, Revenue Bonds, Senior Lien, Series 2016, | 1/26 at 100.00 | Baa1 | 6,480,187 |
| | 3.375%, 1/01/41 | | | |
| 790 | | Clifton Higher Education Finance Corporation, Texas, Education Revenue Bonds, Idea | No Opt. Call | A– | 816,418 |
| | Public Schools, Series 2012, 3.750%, 8/15/22 | | | |
| | Clifton Higher Education Finance Corporation, Texas, Education Revenue Bonds, Uplift | | | |
| | Education Charter School, Series 2013A: | | | |
| 765 | | 4.350%, 12/01/42 | 12/22 at 100.00 | BBB– | 787,590 |
| 685 | | 4.400%, 12/01/47 | 12/22 at 100.00 | BBB– | 705,365 |
| 4,000 | | Clifton Higher Education Finance Corporation, Texas, Education Revenue Bonds, Uplift | 6/25 at 100.00 | BBB– | 4,354,520 |
| | Education Charter School, Series 2015A, 5.000%, 12/01/45 | | | |
| | Club Municipal Management District 1, Texas, Special Assessment Revenue Bonds, | | | |
| | Improvement Area 1 Project, Series 2016: | | | |
| 660 | | 5.750%, 9/01/28 | 9/23 at 103.00 | N/R | 682,645 |
| 770 | | 6.500%, 9/01/46 | 9/23 at 103.00 | N/R | 803,688 |
| 11,735 | | Dallas-Fort Worth International Airport, Texas, Joint Revenue Bonds, Refunding & | 11/21 at 100.00 | A+ | 12,498,244 |
| | Improvement Series 2012C, 5.000%, 11/01/45 | | | |
| 2,520 | | Decatur Hospital Authority, Texas, Revenue Bonds, Wise Regional Health System, Series | 9/23 at 100.00 | N/R | 2,874,488 |
| | 2013A, 6.375%, 9/01/42 | | | |
| 400 | | Decatur Hospital Authority, Texas, Revenue Bonds, Wise Regional Health System, Series | 9/24 at 100.00 | BBB– | 439,440 |
| | 2014A, 5.250%, 9/01/44 | | | |
| 1,255 | | Fort Bend County Industrial Development Corporation, Texas, Revenue Bonds, NRG Energy | 11/22 at 100.00 | Baa3 | 1,324,301 |
| | Inc Project, Series 2012A RMKT, 4.750%, 5/01/38 | | | |
| 8,920 | | Fort Bend County Industrial Development Corporation, Texas, Revenue Bonds, NRG Energy | 11/22 at 100.00 | Baa3 | 9,397,755 |
| | Inc Project, Series 2012B, 4.750%, 11/01/42 | | | |
| | Grand Parkway Transportation Corporation, Texas, System Toll Revenue Bonds, Subordinate | | | |
| | Lien Series 2013B: | | | |
| 20,000 | | 5.250%, 10/01/51 | 10/23 at 100.00 | AA | 22,623,400 |
| 10,000 | | 5.000%, 4/01/53 (UB) (5) | 10/23 at 100.00 | AA | 11,119,600 |
| 5,470 | | Grand Parkway Transportation Corporation, Texas, System Toll Revenue Bonds, Tender | 10/23 at 100.00 | AA | 7,920,341 |
| | Option Bond Trust 2015-XF0228, 14.747%, 11/01/44, 144A (IF) (5) | | | |
58
| | | | | | |
| Principal | | | Optional Call | | |
| Amount (000) | | Description (1) | Provisions (2) | Ratings (3) | Value |
| | Texas (continued) | | | |
| $ 4,255 | | Harris County Cultural Education Facilities Finance Corporation, Texas, Revenue Bonds, | 6/25 at 100.00 | AA | $ 4,860,316 |
| | Houston Methodist Hospital System, Series 2015, 5.000%, 12/01/45 | | | |
| 1,545 | | Harris County Metropolitan Transit Authority, Texas, Sales and Use Tax Revenue Bonds, | 11/21 at 100.00 | Aa2 | 1,855,344 |
| | Tender Option Bond Trust 2016-XG0054, 11.408%, 11/01/41, 144A (IF) (5) | | | |
| 4,080 | | Harris County, Texas, General Obligation Toll Road Revenue Bonds, Tender Option Bond | No Opt. Call | AAA | 8,889,994 |
| | Trust 2015-XF0064, 12.123%, 8/15/32 – AGM Insured, 144A (IF) | | | |
| 6,000 | | Harris County-Houston Sports Authority, Texas, Revenue Bonds, Capital Appreciation | 11/31 at 44.13 | A2 | 1,911,300 |
| | Refunding Senior Lien Series 2014A, 0.000%, 11/15/48 | | | |
| 6,000 | | Harris County-Houston Sports Authority, Texas, Revenue Bonds, Refunding Senior Lien | 11/24 at 100.00 | A– | 6,734,160 |
| | Series 2014A, 5.000%, 11/15/53 | | | |
| | Harris County-Houston Sports Authority, Texas, Revenue Bonds, Third Lien Series 2004A-3: | | | |
| 1,940 | | 0.000%, 11/15/34 (Pre-refunded 11/15/24) – NPFG Insured | 11/24 at 55.69 | Baa2 (4) | 994,696 |
| 14,055 | | 0.000%, 11/15/34 – NPFG Insured | 11/24 at 55.69 | BB | 6,735,859 |
| 5,000 | | Houston Higher Education Finance Corporation, Texas, Education Revenue Bonds, KIPP, Inc, | 8/25 at 100.00 | AAA | 5,360,550 |
| | Refunding Series 2015, 4.000%, 8/15/44 | | | |
| | Houston, Texas, Hotel Occupancy Tax and Special Revenue Bonds, Convention and | | | |
| | Entertainment Project, Series 2001B: | | | |
| 4,130 | | 0.000%, 9/01/26 – AMBAC Insured | No Opt. Call | A2 | 3,648,566 |
| 4,865 | | 0.000%, 9/01/27 – AGM Insured | No Opt. Call | A2 | 4,184,824 |
| 4,715 | | Houston, Texas, Hotel Occupancy Tax and Special Revenue Bonds, Refunding Series 2015, | 9/24 at 100.00 | A | 5,300,556 |
| | 5.000%, 9/01/40 | | | |
| 17,000 | | Houston, Texas, Water and Sewerage System Revenue Bonds, Refunding Junior Lien Series | No Opt. Call | A2 (4) | 24,841,420 |
| | 2002A, 5.750%, 12/01/32 – AGM Insured (ETM) | | | |
| 6,700 | | Hutto Independent School District, Williamson County, Texas, General Obligation Bonds, | 8/21 at 100.00 | A+ | 7,082,168 |
| | Refunding Series 2012A, 5.000%, 8/01/46 | | | |
| 3,500 | | Irving, Texas, Hotel Occupancy Tax Revenue Bonds, Series 2014B, 5.000%, 8/15/43 | 12/19 at 100.00 | BBB+ | 3,502,765 |
| 940 | | Kerrville Health Facilities Development Corporation, Texas, Revenue Bonds, Sid Peterson | 8/25 at 100.00 | A– | 1,084,027 |
| | Memorial Hospital Project, Series 2015, 5.000%, 8/15/30 | | | |
| 1,000 | | Lower Colorado River Authority, Texas, Transmission Contract Revenue Bonds, LCRA | 5/25 at 100.00 | A | 1,145,680 |
| | Transmission Services Corporation Project, Refunding Series 2015, 5.000%, 5/15/45 | | | |
| | McCamey County Hospital District, Texas, General Obligation Bonds, Series 2013: | | | |
| 3,095 | | 5.750%, 12/01/33 | 12/25 at 100.00 | B1 | 3,409,576 |
| 3,125 | | 6.125%, 12/01/38 | 12/25 at 100.00 | B1 | 3,454,812 |
| | Montgomery County Toll Road Authority, Texas, Toll Road Revenue Bonds, Senior Lien | | | |
| | Series 2018: | | | |
| 1,900 | | 5.000%, 9/15/43 | 9/25 at 100.00 | BBB– | 2,106,074 |
| 1,785 | | 5.000%, 9/15/48 | 9/25 at 100.00 | BBB– | 1,974,014 |
| | New Hope Cultural Education Facilities Finance Corporation, Texas, Retirement Facility | | | |
| | Revenue Bonds, Legacy at Willow Bend Project, Series 2016: | | | |
| 2,335 | | 5.000%, 11/01/46 | 11/23 at 103.00 | BBB– | 2,500,855 |
| 6,015 | | 5.000%, 11/01/51 | 11/23 at 103.00 | BBB– | 6,430,637 |
| 745 | | New Hope Cultural Education Facilities Finance Corporation, Texas, Retirement Facility | 1/25 at 100.00 | N/R | 805,591 |
| | Revenue Bonds, Wesleyan Homes, Inc Project, Series 2014, 5.500%, 1/01/43 | | | |
| 210 | | New Hope Cultural Education Facilities Finance Corporation, Texas, Student Housing | 4/26 at 100.00 | B2 | 210,905 |
| | Revenue Bonds, CHF-Collegiate Housing Corpus Christi II, LLC-Texas A&M University-Corpus | | | |
| | Christi Project, Series 2016A, 5.000%, 4/01/48 | | | |
| 4,530 | | New Hope Cultural Education Facilities Finance Corporation, Texas, Student Housing | 4/24 at 100.00 | A2 | 4,870,339 |
| | Revenue Bonds, CHF-Collegiate Housing Foundation – College Station I LLC – Texas A&M | | | |
| | University Project, Series 2014A, 4.100%, 4/01/34 – AGM Insured | | | |
| 820 | | New Hope Cultural Education Facilities Finance Corporation, Texas, Student Housing | 4/26 at 100.00 | BBB– | 863,148 |
| | Revenue Bonds, CHF-Collegiate Housing Foundation – San Antonio 1, LLC – Texas A&M | | | |
| | University – San Antonio Project,, 5.000%, 4/01/48 | | | |
59
| | | | | |
| NVG | Nuveen AMT-Free Municipal Credit Income Fund | |
| Portfolio of Investments (continued) | | | |
|
| October 31, 2019 | | | |
|
|
|
|
| Principal | | | Optional Call | | |
| Amount (000) | | Description (1) | Provisions (2) | Ratings (3) | Value |
| | Texas (continued) | | | |
| | New Hope Cultural Education Facilities Finance Corporation, Texas, Student Housing | | | |
| | Revenue Bonds, CHF-Collegiate Housing Foundation – Stephenville II, LLC – Tarleton State | | | |
| | University Project, Series 2014A: | | | |
| $ 1,000 | | 5.000%, 4/01/34 | 4/24 at 100.00 | BBB– | $ 1,082,510 |
| 2,200 | | 5.000%, 4/01/39 | 4/24 at 100.00 | BBB– | 2,363,218 |
| 1,600 | | 5.000%, 4/01/46 | 4/24 at 100.00 | BBB– | 1,707,616 |
| 5,540 | | New Hope Cultural Education Facilities Finance Corporation, Texas, Student Housing | 4/24 at 100.00 | Baa3 | 5,774,841 |
| | Revenue Bonds, CHF-Collegiate Housing Galveston-Texas A&M University at Galveston Project, | | | |
| | Series 2014A, 5.000%, 4/01/39 | | | |
| 3,220 | | North Fort Bend Water Authority, Texas, Water System Revenue Bonds, Series 2011, 5.000%, | 12/21 at 100.00 | A2 | 3,455,028 |
| | 12/15/36 – AGM Insured | | | |
| | North Texas Tollway Authority, Special Projects System Revenue Bonds, Convertible | | | |
| | Capital Appreciation Series 2011C: | | | |
| 2,590 | | 0.000%, 9/01/43 (Pre-refunded 9/01/31) (6) | 9/31 at 100.00 | N/R (4) | 3,233,149 |
| 3,910 | | 0.000%, 9/01/45 (Pre-refunded 9/01/31) (6) | 9/31 at 100.00 | N/R (4) | 5,309,350 |
| 6,155 | | North Texas Tollway Authority, System Revenue Bonds, Refunding First Tier, Series 2015B, | 1/23 at 100.00 | A+ | 6,769,638 |
| | 5.000%, 1/01/40 | | | |
| 2,000 | | North Texas Tollway Authority, System Revenue Bonds, Refunding Second Tier, Series | 1/25 at 100.00 | A | 2,291,400 |
| | 2015A, 5.000%, 1/01/38 | | | |
| 610 | | Reagan Hospital District of Reagan County, Texas, Limited Tax Revenue Bonds, Series | 2/24 at 100.00 | Ba1 | 644,862 |
| | 2014A, 5.125%, 2/01/39 | | | |
| 1,000 | | Red River Education Finance Corporation, Texas, Higher Education Revenue Bonds, Saint | 6/26 at 100.00 | Baa2 | 1,045,150 |
| | Edward’s University Project, Series 2016, 4.000%, 6/01/41 | | | |
| 2,410 | | Tarrant County Cultural Education Facilities Finance Corporation, Texas, Hospital | 11/21 at 100.00 | AA– | 2,567,204 |
| | Revenue Bonds, Baylor Health Care System, Series 2011A, 5.000%, 11/15/30 | | | |
| 1,870 | | Tarrant County Cultural Education Facilities Finance Corporation, Texas, Hospital | 9/23 at 100.00 | A | 2,085,985 |
| | Revenue Bonds, Hendrick Medical Center, Refunding Series 2013, 5.500%, 9/01/43 | | | |
| | Tarrant County Cultural Education Facilities Finance Corporation, Texas, Hospital | | | |
| | Revenue Bonds, Scott & White Healthcare Project, Series 2010: | | | |
| 215 | | 5.500%, 8/15/45 (Pre-refunded 8/15/20) | 8/20 at 100.00 | N/R (4) | 222,175 |
| 2,675 | | 5.500%, 8/15/45 (Pre-refunded 8/15/20) | 8/20 at 100.00 | N/R (4) | 2,764,265 |
| 17,640 | | Tarrant County Cultural Education Facilities Finance Corporation, Texas, Hospital | 5/26 at 100.00 | AA– | 20,341,743 |
| | Revenue Bonds, Scott & White Healthcare Project, Series 2016A, 5.000%, 11/15/45 (UB) (5) | | | |
| 4,300 | | Texas City Industrial Development Corporation, Texas, Industrial Development Revenue | 2/25 at 100.00 | Baa3 | 4,455,144 |
| | Bonds, NRG Energy, inc Project, Fixed Rate Series 2012, 4.125%, 12/01/45 | | | |
| 4,000 | | Texas Department of Housing and Community Affairs, Single Family Mortgage Revenue Bonds, | 9/27 at 100.00 | AA+ | 4,369,840 |
| | Series 2018A, 4.250%, 9/01/43 | | | |
| | Texas Municipal Gas Acquisition and Supply Corporation III, Gas Supply Revenue Bonds, | | | |
| | Series 2012: | | | |
| 2,500 | | 5.000%, 12/15/26 | 12/22 at 100.00 | BBB | 2,736,925 |
| 2,500 | | 5.000%, 12/15/29 | 12/22 at 100.00 | BBB | 2,722,450 |
| 4,355 | | 5.000%, 12/15/30 | 12/22 at 100.00 | BBB | 4,734,320 |
| 2,975 | | 5.000%, 12/15/32 | 12/22 at 100.00 | BBB | 3,225,406 |
| 3,150 | | Texas Transportation Commission, Central Texas Turnpike System Revenue Bonds, First | 8/22 at 100.00 | A– | 3,390,187 |
| | Tier Refunding Series 2012A, 5.000%, 8/15/41 | | | |
| | Texas Transportation Commission, Central Texas Turnpike System Revenue Bonds, First | | | |
| | Tier Refunding Series 2015B: | | | |
| 11,280 | | 0.000%, 8/15/36 | 8/24 at 59.60 | A– | 5,797,469 |
| 10,000 | | 0.000%, 8/15/37 | 8/24 at 56.94 | A– | 4,898,600 |
| | | | | | |
| Principal | | | Optional Call | | |
| Amount (000) | | Description (1) | Provisions (2) | Ratings (3) | Value |
| | Texas (continued) | | | |
| | Texas Transportation Commission, Central Texas Turnpike System Revenue Bonds, Second | | | |
| | Tier Refunding Series 2015C: | | | |
| $ 5,000 | | 5.000%, 8/15/37 | 8/24 at 100.00 | BBB+ | $ 5,628,200 |
| 31,810 | | 5.000%, 8/15/42 | 8/24 at 100.00 | BBB+ | 35,547,993 |
| 7,500 | | Texas Transportation Commission, State Highway 249 System Revenue Bonds, First Tier Toll | 2/29 at 100.00 | Baa3 | 8,775,075 |
| | Series 2019A, 5.000%, 8/01/57 | | | |
| 4,400 | | Texas Turnpike Authority, Central Texas Turnpike System Revenue Bonds, First Tier Series | No Opt. Call | A– | 3,960,484 |
| | 2002A, 0.000%, 8/15/25 – AMBAC Insured | | | |
| 1,840 | | Ysleta Independent School District Public Facility Corporation, Texas, Lease Revenue | 5/20 at 100.00 | AA– | 1,880,204 |
| | Refunding Bonds, Series 2001, 5.375%, 11/15/24 – AMBAC Insured | | | |
| 374,215 | | Total Texas | | | 394,529,487 |
| | Virginia – 1.9% (1.2% of Total Investments) | | | |
| | Embrey Mill Community Development Authority, Virginia, Special Assessment Revenue Bonds, | | | |
| | Series 2015: | | | |
| 1,200 | | 5.300%, 3/01/35, 144A | 3/25 at 100.00 | N/R | 1,249,548 |
| 1,085 | | 5.600%, 3/01/45, 144A | 3/25 at 100.00 | N/R | 1,134,606 |
| 11,380 | | Hampton Roads Transportation Accountability Commission, Virginia, Hampton Roads | 1/28 at 100.00 | AA | 14,122,921 |
| | Transportation Fund Revenue Bonds, Senior Lien Series 2018A, 5.500%, 7/01/57 | | | |
| 14,945 | | Metropolitan Washington Airports Authority, Virginia, Dulles Toll Road Revenue Bonds, | 4/22 at 100.00 | BBB+ | 15,967,686 |
| | Dulles Metrorail & Capital Improvement Projects, Refunding Second Senior Lien Series 2014A, | | | |
| | 5.000%, 10/01/53 | | | |
| 11,000 | | Metropolitan Washington Airports Authority, Virginia, Dulles Toll Road Revenue Bonds, | 10/26 at 100.00 | A3 | 14,250,720 |
| | Dulles Metrorail & Capital improvement Projects, Second Senior Lien Series 2009C, 6.500%, | | | |
| | 10/01/41 – AGC Insured | | | |
| 10,000 | | Metropolitan Washington Airports Authority, Virginia, Dulles Toll Road Revenue Bonds, | 10/28 at 100.00 | BBB+ | 13,329,300 |
| | Dulles Metrorail Capital Appreciation, Second Senior Lien Series 2010B, 6.500%, 10/01/44 | | | |
| 2,000 | | Peninsula Town Center Community Development Authority, Virginia, Special Obligation | 9/27 at 100.00 | N/R | 2,216,180 |
| | Bonds, Refunding Series 2018, 5.000%, 9/01/45, 144A | | | |
| | Roanoke Industrial Development Authority, Virginia, Hospital Revenue Bonds, Carilion | | | |
| | Health System Obligated Group, Series 2005B: | | | |
| 15 | | 5.000%, 7/01/38 (Pre-refunded 7/01/20) | 7/20 at 100.00 | Aa3 (4) | 15,374 |
| 985 | | 5.000%, 7/01/38 | 7/20 at 100.00 | Aa3 | 1,004,267 |
| 1,000 | | Virginia College Building Authority, Educational Facilities Revenue Bonds, Marymount | 7/25 at 100.00 | Ba2 | 1,098,770 |
| | University Project, Green Series 2015B, 5.250%, 7/01/35, 144A | | | |
| 2,045 | | Virginia Small Business Finance Authority, Tourism Development Financing Program Revenue | 4/28 at 112.76 | N/R | 2,433,918 |
| | Bonds, Downtown Norfolk and Virginia Beach Oceanfront Hotel Projects, Series 2018A, 8.375%, | | | |
| | 4/01/41, 144A | | | |
| 55,655 | | Total Virginia | | | 66,823,290 |
| | Washington – 1.4% (0.9% of Total Investments) | | | |
| 5,000 | | Energy Northwest, Washington, Electric Revenue Bonds, Columbia Generating Station, | 7/25 at 100.00 | AA– | 5,851,700 |
| | Refunding Series 2015A, 5.000%, 7/01/38 (UB) (5) | | | |
| 5,750 | | Washington Health Care Facilities Authority, Revenue Bonds, Fred Hutchinson Cancer | 1/21 at 100.00 | A2 | 5,972,640 |
| | Research Center, Series 2011A, 5.625%, 1/01/35 | | | |
| 1,250 | | Washington Health Care Facilities Authority, Revenue Bonds, Providence Health & | 10/24 at 100.00 | AA– | 1,900,888 |
| | Services, Tender Option Bond Trust 2015-XF0148, 14.712%, 10/01/44, 144A (IF) (5) | | | |
| 6,565 | | Washington Health Care Facilities Authority, Revenue Bonds, Seattle Children’s Hospital, | 10/22 at 100.00 | Aa2 | 7,141,867 |
| | Series 2012A, 5.000%, 10/01/42 | | | |
| | Washington State Housing Finance Commission, Non-profit Housing Revenue Bonds, | | | |
| | Presbyterian Retirement Communities Northwest Project, Refunding Series 2016A: | | | |
| 5,450 | | 5.000%, 1/01/46, 144A | 1/25 at 102.00 | BB | 6,027,373 |
| 3,650 | | 5.000%, 1/01/51, 144A | 1/25 at 102.00 | BB | 4,027,483 |
61
| | | | | |
| NVG | Nuveen AMT-Free Municipal Credit Income Fund | |
| Portfolio of Investments (continued) | | | |
|
| October 31, 2019 | | | |
|
|
|
|
| Principal | | | Optional Call | | |
| Amount (000) | | Description (1) | Provisions (2) | Ratings (3) | Value |
| | Washington (continued) | | | |
| $ 21,510 | | Washington State, Motor Vehicle Fuel Tax General Obligation Bonds, Series 2002-03C, | No Opt. Call | AA+ | $ 18,551,515 |
| | 0.000%, 6/01/28 – NPFG Insured (UB) (5) | | | |
| 49,175 | | Total Washington | | | 49,473,466 |
| | West Virginia – 1.7% (1.1% of Total Investments) | | | |
| 1,900 | | Monongalia County Commission, West Virginia, Special District Excise Tax Revenue, | 6/27 at 100.00 | N/R | 2,093,724 |
| | University Town Centre Economic Opportunity Development District, Refunding & Improvement | | | |
| | Series 2017A, 5.500%, 6/01/37, 144A | | | |
| 10,000 | | West Virginia Economic Development Authority, State Lottery Revenue Bonds, Series 2010A, | 6/20 at 100.00 | A1 (4) | 10,236,000 |
| | 5.000%, 6/15/40 (Pre-refunded 6/15/20) | | | |
| 40,855 | | West Virginia Hospital Finance Authority, Hospital Revenue Bonds, West Virginia United | 6/23 at 100.00 | A | 45,492,451 |
| | Health System Obligated Group, Refunding & Improvement Series 2013A, 5.500%, 6/01/44 | | | |
| 52,755 | | Total West Virginia | | | 57,822,175 |
| | Wisconsin – 4.0% (2.6% of Total Investments) | | | |
| | Public Finance Authority of Wisconsin, Charter School Revenue Bonds, Cornerstone Charter | | | |
| | Academy, North Carolina, Series 2016A: | | | |
| 1,750 | | 5.000%, 2/01/36, 144A | 2/26 at 100.00 | N/R | 1,826,055 |
| 305 | | 5.125%, 2/01/46, 144A | 2/26 at 100.00 | N/R | 315,922 |
| 500 | | Public Finance Authority of Wisconsin, Charter School Revenue Bonds, Corvian Community | 6/24 at 100.00 | N/R | 515,175 |
| | School Bonds, North Carolina, Series 2017A, 5.125%, 6/15/47, 144A | | | |
| 1,480 | | Public Finance Authority of Wisconsin, Charter School Revenue Bonds, Envision Science | 5/26 at 100.00 | N/R | 1,509,038 |
| | Academy Project, Series 2016A, 5.125%, 5/01/36, 144A | | | |
| 6,000 | | Public Finance Authority of Wisconsin, Charter School Revenue Bonds, Phoenix Academy | 6/24 at 100.00 | N/R | 6,090,780 |
| | Charter School, North Carolina, Series 2017A, 5.625%, 6/15/37, 144A | | | |
| | Public Finance Authority of Wisconsin, Charter School Revenue Bonds, Uwharrie Charter | | | |
| | Academy, North Carolina, Series 2017A: | | | |
| 1,000 | | 5.500%, 6/15/37, 144A | 6/27 at 100.00 | N/R | 1,018,290 |
| 1,790 | | 5.625%, 6/15/47, 144A | 6/27 at 100.00 | N/R | 1,820,341 |
| 35,100 | | Public Finance Authority of Wisconsin, Limited Obligation PILOT Revenue Bonds, American | 12/27 at 100.00 | N/R | 42,036,111 |
| | Dream @ Meadowlands Project, Series 2017, 7.000%, 12/01/50, 144A | | | |
| 1,700 | | Public Finance Authority of Wisconsin, Revenue Bonds, Alabama Proton Therapy Center, | 10/27 at 100.00 | N/R | 1,880,965 |
| | Senior Series 2017A, 7.000%, 10/01/47, 144A | | | |
| | Public Finance Authority of Wisconsin, Revenue Bonds, Prime Healthcare Foundation, Inc, | | | |
| | Series 2017A: | | | |
| 1,730 | | 5.000%, 12/01/27 | No Opt. Call | BBB– | 1,914,608 |
| 1,815 | | 5.200%, 12/01/37 | 12/27 at 100.00 | BBB– | 2,127,979 |
| | Public Finance Authority, Wisconsin, Educational Revenue Bonds, Lake Norman Charter | | | |
| | School, Series 2018A: | | | |
| 4,050 | | 5.000%, 6/15/38, 144A | 6/26 at 100.00 | BBB– | 4,520,529 |
| 1,575 | | 5.000%, 6/15/48, 144A | 6/26 at 100.00 | BBB– | 1,737,619 |
| 2,500 | | Public Finance Authority, Wisconsin, Exempt Facilities Revenue Bonds, Celanese Project, | 5/26 at 100.00 | Baa3 | 2,693,550 |
| | Refunding Series 2016C, 4.050%, 11/01/30 | | | |
| 8,460 | | Wisconsin Health and Educational Facilities Authority, Revenue Bonds, Aurora Health | 7/21 at 100.00 | Aa3 (4) | 9,004,232 |
| | Care, Inc, Series 2012A, 5.000%, 7/15/25 (Pre-refunded 7/15/21) | | | |
| 6,620 | | Wisconsin Health and Educational Facilities Authority, Revenue Bonds, Froedtert Health | 10/22 at 100.00 | AA– | 7,110,145 |
| | Inc Obligated Group, Series 2012A, 5.000%, 4/01/42 | | | |
| | Wisconsin Health and Educational Facilities Authority, Revenue Bonds, Marshfield Clinic, | | | |
| | Series 2012B: | | | |
| 3,495 | | 4.500%, 2/15/40 | 2/22 at 100.00 | A– | 3,618,653 |
| 1,485 | | 5.000%, 2/15/40 | 2/22 at 100.00 | A– | 1,573,061 |
| | Wisconsin Health and Educational Facilities Authority, Revenue Bonds, Mercy Alliance, | | | |
| | Inc, Series 2012: | | | |
| 11,000 | | 5.000%, 6/01/32 | 6/22 at 100.00 | A3 | 11,771,980 |
| 1,500 | | 5.000%, 6/01/39 | 6/22 at 100.00 | A3 | 1,592,865 |
62
| | | | | | |
| Principal | | | Optional Call | | |
| Amount (000) | | Description (1) | Provisions (2) | Ratings (3) | Value |
| | Wisconsin (continued) | | | |
| $ 1,250 | | Wisconsin Health and Educational Facilities Authority, Revenue Bonds, Meriter Hospital, | 5/21 at 100.00 | N/R (4) | $ 1,333,638 |
| | Inc, Series 2011A, 5.750%, 5/01/35 (Pre-refunded 5/01/21) | | | |
| 1,450 | | Wisconsin Health and Educational Facilities Authority, Revenue Bonds, Rocket Education | 6/26 at 100.00 | N/R | 1,561,650 |
| | Obligated Group, Series 2017C, 5.250%, 6/01/40, 144A | | | |
| 16,190 | | Wisconsin Health and Educational Facilities Authority, Revenue Bonds, Gundersen | 10/21 at 100.00 | A1 | 17,158,810 |
| | Lutheran, Series 2011A, 5.250%, 10/15/39 | | | |
| 1,000 | | Wisconsin Health and Educational Facilities Authority, Wisconsin, Revenue Bonds, | 8/24 at 103.00 | N/R | 1,080,760 |
| | American Baptist Homes of the Midwest Obligated Group, Refunding Series 2017, 5.000%, 8/01/37 | | | |
| 2,500 | | Wisconsin Health and Educational Facilities Authority, Wisconsin, Revenue Bonds, Aurora | 4/23 at 100.00 | Aa3 (4) | 2,833,100 |
| | Health Care, Inc, Series 2013A, 5.125%, 4/15/31 (Pre-refunded 4/15/23) | | | |
| | Wisconsin Health and Educational Facilities Authority, Wisconsin, Revenue Bonds, Dickson | | | |
| | Hollow Project Series 2014: | | | |
| 1,000 | | 5.375%, 10/01/44 | 10/22 at 102.00 | N/R | 1,072,060 |
| 1,500 | | 5.500%, 10/01/49 | 10/22 at 102.00 | N/R | 1,613,250 |
| 1,000 | | Wisconsin Health and Educational Facilities Authority, Wisconsin, Revenue Bonds, Rogers | 7/24 at 100.00 | A | 1,129,160 |
| | Memorial Hospital, Inc, Series 2014A, 5.000%, 7/01/34 | | | |
| | Wisconsin Health and Educational Facilities Authority, Wisconsin, Revenue Bonds, Saint | | | |
| | John’s Communities Inc, Series 2015B: | | | |
| 550 | | 5.000%, 9/15/37 | 9/22 at 100.00 | BBB– | 573,953 |
| 1,350 | | 5.000%, 9/15/45 | 9/22 at 100.00 | BBB– | 1,400,558 |
| 1,000 | | Wisconsin Health and Educational Facilities Authority, Wisconsin, Revenue Bonds, Three | 8/23 at 100.00 | A | 1,096,140 |
| | Pillars Senior Living Communities, Refunding Series 2013, 5.000%, 8/15/33 | | | |
| | Wisconsin Health and Educational Facilities Authority, Wisconsin, Revenue Bonds, | | | |
| | Woodland Hills Senior Housing Project, Series 2014: | | | |
| 2,565 | | 5.000%, 12/01/44 | 12/22 at 102.00 | N/R | 2,727,724 |
| 1,775 | | 5.250%, 12/01/49 | 12/22 at 102.00 | N/R | 1,900,439 |
| 126,985 | | Total Wisconsin | | | 140,159,140 |
| | Wyoming – 0.1% (0.0% of Total Investments) | | | |
| | Teton County Hospital District, Wyoming, Hospital Revenue Bonds, St John’s Medical | | | |
| | Center Project, Series 2011B: | | | |
| 1,000 | | 5.500%, 12/01/27 | 12/21 at 100.00 | A– | 1,066,400 |
| 1,000 | | 6.000%, 12/01/36 | 12/21 at 100.00 | A– | 1,076,920 |
| 2,000 | | Total Wyoming | | | 2,143,320 |
| $ 5,657,792 | | Total Long-Term Investments (cost $4,838,743,489) | | | 5,399,427,282 |
| | Floating Rate Obligations – (5.3)% | | | (184,980,000) |
| | MuniFund Preferred Shares, net of deferred offering costs ��� (11.6)% (8) | | | (403,797,156) |
| | Variable Rate Demand Preferred Shares, net of deferred offering costs – (40.5)% (9) | | | (1,407,881,715) |
| | Other Assets Less Liabilities – 2.1% | | | 74,193,867 |
| | Net Assets Applicable to Common Shares – 100% | | | $ 3,476,962,278 |
63
| | |
| NVG | Nuveen AMT-Free Municipal Credit Income Fund Portfolio of Investments (continued)
October 31, 2019 |
| | |
(1) | All percentages shown in the Portfolio of Investments are based on net assets applicable to common shares unless otherwise noted. |
(2) | Optional Call Provisions: Dates (month and year) and prices of the earliest optional call or redemption. There may be other call provisions at varying prices at later dates. Certain mortgage-backed securities may be subject to periodic principal paydowns. Optional Call Provisions are not covered by the report of independent registered public accounting firm. |
(3) | The ratings disclosed are the lowest of Standard & Poor’s Group (“Standard & Poor’s”), Moody’s Investors Service, Inc. (“Moody’s”) or Fitch, Inc. (“Fitch”) rating. Ratings below BBB by Standard & Poor’s, Baa by Moody’s or BBB by Fitch are considered to be below investment grade. Holdings designated N/R are not rated by any of these national rating agencies. Ratings are not covered by the report of independent registered public accounting firm. |
(4) | Backed by an escrow or trust containing sufficient U.S. Government or U.S. Government agency securities, which ensure the timely payment of principal and interest. |
(5) | Investment, or portion of investment, has been pledged to collateralize the net payment obligations for investments in inverse floating rate transactions. |
(6) | Step-up coupon bond, a bond with a coupon that increases (“steps up”), usually at regular intervals, while the bond is outstanding. The rate shown is the coupon as of the end of the reporting period. |
(7) | Defaulted security. A security whose issuer has failed to fully pay principal and/or interest when due, or is under the protection of bankruptcy. |
(8) | MuniFund Preferred Shares, net of deferred offering costs as a percentage of Total Investments is 7.5%. |
(9) | Variable Rate Demand Preferred Shares, net of deferred offering costs as a percentage of Total Investments is 26.1%. |
144A | Investment is exempt from registration under Rule 144A of the Securities Act of 1933, as amended. These investments may only be resold in transactions exempt from registration, which are normally those transactions with qualified institutional buyers. |
ETM | Escrowed to maturity. |
IF | Inverse floating rate security issued by a tender option bond (“TOB”) trust, the interest rate on which varies inversely with the Securities Industry Financial Markets Association (SIFMA) short-term rate, which resets weekly, or a similar short-term rate, and is reduced by the expenses related to the TOB trust. |
UB | Underlying bond of an inverse floating rate trust reflected as a financing transaction. See Notes to Financial Statements, Note 4 – Portfolio Securities and Investments in Derivatives, Inverse Floating Rate Securities for more information. |
WI/DD | Purchased on a when-issued or delayed delivery basis. |
| See accompanying notes to financial statements |
64
| | |
| NZF | Nuveen Municipal Credit Income Fund Portfolio of Investments
October 31, 2019 |
| | | | | | |
| Principal | | | Optional Call | | |
| Amount (000) | | Description (1) | Provisions (2) | Ratings (3) | Value |
| | LONG-TERM INVESTMENTS – 156.6% (100.0% of Total Investments) | | | |
| | MUNICIPAL BONDS – 156.5% (99.9% of Total Investments) | | | |
| | Alabama – 1.2% (0.7% of Total Investments) | | | |
| $ 8,585 | | Alabama Private Colleges and University Facilities Authority, Limited Obligation Bonds, | 9/25 at 100.00 | N/R | $ 9,251,454 |
| | University of Mobile Project, Series 2015A, 6.000%, 9/01/45, 144A | | | |
| 6,710 | | Alabama Special Care Facilities Financing Authority, Birmingham, Hospital Revenue Bonds, | 1/20 at 100.00 | Aaa | 7,164,200 |
| | Daughters of Charity National Health System – Providence Hospital and St Vincent’s Hospital, | | | |
| | Series 1995, 5.000%, 11/01/25 (ETM) | | | |
| 5,835 | | Lower Alabama Gas District, Alabama, Gas Project Revenue Bonds, Series 2016A, | No Opt. Call | A3 | 8,253,257 |
| | 5.000%, 9/01/46 | | | |
| 2,375 | | Selma Industrial Development Board, Alabama, Gulf Opportunity Zone Revenue Bonds, | 5/20 at 100.00 | BBB | 2,424,115 |
| | International Paper Company Project, Series 2010A, 5.800%, 5/01/34 | | | |
| 23,505 | | Total Alabama | | | 27,093,026 |
| | Alaska – 0.3% (0.2% of Total Investments) | | | |
| | Alaska Industrial Development and Export Authority, Power Revenue Bonds, Snettisham | | | |
| | Hydroelectric Project, Refunding Series 2015: | | | |
| 1,000 | | 5.000%, 1/01/31 (AMT) | 7/25 at 100.00 | Baa2 | 1,096,400 |
| 2,950 | | 5.000%, 1/01/33 (AMT) | 7/25 at 100.00 | Baa2 | 3,218,037 |
| 2,900 | | 5.000%, 1/01/34 (AMT) | 7/25 at 100.00 | Baa2 | 3,155,664 |
| 95 | | Northern Tobacco Securitization Corporation, Alaska, Tobacco Settlement Asset-Backed | 11/19 at 100.00 | A2 | 95,129 |
| | Bonds, Series 2006A, 4.625%, 6/01/23 | | | |
| 6,945 | | Total Alaska | | | 7,565,230 |
| | Arizona – 2.7% (1.7% of Total Investments) | | | |
| 1,300 | | Apache County Industrial Development Authority, Arizona, Pollution Control Revenue | 3/22 at 100.00 | A– | 1,367,639 |
| | Bonds, Tucson Electric Power Company, Series 20102A, 4.500%, 3/01/30 | | | |
| 2,820 | | Arizona Health Facilities Authority, Revenue Bonds, Scottsdale Lincoln Hospitals | 12/24 at 100.00 | A2 | 3,217,000 |
| | Project, Refunding Series 2014A, 5.000%, 12/01/39 | | | |
| 2,930 | | Arizona Industrial Development Authority, Arizona, Education Revenue Bonds, Legacy | 12/19 at 101.00 | N/R | 2,939,054 |
| | Traditional School Southwest Las Vegas Nevada Campus, Series 2018, 5.250%, 7/01/22, 144A | | | |
| 10,450 | | Arizona Sports and Tourism Authority, Tax Revenue Bonds, Multipurpose Stadium Facility | 7/22 at 100.00 | A | 11,155,479 |
| | Project, Refunding Senior Series 2012A, 5.000%, 7/01/30 | | | |
| 2,255 | | Cahava Springs Revitalization District, Cave Creek, Arizona, Special Assessment Bonds, | 7/27 at 100.00 | N/R | 2,323,597 |
| | Series 2017A, 7.000%, 7/01/41, 144A | | | |
| 3,185 | | Eastmark Community Facilities District 1, Mesa, Arizona, General Obligation Bonds, | 7/25 at 100.00 | N/R | 3,395,528 |
| | Series 2015, 5.000%, 7/15/39, 144A | | | |
| 1,750 | | Maricopa County Industrial Development Authority, Arizona, Hospital Revenue Bonds, | 9/28 at 100.00 | A2 | 2,087,627 |
| | HonorHealth, Series 2019A, 5.000%, 9/01/42 | | | |
| 4,500 | | Phoenix Civic Improvement Corporation, Arizona, Airport Revenue Bonds, Junior Lien | 7/20 at 100.00 | A+ (4) | 4,613,850 |
| | Series 2010A, 5.000%, 7/01/40 (Pre-refunded 7/01/20) | | | |
| 4,360 | | Phoenix Industrial Development Authority, Arizona, Education Facility Revenue Bonds, | 12/19 at 101.00 | N/R | 4,358,866 |
| | Legacy Traditional Schools East Mesa and Cadence, Nevada Campuses, Series 2017A, 4.000%, | | | |
| | 7/01/22, 144A | | | |
| 3,065 | | Phoenix Industrial Development Authority, Arizona, Education Facility Revenue Bonds, | 12/19 at 101.00 | N/R | 3,064,172 |
| | Legacy Traditional Schools Phoenix/East Mesa and Cadence, Nevada Campuses, Series 2017B, | | | |
| | 4.000%, 7/01/22, 144A | | | |
| | Phoenix Mesa Gateway Airport Authority, Arizona, Special Facility Revenue Bonds, Mesa | | | |
| | Project, Series 2012: | | | |
| 400 | | 5.000%, 7/01/27 (AMT) | 7/22 at 100.00 | A1 | 432,812 |
| 950 | | 5.000%, 7/01/32 (AMT) | 7/22 at 100.00 | A1 | 1,023,302 |
65
| | | | | |
| NZF | Nuveen Municipal Credit Income Fund | | |
| Portfolio of Investments (continued) | | | |
|
| October 31, 2019 | | | |
|
|
|
|
| Principal | | | Optional Call | | |
| Amount (000) | | Description (1) | Provisions (2) | Ratings (3) | Value |
| | Arizona (continued) | | | |
| | Pima County Industrial Development Authority, Arizona, Education Facility Revenue and | | | |
| | Refunding Bonds, Edkey Charter Schools Project, Series 2013: | | | |
| $ 335 | | 6.000%, 7/01/33 | 7/20 at 102.00 | BB– | $ 337,888 |
| 365 | | 6.000%, 7/01/43 | 7/20 at 102.00 | BB– | 365,088 |
| 205 | | 6.000%, 7/01/48 | 7/20 at 102.00 | BB– | 203,883 |
| 1,390 | | Pima County Industrial Development Authority, Arizona, Education Facility Revenue Bonds, | 7/20 at 102.00 | BB– | 1,423,388 |
| | Edkey Charter Schools Project, Series 2014A, 7.375%, 7/01/49 | | | |
| | Pima County Industrial Development Authority, Arizona, Education Facility Revenue Bonds, | | | |
| | Edkey Charter Schools Project, Series 2016: | | | |
| 1,790 | | 5.375%, 7/01/46 | 7/26 at 100.00 | BB– | 1,636,901 |
| 2,140 | | 5.500%, 7/01/51 | 7/26 at 100.00 | BB– | 1,968,607 |
| 595 | | Pima County Industrial Development Authority, Arizona, Education Facility Revenue Bonds, | 2/24 at 100.00 | N/R | 621,287 |
| | San Tan Montessori School Project, Series 2016, 6.500%, 2/01/48, 144A | | | |
| 2,060 | | Pima County Industrial Development Authority, Arizona, Education Facility Revenue Bonds, | 2/28 at 100.00 | N/R | 2,247,089 |
| | San Tan Montessori School Project, Series 2017, 6.750%, 2/01/50, 144A | | | |
| 865 | | Pima County Industrial Development Authority, Arizona, Education Revenue Bonds, Noah | 7/20 at 102.00 | BB– | 886,348 |
| | Webster Schools ? Pima Project, Series 2014A, 7.250%, 7/01/39 | | | |
| 3,710 | | Pinal County Electrical District 3, Arizona, Electric System Revenue Bonds, Refunding | 7/21 at 100.00 | A+ (4) | 3,958,459 |
| | Series 2011, 5.250%, 7/01/41 (Pre-refunded 7/01/21) | | | |
| 7,235 | | Salt Verde Financial Corporation, Arizona, Senior Gas Revenue Bonds, Citigroup Energy | No Opt. Call | BBB+ | 9,740,191 |
| | Inc Prepay Contract Obligations, Series 2007, 5.000%, 12/01/37 | | | |
| 58,655 | | Total Arizona | | | 63,368,055 |
| | California – 23.8% (15.2% of Total Investments) | | | |
| 1,500 | | ABAG Finance Authority for Non-Profit Corporations, California, Cal-Mortgage Insured | 5/20 at 100.00 | AA– (4) | 1,539,660 |
| | Revenue Bonds, Channing House, Series 2010, 6.000%, 5/15/30 (Pre-refunded 5/15/20) | | | |
| 2,000 | | ABC Unified School District, Los Angeles County, California, General Obligation Bonds, | No Opt. Call | AA– | 1,889,520 |
| | Series 2000B, 0.000%, 8/01/23 – FGIC Insured | | | |
| 4,225 | | Alameda Unified School District, Alameda County, California, General Obligation Bonds, | No Opt. Call | AA | 3,599,446 |
| | Series 2005B, 0.000%, 8/01/28 – AGM Insured | | | |
| 535 | | Antelope Valley Healthcare District, California, Revenue Bonds, Series 2016A, | 3/26 at 100.00 | Ba3 | 570,032 |
| | 5.000%, 3/01/41 | | | |
| 1,900 | | Blythe Redevelopment Agency Successor Agency, California, Tax Allocation Bonds, | 11/25 at 100.00 | N/R | 2,145,537 |
| | Redevelopment Project 1, Refunding Series 2015, 5.000%, 5/01/38 | | | |
| | Calexico Unified School District, Imperial County, California, General Obligation Bonds, | | | |
| | Series 2005B: | | | |
| 4,070 | | 0.000%, 8/01/32 – FGIC Insured | No Opt. Call | A3 | 2,901,666 |
| 6,410 | | 0.000%, 8/01/34 – FGIC Insured | No Opt. Call | A3 | 4,248,868 |
| 1,515 | | California Community Housing Agency, Workforce Housing Revenue Bonds, Annadel | 4/29 at 100.00 | N/R | 1,682,983 |
| | Apartments, Series 2019A, 5.000%, 4/01/49, 144A | | | |
| 1,295 | | California County Tobacco Securitization Agency, Tobacco Settlement Asset-Backed Bonds, | 11/19 at 100.00 | N/R | 1,295,168 |
| | Golden Gate Tobacco Funding Corporation, Turbo, Series 2007A, 5.000%, 6/01/36 | | | |
| | California County Tobacco Securitization Agency, Tobacco Settlement Asset-Backed Bonds, | | | |
| | Los Angeles County Securitization Corporation, Series 2006A: | | | |
| 3,280 | | 5.450%, 6/01/28 | 11/19 at 100.00 | B2 | 3,329,954 |
| 13,500 | | 5.600%, 6/01/36 | 11/19 at 100.00 | B2 | 13,596,795 |
| 12,025 | | 5.650%, 6/01/41 | 11/19 at 100.00 | B2 | 12,109,175 |
| 200 | | California County Tobacco Securitization Agency, Tobacco Settlement Asset-Backed Bonds, | 12/19 at 100.00 | A2 | 200,060 |
| | Merced County Tobacco Funding Corporation, Series 2005A, 5.000%, 6/01/26 | | | |
| | California Health Facilities Financing Authority, Revenue Bonds, Saint Joseph Health | | | |
| | System, Series 2013A: | | | |
| 3,840 | | 5.000%, 7/01/33 | 7/23 at 100.00 | AA– | 4,329,331 |
| 710 | | 5.000%, 7/01/37 | 7/23 at 100.00 | AA– | 797,231 |
66
| | | | | | |
| Principal | | | Optional Call | | |
| Amount (000) | | Description (1) | Provisions (2) | Ratings (3) | Value |
| | California (continued) | | | |
| $ 825 | | California Municipal Finance Authority, Charter School Lease Revenue Bonds, Santa Rosa | 7/25 at 100.00 | BB+ | $ 907,294 |
| | Academy Project, Series 2015, 5.375%, 7/01/45, 144A | | | |
| 1,310 | | California Municipal Finance Authority, Mobile Home Park Revenue Bonds, Caritas Projects | 8/20 at 100.00 | BBB (4) | 1,364,313 |
| | Series 2010A, 6.400%, 8/15/45 (Pre-refunded 8/15/20) | | | |
| 1,795 | | California Pollution Control Financing Authority, Water Furnishing Revenue Bonds, San | 1/29 at 100.00 | Baa3 | 2,168,396 |
| | Diego County Water Authority Desalination Project Pipeline, Refunding Series 2019, 5.000%, | | | |
| | 7/01/39, 144A | | | |
| 2,000 | | California School Finance Authority, Charter School Revenue Bonds, Downtown College Prep – | 6/26 at 100.00 | N/R | 2,142,020 |
| | Obligated Group, Series 2016, 5.000%, 6/01/51, 144A | | | |
| 2,000 | | California State Public Works Board, Lease Revenue Bonds, Judicial Council of | 3/23 at 100.00 | A+ | 2,217,440 |
| | California, Various Projects Series 2013A, 5.000%, 3/01/38 | | | |
| 1,500 | | California State Public Works Board, Lease Revenue Bonds, Various Capital Projects, | 3/20 at 100.00 | A+ (4) | 1,523,625 |
| | Series 2010A-1, 5.750%, 3/01/30 (Pre-refunded 3/01/20) | | | |
| 4,500 | | California State Public Works Board, Lease Revenue Bonds, Various Capital Projects, | 10/21 at 100.00 | A+ | 4,833,315 |
| | Series 2011A, 5.125%, 10/01/31 | | | |
| | California State, General Obligation Bonds, Various Purpose Series 2010: | | | |
| 1,000 | | 5.500%, 3/01/40 | 3/20 at 100.00 | AA– | 1,014,410 |
| 8,500 | | 5.250%, 11/01/40 | 11/20 at 100.00 | AA– | 8,841,785 |
| 3,000 | | California State, General Obligation Bonds, Various Purpose Series 2011, | 10/21 at 100.00 | AA– | 3,230,460 |
| | 5.250%, 10/01/32 | | | |
| 10,000 | | California Statewide Communities Development Authority, California, Revenue Bonds, Loma | 12/24 at 100.00 | BB– | 11,146,900 |
| | Linda University Medical Center, Series 2014A, 5.500%, 12/01/54 | | | |
| | California Statewide Communities Development Authority, California, Revenue Bonds, Loma | | | |
| | Linda University Medical Center, Series 2016A: | | | |
| 2,250 | | 5.000%, 12/01/41, 144A | 6/26 at 100.00 | BB– | 2,525,602 |
| 17,155 | | 5.000%, 12/01/46, 144A | 6/26 at 100.00 | BB– | 19,158,189 |
| 24,540 | | 5.250%, 12/01/56, 144A | 6/26 at 100.00 | BB– | 27,697,316 |
| 10,340 | | California Statewide Communities Development Authority, California, Revenue Bonds, Loma | 6/28 at 100.00 | BB– | 12,133,370 |
| | Linda University Medical Center, Series 2018A, 5.500%, 12/01/58, 144A | | | |
| 1,000 | | California Statewide Community Development Authority, Revenue Bonds, Daughters of | 12/19 at 100.00 | CC | 979,920 |
| | Charity Health System, Series 2005A, 5.500%, 7/01/39 | | | |
| 675 | | California Statewide Community Development Authority, Revenue Bonds, Daughters of | 12/19 at 100.00 | CC | 671,085 |
| | Charity Health System, Series 2005H, 5.750%, 7/01/25 | | | |
| 9,955 | | Capistrano Unified School District, Orange County, California, Special Tax Bonds, | No Opt. Call | Baa2 | 7,221,855 |
| | Community Facilities District 98-2, Series 2005, 0.000%, 9/01/31 – FGIC Insured | | | |
| | Clovis Unified School District, Fresno County, California, General Obligation Bonds, | | | |
| | Election 2012 Series 2013B: | | | |
| 1,135 | | 5.000%, 8/01/38 | 8/23 at 100.00 | AA | 1,281,177 |
| 1,865 | | 5.000%, 8/01/38 (Pre-refunded 8/01/23) | 8/23 at 100.00 | N/R (4) | 2,134,567 |
| 4,000 | | Coast Community College District, Orange County, California, General Obligation Bonds, | No Opt. Call | AA+ | 3,866,080 |
| | Series 2005, 0.000%, 8/01/22 – NPFG Insured | | | |
| 3,795 | | Colton Joint Unified School District, San Bernardino County, California, General | No Opt. Call | A+ | 2,375,404 |
| | Obligation Bonds, Series 2006C, 0.000%, 2/01/37 – FGIC Insured | | | |
| 2,180 | | Contra Costa County, California, GNMA Mortgage-Backed Securities Program Home Mortgage | No Opt. Call | AA+ (4) | 2,344,961 |
| | Revenue Bonds, Series 1989, 7.750%, 5/01/22 (AMT) (ETM) | | | |
| 1,320 | | Davis, California, Special Tax Bonds, Community Facilities District 2015-1 Series 2015, | 9/25 at 100.00 | N/R | 1,493,989 |
| | 5.000%, 9/01/40 | | | |
| 5,000 | | Escondido Union School District, San Diego County, California, General Obligation Bonds, | 8/27 at 100.00 | Aa2 | 5,550,500 |
| | Election 2014 Series 2018B, 4.000%, 8/01/47 | | | |
| 2,510 | | Folsom Cordova Unified School District, Sacramento County, California, General | No Opt. Call | AA– | 2,094,846 |
| | Obligation Bonds, School Facilities Improvement District 1, Series 2004B, 0.000%, 10/01/28 – | | | |
| | NPFG Insured | | | |
67
| | | | | |
| NZF | Nuveen Municipal Credit Income Fund | | |
| Portfolio of Investments (continued) | | | |
|
| October 31, 2019 | | | |
|
|
|
|
| Principal | | | Optional Call | | |
| Amount (000) | | Description (1) | Provisions (2) | Ratings (3) | Value |
| | California (continued) | | | |
| $ 3,360 | | Folsom Cordova Unified School District, Sacramento County, California, General | No Opt. Call | AA– | $ 2,928,173 |
| | Obligation Bonds, School Facilities Improvement District 2, Series 2002A, 0.000%, 7/01/27 – | | | |
| | NPFG Insured | | | |
| 3,725 | | Foothill/Eastern Transportation Corridor Agency, California, Toll Road Revenue Bonds, | No Opt. Call | BBB– | 2,538,066 |
| | Refunding Senior Lien Series 2015A, 0.000%, 1/15/34 – AGM Insured | | | |
| | Foothill/Eastern Transportation Corridor Agency, California, Toll Road Revenue Bonds, | | | |
| | Refunding Series 2013A: | | | |
| 3,000 | | 0.000%, 1/15/26 (5) | No Opt. Call | BBB– | 2,855,190 |
| 1,560 | | 5.750%, 1/15/46 | 1/24 at 100.00 | BBB– | 1,804,483 |
| 3,560 | | 6.000%, 1/15/49 | 1/24 at 100.00 | BBB– | 4,171,074 |
| 4,505 | | Foothill-De Anza Community College District, Santa Clara County, California, Election of | No Opt. Call | AAA | 3,640,986 |
| | 1999 General Obligation Bonds, Series A, 0.000%, 8/01/30 – NPFG Insured | | | |
| 5,855 | | Fremont Union High School District, Santa Clara County, California, General Obligation | 8/27 at 100.00 | AAA | 6,569,251 |
| | Bonds, Refunding Series 2017A, 4.000%, 8/01/46 | | | |
| 2,315 | | Gateway Unified School District, California, General Obligation Bonds, Series 2004B, | No Opt. Call | A+ | 1,688,260 |
| | 0.000%, 8/01/32 – FGIC Insured | | | |
| 1,000 | | Gavilan Joint Community College District, Santa Clara and San Benito Counties, | 8/21 at 100.00 | AA (4) | 1,083,610 |
| | California, General Obligation Bonds, Election of 2004 Series 2011D, 5.750%, 8/01/35 | | | |
| | (Pre-refunded 8/01/21) | | | |
| 8,495 | | Golden State Tobacco Securitization Corporation, California, Enhanced Tobacco Settlement | 6/25 at 100.00 | A+ | 9,828,375 |
| | Asset-Backed Revenue Bonds, Refunding Series 2015A, 5.000%, 6/01/45 | | | |
| 3,170 | | Golden State Tobacco Securitization Corporation, California, Enhanced Tobacco Settlement | No Opt. Call | Aa3 | 2,851,605 |
| | Asset-Backed Revenue Bonds, Series 2005A, 0.000%, 6/01/26 – AGM Insured | | | |
| 8,550 | | Golden State Tobacco Securitization Corporation, California, Tobacco Settlement | 6/22 at 100.00 | N/R | 8,827,789 |
| | Asset-Backed Bonds, Series 2018A-1, 5.250%, 6/01/47 | | | |
| 500 | | Golden State Tobacco Securitization Corporation, California, Tobacco Settlement | 6/22 at 100.00 | N/R | 514,200 |
| | Asset-Backed Bonds, Series 2018A-2, 5.000%, 6/01/47 | | | |
| 7,150 | | Grossmont Healthcare District, California, General Obligation Bonds, Series 2011B, | 7/21 at 100.00 | Aaa | 7,770,119 |
| | 6.125%, 7/15/40 (Pre-refunded 7/15/21) | | | |
| 3,190 | | Hillsborough City School District, San Mateo County, California, General Obligation | No Opt. Call | AAA | 2,808,604 |
| | Bonds, Series 2006B, 0.000%, 9/01/27 | | | |
| 5,000 | | Huntington Beach Union High School District, Orange County, California, General | No Opt. Call | Aa2 | 3,849,450 |
| | Obligation Bonds, Series 2005, 0.000%, 8/01/31 – NPFG Insured | | | |
| 2,500 | | Huntington Beach Union High School District, Orange County, California, General | No Opt. Call | AA– | 1,862,600 |
| | Obligation Bonds, Series 2007, 0.000%, 8/01/32 – FGIC Insured | | | |
| 14,565 | | Los Angeles Department of Airports, California, Revenue Bonds, Los Angeles International | 5/28 at 100.00 | AA– | 17,430,809 |
| | Airport, Subordinate Lien Series 2018A, 5.000%, 5/15/44 (AMT) | | | |
| 2,750 | | Los Angeles Regional Airports Improvement Corporation, California, Lease Revenue Bonds, | 1/22 at 100.00 | A | 2,916,320 |
| | LAXFUEL Corporation at Los Angeles International Airport, Refunding Series 2012, 4.500%, | | | |
| | 1/01/27 (AMT) | | | |
| 540 | | Madera County, California, Certificates of Participation, Children’s Hospital Central | 3/20 at 100.00 | A1 (4) | 548,591 |
| | California, Series 2010, 5.375%, 3/15/36 (Pre-refunded 3/15/20) | | | |
| 2,000 | | Martinez Unified School District, Contra Costa County, California, General Obligation | 8/24 at 100.00 | AA | 2,404,120 |
| | Bonds, Series 2011, 5.875%, 8/01/31 | | | |
| 1,000 | | Mendocino-Lake Community College District, Mendocino and Lake Counties, California, | 8/26 at 100.00 | A1 | 1,252,490 |
| | General Obligation Bonds, Election 2006, Series 2011B, 5.600%, 8/01/31 – AGM Insured | | | |
| 2,335 | | Morongo Band of Mission Indians, California, Enterprise Revenue Bonds, Series 2018A, 5.000%, | 10/28 at 100.00 | BBB– | 2,635,304 |
| | 10/01/42, 144A | | | |
| | Mount San Antonio Community College District, Los Angeles County, California, General | | | |
| | Obligation Bonds, Election of 2008, Series 2013A: | | | |
| 1,030 | | 0.000%, 8/01/28 (5) | 2/28 at 100.00 | AA | 1,120,269 |
| 2,320 | | 0.000%, 8/01/43 (5) | 8/35 at 100.00 | AA | 2,275,224 |
68
| | | | | | |
| Principal | | | Optional Call | | |
| Amount (000) | | Description (1) | Provisions (2) | Ratings (3) | Value |
| | California (continued) | | | |
| $ 5,420 | | M-S-R Energy Authority, California, Gas Revenue Bonds, Citigroup Prepay Contracts, | No Opt. Call | BBB+ | $ 8,495,362 |
| | Series 2009B, 6.500%, 11/01/39 | | | |
| | M-S-R Energy Authority, California, Gas Revenue Bonds, Citigroup Prepay Contracts, | | | |
| | Series 2009C: | | | |
| 2,700 | | 7.000%, 11/01/34 | No Opt. Call | BBB+ | 4,133,376 |
| 2,200 | | 6.500%, 11/01/39 | No Opt. Call | BBB+ | 3,448,302 |
| | North Orange County Community College District, California, General Obligation Bonds, | | | |
| | Election of 2002 Series 2003B: | | | |
| 7,735 | | 0.000%, 8/01/25 – FGIC Insured | No Opt. Call | AA+ | 7,108,001 |
| 4,180 | | 0.000%, 8/01/26 – FGIC Insured | No Opt. Call | AA+ | 3,757,151 |
| 10,885 | | Norwalk La Mirada Unified School District, Los Angeles County, California, General | No Opt. Call | A+ | 9,917,541 |
| | Obligation Bonds, Election of 2002 Series 2005B, 0.000%, 8/01/25 – FGIC Insured | | | |
| 405 | | Palomar Pomerado Health Care District, California, Certificates of Participation, Series | 11/20 at 100.00 | Ba1 (4) | 415,429 |
| | 2010, 5.250%, 11/01/21 (Pre-refunded 11/01/20) | | | |
| 6,000 | | Palomar Pomerado Health, California, General Obligation Bonds, Capital Appreciation, | No Opt. Call | BB+ | 5,488,080 |
| | Election of 2004, Series 2007A, 0.000%, 8/01/24 – NPFG Insured | | | |
| 12,210 | | Palomar Pomerado Health, California, General Obligation Bonds, Convertible Capital | 8/30 at 100.00 | BB+ | 16,296,443 |
| | Appreciation, Election 2004 Series 2010A, 0.000%, 8/01/40 (5) | | | |
| 5,000 | | Palomar Pomerado Health, California, General Obligation Bonds, Series 2009A, 7.000%, | 8/29 at 100.00 | BB+ | 6,918,400 |
| | 8/01/38 – AGC Insured | | | |
| 1,750 | | Paramount Unified School District, Los Angeles County, California, General Obligation | No Opt. Call | Aa3 | 1,656,812 |
| | Bonds, Series 2001B, 0.000%, 9/01/23 – AGM Insured | | | |
| 9,315 | | Perris, California, GNMA Mortgage-Backed Securities Program Single Family Mortgage | No Opt. Call | AA+ (4) | 11,121,737 |
| | Revenue Bonds, Series 1989A, 7.600%, 1/01/23 (AMT) (ETM) | | | |
| 2,500 | | Petaluma, Sonoma County, California, Wastewater Revenue Bonds, Refunding Series 2011, | 5/21 at 100.00 | AA+ (4) | 2,670,025 |
| | 5.500%, 5/01/32 (Pre-refunded 5/01/21) | | | |
| 3,850 | | Placentia-Yorba Linda Unified School District, Orange County, California, Certificates | 10/21 at 100.00 | A2 | 4,228,185 |
| | of Participation, Refunding Series 2011, 6.250%, 10/01/28 – AGM Insured | | | |
| 3,200 | | Redlands Unified School District, San Bernardino County, California, General Obligation | No Opt. Call | A2 | 2,742,560 |
| | Bonds, Series 2003, 0.000%, 7/01/27 – AGM Insured | | | |
| 2,000 | | Ridgecrest Redevelopment Agency, California, Ridgecrest Redevelopment Project Tax | 6/20 at 100.00 | A– (4) | 2,066,920 |
| | Allocation Bonds, Refunding Series 2010, 6.125%, 6/30/37 (Pre-refunded 6/30/20) | | | |
| 205 | | Riverside County Transportation Commission, California, Toll Revenue Senior Lien Bonds, | 6/23 at 100.00 | BBB | 229,940 |
| | Series 2013A, 5.750%, 6/01/44 | | | |
| 2,755 | | Sacramento City Unified School District, Sacramento County, California, General | No Opt. Call | BBB+ | 2,466,386 |
| | Obligation Bonds, Series 2007, 0.000%, 7/01/25 – AGM Insured | | | |
| 3,550 | | San Buenaventura, California, Revenue Bonds, Community Memorial Health System, Series | 12/21 at 100.00 | BB | 3,923,602 |
| | 2011, 7.500%, 12/01/41 | | | |
| 165 | | San Clemente, California, Special Tax Revenue Bonds, Community Facilities District | 9/25 at 100.00 | N/R | 186,938 |
| | 2006-1 Marblehead Coastal, Series 2015, 5.000%, 9/01/40 | | | |
| 3,000 | | San Diego Community College District, California, General Obligation Bonds, Tender | 8/21 at 100.00 | AAA | 3,636,120 |
| | Option Bond Trust 2016-XG0053, 11.625%, 8/01/41 (Pre-refunded 8/01/21), 144A (IF) (6) | | | |
| 50,510 | | San Francisco Airports Commission, California, Revenue Bonds, San Francisco | 5/28 at 100.00 | A+ | 59,778,585 |
| | International Airport, Second Series 2018D, 5.000%, 5/01/48 (AMT) | | | |
| 22,975 | | San Francisco Airports Commission, California, Revenue Bonds, San Francisco | 5/29 at 100.00 | A+ | 27,575,514 |
| | International Airport, Second Series 2019A, 5.000%, 5/01/49 (AMT) | | | |
| 2,700 | | San Joaquin Hills Transportation Corridor Agency, Orange County, California, Toll Road | 1/25 at 100.00 | BBB– | 3,054,510 |
| | Revenue Bonds, Refunding Junior Lien Series 2014B, 5.250%, 1/15/44 | | | |
| | San Joaquin Hills Transportation Corridor Agency, Orange County, California, Toll Road | | | |
| | Revenue Bonds, Refunding Senior Lien Series 2014A: | | | |
| 6,630 | | 5.000%, 1/15/44 | 1/25 at 100.00 | BBB | 7,527,503 |
| 3,160 | | 5.000%, 1/15/50 | 1/25 at 100.00 | BBB | 3,561,604 |
69
| | | | | |
| NZF | Nuveen Municipal Credit Income Fund | | |
| Portfolio of Investments (continued) | | | |
|
| October 31, 2019 | | | |
|
|
|
|
| Principal | | | Optional Call | | |
| Amount (000) | | Description (1) | Provisions (2) | Ratings (3) | Value |
| | California (continued) | | | |
| $ 7,205 | | San Joaquin Hills Transportation Corridor Agency, Orange County, California, Toll Road | No Opt. Call | Baa2 | $ 6,759,587 |
| | Revenue Bonds, Refunding Series 1997A, 0.000%, 1/15/23 – NPFG Insured | | | |
| 9,750 | | San Luis Obispo County Community College District, California, General Obligation Bonds, | 8/28 at 100.00 | AA– | 10,959,195 |
| | Election of 2014 Series 2018B, 4.000%, 8/01/43 | | | |
| 5,760 | | San Ysidro School District, San Diego County, California, General Obligation Bonds, | 8/25 at 34.92 | A2 | 1,713,946 |
| | Refunding Series 2015, 0.000%, 8/01/45 | | | |
| 10,000 | | Santa Monica Community College District, Los Angeles County, California, General | 8/28 at 100.00 | Aa2 | 11,270,800 |
| | Obligation Bonds, 2016 Election Series 2018A, 4.000%, 8/01/47 | | | |
| 690 | | Semitrophic Improvement District of Semitrophic Water Storage District, Kern County, | 12/19 at 100.00 | A+ (4) | 692,056 |
| | California, Revenue Bonds, Refunding Series 2009A, 5.000%, 12/01/38 (Pre-refunded 12/01/19) | | | |
| 5,520 | | Silicon Valley Clean Water, Mateo County, California, Wastewater Revenue Bonds, Series | 2/28 at 100.00 | AA | 6,179,806 |
| | 2018, 4.000%, 8/01/42 | | | |
| | Silicon Valley Tobacco Securitization Authority, California, Tobacco Settlement | | | |
| | Asset-Backed Bonds, Santa Clara County Tobacco Securitization Corporation, Series 2007A: | | | |
| 7,500 | | 0.000%, 6/01/36 | 12/19 at 40.05 | N/R | 2,990,625 |
| 37,555 | | 0.000%, 6/01/47 | 12/19 at 21.32 | N/R | 7,972,551 |
| 1,820 | | Southwestern Community College District, San Diego County, California, General | 8/27 at 100.00 | AA– | 2,025,533 |
| | Obligation Bonds, Election of 2016, Series 2017A, 4.000%, 8/01/42 | | | |
| | Tobacco Securitization Authority of Southern California, Tobacco Settlement Asset-Backed | | | |
| | Bonds, San Diego County Tobacco Asset Securitization Corporation, Senior Series 2006A: | | | |
| 11,595 | | 5.000%, 6/01/37 | 11/19 at 100.00 | B– | 11,607,754 |
| 3,090 | | 5.125%, 6/01/46 | 11/19 at 100.00 | B– | 3,093,523 |
| 1,800 | | Walnut Valley Unified School District, Los Angeles County, California, General | No Opt. Call | AA– | 1,571,760 |
| | Obligation Bonds, Election 2000 Series 2003D, 0.000%, 8/01/27 – FGIC Insured | | | |
| | Wiseburn School District, Los Angeles County, California, General Obligation Bonds, | | | |
| | Series 2011B: | | | |
| 4,005 | | 0.000%, 8/01/36 – AGM Insured (5) | 8/31 at 100.00 | AA | 4,159,192 |
| 3,900 | | 5.625%, 5/01/41 (Pre-refunded 8/01/21) – AGM Insured | 8/21 at 100.00 | AA (4) | 4,214,145 |
| 3,000 | | Yuba Community College District, California, General Obligation Bonds, Election 2006 | 8/21 at 100.00 | Aa2 (4) | 3,224,970 |
| | Series 2011C, 5.250%, 8/01/47 (Pre-refunded 8/01/21) | | | |
| 563,320 | | Total California | | | 562,169,676 |
| | Colorado – 7.3% (4.6% of Total Investments) | | | |
| 1,250 | | Adams County School District 1, Mapleton Public Schools, Colorado, General Obligation | 12/20 at 100.00 | Aa2 (4) | 1,317,763 |
| | Bonds, Series 2010, 6.250%, 12/01/35 (Pre-refunded 12/01/20) | | | |
| 1,500 | | Anthem West Metropolitan District, Colorado, General Obligation Bonds, Refunding Series | 12/25 at 100.00 | A3 | 1,752,510 |
| | 2015, 5.000%, 12/01/35 – BAM Insured | | | |
| 1,215 | | Base Village Metropolitan District 2, Colorado, General Obligation Bonds, Refunding | 12/21 at 103.00 | N/R | 1,280,975 |
| | Series 2016A, 5.500%, 12/01/36 | | | |
| | Canyons Metropolitan District 5, Douglas County, Colorado, Limited Tax General | | | |
| | Obligation and Special Revenue Bonds, Refunding & Improvement Series 2017A: | | | |
| 775 | | 6.000%, 12/01/37 | 12/22 at 103.00 | N/R | 819,291 |
| 2,320 | | 6.125%, 12/01/47 | 12/22 at 103.00 | N/R | 2,442,774 |
| 685 | | Canyons Metropolitan District 6, Douglas County, Colorado, Limited Tax General | 12/22 at 103.00 | N/R | 707,180 |
| | Obligation and Special Revenue Bonds, Refunding & Improvement Series 2017A, 6.125%, 12/01/47 | | | |
| 500 | | Castle Oaks Metropolitan District 3, Castle Rock, Douglas County, Colorado, General | 12/20 at 103.00 | N/R (4) | 537,135 |
| | Obligation Limited Tax Bonds, Series 2016, 5.500%, 12/01/45 (Pre-refunded 12/01/20) | | | |
| | Centerra Metropolitan District 1, Loveland, Colorado, Special Revenue Bonds, Refunding & | | | |
| | Improvement Series 2017: | | | |
| 770 | | 5.000%, 12/01/37, 144A | 12/22 at 103.00 | N/R | 818,294 |
| 2,210 | | 5.000%, 12/01/47, 144A | 12/22 at 103.00 | N/R | 2,328,080 |
| 625 | | Central Platte Valley Metropolitan District, Colorado, General Obligation Bonds, | 12/23 at 100.00 | BBB– | 722,850 |
| | Refunding Series 2013A, 6.000%, 12/01/38 | | | |
70
| | | | | | |
| Principal | | | Optional Call | | |
| Amount (000) | | Description (1) | Provisions (2) | Ratings (3) | Value |
| | Colorado (continued) | | | |
| $ 1,000 | | Cherry Creek Corporate Center Metropolitan District, Arapahoe County, Colorado, Revenue | 12/25 at 100.00 | N/R | $ 1,043,690 |
| | Bonds, Refunding Senior Lien Series 2015A, 5.000%, 6/01/37 | | | |
| 1,240 | | Colorado City Metropolitan District, Oueblo county, Colorado, Water and Wastewater | 12/19 at 100.00 | N/R | 1,241,860 |
| | Enterprise Revenue Bonds, Refunding & Improvement Series 2012, 4.500%, 12/01/34 | | | |
| 1,000 | | Colorado Educational and Cultural Facilities Authority, Charter School Revenue Bonds, | 12/19 at 100.00 | AA– | 1,001,780 |
| | Pinnacle Charter School, Inc High School Project, Series 2010, 5.000%, 12/01/29 | | | |
| 1,745 | | Colorado Educational and Cultural Facilities Authority, Revenue Bonds, Montessori Peaks | 12/19 at 100.00 | N/R | 1,746,291 |
| | Academy, Series 2006A, 5.400%, 5/01/26 | | | |
| 9,335 | | Colorado Health Facilities Authority, Colorado, Revenue Bonds, Catholic Health | 1/23 at 100.00 | BBB+ (4) | 10,481,431 |
| | Initiatives, Series 2013A, 5.250%, 1/01/45 (Pre-refunded 1/01/23) | | | |
| 2,000 | | Colorado Health Facilities Authority, Colorado, Revenue Bonds, Children’s Hospital | 12/23 at 100.00 | A+ | 2,242,760 |
| | Colorado Project, Series 2013A, 5.000%, 12/01/36 | | | |
| 30,245 | | Colorado Health Facilities Authority, Colorado, Revenue Bonds, CommonSpirit Health, | 8/29 at 100.00 | BBB+ | 35,783,464 |
| | Series 2019A-2, 5.000%, 8/01/44 | | | |
| 2,000 | | Colorado Health Facilities Authority, Colorado, Revenue Bonds, Craig Hospital Project, | 12/22 at 100.00 | A+ | 2,083,360 |
| | Series 2012, 4.000%, 12/01/42 | | | |
| 585 | | Colorado Health Facilities Authority, Colorado, Revenue Bonds, Evangelical Lutheran Good | 6/23 at 100.00 | N/R (4) | 674,874 |
| | Samaritan Society Project, Series 2013, 5.625%, 6/01/43 (Pre-refunded 6/01/23) | | | |
| 3,655 | | Colorado Health Facilities Authority, Colorado, Revenue Bonds, Evangelical Lutheran Good | 6/25 at 100.00 | N/R (4) | 4,377,776 |
| | Samaritan Society Project, Series 2013A, 5.000%, 6/01/45 (Pre-refunded 6/01/25) | | | |
| 11,500 | | Colorado Health Facilities Authority, Colorado, Revenue Bonds, Sisters of Charity of | 1/20 at 100.00 | AA– | 11,569,115 |
| | Leavenworth Health Services Corporation, Series 2010A, 5.000%, 1/01/40 | | | |
| 2,105 | | Colorado International Center Metropolitan District 14, Denver, Colorado, Limited Tax | 12/23 at 103.00 | N/R | 2,301,544 |
| | General Obligation Bonds, Refunding & Improvement Series 2018, 5.875%, 12/01/46 | | | |
| 2,250 | | Colorado Springs, Colorado, Utilities System Revenue Bonds, Improvement Series 2013B-1, | 11/23 at 100.00 | Aa2 | 2,533,410 |
| | 5.000%, 11/15/38 | | | |
| 20 | | Colorado State Board of Governors, Colorado State University Auxiliary Enterprise System | 12/19 at 100.00 | AA | 20,054 |
| | Revenue Bonds, Series 2009A, 5.000%, 3/01/34 | | | |
| 1,000 | | Concord Metropolitan District, Douglas County, Colorado, General Obligation Bonds, | 12/20 at 100.00 | BBB+ (4) | 1,042,250 |
| | Refunding Series 2010, 5.375%, 12/01/40 (Pre-refunded 12/01/20) | | | |
| 500 | | Copperleaf Metropolitan District 2, Colorado, General Obligation Limited Tax Bonds, | 12/20 at 103.00 | N/R | 523,810 |
| | Series 2006, 5.250%, 12/01/30 | | | |
| 2,200 | | Denver City and County, Colorado, Airport System Revenue Bonds, Series 2012B, | 11/22 at 100.00 | A+ | 2,427,744 |
| | 5.000%, 11/15/32 | | | |
| 3,870 | | Denver City and County, Colorado, Airport System Revenue Bonds, Subordinate Lien Series | 11/23 at 100.00 | A | 4,335,019 |
| | 2013B, 5.000%, 11/15/43 | | | |
| | Denver Urban Renewal Authority, Colorado, Tax Increment Revenue Bonds, 9th and Colorado | | | |
| | Urban Redevelopment Area, Series 2018A: | | | |
| 835 | | 5.250%, 12/01/39, 144A | 12/23 at 103.00 | N/R | 893,868 |
| 1,310 | | 5.250%, 12/01/39, 144A | 12/23 at 103.00 | N/R | 1,402,355 |
| 10,000 | | E-470 Public Highway Authority, Colorado, Senior Revenue Bonds, Capital Appreciation | No Opt. Call | A | 5,176,300 |
| | Series 2010A, 0.000%, 9/01/41 | | | |
| 8,845 | | E-470 Public Highway Authority, Colorado, Senior Revenue Bonds, Series 1997B, 0.010%, | No Opt. Call | A | 7,740,348 |
| | 9/01/26 – NPFG Insured | | | |
| | E-470 Public Highway Authority, Colorado, Senior Revenue Bonds, Series 2000B: | | | |
| 7,550 | | 0.010%, 9/01/29 – NPFG Insured | No Opt. Call | A | 6,010,555 |
| 11,100 | | 0.010%, 9/01/31 – NPFG Insured | No Opt. Call | A | 8,232,981 |
| 10,000 | | 0.000%, 9/01/32 – NPFG Insured | No Opt. Call | A | 7,164,400 |
| 8,135 | | E-470 Public Highway Authority, Colorado, Toll Revenue Bonds, Series 2004B, 0.000%, | 9/20 at 63.99 | A | 5,133,673 |
| | 9/01/28 – NPFG Insured | | | |
71
| | | | | |
| NZF | Nuveen Municipal Credit Income Fund | | |
| Portfolio of Investments (continued) | | | |
|
| October 31, 2019 | | | |
|
|
|
|
| Principal | | | Optional Call | | |
| Amount (000) | | Description (1) | Provisions (2) | Ratings (3) | Value |
| | Colorado (continued) | | | |
| | Eaton Area Park and Recreation District, Colorado, General Obligation Limited Tax Bonds, | | | |
| | Series 2015: | | | |
| $ 475 | | 5.500%, 12/01/30 | 12/22 at 100.00 | N/R | $ 509,476 |
| 180 | | 5.250%, 12/01/34 | 12/22 at 100.00 | N/R | 190,449 |
| 500 | | Erie Highlands Metropolitan District No 1 (In the Town of Erie), Weld County, Colorado, | 12/20 at 103.00 | N/R | 519,990 |
| | General Obligation Limited Tax Bonds, Series 2015A, 5.750%, 12/01/45 | | | |
| 945 | | Flatiron Meadows Metropolitan District, Boulder County, Colorado, General Obligation | 12/21 at 103.00 | N/R | 975,675 |
| | Limited Tax Bonds, Series 2016, 5.125%, 12/01/46 | | | |
| | Foothills Metropolitan District, Fort Collins, Colorado, Special Revenue Bonds, | | | |
| | Series 2014: | | | |
| 1,125 | | 5.750%, 12/01/30 | 12/24 at 100.00 | N/R | 1,191,263 |
| 1,000 | | 6.000%, 12/01/38 | 12/24 at 100.00 | N/R | 1,056,200 |
| 770 | | Great Western Park Metropolitan District 2, Broomfield City and County, Colorado, | 12/21 at 100.00 | N/R | 795,733 |
| | General Obligation Bonds, Series 2016A, 5.000%, 12/01/46 | | | |
| | Johnstown Plaza Metropolitan District, Colorado, Special Revenue Bonds, Series 2016A: | | | |
| 1,590 | | 5.250%, 12/01/36 | 12/21 at 103.00 | N/R | 1,625,425 |
| 6,130 | | 5.375%, 12/01/46 | 12/21 at 103.00 | N/R | 6,268,599 |
| 1,000 | | Meridian Metropolitan District, Douglas County, Colorado, General Obligation Refunding | 12/21 at 100.00 | A– | 1,063,640 |
| | Bonds, Series 2011A, 5.000%, 12/01/41 | | | |
| 825 | | North Range Metropolitan District No 2 , In the City of Commerce City, Adams County, | 12/22 at 103.00 | N/R | 871,621 |
| | Colorado , Limited Tax General Obligation and Special Revenue and Improvement Bonds, | | | |
| | Refunding Series 2017A, 5.750%, 12/01/47 | | | |
| 1,870 | | Park Creek Metropolitan District, Colorado, Senior Limited Property Tax Supported | 12/25 at 100.00 | A | 2,108,500 |
| | Revenue Bonds, Refunding Series 2015A, 5.000%, 12/01/45 | | | |
| 3,015 | | Park Creek Metropolitan District, Colorado, Senior Limited Property Tax Supported | 12/20 at 100.00 | A2 (4) | 3,172,775 |
| | Revenue Refunding Bonds, Series 2011, 6.125%, 12/01/41 (Pre-refunded 12/01/20) – AGM Insured | | | |
| 500 | | Parker Automotive Metropolitan District (In the Town of Parker, Colorado), General | 12/26 at 100.00 | N/R | 518,250 |
| | Obligation Bonds, Refunding Series 2016, 5.000%, 12/01/45 | | | |
| 1,590 | | Regional Transportation District, Colorado, Certificates of Participation, Series 2010A, | 6/20 at 100.00 | AA– | 1,624,853 |
| | 5.375%, 6/01/31 | | | |
| | Regional Transportation District, Colorado, Denver Transit Partners Eagle P3 Project | | | |
| | Private Activity Bonds, Series 2010: | | | |
| 4,355 | | 6.000%, 1/15/34 | 7/20 at 100.00 | Baa3 | 4,467,490 |
| 2,365 | | 6.000%, 1/15/41 | 7/20 at 100.00 | Baa3 | 2,426,088 |
| 1,020 | | Reserve Metropolitan District 2, Mount Crested Butte, Colorado, Limited Tax General | 12/26 at 100.00 | N/R | 1,066,726 |
| | Obligation Bonds, Refunding Series 2016A, 5.000%, 12/01/45 | | | |
| 525 | | Sierra Ridge Metropolitan District 2, Douglas County, Colorado, General Obligation | 12/21 at 103.00 | N/R | 551,885 |
| | Bonds, Limited Tax Series 2016A, 5.500%, 12/01/46 | | | |
| 648 | | Thompson Crossing Metropolitan District 6, Johnstown, Larimer County, Colorado, General | 12/20 at 103.00 | N/R | 672,462 |
| | Obligation Limited Tax Bonds Series 2015A, 6.000%, 12/01/44 | | | |
| 55 | | Water Valley Metropolitan District 1, Colorado, General Obligation Bonds, Refunding | 12/26 at 100.00 | N/R | 60,514 |
| | Series 2016, 5.250%, 12/01/40 | | | |
| 105 | | Water Valley Metropolitan District 2, Windsor, Colorado, General Obligation Bonds, | 12/26 at 100.00 | N/R | 115,802 |
| | Refunding Series 2016, 5.250%, 12/01/40 | | | |
| 176,463 | | Total Colorado | | | 171,764,980 |
| | Connecticut – 0.3% (0.2% of Total Investments) | | | |
| 1,500 | | Connecticut Health and Educational Facilities Authority, Revenue Bonds, Hartford | 7/21 at 100.00 | A | 1,570,470 |
| | HealthCare, Series 2011A, 5.000%, 7/01/41 | | | |
| 5,000 | | Connecticut Health and Educational Facilities Authority, Revenue Bonds, Trinity Health | 6/26 at 100.00 | AA– | 5,816,450 |
| | Credit Group, Series 2016CT, 5.000%, 12/01/45 | | | |
| 6,500 | | Total Connecticut | | | 7,386,920 |
72
| | | | | | |
| Principal | | | Optional Call | | |
| Amount (000) | | Description (1) | Provisions (2) | Ratings (3) | Value |
| | Florida – 6.6% (4.2% of Total Investments) | | | |
| $ 1,250 | | Bay County, Florida, Educational Facilities Revenue Refunding Bonds, Bay Haven Charter | 9/20 at 100.00 | BBB | $ 1,283,813 |
| | Academy, Inc Project, Series 2010A, 6.000%, 9/01/40 | | | |
| | Bay County, Florida, Educational Facilities Revenue Refunding Bonds, Bay Haven Charter | | | |
| | Academy, Inc Project, Series 2013A: | | | |
| 1,005 | | 5.000%, 9/01/43 | 9/23 at 100.00 | BBB | 1,065,531 |
| 865 | | 5.000%, 9/01/45 | 9/23 at 100.00 | BBB | 915,992 |
| 625 | | Belmont Community Development District, Florida, Capital Improvement Revenue Bonds, | 11/27 at 100.00 | N/R | 670,700 |
| | Series 2016A, 5.375%, 11/01/36 | | | |
| 30 | | Belmont Community Development District, Florida, Capital Improvement Revenue Bonds, | No Opt. Call | N/R | 32,887 |
| | Series 2016B, 5.625%, 11/01/35 | | | |
| 665 | | Bexley Community Development District, Pasco County, Florida, Special Assessment Revenue | 5/26 at 100.00 | N/R | 693,309 |
| | Bonds, Series 2016, 4.700%, 5/01/36 | | | |
| 3,430 | | Broward County, Florida, Airport Facility Revenue Bonds, Learjet Inc, Series 2000, | 12/19 at 100.00 | Caa1 | 3,432,573 |
| | 7.500%, 11/01/20 (AMT) | | | |
| 1,480 | | Broward County, Florida, Fuel System Revenue Bonds, Fort Lauderdale Fuel Facilities LLC | 4/23 at 100.00 | AA | 1,616,515 |
| | Project, Series 2013A, 5.000%, 4/01/33 – AGM Insured (AMT) | | | |
| 4,390 | | Capital Trust Agency, Florida, Multifamily Housing Revenue Bonds, The Gardens Apartments | 7/25 at 100.00 | CCC+ | 3,131,343 |
| | Project, Series 2015A, 5.000%, 7/01/50 | | | |
| | Creekside at Twin Creeks Community Development District, Florida, Special Assessment | | | |
| | Bonds, Area 1 Project, Series 2016A-1: | | | |
| 125 | | 5.250%, 11/01/37 | 11/28 at 100.00 | N/R | 134,550 |
| 160 | | 5.600%, 11/01/46 | 11/28 at 100.00 | N/R | 174,168 |
| 25 | | Creekside at Twin Creeks Community Development District, Florida, Special Assessment | No Opt. Call | N/R | 27,405 |
| | Bonds, Area 1 Project, Series 2016A-2, 5.625%, 11/01/35 | | | |
| | Downtown Doral Community Development District, Florida, Special Assessment Bonds, | | | |
| | Series 2015: | | | |
| 555 | | 5.250%, 5/01/35 | 5/26 at 100.00 | N/R | 586,197 |
| 615 | | 5.300%, 5/01/36 | 5/26 at 100.00 | N/R | 649,514 |
| 955 | | 5.500%, 5/01/45 | 5/26 at 100.00 | N/R | 1,016,321 |
| 1,305 | | 5.500%, 5/01/46 | 5/26 at 100.00 | N/R | 1,388,794 |
| | Florida Development Finance Corporation, Educational Facilities Revenue Bonds, Downtown | | | |
| | Doral Charter Upper School Project, Series 2017C: | | | |
| 1,115 | | 5.650%, 7/01/37, 144A | 7/27 at 101.00 | N/R | 1,151,895 |
| 3,385 | | 5.750%, 7/01/47, 144A | 7/27 at 101.00 | N/R | 3,491,763 |
| | Florida Development Finance Corporation, Educational Facilities Revenue Bonds, Florida | | | |
| | Charter Foundation Inc Projects, Series 2016A: | | | |
| 1,015 | | 6.250%, 6/15/36, 144A | 6/26 at 100.00 | N/R | 1,158,541 |
| 1,420 | | 4.750%, 7/15/36, 144A | 7/26 at 100.00 | N/R | 1,450,118 |
| 2,475 | | 6.375%, 6/15/46, 144A | 6/26 at 100.00 | N/R | 2,811,971 |
| 1,465 | | 5.000%, 7/15/46, 144A | 7/26 at 100.00 | N/R | 1,500,893 |
| | Florida Development Finance Corporation, Educational Facilities Revenue Bonds, Pepin | | | |
| | Academies Inc, Series 2016A: | | | |
| 1,000 | | 5.000%, 7/01/36 | 7/26 at 100.00 | N/R | 1,010,080 |
| 6,785 | | 5.125%, 7/01/46 | 7/26 at 100.00 | N/R | 6,835,888 |
| | Florida Development Finance Corporation, Educational Facilities Revenue Bonds, | | | |
| | Renaissance Charter School Income Projects, Series 2015A: | | | |
| 900 | | 6.000%, 6/15/35, 144A | 6/25 at 100.00 | N/R | 995,859 |
| 560 | | 6.125%, 6/15/46, 144A | 6/25 at 100.00 | N/R | 613,178 |
| | Florida Development Finance Corporation, Florida, Surface Transportation Facility | | | |
| | Revenue Bonds, Virgin Trains USA Passenger Rail Project , Series 2019A: | | | |
| 30,000 | | 6.250%, 1/01/49 (AMT) (Mandatory Put 1/01/24), 144A | 1/20 at 104.00 | N/R | 28,575,000 |
| 10,000 | | 6.375%, 1/01/49 (AMT) (Mandatory Put 1/01/26), 144A | 1/20 at 105.00 | N/R | 9,459,400 |
| 10,000 | | 6.500%, 1/01/49 (AMT) (Mandatory Put 1/01/29), 144A | 1/20 at 105.00 | N/R | 9,422,100 |
73
| | | | | |
| NZF | Nuveen Municipal Credit Income Fund | | |
| Portfolio of Investments (continued) | | | |
|
| October 31, 2019 | | | |
|
|
|
|
| Principal | | | Optional Call | | |
| Amount (000) | | Description (1) | Provisions (2) | Ratings (3) | Value |
| | Florida (continued) | | | |
| $ 10,000 | | Florida Development Finance Corporation, Florida, Surface Transportation Facility | No Opt. Call | Aaa | $ 10,012,700 |
| | Revenue Bonds, Virgin Trains USA Passenger Rail Project , Series 2019B, 1.900%, 1/01/49 (AMT) | | | |
| | (Mandatory Put 3/17/20) | | | |
| 1,100 | | Florida Higher Educational Facilities Financing Authority, Revenue Bonds, Nova | 4/21 at 100.00 | Baa1 | 1,165,615 |
| | Southeastern University, Refunding Series 2011, 6.375%, 4/01/31 | | | |
| 320 | | Grand Bay at Doral Community Development District, Miami-Dade County, Florida, Special | 5/26 at 100.00 | N/R | 332,675 |
| | Assessment Bonds, South Parcel Assessment Area Project, Series 2016, 4.750%, 5/01/36 | | | |
| 5,000 | | Greater Orlando Aviation Authority, Florida, Orlando Airport Facilities Revenue Bonds, | 10/27 at 100.00 | A+ | 5,863,750 |
| | Priority Subordinated Series 2017, 5.000%, 10/01/47 (AMT) | | | |
| 14,375 | | Halifax Hospital Medical Center, Daytona Beach, Florida, Hospital Revenue Bonds, | 6/26 at 100.00 | A– | 16,694,981 |
| | Refunding & Improvement Series 2016, 5.000%, 6/01/36 | | | |
| 1,750 | | Hillsborough County Aviation Authority, Florida, Revenue Bonds, Tampa International | 10/24 at 100.00 | A+ | 1,977,255 |
| | Airport, Subordinate Lien Series 2015B, 5.000%, 10/01/40 (AMT) | | | |
| 4,695 | | Hillsborough County Aviation Authority, Florida, Tampa International Airport Customer | 10/24 at 100.00 | A3 | 5,311,688 |
| | Facility Charge Revenue Bonds, Series 2015A, 5.000%, 10/01/44 | | | |
| 1,000 | | Miami-Dade County, Florida, Aviation Revenue Bonds, Refunding Series 2019A, 5.000%, | 10/29 at 100.00 | A | 1,201,520 |
| | 10/01/49 (AMT) | | | |
| 2,490 | | Miami-Dade County, Florida, Special Obligation Bonds, Refunding Subordinate Series | 10/22 at 100.00 | A2 | 2,722,765 |
| | 2012B, 5.000%, 10/01/37 | | | |
| 7,045 | | Miami-Dade County, Florida, Water and Sewer System Revenue Bonds, Series 2013A, | 10/22 at 100.00 | A+ | 7,717,234 |
| | 5.000%, 10/01/42 | | | |
| 2,140 | | Northern Palm Beach County Improvement District, Florida, Water Control and Improvement | 8/26 at 100.00 | N/R | 2,356,097 |
| | Bonds, Development Unit 53, Series 2015, 5.350%, 8/01/35 | | | |
| 2,185 | | Orange County Health Facilities Authority, Florida, Hospital Revenue Bonds, Orlando | 4/22 at 100.00 | A2 | 2,332,619 |
| | Health, Inc, Series 2012A, 5.000%, 10/01/42 | | | |
| 2,335 | | Orlando, Florida, Capital Improvement Special Revenue Bonds, Series 2014B, | 10/24 at 100.00 | Aa2 | 2,699,260 |
| | 5.000%, 10/01/46 | | | |
| 85 | | Palm Beach County Health Facilities Authority, Florida, Revenue Bonds, Sinai Residences | 6/22 at 102.00 | N/R | 94,985 |
| | of Boca Raton Project, Series 2014A, 7.250%, 6/01/34 | | | |
| 1,745 | | Palm Beach County, Florida, Revenue Bonds, Provident Group – PBAU Properties LLC – Palm | 4/29 at 100.00 | Ba1 | 1,953,231 |
| | Beach Atlantic University Housing Project, Series 2019A, 5.000%, 4/01/39, 144A | | | |
| 545 | | Reunion West Community Development District, Florida, Special Assessment Bonds, Area 3 | 11/26 at 100.00 | N/R | 573,471 |
| | Project, Series 2016, 5.000%, 11/01/46 | | | |
| | Six Mile Creek Community Development District, Florida, Capital Improvement Revenue | | | |
| | Bonds, Assessment Area 2, Series 2016: | | | |
| 160 | | 4.750%, 11/01/28 | 11/27 at 100.00 | N/R | 166,915 |
| 265 | | 5.375%, 11/01/36 | 11/27 at 100.00 | N/R | 281,515 |
| 375 | | South Village Community Development District, Clay County, Florida, Capital Improvement | 5/26 at 100.00 | A | 398,588 |
| | Revenue Bonds, Refunding Series 2016A1, 3.625%, 5/01/35 | | | |
| | South Village Community Development District, Clay County, Florida, Capital Improvement | | | |
| | Revenue Bonds, Refunding Series 2016A2: | | | |
| 130 | | 4.350%, 5/01/26 | No Opt. Call | N/R | 133,361 |
| 100 | | 4.875%, 5/01/35 | 5/26 at 100.00 | N/R | 104,378 |
| 1,350 | | Sumter County Industrial Development Authority, Florida, Hospital Revenue Bonds, Central | 1/24 at 100.00 | A– | 1,490,427 |
| | Florida Health Alliance Projects, Series 2014A, 5.125%, 7/01/34 | | | |
| 3,300 | | Tampa, Florida, Health System Revenue Bonds, Baycare Health System, Series 2012A, | 5/22 at 100.00 | Aa2 | 3,572,844 |
| | 5.000%, 11/15/33 | | | |
| 85 | | Tolomato Community Development District, Florida, Special Assessment Bonds, Convertible, | 5/22 at 100.00 | N/R | 73,358 |
| | Capital Appreciation, Series 2012A-4, 0.000%, 5/01/40 (5) | | | |
| 110 | | Tolomato Community Development District, Florida, Special Assessment Bonds, Hope Note, | 12/19 at 100.00 | N/R | 1 |
| | Series 2007-3, 6.650%, 5/01/40 (7) | | | |
74
| | | | | | |
| Principal | | | Optional Call | | |
| Amount (000) | | Description (1) | Provisions (2) | Ratings (3) | Value |
| | Florida (continued) | | | |
| $ 295 | | Tolomato Community Development District, Florida, Special Assessment Bonds, Refunding | 12/19 at 100.00 | N/R | $ 252,892 |
| | Series 2015-1, 0.000%, 5/01/40 | | | |
| 180 | | Tolomato Community Development District, Florida, Special Assessment Bonds, Refunding | 12/19 at 100.00 | N/R | 126,700 |
| | Series 2015-2, 0.000%, 5/01/40 | | | |
| 195 | | Tolomato Community Development District, Florida, Special Assessment Bonds, Refunding | 12/19 at 100.00 | N/R | 2 |
| | Series 2015-3, 6.610%, 5/01/40 (7) | | | |
| 300 | | Union Park Community Development District, Florida, Capital Improvement Revenue Bonds, | 11/27 at 100.00 | N/R | 321,885 |
| | Series 2016A-1, 5.375%, 11/01/37 | | | |
| 151,255 | | Total Florida | | | 155,229,010 |
| | Georgia – 2.1% (1.3% of Total Investments) | | | |
| 2,725 | | Atlanta Development Authority, Georgia, Revenue Bonds, New Downtown Atlanta Stadium | 7/25 at 100.00 | A+ | 3,212,121 |
| | Project, Senior Lien Series 2015A-1, 5.250%, 7/01/40 | | | |
| 15,000 | | Atlanta, Georgia, Airport General Revenue Bonds, Refunding Series 2010C, 5.250%, 1/01/30 | 1/21 at 100.00 | Aa3 | 15,672,000 |
| 4,400 | | Atlanta, Georgia, Water and Wastewater Revenue Bonds, Series 1999A, 5.500%, 11/01/22 – | No Opt. Call | AA– | 4,784,164 |
| | FGIC Insured | | | |
| 3,250 | | DeKalb County Hospital Authority, Georgia, Anticipation Certificates Revenue Bonds, | 9/20 at 100.00 | N/R (4) | 3,376,522 |
| | DeKalb Medical Center, Inc Project, Series 2010, 6.000%, 9/01/30 (Pre-refunded 9/01/20) | | | |
| | Gainesville and Hall County Hospital Authority, Georgia, Revenue Anticipation | | | |
| | Certificates, Northeast Georgia Health Services Inc, Series 2010A: | | | |
| 590 | | 5.000%, 2/15/30 | 2/20 at 100.00 | A | 596,130 |
| 1,910 | | 5.000%, 2/15/30 (Pre-refunded 2/15/20) | 2/20 at 100.00 | N/R (4) | 1,930,666 |
| | Gainesville and Hall County Hospital Authority, Georgia, Revenue Anticipation | | | |
| | Certificates, Northeast Georgia Health Services Inc, Series 2010B: | | | |
| 475 | | 5.250%, 2/15/37 | 2/20 at 100.00 | AA– | 480,064 |
| 1,525 | | 5.250%, 2/15/37 (Pre-refunded 2/15/20) | 2/20 at 100.00 | N/R (4) | 1,542,553 |
| 1,180 | | 5.125%, 2/15/40 | 2/20 at 100.00 | AA– | 1,192,001 |
| 3,820 | | 5.125%, 2/15/40 (Pre-refunded 2/15/20) | 2/20 at 100.00 | N/R (4) | 3,862,669 |
| 4,010 | | Georgia Municipal Electric Authority, Plant Vogtle Units 3 & 4 Project J Bonds, Series | 7/25 at 100.00 | Baa3 | 4,387,381 |
| | 2015A, 5.000%, 7/01/60 | | | |
| 840 | | Macon-Bibb County Urban Development Authority, Georgia, Revenue Bonds, Academy for | 6/27 at 100.00 | N/R | 861,949 |
| | Classical Education, Series 2017, 5.875%, 6/15/47, 144A | | | |
| 1,070 | | Main Street Natural Gas Inc, Georgia, Gas Supply Revenue Bonds, Series 2019A, | 5/29 at 100.00 | A3 | 1,262,568 |
| | 5.000%, 5/15/43 | | | |
| 3,000 | | Marietta Development Authority, Georgia, University Facilities Revenue Bonds, Life | 11/27 at 100.00 | Ba3 | 3,322,380 |
| | University, Inc Project, Refunding Series 2017A, 5.000%, 11/01/47, 144A | | | |
| 2,750 | | Monroe County Development Authority, Georgia, Pollution Control Revenue Bonds, Georgia | 6/24 at 100.00 | Baa1 | 2,801,288 |
| | Power Company – Scherer Plant, First Series 1995, 2.250%, 7/01/25 | | | |
| 46,545 | | Total Georgia | | | 49,284,456 |
| | Guam – 0.2% (0.1% of Total Investments) | | | |
| 4,000 | | Guam Government Waterworks Authority, Water and Wastewater System Revenue Bonds, Series | 7/20 at 100.00 | BBB– (4) | 4,114,800 |
| | 2010, 5.500%, 7/01/30 (Pre-refunded 7/01/20) | | | |
| 810 | | Guam Government Waterworks Authority, Water and Wastewater System Revenue Bonds, Series | 7/23 at 100.00 | BBB– | 890,101 |
| | 2013, 5.500%, 7/01/43 | | | |
| 4,810 | | Total Guam | | | 5,004,901 |
| | Hawaii – 0.2% (0.2% of Total Investments) | | | |
| 1,000 | | Hawaii Department of Budget and Finance, Special Purpose Revenue Bonds, Hawaii Pacific | 7/20 at 100.00 | A1 (4) | 1,028,160 |
| | Health Obligated Group, Series 2010A, 5.500%, 7/01/40 (Pre-refunded 7/01/20) | | | |
| 3,000 | | Hawaii Department of Budget and Finance, Special Purpose Revenue Bonds, Hawaii Pacific | 7/23 at 100.00 | A1 | 3,352,440 |
| | Health Obligated Group, Series 2013A, 5.500%, 7/01/43 | | | |
75
| | | | | |
| NZF | Nuveen Municipal Credit Income Fund | | |
| Portfolio of Investments (continued) | | | |
|
| October 31, 2019 | | | |
|
|
|
|
| Principal | | | Optional Call | | |
| Amount (000) | | Description (1) | Provisions (2) | Ratings (3) | Value |
| | Hawaii (continued) | | | |
| $ 1,175 | | Hawaii Department of Budget and Finance, Special Purpose Revenue Bonds, Hawaii Pacific | 7/23 at 100.00 | BB | $ 1,258,672 |
| | University, Series 2013A, 6.625%, 7/01/33 | | | |
| 5,175 | | Total Hawaii | | | 5,639,272 |
| | Idaho – 0.1% (0.1% of Total Investments) | | | |
| 1,175 | | Idaho Health Facilities Authority, Revenue Bonds, Madison Memorial Hospital Project, | 9/26 at 100.00 | BB+ | 1,313,838 |
| | Refunding Series 2016, 5.000%, 9/01/37 | | | |
| 595 | | Idaho Water Resource Board, Water Resource Loan Program Revenue, Ground Water Rights | 9/22 at 100.00 | A3 | 648,264 |
| | Mitigation Series 2012A, 5.000%, 9/01/32 | | | |
| 1,770 | | Total Idaho | | | 1,962,102 |
| | Illinois – 30.1% (19.2% of Total Investments) | | | |
| 50,000 | | Chicago Board of Education, Illinois, Dedicated Capital Improvement Tax Revenue Bonds, | 4/27 at 100.00 | A | 59,735,500 |
| | Series 2016, 6.000%, 4/01/46 | | | |
| 1,000 | | Chicago Board of Education, Illinois, General Obligation Bonds, Dedicated Revenues | 12/21 at 100.00 | B2 | 1,048,590 |
| | Series 2011A, 5.500%, 12/01/39 | | | |
| 8,400 | | Chicago Board of Education, Illinois, General Obligation Bonds, Dedicated Revenues, | 12/27 at 100.00 | BB– | 10,749,060 |
| | Refunding Series 2017B, 7.000%, 12/01/42, 144A | | | |
| 8,455 | | Chicago Board of Education, Illinois, General Obligation Bonds, Dedicated Revenues, | 12/27 at 100.00 | BB– | 9,601,075 |
| | Refunding Series 2017H, 5.000%, 12/01/36 | | | |
| | Chicago Board of Education, Illinois, General Obligation Bonds, Dedicated Revenues, | | | |
| | Series 2016A: | | | |
| 1,800 | | 7.000%, 12/01/26 | 12/25 at 100.00 | BB– | 2,251,908 |
| 51,780 | | 7.000%, 12/01/44 | 12/25 at 100.00 | BB– | 62,977,425 |
| 6,210 | | Chicago Board of Education, Illinois, General Obligation Bonds, Dedicated Revenues, | 12/27 at 100.00 | BB– | 7,910,484 |
| | Series 2017A, 7.000%, 12/01/46, 144A | | | |
| 450 | | Chicago Board of Education, Illinois, General Obligation Bonds, Series 1999A, 0.000%, | No Opt. Call | BB– | 370,908 |
| | 12/01/26 – NPFG Insured | | | |
| | Chicago Board of Education, Illinois, Unlimited Tax General Obligation Bonds, Dedicated | | | |
| | Tax Revenues, Series 1998B-1: | | | |
| 1,715 | | 0.000%, 12/01/26 – NPFG Insured | No Opt. Call | BB– | 1,413,572 |
| 1,765 | | 0.000%, 12/01/30 – NPFG Insured | No Opt. Call | BB– | 1,250,785 |
| | Chicago Board of Education, Illinois, Unlimited Tax General Obligation Bonds, Dedicated | | | |
| | Tax Revenues, Series 1999A: | | | |
| 2,585 | | 0.000%, 12/01/27 – NPFG Insured | No Opt. Call | BB– | 2,058,927 |
| 8,565 | | 0.010%, 12/01/31 – NPFG Insured | No Opt. Call | BB– | 5,835,591 |
| 4,300 | | Chicago Transit Authority, Illinois, Sales Tax Receipts Revenue Bonds, Series 2011, | 12/21 at 100.00 | A3 | 4,533,490 |
| | 5.250%, 12/01/40 | | | |
| | Chicago, Illinois, General Obligation Bonds, City Colleges, Series 1999: | | | |
| 25,755 | | 0.010%, 1/01/29 – NPFG Insured | No Opt. Call | BBB– | 19,703,090 |
| 8,765 | | 0.000%, 1/01/34 – FGIC Insured | No Opt. Call | BBB– | 5,522,476 |
| 17,310 | | 0.000%, 1/01/37 – FGIC Insured | No Opt. Call | BBB– | 9,622,802 |
| 670 | | Chicago, Illinois, General Obligation Bonds, Neighborhoods Alive 21 Program, Series | 1/25 at 100.00 | Ba1 | 761,971 |
| | 2002B, 5.500%, 1/01/31 | | | |
| 2,695 | | Chicago, Illinois, General Obligation Bonds, Project & Refunding Series 2014A, | 1/24 at 100.00 | Ba1 | 2,918,281 |
| | 5.000%, 1/01/35 | | | |
| 27,095 | | Chicago, Illinois, General Obligation Bonds, Project & Refunding Series 2017A, | 1/27 at 100.00 | BBB– | 32,172,603 |
| | 6.000%, 1/01/38 | | | |
| 2,000 | | Chicago, Illinois, General Obligation Bonds, Project and Refunding Series 2005D, | 1/25 at 100.00 | Ba1 | 2,236,160 |
| | 5.500%, 1/01/40 | | | |
| 305 | | Chicago, Illinois, General Obligation Bonds, Project and Refunding Series 2009C, | 12/19 at 100.00 | Ba1 | 305,735 |
| | 5.000%, 1/01/34 | | | |
| 4,930 | | Chicago, Illinois, General Obligation Bonds, Project Series 2011A, 5.250%, 1/01/35 | 1/21 at 100.00 | Ba1 | 5,062,469 |
76
| | | | | | |
| Principal | | | Optional Call | | |
| Amount (000) | | Description (1) | Provisions (2) | Ratings (3) | Value |
| | Illinois (continued) | | | |
| $ 550 | | Chicago, Illinois, General Obligation Bonds, Project Series 2012A, 5.000%, 1/01/34 | 1/22 at 100.00 | Ba1 | $ 574,844 |
| | Chicago, Illinois, General Obligation Bonds, Refunding Series 2007E: | | | |
| 10,115 | | 5.500%, 1/01/35 | 1/25 at 100.00 | Ba1 | 11,410,226 |
| 5,890 | | 5.500%, 1/01/42 | 1/25 at 100.00 | Ba1 | 6,566,879 |
| 765 | | Chicago, Illinois, General Obligation Bonds, Refunding Series 2016C, 5.000%, 1/01/35 | 1/26 at 100.00 | BBB– | 848,293 |
| 1,610 | | Chicago, Illinois, General Obligation Bonds, Series 1999, 0.000%, 1/01/30 | No Opt. Call | A2 | 1,204,264 |
| | Chicago, Illinois, General Obligation Bonds, Series 2015A: | | | |
| 1,000 | | 5.500%, 1/01/35 | 1/25 at 100.00 | BBB– | 1,128,050 |
| 9,800 | | 5.500%, 1/01/39 | 1/25 at 100.00 | BBB– | 10,973,256 |
| 5,630 | | Chicago, Illinois, Sales Tax Revenue Bonds, Series 2011A, 5.250%, 1/01/38 | 1/22 at 100.00 | N/R (4) | 6,112,998 |
| | (Pre-refunded 1/01/22) | | | |
| 3,095 | | Cook County Forest Preserve District, Illinois, General Obligation Bonds, Personal | 6/22 at 100.00 | A2 | 3,272,591 |
| | Property Replacement Tax Alternate Source, Series 2012C, 5.000%, 12/15/37 – AGM Insured | | | |
| 25,375 | | Cook County, Illinois, General Obligation Bonds, Refunding Series 2010A, | 11/20 at 100.00 | A2 | 26,272,767 |
| | 5.250%, 11/15/33 | | | |
| 800 | | Illinois Finance Authority, Charter School Revenue Bonds, Intrinsic Charter Schools | 12/25 at 100.00 | N/R | 849,504 |
| | Belmont School Project, Series 2015A, 5.500%, 12/01/30, 144A | | | |
| | Illinois Finance Authority, Charter School Revenue Bonds, Uno Charter School Network, | | | |
| | Refunding and Improvement Series 2011A: | | | |
| 1,380 | | 6.875%, 10/01/31 | 10/21 at 100.00 | BB+ | 1,473,633 |
| 2,535 | | 7.125%, 10/01/41 | 10/21 at 100.00 | BB+ | 2,698,736 |
| 2,675 | | Illinois Finance Authority, Revenue Bonds, Columbia College Chicago, Series 2015A, | 12/25 at 100.00 | BBB+ | 2,896,009 |
| | 5.000%, 12/01/37 | | | |
| 5,220 | | Illinois Finance Authority, Revenue Bonds, DePaul University, Series 2011A, 5.750%, | 4/21 at 100.00 | A (4) | 5,549,852 |
| | 10/01/27 (Pre-refunded 4/01/21) | | | |
| 845 | | Illinois Finance Authority, Revenue Bonds, Illinois Wesleyan University, Refunding | 9/26 at 100.00 | Baa1 | 958,948 |
| | Series 2016, 5.000%, 9/01/46 | | | |
| 5,015 | | Illinois Finance Authority, Revenue Bonds, Ingalls Health System, Series 2013, | 5/22 at 100.00 | Baa2 | 5,306,371 |
| | 5.000%, 5/15/43 | | | |
| 20,000 | | Illinois Finance Authority, Revenue Bonds, Northwestern Memorial Healthcare, Series | 1/28 at 100.00 | Aa2 | 23,943,400 |
| | 2017A, 5.000%, 7/15/42 | | | |
| | Illinois Finance Authority, Revenue Bonds, OSF Healthcare System, Refunding | | | |
| | Series 2010A: | | | |
| 330 | | 6.000%, 5/15/39 | 5/20 at 100.00 | A3 | 339,270 |
| 2,030 | | 6.000%, 5/15/39 (Pre-refunded 5/15/20) | 5/20 at 100.00 | N/R (4) | 2,080,933 |
| | Illinois Finance Authority, Revenue Bonds, Rehabilitation Institute of Chicago, | | | |
| | Series 2013A: | | | |
| 415 | | 5.500%, 7/01/28 | 7/23 at 100.00 | A– | 468,062 |
| 905 | | 6.000%, 7/01/43 | 7/23 at 100.00 | A– | 1,019,600 |
| 1,050 | | Illinois Finance Authority, Revenue Bonds, Silver Cross Hospital and Medical Centers, | 8/25 at 100.00 | Baa1 | 1,174,478 |
| | Refunding Series 2015C, 5.000%, 8/15/44 | | | |
| 500 | | Illinois Finance Authority, Revenue Bonds, Southern Illinois Healthcare Enterprises, | 3/20 at 100.00 | A2 (4) | 506,570 |
| | Inc, Series 2005 Remarketed, 5.250%, 3/01/30 (Pre-refunded 3/01/20) – AGM Insured | | | |
| 2,500 | | Illinois Finance Authority, Revenue Bonds, The University of Chicago Medical Center, | 2/21 at 100.00 | AA– (4) | 2,634,175 |
| | Series 2011C, 5.500%, 8/15/41 (Pre-refunded 2/15/21) (UB) (6) | | | |
| 3,000 | | Illinois Finance Authority, Revenue Bonds, University of Chicago, Refunding Series | 10/25 at 100.00 | AA– | 3,458,340 |
| | 2015A, 5.000%, 10/01/46 (UB) (6) | | | |
| 4,125 | | Illinois Finance Authority, Revenue Bonds, University of Chicago, Series 2012A, | 10/21 at 100.00 | AA– | 4,350,142 |
| | 5.000%, 10/01/51 | | | |
| | Illinois State, General Obligation Bonds, April Series 2014: | | | |
| 6,165 | | 5.000%, 4/01/38 | 4/24 at 100.00 | BBB– | 6,633,540 |
| 5,000 | | 5.000%, 4/01/39 | 4/24 at 100.00 | BBB– | 5,373,100 |
77
| | | | | |
| NZF | Nuveen Municipal Credit Income Fund | | |
| Portfolio of Investments (continued) | | | |
|
| October 31, 2019 | | | |
|
|
|
|
| Principal | | | Optional Call | | |
| Amount (000) | | Description (1) | Provisions (2) | Ratings (3) | Value |
| | Illinois (continued) | | | |
| | Illinois State, General Obligation Bonds, February Series 2014: | | | |
| $ 2,010 | | 5.250%, 2/01/30 | 2/24 at 100.00 | BBB– | $ 2,205,995 |
| 3,435 | | 5.250%, 2/01/33 | 2/24 at 100.00 | BBB– | 3,748,856 |
| 3,745 | | 5.250%, 2/01/34 | 2/24 at 100.00 | BBB– | 4,082,424 |
| 6,000 | | 5.000%, 2/01/39 | 2/24 at 100.00 | BBB– | 6,433,080 |
| 8,565 | | Illinois State, General Obligation Bonds, June Series 2016, 5.000%, 6/01/26 | No Opt. Call | BBB– | 9,779,603 |
| | Illinois State, General Obligation Bonds, November Series 2016: | | | |
| 3,100 | | 5.000%, 11/01/35 | 11/26 at 100.00 | BBB– | 3,453,989 |
| 3,000 | | 5.000%, 11/01/37 | 11/26 at 100.00 | BBB– | 3,332,670 |
| 2,400 | | 5.000%, 11/01/40 | 11/26 at 100.00 | BBB– | 2,650,848 |
| 5,795 | | Illinois State, General Obligation Bonds, November Series 2017D, 5.000%, 11/01/28 | 11/27 at 100.00 | BBB– | 6,633,421 |
| 4,900 | | Illinois State, General Obligation Bonds, October Series 2016, 5.000%, 2/01/26 | No Opt. Call | BBB– | 5,569,536 |
| 27,215 | | Illinois State, General Obligation Bonds, Series 2013, 5.500%, 7/01/38 | 7/23 at 100.00 | BBB– | 29,536,984 |
| 7,250 | | Illinois Toll Highway Authority, Toll Highway Revenue Bonds, Senior Lien Series 2013A, | 1/23 at 100.00 | A1 | 7,932,877 |
| | 5.000%, 1/01/38 | | | |
| 2,755 | | Illinois Toll Highway Authority, Toll Highway Revenue Bonds, Senior Lien Series 2015A, | 7/25 at 100.00 | A1 | 3,168,581 |
| | 5.000%, 1/01/40 | | | |
| 560 | | Illinois Toll Highway Authority, Toll Highway Revenue Bonds, Tender Option Bond Trust | 1/23 at 100.00 | A1 | 771,204 |
| | 2015-XF0051, 14.263%, 1/01/38, 144A (IF) | | | |
| 2,500 | | Kane & DeKalb Counties Community Unit School District 301, Illinois, General Obligation | No Opt. Call | Aa2 | 2,329,525 |
| | Bonds, Series 2006, 0.000%, 12/01/23 – NPFG Insured | | | |
| 9,795 | | Lake, Cook, Kane and McHenry Counties Community Unit School District 220, Barrington, | No Opt. Call | A2 | 9,824,189 |
| | Illinois, General Obligation Bonds, Refunding Series 2002, 5.250%, 12/01/19 – AGM Insured (UB) | | | |
| | Mc Henry and Lake Counties Community Consolidated School District 26, Cary, Illinois, | | | |
| | General Obligation Bonds, Series 2011B: | | | |
| 85 | | 6.250%, 2/01/21 (Pre-refunded 2/01/20) – AGM Insured | 2/20 at 100.00 | Aa3 (4) | 86,043 |
| 1,160 | | 6.250%, 2/01/21 (Pre-refunded 2/01/20) – AGM Insured | 2/20 at 100.00 | Aa3 (4) | 1,174,094 |
| | McHenry and Kane Counties Community Consolidated School District 158, Huntley, Illinois, | | | |
| | General Obligation Bonds, Series 2003: | | | |
| 570 | | 0.000%, 1/01/21 – FGIC Insured | No Opt. Call | N/R | 557,984 |
| 745 | | 0.000%, 1/01/21 – NPFG Insured (ETM) | No Opt. Call | N/R (4) | 733,058 |
| | McHenry and Lake Counties Community Consolidated School District 26, Cary, Illinois, | | | |
| | General Obligation Bonds, Series 2011A: | | | |
| 70 | | 6.000%, 2/01/24 (Pre-refunded 2/01/20) – AGM Insured | 2/20 at 100.00 | Aa3 (4) | 70,817 |
| 930 | | 6.000%, 2/01/24 (Pre-refunded 2/01/20) – AGM Insured | 2/20 at 100.00 | Aa3 (4) | 940,742 |
| 70 | | 6.000%, 2/01/25 (Pre-refunded 2/01/20) – AGM Insured | 2/20 at 100.00 | Aa3 (4) | 70,817 |
| 960 | | 6.000%, 2/01/25 (Pre-refunded 2/01/20) – AGM Insured | 2/20 at 100.00 | Aa3 (4) | 971,088 |
| 13,785 | | Metropolitan Pier and Exposition Authority, Illinois, McCormick Place Expansion Project | 6/22 at 100.00 | BBB– | 14,479,764 |
| | Bonds, Refunding Series 2012A, 5.000%, 6/15/42 – NPFG Insured | | | |
| 2,500 | | Metropolitan Pier and Exposition Authority, Illinois, McCormick Place Expansion Project | 6/22 at 100.00 | BBB– | 2,616,900 |
| | Bonds, Refunding Series 2012B, 5.000%, 6/15/52 | | | |
| 5,400 | | Metropolitan Pier and Exposition Authority, Illinois, McCormick Place Expansion Project | 12/25 at 100.00 | BBB– | 5,868,450 |
| | Bonds, Refunding Series 2015B, 5.000%, 6/15/52 | | | |
| | Metropolitan Pier and Exposition Authority, Illinois, McCormick Place Expansion Project | | | |
| | Bonds, Series 2015A: | | | |
| 23,110 | | 0.000%, 12/15/52 | No Opt. Call | BBB– | 6,571,560 |
| 2,455 | | 5.000%, 6/15/53 | 12/25 at 100.00 | BBB– | 2,666,547 |
| 6,000 | | Metropolitan Pier and Exposition Authority, Illinois, McCormick Place Expansion Project | 12/27 at 100.00 | BBB– | 6,644,100 |
| | Bonds, Series 2017A, 5.000%, 6/15/57 | | | |
| | Metropolitan Pier and Exposition Authority, Illinois, McCormick Place Expansion Project | | | |
| | Refunding Bonds, Series 2010A: | | | |
| 2,920 | | 5.500%, 6/15/50 (Pre-refunded 6/15/20) | 6/20 at 100.00 | BBB– (4) | 2,996,884 |
| 9,080 | | 5.500%, 6/15/50 | 6/20 at 100.00 | Ba1 | 9,207,302 |
78
| | | | | | |
| Principal | | | Optional Call | | |
| Amount (000) | | Description (1) | Provisions (2) | Ratings (3) | Value |
| | Illinois (continued) | | | |
| $ 45,000 | | Metropolitan Pier and Exposition Authority, Illinois, Revenue Bonds, McCormick Place | No Opt. Call | BBB– | $ 19,905,750 |
| | Expansion Project, Capital Appreciation Refunding Series 2010B-1, 0.010%, 6/15/43 – AGM Insured | | | |
| | Metropolitan Pier and Exposition Authority, Illinois, Revenue Bonds, McCormick Place | | | |
| | Expansion Project, Refunding Series 1998A: | | | |
| 145 | | 5.500%, 6/15/29 – NPFG Insured (ETM) | No Opt. Call | Baa2 (4) | 173,216 |
| 2,680 | | 5.500%, 6/15/29 – NPFG Insured | No Opt. Call | BBB | 3,258,666 |
| 1,040 | | Metropolitan Pier and Exposition Authority, Illinois, Revenue Bonds, McCormick Place | 12/19 at 100.00 | BBB– | 1,042,860 |
| | Expansion Project, Refunding Series 2002B, 5.550%, 6/15/21 | | | |
| 10,960�� | | Metropolitan Pier and Exposition Authority, Illinois, Revenue Bonds, McCormick Place | 6/20 at 100.00 | Ba1 | 11,097,110 |
| | Expansion Project, Refunding Series 2010B-2, 5.250%, 6/15/50 | | | |
| 1,165 | | Metropolitan Pier and Exposition Authority, Illinois, Revenue Bonds, McCormick Place | No Opt. Call | Baa2 | 1,130,318 |
| | Expansion Project, Series 1993A, 0.000%, 6/15/21 – FGIC Insured | | | |
| | Metropolitan Pier and Exposition Authority, Illinois, Revenue Bonds, McCormick Place | | | |
| | Expansion Project, Series 2002A: | | | |
| 2,195 | | 5.700%, 6/15/24 (Pre-refunded 6/15/22) | 6/22 at 101.00 | N/R (4) | 2,469,068 |
| 7,305 | | 5.700%, 6/15/24 | 6/22 at 101.00 | BBB– | 8,057,999 |
| 8,400 | | 0.000%, 12/15/30 – NPFG Insured | No Opt. Call | BBB– | 6,042,960 |
| 7,940 | | 0.010%, 6/15/33 – NPFG Insured | No Opt. Call | BBB– | 5,179,500 |
| 450 | | 0.010%, 12/15/34 – NPFG Insured | No Opt. Call | BBB– | 277,587 |
| 12,500 | | 0.010%, 6/15/35 – NPFG Insured | No Opt. Call | BBB– | 7,554,000 |
| 10,620 | | 0.010%, 12/15/35 – NPFG Insured | No Opt. Call | BBB– | 6,296,173 |
| 11,505 | | 0.010%, 12/15/36 – NPFG Insured | No Opt. Call | BBB– | 6,549,681 |
| 65,000 | | 0.000%, 12/15/38 – NPFG Insured | No Opt. Call | BBB– | 34,041,150 |
| 38,040 | | 0.000%, 6/15/40 – NPFG Insured | No Opt. Call | BBB– | 18,714,539 |
| 3,720 | | 0.000%, 6/15/41 – NPFG Insured | No Opt. Call | BBB– | 1,752,380 |
| | Quad Cities Regional Economic Development Authority, Illinois, Revenue Bonds, Augustana | | | |
| | College, Series 2012: | | | |
| 480 | | 5.000%, 10/01/25 | 10/22 at 100.00 | Baa1 | 527,448 |
| 400 | | 5.000%, 10/01/26 | 10/22 at 100.00 | Baa1 | 438,248 |
| 780 | | Railsplitter Tobacco Settlement Authority, Illinois, Tobacco Settlement Revenue Bonds, | No Opt. Call | A | 826,457 |
| | Series 2010, 5.250%, 6/01/21 | | | |
| 965 | | Regional Transportation Authority, Cook, DuPage, Kane, Lake, McHenry and Will Counties, | No Opt. Call | A2 | 993,757 |
| | Illinois, General Obligation Bonds, Series 1990A, 7.200%, 11/01/20 – AMBAC Insured | | | |
| 11,690 | | Sales Tax Securitization Corporation, Illinois, Sales Tax Securitization Bonds, Series | 1/28 at 100.00 | AA– | 13,554,204 |
| | 2018A, 5.000%, 1/01/37 | | | |
| 3,815 | | Southwestern Illinois Development Authority, Environmental Improvement Revenue Bonds, US | 8/22 at 100.00 | B3 | 3,943,375 |
| | Steel Corporation Project, Series 2012, 5.750%, 8/01/42 (AMT) | | | |
| 1,580 | | University of Illinois, Health Services Facilities System Revenue Bonds, Series 2013, | 10/23 at 100.00 | Baa1 | 1,800,015 |
| | 6.000%, 10/01/32 | | | |
| 11,350 | | Will County Community High School District 210 Lincoln-Way, Illinois, General Obligation | No Opt. Call | A2 | 10,361,642 |
| | Bonds, Series 2006, 0.000%, 1/01/24 – AGM Insured | | | |
| 787,460 | | Total Illinois | | | 711,219,768 |
| | Indiana – 3.5% (2.3% of Total Investments) | | | |
| | Carmel Redevelopment Authority, Indiana, Lease Rent Revenue Bonds, Series 2005: | | | |
| 1,950 | | 0.000%, 2/01/24 | No Opt. Call | Aa3 | 1,819,837 |
| 2,705 | | 0.000%, 2/01/25 | No Opt. Call | Aa3 | 2,472,289 |
| 4,400 | | Crown Point Multi-School Building Corporation, Indiana, First Mortgage Bonds, Crown | No Opt. Call | Baa2 | 4,128,344 |
| | Point Community School Corporation, Series 2000, 0.000%, 1/15/24 – NPFG Insured | | | |
| 680 | | Indiana Finance Authority, Educational Facilities Revenue Bonds, Butler University | 2/22 at 100.00 | A– | 729,878 |
| | Project, Refunding Series 2012B, 5.000%, 2/01/29 | | | |
| 1,050 | | Indiana Finance Authority, Educational Facilities Revenue Bonds, Drexel Foundation For | 12/19 at 100.00 | B | 1,051,554 |
| | Educational Excellence, Inc, Series 2009A, 7.000%, 10/01/39 | | | |
| 520 | | Indiana Finance Authority, Environmental Improvement Revenue Bonds, United States Steel | 6/20 at 100.00 | B3 | 528,596 |
| | Corporation Project, Refunding Series 2010, 6.000%, 12/01/26 | | | |
79
| | | | | |
| NZF | Nuveen Municipal Credit Income Fund | | |
| Portfolio of Investments (continued) | | | |
| | | | | |
| October 31, 2019 | | | |
|
|
|
| Principal | | | Optional Call | | |
| Amount (000) | | Description (1) | Provisions (2) | Ratings (3) | Value |
| | Indiana (continued) | | | |
| $ 1,230 | | Indiana Finance Authority, Environmental Improvement Revenue Bonds, United States Steel | 8/22 at 100.00 | B3 | $ 1,271,389 |
| | Corporation Project, Series 2012, 5.750%, 8/01/42 (AMT) | | | |
| 1,815 | | Indiana Finance Authority, Hospital Revenue Bonds, Community Health Network Project, | 5/23 at 100.00 | A | 1,976,571 |
| | Series 2012A, 5.000%, 5/01/42 | | | |
| 1,500 | | Indiana Finance Authority, Hospital Revenue Bonds, Floyd Memorial Hospital and Health | 3/20 at 100.00 | N/R (4) | 1,519,020 |
| | Services Project, Refunding Series 2010, 5.125%, 3/01/30 (Pre-refunded 3/02/20) | | | |
| 9,300 | | Indiana Finance Authority, Hospital Revenue Bonds, Major Hospital Project, Series 2014A, | 10/23 at 100.00 | Baa3 | 10,006,521 |
| | 5.000%, 10/01/44 | | | |
| | Indiana Finance Authority, Private Activity Bonds, Ohio River Bridges East End Crossing | | | |
| | Project, Series 2013A: | | | |
| 5,380 | | 5.000%, 7/01/44 (AMT) | 7/23 at 100.00 | BBB+ | 5,856,291 |
| 5,100 | | 5.000%, 7/01/48 (AMT) | 7/23 at 100.00 | BBB+ | 5,538,753 |
| 5,370 | | 5.250%, 1/01/51 (AMT) | 7/23 at 100.00 | BBB+ | 5,876,284 |
| 6,730 | | Indiana Finance Authority, Revenue Bonds, Trinity Health Care Group, Refunding Series | 12/19 at 100.00 | AA– (4) | 6,750,459 |
| | 2009A, 5.250%, 12/01/38 (Pre-refunded 12/01/19) | | | |
| 6,700 | | Indiana Finance Authority, Wastewater Utility Revenue Bonds, CWA Authority Project, | 10/21 at 100.00 | A1 | 7,123,373 |
| | Series 2011B, 5.000%, 10/01/41 | | | |
| 13,000 | | Indiana Finance Authority, Water Utility Revenue Bonds, Citizens Energy Group Project, | 10/24 at 100.00 | A+ | 14,802,710 |
| | First Lien Series 2014A, 5.000%, 10/01/44 | | | |
| 10,000 | | Indianapolis Local Public Improvement Bond Bank, Indiana, Series 1999E, 0.000%, 2/01/26 – | No Opt. Call | AA– | 9,012,600 |
| | AMBAC Insured | | | |
| 1,000 | | Merrillville, Indiana, Economic Development Revenue Bonds, Belvedere Housing Project, | 4/24 at 102.00 | N/R | 1,002,060 |
| | Series 2016, 5.750%, 4/01/36 | | | |
| 1,250 | | Shoals, Indiana, Exempt Facilities Revenue Bonds, National Gypsum Company Project, | 11/23 at 100.00 | N/R | 1,386,825 |
| | Series 2013, 7.250%, 11/01/43 (AMT) | | | |
| 830 | | Valparaiso, Indiana, Exempt Facilities Revenue Bonds, Pratt Paper LLC Project, Series | 1/24 at 100.00 | N/R | 970,668 |
| | 2013, 7.000%, 1/01/44 (AMT) | | | |
| 80,510 | | Total Indiana | | | 83,824,022 |
| | Iowa – 1.2% (0.8% of Total Investments) | | | |
| 1,255 | | Iowa Finance Authority, Iowa, Midwestern Disaster Area Revenue Bonds, Iowa Fertilizer | 12/23 at 100.00 | B– | 1,366,544 |
| | Company Project, Series 2013, 5.250%, 12/01/25 | | | |
| 1,470 | | Iowa Finance Authority, Iowa, Midwestern Disaster Area Revenue Bonds, Iowa Fertilizer | 11/19 at 105.00 | B– | 1,545,176 |
| | Company Project, Series 2016, 5.875%, 12/01/27, 144A | | | |
| 1,710 | | Iowa Finance Authority, Iowa, Midwestern Disaster Area Revenue Bonds, Iowa Fertilizer | 12/22 at 103.00 | B+ | 1,827,477 |
| | Company Project, Series 2013A, 5.250%, 12/01/50 (Mandatory Put 12/01/33) | | | |
| 1,630 | | Iowa Higher Education Loan Authority, Private College Facility Revenue Bonds, University | 10/21 at 100.00 | BBB | 1,724,784 |
| | of Dubuque Project, Refunding Series 2011, 6.000%, 10/01/31 | | | |
| 1,900 | | Iowa Higher Education Loan Authority, Private College Facility Revenue Bonds, Upper Iowa | 9/23 at 100.00 | N/R (4) | 2,175,234 |
| | University Project, Series 2012, 5.000%, 9/01/43 (Pre-refunded 9/01/23) | | | |
| 1,620 | | Iowa Student Loan Liquidity Corporation, Student Loan Revenue Bonds, Refunding Series | 12/19 at 100.00 | AAA | 1,625,346 |
| | 2009-2, 5.500%, 12/01/25 | | | |
| | Iowa Tobacco Settlement Authority, Asset Backed Settlement Revenue Bonds, Series 2005C: | | | |
| 6,425 | | 5.375%, 6/01/38 | 12/19 at 100.00 | B– | 6,426,285 |
| 525 | | 5.500%, 6/01/42 | 12/19 at 100.00 | B– | 525,100 |
| 5,045 | | 5.625%, 6/01/46 | 12/19 at 100.00 | B– | 5,045,908 |
| 6,590 | | Iowa Tobacco Settlement Authority, Tobacco Asset-Backed Revenue Bonds, Series 2005B, | 12/19 at 100.00 | B– | 6,598,501 |
| | 5.600%, 6/01/34 | | | |
| 28,170 | | Total Iowa | | | 28,860,355 |
80
| | | | | | |
| Principal | | | Optional Call | | |
| Amount (000) | | Description (1) | Provisions (2) | Ratings (3) | Value |
| | Kansas – 0.4% (0.2% of Total Investments) | | | |
| | Johnson/Miami County Unified School District 230 Spring Hill, Kansas, General Obligation | | | |
| | Bonds, Series 2011A: | | | |
| $ 2,000 | | 5.000%, 9/01/26 | 9/21 at 100.00 | Aa3 | $ 2,131,500 |
| 1,000 | | 5.000%, 9/01/27 | 9/21 at 100.00 | Aa3 | 1,063,880 |
| 2,000 | | Kansas Development Finance Authority, Hospital Revenue Bonds, Adventist Health | 5/22 at 100.00 | AA | 2,167,940 |
| | System/Sunbelt Obligated Group, Series 2012A, 5.000%, 11/15/28 | | | |
| 1,485 | | Kansas State Power Pool, Electric Utility Revenue Bonds, Dogwood Energy Facility, Series | 12/20 at 100.00 | A3 (4) | 1,545,083 |
| | 2012A, 5.000%, 12/01/31 (Pre-refunded 12/01/20) | | | |
| 1,605 | | Overland Park Development Corporation, Kansas, Revenue Bonds, Overland Park Convention | 12/19 at 100.00 | Ba3 | 1,607,712 |
| | Center, First Tier Series 2007A, 5.125%, 1/01/22 – AMBAC Insured | | | |
| 400 | | Overland Park Transportation Development District, Kansas, Sales Tax Revenue Bonds, Oak | 4/20 at 100.00 | BBB | 404,888 |
| | Park Mall Project, Series 2010, 5.900%, 4/01/32 | | | |
| 8,490 | | Total Kansas | | | 8,921,003 |
| | Kentucky – 2.3% (1.5% of Total Investments) | | | |
| | Christian County, Kentucky, Hospital Revenue Bonds, Jennie Stuart Medical Center, | | | |
| | Series 2016: | | | |
| 5,000 | | 5.375%, 2/01/36 | 2/26 at 100.00 | BB+ | 5,648,200 |
| 435 | | 5.500%, 2/01/44 | 2/26 at 100.00 | BB+ | 488,109 |
| 1,000 | | Kentucky Economic Development Finance Authority, Hospital Revenue Bonds, Owensboro | 6/20 at 100.00 | BB+ (4) | 1,027,180 |
| | Medical Health System, Series 2010A, 6.000%, 6/01/30 (Pre-refunded 6/01/20) | | | |
| 6,015 | | Kentucky Economic Development Finance Authority, Hospital Revenue Bonds, Owensboro | 6/20 at 100.00 | BB+ (4) | 6,191,360 |
| | Medical Health System, Series 2010B, 6.375%, 3/01/40 (Pre-refunded 6/01/20) | | | |
| | Kentucky Economic Development Finance Authority, Kentucky, Healthcare Facilities Revenue | | | |
| | Bonds, Rosedale Green Project, Refunding Series 2015: | | | |
| 500 | | 5.750%, 11/15/45 | 11/25 at 100.00 | N/R | 536,500 |
| 2,250 | | 5.750%, 11/15/50 | 11/25 at 100.00 | N/R | 2,408,085 |
| 6,385 | | Kentucky Economic Development Finance Authority, Revenue Bonds, CommonSpirit Health, | 8/29 at 100.00 | BBB+ | 7,554,221 |
| | Series 2019A-1, 5.000%, 8/01/44 | | | |
| 5,000 | | Kentucky Economic Development Finance Authority, Revenue Bonds, CommonSpirit Health, | 8/29 at 100.00 | BBB+ | 5,915,450 |
| | Series 2019A-2, 5.000%, 8/01/44 | | | |
| | Kentucky Economic Development Finance Authority, Revenue Bonds, Next Generation Kentucky | | | |
| | Information Highway Project, Senior Series 2015A: | | | |
| 2,130 | | 5.000%, 7/01/40 | 7/25 at 100.00 | Baa2 | 2,342,489 |
| 2,940 | | 5.000%, 1/01/45 | 7/25 at 100.00 | Baa2 | 3,220,505 |
| | Kentucky Public Transportation Infrastructure Authority, First Tier Toll Revenue Bonds, | | | |
| | Downtown Crossing Project, Convertible Capital Appreciation Series 2013C: | | | |
| 1,335 | | 0.000%, 7/01/43 (5) | 7/31 at 100.00 | Baa3 | 1,447,714 |
| 2,295 | | 0.000%, 7/01/46 (5) | 7/31 at 100.00 | Baa3 | 2,493,885 |
| | Kentucky Public Transportation Infrastructure Authority, First Tier Toll Revenue Bonds, | | | |
| | Downtown Crossing Project, Series 2013A: | | | |
| 3,080 | | 5.750%, 7/01/49 | 7/23 at 100.00 | Baa3 | 3,450,678 |
| 615 | | 6.000%, 7/01/53 | 7/23 at 100.00 | Baa3 | 695,996 |
| 5,400 | | Lexington-Fayette Urban County Government Public Facilities Corporation, Kentucky State | 6/21 at 100.00 | A– | 5,679,126 |
| | Lease Revenue Bonds, Eastern State Hospital Project, Series 2011A, 5.250%, 6/01/29 | | | |
| | Pikeville, Kentucky, Hospital Revenue Bonds, Pikeville Medical Center, Inc Project, | | | |
| | Improvement and Refunding Series 2011: | | | |
| 500 | | 6.250%, 3/01/31 (Pre-refunded 3/01/21) | 3/21 at 100.00 | Baa2 (4) | 532,945 |
| 4,500 | | 6.250%, 3/01/31 | 3/21 at 100.00 | Baa2 | 4,727,745 |
| 215 | | Warren County, Kentucky, Hospital Revenue Bonds, Bowling Green-Warren County Community | 10/22 at 100.00 | A+ | 227,711 |
| | Hospital Corporation, Series 2012A, 4.000%, 10/01/29 | | | |
| 49,595 | | Total Kentucky | | | 54,587,899 |
81
| | | | | |
| NZF | Nuveen Municipal Credit Income Fund | | |
| Portfolio of Investments (continued) | | | |
| | | | | |
| October 31, 2019 | | | |
|
|
|
| Principal | | | Optional Call | | |
| Amount (000) | | Description (1) | Provisions (2) | Ratings (3) | Value |
| | Louisiana – 1.4% (0.9% of Total Investments) | | | |
| $ 2,000 | | Jefferson Parish Hospital Service District 2, Louisiana, Hospital Revenue Bonds, East | 7/21 at 100.00 | Caa1 | $ 2,044,960 |
| | Jefferson General Hospital, Refunding Series 2011, 6.375%, 7/01/41 | | | |
| 6,930 | | Louisiana Public Facilities Authority, Dock and Wharf Revenue Bonds, Impala Warehousing | 7/23 at 100.00 | N/R | 7,625,148 |
| | (US) LLC Project, Series 2013, 6.500%, 7/01/36, 144A (AMT) | | | |
| | Louisiana Public Facilities Authority, Hospital Revenue Bonds, Franciscan Missionaries | | | |
| | of Our Lady Health System, Refunding Series 2015A: | | | |
| 10 | | 5.000%, 7/01/39 (Pre-refunded 7/01/25) | 7/25 at 100.00 | N/R (4) | 12,006 |
| 1,450 | | 5.000%, 7/01/39 | 7/25 at 100.00 | A | 1,645,010 |
| 5,000 | | Louisiana Public Facilities Authority, Revenue Bonds, Ochsner Clinic Foundation Project, | 5/27 at 100.00 | A3 | 5,764,900 |
| | Refunding Series 2017, 5.000%, 5/15/46 | | | |
| 4,425 | | Louisiana Public Facilities Authority, Revenue Bonds, Ochsner Clinic Foundation Project, | 5/21 at 100.00 | A3 (4) | 4,794,222 |
| | Series 2011, 6.750%, 5/15/41 (Pre-refunded 5/15/21) | | | |
| 1,060 | | Louisiana Public Facilities Authority, Revenue Bonds, Southwest Louisiana Charter | 12/23 at 100.00 | N/R | 1,125,921 |
| | Academy Foundation Project, Series 2013A, 8.375%, 12/15/43 | | | |
| 2,235 | | Louisiana Stadium and Exposition District, Revenue Refunding Bonds, Senior Lien Series | 7/23 at 100.00 | A2 | 2,485,342 |
| | 2013A, 5.000%, 7/01/36 | | | |
| 5,100 | | New Orleans Aviation Board, Louisiana, General Airport Revenue Bonds, North Terminal | 1/25 at 100.00 | A– | 5,689,152 |
| | Project, Series 2015B, 5.000%, 1/01/45 (AMT) | | | |
| 2,560 | | New Orleans, Louisiana, Sewerage Service Revenue Bonds, Refunding Series 2014, | 6/24 at 100.00 | A– | 2,889,037 |
| | 5.000%, 6/01/44 | | | |
| 30,770 | | Total Louisiana | | | 34,075,698 |
| | Maine – 0.6% (0.4% of Total Investments) | | | |
| 4,965 | | Maine Health and Higher Educational Facilities Authority Revenue Bonds, Eastern Maine | 7/26 at 100.00 | Ba1 | 5,534,535 |
| | Medical Center Obligated Group Issue, Series 2016A, 5.000%, 7/01/46 | | | |
| 2,750 | | Maine Health and Higher Educational Facilities Authority Revenue Bonds, MaineHealth | 7/28 at 100.00 | A+ | 3,276,240 |
| | Issue, Series 2018A, 5.000%, 7/01/43 | | | |
| | Maine Health and Higher Educational Facilities Authority, Revenue Bonds, Maine General | | | |
| | Medical Center, Series 2011: | | | |
| 2,000 | | 6.750%, 7/01/36 | 7/21 at 100.00 | Ba3 | 2,149,340 |
| 1,050 | | 6.750%, 7/01/41 | 7/21 at 100.00 | Ba3 | 1,125,117 |
| 1,250 | | Maine Health and Higher Educational Facilities Authority, Revenue Bonds, Series 2010A, | 7/20 at 100.00 | A1 | 1,278,013 |
| | 5.000%, 7/01/40 | | | |
| 12,015 | | Total Maine | | | 13,363,245 |
| | Maryland – 0.5% (0.4% of Total Investments) | | | |
| 2,000 | | Maryland Economic Development Corporation, Revenue Bonds, Chesapeake Bay Hyatt | 12/19 at 100.00 | N/R | 1,267,500 |
| | Conference Center, Series 2006A, 5.000%, 12/01/31 (7) | | | |
| 7,145 | | Maryland Health and Higher Educational Facilities Authority, Revenue Bonds, Adventist | 1/27 at 100.00 | Baa3 | 8,362,794 |
| | Healthcare, Series 2016A, 5.500%, 1/01/46 | | | |
| 555 | | Maryland Health and Higher Educational Facilities Authority, Revenue Bonds, Mercy Ridge | 11/19 at 100.00 | A | 555,810 |
| | Retirement Community, Series 2007, 4.750%, 7/01/34 | | | |
| 2,000 | | Maryland Health and Higher Educational Facilities Authority, Revenue Bonds, Peninsula | 7/24 at 100.00 | A3 | 2,248,380 |
| | Regional Medical Center Issue, Refunding Series 2015, 5.000%, 7/01/45 | | | |
| 355 | | Prince George’s County Revenue Authority, Maryland, Special Obligation Bonds, | 1/26 at 100.00 | N/R | 379,633 |
| | Suitland-Naylor Road Project, Series 2016, 5.000%, 7/01/46, 144A | | | |
| 12,055 | | Total Maryland | | | 12,814,117 |
| | Massachusetts – 2.0% (1.3% of Total Investments) | | | |
| 8,825 | | Massachusetts Department of Transportation, Metropolitan Highway System Revenue Bonds, | 1/20 at 100.00 | A2 | 8,878,744 |
| | Refunding Senior Lien Series 2010B, 5.000%, 1/01/32 | | | |
| 475 | | Massachusetts Development Finance Agency, Revenue Bonds, Boston Medical Center Issue, | 7/25 at 100.00 | BBB | 534,503 |
| | Green Bonds, Series 2015D, 5.000%, 7/01/44 | | | |
82
| | | | | | |
| Principal | | | Optional Call | | |
| Amount (000) | | Description (1) | Provisions (2) | Ratings (3) | Value |
| | Massachusetts (continued) | | | |
| $ 1,525 | | Massachusetts Development Finance Agency, Revenue Bonds, Emerson College, Series 2015, | 1/25 at 100.00 | Baa2 | $ 1,631,094 |
| | 4.500%, 1/01/45 | | | |
| 22,345 | | Massachusetts Educational Financing Authority, Education Loan Revenue Bonds, Series | 7/24 at 100.00 | A | 23,227,404 |
| | 2016J, 3.500%, 7/01/33 (AMT) | | | |
| 400 | | Massachusetts Port Authority, Special Facilities Revenue Bonds, ConRac Project, Series | 7/21 at 100.00 | A3 | 422,740 |
| | 2011A, 5.125%, 7/01/41 | | | |
| 4,560 | | Massachusetts School Building Authority, Dedicated Sales Tax Revenue Bonds, Senior | 5/23 at 100.00 | Aa2 | 5,081,618 |
| | Series 2013A, 5.000%, 5/15/43 | | | |
| 7,175 | | Metropolitan Boston Transit Parking Corporation, Massachusetts, Systemwide Parking Revenue | 7/21 at 100.00 | A+ | 7,579,670 |
| | Bonds, Senior Lien Series 2011, 5.000%, 7/01/41 | | | |
| 45,305 | | Total Massachusetts | | | 47,355,773 |
| | Michigan – 2.4% (1.5% of Total Investments) | | | |
| | Detroit Academy of Arts and Sciences, Michigan, Public School Academy Revenue Bonds, | | | |
| | Refunding Series 2013: | | | |
| 880 | | 6.000%, 10/01/33 | 10/23 at 100.00 | N/R | 896,157 |
| 1,250 | | 6.000%, 10/01/43 | 10/23 at 100.00 | N/R | 1,259,425 |
| 15,000 | | Detroit City School District, Wayne County, Michigan, Unlimited Tax School Building and | No Opt. Call | AA | 18,823,650 |
| | Site Improvement Bonds, Series 2001A, 6.000%, 5/01/29 – AGM Insured (UB) | | | |
| 1,930 | | Detroit Water and Sewerage Department, Michigan, Sewage Disposal System Revenue Bonds, | 7/22 at 100.00 | A2 | 2,094,687 |
| | Refunding Senior Lien Series 2012A, 5.250%, 7/01/39 | | | |
| 5 | | Detroit, Michigan, Second Lien Sewerage Disposal System Revenue Bonds, Series 2005A, | 12/19 at 100.00 | A3 | 5,011 |
| | 4.500%, 7/01/35 – NPFG Insured | | | |
| 3,000 | | Detroit, Michigan, Senior Lien Sewerage Disposal System Revenue Bonds, Series 2001B, | No Opt. Call | A3 | 3,764,280 |
| | 5.500%, 7/01/29 – NPFG Insured | | | |
| 5 | | Detroit, Michigan, Sewer Disposal System Revenue Bonds, Second Lien, Series 2006B, | 12/19 at 100.00 | A3 | 5,013 |
| | 5.000%, 7/01/36 – FGIC Insured | | | |
| 2,000 | | Detroit, Michigan, Water Supply System Revenue Bonds, Senior Lien Series 2011A, | 7/21 at 100.00 | A2 | 2,113,380 |
| | 5.250%, 7/01/41 | | | |
| 2,000 | | Grand Traverse County Hospital Finance Authority, Michigan, Revenue Bonds, Munson | 7/24 at 100.00 | A1 | 2,206,440 |
| | Healthcare, Series 2014A, 5.000%, 7/01/47 | | | |
| 1,500 | | Jackson County Hospital Finance Authority, Michigan, Hospital Revenue Bonds, WA Foote | 6/20 at 100.00 | AA (4) | 1,533,600 |
| | Memorial Hospital, Refunding Series 2006B-2, 5.000%, 6/01/27 (Pre-refunded 6/01/20) – | | | |
| | AGM Insured | | | |
| | Kalamazoo Hospital Finance Authority, Michigan, Hospital Revenue Bonds, Bronson | | | |
| | Methodist Hospital, Refunding Series 2010: | | | |
| 3,080 | | 5.500%, 5/15/36 | 5/20 at 100.00 | A2 | 3,150,162 |
| 3,800 | | 5.500%, 5/15/36 (Pre-refunded 5/15/20) | 5/20 at 100.00 | N/R (4) | 3,885,538 |
| 3,580 | | Lansing Board of Water and Light, Michigan, Utility System Revenue Bonds, Series 2011A, | 7/21 at 100.00 | AA– | 3,814,776 |
| | 5.500%, 7/01/41 | | | |
| 1,000 | | Michigan Finance Authority, Local Government Loan Program Revenue Bonds, Detroit Water & | 7/24 at 100.00 | A3 | 1,134,190 |
| | Sewerage Department Water Supply System Local Project, Series 2014D-6, 5.000%, 7/01/36 – | | | |
| | NPFG Insured | | | |
| | Michigan Finance Authority, Revenue Bonds, Trinity Health Credit Group, Refunding | | | |
| | Series 2011MI: | | | |
| 20 | | 5.000%, 12/01/39 (Pre-refunded 12/01/21) | 12/21 at 100.00 | N/R (4) | 21,548 |
| 4,980 | | 5.000%, 12/01/39 | 12/21 at 100.00 | AA– | 5,320,084 |
| 2,250 | | Michigan State Building Authority, Revenue Bonds, Facilities Program, Refunding Series | 10/21 at 100.00 | AA– | 2,413,800 |
| | 2011-I-A, 5.375%, 10/15/41 | | | |
| 1,525 | | Michigan Tobacco Settlement Finance Authority, Tobacco Settlement Asset-Backed Revenue | 11/19 at 100.00 | B2 | 1,541,470 |
| | Bonds, Series 2008A, 6.875%, 6/01/42 | | | |
| 2,000 | | Wayne County Airport Authority, Michigan, Revenue Bonds, Detroit Metropolitan Wayne | 12/22 at 100.00 | A | 2,196,020 |
| | County Airport, Series 2012A, 5.000%, 12/01/37 | | | |
| 49,805 | | Total Michigan | | | 56,179,231 |
83
| | | | | |
| NZF | Nuveen Municipal Credit Income Fund | | |
| Portfolio of Investments (continued) | | | |
|
| October 31, 2019 | | | |
|
|
|
|
| Principal | | | Optional Call | | |
| Amount (000) | | Description (1) | Provisions (2) | Ratings (3) | Value |
| | Minnesota – 0.8% (0.5% of Total Investments) | | | |
| $ 700 | | City of Ham Lake, Minnesota, Charter School Lease Revenue Bonds, DaVinci Academy | 7/24 at 102.00 | N/R | $ 735,518 |
| | Project, Series 2016A, 5.000%, 7/01/47 | | | |
| 1,500 | | Forest Lake, Minnesota, Charter School Lease Revenue Bonds, Lakes International Language | 8/22 at 102.00 | BB+ | 1,607,325 |
| | Academy, Series 2014A, 5.750%, 8/01/44 | | | |
| 795 | | Minneapolis, Minnesota, Charter School Lease Revenue Bonds, Hiawatha Academies Project, | 7/24 at 102.00 | N/R | 856,485 |
| | Series 2016A, 5.000%, 7/01/36 | | | |
| | Saint Paul Housing & Redevelopment Authority, Minnesota, Charter School Lease Revenue | | | |
| | Bonds, Hmong College Prep Academy Project, Series 2016A: | | | |
| 750 | | 5.750%, 9/01/46 | 9/26 at 100.00 | BB+ | 830,497 |
| 4,000 | | 6.000%, 9/01/51 | 9/26 at 100.00 | BB+ | 4,475,960 |
| 5,265 | | Saint Paul Housing and Redevelopment Authority, Minnesota, Health Care Facility Revenue | 7/25 at 100.00 | A2 | 6,025,845 |
| | Bonds, HealthPartners Obligated Group, Refunding Series 2015A, 5.000%, 7/01/33 | | | |
| 4,250 | | Saint Paul Port Authority, Minnesota, Lease Revenue Bonds, Regions Hospital Parking Ramp | 12/19 at 100.00 | N/R | 4,258,245 |
| | Project, Series 2007-1, 5.000%, 8/01/36 | | | |
| 17,260 | | Total Minnesota | | | 18,789,875 |
| | Missouri – 2.1% (1.3% of Total Investments) | | | |
| 1,400 | | Bi-State Development Agency of the Missouri-Illinois Metropolitan District, Mass Transit | 10/22 at 100.00 | Aa2 | 1,535,968 |
| | Sales Tax Appropriation Bonds, Refunding Combined Lien Series 2013A, 5.000%, 10/01/44 | | | |
| 1,140 | | Cape Girardeau County Industrial Development Authority, Missouri, Health Facilities | 3/23 at 103.00 | BBB– | 1,304,958 |
| | Revenue Bonds, Southeasthealth, Series 2016A, 6.000%, 3/01/33 | | | |
| 890 | | Hanley Road Corridor Transportation Development District, Brentwood and Maplewood, | 12/19 at 100.00 | A– | 892,314 |
| | Missouri, Transportation Sales Revenue Bonds, Refunding Series 2009A, 5.875%, 10/01/36 | | | |
| 135 | | Kansas City Industrial Development Authority, Missouri, Sales Tax Revenue Bonds, Ward | 4/26 at 100.00 | N/R | 139,703 |
| | Parkway Center Community Improvement District, Senior Refunding & Improvement Series 2016, | | | |
| | 5.000%, 4/01/46, 144A | | | |
| 12,005 | | Kansas City Municipal Assistance Corporation, Missouri, Leasehold Revenue Bonds, Series | No Opt. Call | A1 | 9,647,818 |
| | 2004B-1, 0.000%, 4/15/29 – AMBAC Insured | | | |
| 650 | | Land Clearance for Redevelopment Authority of Kansas City, Missouri, Project Revenue | 2/28 at 100.00 | N/R | 717,782 |
| | Bonds, Convention Center Hotel Project – TIF Financing, Series 2018B, 5.000%, 2/01/40, 144A | | | |
| 1,000 | | Liberty Public School District 53, Clay County, Missouri, Lease Participation | 4/22 at 100.00 | AA– | 1,080,570 |
| | Certificates, School Boards Association, Series 2014, 5.000%, 4/01/31 | | | |
| | Liberty, Missouri, Special Obligation Tax Increment and Special Districts Bonds, Liberty | | | |
| | Commons Project, Series 2015A: | | | |
| 1,560 | | 5.125%, 6/01/25, 144A | No Opt. Call | N/R | 1,592,900 |
| 3,810 | | 5.750%, 6/01/35, 144A | 6/25 at 100.00 | N/R | 3,895,344 |
| 3,695 | | 6.000%, 6/01/46, 144A | 6/25 at 100.00 | N/R | 3,798,534 |
| | Missouri Health and Educational Facilities Authority, Educational Facilities Revenue | | | |
| | Bonds, Kansas City University of Medicine and Biosciences, Series 2013A: | | | |
| 1,590 | | 5.000%, 6/01/30 | 6/23 at 100.00 | A1 | 1,774,758 |
| 2,700 | | 5.000%, 6/01/33 | 6/23 at 100.00 | A1 | 3,011,580 |
| 665 | | Missouri Health and Educational Facilities Authority, Educational Facilities Revenue | 5/23 at 100.00 | BBB | 718,167 |
| | Bonds, Saint Louis College of Pharmacy, Series 2013, 5.250%, 5/01/33 | | | |
| 505 | | Missouri Health and Educational Facilities Authority, Educational Facilities Revenue | 10/23 at 100.00 | A+ | 568,883 |
| | Bonds, University of Central Missouri, Series 2013C-2, 5.000%, 10/01/34 | | | |
| | Missouri Health and Educational Facilities Authority, Health Facilities Revenue Bonds, | | | |
| | CoxHealth, Series 2013A: | | | |
| 50 | | 5.000%, 11/15/44 | 11/23 at 100.00 | A2 | 54,605 |
| 6,930 | | 5.000%, 11/15/48 | 11/23 at 100.00 | A2 | 7,557,096 |
| 2,000 | | Missouri Health and Educational Facilities Authority, Health Facilities Revenue Bonds, | 11/24 at 100.00 | AA– | 2,254,340 |
| | Mercy Health, Series 2014F, 5.000%, 11/15/45 | | | |
| 2,500 | | Missouri Health and Educational Facilities Authority, Revenue Bonds, Washington | 11/21 at 100.00 | AA+ | 2,675,525 |
| | University, Series 2011B, 5.000%, 11/15/37 | | | |
84
| | | | | | |
| Principal | | | Optional Call | | |
| Amount (000) | | Description (1) | Provisions (2) | Ratings (3) | Value |
| | Missouri (continued) | | | |
| | Saint Louis County Industrial Development Authority, Missouri, Health Facilities Revenue | | | |
| | Bonds, Ranken-Jordan Project, Refunding & Improvement Series 2016: | | | |
| $ 1,275 | | 5.000%, 11/15/41 | 11/25 at 100.00 | N/R | $ 1,408,786 |
| 1,105 | | 5.000%, 11/15/46 | 11/25 at 100.00 | N/R | 1,215,202 |
| 430 | | Saint Louis County Industrial Development Authority, Missouri, Revenue Bonds, Friendship | 9/23 at 100.00 | BB+ | 478,452 |
| | Village of Sunset Hills, Series 2013A, 5.875%, 9/01/43 | | | |
| | Saint Louis County Industrial Development Authority, Missouri, Revenue Bonds, Saint | | | |
| | Andrew’s Resources for Seniors, Series 2015A: | | | |
| 450 | | 5.000%, 12/01/35 | 12/25 at 100.00 | N/R | 495,171 |
| 130 | | 5.125%, 12/01/45 | 12/25 at 100.00 | N/R | 141,987 |
| 945 | | Stoddard County Industrial Development Authority, Missouri, Health Facility Revenue | 3/23 at 103.00 | BBB– | 1,076,931 |
| | Bonds, Southeasthealth, Series 2016B, 6.000%, 3/01/37 | | | |
| 700 | | The Industrial Development Authority of the City of Saint Louis, Missouri, Development | 11/26 at 100.00 | N/R | 763,679 |
| | Financing Revenue Bonds, Ballpark Village Development Project, Series 2017A, 4.750%, 11/15/47 | | | |
| 48,260 | | Total Missouri | | | 48,801,053 |
| | Nebraska – 0.6% (0.4% of Total Investments) | | | |
| 580 | | Douglas County Hospital Authority 2, Nebraska, Health Facilities Revenue Bonds, Nebraska | 11/25 at 100.00 | A | 658,254 |
| | Methodist Health System, Refunding Series 2015, 5.000%, 11/01/45 | | | |
| | Douglas County Hospital Authority 2, Nebraska, Hospital Revenue Bonds, Madonna | | | |
| | Rehabilitation Hospital Project, Series 2014: | | | |
| 1,930 | | 5.000%, 5/15/27 | 5/24 at 100.00 | A– | 2,188,794 |
| 3,000 | | 5.000%, 5/15/36 | 5/24 at 100.00 | A– | 3,343,050 |
| | Douglas County Hospital Authority 3, Nebraska, Health Facilities Revenue Bonds, Nebraska | | | |
| | Methodist Health System, Refunding Series 2015: | | | |
| 4,070 | | 5.000%, 11/01/45 | 11/25 at 100.00 | A | 4,619,124 |
| 2,110 | | 5.000%, 11/01/48 | 11/25 at 100.00 | A | 2,389,575 |
| 500 | | Lincoln County Hospital Authority 1, Nebraska, Hospital Revenue and Refunding Bonds, | 11/21 at 100.00 | A– | 525,270 |
| | Great Plains Regional Medical Center Project, Series 2012, 5.000%, 11/01/42 | | | |
| 12,190 | | Total Nebraska | | | 13,724,067 |
| | Nevada – 2.1% (1.4% of Total Investments) | | | |
| 29,000 | | Clark County, Nevada, Airport Revenue Bonds, Subordinate Lien Series 2010B, | 1/20 at 100.00 | A+ | 29,198,070 |
| | 5.750%, 7/01/42 | | | |
| 6,000 | | Clark County, Nevada, Passenger Facility Charge Revenue Bonds, Las Vegas-McCarran | 1/20 at 100.00 | A+ | 6,034,920 |
| | International Airport, Series 2010A, 5.250%, 7/01/42 | | | |
| 10,000 | | Las Vegas Valley Water District, Nevada, General Obligation Bonds, Refunding Series | 6/21 at 100.00 | AA+ | 10,539,100 |
| | 2011C, 5.000%, 6/01/38 | | | |
| 4,000 | | Las Vegas Valley Water District, Nevada, General Obligation Bonds, Refunding Series | 12/24 at 100.00 | AA+ | 4,608,120 |
| | 2015, 5.000%, 6/01/39 | | | |
| 49,000 | | Total Nevada | | | 50,380,210 |
| | New Jersey – 5.5% (3.5% of Total Investments) | | | |
| 615 | | Gloucester County Pollution Control Financing Authority, New Jersey, Pollution Control | No Opt. Call | Ba1 | 668,868 |
| | Revenue Bonds, Logan Project, Refunding Series 2014A, 5.000%, 12/01/24 (AMT) | | | |
| 1,100 | | New Jersey Economic Development Authority, Private Activity Bonds, The Goethals Bridge | 1/24 at 100.00 | BBB | 1,224,113 |
| | Replacement Project, Series 2013, 5.125%, 7/01/42 – AGM Insured (AMT) | | | |
| 17,580 | | New Jersey Economic Development Authority, School Facilities Construction Bonds, | 12/26 at 100.00 | BBB+ | 20,940,593 |
| | Refunding Series 2016BBB, 5.500%, 6/15/31 | | | |
| | New Jersey Economic Development Authority, School Facilities Construction Bonds, Series | | | |
| | 2016AAA: | | | |
| 1,000 | | 5.000%, 6/15/36 | 12/26 at 100.00 | BBB+ | 1,142,440 |
| 10,000 | | 5.000%, 6/15/41 | 12/26 at 100.00 | BBB+ | 11,297,500 |
| 2,000 | | New Jersey Economic Development Authority, School Facilities Construction Bonds, Series | 6/27 at 100.00 | BBB+ | 2,293,600 |
| | 2017DDD, 5.000%, 6/15/35 | | | |
85
| | | | | |
| NZF | Nuveen Municipal Credit Income Fund | | |
| Portfolio of Investments (continued) | | | |
|
| October 31, 2019 | | | |
|
|
|
|
| Principal | | | Optional Call | | |
| Amount (000) | | Description (1) | Provisions (2) | Ratings (3) | Value |
| | New Jersey (continued) | | | |
| $ 15,040 | | New Jersey Economic Development Authority, School Facilities Construction Bonds, Series | 12/28 at 100.00 | BBB+ | $ 17,086,342 |
| | 2018EE, 5.000%, 6/15/48 | | | |
| 3,050 | | New Jersey Economic Development Authority, School Facilities Construction Financing | 3/21 at 100.00 | BBB+ | 3,188,653 |
| | Program Bonds, Refunding Series 2011GG, 5.000%, 9/01/24 | | | |
| | New Jersey Economic Development Authority, Student Housing Revenue Bonds, Provident | | | |
| | Group-Montclair Properties LLC, Montclair State University Student Housing Project, Series 2010A: | | | |
| 835 | | 5.750%, 6/01/31 (Pre-refunded 6/01/20) | 6/20 at 100.00 | N/R (4) | 857,286 |
| 3,000 | | 5.875%, 6/01/42 (Pre-refunded 6/01/20) | 6/20 at 100.00 | N/R (4) | 3,082,200 |
| 1,120 | | New Jersey Educational Facilities Authority, Revenue Bonds, Seton Hall University, | 7/23 at 100.00 | A– | 1,246,605 |
| | Series 2013D, 5.000%, 7/01/33 | | | |
| 600 | | New Jersey Health Care Facilities Financing Authority, New Jersey, Revenue Bonds, Saint | 7/21 at 100.00 | BB+ | 635,670 |
| | Peters University Hospital, Refunding Series 2011, 6.000%, 7/01/26 | | | |
| 405 | | New Jersey Health Care Facilities Financing Authority, Revenue Bonds, University | 7/25 at 100.00 | BB– | 457,403 |
| | Hospital Issue, Refunding Series 2015A, 5.000%, 7/01/46 – AGM Insured | | | |
| | New Jersey Transportation Trust Fund Authority, Transportation System Bonds, Capital | | | |
| | Appreciation Series 2010A: | | | |
| 3,130 | | 0.000%, 12/15/28 | No Opt. Call | Baa1 | 2,433,012 |
| 3,000 | | 0.000%, 12/15/31 | No Opt. Call | BBB+ | 2,110,380 |
| 12,715 | | 0.000%, 12/15/33 | No Opt. Call | BBB+ | 8,354,518 |
| 610 | | 0.000%, 12/15/34 | No Opt. Call | BBB+ | 386,496 |
| 2,480 | | 0.000%, 12/15/40 | No Opt. Call | BBB+ | 1,180,480 |
| 10,000 | | New Jersey Transportation Trust Fund Authority, Transportation System Bonds, Refunding | No Opt. Call | A– | 6,850,700 |
| | Series 2006C, 0.000%, 12/15/33 – AGM Insured | | | |
| 19,175 | | New Jersey Transportation Trust Fund Authority, Transportation System Bonds, Series | No Opt. Call | BBB+ | 11,623,310 |
| | 2008A, 0.000%, 12/15/35 | | | |
| 15,000 | | New Jersey Transportation Trust Fund Authority, Transportation System Bonds, Series | No Opt. Call | BBB+ | 7,457,400 |
| | 2009A, 0.010%, 12/15/39 | | | |
| 5,000 | | New Jersey Transportation Trust Fund Authority, Transportation System Bonds, Series | 12/24 at 100.00 | BBB+ | 5,685,000 |
| | 2009C, 5.250%, 6/15/32 | | | |
| 6,305 | | New Jersey Transportation Trust Fund Authority, Transportation System Bonds, Series | 6/25 at 100.00 | BBB+ | 6,986,129 |
| | 2015AA, 5.000%, 6/15/45 | | | |
| 1,595 | | Tobacco Settlement Financing Corporation, New Jersey, Tobacco Settlement Asset-Backed | 6/28 at 100.00 | BBB+ | 1,817,758 |
| | Bonds, Series 2018A, 5.000%, 6/01/46 | | | |
| 10,000 | | Tobacco Settlement Financing Corporation, New Jersey, Tobacco Settlement Asset-Backed | 6/28 at 100.00 | BB+ | 11,024,700 |
| | Bonds, Series 2018B, 5.000%, 6/01/46 | | | |
| 145,355 | | Total New Jersey | | | 130,031,156 |
| | New Mexico – 0.7% (0.5% of Total Investments) | | | |
| 1,500 | | New Mexico Hospital Equipment Loan Council, First Mortgage Revenue Bonds, La Vida LLena | 7/20 at 100.00 | BBB– (4) | 1,547,355 |
| | Project, Series 2010A, 6.125%, 7/01/40 (Pre-refunded 7/01/20) | | | |
| 10,000 | | New Mexico Municipal Energy Acquisition Authority, Gas Supply Revenue Bonds, Refunding & | 2/25 at 100.73 | Aa2 | 11,703,700 |
| | Acquisition Sub-Series 2019A, 5.000%, 11/01/39 (Mandatory Put 5/01/25) | | | |
| 4,180 | | Winrock Town Center Tax Increment Development District, Albuquerque, New Mexico, Gross | 5/20 at 103.00 | N/R | 4,300,844 |
| | Receipts Tax Increment Bonds, Senior Lien Series 2015, 5.750%, 5/01/30, 144A | | | |
| 15,680 | | Total New Mexico | | | 17,551,899 |
| | New York – 13.4% (8.6% of Total Investments) | | | |
| 1,755 | | Albany Industrial Development Agency, New York, Revenue Bonds, Brighter Choice Charter | 12/19 at 100.00 | B | 1,757,545 |
| | Schools, Series 2007A, 5.000%, 4/01/32 | | | |
| | Brooklyn Arena Local Development Corporation, New York, Payment in Lieu of Taxes Revenue | | | |
| | Bonds, Barclays Center Project, Series 2009: | | | |
| 3,220 | | 6.000%, 7/15/30 (Pre-refunded 1/15/20) | 1/20 at 100.00 | AA+ (4) | 3,250,848 |
| 3,065 | | 6.250%, 7/15/40 (Pre-refunded 1/15/20) | 1/20 at 100.00 | AA+ (4) | 3,095,865 |
| 3,400 | | 0.000%, 7/15/44 | No Opt. Call | BB | 1,407,022 |
| 12,020 | | 0.000%, 7/15/46 | No Opt. Call | BB | 4,538,872 |
86
| | | | | | |
| Principal | | | Optional Call | | |
| Amount (000) | | Description (1) | Provisions (2) | Ratings (3) | Value |
| | New York (continued) | | | |
| $ 450 | | Buffalo and Erie County Industrial Land Development Corporation, New York, Revenue | 7/25 at 100.00 | BBB | $ 526,721 |
| | Bonds, Catholic Health System, Inc Project, Series 2015, 5.250%, 7/01/35 | | | |
| 200 | | Build New York City Resource Corporation, New York, Revenue Bonds, Metropolitan College | 11/24 at 100.00 | BB | 211,564 |
| | of New York, Series 2014, 5.000%, 11/01/39 | | | |
| 3,170 | | Dormitory Authority of the State of New York, Revenue Bonds, New School University, | 7/25 at 100.00 | A– | 3,598,299 |
| | Series 2015A, 5.000%, 7/01/50 | | | |
| 15,270 | | Dormitory Authority of the State of New York, Revenue Bonds, Vaughn College of | 12/26 at 100.00 | BB– | 16,600,170 |
| | Aeronautics & Technology, Series 2016A, 5.500%, 12/01/46, 144A | | | |
| 4,675 | | Dormitory Authority of the State of New York, State Personal Income Tax Revenue Bonds, | 3/21 at 100.00 | AA+ | 4,914,874 |
| | General Purpose Series 2011C, 5.000%, 3/15/41 | | | |
| 81,270 | | Erie County Tobacco Asset Securitization Corporation, New York, Tobacco Settlement | 12/19 at 14.75 | N/R | 9,048,602 |
| | Asset-Backed Bonds, Series 2005C, 0.000%, 6/01/50 | | | |
| | Hudson Yards Infrastructure Corporation, New York, Revenue Bonds, Senior Fiscal 2012 | | | |
| | Series 2011A: | | | |
| 270 | | 5.250%, 2/15/47 (Pre-refunded 2/15/21) | 2/21 at 100.00 | Aa2 (4) | 284,170 |
| 5,890 | | 5.250%, 2/15/47 | 2/21 at 100.00 | AA– | 6,175,253 |
| 800 | | 5.750%, 2/15/47 | 2/21 at 100.00 | AA– | 843,936 |
| 1,300 | | 5.750%, 2/15/47 (Pre-refunded 2/15/21) | 2/21 at 100.00 | Aa2 (4) | 1,376,466 |
| 3,000 | | Long Island Power Authority, New York, Electric System General Revenue Bonds, Series | 9/24 at 100.00 | A | 3,437,850 |
| | 2014A, 5.000%, 9/01/39 | | | |
| 1,200 | | Long Island Power Authority, New York, Electric System Revenue Bonds, Series 2011A, | 5/21 at 100.00 | A2 (4) | 1,270,704 |
| | 5.000%, 5/01/36 (Pre-refunded 5/01/21) – AGM Insured | | | |
| 6,000 | | Long Island Power Authority, New York, Electric System Revenue Bonds, Series 2012A, | 9/22 at 100.00 | A | 6,534,180 |
| | 5.000%, 9/01/42 | | | |
| | Metropolitan Transportation Authority, New York, Transportation Revenue Bonds, | | | |
| | Series 2011A: | | | |
| 285 | | 5.000%, 11/15/41 (Pre-refunded 11/15/21) | 11/21 at 100.00 | N/R (4) | 308,096 |
| 465 | | 5.000%, 11/15/41 (Pre-refunded 11/15/21) | 11/21 at 100.00 | A (4) | 502,684 |
| 2,500 | | Metropolitan Transportation Authority, New York, Transportation Revenue Bonds, Series | 5/23 at 100.00 | A | 2,769,725 |
| | 2013A, 5.000%, 11/15/38 | | | |
| 16,290 | | New York City Industrial Development Agency, New York, PILOT Revenue Bonds, Queens | 12/19 at 100.00 | BBB | 16,540,214 |
| | Baseball Stadium Project, Series 2006, 5.000%, 1/01/46 – AMBAC Insured | | | |
| | New York City Municipal Water Finance Authority, New York, Water and Sewer System | | | |
| | Revenue Bonds, Second Generation Resolution, Fiscal 2011 Series EE: | | | |
| 1,480 | | 5.375%, 6/15/43 | 12/20 at 100.00 | AA+ | 1,547,000 |
| 2,895 | | 5.375%, 6/15/43 (Pre-refunded 12/15/20) | 12/20 at 100.00 | N/R (4) | 3,032,599 |
| 5,000 | | New York City Transitional Finance Authority, New York, Building Aid Revenue Bonds, | 7/28 at 100.00 | AA | 6,053,350 |
| | Fiscal 2019 Subseries S-1, 5.000%, 7/15/45 | | | |
| 4,440 | | New York City Transitional Finance Authority, New York, Building Aid Revenue Bonds, | 7/28 at 100.00 | AA | 5,497,608 |
| | Fiscal 2019 Subseries S-3A, 5.000%, 7/15/36 | | | |
| 10,000 | | New York City Transitional Finance Authority, New York, Future Tax Secured Bonds, | 5/23 at 100.00 | Aa1 | 11,160,100 |
| | Subordinate Fiscal 2013 Series I, 5.000%, 5/01/38 | | | |
| 10 | | New York City, New York, General Obligation Bonds, Fiscal Series 2002G, 5.625%, 8/01/20 – | 12/19 at 100.00 | AA | 10,034 |
| | NPFG Insured | | | |
| 67,290 | | New York Liberty Development Corporation, New York, Liberty Revenue Bonds, 3 World Trade | 11/24 at 100.00 | N/R | 74,257,207 |
| | Center Project, Class 1 Series 2014, 5.000%, 11/15/44, 144A | | | |
| | New York Liberty Development Corporation, New York, Liberty Revenue Bonds, 4 World Trade | | | |
| | Center Project, Series 2011: | | | |
| 1,870 | | 5.000%, 11/15/44 | 11/21 at 100.00 | A | 1,993,813 |
| 2,000 | | 5.750%, 11/15/51 | 11/21 at 100.00 | A | 2,175,960 |
| 3,000 | | New York State Power Authority, General Revenue Bonds, Series 2011A, 5.000%, 11/15/38 | 11/21 at 100.00 | AA | 3,217,500 |
| 5,000 | | New York State Thruway Authority, General Revenue Junior Indebtedness Obligations, | 1/26 at 100.00 | A– | 5,757,200 |
| | Series 2016A, 5.000%, 1/01/51 | | | |
87
| | | | | |
| NZF | Nuveen Municipal Credit Income Fund | | |
| Portfolio of Investments (continued) | | | |
|
| October 31, 2019 | | | |
|
|
|
|
| Principal | | | Optional Call | | |
| Amount (000) | | Description (1) | Provisions (2) | Ratings (3) | Value |
| | New York (continued) | | | |
| | New York Transportation Development Corporation, New York, Special Facility Revenue Bonds, | | | |
| | American Airlines, Inc John F Kennedy International Airport Project, Refunding Series 2016: | | | |
| $ 3,500 | | 5.000%, 8/01/26 (AMT) | 8/21 at 100.00 | BB– | $ 3,672,690 |
| 15,265 | | 5.000%, 8/01/31 (AMT) | 8/21 at 100.00 | BB– | 15,977,570 |
| 2,745 | | New York Transportation Development Corporation, New York, Special Facility Revenue | 1/28 at 100.00 | Baa3 | 3,259,138 |
| | Bonds, Delta Air Lines, Inc – LaGuardia Airport Terminals C&D Redevelopment Project, Series | | �� | |
| | 2018, 5.000%, 1/01/36 (AMT) | | | |
| | New York Transportation Development Corporation, Special Facilities Bonds, LaGuardia | | | |
| | Airport Terminal B Redevelopment Project, Series 2016A: | | | |
| 10,680 | | 5.000%, 7/01/41 (AMT) | 7/24 at 100.00 | Baa3 | 11,869,432 |
| 1,800 | | 4.000%, 7/01/46 (AMT) | 7/24 at 100.00 | Baa3 | 1,888,812 |
| 21,810 | | 5.000%, 7/01/46 (AMT) | 7/24 at 100.00 | Baa3 | 24,121,642 |
| 24,150 | | 5.250%, 1/01/50 (AMT) | 7/24 at 100.00 | Baa3 | 26,968,788 |
| 10,000 | | Port Authority of New York and New Jersey, Consolidated Revenue Bonds, Two Hundred | 4/27 at 100.00 | AA– | 12,090,400 |
| | Series 2017, 5.250%, 10/15/57 | | | |
| | Port Authority of New York and New Jersey, Special Project Bonds, JFK International Air | | | |
| | Terminal LLC Project, Eighth Series 2010: | | | |
| 6,065 | | 6.500%, 12/01/28 | 12/19 at 100.00 | BBB+ | 6,332,224 |
| 3,430 | | 6.000%, 12/01/36 | 12/20 at 100.00 | BBB+ | 3,604,656 |
| 795 | | 6.000%, 12/01/42 | 12/20 at 100.00 | BBB+ | 832,906 |
| 2,500 | | Triborough Bridge and Tunnel Authority, New York, General Purpose Revenue Bonds, | 5/25 at 100.00 | AA– | 2,881,900 |
| | Refunding Series 2015A, 5.000%, 11/15/50 | | | |
| 372,220 | | Total New York | | | 317,196,189 |
| | North Carolina – 0.2% (0.1% of Total Investments) | | | |
| 3,300 | | North Carolina Medical Care Commission, Health Care Facilities Revenue Bonds, WakeMed, | 10/22 at 100.00 | A2 | 3,602,742 |
| | Refunding Series 2012A, 5.000%, 10/01/31 | | | |
| | North Dakota – 2.3% (1.5% of Total Investments) | | | |
| 1,000 | | Burleigh County, North Dakota, Health Care Revenue Bonds, Saint Alexius Medical Center | 7/21 at 100.00 | N/R (4) | 1,061,170 |
| | Project, Series 2014A, 5.000%, 7/01/35 (Pre-refunded 7/01/21) | | | |
| | Fargo, North Dakota, Health System Revenue Bonds, Sanford Health, Refunding Series 2011: | | | |
| 1,500 | | 6.000%, 11/01/28 | 11/21 at 100.00 | A2 | 1,642,335 |
| 2,190 | | 6.250%, 11/01/31 | 11/21 at 100.00 | A2 | 2,405,365 |
| | Grand Forks, North Dakota, Health Care System Revenue Bonds, Altru Health System | | | |
| | Obligated Group, Series 2012: | | | |
| 3,000 | | 5.000%, 12/01/29 | 12/21 at 100.00 | Baa2 | 3,185,610 |
| 1,875 | | 5.000%, 12/01/32 | 12/21 at 100.00 | Baa2 | 1,984,931 |
| 39,670 | | Ward County Health Care, North Dakota, Revenue Bonds, Trinity Obligated Group, Series | 6/28 at 100.00 | BBB– | 44,517,674 |
| | 2017C, 5.000%, 6/01/53 | | | |
| 49,235 | | Total North Dakota | | | 54,797,085 |
| | Ohio – 3.8% (2.4% of Total Investments) | | | |
| 800 | | Allen County, Ohio, Hospital Facilities Revenue Bonds, Catholic Health Partners, | 5/22 at 100.00 | A2 | 856,048 |
| | Refunding and Improvement Series 2012A, 5.000%, 5/01/42 | | | |
| | Buckeye Tobacco Settlement Financing Authority, Ohio, Tobacco Settlement Asset-Backed | | | |
| | Revenue Bonds, Senior Lien, Series 2007A-2: | | | |
| 645 | | 5.375%, 6/01/24 | 11/19 at 100.00 | CCC+ | 645,709 |
| 44,590 | | 6.500%, 6/01/47 | 11/19 at 100.00 | B– | 45,602,639 |
| | Butler County, Ohio, Hospital Facilities Revenue Bonds, UC Health, Series 2010: | | | |
| 2,000 | | 5.250%, 11/01/29 (Pre-refunded 11/01/20) | 11/20 at 100.00 | A (4) | 2,081,640 |
| 3,000 | | 5.750%, 11/01/40 (Pre-refunded 11/01/20) | 11/20 at 100.00 | A (4) | 3,137,220 |
| 3,040 | | Franklin County, Ohio, Healthcare Facilities Revenue Bonds, Ohio Presbyterian Retirement | 7/20 at 100.00 | BBB | 3,119,678 |
| | Services, Improvement Series 2010A, 5.625%, 7/01/26 | | | |
| 5,800 | | Franklin County, Ohio, Hospital Revenue Bonds, OhioHealth Corporation, Series 2011A, | 11/21 at 100.00 | Aa2 | 6,160,354 |
| | 5.000%, 11/15/41 | | | |
88
| | | | | | |
| Principal | | | Optional Call | | |
| Amount (000) | | Description (1) | Provisions (2) | Ratings (3) | Value |
| | Ohio (continued) | | | |
| $ 4,615 | | Lucas County, Ohio, Hospital Revenue Bonds, ProMedica Healthcare Obligated Group, Series | 11/21 at 100.00 | Baa3 (4) | $ 5,056,102 |
| | 2011A, 6.000%, 11/15/41 (Pre-refunded 11/15/21) | | | |
| 1,000 | | Ohio Air Quality Development Authority, Ohio, Pollution Control Revenue Bonds, | No Opt. Call | N/R | 882,500 |
| | FirstEnergy Nuclear Generation Project, Refunding Series 2008C, 3.950%, 11/01/32 (AMT) | | | |
| | (Mandatory Put 5/01/20) (7) | | | |
| 10 | | Ohio Air Quality Development Authority, Ohio, Revenue Bonds, AK Steel Holding | 2/22 at 100.00 | B– | 10,304 |
| | Corporation, Refunding Series 2012A, 6.750%, 6/01/24 (AMT) | | | |
| 2,000 | | Ohio Turnpike Commission, Turnpike Revenue Bonds, Infrastructure Project, Junior Lien | 2/23 at 100.00 | A+ | 2,235,260 |
| | Series 2013A-1, 5.250%, 2/15/33 | | | |
| 330 | | Ohio Water Development Authority, Ohio, Environmental Improvement Bonds, United States | 11/21 at 100.00 | B3 | 344,979 |
| | Steel Corporation Project, Refunding Series 2011, 6.600%, 5/01/29 | | | |
| 3,000 | | Ohio Water Development Authority, Pollution Control Revenue Refunding Bonds, FirstEnergy | No Opt. Call | N/R | 2,647,500 |
| | Nuclear Generating Corporation Project, Series 2008C, 3.950%, 11/01/32 (AMT) (Mandatory | | | |
| | Put 5/01/20) (7) | | | |
| 13,350 | | Ohio Water Development Authority, Pollution Control Revenue Refunding Bonds, FirstEnergy | No Opt. Call | N/R | 14,317,875 |
| | Nuclear Generating Corporation Project, Series 2009A, 4.375%, 6/01/33 (Mandatory Put 6/01/22) (7) | | | |
| 2,500 | | Ohio Water Development Authority, Pollution Control Revenue Refunding Bonds, FirstEnergy | No Opt. Call | N/R | 2,681,250 |
| | Nuclear Generating Corporation Project, Series 2010B, 4.375%, 6/01/33 (Mandatory Put 6/01/22) (7) | | | |
| 86,680 | | Total Ohio | | | 89,779,058 |
| | Oklahoma – 2.7% (1.7% of Total Investments) | | | |
| 1,745 | | Fort Sill Apache Tribe of Oklahoma Economic Development Authority, Gaming Enterprise | 8/21 at 100.00 | N/R | 1,928,225 |
| | Revenue Bonds, Fort Sill Apache Casino, Series 2011A, 8.500%, 8/25/26, 144A | | | |
| 3,500 | | Grand River Dam Authority, Oklahoma, Revenue Bonds, Series 2010A, 5.250%, 6/01/40 | 6/20 at 100.00 | A1 (4) | 3,582,390 |
| | (Pre-refunded 6/01/20) | | | |
| | Oklahoma Development Finance Authority, Health System Revenue Bonds, OU Medicine | | | |
| | Project, Series 2018B: | | | |
| 3,515 | | 5.250%, 8/15/43 | 8/28 at 100.00 | BB+ | 4,205,873 |
| 11,870 | | 5.250%, 8/15/48 | 8/28 at 100.00 | BB+ | 14,094,675 |
| 4,555 | | 5.500%, 8/15/52 | 8/28 at 100.00 | BB+ | 5,466,820 |
| 27,375 | | 5.500%, 8/15/57 | 8/28 at 100.00 | BB+ | 32,644,414 |
| 2,055 | | Tulsa Airports Improvement Trust, Oklahoma, General Airport Revenue Bonds, Series 2013A, | 6/23 at 100.00 | Baa1 | 2,298,271 |
| | 5.375%, 6/01/33 (AMT) | | | |
| 54,615 | | Total Oklahoma | | | 64,220,668 |
| | Oregon – 0.1% (0.0% of Total Investments) | | | |
| 1,270 | | Forest Grove, Oregon, Campus Improvement Revenue Bonds, Pacific University Project, | 5/22 at 100.00 | BBB | 1,344,752 |
| | Refunding Series 2014A, 5.000%, 5/01/40 | | | |
| | Pennsylvania – 6.0% (3.8% of Total Investments) | | | |
| 380 | | Allegheny Country Industrial Development Authority, Pennsylvania, Environmental | 8/22 at 100.00 | B3 | 392,787 |
| | Improvement Revenue Bonds, United States Steel Corporation Project, Series 2012, | | | |
| | 5.750%, 8/01/42 (AMT) | | | |
| 1,355 | | Allentown Neighborhood Improvement Zone Development Authority, Pennsylvania, Tax Revenue | 5/27 at 100.00 | Ba3 | 1,514,416 |
| | Bonds, City Center Refunding Project, Series 2017, 5.000%, 5/01/42, 144A | | | |
| 10,650 | | Beaver County Industrial Development Authority, Pennsylvania, Pollution Control Revenue | No Opt. Call | N/R | 11,422,125 |
| | Refunding Bonds, FirstEnergy Nuclear Generation Project, Series 2006A, 4.375%, 1/01/35 | | | |
| | (Mandatory Put 7/01/22) (7) | | | |
| 32,785 | | Beaver County Industrial Development Authority, Pennsylvania, Pollution Control Revenue | No Opt. Call | N/R | 28,932,763 |
| | Refunding Bonds, FirstEnergy Nuclear Generation Project, Series 2006B, 3.500%, 12/01/35 | | | |
| | (Mandatory Put 6/01/20) (7) | | | |
| 23,670 | | Berks County Industrial Development Authority, Pennsylvania, Health System Revenue | 11/27 at 100.00 | Baa2 | 26,881,072 |
| | Bonds, Tower Health Project, Series 2017, 5.000%, 11/01/50 | | | |
| 2,950 | | Commonwealth Financing Authority, Pennsylvania, State Appropriation Lease Bonds, Master | 6/28 at 100.00 | A | 3,579,353 |
| | Settlement, Series 2018, 5.000%, 6/01/35 | | | |
89
| | | | | |
| NZF | Nuveen Municipal Credit Income Fund | | |
| Portfolio of Investments (continued) | | | |
|
| October 31, 2019 | | | |
|
|
|
|
| Principal | | | Optional Call | | |
| Amount (000) | | Description (1) | Provisions (2) | Ratings (3) | Value |
| | Pennsylvania (continued) | | | |
| $ 2,080 | | Cumberland County Municipal Authority, Pennsylvania, Revenue Bonds, Diakon Lutheran | 1/25 at 100.00 | BBB+ | $ 2,283,445 |
| | Social Ministries Project, Series 2015, 5.000%, 1/01/38 | | | |
| 6,335 | | Geisinger Authority, Montour County, Pennsylvania, Health System Revenue Bonds, | 2/27 at 100.00 | Aa3 | 7,431,588 |
| | Geisinger Health System, Series 2017A-1, 5.000%, 2/15/45 | | | |
| | Montgomery County Industrial Development Authority, Pennsylvania, Health System Revenue | | | |
| | Bonds, Albert Einstein Healthcare Network Issue, Series 2015A: | | | |
| 6,190 | | 5.250%, 1/15/36 | 1/25 at 100.00 | Ba1 | 6,955,517 |
| 3,535 | | 5.250%, 1/15/45 | 1/25 at 100.00 | Ba1 | 3,943,257 |
| 2,206 | | Northampton County Industrial Development Authority, Pennsylvania, Recovery Revenue | 12/19 at 100.00 | N/R | 551,431 |
| | Bonds, Northampton Generating Project, Senior Lien Series 2013A0 & AE2, 1.500%, 12/31/23 | | | |
| 533 | | Northampton County Industrial Development Authority, Pennsylvania, Recovery Revenue | No Opt. Call | N/R | 133,337 |
| | Bonds, Northampton Generating Project, Senior Lien Taxable Series 2013B, 5.000%, 12/31/23 | | | |
| | (cash 5.000%, PIK 5.000%) | | | |
| 4,135 | | Pennsylvania Economic Development Financing Authority, Exempt Facilities Revenue Bonds, | 11/24 at 100.00 | N/R | 4,413,120 |
| | National Gypsum Company, Refunding Series 2014, 5.500%, 11/01/44 (AMT) | | | |
| 11,750 | | Pennsylvania Economic Development Financing Authority, Exempt Facilities Revenue | 9/25 at 100.00 | B3 | 12,705,980 |
| | Refunding Bonds, PPL Energy Supply, LLC Project, Series 2009A, 6.400%, 12/01/38 | | | |
| 1,085 | | Pennsylvania Economic Development Financing Authority, Private Activity Revenue Bonds, | 6/26 at 100.00 | BBB | 1,237,182 |
| | Pennsylvania Rapid Bridge Replacement Project, Series 2015, 5.000%, 12/31/38 (AMT) | | | |
| 600 | | Pennsylvania Higher Educational Facilities Authority, Revenue Bonds, Edinboro University | 7/20 at 100.00 | N/R (4) | 619,062 |
| | Foundation Student Housing Project, Series 2010, 6.000%, 7/01/43 (Pre-refunded 7/01/20) | | | |
| | Pennsylvania Turnpike Commission, Motor License Fund-Enhanced Turnpike Special Revenue | | | |
| | Bonds, Subordinate Series 2010A1&2: | | | |
| 315 | | 5.500%, 12/01/34 (Pre-refunded 12/01/20) | 12/20 at 100.00 | N/R (4) | 329,594 |
| 1,435 | | 5.500%, 12/01/34 (Pre-refunded 12/01/20) | 12/20 at 100.00 | A2 (4) | 1,501,484 |
| 5,140 | | Pennsylvania Turnpike Commission, Motor License Fund-Enhanced Turnpike Special Revenue | 12/21 at 100.00 | A2 (4) | 5,548,990 |
| | Bonds, Subordinate Series 2011B, 5.000%, 12/01/34 (Pre-refunded 12/01/21) | | | |
| 5,660 | | Pennsylvania Turnpike Commission, Turnpike Revenue Bonds, Series 2015A-1, 5.000%, 12/01/45 | 6/25 at 100.00 | A+ | 6,468,418 |
| 3,170 | | Pennsylvania Turnpike Commission, Turnpike Revenue Bonds, Subordinate Series 2016A-1, | 12/25 at 100.00 | A3 | 3,635,641 |
| | 5.000%, 12/01/46 | | | |
| 1,595 | | Philadelphia Hospitals and Higher Education Facilities Authority, Pennsylvania, Health System | 5/20 at 100.00 | N/R (4) | 1,627,123 |
| | Revenue Bonds, Jefferson Health System, Series 2010B, 5.000%, 5/15/40 (Pre-refunded 5/15/20) | | | |
| | Philadelphia, Pennsylvania, General Obligation Bonds, Refunding Series 2011: | | | |
| 5,445 | | 6.000%, 8/01/36 (Pre-refunded 8/01/20) | 8/20 at 100.00 | A– (4) | 5,639,332 |
| 1,425 | | 6.500%, 8/01/41 (Pre-refunded 8/01/20) | 8/20 at 100.00 | A– (4) | 1,480,461 |
| | The Redevelopment Authority of the City of Scranton, Lackawanna county, Pennsylvania, | | | |
| | Guaranteed Lease Revenue Bonds, Series 2016A: | | | |
| 425 | | 5.000%, 11/15/21 | No Opt. Call | BB+ | 437,304 |
| 1,255 | | 5.000%, 11/15/28 | 5/24 at 100.00 | BB+ | 1,296,013 |
| 136,104 | | Total Pennsylvania | | | 140,960,795 |
| | Puerto Rico – 3.5% (2.2% of Total Investments) | | | |
| 3,325 | | Puerto Rico Aqueduct and Sewerage Authority, Revenue Bonds, Senior Lien Series 2008A, | 12/19 at 100.00 | C | 3,370,719 |
| | 6.000%, 7/01/44 | | | |
| | Puerto Rico Aqueduct and Sewerage Authority, Revenue Bonds, Senior Lien Series 2012A: | | | |
| 1,800 | | 5.500%, 7/01/28 | 7/22 at 100.00 | C | 1,910,250 |
| 6,640 | | 5.750%, 7/01/37 | 7/22 at 100.00 | C | 7,063,300 |
| 5,425 | | 6.000%, 7/01/47 | 7/22 at 100.00 | C | 5,784,406 |
| 215 | | Puerto Rico Highway and Transportation Authority, Highway Revenue Bonds, Series 2007N, | No Opt. Call | C | 240,054 |
| | 5.500%, 7/01/29 – AMBAC Insured | | | |
90
| | | | | | |
| Principal | | | Optional Call | | |
| Amount (000) | | Description (1) | Provisions (2) | Ratings (3) | Value |
| | Puerto Rico (continued) | | | |
| | Puerto Rico Sales Tax Financing Corporation, Sales Tax Revenue Bonds, Restructured 2018A-1: | | | |
| $ 153 | | 0.000%, 7/01/24 | No Opt. Call | N/R | $ 134,261 |
| 136 | | 4.550%, 7/01/40 | 7/28 at 100.00 | N/R | 139,348 |
| 18,363 | | 0.010%, 7/01/46 | 7/28 at 41.38 | N/R | 4,797,334 |
| 60,234 | | 0.000%, 7/01/51 | 7/28 at 30.01 | N/R | 11,754,063 |
| 1,007 | | 4.750%, 7/01/53 | 7/28 at 100.00 | N/R | 1,042,648 |
| 15,458 | | 5.000%, 7/01/58 | 7/28 at 100.00 | N/R | 16,266,453 |
| | Puerto Rico Sales Tax Financing Corporation, Sales Tax Revenue Bonds, Taxable | | | |
| | Restructured Cofina Project Series 2019A-2: | | | |
| 16,577 | | 4.329%, 7/01/40 | 7/28 at 100.00 | N/R | 16,866,932 |
| 493 | | 4.536%, 7/01/53 | 7/28 at 100.00 | N/R | 500,242 |
| 6,645 | | 4.784%, 7/01/58 | 7/28 at 100.00 | N/R | 6,862,491 |
| | Puerto Rico Urgent Interest Fund Corp (COFINA), National Custodial Taxable Trust Unit, | | | |
| | Series 2007A Sr. Bond: | | | |
| 24 | | 0.010%, 8/01/40 (8) | No Opt. Call | N/R | 3,306 |
| 1,538 | | 0.000%, 8/01/41 (8) | No Opt. Call | N/R | 211,465 |
| 14 | | 0.010%, 8/01/41 – BHAC Insured | No Opt. Call | N/R | 1,943 |
| 5,442 | | 0.000%, 8/01/42 (8) | No Opt. Call | N/R | 748,226 |
| 5,226 | | 0.000%, 8/01/43 (8) | No Opt. Call | N/R | 718,609 |
| 8,707 | | 0.000%, 8/01/44 (8) | No Opt. Call | N/R | 1,197,167 |
| 4,009 | | 0.000%, 8/01/44 (8) | No Opt. Call | N/R | 200,456 |
| 1,944 | | 0.000%, 8/01/45 (8) | No Opt. Call | N/R | 97,202 |
| 748 | | 0.000%, 8/01/45 (8) | No Opt. Call | N/R | 102,870 |
| 9,015 | | 0.000%, 8/01/46 (8) | No Opt. Call | N/R | 1,239,596 |
| 1,867 | | 0.000%, 8/01/46 (8) | No Opt. Call | N/R | 93,372 |
| 4,357 | | 0.010%, 8/01/54 | No Opt. Call | N/R | 796,804 |
| 179,362 | | Total Puerto Rico | | | 82,143,517 |
| | Rhode Island – 0.1% (0.1% of Total Investments) | | | |
| 21,570 | | Rhode Island Tobacco Settlement Financing Corporation, Tobacco Settlement Asset-Backed | 11/19 at 14.61 | CCC– | 2,888,654 |
| | Bonds, Series 2007A, 0.000%, 6/01/52 | | | |
| | South Carolina – 2.4% (1.5% of Total Investments) | | | |
| 5,000 | | Piedmont Municipal Power Agency, South Carolina, Electric Revenue Bonds, Refunding | No Opt. Call | A– | 5,282,900 |
| | Series 1991, 6.250%, 1/01/21 – FGIC Insured | | | |
| | Piedmont Municipal Power Agency, South Carolina, Electric Revenue Bonds, Series 2004A-2: | | | �� |
| 1,220 | | 0.000%, 1/01/23 – FGIC Insured | No Opt. Call | A– | 1,159,561 |
| 21,570 | | 0.000%, 1/01/30 – AMBAC Insured | No Opt. Call | A– | 16,946,686 |
| 5,560 | | 0.000%, 1/01/31 – AGC Insured | No Opt. Call | A3 | 4,280,755 |
| 10,000 | | South Carolina Public Service Authority, Santee Cooper Revenue Obligations, Refunding & | 6/25 at 100.00 | A– | 11,324,700 |
| | Improvement Series 2015A, 5.000%, 12/01/50 | | | |
| 6,930 | | South Carolina Public Service Authority, Santee Cooper Revenue Obligations, Refunding | 12/24 at 100.00 | A– | 7,869,847 |
| | Series 2014C, 5.000%, 12/01/39 | | | |
| 9,155 | | South Carolina Public Service Authority, Santee Cooper Revenue Obligations, Series | 6/24 at 100.00 | A– | 10,393,122 |
| | 2014A, 5.500%, 12/01/54 | | | |
| 59,435 | | Total South Carolina | | | 57,257,571 |
| | South Dakota – 0.2% (0.1% of Total Investments) | | | |
| 4,455 | | South Dakota Health and Educational Facilities Authority, Revenue Bonds, Sanford Health, | 11/24 at 100.00 | A2 | 4,999,223 |
| | Series 2014B, 5.000%, 11/01/44 | | | |
91
| | | | | |
| NZF | Nuveen Municipal Credit Income Fund | | |
| Portfolio of Investments (continued) | | | |
|
| October 31, 2019 | | | |
|
|
|
|
| Principal | | | Optional Call | | |
| Amount (000) | | Description (1) | Provisions (2) | Ratings (3) | Value |
| | Tennessee – 0.7% (0.4% of Total Investments) | | | |
| $ 8,890 | | Chattanooga Health, Educational and Housing Facility Board, Tennessee, Revenue Bonds, | 1/23 at 100.00 | BBB+ (4) | $ 9,967,112 |
| | Catholic Health Initiatives, Series 2013A, 5.250%, 1/01/45 (Pre-refunded 1/01/23) | | | |
| 1,665 | | Chattanooga Health, Educational and Housing Facility Board, Tennessee, Revenue Bonds, | 8/29 at 100.00 | BBB+ | 1,969,895 |
| | CommonSpirit Health, Series 2019A-2, 5.000%, 8/01/44 | | | |
| 2,395 | | Chattanooga-Hamilton County Hospital Authority, Tennessee, Hospital Revenue Bonds, | 10/24 at 100.00 | Baa2 | 2,644,511 |
| | Erlanger Health System, Refunding Series 2014A, 5.000%, 10/01/44 | | | |
| 2,540 | | Metropolitan Government of Nashville-Davidson County Health and Educational Facilities | 6/27 at 100.00 | N/R | 1,524,000 |
| | Board, Tennessee, Revenue Bonds, Knowledge Academy Charter School, Series 2017A, 0.000%, | | | |
| | 6/15/37, 144A (7) | | | |
| 355 | | Metropolitan Government of Nashville-Davidson County Health and Educational Facilities | No Opt. Call | N/R | 355,824 |
| | Board, Tennessee, Revenue Refunding and Improvement Bonds, Meharry Medical College, Series | | | |
| | 1996, 6.000%, 12/01/19 – AMBAC Insured | | | |
| 15,845 | | Total Tennessee | | | 16,461,342 |
| | Texas – 14.6% (9.3% of Total Investments) | | | |
| | Arlington Higher Education Finance Corporation, Texas, Education Revenue Bonds, Uplift | | | |
| | Education, Series 2016A: | | | |
| 165 | | 5.000%, 12/01/36 | 12/26 at 100.00 | BBB– | 186,825 |
| 130 | | 5.000%, 12/01/46 | 12/26 at 100.00 | BBB– | 144,902 |
| 760 | | 5.000%, 12/01/51 | 12/26 at 100.00 | BBB– | 845,302 |
| 495 | | Arlington Higher Education Finance Corporation, Texas, Education Revenue Bonds, Wayside | 8/21 at 100.00 | BB+ | 502,989 |
| | Schools, Series 2016A, 4.375%, 8/15/36 | | | |
| 915 | | Aubrey, Denton County, Texas, Special Assessment Revenue Bonds, Jackson Ridge Public | 9/23 at 103.00 | N/R | 978,620 |
| | Improvement District Phase 1 Project, Series 2015, 7.250%, 9/01/45 | | | |
| 780 | | Aubrey, Denton County, Texas, Special Assessment Revenue Bonds, Jackson Ridge Public | 9/23 at 103.00 | N/R | 830,903 |
| | Improvement District Phases 2-3 Major Improvements Project, Series 2015, 8.250%, 9/01/40 | | | |
| | Board of Managers, Joint Guadalupe County-Seguin City Hospital, Texas, Hospital Mortgage | | | |
| | Revenue Bonds, Refunding & Improvement Series 2015: | | | |
| 3,135 | | 5.250%, 12/01/35 | 12/25 at 100.00 | BB | 3,507,469 |
| 3,340 | | 5.000%, 12/01/40 | 12/25 at 100.00 | BB | 3,593,840 |
| 2,000 | | Capital Area Cultural Education Facilities Finance Corporation, Texas, Revenue Bonds, The | 4/20 at 100.00 | Baa1 | 2,034,840 |
| | Roman Catholic Diocese of Austin, Series 2005B Remarketed, 6.125%, 4/01/45 | | | |
| 1,045 | | Celina, Texas, Special Assessment Revenue Bonds, Sutton Fields II Public Improvement | 3/23 at 103.00 | N/R | 1,093,791 |
| | District Neighborhood Improvement Area 1 Project, Series 2015, 7.250%, 9/01/45 | | | |
| 1,850 | | Celina, Texas, Special Assessment Revenue Bonds, Sutton Fields II Public Improvement | 3/23 at 103.00 | N/R | 1,933,121 |
| | District Neighborhood Improvement Areas 2-5 Major Improvement Project, Series 2015, | | | |
| | 8.250%, 9/01/40 | | | |
| | Central Texas Regional Mobility Authority, Revenue Bonds, Senior Lien Series 2011: | | | |
| 3,250 | | 6.000%, 1/01/41 (Pre-refunded 1/01/21) | 1/21 at 100.00 | Baa1 (4) | 3,428,067 |
| 2,700 | | 6.250%, 1/01/46 (Pre-refunded 1/01/21) | 1/21 at 100.00 | Baa1 (4) | 2,855,682 |
| | Central Texas Regional Mobility Authority, Revenue Bonds, Senior Lien, Series 2015A: | | | |
| 2,000 | | 5.000%, 1/01/40 | 7/25 at 100.00 | Baa1 | 2,277,380 |
| 3,625 | | 5.000%, 1/01/45 | 7/25 at 100.00 | Baa1 | 4,093,712 |
| | Club Municipal Management District 1, Texas, Special Assessment Revenue Bonds, | | | |
| | Improvement Area 1 Project, Series 2016: | | | |
| 550 | | 6.250%, 9/01/35 | 9/23 at 103.00 | N/R | 575,064 |
| 520 | | 6.500%, 9/01/46 | 9/23 at 103.00 | N/R | 542,750 |
| 4,500 | | Colorado River Municipal Water District, Texas, Water System Revenue Bonds, Series 2011, | 1/21 at 100.00 | AA– (4) | 4,700,835 |
| | 5.000%, 1/01/36 (Pre-refunded 1/01/21) | | | |
| 4,000 | | Dallas-Fort Worth International Airport, Texas, Joint Revenue Bonds, Improvement Series | 11/22 at 100.00 | A+ | 4,363,520 |
| | 2013C, 5.000%, 11/01/38 (AMT) | | | |
92
| | | | | | |
| Principal | | | Optional Call | | |
| Amount (000) | | Description (1) | Provisions (2) | Ratings (3) | Value |
| | Texas (continued) | | | |
| $ 2,600 | | Dallas-Fort Worth International Airport, Texas, Joint Revenue Bonds, Refunding & | 11/21 at 100.00 | A+ | $ 2,769,104 |
| | Improvement Series 2012C, 5.000%, 11/01/45 | | | |
| 1,000 | | Fort Bend County Industrial Development Corporation, Texas, Revenue Bonds, NRG Energy | 11/22 at 100.00 | Baa3 | 1,055,220 |
| | Inc Project, Series 2012A RMKT, 4.750%, 5/01/38 | | | |
| 2,335 | | Grand Parkway Transportation Corporation, Texas, System Toll Revenue Bonds, First Tier | 10/23 at 100.00 | BBB | 2,579,124 |
| | Series 2013A, 5.125%, 10/01/43 | | | |
| 17,000 | | Grand Parkway Transportation Corporation, Texas, System Toll Revenue Bonds, Subordinate | 10/23 at 100.00 | AA | 19,229,890 |
| | Lien Series 2013B, 5.250%, 10/01/51 | | | |
| 4,410 | | Grand Parkway Transportation Corporation, Texas, System Toll Revenue Bonds, Subordinate | 4/28 at 100.00 | AA | 5,275,903 |
| | Lien Series 2018A Tela Supported, 5.000%, 10/01/48 | | | |
| 1,140 | | Grand Parkway Transportation Corporation, Texas, System Toll Revenue Bonds, Tender | 10/23 at 100.00 | AA | 1,650,674 |
| | Option Bond Trust 2015-XF0228, 14.747%, 11/01/44, 144A (IF) (6) | | | |
| 10,000 | | Gulf Coast Industrial Development Authority, Texas, Solid Waste Disposal Revenue Bonds, | 12/19 at 100.00 | B3 | 10,052,700 |
| | Citgo Petroleum Corporation Project, Series 1998, 8.000%, 4/01/28 (AMT) | | | |
| 3,480 | | Harris County Cultural Education Facilities Finance Corporation, Texas, Revenue Bonds, | 6/25 at 100.00 | AA | 3,975,065 |
| | Houston Methodist Hospital System, Series 2015, 5.000%, 12/01/45 | | | |
| | Harris County-Houston Sports Authority, Texas, Revenue Bonds, Capital Appreciation | | | |
| | Refunding Senior Lien Series 2014A: | | | |
| 295 | | 0.010%, 11/15/41 – AGM Insured | 11/31 at 62.66 | A2 | 135,682 |
| 590 | | 0.010%, 11/15/42 – AGM Insured | 11/31 at 59.73 | A2 | 257,978 |
| 1,000 | | 0.010%, 11/15/43 – AGM Insured | 11/31 at 56.93 | A2 | 415,550 |
| 2,000 | | 0.010%, 11/15/44 – AGM Insured | 11/31 at 54.25 | A2 | 789,540 |
| 2,600 | | 0.010%, 11/15/45 – AGM Insured | 11/31 at 51.48 | A2 | 971,828 |
| 4,180 | | 0.010%, 11/15/53 – AGM Insured | 11/31 at 33.96 | A2 | 1,013,107 |
| 6,170 | | Harris County-Houston Sports Authority, Texas, Revenue Bonds, Junior Lien Series 2001H, | 11/31 at 69.08 | BB+ | 2,976,408 |
| | 0.010%, 11/15/37 – NPFG Insured | | | |
| 4,565 | | Harris County-Houston Sports Authority, Texas, Revenue Bonds, Third Lien Series 2004A-3, | 11/24 at 52.47 | BB | 2,059,135 |
| | 0.010%, 11/15/35 – NPFG Insured | | | |
| 40,500 | | Harris County-Houston Sports Authority, Texas, Special Revenue Bonds, Refunding Senior | 11/30 at 54.04 | A2 | 16,961,805 |
| | Lien Series 2001A, 0.000%, 11/15/40 – NPFG Insured | | | |
| 3,855 | | Houston, Texas, Airport System Revenue Bonds, Refunding Subordinate Lien Series | 7/22 at 100.00 | A | 4,182,752 |
| | 2012A, 5.000%, 7/01/32 (AMT) | | | |
| 235 | | Houston, Texas, Airport System Special Facilities Revenue Bonds, United Airlines, Inc | 7/24 at 100.00 | Ba3 | 262,624 |
| | Terminal E Project, Refunding Series 2014, 5.000%, 7/01/29 (AMT) | | | |
| 10,000 | | Houston, Texas, Combined Utility System Revenue Bonds, First Lien Series 2011D, 5.000%, | 11/21 at 100.00 | AA (4) | 10,778,900 |
| | 11/15/40 (Pre-refunded 11/15/21) | | | |
| | Houston, Texas, Hotel Occupancy Tax and Special Revenue Bonds, Convention and | | | |
| | Entertainment Project, Series 2001B: | | | |
| 28,305 | | 0.000%, 9/01/28 – AMBAC Insured | No Opt. Call | A | 23,404,838 |
| 5,000 | | 0.000%, 9/01/30 – AMBAC Insured | No Opt. Call | A | 3,854,450 |
| 5,765 | | 0.010%, 9/01/31 – AMBAC Insured | No Opt. Call | A | 4,280,974 |
| 6,000 | | Houston, Texas, Water and Sewerage System Revenue Bonds, Refunding Junior Lien Series | No Opt. Call | AA+ (4) | 7,760,760 |
| | 2001B, 5.500%, 12/01/29 – NPFG Insured (ETM) | | | |
| 7,500 | | Houston, Texas, Water and Sewerage System Revenue Bonds, Refunding Junior Lien Series | No Opt. Call | A2 (4) | 10,959,450 |
| | 2002A, 5.750%, 12/01/32 – AGM Insured (ETM) | | | |
| 720 | | Kerrville Health Facilities Development Corporation, Texas, Revenue Bonds, Sid Peterson | 8/25 at 100.00 | A– | 822,197 |
| | Memorial Hospital Project, Series 2015, 5.000%, 8/15/35 | | | |
| 8,000 | | Lower Colorado River Authority, Texas, Transmission Contract Revenue Bonds, LCRA | 5/20 at 100.00 | A | 8,155,120 |
| | Transmission Services Corporation Project, Refunding & Improvement Series 2010, 5.000%, 5/15/40 | | | |
| 2,750 | | Lower Colorado River Authority, Texas, Transmission Contract Revenue Bonds, LCRA | 5/25 at 100.00 | A | 3,173,940 |
| | Transmission Services Corporation Project, Refunding Series 2015, 5.000%, 5/15/40 | | | |
| 1,750 | | Martin County Hospital District, Texas, Combination Limited Tax and Revenue Bonds, | 4/21 at 100.00 | BBB | 1,847,982 |
| | Series 2011A, 7.250%, 4/01/36 | | | |
93
| | | | | |
| NZF | Nuveen Municipal Credit Income Fund | | |
| Portfolio of Investments (continued) | | | |
|
| October 31, 2019 | | | |
|
|
|
|
| Principal | | | Optional Call | | |
| Amount (000) | | Description (1) | Provisions (2) | Ratings (3) | Value |
| | Texas (continued) | | | |
| $ 2,505 | | Matagorda County Navigation District 1, Texas, Collateralized Revenue Refunding Bonds, | No Opt. Call | A | $ 3,138,289 |
| | Houston Light and Power Company, Series 1997, 5.125%, 11/01/28 – AMBAC Insured (AMT) | | | |
| 8,630 | | Mission Economic Development Corporation, Texas, Revenue Bonds, Natgasoline Project, | 10/21 at 105.00 | BB– | 9,356,991 |
| | Senior Lien Series 2018, 4.625%, 10/01/31, 144A (AMT) | | | |
| 15,600 | | Mission Economic Development Corporation, Texas, Water Supply Revenue Bonds, Enviro | 1/26 at 102.00 | N/R | 7,800,000 |
| | Water Minerals Project, Green Bonds, Series 2015, 7.750%, 1/01/45, 144A (AMT) (7), (9) | | | |
| 150 | | New Hope Cultural Education Facilities Finance Corporation, Texas, Student Housing | 4/26 at 100.00 | B2 | 150,647 |
| | Revenue Bonds, CHF-Collegiate Housing Corpus Christi II, LLC-Texas A&M University-Corpus | | | |
| | Christi Project, Series 2016A, 5.000%, 4/01/48 | | | |
| 565 | | New Hope Cultural Education Facilities Finance Corporation, Texas, Student Housing | 4/26 at 100.00 | BBB– | 594,730 |
| | Revenue Bonds, CHF-Collegiate Housing Foundation – San Antonio 1, LLC – Texas A&M | | | |
| | University – San Antonio Project,, 5.000%, 4/01/48 | | | |
| | North Texas Tollway Authority, Special Projects System Revenue Bonds, Convertible | | | |
| | Capital Appreciation Series 2011C: | | | |
| 6,330 | | 0.000%, 9/01/43 (Pre-refunded 9/01/31) (5) | 9/31 at 100.00 | N/R (4) | 7,901,866 |
| 9,130 | | 0.000%, 9/01/45 (Pre-refunded 9/01/31) (5) | 9/31 at 100.00 | N/R (4) | 12,397,536 |
| | North Texas Tollway Authority, System Revenue Bonds, Refunding First Tier Capital | | | |
| | Appreciation Series 2008I: | | | |
| 2,555 | | 6.200%, 1/01/42 – AGC Insured | 1/25 at 100.00 | A1 | 3,119,144 |
| 7,000 | | 6.500%, 1/01/43 | 1/25 at 100.00 | A+ | 8,670,900 |
| 10,000 | | North Texas Tollway Authority, System Revenue Bonds, Refunding First Tier, Series 2008D, | No Opt. Call | A1 | 8,534,500 |
| | 0.000%, 1/01/28 – AGC Insured | | | |
| | North Texas Tollway Authority, System Revenue Bonds, Refunding First Tier, Series 2015B: | | | |
| 2,870 | | 5.000%, 1/01/40 | 1/23 at 100.00 | A+ | 3,156,598 |
| 4,880 | | 5.000%, 1/01/45 | 1/25 at 100.00 | A+ | 5,539,630 |
| | North Texas Tollway Authority, System Revenue Bonds, Refunding Second Tier, Series 2015A: | | | |
| 7,855 | | 5.000%, 1/01/33 | 1/25 at 100.00 | A | 9,092,162 |
| 2,205 | | 5.000%, 1/01/34 | 1/25 at 100.00 | A | 2,548,759 |
| 1,000 | | 5.000%, 1/01/35 | 1/25 at 100.00 | A | 1,154,070 |
| 2,345 | | 5.000%, 1/01/38 | 1/25 at 100.00 | A | 2,686,666 |
| 1,570 | | Reagan Hospital District of Reagan County, Texas, Limited Tax Revenue Bonds, Series | 2/24 at 100.00 | Ba1 | 1,664,404 |
| | 2014A, 5.000%, 2/01/34 | | | |
| 3,500 | | Southwest Higher Education Authority Inc, Texas, Revenue Bonds, Southern Methodist | 10/20 at 100.00 | AA– (4) | 3,621,380 |
| | University, Series 2010, 5.000%, 10/01/41 (Pre-refunded 10/01/20) | | | |
| | Tarrant County Cultural Education Facilities Finance Corporation, Texas, Hospital | | | |
| | Revenue Bonds, Scott & White Healthcare Project, Series 2010: | | | |
| 425 | | 5.500%, 8/15/45 (Pre-refunded 8/15/20) | 8/20 at 100.00 | N/R (4) | 439,182 |
| 5,410 | | 5.500%, 8/15/45 (Pre-refunded 8/15/20) | 8/20 at 100.00 | N/R (4) | 5,590,532 |
| 1,840 | | Texas Municipal Gas Acquisition and Supply Corporation I, Gas Supply Revenue Bonds, | No Opt. Call | A– | 2,146,857 |
| | Senior Lien Series 2008D, 6.250%, 12/15/26 | | | |
| | Texas Municipal Gas Acquisition and Supply Corporation III, Gas Supply Revenue Bonds, | | | |
| | Series 2012: | | | |
| 2,500 | | 5.000%, 12/15/27 | 12/22 at 100.00 | BBB | 2,733,225 |
| 4,835 | | 5.000%, 12/15/28 | 12/22 at 100.00 | BBB | 5,276,339 |
| 13,235 | | 5.000%, 12/15/29 | 12/22 at 100.00 | BBB | 14,412,650 |
| 435 | | 5.000%, 12/15/32 | 12/22 at 100.00 | BBB | 471,614 |
| 1,620 | | Texas Private Activity Bond Surface Transportation Corporation, Revenue Bonds, NTE | 12/19 at 100.00 | BBB– | 1,634,645 |
| | Mobility Partners LLC North Tarrant Express Managed Lanes Project, Senior Lien Series 2009, | | | |
| | 6.875%, 12/31/39 | | | |
| 2,000 | | Texas Private Activity Bond Surface Transportation Corporation, Senior Lien Revenue | 9/23 at 100.00 | Baa3 | 2,346,220 |
| | Bonds, NTE Mobility Partners Segments 3 LLC Segments 3A & 3B Facility, Series 2013, 7.000%, | | | |
| | 12/31/38 (AMT) | | | |
| | Texas Private Activity Bond Surface Transportation Corporation, Senior Lien Revenue | | | |
| | Bonds, LBJ Infrastructure Group LLC IH-635 Managed Lanes Project, Series 2010: | | | |
| 2,000 | | 7.000%, 6/30/34 | 6/20 at 100.00 | Baa3 | 2,078,320 |
| 500 | | 7.000%, 6/30/40 | 6/20 at 100.00 | Baa3 | 518,725 |
94
| | | | | | |
| Principal | | | Optional Call | | |
| Amount (000) | | Description (1) | Provisions (2) | Ratings (3) | Value |
| | Texas (continued) | | | |
| $ 5,355 | | Texas Transportation Commission, Central Texas Turnpike System Revenue Bonds, First | 8/22 at 100.00 | A– | $ 5,763,319 |
| | Tier Refunding Series 2012A, 5.000%, 8/15/41 | | | |
| | Texas Transportation Commission, Central Texas Turnpike System Revenue Bonds, Second | | | |
| | Tier Refunding Series 2015C: | | | |
| 4,000 | | 5.000%, 8/15/32 | 8/24 at 100.00 | BBB+ | 4,543,400 |
| 1,875 | | 5.000%, 8/15/37 | 8/24 at 100.00 | BBB+ | 2,110,575 |
| | Texas Turnpike Authority, Central Texas Turnpike System Revenue Bonds, First Tier | | | |
| | Series 2002A: | | | |
| 300 | | 0.000%, 8/15/21 – AMBAC Insured (ETM) | No Opt. Call | A3 (4) | 292,641 |
| 1,020 | | 0.000%, 8/15/21 – AMBAC Insured | No Opt. Call | A– | 993,939 |
| 3,600 | | 0.000%, 8/15/25 – AMBAC Insured | No Opt. Call | A– | 3,240,396 |
| 5,000 | | Texas Water Development Board, State Water Implementation Revenue Fund Bonds, Master | 10/27 at 100.00 | AAA | 5,659,150 |
| | Trust Series 2017A, 4.000%, 10/15/37 | | | |
| 3,400 | | Travis County Health Facilities Development Corporation, Texas, Hospital Revenue Bonds, | 1/20 at 100.00 | Aaa | 3,446,138 |
| | Daughters of Charity National Health System, Series 1993B, 6.000%, 11/15/22 (ETM) | | | |
| 367,545 | | Total Texas | | | 344,968,451 |
| | Utah – 0.3% (0.2% of Total Investments) | | | |
| 2,030 | | Box Elder County, Utah, Solid Waste Disposal Revenue Bonds, Promontory Point Res, LLC, | 12/27 at 100.00 | N/R | 2,034,060 |
| | Senior Series 2017A, 8.000%, 12/01/39, 144A (AMT) | | | |
| 3,000 | | Salt Lake City, Utah, Airport Revenue Bonds, International Airport Series 2018A, 5.000%, | 7/28 at 100.00 | A2 | 3,554,280 |
| | 7/01/48 (AMT) | | | |
| 810 | | Utah Charter School Finance Authority, Charter School Revenue Bonds, North Davis | 7/20 at 100.00 | BBB– | 829,286 |
| | Preparatory Academy, Series 2010, 6.375%, 7/15/40 | | | |
| 1,555 | | Utah Charter School Finance Authority, Charter School Revenue Bonds, Paradigm High | 7/20 at 100.00 | BB | 1,580,564 |
| | School, Series 2010A, 6.375%, 7/15/40 | | | |
| 7,395 | | Total Utah | | | 7,998,190 |
| | Virginia – 1.2% (0.8% of Total Investments) | | | |
| 540 | | Embrey Mill Community Development Authority, Virginia, Special Assessment Revenue Bonds, | 3/25 at 100.00 | N/R | 564,689 |
| | Series 2015, 5.600%, 3/01/45, 144A | | | |
| 1,800 | | Henrico County Economic Development Authority, Virginia, Revenue Bonds, Bon Secours | 11/22 at 100.00 | A+ (4) | 1,999,854 |
| | Health System Obligated Group, Series 2013, 5.000%, 11/01/30 (Pre-refunded 11/01/22) | | | |
| 10,935 | | Metropolitan Washington DC Airports Authority, Airport System Revenue Bonds, Refunding | 10/27 at 100.00 | AA– | 12,858,248 |
| | Series 2017, 5.000%, 10/01/47 (AMT) | | | |
| 1,810 | | Virginia Small Business Financing Authority, Senior Lien Revenue Bonds, 95 Express Lanes | 1/22 at 100.00 | BBB | 1,929,243 |
| | LLC Project, Series 2012, 5.000%, 1/01/40 (AMT) | | | |
| | Virginia Small Business Financing Authority, Senior Lien Revenue Bonds, Elizabeth River | | | |
| | Crossing, Opco LLC Project, Series 2012: | | | |
| 1,885 | | 5.250%, 1/01/32 (AMT) | 7/22 at 100.00 | BBB | 2,053,538 |
| 4,480 | | 6.000%, 1/01/37 (AMT) | 7/22 at 100.00 | BBB | 4,963,661 |
| 3,810 | | 5.500%, 1/01/42 (AMT) | 7/22 at 100.00 | BBB | 4,148,290 |
| 25,260 | | Total Virginia | | | 28,517,523 |
| | Washington – 1.7% (1.1% of Total Investments) | | | |
| 1,260 | | Central Puget Sound Regional Transit Authority, Washington, Sales Tax and Motor Vehicle | 12/19 at 100.00 | AAA | 1,443,557 |
| | Excise Tax Bonds, Series 1999, 4.750%, 2/01/28 – FGIC Insured | | | |
| 6,000 | | Energy Northwest, Washington, Electric Revenue Bonds, Columbia Generating Station, | 7/25 at 100.00 | AA– | 7,022,040 |
| | Refunding Series 2015A, 5.000%, 7/01/38 (UB) (6) | | | |
| 10,000 | | Washington Health Care Facilities Authority, Revenue Bonds, Catholic Health, Series | 2/21 at 100.00 | BBB+ (4) | 10,459,100 |
| | 2011A, 5.000%, 2/01/41 (Pre-refunded 2/01/21) | | | |
| 6,065 | | Washington Health Care Facilities Authority, Revenue Bonds, Central Washington Health | 7/25 at 100.00 | Baa1 | 6,345,991 |
| | Services Association, Refunding Series 2015, 4.000%, 7/01/36 | | | |
| 7,190 | | Washington Health Care Facilities Authority, Revenue Bonds, Fred Hutchinson Cancer | 1/21 at 100.00 | A2 | 7,468,397 |
| | Research Center, Series 2011A, 5.625%, 1/01/35 | | | |
95
| | | | | |
| NZF | Nuveen Municipal Credit Income Fund | | |
| Portfolio of Investments (continued) | | | |
|
| October 31, 2019 | | | |
|
|
|
|
| Principal | | | Optional Call | | |
| Amount (000) | | Description (1) | Provisions (2) | Ratings (3) | Value |
| | Washington (continued) | | | |
| $ 2,940 | | Washington Health Care Facilities Authority, Revenue Bonds, Kadlec Regional Medical | 12/20 at 100.00 | N/R (4) | $ 3,076,210 |
| | Center, Series 2010, 5.500%, 12/01/39 (Pre-refunded 12/01/20) | | | |
| 2,185 | | Washington Health Care Facilities Authority, Revenue Bonds, Seattle Children’s Hospital, | 10/22 at 100.00 | Aa2 | 2,376,996 |
| | Series 2012A, 5.000%, 10/01/42 | | | |
| 1,410 | | Washington State, Motor Vehicle Fuel Tax General Obligation Bonds, Series 2003F, 0.000%, | No Opt. Call | AA+ | 1,314,346 |
| | 12/01/24 – NPFG Insured | | | |
| 37,050 | | Total Washington | | | 39,506,637 |
| | West Virginia – 0.6% (0.4% of Total Investments) | | | |
| 2,950 | | West Virginia Economic Development Authority, Solid Waste Disposal Facilities Revenue | 12/20 at 100.00 | Baa1 | 3,058,471 |
| | Bonds, Appalachian Power Company – Amos Project, Series 2010, 5.375%, 12/01/38 | | | |
| 5,160 | | West Virginia Hospital Finance Authority, Hospital Revenue Bonds, West Virginia United | 6/23 at 100.00 | A | 5,745,712 |
| | Health System Obligated Group, Refunding & Improvement Series 2013A, 5.500%, 6/01/44 | | | |
| 5,000 | | West Virginia Hospital Finance Authority, Revenue Bonds, West Virginia University Health | 6/27 at 100.00 | A | 5,827,650 |
| | System Obligated Group, Improvement Series 2017A, 5.000%, 6/01/47 | | | |
| 13,110 | | Total West Virginia | | | 14,631,833 |
| | Wisconsin – 1.7% (1.1% of Total Investments) | | | |
| 1,000 | | Public Finance Authority of Wisconsin, Charter School Revenue Bonds, Envision Science | 5/26 at 100.00 | N/R | 1,019,620 |
| | Academy Project, Series 2016A, 5.125%, 5/01/36, 144A | | | |
| | Public Finance Authority of Wisconsin, Charter School Revenue Bonds, North Carolina | | | |
| | Charter Educational Foundation Project, Series 2016A: | | | |
| 5,375 | | 5.000%, 6/15/36, 144A | 6/26 at 100.00 | N/R | 5,407,787 |
| 4,440 | | 5.000%, 6/15/46, 144A | 6/26 at 100.00 | N/R | 4,335,616 |
| | Public Finance Authority of Wisconsin, Conference Center and Hotel Revenue Bonds, | | | |
| | Lombard Public Facilities Corporation, First Tier Series 2018A-1: | | | |
| 80 | | 0.000%, 1/01/47, 144A | No Opt. Call | N/R | 2,651 |
| 70 | | 0.000%, 1/01/48, 144A | No Opt. Call | N/R | 2,330 |
| 69 | | 0.000%, 1/01/49, 144A | No Opt. Call | N/R | 2,288 |
| 66 | | 0.000%, 1/01/50, 144A | No Opt. Call | N/R | 2,167 |
| 65 | | 0.000%, 1/01/51, 144A | No Opt. Call | N/R | 2,133 |
| 85 | | 0.000%, 1/01/52, 144A | No Opt. Call | N/R | 2,713 |
| 84 | | 0.000%, 1/01/53, 144A | No Opt. Call | N/R | 2,677 |
| 81 | | 0.000%, 1/01/54, 144A | No Opt. Call | N/R | 2,562 |
| 79 | | 0.000%, 1/01/55, 144A | No Opt. Call | N/R | 2,499 |
| 78 | | 0.000%, 1/01/56, 144A | No Opt. Call | N/R | 2,450 |
| 3,850 | | 5.500%, 7/01/56, 144A | 3/28 at 100.00 | N/R | 3,696,708 |
| 86 | | 0.000%, 1/01/57, 144A | No Opt. Call | N/R | 2,686 |
| 84 | | 0.000%, 1/01/58, 144A | No Opt. Call | N/R | 2,601 |
| 81 | | 0.000%, 1/01/59, 144A | No Opt. Call | N/R | 2,529 |
| 80 | | 0.000%, 1/01/60, 144A | No Opt. Call | N/R | 2,438 |
| 79 | | 0.000%, 1/01/61, 144A | No Opt. Call | N/R | 2,376 |
| 76 | | 0.000%, 1/01/62, 144A | No Opt. Call | N/R | 2,289 |
| 75 | | 0.000%, 1/01/63, 144A | No Opt. Call | N/R | 2,229 |
| 73 | | 0.000%, 1/01/64, 144A | No Opt. Call | N/R | 2,177 |
| 72 | | 0.000%, 1/01/65, 144A | No Opt. Call | N/R | 2,107 |
| 78 | | 0.000%, 1/01/66, 144A | No Opt. Call | N/R | 2,195 |
| 935 | | 0.000%, 1/01/67, 144A | No Opt. Call | N/R | 24,915 |
| 1,055 | | Public Finance Authority of Wisconsin, Exempt Facilities Revenue Bonds, National Gypsum | 11/24 at 100.00 | N/R | 1,163,771 |
| | Company Project, Refunding Series 2014, 5.250%, 4/01/30 (AMT) | | | |
| 1,200 | | Public Finance Authority of Wisconsin, Exempt Facilities Revenue Bonds, National Gypsum | 8/26 at 100.00 | N/R | 1,247,412 |
| | Company Project, Refunding Series 2016, 4.000%, 8/01/35 (AMT) | | | |
| 1,000 | | Public Finance Authority, Wisconsin, Exempt Facilities Revenue Bonds, Celanese Project, | 5/26 at 100.00 | Baa3 | 1,092,200 |
| | Refunding Series 2016C, 4.300%, 11/01/30 (AMT) | | | |
| 3,000 | | Southeast Wisconsin Professional Baseball Park District, Sales Tax Revenue Refunding | No Opt. Call | AA– | 3,015,030 |
| | Bonds, Series 1998A, 5.500%, 12/15/19 – NPFG Insured | | | |
96
| | | | | | |
| Principal | | | Optional Call | | |
| Amount (000) | | Description (1) | Provisions (2) | Ratings (3) | Value |
| | Wisconsin (continued) | | | |
| $ 1,400 | | Wisconsin Health and Educational Facilities Authority, Revenue Bonds, Beloit Health | 4/20 at 100.00 | A | $ 1,415,288 |
| | System, Inc, Series 2010B, 5.000%, 4/01/30 | | | |
| 1,250 | | Wisconsin Health and Educational Facilities Authority, Revenue Bonds, Marshfield Clinic, | 2/22 at 100.00 | A– | 1,339,125 |
| | Series 2012B, 5.000%, 2/15/32 | | | |
| | Wisconsin Health and Educational Facilities Authority, Revenue Bonds, Mercy Alliance, | | | |
| | Inc, Series 2012: | | | |
| 2,105 | | 5.000%, 6/01/32 | 6/22 at 100.00 | A3 | 2,252,729 |
| 2,500 | | 5.000%, 6/01/39 | 6/22 at 100.00 | A3 | 2,654,775 |
| 1,120 | | Wisconsin Health and Educational Facilities Authority, Wisconsin, Revenue Bonds, Dickson | 10/22 at 102.00 | N/R | 1,197,840 |
| | Hollow Project Series 2014, 5.250%, 10/01/39 | | | |
| 4,000 | | Wisconsin Health and Educational Facilities Authority, Wisconsin, Revenue Bonds, | 8/24 at 100.00 | A+ | 4,445,120 |
| | ProHealth Care, Inc Obligated Group, Refunding Series 2015, 5.000%, 8/15/39 | | | |
| | Wisconsin Health and Educational Facilities Authority, Wisconsin, Revenue Bonds, Rogers | | | |
| | Memorial Hospital, Inc, Series 2014A: | | | |
| 1,415 | | 5.000%, 7/01/27 | 7/24 at 100.00 | A | 1,621,590 |
| 1,310 | | 5.000%, 7/01/29 | 7/24 at 100.00 | A | 1,493,806 |
| 3,000 | | Wisconsin Health and Educational Facilities Authority, Wisconsin, Revenue Bonds, Rogers | 7/24 at 100.00 | A | 3,335,580 |
| | Memorial Hospital, Inc, Series 2014B, 5.000%, 7/01/44 | | | |
| 41,496 | | Total Wisconsin | | | 40,807,009 |
| $ 3,912,810 | | Total Municipal Bonds (cost $3,317,401,712) | | | 3,699,028,238 |
|
| Shares | | Description (1), (10) | | | Value |
| | INVESTMENT COMPANIES – 0.1% (0.1% of Total Investments) | | | |
| 6,266 | | BlackRock MuniHoldings Fund Inc | | | $ 101,885 |
| 26,880 | | BNY Mellon Strategic Municipals Inc | | | 231,437 |
| 30,000 | | Invesco Municipal Opportunity Trust | | | 372,300 |
| 43,020 | | Invesco Trust for Investment Grade Municipals | | | 551,516 |
| 43,420 | | PIMCO Municipal Income Fund II | | | 676,484 |
| | Total Investment Companies (cost $1,790,280) | | | 1,933,622 |
|
| Principal | | | | | | |
| Amount (000) | | Description (1) | Coupon | Maturity | Ratings (3) | Value |
| | CORPORATE BONDS – 0.0% (0.0% of Total Investments) | | | | |
| | Industrials – 0.0% (0.0% of Total Investments) | | | | |
| $ 2,701 | | EWM P1 LLC (cash 13.750%, PIK 1.250%) (7), (9) | 15.000% | 9/01/28 | N/R | $ — |
| 1,500 | | EWM P1 LLC (7), (9) | 15.000% | 9/01/28 | N/R | — |
| $ 4,201 | | Total Corporate Bonds (cost $4,201,140) | | | | — |
| | Total Long-Term Investments (cost $3,323,393,132) | | | | 3,700,961,860 |
| | Floating Rate Obligations – (1.0)% | | | | (23,620,000) |
| | MuniFund Preferred Shares, net of deferred offering costs – (27.1)% (11) | | | | (639,973,963) |
| | Variable Rate Demand Preferred Shares, net of deferred offering costs – (30.6)% (12) | | | | (722,295,855) |
| | Other Assets Less Liabilities – 2.1% | | | | 48,949,461 |
| | Net Assets Applicable to Common Shares – 100% | | | | $ 2,364,021,503 |
97
| | |
| NZF | Nuveen Municipal Credit Income Fund Portfolio of Investments (continued)
October 31, 2019 |
| | |
(1) | All percentages shown in the Portfolio of Investments are based on net assets applicable to common shares unless otherwise noted. |
(2) | Optional Call Provisions: Dates (month and year) and prices of the earliest optional call or redemption. There may be other call provisions at varying prices at later dates. Certain mortgage-backed securities may be subject to periodic principal paydowns. Optional Call Provisions are not covered by the report of independent registered public accounting firm. |
(3) | The ratings disclosed are the lowest of Standard & Poor’s Group (“Standard & Poor’s”), Moody’s Investors Service, Inc. (“Moody’s”) or Fitch, Inc. (“Fitch”) rating. Ratings below BBB by Standard & Poor’s, Baa by Moody’s or BBB by Fitch are considered to be below investment grade. Holdings designated N/R are not rated by any of these national rating agencies. Ratings are not covered by the report of independent registered public accounting firm. |
(4) | Backed by an escrow or trust containing sufficient U.S. Government or U.S. Government agency securities, which ensure the timely payment of principal and interest. |
(5) | Step-up coupon bond, a bond with a coupon that increases (“steps up”), usually at regular intervals, while the bond is outstanding. The rate shown is the coupon as of the end of the reporting period. |
(6) | Investment, or portion of investment, has been pledged to collateralize the net payment obligations for investments in inverse floating rate transactions. |
(7) | Defaulted security. A security whose issuer has failed to fully pay principal and/or interest when due, or is under the protection of bankruptcy. |
(8) | Effective February 12, 2019, the par value of the original bonds was replaced with taxable and tax exempt Puerto Rico Sales Tax Financing Corporation (commonly known as COFINA) bond units that are collateralized by a bundle of zero and coupon paying bonds. The quantity shown represents units in a trust, which were assigned according to the original bond’s accreted value. These securities do not have a stated coupon interest rate and income will be recognized through accretion of the discount associated with the trust units. The factor at which these units accrete can also decrease, primarily for principal payments generated from coupon payments received or dispositions of the underlying bond collateral. The quantity of units will not change as a result of these principal payments. |
(9) | Investment valued at fair value using methods determined in good faith by, or at the discretion of, the Board. For fair value measurement disclosure purposes, investment classified as Level 3. See Notes to Financial Statements, Note 3 – Investment Valuation and Fair Value Measurements for more information. |
(10) | A copy of the most recent financial statements for these investment companies can be obtained directly from the Securities and Exchange Commission on its website at http://www.sec.gov. |
(11) | MuniFund Preferred Shares, net of deferred offering costs as a percentage of Total Investments is 17.3%. |
(12) | Variable Rate Demand Preferred Shares, net of deferred offering costs as a percentage of Total Investments is 19.5%. |
144A | Investment is exempt from registration under Rule 144A of the Securities Act of 1933, as amended. These investments may only be resold in transactions exempt from registration, which are normally those transactions with qualified institutional buyers. |
ATM | Alternative Minimum Tax. |
ETM | Escrowed to maturity. |
IF | Inverse floating rate security issued by a tender option bond (“TOB”) trust, the interest rate on which varies inversely with the Securities Industry Financial Markets Association (SIFMA) short-term rate, which resets weekly, or a similar short-term rate, and is reduced by the expenses related to the TOB trust. |
PIK | Payment-in-kind (“PIK”) security. Depending on the terms of the security, income may be received in the form of cash, securities, or a combination of both. The PIK rate shown, where applicable, represents the annualized rate of the last PIK payment made by the issuer as of the end of the reporting period. |
UB | Underlying bond of an inverse floating rate trust reflected as a financing transaction. See Notes to Financial Statements, Note 4 – Portfolio Securities and Investments in Derivatives, Inverse Floating Rate Securities for more information. |
| See accompanying notes to financial statements |
98
| | |
| NMZ | Nuveen Municipal High Income Opportunity Fund Portfolio of Investments
October 31, 2019 |
| | | | | | |
| Principal | | | Optional Call | | |
| Amount (000) | | Description (1) | Provisions (2) | Ratings (3) | Value |
| | LONG-TERM INVESTMENTS – 142.8% (98.7% of Total Investments) | | | |
| | MUNICIPAL BONDS – 141.7% (97.9% of Total Investments) | | | |
| | Alabama – 1.8% (1.3% of Total Investments) | | | |
| $ 182 | | Adamsville Solid Waste Disposal Authority, Alabama, Solid Waste Disposal Revenue Bonds, | 12/19 at 100.00 | N/R | $ 2 |
| | Big Sky Environmental LLC Project, Refunding Taxable Series 2017C, 1.000%, 9/01/37, 144A (4) | | | |
| 1,000 | | Adamsville Solid Waste Disposal Authority, Alabama, Solid Waste Disposal Revenue Bonds, | 9/27 at 100.00 | N/R | 700,000 |
| | Big Sky Environmental LLC Project, Series 2017A, 6.750%, 9/01/37, 144A (4) | | | |
| 213 | | Adamsville Solid Waste Disposal Authority, Alabama, Solid Waste Disposal Revenue Bonds, | 9/27 at 100.00 | N/R | 148,646 |
| | Big Sky Environmental LLC Project, Taxable Series 2017B, 6.750%, 9/01/37, 144A (4) | | | |
| 1,000 | | Alabama Industrial Development Authority, Solid Waste Disposal Revenue Bonds, Pine City | 12/19 at 100.00 | B1 | 1,013,980 |
| | Fiber Co Project, Series 1993, 6.450%, 12/01/23 (AMT) | | | |
| 2,000 | | Alabama Private Colleges and University Facilities Authority, Limited Obligation Bonds, | 9/25 at 100.00 | N/R | 2,155,260 |
| | University of Mobile Project, Series 2015A, 6.000%, 9/01/45, 144A | | | |
| 9,765 | | Hoover Industrial Development Board, Alabama, Environmental Improvement Revenue Bonds, | 10/29 at 100.00 | B3 | 10,315,648 |
| | United States Steel Corporation Project, Series 2019, 5.750%, 10/01/49 (AMT) | | | |
| 1,000 | | Jefferson County, Alabama, Sewer Revenue Warrants, Senior Lien Series 2013C, 0.000%, | 10/23 at 105.00 | BB+ | 976,480 |
| | 10/01/38 – AGM Insured | | | |
| 2,260 | | Tuscaloosa County Industrial Development Authority, Alabama, Gulf Opportunity Zone | 5/29 at 100.00 | N/R | 2,493,029 |
| | Bonds, Hunt Refining Project, Refunding Series 2019A, 4.500%, 5/01/32, 144A | | | |
| 17,420 | | Total Alabama | | | 17,803,045 |
| | Arizona – 2.6% (1.8% of Total Investments) | | | |
| 5,000 | | Arizona Industrial Development Authority, Arizona, Education Facility Revenue Bonds, | 9/23 at 105.00 | BB+ | 5,355,550 |
| | Pinecrest Academy of Nevada-Sloan Canyon Project, Refunding Series 2018A, | | | |
| | 6.150%, 9/15/53, 144A | | | |
| 500 | | Arizona Industrial Development Authority, Arizona, Education Revenue Bonds, Leman | 7/24 at 101.00 | N/R | 513,060 |
| | Academy of Excellence – Parker Colorado Campus Project, Series 2019A, | | | |
| | 5.000%, 7/01/54, 144A | | | |
| 1,000 | | Arizona Industrial Development Authority, Education Facility Revenue Bonds, Caurus | 6/28 at 100.00 | N/R | 1,061,270 |
| | Academy Project, Series 2018A, 6.500%, 6/01/50, 144A | | | |
| 3,000 | | Phoenix Industrial Development Authority, Arizona, Lease Revenue Bonds, Rowan University | 6/22 at 100.00 | A3 | 3,804,870 |
| | Project, Tender Option Bond Trust 2016-XF2337, 14.091%, 6/01/42, 144A (IF) (5) | | | |
| 440 | | Phoenix Industrial Development Authority, Arizona, Multifamily Housing Revenue Bonds, | 7/24 at 101.00 | N/R | 446,081 |
| | Deer Valley Veterans Assisted Living Project, Series 2016A, 5.125%, 7/01/36 | | | |
| 1,000 | | Pima County Industrial Development Authority, Arizona, Charter School Revenue Bonds, | 5/24 at 100.00 | N/R | 1,108,140 |
| | Desert Heights Charter School, Series 2014, 7.250%, 5/01/44 | | | |
| 100 | | Pima County Industrial Development Authority, Arizona, Education Facility Revenue Bonds, | 7/20 at 102.00 | BB– | 102,046 |
| | Edkey Charter Schools Project, Series 2014A, 6.875%, 7/01/34 | | | |
| | Pima County Industrial Development Authority, Arizona, Education Facility Revenue Bonds, | | | |
| | Edkey Charter Schools Project, Series 2016: | | | |
| 245 | | 5.250%, 7/01/36 | 7/26 at 100.00 | BB– | 231,131 |
| 400 | | 5.375%, 7/01/46 | 7/26 at 100.00 | BB– | 365,788 |
| 475 | | 5.500%, 7/01/51 | 7/26 at 100.00 | BB– | 436,957 |
| 2,000 | | Pima County Industrial Development Authority, Arizona, Education Facility Revenue Bonds, | 2/24 at 100.00 | N/R | 2,312,860 |
| | San Tan Montessori School Project, Series 2014A, 9.000%, 2/01/44 | | | |
| 100 | | Pima County Industrial Development Authority, Arizona, Education Facility Revenue Bonds, | 7/25 at 100.00 | N/R | 100,848 |
| | The Paideia Academies Project, 2019, 5.125%, 7/01/39 | | | |
| 2,500 | | Pima County Industrial Development Authority, Arizona, Education Revenue Bonds, Carden | 1/22 at 100.00 | B | 2,433,925 |
| | Traditional Schools Project, Series 2012, 7.500%, 1/01/42 | | | |
99
| | | | | |
| NMZ | Nuveen Municipal High Income Opportunity Fund | |
| Portfolio of Investments (continued) | | | |
|
| October 31, 2019 | | | |
|
|
|
|
| Principal | | | Optional Call | | |
| Amount (000) | | Description (1) | Provisions (2) | Ratings (3) | Value |
| | Arizona (continued) | | | |
| $ 885 | | Pinal County Industrial Development Authority, Arizona, Correctional Facilities Contract | 12/19 at 100.00 | BBB– | $ 886,159 |
| | Revenue Bonds, Florence West Prison LLC, Series 2002A, 5.250%, 10/01/22 – ACA Insured | | | |
| 1,485 | | Quechan Indian Tribe of the Fort Yuma Reservation, Arizona, Tribal Economic Development | 5/22 at 100.00 | BB– | 1,625,021 |
| | Bonds, Series 2012A, 9.750%, 5/01/25 | | | |
| 2,500 | | Salt Verde Financial Corporation, Arizona, Senior Gas Revenue Bonds, Citigroup Energy | No Opt. Call | Ba3 | 3,474,450 |
| | Inc Prepay Contract Obligations, Series 2007, 5.500%, 12/01/37, 144A | | | |
| 975 | | Yuma County Industrial Development Authority, Arizona, Exempt Revenue Bonds, Far West | 1/20 at 100.00 | N/R | 952,994 |
| | Water & Sewer Inc Refunding, Series 2007A, 6.375%, 12/01/37 (AMT) | | | |
| 22,605 | | Total Arizona | | | 25,211,150 |
| | Arkansas – 0.2% (0.1% of Total Investments) | | | |
| 2,000 | | Arkansas Development Finance Authority, Industrial Development Revenue Bonds, Big River | 9/26 at 103.00 | B | 2,129,000 |
| | Steel Project, Series 2019, 4.500%, 9/01/49, 144A (AMT) | | | |
| | California – 19.2% (13.2% of Total Investments) | | | |
| 18,875 | | Alameda Corridor Transportation Authority, California, Revenue Bonds, Refunding Second | 10/26 at 100.00 | Baa2 | 22,044,679 |
| | Subordinate Lien Series 2016B, 5.000%, 10/01/37 (UB) (5) | | | |
| 1,000 | | California Enterprise Development Authority, Recovery Zone Facility Revenue Bonds, | 4/21 at 100.00 | N/R | 1,043,490 |
| | SunPower Corporation – Headquarters Project, Series 2010, 8.500%, 4/01/31 | | | |
| 2,205 | | California County Tobacco Securitization Agency, Tobacco Settlement Asset-Backed Bonds, | 12/19 at 100.00 | B– | 2,211,152 |
| | Sonoma County Tobacco Securitization Corporation, Series 2005, 5.125%, 6/01/38 | | | |
| | California Health Facilities Financing Authority, Refunding Revenue Bonds, Stanford | | | |
| | Hospital and Clinics, Tender Option Bond Trust 2016-XF2353: | | | |
| 1,250 | | 15.553%, 11/15/40 (Pre-refunded 11/15/21), 144A (IF) (5) | 11/21 at 100.00 | AA– (6) | 1,676,075 |
| 1,875 | | 16.543%, 11/15/40 (Pre-refunded 11/15/21), 144A (IF) (5) | 11/21 at 100.00 | AA– (6) | 2,551,706 |
| | California Health Facilities Financing Authority, Revenue Bonds, Children’s Hospital Los | | | |
| | Angeles, Series 2017A: | | | |
| 5,165 | | 5.000%, 8/15/42 (UB) (5) | 8/27 at 100.00 | Baa2 | 6,111,176 |
| 22,115 | | 5.000%, 8/15/47 (UB) (5) | 8/27 at 100.00 | Baa2 | 25,948,414 |
| 12,500 | | California Health Facilities Financing Authority, Revenue Bonds, Kaiser Permanente | 11/27 at 100.00 | AA– | 13,860,875 |
| | System, Series 2017A-2, 4.000%, 11/01/44 (UB) (5) | | | |
| | California Health Facilities Financing Authority, Revenue Bonds, Stanford Hospitals and | | | |
| | Clinics, Tender Option Bond Trust 2016-XG0049: | | | |
| 1,000 | | 14.776%, 8/15/51, 144A (IF) (5) | 8/22 at 100.00 | AA– | 1,378,870 |
| 250 | | 14.779%, 8/15/51, 144A (IF) (5) | 8/22 at 100.00 | AA– | 344,745 |
| 1,020 | | California Municipal Finance Authority, Mobile Home Park Revenue Bonds, Caritas | 8/24 at 100.00 | N/R | 1,115,931 |
| | Affordable Housing Inc Projects, Series 2014B, 5.875%, 8/15/49 | | | |
| 960 | | California Municipal Finance Authority, Mobile Home Park Revenue Bonds, Caritas Projects | 8/20 at 100.00 | N/R (6) | 1,005,734 |
| | Series 2010B, 7.250%, 8/15/45 (Pre-refunded 8/15/20) | | | |
| 500 | | California Municipal Finance Authority, Revenue Bonds, California Baptist University, | 11/26 at 100.00 | N/R | 574,540 |
| | Series 2016A, 5.000%, 11/01/36, 144A | | | |
| 7,430 | | California Municipal Finance Authority, Revenue Bonds, Eisenhower Medical Center, | 7/27 at 100.00 | BBB– | 8,061,327 |
| | Refunding Series 2017B, 4.000%, 7/01/42 (UB) (5) | | | |
| 20,925 | | California Municipal Finance Authority, Revenue Bonds, Linxs APM Project, Senior Lien | 6/28 at 100.00 | BBB | 22,304,167 |
| | Series 2018A, 4.000%, 12/31/47 (AMT) (UB) (5) | | | |
| 400 | | California Pollution Control Financing Authority, Solid Waste Disposal Revenue Bonds, | No Opt. Call | N/R | 120,000 |
| | Aemerge Redpak Services Southern California, LLC Project, Subordinate Series 2017, 8.000%, | | | |
| | 12/01/27, 144A (AMT) | | | |
| 3,795 | | California Public Finance Authority, Revenue Bonds, Verity Health System, Series 2015B, | No Opt. Call | N/R | 3,818,719 |
| | 7.250%, 6/10/20 (4) | | | |
| 1,950 | | California School Finance Authority, Educational Facilities Revenue Bonds, Tri-Valley | 6/20 at 102.00 | N/R | 39,000 |
| | Learning Corporation, Series 2012A, 7.000%, 6/01/47 (4) | | | |
100
| | | | | | |
| Principal | | | Optional Call | | |
| Amount (000) | | Description (1) | Provisions (2) | Ratings (3) | Value |
| | California (continued) | | | |
| $ 1,300 | | California State, General Obligation Bonds, Tender Option Bond Trust 2016-XG0039, | 3/20 at 100.00 | AA | $ 1,370,304 |
| | 16.320%, 3/01/40 – AGM Insured, 144A (IF) (5) | | | |
| | California Statewide Communities Development Authority, California, Revenue Bonds, Loma | | | |
| | Linda University Medical Center, Series 2014A: | | | |
| 800 | | 5.250%, 12/01/44 | 12/24 at 100.00 | BB– | 886,488 |
| 1,000 | | 5.500%, 12/01/54 | 12/24 at 100.00 | BB– | 1,114,690 |
| 6,940 | | California Statewide Communities Development Authority, California, Revenue Bonds, Loma | 6/26 at 100.00 | BB– | 7,832,900 |
| | Linda University Medical Center, Series 2016A, 5.250%, 12/01/56, 144A | | | |
| 500 | | California Statewide Communities Development Authority, Revenue Bonds, Lancer | 6/26 at 100.00 | N/R | 555,475 |
| | Educational Student Housing Project, Refunding Series 2016A, 5.000%, 6/01/46, 144A | | | |
| 1,000 | | California Statewide Communities Development Authority, Special Tax Bonds, Community | 9/22 at 100.00 | N/R | 1,070,320 |
| | Facilities District 2012-01, Fancher Creek, Series 2013A, 5.700%, 9/01/43 | | | |
| 1,555 | | California Statewide Communities Development Authority, Statewide Community | 9/21 at 100.00 | N/R | 1,593,035 |
| | Infrastructure Program Revenue Bonds, Series 2011A, 8.000%, 9/02/41 | | | |
| 500 | | California Statewide Community Development Authority, Revenue Bonds, California Baptist | 11/21 at 100.00 | N/R (6) | 563,295 |
| | University, Series 2011A, 7.500%, 11/01/41 (Pre-refunded 11/01/21) | | | |
| 1,500 | | California Statewide Community Development Authority, Revenue Bonds, Daughters of | 12/19 at 100.00 | CC | 1,469,880 |
| | Charity Health System, Series 2005A, 5.500%, 7/01/39 | | | |
| 1,825 | | Daly City Housing Development Finance Agency, California, Mobile Home Park Revenue | 12/19 at 100.00 | N/R | 1,828,194 |
| | Bonds, Franciscan Mobile Home Park Project, Refunding Third Tier Series 2007C, 6.500%, 12/15/47 | | | |
| 2,000 | | Daly City Housing Development Finance Agency, California, Mobile Home Park Revenue | 12/19 at 100.00 | A+ | 2,004,880 |
| | Bonds, Franciscan Mobile Home Park, Refunding Series 2007A, 5.000%, 12/15/37 | | | |
| | Golden State Tobacco Securitization Corporation, California, Enhanced Tobacco Settlement | | | |
| | Asset-Backed Revenue Bonds, Refunding Series 2015A: | | | |
| 2,000 | | 5.000%, 6/01/40 (UB) (5) | 6/25 at 100.00 | A+ | 2,327,680 |
| 2,000 | | 5.000%, 6/01/45 (UB) (5) | 6/25 at 100.00 | A+ | 2,313,920 |
| 3,500 | | Golden State Tobacco Securitization Corporation, California, Tobacco Settlement | 6/22 at 100.00 | B– | 3,633,175 |
| | Asset-Backed Bonds, Senior Convertible Series 2007A-2, 5.300%, 6/01/37 | | | |
| 2,660 | | Golden State Tobacco Securitization Corporation, California, Tobacco Settlement | 6/22 at 100.00 | N/R | 2,735,544 |
| | Asset-Backed Bonds, Series 2018A-1, 5.000%, 6/01/47 | | | |
| 5,000 | | Golden State Tobacco Securitization Corporation, California, Tobacco Settlement | 6/22 at 100.00 | N/R | 5,142,000 |
| | Asset-Backed Bonds, Series 2018A-2, 5.000%, 6/01/47 | | | |
| 860 | | Golden State Tobacco Securitization Corporation, California, Tobacco Settlement | 6/25 at 100.00 | A+ | 1,399,891 |
| | Asset-Backed Bonds, Tender Option Bond Trust 2015-XF1038, 14.070%, | | | |
| | 6/01/45, 144A (IF) (5) | | | |
| 1,500 | | Grossmont Healthcare District, California, General Obligation Bonds, Tender Option Bond | 7/21 at 100.00 | Aaa | 2,020,365 |
| | Trust 2017-ZF2453, 19.080%, 7/15/40 (Pre-refunded 7/15/21), 144A (IF) (5) | | | |
| | Hercules Redevelopment Agency, California, Tax Allocation Bonds, Merged Project Area, | | | |
| | Series 2005: | | | |
| 1,000 | | 5.000%, 8/01/25 – AMBAC Insured | 12/19 at 100.00 | N/R | 1,015,140 |
| 1,000 | | 5.000%, 8/01/35 – AMBAC Insured | 12/19 at 100.00 | N/R | 1,010,800 |
| 390 | | Lee Lake Public Financing Authority, California, Junior Lien Revenue Bonds, Series | 9/23 at 100.00 | N/R | 425,525 |
| | 2013B, 5.250%, 9/01/32 | | | |
| 850 | | Los Angeles County, California, Community Development Commission Headquarters Office | 9/21 at 100.00 | Aa3 | 1,083,691 |
| | Building, Lease Revenue Bonds, Community Development Properties Los Angeles County Inc, | | | |
| | Tender Option Bond Trust 2016-XL0022, 15.186%, 9/01/42, 144A (IF) (5) | | | |
| 1,825 | | Los Angeles Department of Airports, California, Revenue Bonds, Los Angeles International | 5/20 at 100.00 | AA | 1,974,778 |
| | Airport, Tender Option Bond Trust 2016-XL0005, 14.621%, 5/15/40, 144A (IF) (5) | | | |
| 1,000 | | Lynwood Redevelopment Agency, California, Tax Allocation Revenue Bonds, Project Area A, | 9/21 at 100.00 | A | 1,102,090 |
| | Subordinate Lien Series 2011A, 7.000%, 9/01/31 | | | |
101
| | | | | |
| NMZ | Nuveen Municipal High Income Opportunity Fund | |
| Portfolio of Investments (continued) | | | |
|
| October 31, 2019 | | | |
|
|
|
|
| Principal | | | Optional Call | | |
| Amount (000) | | Description (1) | Provisions (2) | Ratings (3) | Value |
| | California (continued) | | | |
| | March Joint Powers Redevelopment Agency, California, Tax Allocation Revenue Bonds, March | | | |
| | Air Force Base Redevelopment Project, Series 2011A: | | | |
| $ 1,000 | | 7.000%, 8/01/26 (Pre-refunded 8/01/21) | 8/21 at 100.00 | N/R (6) | $ 1,101,300 |
| 1,500 | | 7.500%, 8/01/41 (Pre-refunded 8/01/21) | 8/21 at 100.00 | N/R (6) | 1,664,850 |
| 500 | | National City Community Development Commission, California, Tax Allocation Bonds, | 8/21 at 100.00 | A (6) | 551,650 |
| | National City Redevelopment Project, Series 2011, 7.000%, 8/01/32 (Pre-refunded 8/01/21) | | | |
| 330 | | Novato Redevelopment Agency, California, Tax Allocation Bonds, Hamilton Field | 9/21 at 100.00 | A– ( 6) | 364,416 |
| | Redevelopment Project, Series 2011, 6.750%, 9/01/40 (Pre-refunded 9/01/21) | | | |
| | Palomar Pomerado Health Care District, California, Certificates of Participation, Series 2010: | | | |
| 200 | | 5.250%, 11/01/21 (Pre-refunded 11/01/20) | 11/20 at 100.00 | Ba1 (6) | 205,150 |
| 1,000 | | 6.000%, 11/01/41 (Pre-refunded 11/01/20) | 11/20 at 100.00 | Ba1 (6) | 1,048,600 |
| 1,200 | | Riverside County Redevelopment Agency, California, Tax Allocation Bonds, Jurupa Valley | 10/21 at 100.00 | A | 1,325,568 |
| | Project Area, Series 2011B, 6.750%, 10/01/30 | | | |
| | Sacramento City Financing Authority California, Lease Revenue Bonds, Master Lease | | | |
| | Program Facilities Projects, Tender Option Bond Trust 2016-XG0100: | | | |
| 750 | | 15.322%, 12/01/30, 144A (IF) (5) | No Opt. Call | A+ | 1,633,650 |
| 2,015 | | 15.112%, 12/01/33, 144A (IF) (5) | No Opt. Call | A+ | 4,903,563 |
| | San Buenaventura, California, Revenue Bonds, Community Memorial Health System, | | | |
| | Series 2011: | | | |
| 960 | | 8.000%, 12/01/26 | 12/21 at 100.00 | BB | 1,079,395 |
| 1,000 | | 8.000%, 12/01/31 | 12/21 at 100.00 | BB | 1,119,960 |
| 4,095 | | San Francisco City and County Redevelopment Agency Successor Agency, California, Tax | 8/21 at 61.78 | N/R | 2,382,184 |
| | Allocation Bonds, Mission Bay South Redevelopment Project, Subordinate Series 2016D, | | | |
| | 0.000%, 8/01/31, 144A | | | |
| 960 | | Santa Margarita Water District, California, Special Tax Bonds, Community Facilities | 9/23 at 100.00 | N/R | 1,063,843 |
| | District 2013-1 Village of Sendero, Series 2013, 5.625%, 9/01/43 | | | |
| 1,000 | | Santee Community Development Commission, California, Santee Redevelopment Project Tax | 2/21 at 100.00 | A (6) | 1,073,700 |
| | Allocation Bonds, Series 2011A, 7.000%, 8/01/41 (Pre-refunded 2/01/21) | | | |
| 1,065 | | Temecula Public Financing Authority, California, Special Tax Bonds, Community Facilities | 9/27 at 100.00 | N/R | 1,145,248 |
| | District 16-01, Series 2017, 6.250%, 9/01/47, 144A | | | |
| 1,890 | | Tobacco Securitization Authority of Northern California, Tobacco Settlement Asset-Backed | 11/19 at 100.00 | B– | 1,897,352 |
| | Bonds, Series 2005A-1, 5.500%, 6/01/45 | | | |
| 650 | | Twentynine Palms Redevelopment Agency, California, Tax Allocation Bonds, Four Corners | 9/21 at 100.00 | BBB+ (6) | 727,207 |
| | Project Area, Series 2011A, 7.650%, 9/01/42 (Pre-refunded 9/01/21) | | | |
| 1,250 | | University of California, General Revenue Bonds, Tender Option Bond Trust 2016-XL0001, | 5/23 at 100.00 | AA | 1,849,375 |
| | 14.720%, 5/15/39, 144A (IF) (5) | | | |
| 167,085 | | Total California | | | 185,821,671 |
| | Colorado – 7.5% (5.2% of Total Investments) | | | |
| 500 | | Aviation Station North Metropolitan District 2, Denver County, Colorado, Limited Tax | 9/24 at 103.00 | N/R | 514,940 |
| | General Obligation Bonds, Subordinate Series 2019B, 7.750%, 12/15/48 | | | |
| 500 | | Cherry Creek Corporate Center Metropolitan District, Arapahoe County, Colorado, Revenue | 12/21 at 103.00 | N/R | 504,150 |
| | Bonds, Refunding Subordinate Lien Series 2016B, 8.000%, 6/15/37 | | | |
| 750 | | Colorado Educational and Cultural Facilities Authority, Charter School Revenue Bonds, | 12/19 at 100.00 | BB+ | 751,748 |
| | Community Leadership Academy Project, Series 2008, 6.250%, 7/01/28 | | | |
| 2,180 | | Colorado Educational and Cultural Facilities Authority, Charter School Revenue Bonds, | 10/22 at 100.00 | N/R | 2,298,941 |
| | Mountain Phoenix Community School, Series 2012, 7.000%, 10/01/42 | | | |
| 560 | | Colorado Educational and Cultural Facilities Authority, Charter School Revenue Bonds, | 7/24 at 100.00 | BB | 591,427 |
| | Skyview Academy Project, Series 2014, 5.375%, 7/01/44, 144A | | | |
| 2,500 | | Colorado Health Facilities Authority, Colorado, Revenue Bonds, American Baptist Homes of | 2/24 at 100.00 | N/R | 2,836,250 |
| | the Midwest Obligated Group, Series 2013, 8.000%, 8/01/43 | | | |
| 1,000 | | Colorado Health Facilities Authority, Colorado, Revenue Bonds, American Baptist Homes | 2/26 at 100.00 | N/R | 1,032,790 |
| | Project, Series 2016, 6.125%, 2/01/46, 144A | | | |
102
| | | | | | |
| Principal | | | Optional Call | | |
| Amount (000) | | Description (1) | Provisions (2) | Ratings (3) | Value |
| | Colorado (continued) | | | |
| $ 4,920 | | Colorado Health Facilities Authority, Colorado, Revenue Bonds, CommonSpirit Health, | 8/29 at 100.00 | BBB+ | $ 5,264,498 |
| | Series 2019A-2, 4.000%, 8/01/49 | | | |
| 1,285 | | Colorado Health Facilities Authority, Colorado, Revenue Bonds, Craig Hospital Project, | 12/22 at 100.00 | A+ | 1,398,838 |
| | Series 2012, 5.000%, 12/01/32 (UB) (5) | | | |
| 750 | | Colorado Health Facilities Authority, Health Facilities Revenue Bonds, Sisters of | 1/20 at 100.00 | AA– | 769,193 |
| | Charity of Leavenworth Health Services Corporation, Tender Option Bond Trust 2015-XF0054, | | | |
| | 15.239%, 1/01/30, 144A (IF) | | | |
| 518 | | Colorado Housing and Finance Authority, Revenue Bonds, Confluence Energy LLC Project, | No Opt. Call | N/R | — |
| | Series 2007, 5.000%, 6/01/18 (4), (7) | | | |
| | Colorado Housing and Finance Authority, Revenue Bonds, Confluence Energy LLC Project, | | | |
| | Series 2017: | | | |
| 5,045 | | 6.750%, 4/01/27 (AMT) (4), (7) | No Opt. Call | N/R | 254,370 |
| 2,224 | | 6.875%, 10/01/27 (AMT) (4), (7) | No Opt. Call | N/R | 769,417 |
| 2,000 | | Compark Business Campus Metropolitan District, Douglas County, Colorado, General | 12/22 at 100.00 | N/R (6) | 2,324,200 |
| | Obligation Bonds, Series 2012A, 6.750%, 12/01/39 (Pre-refunded 12/01/22) | | | |
| | Confluence Metropolitan District, Colorado, General Obligation Limited Tax Bonds, Series 2007: | | | |
| 1,000 | | 5.400%, 12/01/27 (4) | 12/19 at 100.00 | N/R | 600,000 |
| 1,500 | | 5.450%, 12/01/34 | 12/19 at 100.00 | N/R | 900,000 |
| 1,000 | | Cross Creek North Community Development District, Clay County, Florida, Special | 11/29 at 100.00 | N/R | 1,069,600 |
| | Assessment Bonds, Series 2018, 5.375%, 11/01/50, 144A | | | |
| 10,000 | | Denver City and County, Colorado, Airport System Revenue Bonds, Subordinate Lien Series | 12/28 at 100.00 | A | 10,814,800 |
| | 2018A, 4.000%, 12/01/48 (AMT) (UB) (5) | | | |
| 500 | | Dinosaur Ridge Metropolitan District, Golden, Jefferson County, Colorado, Special | 6/24 at 103.00 | N/R | 510,730 |
| | Revenue Refunding and Improvement Bonds, Series 2019A, 5.000%, 6/01/49 | | | |
| 2,000 | | E-470 Public Highway Authority, Colorado, Toll Revenue Bonds, Series 2004A, 0.010%, | No Opt. Call | A | 1,699,180 |
| | 9/01/27 – NPFG Insured | | | |
| 708 | | Erie Highlands Metropolitan District No 1 (In the Town of Erie), Weld County, Colorado, | 12/20 at 103.00 | N/R | 726,493 |
| | General Obligation Limited Tax Bonds, Series 2015B, 7.750%, 12/15/45 | | | |
| 880 | | Fitzsimons Village Metropolitan District 1, Aurora, Arapahoe County, Colorado, Tax Increment | 3/20 at 100.00 | N/R | 887,867 |
| | Public Improvement Fee Supported Revenue Bonds, Series 2010A, 7.500%, 3/01/40 | | | |
| 1,000 | | Fitzsimons Village Metropolitan District 3, Arapahoe County, Colorado, Tax | 3/20 at 100.00 | N/R | 968,850 |
| | Increment/Public Improvement Fee Supported Revenue Bonds, Series 2014A, 6.000%, 3/01/44 | | | |
| | Foothills Metropolitan District, Fort Collins, Colorado, Special Revenue Bonds, Series 2014: | | | |
| 1,000 | | 5.750%, 12/01/30 | 12/24 at 100.00 | N/R | 1,058,900 |
| 2,080 | | 6.000%, 12/01/38 | 12/24 at 100.00 | N/R | 2,196,896 |
| 500 | | Fourth Street Crossing Business Improvement District, Silverthorne, Summit County, Colorado, | 6/24 at 103.00 | N/R | 509,945 |
| | Special Revenue and Tax Supported Bonds, Senior Series 2019A, 5.375%, 12/01/49, 144A | | | |
| 1,989 | | Great Western Metropolitan District 5, Colorado, General Obligation Limited Tax Revenue | 12/19 at 100.00 | N/R | 1,937,286 |
| | Bonds, Series 2009A-1, 6.750%, 8/01/39 (4) | | | |
| 2,000 | | Heritage Todd Creek Metropolitan District, Colorado, General Obligation Bonds Limited | 12/24 at 100.00 | N/R | 2,089,640 |
| | Tax, Refunding & Improvement Series 2015, 6.125%, 12/01/44 | | | |
| 912 | | Heritage Todd Creek Metropolitan District, Colorado, General Obligation Bonds Limited | 12/19 at 100.00 | N/R | 912,328 |
| | Tax, Series 2007A, 5.500%, 12/01/37 | | | |
| 1,000 | | Iliff Commons Metropolitan District 2, Aurora, Arapahoe County, Colorado, General | 12/20 at 103.00 | N/R | 1,041,120 |
| | Obligation Bonds, Limited Tax Convertible to Unlimited Tax Series 2015, 6.250%, 12/01/44 | | | |
| 305 | | Iliff Commons Metropolitan District 2, Aurora, Arapahoe County, Colorado, General | 12/21 at 103.00 | N/R | 318,859 |
| | Obligation Bonds, Subordinated Limited Tax Convertible to Unlimited Tax Series 2016B, | | | |
| | 8.000%, 12/15/46 | | | |
| 2,000 | | Jefferson Center Metropolitan District 1, Arvada, Jefferson County, Colorado, Revenue | 12/20 at 103.00 | N/R | 2,044,660 |
| | Bonds, Refunding Series 2015, 5.500%, 12/01/45 | | | |
| | Johnstown Plaza Metropolitan District, Colorado, Special Revenue Bonds, Series 2016A: | | | |
| 675 | | 5.250%, 12/01/36 | 12/21 at 103.00 | N/R | 690,039 |
| 1,265 | | 5.375%, 12/01/46 | 12/21 at 103.00 | N/R | 1,293,602 |
103
| | | | | |
| NMZ | Nuveen Municipal High Income Opportunity Fund | |
| Portfolio of Investments (continued) | | | |
| | | | | |
| October 31, 2019 | | | |
|
|
|
| Principal | | | Optional Call | | |
| Amount (000) | | Description (1) | Provisions (2) | Ratings (3) | Value |
| | Colorado (continued) | | | |
| $ 2,930 | | Kit Carson County Health Service District, Colorado, Health Care Facility Revenue Bonds, | 12/19 at 100.00 | N/R | $ 2,908,552 |
| | Series 2007, 6.750%, 1/01/34 | | | |
| 500 | | Lanterns Metropolitan District 1, Castle Rock, Douglas County, Colorado, Limited Tax | 9/24 at 103.00 | N/R | 522,340 |
| | General Obligation Bonds, Series 2019A, 5.000%, 12/01/49 | | | |
| 500 | | Larkridge Metropolitan District No 2, In the City of Thornton, Adams County, Colorado, | 12/23 at 103.00 | N/R | 525,270 |
| | General Obligation, Limited Tax Convertible to Unlimited Tax, Improvement Bonds, Refunding | | | |
| | Series 2019, 5.250%, 12/01/48 | | | |
| 1,250 | | Lewis Pointe Metropolitan District, Thornton, Colorado, Limited Tax Convertible to | 12/20 at 100.00 | N/R | 1,263,000 |
| | Unlimited Tax General Obligation Bonds, Series 2015A, 6.000%, 12/01/44 | | | |
| 500 | | Leyden Rock Metropolitan District No 10, In the City of Arvada, Colorado, Limited Tax | 12/21 at 103.00 | N/R | 525,015 |
| | General Obligation Bonds, Refunding and Improvement Series 20016A, 5.000%, 12/01/45 | | | |
| 500 | | Leyden Rock Metropolitan District No 10, In the City of Arvada, Colorado, Limited Tax | 12/21 at 103.00 | N/R | 518,505 |
| | General Obligation Bonds, Refunding and Improvement Series 20016B, 7.250%, 12/15/45 | | | |
| 500 | | Midcities Metropolitan District No 2, In the City and County of Broomfield, Colorado, | 12/21 at 103.00 | N/R | 514,130 |
| | Subordinate Special Revenue Refunding Bonds, Series 2016B, 7.750%, 12/15/46 | | | |
| 2,000 | | Murphy Creek Metropolitan District 3, Aurora, Colorado, General Obligation Bonds, | 12/19 at 100.00 | N/R | 2,000,000 |
| | Refunding & Improvement Series 2006, 6.125%, 12/01/35 (4) | | | |
| 500 | | Palisade Park West Metropolitan District, Broomfield County, Colorado, Limited Tax | 6/24 at 103.00 | N/R | 510,675 |
| | General Obligation Bonds, Convertible to Unlimited Tax, Series 2019A, 5.125%, 12/01/49 | | | |
| 1,000 | | Pinon Pines Metropolitan District No 1, El Paso County, Colorado, General Obligation | 12/21 at 103.00 | N/R | 1,012,560 |
| | Limited Tax Bonds, Series 2016, 5.375%, 12/01/46 | | | |
| 1,080 | | Promenade at Castle Rock Metropolitan District 1, Colorado, General Obligation Bonds, | 12/20 at 103.00 | N/R | 1,136,722 |
| | Limited Tax Series 2015A, 5.750%, 12/01/39 | | | |
| | Regional Transportation District, Colorado, Denver Transit Partners Eagle P3 Project | | | |
| | Private Activity Bonds, Series 2010: | | | |
| 1,000 | | 6.500%, 1/15/30 | 7/20 at 100.00 | Baa3 | 1,029,270 |
| 1,000 | | 6.000%, 1/15/41 | 7/20 at 100.00 | Baa3 | 1,025,830 |
| 500 | | Ritoro Metropolitan District In the Town of Elizabeth, Elbert County, Colorado, Limited | 6/24 at 103.00 | N/R | 511,050 |
| | Tax , Convertible to Unlimited Tax, General Obligation Bonds, Series 2019A, 5.000%, 12/01/49 | | | |
| 500 | | Riverdale Ranch Metropolitan District, Thornton City, Adams County, Colorado, Limited | 9/24 at 103.00 | N/R | 504,475 |
| | Tax General Obligation Bonds, Convertible to Unlimited Tax Series 2019A, 5.000%, 12/01/49 | | | |
| 1,000 | | South Aurora Regional Improvement Authority, Aurora, Colorado, Special Revenue Bonds, | 12/23 at 103.00 | N/R | 1,052,960 |
| | Series 2018, 6.250%, 12/01/57 | | | |
| 978 | | STC Metropolitan District 2, Superior, Boulder County, Colorado, Limited Tax General | 12/19 at 103.00 | N/R | 1,008,279 |
| | Obligation Bonds, Series 2015A, 6.000%, 12/01/38 | | | |
| 875 | | STC Metropolitan District 2, Superior, Boulder County, Colorado, Limited Tax General | 12/19 at 103.00 | N/R | 894,329 |
| | Obligation Bonds, Series 2015B, 7.750%, 12/15/38 | | | |
| 3,000 | | Stone Ridge Metropolitan District 2, Colorado, General Obligation Bonds, Limited Tax | 12/19 at 100.00 | N/R | 480,000 |
| | Convertible to Unlimited, Series 2007, 7.250%, 12/01/31 (4) | | | |
| 1,815 | | Three Springs Metropolitan District 3, Durango, La Plata County, Colorado, Property Tax | 12/20 at 100.00 | N/R | 1,851,808 |
| | Supported Revenue Bonds, Series 2010, 7.750%, 12/01/39 | | | |
| 965 | | VDW Metropolitan District 2, Larimer County, Colorado, General Obligation Bonds, | 12/21 at 103.00 | N/R | 990,051 |
| | Refunding Limited Tax Series 2016B, 7.250%, 12/15/45 | | | |
| 705 | | Windsor Highlands Metropolitan District 9, Windsor, Larimer County, Colorado, Limited | 9/24 at 103.00 | N/R | 720,059 |
| | Tax Supported Revenue Bonds, Series 2019, 5.000%, 12/01/49 | | | |
| 80,644 | | Total Colorado | | | 73,086,437 |
| | Connecticut – 0.4% (0.3% of Total Investments) | | | |
| 500 | | Great Pond Improvement District, Connecticut, Special Obligation Revenue Bonds, Great | 10/26 at 102.00 | N/R | 520,245 |
| | Pond Phase 1 Project, Series 20019, 4.750%, 10/01/48, 144A | | | |
| 2,500 | | Harbor Point Infrastructure Improvement District, Connecticut, Special Obligation | 4/20 at 100.00 | N/R (6) | 2,567,825 |
| | Revenue Bonds, Harbor Point Project, Series 2010A, 7.875%, 4/01/39 (Pre-refunded 4/01/20) | | | |
104
| | | | | | |
| Principal | | | Optional Call | | |
| Amount (000) | | Description (1) | Provisions (2) | Ratings (3) | Value |
| | Connecticut (continued) | | | |
| $ 6,171 | | Mashantucket Western Pequot Tribe, Connecticut, Special Revenue Bonds, Subordinate | No Opt. Call | N/R | $ 231,426 |
| | Series 2013A, 6.050%, 7/01/31 (cash 4.000%, PIK 2.050%) (4) | | | |
| 1,000 | | Stamford, Connecticut, Special Obligation Revenue Bonds, Mill River Corridor Project, | 4/21 at 100.00 | N/R (6) | 1,079,710 |
| | Series 2011aA, 7.000%, 4/01/41 (Pre-refunded 4/01/21) | | | |
| 10,171 | | Total Connecticut | | | 4,399,206 |
| | Delaware – 0.3% (0.2% of Total Investments) | | | |
| 2,500 | | Delaware Economic Development Authority, Revenue Bonds, Odyssey Charter School Inc | 3/25 at 100.00 | N/R | 2,707,925 |
| | Project, Series 2015A, 7.000%, 9/01/45, 144A | | | |
| | District of Columbia – 0.4% (0.3% of Total Investments) | | | |
| 135 | | District of Columbia Tobacco Settlement Corporation, Tobacco Settlement Asset-Backed | No Opt. Call | Baa1 | 154,305 |
| | Bonds, Series 2001, 6.500%, 5/15/33 | | | |
| 1,000 | | District of Columbia, Revenue Bonds, Cesar Chavez Public Charter Schools for Public | 11/20 at 100.00 | B– | 1,013,850 |
| | Policy, Series 2011, 7.500%, 11/15/31 | | | |
| | District of Columbia, Revenue Bonds, Howard University, Tender Option Bond Trust | | | |
| | 2016-XG0094: | | | |
| 28 | | 19.451%, 10/01/37 (Pre-refunded 4/01/21), 144A (IF) (5) | 4/21 at 100.00 | N/R (6) | 32,770 |
| 2,472 | | 19.451%, 10/01/37, 144A (IF) (5) | 4/21 at 100.00 | Ba2 | 2,893,130 |
| 250 | | District of Columbia, Revenue Bonds, KIPP DC Issue, Series 2013A, 6.000%, 7/01/33 | 7/23 at 100.00 | N/R (6) | 293,015 |
| | (Pre-refunded 7/01/23) | | | |
| 3,885 | | Total District of Columbia | | | 4,387,070 |
| | Florida – 13.4% (9.2% of Total Investments) | | | |
| 1,500 | | Alachua County Health Facilities Authority, Florida, Health Facilities Revenue Bonds, | 11/21 at 100.00 | N/R | 1,508,370 |
| | Terraces at Bonita Springs Project, Series 2011A, 8.125%, 11/15/46 | | | |
| 1,810 | | Ave Maria Stewardship Community District, Florida, Capital Improvement Revenue Bonds, | 5/22 at 100.00 | N/R | 1,867,558 |
| | Series 2012, 6.700%, 5/01/42 | | | |
| 1,735 | | Ave Maria Stewardship Community District, Florida, Capital Improvement Revenue Bonds, | 5/25 at 100.00 | N/R | 1,780,978 |
| | Series 2015, 5.375%, 5/01/45 | | | |
| 995 | | Babcock Ranch Community Independent Special District, Charlotte County, Florida, Special | 11/25 at 100.00 | N/R | 1,060,680 |
| | Assessment Bonds, Series 2015, 5.250%, 11/01/46 | | | |
| 905 | | Belmont Community Development District, Florida, Capital Improvement Revenue Bonds, | No Opt. Call | N/R | 1,067,520 |
| | Phase 1 Project, Series 2013A, 6.125%, 11/01/33 | | | |
| 1,800 | | Boggy Creek Improvement District, Orlando, Florida, Special Assessment Revenue Bonds, | 5/23 at 100.00 | N/R | 1,854,774 |
| | Refunding Series 2013, 5.125%, 5/01/43 | | | |
| 700 | | Broward County, Florida, Airport Facility Revenue Bonds, Learjet Inc, Series 2000, | 12/19 at 100.00 | Caa1 | 700,525 |
| | 7.500%, 11/01/20 (AMT) | | | |
| 1,435 | | Capital Projects Finance Authority, Florida, Student Housing Revenue Bonds, Capital Projects | 12/19 at 100.00 | Baa2 | 1,472,310 |
| | Loan Program, Series 2001F-1, 5.000%, 10/01/31 – NPFG Insured | | | |
| 1,000 | | Capital Trust Agency, Florida, Revenue Bonds, Palm Coast Senior Living Community | 4/24 at 103.00 | N/R | 971,900 |
| | Project, Series 2017A, 7.000%, 10/01/49, 144A | | | |
| 2,595 | | Capital Trust Agency, Florida, Revenue Bonds, Provision CARES Proton Therapy Center, | 6/28 at 100.00 | N/R | 2,836,231 |
| | Orlando Project, Series 2018, 7.500%, 6/01/48, 144A | | | |
| 830 | | Capital Trust Agency, Florida, Revenue Bonds, Renaissance Charter School Project, Series | 6/26 at 100.00 | N/R | 875,318 |
| | 2019A, 5.000%, 6/15/39, 144A | | | |
| 1,000 | | Capital Trust Agency, Florida, Senior Living Facilities Revenue Bonds, Elim Senior | 8/24 at 103.00 | N/R | 1,045,720 |
| | Housing, Inc Project, Series 2017, 5.875%, 8/01/52, 144A | | | |
| 1,000 | | Celebration Pointe Community Development District 1, Alachua County, Florida, Special | 5/24 at 100.00 | N/R | 1,050,440 |
| | Assessment Revenue Bonds, Series 2014, 5.125%, 5/01/45 | | | |
| 500 | | Charlotte County Industrial Development Authority, Florida, Utility System Revenue | 10/27 at 100.00 | N/R | 544,510 |
| | Bonds, Town & Country Utilities Project, Series 2019, 5.000%, 10/01/49, 144A (AMT) | | | |
105
| | | | | |
| NMZ | Nuveen Municipal High Income Opportunity Fund | |
| Portfolio of Investments (continued) | | | |
|
| October 31, 2019 | | | |
|
|
|
|
| Principal | | | Optional Call | | |
| Amount (000) | | Description (1) | Provisions (2) | Ratings (3) | Value |
| | Florida (continued) | | | |
| $ 2,000 | | Collier County Industrial Development Authority, Florida, Continuing Care Community | 5/24 at 100.00 | N/R | $ 1,907,860 |
| | Revenue Bonds, Arlington of Naples Project, Series 2014A, 7.750%, 5/15/35, 144A | | | |
| 900 | | Cordoba Ranch Community Development District, Hillsborough County, Florida, Special | 12/19 at 100.00 | N/R | 899,955 |
| | Assessment Revenue Bonds, Series 2006, 5.550%, 5/01/37 | | | |
| 2,665 | | Currents Community Development District, Collier County, Florida, Bond Anticipation | 10/20 at 100.00 | N/R | 2,665,080 |
| | Note, Series 2019, 4.500%, 11/01/20 | | | |
| 800 | | Fishhawk Community Development District IV, Hillsborough County, Florida, Special | 5/23 at 100.00 | N/R | 902,904 |
| | Assessment Revenue Bonds, Series 2013A, 7.000%, 5/01/33 | | | |
| 1,850 | | Florida Development Finance Corporation, Educational Facilities Revenue Bonds, Downtown | 7/24 at 100.00 | N/R | 1,976,558 |
| | Doral Charter Elementary School Project, Series 2014A, 6.500%, 7/01/44 | | | |
| 1,000 | | Florida Development Finance Corporation, Educational Facilities Revenue Bonds, Downtown | 7/27 at 100.00 | N/R | 1,050,200 |
| | Doral Charter Elementary School Project, Series 2017A, 5.750%, 7/01/44, 144A | | | |
| 565 | | Florida Development Finance Corporation, Educational Facilities Revenue Bonds, Florida | 7/26 at 100.00 | N/R | 578,843 |
| | Charter Foundation Inc Projects, Series 2016A, 5.000%, 7/15/46, 144A | | | |
| 1,000 | | Florida Development Finance Corporation, Educational Facilities Revenue Bonds, Miami | 6/24 at 100.00 | N/R | 982,510 |
| | Arts Charter School Projects, Series 2014, 6.000%, 6/15/44, 144A | | | |
| 1,000 | | Florida Development Finance Corporation, Educational Facilities Revenue Bonds, | 9/20 at 100.00 | B+ | 1,021,810 |
| | Renaissance Charter School, Inc Projects, Series 2010A, 6.000%, 9/15/40 | | | |
| 2,000 | | Florida Development Finance Corporation, Educational Facilities Revenue Bonds, | 6/21 at 100.00 | B+ | 2,132,460 |
| | Renaissance Charter School, Inc Projects, Series 2011A, 7.625%, 6/15/41 | | | |
| 4,000 | | Florida Development Finance Corporation, Educational Facilities Revenue Bonds, | 6/23 at 100.00 | N/R | 4,578,080 |
| | Renaissance Charter School, Inc Projects, Series 2013A, 8.500%, 6/15/44 | | | |
| | Florida Development Finance Corporation, Florida, Surface Transportation Facility | | | |
| | Revenue Bonds, Virgin Trains USA Passenger Rail Project , Series 2019A: | | | |
| 4,605 | | 6.250%, 1/01/49 (AMT) (Mandatory Put 1/01/24), 144A | 1/20 at 104.00 | N/R | 4,386,263 |
| 25,000 | | 6.375%, 1/01/49 (AMT) (Mandatory Put 1/01/26), 144A | 1/20 at 105.00 | N/R | 23,648,500 |
| 3,000 | | 6.500%, 1/01/49 (AMT) (Mandatory Put 1/01/29), 144A | 1/20 at 105.00 | N/R | 2,826,630 |
| 2,500 | | Grand Bay at Doral Community Development District, Miami-Dade County, Florida, Special | 11/22 at 100.00 | N/R | 2,670,900 |
| | Assessment Bonds, Doral Breeze Project Series 2012, 5.500%, 11/01/32 | | | |
| 1,000 | | Grand Bay at Doral Community Development District, Miami-Dade County, Florida, Special | 5/24 at 100.00 | N/R | 1,089,530 |
| | Assessment Improvement Bonds, Assessment Area Two Project, Refunding Series 2014A-2, | | | |
| | 6.500%, 5/01/39 | | | |
| 200 | | Gulfstream Polo Community Development District, Palm Beach County, Florida, Special | 11/29 at 100.00 | N/R | 207,296 |
| | Assessment Bonds, Phase 2 Project, Series 2019, 4.375%, 11/01/49 | | | |
| 1,925 | | Harmony Community Development District, Florida, Capital Improvement Revenue Bonds, | 5/24 at 100.00 | N/R | 2,018,189 |
| | Special Assessment, Refunding Series 2014, 5.250%, 5/01/32 | | | |
| 200 | | Hawkstone Community Development District, Florida, Special Assessment Revenue Bonds, | 11/29 at 100.00 | N/R | 197,526 |
| | Assessment Area 2, Series 2019, 4.000%, 11/01/39 | | | |
| 1,000 | | Lakes by the Bay South Community Development District, Florida, Special Assessment | 11/22 at 100.00 | N/R | 1,055,340 |
| | Bonds, Series 2012, 5.750%, 11/01/42 | | | |
| 665 | | Lakewood Ranch Stewardship District, Florida, Special Assessment Revenue Bonds, Lakewood | 5/25 at 100.00 | N/R | 696,774 |
| | Centre North Project, Series 2015, 4.875%, 5/01/45 | | | |
| 2,000 | | Lee County Industrial Development Authority, Florida, Charter School Revenue Bonds, Lee | 12/19 at 100.00 | BB– | 2,000,320 |
| | County Community Charter Schools, Series 2007A, 5.375%, 6/15/37 | | | |
| 630 | | Lee County Industrial Development Authority, Florida, Healthcare Facilities Revenue | 12/22 at 105.00 | N/R | 670,081 |
| | Bonds, Preserve Project, Series 2017A, 5.750%, 12/01/52, 144A | | | |
| 1,000 | | Magic Place Community Development District, Osceola County, Florida, Special Assessment | 5/30 at 100.00 | N/R | 993,330 |
| | Revenue Bonds, Series 2019, 4.500%, 5/01/51 | | | |
| 12,190 | | Miami Beach, Florida, Resort Tax Revenue Bonds, Series 2015, 5.000%, 9/01/45 (UB) (5) | 9/25 at 100.00 | AA– | 14,137,231 |
| 750 | | Miami Dade County Industrial Development Authority, Florida, Educational Facilities Revenue | 7/27 at 100.00 | N/R | 773,115 |
| | Bonds, South Florida Autism Charter School Project, Series 2017, 6.000%, 7/01/47, 144A | | | |
106
| | | | | | |
| Principal | | | Optional Call | | |
| Amount (000) | | Description (1) | Provisions (2) | Ratings (3) | Value |
| | Florida (continued) | | | |
| $ 1,085 | | Miami World Center Community Development District, Miami-Dade County, Florida, Special | 11/27 at 100.00 | N/R | $ 1,190,994 |
| | Assessment Bonds, Series 2017, 5.250%, 11/01/49 | | | |
| 750 | | Miami-Dade County Industrial Development Authority, Florida, Revenue Bonds, Youth Co-Op | 9/25 at 100.00 | N/R | 789,375 |
| | Charter Schools Project, Series 2015A, 6.000%, 9/15/45, 144A | | | |
| 1,250 | | Miami-Dade County, Florida, Water and Sewer System Revenue Bonds, Tender Option Bond | 10/20 at 100.00 | Aa3 (6) | 1,425,712 |
| | Trust 2016-XG0030, 14.415%, 10/01/39 (Pre-refunded 10/01/20), 144A – AGM Insured (IF) | | | |
| 505 | | Mirada Community Development District, Pasco County, Florida, Bond Anticipation Note, | 11/20 at 100.00 | N/R | 504,086 |
| | Assessment Area 3, Series 2019, 4.500%, 5/01/24 | | | |
| 400 | | North Park Isle Community Development District, Plant City, Florida, Special Assessment | 5/29 at 100.00 | N/R | 409,516 |
| | Revenue Bonds, Assessment Area 1, Series 2019, 4.750%, 5/01/50 | | | |
| 930 | | Northern Palm Beach County Improvement District, Florida, Water Control and Improvement | 8/26 at 100.00 | N/R | 1,002,456 |
| | Bonds, Development Unit 53, Series 2015, 5.500%, 8/01/46 | | | |
| | Palm Beach County Health Facilities Authority, Florida, Revenue Bonds, Sinai Residences | | | |
| | of Boca Raton Project, Series 2014A: | | | |
| 620 | | 7.000%, 6/01/29 | 6/22 at 102.00 | N/R | 689,198 |
| 3,110 | | 7.500%, 6/01/49 | 6/22 at 102.00 | N/R | 3,491,099 |
| 500 | | Palm Beach County, Florida, Revenue Bonds, Provident Group – PBAU Properties LLC – Palm | 4/29 at 100.00 | Ba1 | 551,230 |
| | Beach Atlantic University Housing Project, Series 2019A, 5.000%, 4/01/51, 144A | | | |
| 3,530 | | Pine Island Community Development District, Florida, Special Assessment Bonds, Bella | 12/19 at 100.00 | N/R | 3,538,331 |
| | Collina, Series 2004, 5.750%, 5/01/35 | | | |
| 1,660 | | Reunion West Community Development District, Florida, Special Assessment Bonds, Series | 5/22 at 100.00 | N/R | 1,762,306 |
| | 2004A-1, 6.250%, 5/01/36 | | | |
| 2,500 | | Rolling Oaks Community Development District, Florida, Special Assessment Bonds, Series | 11/27 at 100.00 | N/R | 2,889,050 |
| | 2016, 6.000%, 11/01/47 | | | |
| 990 | | Shingle Creek Community Development District, Osceola County, Florida, Special | 11/25 at 100.00 | N/R | 1,044,311 |
| | Assessment Revenue Bonds, Series 2015, 5.400%, 11/01/45 | | | |
| 1,540 | | Tolomato Community Development District, Florida, Special Assessment Bonds, Convertible, | 5/22 at 100.00 | N/R | 1,329,066 |
| | Capital Appreciation, Series 2012A-4, 0.000%, 5/01/40 (8) | | | |
| | Tolomato Community Development District, Florida, Special Assessment Bonds, Hope Note, | | | |
| | Series 2007-3: | | | |
| 120 | | 6.375%, 5/01/17 (4) | No Opt. Call | N/R | 1 |
| 1,360 | | 6.650%, 5/01/40 (4) | 12/19 at 100.00 | N/R | 14 |
| 2,845 | | Tolomato Community Development District, Florida, Special Assessment Bonds, Hope Note, | 12/19 at 100.00 | N/R | 28 |
| | Series 2007A-2, 5.250%, 5/01/39 (4) | | | |
| 3,740 | | Tolomato Community Development District, Florida, Special Assessment Bonds, Refunding | 12/19 at 100.00 | N/R | 3,206,152 |
| | Series 2015-1, 0.000%, 5/01/40 | | | |
| 2,300 | | Tolomato Community Development District, Florida, Special Assessment Bonds, Refunding | 12/19 at 100.00 | N/R | 1,618,947 |
| | Series 2015-2, 0.000%, 5/01/40 | | | |
| 2,505 | | Tolomato Community Development District, Florida, Special Assessment Bonds, Refunding | 12/19 at 100.00 | N/R | 25 |
| | Series 2015-3, 6.610%, 5/01/40 (4) | | | |
| 2,000 | | Twin Creeks North Community Development District, Florida, Special Assessment Bonds, | 11/31 at 100.00 | N/R | 2,240,000 |
| | Master Infrastructure Improvements, Series 2016A-1, 6.375%, 11/01/47 | | | |
| 3,820 | | Twin Creeks North Community Development District, Florida, Special Assessment Bonds, | 11/31 at 100.00 | N/R | 4,278,400 |
| | Master Infrastructure Improvements, Series 2016A-2, 6.375%, 11/01/47 | | | |
| 500 | | Two Lakes Community Development District, Hialeah, Florida, Special Assessment Bonds, | 12/29 at 100.00 | N/R | 502,465 |
| | Expansion Area Project, Series 2019, 4.000%, 12/15/49 | | | |
| 1,000 | | Venetian Parc Community Development District, Miami-Dade County, Florida, Special | 11/28 at 100.00 | N/R | 1,325,060 |
| | Assessment Bonds, Area One Project, Series 2013, 6.500%, 11/01/43 | | | |
| 975 | | Waterset North Community Development District, Hillsborough County, Florida, Special | 11/24 at 100.00 | N/R | 1,041,027 |
| | Assessment Revenue Bonds, Series 2014, 5.500%, 11/01/45 | | | |
| 132,785 | | Total Florida | | | 129,532,968 |
107
| | | | | |
| NMZ | Nuveen Municipal High Income Opportunity Fund | |
| Portfolio of Investments (continued) | | | |
| | | | | |
| October 31, 2019 | | | |
|
|
| Principal | | | Optional Call | | |
| Amount (000) | | Description (1) | Provisions (2) | Ratings (3) | Value |
| | Georgia – 0.8% (0.5% of Total Investments) | | | |
| $ 1,000 | | Atlanta Urban Residential Finance Authority, Georgia, Multifamily Housing Revenue Bonds, | 11/23 at 100.00 | BBB+ | $ 1,045,650 |
| | Testletree Village Apartments, Series 2013A, 5.000%, 11/01/48 | | | |
| 1,250 | | Clayton County Development Authority, Georgia, Special Facilities Revenue Bonds, Delta | 6/20 at 100.00 | BB+ | 1,301,475 |
| | Air Lines, Inc Project, Series 2009A, 8.750%, 6/01/29 | | | |
| 1,880 | | Douglas County Development Authority, Georgia, Charter School Revenue Bonds, Brighten | 10/23 at 100.00 | N/R | 1,998,891 |
| | Academy Project, Series 2013A, 7.125%, 10/01/43 | | | |
| 1,000 | | Fulton County Development Authority, Georgia, Revenue Bonds, Amana Academy Project, | 4/23 at 100.00 | N/R | 1,035,020 |
| | Series 2013A, 6.500%, 4/01/43 | | | |
| | Liberty County Industrial Authority, Georgia, Revenue Bonds, Series 2014: | | | |
| 324 | | 5.500%, 7/15/23 | 7/21 at 100.00 | N/R | 325,878 |
| 767 | | 5.500%, 7/15/30 | 7/21 at 100.00 | N/R | 769,588 |
| 842 | | 5.500%, 1/15/36 | 7/21 at 100.00 | N/R | 845,007 |
| 7,063 | | Total Georgia | | | 7,321,509 |
| | Guam – 0.0% (0.0% of Total Investments) | | | |
| 330 | | Guam International Airport Authority, Revenue Bonds, Series 2013C, 6.375%, 10/01/43 (AMT) | 10/23 at 100.00 | Baa2 | 381,972 |
| | Idaho – 0.1% (0.0% of Total Investments) | | | |
| 500 | | Idaho Health Facilities Authority, Revenue Bonds, Saint Luke’s Health System Project, | 3/22 at 100.00 | A– | 605,460 |
| | Tender Option Bond Trust 2016-XG0066, 13.391%, 3/01/47, 144A (IF) (5) | | | |
| | Illinois – 24.4% (16.8% of Total Investments) | | | |
| 625 | | Bolingbrook, Illinois, Sales Tax Revenue Bonds, Series 2005, 6.250%, 1/01/24 | 12/19 at 100.00 | N/R | 616,975 |
| 10,670 | | Chicago Board of Education, Illinois, Dedicated Capital Improvement Tax Revenue Bonds, | 4/27 at 100.00 | A | 12,747,556 |
| | Series 2017, 6.000%, 4/01/46 (UB) (5) | | | |
| 1,500 | | Chicago Board of Education, Illinois, General Obligation Bonds, Dedicated Revenues, | 12/24 at 100.00 | BB– | 1,649,310 |
| | Project Series 2015C, 5.250%, 12/01/39 | | | |
| 1,000 | | Chicago Board of Education, Illinois, General Obligation Bonds, Dedicated Revenues, | 12/20 at 100.00 | B2 | 1,022,860 |
| | Refunding Series 2010F, 5.000%, 12/01/31 | | | |
| 1,000 | | Chicago Board of Education, Illinois, General Obligation Bonds, Dedicated Revenues, | 12/28 at 100.00 | BB– | 1,123,970 |
| | Refunding Series 2018D, 5.000%, 12/01/46 | | | |
| 15,385 | | Chicago Board of Education, Illinois, General Obligation Bonds, Dedicated Revenues, | 12/25 at 100.00 | BB– | 18,712,006 |
| | Series 2016A, 7.000%, 12/01/44 | | | |
| 2,025 | | Chicago Board of Education, Illinois, General Obligation Bonds, Dedicated Revenues, | 12/26 at 100.00 | BB– | 2,443,750 |
| | Series 2016B, 6.500%, 12/01/46 | | | |
| 9,910 | | Chicago Board of Education, Illinois, General Obligation Bonds, Dedicated Revenues, | 12/27 at 100.00 | BB– | 12,623,655 |
| | Series 2017A, 7.000%, 12/01/46, 144A | | | |
| 3,000 | | Chicago Greater Metropolitan Water Reclamation District, Illinois, General Obligation | 12/24 at 100.00 | AA+ | 3,365,850 |
| | Bonds, Capital Improvement, Green 2014 Series 2015A, 5.000%, 12/01/44 (UB) (5) | | | |
| 7,500 | | Chicago Transit Authority, Illinois, Sales Tax Receipts Revenue Bonds, Series 2011, | 12/21 at 100.00 | A3 | 7,907,250 |
| | 5.250%, 12/01/40 (UB) (5) | | | |
| 1,511 | | Chicago, Illinois, Certificates of Participation Tax Increment Bonds, 35th and State | 11/19 at 100.00 | N/R | 1,511,336 |
| | Redevelopment Project, Series 2012, 6.100%, 1/15/29 | | | |
| 2,408 | | Chicago, Illinois, Certificates of Participation, Tax Increment Allocation Revenue | 12/19 at 100.00 | N/R | 1,818,535 |
| | Bonds, Diversey-Narragansett Project, Series 2006, 7.460%, 2/15/26 (4) | | | |
| 5,000 | | Chicago, Illinois, General Airport Revenue Bonds, O’Hare International Airport, | 1/29 at 100.00 | A | 5,476,150 |
| | Refunding Senior Lien Series 2018A, 4.000%, 1/01/43 (AMT) (UB) (5) | | | |
| 30,500 | | Chicago, Illinois, General Airport Revenue Bonds, O’Hare International Airport, Senior | 1/29 at 100.00 | A | 36,748,535 |
| | Lien Series 2018B, 5.000%, 1/01/48 (UB) (5) | | | |
108
| | | | | | |
| Principal | | | Optional Call | | |
| Amount (000) | | Description (1) | Provisions (2) | Ratings (3) | Value |
| | Illinois (continued) | | | |
| $ 2,000 | | Chicago, Illinois, General Obligation Bonds, Project & Refunding Series 2014A, 5.250%, 1/01/30 | 1/24 at 100.00 | Ba1 | $ 2,205,780 |
| 9,400 | | Chicago, Illinois, General Obligation Bonds, Project & Refunding Series 2017A, 6.000%, 1/01/38 | 1/27 at 100.00 | BBB– | 11,161,560 |
| 1,000 | | Chicago, Illinois, General Obligation Bonds, Project and Refunding Series 2005D, 5.500%, 1/01/37 | 1/25 at 100.00 | Ba1 | 1,123,940 |
| 130 | | Chicago, Illinois, General Obligation Bonds, Refunding Series 2016C, 5.000%, 1/01/38 | 1/26 at 100.00 | BBB– | 143,218 |
| | Chicago, Illinois, General Obligation Bonds, Series 2019A: | | | |
| 7,500 | | 5.000%, 1/01/44 (UB) (5) | 1/29 at 100.00 | BBB– | 8,449,800 |
| 8,000 | | 5.500%, 1/01/49 (UB) (5) | 1/29 at 100.00 | BBB– | 9,320,240 |
| 1,500 | | Chicago, Illinois, General Obligation Bonds, VAribale Rate Demand Series 2007F, 5.500%, 1/01/42 | 1/25 at 100.00 | Ba1 | 1,672,380 |
| 4,000 | | Cook County, Illinois, Recovery Zone Facility Revenue Bonds, Navistar International | 10/20 at 100.00 | B1 | 4,130,200 |
| | Corporation Project, Series 2010, 6.750%, 10/15/40 | | | |
| 5,000 | | Illinois Finance Authority Revenue Bonds, Ness Healthcare NFP, Series 2016A, 6.375%, | 11/26 at 100.00 | N/R | 4,600,650 |
| | 11/01/46, 144A | | | |
| 1,000 | | Illinois Finance Authority, Recovery Zone Facility Revenue Bonds, Navistar International | 10/20 at 100.00 | B1 | 1,032,550 |
| | Corporation Project, Series 2010, 6.750%, 10/15/40 | | | |
| | Illinois Finance Authority, Revenue Bonds, Ascension Health/fkaPresence Health Network, | | | |
| | Series 2016C: | | | |
| 25 | | 4.000%, 2/15/41 (Pre-refunded 2/15/27) (UB) | 2/27 at 100.00 | N/R (6) | 29,182 |
| 11,150 | | 4.000%, 2/15/41 (UB) | 2/27 at 100.00 | Aa2 | 12,231,327 |
| 1,000 | | Illinois Finance Authority, Revenue Bonds, Lake Forest College, Series 2012A, 6.000%, 10/01/48 | 10/22 at 100.00 | BBB– | 1,074,070 |
| 5,000 | | Illinois Finance Authority, Revenue Bonds, Northwestern Memorial Healthcare, Series | 1/28 at 100.00 | Aa2 | 5,467,050 |
| | 2017A, 4.000%, 7/15/47 (UB) (5) | | | |
| | Illinois Finance Authority, Revenue Bonds, The Carle Foundation, Tender Option Bond | | | |
| | Trust 2015-XF0121: | | | |
| 1,685 | | 18.287%, 8/15/41 – AGM Insured, 144A (IF) (5) | 8/21 at 100.00 | A2 | 2,172,235 |
| 250 | | 18.299%, 8/15/41 – AGM Insured, 144A (IF) (5) | 8/21 at 100.00 | A2 | 322,345 |
| 5,000 | | Illinois Finance Authority, Revenue Bonds, The University of Chicago Medical Center, | 2/27 at 100.00 | A1 | 5,427,350 |
| | Series 2016B, 4.000%, 8/15/41 (UB) (5) | | | |
| | Illinois State, General Obligation Bonds, November Series 2016: | | | |
| 1,000 | | 5.000%, 11/01/35 | 11/26 at 100.00 | BBB– | 1,114,190 |
| 1,000 | | 5.000%, 11/01/37 | 11/26 at 100.00 | BBB– | 1,110,890 |
| 9,945 | | Illinois State, General Obligation Bonds, November Series 2017D, 5.000%, 11/01/27 (UB) (5) | No Opt. Call | BBB– | 11,407,213 |
| 630 | | Illinois State, General Obligation Bonds, Series 2012A, 5.000%, 3/01/36 | 3/22 at 100.00 | BBB– | 657,802 |
| 5,445 | | Illinois State, Sales Tax Revenue Bonds, Build Illinois, Refunding Junior Obligation | 6/26 at 100.00 | BBB | 5,751,826 |
| | September Series 2016C, 4.000%, 6/15/31 (UB) (5) | | | |
| 2,000 | | Lombard Public Facilities Corporation, Illinois, Conference Center and Hotel Revenue | 12/19 at 100.00 | N/R | 1,914,940 |
| | Bonds, First Tier Series 2005A-2, 5.500%, 1/01/36, 144A | | | |
| 800 | | Railsplitter Tobacco Settlement Authority, Illinois, Tobacco Settlement Revenue Bonds, | 6/21 at 100.00 | N/R (6) | 859,464 |
| | Series 2010, 6.000%, 6/01/28 (Pre-refunded 6/01/21) | | | |
| 900 | | Rantoul, Champaign County, Illinois, Tax Increment Revenue Bonds, Evans Road Series | 12/23 at 100.00 | N/R | 938,970 |
| | 2013B, 7.000%, 12/01/33 | | | |
| | Sales Tax Securitization Corporation, Illinois, Sales Tax Securitization Bonds, Series 2018C: | | | |
| 9,875 | | 5.000%, 1/01/36 (UB) (5) | 1/29 at 100.00 | AA– | 11,621,986 |
| 17,750 | | 5.250%, 1/01/48 (UB) (5) | 1/29 at 100.00 | AA– | 20,771,760 |
| 1,000 | | Southwestern Illinois Development Authority, Health Facility Revenue Bonds, Memorial | 11/23 at 100.00 | N/R (6) | 1,226,740 |
| | Group, Inc, Series 2013, 7.125%, 11/01/43 (Pre-refunded 11/01/23) | | | |
| 895 | | Yorkville United City Business District, Illinois, Storm Water and Water Improvement | 11/19 at 100.00 | N/R | 474,350 |
| | Project Revenue Bonds, Series 2007, 4.800%, 1/01/26 (4) | | | |
| 206,914 | | Total Illinois | | | 236,181,746 |
109
| | | | | |
| NMZ | Nuveen Municipal High Income Opportunity Fund | |
| Portfolio of Investments (continued) | | | |
| | | | | |
| October 31, 2019 | | | |
|
|
|
| Principal | | | Optional Call | | |
| Amount (000) | | Description (1) | Provisions (2) | Ratings (3) | Value |
| | Indiana – 2.0% (1.4% of Total Investments) | | | |
| $ 3,500 | | Carmel Redevelopment District, Indiana, Tax Increment Revenue Bonds, Series 2004A, | 12/19 at 100.00 | N/R | $ 3,533,250 |
| | 6.650%, 7/15/24 | | | |
| 1,000 | | Gary, Indiana, Revenue Anticipation Notes, Series 2019, 5.000%, 2/25/20 | No Opt. Call | N/R | 995,110 |
| 1,000 | | Indiana Bond Bank, Special Program Bonds, Hendricks Regional Health Project, Tender | No Opt. Call | AA | 2,209,050 |
| | Option Bond Trust 2016-XL0019, 15.082%, 4/01/30, 144A (IF) (5) | | | |
| 1,250 | | Indiana Bond Bank, Special Program Gas Revenue Bonds, JP Morgan Ventures Energy | No Opt. Call | A2 | 1,423,725 |
| | Corporation Guaranteed, Tender Option Bond Trust 2015-XF0115, 14.682%, 10/15/20, | | | |
| | 144A (IF) (5) | | | |
| 1,000 | | Indiana Finance Authority, Educational Facilities Revenue Bonds, Discovery Charter | 12/25 at 100.00 | BB– | 1,090,900 |
| | School Project, Series 2015A, 7.250%, 12/01/45 | | | |
| 1,000 | | Indiana Finance Authority, Environmental Improvement Revenue Bonds, United States Steel | No Opt. Call | B3 | 1,003,020 |
| | Corporation Project, Refunding Series 2011, 6.000%, 12/01/19 | | | |
| 2,000 | | Indiana Finance Authority, Environmental Improvement Revenue Bonds, United States Steel | 8/22 at 100.00 | B3 | 2,067,300 |
| | Corporation Project, Series 2012, 5.750%, 8/01/42 (AMT) | | | |
| 500 | | Indiana Finance Authority, Hospital Revenue Bonds, King’s Daughters’ Hospital and Health | 8/20 at 100.00 | Baa2 | 513,890 |
| | Services, Series 2010, 5.500%, 8/15/45 | | | |
| | Indiana Finance Authority, Revenue Bonds, Trinity Health Care Group Revenue Bonds, | | | |
| | Tender Option Bond Trust 2015-XF0106: | | | |
| 1,290 | | 14.348%, 12/01/37 (Pre-refunded 12/01/20), 144A (IF) (5) | 12/20 at 100.00 | AA– (6) | 1,493,098 |
| 1,250 | | 14.348%, 12/01/38, 144A (IF) (5) | No Opt. Call | AA– | 1,265,187 |
| 370 | | Indiana Housing and Community Development Authority, Multifamily Housing Revenue Bonds, | 7/26 at 103.00 | N/R | 378,225 |
| | Lake Meadows Assisted Living Project, Series 2019A, 5.000%, 1/01/39, 144A | | | |
| 1,000 | | Shoals, Indiana, Exempt Facilities Revenue Bonds, National Gypsum Company Project, | 11/23 at 100.00 | N/R | 1,109,460 |
| | Series 2013, 7.250%, 11/01/43 (AMT) | | | |
| 925 | | St Joseph County, Indiana, Economic Development Revenue Bonds, Chicago Trail Village | 12/19 at 100.00 | N/R | 925,583 |
| | Apartments, Series 2005A, 7.500%, 7/01/35 | | | |
| 1,375 | | Terre Haute, Indiana, Economic Development Solid Waste Facility Revenue Bonds, Pyrolyx | No Opt. Call | N/R | 1,414,683 |
| | USA Indiana, LLC Project, Series 2017A, 7.250%, 12/01/28 (AMT) | | | |
| 17,460 | | Total Indiana | | | 19,422,481 |
| | Iowa – 0.7% (0.5% of Total Investments) | | | |
| 1,030 | | Iowa Finance Authority, Iowa, Midwestern Disaster Area Revenue Bonds, Alcoa Inc Project, | 8/22 at 100.00 | Ba2 | 1,073,466 |
| | Series 2012, 4.750%, 8/01/42 | | | |
| 2,000 | | Iowa Finance Authority, Iowa, Midwestern Disaster Area Revenue Bonds, Iowa Fertilizer | 12/23 at 100.00 | B– | 2,177,760 |
| | Company Project, Series 2013, 5.250%, 12/01/25 | | | |
| | Iowa Tobacco Settlement Authority, Asset Backed Settlement Revenue Bonds, Series 2005C: | | | |
| 1,000 | | 5.375%, 6/01/38 | 12/19 at 100.00 | B– | 1,000,200 |
| 2,900 | | 5.625%, 6/01/46 | 12/19 at 100.00 | B– | 2,900,522 |
| 6,930 | | Total Iowa | | | 7,151,948 |
| | Kansas – 0.6% (0.4% of Total Investments) | | | |
| 5,305 | | University of Kansas Hospital Authority, Health Facilities Revenue Bonds, KU Health | 9/25 at 100.00 | AA– | 6,102,129 |
| | System, Refunding & Improvement Series 2015, 5.000%, 9/01/45 (UB) (5) | | | |
| | Kentucky – 6.8% (4.7% of Total Investments) | | | |
| | Kentucky Economic Development Finance Authority, Hospital Revenue Bonds, Owensboro | | | |
| | Health, Refunding Series 2017A: | | | |
| 5,450 | | 5.000%, 6/01/41 | 6/27 at 100.00 | BB+ | 6,210,547 |
| 3,300 | | 5.000%, 6/01/45 | 6/27 at 100.00 | BB+ | 3,722,829 |
| 12,665 | | 5.000%, 6/01/45 (UB) (5) | 6/27 at 100.00 | BB+ | 14,287,766 |
110
| | | | | | |
| Principal | | | Optional Call | | |
| Amount (000) | | Description (1) | Provisions (2) | Ratings (3) | Value |
| | Kentucky (continued) | | | |
| $ 500 | | Kentucky Economic Development Finance Authority, Hospital Revenue Bonds, Owensboro | 6/20 at 100.00 | BB+ (6) | $ 513,590 |
| | Medical Health System, Series 2010A, 6.000%, 6/01/30 (Pre-refunded 6/01/20) | | | |
| | Kentucky Economic Development Finance Authority, Revenue Bonds, Next Generation Kentucky | | | |
| | Information Highway Project, Senior Series 2015A: | | | |
| 11,000 | | 5.000%, 7/01/37 (UB) | 7/25 at 100.00 | Baa2 | 12,410,530 |
| 9,295 | | 5.000%, 7/01/40 (UB) | 7/25 at 100.00 | Baa2 | 10,222,269 |
| 16,800 | | 5.000%, 1/01/45 (UB) | 7/25 at 100.00 | Baa2 | 18,402,888 |
| 59,010 | | Total Kentucky | | | 65,770,419 |
| | Louisiana – 1.3% (0.9% of Total Investments) | | | |
| 2,130 | | Ascension Parish Industrial development Board, Louisiana, Revenue Bonds, Impala | 7/23 at 100.00 | N/R | 2,318,888 |
| | Warehousing (US) LLC Project, Series 2013, 6.000%, 7/01/36 | | | |
| 1,745 | | Louisiana Public Facilities Authority, Revenue Bonds, Lake Charles Charter Academy | 12/21 at 100.00 | N/R | 1,880,674 |
| | Foundation Project, Series 2011A, 7.750%, 12/15/31 | | | |
| 500 | | Louisiana Local Government Environmental Facilities and Community Development Authority, | 11/20 at 100.00 | BBB | 523,720 |
| | Revenue Bonds, Westlake Chemical Corporation Projects, Series 2010A-1, 6.500%, 11/01/35 | | | |
| | Louisiana Local Government Environmental Facilities and Community Development Authority, | | | |
| | Revenue Bonds, Womans Hospital Foundation Project, Tender Option Bonds Trust 2016-XF2336: | | | |
| 750 | | 17.595%, 10/01/40 (Pre-refunded 10/01/20), 144A (IF) (5) | 10/20 at 100.00 | A2 (6) | 877,605 |
| 750 | | 17.605%, 10/01/40 (Pre-refunded 10/01/20), 144A (IF) (5) | 10/20 at 100.00 | A2 (6) | 877,680 |
| 1,000 | | Louisiana Public Facilities Authority, Dock and Wharf Revenue Bonds, Impala Warehousing | 7/23 at 100.00 | N/R | 1,100,310 |
| | (US) LLC Project, Series 2013, 6.500%, 7/01/36, 144A (AMT) | | | |
| 2,000 | | Louisiana Public Facilities Authority, Revenue Bonds, Loyola University Project, | No Opt. Call | BBB | 2,079,540 |
| | Refunding Series 2017, 0.000%, 10/01/33 (8) | | | |
| 2,110 | | Louisiana Public Facilities Authority, Revenue Bonds, Southwest Louisiana Charter | 12/23 at 100.00 | N/R | 2,282,028 |
| | Academy Foundation Project, Series 2013A, 8.125%, 12/15/33 | | | |
| 500 | | Louisiana Public Facilities Authority, Revenue Bonds, Young Audiences Charter School, | 4/27 at 100.00 | N/R | 513,045 |
| | Series 2019A, 5.000%, 4/01/57, 144A | | | |
| 2,000 | | Louisiana Public Facilities Authority, Solid Waste Disposal Facility Revenue Bonds, | No Opt. Call | N/R | 20 |
| | Louisiana Pellets Inc Project, Series 2015, 7.000%, 7/01/24, 144A (AMT) | | | |
| 13,485 | | Total Louisiana | | | 12,453,510 |
| | Maryland – 0.7% (0.5% of Total Investments) | | | |
| 3,000 | | Maryland Economic Development Corporation, Port Facilities Revenue Bonds, CNX Marine | 9/20 at 100.00 | BB– | 3,070,650 |
| | Terminals Inc Port of Baltimore Facility, Refunding Series 2010, 5.750%, 9/01/25 | | | |
| 4,000 | | Maryland Economic Development Corporation, Revenue Bonds, Chesapeake Bay Hyatt | 12/19 at 100.00 | N/R | 2,535,000 |
| | Conference Center, Series 2006A, 5.000%, 12/01/31 (4) | | | |
| 2,500 | | Maryland Economic Development Corporation, Revenue Bonds, Chesapeake Bay Hyatt | 12/19 at 100.00 | N/R | 1,584,375 |
| | Conference Center, Series 2006B, 5.250%, 12/01/31 (4) | | | |
| 9,500 | | Total Maryland | | | 7,190,025 |
| | Massachusetts – 1.6% (1.1% of Total Investments) | | | |
| 5,735 | | Massachusetts Educational Financing Authority, Education Loan Revenue Bonds, Issue K, | 7/26 at 100.00 | A | 6,117,983 |
| | Series 2017B, 4.250%, 7/01/46 (AMT) (UB) (5) | | | |
| 5,000 | | Massachusetts State, General Obligation Bonds, Consolidated Loan, Series 2016A, 5.000%, | 3/24 at 100.00 | AA | 5,630,850 |
| | 3/01/46 (UB) (5) | | | |
| 2,985 | | Massachusetts State, General Obligation Bonds, Consolidated Loan, Series 2016E, 4.000%, | 4/25 at 100.00 | AA | 3,315,977 |
| | 4/01/33 (UB) (5) | | | |
| 13,720 | | Total Massachusetts | | | 15,064,810 |
111
| | | | | |
| NMZ | Nuveen Municipal High Income Opportunity Fund | |
| Portfolio of Investments (continued) | | | |
| | | | | |
| October 31, 2019 | | | |
|
|
| Principal | | | Optional Call | | |
| Amount (000) | | Description (1) | Provisions (2) | Ratings (3) | Value |
| | Michigan – 1.6% (1.1% of Total Investments) | | | |
| | Detroit Local Development Finance Authority, Michigan, Tax Increment Bonds, Series 1998A: | | | |
| $ 10 | | 5.500%, 5/01/21 – ACA Insured | 12/19 at 100.00 | B– | $ 10,028 |
| 330 | | 5.500%, 5/01/21 | 12/19 at 100.00 | B– | 327,891 |
| 88 | | Detroit, Michigan, General Obligation Bonds, Series 2003A, 5.250%, 4/01/22 | 12/19 at 100.00 | N/R | 87,571 |
| 915 | | Michigan Finance Authority, Public School Academy Limited Obligation Revenue Bonds, Hope | 4/21 at 100.00 | B | 825,202 |
| | Academy Project, Series 2011, 8.125%, 4/01/41 | | | |
| 1,240 | | Michigan Finance Authority, Public School Academy Limited Obligation Revenue Bonds, | 7/27 at 100.00 | N/R | 1,009,732 |
| | Voyageur Academy Project, Refunding Series 2017 Private Placement of 2017, 5.900%, 7/15/46, 144A | | | |
| | Michigan Housing Development Authority, Rental Housing Revenue Bonds, Series 2015A: | | | |
| 2,225 | | 4.350%, 10/01/45 (UB) (5) | 10/24 at 100.00 | AA | 2,367,845 |
| 4,500 | | 4.600%, 4/01/52 (UB) (5) | 10/24 at 100.00 | AA | 4,816,305 |
| 1,620 | | Michigan Public Educational Facilities Authority, Charter School Revenue Bonds, American | 12/19 at 100.00 | N/R | 1,621,037 |
| | Montessori Academy, Series 2007, 6.500%, 12/01/37 | | | |
| 1,000 | | Michigan Public Educational Facilities Authority, Limited Obligation Revenue Bonds, | 12/19 at 100.00 | BBB– | 1,001,860 |
| | Chandler Park Academy Project, Series 2008, 6.500%, 11/01/35 | | | |
| 1,000 | | Michigan Public Educational Facilities Authority, Limited Obligation Revenue Bonds, | 12/19 at 100.00 | BBB– | 1,000,560 |
| | Richfield Public School Academy, Series 2007, 5.000%, 9/01/36 | | | |
| 805 | | Michigan Public Educational Facilities Authority, Limited Obligation Revenue Bonds, | 12/19 at 100.00 | N/R | 805,314 |
| | David Ellis Academy-West Charter School Project, Series 2007, 5.875%, 6/01/37 | | | |
| 845 | | Michigan Strategic Fund, Limited Obligation Revenue Bonds, Detroit Thermal LLC Project, | 12/23 at 100.00 | N/R | 956,041 |
| | Series 2018, 7.000%, 12/01/30, 144A (AMT) | | | |
| 500 | | Summit Academy, Michigan, Revenue Bonds, Public School Academy Series 2005, | 12/19 at 100.00 | B+ | 500,400 |
| | 6.375%, 11/01/35 | | | |
| 15,078 | | Total Michigan | | | 15,329,786 |
| | Minnesota – 0.8% (0.5% of Total Investments) | | | |
| 665 | | Brooklyn Park, Minnesota, Charter School Lease Revenue Bonds, Athlos Leadership Academy | 7/25 at 100.00 | N/R | 715,028 |
| | Project, Series 2015A, 5.500%, 7/01/35 | | | |
| 1,000 | | Columbus, Minnesota, Charter School Lease Revenue Bonds, New Millennium Academy Project, | 7/25 at 100.00 | B– | 881,480 |
| | Series 2015A, 6.000%, 7/01/45 | | | |
| 505 | | Greenwood, Minnesota, Charter School Lease Revenue Bonds, Main Street School of | 7/26 at 100.00 | N/R | 514,413 |
| | Performing Arts Project, Series 2016A, 5.000%, 7/01/47 | | | |
| 2,000 | | Saint Paul Housing & Redevelopment Authority, Minnesota, Charter School Lease Revenue | 7/26 at 100.00 | N/R | 2,161,440 |
| | Bonds, Community School of Excellence, Series 2016A, 5.750%, 7/01/47, 144A | | | |
| 3,000 | | Saint Paul Port Authority, Minnesota, Solid Waste Disposal Revenue Bonds, Gerdau Saint | 10/22 at 100.00 | Ba1 | 3,105,720 |
| | Paul Steel Mill Project, Series 2012-7, 4.500%, 10/01/37, 144A (AMT) | | | |
| 7,170 | | Total Minnesota | | | 7,378,081 |
| | Mississippi – 0.1% (0.1% of Total Investments) | | | |
| 500 | | Mississippi Business Finance Corporation, Gulf Opportunity Zone Revenue Bonds, King Edward | 10/26 at 100.00 | N/R | 495,875 |
| | Mixed-Use Project, Refunding Series 2019A, 4.250%, 10/15/49, 144A (Mandatory Put 10/15/39) | | | |
| 608 | | Mississippi Home Corporation, Multifamily Housing Revenue Bonds, Tupelo Personal Care | 12/19 at 100.00 | N/R | 611,384 |
| | Apartments, Series 2004-2, 6.125%, 9/01/34 (AMT) | | | |
| 1,108 | | Total Mississippi | | | 1,107,259 |
| | Missouri – 2.0% (1.4% of Total Investments) | | | |
| 890 | | Hanley Road Corridor Transportation Development District, Brentwood and Maplewood, | 12/19 at 100.00 | A– | 892,314 |
| | Missouri, Transportation Sales Revenue Bonds, Refunding Series 2009A, 5.875%, 10/01/36 | | | |
| 1,280 | | Joplin Industrial Development Authority, Missouri, Tax Increment Revenue Bonds, Joplin | 4/23 at 100.00 | N/R | 1,354,317 |
| | Recovery TIF Redevelopment Project, Series 2013B, 5.875%, 4/01/36 | | | |
| 655 | | Kansas City Industrial Development Authority, Missouri, Sales Tax Revenue Bonds, Ward | 4/26 at 100.00 | N/R | 677,820 |
| | Parkway Center Community Improvement District, Senior Refunding & Improvement Series 2016, | | | |
| | 5.000%, 4/01/46, 144A | | | |
112
| | | | | | |
| Principal | | | Optional Call | | |
| Amount (000) | | Description (1) | Provisions (2) | Ratings (3) | Value |
| | Missouri (continued) | | | |
| $ 2,000 | | Liberty, Missouri, Special Obligation Tax Increment and Special Districts Bonds, Liberty | 6/25 at 100.00 | N/R | $ 2,054,840 |
| | Commons Project, Subordinate Lien Series 2015B, 8.500%, 6/15/46, 144A | | | |
| 10,000 | | Missouri Health and Educational Facilities Authority, Health Facilities Revenue Bonds, | 11/27 at 100.00 | AA– | 10,817,900 |
| | Mercy Health, Series 2017C, 4.000%, 11/15/49 (UB) (5) | | | |
| 1,100 | | Saint Louis Industrial Development Authority, Missouri, Confluence Academy Project, | 12/19 at 100.00 | N/R | 1,100,033 |
| | Series 2007A, 5.350%, 6/15/32 | | | |
| 805 | | Saint Louis Land Clearance for Redevelopment Authority, Missouri, Tax-Exempt Recovery Zone | 9/20 at 100.00 | N/R | 819,941 |
| | Facilities Improvement, Special Revenue Bonds, Kiel Opera House Project, Series 2010B, | | | |
| | 7.000%, 9/01/35 | | | |
| 1,353 | | Saint Louis, Missouri, Tax Increment Financing Revenue Bonds, Fashion Square | 3/20 at 100.00 | N/R | 1,354,421 |
| | Redevelopment Project, Series 2008A, 6.300%, 8/22/26 | | | |
| 732 | | Saint Louis, Missouri, Tax Increment Financing Revenue Bonds, Grace Lofts Redevelopment | No Opt. Call | N/R | 256,200 |
| | Projects, Series 2007A, 6.000%, 12/31/26 | | | |
| 18,815 | | Total Missouri | | | 19,327,786 |
| | Nevada – 1.7% (1.2% of Total Investments) | | | |
| 1,000 | | City of Henderson, Nevada, Local Improvement District No T-20 Rainbow Canyon, Local | 9/28 at 100.00 | N/R | 1,071,940 |
| | Improvement Bonds, Series 2018, 5.375%, 9/01/48 | | | |
| 2,000 | | Director of Nevada State Department of Business & Industry, Environmental Improvement | 8/29 at 100.00 | N/R | 2,041,800 |
| | Revenue Bonds, Fulcrum Sierra Holdings LLC, Green Series 2019, 5.750%, 2/15/38, 144A (AMT) | | | |
| 10,000 | | Las Vegas Convention and Visitors Authority, Nevada, Convention Center Expansion Revenue | 7/28 at 100.00 | A+ | 10,910,600 |
| | Bonds, Series 2018B, 4.000%, 7/01/49 (UB) (5) | | | |
| 575 | | North Las Vegas, Nevada, Local Improvement Bonds, Special Improvement District 64 Valley | 12/28 at 100.00 | N/R | 606,067 |
| | Vista, Series 2019, 4.625%, 6/01/49 | | | |
| | Sparks Tourism Improvement District 1, Legends at Sparks Marina, Nevada, Senior Sales | | | |
| | Tax Revenue Bonds Series 2008A: | | | |
| 155 | | 6.500%, 6/15/20 | 11/19 at 100.00 | Ba2 | 158,129 |
| 1,500 | | 6.750%, 6/15/28, 144A | 11/19 at 100.00 | Ba2 | 1,530,300 |
| 15,230 | | Total Nevada | | | 16,318,836 |
| | New Jersey – 5.7% (3.9% of Total Investments) | | | |
| 2,500 | | New Jersey Economic Development Authority, Lease Revenue Bonds, State Government | 12/27 at 100.00 | BBB+ | 2,819,225 |
| | Buildings-Health Department & Taxation Division Office Project, Series 2018A, 5.000%, | | | |
| | 6/15/47 (UB) (5) | | | |
| 5,000 | | New Jersey Economic Development Authority, Lease Revenue Bonds, State Government | 12/27 at 100.00 | BBB+ | 5,638,450 |
| | Buildings-Juvenile Justice Commission Facilities Project, Series 2018C, 5.000%, 6/15/47 (UB) (5) | | | |
| 9,500 | | New Jersey Economic Development Authority, School Facilities Construction Bonds, Series | 6/27 at 100.00 | BBB+ | 10,701,750 |
| | 2017DDD, 5.000%, 6/15/42 (UB) (5) | | | |
| 2,100 | | New Jersey Economic Development Authority, Special Facilities Revenue Bonds, Continental | 8/22 at 101.00 | Ba3 | 2,295,510 |
| | Airlines Inc, Series 1999, 5.250%, 9/15/29 (AMT) | | | |
| 1,080 | | New Jersey Economic Development Authority, Special Facilities Revenue Bonds, Continental | 3/24 at 101.00 | Ba3 | 1,240,412 |
| | Airlines Inc, Series 2000A & 2000B, 5.625%, 11/15/30 (AMT) | | | |
| 1,000 | | New Jersey Economic Development Authority, Student Housing Revenue Bonds, Provident | 6/20 at 100.00 | N/R (6) | 1,027,400 |
| | Group-Montclair Properties LLC, Montclair State University Student Housing Project, Series | | | |
| | 2010A, 5.875%, 6/01/42 (Pre-refunded 6/01/20) | | | |
| 5,200 | | New Jersey Health Care Facilities Financing Authority, New Jersey, Revenue Bonds, Saint | 12/19 at 100.00 | BB+ | 5,216,484 |
| | Peters University Hospital, Series 2007, 5.750%, 7/01/37 | | | |
| 40,000 | | New Jersey Transportation Trust Fund Authority, Transportation System Bonds, Refunding | No Opt. Call | BBB+ | 23,393,600 |
| | Series 2006C, 0.000%, 12/15/36 – AMBAC Insured (UB) (5) | | | |
| 2,200 | | Tobacco Settlement Financing Corporation, New Jersey, Tobacco Settlement Asset-Backed | 6/28 at 100.00 | BB+ | 2,425,434 |
| | Bonds, Series 2018B, 5.000%, 6/01/46 | | | |
| 68,580 | | Total New Jersey | | | 54,758,265 |
113
| | | | | |
| NMZ | Nuveen Municipal High Income Opportunity Fund | |
| Portfolio of Investments (continued) | | | |
| | | | | |
| October 31, 2019 | | | |
|
|
|
| Principal | | | Optional Call | | |
| Amount (000) | | Description (1) | Provisions (2) | Ratings (3) | Value |
| | New Mexico – 0.6% (0.4% of Total Investments) | | | |
| $ 320 | | Mariposa East Public Improvement District, New Mexico, Revenue Bonds, Capital | 3/20 at 55.29 | N/R | $ 147,200 |
| | Appreciation Taxable Series 2015D, 0.000%, 3/01/32 | | | |
| 50 | | Mariposa East Public Improvement District, New Mexico, Special Levy Revenue Bonds, | 9/25 at 100.00 | N/R | 51,533 |
| | Series 2015A, 5.900%, 9/01/32 | | | |
| 230 | | Mariposa East Public Improvement District, New Mexico, Special Levy Revenue Bonds, | 9/25 at 100.00 | N/R | 237,052 |
| | Series 2015B, 5.900%, 9/01/32 | | | |
| 395 | | Mariposa East Public Improvement District, New Mexico, Special Levy Revenue Bonds, | No Opt. Call | N/R | 402,157 |
| | Series 2015C, 5.900%, 9/01/32 | | | |
| 1,210 | | Mesa Del Sol Public Improvement District 1, Albuquerque, New Mexico, Special Levy | 10/23 at 100.00 | N/R | 1,278,692 |
| | Revenue Bonds, Series 2013, 7.250%, 10/01/43 | | | |
| 965 | | New Mexico Hospital Equipment Loan Council, First Mortgage Revenue Bonds, La Vida LLena | 7/20 at 100.00 | BBB– (6) | 993,960 |
| | Project, Series 2010A, 5.875%, 7/01/30 (Pre-refunded 7/01/20) | | | |
| 1,020 | | Volterra Public Improvement District, Albuquerque, New Mexico, Special Levy Revenue | 10/24 at 100.00 | N/R | 1,067,440 |
| | Bonds, Series 2014, 6.750%, 10/01/33 | | | |
| 1,452 | | Winrock Town Center Tax Increment Development District, Albuquerque, New Mexico, Gross | 5/20 at 103.00 | N/R | 1,500,802 |
| | Receipts Tax Increment Bonds, Senior Lien Series 2015, 6.000%, 5/01/40, 144A | | | |
| 5,642 | | Total New Mexico | | | 5,678,836 |
| | New York – 8.6% (6.0% of Total Investments) | | | |
| 1,000 | | Brooklyn Arena Local Development Corporation, New York, Payment in Lieu of Taxes Revenue | 1/20 at 100.00 | AA+ (6) | 1,010,320 |
| | Bonds, Barclays Center Project, Series 2009, 6.375%, 7/15/43 (Pre-refunded 1/15/20) | | | |
| 4,000 | | Build NYC Resource Corporation, New York, Revenue Bonds, Albert Einstein College of Medicine, | 9/25 at 100.00 | N/R | 4,560,400 |
| | Inc, Series 2015, 5.500%, 9/01/45, 144A | | | |
| 200 | | Dormitory Authority of the State of New York, Revenue Bonds, Orange Regional Medical | 6/27 at 100.00 | BBB– | 234,202 |
| | Center Obligated Group, Series 2017, 5.000%, 12/01/36, 144A | | | |
| 1,000 | | Madison County Capital Resource Corporation, New York, Revenue Bonds, Cazenovia College | 6/22 at 100.00 | N/R | 996,560 |
| | Project, Series 2019A, 5.500%, 9/01/22 | | | |
| 10,000 | | Metropolitan Transportation Authority, New York, Transportation Revenue Bonds, Series | 11/26 at 100.00 | A | 11,579,600 |
| | 2016C-1, 5.000%, 11/15/56 (UB) (5) | | | |
| 14,260 | | New York City Housing Development Corporation, New York, Multifamily Housing Revenue | 9/26 at 100.00 | Aa2 | 15,286,150 |
| | Bonds, Sustainable Neighborhood Series 2018K, 4.125%, 11/01/53 (UB) (5) | | | |
| | New York City Industrial Development Agency, New York, Civic Facility Revenue Bonds, | | | |
| | Bronx Parking Development Company, LLC Project, Series 2007: | | | |
| 1,500 | | 3.163%, 10/01/37 (4) | 12/19 at 100.00 | N/R | 990,000 |
| 5,000 | | 3.231%, 10/01/46 (4) | 12/19 at 100.00 | N/R | 3,300,000 |
| 395 | | New York City Industrial Development Agency, New York, Civic Facility Revenue Bonds, | 12/19 at 100.00 | N/R | 389,146 |
| | Special Needs Facilities Pooled Program, Series 2008A-1, 5.800%, 7/01/23 | | | |
| 7,075 | | New York City, New York, General Obligation Bonds, Fiscal 2017 Series A-1, 5.000%, | 8/26 at 100.00 | AA | 8,392,153 |
| | 8/01/38 (UB) (5) | | | |
| 500 | | New York Liberty Development Corporation, Liberty Revenue Bonds, Secured by Port | 12/21 at 100.00 | AA– | 649,500 |
| | Authority Consolidated Bonds, Tender Option Bond Trust 2016-XG0062, 14.725%, | | | |
| | 12/15/41, 144A (IF) (5) | | | |
| 1,000 | | New York Liberty Development Corporation, New York, Liberty Revenue Bonds, 3 World Trade | 11/24 at 100.00 | N/R | 1,103,540 |
| | Center Project, Class 1 Series 2014, 5.000%, 11/15/44, 144A | | | |
| 3,250 | | New York Liberty Development Corporation, New York, Liberty Revenue Bonds, 3 World Trade | 11/24 at 100.00 | N/R | 3,643,282 |
| | Center Project, Class 2 Series 2014, 5.150%, 11/15/34, 144A | | | |
| 6,000 | | New York Liberty Development Corporation, New York, Liberty Revenue Bonds, 3 World Trade | 11/24 at 100.00 | N/R | 7,142,280 |
| | Center Project, Class 3 Series 2014, 7.250%, 11/15/44, 144A | | | |
| 1,375 | | New York Liberty Development Corporation, New York, Liberty Revenue Bonds, Bank of | 1/20 at 100.00 | AA+ (6) | 1,389,053 |
| | America Tower at One Bryant Park Project, Second Priority Refunding Series 2010, 6.375%, | | | |
| | 7/15/49 (Pre-refunded 1/15/20) | | | |
114
| | | | | | |
| Principal | | | Optional Call | | |
| Amount (000) | | Description (1) | Provisions (2) | Ratings (3) | Value |
| | New York (continued) | | | |
| | New York Liberty Development Corporation, Second Priority Liberty Revenue Refunding Bonds, | | | |
| | Bank of America Tower at One Bryant Park Project, Tender Option Bond Trust 2016-XG0018: | | | |
| $ 250 | | 14.966%, 1/15/44 (Pre-refunded 1/15/20), 144A (IF) (5) | 1/20 at 100.00 | AA+ (6) | $ 258,090 |
| 625 | | 14.966%, 1/15/44 (Pre-refunded 1/15/20), 144A (IF) (5) | 1/20 at 100.00 | AA+ (6) | 645,225 |
| 4,985 | | New York Transportation Development Corporation, Special Facilities Bonds, LaGuardia | 7/24 at 100.00 | A2 | 5,562,811 |
| | Airport Terminal B Redevelopment Project, Series 2016A, 5.000%, 7/01/46 – AGM Insured | | | |
| | (AMT) (UB) (5) | | | |
| 3,265 | | Port Authority of New York and New Jersey, Consolidated Revenue Bonds, Two Hundred | 4/27 at 100.00 | AA– | 3,865,858 |
| | Series 2017, 5.000%, 4/15/57 (UB) (5) | | | |
| 530 | | Port Authority of New York and New Jersey, Special Project Bonds, JFK International Air | 12/20 at 100.00 | BBB+ | 555,270 |
| | Terminal LLC Project, Eighth Series 2010, 6.000%, 12/01/42 | | | |
| 1,000 | | Suffolk County Industrial Development Agency, New York, Revenue Bonds, Nissequogue | 12/19 at 100.00 | N/R | 1,009,610 |
| | Cogeneration Partners Facility, Series 1998, 5.500%, 1/01/23 (AMT) | | | |
| 9,975 | | Westchester County Local Development Corporation, New York, Revenue Bonds, Westchester | 11/25 at 100.00 | BBB– | 11,202,723 |
| | Medical Center Obligated Group Project, Refunding Series 2016, 5.000%, 11/01/46 (UB) (5) | | | |
| 77,185 | | Total New York | | | 83,765,773 |
| | North Carolina – 0.1% (0.1% of Total Investments) | | | |
| 940 | | Charlotte-Mecklenberg Hospital Authority, North Carolina, Health Care Revenue Bonds, DBA | 1/21 at 100.00 | AA– | 1,101,821 |
| | Carolinas HealthCare System, Tender Option Bond Trust 2016-XF2222, 15.341%, | | | |
| | 1/15/42, 144A (IF) | | | |
| | North Dakota – 0.1% (0.1% of Total Investments) | | | |
| 2,000 | | Williston, North Dakota, Multifamily Housing Revenue Bonds, Eagle Crest Apartments LLC | 9/23 at 100.00 | N/R | 880,000 |
| | Project, Series 2013, 7.750%, 9/01/38 (4) | | | |
| | Ohio – 8.1% (5.6% of Total Investments) | | | |
| 30,500 | | Buckeye Tobacco Settlement Financing Authority, Ohio, Tobacco Settlement Asset-Backed | 11/19 at 9.11 | N/R | 1,326,750 |
| | Revenue Bonds, Second Subordinate Capital Appreciation Turbo Term Series 2007C, | | | |
| | 0.000%, 6/01/52 | | | |
| | Buckeye Tobacco Settlement Financing Authority, Ohio, Tobacco Settlement Asset-Backed | | | |
| | Revenue Bonds, Senior Lien, Series 2007A-2: | | | |
| 10,000 | | 5.875%, 6/01/30 | 11/19 at 100.00 | CCC+ | 10,027,400 |
| 6,875 | | 5.750%, 6/01/34 | 11/19 at 100.00 | CCC+ | 6,883,662 |
| 10,500 | | 5.875%, 6/01/47 | 11/19 at 100.00 | B– | 10,567,410 |
| 2,005 | | 6.500%, 6/01/47 | 11/19 at 100.00 | B– | 2,050,534 |
| 5,455 | | Buckeye Tobacco Settlement Financing Authority, Ohio, Tobacco Settlement Asset-Backed | 6/22 at 100.00 | Caa3 | 5,588,047 |
| | Revenue Bonds, Senior Lien, Series 2007A-3, 6.250%, 6/01/37 | | | |
| 1,500 | | Butler County Port Authority, Ohio, Public Infrastructure Revenue Bonds, Liberty Center | 12/22 at 100.00 | N/R | 1,531,920 |
| | Project, Liberty Community Authority, Series 2014C, 6.000%, 12/01/43 | | | |
| 1,270 | | Medina County Port Authority, Ohio, Development Revenue Bond, Fiber Network Project, | 12/20 at 100.00 | AA– | 1,314,234 |
| | Series 2010B, 6.000%, 12/01/30 | | | |
| 11,160 | | Montgomery County, Ohio, Hospital Facilities Revenue Bonds, Kettering Health Network | 8/26 at 100.00 | A2 | 11,835,626 |
| | Obligated Group, Series 2016, 4.000%, 8/01/47 (UB) (5) | | | |
| 2,800 | | Ohio Air Quality Development Authority, Ohio, Air Quality Development Revenue Bonds, | No Opt. Call | N/R | 2,471,000 |
| | FirstEnergy Generation Corporation Project, Series 2009A, 5.700%, 8/01/20 (4) | | | |
| 3,310 | | Ohio Air Quality Development Authority, Ohio, Exempt Facilities Revenue Bonds, AMG | 7/29 at 100.00 | B3 | 3,659,470 |
| | Vanadium Project, Series 2019, 5.000%, 7/01/49, 144A (AMT) | | | |
| 365 | | Ohio Air Quality Development Authority, Ohio, Pollution Control Revenue Bonds, | No Opt. Call | N/R | 322,113 |
| | FirstEnergy Generation Corporation Project, Refunding Series 2009B, 3.100%, 3/01/23 (4) | | | |
| 2,015 | | Ohio Air Quality Development Authority, Ohio, Pollution Control Revenue Bonds, | No Opt. Call | N/R | 2,075,450 |
| | FirstEnergy Generation Corporation Project, Refunding Series 2009C, 5.625%, 6/01/18 (4) | | | |
115
| | | | | |
| NMZ | Nuveen Municipal High Income Opportunity Fund | |
| Portfolio of Investments (continued) | | | |
|
| October 31, 2019 | | | |
|
|
|
|
| Principal | | | Optional Call | | |
| Amount (000) | | Description (1) | Provisions (2) | Ratings (3) | Value |
| | Ohio (continued) | | | |
| $ 4,750 | | Ohio Air Quality Development Authority, Ohio, Pollution Control Revenue Bonds, | No Opt. Call | N/R | $ 4,191,875 |
| | FirstEnergy Nuclear Generation Project, Refunding Series 2008C, 3.950%, 11/01/32 (AMT) | | | |
| | (Mandatory Put 5/01/20) (4) | | | |
| 3,000 | | Ohio Water Development Authority, Pollution Control Revenue Refunding Bonds, FirstEnergy | No Opt. Call | N/R | 2,647,500 |
| | Nuclear Generating Corporation Project, Series 2005B, 4.000%, 1/01/34 (Mandatory | | | |
| | Put 7/01/21) (4) | | | |
| 3,085 | | Ohio Water Development Authority, Pollution Control Revenue Refunding Bonds, FirstEnergy | No Opt. Call | N/R | 2,722,512 |
| | Nuclear Generating Corporation Project, Series 2006A, 3.000%, 5/15/19 (4) | | | |
| 255 | | Ohio Water Development Authority, Pollution Control Revenue Refunding Bonds, FirstEnergy | No Opt. Call | N/R | 225,038 |
| | Nuclear Generating Corporation Project, Series 2008B, 3.625%, 10/01/33 (Mandatory Put | | | |
| | 4/01/20) (4) | | | |
| 1,015 | | Ohio Water Development Authority, Pollution Control Revenue Refunding Bonds, FirstEnergy | No Opt. Call | N/R | 895,737 |
| | Nuclear Generating Corporation Project, Series 2008C, 3.950%, 11/01/32 (AMT) (Mandatory | | | |
| | Put 5/01/20) (4) | | | |
| 2,725 | | Ohio Water Development Authority, Pollution Control Revenue Refunding Bonds, FirstEnergy | No Opt. Call | N/R | 2,404,813 |
| | Nuclear Generating Corporation Project, Series 2010A, 3.750%, 7/01/33 (Mandatory Put 7/01/20) (4) | | | |
| 3,000 | | Ohio Water Development Authority, Pollution Control Revenue Refunding Bonds, FirstEnergy | No Opt. Call | N/R | 3,217,500 |
| | Nuclear Generating Corporation Project, Series 2010B, 4.375%, 6/01/33 (Mandatory Put 6/01/22) (4) | | | |
| 2,000 | | Tuscarawas County Economic Development and Finance Alliance, Ohio, Higher Education | 3/25 at 100.00 | N/R | 2,131,740 |
| | Facilities Revenue Bonds, Ashland University, Refunding & Improvement Series 2015, | | | |
| | 6.000%, 3/01/45 | | | |
| 6,000 | | Western Reserve Port Authority, Ohio, Solid Waste Facility Revenue Bonds, Central Waste | 12/19 at 100.00 | N/R | 60 |
| | Inc, Series 2007A, 6.350%, 7/01/27 (AMT) (4) | | | |
| 113,585 | | Total Ohio | | | 78,090,391 |
| | Oklahoma – 0.2% (0.1% of Total Investments) | | | |
| 1,745 | | Fort Sill Apache Tribe of Oklahoma Economic Development Authority, Gaming Enterprise | 8/21 at 100.00 | N/R | 1,928,225 |
| | Revenue Bonds, Fort Sill Apache Casino, Series 2011A, 8.500%, 8/25/26, 144A | | | |
| | Pennsylvania – 1.5% (1.0% of Total Investments) | | | |
| 1,250 | | Allentown Neighborhood Improvement Zone Development Authority, Pennsylvania, Tax Revenue | 5/28 at 100.00 | N/R | 1,396,150 |
| | Bonds, City Center Project, Subordinate Lien, Series 2018, 5.125%, 5/01/32, 144A | | | |
| 2,500 | | Beaver County Industrial Development Authority, Pennsylvania, Pollution Control Revenue | No Opt. Call | N/R | 2,206,250 |
| | Refunding Bonds, FirstEnergy Nuclear Generation Project, Series 2006A, 3.500%, 4/01/41 | | | |
| | (Mandatory Put 6/01/20) (4) | | | |
| 2,715 | | Beaver County Industrial Development Authority, Pennsylvania, Pollution Control Revenue | No Opt. Call | N/R | 2,395,987 |
| | Refunding Bonds, FirstEnergy Nuclear Generation Project, Series 2006B, 3.500%, 12/01/35 | | | |
| | (Mandatory Put 6/01/20) (4) | | | |
| 185 | | Montgomery County Industrial Development Authority, Pennsylvania, FHA Insured Mortgage | 8/20 at 100.00 | N/R (6) | 208,345 |
| | Revenue Bonds, New Regional Medical Center Project, Tender Option Bond Trust 2017-XF2454, | | | |
| | 16.063%, 8/01/38 (Pre-refunded 8/01/20), 144A (IF) (5) | | | |
| 5 | | Pennsylvania Economic Development Financing Authority, Exempt Facilities Revenue Bonds, | No Opt. Call | N/R | 4,413 |
| | Shippingport Project, First Energy Guarantor, Series 2006A, 2.550%, 11/01/41 (4) | | | |
| 4,250 | | Pennsylvania Economic Development Financing Authority, Exempt Facilities Revenue | 9/25 at 100.00 | B3 | 4,595,780 |
| | Refunding Bonds, PPL Energy Supply, LLC Project, Series 2009A, 6.400%, 12/01/38 | | | |
| 2,500 | | Philadelphia Authority for Industrial Development, Pennsylvania, Revenue Bonds, Nueva | 1/23 at 100.00 | N/R | 2,760,900 |
| | Esperanza, Inc – Esperanza Academy Charter School, Series 2013, 8.000%, 1/01/33 | | | |
| 510 | | Philadelphia Hospitals and Higher Education Facilities Authority, Pennsylvania, Hospital | 7/22 at 100.00 | Ba1 | 555,808 |
| | Revenue Bonds, Temple University Health System Obligated Group, Series 2012A, 5.625%, 7/01/36 | | | |
| 180 | | The Redevelopment Authority of the City of Scranton, Lackawanna county, Pennsylvania, | 5/24 at 100.00 | BB+ | 185,882 |
| | Guaranteed Lease Revenue Bonds, Series 2016A, 5.000%, 11/15/28 | | | |
| 14,095 | | Total Pennsylvania | | | 14,309,515 |
116
| | | | | | |
| Principal | | | Optional Call | | |
| Amount (000) | | Description (1) | Provisions (2) | Ratings (3) | Value |
| | Puerto Rico – 3.9% (2.7% of Total Investments) | | | |
| | Puerto Rico Aqueduct and Sewerage Authority, Revenue Bonds, Senior Lien Series 2008A: | | | |
| $ 5,260 | | 6.000%, 7/01/38 | 12/19 at 100.00 | C | $ 5,332,325 |
| 2,125 | | 6.000%, 7/01/44 | 12/19 at 100.00 | C | 2,154,219 |
| 2,000 | | Puerto Rico Aqueduct and Sewerage Authority, Revenue Bonds, Senior Lien Series 2012A, | 7/22 at 100.00 | C | 2,097,500 |
| | 5.250%, 7/01/42 | | | |
| 1,500 | | Puerto Rico Electric Power Authority, Power Revenue Bonds, Federally Taxable Build | 7/20 at 100.00 | D | 1,141,875 |
| | America Bonds, Series 2010YY, 4.050%, 7/01/40 (4) | | | |
| | Puerto Rico Electric Power Authority, Power Revenue Bonds, Refunding Series 2012A: | | | |
| 1,835 | | 3.957%, 7/01/42 (4) | 7/22 at 100.00 | D | 1,380,838 |
| 185 | | 3.961%, 7/01/42 (4) | 7/22 at 100.00 | D | 139,213 |
| 2,000 | | Puerto Rico Electric Power Authority, Power Revenue Bonds, Series 2003NN, 3.999%, 7/01/20 (4) | No Opt. Call | D | 1,515,000 |
| 615 | | Puerto Rico Electric Power Authority, Power Revenue Bonds, Series 2007TT, 3.957%, 7/01/37 (4) | 12/19 at 100.00 | D | 462,788 |
| 405 | | Puerto Rico Electric Power Authority, Power Revenue Bonds, Series 2010CCC, 3.957%, 7/01/28 (4) | 7/20 at 100.00 | D | 304,763 |
| 3,000 | | Puerto Rico Electric Power Authority, Power Revenue Bonds, Series 2010ZZ, 3.978%, 7/01/25 (4) | 7/20 at 100.00 | D | 2,287,500 |
| 375 | | Puerto Rico Electric Power Authority, Power Revenue Bonds, Series WW, 3.978%, 7/01/33 (4) | 12/19 at 100.00 | D | 285,938 |
| 3,000 | | Puerto Rico Electric Power Authority, Power Revenue Bonds, Taxable Build America Bond | 7/20 at 100.00 | D | 2,283,750 |
| | Series 2010EE, 6.050%, 7/01/32 (4) | | | |
| | Puerto Rico Sales Tax Financing Corporation, Sales Tax Revenue Bonds, Restructured 2018A-1: | | | |
| 30,000 | | 0.010%, 7/01/46 | 7/28 at 41.38 | N/R | 7,837,500 |
| 10,000 | | 0.000%, 7/01/51 | 7/28 at 30.01 | N/R | 1,951,400 |
| 4,000 | | 4.750%, 7/01/53 | 7/28 at 100.00 | N/R | 4,141,600 |
| 3,185 | | 5.000%, 7/01/58 | 7/28 at 100.00 | N/R | 3,351,575 |
| 1,000 | | Puerto Rico Sales Tax Financing Corporation, Sales Tax Revenue Bonds, Taxable | 7/28 at 100.00 | N/R | 1,032,730 |
| | Restructured Cofina Project Series 2019A-2, 4.784%, 7/01/58 | | | |
| 70,485 | | Total Puerto Rico | | | 37,700,514 |
| | Rhode Island – 0.4% (0.3% of Total Investments) | | | |
| 1,000 | | Rhode Island Health & Educational Building Corporation, Health Facilities Revenue Bonds, | 1/21 at 100.00 | N/R (6) | 1,081,660 |
| | Tockwotton Home, Series 2011, 8.375%, 1/01/46 (Pre-refunded 1/01/21) | | | |
| 18,260 | | Rhode Island Tobacco Settlement Financing Corporation, Tobacco Settlement Asset-Backed | 11/19 at 14.61 | CCC– | 2,445,379 |
| | Bonds, Series 2007A, 0.000%, 6/01/52 | | | |
| 19,260 | | Total Rhode Island | | | 3,527,039 |
| | South Carolina – 2.2% (1.5% of Total Investments) | | | |
| 4,000 | | Lancaster County, South Carolina, Special Assessment Bonds, Edgewater II Improvement | 12/19 at 100.00 | N/R | 840,000 |
| | District, Series 2007A, 7.750%, 11/01/39 (4) | | | |
| 3,477 | | Lancaster County, South Carolina, Special Assessment Bonds, Edgewater II Improvement | No Opt. Call | N/R | 730,170 |
| | District, Series 2007B, 7.700%, 11/01/17 (4) | | | |
| 990 | | South Carolina Jobs-Economic Development Authority, Economic Development Revenue Bonds, | 11/24 at 100.00 | N/R | 1,119,136 |
| | Midland Valley Preparatory School Project, Series 2014, 7.750%, 11/15/45, 144A | | | |
| 1,000 | | South Carolina Jobs-Economic Development Authority, Educational Facilities Revenue | 12/29 at 100.00 | Baa3 | 1,132,450 |
| | Bonds, Lowcountry Leadership Charter School Project, Series 2019A, 5.000%, 12/01/49, 144A | | | |
| 1,250 | | South Carolina Jobs-Economic Development Authority, Hospital Revenue Bonds, Palmetto | 8/21 at 100.00 | AA (6) | 1,364,275 |
| | Health, Refunding Series 2011A, 6.500%, 8/01/39 (Pre-refunded 8/01/21) – AGM Insured | | | |
| 3,000 | | South Carolina Public Service Authority Santee Cooper Revenue Obligations, Refunding | 12/26 at 100.00 | A– | 3,498,840 |
| | Series 2016B, 5.000%, 12/01/46 (UB) (5) | | | |
| 11,615 | | South Carolina Public Service Authority, Santee Cooper Revenue Obligations, Series | 6/24 at 100.00 | A– | 12,935,393 |
| | 2014A, 5.000%, 12/01/49 (UB) (5) | | | |
| 25,332 | | Total South Carolina | | | 21,620,264 |
117
| | | | | |
| NMZ | Nuveen Municipal High Income Opportunity Fund | |
| Portfolio of Investments (continued) | | | |
|
| October 31, 2019 | | | |
|
|
|
|
| Principal | | | Optional Call | | |
| Amount (000) | | Description (1) | Provisions (2) | Ratings (3) | Value |
| | Tennessee – 3.7% (2.6% of Total Investments) | | | |
| $ 3,000 | | Johnson City Health and Educational Facilities Board, Tennessee, Hospital Revenue Bonds, | 7/20 at 100.00 | Baa1 (6) | $ 3,103,890 |
| | Mountain States Health Alliance, Refunding Series 2010A, 6.500%, 7/01/38 | | | |
| | (Pre-refunded 7/01/20) | | | |
| | Metropolitan Government of Nashville-Davidson County Health and Educational Facilities | | | |
| | Board, Tennessee, Revenue Bonds, Vanderbilt University Medical Center, Series 2016A: | | | |
| 11,095 | | 5.000%, 7/01/40 (UB) | 7/26 at 100.00 | A3 | 12,932,665 |
| 5,240 | | 5.000%, 7/01/46 (UB) (5) | 7/26 at 100.00 | A3 | 6,042,034 |
| 5,000 | | The Health and Educational Facilities Board of the City of Franklin, Tennessee, Revenue | 6/27 at 100.00 | N/R | 5,566,600 |
| | Bonds, Provision Cares Proton Therapy Center, Nashville Project, Series 2017A, 7.500%, | | | |
| | 6/01/47, 144A | | | |
| 6,024 | | The Tennessee Energy Acquisition Corporation, Gas Revenue Bonds, Series 2006B, | No Opt. Call | BBB | 7,357,051 |
| | 5.625%, 9/01/26 | | | |
| 940 | | Wilson County Health and Educational Facilities Board, Tennessee, Senior Living Revenue | 12/19 at 100.00 | N/R | 939,915 |
| | Bonds, Rutland Place Inc Project, Series 2015A, 5.500%, 1/01/46 | | | |
| 31,299 | | Total Tennessee | | | 35,942,155 |
| | Texas – 4.8% (3.3% of Total Investments) | | | |
| 500 | | Celina, Texas, Special Assessment Revenue Bonds, Celina Sutton Fields II Public | 9/29 at 100.00 | N/R | 495,795 |
| | Improvement District Neighborhood Improvement Areas 2-3 Project, Series 2019, 4.250%, | | | |
| | 9/01/49, 144A | | | |
| 1,000 | | Celina, Texas, Special Assessment Revenue Bonds, Creeks of Legacy Public Improvement | 9/22 at 103.00 | N/R | 1,039,980 |
| | District Phase 1 Project, Series 2014, 7.000%, 9/01/40 | | | |
| | Central Texas Regional Mobility Authority, Revenue Bonds, Senior Lien Series 2011: | | | |
| 250 | | 6.000%, 1/01/41 (Pre-refunded 1/01/21) | 1/21 at 100.00 | Baa1 (6) | 263,698 |
| 1,000 | | 6.750%, 1/01/41 (Pre-refunded 1/01/21) | 1/21 at 100.00 | Baa2 (6) | 1,062,670 |
| 4,165 | | Dallas Area Rapid Transit, Texas, Sales Tax Revenue Bonds, Refunding Series 2016A, | 12/25 at 100.00 | Aa2 | 4,853,308 |
| | 5.000%, 12/01/48 (UB) (5) | | | |
| | Decatur Hospital Authority, Texas, Revenue Bonds, Wise Regional Health System, Series 2013A: | | | |
| 390 | | 6.625%, 9/01/31 | 9/23 at 100.00 | N/R | 456,830 |
| 1,000 | | 6.375%, 9/01/42 | 9/23 at 100.00 | N/R | 1,140,670 |
| 165 | | Fate, Rockwall County, Texas, Special Assessment Revenue Bonds, Williamsburg Public | 8/27 at 100.00 | N/R | 166,845 |
| | Improvement District 1 Phase 2B, 2C & 3A1, Series 2019, 4.250%, 8/15/49, 144A | | | |
| 1,500 | | Fort Bend County Industrial Development Corporation, Texas, Revenue Bonds, NRG Energy | 11/22 at 100.00 | Baa3 | 1,582,830 |
| | Inc Project, Series 2012A RMKT, 4.750%, 5/01/38 | | | |
| 1,000 | | Gulf Coast Industrial Development Authority, Texas, Solid Waste Disposal Revenue Bonds, | 12/19 at 100.00 | B3 | 1,005,270 |
| | Citgo Petroleum Corporation Project, Series 1998, 8.000%, 4/01/28 (AMT) | | | |
| 125 | | Haslett, Texas, Special Assessment Revenue Bonds, Haslet Public Improvement District 5 | 9/29 at 100.00 | N/R | 126,238 |
| | Improvement Area 1 Project, Series 2019, 4.375%, 9/01/49, 144A | | | |
| 835 | | Heart of Texas Education Finance Corporation, Texas, Gateway Charter Academy, Series | 12/19 at 100.00 | N/R | 835,042 |
| | 2006A, 6.000%, 2/15/36 | | | |
| 3,355 | | Jefferson County Industrial Development Corporation, Texas, Hurricane Ike Disaster Area | 7/22 at 100.00 | N/R | 3,466,118 |
| | Revenue Bonds, Port of Beaumont Petroleum Transload Terminal, LLC Project, Series 2012, | | | |
| | 8.250%, 7/01/32 | | | |
| | Mesquite, Texas, Special Assessment Bonds, Iron Horse Public Improvement District | | | |
| | Project, Series 2019: | | | |
| 300 | | 5.750%, 9/15/39, 144A | 9/29 at 100.00 | N/R | 307,233 |
| 500 | | 6.000%, 9/15/49, 144A | 9/29 at 100.00 | N/R | 511,915 |
| 2,000 | | Mission Economic Development Corporation, Texas, Water Supply Revenue Bonds, Enviro | 1/26 at 102.00 | N/R | 1,000,000 |
| | Water Minerals Project, Green Bonds, Series 2015, 7.750%, 1/01/45, 144A (AMT) (4), (7) | | | |
| 1,000 | | New Hope Cultural Education Facilities Finance Corporation, Texas, Student Housing Revenue | 4/24 at 100.00 | BBB– | 973,830 |
| | Bonds, CHF-Collegiate Housing Corpus Christi I, LLC-Texas A&M University-Corpus Christi
|
| | |
| | Project, Series 2014A, 5.000%, 4/01/44 | | | |
118
| | | | | | |
| Principal | | | Optional Call | | |
| Amount (000) | | Description (1) | Provisions (2) | Ratings (3) | Value |
| | Texas (continued) | | | |
| $ 1,000 | | New Hope Cultural Education Facilities Finance Corporation, Texas, Student Housing | 4/26 at 100.00 | BBB– | $ 1,052,620 |
| | Revenue Bonds, CHF-Collegiate Housing Foundation – San Antonio 1, LLC – Texas A&M | | | |
| | University – San Antonio Project,, 5.000%, 4/01/48 | | | |
| | New Hope Cultural Education Facilities Finance Corporation, Texas, Student Housing Revenue | | | |
| | Bonds, NCCD – College Station Properties LLC – Texas A&M University Project, Series 2015A: | | | |
| 1,250 | | 5.000%, 7/01/35 | 7/25 at 100.00 | CCC | 1,162,438 |
| 2,445 | | 5.000%, 7/01/47 | 7/25 at 100.00 | CCC | 2,266,222 |
| 2,250 | | North Texas Tollway Authority, Special Projects System Revenue Bonds, Tender Option Bond | 9/21 at 100.00 | N/R (6) | 2,944,665 |
| | Trust 2016-XG0036, 16.451%, 9/01/41 (Pre-refunded 9/01/21), 144A (IF) | | | |
| 205 | | Princeton, Texas, Special Assessment Revenue Bonds, Whitewing Trails Public Improvement | 9/29 at 100.00 | N/R | 204,014 |
| | District 2 Phase 1 Project, Series 2019, 4.750%, 9/01/49, 144A | | | |
| 185 | | Princeton, Texas, Special Assessment Revenue Bonds, Whitewing Trails Public Improvement | 9/29 at 100.00 | N/R | 184,321 |
| | District 2 Phase 2-6 Major Improvement Project, Series 2019, 5.500%, 9/01/39, 144A | | | |
| 2,000 | | Red River Health Facilities Development Corporation, Texas, First Mortgage Revenue | 12/21 at 100.00 | N/R | 1,325,000 |
| | Bonds, Eden Home Inc, Series 2012, 2.576%, 12/15/32 (4) | | | |
| 175 | | Rowlett, Texas, Special Assessment Revenue Bonds, Bayside Public Improvement District | 3/24 at 102.00 | N/R | 175,817 |
| | North Improvement Area, Series 2016, 5.750%, 9/15/36 | | | |
| 5,000 | | Texas Department of Housing and Community Affairs, Single Family Mortgage Revenue Bonds, | 9/27 at 100.00 | AA+ | 5,434,650 |
| | Series 2018A, 4.250%, 9/01/48 (UB) (5) | | | |
| 2,810 | | Texas Private Activity Bond Surface Transportation Corporation, Revenue Bonds, NTE | 12/19 at 100.00 | BBB– | 2,835,402 |
| | Mobility Partners LLC North Tarrant Express Managed Lanes Project, Senior Lien Series 2009, | | | |
| | 6.875%, 12/31/39 | | | |
| | Texas Private Activity Bond Surface Transportation Corporation, Senior Lien Revenue | | | |
| | Bonds, LBJ Infrastructure Group LLC IH-635 Managed Lanes Project, Series 2010: | | | |
| 1,000 | | 7.000%, 6/30/34 | 6/20 at 100.00 | Baa3 | 1,039,160 |
| 4,500 | | 7.000%, 6/30/40 | 6/20 at 100.00 | Baa3 | 4,668,525 |
| 810 | | Texas Public Finance Authority Charter School Finance Corporation, Charter School | 12/19 at 100.00 | BB– | 811,944 |
| | Revenue Bonds, School of Excellence Education Project, Series 2004A, 7.000%, 12/01/34 | | | |
| 2,060 | | Texas State Affordable Housing Corporation Multifamily Housing Revenue Bonds, Peoples El | 1/34 at 100.00 | N/R | 2,204,381 |
| | Shaddai Village and St James Manor Apartments Project, Series 2016, 4.850%, 12/01/56, 144A | | | |
| | Travis County Health Facilities Development Corporation, Texas, Revenue Bonds, | | | |
| | Westminster Manor, Series 2010: | | | |
| 30 | | 7.000%, 11/01/30 | 11/20 at 100.00 | BBB+ | 30,708 |
| 440 | | 7.000%, 11/01/30 (Pre-refunded 11/01/20) | 11/20 at 100.00 | N/R (6) | 464,587 |
| 45,245 | | Total Texas | | | 46,092,726 |
| | Utah – 0.4% (0.3% of Total Investments) | | | |
| 1,690 | | Utah Charter School Finance Authority, Charter School Revenue Bonds, North Davis | 7/20 at 100.00 | BBB– | 1,730,239 |
| | Preparatory Academy, Series 2010, 6.375%, 7/15/40 | | | |
| 1,980 | | Utah Charter School Finance Authority, Charter School Revenue Bonds, Summit Academy High | 5/21 at 100.00 | N/R (6) | 2,180,930 |
| | School, Series 2011A, 8.125%, 5/15/31 (Pre-refunded 5/15/21) | | | |
| 3,670 | | Total Utah | | | 3,911,169 |
| | Vermont – 0.5% (0.4% of Total Investments) | | | |
| 3,400 | | Vermont Educational and Health Buildings Financing Agency, Revenue Bonds, University of | 6/26 at 100.00 | A | 3,935,194 |
| | Vermont Medical Center Project, Green Series 2016B, 5.000%, 12/01/46 (UB) (5) | | | |
| 1,155 | | Vermont Educational and Health Buildings Financing Agency, Revenue Bonds, Vermont Law | 1/21 at 100.00 | N/R (6) | 1,220,211 |
| | School Project, Series 2011A, 6.250%, 1/01/41 (Pre-refunded 1/01/21) | | | |
| 4,555 | | Total Vermont | | | 5,155,405 |
119
| | | | | |
| NMZ | Nuveen Municipal High Income Opportunity Fund | |
| Portfolio of Investments (continued) | | | |
| | | | | |
| October 31, 2019 | | | |
|
|
|
| Principal | | | Optional Call | | |
| Amount (000) | | Description (1) | Provisions (2) | Ratings (3) | Value |
| | Virgin Islands – 1.0% (0.7% of Total Investments) | | | |
| | Virgin Islands Public Finance Authority, Gross Receipts Taxes Loan Note, Refunding | | | |
| | Series 2014C: | | | |
| $ 1,000 | | 5.000%, 10/01/30 | 10/24 at 100.00 | N/R | $ 1,000,000 |
| 5,000 | | 5.000%, 10/01/39 | 10/24 at 100.00 | N/R | 4,953,100 |
| 1,000 | | Virgin Islands Public Finance Authority, Matching Fund Revenue Loan Note – Diageo | 12/19 at 100.00 | Caa3 | 1,001,920 |
| | Project, Series 2009A, 6.750%, 10/01/37 | | | |
| 2,820 | | Virgin Islands Water and Power Authority, Electric System Revenue Bonds, BANS Series | No Opt. Call | N/R | 2,824,286 |
| | 2018B, 7.000%, 7/01/20, 144A | | | |
| 9,820 | | Total Virgin Islands | | | 9,779,306 |
| | Virginia – 0.7% (0.5% of Total Investments) | | | |
| 762 | | Celebrate Virginia North Community Development Authority, Special Assessment Revenue | No Opt. Call | N/R | 457,200 |
| | Bonds, Series 2003B, 4.125%, 3/01/18 (4) | | | |
| 5,000 | | Industrial Development Authority of the City of Newport News, Virginia, Health System | 7/27 at 100.00 | N/R | 5,535,000 |
| | Revenue Bonds, Riverside Health System, Series 2017A, 5.000%, 7/01/46, 144A | | | |
| 1,000 | | Tobacco Settlement Financing Corporation of Virginia, Tobacco Settlement Asset Backed | 11/19 at 100.00 | B– | 1,002,720 |
| | Bonds, Series 2007B1, 5.000%, 6/01/47 | | | |
| | Virginia Small Business Financing Authority, Senior Lien Revenue Bonds, Elizabeth River | | | |
| | Crossing, Opco LLC Project, Series 2012: | | | |
| 80 | | 6.000%, 1/01/37 (AMT) | 7/22 at 100.00 | BBB | 88,637 |
| 130 | | 5.500%, 1/01/42 (AMT) | 7/22 at 100.00 | BBB | 141,543 |
| 6,972 | | Total Virginia | | | 7,225,100 |
| | Washington – 1.7% (1.2% of Total Investments) | | | |
| 1,000 | | King County Public Hospital District 4, Washington, Hospital Revenue Bonds, Snoqualmie | 12/25 at 100.00 | N/R | 1,059,460 |
| | Valley Hospital, Series 2015A, 6.250%, 12/01/45 | | | |
| 1,000 | | Kitsap County Consolidated Housing Authority, Washington, Pooled Tax Credit Housing | 12/19 at 100.00 | N/R | 1,001,130 |
| | Revenue Bonds, Series 2007, 5.600%, 6/01/37 (AMT) | | | |
| 220 | | Tacoma Consolidated Local Improvement District 65, Washington, Special Assessment Bonds, | 11/19 at 100.00 | N/R | 220,849 |
| | Series 2013, 5.750%, 4/01/43 | | | |
| 3,215 | | Washington Economic Development Finance Authority, Environmental Facilities Revenue | 1/28 at 100.00 | N/R | 3,303,155 |
| | Bonds, Columbia Pulp I, LLC Project, Series 2017A, 7.500%, 1/01/32, 144A (AMT) | | | |
| 570 | | Washington Economic Development Finance Authority, Environmental Facilities Revenue | 1/28 at 100.00 | N/R | 576,247 |
| | Bonds, Columbia Pulp I, LLC Project, Series 2018, 7.250%, 1/01/32, 144A (AMT) | | | |
| 1,565 | | Washington Economic Development Finance Authority, Environmental Facilities Revenue | 1/28 at 100.00 | N/R | 1,605,580 |
| | Bonds, Columbia Pulp I, LLC Project, Series 2019A, 7.500%, 1/01/32, 144A (AMT) | | | |
| 7,330 | | Washington Health Care Facilities Authority, Revenue Bonds, Virginia Mason Medical | 8/27 at 100.00 | BBB | 7,677,295 |
| | Center, Series 2017, 4.000%, 8/15/42 (UB) | | | |
| 1,000 | | Washington State Housing Finance Commission, Non-Profit Housing Revenue Bonds, Mirabella | 10/22 at 100.00 | N/R | 1,073,900 |
| | Project, Series 2012A, 6.750%, 10/01/47, 144A | | | |
| 15,900 | | Total Washington | | | 16,517,616 |
| | West Virginia – 0.3% (0.2% of Total Investments) | | | |
| 1,387 | | Berkeley, Hardy and Jefferson Counties, West Virginia, as Joint Issuers, Commercial | 12/23 at 100.00 | N/R | 1,445,975 |
| | Development Revenue Bonds, Scattered Site Housing Projects, Series 2010, 5.750%, 12/01/44 | | | |
| 1,125 | | Monongalia County Commission, West Virginia, Special District Excise Tax Revenue, | 6/27 at 100.00 | N/R | 1,243,249 |
| | University Town Centre Economic Opportunity Development District, Refunding & Improvement | | | |
| | Series 2017A, 5.750%, 6/01/43, 144A | | | |
| 2,512 | | Total West Virginia | | | 2,689,224 |
120
| | | | | | |
| Principal | | | Optional Call | | |
| Amount (000) | | Description (1) | Provisions (2) | Ratings (3) | Value |
| | Wisconsin – 6.2% (4.3% of Total Investments) | | | |
| $ 2,000 | | Lac Courte Oreilles Band of Lake Superior Chippewa Indians, Wisconsin, General Revenue | 12/27 at 100.00 | N/R | $ 2,029,640 |
| | Bonds, Refunding Series 2017, 6.750%, 6/01/32 | | | |
| 5,000 | | Public Finance Authority of Wisconsin, Charter School Revenue Bonds, North Carolina | 6/26 at 100.00 | N/R | 4,882,450 |
| | Charter Educational Foundation Project, Series 2016A, 5.000%, 6/15/46, 144A | | | |
| 1,650 | | Public Finance Authority of Wisconsin, Charter School Revenue Bonds, Thomas Jefferson | 11/19 at 100.00 | BBB– | 1,652,459 |
| | Classical Academy of Mooresboro, North Carolina, Series 2011, 7.125%, 7/01/42 | | | |
| | Public Finance Authority of Wisconsin, Conference Center and Hotel Revenue Bonds, | | | |
| | Lombard Public Facilities Corporation, First Tier Series 2018A-1: | | | |
| 13 | | 0.000%, 1/01/47, 144A | No Opt. Call | N/R | 419 |
| 11 | | 0.000%, 1/01/48, 144A | No Opt. Call | N/R | 368 |
| 11 | | 0.000%, 1/01/49, 144A | No Opt. Call | N/R | 361 |
| 10 | | 0.000%, 1/01/50, 144A | No Opt. Call | N/R | 342 |
| 10 | | 0.000%, 1/01/51, 144A | No Opt. Call | N/R | 337 |
| 13 | | 0.000%, 1/01/52, 144A | No Opt. Call | N/R | 428 |
| 13 | | 0.000%, 1/01/53, 144A | No Opt. Call | N/R | 423 |
| 13 | | 0.000%, 1/01/54, 144A | No Opt. Call | N/R | 404 |
| 13 | | 0.000%, 1/01/55, 144A | No Opt. Call | N/R | 394 |
| 12 | | 0.000%, 1/01/56, 144A | No Opt. Call | N/R | 387 |
| 608 | | 5.500%, 7/01/56, 144A | 3/28 at 100.00 | N/R | 583,550 |
| 14 | | 0.000%, 1/01/57, 144A | No Opt. Call | N/R | 424 |
| 13 | | 0.000%, 1/01/58, 144A | No Opt. Call | N/R | 411 |
| 13 | | 0.000%, 1/01/59, 144A | No Opt. Call | N/R | 399 |
| 13 | | 0.000%, 1/01/60, 144A | No Opt. Call | N/R | 385 |
| 12 | | 0.000%, 1/01/61, 144A | No Opt. Call | N/R | 375 |
| 12 | | 0.000%, 1/01/62, 144A | No Opt. Call | N/R | 361 |
| 12 | | 0.000%, 1/01/63, 144A | No Opt. Call | N/R | 352 |
| 12 | | 0.000%, 1/01/64, 144A | No Opt. Call | N/R | 344 |
| 11 | | 0.000%, 1/01/65, 144A | No Opt. Call | N/R | 333 |
| 12 | | 0.000%, 1/01/66, 144A | No Opt. Call | N/R | 346 |
| 148 | | 0.000%, 1/01/67, 144A | No Opt. Call | N/R | 3,933 |
| | Public Finance Authority of Wisconsin, Conference Center and Hotel Revenue Bonds, | | | |
| | Lombard Public Facilities Corporation, Second Tier Series 2018B: | | | |
| 24 | | 0.000%, 1/01/46, 144A | No Opt. Call | N/R | 816 |
| 24 | | 0.000%, 1/01/47, 144A | No Opt. Call | N/R | 790 |
| 24 | | 0.000%, 1/01/48, 144A | No Opt. Call | N/R | 788 |
| 23 | | 0.000%, 1/01/49, 144A | No Opt. Call | N/R | 781 |
| 23 | | 0.000%, 1/01/50, 144A | No Opt. Call | N/R | 753 |
| 25 | | 0.000%, 1/01/51, 144A | No Opt. Call | N/R | 826 |
| 659 | | 3.750%, 7/01/51, 144A | 3/28 at 100.00 | N/R | 584,784 |
| 25 | | 0.000%, 1/01/52, 144A | No Opt. Call | N/R | 803 |
| 25 | | 0.000%, 1/01/53, 144A | No Opt. Call | N/R | 792 |
| 25 | | 0.000%, 1/01/54, 144A | No Opt. Call | N/R | 779 |
| 24 | | 0.000%, 1/01/55, 144A | No Opt. Call | N/R | 765 |
| 24 | | 0.000%, 1/01/56, 144A | No Opt. Call | N/R | 756 |
| 24 | | 0.000%, 1/01/57, 144A | No Opt. Call | N/R | 743 |
| 23 | | 0.000%, 1/01/58, 144A | No Opt. Call | N/R | 728 |
| 23 | | 0.000%, 1/01/59, 144A | No Opt. Call | N/R | 722 |
| 23 | | 0.000%, 1/01/60, 144A | No Opt. Call | N/R | 705 |
| 23 | | 0.000%, 1/01/61, 144A | No Opt. Call | N/R | 687 |
| 23 | | 0.000%, 1/01/62, 144A | No Opt. Call | N/R | 676 |
| 22 | | 0.000%, 1/01/63, 144A | No Opt. Call | N/R | 663 |
| 22 | | 0.000%, 1/01/64, 144A | No Opt. Call | N/R | 657 |
| 22 | | 0.000%, 1/01/65, 144A | No Opt. Call | N/R | 641 |
| 22 | | 0.000%, 1/01/66, 144A | No Opt. Call | N/R | 610 |
| 281 | | 0.000%, 1/01/67, 144A | No Opt. Call | N/R | 7,487 |
| 4,700 | | Public Finance Authority of Wisconsin, Contract Revenue Bonds, Mercer Crossing Public | 3/27 at 100.00 | N/R | 4,834,655 |
| | Improvement District Project, Series 2017, 7.000%, 3/01/47, 144A | | | |
| 830 | | Public Finance Authority of Wisconsin, Educational Facility Revenue Bonds, Cottonwood | 12/22 at 100.00 | N/R | 862,071 |
| | Classical Preparatory School in Albuquerque, New Mexico, Series 2012A, 6.250%, 12/01/42 | | | |
121
| | | | | |
| NMZ | Nuveen Municipal High Income Opportunity Fund | |
| Portfolio of Investments (continued) | | | |
| | | | | |
| October 31, 2019 | | | |
|
|
|
| Principal | | | Optional Call | | |
| Amount (000) | | Description (1) | Provisions (2) | Ratings (3) | Value |
| | Wisconsin (continued) | | | |
| $ 335 | | Public Finance Authority of Wisconsin, Exempt Facilities Revenue Bonds, National Gypsum | 8/26 at 100.00 | N/R | $ 348,236 |
| | Company Project, Refunding Series 2016, 4.000%, 8/01/35 (AMT) | | | |
| 1,000 | | Public Finance Authority of Wisconsin, Limited Obligation Grant Revenue Bonds, American | No Opt. Call | N/R | 1,191,280 |
| | Dream @ Meadowlands Project, Series 2017A, 6.750%, 8/01/31, 144A | | | |
| | Public Finance Authority of Wisconsin, Limited Obligation PILOT Revenue Bonds, American | | | |
| | Dream @ Meadowlands Project, Series 2017: | | | |
| 2,000 | | 6.750%, 12/01/42, 144A | 12/27 at 100.00 | N/R | 2,367,180 |
| 14,000 | | 7.000%, 12/01/50, 144A | 12/27 at 100.00 | N/R | 16,766,540 |
| 3,500 | | Public Finance Authority of Wisconsin, Revenue Bonds, Alabama Gulf Coast Zoo, Series | 9/28 at 100.00 | N/R | 3,652,285 |
| | 2018A, 6.500%, 9/01/48 | | | |
| 500 | | Public Finance Authority of Wisconsin, Revenue Bonds, Alabama Proton Therapy Center, | 10/27 at 100.00 | N/R | 553,225 |
| | Senior Series 2017A, 7.000%, 10/01/47, 144A | | | |
| | Public Finance Authority of Wisconsin, Revenue Bonds, Procure Proton Therapy Center, | | | |
| | Senior Series 2018A: | | | |
| 2,415 | | 6.950%, 7/01/38, 144A | 7/28 at 100.00 | N/R | 2,490,976 |
| 4,585 | | 7.000%, 7/01/48, 144A | 7/28 at 100.00 | N/R | 4,510,677 |
| 1,060 | | Public Finance Authority of Wisconsin, Revenue Bonds, Roseman University of Health | 4/25 at 100.00 | BB | 1,179,716 |
| | Sciences, Series 2015, 5.875%, 4/01/45 | | | |
| 1,000 | | Public Finance Authority of Wisconsin, Revenue Bonds, SearStone Retirement Community of | 6/22 at 104.00 | N/R | 1,069,040 |
| | Cary North Carolina, Series 2016, 6.000%, 6/01/49, 144A | | | |
| | Public Finance Authority of Wisconsin, Senior Revenue Bonds, Maryland Proton Treatment | | | |
| | Center, Series 2018A-1: | | | |
| 1,000 | | 6.250%, 1/01/38, 144A | 1/28 at 100.00 | N/R | 1,054,620 |
| 2,000 | | 6.375%, 1/01/48, 144A | 1/28 at 100.00 | N/R | 2,111,660 |
| 5,000 | | Wisconsin Health and Educational Facilities Authority, Wisconsin, Revenue Bonds, | 5/26 at 100.00 | Aa2 | 5,399,950 |
| | Ascension Health Alliance Senior Credit Group, Series 2016A, 4.000%, 11/15/46 (UB) (5) | | | |
| 1,970 | | Wisconsin Public Finance Authority, Revenue Bonds, SearStone Retirement Community of | 6/22 at 100.00 | N/R (6) | 2,329,505 |
| | Cary North Carolina, Series 2012A, 8.625%, 6/01/47 (Pre-refunded 6/01/22) | | | |
| 56,977 | | Total Wisconsin | | | 60,488,993 |
| $ 1,412,512 | | Total Municipal Bonds (cost $1,299,364,732) | | | 1,373,348,566 |
|
| Shares | | Description (1) | | | Value |
| | COMMON STOCKS – 0.7% (0.5% of Total Investments) | | | |
| | Airlines – 0.7% (0.5% of Total Investments) | | | |
| 227,514 | | American Airlines Group Inc. (9) | | | $ 6,839,071 |
| | Total Common Stocks (cost $6,316,916) | | | 6,839,071 |
| | | | | | | |
| Principal | | | | | | |
| Amount (000) | | Description (1) | Coupon | Maturity | Ratings (3) | Value |
| | CORPORATE BONDS – 0.4% (0.3% of Total Investments) | | | | |
| | Industrials – 0.0% (0.0% of Total Investments) | | | | |
| $ 346 | | EWM P1 LLC (cash 13.750%, PIK 1.250%) (4), (7) | 15.000% | 9/01/28 | N/R | $ — |
| 193 | | EWM P1 LLC (4), (7) | 15.000% | 9/01/28 | N/R | — |
| 539 | | Total Industrials | | | | — |
| | Real Estate – 0.4% (0.3% of Total Investments) | | | | |
| 300 | | Zilkha Biomass Selma LLC | 5.000% | 8/01/28 | N/R | 320,589 |
| 3,200 | | Zilkha Biomass Selma LLC | 10.000% | 8/01/38 | N/R | 3,482,891 |
| 3,500 | | Total Real Estate | | | | 3,803,480 |
| $ 4,039 | | Total Corporate Bonds (cost $4,038,605) | | | | 3,803,480 |
| | Total Long-Term Investments (cost $1,309,720,253) | | | | 1,383,991,117 |
122
| | | | | | |
| Principal | | | Optional Call | | |
| Amount (000) | | Description (1) | Provisions (2) | Ratings (3) | Value |
| | SHORT-TERM INVESTMENTS – 1.9% (1.3% of Total Investments) | | | |
| | MUNICIPAL BONDS – 1.9% (1.3% of Total Investments) | | | |
| | Massachusetts – 0.7% (0.5% of Total Investments) | | | |
| $ 6,685 | | Massachusetts Development Finance Agency, Variable Rate Demand Obligations, Revenue Bonds, | 12/19 at 100.00 | A-1+ | $ 6,685,000 |
| | Tufts University, Series 2018R, 1.160%, 8/15/48 (11) | | | |
| | New York – 0.3% (0.2% of Total Investments) | | | |
| 3,000 | | New York City Transitional Finance Authority, New York, Variable Rate Demand Obligations, Future | 12/19 at 100.00 | A-1 | 3,000,000 |
| | Tax Secured Bonds, Subordinate Fiscal 2019 Subseries C-4, 1.300%, 11/01/44 (11) | | | |
| | North Carolina – 0.9% (0.6% of Total Investments) | | | |
| 8,200 | | University of North Carolina Chapel Hill, Variable Rate Demand Obligations, Revenue Bonds, | 1/20 at 100.00 | A-1 | 8,200,000 |
| | University of North Carolina Hospitals at Chapel Hill, Updates Series 2001A, 1.280%, 2/15/31 (11) | | | |
| $ 17,885 | | Total Short-Term Investments (cost $17,885,000) | | | 17,885,000 |
| | Total Investments (cost $1,327,605,253) – 144.7% | | | 1,401,876,117 |
| | Floating Rate Obligations – (39.6)% | | | (383,362,000) |
| | Adjustable Rate MuniFund Term Preferred Shares, net of deferred offering costs – (9.0)% (10) | | | (86,866,271) |
| | Other Assets Less Liabilities – 3.9% | | | 37,420,581 |
| | Net Assets Applicable to Common Shares – 100% | | | $ 969,068,427 |
| | |
(1) | All percentages shown in the Portfolio of Investments are based on net assets applicable to common shares unless otherwise noted. |
(2) | Optional Call Provisions: Dates (month and year) and prices of the earliest optional call or redemption. There may be other call provisions at varying prices at later dates. Certain mortgage-backed securities may be subject to periodic principal paydowns. Optional Call Provisions are not covered by the report of independent registered public accounting firm. |
(3) | The ratings disclosed are the lowest of Standard & Poor’s Group (“Standard & Poor’s”), Moody’s Investors Service, Inc. (“Moody’s”) or Fitch, Inc. (“Fitch”) rating. Ratings below BBB by Standard & Poor’s, Baa by Moody’s or BBB by Fitch are considered to be below investment grade. Holdings designated N/R are not rated by any of these national rating agencies. Ratings are not covered by the report of independent registered public accounting firm. |
(4) | Defaulted security. A security whose issuer has failed to fully pay principal and/or interest when due, or is under the protection of bankruptcy. |
(5) | Investment, or portion of investment, has been pledged to collateralize the net payment obligations for investments in inverse floating rate transactions. |
(6) | Backed by an escrow or trust containing sufficient U.S. Government or U.S. Government agency securities, which ensure the timely payment of principal and interest. |
(7) | Investment valued at fair value using methods determined in good faith by, or at the discretion of, the Board. For fair value measurement disclosure purposes, investment classified as Level 3. See Notes to Financial Statements, Note 3 – Investment Valuation and Fair Value Measurements for more information. |
(8) | Step-up coupon bond, a bond with a coupon that increases (“steps up”), usually at regular intervals, while the bond is outstanding. The rate shown is the coupon as of the end of the reporting period. |
(9) | On November 28, 2011, AMR Corp. (“AMR”), the parent company of American Airlines Group, Inc. (“AAL”) filed for federal bankruptcy protection. On December 9, 2013,AMR emerged from federal bankruptcy with the acceptance of its reorganization plan by the bankruptcy court. Under the settlement agreement established to meet AMR’s unsecured bond obligations, the bondholders, including the Fund, received a distribution of AAL preferred stock which was converted to AAL common stock over a 120-day period. Every 30 days, a quarter of the preferred stock was converted to AAL common stock based on the 5-day volume-weighted average price and the amount of preferred shares tendered during the optional preferred conversion period. |
(10) | Adjustable Rate MuniFund Term Preferred Shares, net of deferred offering costs as a percentage of Total Investments is 6.2%. |
(11) | Investment has a maturity of greater than one year, but has variable rate and/or demand features which qualify it as a short-term investment. The rate disclosed, as well as the reference rate and spread, where applicable, is that in effect as of the end of the reporting period. This rate changes periodically based on market conditions or a specified market index. |
144A | Investment is exempt from registration under Rule 144A of the Securities Act of 1933, as amended. These investments may only be resold in transactions exempt from registration, which are normally those transactions with qualified institutional buyers. |
AMT | Alternative Minimum Tax. |
IF | Inverse floating rate security issued by a tender option bond (“TOB”) trust, the interest rate on which varies inversely with the Securities Industry Financial Markets Association (SIFMA) short-term rate, which resets weekly, or a similar short-term rate, and is reduced by the expenses related to the TOB trust. |
PIK | Payment-in-kind (“PIK”) security. Depending on the terms of the security, income may be received in the form of cash, securities, or a combination of both. The PIK rate shown, where applicable, represents the annualized rate of the last PIK payment made by the issuer as of the end of the reporting period. |
UB | Underlying bond of an inverse floating rate trust reflected as a financing transaction. See Notes to Financial Statements, Note 4 – Portfolio Securities and Investments in Derivatives, Inverse Floating Rate Securities for more information. |
| See accompanying notes to financial statements |
123
| | |
| NMCO | Nuveen Municipal Credit Opportunities Fund Portfolio of Investments
October 31, 2019 |
| | | | | | |
| Principal | | | Optional Call | | |
| Amount (000) | | Description (1) | Provisions (2) | Ratings (3) | Value |
| | LONG-TERM INVESTMENTS – 91.1% (88.6% of Total Investments) | | | |
| | MUNICIPAL BONDS – 86.4% (84.0% of Total Investments) | | | |
| | Alabama – 4.6% (4.4% of Total Investments) | | | |
| $ 32,450 | | Hoover Industrial Development Board, Alabama, Environmental Improvement Revenue Bonds, | 10/29 at 100.00 | B3 | $ 34,279,855 |
| | United States Steel Corporation Project, Series 2019, 5.750%, 10/01/49 (AMT) | | | |
| 2,000 | | Tuscaloosa County Industrial Development Authority, Florida, Gulf Opportunity Zone | 5/29 at 100.00 | N/R | 2,305,020 |
| | Bonds, Hunt Refining Project, Refunding Series 2019A, 5.250%, 5/01/44, 144A | | | |
| 34,450 | | Total Alabama | | | 36,584,875 |
| | Alaska – 0.0% (0.0% of Total Investments) | | | |
| 200 | | Northern Tobacco Securitization Corporation, Alaska, Tobacco Settlement Asset-Backed | 11/19 at 100.00 | B3 | 200,272 |
| | Bonds, Series 2006A, 5.000%, 6/01/46 | | | |
| | Arizona – 0.6% (0.6% of Total Investments) | | | |
| 4,000 | | Arizona Industrial Development Authority, Arizona, Education Facility Revenue Bonds, Leman | 7/24 at 101.00 | N/R | 4,142,800 |
| | Academy of Excellence ? East Tucson & Central Tucson Projects, Series 2019A, 5.000%, | | | |
| | 7/01/49, 144A | | | |
| 500 | | Pima County Industrial Development Authority, Arizona, Education Facility Revenue Bonds, | 6/25 at 100.00 | N/R | 525,925 |
| | American Leadership Academy Project, Series 2019, 5.000%, 6/15/52, 144A | | | |
| 4,500 | | Total Arizona | | | 4,668,725 |
| | Arkansas – 3.1% (3.0% of Total Investments) | | | |
| 23,250 | | Arkansas Development Finance Authority, Industrial Development Revenue Bonds, Big River | 9/26 at 103.00 | B | 24,749,625 |
| | Steel Project, Series 2019, 4.500%, 9/01/49, 144A (AMT) | | | |
| | California – 4.9% (4.7% of Total Investments) | | | |
| 15,000 | | California Community Housing Agency, California, Essential Housing Revenue Bonds, | 8/29 at 100.00 | N/R | 16,962,000 |
| | Verdant at Green Valley Apartments, Series 2019A, 5.000%, 8/01/49, 144A | | | |
| | California School Finance Authority, California, Charter School Revenue Bonds, Encore | | | |
| | Education Obligated Group, Series 2016A: | | | |
| 4,020 | | 5.000%, 6/01/42, 144A | 6/26 at 100.00 | N/R | 3,674,481 |
| 4,380 | | 5.000%, 6/01/52, 144A | 6/26 at 100.00 | N/R | 3,875,293 |
| 1,095 | | California Statewide Communities Development Authority, California, Revenue Bonds, Loma | 6/28 at 100.00 | BB– | 1,284,917 |
| | Linda University Medical Center, Series 2018A, 5.500%, 12/01/58, 144A | | | |
| | California Statewide Community Development Authority, Revenue Bonds, Daughters of | | | |
| | Charity Health System, Series 2005A: | | | |
| 3,160 | | 5.750%, 7/01/24 | 12/19 at 100.00 | CC | 3,144,453 |
| 40 | | 5.750%, 7/01/30 | 12/19 at 100.00 | CC | 39,914 |
| 1,515 | | 5.750%, 7/01/35 | 12/19 at 100.00 | CC | 1,506,274 |
| 2,480 | | California Statewide Community Development Authority, Revenue Bonds, Daughters of | 12/19 at 100.00 | CC | 2,470,477 |
| | Charity Health System, Series 2005G, 5.500%, 7/01/22 | | | |
| 1,130 | | California Statewide Community Development Authority, Revenue Bonds, Daughters of | 12/19 at 100.00 | CC | 1,123,446 |
| | Charity Health System, Series 2005H, 5.750%, 7/01/25 | | | |
| 25,000 | | California Statewide Financing Authority, Tobacco Settlement Asset-Backed Bonds, Pooled | 11/19 at 19.53 | N/R | 4,864,250 |
| | Tobacco Securitization Program, Series 2006A, 0.000%, 6/01/46 | | | |
| 57,820 | | Total California | | | 38,945,505 |
| | Colorado – 2.0% (2.0% of Total Investments) | | | |
| 4,000 | | Colorado Health Facilities Authority, Colorado, Revenue Bonds, CommonSpirit Health, | 8/29 at 100.00 | BBB+ | 4,827,680 |
| | Series 2019A-1, 5.000%, 8/01/36 | | | |
| 4,210 | | Colorado Health Facilities Authority, Colorado, Revenue Bonds, CommonSpirit Health, | 8/29 at 100.00 | BBB+ | 3,994,701 |
| | Series 2019A-2, 3.250%, 8/01/49 | | | |
| 1,000 | | Palisade Metropolitan District 2, Broomfield County, Colorado, General Obligation | 12/24 at 103.00 | N/R | 997,320 |
| | Limited Tax Bonds, Subordinate Series 2019, 7.250%, 12/15/49 | | | |
124
| | | | | | |
| Principal | | | Optional Call | | |
| Amount (000) | | Description (1) | Provisions (2) | Ratings (3) | Value |
| | Colorado (continued) | | | |
| $ 705 | | Penrith Park Metropolitan District, Adams County, Colorado, General Obligation Limited | 12/24 at 103.00 | N/R | $ 715,737 |
| | Tax Bonds, Series 2019A, 5.000%, 12/01/49 | | | |
| 760 | | Talon Pointe Metropolitan District, Adams County, Colorado, Limited Tax General | 12/25 at 103.00 | N/R | 773,672 |
| | Obligation Bonds, Convertible to Unlimited Tax Refunding & Improvement Series 2019A, | | | |
| | 5.250%, 12/01/51 (WI/DD, Settling 11/12/19) | | | |
| | Thompson Crossing Metropolitan District 4, Johnstown, Larimer County, Colorado, General | | | |
| | Obligation Bonds, Limited Tax Convertible to Unlimited Tax, Refunding & Improvement Series 2019: | | | |
| 1,400 | | 5.000%, 12/01/39 | 9/24 at 103.00 | N/R | 1,507,086 |
| 2,125 | | 5.000%, 12/01/49 | 9/24 at 103.00 | N/R | 2,266,461 |
| 1,000 | | Willow Bend Metropolitan District, City of Thornton, Adams County, Colorado, Limited Tax | 9/24 at 103.00 | N/R | 1,056,930 |
| | General Obligation Bonds, Convertible to Unlimited Tax Series 2019A, 5.000%, 12/01/49 | | | |
| 15,200 | | Total Colorado | | | 16,139,587 |
| | Connecticut – 0.0% (0.0% of Total Investments) | | | |
| 4,396 | | Mashantucket Western Pequot Tribe, Connecticut, Special Revenue Bonds, Subordinate | No Opt. Call | N/R | 164,832 |
| | Series 2013A, 6.050%, 7/01/31 (cash 4.000%, PIK 2.050%) (5) | | | |
| | District of Columbia – 2.0% (2.0% of Total Investments) | | | |
| 86,000 | | District of Columbia Tobacco Settlement Corporation, Tobacco Settlement Asset-Backed | 12/19 at 19.53 | N/R | 16,427,720 |
| | Bonds, Series 2006A, 0.000%, 6/15/46 | | | |
| | Florida – 10.3% (10.0% of Total Investments) | | | |
| | Cape Coral Health Facilities Authority, Florida, Senior Housing Revenue Bonds, Gulf Care | | | |
| | Inc Project, Series 2015: | | | |
| 4,200 | | 5.875%, 7/01/40, 144A | 7/25 at 100.00 | N/R | 4,572,834 |
| 2,500 | | 6.000%, 7/01/45, 144A | 7/25 at 100.00 | N/R | 2,729,650 |
| 475 | | Capital Trust Agency, Florida, Senior Living Facilities Revenue Bonds, Elim Senior | 8/24 at 103.00 | N/R | 496,717 |
| | Housing, Inc Project, Series 2017, 5.875%, 8/01/52, 144A | | | |
| 500 | | Currents Community Development District, Collier County, Florida, Bond Anticipation | 10/20 at 100.00 | N/R | 500,015 |
| | Note, Series 2019, 4.500%, 11/01/20 | | | |
| | Epperson North Community Development District, Florida, Capital Improvement Revenue | | | |
| | Bonds, Assessment Area 1, Series 2018A-1: | | | |
| 1,000 | | 5.500%, 11/01/39, 144A | 11/29 at 100.00 | N/R | 1,098,340 |
| 1,000 | | 5.750%, 11/01/49, 144A | 11/29 at 100.00 | N/R | 1,102,550 |
| | Florida Development Finance Corporation, Educational Facilities Revenue Bonds, Miami | | | |
| | Arts Charter School Projects, Series 2014: | | | |
| 165 | | 5.000%, 6/15/24, 144A | No Opt. Call | N/R | 163,188 |
| 2,500 | | 5.875%, 6/15/34, 144A | 6/24 at 100.00 | N/R | 2,462,275 |
| 5,100 | | 6.000%, 6/15/44, 144A | 6/24 at 100.00 | N/R | 5,010,801 |
| 1,075 | | Florida Development Finance Corporation, Educational Facilities Revenue Bonds, Southwest | 6/27 at 100.00 | N/R | 1,145,810 |
| | Charter Foundation Inc Projects, Series 2017A, 6.000%, 6/15/37, 144A | | | |
| | Florida Development Finance Corporation, Florida, Surface Transportation Facility | | | |
| | Revenue Bonds, Virgin Trains USA Passenger Rail Project , Series 2019A: | | | |
| 11,000 | | 6.250%, 1/01/49 (AMT) (Mandatory Put 1/01/24), 144A | 1/20 at 104.00 | N/R | 10,477,500 |
| 40,815 | | 6.500%, 1/01/49 (AMT) (Mandatory Put 1/01/29), 144A | 1/20 at 105.00 | N/R | 38,456,301 |
| 7,000 | | Florida Development Finance Corporation, Student Housing Revenue Bonds, Midtown Campus | 12/23 at 105.00 | N/R | 7,091,280 |
| | Properties LLC Project, Series 2019, 6.875%, 12/01/38, 144A | | | |
| 2,550 | | Three Rivers Community Development District, Florida, Special Assessment Revenue Bonds, | 5/29 at 100.00 | N/R | 2,561,602 |
| | Series 2019A-1, 4.750%, 5/01/50 | | | |
| 1,575 | | Three Rivers Community Development District, Florida, Special Assessment Revenue Bonds, | No Opt. Call | N/R | 1,582,166 |
| | Series 2019A-2, 4.750%, 5/01/29 | | | |
| 2,000 | | Twin Creeks North Community Development District, Florida, Special Assessment Bonds, | 11/31 at 100.00 | N/R | 2,240,000 |
| | Master Infrastructure Improvements, Series 2016A-1, 6.375%, 11/01/47 | | | |
| 900 | | Westside Community Development District, Florida, Special Assessment Revenue Bonds, | 5/29 at 100.00 | N/R | 901,755 |
| | Refunding Series 2019, 4.125%, 5/01/38, 144A | | | |
| 84,355 | | Total Florida | | | 82,592,784 |
125
| | | | | | |
| NMCO | Nuveen Municipal Credit Opportunities Fund | | |
| | Portfolio of Investments (continued) | | | |
| | | | | | |
| | October 31, 2019 | | | |
|
|
|
| Principal | | | Optional Call | | |
| Amount (000) | | Description (1) | Provisions (2) | Ratings (3) | Value |
| | Georgia – 4.0% (3.9% of Total Investments) | | | |
| | Atlanta Development Authority, Georgia, Senior Health Care Facilities Revenue Bonds, | | | |
| | Georgia Proton Treatment Center Project, Current Interest Series 2017A-1: | | | |
| $ 4,015 | | 6.750%, 1/01/35 | 1/28 at 100.00 | N/R | $ 4,245,341 |
| 7,765 | | 7.000%, 1/01/40 | 1/28 at 100.00 | N/R | 8,245,886 |
| 441 | | Georgia Local Governments, Certificates of Participation, Georgia Municipal Association, | No Opt. Call | Baa2 | 507,485 |
| | Series 1998A, 4.750%, 6/01/28 – NPFG Insured | | | |
| 18,000 | | Georgia Municipal Electric Authority, Plant Vogtle Units 3 & 4 Project P Bonds, Series | 7/28 at 100.00 | Baa2 | 19,150,740 |
| | 2019B, 4.000%, 1/01/49 (UB) (4) | | | |
| 30,221 | | Total Georgia | | | 32,149,452 |
| | Illinois – 9.5% (9.3% of Total Investments) | | | |
| | Chicago, Illinois, General Obligation Bonds, Series 2019A: | | | |
| 4,550 | | 5.000%, 1/01/28 | No Opt. Call | BBB– | 5,311,260 |
| 5,000 | | 5.500%, 1/01/35 | 1/29 at 100.00 | BBB– | 5,982,400 |
| 4,485 | | 5.000%, 1/01/44 | 1/29 at 100.00 | BBB– | 5,052,980 |
| 4,475 | | 5.500%, 1/01/49 | 1/29 at 100.00 | BBB– | 5,213,509 |
| 9,900 | | Illinois Finance Authority, Revenue Bonds, Admiral at the Lake Project, Refunding Series | 5/24 at 103.00 | N/R | 10,318,275 |
| | 2017, 5.250%, 5/15/54 | | | |
| 5,000 | | Illinois Finance Authority, Student Housing Revenue Bonds, CHF-Collegiate Housing Foundation – | 7/25 at 100.00 | B– | 4,818,350 |
| | Cook LLC Northeastern Illinois University Project, Series 2015A, 5.000%, 7/01/47 | | | |
| 1,010 | | Illinois State, General Obligation Bonds, December Series 2017A, 4.000%, 12/01/33 | 12/27 at 100.00 | BBB– | 1,051,976 |
| 7,100 | | Illinois State, General Obligation Bonds, February Series 2014, 5.000%, 2/01/39 | 2/24 at 100.00 | BBB– | 7,612,478 |
| 1,000 | | Illinois State, General Obligation Bonds, June Series 2016, 4.000%, 6/01/34 | 6/26 at 100.00 | BBB– | 1,031,890 |
| | Illinois State, General Obligation Bonds, November Series 2017D: | | | |
| 20,000 | | 5.000%, 11/01/28 (UB) (4) | 11/27 at 100.00 | BBB– | 22,893,600 |
| 5,805 | | 5.000%, 11/01/28 | 11/27 at 100.00 | BBB– | 6,644,867 |
| 500 | | Morton Grove, Illinois, Tax Increment Revenue Bonds, Sawmill Station Redevelopment | 1/26 at 100.00 | N/R | 507,375 |
| | Project, Senior Lien Series 2019, 5.000%, 1/01/39 | | | |
| 68,825 | | Total Illinois | | | 76,438,960 |
| | Kentucky – 0.6% (0.5% of Total Investments) | | | |
| 1,105 | | Kentucky Economic Development Finance Authority, Revenue Bonds, CommonSpirit Health, | 8/29 at 100.00 | BBB+ | 1,350,708 |
| | Series 2019A-1, 5.000%, 8/01/32 | | | |
| 2,505 | | Kentucky Economic Development Finance Authority, Revenue Bonds, CommonSpirit Health, | 8/29 at 100.00 | BBB+ | 3,094,126 |
| | Series 2019A-2, 5.000%, 8/01/30 | | | |
| 3,610 | | Total Kentucky | | | 4,444,834 |
| | Louisiana – 0.6% (0.5% of Total Investments) | | | |
| 160 | | Lakeshore Villages Master Community Development District, Louisiana, Special Assessment | 6/30 at 100.00 | N/R | 158,616 |
| | Revenue Bonds, Series 2019, 4.125%, 6/01/39, 144A | | | |
| 3,950 | | Louisiana Local Government Environmental Facilities and Community Development Authority, | 11/29 at 100.00 | N/R | 3,959,915 |
| | Louisiana, Revenue Bonds, Jefferson Parish GOMESA Project, Series 2019, 4.000%, 11/01/44, 144A | | | |
| 395 | | Louisiana Local Government Environmental Facilities and Community Development Authority, | 12/22 at 105.00 | BB+ | 363,274 |
| | Multifamily Housing Revenue Bonds, Cove at Nola Apartments, Series 2017A, 4.000%, 12/01/27 | | | |
| 4,505 | | Total Louisiana | | | 4,481,805 |
| | Michigan – 2.5% (2.5% of Total Investments) | | | |
| 600,000 | | Michigan Tobacco Settlement Finance Authority, Tobacco Settlement Asset-Backed Revenue | 6/33 at 11.41 | N/R | 20,418,000 |
| | Bonds, Capital Appreciation Turbo Term Series 2008C, 0.010%, 6/01/58 | | | |
126
| | | | | | |
| Principal | | | Optional Call | | |
| Amount (000) | | Description (1) | Provisions (2) | Ratings (3) | Value |
| | Minnesota – 0.3% (0.3% of Total Investments) | | | |
| $ 500 | | Bethel, Minnesota Charter School Lease Revenue Bonds, Partnership Academy Project, | 7/26 at 102.00 | N/R | $ 518,810 |
| | Series 2018A, 5.000%, 7/01/53 | | | |
| 1,300 | | Brooklyn Park, Minnesota, Charter School Lease Revenue Bonds, Athlos Leadership Academy | 7/25 at 100.00 | N/R | 1,393,015 |
| | Project, Series 2015A, 5.750%, 7/01/46 | | | |
| 440 | | Columbia Heights, Minnesota, Charter School Lease Revenue Bonds, Prodeo Academy Project, | 7/27 at 102.00 | N/R | 450,639 |
| | Series 2019A, 5.000%, 7/01/54 | | | |
| 2,240 | | Total Minnesota | | | 2,362,464 |
| | Nevada – 1.1% (1.1% of Total Investments) | | | |
| 5,375 | | Director of Nevada State Department of Business & Industry, Environmental Improvement | 8/28 at 100.00 | N/R | 6,186,249 |
| | Revenue Bonds, Fulcrum Sierra BioFuels LLC Project, Green Series 2018, 6.950%, 2/15/38, | | | |
| | 144A (AMT) | | | |
| 2,750 | | Director of Nevada State Department of Business & Industry, Environmental Improvement | 8/29 at 100.00 | N/R | 2,807,475 |
| | Revenue Bonds, Fulcrum Sierra Holdings LLC, Green Series 2019, 5.750%, 2/15/38, 144A (AMT) | | | |
| 8,125 | | Total Nevada | | | 8,993,724 |
| | New Jersey – 3.9% (3.8% of Total Investments) | | | |
| 4,000 | | New Jersey Economic Development Authority Revenue Bonds, Black Horse EHT Urban Renewal | 10/27 at 102.00 | N/R | 4,012,240 |
| | LLC Project, Series 2019A, 5.000%, 10/01/39, 144A | | | |
| | New Jersey Transportation Trust Fund Authority, Transportation System Bonds, Series 2019BB: | | | |
| 10,000 | | 4.000%, 6/15/44 | 12/28 at 100.00 | BBB+ | 10,440,000 |
| 14,285 | | 4.000%, 6/15/50 | 12/28 at 100.00 | BBB+ | 14,850,400 |
| 1,800 | | Tobacco Settlement Financing Corporation, New Jersey, Tobacco Settlement Asset-Backed | 6/28 at 100.00 | BB+ | 1,984,446 |
| | Bonds, Series 2018B, 5.000%, 6/01/46 | | | |
| 30,085 | | Total New Jersey | | | 31,287,086 |
| | New York – 6.8% (6.6% of Total Investments) | | | |
| 375 | | Build New York City Resource Corporation, New York, Solid Waste Disposal Revenue Bonds, | No Opt. Call | N/R | 376,181 |
| | Pratt Paper NY, Inc Project, Series 2014, 3.750%, 1/01/20, 144A (AMT) | | | |
| 5,000 | | New York Liberty Development Corporation, New York, Liberty Revenue Bonds, 3 World Trade | 11/24 at 100.00 | N/R | 5,632,650 |
| | Center Project, Class 2 Series 2014, 5.375%, 11/15/40, 144A | | | |
| 30,000 | | New York State Thruway Authority, General Revenue Junior Indebtedness Obligations, | 1/30 at 100.00 | A– | 33,291,000 |
| | Series 2019B, 4.000%, 1/01/50 | | | |
| 15,200 | | TSASC Inc, New York, Tobacco Asset-Backed Bonds, Series 2006, 5.000%, 6/01/48 | 6/27 at 100.00 | N/R | 15,130,688 |
| 50,575 | | Total New York | | | 54,430,519 |
| | Ohio – 9.8% (9.6% of Total Investments) | | | |
| 36,200 | | Buckeye Tobacco Settlement Financing Authority, Ohio, Tobacco Settlement Asset-Backed | 11/19 at 14.07 | N/R | 2,213,630 |
| | Revenue Bonds, First Subordinate Capital Appreciation Turbo Term Series 2007B, 0.000%, 6/01/47 | | | |
| 100,000 | | Buckeye Tobacco Settlement Financing Authority, Ohio, Tobacco Settlement Asset-Backed | 11/19 at 9.11 | N/R | 4,350,000 |
| | Revenue Bonds, Second Subordinate Capital Appreciation Turbo Term Series 2007C, 0.000%, 6/01/52 | | | |
| | Buckeye Tobacco Settlement Financing Authority, Ohio, Tobacco Settlement Asset-Backed | | | |
| | Revenue Bonds, Senior Lien, Series 2007A-2: | | | |
| 2,000 | | 5.750%, 6/01/34 | 11/19 at 100.00 | CCC+ | 2,002,520 |
| 15,005 | | 5.875%, 6/01/47 | 11/19 at 100.00 | B– | 15,101,332 |
| | Butler County Port Authority, Ohio, Public Infrastructure Revenue Bonds, Liberty Center | | | |
| | Project, Liberty Community Authority, Series 2014C: | | | |
| 765 | | 5.000%, 12/01/24 | 12/22 at 100.00 | N/R | 783,031 |
| 1,000 | | 5.750%, 12/01/34 | 12/22 at 100.00 | N/R | 1,020,520 |
| 1,000 | | 6.000%, 12/01/43 | 12/22 at 100.00 | N/R | 1,021,280 |
| 1,000 | | Hilliard Hickory Chase Community Authority, Ohio, Infrastructure Improvement Revenue | 12/29 at 100.00 | N/R | 1,032,740 |
| | Bonds, Hickory Chase Project, Senior Series 2019A, 5.000%, 12/01/40, 144A | | | |
| 5,020 | | Ohio Air Quality Development Authority, Ohio, Air Quality Development Revenue Bonds, | No Opt. Call | N/R | 4,430,150 |
| | FirstEnergy Generation Corporation Project, Series 2009A, 5.700%, 8/01/20 (5) | | | |
| 14,950 | | Ohio Air Quality Development Authority, Ohio, Exempt Facilities Revenue Bonds, AMG | 7/29 at 100.00 | B3 | 16,528,421 |
| | Vanadium Project, Series 2019, 5.000%, 7/01/49, 144A (AMT) | | | |
127
| | | | | | |
| NMCO | Nuveen Municipal Credit Opportunities Fund | | |
| | Portfolio of Investments (continued) | | | |
|
| | October 31, 2019 | | | |
|
|
|
|
| Principal | | | Optional Call | | |
| Amount (000) | | Description (1) | Provisions (2) | Ratings (3) | Value |
| | Ohio (continued) | | | |
| $ 2,085 | | Ohio Air Quality Development Authority, Ohio, Pollution Control Revenue Bonds, | No Opt. Call | N/R | $ 1,840,012 |
| | FirstEnergy Generation Corporation Project, Refunding Series 2009B, 3.100%, 3/01/23 (5) | | | |
| 2,200 | | Ohio Air Quality Development Authority, Ohio, Pollution Control Revenue Bonds, | No Opt. Call | N/R | 2,266,000 |
| | FirstEnergy Generation Corporation Project, Refunding Series 2009C, 5.625%, 6/01/18 (5) | | | |
| 4,140 | | Ohio Air Quality Development Authority, Ohio, Pollution Control Revenue Bonds, | No Opt. Call | N/R | 3,653,550 |
| | FirstEnergy Generation Project, Refunding Series 2006A, 3.750%, 12/01/23 (5) | | | |
| 2,895 | | Ohio Air Quality Development Authority, Ohio, Pollution Control Revenue Bonds, | No Opt. Call | N/R | 3,104,888 |
| | FirstEnergy Nuclear Generation Project, Refunding Series 2009A, 4.375%, 6/01/33 (Mandatory | | | |
| | Put 6/01/22) (5) | | | |
| 4,000 | | Ohio Air Quality Development Authority, Ohio, Revenue Bonds, Pratt Paper Ohio, LLC | 1/28 at 100.00 | N/R | 4,327,160 |
| | Project, Series 2017, 4.500%, 1/15/48, 144A (AMT) | | | |
| 2,470 | | Ohio Water Development Authority, Pollution Control Revenue Refunding Bonds, FirstEnergy | No Opt. Call | N/R | 2,179,775 |
| | Nuclear Generating Corporation Project, Series 2006A, 3.000%, 5/15/19 (5) | | | |
| 2,510 | | Ohio Water Development Authority, Pollution Control Revenue Refunding Bonds, FirstEnergy | No Opt. Call | N/R | 2,215,075 |
| | Nuclear Generating Corporation Project, Series 2006B, 4.000%, 12/01/33 (5) | | | |
| 6,455 | | Ohio Water Development Authority, Pollution Control Revenue Refunding Bonds, FirstEnergy | No Opt. Call | N/R | 6,922,988 |
| | Nuclear Generating Corporation Project, Series 2009A, 4.375%, 6/01/33 (Mandatory Put 6/01/22) (5) | | | |
| 2,015 | | Ohio Water Development Authority, Pollution Control Revenue Refunding Bonds, FirstEnergy | No Opt. Call | N/R | 2,161,088 |
| | Nuclear Generating Corporation Project, Series 2010B, 4.375%, 6/01/33 (Mandatory Put 6/01/22) (5) | | | |
| 2,000 | | Ohio Water Development Authority, Pollution Control Revenue Refunding Bonds, FirstEnergy | No Opt. Call | N/R | 1,765,000 |
| | Nuclear Generating Corporation Project, Series 2010C, 4.000%, 6/01/33 (5) | | | |
| 207,710 | | Total Ohio | | | 78,919,160 |
| | Oklahoma – 0.3% (0.3% of Total Investments) | | | |
| 2,000 | | Oklahoma Development Finance Authority, Health System Revenue Bonds, OU Medicine | 8/28 at 100.00 | BB+ | 2,384,980 |
| | Project, Series 2018B, 5.500%, 8/15/57 | | | |
| | Pennsylvania – 2.4% (2.3% of Total Investments) | | | |
| 1,125 | | Allegheny Country Industrial Development Authority, Pennsylvania, Environmental | 8/22 at 100.00 | B3 | 1,162,856 |
| | Improvement Revenue Bonds, United States Steel Corporation Project, Series 2012, 5.750%, | | | |
| | 8/01/42 (AMT) | | | |
| 1,440 | | Beaver County Industrial Development Authority, Pennsylvania, Pollution Control Revenue | No Opt. Call | N/R | 1,270,800 |
| | Bonds, FirstEnergy Nuclear Generation Project, Refunding Series 2005A, 4.000%, 1/01/35 | | | |
| | (Mandatory Put 7/01/21) (5) | | | |
| 1,280 | | Beaver County Industrial Development Authority, Pennsylvania, Pollution Control Revenue | No Opt. Call | N/R | 1,372,800 |
| | Refunding Bonds, FirstEnergy Generation Project, Series 2008B, 4.250%, 10/01/47 (Mandatory | | | |
| | Put 4/01/21) (5) | | | |
| | Beaver County Industrial Development Authority, Pennsylvania, Pollution Control Revenue | | | |
| | Refunding Bonds, FirstEnergy Nuclear Generation Project, Series 2006A: | | | |
| 3,300 | | 4.375%, 1/01/35 (Mandatory Put 7/01/22) (5) | No Opt. Call | N/R | 3,539,250 |
| 560 | | 3.500%, 4/01/41 (Mandatory Put 6/01/20) (5) | No Opt. Call | N/R | 494,200 |
| 5,355 | | Beaver County Industrial Development Authority, Pennsylvania, Pollution Control Revenue | No Opt. Call | N/R | 4,725,787 |
| | Refunding Bonds, FirstEnergy Nuclear Generation Project, Series 2006B, 3.500%, 12/01/35 | | | |
| | (Mandatory Put 6/01/20) (5) | | | |
| 1,025 | | Beaver County Industrial Development Authority, Pennsylvania, Pollution Control Revenue | No Opt. Call | N/R | 904,562 |
| | Refunding Bonds, FirstEnergy Nuclear Generation Project, Series 2008A, 2.700%, 4/01/35 (5) | | | |
| | Chester County Industrial Development Authority, Pennsylvania, Revenue Bonds, Collegium | | | |
| | Chater School Project, Series 2017A: | | | |
| 1,825 | | 5.125%, 10/15/37 | 4/27 at 100.00 | BB | 1,980,490 |
| 3,250 | | 5.250%, 10/15/47 | 4/27 at 100.00 | BB | 3,500,673 |
| 19,160 | | Total Pennsylvania | | | 18,951,418 |
128
| | | | | | |
| Principal | | | Optional Call | | |
| Amount (000) | | Description (1) | Provisions (2) | Ratings (3) | Value |
| | Puerto Rico – 6.7% (6.5% of Total Investments) | | | |
| | Puerto Rico Electric Power Authority, Power Revenue Bonds, Refunding Series 2012A: | | | |
| $ 5,605 | | 3.957%, 7/01/42 (5) | 7/22 at 100.00 | D | $ 4,217,763 |
| 1,000 | | 3.961%, 7/01/42 (5) | 7/22 at 100.00 | D | 752,500 |
| | Puerto Rico Electric Power Authority, Power Revenue Bonds, Series 2007TT: | | | |
| 25 | | 3.957%, 7/01/21 (5) | 12/19 at 100.00 | D | 18,813 |
| 3,750 | | 3.957%, 7/01/26 (5) | 12/19 at 100.00 | D | 2,821,875 |
| 310 | | 3.957%, 7/01/32 (5) | 12/19 at 100.00 | D | 233,275 |
| 160 | | 3.957%, 7/01/37 (5) | 12/19 at 100.00 | D | 120,400 |
| | Puerto Rico Electric Power Authority, Power Revenue Bonds, Series 2010CCC: | | | |
| 2,995 | | 3.957%, 7/01/28 (5) | 7/20 at 100.00 | D | 2,253,738 |
| 500 | | 3.978%, 7/01/28 (5) | 7/20 at 100.00 | D | 381,250 |
| | Puerto Rico Electric Power Authority, Power Revenue Bonds, Series 2010XX: | | | |
| 100 | | 3.978%, 7/01/27 (5) | 7/20 at 100.00 | D | 76,250 |
| 4,000 | | 3.978%, 7/01/35 (5) | 12/19 at 100.00 | D | 3,050,000 |
| 3,000 | | 3.978%, 7/01/40 (5) | 7/20 at 100.00 | D | 2,287,500 |
| 400 | | Puerto Rico Electric Power Authority, Power Revenue Bonds, Series 2010ZZ, 3.978%, | 7/20 at 100.00 | D | 305,000 |
| | 7/01/24 (5) | | | |
| | Puerto Rico Electric Power Authority, Power Revenue Bonds, Series 2013A: | | | |
| 5,000 | | 4.123%, 7/01/33 (5) | 7/23 at 100.00 | D | 3,918,750 |
| 10,000 | | 4.102%, 7/01/36 (5) | 7/23 at 100.00 | D | 7,787,500 |
| 1,000 | | Puerto Rico Electric Power Authority, Power Revenue Bonds, Series 2016A-4-RSA-1, | No Opt. Call | N/R | 810,000 |
| | 4.371%, 7/01/19 (5) | | | |
| 25 | | Puerto Rico Electric Power Authority, Power Revenue Bonds, Series WW, 3.978%, 7/01/33 (5) | 12/19 at 100.00 | D | 19,062 |
| | Puerto Rico Sales Tax Financing Corporation, Sales Tax Revenue Bonds, | | | |
| | Restructured 2018A-1: | | | |
| 26,196 | | 0.010%, 7/01/46 | 7/28 at 41.38 | N/R | 6,843,717 |
| 26,135 | | 0.000%, 7/01/51 | 7/28 at 30.01 | N/R | 5,100,050 |
| 11,925 | | 5.000%, 7/01/58 | 7/28 at 100.00 | N/R | 12,548,760 |
| 500 | | University of Puerto Rico, University System Revenue Bonds, Series 2006Q, 5.000%, 6/01/24 | 12/19 at 100.00 | C | 498,750 |
| 102,626 | | Total Puerto Rico | | | 54,044,953 |
| | Tennessee – 0.5% (0.5% of Total Investments) | | | |
| 4,000 | | Bristol Industrial Development Board, Tennessee, State Sales Tax Revenue Bonds, Pinnacle | 12/26 at 100.00 | N/R | 4,109,280 |
| | Project, Series 2016A, 5.125%, 12/01/42, 144A | | | |
| | Texas – 3.2% (3.1% of Total Investments) | | | |
| 520 | | New Hope Cultural Education Facilities Finance Corporation, Texas, Education Revenue | 8/24 at 100.00 | N/R | 546,780 |
| | Bonds, Beta Academy, Series 2019A, 5.000%, 8/15/49, 144A | | | |
| 2,100 | | New Hope Cultural Education Facilities Finance Corporation, Texas, Student Housing | No Opt. Call | CCC | 1,893,276 |
| | Revenue Bonds, NCCD – College Station Properties LLC – Texas A&M University Project, | | | |
| | Series 2015B, 4.375%, 7/01/21 | | | |
| 20,000 | | Texas Private Activity Bond Surface Transportation Corporation, Senior Lien Revenue Bonds, | 6/29 at 100.00 | Baa3 | 23,330,800 |
| | NTE Mobility Partners Segments 3 LLC Segments 3C Project, Series 2019, 5.000%, | | | |
| | 6/30/58 (AMT) | | | |
| 22,620 | | Total Texas | | | 25,770,856 |
| | Utah – 0.1% (0.1% of Total Investments) | | | |
| 1,000 | | Utah Charter School Finance Authority, Charter School Revenue Bonds, Leadership Learning | 6/27 at 102.00 | N/R | 1,046,980 |
| | Academy Project, Series 2019A, 5.000%, 6/15/50, 144A | | | |
129
| | | | | | |
| NMCO | Nuveen Municipal Credit Opportunities Fund | | |
| | Portfolio of Investments (continued) | | | |
| | | | | | |
| | October 31, 2019 | | | |
|
|
|
| Principal | | | Optional Call | | |
| Amount (000) | | Description (1) | Provisions (2) | Ratings (3) | Value |
| | Virgin Islands – 2.4% (2.3% of Total Investments) | | | |
| $ 710 | | Virgin Islands Public Finance Authority, Gross Receipts Taxes Loan Note, Refunding | 10/22 at 100.00 | N/R | $ 708,225 |
| | Series 2012A, 5.000%, 10/01/32 | | | |
| | Virgin Islands Public Finance Authority, Gross Receipts Taxes Loan Note, Refunding | | | |
| | Series 2014C: | | | |
| 1,000 | | 5.000%, 10/01/30 | 10/24 at 100.00 | N/R | 1,000,000 |
| 15,000 | | 5.000%, 10/01/39 | 10/24 at 100.00 | N/R | 14,859,300 |
| 700 | | Virgin Islands Public Finance Authority, Gross Receipts Taxes Loan Note, Working Capital | No Opt. Call | N/R | 703,500 |
| | Series 2014A, 5.000%, 10/01/24 | | | |
| 1,000 | | Virgin Islands Public Finance Authority, Matching Fund Loan Notes Revenue Bonds, | 10/20 at 100.00 | Caa3 | 1,005,440 |
| | Subordinate Lien Series 2010B, 5.250%, 10/01/29 | | | |
| 1,000 | | Virgin Islands Public Finance Authority, Matching Fund Revenue Loan Note – Diageo | 12/19 at 100.00 | Caa3 | 1,002,540 |
| | Project, Series 2009A, 6.625%, 10/01/29 | | | |
| 19,410 | | Total Virgin Islands | | | 19,279,005 |
| | Washington – 2.6% (2.6% of Total Investments) | | | |
| | Washington Health Care Facilities Authority, Revenue Bonds, CommonSpirit Health, | | | |
| | Series 2019A-1: | | | |
| 1,005 | | 5.000%, 8/01/28 | No Opt. Call | BBB+ | 1,239,195 |
| 1,000 | | 5.000%, 8/01/31 | 8/29 at 100.00 | BBB+ | 1,224,660 |
| 1,500 | | 5.000%, 8/01/35 | 8/29 at 100.00 | BBB+ | 1,815,660 |
| 3,280 | | 5.000%, 8/01/39 | 8/29 at 100.00 | BBB+ | 3,918,288 |
| | Washington Health Care Facilities Authority, Revenue Bonds, CommonSpirit Health, | | | |
| | Series 2019A-2: | | | |
| 3,500 | | 5.000%, 8/01/30 | 8/29 at 100.00 | BBB+ | 4,323,130 |
| 2,855 | | 5.000%, 8/01/35 | 8/29 at 100.00 | BBB+ | 3,455,806 |
| 4,250 | | 5.000%, 8/01/39 | 8/29 at 100.00 | BBB+ | 5,077,050 |
| 17,390 | | Total Washington | | | 21,053,789 |
| | West Virginia – 0.5% (0.5% of Total Investments) | | | |
| | Monongalia County Commission, West Virginia, Special District Excise Tax Revenue, | | | |
| | University Town Centre Economic Opportunity Development District, Refunding & | | | |
| | Improvement Series 2017A: | | | |
| 3,000 | | 5.500%, 6/01/37, 144A | 6/27 at 100.00 | N/R | 3,305,880 |
| 625 | | 5.750%, 6/01/43, 144A | 6/27 at 100.00 | N/R | 690,694 |
| 3,625 | | Total West Virginia | | | 3,996,574 |
| | Wisconsin – 1.1% (1.0% of Total Investments) | | | |
| 4,000 | | Public Finance Authority of Wisconsin, Charter School Revenue Bonds, North Carolina | 6/26 at 100.00 | N/R | 3,905,960 |
| | Charter Educational Foundation Project, Series 2016A, 5.000%, 6/15/46, 144A | | | |
| 2,000 | | Public Finance Authority of Wisconsin, Revenue Bonds, Procure Proton Therapy Center, | 7/28 at 100.00 | N/R | 1,967,580 |
| | Senior Series 2018A, 7.000%, 7/01/48, 144A | | | |
| 2,500 | | Public Finance Authority of Wisconsin, Senior Revenue Bonds, Maryland Proton Treatment | 1/28 at 100.00 | N/R | 2,648,650 |
| | Center, Series 2018A-1, 6.125%, 1/01/33, 144A | | | |
| 8,500 | | Total Wisconsin | | | 8,522,190 |
| $ 1,516,398 | | Total Municipal Bonds (cost $691,381,165) | | | 693,559,954 |
|
| Shares | | Description (1), (6) | | | Value |
| | EXCHANGE-TRADED FUNDS – 4.7% (4.6% of Total Investments) | | | |
| 592,000 | | VanEck Vectors High-Yield Municipal Index ETF | | | $ 38,071,520 |
| | Total Exchange-Traded Funds (cost $38,111,630) | | | 38,071,520 |
| | Total Long-Term Investments (cost $729,492,795) | | | 731,631,474 |
130
| | | | | | |
| Principal | | | Optional Call | | |
| Amount (000) | | Description (1) | Provisions (2) | Ratings (3) | Value |
| | SHORT-TERM INVESTMENTS – 11.7% (11.4% of Total Investments) | | | |
| | MUNICIPAL BONDS – 11.7% (11.4% of Total Investments) | | | |
| | Arizona – 2.7% (2.6% of Total Investments) | | | |
| $ 21,320 | | Phoenix Industrial Development Authority, Arizona, Health Care Facilities Revenue Bonds, | 12/19 at 100.00 | A-1 | $ 21,320,000 |
| | Mayo Clinic, Variable Rate Demand Obligations, Series 2014B, 1.200%, 11/15/52 (7) | | | |
| | Indiana – 3.7% (3.6% of Total Investments) | | | |
| 30,000 | | Indiana Finance Authority, Hospital Revenue Bonds, Parkview Health System Obligated Group, | 12/19 at 100.00 | A-1 | 30,000,000 |
| | Variable Rate Series 2009D, Variable Rate Demand Obligations, 1.260%, 11/01/39 (7) | | | |
| | Mississippi – 3.7% (3.6% of Total Investments) | | | |
| 15,000 | | Mississippi Business Finance Corporation, Gulf Opportunity Zone Industrial Development | 1/20 at 100.00 | A-1+ | 15,000,000 |
| | Revenue Bonds, Chevron USA Inc Project, Variable Rate Demand Obligations, Series 2010H, | | | |
| | 1.260%, 11/01/35 (7) | | | |
| 15,000 | | Mississippi Business Finance Corporation, Gulf Opportunity Zone Industrial Development | 1/20 at 100.00 | A-1+ | 15,000,000 |
| | Revenue Bonds, Chevron USA Inc Project, Variable Rate Demand Obligations, Series 2010K, | | | |
| | 1.260%, 11/01/35 (7) | | | |
| 30,000 | | Total Mississippi | | | 30,000,000 |
| | New York – 1.6% (1.6% of Total Investments) | | | |
| 5,000 | | New York City Transitional Finance Authority, New York, Future Tax Secured Bonds, Variable Rate | 12/19 at 100.00 | A-1 | 5,000,000 |
| | Demand Obligations, Subordinate Fiscal 2016 Adjustable Rate Series E-43, 1.350%, 2/01/45 (7) | | | |
| 8,000 | | New York City Transitional Finance Authority, New York, Future Tax Secured Revenue Bonds, | 12/19 at 100.00 | A-1 | 8,000,000 |
| | Variable Rate Demand Obligations, Subordinate Lien Series 2010G-5, 1.300%, 5/01/34 | | | |
| | (Mandatory Put 11/02/19) (7) | | | |
| 13,000 | | Total New York | | | 13,000,000 |
| $ 94,320 | | Total Short-Term Investments (cost $94,320,000) | | | 94,320,000 |
| | Total Investments (cost $823,812,795) – 102.8% | | | 825,951,474 |
| | Floating Rate Obligations – (3.5)% | | | (28,500,000) |
| | Other Assets Less Liabilities – 0.7% | | | 5,594,235 |
| | Net Assets Applicable to Common Shares – 100% | | | $ 803,045,709 |
| | |
(1) | All percentages shown in the Portfolio of Investments are based on net assets applicable to common shares unless otherwise noted. |
(2) | Optional Call Provisions: Dates (month and year) and prices of the earliest optional call or redemption. There may be other call provisions at varying prices at later dates. Certain mortgage-backed securities may be subject to periodic principal paydowns. Optional Call Provisions are not covered by the report of independent registered public accounting firm. |
(3) | The ratings disclosed are the lowest of Standard & Poor’s Group (“Standard & Poor’s”), Moody’s Investors Service, Inc. (“Moody’s”) or Fitch, Inc. (“Fitch”) rating. Ratings below BBB by Standard & Poor’s, Baa by Moody’s or BBB by Fitch are considered to be below investment grade. Holdings designated N/R are not rated by any of these national rating agencies. Ratings are not covered by the report of independent registered public accounting firm. |
(4) | Investment, or portion of investment, has been pledged to collateralize the net payment obligations for investments in inverse floating rate transactions. |
(5) | Defaulted security. A security whose issuer has failed to fully pay principal and/or interest when due, or is under the protection of bankruptcy. |
(6) | A copy of the most recent financial statements for these exchange-traded funds can be obtained directly from the Securities and Exchange Commission on its website at http://www.sec.gov. |
(7) | Investment has a maturity of greater than one year, but has variable rate and/or demand features which qualify it as a short-term investment. The rate disclosed, as well as the reference rate and spread, where applicable, is that in effect as of the end of the reporting period. This rate changes periodically based on market conditions or a specified market index. |
144A | Investment is exempt from registration under Rule 144A of the Securities Act of 1933, as amended. These investments may only be resold in transactions exempt from registration, which are normally those transactions with qualified institutional buyers. |
AMT | Alternative Minimum Tax. |
ETF | Exchange-Traded Fund. |
PIK | Payment-in-kind (“PIK”) security. Depending on the terms of the security, income may be received in the form of cash, securities, or a combination of both. The PIK rate shown, where applicable, represents the annualized rate of the last PIK payment made by the issuer as of the end of the reporting period. |
UB | Underlying bond of an inverse floating rate trust reflected as a financing transaction. See Notes to Financial Statements, Note 4 – Portfolio Securities and Investments in Derivatives, Inverse Floating Rate Securities for more information. |
WI/DD | Purchased on a when-issued or delayed delivery basis. |
| See accompanying notes to financial statements |
131
Statement of Assets and Liabilities
October 31, 2019
| | | | | | | | | | | | | |
| | NVG | | | NZF | | | NMZ | | | NMCO | |
| Assets | | | | | | | | | | | | |
Long-term investments, at value (cost $4,838,743,489, $3,323,393,132, | | | | | | | | | | | | |
| $1,309,720,253 and $729,492,795, respectively) | | $ | 5,399,427,282 | | | $ | 3,700,961,860 | | | $ | 1,383,991,117 | | | $ | 731,631,474 | |
Short-term investments, at value (cost approximates value) | | | — | | | | — | | | | 17,885,000 | | | | 94,320,000 | |
Cash | | | — | | | | — | | | | 438,878 | | | | 11,531,093 | |
Receivable for: | | | | | | | | | | | | | | | | |
| Dividends and interest | | | 78,890,996 | | | | 52,421,500 | | | | 25,015,721 | | | | 7,442,788 | |
| Investments sold | | | 34,132,443 | | | | 11,102,933 | | | | 16,139,472 | | | | 20,000 | |
| Shares sold | | | — | | | | — | | | | 3,972,476 | | | | — | |
Other assets | | | 1,788,277 | | | | 772,080 | | | | 98,917 | | | | 698 | |
| Total assets | | | 5,514,238,998 | | | | 3,765,258,373 | | | | 1,447,541,581 | | | | 844,946,053 | |
| Liabilities | | | | | | | | | | | | | | | | |
Cash overdraft | | | 7,772,606 | | | | 3,214,179 | | | | — | | | | — | |
Floating rate obligations | | | 184,980,000 | | | | 23,620,000 | | | | 383,362,000 | | | | 28,500,000 | |
Payable for: | | | | | | | | | | | | | | | | |
| Dividends | | | 12,506,532 | | | | 8,889,537 | | | | 3,977,799 | | | | — | |
| Interest | | | 1,260,864 | | | | 185,156 | | | | 2,684,020 | | | | 45,413 | |
| Investments purchased | | | 14,454,227 | | | | 68,182 | | | | 534,245 | | | | 12,690,020 | |
| Offering costs | | | 26,001 | | | | — | | | | — | | | | — | |
Adjustable Rate MuniFund Term Preferred (“AMTP”) Shares, net of | | | | | | | | | | | | | | | | |
| deferred offering costs (liquidation preference $—, $—, | | | | | | | | | | | | | | | | |
| $87,000,000 and $—, respectively) | | | — | | | | — | | | | 86,866,271 | | | | — | |
MuniFund Term Preferred (“MFP”) Shares, net of deferred offering | | | | | | | | | | | | | | | | |
| costs (liquidation preference $405,400,000, $641,000,000, | | | | | | | | | | | | | | | | |
| $— and $—, respectively) | | | 403,797,156 | | | | 639,973,963 | | | | — | | | | — | |
Variable Rate Demand Preferred (“VRDP”) Shares, net of deferred | | | | | | | | | | | | | | | | |
| offering costs (liquidation preference $1,411,600,000, $727,000,000, | | | | | | | | | | | | | | | | |
| $— and $—, respectively) | | | 1,407,881,715 | | | | 722,295,855 | | | | — | | | | — | |
Accrued expenses: | | | | | | | | | | | | | | | | |
| Management fees | | | 2,806,021 | | | | 1,930,224 | | | | 788,896 | | | | 584,316 | |
| Trustees fees | | | 962,835 | | | | 646,616 | | | | 103,268 | | | | 4,429 | |
| Other | | | 828,763 | | | | 413,158 | | | | 156,655 | | | | 76,166 | |
| Total liabilities | | | 2,037,276,720 | | | | 1,401,236,870 | | | | 478,473,154 | | | | 41,900,344 | |
Net assets applicable to common shares | | $ | 3,476,962,278 | | | $ | 2,364,021,503 | | | $ | 969,068,427 | | | $ | 803,045,709 | |
Common shares outstanding | | | 202,552,895 | | | | 142,125,906 | | | | 69,031,903 | | | | 53,256,667 | |
Net asset value (“NAV”) per common share outstanding | | $ | 17.17 | | | $ | 16.63 | | | $ | 14.04 | | | $ | 15.08 | |
| | |
| Net assets applicable to common shares consist of: | | | | | | | | | | | | | | | | |
Common shares, $0.01 par value per share | | $ | 2,025,529 | | | $ | 1,421,259 | | | $ | 690,319 | | | $ | 532,567 | |
Paid-in surplus | | | 2,905,850,438 | | | | 2,007,898,841 | | | | 883,945,291 | | | | 798,313,003 | |
Total distributable earnings | | | 569,086,311 | | | | 354,701,403 | | | | 84,432,817 | | | | 4,200,139 | |
Net assets applicable to common shares | | $ | 3,476,962,278 | | | $ | 2,364,021,503 | | | $ | 969,068,427 | | | $ | 803,045,709 | |
Authorized shares: | | | | | | | | | | | | | | | | |
| Common | | Unlimited | | | Unlimited | | | Unlimited | | | Unlimited | |
| Preferred | | Unlimited | | | Unlimited | | | Unlimited | | | Unlimited | |
See accompanying notes to financial statements.
132
| |
| Statement of Operations |
|
| Year Ended October 31, 2019 |
|
|
|
| | |
| | NVG | | | NZF | | | NMZ | | | NMCO* | |
| Investment Income | | $ | 243,105,524 | | | $ | 166,159,469 | | | $ | 69,075,321 | | | $ | 3,254,922 | |
| Expenses | | | | | | | | | | | | | | | | |
Management fees | | | 32,262,996 | | | | 22,236,437 | | | | 8,557,946 | | | | 789,743 | |
Interest expense and amortization of offering costs | | | 37,714,817 | | | | 33,617,306 | | | | 10,136,888 | | | | 45,412 | |
Liquidity fees | | | 9,755,090 | | | | 1,600,058 | | | | — | | | | — | |
Remarketing fees | | | 1,394,866 | | | | 99,361 | | | | — | | | | — | |
Custodian fees | | | 483,149 | | | | 360,363 | | | | 132,261 | | | | 11,103 | |
Trustees fees | | | 153,876 | | | | 109,061 | | | | 28,800 | | | | 4,438 | |
Professional fees | | | 243,389 | | | | 567,848 | | | | 162,674 | | | | 22,314 | |
Shareholder reporting expenses | | | 259,019 | | | | 174,499 | | | | 95,195 | | | | 35,181 | |
Shareholder servicing agent fees | | | 91,714 | | | | 52,067 | | | | 14,730 | | | | 15 | |
Stock exchange listing fees | | | 56,860 | | | | 39,898 | | | | 22,394 | | | | — | |
Investor relations expenses | | | 210,458 | | | | 148,306 | | | | 39,904 | | | | 7,440 | |
Other | | | 266,482 | | | | 362,452 | | | | 148,323 | | | | 209 | |
Total expenses | | | 82,892,716 | | | | 59,367,656 | | | | 19,339,115 | | | | 915,855 | |
Net investment income (loss) | | | 160,212,808 | | | | 106,791,813 | | | | 49,736,206 | | | | 2,339,067 | |
| Realized and Unrealized Gain (Loss) | | | | | | | | | | | | | | | | |
Net realized gain (loss) from: | | | | | | | | | | | | | | | | |
| Investments | | | 8,920,660 | | | | 12,807,388 | | | | 2,231,652 | | | | (282,042 | ) |
| Swaps | | | (80,409 | ) | | | — | | | | — | | | | — | |
Change in net unrealized appreciation (depreciation) of: | | | | | | | | | | | | | | | | |
| Investments | | | 339,640,998 | | | | 215,305,771 | | | | 74,265,476 | | | | 2,138,679 | |
| Swaps | | | (1,924,823 | ) | | | — | | | | — | | | | — | |
Net realized and unrealized gain (loss) | | | 346,556,426 | | | | 228,113,159 | | | | 76,497,128 | | | | 1,856,637 | |
Net increase (decrease) in net assets applicable to | | | | | | | | | | | | | | | | |
| common shares from operations | | $ | 506,769,234 | | | $ | 334,904,972 | | | $ | 126,233,334 | | | $ | 4,195,704 | |
| |
* For the period September 16, 2019 (commencement of operations) through October 31, 2019. |
See accompanying notes to financial statements.
133
Statement of Changes in Net Assets
| | | | | | | | | | | | | |
| | NVG | | | NZF | |
| | Year Ended | | | Year Ended | | | Year Ended | | | Year Ended | |
| | 10/31/19 | | | 10/31/18 | | | 10/31/19 | | | 10/31/18 | |
| Operations | | | | | | | | | | | | |
Net investment income (loss) | | $ | 160,212,808 | | | $ | 163,773,767 | | | $ | 106,791,813 | | | $ | 114,479,914 | |
Net realized gain (loss) from: | | | | | | | | | | | | | | | | |
| Investments | | | 8,920,660 | | | | 11,735,734 | | | | 12,807,388 | | | | (6,595,116 | ) |
| Swaps | | | (80,409 | ) | | | 5,165,658 | | | | — | | | | — | |
Change in net unrealized appreciation (depreciation) of: | | | | | | | | | | | | | | | | |
| Investments | | | 339,640,998 | | | | (195,930,797 | ) | | | 215,305,771 | | | | (126,617,701 | ) |
| Swaps | | | (1,924,823 | ) | | | 776,750 | | | | — | | | | — | |
Net increase (decrease) in net assets applicable to common shares | | | | | | | | | | | | | | | | |
| from operations | | | 506,769,234 | | | | (14,478,888 | ) | | | 334,904,972 | | | | (18,732,903 | ) |
| Distributions to Common Shareholders | | | | | | | | | | | | | | | | |
Dividends | | | (164,776,774 | ) | | | (170,326,725 | ) | | | (112,563,715 | ) | | | (118,490,365 | ) |
Decrease in net assets applicable to common shares from | | | | | | | | | | | | | | | | |
| distributions to common shareholders | | | (164,776,774 | ) | | | (170,326,725 | ) | | | (112,563,715 | ) | | | (118,490,365 | ) |
| Capital Share Transactions | | | | | | | | | | | | | | | | |
Common shares: | | | | | | | | | | | | | | | | |
Proceeds from sale of shares, net of offering costs | | | — | | | | — | | | | — | | | | — | |
Proceeds from shelf offering, net of offering costs | | | — | | | | — | | | | — | | | | — | |
Net proceeds from shares issued to shareholders | | | | | | | | | | | | | | | | |
| due to reinvestment of distributions | | | — | | | | — | | | | — | | | | — | |
Net increase (decrease) in net assets applicable to common shares | | | | | | | | | | | | | | | | |
| from capital share transactions | | | — | | | | — | | | | — | | | | — | |
Net increase (decrease) in net assets applicable to common shares | | | 341,992,460 | | | | (184,805,613 | ) | | | 222,341,257 | | | | (137,223,268 | ) |
Net assets applicable to common shares at the beginning of period | | | 3,134,969,818 | | | | 3,319,775,431 | | | | 2,141,680,246 | | | | 2,278,903,514 | |
Net assets applicable to common shares at the end of period | | $ | 3,476,962,278 | | | $ | 3,134,969,818 | | | $ | 2,364,021,503 | | | $ | 2,141,680,246 | |
See accompanying notes to financial statements.
134
| | | | | | | | | | |
| | NMZ | | | NMCO | |
| | | | | | | | For the period 9/16/19 | |
| | | | | | | | (commencement | |
| | Year Ended | | | Year Ended | | | of operations) | |
| | 10/31/19 | | | 10/31/18 | | | through 10/31/19 | |
| Operations | | | | | | | | | |
Net investment income (loss) | | $ | 49,736,206 | | | $ | 52,376,782 | | | $ | 2,339,067 | |
Net realized gain (loss) from: | | | | | | | | | | | | |
| Investments | | | 2,231,652 | | | | (3,425,012 | ) | | | (282,042 | ) |
| Swaps | | | — | | | | — | | | | — | |
Change in net unrealized appreciation (depreciation) of: | | | | | | | | | | | | |
| Investments | | | 74,265,476 | | | | (46,142,642 | ) | | | 2,138,679 | |
| Swaps | | | — | | | | — | | | | — | |
Net increase (decrease) in net assets applicable to common shares | | | | | | | | | | | | |
| from operations | | | 126,233,334 | | | | 2,809,128 | | | | 4,195,704 | |
| Distributions to Common Shareholders | | | | | | | | | | | | |
Dividends | | | (45,460,832 | ) | | | (47,475,440 | ) | | | — | |
Decrease in net assets applicable to common shares from | | | | | | | | | | | | |
| distributions to common shareholders | | | (45,460,832 | ) | | | (47,475,440 | ) | | | — | |
| Capital Share Transactions | | | | | | | | | | | | |
Common shares: | | | | | | | | | | | | |
Proceeds from sale of shares, net of offering costs | | | — | | | | — | | | | 798,750,000 | |
Proceeds from shelf offering, net of offering costs | | | 69,515,572 | | | | 9,084,815 | | | | — | |
Net proceeds from shares issued to shareholders | | | | | | | | | | | | |
| due to reinvestment of distributions | | | 341,504 | | | | 274,882 | | | | — | |
Net increase (decrease) in net assets applicable to common shares | | | | | | | | | | | | |
| from capital share transactions | | | 69,857,076 | | | | 9,359,697 | | | | 798,750,000 | |
Net increase (decrease) in net assets applicable to common shares | | | 150,629,578 | | | | (35,306,615 | ) | | | 802,945,704 | |
Net assets applicable to common shares at the beginning of period | | | 818,438,849 | | | | 853,745,464 | | | | 100,005 | |
Net assets applicable to common shares at the end of period | | $ | 969,068,427 | | | $ | 818,438,849 | | | $ | 803,045,709 | |
See accompanying notes to financial statements.
135
| |
| Statement of Cash Flows |
|
| Year Ended October 31, 2019 |
|
|
|
| | |
| | NVG | | | NZF | | | NMZ | |
| Cash Flows from Operating Activities: | | | | | | | | | |
| Net Increase (Decrease) in Net Assets Applicable to Common Shares from Operations | | $ | 506,769,234 | | | $ | 334,904,972 | | | $ | 126,233,334 | |
Adjustments to reconcile the net increase (decrease) in net assets applicable to | | | | | | | | | | | | |
| common shares from operations to net cash provided by (used in) operating activities: | | | | | | | | | | | | |
Purchases of investments | | | (336,191,714 | ) | | | (419,425,265 | ) | | | (266,237,896 | ) |
Proceeds from sales and maturities of investments | | | 361,090,778 | | | | 486,237,108 | | | | 205,266,707 | |
Proceeds from (Purchases of) short-term investments, net | | | 5,000,000 | | | | — | | | | (17,885,000 | ) |
Payment-in-kind distributions | | | — | | | | (528,479 | ) | | | (66,823 | ) |
Premiums received (paid) for interest rate swaps | | | 1,072 | | | | — | | | | — | |
Taxes paid | | | (286,336 | ) | | | (31,120 | ) | | | (6,349 | ) |
Amortization (Accretion) of premiums and discounts, net | | | (17,850,798 | ) | | | (14,085,261 | ) | | | 693,827 | |
Amortization of deferred offering costs | | | 459,887 | | | | 258,632 | | | | 14,959 | |
(Increase) Decrease in: | | | | | | | | | | | | |
| Receivable for dividends and interest | | | (5,472,325 | ) | | | (638,550 | ) | | | (3,898,432 | ) |
| Receivable for investments sold | | | (21,130,264 | ) | | | 17,554,412 | | | | (14,619,934 | ) |
| Receivable for shares sold | | | — | | | | — | | | | (3,972,476 | ) |
| Receivable for variation margin on swap contracts | | | 331,347 | | | | — | | | | — | |
| Other assets | | | 21,509 | | | | 44,581 | | | | 318,447 | |
Increase (Decrease) in: | | | | | | | | | | | | |
| Payable for interest | | | 1,163,332 | | | | 185,156 | | | | 2,506,111 | |
| Payable for investments purchased | | | (16,373,118 | ) | | | (34,855,533 | ) | | | 530,516 | |
| Payable for offering costs | | | (206,448 | ) | | | (136,955 | ) | | | — | |
| Accrued management fees | | | 131,566 | | | | 99,075 | | | | 104,244 | |
| Accrued Trustees fees | | | (6,429 | ) | | | (1,727 | ) | | | 5,044 | |
| Accrued other expenses | | | 204,208 | | | | 2,507 | | | | 4,034 | |
Net realized (gain) loss from investments | | | (8,920,660 | ) | | | (12,807,388 | ) | | | (2,231,652 | ) |
Change in net unrealized (appreciation) depreciation of investments | | | (339,640,998 | ) | | | (215,305,771 | ) | | | (74,265,476 | ) |
Net cash provided by (used in) operating activities | | | 129,093,843 | | | | 141,470,394 | | | | (47,506,815 | ) |
| Cash Flows from Financing Activities | | | | | | | | | | | | |
Proceeds from borrowings | | | 91,272,000 | | | | 150,749,575 | | | | 27,100,000 | |
Repayments of borrowings | | | (91,272,000 | ) | | | (175,149,575 | ) | | | (27,100,000 | ) |
Proceeds from MFP Shares issued, at liquidation value | | | 200,000,000 | | | | — | | | | — | |
(Payments for) MFP Shares redeemed, at liquidation value | | | (200,000,000 | ) | | | — | | | | — | |
(Payments for) deferred offering cost | | | (1,540,000 | ) | | | — | | | | — | |
Proceeds from shelf offering, net of offering costs | | | — | | | | — | | | | 69,515,572 | |
Increase (Decrease) in cash overdraft | | | 7,772,606 | | | | (4,459,839 | ) | | | (2,837,889 | ) |
Proceeds from floating rate obligations | | | 11,040,000 | | | | — | | | | 83,229,000 | |
Repayments from floating rate obligations | | | (5,060,000 | ) | | | — | | | | (57,280,000 | ) |
Cash distribution paid to common shareholders | | | (164,763,054 | ) | | | (112,610,555 | ) | | | (44,680,990 | ) |
Net cash provided by (used in) financing activities | | | (152,550,448 | ) | | | (141,470,394 | ) | | | 47,945,693 | |
| Net Increase (Decrease) in Cash and Cash Collateral at Brokers | | | (23,456,605 | ) | | | — | | | | 438,878 | |
Cash and cash collateral at brokers at the beginning of period | | | 23,456,605 | | | | — | | | | — | |
Cash and cash collateral at brokers at the end of period | | $ | — | | | $ | — | | | $ | 438,878 | |
| | |
| Supplemental Disclosure of Cash Flow Information | | NVG | | | NZF | | | NMZ | |
Cash paid for interest (excluding amortization of offering costs) | | $ | 36,090,405 | | | $ | 33,165,608 | | | $ | 7,614,793 | |
Non-cash financing activities not included herein consists of | | | | | | | | | | | | |
| reinvestments of common share distributions | | | — | | | | — | | | | 341,504 | |
See accompanying notes to financial statements.
136
THIS PAGE INTENTIONALLY LEFT BLANK
137
| |
| Financial Highlights |
|
|
|
|
Selected data for a common share outstanding throughout each period: |
|
|
|
| | |
| | | | | Investment Operations
| | | Less Distributions to Common Shareholders
| | | Common Share | |
| | | Beginning Common
Share NAV | | | Net Investment Income (Loss) | | | Net Realized/ Unrealized Gain (Loss)
| | | Total | | | From
Net Investment Income | | | From Accumulated Net Realized Gains | | | Total | | | Discount Per Share Repurchased and Retired | | | Ending NAV | | | Ending Share Price | |
| NVG | | | | | | | | | | | | | | | | | | | | | | | | | | | | | | |
Year Ended 10/31:
| | | | | | | | | | | | | | | | | | | | | | |
2019 | | $ | 15.48 | | | $ | 0.79 | | | $ | 1.72 | | | $ | 2.51 | | | $ | (0.79 | ) | | $ | (0.03 | ) | | $ | (0.82 | ) | | $ | — | | | $ | 17.17 | | | $ | 16.45 | |
2018 | | | 16.39 | | | | 0.81 | | | | (0.88 | ) | | | (0.07 | ) | | | (0.84 | ) | | | — | | | | (0.84 | ) | | | — | | | | 15.48 | | | | 13.40 | |
2017 | | | 16.64 | | | | 0.84 | | | | (0.19 | ) | | | 0.65 | | | | (0.87 | ) | | | (0.03 | ) | | | (0.90 | ) | | | — | | | | 16.39 | | | | 15.17 | |
2016 | | | 16.03 | | | | 0.73 | | | | 0.77 | | | | 1.50 | | | | (0.86 | ) | | | (0.03 | ) | | | (0.89 | ) | | | — | | | | 16.64 | | | | 15.05 | |
2015 | | | 16.24 | | | | 0.77 | | | | (0.13 | ) | | | 0.64 | | | | (0.75 | ) | | | (0.10 | ) | | | (0.85 | ) | | | — | * | | | 16.03 | | | | 14.05 | |
| | |
| NZF | | | | | | | | | | | | | | | | | | | | | | | | | | | | | | | | | | | | | | | | |
Year Ended 10/31:
| | | | | | | | | | | | | | | | | | | | | | | | | | | | | |
2019 | | | 15.07 | | | | 0.75 | | | | 1.60 | | | | 2.35 | | | | (0.79 | ) | | | — | | | | (0.79 | ) | | | — | | | | 16.63 | | | | 16.03 | |
2018 | | | 16.03 | | | | 0.81 | | | | (0.94 | ) | | | (0.13 | ) | | | (0.83 | ) | | | — | | | | (0.83 | ) | | | — | | | | 15.07 | | | | 13.29 | |
2017 | | | 16.34 | | | | 0.87 | | | | (0.29 | ) | | | 0.58 | | | | (0.89 | ) | | | — | * | | | (0.89 | ) | | | — | | | | 16.03 | | | | 15.01 | |
2016 | | | 15.75 | | | | 0.72 | | | | 0.74 | | | | 1.46 | | | | (0.87 | ) | | | — | | | | (0.87 | ) | | | — | | | | 16.34 | | | | 14.82 | |
2015 | | | 15.82 | | | | 0.83 | | | | (0.13 | ) | | | 0.70 | | | | (0.78 | ) | | | — | | | | (0.78 | ) | | | 0.01 | | | | 15.75 | | | | 13.86 | |
| | |
(a) | Total Return Based on Common Share NAV is the combination of changes in common share NAV, reinvested dividend income at NAV and reinvested capital gains distributions at NAV, if any. The last dividend declared in the period, which is typically paid on the first business day of the following month, is assumed to be reinvested at the ending NAV. The actual reinvest price for the last dividend declared in the period may often be based on the Fund’s market price (and not its NAV), and therefore may be different from the price used in the calculation. Total returns are not annualized. |
| Total Return Based on Common Share Price is the combination of changes in the market price per share and the effect of reinvested dividend income and reinvested capital gains distributions, if any, at the average price paid per share at the time of reinvestment. The last dividend declared in the period, which is typically paid on the first business day of the following month, is assumed to be reinvested at the ending market price. The actual reinvestment for the last dividend declared in the period may take place over several days, and in some instances may not be based on the market price, so the actual reinvestment price may be different from the price used in the calculation. Total returns are not annualized. |
138
| | | | | | | | | | | | | | | | | | | | | | | |
| | | | | | | Common Share Supplemental Data/ Ratios Applicable to Common Shares | |
| | |
Common Share Total Returns
| | | | | | Ratios to Average Net Assets Before Reimbursement(b) | | | Ratio to Average Net Assets After Reimbursement(b) | | | | |
| | |
| | |
Based on NAV(a) | | | Based on Share Price(a) | | | Ending Net Assets (000) | | | Expenses(c) | | | Net Investment Income (Loss) | | | Expenses(c) | | | Net Investment Income (Loss) | | | Portfolio Turnover Rate(d) | |
| | |
| | |
| | 16.52 | % | | | 29.47 | % | | $ | 3,476,962 | | | | 2.49 | % | | | 4.82 | % | | | N/A | | | | N/A | | | | 6 | % |
| | (0.50 | ) | | | (6.49 | ) | | | 3,134,970 | | | | 2.40 | | | | 5.02 | | | | N/A | | | | N/A | | | | 15 | |
| | 4.25 | | | | 7.10 | | | | 3,319,775 | | | | 2.05 | | | | 5.26 | | | | 2.04(e | )% | | | 5.27(e | )% | | | 18 | |
| | 9.40 | | | | 13.46 | | | | 3,370,157 | | | | 1.81 | | | | 4.87 | | | | 1.75(e | ) | | | 4.93(e | ) | | | 21 | |
| | 4.04 | | | | 5.53 | | | | 427,104 | | | | 1.50 | | | | 4.81 | | | | N/A | | | | N/A | | | | 26 | |
| | |
| | |
| | |
| | 15.90 | | | | 27.08 | | | | 2,364,022 | | | | 2.60 | | | | 4.68 | | | | N/A | | | | N/A | | | | 12 | |
| | (0.85 | ) | | | (6.21 | ) | | | 2,141,680 | | | | 2.43 | | | | 5.17 | | | | N/A | | | | N/A | | | | 25 | |
| | 3.88 | | | | 7.61 | | | | 2,278,904 | | | | 2.12 | | | | 5.58 | | | | 2.11(e | ) | | | 5.59(e | ) | | | 21 | |
| | 9.36 | | | | 13.26 | | | | 2,321,756 | | | | 1.86 | | | | 5.03 | | | | 1.81(e | ) | | | 5.08(e | ) | | | 20 | |
| | 4.57 | | | | 6.21 | | | | 571,790 | | | | 1.48 | | | | 5.24 | | | | N/A | | | | N/A | | | | 26 | |
| | |
(b) | Net Investment Income (Loss) ratios reflect income earned and expenses incurred on assets attributable to preferred shares issued by the Fund. |
(c) | The expense ratios reflect, among other things, all interest expense and other costs related to preferred shares (as described in Note 5 – Fund Shares, Preferred Shares) and/or the interest expense deemed to have been paid by the Fund on the floating rate certificates issued by the special purpose trusts for the self-deposited inverse floaters held by the Fund (as described in Note 4 – Portfolio Securities and Investments in Derivatives, Inverse Floating Rate Securities), where applicable, as follows: |
| | | | | |
| NVG | | | NZF | |
Year Ended 10/31: | | | Year Ended 10/31: | |
2019 | 1.47% | | 2019 | 1.55% |
2018 | 1.37 | | 2018 | 1.38 |
2017 | 1.02 | | 2017 | 1.09 |
2016 | 0.78 | | 2016 | 0.84 |
2015 | 0.46 | | 2015 | 0.46 |
| | |
(d) | Portfolio Turnover Rate is calculated based on the lesser of long-term purchases or sales (as disclosed in Note 4 – Portfolio Securities and Investments in Derivatives, Investment Transactions) divided by the average long-term market value during the period. |
(e) | During the fiscal years ended October 31, 2017 and October 31, 2016, the Adviser voluntarily reimbursed the Fund for certain expenses incurred in connection with its reorganization. |
N/A | Fund does not have or no longer has a contractual reimbursement with the Adviser. |
* | Rounds to less than $0.01 per share. |
See accompanying notes to financial statements.
139
| |
| Financial Highlights (continued) |
|
|
|
|
Selected data for a common share outstanding throughout each period: |
|
|
|
| | |
| | | | | Investment Operations | | | Less Distributions to Common Shareholders
| | | Common Share | |
| | | Beginning Common
Share NAV | | | Net Investment Income (Loss)
| | | Net Realized/ Unrealized Gain (Loss) | | | Total | | | From
Net Investment Income | | | From Accumulated Net Realized Gains | | | Total | | | Premium Per Share Sold through Shelf Offering | | | Shelf Offering Costs | | | Ending NAV | | | Ending Share Price | |
| NMZ | | | | | | | | | | | | | | | | | | | | | | | | | | | | | | | | | |
Year Ended 10/31:
| | | | | | | | | | | | | | | | | | | | | | | | | |
2019 | | $ | 12.77 | | | $ | 0.76 | | | $ | 1.20 | | | $ | 1.96 | | | $ | (0.70 | ) | | $ | — | | | $ | (0.70 | ) | | $ | 0.01 | | | $ | — | | | $ | 14.04 | | | $ | 14.22 | |
2018 | | | 13.47 | | | | 0.82 | | | | (0.78 | ) | | | 0.04 | | | | (0.74 | ) | | | — | | | | (0.74 | ) | | | — | * | | | — | | | | 12.77 | | | | 11.76 | |
2017 | | | 13.68 | | | | 0.80 | | | | (0.22 | ) | | | 0.58 | | | | (0.81 | ) | | | — | | | | (0.81 | ) | | | 0.02 | | | | — | | | | 13.47 | | | | 13.53 | |
2016 | | | 13.66 | | | | 0.86 | | | | 0.04 | | | | 0.90 | | | | (0.91 | ) | | | — | | | | (0.91 | ) | | | 0.03 | | | | — | | | | 13.68 | | | | 13.32 | |
2015 | | | 13.71 | | | | 0.91 | | | | (0.04 | ) | | | 0.87 | | | | (0.92 | ) | | | — | | | | (0.92 | ) | | | — | | | | — | | | | 13.66 | | | | 13.76 | |
| | |
| NMCO | | | | | | | | | | | | | | | | | | | | | | | | | | | | | | | | | | | | | | | | | | | | |
Year Ended 10/31:
| | | | | | | | | | | | | | | | | | | | | | | | | | | | | | | | | |
2019(e) | | | 15.00 | | | | 0.04 | | | | 0.04 | | | | 0.08 | | | | — | | | | — | | | | — | | | | — | | | | — | | | | 15.08 | | | | 15.39 | |
| | |
(a) | Total Return Based on Common Share NAV is the combination of changes in common share NAV, reinvested dividend income at NAV and reinvested capital gains distributions at NAV, if any. The last dividend declared in the period, which is typically paid on the first business day of the following month, is assumed to be reinvested at the ending NAV. The actual reinvest price for the last dividend declared in the period may often be based on the Fund’s market price (and not its NAV), and therefore may be different from the price used in the calculation. Total returns are not annualized. |
| Total Return Based on Common Share Price is the combination of changes in the market price per share and the effect of reinvested dividend income and reinvested capital gains distributions, if any, at the average price paid per share at the time of reinvestment. The last dividend declared in the period, which is typically paid on the first business day of the following month, is assumed to be reinvested at the ending market price. The actual reinvestment for the last dividend declared in the period may take place over several days, and in some instances may not be based on the market price, so the actual reinvestment price may be different from the price used in the calculation. Total returns are not annualized. |
140
| | | | | | | | | | | | | | | | | |
| | | | | | | Common Share Supplemental Data/ Ratios Applicable to Common Shares
| |
| | |
Common Share Total Returns
| | | | | | Ratios to Average Net Assets(b) | | | | |
| | |
| | |
| | |
Based on NAV(a) | | | Based on Share Price(a) | | | Ending Net Assets (000) | | | Expenses(c) | | | Net Investment Income (Loss) | | | Portfolio Turnover Rate(d) | |
| | |
| | |
| | 15.75 | % | | | 27.45 | % | | $ | 969,068 | | | | 2.20 | % | | | 5.67 | % | | | 15 | % |
| | 0.25 | | | | (7.93 | ) | | | 818,439 | | | | 1.95 | | | | 6.17 | | | | 11 | |
| | 4.73 | | | | 8.04 | | | | 853,745 | | | | 1.54 | | | | 6.14 | | | | 10 | |
| | 6.91 | | | | 3.34 | | | | 788,577 | | | | 1.28 | | | | 6.27 | | | | 11 | |
| | 6.54 | | | | 11.49 | | | | 684,109 | | | | 1.25 | | | | 6.64 | | | | 9 | |
| | |
| | |
| | |
| | 0.53 | | | | 2.60 | | | | 803,046 | | | | 1.01 | ** | | | 2.58 | ** | | | 8 | |
| | |
(b) | Net Investment Income (Loss) ratios reflect income earned and expenses incurred on assets attributable to preferred shares issued by the Fund. |
(c) | The expense ratios reflect, among other things, all interest expense and other costs related to preferred shares (as described in Note 5 – Fund Shares, Preferred Shares) and/or the interest expense deemed to have been paid by the Fund on the floating rate certificates issued by the special purpose trusts for the self-deposited inverse floaters held by the Fund (as described in Note 4 – Portfolio Securities and Investments in Derivatives, Inverse Floating Rate Securities), where applicable, as follows: |
| | | | |
| NMZ | | NMCO | |
Year Ended 10/31: | | Year Ended 10/31: | |
2019 | 1.16% | 2019(e) | 0.05%** |
2018 | 0.91 | | |
2017 | 0.49 | | |
2016 | 0.24 | | |
2015 | 0.17 | | |
| | |
(d) | Portfolio Turnover Rate is calculated based on the lesser of long-term purchases or sales (as disclosed in Note 4 – Portfolio Securities and Investments in Derivatives, Investment Transactions) divided by the average long-term market value during the period. |
(e) | For the period September 16, 2019 (commencement of operations) through October 31, 2019. |
* | Rounds to less than $0.01 per share. |
** | Annualized. |
See accompanying notes to financial statements.
141
Financial Highlights (continued)
| | | | | | | | | | | | | | | | | | | | | | | | | | | | |
| | iMTP Shares at the End of Period | | | MFP Shares at the End of Period | | | VMTP Shares at the End of Period | | | VRDP Shares at the End of Period | | | iMTP, MFP, VMTP and /or VRDP Shares at the End of the Period | |
| | | Aggregate Amount Outstanding (000) | | | Aggregate Coverage Per $5,000 Share | | | Aggregate Amount Outstanding
(000) | | | Asset Coverage Per $100,000 Share(a) | | | Aggregate Amount Outstanding
(000) | | | Asset Coverage Per $100,000 Share | | | Aggregate Amount Outstanding
(000) | | | Asset Coverage Per $100,000 Share | | | Asset Coverage Per $1 Liquidation Preference | |
| NVG | | | | | | | | | | | | | | | | | | | | | | | | | | | |
Year Ended 10/31:
| | | | | | | | | | | | | | | | | | | | | | |
2019 | | $ | — | | | $ | — | | | $ | 405,400 | | | $ | 291,357 | | | $ | — | | | $ | — | | | $ | 1,411,600 | | | $ | 291,357 | | | $ | 2.91 | |
2018 | | | — | | | | — | | | | 405,400 | | | | 272,535 | | | | — | | | | — | | | | 1,411,600 | | | | 272,535 | | | | 2.73 | |
2017 | | | — | | | | — | | | | — | | | | — | | | | 240,400 | | | | 300,955 | | | | 1,411,600 | | | | 300,955 | | | | 3.01 | |
2016 | | | — | | | | — | | | | — | | | | — | | | | 240,400 | | | | 304,005 | | | | 1,411,600 | | | | 304,005 | | | | 3.04 | |
2015 | | | — | | | | — | | | | — | | | | — | | | | — | | | | — | | | | 179,000 | | | | 338,606 | | | | — | |
| | |
| NZF | | | | | | | | | | | | | | | | | | | | | | | | | | | | | | | | | | | | |
Year Ended 10/31:
| | | | | | | | | | | | | | | | | | | | | | | | | | | | | |
2019 | | | — | | | | — | | | | 641,000 | | | | 272,809 | | | | — | | | | — | | | | 727,000 | | | | 272,809 | | | | 2.73 | |
2018 | | | — | | | | — | | | | 641,000 | | | | 256,556 | | | | — | | | | — | | | | 727,000 | | | | 256,556 | | | | 2.57 | |
2017 | | | — | | | | — | | | | 150,000 | | | | 287,873 | | | | 336,000 | | | | 287,873 | | | | 727,000 | | | | 287,873 | | | | 2.88 | |
2016 | | | 150,000 | | | | 14,570 | | | | — | | | | — | | | | 336,000 | | | | 291,406 | | | | 727,000 | | | | 291,406 | | | | 2.91 | |
2015 | | | 150,000 | | | | 17,376 | | | | — | | | | — | | | | 81,000 | | | | 347,528 | | | | — | | | | — | | | | 3.48 | |
| | |
(a) | NVG’s Series B MFP Shares have a $1,000 liquidation preference per share, while all other MFP Shares have a $100,000 liquidation preference per share. The asset coverage per $1,000 share for NVG’s Series B MFP Shares is $2,914. |
See accompanying notes to financial statements.
142
| | | | | | | | | | | | | |
| | AMTP Shares at the End of Period | | | VMTP Shares
at the End of Period | |
| | |
| | | Aggregate Amount Outstanding (000) | | | Asset Coverage Per $100,000 Share | | | Aggregate Amount Outstanding (000) | | | Asset Coverage
Per $100,000
Share | |
| NMZ | | | | | | | | | | | | |
Year Ended 10/31: | | | | | | | | | | | | |
2019 | | $ | 87,000 | | | $ | 1,213,872 | | | $ | — | | | $ | — | |
2018 | | | 87,000 | | | | 1,040,734 | | | | — | | | | — | |
2017 | | | — | | | | — | | | | 87,000 | | | | 1,081,317
| |
2016 | | | — | | | | — | | | | 87,000 | | | | 1,006,411
| |
2015 | | | — | | | | — | | | | 87,000 | | | | 886,333 | |
See accompanying notes to financial statements.
143
Notes to
Financial Statements
1. General Information
Fund Information
The funds covered in this report and their corresponding New York Stock Exchange (“NYSE”) symbols are as follows (each a “Fund” and collectively, the “Funds”):
| • | Nuveen AMT-Free Municipal Credit Income Fund (NVG) |
| • | Nuveen Municipal Credit Income Fund (NZF) |
| • | Nuveen Municipal High Income Opportunity Fund (NMZ) |
| • | Nuveen Municipal Credit Opportunities Fund (NMCO) |
The Funds are registered under the Investment Company Act of 1940 (the “1940 Act”), as amended, as diversified closed-end management investment companies. NVG, NZF, NMZ and NMCO were organized as Massachusetts business trusts on July 12, 1999, March 21, 2001, October 8, 2003 and April 18, 2019, respectively.
The end of the reporting period for the Funds is October 31, 2019, and the period covered by these Notes to Financial Statements for NVG, NZF and NMZ is the fiscal year ended October 31, 2019 (the “current fiscal period”). The reporting period for NMCO is the period September 16, 2019 (commencement of operations) through October 31, 2019.
Investment Adviser
The Funds’ investment adviser is Nuveen Fund Advisors, LLC (the “Adviser”), a subsidiary of Nuveen, LLC (“Nuveen”). Nuveen is the investment management arm of Teachers Insurance and Annuity Association of America (TIAA). The Adviser has overall responsibility for management of the Funds, oversees the management of the Funds’ portfolios, manages the Funds’ business affairs and provides certain clerical, bookkeeping and other administrative services, and, if necessary, asset allocation decisions. The Adviser has entered into sub-advisory agreements with Nuveen Asset Management, LLC (the “Sub-Adviser”), a subsidiary of the Adviser, under which the Sub-Adviser manages the investment portfolios of the Funds.
Fund Merger
During May 2019, the Funds’ Board of Trustees (the “Board”) approved the merger of the Nuveen Connecticut Quality Municipal Income Fund (NTC) (the “Target Fund”) into NVG (the “Acquiring Fund”) (the “Merger”). The Merger is intended to create one larger fund with lower operating expenses and increased trading volume on the exchange for common shares.
The Merger was approved by shareholders of the Target Fund at a special meeting during October 2019 and was completed before the opening of business on November 18, 2019 (subsequent to the close of this reporting period).
2. Significant Accounting Policies
The accompanying financial statements were prepared in accordance with accounting principles generally accepted in the United States of America (“U.S. GAAP”), which may require the use of estimates made by management and the evaluation of subsequent events. Actual results may differ from those estimates. Each Fund is an investment company and follows the accounting guidance in the Financial Accounting Standards Board (“FASB”) Accounting Standards Codification 946, Financial Services—Investment Companies. The net asset value (“NAV”) for financial reporting purposes may differ from the NAV for processing security and common share transactions. The NAV for financial reporting purposes includes security and common share transactions through the date of the report. Total return is computed based on the NAV used for processing security and common share transactions. The following is a summary of the significant accounting policies consistently followed by the Funds.
Compensation
The Funds pay no compensation directly to those of its trustees who are affiliated with the Adviser or to its officers, all of whom receive remuneration for their services to the Funds from the Adviser or its affiliates. The Board has adopted a deferred compensation plan for independent trustees that enables trustees to elect to defer receipt of all or a portion of the annual compensation they are entitled to receive from certain Nuveen-advised funds. Under the plan, deferred amounts are treated as though equal dollar amounts had been invested in shares of select Nuveen-advised funds.
144
Distributions to Common Shareholders
Distributions to common shareholders are recorded on the ex-dividend date. The amount, character and timing of distributions are determined in accordance with federal income tax regulations, which may differ from U.S. GAAP.
Indemnifications
Under the Funds’ organizational documents, their officers and trustees are indemnified against certain liabilities arising out of the performance of their duties to the Funds. In addition, in the normal course of business, the Funds enter into contracts that provide general indemnifications to other parties. The Funds’ maximum exposure under these arrangements is unknown as this would involve future claims that may be made against the Funds that have not yet occurred. However, the Funds have not had prior claims or losses pursuant to these contracts and expect the risk of loss to be remote.
Investments and Investment Income
Securities transactions are accounted for as of the trade date for financial reporting purposes. Realized gains and losses on securities transactions are based upon the specific identification method. Investment income is comprised of interest income, which reflects the amortization of premiums and accretion of discounts for financial reporting purposes and, is recorded on an accrual basis. Investment income also reflects payment-in-kind (“PIK”) interest and paydown gains and losses, if any. PIK interest represents income received in the form of securities in lieu of cash.
Netting Agreements
In the ordinary course of business, the Funds may enter into transactions subject to enforceable International Swaps and Derivative Association, Inc. (ISDA) master agreements or other similar arrangements (“netting agreements”). Generally, the right to offset in netting agreements allows each Fund to offset certain securities and derivatives with a specific counterparty, when applicable, as well as any collateral received or delivered to that counterparty based on the terms of the agreements. Generally, each Fund manages its cash collateral and securities collateral on a counterparty basis.
The Funds’ investments subject to netting agreements as of the end of the reporting period, if any, are further described in Note 4 – Portfolio Securities and Investments in Derivatives.
Organizational Expenses
Prior to the commencement of operations for NMCO on September 16, 2019, the Fund had no operations other than those related to organizational matters, the Fund’s initial contribution of $100,005, by the Adviser.
New Accounting Pronouncements and Rule Issuances
FASB Accounting Standards Update (“ASU”) 2017-08 (“ASU 2017-08”) Premium Amortization on Purchased Callable Debt Securities
The FASB has issued ASU 2017-08, which shortens the premium amortization period for purchased non-contingently callable debt securities. ASU 2017-08 specifies that the premium amortization period ends at the earliest call date, for purchased non-contingently callable debt securities. ASU 2017-08 is effective for fiscal years, and interim periods within those fiscal years, beginning after December 15, 2018. During the current fiscal period, ASU 2017-08 became effective for NMCO and it did not have a material impact on the Fund’s financial statements. Management is currently evaluating the implications of ASU 2017-18, if any, for NVG, NZF and NMZ.
Fair Value Measurement: Disclosure Framework
During August 2018, the FASB issued ASU 2018-13 (“ASU 2018-13”), Fair Value Measurement: Disclosure Framework – Changes to the Disclosure Requirements for Fair Value Measurements. ASU 2018-13 modifies the disclosures required by Topic 820, Fair Value Measurements. The amendments in ASU 2018-13 are effective for all entities for fiscal years, and interim periods within those fiscal years, beginning after December 15, 2019. Management has early implemented this guidance and it did not have a material impact on the Funds’ financial statements.
3. Investment Valuation and Fair Value Measurements
The fair valuation input levels as described below are for fair value measurement purposes.
The Funds’ investments in securities are recorded at their estimated fair value. Fair value is defined as the price that would be received upon selling an investment or transferring a liability in an orderly transaction to an independent buyer in the principal or most advantageous market for the investment. A three-tier hierarchy is used to maximize the use of observable market data and minimize the use of unobservable inputs and to establish classification of fair value measurements for disclosure purposes. Observable inputs reflect the assumptions market participants would use in pricing the asset or liability. Observable inputs are based on market data obtained from sources independent of the reporting entity. Unobservable inputs reflect the
145
Notes to Financial Statements (continued)
reporting entity’s own assumptions about the assumptions market participants would use in pricing the asset or liability. Unobservable inputs are based on the best information available in the circumstances. The following is a summary of the three-tiered hierarchy of valuation input levels.
Level 1 – Inputs are unadjusted and prices are determined using quoted prices in active markets for identical securities.
Level 2 – Prices are determined using other significant observable inputs (including quoted prices for similar securities, interest rates, credit spreads, etc.).
Level 3 – Prices are determined using significant unobservable inputs (including management’s assumptions in determining the fair value of investments).
Prices of fixed income securities are provided by an independent pricing service (“pricing service”) approved by the Board. The pricing service establishes a security’s fair value using methods that may include consideration of the following: yields or prices of investments of comparable quality, type of issue, coupon, maturity and rating, market quotes or indications of value from security dealers, evaluations of anticipated cash flows or collateral, general market conditions and other information and analysis, including the obligor’s credit characteristics considered relevant. These securities are generally classified as Level 2. In pricing certain securities, particularly less liquid and lower quality securities, the pricing service may consider information about a security, its issuer or market activity, provided by the Adviser. These securities are generally classified as Level 2 or Level 3 depending on the observability of the significant inputs.
Prices of swap contracts are also provided by a pricing service approved by the Board using the same methods as described above and are generally classified as Level 2.
Investments in investment companies are valued at their respective NAV on valuation date and are generally classified as Level 1.
Common stocks and other equity-type securities are valued at the last sales price on the securities exchange on which such securities are primarily traded and are generally classified as Level 1. Securities primarily traded on the Nasdaq National Market (“Nasdaq”) are valued at the Nasdaq Official Closing Price and are generally classified as Level 1. However, securities traded on a securities exchange or Nasdaq for which there were no transactions on a given day or securities not listed on a securities exchange or Nasdaq are valued at the quoted bid price and are generally classified as Level 2.
Exchange-traded funds are valued at the last sales price on the securities exchange on which such securities are primarily traded and are generally classified as Level 1.
Certain securities may not be able to be priced by the pre-established pricing methods as described above. Such securities may be valued by the Board and/or its appointee at fair value. These securities generally include, but are not limited to, restricted securities (securities which may not be publicly sold without registration under the Securities Act of 1933, as amended) for which a pricing service is unable to provide a market price; securities whose trading has been formally suspended; debt securities that have gone into default and for which there is no current market quotation; a security whose market price is not available from a pre-established pricing source; a security with respect to which an event has occurred that is likely to materially affect the value of the security after the market has closed but before the calculation of a Fund’s NAV (as may be the case in non-U.S. markets on which the security is primarily traded) or make it difficult or impossible to obtain a reliable market quotation; and a security whose price, as provided by the pricing service, is not deemed to reflect the security’s fair value. As a general principle, the fair value of a security would appear to be the amount that the owner might reasonably expect to receive for it in a current sale. A variety of factors may be considered in determining the fair value of such securities, which may include consideration of the following: yields or prices of investments of comparable quality, type of issue, coupon, maturity and rating, market quotes or indications of value from security dealers, evaluations of anticipated cash flows or collateral, general market conditions and other information and analysis, including the obligor’s credit characteristics considered relevant. These securities are generally classified as Level 2 or Level 3 depending on the observability of the significant inputs. Regardless of the method employed to value a particular security, all valuations are subject to review by the Board and/or its appointee.
146
The inputs or methodologies used for valuing securities are not an indication of the risks associated with investing in those securities. The following is a summary of each Fund’s fair value measurements as of the end of the reporting period:
| | | | | | | | | | | | | |
| NVG | | Level 1 | | | Level 2 | | | Level 3 | | | Total | |
Long-Term Investments: | | | | | | | | | | | | |
| Municipal Bonds* | | $ | — | | | $ | 5,399,427,282 | | | $ | — | | | $ | 5,399,427,282 | |
| | |
| NZF | | | | | | | | | | | | | | | | |
Long-Term Investments: | | | | | | | | | | | | | | | | |
| Municipal Bonds* | | $ | — | | | $ | 3,691,228,238 | | | $ | 7,800,000 | *** | | $ | 3,699,028,238 | |
| Investment Companies | | | 1,933,622 | | | | — | | | | — | | | | 1,933,622 | |
| Corporate Bonds** | | | — | | | | — | | | | — | **** | | | — | |
Total | | $ | 1,933,622 | | | $ | 3,691,228,238 | | | $ | 7,800,000 | | | $ | 3,700,961,860 | |
| | |
| NMZ | | | | | | | | | | | | | | | | |
Long-Term Investments: | | | | | | | | | | | | | | | | |
| Municipal Bonds* | | $ | — | | | $ | 1,371,324,779 | | | $ | 2,023,787 | *** | | $ | 1,373,348,566 | |
| Common Stocks** | | | 6,839,071 | | | | — | | | | — | | | | 6,839,071 | |
| Corporate Bonds** | | | — | | | | 3,803,480 | | | | — | **** | | | 3,803,480 | |
Short-Term Investments: | | | | | | | | | | | | | | | | |
| Municipal Bonds* | | | — | | | | 17,885,000 | | | | — | | | | 17,885,000 | |
Total | | $ | 6,839,071 | | | $ | 1,393,013,259 | | | $ | 2,023,787 | | | $ | 1,401,876,117 | |
| | |
| NMCO | | | | | | | | | | | | | | | | |
Long-Term Investments: | | | | | | | | | | | | | | | | |
| Municipal Bonds* | | $ | — | | | $ | 693,559,954 | | | $ | — | | | $ | 693,559,954 | |
| Exchange-Traded Funds | | | 38,071,520 | | | | — | | | | — | | | | 38,071,520 | |
Short-Term Investments: | | | | | | | | | | | | | | | | |
Municipal Bonds*
| | | — | | | | 94,320,000 | | | | — | | | | 94,320,000 | |
Total | | $ | 38,071,520 | | | $ | 787,879,954 | | | $ | — | | | $ | 825,951,474 | |
| | |
* | Refer to the Fund’s Portfolio of Investments for state classifications. |
** | Refer to the Fund’s Portfolio of Investments for industry classifications. |
*** | Refer to the Fund’s Portfolio of Investments for securities classified as Level 3. |
**** | Refer to the Fund’s Portfolio of Investments for securities classified as Level 3. Value equals zero as of the end of the reporting period. |
4. Portfolio Securities and Investments in Derivatives
Portfolio Securities
Inverse Floating Rate Securities
Each Fund is authorized to invest in inverse floating rate securities. An inverse floating rate security is created by depositing a municipal bond (referred to as an “Underlying Bond”), typically with a fixed interest rate, into a special purpose tender option bond (“TOB”) trust (referred to as the “TOB Trust”) created by or at the direction of one or more Funds. In turn, the TOB Trust issues (a) floating rate certificates (referred to as “Floaters”) in face amounts equal to some fraction of the Underlying Bond’s par amount or market value, and (b) an inverse floating rate certificate (referred to as an “Inverse Floater”) that represents all remaining or residual interest in the TOB Trust. Floaters typically pay short-term tax-exempt interest rates to third parties who are also provided a right to tender their certificate and receive its par value, which may be paid from the proceeds of a remarketing of the Floaters, by a loan to the TOB Trust from a third party liquidity provider (“Liquidity Provider”), or by the sale of assets from the TOB Trust. The Inverse Floater is issued to a long term investor, such as one or more of the Funds. The income received by the Inverse Floater holder varies inversely with the short-term rate paid to holders of the Floaters, and in most circumstances the Inverse Floater holder bears substantially all of the Underlying Bond’s downside investment risk and also benefits disproportionately from any potential appreciation of the Underlying Bond’s value. The value of an Inverse Floater will be more volatile than that of the Underlying Bond because the interest rate is dependent on not only the fixed coupon rate of the Underlying Bond but also on the short-term interest paid on the Floaters, and because the Inverse Floater essentially bears the risk of loss (and possible gain) of the greater face value of the Underlying Bond.
The Inverse Floater held by a Fund gives the Fund the right to (a) cause the holders of the Floaters to tender their certificates at par (or slightly more than par in certain circumstances), and (b) have the trustee of the TOB Trust (the “Trustee”) transfer the Underlying Bond held by the TOB Trust to the Fund, thereby collapsing the TOB Trust.
147
Notes to Financial Statements (continued)
The Fund may acquire an Inverse Floater in a transaction where it (a) transfers an Underlying Bond that it owns to a TOB Trust created by a third party or (b) transfers an Underlying Bond that it owns, or that it has purchased in a secondary market transaction for the purpose of creating an Inverse Floater, to a TOB Trust created at its direction, and in return receives the Inverse Floater of the TOB Trust (referred to as a “self-deposited Inverse Floater”). A Fund may also purchase an Inverse Floater in a secondary market transaction from a third party creator of the TOB Trust without first owning the Underlying Bond (referred to as an “externally-deposited Inverse Floater”).
An investment in a self-deposited Inverse Floater is accounted for as a “financing” transaction (i.e., a secured borrowing). For a self-deposited Inverse Floater, the Underlying Bond deposited into the TOB Trust is identified in the Fund’s Portfolio of Investments as “(UB) – Underlying bond of an inverse floating rate trust reflected as a financing transaction,” with the Fund recognizing as liabilities, labeled “Floating rate obligations” on the Statement of Assets and Liabilities, (a) the liquidation value of Floaters issued by the TOB Trust, and (b) the amount of any borrowings by the TOB Trust from a Liquidity Provider to enable the TOB Trust to purchase outstanding Floaters in lieu of a remarketing. In addition, the Fund recognizes in “Investment Income” the entire earnings of the Underlying Bond, and recognizes (a) the interest paid to the holders of the Floaters or on the TOB Trust’s borrowings, and (b) other expenses related to remarketing, administration, trustee, liquidity and other services to a TOB Trust, as a component of “Interest expense and amortization of offering costs” on the Statement of Operations. Earnings due from the Underlying Bond and interest due to the holders of the Floaters as of the end of the reporting period are recognized as components of “Receivable for interest” and “Payable for interest” on the Statement of Assets and Liabilities, respectively.
In contrast, an investment in an externally-deposited Inverse Floater is accounted for as a purchase of the Inverse Floater and is identified in the Fund’s Portfolio of Investments as “(IF) – Inverse floating rate investment.” For an externally-deposited Inverse Floater, a Fund’s Statement of Assets and Liabilities recognizes the Inverse Floater and not the Underlying Bond as an asset, and the Fund does not recognize the Floaters, or any related borrowings from a Liquidity Provider, as a liability. Additionally, the Fund reflects in “Investment Income” only the net amount of earnings on the Inverse Floater (net of the interest paid to the holders of the Floaters or the Liquidity Provider as lender, and the expenses of the Trust), and does not show the amount of that interest paid or the expenses of the TOB Trust as described above as interest expense on the Statement of Operations.
Fees paid upon the creation of a TOB Trust for self-deposited Inverse Floaters and externally-deposited Inverse Floaters are recognized as part of the cost basis of the Inverse Floater and are capitalized over the term of the TOB Trust.
As of the end of the reporting period, the aggregate value of Floaters issued by each Fund’s TOB Trust for self-deposited Inverse Floaters and externally-deposited Inverse Floaters was as follows:
| | | | | | | | | | | | | |
| Floating Rate Obligations Outstanding | | NVG | | | NZF | | | NMZ | | | NMCO | |
Floating rate obligations: self-deposited Inverse Floaters | | $ | 184,980,000 | | | $ | 23,620,000 | | | $ | 383,362,000 | | | $ | 28,500,000 | |
Floating rate obligations: externally-deposited Inverse Floaters | | | 77,355,000 | | | | 11,095,000 | | | | 107,065,000 | | | | — | |
Total | | $ | 262,335,000 | | | $ | 34,715,000 | | | $ | 490,427,000 | | | $ | 28,500,000 | |
During the current fiscal period, the average amount of Floaters (including any borrowings from a Liquidity Provider) outstanding, and the average annual interest rate and fees related to self-deposited Inverse Floaters, were as follows:
| | | | | | | | | | | | | |
| Self-Deposited Inverse Floaters | | NVG | | | NZF | | | NMZ | | | NMCO | |
Average floating rate obligations outstanding | | $ | 184,864,438 | | | $ | 23,620,000 | | | $ | 374,332,633 | | | $ | 2,345,548 | |
Average annual interest rate and fees | | | 2.10 | % | | | 2.16 | % | | | 2.15 | % | | | 1.94 | % |
TOB Trusts are supported by a liquidity facility provided by a Liquidity Provider pursuant to which the Liquidity Provider agrees, in the event that Floaters are (a) tendered to the Trustee for remarketing and the remarketing does not occur, or (b) subject to mandatory tender pursuant to the terms of the TOB Trust agreement, to either purchase Floaters or to provide the Trustee with an advance from a loan facility to fund the purchase of Floaters by the TOB Trust. In certain circumstances, the Liquidity Provider may otherwise elect to have the Trustee sell the Underlying Bond to retire the Floaters that were tendered and not remarketed prior to providing such a loan. In these circumstances, the Liquidity Provider remains obligated to provide a loan to the extent that the proceeds of the sale of the Underlying Bond is not sufficient to pay the purchase price of the Floaters.
The size of the commitment under the loan facility for a given TOB Trust is at least equal to the balance of that TOB Trust’s outstanding Floaters plus any accrued interest. In consideration of the loan facility, fee schedules are in place and are charged by the Liquidity Provider(s). Any loans made by the Liquidity Provider will be secured by the purchased Floaters held by the TOB Trust. Interest paid on any outstanding loan balances will be effectively borne by the Fund that owns the Inverse Floaters of the TOB Trust that has incurred the borrowing and may be at a rate that is greater than the rate that would have been paid had the Floaters been successfully remarketed.
As described above, any amounts outstanding under a liquidity facility are recognized as a component of “Floating rate obligations” on the Statement of Assets and Liabilities by the Fund holding the corresponding Inverse Floaters issued by the borrowing TOB Trust. As of the end of the reporting period there were no loans outstanding under any such facility.
148
Each Fund may also enter into shortfall and forbearance agreements (sometimes referred to as a “recourse arrangement”) (TOB Trusts involving such agreements are referred to herein as “Recourse Trusts”), under which a Fund agrees to reimburse the Liquidity Provider for the Trust’s Floaters, in certain circumstances, for the amount (if any) by which the liquidation value of the Underlying Bond held by the TOB Trust may fall short of the sum of the liquidation value of the Floaters issued by the TOB Trust plus any amounts borrowed by the TOB Trust from the Liquidity Provider, plus any shortfalls in interest cash flows. Under these agreements, a Fund’s potential exposure to losses related to or on an Inverse Floater may increase beyond the value of the Inverse Floater as a Fund may potentially be liable to fulfill all amounts owed to holders of the Floaters or the Liquidity Provider. Any such shortfall amount in the aggregate is recognized as “Unrealized depreciation on Recourse Trusts” on the Statement of Assets and Liabilities.
As of the end of the reporting period, each Fund’s maximum exposure to the Floaters issued by Recourse Trusts for self-deposited Inverse Floaters and externally-deposited Inverse Floaters was as follows:
| | | | | | | | | | | | | |
| Floating Rate Obligations – Recourse Trusts | | NVG | | | NZF | | | NMZ | | | NMCO | |
Maximum exposure to Recourse Trusts: self-deposited Inverse Floaters | | $ | 177,235,000 | | | $ | 8,775,000 | | | $ | 352,922,000 | | | $ | 28,500,000 | |
Maximum exposure to Recourse Trusts: externally-deposited Inverse Floaters | | | 65,000,000 | | | | 9,420,000 | | | | 104,815,000 | | | | — | |
Total | | $ | 242,235,000 | | | $ | 18,195,000 | | | $ | 457,737,000 | | | $ | 28,500,000 | |
Zero Coupon Securities
A zero coupon security does not pay a regular interest coupon to its holders during the life of the security. Income to the holder of the security comes from accretion of the difference between the original purchase price of the security at issuance and the par value of the security at maturity and is effectively paid at maturity. The market prices of zero coupon securities generally are more volatile than the market prices of securities that pay interest periodically.
Investment Transactions
Long-term purchases and sales (including maturities but excluding derivative transactions, where applicable) during the current fiscal period were as follows:
| | | | | | | | | | | | | |
| | NVG | | | NZF | | | NMZ | | | NMCO | |
Purchases | | $ | 336,191,714 | | | $ | 419,425,265 | | | $ | 266,237,896 | | | $ | 779,041,825 | |
Sales and maturities | | | 361,090,778 | | | | 486,237,108 | | | | 205,266,707 | | | | 49,666,848 | |
Investments purchased on a when-issued/delayed delivery basis may have extended settlement periods. Any investments so purchased are subject to market fluctuation during this period. The Funds have earmarked securities in their portfolios with a current value at least equal to the amount of the when-issued/delayed delivery purchase commitments.
As of the end of the reporting period, the following Funds' outstanding when-issued/delayed delivery purchase commitments were as follows:
| | | | | | | |
| | NVG | | | NMCO | |
Outstanding when-issued/delayed delivery purchase commitments | | $ | 14,126,730 | | | $ | 773,672 | |
Investments in Derivatives
In addition to the inverse floating rate securities in which each Fund may invest, which are considered portfolio securities for financial reporting purposes, each Fund is authorized to invest in certain other derivative instruments such as futures, options and swap contracts. Each Fund limits its investments in futures, options on futures and swap contracts to the extent necessary for the Adviser to claim the exclusion from registration by the Commodity Futures Trading Commission as a commodity pool operator with respect to the Fund. The Funds record derivative instruments at fair value, with changes in fair value recognized on the Statement of Operations, when applicable. Even though the Funds’ investments in derivatives may represent economic hedges, they are not considered to be hedge transactions for financial reporting purposes.
Interest Rate Swap Contracts
Interest rate swap contracts involve a Fund’s agreement with the counterparty to pay or receive a fixed rate payment in exchange for the counterparty receiving or paying a variable rate payment. Forward interest rate swap contracts involve a Fund’s agreement with a counterparty to pay, in the future, a fixed or variable rate payment in exchange for the counterparty paying the Fund a variable or fixed rate payment, the accruals for which would begin at a specified date in the future (the “effective date”).
The amount of the payment obligation for an interest rate swap is based on the notional amount and the termination date of the contract. Interest rate swap contracts do not involve the delivery of securities or other underlying assets or principal. Accordingly, the risk of loss with respect to the swap counterparty on such transactions is limited to the net amount of interest payments that the Fund is to receive.
149
Notes to Financial Statements (continued)
Interest rate swap contracts are valued daily. Upon entering into an interest rate swap contract (and beginning on the effective date for a forward interest rate swap contract), a Fund accrues the fixed rate payment expected to be paid or received and the variable rate payment expected to be received or paid on the interest rate swap contracts on a daily basis, and recognizes the daily change in the fair value of the Fund’s contractual rights and obligations under the contracts. For an over-the-counter (“OTC”) swap that is not cleared through a clearing house (“OTC Uncleared”), the amount recorded on these transactions is recognized on the Statement of Assets and Liabilities as a component of “Unrealized appreciation or depreciation on interest rate swaps.”
Upon the execution of an OTC swap cleared through a clearing house (“OTC Cleared”), the Fund is obligated to deposit cash or eligible securities, also known as “initial margin,” into an account at its clearing broker equal to a specified percentage of the contract amount. Cash deposited by the Fund to cover initial margin requirements on open swap contracts, if any, is recognized as a component of “Cash collateral at brokers for investments in swaps” on the Statement of Assets and Liabilities. Investments in OTC Cleared swaps obligate the Fund and the clearing broker to settle monies on a daily basis representing changes in the prior day’s “mark-to-market” of the swap contract. If the Fund has unrealized appreciation, the clearing broker will credit the Fund’s account with an amount equal to the appreciation. Conversely, if the Fund has unrealized depreciation, the clearing broker will debit the Fund’s account with an amount equal to the depreciation. These daily cash settlements are also known as “variation margin.” Variation margin for OTC Cleared swaps is recognized as a receivable and/or payable for “Variation margin on swap contracts” on the Statement of Assets and Liabilities. Upon the execution of an OTC Uncleared swap, neither the Fund nor the counterparty is required to deposit initial margin as the trades are recorded bilaterally between both parties to the swap contract, and the terms of the variation margin are subject to a predetermined threshold negotiated by the Fund and the counterparty. Variation margin for OTC Uncleared swaps is recognized as a component of “Unrealized appreciation or depreciation on interest rate swaps” as described in the preceding paragraph.
The net amount of periodic payments settled in cash are recognized as a component of “Net realized gain (loss) from swaps” on the Statement of Operations, in addition to the net realized gain or loss recorded upon the termination of the swap contract. For tax purposes, payments expected to be received or paid on the swap contracts are treated as ordinary income or expense, respectively. Changes in the value of the swap contracts during the fiscal period are recognized as a component of “Change in net unrealized appreciation (depreciation) of swaps” on the Statement of Operations. In certain instances, payments are made or received upon entering into the swap contract to compensate for differences between the stated terms of the swap agreements and prevailing market conditions (credit spreads, currency exchange rates, interest rates, and other relevant factors). Payments received or made at the beginning of the measurement period, if any, are recognized as “Interest rate swaps premiums received and/or paid” on the Statement of Assets and Liabilities.
During the current fiscal period, NVG continued to invest in forward interest rate swap contracts, as part of its duration management strategies, to help reduce price volatility risk to movements in U.S. interest rates relative to the Fund’s benchmark.
The average notional amount of interest rate swap contracts outstanding during the current fiscal period was as follows:
| | | | |
| | NVG | |
Average notional amount of interest rate swap contracts outstanding* | | $ | 15,880,000 | |
| |
| * The average notional amount is calculated based on the outstanding notional at the beginning of the current fiscal period and at the end of each fiscal quarter within the current fiscal period. |
The following table presents the amount of net realized gain (loss) and change in net unrealized appreciation (depreciation) recognized on swap contracts on the Statement of Operations during the current fiscal period, and the primary underlying risk exposure.
| | | | | |
| | | | Change in Net |
| | | Net Realized | Unrealized Appreciation |
| Underlying | Derivative | Gain (Loss) from | (Depreciation) of |
| Fund | Risk Exposure | Instrument | Swaps | Swaps |
| NVG | Interest rate | Swaps | $(80,409) | $(1,924,823) |
Market and Counterparty Credit Risk
In the normal course of business each Fund may invest in financial instruments and enter into financial transactions where risk of potential loss exists due to changes in the market (market risk) or failure of the other party to the transaction to perform (counterparty credit risk). The potential loss could exceed the value of the financial assets recorded on the financial statements. Financial assets, which potentially expose each Fund to counterparty credit risk, consist principally of cash due from counterparties on forward, option and swap transactions, when applicable. The extent of each Fund’s exposure to counterparty credit risk in respect to these financial assets approximates their carrying value as recorded on the Statement of Assets and Liabilities.
Each Fund helps manage counterparty credit risk by entering into agreements only with counterparties the Adviser believes have the financial resources to honor their obligations and by having the Adviser monitor the financial stability of the counterparties. Additionally, counterparties may be required to pledge collateral daily (based on the daily valuation of the financial asset) on behalf of each Fund with a value approximately equal to the amount of any unrealized gain above a pre-determined threshold. Reciprocally, when each Fund has an unrealized loss, the Funds have instructed the custodian to pledge assets of the Funds as collateral with a value approximately equal to the amount of the unrealized loss above a pre-determined threshold.
150
Collateral pledges are monitored and subsequently adjusted if and when the valuations fluctuate, either up or down, by at least the pre-determined threshold amount.
5. Fund Shares
Common Shares
Common Shares Equity Shelf Programs and Offering Costs
NMZ has filed a registration statement with the Securities and Exchange Commission (“SEC”) authorizing the Fund to issue additional common shares through one or more equity shelf programs (“Shelf Offering”), which became effective with the SEC during the current fiscal period.
Under this Shelf Offering, the Fund, subject to market conditions, may raise additional equity capital by issuing additional common shares from time to time in varying amounts and by different offering methods at a net price at or above the Fund’s NAV per common share. In the event the Fund’s Shelf Offering registration statement is no longer current, the Fund may not issue additional common shares until a post-effective amendment to the registration statement has been filed with the SEC.
Additional authorized common shares, common shares sold and offering proceeds, net of offering costs under the Fund’s Shelf Offering during the Fund’s current and prior fiscal period were as follows:
| | | | | | | |
| | NMZ | |
| | Year | | | Year | |
| | Ended | | | Ended | |
| | 10/31/19 | | | 10/31/18 | |
Additional authorized common shares | | | 15,700,000 | ** | | | 15,700,000 | * |
Common shares sold | | | 4,928,383 | | | | 669,558 | |
Offering proceeds, net of offering costs | | $ | 69,515,572 | | | $ | 9,084,815 | |
| | |
* | Represents additional authorized common shares for the period November 1, 2017 through August 31, 2018. |
** | Represents additional authorized common shares for the period April 11, 2019 through October 31, 2019. |
Costs incurred by the Fund in connection with its initial shelf registration are recorded as a prepaid expense and recognized as “Deferred offering costs” on the Statement of Assets and Liabilities. These costs are amortized pro rata as common shares are sold and are recognized as a component of “Proceeds from shelf offering, net of offering costs” on the Statement of Changes in Net Assets. Any deferred offering costs remaining one year after effectiveness of the initial shelf registration will be expensed. Costs incurred by the Funds to keep the shelf registration current are expensed as incurred and recognized as a component of “Other expenses” on the Statement of Operations.
Common Share Transactions
Transactions in common shares for the Funds during the Funds’ current and prior fiscal period, where applicable, were as follows:
| | | | | | | |
| | NMZ | |
| | |
| | Year | | | Year | |
| | Ended | | | Ended | |
| | 10/31/19 | | | 10/31/18 | |
| | |
Common shares: | | | | | | |
| Issued to shareholders due to reinvestment of distributions | | | 24,585 | | | | 20,267 | |
| Sold through shelf offering | | | 4,928,383 | | | | 669,558 | |
| | |
Weighted average common share: | | | | | | | | |
| Premium to NAV per shelf offering share sold | | | 1.26 | % | | | 1.13 | % |
|
| NMCO* |
|
| For the period 9/16/19 |
| (commencement |
| of operations) |
| through 10/31/19 |
|
Common shares: | | |
| Sold | | 53,250,000 |
| |
| * Prior to the commencement of operations, the Adviser purchased 6,667 shares, which are still held as of the end of the reporting period. |
151
Notes to Financial Statements (continued)
Preferred Shares
Adjustable Rate MuniFund Term Preferred Shares
NMZ has issued and has outstanding Adjustable Rate MuniFund Term Preferred (“AMTP”) Shares, with a $100,000 liquidation preference per share. AMTP Shares are issued via private placement and are not publicly available.
The details of NMZ’s AMTP Shares outstanding as of the end of the reporting period, were as follows:
| | | | | |
| | | | Liquidation |
| | | | Preference |
| | | | Net of |
| | Shares | Liquidation | Deferred |
| Fund | Series | Outstanding | Preference | Offering Costs |
NMZ | 2028 | 870 | $87,000,000 | $86,866,271 |
The Fund is obligated to redeem its AMTP Shares by the date as specified in its offering document (“Term Redemption Date”), unless earlier redeemed by the Fund. AMTP Shares are subject to optional and mandatory redemption in certain circumstances. The AMTP Shares may be redeemed at the option of the Fund, subject to payment of premium for approximately six months following the date of issuance (“Premium Expiration Date”), and at the redemption price per share thereafter. The redemption price per share is equal to the sum of the liquidation preference per share plus any accumulated but unpaid dividends.
AMTP Shares are short-term or short/intermediate-term instruments that pay a variable dividend rate tied to a short-term index, plus an additional fixed “spread” amount which is initially established at the time of issuance and may be adjusted in the future based upon a mutual agreement between the majority owner and the Fund. From time-to-time the majority owner may propose to the Fund an adjustment to the dividend rate. Should the majority owner and the Fund fail to agree upon an adjusted dividend rate, and such proposed dividend rate adjustment is not withdrawn, the Fund will be required to redeem all outstanding shares upon the end of a notice period.
In addition, the Fund may be obligated to redeem a certain amount of the AMTP Shares if the Fund fails to maintain certain asset coverage and leverage ratio requirements and such failures are not cured by the applicable cure date. The Term Redemption Date and Premium Expiration Date for the Fund’s AMTP Shares are as follows:
| | | | | |
| Notice | | Term | Premium |
| Fund | Period | Series | Redemption Date | Expiration Date |
NMZ | 360-day | 2028 | March 1, 2028* | August 31, 2018 |
| |
* Subject to early termination by either the Fund or the holder. |
The average liquidation preference of AMTP Shares outstanding and annualized dividend rate for the Fund during the current fiscal period were as follows:
| | | | |
| | NMZ | |
Average liquidation preference of AMTP Shares outstanding | | $ | 87,000,000 | |
Annualized dividend rate | | | 2.39 | % |
AMTP Shares are subject to restrictions on transfer, generally do not trade, and market quotations are generally not available. The fair value of AMTP Shares is expected to be approximately their liquidation preference so long as the fixed “spread” on the AMTP Shares remains roughly in line with the “spread” being demanded by investors on instruments having similar terms in the current market environment. In present market conditions, the Funds’ Adviser has determined that the fair value of AMTP Shares is approximately their liquidation preference, but their fair value could vary if market conditions change materially. For financial reporting purposes, the liquidation preference of AMTP Shares is a liability and is recognized as a component of “Adjustable Rate MuniFund Term Preferred (“AMTP”) Shares, net of deferred offering costs” on the Statement of Assets and Liabilities.
AMTP Share dividends are treated as interest payments for financial reporting purposes. Unpaid dividends on AMTP Shares are recognized as a component of “Interest payable” on the Statement of Assets and Liabilities. Dividends accrued on AMTP Shares are recognized as a component of “Interest expense and amortization of offering costs” on the Statement of Operations.
Costs incurred in connection with NMZ’s offering of AMTP Shares were recorded as deferred charges, which are amortized over the life of the shares and are recognized as components of “Adjustable Rate MuniFund Term Preferred (“AMTP”) Shares, net of deferred offering costs” on the Statement of Assets and Liabilities and “Interest expense and amortization of offering costs” on the Statement of Operations.
152
MuniFund Preferred Shares
The following Funds have issued and have outstanding MuniFund Preferred (“MFP”) Shares, with a $100,000 ($1,000 for NVG’s Series B) liquidation preference per share. These MFP Shares were issued via private placement and are not publically available.
The Funds are obligated to redeem their MFP Shares by the date as specified in its offering documents (“Term Redemption Date”), unless earlier redeemed by the Funds. MFP Shares are initially issued in a pre-specified mode, however, MFP Shares can be subsequently designated as an alternative mode at a later date at the discretion of the Funds. The modes within MFP Shares detail the dividend mechanics and are described as follows. At a subsequent date, the Fund may establish additional mode structures with the MFP Share.
| • | Variable Rate Remarketed Mode (“VRRM”) – Dividends for MFP Shares within this mode will be established by a remarketing agent; therefore, market value of the MFP Shares is expected to approximate its liquidation preference. Shareholders have the ability to request a best-efforts tender of its shares upon seven days notice. If the remarketing agent is unable to identify an alternative purchaser, the shares will be retained by the share- holder requesting tender and the subsequent dividend rate will increase to its step-up dividend rate. If after one consecutive year of unsuccessful remarketing attempts, the Fund will be required to designate an alternative mode or redeem the shares.
Each Fund will pay a remarketing fee on the aggregate principal amount of all MFP Shares while designated in VRRM. Payments made by the Fund to the remarketing agent are recognized as “Remarketing fees” on the Statement of Operations. |
| • | Variable Rate Mode (“VRM”) – Dividends for MFP Shares designated in this mode are based upon a short-term index plus an additional fixed “spread” amount established at the time of issuance or renewal / conversion of its mode. At the end of the period of the mode, the Fund will be required to either extend the term of the mode, designate an alternative mode or redeem the MFP Shares.
The fair value of MFP Shares while in VRM are expected to approximate their liquidation preference so long as the fixed “spread” on the shares remains roughly in line with the “spread” being demanded by investors on instruments having similar terms in the current market. In current market conditions, the Adviser has determined that the fair value of the shares are approximately their liquidation preference, but their fair value could vary if market conditions change materially. |
| • | Variable Rate Demand Mode (“VRDM”) – Dividends for MFP Shares designated in this mode will be established by a remarketing agent; therefore, the market value of the MFP Shares is expected to approximate its liquidation preference. While in this mode, Shares will have an unconditional liquidity feature that enable its shareholders to require a liquidity provider, which the Fund has entered into a contractual agreement, to purchase shares in the event that the shares are not able to be successfully remarketed. In the event that shares within this mode are unable to be successfully remarketed and are purchased by the liquidity provider, the dividend rate will be the maximum rate which is designed to escalate according to a specified schedule in order to enhance the remarketing agent’s ability to successfully remarket the shares. Each Fund is required to redeem any shares that are still owned by a liquidity provider after six months of continuous, unsuccessful remarketing.
The Fund will pay a liquidity and remarketing fee on the aggregate principal amount of all MFP shares while within VRDM. Payments made by the Fund to the liquidity provider and remarketing agent are recognized as “Liquidity fees” and “Remarketing fees”, respectively, on the Statement of Operations. |
For financial reporting purposes, the liquidation preference of MFP Shares is recorded as a liability and is recognized as a component of “MuniFund Preferred (“MFP”) Shares, net of deferred offering costs” on the Statement of Assets and Liabilities. Dividends on the MFP shares are treated as interest payments for financial reporting purposes. Unpaid dividends on MFP shares are recognized as a component on “Interest payable” on the Statement of Assets and Liabilities. Dividends accrued on MFP Shares are recognized as a component of “Interest expense and amortization of offering costs” on the Statement of Operations.
Subject to certain conditions, MFP Shares may be redeemed, in whole or in part, at any time at the option of the Fund. The Fund may also be required to redeem certain MFP shares if the Fund fails to maintain certain asset coverage requirements and such failures are not cured by the applicable cure date. The redemption price per share in all circumstances is equal to the liquidation preference per share plus any accumulated but unpaid dividends.
NVG incurred offering costs of $1,540,000 in connection with its offering of MFP Shares, which were recorded as a deferred charge and are being amortized over the life of the shares. These offering costs are recognized as a component of “MuniFund Preferred (“MFP”) Shares, net of deferred offering costs” on the Statement of Assets and Liabilities and “Interest expense and amortization of offering costs” on the Statement of Operations.
In conjunction with NVG’s redemption of MFP Shares, deferred costs of $171,958 were expensed during the current fiscal period, as the redemption was deemed an extinguishment of debt.
As of the end of the reporting period, NVG and NZF had $403,797,156 and $639,973,963 of MFP Shares at liquidation preference, net of deferred offering costs, respectively. Further details of each Fund’s MFP Shares outstanding as of the end of the reporting period, were as follows:
153
Notes to Financial Statements (continued)
| | | | | | | |
| | | | | | Mode |
| | Shares | Liquidation | Term | | Termination |
| Fund | Series | Outstanding | Preference | Redemption Date | Mode | Date |
| NVG | A | 2,054 | $205,400,000 | January 3, 2028 | VRM | January 3, 2028* |
| B | 200,000 | 200,000,000 | March 1, 2029 | VRRM | N/A |
| NZF | A | 1,500 | $150,000,000 | May 1, 2047 | VRM | May 8, 2020 |
| B | 1,550 | 155,000,000 | February 3, 2048 | VRM | February 3, 2048* |
| C | 3,360 | 336,000,000 | June 1, 2048 | VRM | June 24, 2020 |
| |
* Subject to earlier termination by either the Fund or the holder. |
The average liquidation preference of MFP Shares outstanding and annualized dividend rate for the Funds during the current fiscal period were as follows:
| | | | | | | |
| | NVG | | | NZF | |
Average liquidation preference of MFP Shares outstanding | | $ | 405,400,000 | | | $ | 641,000,000 | |
Annualized dividend rate | | | 2.30 | % | | | 2.45 | % |
Variable Rate Demand Preferred Shares
The following Funds have issued and have outstanding Variable Rate Demand Preferred (“VRDP”) Shares, with a $100,000 liquidation preference per share. VRDP Shares are issued via private placement and are not publicly available.
As of the end of the reporting period, NVG and NZF had $1,407,881,715 and $722,295,855 of VRDP Shares at liquidation preference, net of deferred offering costs, respectively. Further details of the Funds’ VRDP Shares outstanding as of the end of the reporting period, were as follows:
| | | | | | |
| | Shares | Remarketing | Liquidation | |
| Fund | Series | Outstanding | Fee* | Preference | Maturity |
| NVG | 1 | 1,790 | 0.08% | $179,000,000 | December 1, 2043 |
| 2 | 3,854 | 0.10 | $385,400,000 | December 1, 2040 |
| 4 | 1,800 | 0.08 | $180,000,000 | June 1, 2046 |
| 5 | 3,405 | 0.10 | $340,500,000 | December 1, 2040 |
| 6 | 3,267 | 0.10 | $326,700,000 | December 1, 2040 |
| NZF | 1 | 2,688 | N/A | $268,800,000 | March 1, 2040 |
| 2 | 2,622 | N/A | $262,200,000 | March 1, 2040 |
| 3 | 1,960 | 0.05 | $196,000,000 | June 1, 2040 |
|
* | Remarketing fees as a percentage of aggregate principal amount of all VRDP Shares outstanding of each series. |
N/A | Not applicable. Series is considered to be Special Rate VRDP and therefore does not pay a remarketing fee. |
VRDP Shares include a liquidity feature that allows VRDP shareholders to have their shares purchased by a liquidity provider with whom each Fund has contracted in the event that the VRDP Shares are not able to be successfully remarketed. Each Fund is required to redeem any VRDP Shares that are still owned by the liquidity provider after six months of continuous, unsuccessful remarketing. Each Fund pays an annual remarketing fee on the aggregate principal amount of all VRDP Shares outstanding. Each Fund’s VRDP Shares have successfully remarketed since issuance.
NZF’s Series 1 and Series 2 VRDP Shares are considered to be Special Rate VRDP, which are sold to institutional investors. The special rate period will expire on March 1, 2040 for the Fund’s Series 1 and 2 VRDP Shares, but is subject to earlier termination by either the Fund or the holder. During the special rate period, the VRDP Shares will not be remarketed by a remarketing agent, be subject to optional or mandatory tender events, or be supported by a liquidity provider and are not subject to remarketing fees or liquidity fees. During the special rate period, VRDP dividends will be set monthly as a floating rate based on the predetermined formula. Following the initial special rate period, Special Rate Period VRDP Shares may transition to traditional VRDP Shares with dividends set at weekly remarketings, and be supported by designated liquidity provider, or the Board may approve a subsequent special rate period.
Dividends on the VRDP Shares (which are treated as interest payments for financial reporting purposes) are set at a rate established by a remarketing agent; therefore, the market value of the VRDP Shares is expected to approximate its liquidation preference. In the event that VRDP Shares are unable to be successfully remarketed, the dividend rate will be the maximum rate which is designed to escalate according to a specified schedule in order to enhance the remarketing agent’s ability to successfully remarket the VRDP Shares.
Subject to certain conditions, VRDP Shares may be redeemed, in whole or in part, at any time at the option of each Fund. Each Fund may also redeem certain of the VRDP Shares if the Fund fails to maintain certain asset coverage requirements and such failures are not cured by the applicable cure date. The redemption price per share is equal to the sum of the liquidation preference per share plus any accumulated but unpaid dividends.
154
The average liquidation preference of VRDP Shares outstanding and annualized dividend rate for each Fund during the current fiscal period were as follows:
| | | | | | | |
| | NVG | | | NZF | |
Average liquidation preference of VRDP Shares outstanding | | $ | 1,411,600,000 | | | $ | 727,000,000 | |
Annualized dividend rate | | | 1.69 | % | | | 2.36 | % |
For financial reporting purposes, the liquidation preference of VRDP Shares is a liability and is recognized as a component of “Variable Rate Demand Preferred (“VRDP”) Shares, net of deferred offering costs” on the Statement of Assets and Liabilities. Unpaid dividends on VRDP Shares are recognized as a component of “Interest payable” on the Statement of Assets and Liabilities, when applicable. Dividends accrued on VRDP Shares are recognized as a component of “Interest expense and amortization of offering costs” on the Statement of Operations. Costs incurred by the Funds in connection with their offerings of VRDP Shares were recorded as a deferred charge, which are amortized over the life of the shares and are recognized as a component of “Variable Rate Demand Preferred (“VRDP”) Shares, net of deferred offering costs” on the Statement of Assets and Liabilities and “Interest expense and amortization of offerings costs” on the Statement of Operations. In addition to interest expense, each Fund also pays a per annum liquidity fee to the liquidity provider, as well as a remarketing fee, which are recognized as “Liquidity fees” and “Remarketing fees,” respectively, on the Statement of Operations.
Preferred Share Transactions
Transactions in preferred shares for the Funds during the Funds’ current and prior fiscal period, where applicable, are noted in the following tables.
Transactions in AMTP Shares for the Funds, where applicable, were as follows:
| | | | |
| Year Ended October 31, 2018 |
| NMZ | Series | Shares | Amount |
AMTP Shares issued | 2028 | 870 | $87,000,000 |
Transactions in MFP Shares for the Funds, where applicable, were as follows:
| | | | |
| Year Ended October 31, 2019 |
| NVG | Series | Shares | Amount |
MFP Shares issued | B | 200,000 | $ 200,000,000 |
MFP Shares redeemed | A | (2,000) | (200,000,000) |
Net increase (decrease) | | 198,000 | $ — |
| | | | |
| Year Ended October 31, 2018 |
| NVG | Series | Shares | Amount |
MFP Shares issued | A | 4,054 | $405,400,000 |
| | | | |
| Year Ended October 31, 2018 |
| NZF | Series | Shares | Amount |
MFP Shares issued | B | 1,550 | $155,000,000 |
| C | 3,360 | $336,000,000 |
Transactions in VMTP Shares for the Funds, where applicable, were as follows:
| | | | |
| Year Ended October 31, 2018 |
| NVG | Series | Shares | Amount |
VMTP Shares redeemed | 2018 | (2,404) | $(240,400,000) |
| | | |
| Year Ended October 31, 2018 |
| NZF | Series | Shares | Amount |
VMTP Shares redeemed | 2019 | (3,360) | $(336,000,000) |
| | | |
| Year Ended October 31, 2018 |
| NMZ | Series | Shares | Amount |
VMTP Shares redeemed | 2018 | (870) | $(87,000,000) |
155
Notes to Financial Statements (continued)
6. Income Tax Information
Each Fund is a separate taxpayer for federal income tax purposes. Each Fund intends to distribute substantially all of its net investment income and net capital gains to shareholders and to otherwise comply with the requirements of Subchapter M of the Internal Revenue Code applicable to regulated investment companies. Therefore, no federal income tax provision is required. Furthermore, each Fund intends to satisfy conditions that will enable interest from municipal securities, which is exempt from regular federal income tax, to retain such tax-exempt status when distributed to shareholders of the Funds. Net realized capital gains and ordinary income distributions paid by the Funds are subject to federal taxation.
For all open tax years and all major taxing jurisdictions, management of the Funds has concluded that there are no significant uncertain tax positions that would require recognition in the financial statements. Open tax years are those that are open for examination by taxing authorities (i.e., generally the last four tax year ends and the interim tax period since then). Furthermore, management of the Funds is also not aware of any tax positions for which it is reasonably possible that the total amounts of unrecognized tax benefits will significantly change in the next twelve months.
The following information is presented on an income tax basis. Differences between amounts for financial statement and federal income tax purposes are primarily due to timing differences in recognizing taxable market discount, timing differences in recognizing certain gains and losses on investment transactions and the treatment of investments in inverse floating rate securities reflected as financing transactions, if any. To the extent that differences arise that are permanent in nature, such amounts are reclassified within the capital accounts as detailed below. Temporary differences do not require reclassification. Temporary and permanent differences do not impact the NAVs of the Funds.
The table below presents the cost and unrealized appreciation (depreciation) of each Fund’s investment portfolio, as determined on a federal income tax basis, as of October 31, 2019.
| | | | | | | | | | | | | |
| | NVG | | | NZF | | | NMZ | | | NMCO | |
Tax cost of investments | | $ | 4,641,264,395 | | | $ | 3,295,006,390 | | | $ | 939,725,116 | | | $ | 795,115,454 | |
Gross unrealized: | | | | | | | | | | | | | | | | |
| Appreciation | | $ | 578,375,751 | | | $ | 408,358,307 | | | $ | 113,459,522 | | | $ | 5,223,952 | |
| Depreciation | | | (5,191,852 | ) | | | (26,022,785 | ) | | | (34,670,047 | ) | | | (2,887,837 | ) |
Net unrealized appreciation (depreciation) of investments | | $ | 573,183,899 | | | $ | 382,335,522 | | | $ | 78,789,475 | | | $ | 2,336,115 | |
Permanent differences, primarily due to federal taxes paid, nondeductible offering costs, taxable market discount, and distribution reallocations, resulted in reclassifications among the Funds’ components of common share net assets as of October 31, 2019, the Funds’ tax year end.
The tax components of undistributed net tax-exempt income, net ordinary income and net long-term capital gains as of October 31, 2019, the Funds’ tax year end, were as follows:
| | | | | | | | | | | | | |
| | NVG | | | NZF | | | NMZ | | | NMCO | |
Undistributed net tax-exempt income1 | | $ | 805,374 | | | $ | — | | | $ | 8,938,892 | | | $ | 2,103,978 | |
Undistributed net ordinary income2 | | | 895,120 | | | | 544,785 | | | | 1,823,345 | | | | 36,108 | |
Undistributed net long-term capital gains | | | 7,412,763 | | | | — | | | | — | | | | — | |
| | |
1
| Undistributed net tax-exempt income (on a tax basis) has not been reduced for the dividend declared on October 1, 2019 and paid on November 1, 2019. |
2
| Net ordinary income consists of taxable market discount income and net short-term capital gains, if any. |
The tax character of distributions paid during the Funds’ tax years ended October 31, 2019 and October 31, 2018 was designated for purposes of the dividends paid deduction as follows:
| | | | | | | | | | | | | |
| 2019 | | NVG | | | NZF | | | NMZ | | | NMCO5 | |
Distributions from net tax-exempt income3 | | $ | 190,221,672 | | | $ | 143,023,900 | | | $ | 45,872,276 | | | $ | — | |
Distributions from net ordinary income2 | | | 2,107,685 | | | | 2,380,321 | | | | 1,266,915 | | | | — | |
Distributions from net long-term capital gains4 | | | 5,573,838 | | | | — | | | | — | | | | — | |
| | |
| 2018 | | | | | | NVG | | | NZF | | | NMZ | |
Distributions from net tax-exempt income | | | | | | $ | 201,231,024 | | | $ | 146,346,063 | | | $ | 49,242,889 | |
Distributions from net ordinary income2 | | | | | | | 1,195,062 | | | | 1,378,621 | | | | 579,883 | |
Distributions from net long-term capital gains | | | | | | | — | | | | — | | | | — | |
| | |
2
| Net ordinary income consists of taxable market discount income and net short-term capital gains, if any. |
| 3 | The Funds hereby designate these amounts paid during the fiscal year ended October 31, 2019, as Exempt Interest Dividends. |
| 4 | The Funds hereby designate as long-term capital gain dividend, pursuant to the Internal Revenue Code Section 852(b)(3), the amount necessary to reduce earnings and profits of the Funds related to net capital gain to zero for the year ended October 31, 2019. |
| 5 | For the period September 16, 2019 (commencement of operations) through October 31, 2019. |
156
As of October 31, 2019, the Funds’ tax year end, the following Funds had unused capital losses carrying forward available for federal income tax purposes to be applied against future capital gains, if any. The capital losses are not subject to expiration.
| | | | | | | | | | |
| | NZF6 | | | NMZ | | | NMCO | |
Not subject to expiration: | | | | | | | | | |
| Short-term | | $ | 18,798,593 | | | $ | 574,436 | | | $ | 279,799 | |
| Long-term | | | — | | | | 344,148 | | | | — | |
Total | | $ | 18,798,593 | | | $ | 918,584 | | | $ | 279,799 | |
| | |
6
| A portion of NZF’s capital loss carryforward is subject to an annual limitation under the Internal Revenue Code and related regulations. |
During the Funds’ tax year ended October 31, 2019, the following Funds utilized capital loss carryforwards as follows:
| | | | | | | |
| | NZF | | | NMZ | |
Utilized capital loss carryforwards | | $ | 12,251,952 | | | $ | 2,259,147 | |
7. Management Fees and Other Transactions with Affiliates
Management Fees
Each Fund’s management fee compensates the Adviser for overall investment advisory and administrative services and general office facilities. The Sub-Adviser is compensated for its services to the Funds from the management fees paid to the Adviser.
Each Fund’s management fee consists of two components – a fund-level fee, based only on the amount of assets within each individual Fund, and a complex-level fee, based on the aggregate amount of all eligible fund assets managed by the Adviser. This pricing structure enables Fund shareholders to benefit from growth in the assets within their respective Fund as well as from growth in the amount of complex-wide assets managed by the Adviser.
The annual fund-level fee, payable monthly, for each Fund is calculated according to the following schedules:
| | | | |
| | NVG | |
| | NZF | |
| Average Daily Managed Assets* | | Fund-Level Fee Rate | |
For the first $125 million | | | 0.5000 | % |
For the next $125 million | | | 0.4875 | |
For the next $250 million | | | 0.4750 | |
For the next $500 million | | | 0.4625 | |
For the next $1 billion | | | 0.4500 | |
For the next $3 billion | | | 0.4250 | |
For managed assets over $5 billion | | | 0.4125 | |
| | NMZ | |
| Average Daily Managed Assets* | | Fund-Level Fee Rate | |
For the first $125 million | | | 0.5500 | % |
For the next $125 million | | | 0.5375 | |
For the next $250 million | | | 0.5250 | |
For the next $500 million | | | 0.5125 | |
For the next $1 billion | | | 0.5000 | |
For the next $3 billion | | | 0.4750 | |
For managed assets over $5 billion | | | 0.4625 | |
| | NMCO | |
| Average Daily Managed Assets* | | Fund-Level Fee Rate | |
For the first $125 million | | | 0.7500 | % |
For the next $125 million | | | 0.7375 | |
For the next $250 million | | | 0.7250 | |
For the next $500 million | | | 0.7125 | |
For the next $1 billion | | | 0.7000 | |
For the next $3 billion | | | 0.6750 | |
For managed assets over $5 billion | | | 0.6625 | |
157
Notes to Financial Statements (continued)
The annual complex-level fee, payable monthly, for each Fund is calculated by multiplying the current complex-wide fee rate, determined according to the following schedule by the Fund’s daily managed assets:
| | | | |
| Complex-Level Eligible Asset Breakpoint Level* | | Effective Complex-Level Fee Rate at Breakpoint Level | |
$55 billion | | | 0.2000 | % |
$56 billion | | | 0.1996 | |
$57 billion | | | 0.1989 | |
$60 billion | | | 0.1961 | |
$63 billion | | | 0.1931 | |
$66 billion | | | 0.1900 | |
$71 billion | | | 0.1851 | |
$76 billion | | | 0.1806 | |
$80 billion | | | 0.1773 | |
$91 billion | | | 0.1691 | |
$125 billion | | | 0.1599 | |
$200 billion | | | 0.1505 | |
$250 billion | | | 0.1469 | |
$300 billion | | | 0.1445 | |
| |
| * For the complex-level fees, managed assets include closed-end fund assets managed by the Adviser that are attributable to certain types of leverage. For these purposes, leverage includes the funds’ use of preferred stock and borrowings and certain investments in the residual interest certificates (also called inverse floating rate securities) in tender option bond (TOB) trusts, including the portion of assets held by a TOB trust that has been effectively financed by the trust’s issuance of floating rate securities, subject to an agreement by the Adviser as to certain funds to limit the amount of such assets for determining managed assets in certain circumstances. The complex-level fee is calculated based upon the aggregate daily managed assets of all Nuveen open-end and closed-end funds that constitute “eligible assets.” Eligible assets do not include assets attributable to investments in other Nuveen funds or assets in excess of a determined amount (originally $2 billion) added to the Nuveen fund complex in connection with the Adviser’s assumption of the management of the former First American Funds effective January 1, 2011, but do not include certain Nuveen funds that were reorganized into funds advised by an affiliate of the Adviser during the 2019 calendar year. As of October 31, 2019, the complex-level fee for each Fund was 0.1566%. |
Other Transactions with Affiliates
Each Fund is permitted to purchase or sell securities from or to certain other funds managed by the Adviser (“inter-fund trade”) under specified conditions outlined in procedures adopted by the Board. These procedures have been designed to ensure that any inter-fund trade of securities by the Fund from or to another fund that is, or could be, considered an affiliate of the Fund under certain limited circumstances by virtue of having a common investment adviser (or affiliated investment adviser), common officer and/or common trustee complies with Rule 17a-7 of the 1940 Act. Further, as defined under these procedures, each inter-fund trade is effected at the current market price as provided by an independent pricing service. Unsettled inter-fund trades as of the end of the reporting period are recognized as a component of “Receivable for investments sold” and/or “Payable for investments purchased” on the Statement of Assets and Liabilities, when applicable.
During the current fiscal period, the following Funds engaged in inter-fund trades pursuant to these procedures as follows:
| | | | | | | | | | |
| Inter-Fund Trades | | NZF | | | NMZ | | | NMCO | |
Purchases | | $ | — | | | $ | — | | | $ | 3,228,540 | |
Sales | | | 19,368,199 | | | | 19,939,437 | | | | — | |
8. Borrowing Arrangements
Committed Line of Credit
The Funds, along with certain other funds managed by the Adviser (“Participating Funds”), have established a 364-day, $2.65 billion standby credit facility with a group of lenders, under which the Participating Funds may borrow for various purposes other than leveraging for investment purposes. Each Participating Fund is allocated a designated proportion of the facility’s capacity (and its associated costs, as described below) based upon a multi-factor assessment of the likelihood and frequency of its need to draw on the facility, the size of the Fund and its anticipated draws, and the potential importance of such draws to the operations and well-being of the Fund, relative to those of the other Funds. A Fund may effect draws on the facility in excess of its designated capacity if and to the extent that other Participating Funds have undrawn capacity. The credit facility expires in June 2020 unless extended or renewed.
The credit facility has the following terms: a fee of 0.15% per annum on unused commitment amounts, and interest at a rate equal to the higher of (a) one-month LIBOR (London Inter-Bank Offered Rate) plus 1.00% per annum or (b) the Fed Funds rate plus 1.00% per annum on amounts borrowed. Participating Funds paid administration, legal and arrangement fees, which are recognized as a component of “Other expenses” on the Statement of Operations, and along with commitment fees, have been allocated among such Participating Funds based upon the relative proportions of the facility’s aggregate capacity reserved for them and other factors deemed relevant by the Adviser and the Board of each Participating Fund.
158
During the current fiscal period, the following Funds utilized this facility. Each Fund’s maximum outstanding balance during the utilization period was as follows:
| | | | |
| NVG | NZF | NMZ |
Maximum outstanding balance | $21,500,000 | $35,500,000 | $19,700,000 |
During each Fund’s utilization period(s) during the current fiscal period, the average daily balance outstanding and average annual interest rate on the Borrowings were as follows:
| | | | |
| NVG | NZF | NMZ |
Utilization period (days outstanding) | 63 | 107 | 38 |
Average daily balance outstanding | $12,581,651 | $13,550,459 | $14,531,579 |
Average annual interest rate | 3.34% | 3.39% | 3.49% |
Borrowings outstanding as of the end of the reporting period are recognized as “Borrowings” on the Statement of Assets and Liabilities, where applicable.
Inter-Fund Borrowing and Lending
The SEC has granted an exemptive order permitting registered open-end and closed-end Nuveen funds to participate in an inter-fund lending facility whereby the Nuveen funds may directly lend to and borrow money from each other for temporary purposes (e.g., to satisfy redemption requests or when a sale of securities “fails,” resulting in an unanticipated cash shortfall) (the “Inter-Fund Program”). The closed-end Nuveen funds, including the Funds covered by this shareholder report, will participate only as lenders, and not as borrowers, in the Inter-Fund Program because such closed-end funds rarely, if ever, need to borrow cash to meet redemptions. The Inter-Fund Program is subject to a number of conditions, including, among other things, the requirements that (1) no fund may borrow or lend money through the Inter-Fund Program unless it receives a more favorable interest rate than is typically available from a bank or other financial institution for a comparable transaction; (2) no fund may borrow on an unsecured basis through the Inter-Fund Program unless the fund’s outstanding borrowings from all sources immediately after the inter-fund borrowing total 10% or less of its total assets; provided that if the borrowing fund has a secured borrowing outstanding from any other lender, including but not limited to another fund, the inter-fund loan must be secured on at least an equal priority basis with at least an equivalent percentage of collateral to loan value; (3) if a fund’s total outstanding borrowings immediately after an inter-fund borrowing would be greater than 10% of its total assets, the fund may borrow through the inter-fund loan on a secured basis only; (4) no fund may lend money if the loan would cause its aggregate outstanding loans through the Inter-Fund Program to exceed 15% of its net assets at the time of the loan; (5) a fund’s inter-fund loans to any one fund shall not exceed 5% of the lending fund’s net assets; (6) the duration of inter-fund loans will be limited to the time required to receive payment for securities sold, but in no event more than seven days; and (7) each inter-fund loan may be called on one business day’s notice by a lending fund and may be repaid on any day by a borrowing fund. In addition, a Nuveen fund may participate in the Inter-Fund Program only if and to the extent that such participation is consistent with the fund’s investment objective and investment policies. The Board is responsible for overseeing the Inter-Fund Program.
The limitations detailed above and the other conditions of the SEC exemptive order permitting the Inter-Fund Program are designed to minimize the risks associated with Inter-Fund Program for both the lending fund and the borrowing fund. However, no borrowing or lending activity is without risk. When a fund borrows money from another fund, there is a risk that the loan could be called on one day’s notice or not renewed, in which case the fund may have to borrow from a bank at a higher rate or take other actions to payoff such loan if an inter-fund loan is not available from another fund. Any delay in repayment to a lending fund could result in a lost investment opportunity or additional borrowing costs.
During the current reporting period, none of the Funds covered by this shareholder report have entered into any inter-fund loan activity.
9. Subsequent Events
Fund Merger
As noted in Note 1 – General Information, Fund Merger, before the opening of business on November 18, 2019 NTC merged into NVG.
Upon the closing of the Mergers, NTC transferred its assets to NVG in exchange for common and preferred shares of NVG and the assumption by NVG of the liabilities of NTC. NTC was then liquidated, dissolved and terminated in accordance with its Declaration of Trust. Shareholders of NTC became shareholders of NVG. Holders of common shares of NTC received newly issued common shares of NVG, the aggregate NAV of which is equal to the aggregate NAV of the common shares of NTC held immediately prior to the Merger (including for this purpose fractional Acquiring Fund shares to which shareholders would be entitled). Holders of preferred shares of NTC received on a one-for-one basis newly issued preferred shares of NVG, in exchange for preferred shares of NTC held immediately prior to the Merger.
Adjustable Rate MuniFund Term Preferred Shares
On November 18, 2019, NVG issued 1,120 Series AMTP Shares in connection with the merger of NTC into NVG.
159
Notes to Financial Statements (continued)
MuniFund Preferred Shares
On November 21, 2019, NMCO issued 1,000 Series A MFP Shares. The new MFP Shares were issued with terms establishing an initial Variable Rate Demand Mode and a term redemption date of October 1, 2031 subject to extension to no later than October 31, 2033.
On or around December 30, 2019, NMCO is expected to issue 2,250 Series B MFP Shares. The new MFP Shares will be issued with terms establishing an initial Variable Rate Mode and a term redemption date of October 1, 2031 subject to extension to not later than October 1, 2032.
160
Additional Fund Information (Unaudited)
| | | | | | |
| Board of Trustees | | | | | |
Margo Cook* | Jack B. Evans | William C. Hunter | Albin F. Moschner | John K. Nelson | Judith M. Stockdale |
Carole E. Stone | Terence J. Toth | Margaret L. Wolff | Robert L. Young | | |
|
* Interested Board Member.
|
|
|
| Fund Manager | Custodian | Legal Counsel | Independent Registered | Transfer Agent and |
Nuveen Fund Advisors, LLC | State Street Bank | Chapman and Cutler LLP | Public Accounting Firm | Shareholder Services |
333 West Wacker Drive | and Trust Company | Chicago, IL 60603 | KPMG LLP | | ComputerShare Trust |
Chicago, IL 60606 | One Lincoln Street | | 200 East | | Company, N.A. |
| Boston, MA 02111 | | Randolph Street | 250 Royall Street |
| | | Chicago, IL 60601 | Canton, MA 02021 |
| | | | | (800) 257-8787 |
Portfolio of Investments Information
Each Fund is required to file its complete schedule of portfolio holdings with the Securities and Exchange Commission (SEC) for the first and third quarters of each fiscal year as an exhibit to its report on Form N-PORT. You may obtain this information on the SEC’s website at http://www.sec.gov.
Nuveen Funds’ Proxy Voting InformationYou may obtain (i) information regarding how each fund voted proxies relating to portfolio securities held during the most recent twelve-month period ended June 30, without charge, upon request, by calling Nuveen toll-free at (800) 257-8787 or on Nuveen’s website at www.nuveen.com and (ii) a description of the policies and procedures that each fund used to determine how to vote proxies relating to portfolio securities without charge, upon request, by calling Nuveen toll free at (800) 257-8787. You may also obtain this information directly from the SEC. Visit the SEC on-line at http://www.sec.gov.
CEO Certification DisclosureEach Fund’s Chief Executive Officer (CEO) has submitted to the New York Stock Exchange (NYSE) the annual CEO certification as required by Section 303A.12(a) of the NYSE Listed Company Manual. Each Fund has filed with the SEC the certification of its CEO and Chief Financial Officer required by Section 302 of the Sarbanes-Oxley Act.
Common Share RepurchasesEach Fund intends to repurchase, through its open-market share repurchase program, shares of its own common stock at such times and in such amounts as is deemed advisable. During the period covered by this report, each Fund repurchased shares of its common stock as shown in the accompanying table. Any future repurchases will be reported to shareholders in the next annual or semi-annual report.
| | | | |
| NVG | NZF | NMZ |
Common shares repurchased | — | — | — |
FINRA BrokerCheck
The Financial Industry Regulatory Authority (FINRA) provides information regarding the disciplinary history of FINRA member firms and associated investment professionals. This information as well as an investor brochure describing FINRA BrokerCheck is available to the public by calling the FINRA BrokerCheck Hotline number at (800) 289-9999 or by visiting www.FINRA.org.
Glossary of Terms Used in this Report (Unaudited)
| ■ | Average Annual Total Return: This is a commonly used method to express an investment’s performance over a particular, usually multi-year time period. It expresses the return that would have been necessary each year to equal the investment’s actual cumula- tive performance (including change in NAV or market price and reinvested dividends and capital gains distributions, if any) over the time period being considered. |
| ■ | Duration: Duration is a measure of the expected period over which a bond’s principal and interest will be paid, and consequently is a measure of the sensitivity of a bond’s or bond fund’s value to changes when market interest rates change. Generally, the longer a bond’s or fund’s duration, the more the price of the bond or fund will change as interest rates change. |
| ■ | Effective Leverage: Effective leverage is a fund’s effective economic leverage, and includes both regulatory leverage (see leverage) and the leverage effects of certain derivative investments in the fund’s portfolio. Currently, the leverage effects of Tender Option Bond (TOB) inverse floater holdings are included in effective leverage values, in addition to any regulatory leverage. |
| ■ | Forward Interest Rate Swap: A contractual agreement between two counterparties under which one party agrees to make peri- odic payments to the other for an agreed period of time based on a fixed rate, while the other party agrees to make periodic payments based on a floating rate of interest based on an underlying index. Alternatively, both series of cash flows to be exchanged could be calculated using floating rates of interest but floating rates that are based upon different underlying indexes. |
| ■ | Gross Domestic Product (GDP): The total market value of all final goods and services produced in a country/region in a given year, equal to total consumer, investment and government spending, plus the value of exports, minus the value of imports. |
| ■ | Industrial Development Revenue Bond (IDR): A unique type of revenue bond issued by a state or local government agency on behalf of a private sector company and intended to build or acquire factories or other heavy equipment and tools. |
| ■ | Inverse Floating Rate Securities: Inverse floating rate securities, also known as inverse floaters or tender option bonds (TOBs), are created by depositing a municipal bond, typically with a fixed interest rate, into a special purpose trust. This trust, in turn, (a) issues floating rate certificates typically paying short-term tax-exempt interest rates to third parties in amounts equal to some fraction of the deposited bond’s par amount or market value, and (b) issues an inverse floating rate certificate (sometimes referred to as an “inverse floater”) to an investor (such as a fund) interested in gaining investment exposure to a long-term municipal bond. The income received by the holder of the inverse floater varies inversely with the short-term rate paid to the floating rate certificates’ holders, and in most circumstances the holder of the inverse floater bears substantially all of the underlying bond’s downside investment risk. The holder of the inverse floater typically also benefits disproportionately from any potential appreciation of the underlying bond’s value.
Hence, an inverse floater essentially represents an investment in the underlying bond on a leveraged basis. |
| ■ | Leverage: Leverage is created whenever a fund has investment exposure (both reward and/or risk) equivalent to more than 100% of the investment capital. |
162
| ■ | NVG and NZF Custom Blended Fund Performance Benchmark: The Fund Performance Benchmark is an unleveraged index consisting of the returns of the S&P Municipal Bond Index prior to 4/11/16 and thereafter the returns of an 60%/40% blend of the S&P Municipal Bond Investment Grade Index and the S&P Municipal Bond High Yield Index, respectively. The S&P Municipal Bond Index is an unmanaged, market value-weighted index designed to measure the performance of tax-exempt municipal bonds. The S&P Municipal Bond Investment Grade Index is an unmanaged, market value-weighted index designed to measure the perform- ance of tax-exempt municipal bonds rated investment grade by Standard & Poor’s, Moody’s and/or Fitch. The S&P Municipal Bond High Yield Index is an unmanaged, market value-weighted index designed to measure the performance of the tax-exempt, high yield municipal bonds. Index returns assume compounding and do not include the effects of any fees or expenses. |
| ■ | Net Asset Value (NAV) Per Share: A fund’s Net Assets is equal to its total assets (securities, cash, accrued earnings and receivables) less its total liabilities. NAV per share is equal to the fund’s Net Assets divided by its number of shares outstanding. |
| ■ | Pre-Refunding: Pre-Refunding, also known as advanced refundings or refinancings, is a procedure used by state and local govern- ments to refinance municipal bonds to lower interest expenses. The issuer sells new bonds with a lower yield and uses the proceeds to buy U.S. Treasury securities, the interest from which is used to make payments on the higher-yielding bonds. Because of this collateral, pre-refunding generally raises a bond’s credit rating and thus its value. |
| ■ | Regulatory Leverage: Regulatory leverage consists of preferred shares issued by or borrowings of a fund. Both of these are part of a fund’s capital structure. Regulatory leverage is subject to asset coverage limits set in the Investment Company Act of 1940. |
| ■ | S&P Municipal Bond High Yield Index: An unleveraged, market value-weighted index designed to measure the performance of the tax-exempt, investment grade U.S. high yield municipal bond market. Index returns assume reinvestment of distributions, but do not reflect any applicable sales charges or management fees. |
| ■ | S&P Municipal Bond Index: An unleveraged, market value-weighted index designed to measure the performance of the tax- exempt, investment-grade U.S. municipal bond market. Index returns assume reinvestment of distributions, but do not reflect any applicable sales charges or management fees. |
| ■ | The S&P Municipal Yield Index: An unleveraged, market value-weighted index containing all bonds in the S&P Municipal Bond Index that are non-rated bonds or whose ratings are BB+ by S&P and BA-1 by Moody’s Investors Service, Inc. or lower. This index does not contain bonds that are pre-refunded or escrowed to maturity. Index returns assume reinvestment of distributions, but do not reflect any applicable sales charges or management fees. |
| ■ | Total Investment Exposure: Total investment exposure is a fund’s assets managed by the Adviser that are attributable to financial leverage. For these purposes, financial leverage includes a fund’s use of preferred stock and borrowings and investments in the resid- ual interest certificates (also called inverse floating rate securities) in tender option bond (TOB) trusts, including the portion of assets held by a TOB trust that has been effectively financed by the trust’s issuance of floating rate securities. |
| ■ | Zero Coupon Bond: A zero coupon bond does not pay a regular interest coupon to its holders during the life of the bond. Income to the holder of the bond comes from accretion of the difference between the original purchase price of the bond at issuance and the par value of the bond at maturity and is effectively paid at maturity. The market prices of zero coupon bonds generally are more volatile than the market prices of bonds that pay interest periodically. |
163
Reinvest Automatically, Easily and Conveniently
Nuveen makes reinvesting easy. A phone call is all it takes to set up your reinvestment account.
Nuveen Closed-End Funds Automatic Reinvestment PlanNuveen Closed-End Fund allows you to conveniently reinvest distributions in additional Fund shares. By choosing to reinvest, you’ll be able to invest money regularly and automatically, and watch your investment grow through the power of compounding. Just like distributions in cash, there may be times when income or capital gains taxes may be payable on distributions that are reinvested. It is important to note that an automatic reinvestment plan does not ensure a profit, nor does it protect you against loss in a declining market.
Easy and convenient
To make recordkeeping easy and convenient, each month you’ll receive a statement showing your total distributions, the date of investment, the shares acquired and the price per share, and the total number of shares you own.
How shares are purchased
The shares you acquire by reinvesting will either be purchased on the open market or newly issued by the Fund. If the shares are trading at or above net asset value at the time of valuation, the Fund will issue new shares at the greater of the net asset value or 95% of the then-current market price. If the shares are trading at less than net asset value, shares for your account will be purchased on the open market. If the Plan Agent begins purchasing Fund shares on the open market while shares are trading below net asset value, but the Fund’s shares subsequently trade at or above their net asset value before the Plan Agent is able to complete its purchases, the Plan Agent may cease open-market purchases and may invest the uninvested portion of the distribution in newly-issued Fund shares at a price equal to the greater of the shares’ net asset value or 95% of the shares’ market value on the last business day immediately prior to the purchase date. Distributions received to purchase shares in the open market will normally be invested shortly after the distribution payment date. No interest will be paid on distributions awaiting reinvestment. Because the market price of the shares may increase before purchases are completed, the average purchase price per share may exceed the market price at the time of valuation, resulting in the acquisition of fewer shares than if the distribution had been paid in shares issued by the Fund. A pro rata portion of any applicable brokerage commissions on open market purchases will be paid by Plan participants. These commissions usually will be lower than those charged on individual transactions.
Flexible
You may change your distribution option or withdraw from the Plan at any time, should your needs or situation change. You can reinvest whether your shares are registered in your name, or in the name of a brokerage firm, bank, or other nominee. Ask your investment advisor if his or her firm will participate on your behalf. Participants whose shares are registered in the name of one firm may not be able to transfer the shares to another firm and continue to participate in the Plan. The Fund reserves the right to amend or terminate the Plan at any time. Although the Fund reserves the right to amend the Plan to include a service charge payable by the participants, there is no direct service charge to participants in the Plan at this time.
Call today to start reinvesting distributions
For more information on the Nuveen Automatic Reinvestment Plan or to enroll in or withdraw from the Plan, speak with your financial advisor or call us at (800) 257-8787.
164
Annual Investment Management Agreement Approval Process (Unaudited)
The Board of Trustees (each, a “Board,” and each Trustee, a “Board Member”) of each Fund, including the Board Members who are not “interested persons” (as defined under the Investment Company Act of 1940 (the “1940 Act”)) (the “Independent Board Members”), is responsible for determining whether to initially approve or, after an initial term, to renew, the advisory arrangements of its respective Fund. A discussion of the Board’s most recent approval of the renewal of the advisory arrangements for each Fund other than Nuveen Municipal Credit Opportunities Fund is set forth in Part I below. The advisory arrangements for Nuveen Municipal Credit Opportunities Fund have not yet been up for renewal. A discussion of the Board’s initial approval of the advisory arrangements for Nuveen Municipal Credit Opportunities Fund is set forth in Part II below.
PART I
Nuveen AMT-Free Municipal Credit Income Fund
Nuveen Municipal Credit Income Fund
Nuveen Municipal High Income Opportunity Fund
At a meeting held on May 21-23, 2019 (the “May Meeting”), the Board of each Fund (as defined below), including the Independent Board Members, approved, for its respective Fund, the renewal of the management agreement (for purposes of this Part I, each, an “Investment Management Agreement”) with Nuveen Fund Advisors, LLC (the “Adviser”) pursuant to which the Adviser serves as investment adviser to such Fund and the sub-advisory agreement (for purposes of this Part I, each, a “Sub-Advisory Agreement”) with Nuveen Asset Management, LLC (the “Sub-Adviser”) pursuant to which the Sub-Adviser serves as the sub-adviser to such Fund. For purposes of this Part I, the following are the “Funds”: Nuveen AMT-Free Municipal Credit Income Fund (the “AMT-Free Municipal Credit Fund”); Nuveen Municipal Credit Income Fund (the “Municipal Credit Fund”); and Nuveen Municipal High Income Opportunity Fund (the “Municipal High Income Fund”). Following an initial two-year period, the Board, including the Independent Board Members, is required under the 1940 Act to review and approve each Investment Management Agreement and Sub-Advisory Agreement on behalf of the applicable Fund on an annual basis. For purposes of this Part I, the Investment Management Agreements and Sub-Advisory Agreements are collectively referred to as the “Advisory Agreements” and the Adviser and the Sub-Adviser are collectively, the “Fund Advisers” and each, a “Fund Adviser.”
In response to a request on behalf of the Independent Board Members by independent legal counsel, the Board received and reviewed prior to the May Meeting extensive materials specifically prepared for the annual review of Advisory Agreements by the Adviser as well as by Broadridge Financial Solutions, Inc. (“Broadridge”), an independent provider of investment company data. The materials provided in connection with the annual review covered a breadth of subject matter including, but not limited to, a description of the nature, extent and quality of services provided by the Fund Advisers; a review of the Sub-Adviser and investment team; an analysis of fund performance in absolute terms and as compared to the performance of certain peer funds and benchmarks with a focus on any performance outliers; an analysis of the fees and expense ratios of the Nuveen funds in absolute terms and as compared to those of certain peer funds with a focus on any expense outliers; a description of portfolio manager compensation; a review of the secondary market trading of shares of the Nuveen closed-end funds (including, among other things, an analysis of performance, distribution and valuation and capital raising trends in the broader closed-end fund market and in particular with respect to Nuveen closed-end funds; a review of the leverage management actions taken on behalf of the Nuveen closed-end funds and their resulting impact on performance; and a description of the distribution management process and any capital management activities); a review of the performance of various service providers; a description of various initiatives Nuveen had undertaken or continued during the year for the benefit of particular fund(s) and/or the complex; a description of the profitability or financial data of Nuveen and the Sub-Adviser; and a description of indirect benefits received by the Fund Advisers as a result of their relationships with the Nuveen funds. The Board Members held an in-person meeting on April 17-18, 2019 (the “April Meeting”), in part, to review
165
Annual Investment Management Agreement Approval Process (Unaudited) (continued)
and discuss the performance of the Nuveen funds and the Adviser’s evaluation of the various sub-advisers to the Nuveen funds. The Independent Board Members asked questions and requested additional information that was provided for the May Meeting.
The information prepared specifically for the annual review of the Advisory Agreements supplemented the information provided to the Board and its committees throughout the year. The Board and its committees met regularly during the year and the information provided and topics discussed were relevant to the review of the Advisory Agreements. Some of these reports and other data included, among other things, materials that outlined the investment performance of the Nuveen funds; strategic plans of the Adviser which may impact the services it provides to the Nuveen funds; the review of the Nuveen funds and applicable investment teams; the management of leverage financing for closed-end funds; the secondary market trading of the closed-end funds and any actions to address discounts; compliance, regulatory and risk management matters; the trading practices of the various sub-advisers; valuation of securities; fund expenses; and overall market and regulatory developments. The Board further continued its practice of seeking to meet periodically with the various sub-advisers to the Nuveen funds and their investment teams, when feasible. The Independent Board Members considered the review of the Advisory Agreements to be an ongoing process and employed the accumulated information, knowledge, and experience the Board Members had gained during their tenure on the boards governing the Nuveen funds and working with the Fund Advisers in their review of the Advisory Agreements. The contractual arrangements are a result of multiple years of review, negotiation and information provided in connection with the boards’ annual review of the Nuveen funds’ advisory arrangements and oversight of the Nuveen funds.
The Independent Board Members were advised by independent legal counsel during the annual review process as well as throughout the year, including meeting in executive sessions with such counsel at which no representatives from the Adviser or the Sub-Adviser were present. In connection with their annual review, the Independent Board Members also received a memorandum from independent legal counsel outlining their fiduciary duties and legal standards in reviewing the Advisory Agreements.
In deciding to renew the Advisory Agreements, the Independent Board Members did not identify a particular factor or information as determinative or controlling, but rather the decision reflected the comprehensive consideration of all the information provided, and each Board Member may have attributed different levels of importance to the various factors and information considered in connection with the approval process. The following summarizes the principal factors and information, but not all the factors, the Board considered in deciding to renew the Advisory Agreements and its conclusions.
A. Nature, Extent and Quality of Services
In evaluating the renewal of the Advisory Agreements, the Independent Board Members received and considered information regarding the nature, extent and quality of the applicable Fund Adviser’s services provided to the respective Fund with particular focus on the services and enhancements to such services provided during the last year. The Board recognized that the Adviser provides a comprehensive set of services necessary to operate the Nuveen funds in a highly regulated industry and noted that the scope of such services has expanded over the years as a result of regulatory, market and other developments, such as the development of the liquidity management program and expanded compliance programs. Some of the functions the Adviser is responsible for include, but are not limited to: product management (such as analyzing a fund’s position in the marketplace, setting dividends, preparing shareholder and intermediary communications and other due diligence support); investment oversight (such as analyzing fund performance, sub-advisers and investment teams and analyzing trade executions of portfolio transactions, soft dollar practices and securities lending activities); securities valuation services (such as executing the daily valuation process for portfolio securities and developing and recommending changes to valuation policies and procedures); risk management (such as overseeing operational and investment risks, including stress testing); fund administration (such as preparing fund tax returns and other tax compliance services, overseeing the Nuveen funds’ independent public accountants and other service providers; managing fund budgets and expenses; and helping to fulfill the funds’ regulatory filing requirements); oversight of shareholder services and transfer agency functions (such as oversight and liaison of transfer agent service providers which include registered shareholder customer service and transaction processing); Board relations services
166
(such as organizing and administering Board and committee meetings, preparing various reports to the Board and committees and providing other support services); compliance and regulatory oversight services (such as developing and maintaining a compliance program to ensure compliance with applicable laws and regulations, monitoring compliance with applicable fund policies and procedures and adherence to investment restrictions, and evaluating the compliance programs of the Nuveen fund sub-advisers and certain other service providers); legal support and oversight of outside law firms (such as with respect to filing and updating registration statements; maintaining various regulatory registrations; and providing legal interpretations regarding fund activities, applicable regulations and implementation of policies and procedures); and leverage, capital and distribution management services. In reviewing the scope and quality of services, the Board recognized the continued efforts and resources the Adviser and its affiliates have employed to continue to enhance their services for the benefit of the complex as well as particular Nuveen funds over recent years. Such service enhancements have included, but are not limited to:
| | ● | Fund Improvements and Product Management Initiatives – continuing to proactively manage the Nuveen fund complex as a whole and at the individual fund level with an aim to enhance the shareholder outcomes through, among other things, repositioning funds, merging funds, reviewing and updating investment policies and benchmarks, modifying the composition of certain portfolio management teams and analyzing various data to help devise such improvements; |
| ● | Capital Initiatives – continuing to invest capital to support new funds with initial capital as well as to facilitate modifications to the strategies or structure of existing funds; |
| | ● | Compliance Program Initiatives – continuing efforts to enhance the compliance program through, among other things, internally integrating various portfolio management teams and aligning compliance support accordingly, completing a comprehensive review of existing policies and procedures and revising such policies and procedures as appropriate, enhancing compliance-related technologies and workflows, and optimizing compliance shared services across the organization and affiliates; |
| | ● | Risk Management and Valuation Services - continuing efforts to strengthen the risk management functions, including through, among other things, enhancing the interaction and reporting between the investment risk management team and various affiliates, increasing the efficiency of risk monitoring performed on the Nuveen funds through improved reporting, continuing to implement risk programs designed to provide a more disciplined and consistent approach to identifying and mitigating operational risks, continuing progress on implementing a liquidity program that complies with the new liquidity regulatory requirements and continuing to oversee the daily valuation process; |
| | ● | Additional Compliance Services – continuing investment of time and resources necessary to develop the compliance policies and procedures and other related tools necessary to meet the various new regulatory requirements affecting the Nuveen funds that have been adopted over recent years; |
| | ● | Government Relations – continuing efforts of various Nuveen teams and affiliates to advocate and communicate their positions with lawmakers and other regulatory bodies on issues that will impact the Nuveen funds; |
| | ● | Business Continuity, Disaster Recovery and Information Services – establishing an information security program to help identify and manage information security risks, periodically testing disaster recovery plans, maintaining and updating business continuity plans and providing reports to the Board, at least annually, addressing, among other things, management’s security risk assessment, cyber risk profile, incident tracking and other relevant information technology risk-related reports; |
| | ● | Expanded Dividend Management Services – continuing to expand the services necessary to manage the dividends among the varying types of Nuveen funds that have developed as the Nuveen complex has grown in size and scope; and |
| | ● | with respect specifically to closed-end funds, such initiatives also included: |
| | ●● | Leverage Management Services – continuing to actively manage leverage including developing new leverage instruments, refinancing existing leverage and negotiating reductions in associated leverage expenses; |
167
Annual Investment Management Agreement Approval Process (Unaudited) (continued)
| | ●● | Capital Management Services – ongoing capital management efforts through a share repurchase program as well as a shelf offering program that raises additional equity capital in seeking to enhance shareholder value; |
| | ●● | Data and Market Analytics – continuing focus on analyzing data and market analytics to better understand the ownership cycles and secondary market experience of closed-end funds; and |
| | ●● | Closed-end Fund Investor Relations Program – maintaining the closed-end fund investor relations program which, among other things, raises awareness, provides educational materials and cultivates advocacy for closed-end funds and the Nuveen closed-end fund product line. |
In addition to the services provided by the Adviser, the Board also considered the risks borne by the Adviser and its affiliates in managing the Nuveen funds, including entrepreneurial, operational, reputational, regulatory and litigation risks.
The Board further considered the division of responsibilities between the Adviser and the Sub-Adviser and recognized that the Sub-Adviser and its investment personnel generally are responsible for the management of each Fund’s portfolio. The Board noted that the Adviser oversees the Sub-Adviser and considered an analysis of the Sub-Adviser provided by the Adviser which included, among other things, the Sub-Adviser’s assets under management and changes thereto, a summary of the investment team and changes thereto, the investment approach of the team and the performance of the funds sub-advised by the Sub-Adviser over various periods. The Board further considered at the May Meeting or prior meetings evaluations of the Sub-Adviser’s compliance program and trade execution. The Board noted that the Adviser recommended the renewal of the Sub-Advisory Agreements.
Based on its review, the Board determined, in the exercise of its reasonable business judgment, that it was satisfied with the nature, extent and quality of services provided to the respective Funds under each applicable Advisory Agreement.
B. The Investment Performance of the Funds and Fund Advisers
In evaluating the quality of the services provided by the Fund Advisers, the Board also received and considered the investment performance of the Nuveen funds they advise. In this regard, the Board reviewed Fund performance over the quarter, one-, three- and five-year periods ending December 31, 2018 as well as performance data for the first quarter of 2019 ending March 29, 2019. Unless otherwise indicated, the performance data referenced below reflects the periods ended December 31, 2018. The Board considered the Adviser’s analysis of each fund’s performance, with particular focus on funds that were considered performance outliers and the factors contributing to their performance. The Board also noted that it received performance data of the Nuveen funds during its quarterly meetings throughout the year and took into account the discussions that occurred at these Board meetings regarding fund performance. In this regard, in its evaluation of Nuveen fund performance at meetings throughout the year, the Board considered performance information for the funds for different time periods, both absolute and relative to appropriate benchmarks and peers, with particular attention to information indicating underperformance of the respective funds and discussed with the Adviser the reasons for such underperformance.
The Board reviewed both absolute and relative fund performance during the annual review. With respect to the latter, the Board considered fund performance in comparison to the performance of peer funds (the “Performance Peer Group”) and recognized and/or customized benchmarks (i.e., generally benchmarks derived from multiple recognized benchmarks). In considering performance data, the Board is aware of certain inherent limitations with such data, including that differences between the objective(s), strategies and other characteristics of the Nuveen funds compared to the respective Performance Peer Group and/or benchmark(s) (such as differences in the use of leverage) will necessarily contribute to differences in performance results and limit the value of the comparative information. To assist the Board in its review of the comparability of the relative performance, the Adviser has ranked the relevancy of the peer group to the funds as low, medium or high. Depending on the facts and circumstances, however, the Board may be satisfied with a fund’s performance notwithstanding that its performance may be below its benchmark or peer group for certain periods. In addition, the performance data may vary significantly depending on the end date selected, and shareholders may evaluate fund performance based on their own holding period which may differ
168
from the performance periods reviewed by the Board leading to different results. Further, the Board considered a fund’s performance in light of the overall financial market conditions during the respective periods. As noted above, the Board reviewed, among other things, Nuveen fund performance over various periods ended December 31, 2018, and the Board was aware of the market decline in the fourth quarter of 2018 and considered performance from the first quarter of 2019 as well. The Board also noted that a shorter period of underperformance may significantly impact longer term performance.
In addition to the foregoing, the Board recognized the importance of secondary market trading to shareholders and considered the evaluation of premiums and discounts at which the shares of the Nuveen closed-end funds trade to be a continuing priority for the Board. The Board and/or its Closed-end Fund committee consider premium and discount data at each quarterly meeting throughout the year as well as during the annual review.
In their review of performance, the Independent Board Members focused, in particular, on the Adviser’s analysis of Nuveen funds determined to be underperforming performance outliers. The Board recognized that some periods of underperformance may only be temporary while other periods of underperformance may indicate a broader issue that may require a corrective action. Accordingly, with respect to any Nuveen funds for which the Board had identified performance issues, the Board monitors such funds closely until performance improves, discusses with the Adviser the reasons for such results, considers whether any steps are necessary or appropriate to address such issues, and reviews the results of any efforts undertaken.
The Board’s determinations with respect to each Fund are summarized below.
For the AMT-Free Municipal Credit Fund, the Board noted that the Fund ranked in the second quartile of its Performance Peer Group for the one-year period and first quartile for the three- and five-year periods. In its review, the Board, however, noted that the Performance Peer Group was classified as low for relevancy. In addition, although the Fund’s performance was below the performance of its blended benchmark for the one-year period, the Fund outperformed its blended benchmark for the three-and five-year periods. The Board was satisfied with the Fund’s overall performance.
For the Municipal Credit Fund, the Board noted that the Fund ranked in the second quartile of its Performance Peer Group for the one-year period and first quartile for the three- and five-year periods. In its review, the Board, however, noted that the Performance Peer Group was classified as low for relevancy. In addition, although the Fund’s performance was below the performance of its blended benchmark for the one-year period, the Fund outperformed its blended benchmark for the three-and five-year periods. The Board was satisfied with the Fund’s overall performance.
For the Municipal High Income Fund, the Board noted that although the Fund ranked in the fourth quartile of its Performance Peer Group for the one-year period, the Fund ranked in the first quartile for the three- and five-year periods. In addition, although the Fund’s performance was below the performance of its benchmark for the one- and three-year periods, the Fund outperformed its benchmark for the five-year period. The Board was satisfied with the Fund’s overall performance.
C. Fees, Expenses and Profitability
1. Fees and Expenses
In its annual review, the Board considered the fees paid to the Fund Advisers and the total operating expense ratio of each Nuveen fund. More specifically, the Independent Board Members reviewed, among other things, each fund’s gross and net management fee rates and net total expense ratio in relation to those of a comparable universe of funds (the “Peer Universe”) established by Broadridge. The Independent Board Members reviewed the methodology Broadridge employed to establish its Peer Universe and recognized that differences between the applicable fund and its respective Peer Universe as well as changes to the composition of the Peer Universe from year to year may limit some of the value of the comparative data. The Independent Board Members also considered a fund’s operating expense ratio as it more directly reflected the shareholder’s costs in investing in the respective fund.
169
Annual Investment Management Agreement Approval Process (Unaudited) (continued)
In their review, the Independent Board Members considered, in particular, each fund with a net expense ratio (excluding investment-related costs of leverage) of six basis points or higher compared to that of its peer average (each, an “Expense Outlier Fund”), including the Municipal Credit Fund, and an analysis as to the factors contributing to each such fund’s higher relative net expense ratio. In addition, although the Board reviewed a fund’s total net expenses both including and excluding investment-related expenses (i.e., leverage costs) and taxes for certain of the closed-end funds, the Board recognized that leverage expenses will vary across the Nuveen funds and in comparison to peers because of differences in the forms and terms of leverage employed by the respective fund. Accordingly, in reviewing the comparative data between a fund and its peers, the Board generally considered the fund’s net expense ratio and fees (excluding leverage costs and leveraged assets) to be higher if they were over 10 basis points higher, slightly higher if they were 6 to 10 basis points higher, in line if they were within approximately 5 basis points higher than the peer average and below if they were below the peer average of the Peer Universe. The Independent Board Members also considered, in relevant part, a fund’s net management fee and net total expense ratio in light of its performance history.
In their review of the fee arrangements for the Nuveen funds, the Independent Board Members considered the management fee schedules, including the complex-wide and fund-level breakpoint schedules, as applicable. The Board noted that across the Nuveen fund complex, the complex-wide fee breakpoints reduced fees by $51.5 million and fund-level breakpoints reduced fees by $55.1 million in 2018.
With respect to the Sub-Adviser, the Board considered the sub-advisory fee paid to the Sub-Adviser, including any breakpoint schedule, and as described below, comparative data of the fees the Sub-Adviser charges to other clients, if any.
The Independent Board Members noted that: (a) the AMT-Free Municipal Credit Fund and the Municipal High Income Fund each had a net management fee higher than its peer average, but a net expense ratio in line with its peer average; and (b) the Municipal Credit Fund had a net management fee higher than its peer average and a net expense ratio slightly higher than its peer average. The Independent Board Members noted that the Municipal Credit Fund’s net expense ratio increased in 2018 as a result of increased management fees resulting from an increase in leverage for such Fund. Based on its review of the information provided, the Board determined that each Fund’s management fees (as applicable) to a Fund Adviser were reasonable in light of the nature, extent and quality of services provided to the Fund.
2. Comparisons with the Fees of Other Clients
In determining the appropriateness of fees, the Board also reviewed information regarding the fee rates the respective Fund Advisers charged to certain other types of clients and the type of services provided to these other clients. With respect to the Adviser and/or the Sub-Adviser, such other clients may include retail and institutional managed accounts, passively managed exchange-traded funds sub-advised by the Sub-Adviser but that are offered by another fund complex and municipal managed accounts offered by an unaffiliated adviser. With respect to the Sub-Adviser, the Board reviewed, among other things, the fee range and average fee of municipal retail wrap accounts and municipal institutional accounts.
In addition to the comparative fee data, the Board also reviewed, among other things, a description of the different levels of services provided to certain other clients compared to the services provided to the Nuveen funds as well as the differences in portfolio investment policies, investor profiles, account sizes and regulatory requirements, all of which contribute to the variations in the fee schedules. The Board noted, among other things, the wide range of services in addition to investment management services provided to the Nuveen funds when the Adviser is principally responsible for all aspects of operating the funds, including the increased regulatory requirements that must be met in managing the funds, the larger account sizes of managed accounts and the increased entrepreneurial, legal and regulatory risks that the Adviser incurs in sponsoring and managing the funds. In general, higher fee levels reflect higher levels of service provided by the Adviser, increased investment management complexity, greater product management requirements, and higher levels of business risk or some combination of these factors. The Board further considered that the Sub-Adviser’s fee is essentially for portfolio management services and therefore more comparable to the fees it receives for retail wrap accounts and other external sub-advisory mandates. The Board
170
concluded the varying levels of fees were justified given, among other things, the inherent differences in the products and the level of services provided to the Nuveen funds versus other clients, the differing regulatory requirements and legal liabilities and the entrepreneurial, legal and regulatory risks incurred in sponsoring and advising a registered investment company.
3. Profitability of Fund Advisers
In conjunction with their review of fees, the Independent Board Members considered information regarding Nuveen’s level of profitability for its advisory services to the Nuveen funds for the calendar years 2018 and 2017. The Board reviewed, among other things, Nuveen’s net margins (pre-tax) (both including and excluding distribution expenses); gross and net revenue margins (pre-and post-tax); revenues, expenses, and net income (pre-tax and after-tax and before distribution) of Nuveen for fund advisory services; and comparative profitability data comparing the adjusted margins of Nuveen compared to the adjusted margins of certain peers with publicly available data and with the most comparable assets under management (based on asset size and asset composition) for each of the last two calendar years. The Board also reviewed the revenues and expenses the Adviser derived from its exchange-traded fund product line that was launched in 2016. The Independent Board Members noted that Nuveen’s net margins were higher in 2018 than the previous year and considered the key drivers behind the revenue and expense changes that impacted Nuveen’s net margins between the years. The Board considered the costs of investments in the Nuveen business, including the investment of seed capital in certain Nuveen funds and additional investments in infrastructure and technology. The Independent Board Members also noted that Nuveen’s adjusted margins from its relationships with the Nuveen funds were on the low range compared to the adjusted margins of the peers; however, the Independent Board Members recognized the inherent limitations of the comparative data of other publicly traded peers given that the calculation of profitability is rather subjective and numerous factors (such as types of funds, business mix, cost of capital, methodology to allocate expenses and other factors) can have a significant impact on the results.
The Independent Board Members also reviewed a description of the expense allocation methodology employed to develop the financial information and a summary of the history of changes to the methodology over the ten-year period from 2008 to 2018, and recognized that other reasonable allocation methodologies could be employed and lead to significantly different results. The Board noted that two Independent Board Members, along with independent counsel, serve as the Board’s liaisons to review profitability and discuss any proposed changes to the methodology prior to the full Board’s review.
Aside from Nuveen’s profitability, the Board recognized that the Adviser is a subsidiary of Nuveen, LLC, the investment management arm of Teachers Insurance and Annuity Association of America (“TIAA”). As such, the Board also reviewed a balance sheet for TIAA reflecting its assets, liabilities and capital and contingency reserves for the 2018 and 2017 calendar years to consider the financial strength of TIAA having recognized the importance of having an adviser with significant resources.
In addition to Nuveen, the Independent Board Members also considered the profitability of the Sub-Adviser from its relationships with the Nuveen funds. In this regard, the Independent Board Members reviewed the Sub-Adviser’s revenues, expenses and revenue margins (pre- and post-tax) for its advisory activities for the calendar year ended December 31, 2018. The Independent Board Members also reviewed a profitability analysis reflecting the revenues, expenses and revenue margin (pre- and post-tax) by asset type for the Sub-Adviser for the calendar year ending December 31, 2018 and the pre- and post-tax revenue margin from 2018 and 2017.
In evaluating the reasonableness of the compensation, the Independent Board Members also considered any other ancillary benefits derived by the respective Fund Adviser from its relationship with the Nuveen funds as discussed in further detail below.
Based on a consideration of all the information provided, the Board noted that Nuveen’s and the Sub-Adviser’s level of profitability was acceptable and not unreasonable in light of the services provided.
171
Annual Investment Management Agreement Approval Process (Unaudited) (continued)
D. Economies of Scale and Whether Fee Levels Reflect These Economies of Scale
With respect to economies of scale, the Independent Board Members noted that although economies of scale are difficult to measure, the Adviser shares the benefits of economies of scale in various ways including breakpoints in the management fee schedule (subject to limited exceptions), fee waivers and/or expense limitations, the pricing of Nuveen funds at scale at inception and investments in its business which can enhance the services provided to the funds for the fees paid. With respect to breakpoint schedules, because the Board had previously recognized that economies of scale may occur not only when the assets of a particular Nuveen fund grow but also when the assets in the complex grow, the Nuveen funds generally pay the Adviser a management fee comprised of a fund-level component and a complex-level component each with its own breakpoint schedule, subject to certain exceptions. In general terms, the breakpoint schedule at the fund level reduces fees as assets in the particular fund pass certain thresholds and the breakpoint schedule at the complex level reduces fees on the Nuveen funds as the eligible assets in the complex pass certain thresholds. The Independent Board Members reviewed, among other things, the fund-level and complex-level fee schedules. In addition, with respect to the Nuveen closed-end funds, the Independent Board Members noted that, although such funds may from time-to-time make additional share offerings, the growth of their assets would occur primarily through the appreciation of such funds’ investment portfolios.
In addition, the Independent Board Members recognized the Adviser’s continued reinvestment in its business through, among other things, investments in its business infrastructure and information technology, portfolio accounting system as well as other systems and platforms that will, among other things, support growth, simplify and enhance information sharing, and enhance the investment process to the benefit of all of the Nuveen funds.
Based on its review, the Board concluded that the current fee arrangements together with the Adviser’s reinvestment in its business appropriately shared any economies of scale with shareholders.
E. Indirect Benefits
The Independent Board Members received and considered information regarding other benefits the respective Fund Adviser or its affiliates may receive as a result of their relationship with the Nuveen funds. The Board considered that an affiliate of the Adviser serves as co-manager in the initial public offerings of new closed-end funds for which it may receive revenue and serves as an underwriter on shelf offerings of existing closed-end funds for which it receives compensation. In addition, the Independent Board Members also noted that the Sub-Adviser engages in soft dollar transactions pursuant to which it may receive the benefit of research products and other services provided by broker-dealers executing portfolio transactions on behalf of the applicable Nuveen funds.
The Board, however, noted that the benefits for the Sub-Adviser when transacting in fixed-income securities may be more limited as such securities generally trade on a principal basis and therefore do not generate brokerage commissions. Further, the Board noted that although the Sub-Adviser may benefit from the receipt of research and other services that it may otherwise have to pay for out of its own resources, the research may also benefit the Nuveen funds to the extent it enhances the ability of the Sub-Adviser to manage such funds or is acquired through the commissions paid on portfolio transactions of other clients.
Based on their review, the Board concluded that any indirect benefits received by a Fund Adviser as a result of its relationship with the Funds were reasonable and within acceptable parameters.
F. Other Considerations
The Board Members did not identify any single factor discussed previously as all-important or controlling. The Board Members, including the Independent Board Members, concluded that the terms of each Advisory Agreement were fair and reasonable, that the respective Fund Adviser’s fees were reasonable in light of the services provided to each Fund and that the Advisory Agreements be renewed.
172
PART II
Nuveen Municipal Credit Opportunities Fund
At a meeting held on May 21-23, 2019 (the “Meeting”), the Board Members, including the Independent Board Members, considered and approved the investment management agreement (for purposes of this Part II, the “Investment Management Agreement”) pursuant to which Nuveen Fund Advisors, LLC (the “Adviser”) serves as investment adviser to Nuveen Municipal Credit Opportunities Fund (for purposes of this Part II, the “Fund”) and the investment sub-advisory agreement (for purposes of this Part II, the “Sub-Advisory Agreement”) pursuant to which Nuveen Asset Management, LLC (the “Sub-Adviser”) serves as investment sub-adviser to the Fund. For purposes of this Part II, the Adviser and the Sub-Adviser are each hereafter a “Fund Adviser.” In addition, for purposes of this Part II, the Investment Management Agreement and the Sub-Advisory Agreement are each hereafter an “Advisory Agreement” and collectively, the “Advisory Agreements.”
To assist the Board in its evaluation of an Advisory Agreement with a Fund Adviser at the Meeting, the Independent Board Members had received, in adequate time in advance of the Meeting or at prior meetings, materials which outlined, among other things:
| ● | the nature, extent and quality of the services expected to be provided by the Fund Adviser; |
| ● | the organization of the Fund Adviser, including the responsibilities of various departments and key personnel; |
| ● | the expertise and background of the Fund Adviser with respect to the Fund’s investment strategy; |
| ● | certain performance-related information (as described below); |
| ● | the profitability of Nuveen and its affiliates for their advisory activities; |
| ● | the proposed management fees of the Fund Adviser, including comparisons of such fees with the management fees of comparable funds; |
| ● | the expected expenses of the Fund, including comparisons of the Fund’s expected expense ratio with the expense ratios of comparable funds; and |
| ● | the soft dollar practices of the Fund Adviser, if any. |
At the Meeting and/or prior meetings, the Adviser made presentations to and responded to questions from the Board. During the Meeting and/or prior meetings, the Independent Board Members also met privately with their legal counsel to, among other things, review the Board’s duties under the 1940 Act, the general principles of state law in reviewing and approving advisory contracts, the standards used by courts in determining whether investment company boards of directors have fulfilled their duties, factors to be considered in voting on advisory contracts and an adviser’s fiduciary duty with respect to advisory agreements and compensation. It is with this background that the Independent Board Members considered the Advisory Agreements. As outlined in more detail below, the Independent Board Members considered all factors they believed relevant with respect to the Fund, including, among other things: (a) the nature, extent and quality of the services expected to be provided by the Fund Advisers; (b) investment performance, as described below; (c) the advisory fees and costs of the services expected to be provided to the Fund and the profitability of the Fund Advisers; (d) the extent of any anticipated economies of scale; (e) any benefits expected to be derived by the Fund Advisers from their relationships with the Fund; and (f) other factors. Each Board Member may have accorded different weight to the various factors in reaching his or her conclusions with respect to the Fund’s Advisory Agreements.
A. Nature, Extent and Quality of Services
The Independent Board Members considered the nature, extent and quality of the respective Fund Adviser’s services, including portfolio management services and administrative services. Given that the Adviser and the Sub-Adviser already serve as adviser and sub-adviser, respectively, to other Nuveen funds overseen by the Board Members, the Board has a good understanding of
173
Annual Investment Management Agreement Approval Process (Unaudited) (continued)
each such Fund Adviser’s organization, operations, personnel and services. As the Independent Board Members meet regularly throughout the year to oversee the Nuveen funds, including funds currently advised by the Fund Advisers, the Independent Board Members have relied upon their knowledge from their meetings and any other interactions throughout the year with the respective Fund Adviser in evaluating the Advisory Agreements.
At the Meeting and/or at prior meetings, the Independent Board Members reviewed materials outlining, among other things, the respective Fund Adviser’s organization and business; the types of services that such Fund Adviser or its affiliates provide to the Nuveen funds (as applicable) and are expected to provide to the Fund; and the experience of the respective Fund Adviser with applicable investment strategies. Further, at the Meeting and/or at prior meetings, the Independent Board Members have evaluated the background and experience of the relevant investment personnel.
With respect to services, the Board noted that the Fund would be a registered investment company that would operate in a regulated industry. In considering the services that were expected to be provided by the Fund Advisers, at the Meeting and/or at prior meetings, the Board has recognized the comprehensive set of services the Adviser provides to operate the Nuveen funds in a highly regulated industry. Some of the functions for which the Adviser is responsible include, but are not limited to: product management; investment oversight; securities valuation services; risk management; fund administration; oversight of shareholder services and transfer agency functions; board relations services; compliance and regulatory oversight services; legal support and oversight of outside law firms; and leverage, capital and distribution management services. In addition to the services provided by the Adviser, the Board has also considered the risks borne by the Adviser and its affiliates in managing the Nuveen funds, including entrepreneurial, operational, reputational, regulatory and litigation risks.
The Independent Board Members noted that the Adviser would oversee the Sub-Adviser and recognized that the Sub-Adviser and its investment personnel generally would be responsible for the management of the Fund’s portfolio. In this regard, the Board Members recognized the Sub-Adviser’s relevant experience and expertise.
Based on their review, the Independent Board Members found that, overall, the nature, extent and quality of services expected to be provided to the Fund under each Advisory Agreement were satisfactory.
B. Investment Performance
The Fund was new and, therefore, did not have its own performance history. The Independent Board Members noted, however, that the Fund’s anticipated investment strategy would have some similarities to that of the Nuveen High Yield Municipal Bond Fund (the “High Yield Fund”), a Nuveen open-end fund which had an inception date of June 7, 1999. In this regard, the Independent Board Members reviewed certain performance information relating to the High Yield Fund, including average annual total returns for the quarter-to-date, year-to-date, one-year, three-year, five-year, ten-year and since inception periods as of March 31, 2019.
C. Fees, Expenses and Profitability
1. Fees and Expenses
In evaluating the management fees and expenses that the Fund was expected to bear, the Independent Board Members considered, among other things, the Fund’s proposed management fee structure and its expected expense ratio in absolute terms as well as compared with the fees and expense ratios of comparable funds. Accordingly, the Independent Board Members reviewed, among other things, the proposed advisory fee and estimated net total expense ratio for the Fund (based on both common assets and total managed assets), as well as comparative fee and expense data pertaining to the Fund’s peers in the Lipper category in which the Fund is expected to be classified. In considering the Fund’s advisory fees, the Board also considered the differences between the investment strategy of the Fund and that of Nuveen Municipal High Income Opportunity Fund (NMZ), another comparable closed-end fund in the Nuveen family of funds, and the corresponding differences in management fee rates between the funds. Further, the Independent Board Members took into account the proposed sub-advisory fee for the Fund.
174
The Independent Board Members recognized that assets attributable to the Fund’s use of leverage would be included in the amount of assets upon which the advisory fee is calculated. In this regard, the Independent Board Members noted that the advisory fee is based on a percentage of average daily “Managed Assets.” “Managed Assets” generally means the total assets of the Fund, minus the sum of its accrued liabilities (other than Fund liabilities incurred for the express purpose of creating leverage). “Total assets” for this purpose includes assets attributable to the Fund’s use of leverage (whether or not those assets are reflected in the Fund’s financial statements for purposes of generally accepted accounting principles), and derivatives will be valued at their market value. The Independent Board Members recognized that the fact that a decision to employ or increase the Fund’s leverage will have the effect, all other things being equal, of increasing Managed Assets (and, in turn, increasing the Adviser’s and the Sub-Adviser’s management fees), means that the Adviser and the Sub-Adviser may have a conflict of interest in determining whether to use or increase leverage. The Independent Board Members noted, however, that the Adviser and the Sub-Adviser would seek to manage that potential conflict by recommending to the Board to leverage the Fund (or increase such leverage) when they determine that such action would be in the best interests of the Fund and its common shareholders, and by periodically reviewing with the Board the Fund’s performance and the impact of the use of leverage on that performance.
The Independent Board Members considered the proposed management fee rate as a percentage of Managed Assets before any fund-level and complex-wide breakpoints. Based on their review of the fee and expense information provided, the Independent Board Members determined that the Fund’s management fees (as applicable) to a Fund Adviser were reasonable in light of the nature, extent and quality of services to be provided to the Fund.
2. Comparisons with the Fees of Other Clients
At the Meeting and/or at prior meetings, the Board has reviewed information regarding the fee rates that the Fund Advisers charge for certain other types of clients and the type of services provided to these other clients. In conjunction with municipal funds, with respect to the Adviser and/or the Sub-Adviser, such other clients may include retail and institutional managed accounts, passively managed exchange-traded funds sub-advised by the Sub-Adviser but that are offered by another fund complex and municipal managed accounts offered by an unaffiliated adviser. With respect to the Sub-Adviser, the Board has previously reviewed, among other things, the fee range and average fee of municipal retail wrap accounts and municipal institutional accounts.
In addition to the comparative fee data, the Board has also reviewed, among other things, a description of the different levels of services provided to certain other clients compared to the services provided to the Nuveen funds as well as the differences in portfolio investment policies, investor profiles, account sizes and regulatory requirements, all of which contribute to the variations in the fee schedules. The Board has previously noted, among other things, the wide range of services in addition to investment management services provided to the Nuveen funds when the Adviser is principally responsible for all aspects of operating the funds, including the increased regulatory requirements that must be met in managing the funds, the larger account sizes of managed accounts and the increased entrepreneurial, legal and regulatory risks that the Adviser incurs in sponsoring and managing the Nuveen funds. In general, higher fee levels reflect higher levels of service provided by the Adviser, increased investment management complexity, greater product management requirements, and higher levels of business risk or some combination of these factors. Further, the Board has considered that the Sub-Adviser’s fee is essentially for portfolio management services and therefore more comparable to the fees it receives for retail wrap accounts and other external sub-advisory mandates. The Board has previously concluded that the varying levels of fees were justified given, among other things, the inherent differences in the products and the level of services provided to the Nuveen funds versus other clients, the differing regulatory requirements and legal liabilities and the entrepreneurial, legal and regulatory risks incurred in sponsoring and advising a registered investment company.
3. Profitability of Fund Advisers
In conjunction with their review of fees, at the Meeting and/or at prior meetings, the Independent Board Members have considered information regarding Nuveen’s level of profitability for its advisory services to the Nuveen funds for the calendar years
175
Annual Investment Management Agreement Approval Process (Unaudited) (continued)
2018 and 2017. The Board has previously reviewed, among other things, Nuveen’s net margins (pre-tax) (both including and excluding distribution expenses); gross and net revenue margins (pre- and post-tax); revenues, expenses, and net income (pre-tax and after-tax and before distribution) of Nuveen for fund advisory services; and comparative profitability data comparing the adjusted margins of Nuveen compared to the adjusted margins of certain peers with publicly available data and with the most comparable assets under management (based on asset size and asset composition) for the 2018 and 2017 calendar years. The Board has also reviewed the revenues and expenses the Adviser derived from its exchange-traded fund product line that was launched in 2016. The Independent Board Members have noted that Nuveen’s net margins were higher in 2018 than the previous year and considered the key drivers behind the revenue and expense changes that impacted Nuveen’s net margins between the years. The Board has considered the costs of investments in the Nuveen business, including the investment of seed capital in certain Nuveen funds and additional investments in infrastructure and technology. The Independent Board Members have also noted that Nuveen’s adjusted margins from its relationships with the Nuveen funds were on the low range compared to the adjusted margins of the peers; however, the Independent Board Members have recognized the inherent limitations of the comparative data of other publicly traded peers given that the calculation of profitability is rather subjective and numerous factors (such as types of funds, business mix, cost of capital, methodology to allocate expenses and other factors) can have a significant impact on the results.
Aside from Nuveen’s profitability, the Board has recognized that the Adviser is a subsidiary of Nuveen, LLC, the investment management arm of Teachers Insurance and Annuity Association of America (“TIAA”). As such, the Board has also reviewed a balance sheet for TIAA reflecting its assets, liabilities and capital and contingency reserves for the 2018 and 2017 calendar years to consider the financial strength of TIAA having recognized the importance of having an adviser with significant resources.
In addition, the Independent Board Members have reviewed the Sub-Adviser’s revenues, expenses and revenue margins (pre-and post-tax) for its advisory activities for the calendar year ended December 31, 2018. The Independent Board Members have also reviewed a profitability analysis reflecting the revenues, expenses and revenue margin (pre- and post-tax) by asset type for the Sub-Adviser for the calendar year ending December 31, 2018 and the pre- and post-tax revenue margin from 2018 and 2017.
In evaluating the reasonableness of the compensation, the Independent Board Members have also considered any other ancillary benefits derived by the respective Fund Adviser from its relationship with the Nuveen funds as discussed in further detail below.
Based on a consideration of all the information provided, the Board has noted that Nuveen’s and the Sub-Adviser’s level of profitability was acceptable and not unreasonable in light of the services provided.
D. Economies of Scale and Whether Fee Levels Reflect These Economies of Scale
The Independent Board Members considered whether the Fund could be expected to benefit from any economies of scale. Although the Board has recognized that economies of scale are difficult to measure, the Independent Board Members have noted that economies of scale may be shared in various ways, including through breakpoints in the management fee schedule and through the Adviser’s investment in its business, which can enhance the services provided to the Nuveen funds. With respect to breakpoint schedules, because the Board has previously recognized that economies of scale may occur not only when the assets of a particular Nuveen fund grow, but also when the assets in the complex grow, the Nuveen funds generally pay the Adviser a management fee comprised of a fund-level component and a complex-level component, each with its own breakpoint schedule, subject to certain exceptions. In general terms, the breakpoint schedule at the fund level reduces fees as assets in the particular fund pass certain thresholds and the breakpoint schedule at the complex level reduces fees on the Nuveen funds as the eligible assets in the complex pass certain thresholds. Accordingly, the Independent Board Members reviewed and considered the proposed management fees for the Fund, taking into account the fund-level and complex-level breakpoint schedules. In this regard, however, the Fund is a closed-end fund and the Independent Board Members have recognized that although closed-end funds may from time to time make additional share offerings, the growth of their assets would occur primarily through the appreciation of such funds’ investment portfolios. In addition, the Independent Board Members
176
have recognized the Adviser’s continued reinvestment in its business through, among other things, investments in its business infrastructure and information technology, portfolio accounting system as well as other systems and platforms that will, among other things, support growth, simplify and enhance information sharing, and enhance the investment process to the benefit of all of the Nuveen funds.
Based on their review, the Independent Board Members concluded that the proposed fee structure was acceptable and reflected economies of scale to be shared with the Fund’s shareholders when assets under management increase.
E. Indirect Benefits
The Independent Board Members received and considered information at the Meeting and/or at prior meetings regarding other benefits that a Fund Adviser or its affiliates may receive as a result of their relationship with the Nuveen funds. With respect to closed-end funds, the Independent Board Members have considered that an affiliate of the Adviser serves as co-manager in the initial public offerings of new closed-end funds for which it may receive revenue and serves as an underwriter on shelf offerings of existing closed-end funds for which it receives compensation.
In addition to the above, at the Meeting and/or at prior meetings, the Independent Board Members have noted that the Sub-Adviser engages in soft dollar transactions pursuant to which it may receive the benefit of research products and other services provided by broker-dealers executing portfolio transactions on behalf of the applicable Nuveen funds. The Board, however, has noted that the benefits for sub-advisers transacting in fixed-income securities may be more limited as such securities generally trade on a principal basis and therefore do not generate brokerage commissions. Further, the Board has noted that although the Sub-Adviser may benefit from the receipt of research and other services that it may otherwise have to pay for out of its own resources, the research may also benefit a Nuveen fund to the extent it enhances the ability of the Sub-Adviser to manage such fund or is acquired through the commissions paid on portfolio transactions of other clients.
Based on their review, the Independent Board Members concluded that any indirect benefits expected to be received by a Fund Adviser as a result of its relationship with the Fund were reasonable and within acceptable parameters.
F. Approval
The Independent Board Members did not identify any single factor discussed previously as all-important or controlling. The Board Members, including a majority of the Independent Board Members, concluded that the terms of the Investment Management Agreement and the Sub-Advisory Agreement were fair and reasonable, that the respective Fund Adviser’s fees were reasonable in light of the services to be provided to the Fund and that the Investment Management Agreement and Sub-Advisory Agreement should be and were approved on behalf of the Fund.
177
Board Members & Officers (Unaudited)
The management of the Funds, including general supervision of the duties performed for the Funds by the Adviser, is the responsibility of the Board of Trustees of the Funds. The number of trustees of the Funds is set at ten. None of the trustees who are not “interested” persons of the Funds (referred to herein as “independent board members”) has ever been a director or employee of, or consultant to, Nuveen or its affiliates. The names and business addresses of the trustees and officers of the Funds, their principal occupations and other affiliations during the past five years, the number of portfolios each Trustee oversees and other directorships they hold are set forth below.
| | | | | |
| Name, | Position(s) Held | Year First | Principal | Number |
| Year of Birth | with the Funds | Elected or | Occupation(s) | of Portfolios |
| & Address | | Appointed | Including other | in Fund Complex |
| | and Term(1) | Directorships | Overseen by |
| | | During Past 5 Years | Board Member |
|
|
Independent Board Members:
|
|
|
■ TERENCE J. TOTH | | | Formerly, a Co-Founding Partner, Promus Capital (2008-2017); Director, | |
| 1959 | | | Quality Control Corporation (since 2012); member: Catalyst Schools of | |
| 333 W. Wacker Drive | Chairman and | 2008 | Chicago Board (since 2008) and Mather Foundation Board (since 2012), | 159 |
| Chicago, IL 6o6o6 | Board Member | Class II | and chair of its Investment Committee; formerly, Director, Fulcrum IT | |
| | | Services LLC (2010-2019); formerly, Director, Legal & General Investment | |
| | | Management America, Inc. (2008-2013); formerly, CEO and President, | |
| | | Northern Trust Global Investments (2004-2007): Executive Vice | |
| | | President, Quantitative Management & Securities Lending (2000-2004); | |
| | | prior thereto, various positions with Northern Trust Company (since 1994); | |
| | | formerly, Member, Northern Trust Mutual Funds Board (2005-2007), | |
| | | Northern Trust Global Investments Board (2004-2007), Northern Trust | |
| | | Japan Board (2004-2007), Northern Trust Securities Inc. Board | |
| | | (2003-2007) and Northern Trust Hong Kong Board (1997-2004). | |
|
■ JACK B. EVANS | | | Chairman (since 2019), formerly, President (1996-2019), The Hall-Perrine | |
| 1948 | | | Foundation, a private philanthropic corporation; Director and Chairman, | |
| 333 W. Wacker Drive | Board Member | 1999 | United Fire Group, a publicly held company; Director, Public Member, | 159 |
| Chicago, IL 6o6o6 | | Class III | American Board of Orthopaedic Surgery (since 2015); Life Trustee of Coe | |
| | | College and the Iowa College Foundation; formerly, President Pro-Tem of | |
| | | the Board of Regents for the State of Iowa University System; formerly, | |
| | | Director, Alliant Energy and The Gazette Company; formerly, Director, | |
| | | Federal Reserve Bank of Chicago; formerly, President and Chief Operating | |
| | | Officer, SCI Financial Group, Inc., a regional financial services firm. | |
|
■ WILLIAM C. HUNTER | | | Dean Emeritus, formerly, Dean, Tippie College of Business, University of | |
| 1948 | | | Iowa (2006-2012); Director of Wellmark, Inc. (since 2009); past Director | |
| 333 W. Wacker Drive | Board Member | 2003 | (2005-2015), and past President (2010-2014) Beta Gamma Sigma, Inc., | 159 |
| Chicago, IL 6o6o6 | | Class I | The International Business Honor Society; formerly, Director (2004-2018) | |
| | | of Xerox Corporation; Dean and Distinguished Professor of Finance, School | �� |
| | | of Business at the University of Connecticut (2003-2006); previously, Senior | |
| | | Vice President and Director of Research at the Federal Reserve Bank of | |
| | | Chicago (1995-2003); formerly, Director (1997-2007), Credit Research | |
| | | Center at Georgetown University. | |
|
■ ALBIN F. MOSCHNER | | | Founder and Chief Executive Officer, Northcroft Partners, LLC, a | |
| 1952 | | | management consulting firm (since 2012); formerly, Chairman (2019), | |
| 333 W. Wacker Drive | Board Member | 2016 | and Director (2012-2019), USA Technologies, Inc., a provider of solutions | 159 |
| Chicago, IL 6o6o6 | | Class III | and services to facilitate electronic payment transactions; formerly, | |
| | | Director, Wintrust Financial Corporation (1996-2016); previously, | |
| | | held positions at Leap Wireless International, Inc., including Consultant | |
| | | (2011-2012), Chief Operating Officer (2008-2011), and Chief Marketing | |
| | | Officer (2004-2008); formerly, President, Verizon Card Services division of | |
| | | Verizon Communications, Inc. (2000-2003); formerly, President, One Point | |
| | | Services at One Point Communications (1999-2000); formerly, Vice | |
| | | Chairman of the Board, Diba, Incorporated (1996-1997); formerly, various | |
| | | executive positions (1991-1996) and Chief Executive Officer (1995-1996) of | |
| | | Zenith Electronics Corporation. | |
178
| | | | | |
| Name, | Position(s) Held | Year First | Principal | Number |
| Year of Birth | with the Funds | Elected or | Occupation(s) | of Portfolios |
| & Address | | Appointed | Including other | in Fund Complex |
| | and Term(1) | Directorships | Overseen by |
| | | During Past 5 Years | Board Member |
|
Independent Board Members (continued):
|
|
■ JOHN K. NELSON | | | Member of Board of Directors of Core12 LLC (since 2008), a private firm | |
| 1962 | | | which develops branding, marketing and communications strategies for | |
| 333 W. Wacker Drive | Board Member | 2013 | clients; served on The President’s Council, Fordham University (2010- | 159 |
| Chicago, IL 6o6o6 | | Class II | 2018); and previously was a Director of The Curran Center for Catholic | |
| | | American Studies (2009-2018); formerly, senior external advisor to the | |
| | | financial services practice of Deloitte Consulting LLP (2012-2014): | |
| | | formerly, Chairman of the Board of Trustees of Marian University (2010 | |
| | | as trustee, 2011-2014 as Chairman); formerly, Chief Executive Officer of | |
| | | ABN AMRO N.V. North America, and Global Head of its Financial | |
| | | Markets Division (2007-2008); prior senior positions held at ABN AMRO | |
| | | include Corporate Executive Vice President and Head of Global Markets- | |
| | | the Americas (2006-2007), CEO of Wholesale Banking North America and | |
| | | Global Head of Foreign Exchange and Futures Markets (2001-2006), and | |
| | | Regional Commercial Treasurer and Senior Vice President Trading-North | |
| | | America (1996-2001); formerly, Trustee at St. Edmund Preparatory School | |
| | | in New York City. | |
|
■ JUDITH M. STOCKDALE | | | Board Member, Land Trust Alliance (since 2013) and U.S. Endowment for | |
| 1947 | | | Forestry and Communities (since 2013); formerly, Executive Director | |
| 333 W. Wacker Drive | Board Member | 1997 | (1994-2012), Gaylord and Dorothy Donnelley Foundation; prior thereto, | 159 |
| Chicago, IL 6o6o6 | | Class I | Executive Director, Great Lakes Protection Fund (1990-1994). | |
|
■ CAROLE E. STONE | | | Former Director, Chicago Board Options Exchange, Inc. (2006-2017); | |
| 1947 | | | and C2 Options Exchange, Incorporated (2009-2017); Director, Cboe, | |
| 333 W. Wacker Drive | Board Member | 2007 | Global Markets, Inc., formerly, CBOE Holdings, Inc. (since 2010); | 159 |
| Chicago, IL 6o6o6 | | Class I | formerly, Commissioner, New York State Commission on Public Authority | |
| | | Reform (2005-2010). | |
|
■ MARGARET L. WOLFF | | | Formerly, member of the Board of Directors (2013-2017) of Travelers | |
| 1955 | | | Insurance Company of Canada and The Dominion of Canada General | |
| 333 W. Wacker Drive | Board Member | 2016 | Insurance Company (each, a part of Travelers Canada, the Canadian | 159 |
| Chicago, IL 6o6o6 | | Class I | operation of The Travelers Companies, Inc.); formerly, Of Counsel, | |
| | | Skadden, Arps, Slate, Meagher & Flom LLP (Mergers & Acquisitions | |
| | | Group) (2005-2014); Member of the Board of Trustees of New York- | |
| | | Presbyterian Hospital (since 2005); Member (since 2004) and Chair | |
| | | (since 2015) of the Board of Trustees of The John A. Hartford Foundation | |
| | | (a philanthropy dedicated to improving the care of older adults); | |
| | | formerly, Member (2005-2015) and Vice Chair (2011-2015) of the Board of | |
| | | Trustees of Mt. Holyoke College. | |
|
■ ROBERT L. YOUNG(2) | | | Formerly, Chief Operating Officer and Director, J.P.Morgan Investment | |
| 1963 | | | Management Inc. (2010-2016); formerly, President and Principal | |
| 333 W. Wacker Drive | Board Member | 2017 | Executive Officer (2013-2016), and Senior Vice President and Chief | 157 |
| Chicago, IL 6o6o6 | | Class II | Operating Officer (2005-2010), of J.P.Morgan Funds; formerly, Director | |
| | | and various officer positions for J.P.Morgan Investment Management Inc. | |
| | | (formerly, JPMorgan Funds Management, Inc. and formerly, One Group | |
| | | Administrative Services) and JPMorgan Distribution Services, Inc. | |
| | | (formerly, One Group Dealer Services, Inc.) (1999-2017). | |
179
Board Members & Officers (Unaudited) (continued)
| | | | | |
| Name, | Position(s) Held | Year First | Principal | Number |
| Year of Birth | with the Funds | Elected or | Occupation(s) | of Portfolios |
| & Address | | Appointed | Including other | in Fund Complex |
| | and Term(1) | Directorships | Overseen by |
| | | During Past 5 Years | Board Member |
|
Interested Board Member:
|
|
■ MARGO L. COOK(3) | | | President (since 2017), formerly, Co-Chief Executive Officer and | |
| 1964 | | | Co-President (2016-2017), formerly, Senior Executive Vice President of | |
| 333 W. Wacker Drive | Board Member | 2016 | Nuveen Investments, Inc.; President, Global Products and Solutions | 159 |
| Chicago, IL 6o6o6 | | Class III | (since 2017), and, Co-Chief Executive Officer (since 2015), formerly, | |
| | | Executive Vice President (2013-2015), of Nuveen Securities, LLC; Executive | |
| | | Vice President (since 2017) of Nuveen, LLC; President (since August 2017), | |
| | | formerly Co-President (2016- 2017), formerly, Senior Executive Vice | |
| | | President of Nuveen Fund Advisors, LLC (Executive Vice President | |
| | | 2011-2015); President (since 2017), Nuveen Alternative Investments, LLC; | |
| | | Chartered Financial Analyst. | |
| | | | |
| Name, | Position(s) Held | Year First | Principal |
| Year of Birth | with the Funds | Elected or | Occupation(s) |
| & Address | | Appointed(4) | During Past 5 Years |
|
|
Officers of the Funds:
|
|
■ CEDRIC H. ANTOSIEWICZ | | | Senior Managing Director (since 2017), formerly, Managing Director |
| 1962 | Chief | | (2004-2017) of Nuveen Securities, LLC; Senior Managing Director |
| 333 W. Wacker Drive | Administrative | 2007 | (since 2017), formerly, Managing Director (2014-2017) of Nuveen Fund |
| Chicago, IL 6o6o6 | Officer | | Advisors, LLC. |
|
■ NATHANIEL T. JONES | | | Managing Director (since 2017), formerly, Senior Vice President |
| 1979 | | | (2016-2017), formerly, Vice President (2011-2016) of Nuveen; Managing |
| 333 W. Wacker Drive | Vice President | 2016 | Director (since 2015) of Nuveen Fund Advisors, LLC; Chartered |
| Chicago, IL 6o6o6 | and Treasurer | | Financial Analyst. |
|
■ WALTER M. KELLY | | | Managing Director (since 2017), formerly, Senior Vice President |
| 1970 | Chief Compliance | | (2008-2017) of Nuveen. |
| 333 W. Wacker Drive | Officer and | 2003 | |
| Chicago, IL 6o6o6 | Vice President | | |
|
■ DAVID J. LAMB | | | Managing Director (since 2017), formerly, Senior Vice President of Nuveen |
| 1963 | | | (since 2006), Vice President prior to 2006. |
| 333 W. Wacker Drive | Vice President | 2015 | |
| Chicago, IL 6o6o6 | | | |
|
■ TINA M. LAZAR | | | Managing Director (since 2017), formerly, Senior Vice President |
| 1961 | | | (2014-2017) of Nuveen Securities, LLC. |
| 333 W. Wacker Drive | Vice President | 2002 | |
| Chicago, IL 6o6o6 | | | |
|
■ BRIAN J. LOCKHART | | | Managing Director (since 2019) of Nuveen Fund Advisors, LLC; Managing |
| 1974 | | | Director (since 2017), formerly, Vice President (2010-2017) of Nuveen; |
| 333 W. Wacker Drive | Vice President | 2019 | Head of Investment Oversight (since 2017), formerly, Team Leader of |
| Chicago, IL 6o6o6 | | | Manager Oversight (2015-2017); Chartered Financial Analyst and |
| | | Certified Financial Risk Manager. |
|
■ JACQUES M. LONGERSTAEY | | | Senior Managing Director, Chief Risk Officer, Nuveen, LLC (since |
| 1963 | | | May 2019); Senior Managing Director (since May 2019) of Nuveen Fund |
| 8500 Andrew Carnegie Blvd. | Vice President | 2019 | Advisors, LLC; formerly, Chief Investment and Model Risk Officer, Wealth |
| Charlotte, NC 28262 | | | & Investment Management Division, Wells Fargo Bank (NA) (from |
| | | 2013-2019). |
180
| | | | |
| Name, | Position(s) Held | Year First | Principal |
| Year of Birth | with the Funds | Elected or | Occupation(s) |
| & Address | | Appointed(4) | During Past 5 Years |
|
|
Officers of the Funds (continued):
|
|
■ KEVIN J. MCCARTHY | | | Senior Managing Director (since 2017) and Secretary and General Counsel |
| 1966 | Vice President | | (since 2016) of Nuveen Investments, Inc., formerly, Executive Vice President |
| 333 W. Wacker Drive | and Assistant | 2007 | (2016-2017) and Managing Director and Assistant Secretary (2008-2016); |
| Chicago, IL 6o6o6 | Secretary | | Senior Managing Director (since 2017) and Assistant Secretary (since 2008) of |
| | | Nuveen Securities, LLC, formerly Executive Vice President (2016-2017) and |
| | | Managing Director (2008-2016); Senior Managing Director (since 2017), |
| | | Secretary (since 2016) and Co-General Counsel (since 2011) of Nuveen Fund |
| | | Advisors, LLC, formerly, Executive Vice President (2016-2017), Managing |
| | | Director (2008-2016) and Assistant Secretary (2007-2016); Senior Managing |
| | | Director (since 2017), Secretary (since 2016) and Associate General Counsel |
| | | (since 2011) of Nuveen Asset Management, LLC, formerly Executive Vice |
| | | President (2016-2017) and Managing Director and Assistant Secretary |
| | | (2011-2016); Senior Managing Director (since 2017) and Secretary (since 2016) |
| | | of Nuveen Investments Advisers, LLC, formerly Executive Vice President |
| | | (2016-2017); Vice President (since 2007) and Secretary (since 2016), formerly, |
| | | Assistant Secretary, of NWQ Investment Management Company, LLC, |
| | | Symphony Asset Management LLC, Santa Barbara Asset Management, LLC |
| | | and Winslow Capital Management, LLC (since 2010). Senior Managing Director |
| | | (since 2017) and Secretary (since 2016) of Nuveen Alternative Investments, LLC. |
|
■ JON SCOTT MEISSNER | | | Managing Director of Mutual Fund Tax and Financial Reporting groups at |
| 1973 | | | Nuveen (since 2017); Managing Director of Nuveen Fund Advisors, LLC (since 2019); |
| 8500 Andrew Carnegie Blvd. | Vice President | 2019 | Senior Director of Teachers Advisors, LLC and TIAA-CREF Investment |
| Charlotte, NC 28262 | | | Management, LLC (since 2016); Senior Director (since 2015) Mutual Fund |
| | | Taxation to the TIAA-CREF Funds, the TIAA-CREF Life Funds, the TIAA |
| | | Separate Account VA-1 and the CREF Accounts; has held various positions |
| | | with TIAA since 2004. |
|
■ WILLIAM T. MEYERS | | | Senior Managing Director (since 2017), formerly, Managing Director |
| 1966 | | | (2016-2017), Senior Vice President (2010-2016) of Nuveen Securities, LLC and |
| 333 W. Wacker Drive | Vice President | 2018 | Nuveen Fund Advisors, LLC; Senior Managing Director (since 2017), formerly, |
| Chicago, IL 60606 | | | Managing Director (2016-2017), Senior Vice President (2010-2016) of Nuveen, |
| | | has held various positions with Nuveen since 1991. |
|
■ MICHAEL A. PERRY | | | Executive Vice President (since 2017), previously Managing Director (from |
| 1967 | | | 2016), of Nuveen Fund Advisors, LLC and Nuveen Alternative Investments, |
| 333 W. Wacker Drive | Vice President | 2017 | LLC; Executive Vice President (since 2017), formerly, Managing Director |
| Chicago, IL 6o6o6 | | | (2015-2017), of Nuveen Securities, LLC; formerly, Managing Director |
| | | (2010-2015) of UBS Securities, LLC. |
|
■ CHRISTOPHER M. ROHRBACHER | | | Managing Director (since 2017) and Assistant Secretary of Nuveen Securities, |
| 1971 | Vice President | | LLC; Managing Director (since 2017), formerly, Senior Vice President |
| 333 W. Wacker Drive | and Assistant | 2008 | (2016-2017), Co-General Counsel (since 2019) and Assistant Secretary (since 2016) |
| Chicago, IL 6o6o6 | Secretary | | of Nuveen Fund Advisors, LLC; Managing Director (since 2017), formerly, Senior |
| | | Vice President (2012-2017) and Associate General Counsel (since 2016), formerly, |
| | | Assistant General Counsel (2008-2016) of Nuveen. |
|
■ WILLIAM A. SIFFERMANN | | | Managing Director (since 2017), formerly Senior Vice President (2016-2017) |
| 1975 | | | and Vice President (2011-2016) of Nuveen. |
| 333 W. Wacker Drive | Vice President | 2017 | |
| Chicago, IL 6o6o6 | | | |
|
■ E. SCOTT WICKERHAM | | | Senior Managing Director, Head of Fund Administration at Nuveen, LLC |
| 1973 | Vice President | | (since 2019), formerly, Managing Director; Senior Managing Director |
| TIAA | and Controller | 2019 | (since 2019), Nuveen Fund Advisers, LLC; Principal Financial Officer, Principal |
| 730 Third Avenue | | | Accounting Officer and Treasurer (since 2017) to the TIAA-CREF Funds, the |
| New York, NY 10017 | | | TIAA-CREF Life Funds, the TIAA Separate Account VA-1 and the Treasurer |
| | | (since 2017) to the CREF Accounts; Senior Director, TIAA-CREF Fund |
| | | Administration (2014-2015); has held various positions with TIAA since 2006. |
181
Board Members & Officers (Unaudited) (continued)
| | | | |
| Name, | Position(s) Held | Year First | Principal |
| Year of Birth | with the Funds | Elected or | Occupation(s) |
| & Address | | Appointed(4) | During Past 5 Years |
|
|
Officers of the Funds (continued):
|
|
■ MARK L. WINGET | | | Vice President and Assistant Secretary of Nuveen Securities, LLC |
| 1968 | Vice President | | (since 2008); Vice President and Assistant Secretary of Nuveen Fund |
| 333 W. Wacker Drive | and Assistant | 2008 | Advisors, LLC (since 2019); Vice President (since 2010) and Associate |
| Chicago, IL 60606 | Secretary | | General Counsel (since 2016), formerly, Assistant General Counsel |
| | | (2008-2016) of Nuveen. |
|
■ GIFFORD R. ZIMMERMAN | | | Managing Director (since 2002), and Assistant Secretary of Nuveen Securities, |
| 1956 | Vice President | | LLC; Managing Director (since 2004) and Assistant Secretary (since 1994) of |
| 333 W. Wacker Drive | Secretary | 1988 | Nuveen Investments, Inc.; Managing Director (since 2002), Assistant |
| Chicago, IL 60606 | | | Secretary (since 1997) and Co-General Counsel (since |2011) of Nuveen Fund |
| | | Advisors, LLC; Managing Director, Assistant Secretary and Associate General |
| | | Counsel of Nuveen Asset Management, LLC (since 2011); Vice President |
| | | (since 2017), formerly, Managing Director (2003-2017) and Assistant |
| | | Secretary (since 2003) of Symphony Asset Management LLC; Managing |
| | | Director and Assistant Secretary (since 2002) of Nuveen Investments |
| | | Advisers, LLC; Vice President and Assistant Secretary of NWQ Investment |
| | | Management Company, LLC (since 2002), Santa Barbara Asset Management, |
| | | LLC (since 2006), and of Winslow Capital Management, LLC, (since 2010); |
| | | Chartered Financial Analyst. |
| | |
(1) | The Board of Trustees is divided into three classes, Class I, Class II, and Class III, with each being elected to serve until the third succeeding annual shareholders’ meeting subsequent to its election or thereafter in each case when its respective successors are duly elected or appointed, except two board members are elected by the holders of Preferred Shares, when applicable, to serve until the next annual shareholders’ meeting subsequent to its election or thereafter in each case when its respective successors are duly elected or appointed. The year first elected or appointed represents the year in which the board member was first elected or appointed to any fund in the Nuveen complex. |
(2) | Mr. Young was appointed as a Board Member of each of the Nuveen Funds except Nuveen Diversified Dividend and Income Fund and Nuveen Real Estate Income Fund. |
(3) | “Interested person” as defined in the 1940 Act, by reason of her position with Nuveen, LLC. and certain of its subsidiaries, which are affiliates of the Nuveen Funds. |
(4) | Officers serve one year terms through August of each year. The year first elected or appointed represents the year in which the Officer was first elected or appointed to any fund in the Nuveen complex. |
182
Notes
183
Nuveen:
Serving Investors for Generations
Since 1898, financial advisors and their clients have relied on Nuveen to provide dependable investment solutions through continued adherence to proven, long-term investing principles. Today, we offer a range of high quality solutions designed to be integral components of a well-diversified core portfolio.
Focused on meeting investor needs.
Nuveen is the investment manager of TIAA. We have grown into one of the world’s premier global asset managers, with specialist knowledge across all major asset classes and particular strength in solutions that provide income for investors and that draw on our expertise in alternatives and responsible investing. Nuveen is driven not only by the independent investment processes across the firm, but also the insights, risk management, analytics and other tools and resources that a truly world-class platform provides. As a global asset manager, our mission is to work in partnership with our clients to create solutions which help them secure their financial future.
Find out how we can help you.
To learn more about how the products and services of Nuveen may be able to help you meet your financial goals, talk to your financial advisor, or call us at (800) 257-8787. Please read the information provided carefully before you invest. Investors should consider the investment objective and policies, risk considerations, charges and expenses of any investment carefully. Where applicable, be sure to obtain a prospectus, which contains this and other relevant information. To obtain a prospectus, please contact your securities representative or Nuveen, 333 W. Wacker Dr., Chicago, IL 60606. Please read the prospectus carefully before you invest or send money.
Learn more about Nuveen Funds at: www.nuveen.com/closed-end-funds
| Nuveen Securities, LLC, member FINRA and SIPC | 333 West Wacker Drive Chicago, IL 60606 | www.nuveen.com |  |
EAN-C-1019D 1032024-INV-Y-12/20