| FREE WRITING PROSPECTUS | ||
| FILED PURSUANT TO RULE 433 | ||
| REGISTRATION FILE NO.: 333-228375-01 | ||
 |  |  |
BANK 2019-BNK18
Free Writing Prospectus
Structural and Collateral Term Sheet
$1,046,079,969
(Approximate Total Mortgage Pool Balance)
$877,007,000
(Approximate Offered Certificates)
Banc of America Merrill Lynch Commercial Mortgage Inc.
as Depositor
Wells Fargo Bank, National Association
Morgan Stanley Mortgage Capital Holdings LLC
Bank of America, National Association
National Cooperative Bank, N.A.
as Sponsors and Mortgage Loan Sellers
Commercial Mortgage Pass-Through Certificates
Series 2019-BNK18
May 13, 2019
BOFA MERRILL LYNCH Co-Lead Bookrunner Manager | MORGAN STANLEY Co-Lead Bookrunner Manager | WELLS FARGO SECURITIES Co-Lead Bookrunner Manager |
Academy Securities, Inc. Co-Manager | Drexel Hamilton Co-Manager | |
STATEMENT REGARDING THIS FREE WRITING PROSPECTUS
The depositor has filed a registration statement (including a prospectus) with the SEC (File No. 333-228375) for the offering to which this communication relates. Before you invest, you should read the prospectus in that registration statement and other documents the depositor has filed with the SEC for more complete information about the depositor, the issuing entity and this offering. You may get these documents for free by visiting EDGAR on the SEC web site atwww.sec.gov. Alternatively, the depositor or any underwriter or any dealer participating in the offering will arrange to send you the prospectus if you request it by calling toll free 1-866-294-1322 or by email todg.Prospectus_Requests@baml.com.
This is not a research report and was not prepared by any Underwriter’s research department. Please see additional important information and qualifications at the end of this Term Sheet.
| BANK 2019-BNK18 |
Neither this Term Sheet nor anything contained herein shall form the basis for any contract or commitment whatsoever.The information contained herein is preliminary as of the date hereof.This Term Sheet is subject to change, completion or amendment from time to time.The information contained herein will be superseded by similar information delivered to you as part of the Preliminary Prospectus.The information contained herein supersedes any such information previously delivered.The information contained herein should be reviewed only in conjunction with the entire Preliminary Prospectus.All of the information contained herein is subject to the same limitations and qualifications contained in the Preliminary Prospectus.The information contained herein does not contain all relevant information relating to the underlying mortgage loans or mortgaged properties.Such information is described in the Preliminary Prospectus.The information contained herein will be more fully described in the Preliminary Prospectus.The information contained herein should not be viewed as projections, forecasts, predictions or opinions with respect to value.Prior to making any investment decision, prospective investors are strongly urged to read the Preliminary Prospectus in its entirety.Neither the Securities and Exchange Commission nor any state securities commission has approved or disapproved of these securities or determined if this Term Sheet is truthful or complete.Any representation to the contrary is a criminal offense.
IMPORTANT NOTICE RELATING TO AUTOMATICALLY GENERATED EMAIL DISCLAIMERS
Any legends, disclaimers or other notices that may appear at the bottom of, or attached to, the email communication to which this Term Sheet may have been attached are not applicable to this Term Sheet and should be disregarded. Such legends, disclaimers or other notices have been automatically generated as a result of this Term Sheet having been sent via Bloomberg or another email system.
IMPORTANT NOTICE REGARDING THE CONDITIONS FOR THIS OFFERING OF ASSET-BACKED SECURITIES
THE ASSET-BACKED SECURITIES REFERRED TO IN THIS TERM SHEET ARE BEING OFFERED WHEN, AS AND IF ISSUED. IN PARTICULAR, YOU ARE ADVISED THAT THE ASSET-BACKED SECURITIES, AND THE ASSET POOL BACKING THEM, ARE SUBJECT TO MODIFICATION OR REVISION (INCLUDING, AMONG OTHER THINGS, THE POSSIBILITY THAT ONE OR MORE CLASSES OF SECURITIES MAY BE SPLIT, COMBINED OR ELIMINATED), AT ANY TIME PRIOR TO ISSUANCE OR AVAILABILITY OF A FINAL PROSPECTUS. AS A RESULT, YOU MAY COMMIT TO PURCHASE SECURITIES THAT HAVE CHARACTERISTICS THAT MAY CHANGE, AND YOU ARE ADVISED THAT ALL OR A PORTION OF THE SECURITIES MAY NOT BE ISSUED THAT HAVE THE CHARACTERISTICS DESCRIBED IN THIS TERM SHEET. OUR OBLIGATION TO SELL SECURITIES TO YOU IS CONDITIONED ON THE SECURITIES AND THE UNDERLYING TRANSACTION HAVING THE CHARACTERISTICS DESCRIBED IN THIS TERM SHEET. IF WE DETERMINE THAT THE FOREGOING CONDITION IS NOT SATISFIED IN ANY MATERIAL RESPECT, WE WILL NOTIFY YOU, AND NEITHER THE ISSUING ENTITY NOR ANY UNDERWRITER WILL HAVE ANY OBLIGATION TO YOU TO DELIVER ALL OR ANY PORTION OF THE SECURITIES WHICH YOU HAVE COMMITTED TO PURCHASE, AND THERE WILL BE NO LIABILITY BETWEEN US AS A CONSEQUENCE OF THE NON-DELIVERY.
This is not a research report and was not prepared by any Underwriter’s research department. Please see additional important information and qualifications at the end of this Term Sheet.
T-2
| BANK 2019-BNK18 | Structural Overview |
Offered Certificates
| Class | Expected Ratings (Fitch/KBRA/Moody’s)(1) | Approximate Initial Certificate Balance or Notional Amount(2) | Approximate Initial Credit Support(3) | Pass-Through Rate Description | Expected Weighted Average Life (Years)(4) | Expected Principal Window (Months)(4) | Certificate Principal UW NOI Debt Yield(5) | Certificate Principal to Value Ratio(6) |
| Class A-1 | AAAsf/AAA(sf)/Aaa(sf) | $18,052,000 | 30.000% | (7) | 2.81 | 1-60 | 20.0% | 36.7% |
| Class A-2 | AAAsf/AAA(sf)/Aaa(sf) | $32,774,000 | 30.000% | (7) | 4.96 | 60-60 | 20.0% | 36.7% |
| Class A-SB | AAAsf/AAA(sf)/Aaa(sf) | $30,882,000 | 30.000% | (7) | 7.47 | 60-117 | 20.0% | 36.7% |
| Class A-3 | AAAsf/AAA(sf)/Aaa(sf) | (8) | 30.000% | (7) | (8) | (8) | 20.0% | 36.7% |
| Class A-4 | AAAsf/AAA(sf)/Aaa(sf) | (8) | 30.000% | (7) | (8) | (8) | 20.0% | 36.7% |
| Class X-A | AAAsf/AAA(sf)/Aaa(sf) | $695,643,000(9) | N/A | Variable IO(10) | N/A | N/A | N/A | N/A |
| Class X-B | A-sf/AAA(sf)/NR | $181,364,000(9) | N/A | Variable IO(10) | N/A | N/A | N/A | N/A |
| Class A-S | AAAsf/AAA(sf)/Aa3(sf) | $90,682,000 | 20.875% | (7) | 9.96 | 120-120 | 17.7% | 41.4% |
| Class B | AA-sf/AA(sf)/NR | $49,689,000 | 15.875% | (7) | 9.96 | 120-120 | 16.7% | 44.0% |
| Class C | A-sf/A-(sf)/NR | $40,993,000 | 11.750% | (7) | 9.96 | 120-120 | 15.9% | 46.2% |
Privately Offered Certificates(11)
| Class | Expected Ratings (Fitch/KBRA/Moody’s)(1) | Approximate Initial Certificate Balance or Notional Amount(2) | Approximate Initial Credit Support(3) | Pass-Through Rate Description | Expected Weighted Average Life (Years)(4) | Expected Principal Window (Months)(4) | Certificate Principal UW NOI Debt Yield(5) | Certificate Principal to Value Ratio(6) |
| Class X-D | BBB-sf/BBB-(sf)/NR | $53,415,000(9) | N/A | Variable IO(10) | N/A | N/A | N/A | N/A |
| Class X-F | BBsf/BB-(sf)/NR | $19,876,000(9) | N/A | Variable IO(10) | N/A | N/A | N/A | N/A |
| Class X-G | Bsf/B-(sf)/NR | $9,938,000(9) | N/A | Variable IO(10) | N/A | N/A | N/A | N/A |
| Class X-H | NR/NR/NR | $33,539,971(9) | N/A | Variable IO(10) | N/A | N/A | N/A | N/A |
| Class D | BBBsf/BBB+(sf)/NR | $29,813,000 | 8.750% | (7) | 9.96 | 120-120 | 15.4% | 47.8% |
| Class E | BBB-sf/BBB-(sf)/NR | $23,602,000 | 6.375% | (7) | 9.96 | 120-120 | 15.0% | 49.0% |
| Class F | BBsf/BB-(sf)/NR | $19,876,000 | 4.375% | (7) | 9.96 | 120-120 | 14.6% | 50.1% |
| Class G | Bsf/B-(sf)/NR | $9,938,000 | 3.375% | (7) | 9.96 | 120-120 | 14.5% | 50.6% |
| Class H | NR/NR/NR | $33,539,971 | 0.000% | (7) | 9.97 | 120-121 | 14.0% | 52.4% |
Non-Offered Eligible Vertical Interest(11)
| Class | Expected Ratings (Fitch/KBRA/Moody’s)(1) | Approximate Initial Certificate Balance or Notional Amount(2) | Approximate Initial Credit Support(3) | Pass-Through Rate Description | Expected Weighted Average Life (Years)(4) | Expected Principal Window (Months)(4) | Certificate Principal UW NOI Debt Yield | Certificate Principal to Value Ratio |
| RR Interest | NR/NR/NR | $52,303,998.48 | N/A | (12) | 9.54 | 1-121 | N/A | N/A |
| (1) | Ratings shown are those of Fitch Ratings, Inc. (“Fitch”), Kroll Bond Rating Agency, Inc. (“KBRA”) and Moody’s Investor Service, Inc. (“Moody’s”). Certain nationally recognized statistical rating organizations that were not hired by the depositor may use information they receive pursuant to Rule 17g-5 under the Securities Exchange Act of 1934, as amended, or otherwise to rate the certificates. There can be no assurance as to what ratings a non-hired nationally recognized statistical rating organization would assign. See “Risk Factors—Other Risks Relating to the Certificates—Nationally Recognized Statistical Rating Organizations May Assign Different Ratings to the Certificates; Ratings of the Certificates Reflect Only the Views of the Applicable Rating Agencies as of the Dates Such Ratings Were Issued; Ratings May Affect ERISA Eligibility; Ratings May Be Downgraded” and “Ratings” in the Preliminary Prospectus to be dated on or about the date hereof (the “Preliminary Prospectus”). Capitalized terms used but not defined herein have the meanings assigned to such terms in the Preliminary Prospectus. Fitch, KBRA and Moody’s have informed us that the “sf” designation in the ratings represents an identifier of structured finance product ratings. For additional information about this identifier, prospective investors can go to the related Rating Agency’s website. |
| (2) | Approximate, subject to a permitted variance of plus or minus 5% and further subject to the discussion in footnote (8) below. In addition, the notional amounts of the Class X-A, Class X-B, Class X-D, Class X-F, Class X-G and Class X-H certificates may vary depending upon the final pricing of the classes of principal balance certificates whose certificate balances comprise such notional amounts, and, if as a result of such pricing the pass-through rate of any class of the Class X-A, Class X-B, Class X-D, Class X-F, Class X-G or Class X-H certificates, as applicable, would be equal to zero at all times, such class of certificates will not be issued on the closing date of this securitization. |
| (3) | The approximate initial credit support percentages set forth for the certificates are approximate and, for the Class A-1, Class A-2, Class A-SB, Class A-3 and Class A-4 certificates, are represented in the aggregate. The RR Interest provides credit support only to the limited extent that it is allocated a portion of any losses incurred on the underlying mortgage loans, which such losses are allocated between it, on the one hand, and to the Non-Retained Certificates, on the other hand,pro rata in accordance with their respective Percentage Allocation Entitlements (as defined below). See “Credit Risk Retention” in the Preliminary Prospectus. |
| (4) | The Expected Weighted Average Life and Expected Principal Window during which distributions of principal would be received as set forth in the foregoing table with respect to each class of certificates having a certificate balance are based on the assumptions set forth under “Yield and Maturity Considerations— |
This is not a research report and was not prepared by any Underwriter’s research department. Please see additional important information and qualifications at the end of this Term Sheet.
T-3
| BANK 2019-BNK18 | Structural Overview |
| Weighted Average Life” in the Preliminary Prospectus and on the assumptions that there are no prepayments, modifications or losses in respect of the mortgage loans and that there are no extensions or forbearances of maturity dates or anticipated repayment dates of the mortgage loans. | ||
| (5) | Certificate Principal UW NOI Debt Yield for any class of principal balance certificates (other than the RR Interest) is calculated as the product of (a) the weighted average UW NOI Debt Yield for the mortgage pool, multiplied by (b) a fraction, the numerator of which is the total initial certificate balance of all the principal balance certificates, and the denominator of which is the sum of (x) the total initial certificate balance of the subject class of principal balance certificates and all other classes of principal balance certificates (other than the RR Interest), if any, that are senior to such class and (y) the outstanding certificate balance of the RR Interest, multiplied by the applicable RR Interest Computation Percentage. The Certificate Principal UW NOI Debt Yields of the Class A-1, Class A-2, Class A-SB, Class A-3 and Class A-4 certificates are calculated in the aggregate for those classes as if they were a single class. With respect to any class of principal balance certificates, the “RR Interest Computation Percentage” is equal to a fraction, expressed as a percentage, the numerator of which is the total initial certificate balance of the subject class of principal balance certificates and all other classes of principal balance certificates (other than the RR Interest), if any, that are senior to such class, and the denominator of which is the sum of the total initial certificate balance of all the principal balance certificates (other than the RR Interest). |
| (6) | Certificate Principal to Value Ratio for any class of principal balance certificates (other than the RR Interest) is calculated as the product of (a) the weighted average Cut-off Date LTV Ratio of the mortgage pool, multiplied by (b) a fraction, the numerator of which is the sum of (x) the total initial certificate balance of the subject class of principal balance certificates and all other classes of principal balance certificates (other than the RR Interest), if any, that are senior to such class and (y) the outstanding certificate balance of the RR Interest, multiplied by the applicable RR Interest Computation Percentage, and the denominator of which is the total initial certificate balance of all the principal balance certificates. The Certificate Principal to Value Ratios of the Class A-1, Class A-2, Class A-SB, Class A-3 and Class A-4 certificates are calculated in the aggregate for those classes as if they were a single class. |
| (7) | The pass-through rate for each class of the Class A-1, Class A-2, Class A-SB, Class A-3, Class A-4, Class A-S, Class B, Class C, Class D, Class E, Class F, Class G and Class H certificates (which, together with the RR Interest, are referred to as the “principal balance certificates”) will be one of the following: (i) a fixed rateper annum, (ii) a variable rateper annum equal to the weighted average of the net mortgage interest rates on the mortgage loans for the related distribution date, (iii) a variable rateper annum equal to the lesser of (a) a fixed rate and (b) the weighted average of the net mortgage interest rates on the mortgage loans for the related distribution date or (iv) a variable rateper annum equal to the weighted average of the net mortgage interest rates on the mortgage loans for the related distribution date minus a specified percentage. For purposes of the calculation of the weighted average of the net mortgage interest rates on the mortgage loans for each distribution date, the net mortgage interest rates will be adjusted as necessary to a 30/360 basis. |
| (8) | The exact initial certificate balances of the Class A-3 and Class A-4 certificates are unknown and will be determined based on the final pricing of those classes of certificates. However, the initial certificate balances, weighted average lives and principal windows of the Class A-3 and Class A-4 certificates are expected to be within the applicable ranges reflected in the following chart. The aggregate initial certificate balance of the Class A-3 and Class A-4 certificates is expected to be approximately $613,935,000, subject to a variance of plus or minus 5%. |
| Class of Certificates | Expected Range of Initial Certificate Balance | Expected Range of Weighted Average Life (Years) | Expected Range of Principal Window (Months) |
| Class A-3 | $100,000,000 - $305,000,000 | 9.75 – 9.83 | 117 – 118 / 117 – 119 |
| Class A-4 | $308,935,000 - $513,935,000 | 9.91 – 9.94 | 118 – 120 / 119 – 120 |
| (9) | The Class X-A, Class X-B, Class X-D, Class X-F, Class X-G and Class X-H certificates (collectively referred to as the “Class X certificates”) are notional amount certificates and will not be entitled to distributions of principal. The notional amount of the Class X-A certificates will be equal to the aggregate certificate balance of the Class A-1, Class A-2, Class A-SB, Class A-3 and Class A-4 certificates. The notional amount of the Class X-B certificates will be equal to the aggregate certificate balance of the Class A-S, Class B and Class C certificates. The notional amount of the Class X-D certificates will be equal to the aggregate certificate balance of the Class D and Class E certificates. The notional amount of each class of the Class X-F, Class X-G and Class X-H certificates will be equal to the certificate balance of the class of principal balance certificates that with the addition of “X-”, has the same alphabetical designation as the subject class of Class X certificates. |
| (10) | The pass-through rate for the Class X-A certificates for any distribution date will be aper annumrate equal to the excess, if any, of (a) the weighted average of the net mortgage interest rates on the mortgage loans for the related distribution date, over (b) the weighted average of the pass-through rates on the Class A-1, Class A-2, Class A-SB, Class A-3 and Class A-4 certificates for the related distribution date, weighted on the basis of their respective certificate balances outstanding immediately prior to that distribution date. The pass-through rate for the Class X-B certificates for any distribution date will be aper annumrate equal to the excess, if any, of (a) the weighted average of the net mortgage interest rates on the mortgage loans for the related distribution date, over (b) the weighted average of the pass-through rates on the Class A-S, Class B and Class C certificates for the related distribution date, weighted on the basis of their respective certificate balances outstanding immediately prior to that distribution date. The pass-through rate for the Class X-D certificates for any distribution date will be aper annumrate equal to the excess, if any, of (a) the weighted average of the net mortgage interest rates on the mortgage loans for the related distribution date, over (b) the weighted average of the pass-through rates on the Class D and Class E certificates for the related distribution date, weighted on the basis of their respective certificate balances outstanding immediately prior to that distribution date. The pass-through rate for each class of the Class X-F, Class X-G and Class X-H certificates for any distribution date will be aper annumrate equal to the excess, if any, of (a) the weighted average of the net mortgage interest rates on the mortgage loans for the related distribution date, over (b) the pass-through rate for the related distribution date of the class of principal balance certificates that, with the addition of “X-”, has the same alphabetical designation as the subject class of Class X certificates. For purposes of the calculation of the weighted average of the net mortgage interest rates on the mortgage loans for each distribution date, the net mortgage interest rates will be adjusted as necessary to a 30/360 basis. |
| (11) | Not offered pursuant to the Preliminary Prospectus or this Term Sheet. Information provided in this Term Sheet regarding the characteristics of these certificates is provided only to enhance your understanding of the offered certificates. The privately offered certificates also include the Class V and Class R certificates, which do not have a certificate balance, notional amount, credit support, pass-through rate, rating, assumed final distribution date or rated final distribution date, and which are not shown in the chart. The Class V certificates represent a beneficial ownership interest held through the grantor trust in a specified percentage of certain excess interest in respect of mortgage loans having anticipated repayment dates, if any. The Class R certificates represent the beneficial ownership of the residual interest in each of the real estate mortgage investment conduits, as further described in the Preliminary Prospectus. |
| (12) | Although it does not have a specified pass-through rate (other than for tax reporting purposes), the effective pass-through rate for the RR Interest will be a variable rateper annumequal to the weighted average of the net mortgage interest rates on the mortgage loans for the related distribution date (in each case adjusted, if necessary, to accrue on the basis of a 360-day year consisting of twelve 30-day months). |
This is not a research report and was not prepared by any Underwriter’s research department. Please see additional important information and qualifications at the end of this Term Sheet.
T-4
| BANK 2019-BNK18 | Structural Overview |
Issue Characteristics
| Offered Certificates: | $877,007,000 (approximate) monthly pay, multi-class, commercial mortgage pass-through certificates, consisting of eight principal balance classes (Class A-1, Class A-2, Class A-SB, Class A-3, Class A-4, Class A-S, Class B and Class C) and two interest-only classes (Class X-A and Class X-B) |
| Co-Lead Managers and Joint Bookrunners: | BofA Securities, Inc., Wells Fargo Securities, LLC and Morgan Stanley & Co. LLC |
| Co-Managers: | Academy Securities, Inc. and Drexel Hamilton, LLC |
| Mortgage Loan Sellers: | Wells Fargo Bank, National Association, Morgan Stanley Mortgage Capital Holdings LLC, Bank of America, National Association and National Cooperative Bank, N.A. |
| Rating Agencies: | Fitch, KBRA and Moody’s |
| Master Servicers: | Wells Fargo Bank, National Association and National Cooperative Bank, N.A. |
| Special Servicers: | Rialto Capital Advisors, LLC, National Cooperative Bank, N.A. and Situs Asset Management LLC |
| Certificate Administrator/ Certificate Registrar/Custodian: | Wells Fargo Bank, National Association |
| Trustee: | Wilmington Trust, National Association |
| Operating Advisor: | Pentalpha Surveillance LLC |
| Asset Representations Reviewer: | Pentalpha Surveillance LLC |
| Initial Directing Certificateholder: | RREF III Debt AIV, LP (or another affiliate of Rialto Capital Advisors, LLC) |
| Risk Retention Consultation Party: | Bank of America, National Association |
| U.S. Credit Risk Retention: | For a discussion on the manner in which the U.S. credit risk retention requirements will be addressed by Bank of America, National Association, as the retaining sponsor, see “Credit Risk Retention” in the Preliminary Prospectus. |
| EU Risk Retention: | None of the sponsors, the depositor or any other party intends to retain a material net economic interest in the securitization constituted by the issue of the Offered Certificates or to take any other action in connection with such transaction, in a manner prescribed or contemplated by the EU risk retention and due diligence requirements. |
| Cut-off Date: | The mortgage loans will be considered part of the trust fund as of their respective cut-off dates. The cut-off date with respect to each mortgage loan is the respective due date for the monthly debt service payment that is due in May 2019 (or, in the case of any mortgage loan that has its first due date after May 2019, the date that would have been its due date in May 2019 under the terms of that mortgage loan if a monthly debt service payment were scheduled to be due in that month). |
| Expected Pricing Date: | Week of May 13, 2019 |
| Expected Closing Date: | May 31, 2019 |
| Determination Dates: | The 11th day of each month or, if the 11th day is not a business day, then the business day immediately following such 11th day. |
| Distribution Dates: | The 4th business day following each determination date. The first distribution date will be in June 2019. |
| Rated Final Distribution Date: | The distribution date in May 2062 |
| Interest Accrual Period: | Preceding calendar month |
| Payment Structure: | Sequential pay |
| Tax Treatment: | REMIC |
| Optional Termination: | 1.00% clean-up call (solely for the purposes of this calculation, if such right is being exercised after June 2029 and the Newport Corporate Center mortgage loan is still an asset of the trust, then such mortgage loan will be excluded from the then-aggregate principal balance of the pool of mortgage loans and from the initial pool balance) |
| Minimum Denominations: | $10,000 for each class of Offered Certificates (other than Class X-A and Class X-B certificates); $1,000,000 for the Class X-A and Class X-B certificates |
| Settlement Terms: | DTC, Euroclear and Clearstream |
| Legal/Regulatory Status: | Each class of Offered Certificates is expected to be eligible for exemptive relief under ERISA. No class of Offered Certificates is SMMEA eligible. |
| Analytics: | The certificate administrator is expected to make available all distribution date statements, CREFC® reports and supplemental notices received by it to certain modeling financial services as described in the Preliminary Prospectus. |
| Bloomberg Ticker: | BANK 2019-BN18<MTGE><GO> |
| Risk Factors: | THE CERTIFICATES INVOLVE CERTAIN RISKS AND MAY NOT BE SUITABLE FOR ALL INVESTORS. SEE THE “RISK FACTORS” SECTION OF THE PRELIMINARY PROSPECTUS. |
This is not a research report and was not prepared by any Underwriter’s research department. Please see additional important information and qualifications at the end of this Term Sheet.
T-5
| BANK 2019-BNK18 | Structural Overview |
Structural Overview
| Allocation Between the RR Interest and the Non-Retained Certificates: | The aggregate amount available for distributions to the holders of the Certificates (including the RR Interest) on each distribution date (net of specified expenses of the issuing entity, including fees payable to, and costs and expenses reimbursable to, the master servicers, any primary servicers, the special servicers, the certificate administrator, the trustee, the operating advisor, the asset representations reviewer and CREFC®) will be allocated between amounts available for distribution to the holders of the RR Interest, on the one hand, and to all other Certificates (other than the Class R Certificates), referred to herein as the “Non-Retained Certificates”, on the other hand. The portion of such amount allocable to (a) the RR Interest will at all times be the product of such amount multiplied by 5% and (b) the Non-Retained Certificates will at all times be the product of such amount multiplied by the difference between 100% and the percentage set forth in clause (a) (each, the respective “Percentage Allocation Entitlement”). |
| Accrual: | Each class of Offered Certificates will accrue interest on a 30/360 basis. |
| Amount and Order of Distributions: | On each distribution date, the Non-Retained Certificates’ Percentage Allocation Entitlement of funds available for distribution from the mortgage loans, net of (i) any yield maintenance charges and prepayment premiums and (ii) any excess interest, will be distributed in the following amounts and order of priority:
First, to the Class A-1, Class A-2, Class A-SB, Class A-3, Class A-4, Class X-A, Class X-B, Class X-D, Class X-F, Class X-G and Class X-H certificates, in respect of interest, up to an amount equal to, andpro rata in accordance with, the interest entitlements for those classes;
Second, to the Class A-1, Class A-2, Class A-SB, Class A-3 and Class A-4 certificates as follows, to the extent of applicable available funds allocated to principal: either (i)(a)first, to principal on the Class A-SB certificates, until the certificate balance of the Class A-SB certificates is reduced to the planned principal balance for the related distribution date set forth in Annex E to the Preliminary Prospectus, and (b)second, to principal on each class of the Class A-1, Class A-2, Class A-3, Class A-4 and Class A-SB certificates, in that order, in each case until the certificate balance of such class of certificates has been reduced to zero, or (ii) if the certificate balance of each class of principal balance certificates other than the Class A-1, Class A-2, Class A-SB, Class A-3 and Class A-4 certificates and the RR Interest has been reduced to zero as a result of the allocation of losses on the mortgage loans to those certificates, to principal on the Class A-1, Class A-2, Class A-SB, Class A-3 and Class A-4 certificates,pro rata, without regard to the distribution priorities described above or the planned principal balance of the Class A-SB certificates;
Third, to the Class A-1, Class A-2, Class A-SB, Class A-3 and Class A-4 certificates, first, up to an amount equal to, andpro rata based on, any previously unreimbursed losses on the mortgage loans allocable to principal that were previously borne by each such class and then in the amount of interest thereon;
Fourth, to each class of the Class A-S, Class B and Class C certificates, in that order, in each case as follows: (a) to interest on such class of certificates in the amount of its interest entitlement; (b) to the extent of applicable available funds allocable to principal remaining after distributions in respect of principal to each class with a higher priority (as set forth in this clause or prior enumerated clauses set forth above), to principal on such class of certificates until its certificate balance has been reduced to zero; and (c) to reimburse such class of certificates, first, in the amount of any previously unreimbursed losses on the mortgage loans that were previously allocated to those certificates, then in the amount of interest thereon;
Fifth, to the principal balance certificates (other than the Class A-1, Class A-2, Class A-SB, Class A-3, Class A-4, Class A-S, Class B and Class C certificates and the RR Interest) in the amounts and order of priority described in “Description of the Certificates—Distributions” in the Preliminary Prospectus; and
Sixth, to the Class R certificates, any remaining amounts.
|
| Interest and Principal Entitlements: | The interest entitlement of each class of Offered Certificates on each distribution date generally will be the interest accrued during the related interest accrual period on the related certificate balance or notional amount at the related pass-through rate, net of any prepayment interest shortfalls allocated to that class for such distribution date as described below. If prepayment interest shortfalls arise from voluntary prepayments on serviced mortgage loans during any collection period, the applicable master servicer is required to make a limited compensating interest payment to offset those shortfalls. See “Description of the Certificates—Prepayment Interest Shortfalls” in the Preliminary Prospectus. The remaining amount of prepayment interest shortfalls will be allocated between the RR Interest, on one hand, and the Non-Retained Certificates, on the other hand, in accordance with their respective Percentage Allocation Entitlements. The prepayment interest shortfalls allocated to the Non-Retained Certificates (other than the Class V Certificates) will be allocated among such classes of certificates entitled to interest, on apro rata basis, based on their respective amounts of accrued interest for the related distribution date, to reduce the interest entitlement on each such class of certificates. If a class receives less than the entirety of its interest entitlement on any distribution date, then the shortfall (excluding any shortfall due to prepayment interest shortfalls), together with interest thereon, will be added to its interest entitlement for the next succeeding distribution date.
The aggregate principal distribution amount for each distribution date generally will be the aggregate amount of principal received or advanced in respect of the mortgage loans, net of any non-recoverable advances and interest thereon and any workout-delayed reimbursement amounts that are reimbursed to the applicable master servicer or the trustee during the related collection period. Non-recoverable advances and interest thereon are reimbursable from principal collections before reimbursement from other amounts. Workout-delayed reimbursement amounts will be reimbursable from principal collections. The Non-Retained Certificates and the RR Interest will be entitled to their respective Percentage Allocation Entitlements of the aggregate principal distribution amount. |
This is not a research report and was not prepared by any Underwriter’s research department. Please see additional important information and qualifications at the end of this Term Sheet.
T-6
| BANK 2019-BNK18 | Structural Overview |
| Special Servicer Compensation: | The principal compensation to be paid to a special servicer in respect of its special servicing activities will be the special servicing fee, the workout fee and the liquidation fee.
The special servicing fee for each distribution date is calculated based on the outstanding principal balance of each serviced mortgage loan that is a specially serviced mortgage loan (and any related serviced companion loan) or as to which the related mortgaged property has become an REO property at the special servicing fee rate, which will be a rate equal to (a) with respect to Rialto Capital Advisors, LLC, the greater of 0.25% and the per annum rate that would result in a special servicing fee for the related month of (i) $3,500 or (ii) with respect to any mortgage loan with respect to which the risk retention consultation party is entitled to consult with the special servicer, for so long as the related mortgage loan is a specially serviced loan during the occurrence and continuance of a consultation termination event, $5,000, (b) with respect to National Cooperative Bank, N.A., the greater of 0.25% and the per annum rate that would result in a special servicing fee of $1,000 for the related month, and (c) with respect to Situs Asset Management LLC, the greater of 0.25% and the per annum rate that would result in a special servicing fee for the related month of (i) $3,500 or (ii) with respect to any mortgage loan with respect to which the risk retention consultation party is entitled to consult with the special servicer, for so long as the related mortgage loan is a specially serviced loan during the occurrence and continuance of a consultation termination event, $5,000. The special servicing fee will be payable monthly,first,from liquidation proceeds, insurance and condemnation proceeds, and other collections in respect of the related specially serviced mortgage loan or REO property and,then, from general collections on all the mortgage loans and any REO properties.
Each special servicer will also be entitled to (i) liquidation fees generally equal to 1.0% (or, if such rate would result in an aggregate liquidation fee less than $25,000, then the liquidation fee rate will be equal to the lesser of (i) 3.0% and (ii) such lower rate as would result in an aggregate liquidation fee equal to $25,000) of liquidation proceeds and certain other collections in respect of a specially serviced mortgage loan (and any related serviced companion loan) or related REO property and of amounts received in respect of mortgage loan repurchases by the related mortgage loan sellers and (ii) workout fees generally equal to 1.0% of interest (other than post-ARD excess interest on mortgage loans with anticipated repayment dates and other than default interest) and principal payments made in respect of a rehabilitated mortgage loan (and any related serviced companion loan), subject to a floor of $25,000 with respect to any mortgage loan, whole loan or related REO property, and in the case of each of clause (i) and (ii), subject to certain adjustments and exceptions as described in the Preliminary Prospectus under “Pooling and Servicing Agreement—Servicing and Other Compensation and Payment of Expenses—Special Servicing Compensation”.
With respect to any non-serviced mortgage loan, the related special servicer under the related other pooling and servicing agreement pursuant to which such mortgage loan is being serviced will be entitled to similar compensation as that described above with respect to such non-serviced mortgage loan under such other pooling and servicing agreement as further described in the Preliminary Prospectus, although any related fees may accrue at a different rate and there may be a higher (or no) cap on liquidation and workout fees.
|
| Prepayment Premiums/Yield Maintenance Charges: | If any yield maintenance charge or prepayment premium is collected during any collection period with respect to any mortgage loan, then on the immediately succeeding distribution date, the certificate administrator will pay: (i)(a) to the holders of each class of the Class A-1, Class A-2, Class A-SB, Class A-3, Class A-4, Class A-S, Class B, Class C, Class D and Class E certificates, the product of (x) the Non-Retained Certificates’ Percentage Allocation Entitlement of such yield maintenance charge or prepayment premium, (y) the related Base Interest Fraction for such class and the applicable principal prepayment, and (z) a fraction, the numerator of which is equal to the amount of principal distributed to such class for that distribution date, and the denominator of which is the total amount of principal distributed to the Class A-1, Class A-2, Class A-SB, Class A-3, Class A-4, Class A-S, Class B, Class C, Class D and Class E certificates for that distribution date, (b) to the holders of the Class X-A certificates, the excess, if any, of (x) the product of (1) the Non- Retained Certificates’ Percentage Allocation Entitlement of such yield maintenance charge or prepayment premium and (2) a fraction, the numerator of which is equal to the amount of principal distributed to the Class A-1, Class A-2, Class A-SB, Class A-3 and Class A-4 certificates for that distribution date, and the denominator of which is the total amount of principal distributed to the Class A-1, Class A-2, Class A-SB, Class A-3, Class A-4, Class A-S, Class B, Class C, Class D and Class E certificates for that distribution date, over (y) the amount of such yield maintenance charge or prepayment premium distributed to the Class A-1, Class A-2, Class A-SB, Class A-3 and Class A-4 certificates as described above, (c) to the holders of the Class X-B certificates, the excess, if any, of (x) the product of (1) the Non-Retained Certificates’ Percentage Allocation Entitlement of such yield maintenance charge or prepayment premium and (2) a fraction, the numerator of which is equal to the amount of principal distributed to the Class A-S, Class B and Class C certificates for that distribution date, and the denominator of which is the total amount of principal distributed to the Class A-1, Class A-2, Class A-SB, Class A-3, Class A-4, Class A-S, Class B, Class C, Class D and Class E certificates for that distribution date, over (y) the amount of such yield maintenance charge or prepayment premium distributed to the Class A-S, Class B and Class C certificates as described above, and (d) to the holders of the Class X-D certificates, any remaining portion of the Non-Retained Certificates’ Percentage Allocation Entitlement of such yield maintenance charge or prepayment premium not distributed as described above, and (ii) to the RR Interest, its Percentage Allocation Entitlement of such yield maintenance charge or prepayment premium. All yield maintenance charges and prepayment premiums referred to above will be net of any liquidation fees payable therefrom. No prepayment premiums or yield maintenance charges will be distributed to the holders of the Class X-F, Class X-G, Class X-H, Class F, Class G, Class H, Class V or Class R Certificates. “Base Interest Fraction” means, with respect to any principal prepayment of any mortgage loan that provides for the payment of a yield maintenance charge or prepayment premium, and with respect to any class of principal balance certificates (other than the RR Interest), a fraction (A) the numerator of which is the greater of (x) zero |
This is not a research report and was not prepared by any Underwriter’s research department. Please see additional important information and qualifications at the end of this Term Sheet.
T-7
| BANK 2019-BNK18 | Structural Overview |
| and (y) the difference between (i) the pass-through rate on that class, and (ii) the applicable discount rate and (B) the denominator of which is the difference between (i) the mortgage interest rate on the related mortgage loan and (ii) the applicable discount rate; provided, that: under no circumstances will the Base Interest Fraction be greater than one; if the discount rate referred to above is greater than or equal to both the mortgage interest rate on the related mortgage loan and the pass-through rate on that class, then the Base Interest Fraction will equal zero; and if the discount rate referred to above is greater than or equal to the mortgage interest rate on the related mortgage loan and is less than the pass-through rate on that class, then the Base Interest Fraction will be equal to 1.0. Consistent with the foregoing, the Base Interest Fraction is equal to: | |
| (Pass-Through Rate – Discount Rate) | |||
| (Mortgage Rate – Discount Rate) | |||
| Realized Losses: | On each distribution date, immediately following the distributions to be made to the certificateholders on that date, the certificate administrator is required to calculate the amount, if any, by which (i) the aggregate stated principal balance of the mortgage loans, including any successor REO loans, expected to be outstanding immediately following that distribution date is less than (ii) the then aggregate certificate balance of the principal balance certificates after giving effect to distributions of principal on that distribution date. The Non-Retained Certificates’ Percentage Allocation Entitlement of such amount will be applied to the Class H, Class G, Class F, Class E, Class D, Class C, Class B and Class A-S certificates, in that order, in each case until the related certificate balance has been reduced to zero, and then to the Class A-1, Class A-2, Class A-SB, Class A-3 and Class A-4 certificates,pro rata based upon their respective certificate balances, until their respective certificate balances have been reduced to zero. The RR Interest’s Percentage Allocation Entitlement of such amount will be applied to the RR Interest until the related RR Interest balance has been reduced to zero. |
| Serviced Whole Loans: | Each of the following mortgaged properties or portfolio of mortgaged properties secures a mortgage loan and one or morepari passu promissory notes and, in some cases, one or more generally subordinate promissory notes (each, a “serviced companion loan”) that will be serviced pursuant to the related intercreditor agreement and the pooling and servicing agreement for this transaction: 350 Bush Street, The Alhambra, Ford Factory, Newport Corporate Center, 9201 West Sunset Boulevard, Central Tower and Westin Atlanta Airport. With respect to each such mortgaged property or portfolio of mortgaged properties, the related mortgage loan, together with the related serviced companion loan(s), is referred to herein (for so long as it is serviced under the pooling and servicing agreement for this transaction) as a “serviced whole loan.” Each serviced companion loan is not part of the mortgage pool and may be contributed to one or more future securitization transactions (if not already securitized) or may be otherwise transferred at any time, subject to compliance with the related intercreditor agreement. See the table below entitled “Mortgage Loans with Pari Passu Companion Loans,” as well as “Description of the Mortgage Pool—The Whole Loans” in the Preliminary Prospectus, for additional information regarding each such whole loan. |
| Non-Serviced Whole Loans: | Each of the following mortgaged properties or portfolio of mortgaged properties secures a mortgage loan (each, a “non-serviced mortgage loan”), one or morepari passu promissory notes and, in some cases, one or more generally subordinate promissory notes (each such promissory note, a “non-serviced companion loan”) that will be serviced pursuant to the related intercreditor agreement and the pooling and servicing agreement or trust and servicing agreement (referred to herein as a related “pooling and servicing agreement”) for another securitization transaction: ILPT Hawaii Portfolio and Great Wolf Lodge Southern California. With respect to each such mortgaged property or portfolio of mortgaged properties, the related mortgage loan, together with the related non-serviced companion loan(s), is referred to herein (for so long as it is serviced under the pooling and servicing agreement for another securitization transaction) as a “non-serviced whole loan.” Each non-serviced companion loan is not part of the mortgage pool and may be contributed to one or more future securitization transactions (if not already securitized) or may be otherwise transferred at any time, subject to compliance with the related intercreditor agreement. Servicing of each non-serviced whole loan will generally be directed by the holder of the related control note (or, if such control note is included in a securitization, the directing certificateholder thereunder (or other party designated thereunder to exercise the rights of such control note)), and such holder will have the right to replace the special servicer with respect to the related whole loan with or without cause. See the tables below entitled “Mortgage Loans with Pari Passu Companion Loans” and“Mortgage Loans with Subordinate Debt,” as well as “Description of the Mortgage Pool—The Whole Loans” in the Preliminary Prospectus, for additional information regarding each such whole loan. |
| Directing Certificateholder/ Controlling Class: | The “Directing Certificateholder” will be the Controlling Class Certificateholder (or its representative) selected by more than 50% (by certificate balance) of the Controlling Class Certificateholders;provided, that (1) absent that selection, (2) until a Directing Certificateholder is so selected or (3) upon receipt of a notice from a majority of the Controlling Class Certificateholders (by certificate balance) that a Directing Certificateholder is no longer designated, the Controlling Class Certificateholder that owns the largest aggregate certificate balance of the Controlling Class (or its representative) will be the Directing Certificateholder;provided, that (a) in the case of clause (3), if no one holder owns the largest aggregate certificate balance of the Controlling Class, then there will be no Directing Certificateholder until appointed in accordance with the terms of the pooling and servicing agreement, and (b) the certificate administrator and the other parties to the pooling and servicing agreement will be entitled to assume that the identity of the Directing Certificateholder has not changed until such parties receive written notice of a replacement of the Directing Certificateholder from a party holding the requisite interest in the Controlling Class (as confirmed by the certificate registrar), or the resignation of the then current Directing Certificateholder. |
This is not a research report and was not prepared by any Underwriter’s research department. Please see additional important information and qualifications at the end of this Term Sheet.
T-8
| BANK 2019-BNK18 | Structural Overview |
As used herein, the term “Directing Certificateholder” means the entity determined pursuant to clause (ii) of the definition of such term.
The “Controlling Class” will be, as of any time of determination, the most subordinate class of Control Eligible Certificates then outstanding that has an aggregate certificate balance (as notionally reduced by any Cumulative Appraisal Reduction Amounts (as defined below) allocable to such class) at least equal to 25% of the initial certificate balance of that class; provided, that if at any time the certificate balances of the certificates other than the Control Eligible Certificates and the RR Interest have been reduced to zero as a result of principal payments on the mortgage loans, then the Controlling Class will be the most subordinate class of Control Eligible Certificates that has a certificate balance greater than zero without regard to any Cumulative Appraisal Reduction Amounts. The Controlling Class as of the closing date will be the Class H certificates.
The “Control Eligible Certificates” will be any of the Class G or Class H certificates.
| |
| Control Rights: | Prior to a Control Termination Event, the Directing Certificateholder will have certain consent and consultation rights under the pooling and servicing agreement with respect to certain major decisions and other matters. A “Control Termination Event” will occur when (i) the Class G certificates have a certificate balance (taking into account the application of the allocable portion of any Cumulative Appraisal Reduction Amounts to notionally reduce the certificate balance thereof) of less than 25% of the initial certificate balance of that class; or (ii) a holder of the Class G certificates is the majority controlling class certificateholder and has irrevocably waived its right, in writing, to exercise any of the rights of the controlling class certificateholder and such rights have not been reinstated to a successor controlling class certificateholder; provided that no Control Termination Event may occur with respect to the Loan-Specific Directing Certificateholder, and the term “Control Termination Event” will not be applicable to the Loan-Specific Directing Certificateholder; provided, further, that a Control Termination Event will be deemed not continuing in the event that the certificate balances of the principal balance certificates other than the Control Eligible Certificates and the RR Interest have been reduced to zero as a result of principal payments on the mortgage loans.
After the occurrence of a Control Termination Event but prior to the occurrence of a Consultation Termination Event, the Directing Certificateholder will not have any consent rights, but the Directing Certificateholder will have certain non-binding consultation rights under the pooling and servicing agreement with respect to certain major decisions and other matters. A “Consultation Termination Event” will occur when (i) no class of Control Eligible Certificates has a certificate balance (without regard to the application of the allocable portion of any Cumulative Appraisal Reduction Amounts) at least equal to 25% of the initial certificate balance of that class; or (ii) a holder of a majority of the Class G certificates is the majority controlling class certificateholder and has irrevocably waived its right, in writing, to exercise any of the rights of the controlling class certificateholder and such rights have not been reinstated to a successor controlling class certificateholder (provided that no Consultation Termination Event resulting solely from the operation of clause (ii) will be deemed to have existed or be in continuance with respect to a successor holder of the Class G certificates that has not irrevocably waived its right to exercise any of the rights of the controlling class certificateholder); provided that no Consultation Termination Event may occur with respect to the Loan-Specific Directing Certificateholder, and the term “Consultation Termination Event” will not be applicable to the Loan-Specific Directing Certificateholder; provided, further, that a Consultation Termination Event will be deemed not continuing in the event that the certificate balances of the principal balance certificates other than the Control Eligible Certificates and the RR Interest have been reduced to zero as a result of principal payments on the mortgage loans.
After the occurrence of a Consultation Termination Event, the Directing Certificateholder will not have any consent or consultation rights, except with respect to any rights expressly set forth in the pooling and servicing agreement, and the operating advisor will retain certain non-binding consultation rights under the pooling and servicing agreement with respect to certain major decisions and other matters.
Notwithstanding the proviso to the definitions of “Control Termination Event” and “Consultation Termination Event”, a Control Termination Event and a Consultation Termination Event will each be deemed to have occurred with respect to any Excluded Loan with respect to the Directing Certificateholder or the holder of the majority of the Controlling Class, and neither the Directing Certificateholder nor any Controlling Class Certificateholder will have any consent or consultation rights with respect to the servicing of such Excluded Loan.
An “Excluded Loan” means (a) with respect to the Directing Certificateholder or the holder of the majority of the Controlling Class, a mortgage loan or whole loan with respect to which, as of any date of determination, the Directing Certificateholder or the holder of the majority of the Controlling Class is a Borrower Party or (b) with respect to the Risk Retention Consultation Party or the holder of the majority of the RR Interest, a mortgage loan or whole loan with respect to which, as of any date of determination, the Risk Retention Consultation Party or the holder of the majority of the RR Interest is a Borrower Party. It is expected that there will be no Excluded Loans with respect to this securitization on the Closing Date.
“Borrower Party” means a borrower, a mortgagor, a manager of a mortgaged property, the holder of a mezzanine loan that has been accelerated or as to which foreclosure or enforcement proceedings have been commenced against the equity collateral pledged to secure the related mezzanine loan, or any Borrower Party Affiliate. With respect to a mortgage loan secured by a residential cooperative property, a person will not be considered a “Borrower Party” solely by reason of such person holding one or more cooperative unit loans that are secured by direct equity interests in the related borrower or owning one or more residential cooperative units comprising the related mortgaged property as a result of any foreclosure, transfer in lieu of foreclosure or other exercise of remedies with respect to any such unit loan(s).
“Borrower Party Affiliate” means, with respect to a borrower, a mortgagor, a manager of a mortgaged property or the holder of a mezzanine loan that has been accelerated or as to which foreclosure or enforcement proceedings have been commenced against the equity collateral pledged to secure the related mezzanine loan, (a) any other person controlling or controlled by or under common control with such borrower, mortgagor, |
This is not a research report and was not prepared by any Underwriter’s research department. Please see additional important information and qualifications at the end of this Term Sheet.
T-9
| BANK 2019-BNK18 | Structural Overview |
manager or mezzanine lender, as applicable, or (b) any other person owning, directly or indirectly, 25% or more of the beneficial interests in such borrower, mortgagor, manager or mezzanine lender, as applicable. For the purposes of this definition, “control” when used with respect to any specified person means the power to direct the management and policies of such person, directly or indirectly, whether through the ownership of voting securities, by contract or otherwise and the terms “controlling” and “controlled” have meanings correlative to the foregoing.
Notwithstanding any of the foregoing to the contrary, if any mortgage loan is part of a whole loan, the Directing Certificateholder’s consent and/or consultation rights with respect thereto may be limited as described in the Preliminary Prospectus. In particular, with respect to each non-serviced whole loan, the Directing Certificateholder (other than a Loan-Specific Directing Certificateholder) will only have certain consultation rights with respect to certain major decisions and other matters related to such whole loan, in each case only prior to a Control Termination Event or Consultation Termination Event, as applicable, and the Loan-Specific Directing Certificateholder will be entitled to similar consent and/or consultation rights with respect to such whole loan. In addition, with respect to any serviced A/B whole loan, for so long as the holder of the related subordinate companion loan is the controlling note holder, the holder of such subordinate companion loan (rather than the Directing Certificateholder) will be entitled to exercise such consent and consultation rights with respect to such whole loan.
| |
| Appraisal Reduction Amounts and Collateral Deficiency Amounts: | An “Appraisal Reduction Amount” generally will be created in the amount, if any, by which the principal balance of a required appraisal loan (which is a mortgage loan with respect to which certain defaults, modifications or insolvency events have occurred as further described in the Preliminary Prospectus) plus other amounts overdue or advanced in connection with such mortgage loan exceeds 90% of the appraised value of the related mortgaged property plus certain escrows and reserves (including letters of credit) held with respect to the mortgage loan.
As used herein, a “Cumulative Appraisal Reduction Amount” will be the sum of any Appraisal Reduction Amounts and any Collateral Deficiency Amounts.
Any Appraisal Reduction Amount in respect of any non-serviced mortgage loan generally will be calculated in accordance with the other servicing agreement pursuant to which such mortgage loan is being serviced, which calculations are expected to be generally similar to those provided for in the pooling and servicing agreement for this transaction.
If any mortgage loan is part of a whole loan, any Appraisal Reduction Amount or Collateral Deficiency Amount will (or effectively will) be calculated in respect of such whole loan taken as a whole and allocated, to the extent provided in the related intercreditor agreement and the related pooling and servicing agreement,first, to any related subordinate companion loan, andsecond, to the related mortgage loan and anypari passu companion loan on apro rata basis by unpaid principal balance.
Appraisal Reduction Amounts will proportionately reduce the interest portion of debt service advances required to be made in respect of the related mortgage loan. Appraisal Reduction Amounts and Collateral Deficiency Amounts (in each case, to the extent of the Non-Retained Certificates’ Percentage Allocation Entitlement thereof) will be taken into account in determining the identity of the controlling class entitled to appoint the Directing Certificateholder, the existence of a Control Termination Event and the allocation and/or exercise of voting rights for certain purposes (see“Directing Certificateholder/Controlling Class” above).
|
| Appraised-Out Class: | An “Appraised-Out Class” is any class of Control Eligible Certificates, the certificate balance of which (taking into account the application of the Non-Retained Certificates’ Percentage Allocation Entitlement of any Appraisal Reduction Amounts or Collateral Deficiency Amounts to notionally reduce the certificate balance of such class) has been reduced to less than 25% of its initial certificate balance. Any Appraised-Out Class may not exercise any direction, control, consent and/or similar rights of the Controlling Class until such time, if any, as such class is reinstated as the Controlling Class, and the rights of the Controlling Class will be exercised by the next most senior class of Control Eligible Certificates that is not an Appraised-Out Class, if any, during such period. |
This is not a research report and was not prepared by any Underwriter’s research department. Please see additional important information and qualifications at the end of this Term Sheet.
T-10
| BANK 2019-BNK18 | Structural Overview |
| Appraisal Remedy: | The holders of the majority (by certificate balance) of an Appraised-Out Class (such holders, the “Requesting Holders”) will have the right, at their sole expense, to require the applicable special servicer to order (or, with respect to a non-serviced mortgage loan, require the applicable special servicer to request from the applicable non-serviced special servicer) a second appraisal of any mortgage loan (or serviced whole loan) for which an appraisal reduction event has occurred or as to which there exists a Collateral Deficiency Amount. With respect to any serviced mortgage loan, the applicable special servicer will be required to use its reasonable efforts to ensure that such appraisal is delivered within 30 days from receipt of the Requesting Holders’ written request and will be required to cause such appraisal to be prepared on an “as-is” basis by an MAI appraiser. With respect to any non-serviced mortgage loan, the applicable special servicer will be required to use commercially reasonable efforts to obtain such second appraisal from the applicable non-serviced special servicer. Upon receipt of such supplemental appraisal, the applicable special servicer will be required to determine, in accordance with the Servicing Standard, whether, based on its assessment of such supplemental appraisal, any recalculation of the applicable Appraisal Reduction Amount or Collateral Deficiency Amount is warranted and, if so warranted, such person will be required to recalculate such Appraisal Reduction Amount or Collateral Deficiency Amount, as applicable, based upon such supplemental appraisal and information reasonably requested by such special servicer from the applicable non-serviced special servicer. If required by any such recalculation, the applicable Appraised-Out Class will be reinstated as the Controlling Class and each Appraised-Out Class will, if applicable, have its related certificate balance notionally restored to the extent required by such recalculation of the Appraisal Reduction Amount or Collateral Deficiency Amount, if applicable.
In addition, the Requesting Holders of any Appraised-Out Class will have the right to challenge the Appraisal Reduction Amount and to require the special servicer to order an additional appraisal of any serviced mortgage loan as to which there exists a Collateral Deficiency Amount if an event has occurred at, or with respect to, the related mortgaged property or mortgaged properties that would have a material effect on its or their appraised value, and the special servicer is required to use reasonable efforts to obtain an appraisal from an MAI appraiser reasonably acceptable to the special servicer within 30 days from receipt of the Requesting Holders’ written request.
|
| Sale of Defaulted Loans: | Under certain circumstances the applicable special servicer may be required to use reasonable efforts to solicit offers for a defaulted serviced mortgage loan (and any related companion loan (to the extent provided under the related intercreditor agreement) and/or related REO properties).
The Directing Certificateholder will not have a right of first refusal to purchase a defaulted loan.
If the applicable special servicer does not receive an offer at least equal to the outstanding principal balance plus all accrued and unpaid interest and outstanding costs and expenses and certain other amounts specified in the pooling and servicing agreement (the “Par Purchase Price”), the applicable special servicer may purchase the defaulted loan or REO property at the Par Purchase Price or may accept the first cash offer received from any person that is determined to be a fair price for such defaulted loan or REO property. If multiple offers are received during the period designated by the applicable special servicer for receipt of offers, such special servicer is generally required to select the highest offer. The applicable special servicer will be required to determine whether any cash offer constitutes a fair price for any defaulted loan or REO property if the highest offeror is a person other than a party to the pooling and servicing agreement for this transaction (the “PSA”), the Directing Certificateholder, the Risk Retention Consultation Party, any sponsor, any Borrower Party, any independent contractor engaged by a special servicer, the trustee for the securitization of a related companion loan (with respect to a whole loan if it is a defaulted loan), any related companion loan holder or its representative, any holder of a related mezzanine loan or any known affiliate of any of the preceding entities (each, an “Interested Person”). If an offer is made by an Interested Person, the trustee will be required to determine (based upon the most recent appraisal conducted in accordance with the terms of the PSA) whether the offer constitutes a fair price for the defaulted loan or REO property unless (i) the offer is equal to or greater than the applicable Par Purchase Price and (ii) the offer is the highest offer received. Absent an offer at least equal to the Par Purchase Price, no offer from an Interested Person will constitute a fair price unless (x) it is the highest offer received and (y) at least two other offers are received from independent third parties. Neither the trustee nor any of its affiliates may make an offer for or purchase any specially serviced loan or REO property.
Notwithstanding any of the foregoing to the contrary, the applicable special servicer is not required to accept the highest offer and may accept a lower offer for a defaulted loan or REO property if such special servicer determines, in accordance with the Servicing Standard (and subject to the requirements of any related intercreditor agreement), that a rejection of such offer would be in the best interests of the certificateholders and any related companion loan holders as a collective whole as if they constituted a single lender (and with respect to a serviced A/B whole loan, taking into account the subordinate nature of any related subordinate companion loan), so long as such lower offer was not made by such special servicer or any of its affiliates.
If title to any mortgaged property is acquired by the trust fund, the applicable special servicer will generally be required to sell such mortgaged property prior to the close of the third calendar year beginning after the year of acquisition.
The foregoing applies to mortgage loans serviced under the PSA. With respect to any non-serviced whole loan, if the special servicer under the applicable pooling and servicing agreement determines to sell the related controlling companion loan if it becomes a defaulted loan, then the applicable special servicer will be required to sell the related whole loan, including the related mortgage loan included in the BANK 2019-BNK18 securitization trust and the relatedpari passucompanion loan(s) and, under certain circumstances, any subordinate companion loan(s), as a single loan. In connection with any such sale, the special servicer under the applicable pooling and servicing agreement will be required to follow procedures substantially similar to those set forth above.
|
This is not a research report and was not prepared by any Underwriter’s research department. Please see additional important information and qualifications at the end of this Term Sheet.
T-11
| BANK 2019-BNK18 | Structural Overview |
| Risk Retention Consultation Party: | A risk retention consultation party may be appointed by the holder or holders of more than 50% of the RR Interest, by certificate balance. The majority RR Interest holder will have a continuing right to appoint, remove or replace the risk retention consultation party in its sole discretion. This right may be exercised at any time and from time to time. Except with respect to an Excluded Loan as to such party or the holder of the majority of the RR Interest, the risk retention consultation party will be entitled to consult with the applicable special servicer, upon request of the risk retention consultation party, with respect to certain material servicing actions proposed by such special servicer; provided, that prior to the occurrence and continuance of a Consultation Termination Event, such mortgage loan must also be a specially serviced mortgage loan. |
| Appointment and Replacement of a Special Servicer: | The Directing Certificateholder will appoint the initial special servicers as of the closing date. Prior to the occurrence and continuance of a Control Termination Event, any special servicer may generally be replaced by the Directing Certificateholder with or without cause at any time.
After the occurrence and during the continuance of a Control Termination Event and upon (a) the written direction of holders of principal balance certificates evidencing not less than 25% of the voting rights of all classes of certificates (other than the RR Interest) entitled to principal (taking into account the application of Cumulative Appraisal Reduction Amounts to notionally reduce the certificate balances of classes to which such Cumulative Appraisal Reduction Amounts are allocable) requesting a vote to replace the applicable special servicer with a replacement special servicer, (b) payment by such requesting holders to the certificate administrator of all reasonable fees and expenses to be incurred by the certificate administrator in connection with administering such vote and (c) delivery by such holders of a rating agency confirmation from each applicable rating agency, the certificate administrator will be required to promptly post such notice on its internet website and by mail and conduct the solicitation of votes of all certificates in such regard, which requisite affirmative votes must be received within 180 days of the posting of such notice. Upon the written direction of holders of at least 66 2/3% of a Certificateholder Quorum, the trustee will be required to immediately replace the applicable special servicer with a qualified replacement special servicer designated by such holders of certificates.
After the occurrence and during the continuance of a Consultation Termination Event, if the operating advisor determines that the applicable special servicer is not performing its duties as required under the pooling and servicing agreement or is otherwise not acting in accordance with the Servicing Standard, the operating advisor may also recommend the replacement of such special servicer. The operating advisor’s recommendation to replace such special servicer must be confirmed by an affirmative vote of holders of principal balance certificates evidencing at least a majority of the aggregate voting rights (taking into account the application of any Cumulative Appraisal Reduction Amounts to notionally reduce the respective certificate balances) of all principal balance certificates on an aggregate basis (which requisite affirmative vote must be received within 180 days of posting of the notice of the operating advisor’s recommendation to the certificate administrator’s website).
A “Certificateholder Quorum” means, in connection with any solicitation of votes in connection with the replacement of a special servicer or the asset representations reviewer, the holders of certificates evidencing at least 50% of the aggregate voting rights (taking into account the application of realized losses and, other than with respect to the termination of the asset representations reviewer, any Cumulative Appraisal Reduction Amounts to notionally reduce the certificate balance of the certificates) of all classes of certificates entitled to principal (other than the RR Interest) on an aggregate basis.
With respect to each serviced whole loan, any holder of a relatedpari passu companion loan, following a servicer termination event with respect to the applicable special servicer that affects such holder, will be entitled to direct the trustee (and the trustee will be required) to terminate such special servicer solely with respect to such serviced whole loan. A replacement special servicer will be selected by the trustee or, prior to a Control Termination Event, by the Directing Certificateholder;provided, that any successor special servicer appointed to replace the special servicer with respect to such whole loan cannot be the entity (or its affiliate) that was terminated at the direction of the holder of the relatedpari passucompanion loan.
Notwithstanding any of the foregoing to the contrary, with respect to any serviced A/B whole loans as to which a subordinate companion loan holder is the related controlling note holder, the holder of the related control note will be entitled to replace the applicable special servicer with respect to such whole loan at any time, with or without cause, and while it is a serviced whole loan, no other party may replace the applicable special servicer for such whole loan unless there is a servicer termination event with respect thereto.
With respect to any non-serviced whole loan, the BANK 2019-BNK18 trust, as holder of the related mortgage loan, has the right to terminate the special servicer under the related pooling and servicing agreement if a servicer termination event occurs, with respect to such special servicer that affects the trust in its capacity as such holder. Such rights may be exercised by the Directing Certificateholder prior to a Consultation Termination Event (or the special servicer, following the occurrence and during the continuance of a Consultation Termination Event). The successor special servicer will be selected pursuant to the applicable pooling and servicing agreement by the related directing holder prior to a control termination event under such pooling and servicing agreement.
|
| Servicing Standard: | Each master servicer and each special servicer is obligated to service and administer the mortgage loans (and, if applicable, the serviced companion loans) in accordance with the definition of the “Servicing Standard” described in the Preliminary Prospectus and the terms of the pooling and servicing agreement, provided that each non-serviced mortgage loan, if any, will be serviced by another master servicer or special servicer under the pooling and servicing agreement with respect to the securitization of a related companion loan, which entities will be obligated to service and administer such non-serviced mortgage loan pursuant to a similar standard set forth in the related pooling and servicing agreement. |
This is not a research report and was not prepared by any Underwriter’s research department. Please see additional important information and qualifications at the end of this Term Sheet.
T-12
| BANK 2019-BNK18 | Structural Overview |
| Excluded Special Servicer: | If a special servicer obtains knowledge that it has become a Borrower Party with respect to any mortgage loan (an “Excluded Special Servicer Loan”), such special servicer will be required to resign as special servicer of that Excluded Special Servicer Loan. Prior to the occurrence of a Control Termination Event, the Directing Certificateholder will be required to appoint (and may remove and replace with or without cause) a separate special servicer that is not a Borrower Party (an “Excluded Special Servicer”) with respect to any Excluded Special Servicer Loan, unless such Excluded Special Servicer Loan is also an Excluded Loan with respect to the Directing Certificateholder or the holder of the majority of the Controlling Class. After the occurrence and during the continuance of a Control Termination Event, if at any time the applicable Excluded Special Servicer Loan is also an Excluded Loan with respect to the Directing Certificateholder or the holder of the majority of the Controlling Class or if the Directing Certificateholder is entitled to appoint the Excluded Special Servicer but does not so appoint within 30 days of notice of such resignation, the resigning special servicer will be required to use reasonable efforts to select the related Excluded Special Servicer. Any Excluded Special Servicer will be required to perform all of the obligations of the applicable special servicer and will be entitled to all special servicing compensation with respect to such Excluded Special Servicer Loan earned while the related mortgage loan is an Excluded Special Servicer Loan. |
| Liquidated Loan Waterfall: | On liquidation of any mortgage loan, all net liquidation proceeds related to the mortgage loan (but not any related companion loan) will be applied so that amounts allocated as a recovery of accrued and unpaid interest will not, in the first instance, include any delinquent interest that was not advanced as a result of Appraisal Reduction Amounts or accrued on the portion of the stated principal balance thereof equal to any related Collateral Deficiency Amount in effect from time to time and as to which no advance was made. After the adjusted interest amount is so allocated, any remaining liquidation proceeds will be allocated to pay principal on the mortgage loan until the unpaid principal amount of the mortgage loan has been reduced to zero. Any remaining liquidation proceeds will then be allocated to pay delinquent interest that was not advanced as a result of Appraisal Reduction Amounts or that accrued on the portion of the stated principal balance thereof equal to any related Collateral Deficiency Amount in effect from time to time and as to which no advance was made. |
| Operating Advisor: | The operating advisor will be required to perform certain review duties if a Control Termination Event has occurred and is continuing, which will generally include a limited annual review of, and the preparation of a report regarding, certain actions of the applicable special servicer with respect to the resolution and/or liquidation of specially serviced loans. The review and report generally will be based on any asset status reports and additional information delivered to the operating advisor by such special servicer. In addition, if a Control Termination Event has occurred and is continuing, the applicable special servicer must consult with the operating advisor (in addition to the Directing Certificateholder if no Consultation Termination Event has occurred and is continuing) in connection with major decisions with respect to mortgage loans. Furthermore, under certain circumstances, but only if a Consultation Termination Event has occurred and is continuing, the operating advisor may recommend the replacement of the applicable special servicer as described above under “—Appointment and Replacement of Special Servicer”; however, the operating advisor will not have any rights or obligations with respect to a non-serviced whole loan.
If a Consultation Termination Event has occurred and is continuing, the operating advisor may be removed and replaced without cause upon the affirmative direction of certificates owners holding not less than 75% of the voting rights of all certificates (taking into account the application of Cumulative Appraisal Reduction Amounts), following a proposal from certificate owners holding not less than 25% of the voting rights of all certificates (taking into account the application of Cumulative Appraisal Reduction Amounts). The certificateholders who initiate a vote on a termination and replacement of the operating advisor without cause must cause the payment of the fees and expenses incurred in the replacement. In addition, in the event there are no classes of certificates outstanding other than the Control Eligible Certificates, the RR Interest and the Class X-G, Class X-H, Class V and Class R certificates, then all of the rights and obligations of the operating advisor under the PSA will terminate without payment of any penalty or termination fee (other than any rights or obligations that accrued prior to the date of such termination (including accrued and unpaid compensation) and other than indemnification rights arising out of events occurring prior to such termination). See “Pooling and Servicing Agreement—The Operating Advisor—Termination of the Operating Advisor Without Cause” in the Preliminary Prospectus.
|
| Asset Representations Reviewer: | The asset representations reviewer will be required to review certain delinquent mortgage loans after a specified delinquency threshold has been met and the required percentage of certificateholders vote to direct a review as described below. The asset representations reviewer will be entitled to the Asset Representations Reviewer Fee with respect to such review. See “Pooling and Servicing Agreement—The Asset Representations Reviewer” in the Preliminary Prospectus.
The certificate administrator will be required to notify certificateholders if the specified delinquency threshold has been met as described in the Preliminary Prospectus under “—The Asset Representations Reviewer”.
If certificateholders evidencing not less than 5.0% of the voting rights request a vote to commence an asset review, and if subsequently (i) a majority of those certificateholders who cast votes and (ii) a majority of an Asset Review Quorum authorizes an asset review within 150 days of the request for a vote, the asset representations reviewer will be required to conduct an asset review of delinquent loans.
The asset representations reviewer may be terminated and replaced without cause. Upon (i) the written direction of certificateholders evidencing not less than 25% of the voting rights (without regard to the application of any Cumulative Appraisal Reduction Amounts) requesting a vote to terminate and replace the asset representations reviewer with a proposed successor asset representations reviewer that is an eligible asset representations reviewer, and (ii) payment by such holders to the certificate administrator of the reasonable fees and expenses |
This is not a research report and was not prepared by any Underwriter’s research department. Please see additional important information and qualifications at the end of this Term Sheet.
T-13
| BANK 2019-BNK18 | Structural Overview |
to be incurred by the certificate administrator in connection with administering such vote, the certificate administrator will be required to promptly provide notice to all certificateholders and the asset representations reviewer of such request by posting such notice on its internet website, and by mailing such notice to all certificateholders and the asset representations reviewer. Upon the written direction of certificateholders evidencing at least 75% of a Certificateholder Quorum (without regard to the application of any Cumulative Appraisal Reduction Amounts), the trustee will be required to terminate all of the rights and obligations of the asset representations reviewer under the pooling and servicing agreement (other than any rights or obligations that accrued prior to the date of such termination and other than indemnification rights arising out of events occurring prior to such termination) by written notice to the asset representations reviewer, and the proposed successor asset representations reviewer will be appointed. See“Pooling and Servicing Agreement—The Asset Representations Reviewer” in the Preliminary Prospectus. An “Asset Review Quorum” means, in connection with any solicitation of votes to authorize an Asset Review as described above, the holders of certificates evidencing at least 5.0% of the aggregate voting rights represented by all certificates that have voting rights.
| |
| Dispute Resolution Provisions: | The mortgage loan sellers will be subject to the dispute resolution provisions set forth in the PSA to the extent those provisions are triggered with respect to any mortgage loan sold to the depositor by a mortgage loan seller, and such mortgage loan seller will be obligated under the related mortgage loan purchase agreement to comply with all applicable provisions and to take part in any mediation or arbitration proceedings that may result. Generally, in the event that a Repurchase Request is not “Resolved” within 180 days after the related mortgage loan seller receives such Repurchase Request, then the enforcing servicer will be required to send a notice to the first certificateholder (or beneficial owner) to deliver a certificateholder repurchase request with respect to the mortgage loan (the “Initial Requesting Certificateholder”) (if any) and to the certificate administrator (which will be required to make such notice available to certificateholders via the certificate administrator’s website) indicating the enforcing servicer’s intended course of action with respect to the Repurchase Request. If (a) the enforcing servicer’s intended course of action with respect to the Repurchase Request does not involve pursuing further action to exercise rights against the related mortgage loan seller with respect to the Repurchase Request and the Initial Requesting Certificateholder, if any, or any other certificateholder or certificate owner wishes to exercise its right to refer the matter to mediation (including nonbinding arbitration) or arbitration, or (b) the enforcing servicer’s intended course of action is to pursue further action to exercise rights against the related mortgage loan seller with respect to the Repurchase Request but the Initial Requesting Certificateholder, if any, or any other certificateholder or certificate owner does not agree with the dispute resolution method selected by the enforcing servicer, then the Initial Requesting Certificateholder, if any, or such other certificateholder or certificate owner may deliver a written notice to the enforcing servicer indicating its intent to exercise its right to refer the matter to either mediation or arbitration.
“Resolved” means, with respect to a Repurchase Request, (i) that the related material defect or breach has been cured, (ii) the related mortgage loan has been repurchased in accordance with the related mortgage loan purchase agreement, (iii) a mortgage loan has been substituted for the related mortgage loan in accordance with the related mortgage loan purchase agreement, (iv) the applicable mortgage loan seller has made a loss of value payment, (v) a contractually binding agreement has been entered into between the enforcing servicer, on behalf of the issuing entity, and the related mortgage loan seller that settles the related mortgage loan seller’s obligations under the related mortgage loan purchase agreement, or (vi) the related mortgage loan is no longer property of the issuing entity as a result of a sale or other disposition in accordance with the pooling and servicing agreement. See “Pooling and Servicing Agreement—Dispute Resolution Provisions” in the Preliminary Prospectus.
|
| Investor Communications: | The certificate administrator is required to include on any Form 10-D any request received from a certificateholder to communicate with other certificateholders related to certificateholders exercising their rights under the terms of the PSA. Any certificateholder wishing to communicate with other certificateholders regarding the exercise of its rights under the terms of the PSA will be able to deliver a written request signed by an authorized representative of the requesting investor to the certificate administrator. |
| Deal Website: | The certificate administrator will be required to maintain a deal website which will include, among other items: (a) summaries of asset status reports prepared by a special servicer, (b) inspection reports, (c) appraisals, (d) various “special notices” described in the Preliminary Prospectus, (e) the “Investor Q&A Forum” and (f) a voluntary “Investor Registry”. Investors may access the deal website following execution of a certification and confidentiality agreement. |
This is not a research report and was not prepared by any Underwriter’s research department. Please see additional important information and qualifications at the end of this Term Sheet.
T-14
| BANK 2019-BNK18 | Collateral Overview |
| Mortgage Loan Sellers | No. of Mortgage Loans | No. of Mortgaged Properties | Aggregate Cut-off Date Balance | % of Pool(1) |
| Wells Fargo Bank, National Association | 17 | 18 | $485,082,214 | 46.4% |
| Morgan Stanley Mortgage Capital Holdings LLC | 10 | 195 | $253,127,619 | 24.2% |
| Bank of America, National Association | 11 | 11 | $226,870,250 | 21.7% |
| National Cooperative Bank, N.A.(2) | 19 | 19 | $80,999,886 | 7.7% |
| Total: | 57 | 243 | $1,046,079,969 | 100.0% |
| Pool Statistics | |
| Aggregate Cut-off Date Balance: | $1,046,079,969 |
| Number of Mortgage Loans: | 57 |
| Average Cut-off Date Balance per Mortgage Loan: | $18,352,280 |
| Number of Mortgaged Properties: | 243 |
| Average Cut-off Date Balance per Mortgaged Property: | $4,304,856 |
| Weighted Average Mortgage Rate: | 4.3808% |
| % of Pool Secured by 5 Largest Mortgage Loans: | 41.9% |
| % of Pool Secured by 10 Largest Mortgage Loans: | 65.8% |
| % of Pool Secured by ARD Loans(3): | 7.1% |
| Weighted Average Original Term to Maturity (months)(3): | 118 |
| Weighted Average Remaining Term to Maturity (months)(3): | 117 |
| Weighted Average Seasoning (months): | 1 |
| % of Pool Secured by Single Tenant Mortgaged Properties: | 16.1% |
| % of Pool Secured by Refinance Loans: | 63.1% |
| % of Pool Secured by Acquisition Loans: | 32.4% |
| % of Pool Secured by Recapitalization Loans: | 4.5% |
| Additional Debt | |
| % of Pool withPari Passu Mortgage Debt: | 60.0% |
| % of Pool with Subordinate Mortgage Debt(4): | 10.9% |
| % of Pool with Mezzanine Debt: | 9.6% |
| Credit Statistics(5)(6) | |
| Weighted Average UW NOI DSCR: | 2.92x |
| Weighted Average UW NOI Debt Yield(7): | 14.0% |
| Weighted Average UW NCF DSCR: | 2.79x |
| Weighted Average UW NCF Debt Yield(7): | 13.3% |
| Weighted Average Cut-off Date LTV Ratio(7)(8): | 52.4% |
| Weighted Average Maturity Date LTV Ratio(3)(8): | 49.8% |
Footnotes are set forth on the following page.
This is not a research report and was not prepared by any Underwriter’s research department. Please see additional important information and qualifications at the end of this Term Sheet.
T-15
| BANK 2019-BNK18 | Collateral Overview |
Amortization
| Weighted Average Original Amortization Term (months)(9): | 360 |
| Weighted Average Remaining Amortization Term (months)(9): | 360 |
| % of Pool Interest Only through Maturity or ARD(3): | 66.3% |
| % of Pool Interest Only followed by Amortizing Balloon: | 17.1% |
| % of Pool Amortizing Balloon: | 16.6% |
| Lockboxes | |
| % of Pool with Hard Lockboxes: | 64.1% |
| % of Pool with Springing Lockboxes: | 19.8% |
| % of Pool with Soft Lockboxes: | 6.8% |
| % of Pool with No Lockboxes: | 9.3% |
| Reserves | |
| % of Pool Requiring Tax Reserves: | 62.8% |
| % of Pool Requiring Insurance Reserves: | 27.6% |
| % of Pool Requiring Replacement Reserves: | 52.6% |
| % of Pool Requiring TI/LC Reserves(10): | 63.1% |
| Call Protection | |
| % of Pool with lockout period, followed by defeasance until open period: | 83.9% |
| % of Pool with no lockout period. Greater of a prepayment premium and yield maintenance followed by a prepayment premium period until open period: | 7.7% |
| % of Pool with lockout period, followed by defeasance or the greater of a prepayment premium and yield maintenance until open period: | 6.0% |
| % of Pool with lockout period, followed by the greater of a prepayment premium and yield maintenance until open period: | 2.3% |
| (1) | Unless otherwise indicated, all references to “% of Pool” in this Term Sheet reflect a percentage of the aggregate principal balance of the mortgage pool as of the Cut-off Date, after application of all payments of principal due during or prior to May 2019. |
| (2) | 17 of the 19 loans for which National Cooperative Bank, N.A. is the mortgage loan seller were originated by its parent company, National Consumer Cooperative Bank, and transferred to National Cooperative Bank, N.A. Each such mortgage loan originated by National Consumer Cooperative Bank was underwritten pursuant to National Cooperative Bank, N.A.’s underwriting guidelines. |
| (3) | With respect to any ARD Loan, unless otherwise indicated, references in this Term Sheet to the applicable “maturity date” or “maturity” refer to the applicable anticipated repayment date with respect to such ARD Loan, and such applicable anticipated repayment date is treated as its maturity date for all purposes hereof. |
| (4) | 16 of the mortgage loans, each of which is secured by a residential cooperative property, currently have in place subordinate secured lines of credit to the related mortgage borrowers that permit future advances (such loans, collectively, the “Subordinate Coop LOCs”). The percentage figure expressed as “% of Pool with Subordinate Mortgage Debt” is determined as a percentage of the initial pool balance and does not take into account any Subordinate Coop LOCs and future subordinate debt (whether or not secured by the mortgaged property), if any, that may be permitted under the terms of any mortgage loan or the pooling and servicing agreement. See “Description of the Mortgage Pool—Additional Indebtedness—Other Secured Indebtedness”and“Description of the Mortgage Pool—Additional Debt Financing for Mortgage Loans Secured by Residential Cooperatives” in the Preliminary Prospectus. |
| (5) | With respect to any mortgage loan that is part of a whole loan, unless otherwise indicated, all LTV, DSCR and Debt Yield calculations in this Term Sheet include any relatedpari passu companion loans and exclude any subordinate companion loans, as applicable. Additionally, LTV, DSCR and Debt Yield figures in this Term Sheet are calculated for mortgage loans without regard to any additional indebtedness that may be incurred at a future date. For mortgaged properties securing residential cooperative mortgage loans all LTV, DSCR and Debt Yield calculations do not take into account any subordinate debt (whether or not secured by the related mortgaged property), that currently exists or is allowed under the terms of any mortgage loan. With respect to any leased fee loans, the SF/Units/Rooms and Cut-off Date Balance per SF/Unit/Room figures in this Term Sheet are based on the size of the non-collateral improvements. |
| (6) | For mortgaged properties securing residential cooperative mortgage loans, all DSCR and Debt Yield calculations for each such mortgaged property is calculated using underwritten net operating Income or underwritten net cash flow, as applicable, for the related residential cooperative property which is the projected net operating income or net cash flow, as applicable, reflected in the most recent appraisal obtained by or otherwise in the possession of the related mortgage loan seller as of the Cut-off Date. All LTV ratio calculations are based upon the appraised value of the residential cooperative property determined as if such residential cooperative property is operated as a residential cooperative, inclusive of the amount of the underlying debt encumbering such residential cooperative property. |
| (7) | With respect to certain mortgage loans, debt yields and LTVs (such as, for example, UW NOI Debt Yield, UW NCF Debt Yield or Cut-off Date LTV Ratio) have been calculated based on a principal balance that is net of a holdback or earnout reserve. Such mortgage loans are identified under the definitions of “Underwritten NOI Debt Yield”, “Underwritten NCF Debt Yield” and “Cut-off Date LTV Ratio” set forth under “Description of the Mortgage Pool—Certain Calculations and Definitions” in the Preliminary Prospectus. |
| (8) | The LTV ratios set forth in this Term Sheet are generally based on the “as-is” values of the related mortgaged properties; provided that the “as-is” value for a portfolio of mortgaged properties may include a premium relating to the valuation of the mortgaged properties as a whole rather than as the sum of individually valued mortgaged properties; provided, further, that such LTV ratios may be based on “as-stabilized”, “as complete” or other contingent values in certain cases in which reserves have been established at origination for the applicable condition or circumstance that is expected to result in stabilization provided, further, that such LTV ratios may have been calculated based on a principal balance that is net of a holdback or earnout reserve. See the definition of “Appraised Value” under“Description of the Mortgage Pool—Certain Calculations and Definitions”in the Preliminary Prospectus. |
| (9) | Excludes mortgage loans that provide for payments of interest only through the related maturity date or anticipated repayment date, as applicable. |
| (10) | Excludes hospitality, multifamily and self storage properties. |
This is not a research report and was not prepared by any Underwriter’s research department. Please see additional important information and qualifications at the end of this Term Sheet.
T-16
| BANK 2019-BNK18 | Characteristics of the Mortgage Loans |
| Top 10 Mortgage Loans or Groups of Cross-Collateralized Mortgage Loans(1) | |||||||||||||
| Loan No. | Mortgage Loan Seller | Property Name | City | State | Property Type | Cut-off Date Balance | % of Pool | SF/Rooms | Cut-off Date Balance per SF/Room | UW NCF DSCR | UW NOI Debt Yield | Cut-off Date LTV | Maturity Date LTV |
| 1 | WFB | 350 Bush Street | San Francisco | CA | Office | $100,000,000 | 9.6% | 387,599 | $477.30 | 3.42x | 14.2% | 35.4% | 35.4% |
| 2 | WFB | The Alhambra | Alhambra | CA | Office | $100,000,000 | 9.6% | 931,891 | $160.96 | 2.36x | 10.9% | 65.1% | 65.1% |
| 3 | BANA | Ford Factory | Los Angeles | CA | Office | $95,000,000 | 9.1% | 257,028 | $525.23 | 1.81x | 8.5% | 57.0% | 57.0% |
| 4 | WFB | Newport Corporate Center | Bellevue | WA | Office | $73,800,000 | 7.1% | 998,284 | $164.28 | 5.63x | 20.2% | 34.5% | 34.5% |
| 5 | MSMCH | 9201 West Sunset Boulevard | West Hollywood | CA | Office | $70,000,000 | 6.7% | 166,599 | $810.33 | 1.87x | 8.7% | 64.6% | 64.6% |
| 6 | MSMCH | Central Tower | San Francisco | CA | Office | $63,700,000 | 6.1% | 164,848 | $594.49 | 2.32x | 10.3% | 52.6% | 52.6% |
| 7 | WFB | Marriott Hanover | Whippany | NJ | Hospitality | $60,000,000 | 5.7% | 353 | $169,971.67 | 1.85x | 13.6% | 58.1% | 53.5% |
| 8 | MSMCH | Westin Atlanta Airport | College Park | GA | Hospitality | $45,441,378 | 4.3% | 500 | $120,844.10 | 2.07x | 14.6% | 69.1% | 56.3% |
| 9 | MSMCH | ILPT Hawaii Portfolio | Honolulu | HI | Various | $40,000,000 | 3.8% | 9,591,512 | $67.77 | 2.40x | 10.6% | 45.2% | 45.2% |
| 10 | WFB | Great Wolf Lodge Southern California | Garden Grove | CA | Hospitality | $40,000,000 | 3.8% | 603 | $248,756.22 | 2.41x | 14.6% | 49.5% | 49.5% |
| Total/Wtd. Avg. | $687,941,378 | 65.8% | 2.68x | 12.4% | 52.8% | 51.5% | |||||||
| (1) | With respect to any mortgage loan that is part of a whole loan, unless otherwise indicated, all LTV, DSCR, Debt Yield and Cut-off Date Balance per SF/Room calculations in this Term Sheet include any relatedpari passu companion loans and exclude any subordinate companion loans, as applicable. Additionally, LTV, DSCR, Debt Yield and Cut-off Date Balance per SF/Room figures in this Term Sheet are calculated for mortgage loans without regard to any additional indebtedness that may be incurred at a future date. With respect to any leased fee loans, the SF/Rooms and Cut-off Date Balance per SF/Room figures in this Term Sheet are based on the size of the non-collateral improvements. |
This is not a research report and was not prepared by any Underwriter’s research department. Please see additional important information and qualifications at the end of this Term Sheet.
T-17
| BANK 2019-BNK18 | Characteristics of the Mortgage Loans |
| Mortgage Loans with Pari Passu Companion Loans | ||||||||||||
| Loan No. | Mortgage Loan Seller | Property Name | Mortgage Loan Cut-off Date Balance | Aggregate Pari Passu Companion Loan Cut-off Date Balance | Combined Cut-off Date Balance | Lead Servicing Agreement | Master Servicer | Special Servicer | Control Rights | Combined UW NCF DSCR(1) | Combined UW NOI Debt Yield(1) | Combined Cut-off Date LTV(1) |
| 1 | WFB | 350 Bush Street | $100,000,000 | $85,000,000 | $185,000,000 | BANK 2019-BNK18 | Wells Fargo | Rialto | BANK 2019-BNK18 | 3.42x | 14.2% | 35.4% |
| 2 | WFB | The Alhambra | $100,000,000 | $50,000,000 | $150,000,000 | BANK 2019-BNK18 | Wells Fargo | Rialto | BANK 2019-BNK18 | 2.36x | 10.9% | 65.1% |
| 3 | BANA | Ford Factory | $95,000,000 | $40,000,000 | $135,000,000 | BANK 2019-BNK18 | Wells Fargo | Rialto | BANK 2019-BNK18 | 1.81x | 8.5% | 57.0% |
| 4 | WFB | Newport Corporate Center | $73,800,000 | $90,200,000 | $164,000,000 | BANK 2019-BNK18 | Wells Fargo | Rialto | BANK 2019-BNK18 | 5.63x | 20.2% | 34.5% |
| 5 | MSMCH | 9201 West Sunset Boulevard | $70,000,000 | $65,000,000 | $135,000,000 | BANK 2019-BNK18 | Wells Fargo | Rialto | BANK 2019-BNK18 | 1.87x | 8.7% | 64.6% |
| 6 | MSMCH | Central Tower | $63,700,000 | $34,300,000 | $98,000,000 | BANK 2019-BNK18 | Wells Fargo | Rialto | BANK 2019-BNK18 | 2.32x | 10.3% | 52.6% |
| 8 | MSMCH | Westin Atlanta Airport | $45,441,378 | $14,980,674 | $60,422,052 | BANK 2019-BNK18 | Wells Fargo | Rialto | BANK 2019-BNK18 | 2.07x | 14.6% | 69.1% |
| 9 | MSMCH | ILPT Hawaii Portfolio | $40,000,000 | $610,000,000 | $650,000,000 | ILPT Trust 2019-SURF | Midland | Rialto | ILPT Trust 2019-SURF | 2.40x | 10.6% | 45.2% |
| 10 | WFB | Great Wolf Lodge Southern California | $40,000,000 | $110,000,000 | $150,000,000 | WFCM 2019-C50 | Wells Fargo | Rialto | WFCM 2019-C50 | 2.41x | 14.6% | 49.5% |
| (1) | DSCR, Debt Yield and LTV calculations include any relatedpari passu companion loans and exclude any subordinate companion loans, as applicable. |
| Mortgage Loans with Subordinate Debt(1) | |||||||||||
| Loan No. | Mortgage Loan Seller | Property Name | Mortgage Loan Cut-off Date Balance | Cut-off Date Balance per SF/Room | Subordinate Debt Cut-off Date Balance | UW NCF DSCR | UW NOI Debt Yield | Cut-off Date LTV | Total Debt UW NCF DSCR(2) | Total Debt UW NOI Debt Yield(2) | Total Debt Cut-off Date LTV(2) |
| 4 | WFB | Newport Corporate Center | $73,800,000 | $164.28 | $148,000,000 | 5.63x | 20.2% | 34.5% | 2.34x | 10.6% | 65.5% |
| 10 | WFB | Great Wolf Lodge Southern California | $40,000,000 | $248,756.22 | $20,000,000 | 2.41x | 14.6% | 49.5% | 1.89x | 12.9% | 56.1% |
| (1) | In addition, sixteen (16) of the mortgage loans, each of which is secured by a residential cooperative property, currently have in place Subordinate Coop LOCs that permit future advances. See “Description of the Mortgage Pool—Additional Indebtedness—Other Secured Indebtedness” and “Description of the Mortgage Pool—Additional Debt Financing for Mortgage Loans Secured by Residential Cooperatives” in the Preliminary Prospectus. |
| (2) | Total Debt UW NCF DSCR, Total Debt UW NOI Debt Yield and Total Debt Cut-off Date LTV figures shown above are calculated based on any relatedpari passu notes and any related subordinate note(s) and the mezzanine debt. |
| Mortgage Loans with Mezzanine Debt | |||||||||||
| Loan No. | Mortgage Loan Seller | Property Name | Mortgage Loan Cut-off Date Balance | Cut-off Date Balance per Unit/SF | Mezzanine Debt Cut-off Date Balance | UW NCF DSCR | UW NOI Debt Yield | Cut-off Date LTV | Total Debt UW NCF DSCR(1) | Total Debt UW NOI Debt Yield(1) | Total Debt Cut-off Date LTV(1) |
| 1 | WFB | 350 Bush Street | $100,000,000 | $477.30 | $100,000,000 | 3.42x | 14.2% | 35.4% | 2.30x | 9.2% | 54.6% |
| (1) | Total Debt UW NCF DSCR, Total Debt UW NOI Debt Yield and Total Debt Cut-off Date LTV figures shown above are calculated based on any relatedpari passu notes, any related subordinate note(s) and the mezzanine debt. |
This is not a research report and was not prepared by any Underwriter’s research department. Please see additional important information and qualifications at the end of this Term Sheet.
T-18
| BANK 2019-BNK18 | Characteristics of the Mortgage Loans |
| Prior Securitization History(1) | ||||||||||||||
| Loan No. | Mortgage Loan Seller | Property Name | City | State | Property Type | Cut-off Date Balance | % of Pool | SF/Units/ | Cut-off Date Balance per SF/Unit/Room(2) | UW NCF DSCR(2)(3) | UW NOI Debt Yield(2)(3) | Cut-off Date LTV(2)(3) | Maturity Date LTV(2)(3) | Prior Securitization |
| 5 | MSMCH | 9201 West Sunset Boulevard | West Hollywood | CA | Office | $70,000,000 | 6.7% | 166,599 | $810.33 | 1.87x | 8.7% | 64.6% | 64.6% | GSMS 2012-GCJ9 |
| 8 | MSMCH | Westin Atlanta Airport | College Park | GA | Hospitality | $45,441,378 | 4.3% | 500 | $120,844.10 | 2.07x | 14.6% | 69.1% | 56.3% | PFP 2017-4 |
| 29 | MSMCH | McGalliard Mall Shoppes | Muncie | IN | Retail | $6,991,241 | 0.7% | 59,292 | $117.91 | 1.56x | 10.6% | 67.2% | 55.1% | MSBAM 2014-C16 |
| 36 | NCB | Greenwood Arms Cooperative Corp. | Howard Beach | NY | Multifamily | $5,994,757 | 0.6% | 160 | $37,467.23 | 7.38x | 37.0% | 16.7% | 14.7% | WFRBS 2014-C22 |
| 37 | MSMCH | 800 Wilcrest Drive | Houston | TX | Office | $5,625,000 | 0.5% | 65,564 | $85.79 | 1.79x | 13.0% | 75.0% | 64.9% | GSMS 2013-GC16 |
| 44 | NCB | Westerfield Townhouses Cooperative, Inc. | Olathe | KS | Multifamily | $3,944,623 | 0.4% | 258 | $15,289.24 | 4.18x | 33.0% | 19.9% | 12.3% | MSC 2007-IQ-13 |
| 55 | NCB | 111-117 West 96th Street Owners, Inc. | New York | NY | Multifamily | $1,493,841 | 0.1% | 40 | $37,346.03 | 10.52x | 65.0% | 4.6% | 3.7% | MSC 2004-IQ-7 |
| Total | $139,490,840 | 13.3% | ||||||||||||
| (1) | Includes mortgage loans for which all or a portion of the previously existing debt was most recently securitized in conduit securitizations, based on information provided by the related borrower or obtained through searches of a third-party database. The information has not otherwise been confirmed by the mortgage loan sellers. With respect to any mortgage loan that is part of a whole loan, unless otherwise indicated, all LTV, DSCR, Debt Yield and Cut-off Date Balance per SF/Unit/Room calculations include any relatedpari passucompanion loans and exclude any related subordinate companion loans, as applicable. |
| (2) | For properties that are a part of a portfolio, the Cut-off Date Balance Per SF/Unit/Room, UW NCF DSCR, UW NOI Debt Yield, Cut-off Date LTV and Maturity Date LTV calculations reflect the values of the portfolio as a whole. |
| (3) | For mortgaged properties securing residential cooperative mortgage loans, the UW NCF DSCR and UW NOI Debt Yield for each such mortgaged property is calculated using underwritten net operating income or underwritten net cash flow, as applicable, for the related residential cooperative property which is the projected net operating income or net cash flow, as applicable, reflected in the most recent appraisal obtained by or otherwise in the possession of the related mortgage loan seller as of the Cut-off Date. LTV calculations are based upon the appraised value of the residential cooperative property determined as if such residential cooperative property is operated as a residential cooperative, inclusive of the amount of the underlying debt encumbering such residential cooperative property. |
This is not a research report and was not prepared by any Underwriter’s research department. Please see additional important information and qualifications at the end of this Term Sheet.
T-19
| BANK 2019-BNK18 | Characteristics of the Mortgage Loans |
Mortgage Loan with Scheduled Balloon Payment and Related Class(1)
| Class A-2 ($32,774,000) | ||||||||||||||||
| Loan No. | Mortgage Loan Seller | Property Name | State | Property Type | Cut-off Date Balance | % of Pool | Maturity Date Balance | % of Class A-2 Certificate Principal Balance | SF/ Units | Cut-off Date Balance per SF/Unit | UW NCF DSCR | UW NOI Debt Yield | Cut-off Date LTV | Maturity Date LTV | Rem. IO Period (mos.) | Rem. Term to Maturity (mos.) |
| 11 | BANA | 801 Barton Springs | TX | Office | $34,500,000 | 3.3% | $34,500,000 | 105.3% | 89,577 | $385.14 | 2.52x | 10.5% | 54.6% | 54.6% | 60 | 60 |
| Total/Wtd. Avg. | $34,500,000 | 3.3% | $34,500,000 | 105.3% | 2.52x | 10.5% | 54.6% | 54.6% | 60 | 60 | ||||||
| (1) | The table above reflects the mortgage loan whose balloon payment will be applied to pay down the Class A-2 certificates, assuming (i) that the mortgage loan does not experience prepayments, defaults or losses; (ii) there are no extensions of the maturity date; and (iii) the mortgage loan is paid in full on its stated maturity date. The table above is otherwise based on the Structuring Assumptions set forth under “Yield and Maturity Considerations—Weighted Average Life” in the Preliminary Prospectus. |
This is not a research report and was not prepared by any Underwriter’s research department. Please see additional important information and qualifications at the end of this Term Sheet.
T-20
| BANK 2019-BNK18 | Characteristics of the Mortgage Loans |
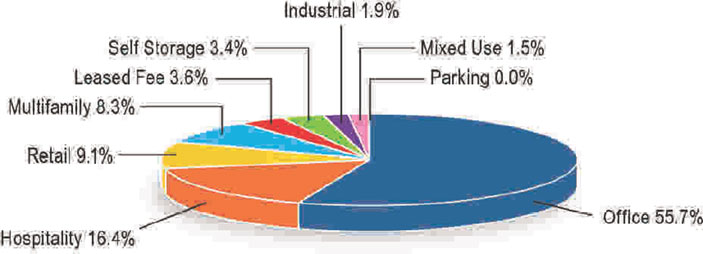
| Property Type Distribution(1) | |||||||||||||||||
| Property Type | Number of Mortgaged Properties | Aggregate Cut-off Date Balance | % of Pool | Wtd. Avg. Mortgage Rate | Wtd. Avg. UW NCF DSCR | Wtd. Avg. UW NOI Debt Yield | Wtd. Avg. Cut-off Date LTV | Wtd. Avg. Maturity Date LTV | |||||||||
| Office | 13 | $582,475,000 | 55.7% | 4.1654% | 2.78x | 12.0% | 52.7% | 52.3% | |||||||||
| CBD | 4 | $293,200,000 | 28.0% | 4.1533% | 2.55x | 11.1% | 48.4% | 48.4% | |||||||||
| Suburban | 8 | $219,275,000 | 21.0% | 4.0922% | 3.36x | 14.2% | 54.8% | 53.5% | |||||||||
| Medical | 1 | $70,000,000 | 6.7% | 4.4450% | 1.87x | 8.7% | 64.6% | 64.6% | |||||||||
| Hospitality | 5 | $171,741,378 | 16.4% | 4.9247% | 2.02x | 14.0% | 59.6% | 53.2% | |||||||||
| Full Service | 4 | $164,441,378 | 15.7% | 4.8903% | 2.03x | 14.0% | 59.3% | 53.3% | |||||||||
| Select Service | 1 | $7,300,000 | 0.7% | 5.7000% | 1.73x | 14.4% | 67.0% | 51.5% | |||||||||
| Retail | 10 | $95,073,455 | 9.1% | 4.7567% | 1.66x | 10.1% | 64.4% | 57.1% | |||||||||
| Anchored | 5 | $56,862,214 | 5.4% | 4.7494% | 1.64x | 9.9% | 65.5% | 58.8% | |||||||||
| Unanchored | 3 | $24,611,241 | 2.4% | 4.9251% | 1.73x | 10.8% | 62.9% | 56.1% | |||||||||
| Single Tenant | 1 | $10,100,000 | 1.0% | 4.3400% | 1.59x | 9.5% | 62.7% | 50.6% | |||||||||
| Shadow Anchored | 1 | $3,500,000 | 0.3% | 4.8950% | 1.60x | 10.5% | 61.4% | 56.6% | |||||||||
| Multifamily | 20 | $86,999,886 | 8.3% | 4.1971% | 6.55x | 36.4% | 18.1% | 15.2% | |||||||||
| Cooperative | 19 | $80,999,886 | 7.7% | 4.1317% | 6.94x | 38.4% | 14.2% | 11.7% | |||||||||
| Garden | 1 | $6,000,000 | 0.6% | 5.0800% | 1.39x | 9.3% | 70.6% | 62.7% | |||||||||
| Leased Fee | 177 | $37,760,349 | 3.6% | 4.3100% | 2.40x | 10.6% | 45.2% | 45.2% | |||||||||
| Leased Fee | 177 | $37,760,349 | 3.6% | 4.3100% | 2.40x | 10.6% | 45.2% | 45.2% | |||||||||
| Self Storage | 4 | $35,780,000 | 3.4% | 4.5357% | 1.98x | 10.1% | 60.2% | 58.7% | |||||||||
| Self Storage | 4 | $35,780,000 | 3.4% | 4.5357% | 1.98x | 10.1% | 60.2% | 58.7% | |||||||||
| Industrial | 10 | $20,393,759 | 1.9% | 4.4664% | 1.78x | 11.3% | 58.0% | 50.6% | |||||||||
| Manufacturing | 1 | $11,495,250 | 1.1% | 4.4100% | 1.65x | 10.6% | 65.9% | 60.3% | |||||||||
| Warehouse | 1 | $6,800,000 | 0.7% | 4.6100% | 1.82x | 12.7% | 48.6% | 35.9% | |||||||||
| Warehouse/Distribution | 6 | $1,531,495 | 0.1% | 4.3100% | 2.40x | 10.6% | 45.2% | 45.2% | |||||||||
| Flex | 2 | $567,014 | 0.1% | 4.3100% | 2.40x | 10.6% | 45.2% | 45.2% | |||||||||
| Mixed Use | 3 | $15,715,000 | 1.5% | 4.8750% | 1.72x | 10.2% | 68.2% | 60.1% | |||||||||
| Office/Retail | 2 | $9,515,000 | 0.9% | 4.9500% | 1.62x | 10.8% | 75.0% | 61.7% | |||||||||
| Retail/Office | 1 | $6,200,000 | 0.6% | 4.7600% | 1.88x | 9.4% | 57.7% | 57.7% | |||||||||
| Parking | 1 | $141,142 | 0.0% | 4.3100% | 2.40x | 10.6% | 45.2% | 45.2% | |||||||||
| Parking | 1 | $141,142 | 0.0% | 4.3100% | 2.40x | 10.6% | 45.2% | 45.2% | |||||||||
| Total/Wtd. Avg. | 243 | $1,046,079,969 | 100.0% | 4.3808% | 2.79x | 14.0% | 52.4% | 49.8% | |||||||||
| (1) | All numerical information concerning the mortgage loans is approximate and, in the case of mortgage loans secured by multiple properties, is based on allocated loan amounts with respect to such properties. All weighted average information regarding the mortgage loans reflects the weighting of the mortgage loans based on their outstanding principal balances as of the Cut-off Date or, in the case of mortgage loans secured by multiple properties, allocated loan amounts. The sum of numbers and percentages in columns may not match the “Total” due to rounding. With respect to any mortgage loan that is part of a whole loan, unless otherwise indicated, all LTV, DSCR and Debt Yield calculations include any relatedpari passu companion loans and exclude any related subordinate companion loans, as applicable. For mortgaged properties securing residential cooperative mortgage loans, the UW NCF DSCR and UW NOI Debt Yield for each such mortgaged property is calculated using underwritten net operating income or underwritten net cash flow, as applicable, for the related residential cooperative property which is the projected net operating income or net cash flow, as applicable, reflected in the most recent appraisal obtained by or otherwise in the possession of the related mortgage loan seller as of the Cut-off Date. LTV calculations are based upon the appraised value of the residential cooperative property determined as if such residential cooperative property is operated as a residential cooperative, inclusive of the amount of the underlying debt encumbering such residential cooperative property. |
This is not a research report and was not prepared by any Underwriter’s research department. Please see additional important information and qualifications at the end of this Term Sheet.
T-21
| BANK 2019-BNK18 | Characteristics of the Mortgage Loans |

| Geographic Distribution(1) | |||||||||||||||||
| State or Other Jurisdiction | Number of Mortgaged Properties | Aggregate Cut-off Date Balance | % of Pool | Wtd. Avg. Mortgage Rate | Wtd. Avg. UW NCF DSCR | Wtd. Avg. UW NOI Debt Yield | Wtd. Avg. Cut-off Date LTV | Wtd. Avg. Maturity Date LTV | |||||||||
| California | 13 | $520,120,000 | 49.7% | 4.3536% | 2.34x | 11.0% | 54.7% | 54.2% | |||||||||
| California – Southern(2) | 9 | $341,320,000 | 32.6% | 4.5244% | 2.05x | 10.1% | 60.6% | 60.1% | |||||||||
| California – Northern(2) | 4 | $178,800,000 | 17.1% | 4.0275% | 2.90x | 12.6% | 43.5% | 43.0% | |||||||||
| New York | 18 | $94,389,642 | 9.0% | 4.1879% | 6.15x | 33.1% | 23.2% | 21.5% | |||||||||
| Texas | 6 | $74,745,000 | 7.1% | 4.5113% | 2.14x | 11.4% | 59.5% | 56.1% | |||||||||
| Washington | 1 | $73,800,000 | 7.1% | 3.5432% | 5.63x | 20.2% | 34.5% | 34.5% | |||||||||
| New Jersey | 1 | $60,000,000 | 5.7% | 4.8500% | 1.85x | 13.6% | 58.1% | 53.5% | |||||||||
| Georgia | 3 | $55,406,999 | 5.3% | 4.7532% | 2.06x | 14.8% | 66.7% | 53.9% | |||||||||
| Hawaii | 186 | $40,000,000 | 3.8% | 4.3100% | 2.40x | 10.6% | 45.2% | 45.2% | |||||||||
| Florida | 3 | $30,525,000 | 2.9% | 4.8276% | 1.48x | 10.2% | 62.5% | 55.8% | |||||||||
| Michigan | 2 | $29,355,000 | 2.8% | 4.6838% | 1.49x | 9.8% | 68.1% | 59.5% | |||||||||
| Ohio | 3 | $21,010,250 | 2.0% | 4.6546% | 1.64x | 10.7% | 70.0% | 60.9% | |||||||||
| Nevada | 1 | $11,000,000 | 1.1% | 4.4200% | 2.49x | 11.2% | 55.3% | 55.3% | |||||||||
| Minnesota | 1 | $10,100,000 | 1.0% | 4.3400% | 1.59x | 9.5% | 62.7% | 50.6% | |||||||||
| Illinois | 2 | $7,950,000 | 0.8% | 4.6241% | 2.29x | 13.5% | 66.5% | 60.4% | |||||||||
| Indiana | 1 | $6,991,241 | 0.7% | 4.7800% | 1.56x | 10.6% | 67.2% | 55.1% | |||||||||
| Arizona | 1 | $6,742,214 | 0.6% | 5.2200% | 1.45x | 10.2% | 67.3% | 55.9% | |||||||||
| Kansas | 1 | $3,944,623 | 0.4% | 4.3400% | 4.18x | 33.0% | 19.9% | 12.3% | |||||||||
| Total/Wtd. Avg. | 243 | $1,046,079,969 | 100.0% | 4.3808% | 2.79x | 14.0% | 52.4% | 49.8% | |||||||||
| (1) | All numerical information concerning the mortgage loans is approximate and, in the case of mortgage loans secured by multiple properties, is based on allocated loan amounts with respect to such properties. All weighted average information regarding the mortgage loans reflects the weighting of the mortgage loans based on their outstanding principal balances as of the Cut-off Date or, in the case of mortgage loans secured by multiple properties, allocated loan amounts. The sum of numbers and percentages in columns may not match the “Total” due to rounding. With respect to any mortgage loan that is part of a whole loan, unless otherwise indicated, all LTV, DSCR and Debt Yield calculations include any relatedpari passu companion loans and exclude any related subordinate companion loans, as applicable. For mortgaged properties securing residential cooperative mortgage loans, the UW NCF DSCR and UW NOI Debt Yield for each such mortgaged property is calculated using underwritten net operating income or underwritten net cash flow, as applicable, for the related residential cooperative property which is the projected net operating income or net cash flow, as applicable, reflected in the most recent appraisal obtained by or otherwise in the possession of the related mortgage loan seller as of the Cut-off Date. LTV calculations are based upon the appraised value of the residential cooperative property determined as if such residential cooperative property is operated as a residential cooperative, inclusive of the amount of the underlying debt encumbering such residential cooperative property. |
| (2) | “California – Northern” includes zip codes above 93600, and “California – Southern” includes zip codes at or below 93600. |
This is not a research report and was not prepared by any Underwriter’s research department. Please see additional important information and qualifications at the end of this Term Sheet.
T-22
| BANK 2019-BNK18 | Collateral Statistics |
Collateral Statistics(1)
Cut-off Date Balance ($)
| No. of Mortgage Loans | Aggregate Cut-off Date Balance ($) | % of Pool | |
| 1,294,778 - 10,000,000 | 36 | 177,518,342 | 17.0 |
| 10,000,001 - 20,000,000 | 9 | 123,120,250 | 11.8 |
| 20,000,001 - 30,000,000 | 1 | 23,000,000 | 2.2 |
| 30,000,001 - 40,000,000 | 3 | 114,500,000 | 10.9 |
| 40,000,001 - 60,000,000 | 2 | 105,441,378 | 10.1 |
| 60,000,001 - 80,000,000 | 3 | 207,500,000 | 19.8 |
| 80,000,001 - 100,000,000 | 3 | 295,000,000 | 28.2 |
| Total: | 57 | $1,046,079,969 | 100.0% |
| Min: $1,294,778 | Max: $100,000,000 | Avg: $18,352,280 | |
State or Other Jurisdiction(2)
| No. of Mortgaged Properties | Aggregate Cut-off Date Balance ($) | % of Pool | |
| California | 13 | 520,120,000 | 49.7 |
| California – Southern(3) | 9 | 341,320,000 | 32.6 |
| California – Northern(3) | 4 | 178,800,000 | 17.1 |
| New York | 18 | 94,389,642 | 9.0 |
| Texas | 6 | 74,745,000 | 7.1 |
| Washington | 1 | 73,800,000 | 7.1 |
| New Jersey | 1 | 60,000,000 | 5.7 |
| Georgia | 3 | 55,406,999 | 5.3 |
| Hawaii | 186 | 40,000,000 | 3.8 |
| Florida | 3 | 30,525,000 | 2.9 |
| Michigan | 2 | 29,355,000 | 2.8 |
| Ohio | 3 | 21,010,250 | 2.0 |
| Nevada | 1 | 11,000,000 | 1.1 |
| Minnesota | 1 | 10,100,000 | 1.0 |
| Illinois | 2 | 7,950,000 | 0.8 |
| Indiana | 1 | 6,991,241 | 0.7 |
| Arizona | 1 | 6,742,214 | 0.6 |
| Kansas | 1 | 3,944,623 | 0.4 |
| Total: | 243 | $1,046,079,969 | 100.0% |
Property Type(2)
| No. of Mortgaged Properties | Aggregate Cut-off Date Balance ($) | % of Pool | |
| Office | 13 | 582,475,000 | 55.7 |
| CBD | 4 | 293,200,000 | 28.0 |
| Suburban | 8 | 219,275,000 | 21.0 |
| Medical | 1 | 70,000,000 | 6.7 |
| Hospitality | 5 | 171,741,378 | 16.4 |
| Full Service | 4 | 164,441,378 | 15.7 |
| Select Service | 1 | 7,300,000 | 0.7 |
| Retail | 10 | 95,073,455 | 9.1 |
| Anchored | 5 | 56,862,214 | 5.4 |
| Unanchored | 3 | 24,611,241 | 2.4 |
| Single Tenant | 1 | 10,100,000 | 1.0 |
| Shadow Anchored | 1 | 3,500,000 | 0.3 |
| Multifamily | 20 | 86,999,886 | 8.3 |
| Cooperative | 19 | 80,999,886 | 7.7 |
| Garden | 1 | 6,000,000 | 0.6 |
| Leased Fee | 177 | 37,760,349 | 3.6 |
| Leased Fee | 177 | 37,760,349 | 3.6 |
| Self Storage | 4 | 35,780,000 | 3.4 |
| Self Storage | 4 | 35,780,000 | 3.4 |
| Industrial | 10 | 20,393,759 | 1.9 |
| Manufacturing | 1 | 11,495,250 | 1.1 |
| Warehouse | 1 | 6,800,000 | 0.7 |
| Warehouse/Distribution | 6 | 1,531,495 | 0.1 |
| Flex | 2 | 567,014 | 0.1 |
| Mixed Use | 3 | 15,715,000 | 1.5 |
| Office/Retail | 2 | 9,515,000 | 0.9 |
| Retail/Office | 1 | 6,200,000 | 0.6 |
| Parking | 1 | 141,142 | 0.0 |
| Parking | 1 | 141,142 | 0.0 |
| Total: | 243 | $1,046,079,969 | 100.0% |
Mortgage Rate (%)
| No. of Mortgage Loans | Aggregate Cut-off Date Balance ($) | % of Pool | |
| 3.5432 – 3.9999 | 7 | 204,049,757 | 19.5 |
| 4.0000 - 4.4999 | 22 | 410,250,602 | 39.2 |
| 4.5000 - 4.9999 | 23 | 360,237,397 | 34.4 |
| 5.0000 - 5.7000 | 5 | 71,542,214 | 6.8 |
| Total: | 57 | $1,046,079,969 | 100.0% |
| Min: 3.5432% | Max: 5.7000% | Wtd Avg: 4.3808% | |
Original Term to Maturity or ARD (mos.)
| No. of Mortgage Loans | Aggregate Cut-off Date Balance ($) | % of Pool | |
| 60 | 1 | 34,500,000 | 3.3 |
| 120 | 55 | 1,007,179,969 | 96.3 |
| 121 | 1 | 4,400,000 | 0.4 |
| Total: | 57 | $1,046,079,969 | 100.0% |
| Min: 60 mos. | Max: 121 mos. | Wtd Avg: 118 mos. | |
Remaining Term to Maturity or ARD (mos.)
No. of | Aggregate | % of | |
| 60 | 1 | 34,500,000 | 3.3 |
| 61 - 120 | 55 | 1,007,179,969 | 96.3 |
| 121 | 1 | 4,400,000 | 0.4 |
| Total: | 57 | $1,046,079,969 | 100.0% |
| Min: 60 mos. | Max: 121 mos. | Wtd Avg: 117 mos. | |
Original Amortization Term (mos.)
| No. of Mortgage Loans | Aggregate Cut-off Date Balance ($) | % of Pool | |
| Interest Only | 20 | 693,670,000 | 66.3 |
| 240 | 2 | 8,458,122 | 0.8 |
| 300 | 3 | 16,765,621 | 1.6 |
| 360 | 28 | 309,861,469 | 29.6 |
| 480 | 4 | 17,324,757 | 1.7 |
| Total: | 57 | $1,046,079,969 | 100.0% |
| Min: 240 mos. | Max: 480 mos. | Wtd Avg: 360 mos. | |
Remaining Amortization Term (mos.)
| No. of Mortgage Loans | Aggregate Cut-off Date Balance ($) | % of Pool | |
| Interest Only | 20 | 693,670,000 | 66.3 |
| 237 - 300 | 5 | 25,223,743 | 2.4 |
| 301 - 360 | 28 | 309,861,469 | 29.6 |
| 361 - 480 | 4 | 17,324,757 | 1.7 |
| Total: | 57 | $1,046,079,969 | 100.0% |
| Min: 237 mos. | Max: 480 mos. | Wtd Avg: 360 mos. | |
Mortgage Loan Sellers
| No. of Mortgage Loans | Aggregate Cut-off Date Balance ($) | % of Pool | |
| WFB | 17 | 485,082,214 | 46.4 |
| MSMCH | 10 | 253,127,619 | 24.2 |
| BANA | 11 | 226,870,250 | 21.7 |
| NCB | 19 | 80,999,886 | 7.7 |
| Total: | 57 | $1,046,079,969 | 100.0% |
Amortization Type
| No. of Mortgage Loans | Aggregate Cut-off Date Balance ($) | % of Pool | |
| Interest Only | 19 | 619,870,000 | 59.3 |
| Partial Interest Only | 13 | 179,200,250 | 17.1 |
| Amortizing Balloon | 24 | 173,209,719 | 16.6 |
| Interest Only, ARD | 1 | 73,800,000 | 7.1 |
| Total: | 57 | $1,046,079,969 | 100.0% |
Cut-off Date LTV Ratio (%)
| No. of Mortgage Loans | Aggregate Cut-off Date Balance ($) | % of Pool | |
| 1.5 - 30.0 | 18 | 76,999,886 | 7.4 |
| 30.1 - 45.0 | 4 | 179,800,000 | 17.2 |
| 45.1 - 55.0 | 5 | 185,000,000 | 17.7 |
| 55.1 - 65.0 | 15 | 346,745,000 | 33.1 |
| 65.1 - 75.0 | 15 | 257,535,083 | 24.6 |
| Total: | 57 | $1,046,079,969 | 100.0% |
| Min: 1.5% | Max: 75.0% | Wtd Avg: 52.4% |
Maturity Date or ARD LTV Ratio (%)
| No. of Mortgage Loans | Aggregate Cut-off Date Balance ($) | % of Pool | |
| 1.5 - 35.0 | 20 | 154,799,886 | 14.8 |
| 35.1 - 45.0 | 3 | 108,800,000 | 10.4 |
| 45.1 - 55.0 | 9 | 281,670,000 | 26.9 |
| 55.1 - 60.0 | 15 | 270,669,833 | 25.9 |
| 60.1 - 66.4 | 10 | 230,140,250 | 22.0 |
| Total: | 57 | $1,046,079,969 | 100.0% |
| Min: 1.5% | Max: 66.4% | Wtd Avg: 49.8% |
UW NCF DSCR (x)
| No. of Mortgage Loans | Aggregate Cut-off Date Balance ($) | % of Pool | |
| 1.34 - 1.60 | 10 | 95,088,455 | 9.1 |
| 1.61 - 1.80 | 9 | 83,580,250 | 8.0 |
| 1.81 - 2.00 | 6 | 246,300,000 | 23.5 |
| 2.01 - 2.20 | 2 | 65,441,378 | 6.3 |
| 2.21 - 2.40 | 3 | 203,700,000 | 19.5 |
| 2.41 - 2.60 | 3 | 85,500,000 | 8.2 |
| 2.61 - 3.10 | 4 | 17,835,621 | 1.7 |
| 3.11 - 5.00 | 5 | 119,917,889 | 11.5 |
| 5.01 - 7.00 | 10 | 115,727,779 | 11.1 |
| 7.01 - 53.49 | 5 | 12,988,598 | 1.2 |
| Total: | 57 | $1,046,079,969 | 100.0% |
| Min: 1.34x | Max: 53.49x | Wtd Avg: 2.79x |
UW NOI Debt Yield (%)
| No. of Mortgage Loans | Aggregate Cut-off Date Balance ($) | % of Pool | |
| 8.5 - 9.5 | 8 | 216,905,000 | 20.7 |
| 9.6 - 10.5 | 9 | 176,467,214 | 16.9 |
| 10.6 - 11.5 | 8 | 197,671,491 | 18.9 |
| 11.6 - 13.5 | 4 | 35,825,000 | 3.4 |
| 13.6 - 14.5 | 4 | 173,420,000 | 16.6 |
| 14.6 - 16.5 | 4 | 94,491,378 | 9.0 |
| 16.6 - 237.1 | 20 | 151,299,886 | 14.5 |
| Total: | 57 | $1,046,079,969 | 100.0% |
| Min: 8.5% | Max: 237.1% | Wtd Avg: 14.0% |
| (1) | All numerical information concerning the mortgage loans is approximate. All weighted average information regarding the mortgage loans reflects the weighting of the mortgage loans based on their outstanding principal balances as of the Cut-off Date. The sum of numbers and percentages in columns may not match the “Total” due to rounding. With respect to any mortgage loan that is part of a whole loan, unless otherwise indicated, all LTV, DSCR and Debt Yield calculations include any relatedpari passu companion loans and exclude any related subordinate companion loans, as applicable. For mortgaged properties securing residential cooperative mortgage loans, the UW DSCR and UW NOI Debt Yield for each such mortgaged property is calculated using underwritten net operating income or underwritten net cash flow, as applicable, for the related residential cooperative property which is the projected net operating income or net cash flow, as applicable, reflected in the most recent appraisal obtained by or otherwise in the possession of the related mortgage loan seller as of the Cut-off Date. LTV calculations are based upon the appraised value of the residential cooperative property determined as if such residential cooperative property is operated as a residential cooperative, inclusive of the amount of the underlying debt encumbering such residential cooperative property. |
| (2) | In the case of mortgage loans secured by multiple properties, cut-off date balance information is based on allocated loan amounts with respect to such properties. |
| (3) | “California – Northern” includes zip codes above 93600, and “California – Southern” includes zip codes at or below 93600. |
This is not a research report and was not prepared by any Underwriter’s research department. Please see additional important information and qualifications at the end of this Term Sheet.
T-23
| Office – CBD | Loan #1 | Cut-off Date Balance: | $100,000,000 | |
| 350 Bush Street | 350 Bush Street | Cut-off Date LTV: | 35.4% | |
| San Francisco, CA 94104 | UW NCF DSCR: | 3.42x | ||
| UW NOI Debt Yield: | 14.2% |
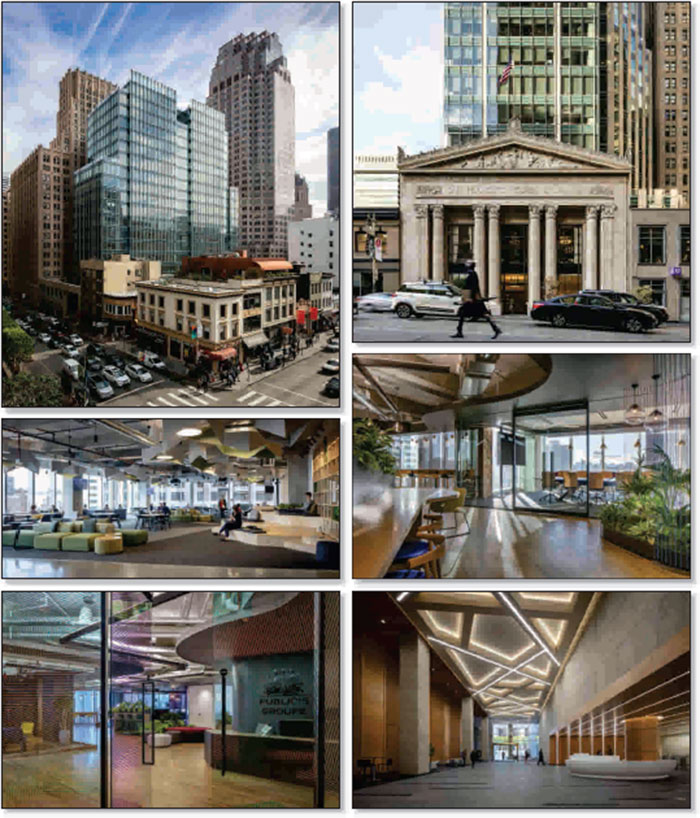
This is not a research report and was not prepared by any Underwriter’s research department. Please see additional important information and qualifications at the end of this Term Sheet.
T-24
| Office – CBD | Loan #1 | Cut-off Date Balance: | $100,000,000 | |
| 350 Bush Street | 350 Bush Street | Cut-off Date LTV: | 35.4% | |
| San Francisco, CA 94104 | UW NCF DSCR: | 3.42x | ||
| UW NOI Debt Yield: | 14.2% |
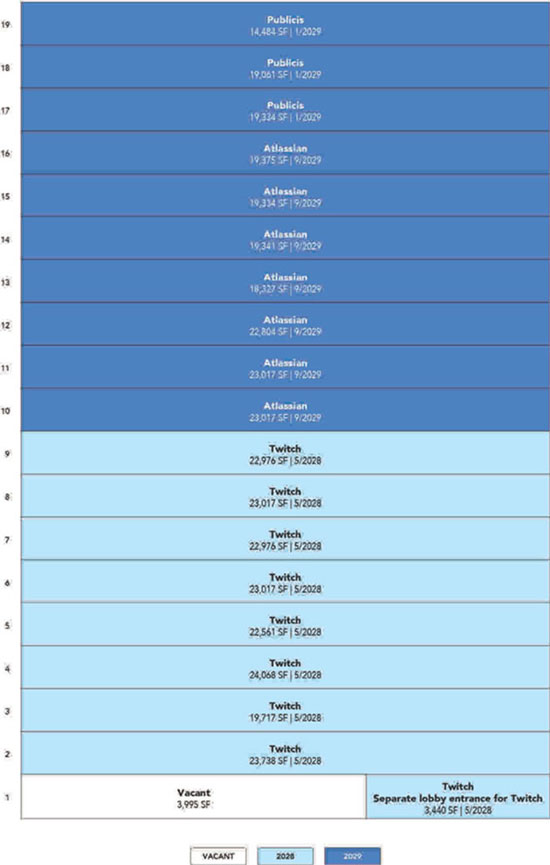
This is not a research report and was not prepared by any Underwriter’s research department. Please see additional important information and qualifications at the end of this Term Sheet.
T-25
| Office – CBD | Loan #1 | Cut-off Date Balance: | $100,000,000 | |
| 350 Bush Street | 350 Bush Street | Cut-off Date LTV: | 35.4% | |
| San Francisco, CA 94104 | UW NCF DSCR: | 3.42x | ||
| UW NOI Debt Yield: | 14.2% |
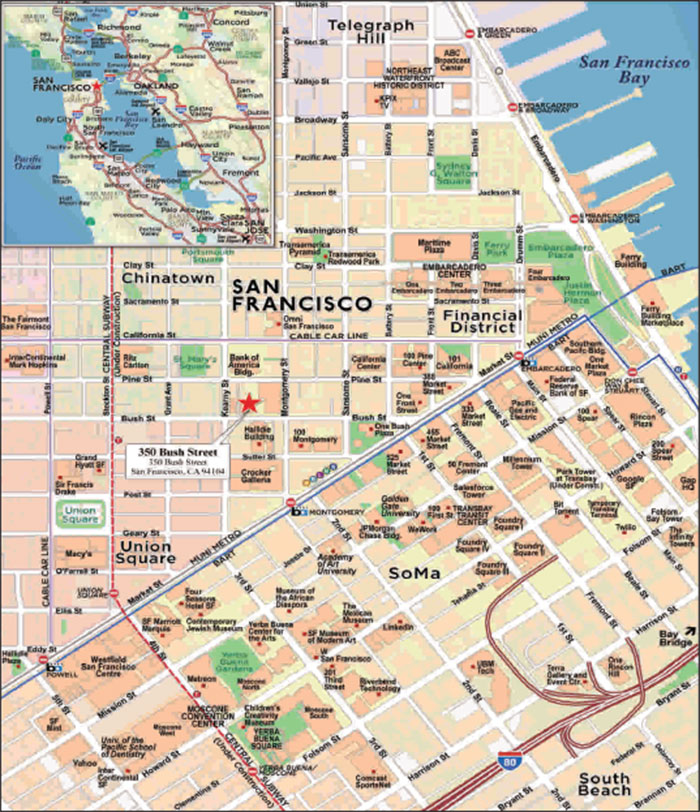
This is not a research report and was not prepared by any Underwriter’s research department. Please see additional important information and qualifications at the end of this Term Sheet.
T-26
| Office – CBD | Loan #1 | Cut-off Date Balance: | $100,000,000 | |
| 350 Bush Street | 350 Bush Street | Cut-off Date LTV: | 35.4% | |
| San Francisco, CA 94104 | UW NCF DSCR: | 3.42x | ||
| UW NOI Debt Yield: | 14.2% |
| Mortgage Loan No. 1 – 350 Bush Street |
| Mortgage Loan Information | Property Information | |||||
| Mortgage Loan Seller: | WFB | Single Asset/Portfolio: | Single Asset | |||
| Credit Assessment (Fitch/KBRA/Moody’s): | A-sf/A(sf)/A3(sf) | Location: | San Francisco, CA 94104 | |||
| Original Balance(1): | $100,000,000 | General Property Type: | Office | |||
| Cut-off Date Balance(1): | $100,000,000 | Detailed Property Type: | CBD | |||
| % of Initial Pool Balance: | 9.6% | Title Vesting: | Fee | |||
| Loan Purpose: | Refinance | Year Built/Renovated: | 2018/N/A | |||
| Sponsors: | Gemdale USA Corporation; Vision Real | Size: | 387,599 SF | |||
| Estate Development, Inc. | Cut-off Date Balance per SF(1): | $477 | ||||
| Guarantors: | Gemdale USA Corporation; Vision Real | Maturity Balance per SF(1): | $477 | |||
| Estate Development, Inc. | Property Manager: | LPC West, Inc. | ||||
| Mortgage Rate: | 3.9122% | |||||
| Note Date: | 4/22/2019 | |||||
| First Payment Date: | 6/11/2019 | |||||
| Maturity Date: | 5/11/2029 | |||||
| Original Term to Maturity: | 120 months | |||||
| Original Amortization Term: | 0 months | |||||
| IO Period: | 120 months | Underwriting and Financial Information | ||||
| Seasoning: | 0 months | UW NOI(4): | $26,306,599 | |||
| Prepayment Provisions(2): | LO (24); DEF (89); O (7) | UW NOI Debt Yield(1)(3): | 14.2% | |||
| Lockbox/Cash Mgmt Status: | Hard/In Place | UW NOI Debt Yield at Maturity(1)(3): | 14.2% | |||
| Additional Debt Type(1)(3): | Pari Passu / Senior Mezzanine / Junior Mezzanine | UW NCF DSCR(1)(3): | 3.42x | |||
| Additional Debt Balance(1)(3): | $85,000,000 / $65,000,000 / $35,000,000 | Most Recent NOI(4): | $6,902,758 (12/31/2018) | |||
| Future Debt Permitted (Type): | No (N/A) | 2nd Most Recent NOI(5): | N/A | |||
| Reserves | 3rd Most Recent NOI(5): | N/A | ||||
| Type | Initial | Monthly | Cap | Most Recent Occupancy: | 99.0% (4/22/2019) | |
| Real Estate Taxes: | $409,996 | $205,001 | N/A | 2nd Most Recent Occupancy: | 99.0% (12/31/2018) | |
| Insurance: | $69,579 | $23,192 | N/A | 3rd Most Recent Occupancy(5): | N/A | |
| Recurring Replacements: | $0 | Springing | N/A | Appraised Value (as of)(6): | $522,000,000 (8/1/2019) | |
| TI/LC: | $0 | Springing | N/A | Appraised Value per SF(6): | $1,347 | |
| Existing TI/LC Obligations Reserve: | $6,651,482 | $0 | N/A | Cut-off Date LTV Ratio(1)(3)(6): | 35.4% | |
| Development Work Reserve: | $153,188 | $0 | N/A | Maturity Date LTV Ratio(1)(3)(6): | 35.4% | |
| Sources and Uses | ||||||
| Sources | Proceeds | % of Total | Uses | Proceeds | % of Total | |
| Whole Loan Amount(1): | $185,000,000 | 74.0% | Loan Payoff Amount: | $147,331,917 | 58.9% | |
| Mezzanine Debt(3): | $65,000,000 | 26.0% | Upfront Reserves: | $7,284,245 | 2.9% | |
| Closing Costs: | $1,224,279 | 0.5% | ||||
| Return of Equity: | $94,159,559 | 37.7% | ||||
| Total Sources: | $250,000,000 | 100.0% | Total Uses: | $250,000,000 | 100.0% | |
| (1) | The Cut-off Date Balance per SF, Maturity Date Balance per SF, UW NOI Debt Yield, UW NOI Debt Yield at Maturity, UW NCF DSCR, Cut-off Date LTV Ratio and Maturity Date LTV Ratio numbers presented above are based on the 350 Bush Street Whole Loan (as defined below). |
| (2) | Defeasance of the 350 Bush Street Whole Loan is permitted at any time after the earlier to occur of (a) the end of the two-year period commencing on the closing date of the securitization of the last promissory note representing a portion of the 350 Bush Street Whole Loan to be securitized and (b) April 22, 2022. The assumed defeasance lockout period of 24 payments is based on the closing date of this transaction in May 2019. |
| (3) | The equity interest in the 350 Bush Street Borrower (as defined in “The Borrower and the Sponsors” section below) has been pledged to secure mezzanine indebtedness with an original principal balance of $65,000,000. As of the Note Date, a separate 350 Bush Street EB-5 Junior Mezzanine Loan of up to $35,000,000 (as defined in the “Mezzanine Loan and Preferred Equity” section below) remains outstanding. As of the Cut-off Date, the UW NOI Debt Yield, UW NOI Debt Yield at Maturity, UW NCF DSCR, Cut-off Date LTV Ratio and Maturity Date LTV Ratio based on the 350 Bush Street New Debt (as defined in the “Mezzanine Loan and Preferred Equity” section below) are 10.5%, 10.5%, 2.32x, 47.9% and 47.9%, respectively, while the UW NOI Debt Yield, UW NOI Debt Yield at Maturity, UW NCF DSCR, Cut-off Date LTV Ratio and Maturity Date LTV Ratio based on the fully advanced 350 Bush Street Total Debt (as defined in the “Mezzanine Loan and Preferred Equity” section below) are 9.2%, 9.2%, 2.30x, 54.6% and 54.6%, respectively. See the “Mezzanine Loan and Preferred Equity” section below for a full discussion. |
| (4) | See “Operating History and Underwritten Net Cash Flow” below for a further discussion of the increase from Most Recent NOI to UW NOI. |
| (5) | Prior historical operating statements and occupancy are not applicable, as the 350 Bush Street Property was constructed in 2018. |
| (6) | The Appraised Value shown reflects a “prospective value upon stabilization” which assumes that all remaining capital costs and tenant improvements have been paid, free rent periods have expired and the vacant retail space has been leased (see “The Property” section below for further discussion of the retail space). At loan closing, the 350 Bush Street Borrower escrowed $6,651,482 for all existing tenant improvements. There is no free rent, leasing commissions or gap rent outstanding as all tenants are currently paying full, unabated rent for the entirety of their spaces. The appraiser also concluded to an “as-is” appraised value of $493,000,000 as of August 2, 2018, which results in a Cut-off Date LTV Ratio of 37.5% and Maturity Date LTV Ratio of 37.5% for the 350 Bush Street Whole Loan. |
This is not a research report and was not prepared by any Underwriter’s research department. Please see additional important information and qualifications at the end of this Term Sheet.
T-27
| Office – CBD | Loan #1 | Cut-off Date Balance: | $100,000,000 | |
| 350 Bush Street | 350 Bush Street | Cut-off Date LTV: | 35.4% | |
| San Francisco, CA 94104 | UW NCF DSCR: | 3.42x | ||
| UW NOI Debt Yield: | 14.2% |
The Mortgage Loan. The largest mortgage loan (the “350 Bush Street Mortgage Loan”) is part of a whole loan (the “350 Bush Street Whole Loan”) that is evidenced by threepari passupromissory notes in the aggregate original principal amount of $185,000,000. The 350 Bush Street Whole Loan is secured by a first priority fee mortgage encumbering a Class A office building located in San Francisco, California (the “350 Bush Street Property”). The 350 Bush Street Mortgage Loan is evidenced by the controlling promissory Note A-1 in the original principal amount of $100,000,000. The non-controlling promissory notes A-2 and A-3 in the aggregate original principal amount of $85,000,000 (collectively, the “350 Bush Street Serviced Companion Loans”) are currently held by Wells Fargo Bank, N.A. and are expected to be contributed to future securitization trusts or may be otherwise transferred at any time. The 350 Bush Street Whole Loan will be serviced pursuant to the pooling and servicing agreement for the BANK 2019-BNK18 securitization trust. See “Description of the Mortgage Pool—The Whole Loans—The Serviced Pari Passu Whole Loans” and “Pooling and Servicing Agreement” in the Preliminary Prospectus.
| 350 Bush Street Whole Loan Summary | ||||
| Note | Original Balance | Cut-off Date Balance | Note Holder | Lead Servicing Interest |
| A-1 | $100,000,000 | $100,000,000 | BANK 2019-BNK18 | Yes |
| A-2 | $65,000,000 | $65,000,000 | Wells Fargo Bank, N.A. | No |
| A-3 | $20,000,000 | $20,000,000 | Wells Fargo Bank, N.A. | No |
| Total | $185,000,000 | $185,000,000 | ||
The Borrower and the Borrower Sponsors. The borrower is 350 Bush Street Owner LLC (the “350 Bush Street Borrower”), a Delaware limited liability company and single purpose entity with one independent director. Legal counsel to the 350 Bush Street Borrower delivered a non-consolidation opinion in connection with the origination of the 350 Bush Street Whole Loan.
The borrower sponsors and non-recourse carveout guarantors are Gemdale USA Corporation (“Gemdale”) and Vision Real Estate Development, Inc. (a subsidiary of Gemdale), each a Delaware corporation. Gemdale is a real estate investment and development company headquartered in Pasadena, California, with offices in New York City, San Francisco, Boston, Seattle and Dallas. The company primarily develops commercial, multifamily rental and for-sale residential projects and focuses on Class A ground-up developments in key gateway high barrier-to-entry markets. Gemdale was the original developer of the 350 Bush Street Property and its portfolio includes office projects in San Francisco, Los Angeles, San Jose, Orange County, California, Boston and New York City. Gemdale is the U.S. subsidiary of Gemdale Corporation, one of China’s largest real estate developers. Gemdale Corporation was founded in 1988 and first listed on the Shanghai Stock Exchange in 2001. In 2017, Gemdale Corporation built and sold residential condominiums totaling approximately 82.9 million SF across 40 cities in China.
The Property. The 350 Bush Street Property is a 387,599 SF, 19-story Class A office building located in San Francisco, California. Constructed in 2018 and situated on a 0.8-acre site, the 350 Bush Street Property was 99.0% leased to three technology and communications tenants as of April 22, 2019 (with approximately 61.5% of the NRA and 60.9% of underwritten base rent attributed to investment grade tenants). The 350 Bush Street Property includes two ground-level retail spaces totaling 3,995 SF (1.0% of NRA), with frontage on Bush Street and Pine Street, respectively, which are currently vacant and account for all economically vacant space in the building. Construction along the side of the 350 Bush Street Property fronting Bush Street integrated the historic San Francisco Mining Exchange (“Mining Exchange”), the second oldest exchange in the United States after the New York Stock Exchange. The historic Mining Exchange hall serves as the lobby for the 350 Bush Street Property and includes a three-story atrium and a museum that showcases the history of the building and San Francisco’s mining industry. The 350 Bush Street Property features five landscaped terraces on the 3rd, 5th, 18th and 19th floors and on the rooftop. According to the appraisal, the 350 Bush Street Property is one of only two office buildings in the San Francisco Financial District built since 2016. The 350 Bush Street Property includes two levels of basement parking totaling 110 parking spaces, which is operated by Ace Parking III, LLC.
Major Tenants.
Twitch (A+/A3/AA- by Fitch/Moody’s/S&P, 185,510 SF, 47.9% of NRA; 46.2% of underwritten base rent, May 31, 2028 expiration). Twitch Interactive, Inc. (“Twitch”), a subsidiary of Amazon, Inc. (“Amazon”), is a live streaming platform and community for video game players. Founded in 2011 and headquartered at the 350 Bush Street Property, Twitch originally focused almost entirely on video games but has since expanded to include streams dedicated to artwork creation, music, talk shows, and TV series. In August 2014, Amazon acquired Twitch for approximately $970 million. The platform has approximately 15 million daily active users and the Twitch iOS/Android apps have had over 83 million downloads. Twitch reports approximately 23 billion minutes watched per month, as of April 2019. Twitch took occupancy of its space at the 350 Bush Street Property (floors two through nine) in July 2018. Twitch’s lease is guaranteed by Amazon and has two, five-year renewal options at the fair market rental rate following its lease expiration in May 2028.
Atlassian (145,215 SF, 37.5% of NRA; 39.1% of underwritten base rent, September 30, 2029 expiration). Atlassian, Inc. (“Atlassian”) is a software company focused on providing various combinations of collaborative products designed for all types of businesses. Founded in 2002 in Sydney, Australia, Atlassian (NASDAQ: TEAM) currently has approximately 3,000 employees and over 125,000 customers, including NASA, Blackrock, Airbnb, Audi, Twitter, and Tesla. Atlassian currently has over 4,000 apps in its marketplace and reported fiscal year (“FY”) 2018 revenue of approximately $874 million, a 41.0% increase from FY 2017. As of May 1, 2019, Atlassian’s market capitalization was approximately $26.2 billion. Atlassian took occupancy of its Phase I space at the 350 Bush Street Property (106,506 SF on floors 10 through 14) in October 2018 and is targeting an October 2019 move in date for Phase II (38,709 SF on floors 15 and 16). Atlassian is currently paying full, unabated rent on its entire 145,215 SF space. Atlassian may terminate its lease for its entire space effective June 1, 2027 with 12 months prior notice, subject to a termination fee in an amount equal to the present value of the remaining base rent obligation through the end of the remaining term, discounted 7.5%per annum from June 1, 2018. Atlassian has one, five-year renewal option at the fair market rental rate following its lease expiration in September 2029.
This is not a research report and was not prepared by any Underwriter’s research department. Please see additional important information and qualifications at the end of this Term Sheet.
T-28
| Office – CBD | Loan #1 | Cut-off Date Balance: | $100,000,000 | |
| 350 Bush Street | 350 Bush Street | Cut-off Date LTV: | 35.4% | |
| San Francisco, CA 94104 | UW NCF DSCR: | 3.42x | ||
| UW NOI Debt Yield: | 14.2% |
Publicis (Baa2/BBB+ by Moody’s/S&P, 52,879 SF, 13.6% of NRA; 14.7% of underwritten base rent, January 31, 2029 expiration). Publicis Groupe, S.A. (“Publicis”), founded in 1926, is the world’s third largest communications group. The company has approximately 80,000 employees across over 100 countries and reported revenues of approximately €9.95 billion in FY 2018, an increase of approximately 1.1% over FY 2017. Publicis took occupancy of its space at the 350 Bush Street Property (floors 17 through 19) in June 2018. Publicis has one, five-year renewal option at 95% of the fair market rental rate following its lease expiration in January 2029.
The following table presents certain information relating to the tenancy at the 350 Bush Street Property:
| Tenant Summary | |||||||||
| Tenant Name | Credit Rating (Fitch/Moody’s/S&P) | Tenant SF | Approximate % of SF | Annual UW Rent | % of Total Annual UW Rent | Annual UW Rent PSF | Termination Option (Y/N) | Lease Expiration | |
| Twitch | A+/A3/AA-(1) | 185,510 | 47.9% | $11,846,664(2) | 46.2% | $63.86(2) | N | 5/31/2028(3) | |
| Atlassian(4) | NR/NR/NR | 145,215 | 37.5% | $10,021,287(5) | 39.1% | $69.01(5) | Y(6) | 9/30/2029(7) | |
| Publicis | NR/Baa2/BBB+(1) | 52,879 | 13.6% | $3,758,111(8) | 14.7% | $71.07(8) | N | 1/31/2029(9) | |
| Subtotal/Wtd. Avg. | 383,604 | 99.0% | $25,626,062 | 100.0% | $66.80 | ||||
| Vacant Space(10) | 3,995 | 1.0% | $0 | 0.0% | $0.00 | ||||
| Total/Wtd. Avg. | 387,599 | 100.0% | $25,626,062 | 100.0% | $66.80 | ||||
| (1) | The Twitch lease is guaranteed by Amazon, Inc., the rated entity. The Publicis lease is guaranteed by the Sapient Corporation, which is a subsidiary of Publicis Groupe S.A., the rated entity. |
| (2) | The Annual UW Rent and Annual UW Rent PSF shown above represent Twitch’s current contractual rent. The lender’s underwriting gives separate credit for straight-line rent averaging over the remaining lease term for Twitch totaling $1,675,737, which implies a total underwritten rental rate of $72.89 PSF (see “Operating History and Underwritten Net Cash Flow” below). |
| (3) | Twitch has two, 5-year renewal options with 15 months’ notice at the then prevailing fair market rental rate. |
| (4) | Atlassian took occupancy of its Phase I space (106,506 SF on floors 10 through 14) in October 2018 and is targeting an October 2019 move in date for Phase II (38,709 SF on floors 15 and 16). Atlassian is currently paying full, unabated rent on all of its 145,215 SF of space. |
| (5) | Annual UW Rent and Annual UW Rent PSF include a contractual rent step for Atlassian in June 2019 totaling $291,882. Atlassian’s current contractual rent is $67.00 PSF. |
| (6) | Atlassian may terminate its lease effective June 1, 2027 with 12 months prior notice, subject to a termination fee in an amount equal to the present value of the remaining base rent obligation through the end of the remaining term, discounted 7.5%per annum from June 1, 2018, which will be deposited in reserve with the lender (subject to a cap of $16,000,000 so long as no event of default exists). |
| (7) | Atlassian has one, 5-year renewal option with 15 months’ notice at the then prevailing fair market rental rate. |
| (8) | The Annual UW Rent and Annual UW Rent PSF shown above represent Publicis’ current contractual rent. The lender’s underwriting gives separate credit for straight-line rent averaging over the remaining lease term for Publicis totaling $517,806, which implies a total underwritten rental rate of $80.86 PSF (see “Operating History and Underwritten Net Cash Flow” below). |
| (9) | Publicis has one, 5-year renewal option with 12 months’ notice at 95% of the then prevailing fair market rental rate. |
| (10) | All vacant space is related to two ground level retail spaces. |
The following table presents certain information relating to the lease rollover schedule at the 350 Bush Street Property:
| Lease Rollover Schedule(1)(2) | ||||||||
| Year | # of Leases Rolling | SF Rolling | Annual UW Rent PSF Rolling(3) | Approx. % of Total SF Rolling | Approx. Cumulative % of SF Rolling | Total UW Rent Rolling | Approx. % of Total Rent Rolling | Approx. Cumulative % of Total Rent Rolling |
| 2019 | 0 | 0 | $0.00 | 0.0% | 0.0% | $0 | 0.0% | 0.0% |
| 2020 | 0 | 0 | $0.00 | 0.0% | 0.0% | $0 | 0.0% | 0.0% |
| 2021 | 0 | 0 | $0.00 | 0.0% | 0.0% | $0 | 0.0% | 0.0% |
| 2022 | 0 | 0 | $0.00 | 0.0% | 0.0% | $0 | 0.0% | 0.0% |
| 2023 | 0 | 0 | $0.00 | 0.0% | 0.0% | $0 | 0.0% | 0.0% |
| 2024 | 0 | 0 | $0.00 | 0.0% | 0.0% | $0 | 0.0% | 0.0% |
| 2025 | 0 | 0 | $0.00 | 0.0% | 0.0% | $0 | 0.0% | 0.0% |
| 2026 | 0 | 0 | $0.00 | 0.0% | 0.0% | $0 | 0.0% | 0.0% |
| 2027 | 0 | 0 | $0.00 | 0.0% | 0.0% | $0 | 0.0% | 0.0% |
| 2028 | 1 | 185,510 | $63.86 | 47.9% | 47.9% | $11,846,664 | 46.2% | 46.2% |
| 2029 | 2 | 198,094 | $69.56 | 51.1% | 99.0% | $13,779,398 | 53.8% | 100.0% |
| 2030 & Beyond | 0 | 0 | $0.00 | 0.0% | 99.0% | $0 | 0.0% | 100.0% |
| Vacant | 0 | 3,995 | $0.00 | 1.0% | 100.0% | $0 | 0.0% | 100.0% |
| Total/Wtd. Avg. | 3 | 387,599 | $66.80 | 100.0% | $25,626,062 | 100.0% | ||
| (1) | Information is based on the underwritten rent roll. |
| (2) | Certain tenants may have lease termination options that are exercisable prior to the originally stated expiration date of the subject lease and that are not considered in the Lease Rollover Schedule. |
| (3) | Wtd. Avg. UW Rent PSF Rolling excludes vacant space. |
This is not a research report and was not prepared by any Underwriter’s research department. Please see additional important information and qualifications at the end of this Term Sheet.
T-29
| Office – CBD | Loan #1 | Cut-off Date Balance: | $100,000,000 | |
| 350 Bush Street | 350 Bush Street | Cut-off Date LTV: | 35.4% | |
| San Francisco, CA 94104 | UW NCF DSCR: | 3.42x | ||
| UW NOI Debt Yield: | 14.2% |
The Market. The 350 Bush Street Property is located within the Financial District of San Francisco, California, approximately three blocks northwest of the Montgomery St. Bay Area Rapid Transit (BART) Station, which is serviced by the Yellow (Antioch, CA), Blue (Dublin/Pleasanton, CA), Green (Daly City, CA) and Red (Richmond, CA) lines and connects to the San Francisco Municipal Transportation Authority network of buses, light rail and cable cars. Thecentral subway extension project, planned to open in late 2019, is expected to serve approximately 35,000 new customers per day and is expected to bring the T-Third Street light rail commuter line from its existing 4th and King Station (approximately 1.4 miles southeast of the 350 Bush Street Property) into a new subway running beneath 4th and Stockton Streets (approximately four blocks southwest of the 350 Bush Street Property).The 350 Bush Street Property is situated approximately 13.8 miles north of the San Francisco International Airport and 18.1 miles northwest of the Oakland International Airport. Approximately 5 blocks southwest of the 350 Bush Street Property is Westfield San Francisco Centre, an approximately 1.3 million SF Unibail-Rodamco-Westfield-owned super regional mall anchored by Nordstrom and Bloomingdale’s, featuring various boutique shops, dining and entertainment options, including a Lego Store and a nine-screen Century San Francisco Centre Theatre.
According to a third party market research provider, the estimated 2019 population within a one-, three- and five-mile radius of the 350 Bush Street Property was approximately 145,501, 434,211 and 693,793, respectively; and the estimated 2019 average household income within the same radii was approximately $114,487, $139,388 and $141,361, respectively.
According to a third-party market research report, the 350 Bush Street Property is situated within the Financial District Office submarket of the San Francisco Office Market. As of April 25, 2019, the Financial District Office submarket reported a total inventory of approximately 30.5 million SF with a 7.5% vacancy rate and average asking rent of $69.80 per SF, triple net. The submarket vacancy rate has decreased from 13.4% in 2010 and has averaged 9.1% from 2010 through 2018.
The appraiser identified six directly competitive office properties totaling approximately 6.8 million SF, with an average occupancy rate of 93.7% and direct asking rents ranging from $85.00 to $117.00 per SF, full-service (asking rents based on 10 comparable leases; with one property reporting two comparable leases at rental rates of $57.50 per SF and 68.50 per SF, triple net, with expense charges quoted at $25.00 per SF).
The following table presents certain information relating to the appraisal’s market rent conclusion for the 350 Bush Street Property:
| Market Rent Summary | |||
Office – Lower (Floor 02-09) | Office – Mid (Floor 10-16) | Office – Upper (Floor 17-19) | |
| Market Rent (PSF) | $91 | $94 | $96 |
| Lease Term (Years) | 10 | 10 | 10 |
| Lease Type (Reimbursements) | Full-Service | Full-Service | Full-Service |
| Rent Increase Projection | 3.0%per annum | 3.0%per annum | 3.0%per annum |
The following table presents information relating to comparable office property sales for the 350 Bush Street Property:
| Comparable Property Sale Summary | ||||||||
| Property Name/Location | Sale Date | Year Built/ Renovated | Total NRA (SF) | Occupancy | Sale Price | Adjusted Sale Price(1) | Sale Price PSF | Appraiser’s Adjusted Sale Price PSF(1) |
350 Bush Street (subject) San Francisco, CA | N/A | 2018/N/A | 387,599 | 99% | ||||
Foundry Square III; 505 Howard Street San Francisco, CA | Dec. 2016 | 2014/N/A | 291,093 | 100% | $332,030,000 | $332,030,000 | $1,140.63 | $1,140.63 |
55 Hawthorne Street San Francisco, CA | Dec. 2016 | 1970/2011 | 136,432 | 100% | $123,000,000 | $125,200,000 | $901.55 | $917.67 |
303 2nd Street San Francisco, CA | Nov. 2016 | 1988/N/A | 740,047 | 95% | $721,000,000 | $721,000,000 | $974.26 | $974.26 |
100 First Plaza; 100 1st Street San Francisco, CA | Aug. 2016 | 1988/N/A | 466,000 | 89% | $434,100,000 | $437,700,000 | $931.55 | $939.27 |
140 New Montgomery Street San Francisco, CA | April 2016 | 1925/2013 | 295,177 | 100% | $284,000,000 | $284,000,000 | $962.13 | $962.13 |
Source:Appraisal.
| (1) | Adjusted sale price for all cash equivalency, lease-up and/or deferred maintenance (as applicable). |
This is not a research report and was not prepared by any Underwriter’s research department. Please see additional important information and qualifications at the end of this Term Sheet.
T-30
| Office – CBD | Loan #1 | Cut-off Date Balance: | $100,000,000 | |
| 350 Bush Street | 350 Bush Street | Cut-off Date LTV: | 35.4% | |
| San Francisco, CA 94104 | UW NCF DSCR: | 3.42x | ||
| UW NOI Debt Yield: | 14.2% |
The following table presents certain information relating to comparable office leases for the 350 Bush Street Property:
| Comparable Leases Summary(1) | |||||||||
| Property Name/Location | Year Built/ Renovated | Total GLA (SF) | Occupancy | Distance from Subject | Tenant Name | Lease Date/Term | Lease Area (SF) | Annual Base Rent PSF | Lease Type |
350 Bush Street Property 350 Bush Street San Francisco, CA | 2018/N/A | 387,599 | 99% | - | Twitch | Jan. 2018 / 10.3 Yrs | 185,510 | $63.86(1) | Triple Net |
| Atlassian | Jan. 2018 / 11.3 Yrs | 145,215 | $67.00(1) | Triple Net | |||||
| Publicis | May 2018 / 10.7 Yrs | 52,879 | $71.07(1) | Triple Net | |||||
415 Mission Street 415 Mission Street San Francisco, CA | 2018/N/A | 1,400,000 | 90% | 0.4 Miles | CBRE (New) | Aug. 2018 / 10.0 Yrs | 38,137 | $100.00 | Full Service |
| VY Capital (New) | 2018 / 10.0 Yrs | 18,833 | $117.00 | Full Service | |||||
One Market Plaza 1 Market Street San Francisco, CA | 1976/N/A | 1,504,700 | 95% | 0.6 Miles | Ironwood Capital Mgt. (Renewal) | May 2019 / 5.2 Yrs | 17,860 | $107.00 | Full Service |
555 California Street 555 California Street San Francisco, CA | 1969/N/A | 1,497,000 | 95% | 0.1 Miles | UBS (Renewal) | Feb. 2017 / 11.5 Yrs | 54,877 | $85.00 | Full Service |
| HMI (New) | Feb. 2018 / 8.2 Yrs | 13,737 | $109.00 | Full Service | |||||
4 Embarcadero Center 4 Embarcadero Center San Francisco, CA | 1979/N/A | 938,200 | 83% | 0.6 Miles | Stockbridge Capital (Renewal) | Dec. 2016 / 3 Yrs | 22,313 | $98.00 | Full Service |
The Ferry Building 1 Embarcadero Center San Francisco, CA | 1898/2002 | 262,500 | 100% | 0.7 Miles | Taylor & Co. Law (New) | Aug 2018 / 2.2 Yrs | 6,185 | $100.00 | Full Service |
| Shack 15/Meltwater (Renewal) | Jun 2018 / 10.7 Yrs | 45,795 | $95.00 | Full Service | |||||
101 California Street 101 California Street San Francisco, CA | 1982/N/A | 1,243,000 | 99% | 0.4 Miles | Prudential Mortgage Capital (New) | Apr 2018 / 10 Yrs | 25,633 | $57.50 | Triple Net |
| CBRE (Short-Term Renewal) | Aug 2017 / 1 Yr | 25,660 | $68.50 | Triple Net | |||||
Source:Appraisal.
| (1) | Information for the 350 Bush Street Property is based on the underwritten rent roll. Atlassian has a current annual base rental rate of $67.00 PSF and was underwritten to $69.01 PSF based on its contractual escalation in June 2019. The rental rates shown above for Twitch and Publicis represent each tenant’s current contractual rental rates. The lender’s underwriting gives separate credit for straight-line rent averaging over the remaining lease term for Twitch and Publicis (see “Underwritten Net Cash Flow” below). |
This is not a research report and was not prepared by any Underwriter’s research department. Please see additional important information and qualifications at the end of this Term Sheet.
T-31
| Office – CBD | Loan #1 | Cut-off Date Balance: | $100,000,000 | |
| 350 Bush Street | 350 Bush Street | Cut-off Date LTV: | 35.4% | |
| San Francisco, CA 94104 | UW NCF DSCR: | 3.42x | ||
| UW NOI Debt Yield: | 14.2% |
Operating History and Underwritten Net Cash Flow.The following table presents certain information relating to the historical operating performance and Underwritten Net Cash Flow at the 350 Bush Street Property:
| Cash Flow Analysis | |||
| 2018(1) | UW(1) | UW PSF | |
| Gross Potential Base Rent | $17,838,654 | $25,626,062(2) | $66.11(2) |
| Rent Average Benefit | $0 | $2,193,543(3) | $5.66 |
| Free Rent Adjustment | ($10,999,863) | $0 | $0.00 |
| Grossed Up Vacant Space | $0 | $379,525 | $0.98 |
| Total Recoveries | $5,187,314 | $10,250,244 | $26.45 |
| Parking Income | $124,120 | $170,820 | $0.44 |
| Other Income(4) | $40,303 | $66,600 | $0.17 |
| Less Vacancy & Credit Loss | $0 | ($1,922,469)(5) | ($4.96) |
| Effective Gross Income | $12,190,528 | $36,764,325 | $94.85 |
| Real Estate Taxes | $1,416,256 | $3,921,790 | $10.12 |
| Insurance | $447,387 | $256,000 | $0.66 |
| Other Operating Expenses | $3,424,127 | $6,279,936 | $16.20 |
| Total Expenses | $5,287,770 | $10,457,726 | $26.98 |
| Net Operating Income | $6,902,758 | $26,306,599 | $67.87 |
| Capital Expenditures | $0 | $58,140 | $0.15 |
| TI/LC | $0 | $1,162,797 | $3.00 |
| Net Cash Flow | $6,902,758 | $25,085,662 | $64.72 |
| Occupancy % | 99.0% | 95.0%(5) | |
| NOI DSCR(6) | 0.94x | 3.58x | |
| NCF DSCR(6) | 0.94x | 3.42x | |
| NOI Debt Yield(6) | 3.7% | 14.2% | |
| NCF Debt Yield(6) | 3.7% | 13.6% | |
| (1) | The 350 Bush Street Property was built in 2018, and the lease commencement dates for Twitch, Atlassian and Publicis ranged from January 2018 to February 2019. The increase in Effective Gross Income and Net Operating Income from 2018 to UW was driven in part by (i) all three tenants taking full occupancy of their spaces and all rent abatement periods expiring and (ii) the inclusion of a contractual rent step for Atlassian in June 2019 totaling $291,882 and straight-line rent averaging for investment grade tenants Twitch and Publicis over their remaining lease terms totaling $2,193,543. |
| (2) | UW Gross Potential Base Rent PSF and UW Gross Potential Base Rent include a contractual rent step for Atlassian in June 2019 totaling $291,882. |
| (3) | Represents straight-line rent averaging over the remaining lease terms for investment grade tenants Twitch and Publicis. |
| (4) | Other Income includes antenna rent, work order fees and other miscellaneous income. |
| (5) | The underwritten economic vacancy is 5.0%. The 350 Bush Street Property was 99.0% occupied as of April 22, 2019. |
| (6) | The debt service coverage ratios and debt yields are based on the 350 Bush Street Whole Loan. |
Escrows and Reserves.
Real Estate Taxes - The 350 Bush Street Borrower is required to deposit an upfront real estate tax reserve of $409,996 and ongoing monthly escrows in an amount equal to one-twelfth of the real estate taxes that the lender estimates will be payable during the next 12 months (initially $205,001).
Insurance - The 350 Bush Street Borrower is required to deposit an upfront insurance reserve of $69,579 and ongoing monthly escrows in an amount equal to one-twelfth of the insurance premiums that the lender estimates will be payable for the renewal of the coverage during the next 12 months (initially $23,192).
Replacement Reserve – Upon the occurrence and continuance of a Cash Trap Event Period (as defined in the “Lockbox and Cash Management” section below), the 350 Bush Street Whole Loan documents require ongoing monthly replacement reserves of $6,460, which the lender may require the 350 Bush Street Borrower to increase (not more than once per year) if the lender reasonably determines such increase is necessary to maintain the proper operation of the 350 Bush Street Property.
Rollover Reserve – Upon the occurrence and continuance of a Cash Trap Event Period, the 350 Bush Street Whole Loan documents require ongoing monthly rollover reserves of $96,900.
Existing TI/LC Obligations Reserve – The 350 Bush Street Borrower is required to deposit an upfront reserve of $6,651,482 for tenant improvements related to Twitch ($2,880,136) and Atlassian ($3,771,346).
This is not a research report and was not prepared by any Underwriter’s research department. Please see additional important information and qualifications at the end of this Term Sheet.
T-32
| Office – CBD | Loan #1 | Cut-off Date Balance: | $100,000,000 | |
| 350 Bush Street | 350 Bush Street | Cut-off Date LTV: | 35.4% | |
| San Francisco, CA 94104 | UW NCF DSCR: | 3.42x | ||
| UW NOI Debt Yield: | 14.2% |
Development Work Reserve – The 350 Bush Street Borrower is required to deposit an upfront reserve of $153,188 for the expected cost of development work, including basement improvements, window washing rig screens and davit corners, amenity deck landscaping, permit closeouts and the receipt of final lien waivers, as required per a development agreement.
Lockbox and Cash Management. The 350 Bush Street Whole Loan documents require that the 350 Bush Street Borrower establish and maintain a lender-controlled lockbox account, which is already in-place, and that the 350 Bush Street Borrower direct all tenants to pay rent directly into such lockbox account. The loan documents also require that all rents received by the 350 Bush Street Borrower or the property manager be deposited into the lockbox account within two business days of receipt. All funds in the lockbox account are required to be swept each business day into the cash management account controlled by the lender and, on each payment date, all funds in the cash management account are required to be applied in accordance with the 350 Bush Street Whole Loan documents. Prior to the occurrence of a Cash Trap Event Period, any excess cash flow will be disbursed to the 350 Bush Street Borrower. During a Cash Trap Event Period, any excess cash flow remaining after satisfaction of the waterfall items are required to be swept to an excess cash flow subaccount to be held by the lender as additional security for the 350 Bush Street Whole Loan during the continuance of the Cash Trap Event Period (subject to a cap in the amount of the Excess Cash Go Dark Event Cap or LOC (as defined below) if the Cash Trap Event Period results solely from a Go Dark Event (as defined below) related to the lease of an Investment Grade Tenant (as defined below)).
A “Cash Trap Event Period” will commence upon the earlier of the following:
| (i) | the occurrence of an event of default under the 350 Bush Whole Loan documents; |
| (ii) | the net cash flow debt service coverage ratio (“NCF DSCR”) for the 350 Bush Street New Debt being less than 1.15x; |
| (iii) | the lender receiving written notice from the senior mezzanine lender that a loan default has occurred under the 350 Bush Street Senior Mezzanine Loan (as defined below); or |
| (iv) | the occurrence of a Lease Sweep Period (as defined below). |
A Cash Trap Event Period will end upon the occurrence of the following:
| ● | with regard to clause (i), the cure of such event of default; |
| ● | with regard to clause (ii), the NCF DSCR for the 350 Bush Street New Debt being equal to or greater than 1.15x for one calendar quarter; |
| ● | with regard to clause (iii), the senior mezzanine lender delivering written notice to the lender that such mezzanine loan default has been cured or waived; or |
| ● | with regard to clause (iv), a Lease Sweep Period Cure (as defined below). |
A “Lease Sweep Period” will commence upon the earlier of the following:
| (i) | 24 months prior to the lease expiration dates of the Twitch or Atlassian (each, a “Major Tenant”) leases unless renewed or extended; |
| (ii) | the date any Major Tenant discontinues its business at 50% or more of its space at the 350 Bush Street Property (or gives notices of its intent to do so) (a “Go Dark Event”); provided, however, that a Cash Trap Event Period triggered by a Go Dark Event related to the lease of an Investment Grade Tenant will be subject to a cap in the amount of the Excess Cash Go Dark Event Cap or LOC (as defined below); |
| (iii) | the date any Major Tenant’s lease is surrendered or terminated prior to its then current expiration; or |
| (iv) | any Major Tenant filing, as a debtor, a bankruptcy or similar insolvency proceeding, or otherwise becoming involved, as a debtor, in a bankruptcy or any similar insolvency proceeding. |
A “Lease Sweep Period Cure” will occur upon the following:
| ● | with regard to clause (i) of the definition of Lease Sweep Period: |
| ○ | (a) the date on which the applicable Major Tenant extends or renews the term of its lease pursuant to the terms of its lease or an approved lease amendment and, in either case, sufficient funds as reasonably determined by the lender having been accumulated in the excess cash flow and/or rollover reserve subaccounts to cover all qualified leasing expenses, free rent periods and/or rent abatement periods in connection with such renewal or extension; |
| ○ | (b) a Major Tenant Re-Tenanting Event (as defined below); or |
| ○ | (c) a DSCR Cure Event (as defined below). |
| ● | with regard to clause (ii) of the definition of Lease Sweep Period: |
| ○ | (a) a Major Tenant Re-Tenanting Event; |
| ○ | (b) a DSCR Cure Event; |
| ○ | (c) the applicable Major Tenant has resumed its business at the 350 Bush Street Property for one month; or |
| ○ | (d) if the applicable Major Tenant is an Investment Grade Tenant (as defined below), the date on which more than 50% of the applicable Major Tenant space is occupied and open for business by such Major Tenant and/or one or more Qualified Subtenants (as defined below) for which (1) the 350 Bush Street Borrower and such Qualified Subtenant have entered into a sublease recognition agreement (as outlined in the loan documents) and (2) all Occupancy Conditions (as defined below) have been satisfied,provided however, that this clause (d) is contingent upon such Major Tenant and such Qualified Subtenant continuing to each be an Investment Grade Tenant. |
| ● | with regard to clause (iii) of the definition of Lease Sweep Period: |
| ○ | (a) a Major Tenant Re-Tenanting Event; or |
| ○ | (b) a DSCR Cure Event. |
This is not a research report and was not prepared by any Underwriter’s research department. Please see additional important information and qualifications at the end of this Term Sheet.
T-33
| Office – CBD | Loan #1 | Cut-off Date Balance: | $100,000,000 | |
| 350 Bush Street | 350 Bush Street | Cut-off Date LTV: | 35.4% | |
| San Francisco, CA 94104 | UW NCF DSCR: | 3.42x | ||
| UW NOI Debt Yield: | 14.2% |
| ● | with regard to clause (iv) of the definition of Lease Sweep Period: |
| ○ | (a) solely if the Major Tenant’s lease has been terminated as a result of a bankruptcy or similar insolvency proceeding, a Major Tenant Re-Tenanting Event; |
| ○ | (b) a DSCR Cure Event; or |
| ○ | (c) such bankruptcy or similar insolvency proceeding has terminated and/or the applicable Major Tenant’s lease has been affirmed and assumed in a manner reasonably satisfactory to the lender. |
“DSCR Cure Event” means the date on which the NCF DSCR for the 350 Bush Street New Debt is at least 1.20x without consideration of any revenue from the applicable Major Tenant lease.
“Excess Cash Go Dark Event Cap or LOC” means in connection with a Lease Sweep Period occurring as a result of a Go Dark Event with respect to an Investment Grade Tenant lease, an amount equal to (or a letter of credit with a face amount of) the product of (i) $50.00 multiplied by (ii) the aggregate rentable square footage of the applicable lease.
“Investment Grade Tenant” means any tenant (or parent entity of any tenant which parent entity has delivered a guaranty to the 350 Bush Street Borrower, guaranteeing such tenant’s obligations under its lease, a “Guaranteed Tenant”) that (i) maintains a long-term unsecured debt rating of at least “BBB+” (or its equivalent) by S&P or Moody’s, or (ii) is an unrated investment grade tenant or Guaranteed Tenant which has a credit score of at least BBB+ and the lender has reasonably determined is substantially similar to at least an investment grade credit rating.
“Major Tenant Re-Tenanting Event” will occur when (1) all or a portion of the Major Tenant’s space is leased pursuant to one or more Qualified Leases (as defined below) sufficient to generate an NCF DSCR for the 350 Bush Street New Debt of at least 1.15x and (2) all Occupancy Conditions have been fully satisfied or expressly waived in writing by the lender.
“Occupancy Conditions” mean delivery by the 350 Bush Street Borrower to the lender of evidence (including an estoppel certificate) that (a) the applicable Major Tenant space is tenanted under one or more Qualified Leases (or Qualified Subleases, as applicable), (b) each such tenant (or Qualified Subtenants, as applicable) is in possession of all of its space and open for business, (c) all contingencies under all such lease(s) have been satisfied, (d) either all TI/LCs have either been completed and paid in full or are reserved with the lender, (e) either such tenant (or Qualified Subtenant, as applicable) has commenced paying full contractual rent and any initial free rent period has expired or such rent amounts have been reserved with the lender and (f) the rent commencement date under all such lease(s) (or Qualified Sublease(s), as applicable) has been set.
“Qualified Lease” means either: (a) the original Major Tenant lease, as extended, renewed or modified in accordance with (1) the express renewal option set forth in such Major Tenant lease or (2) a modification of the Major Tenant lease approved by the lender or (b) a replacement lease (i) with an initial term of not less than five years, (ii) entered into in accordance with the 350 Bush Street Whole Loan documents and (iii) providing for rental rates comparable to existing local market rates for similar properties and is otherwise on commercially reasonable terms.
“Qualified Sublease” means a sublease of all or a portion of the Major Tenant space (a) to an Investment Grade Tenant (b) which occupies the space under a sublease which (i) provides for rental rates at least equal to the rental rates under the applicable Major Tenant lease, (ii) has a term that either (1) expires no earlier than the remainder of the term of the Major Tenant lease or (2) if the remaining term of the applicable Major Tenant lease is longer than five years, is at least five years (but no longer than the remainder term of the applicable Major Tenant lease) and (iii) is otherwise on terms and conditions reasonably approved by the lender (collectively, a “Qualified Subtenant”).
Additional Secured Indebtedness (not including trade debts).The 350 Bush Street Property also secures the 350 Bush Street Serviced Companion Loans, which have an aggregate Cut-off Date principal balance of $85,000,000. The 350 Bush Street Serviced Companion Loans accrue interest at the same rate as the 350 Bush Street Mortgage Loan. The 350 Bush Street Mortgage Loan is entitled to payments of principal and interest on apro rata andpari passu basis with the 350 Bush Street Serviced Companion Loans. The holders of the 350 Bush Street Mortgage Loan and the 350 Bush Street Serviced Companion Loans have entered into a co-lender agreement which sets forth the allocation of collections on the 350 Bush Street Whole Loan. See “Description of the Mortgage Pool—The Whole Loans—The Serviced Pari Passu Whole Loans” in the Preliminary Prospectus.
Mezzanine Loan and Preferred Equity. In connection with the origination of the 350 Bush Street Whole Loan, Wells Fargo Bank, National Association, funded and placed with the entities listed below (which are each affiliates of Apollo Global Management, LLC or Athene Asset Management LLC), a $65,000,000 mezzanine loan (the “350 Bush Street Senior Mezzanine Loan”) to 350 Bush Street Holding LLC (collectively, the 350 Bush Street Whole Loan and the 350 Bush Street Senior Mezzanine Loan are referred to herein as the “350 Bush Street New Debt”). The 350 Bush Street Senior Mezzanine Loan is secured by 100.0% of the direct equity interest in the 350 Bush Street Borrower. The 350 Bush Street Senior Mezzanine Loan accrues interest at a rate of 5.2500%per annum and requires payments of interest-only through the maturity date of May 11, 2029 (co-terminous with the 350 Bush Street Whole Loan).
This is not a research report and was not prepared by any Underwriter’s research department. Please see additional important information and qualifications at the end of this Term Sheet.
T-34
| Office – CBD | Loan #1 | Cut-off Date Balance: | $100,000,000 | |
| 350 Bush Street | 350 Bush Street | Cut-off Date LTV: | 35.4% | |
| San Francisco, CA 94104 | UW NCF DSCR: | 3.42x | ||
| UW NOI Debt Yield: | 14.2% |
| 350 Bush Street Senior Mezzanine Loan Summary | |||
| Mezzanine Note | Original Balance | Cut-off Date Balance | Note Holder |
| A-1 | $20,000,000 | $20,000,000 | The Lincoln National Life Insurance Company |
| A-2 | $15,000,000 | $15,000,000 | Athene Annuity & Life Assurance Company |
| A-3 | $10,000,000 | $10,000,000 | Voya Insurance and Annuity Company |
| A-4 | $5,000,000 | $5,000,000 | Athene Annuity and Life Company |
| A-5 | $5,000,000 | $5,000,000 | Athene Annuity and Life Company |
| A-6 | $5,000,000 | $5,000,000 | Athene Annuity and Life Company |
| A-7 | $5,000,000 | $5,000,000 | American Equity Investment Life Insurance Company |
| Total | $65,000,000 | $65,000,000 | |
The existing capitalization includes an EB-5 junior mezzanine loan of up to $35,000,000 (the “350 Bush Street EB-5 Junior Mezzanine Loan”) between MIM Bush Pine, LLC, as lender (“350 Bush Street EB-5 Junior Mezzanine Lender”) and Bush Pine Mezzanine Owner LLC (an indirect equity owner of the 350 Bush Street Borrower), as borrower (“350 Bush Street EB-5 Junior Mezzanine Borrower), which loan was entered into in August 2015 and remains outstanding after the origination of the 350 Bush Street New Debt (collectively, the 350 Bush Street New Debt and the 350 Bush Street EB-5 Junior Mezzanine Loan are referred to herein as the “350 Bush Street Total Debt”). The 350 Bush Street EB-5 Junior Mezzanine Loan is fully subordinate to the 350 Bush Street New Debt and is secured by a pledge of direct equity interest in the 350 Bush Street EB-5 Junior Mezzanine Borrower. The 350 Bush Street EB-5 Junior Mezzanine Loan accrues interest at a rate of 0.2500%per annum and requires payments of interest-only (such interest payments will be made from excess cash flow to the extent disbursed to the 350 Bush Street Borrower under the 350 Bush Street Whole Loan or from equity contributions permitted pursuant to the 350 Bush Street Whole Loan documents). The initial maturity date of the 350 Bush Street EB-5 Junior Mezzanine Loan is October 31, 2020 (which can be extended for up to two or three one-year extension terms per the conditions outlined in the 350 Bush Street EB-5 Junior Mezzanine Loan documents). In the event the 350 Bush Street EB-5 Junior Mezzanine Loan is not repaid within 15 days of the fully extended maturity date, the interest rate will increase to 7.0000% per annum. Pursuant to the intercreditor agreements, the 350 Bush Street EB-5 Junior Mezzanine Lender is prohibited from enforcing any rights against its collateral until the 350 Bush Street Whole Loan and the 350 Bush Street Senior Mezzanine Loan are repaid and satisfied in full. See “Description of the Mortgage Pool—Additional Indebtedness—Mezzanine Indebtedness” in the Preliminary Prospectus.
| Total Debt Summary | ||||||||
Original Principal Balance | Interest Rate | Original Term (mos.) | Original Amort. Term (mos.) | Original IO Term (mos.) | Total Debt UW NCF DSCR | Total Debt UW NOI Debt Yield | Total Debt Cutoff Date LTV | |
| 350 Bush Street Senior Mezzanine Loan | $65,000,000 | 5.2500% | 120 | 0 | 120 | 2.32x | 10.5% | 47.9% |
| 350 Bush Street EB-5 Junior Mezzanine Loan | $35,000,000 | 0.2500% | 60(1) | 0 | 60 | 2.30x | 9.2% | 54.6% |
| (1) | The 350 Bush Street EB-5 Junior Mezzanine Loan was entered into in August 2015 with the first advance occurring in October 2015. The original maturity date of the 350 Bush Street EB-5 Junior Mezzanine Loan is October 31, 2020. |
Release of Property.Not permitted.
Ground Lease. None.
Right of First Refusal.Twitch has a right of first refusal to purchase the 350 Bush Street Property if the 350 Bush Street Borrower receives an offer to purchase the 350 Bush Street Property from a Competitor (as defined below) (the “ROFR”). The ROFR is not extinguished by foreclosure; however, the ROFR does not apply to foreclosure or deed-in-lieu thereof.
A “Competitor” means any affiliate of the following companies that is generally used as a real estate holding company (or any single purpose entity formed for such purpose) or operating entity: Microsoft Corporation, Alphabet Inc., Apple Inc., Facebook, Inc., Valve Corporation, Zynga, Inc., Netflix, Inc., Samsung Electronics Co. Ltd., Tencent Holdings Limited or Sony Corporation.
Letter of Credit.A letter of credit issued by Credit Industriel et Commercial in the amount of $4,672,000 was delivered by Publicis and a letter of credit issued by Bank of America, N.A. in the amount of $810,784 was delivered by Atlassian, each as a security deposit for its respective lease. The 350 Bush Street Borrower is the beneficiary of each letter of credit and the letters of credit have been assigned to the lender. The 350 Bush Street Borrower is entitled to draw on the letters of credit, subject to the terms of each tenant’s lease. Any proceeds drawn from either letter of credit are required to be deposited with the lender in the rollover reserve and disbursed in connection with the 350 Bush Street Whole Loan documents.
Terrorism Insurance.The 350 Bush Street Whole Loan documents require that the “all risk” insurance policy required to be maintained by the 350 Bush Street Borrower provide coverage for terrorism in an amount equal to the full replacement cost of the 350 Bush Street Property, as well as business interruption insurance covering no less than the 18-month period following the occurrence of a casualty event, together with a 6-month extended period of indemnity (provided that if TRIPRA or a similar statute is not in effect, the 350 Bush Street Borrower will not be obligated to pay terrorism insurance premiums in excess of two times the premium for the casualty and business interruption coverage on a stand-alone basis).
Earthquake Insurance.The 350 Bush Street Whole Loan documents do not require earthquake insurance; however, at the time of loan origination, earthquake insurance coverage was in-place. The seismic report indicated a probable maximum loss of 13.0% for the 350 Bush Street Property.
This is not a research report and was not prepared by any Underwriter’s research department. Please see additional important information and qualifications at the end of this Term Sheet.
T-35
| Office – Suburban | Loan #2 | Cut-off Date Balance: | $100,000,000 | |
| 1000 South Fremont Avenue; | The Alhambra | Cut-off Date LTV: | 65.1% | |
| 1127-1131 South Fremont Avenue | U/W NCF DSCR: | 2.36x | ||
| Alhambra, CA 91803 | U/W NOI Debt Yield: | 10.9% |
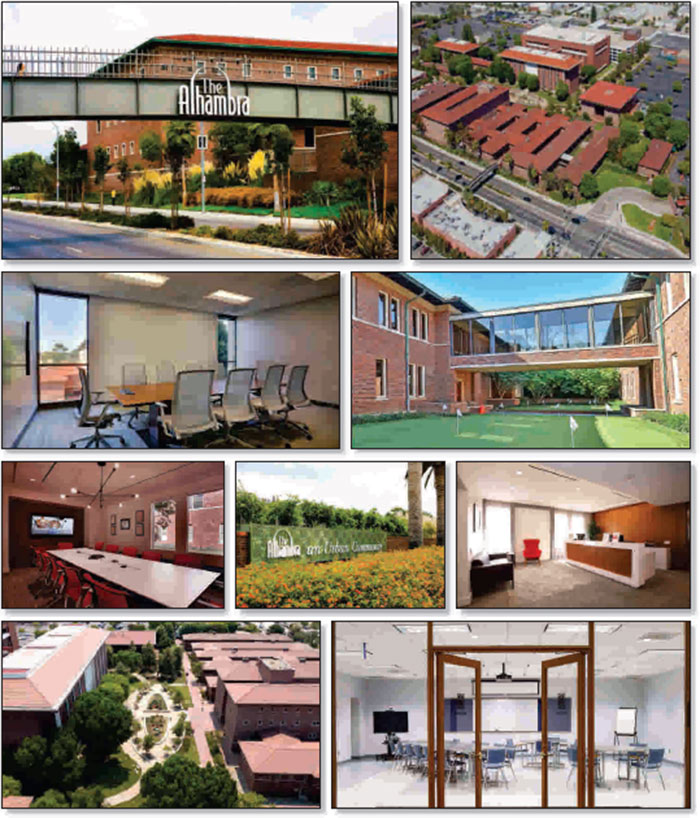
This is not a research report and was not prepared by any Underwriter’s research department. Please see additional important information and qualifications at the end of this Term Sheet.
T-36
| Office – Suburban | Loan #2 | Cut-off Date Balance: | $100,000,000 | |
| 1000 South Fremont Avenue; | The Alhambra | Cut-off Date LTV: | 65.1% | |
| 1127-1131 South Fremont Avenue | U/W NCF DSCR: | 2.36x | ||
| Alhambra, CA 91803 | U/W NOI Debt Yield: | 10.9% |
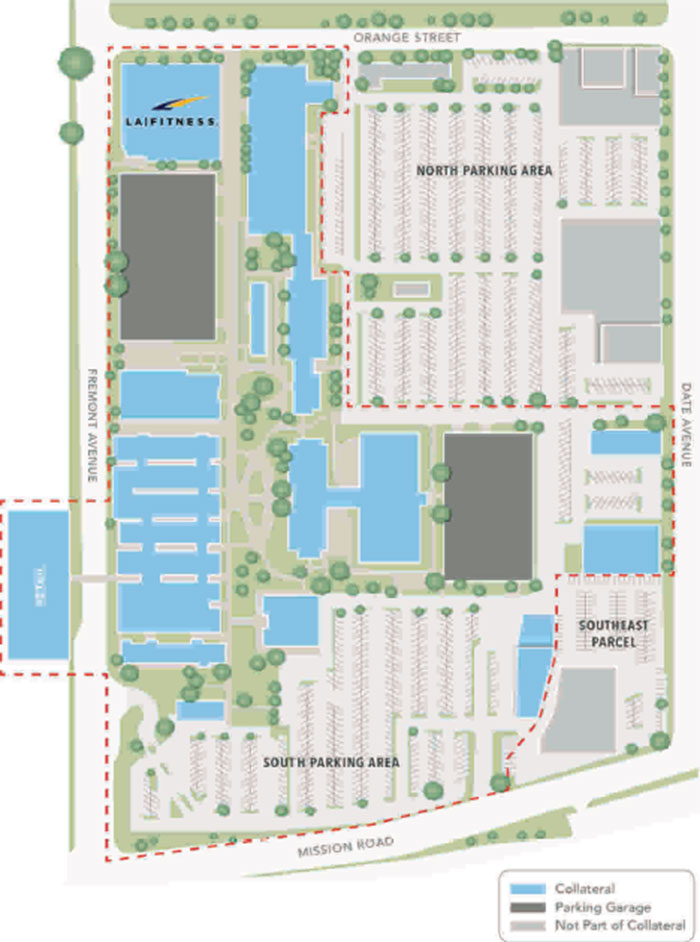
This is not a research report and was not prepared by any Underwriter’s research department. Please see additional important information and qualifications at the end of this Term Sheet.
T-37
| Office – Suburban | Loan #2 | Cut-off Date Balance: | $100,000,000 | |
| 1000 South Fremont Avenue; | The Alhambra | Cut-off Date LTV: | 65.1% | |
| 1127-1131 South Fremont Avenue | U/W NCF DSCR: | 2.36x | ||
| Alhambra, CA 91803 | U/W NOI Debt Yield: | 10.9% |
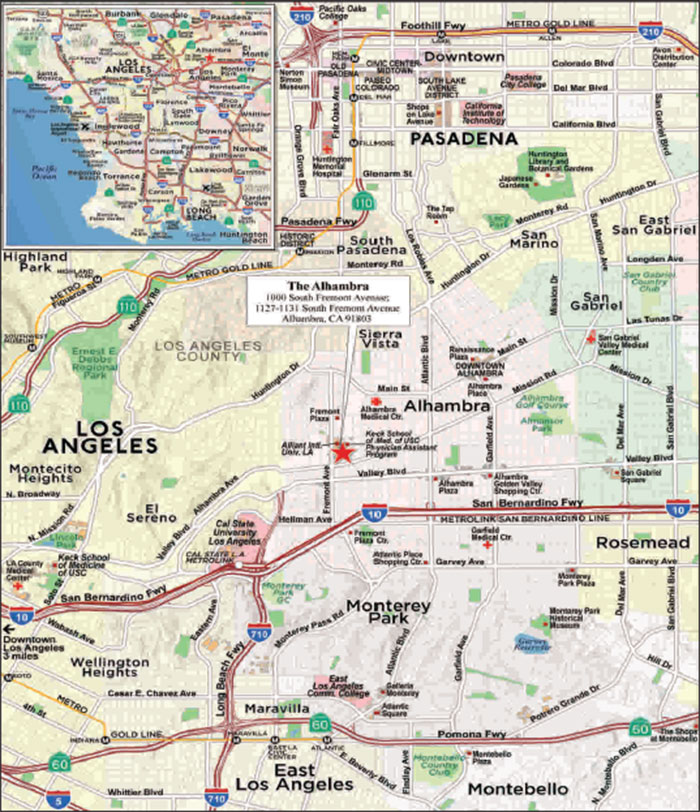
This is not a research report and was not prepared by any Underwriter’s research department. Please see additional important information and qualifications at the end of this Term Sheet.
T-38
| Office – Suburban | Loan #2 | Cut-off Date Balance: | $100,000,000 | |
| 1000 South Fremont Avenue; | The Alhambra | Cut-off Date LTV: | 65.1% | |
| 1127-1131 South Fremont Avenue | U/W NCF DSCR: | 2.36x | ||
| Alhambra, CA 91803 | U/W NOI Debt Yield: | 10.9% |
| Mortgage Loan No. 2 – The Alhambra |
| Mortgage Loan Information | Property Information | |||||||
| Mortgage Loan Seller: | WFB | Single Asset/Portfolio: | Single Asset | |||||
| Credit Assessment (Fitch/KBRA/Moody’s): | NR/NR/NR | Location: | Alhambra, CA 91803 | |||||
| Original Balance(1): | $100,000,000 | General Property Type: | Office | |||||
| Cut-off Date Balance(1): | $100,000,000 | Detailed Property Type: | Suburban | |||||
| % of Initial Pool Balance: | 9.6% | Title Vesting: | Fee | |||||
| Loan Purpose: | Refinance | Year Built/Renovated: | 1927/2015 | |||||
| Sponsors: | RM Properties, LLC; Future Land | Size: | 931,891 SF | |||||
| International LLC; Wayne Ratkovich | Cut-off Date Balance per SF(1): | $161 | ||||||
| Guarantors: | RM Properties, LLC; Future Land | Maturity Date Balance per SF(1): | $161 | |||||
| International LLC; Wayne Ratkovich | Property Manager: | The Ratkovich Company | ||||||
| Mortgage Rate: | 4.2200% | (borrower-related) | ||||||
| Note Date: | 5/1/2019 | |||||||
| First Payment Date: | 6/11/2019 | |||||||
| Maturity Date: | 5/11/2029 | |||||||
| Original Term to Maturity: | 120 months | |||||||
| Original Amortization Term: | 0 months | |||||||
| IO Period: | 120 months | |||||||
| Seasoning: | 0 months | Underwriting and Financial Information | ||||||
| Prepayment Provisions(2): | LO (24); DEF (92); O (4) | UW NOI(5): | $16,341,088 | |||||
| Lockbox/Cash Mgmt Status: | Hard/In Place | UW NOI Debt Yield(1): | 10.9% | |||||
| Additional Debt Type(1)(3): | Pari Passu | UW NOI Debt Yield at Maturity(1): | 10.9% | |||||
| Additional Debt Balance(1)(3): | $50,000,000 | UW NCF DSCR(1): | 2.36x | |||||
| Future Debt Permitted (Type)(4): | Yes (Mezzanine) | Most Recent NOI(5): | $13,720,618 (12/31/2018) | |||||
| Reserves | 2nd Most Recent NOI(5): | $9,652,918 (12/31/2017) | ||||||
| Type | Initial | Monthly | Cap | 3rd Most Recent NOI: | $8,483,379 (12/31/2016) | |||
| RE Tax: | $782,527 | $195,631 | N/A | Most Recent Occupancy: | 89.6% (4/23/2019) | |||
| Insurance: | $72,226 | $24,075 | N/A | 2nd Most Recent Occupancy: | 86.3% (12/31/2018) | |||
| Recurring Replacements: | $0 | $19,414 | $698,918 | 3rd Most Recent Occupancy: | 80.8% (12/31/2017) | |||
| TI/LC Reserve: | $0 | $77,658 | $4,000,000 | Appraised Value (as of): | $230,500,000 (2/6/2019) | |||
| Land Entitlement Contingency: | $6,000,000 | N/A | N/A | Appraised Value per SF: | $247 | |||
| Rent Concession Reserve: | $2,231,181 | N/A | N/A | Cut-off Date LTV Ratio(1): | 65.1% | |||
| Existing TI/LC Reserve: | $9,668,624 | N/A | N/A | Maturity Date LTV Ratio(1): | 65.1% | |||
| Sources and Uses | ||||||
| Sources | Proceeds | % of Total | Uses | Proceeds | % of Total | |
| Whole Loan Amount: | $150,000,000 | 100.0% | Loan Payoff: | $106,528,637 | 71.0% | |
| Return of Equity: | $23,207,192 | 15.5% | ||||
| Reserves: | $18,754,558 | 12.5% | ||||
| Closing Costs: | $1,509,614 | 1.0% | ||||
| Total Sources: | $150,000,000 | 100.0% | Total Uses: | $150,000,000 | 100.0% | |
| (1) | The Cut-off Date Balance per SF, Maturity Date Balance per SF, UW NOI Debt Yield, UW NOI Debt Yield at Maturity, UW NCF DSCR, Cut-off Date LTV Ratio and Maturity Date LTV Ratio numbers presented above are based on The Alhambra Whole Loan (as defined below). |
| (2) | Defeasance of The Alhambra Whole Loan is permitted at any time after the earlier to occur of (a) the end of the two-year period commencing on the closing date of the securitization of the last promissory note representing a portion of The Alhambra Whole Loan to be securitized and (b) May 1, 2022. The assumed defeasance lockout period of 24 payments is based on the closing date of this transaction in May 2019. |
| (3) | See “The Mortgage Loan” and “Additional Secured Indebtedness (not including trade debts)” below for further discussion of additional debt. |
| (4) | See “Mezzanine Loan and Preferred Equity” below for further discussion of future debt permitted. |
| (5) | See “Operating History and Underwritten Net Cash Flow” below for a further discussion of the increases in NOI. |
This is not a research report and was not prepared by any Underwriter’s research department. Please see additional important information and qualifications at the end of this Term Sheet.
T-39
| Office – Suburban | Loan #2 | Cut-off Date Balance: | $100,000,000 | |
| 1000 South Fremont Avenue; | The Alhambra | Cut-off Date LTV: | 65.1% | |
| 1127-1131 South Fremont Avenue | U/W NCF DSCR: | 2.36x | ||
| Alhambra, CA 91803 | U/W NOI Debt Yield: | 10.9% |
The Mortgage Loan. The second largest mortgage loan (“The Alhambra Mortgage Loan”) is part of a whole loan (“The Alhambra Whole Loan”) in the original principal balance of $150,000,000. The Alhambra Whole Loan is secured by a first priority fee mortgage encumbering a 931,891 SF suburban office property located in Alhambra, California (“The Alhambra Property”). The Alhambra Whole Loan consists of threepari passu notes totaling $150,000,000. The Alhambra Whole Loan will be serviced pursuant to the pooling and servicing agreement for the BANK 2019-BNK18 securitization. The Alhambra Mortgage Loan represents the controlling Note A-1, which has an original principal balance of $100,000,000. The non-controllingpari passu notes A-2 and A-3 are referred to herein as “The AlhambraPari Passu Companion Loans”. See “Description of the Mortgage Pool—The Whole Loans—The Serviced Pari Passu Whole Loans” and “Pooling and Servicing Agreement” in the Preliminary Prospectus.
| The Alhambra Whole Loan Summary | ||||
| Note | Original Balance | Cut-off Date Balance | Note Holder | Lead Servicing Interest |
| A-1 | $100,000,000 | $100,000,000 | BANK 2019-BNK18 | Yes |
| A-2 | $30,000,000 | $30,000,000 | Wells Fargo Bank, N.A. | No |
| A-3 | $20,000,000 | $20,000,000 | Wells Fargo Bank, N.A. | No |
| Total | $150,000,000 | $150,000,000 | ||
The Borrower and the Borrower Sponsors. The borrower is ELITE-TRC Alhambra Community LLC, a Delaware limited liability company structured to be bankruptcy-remote with at least two independent directors (“The Alhambra Borrower”). Legal counsel to The Alhambra Borrower delivered a non-consolidation opinion in connection with the origination of The Alhambra Whole Loan. The borrower sponsors and non-recourse carveout guarantors are Wayne Ratkovich; Future Land International LLC, a Delaware limited liability company; and RM Properties, LLC, a California limited liability company.
Wayne Ratkovich is the President and CEO of The Ratkovich Company (“TRC”), a real estate development company based in Los Angeles, California that Mr. Ratkovich founded in 1977. Specializing in urban infill and rehabilitation projects, TRC’s accomplishments range from large-scale entitlement endeavors to retail, office, entertainment and mixed-use projects. TRC engages in both new development and the imaginative re-use of existing buildings, including nearly 20 properties of historic landmark status. Since inception, TRC has developed more than 18.0 million SF of real estate valued at more than $2.7 billion. RM Properties, LLC is the entity that holds the current operating partner interests of TRC. The current holdings of RM Properties, LLC include San Pedro Public Market, The Alhambra, The Hercules Campus, and 5900 Wilshire.
Future Land International LLC (“Future Land”) is 95.0% indirectly owned by Future Land Development Holdings Co., Ltd., a Shanghai-based, publicly traded company that engages in the development and investment of properties and holds all of Future Land’s U.S. investments. The Alhambra Property is Future Land’s largest investment in the U.S.
While not a borrower sponsor or guarantor, Elite International Investment Fund (“EIIF”) holds an approximately 45.0% equity interest in The Alhambra Borrower. Founded in 2013, EIIF is sponsored by the Chinese investment fund National Federation of Real Estate Chamber of Commerce, which focuses on overseas real estate investment opportunities.
The Property. The Alhambra Property is a 931,891 SF suburban office property located in Alhambra, California. Situated on two non-contiguous sites totaling 27.7 acres, The Alhambra Property comprises 16 office buildings ranging from one to seven stories totaling 863,470 SF, a free-standing LA Fitness facility comprising 50,558 SF, and three retail buildings totaling 17,863 SF (the “Retail Center”), which are connected to the office component via a pedestrian bridge. The office component of The Alhambra Property was constructed in phases between 1927 and 1981, with the Retail Center built in 2004 and the LA Fitness building constructed in 2009. The Alhambra Property is LEED Gold Certified, has an Energy Star Rating of 91 and contains five Bloom Energy Boxes (fuel cells) that are natural gas fueled and produce approximately 25% of the total energy output, per the appraisal. The Alhambra Property has a campus-like setting with amenities including a walking path, car wash, “giant games”, putting green and a large outdoor common area with complimentary wireless internet. As of April 23, 2019 The Alhambra Property was 89.6% occupied by 40 office tenants and 10 retail tenants. Investment grade tenants account for approximately 65.7% of the NRA and 67.7% of underwritten base rent at The Alhambra Property.
The collateral of The Alhambra Property contains two parking garages and one surface parking lot (known as the “South Parking Area”). The Alhambra Property also has the right to access and use surface parking areas along the north and east of the property (known as the “North Parking Area” and the “Southeast Parcel”; not part of the collateral) pursuant to an easement. In total, the office component of The Alhambra Property currently has access to 3,254 parking spaces, resulting in a parking ratio of 3.5 spaces per 1,000 SF of NRA (there are an additional 135 surface parking spaces for the Retail Center). The borrower sponsors have submitted an application to pursue the entitlement of the North Parking Area and the Southeast Parcel in order to construct a mixed-use development consisting of for-sale residential townhomes, for-rent apartments, and ground floor retail space. Per the appraisal, the application was submitted in May 2017 and has not yet received entitlements. The construction of this development would result in the loss of approximately 986 parking spaces; however, part of the entitlement entails the borrower sponsor developing a replacement 5-story parking structure, containing 490 parking spaces (the “Date Avenue Parking Structure”), resulting in an estimated total of approximately 2,268 parking spaces, equating to a parking ratio of 2.4 spaces per 1,000 SF of NRA. The Alhambra Borrower also has the right to release the South Parking Area from the collateral of The Alhambra Whole Loan, which would result in the loss of 503 parking spaces; however, such release requires the completion of and commencement of operations at the Date Avenue Parking Structure as well as evidence that The Alhambra Property complies with all applicable zoning laws and major leases, among other requirements (see“Release of Property” section below). Assuming the loss of parking from the North Parking Area, Southeast Parcel and South Parking Area as well as the completion of the Date Avenue Parking Structure, The Alhambra Property would have access to 2,268 parking spaces, which equates to 2.4 spaces per 1,000 SF of rentable area.
This is not a research report and was not prepared by any Underwriter’s research department. Please see additional important information and qualifications at the end of this Term Sheet.
T-40
| Office – Suburban | Loan #2 | Cut-off Date Balance: | $100,000,000 | |
| 1000 South Fremont Avenue; | The Alhambra | Cut-off Date LTV: | 65.1% | |
| 1127-1131 South Fremont Avenue | U/W NCF DSCR: | 2.36x | ||
| Alhambra, CA 91803 | U/W NOI Debt Yield: | 10.9% |
Major Tenants.
USC (NR/Aa1/AA by Fitch/Moody’s/S&P, 137,334 SF, 14.7% of NRA; 16.6% of underwritten base rent, various lease expiration dates). The University of Southern California (“USC”) is a private university located in Los Angeles and is the largest private employer in the County of Los Angeles. Home to the College of Letters, Arts and Sciences, as well as 21 other academic schools and units, USC had a total enrollment of approximately 47,500 for the 2018-2019 academic year. USC’s Keck School of Medicine, which has its campus approximately 3.1 miles southwest of The Alhambra Property, has been a tenant since October 2000. USC recently expanded its space by 41,182 SF, executing new leases in May 2018 for 34,711 and January 2019 for 6,471 SF. USC has one, three-year renewal option at 95.0% of the fair market rental rate following its respective lease expirations in 2020 and 2024.
ELARC (AA-/Aa3/AA- by Fitch/Moody’s/S&P, 114,448 SF, 12.3% of NRA; 12.9% of underwritten base rent, various lease expiration dates). The Eastern Los Angeles Regional Center (“ELARC”) is one of 21 regional centers in the state of California and is a private, nonprofit organization that works closely with and is funded by the California Department of Developmental Services. ELARC is responsible for coordinating and providing community-based services to individuals with developmental disabilities, and provides volunteer and career opportunities to community members. ELARC has been a tenant at The Alhambra Property since August 2002. ELARC has one, five-year renewal option at the fair market rental rate following its respective lease expirations in 2025 and 2026.
CLA – Public Health (AA-/Aa3/AA- by Fitch/Moody’s/S&P, 109,882 SF, 11.8% of NRA; 12.8% of underwritten base rent, various lease expiration dates). The County of Los Angeles’ (“CLA”) Public Health department works to protect and improve health and well-being of residents in Los Angeles County. Los Angeles County is the largest county in the United States and is home to over 10 million residents and a travel destination for millions each year. CLA – Public Health focuses on reducing health disparities through collaborations with a wide-range of partners. CLA – Public Health has been a tenant at The Alhambra Property since August 2000. CLA – Public Health has the right to terminate its lease with respect to its 50,525 SF space effective January 1, 2025 with 12 months’ prior notice, subject to a termination fee in an amount equal to unamortized tenant improvement allowance. In addition, a different division of CLA, CLA – Health Finance, leases 68,148 SF at The Alhambra Property and accounts for 7.3% of the NRA and 10.0% of underwritten base rent. Another division of CLA, CLA – Public Works, leases 42,807 SF at The Alhambra Property and accounts for 4.6% of the NRA and 4.7% of underwritten base rent. The headquarters of CLA – Public Works is located adjacent to The Alhambra Property.
The following table presents certain information relating to the tenants at The Alhambra Property:
| Tenant Summary | ||||||||
| Tenant Name | Credit Rating (Fitch/Moody’s/S&P)(1) | Tenant SF | Approx. % of Total SF | Annual UW Rent(2) | % of Total Annual UW Rent | Annual UW Rent PSF(2) | Lease Expiration | Termination Option (Y/N) |
| USC | NR/Aa1/AA | 137,334 | 14.7% | $4,169,714 | 16.6% | $30.36 | Various(3)(4) | N |
| ELARC | AA-/Aa3/AA- | 114,448 | 12.3% | $3,240,930 | 12.9% | $28.32 | Various(5)(6) | N |
| CLA – Public Health | AA-/Aa3/AA- | 109,882 | 11.8% | $3,213,770 | 12.8% | $29.25 | Various(7)(8) | Y(9) |
| CLA – Health Finance | AA-/Aa3/AA- | 68,148 | 7.3% | $2,509,496 | 10.0% | $36.82 | 11/30/2026 | N |
| LA Fitness | NR/NR/NR | 50,558 | 5.4% | $1,706,333 | 6.8% | $33.75 | 8/25/2028(10) | N |
| Subtotal/Wtd. Avg. | 480,370 | 51.5% | $14,840,243 | 59.0% | $30.89 | |||
| Other Tenants | 354,767 | 38.1% | $10,293,662 | 41.0% | $29.02 | |||
| Vacant Space | 96,754 | 10.4% | $0 | 0.0% | $0.0 | |||
| Total/Wtd. Avg. | 931,891 | 100.0% | $25,133,905 | 100.0% | $30.10 | |||
Information is based on the underwritten rent roll.
| (1) | Certain ratings are those of the parent company whether or not the parent guarantees the lease. |
| (2) | Annual UW Rent and Annual UW Rent PSF include contractual rent steps through May 2020, totaling $658,231. The lender’s underwriting applied separate straight line averaging credit through the lesser of the loan term or remaining lease term for investment grade tenants (USC, ELARC, County of Los Angeles tenants, and Allstate; See“Operating History and Underwritten Net Cash Flow” section below). |
| (3) | USC leases a total of 137,334 SF with 73,677 SF expiring on 8/31/2020, 34,711 SF expiring on 2/16/2024, 22,475 SF expiring on 3/1/2024, and 6,471 SF expiring on 9/1/2024. |
| (4) | USC has one, 3-year renewal option with 6 months’ notice at 95.0% of the then prevailing fair market rental rate. |
| (5) | ELARC leases a total of 114,448 SF with 7,771 SF expiring on 1/31/2025 and 106,677 SF expiring on 7/31/2026. |
| (6) | ELARC has one, 5-year renewal option with 12 months’ notice at the then prevailing fair market rental rate. |
| (7) | CLA – Public Health leases a total of 109,882 SF with 42,250 SF expiring on 11/30/2020, 17,107 SF expiring on 3/31/2022, and 50,525 SF expiring on 12/11/2025. |
| (8) | CLA – Public Health has one, 5-year renewal option on its 42,250 SF of space, and two, 5-year renewal options on its 50,525 SF of space. All of CLA – Public Health’s renewal options require 12 months’ notice and will be at 95.0% of the then prevailing fair market rental rate. |
| (9) | CLA – Public Health may terminate its lease with respect to its 50,525 SF of space effective January 1, 2025 with 12 months’ prior notice, subject to a termination fee in an amount equal to the unamortized tenant improvement allowance. |
| (10) | LA Fitness has two, 5-year renewal option with 24 months’ notice at 95.0% of the then prevailing fair market rental rate. |
This is not a research report and was not prepared by any Underwriter’s research department. Please see additional important information and qualifications at the end of this Term Sheet.
T-41
| Office – Suburban | Loan #2 | Cut-off Date Balance: | $100,000,000 | |
| 1000 South Fremont Avenue; | The Alhambra | Cut-off Date LTV: | 65.1% | |
| 1127-1131 South Fremont Avenue | U/W NCF DSCR: | 2.36x | ||
| Alhambra, CA 91803 | U/W NOI Debt Yield: | 10.9% |
The following table presents certain information relating to the lease rollover schedule at The Alhambra Property:
| Lease Rollover Schedule(1)(2) | ||||||||
| Year | # of Leases Rolling | SF Rolling | UW Rent PSF Rolling | Approx. % of Total SF Rolling | Approx. Cumulative % of SF Rolling | Total UW Rent Rolling | Approx. % of Total Rent Rolling | Approx. Cumulative % of Total Rent Rolling |
| 2019 | 13 | 8,497 | $43.01 | 0.9% | 0.9% | $365,493 | 1.5% | 1.5% |
| 2020 | 28 | 243,427 | $29.89 | 26.1% | 27.0% | $7,276,118 | 28.9% | 30.4% |
| 2021 | 18 | 49,139 | $29.32 | 5.3% | 32.3% | $1,440,943 | 5.7% | 36.1% |
| 2022 | 5 | 21,390 | $31.49 | 2.3% | 34.6% | $673,628 | 2.7% | 38.8% |
| 2023 | 2 | 3,775 | $31.15 | 0.4% | 35.0% | $117,579 | 0.5% | 39.3% |
| 2024 | 9 | 69,189 | $28.34 | 7.4% | 42.4% | $1,960,969 | 7.8% | 47.1% |
| 2025 | 13 | 143,092 | $30.76 | 15.4% | 57.8% | $4,401,854 | 17.5% | 64.6% |
| 2026 | 10 | 174,825 | $31.53 | 18.8% | 76.5% | $5,512,634 | 21.9% | 86.5% |
| 2027 | 0 | 0 | $0.00 | 0.0% | 76.5% | $0 | 0.0% | 86.5% |
| 2028 | 6 | 90,481 | $32.97 | 9.7% | 86.3% | $2,983,374 | 11.9% | 98.4% |
| 2029 | 2 | 13,651 | $29.40 | 1.5% | 87.7% | $401,315 | 1.6% | 100.0% |
| 2030 & Beyond(3) | 14 | 17,671 | $0.00 | 1.9% | 89.6% | $0 | 0.0% | 100.0% |
| Vacant | 0 | 96,754 | $0.00 | 10.4% | 100.0% | $0 | 0.0% | 100.0% |
| Total/Wtd. Avg.(4) | 120 | 931,891 | $30.10 | 100.0% | $25,133,905 | 100.0% | ||
| (1) | Information is based on the underwritten rent roll. |
| (2) | Certain tenants may have lease termination options that are exercisable prior to the stated expiration date of the subject lease or leases which are not considered in the lease rollover schedule. |
| (3) | 2030 & Beyond includes non-revenue generating space totaling 17,671 SF for the café, auditorium, conference rooms, engineering shop, storage, mail room, and other various spaces. |
| (4) | Wtd. Avg. UW Rent PSF Rolling excludes vacant space. |
The Market. The Alhambra Property is located in Alhambra, Los Angeles County, California, approximately 1.3 miles northwest of Interstate 10 (which provides access westbound to Los Angeles), 2.3 miles northeast of the on/off ramps for Interstate 710 (which provides access southbound to East Los Angeles and Long Beach, California), 6.5 miles northeast of the Los Angeles central business district and 24.5 miles northeast of Los Angeles International Airport. The Alhambra Property is situated approximately 0.1 miles north of the intersection of South Fremont Avenue and Concord Avenue, which, according to a third party market research provider, had a daily traffic count of approximately 44,000 vehicles as of 2017. Approximately 1.9 miles northeast of The Alhambra Property is Renaissance Plaza, a shopping center featuring a Sprouts Farmers Market, Burlington Coat Factory, Ross Dress for Less, Bank of America, Rite Aid, various restaurants and fast casual dining options and a 14-screen Edwards IMAX theater. The Alhambra Property is situated approximately 11.0 miles northeast of the main campus of the University of Southern California, which had a 2018-2019 total enrollment of approximately 47,500 students.
According to a third party market research provider, the estimated 2019 population within a three- and five-mile radius of The Alhambra Property was approximately 270,137 and 775,365, respectively; and the estimated 2019 average household income within the same radii was approximately $83,846 and $80,896, respectively.
According to a third-party market research report, The Alhambra Property is situated within the Western San Gabriel Valley Office submarket of the Los Angeles Office Market. As of May 1, 2019, the Western San Gabriel Valley Office submarket reported a total inventory of approximately 12.1 million SF with a 5.0% vacancy rate and average asking rent of $28.40 per SF, full service gross. The submarket vacancy rate has decreased from 7.9% in 2015 and has averaged 6.7% from 2012 through 2018.
The appraiser identified seven directly competitive office properties totaling approximately 1.3 million SF, with an average occupancy rate of 87.4% and rents ranging from $26.52 to $38.40 per SF, full-service gross (“FSG”) (with one property reporting three comparable leases at rental rates of $25.68 to $31.20 per SF, modified gross).
The following table presents certain information relating to the appraisal’s market rent conclusion for the office campus space at The Alhambra Property:
| Market Rent Summary – Office Campus | |||||||
| Lower Levels | Upper Levels | A9 Upper Levels | A9 Lower Levels | LA Fitness | CLA Renewal | USC Renewal | |
| Market Rent (PSF) | $24.00 to $26.40 | $27.60 to $30.00 | $28.20 to $31.20 | $26.40 to $27.60 | $27.00 to $33.60 | $27.00 to $28.20 | $28.80 to $30.00 |
| Lease Term (Years) | 5 | 5 | 5 | 5 | 10 | 10 | 10 |
| Lease Type (Reimbursements) | FSG | FSG | FSG | FSG | NN (Double Net) | FSG | FSG |
| Rent Increase Projection | 3.0%per annum | 3.0%per annum | 3.0%per annum | 3.0%per annum | 3.0%per annum | 3.0%per annum | 3.0%per annum |
This is not a research report and was not prepared by any Underwriter’s research department. Please see additional important information and qualifications at the end of this Term Sheet.
T-42
| Office – Suburban | Loan #2 | Cut-off Date Balance: | $100,000,000 | |
| 1000 South Fremont Avenue; | The Alhambra | Cut-off Date LTV: | 65.1% | |
| 1127-1131 South Fremont Avenue | U/W NCF DSCR: | 2.36x | ||
| Alhambra, CA 91803 | U/W NOI Debt Yield: | 10.9% |
The following table presents certain information relating to the appraisal’s market rent conclusion for the retail center space at The Alhambra Property:
| Market Rent Summary – Retail Center | |||
| Corner Endcap | Middle Inline | Back Inline | |
| Market Rent (PSF) | $48 to $54 | $39 to $42 | $24 to $36 |
| Lease Term (Years) | 5 | 5 | 5 |
| Lease Type (Reimbursements) | NNN | NNN | NNN |
| Rent Increase Projection | 3.0%per annum | 3.0%per annum | 3.0%per annum |
The following table presents information relating to comparable office property sales for The Alhambra Property:
| Comparable Property Sale Summary | ||||||||
| Property Name/Location | Sale Date | Year Built/ Renovated | Total NRA (SF) | Occupancy | Sale Price | Adjusted Sale Price(1) | Sale Price PSF | Appraiser’s Adjusted Sale Price PSF(1) |
The Alhambra (subject) Alhambra, CA | N/A | 1927/2015 | 931,891 | 89.6% | ||||
AXIS Anaheim Anaheim, CA | Dec. 2018 | 1982/2015 | 292,311 | 77.0% | $83,100,000 | $91,900,000 | $284.29 | $314.39 |
The Airflyte El Segundo, CA | May 2018 | 1976/N/A | 549,222 | 100.0% | $167,500,000 | $167,500,000 | $304.98 | $304.98 |
Centerpointe La Palma La Palma, CA | Sept. 2017 | 1988/N/A | 525,560 | 90.0% | $106,100,000 | $106,100,000 | $201.88 | $201.88 |
Los Angeles Corporate Center Monterey Park, CA | April 2017 | 1985/N/A | 394,544 | 95.0% | $81,000,000 | $81,000,000 | $205.30 | $205.30 |
Woodland Hills Corporate Center Woodland Hills, CA | Mar. 2017 | 1973/1995 | 230,833 | 88.0% | $51,125,000 | $51,125,000 | $221.48 | $221.48 |
Empire Towers I-IV Ontario, CA | Feb. 2017 | 2004/N/A | 400,976 | 91.0% | $78,500,000 | $78,500,000 | $195.77 | $195.77 |
Towne Centre Plaza Foothill Ranch, CA | Jan. 2017 | 1999/N/A | 203,749 | 100.0% | $40,000,000 | $40,000,000 | $196.32 | $196.32 |
The Garland Center Los Angeles, CA | Jun. 2016 | 1983/N/A | 733,000 | 85.0% | $204,000,000 | $204,000,000 | $278.31 | $278.31 |
Source:Appraisal.
| (1) | Adjusted sale price for all cash equivalency, lease-up and/or deferred maintenance (as applicable). |
This is not a research report and was not prepared by any Underwriter’s research department. Please see additional important information and qualifications at the end of this Term Sheet.
T-43
| Office – Suburban | Loan #2 | Cut-off Date Balance: | $100,000,000 | |
| 1000 South Fremont Avenue; | The Alhambra | Cut-off Date LTV: | 65.1% | |
| 1127-1131 South Fremont Avenue | U/W NCF DSCR: | 2.36x | ||
| Alhambra, CA 91803 | U/W NOI Debt Yield: | 10.9% |
The following table presents certain information relating to comparable office leases for The Alhambra Property:
| Comparable Leases Summary | |||||||||
| Property Name/Location | Year Built/ Renovated | Total GLA (SF) | Occupancy | Distance from Subject | Tenant Name | Lease Date/Term | Lease Area (SF) | Annual Base Rent PSF | Lease Type |
The Alhambra 1000 South Fremont Avenue; 1127-1131 South Fremont Avenue Alhambra, CA | 1927/2015 | 931,891 | 89.6% | - | |||||
The Lakes 1000-1050 Lakes Drive, West Covina, CA | 1990/N/A | 187,195 | 91.0% | 14.6 Miles | Various | May – Dec. 2017 / 3.3 – 7.8 Yrs | 1,789 – 5,714 | $28.20 – $31.80 | Full Service |
Six25 625 Fair Oaks Avenue South Pasadena, CA | 1987/2016 | 92,548 | 74.0% | 2.5 Miles | Various | Jan. 2017 – Jan. 2018 / 3.2 - 8.0 Yrs | 754 – 10,794 | $33.60 – $38.40 | Full Service |
Los Angeles Corporate Center 900, 1000, 1200 & 1255 Corporate Center Drive Monterey Park, CA | 1985/N/A | 396,239 | 83.0% | 3.2 Miles | Various | Mar. – Jun. 2017 / 6.0 – 7.6 Yrs | 1,656 – 83,021 | $26.52 – $32.04 | Full Service |
Pasadena Tech Center 465 North Halstead Street Pasadena, CA | 1958/2015 | 238,205 | 93.0% | 7.9 Miles | Various | Nov. 2015 – May 2019 / 2.0 – 7.6 Yrs | 413 – 47,051 | $25.68 – $33.00 | Full Service - Modified Gross |
199 South Los Robles 199 S. Los Robles Avenue Pasadena, CA | 1983/N/A | 163,234 | 80.0% | 4.7 Miles | Kaiser Permanente | May 2019 / 10.8 Yrs | 20,663 | $35.40 | Full Service |
200 South Los Robles 200 S. Los Robles Avenue Pasadena, CA | 1988/N/A | 130,818 | 92.0% | 4.7 Miles | Various | Oct. 2017 – Jan. 2019 / 3.1 – 5.4 Yrs | 2,636 – 3,412 | $34.40 – $36.60 | Full Service |
Pasadena Office Tower 150 South Los Robles Avenue Pasadena, CA | 1971/N/A | 138,790 | 99.0% | 4.8 Miles | LaMontagne & Amador LLP | Jan. 2018 / 3.2 Yrs | 1,636 | $34.20 | Full Service |
Source:Appraisal.
��
This is not a research report and was not prepared by any Underwriter’s research department. Please see additional important information and qualifications at the end of this Term Sheet.
T-44
| Office – Suburban | Loan #2 | Cut-off Date Balance: | $100,000,000 | |
| 1000 South Fremont Avenue; | The Alhambra | Cut-off Date LTV: | 65.1% | |
| 1127-1131 South Fremont Avenue | U/W NCF DSCR: | 2.36x | ||
| Alhambra, CA 91803 | U/W NOI Debt Yield: | 10.9% |
Operating History and Underwritten Net Cash Flow.The following table presents certain information relating to the historical operating performance and Underwritten Net Cash Flow at The Alhambra Property:
| Cash Flow Analysis | ||||||
| 2015 | 2016 | 2017(1) | 2018(1) | UW(1) | UW PSF | |
| Gross Potential Rent | $16,895,395 | $15,827,397 | $17,628,901 | $21,286,927 | $27,915,583 | $29.96 |
| Vacancy and Concessions | $0 | $0 | $0 | $0 | ($2,781,678) | ($2.98) |
| Credit Tenant Rent Average | $0 | $0 | $0 | $0 | $537,896(2) | $0.58 |
| Net Rental Income | $16,895,395 | $15,827,397 | $17,628,901 | $21,286,927 | $25,671,801 | $27.55 |
| Reimbursements | $1,695,071 | $1,707,776 | $1,701,276 | $1,098,513 | $1,260,623 | $1.35 |
| Other Income(3) | $1,562,142 | $1,596,628 | $1,701,725 | $2,023,862 | $1,384,401 | $1.49 |
| Effective Gross Income | $20,152,608 | $19,131,802 | $21,031,902 | $24,409,301 | $28,316,825 | $30.39 |
| Taxes | $2,239,885 | $2,453,447 | $2,658,444 | $2,756,010 | $2,347,575 | $2.52 |
| Insurance | $267,038 | $269,338 | $278,988 | $310,579 | $275,144 | $0.30 |
| Other Operating Expenses | $8,058,548 | $7,925,638 | $8,441,552 | $7,622,095 | $9,353,018 | $10.04 |
| Total Operating Expenses | $10,565,471 | $10,648,423 | $11,378,985 | $10,688,684 | $11,975,737 | $12.85 |
| Net Operating Income | $9,587,137 | $8,483,379 | $9,652,918 | $13,720,618 | $16,341,088 | $17.54 |
| TI/LC | $0 | $0 | $0 | $0 | $931,891 | $1.00 |
| Capital Expenditures | $0 | $0 | $0 | $0 | $232,973 | $0.25 |
| Net Cash Flow | $9,587,137 | $8,483,379 | $9,652,918 | $13,720,618 | $15,176,225 | $16.29 |
| NOI DSCR(4) | 1.49x | 1.32x | 1.50x | 2.14x | 2.55x | |
| NCF DSCR(4) | 1.49x | 1.32x | 1.50x | 2.14x | 2.36x | |
| NOI Debt Yield(4) | 6.4% | 5.7% | 6.4% | 9.1% | 10.9% | |
| NCF Debt Yield(4) | 6.4% | 5.7% | 6.4% | 9.1% | 10.1% | |
| (1) | The increases in Gross Potential Rent and Net Operating Income from 2017 to UW were primarily driven by new leases totaling 262,278 SF and $8,548,258 of new rental revenue, renewal leases for 54,074 SF totaling an increase of $61,407 in rental revenue, and re-tenanted spaces totaling 38,598 SF and an increase of $158,173 in rental revenue. In addition, UW Net Rental Income includes contractual rent steps through May 2020 totaling $658,231 and credit tenant rent averaging totaling $537,896. |
| (2) | Underwritten Credit Tenant Rent Average includes straight line rent credit through the lesser of the lease term or loan term for USC, ELARC, County of Los Angeles tenants, and Allstate. |
| (3) | Other Income includes parking income, conference room rental income, vending machine income, rooftop/antenna income, and other miscellaneous income. |
| (4) | The debt service coverage ratios and debt yields shown are based on The Alhambra Whole Loan. |
Escrows and Reserves.
Real Estate Taxes- The Alhambra Borrower is required to deposit an upfront real estate tax reserve of $782,527 and ongoing monthly escrows in an amount equal to one-twelfth of the real estate taxes that the lender estimates will be payable during the next 12 months (initially $195,631).
Insurance – The Alhambra Whole Loan documents require an upfront insurance reserve of $72,226 and ongoing monthly escrows in an amount equal to one-twelfth of the insurance premiums that the lender estimates will be payable during the next 12 months (initially $24,075).
Replacement Reserve – The Alhambra Borrower is required to deposit ongoing monthly replacement reserves of $19,414, subject to a cap of $698,918.
Rollover Reserve – The Alhambra Borrower is required to deposit ongoing monthly rollover reserves of $77,658, subject to a cap of $4,000,000 (excluding any deposits of lease termination fees).
Land Entitlement Contingency Reserve– The Alhambra Borrower is required to deposit an upfront deposit of $6,000,000, which represents the maximum amount of The Alhambra Borrower’s contingent obligations to the seller relating to obtaining the residential construction entitlements at The Alhambra Property.
Rent Concession Reserve - The Alhambra Borrower is required to deposit an upfront reserve of $2,231,181 for future rent credits or abatements under existing leases.
Existing TI/LC Obligations Reserve – The Alhambra Borrower is required to deposit an upfront reserve of $9,668,624 for tenant improvements, tenant allowances and leasing commissions related to County of Los Angeles ($7,350,886), ELARC ($1,329,185), CSULA ($556,242) and other tenants ($432,311).
This is not a research report and was not prepared by any Underwriter’s research department. Please see additional important information and qualifications at the end of this Term Sheet.
T-45
| Office – Suburban | Loan #2 | Cut-off Date Balance: | $100,000,000 | |
| 1000 South Fremont Avenue; | The Alhambra | Cut-off Date LTV: | 65.1% | |
| 1127-1131 South Fremont Avenue | U/W NCF DSCR: | 2.36x | ||
| Alhambra, CA 91803 | U/W NOI Debt Yield: | 10.9% |
Lockbox and Cash Management. The Alhambra Whole Loan documents require a lender-controlled lockbox with in-place cash management, and that The Alhambra Borrower directs the tenants to pay rent directly into such lockbox account. The loan documents also require that all rents received by The Alhambra Borrower or the property manager be deposited into the cash management account within two business days of receipt. All funds in the lockbox account are required to be swept each business day into the cash management account controlled by the lender and, on each payment date, all funds in the cash management account are required to be applied in accordance with The Alhambra Whole Loan documents. Prior to the occurrence of a Cash Trap Event Period (as defined below), any excess funds will be disbursed to The Alhambra Borrower. During a Cash Trap Event Period, any excess funds remaining after satisfaction of the waterfall items are required to be swept to an excess cash flow subaccount to be held by the lender as additional security for The Alhambra Whole Loan.
A “Cash Trap Event Period” will commence upon the earlier of the following:
| (i) | the occurrence and continuance of an event of default; |
| (ii) | the net cash flow debt yield (“NCF DY”) of The Alhambra Whole Loan falling below 8.0%; or |
| (iii) | the occurrence of a USC Trigger Event (as defined below). |
A Cash Trap Event Period will end upon the occurrence of the following:
| ● | with regard to clause (i), the cure of such event of default; |
| ● | with regard to clause (ii), (x) upon the NCF DY of The Alhambra Whole Loan being equal to or greater than 8.25% for two consecutive calendar quarters or (y) The Alhambra Borrower providing a letter of credit in an amount such that, if the face amount were applied to the pay down the principal balance of The Alhambra Whole Loan, would result in condition (x) above being satisfied; or |
| ● | with regard to clause (iii), a USC Trigger Event Cure (as defined below). |
A “USC Trigger Event” will commence upon the earlier of the following:
| (i) | USC vacating more than 33% of its rentable SF at The Alhambra Property; |
| (ii) | USC ceasing to operate or “going dark” with respect to at least 68,667 SF at The Alhambra Property; |
| (iii) | USC filing, as a debtor, a bankruptcy or similar insolvency proceeding, or otherwise becoming involved, as a debtor, in a bankruptcy or any similar insolvency proceeding; |
| (iv) | USC no longer being an investment grade rated entity by two or more of Moody’s, S&P and Fitch (an “Investment Grade Tenant”); |
| (v) | USC failing to renew or extend or enter into new lease with respect to at least 33% of its space on the earlier to occur of (x) six months prior to USC’s lease expiration date, or (y) USC’s lease renewal notice date, per the terms of its lease (current lease requires notice 6 months prior to lease expiration). |
A “USC Trigger Event Cure” will occur upon the earlier of the following:
| ● | with regard to clauses (i)-(v) above: |
| ○ | (a) the date on which there is at least 609,423 SF of space at The Alhambra Property leased to Investment Grade Tenants (excluding the space leased to USC) which are in occupancy and have commenced rent payment pursuant to their leases; |
| ○ | (b) The Alhambra Borrower delivering a letter of credit to the lender in a face amount of the USC Trigger Event Cap (as defined below) and otherwise in compliance with The Alhambra Whole Loan documents; or |
| ○ | (c) the aggregate amount on deposit in the excess cash flow subaccount is equal to at least the USC Trigger Event Cap. |
| ● | with regard to clause (i) or (v) only of the definition of USC Trigger Event, USC leasing 100% of its space that it vacated or failed to renew or extend pursuant to new leases acceptable to the lender; |
| ● | with regard to clause (ii) only of the definition of USC Trigger Event, USC having resumed operations of its business with respect to 100% of the space at The Alhambra Property where it had ceased to operate its business; |
| ● | with regard to clause (iii) only of the definition of USC Trigger Event, such bankruptcy or similar insolvency proceeding having been dismissed and USC’s lease having been accepted and reaffirmed by USC with no material modification and USC is in occupancy and paying full rent; or |
| ● | with regard to clause (iv) only of the definition of USC Trigger Event, USC becoming an Investment Grade Tenant; |
The “USC Trigger Event Cap” means the product of (i) $50.00 and (ii) the rentable SF of space which has been vacated to cause the USC Trigger Event.
Additional Secured Indebtedness (not including trade debts).The Alhambra Property also secures The AlhambraPari Passu Companion Loans, which have an aggregate Cut-off Date principal balance of $50,000,000. The AlhambraPari Passu Companion Loans accrue interest at the same rate as The Alhambra Mortgage Loan. The Alhambra Mortgage Loan is entitled to payments of principal and interest on apro rata andpari passu basis with The AlhambraPari Passu Companion Loans. The holders of The Alhambra Mortgage Loan and The AlhambraPari Passu Companion Loans have entered into a co-lender agreement, which sets forth the allocation of collections on The Alhambra Whole Loan. See “Description of the Mortgage Pool—The Whole Loans—The Serviced Pari Passu Whole Loans” in the Preliminary Prospectus.
Mezzanine Loan and Preferred Equity.Solely in connection with a bona fide sale of The Alhambra Property to an unaffiliated third-party person or entity, a permitted mezzanine borrower may incur indebtedness secured by the direct or indirect interests in the borrower in the form of a single mezzanine loan from a mezzanine lender which is acceptable to the lender in its sole discretion,provided that, among other things, and in accordance with The Alhambra Whole Loan Documents, (a) no event of default has occurred or is continuing, (b) the aggregate loan to value ratio is required to be less than or equal to 65.1%, (c) the aggregate net cash flow debt service coverage ratio (“NCF DSCR”) is not less than 2.20x, (d) the mezzanine lender is required to enter into an intercreditor agreement with the lender, (e) rating agency confirmation, (f) legal opinions, including a new non-consolidation opinion having been received, (g) if the permitted mezzanine loan is a floating rate loan, such loan will require the permitted mezzanine borrower to obtain and maintain an interest rate cap which will cause the aggregate NCF DSCR immediately following the closing of the permitted mezzanine loan to be no less than 2.20x, (h) the permitted mezzanine loan is required to be coterminus with The Alhambra Whole Loan and (i) in no event will payments be made on the permitted mezzanine loan during a Cash Trap Event Period.
This is not a research report and was not prepared by any Underwriter’s research department. Please see additional important information and qualifications at the end of this Term Sheet.
T-46
| Office – Suburban | Loan #2 | Cut-off Date Balance: | $100,000,000 | |
| 1000 South Fremont Avenue; | The Alhambra | Cut-off Date LTV: | 65.1% | |
| 1127-1131 South Fremont Avenue | U/W NCF DSCR: | 2.36x | ||
| Alhambra, CA 91803 | U/W NOI Debt Yield: | 10.9% |
Release of Property.
South Parking Area – Following the defeasance lockout date, The Alhambra Borrower may obtain the release of the South Parking Area,provided that, among other things, and in accordance with The Alhambra Whole Loan Documents,
| ● | no event of default has occurred and is continuing; |
| ● | The Alhambra Whole Loan is partially defeased in an amount such that, following such release, (1) the NCF DSCR is greater than 2.20x and (2) the loan-to-value ratio (“LTV”) is less than 65.1% (based on a then current appraisal); |
| ● | the lender has received reasonably satisfactory evidence that all construction has been completed and operations have commenced at the Date Avenue Parking Structure (as defined in“The Property” section above); |
| ● | the lender has received reasonably satisfactory evidence that, following the release of the South Parking Area, The Alhambra Property complies will all applicable zoning laws, major leases, and permitted encumbrances as defined in The Alhambra Whole Loan documents; |
| ● | prior to the transfer and release, (i) each applicable municipal authority exercising jurisdiction over The Alhambra Property has approved a lot-split ordinance or other applicable action under local law dividing the South Parking Area from the remainder of The Alhambra Property as evidenced by an updated title report and (ii) either (x) a separate tax identification number will have been issued for the South Parking Area parcel or (y) an application has been made under local law to the appropriate governmental authority for a separate tax identification number for the South Parking Area parcel and the transferee and transferor The Alhambra Borrower will have otherwise entered into a property tax allocation agreement which has substantially the same economic effect of a tax lot subdivision; |
| ● | a legal opinion covering compliance in all respects with all laws, rules and regulations governing REMICs has been delivered; and |
| ● | in connection with a partial defeasance, rating agency confirmation is received. |
Retail Center – Following the defeasance lockout date, The Alhambra Borrower may obtain the release of the Retail Center in connection with abona fide sale to an unaffiliated third-party,provided that, among other things, and in accordance with The Alhambra Whole Loan Documents,
| ● | no event of default has occurred and is continuing; |
| ● | The Alhambra Whole Loan is partially defeased in an amount equal to $8,590,022; |
| ● | following such release, (i) the NCF DSCR is equal to or greater than the greater of (x) 2.20x and (y) the NCF DSCR immediately prior to giving effect to the release, (ii) the LTV is equal to or less than the lesser or (a) 65.1% and (b) the LTV immediately prior to giving effect to the release and (iii) the NCF DY is equal to or greater than the greater of (1) 9.4% and (2) the NCF DY immediately prior to giving effect to the release; |
| ● | a legal opinion covering compliance in all respects with all laws, rules and regulations governing REMICs has been delivered; and |
| ● | in connection with a partial defeasance, rating agency confirmation is received. |
Ground Lease.None.
Right of First Refusal.The County of Los Angeles has a right of first refusal (“ROFR”) to purchase The Alhambra Property if The Alhambra Borrower markets The Alhambra Property for sale. The ROFR is not extinguished by foreclosure; however, the ROFR does not apply to foreclosure or deed-in-lieu thereof.
Letter of Credit.None.
Terrorism Insurance.The Alhambra Whole Loan documents require that the “all risk” insurance policy required to be maintained by The Alhambra Borrower provide coverage for terrorism in an amount equal to the full replacement cost of The Alhambra Property, as well as business interruption insurance covering no less than the 18-month period following the occurrence of a casualty event, together with a 6-month extended period of indemnity (provided that if TRIPRA or a similar statute is not in effect, The Alhambra Borrower will not be obligated to pay terrorism insurance premiums in excess of two times the premium for the casualty and business interruption coverage on a stand-alone basis).
This is not a research report and was not prepared by any Underwriter’s research department. Please see additional important information and qualifications at the end of this Term Sheet.
T-47
| Office - CBD | Loan #3 | Cut-off Date Balance: | $95,000,000 | |
| 777 South Santa Fe Avenue | Ford Factory | Cut-off Date LTV: | 57.0% | |
| Los Angeles, CA 90021 | U/W NCF DSCR: | 1.81x | ||
| U/W NOI Debt Yield: | 8.5% |
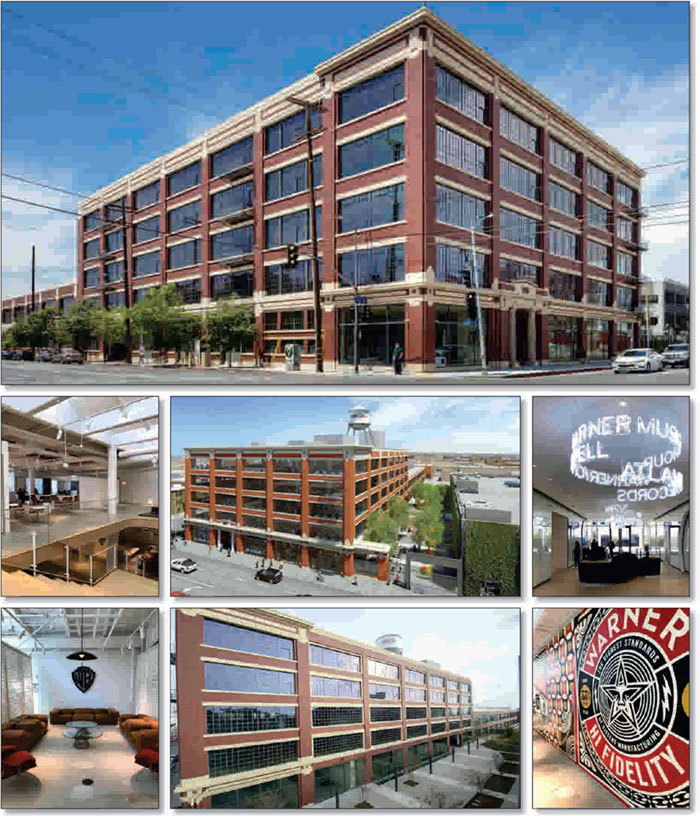
This is not a research report and was not prepared by any Underwriter’s research department. Please see additional important information and qualifications at the end of this Term Sheet.
T-48
| Office - CBD | Loan #3 | Cut-off Date Balance: | $95,000,000 | |
| 777 South Santa Fe Avenue | Ford Factory | Cut-off Date LTV: | 57.0% | |
| Los Angeles, CA 90021 | U/W NCF DSCR: | 1.81x | ||
| U/W NOI Debt Yield: | 8.5% |
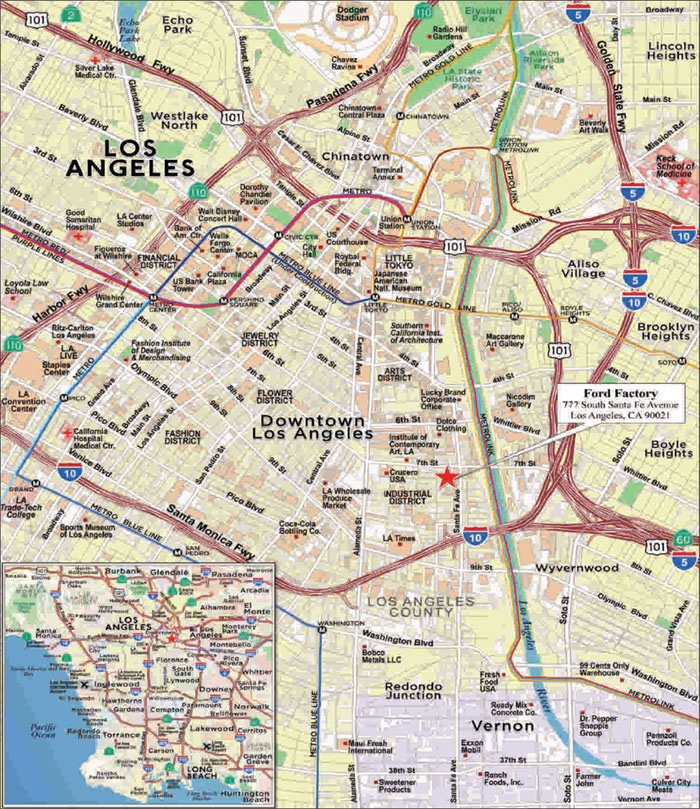
This is not a research report and was not prepared by any Underwriter’s research department. Please see additional important information and qualifications at the end of this Term Sheet.
T-49
| Office - CBD | Loan #3 | Cut-off Date Balance: | $95,000,000 | |
| 777 South Santa Fe Avenue | Ford Factory | Cut-off Date LTV: | 57.0% | |
| Los Angeles, CA 90021 | U/W NCF DSCR: | 1.81x | ||
| U/W NOI Debt Yield: | 8.5% |
| Mortgage Loan No. 3 – Ford Factory |
| Mortgage Loan Information | Property Information | ||||||
| Mortgage Loan Seller: | BANA | Single Asset/Portfolio: | Single Asset | ||||
| Credit Assessment (Fitch/KBRA/Moody’s): | NR/NR/NR | Location: | Los Angeles, CA 90021 | ||||
| Original Balance(1): | $95,000,000 | General Property Type: | Office | ||||
| Cut-off Date Balance(1): | $95,000,000 | Detailed Property Type: | CBD | ||||
| % of Initial Pool Balance: | 9.1% | Title Vesting: | Fee | ||||
| Loan Purpose: | Acquisition | Year Built/Renovated: | 1912/2019 | ||||
| Sponsor: | Access Industries | Size: | 257,028 SF | ||||
| Guarantor: | AIPH Holdings LLC | Cut-off Date Balance per SF(1): | $525 | ||||
| Mortgage Rate: | 4.5200% | Maturity Date Balance per SF(1): | $525 | ||||
| Note Date: | 3/29/2019 | Property Manager: | CBRE, Inc. | ||||
| First Payment Date: | 5/1/2019 | ||||||
| Maturity Date: | 4/1/2029 | ||||||
| Original Term to Maturity: | 120 months | Underwriting and Financial Information | |||||
| Original Amortization Term: | 0 months | UW NOI: | $11,507,454 | ||||
| IO Period: | 120 months | UW NOI Debt Yield(1): | 8.5% | ||||
| Seasoning: | 1 month | UW NOI Debt Yield at Maturity(1): | 8.5% | ||||
| Prepayment Provisions(2): | LO (25); DEF (88); O (7) | UW NCF DSCR(1): | 1.81x | ||||
| Lockbox/Cash Mgmt Status: | Hard/Springing | Most Recent NOI(5): | N/A | ||||
| Additional Debt Type(1)(3): | Pari Passu | 2nd Most Recent NOI(5): | N/A | ||||
| Additional Debt Balance(1)(3): | $40,000,000 | 3rd Most Recent NOI(5): | N/A | ||||
| Future Debt Permitted (Type)(4): | Mezzanine | Most Recent Occupancy: | 100.0% (5/1/2019) | ||||
| Reserves | 2nd Most Recent Occupancy(5): | N/A | |||||
| Type | Initial | Monthly | Cap | 3rd Most Recent Occupancy(5): | N/A | ||
| RE Tax: | $0 | Springing | N/A | Appraised Value (as of): | $237,000,000 (3/1/2019) | ||
| Insurance: | $0 | Springing | N/A | Appraised Value per SF: | $922 | ||
| Recurring Replacements: | $0 | Springing | N/A | Cut-off Date LTV Ratio(1): | 57.0% | ||
| TI/LC: | $6,565,530 | Springing | N/A | Maturity Date LTV Ratio(1): | 57.0% | ||
| Sources and Uses | ||||||
| Sources | Proceeds | % of Total | Uses | Proceeds | % of Total | |
| Whole Loan Amount(1): | $135,000,000 | 67.2% | Purchase Price(6): | $193,500,000 | 96.3% | |
| Borrower Equity(7): | $65,934,930 | 32.8% | Reserves(7): | $6,565,530 | 3.3% | |
| Closing Costs: | $869,400 | 0.4% | ||||
| Total Sources: | $200,934,930 | 100.0% | Total Uses: | $200,934,930 | 100.0% | |
| (1) | The Cut-off Date Balance per SF, Maturity Date Balance per SF, UW NOI Debt Yield, UW NOI Debt Yield at Maturity, UW NCF DSCR, Cut-off Date LTV Ratio and Maturity Date LTV Ratio numbers presented above are based on the Ford Factory Whole Loan (as defined below). |
| (2) | Defeasance of the Ford Factory Whole Loan is permitted at any time after the earlier to occur of (a) the end of the two-year period commencing on the closing date of the securitization of the last promissory note representing a portion of the Ford Factory Whole Loan to be securitized and (b) September 29, 2022. The assumed defeasance lockout period of 25 payments is based on the closing date of this transaction in May 2019. |
| (3) | See “The Mortgage Loan”and“Additional Secured Indebtedness (not including trade debts)” below for further discussion of additional debt. |
| (4) | See“Mezzanine Loan and Preferred Equity”below for further discussion of future debt permitted. |
| (5) | Historical financial statements and occupancy are not available because the Ford Factory Property (as defined below) was recently redeveloped into a single-tenant office building. |
| (6) | In October 2016, the borrower sponsor entered a contract to purchase the Ford Factory Property, contingent upon the seller completing $18.8 million of tenant improvement work. The $195,000,000 purchase price included an adjacent 0.36-acre parcel with an allocated purchase price of $1,500,000, which parcel is not collateral for the Ford Factory Whole Loan. |
| (7) | Borrower Equity includes a seller credit for the $6,565,530 of outstanding tenant improvements owed for completed work, which amount has been reserved by the lender. |
The Mortgage Loan. The third largest mortgage loan (the “Ford Factory Mortgage Loan”) is a part of a whole loan (the “Ford Factory Whole Loan”) in the aggregate original principal amount of $135,000,000. The Ford Factory Whole Loan is secured by a first priority fee mortgage on a 257,028 SF office property located in Los Angeles, California (the “Ford Factory Property”). The Ford Factory Whole Loan is comprised of twopari passu promissory notes: Promissory Note A-1 in the original principal amount of $95,000,000 and Promissory Note A-2 in the original principal amount of $40,000,000 (the “Ford FactoryPari Passu Companion Loan”). The controlling Promissory Note A-1 is being contributed to the BANK 2019-BNK18 securitization trust and the non-controlling Promissory Note A-2 is currently being held by Bank of America, N.A. and will be contributed to one or more future securitization trusts. The Ford Factory Whole Loan will be serviced pursuant to the pooling and servicing agreement for the BANK 2019-BNK18 securitization trust. See“Description of the Mortgage Pool—The Whole Loans—The Serviced Pari Passu Whole Loans” and “Pooling and Servicing Agreement” in the Preliminary Prospectus.
This is not a research report and was not prepared by any Underwriter’s research department. Please see additional important information and qualifications at the end of this Term Sheet.
T-50
| Office - CBD | Loan #3 | Cut-off Date Balance: | $95,000,000 | |
| 777 South Santa Fe Avenue | Ford Factory | Cut-off Date LTV: | 57.0% | |
| Los Angeles, CA 90021 | U/W NCF DSCR: | 1.81x | ||
| U/W NOI Debt Yield: | 8.5% |
| Ford Factory Whole Loan Summary | ||||
| Note | Original Balance | Cut-off Date Balance | Note Holder | Lead Servicing Interest |
| A-1 | $95,000,000 | $95,000,000 | BANK 2019-BNK18 | Yes |
| A-2 | $40,000,000 | $40,000,000 | Bank of America, N.A. | No |
| Total | $135,000,000 | $135,000,000 | ||
The Borrower and the Borrower Sponsor. The borrower is AI FFOZ Owner LLC, a Delaware limited liability company structured to be bankruptcy-remote with at least two independent directors (the “Ford Factory Borrower”). The non-recourse carveout guarantor is AIPH Holdings LLC, a Delaware limited liability company, which is majority owned by Access Industries, the borrower sponsor.
Access Industries is a privately held industrial group founded in 1986 by Len Blavatnik. Access Industries focuses its investments on natural resources and chemicals, media and telecommunications, venture capital and technology, and real estate. In addition to its ownership of Warner Music Group, Access Industries’ media and telecommunications holdings include AI Film, Amedia, DAZN, Deezer, First Access Entertainment, ice group, Perform and R.G.E. Group Ltd. Access Industries has invested approximately $65.9 million to purchase the Ford Factory Property.
The Property. The Ford Factory Property is a Class A, LEED Gold certified, creative office building designed by the architecture firm Rockwell Group and located in the Arts District neighborhood of downtown Los Angeles, California. The Ford Factory Property is comprised of 257,028 SF of office space plus a six-story parking garage containing 762 spaces (approximately 3.0 spaces per 1,000 SF). Amenities include complimentary car valet service, a fitness center, on-site café, outdoor patio space, and a rooftop patio with unobstructed views of downtown Los Angeles. The ground floor can be used as a full performance space.
The Ford Factory Property was originally constructed as four separate industrial buildings: (i) a five-story tower plus basement that was constructed in 1912 as one of the original Ford Model-T manufacturing facilities; (ii) annexed to such five-story tower is a two-story storage facility that was built in 1984; (iii) a two-story original assembly plant building that was constructed in 1923; and (iv) a two-story cold storage facility that was built in 1996. The four buildings were used by Ford until 1972, then from 1972 to 2005 were used by the Imperial Toy Factory as its headquarters, and afterwards the property was used as a self storage facility. In 2014, the Ford Factory Property was acquired vacant and underwent an approximately $90 million extensive interior and exterior renovation which was completed in 2019. The renovations included a new façade, roof and structural upgrades for the buildings, creation of the parking garage and studio, and a comprehensive tenant buildout. Approximately $300 PSF of tenant improvements were invested into the space, of which the landlord provided $18,763,044 ($73.00 PSF) and the tenant contributed the remainder.
The Ford Factory Property is 100% leased to WMG Acquisition Corp (“WMG”) on a triple-net lease that was signed on October 7, 2016, commenced on August 1, 2017, and expires on April 30, 2030. WMG took occupancy in March 2019. The lease requires annual base rent of $41.38 PSF as of August 2019, with annual rent increases of 3.0%, plus annual rent of $1,712,412 as of August 2019 for parking, with annual increases of 2.0%. The lease contains one 10-year renewal option at market rents, which must be exercised 18 months prior to the initial lease expiration. The tenant received the equivalent of twelve months of free rent, which abatement period has expired, and a landlord contribution of $18,763,044 for tenant improvements, of which $6,565,530 is still outstanding and has been fully reserved by the lender. The lease does not contain any termination options. As a security deposit under its lease, WMG delivered a letter of credit in the amount of $15,448,000 (see “Letter of Credit” below). WMG is under common control with the Ford Factory Borrower, the non-recourse carveout guarantor and the borrower sponsor.
Warner Music Group Corp., the parent company of WMG, is a global entertainment and music company, operating music publisher Warner/Chappell Music and major record labels including Elektra Records, Warner Bros Records, Parlaphone, and Atlantic Records. After having consolidated operations from offices in Burbank, the Ford Factory Property is now Warner Music Group Corp.’s new west coast headquarters, home to Rhino, WEA, ADA, Warner Bros Records, Atlantic Records and Warner/Chappell Music. Warner Music Group Corp. was acquired by Access Industries (the borrower sponsor) in 2011 for $3.3 billion and reported total revenue of $4.0 billion in its 2018 fiscal year. Warner Music Group Corp. is rated “BB-” by S&P.
This is not a research report and was not prepared by any Underwriter’s research department. Please see additional important information and qualifications at the end of this Term Sheet.
T-51
| Office - CBD | Loan #3 | Cut-off Date Balance: | $95,000,000 | |
| 777 South Santa Fe Avenue | Ford Factory | Cut-off Date LTV: | 57.0% | |
| Los Angeles, CA 90021 | U/W NCF DSCR: | 1.81x | ||
| U/W NOI Debt Yield: | 8.5% |
The following table presents certain information relating to the lease rollover schedule at the Ford Factory Property:
| Lease Rollover Schedule | ||||||||
| Year | # of Leases Rolling | SF Rolling | UW Rent PSF Rolling | Approx. % of Total SF Rolling | Approx. Cumulative % of SF Rolling | Total UW Rent Rolling | Approx. % of Total Rent Rolling | Approx. Cumulative % of Total Rent Rolling |
| 2019 | 0 | 0 | $0.00 | 0.0% | 0.0% | $0 | 0.0% | 0.0% |
| 2020 | 0 | 0 | $0.00 | 0.0% | 0.0% | $0 | 0.0% | 0.0% |
| 2021 | 0 | 0 | $0.00 | 0.0% | 0.0% | $0 | 0.0% | 0.0% |
| 2022 | 0 | 0 | $0.00 | 0.0% | 0.0% | $0 | 0.0% | 0.0% |
| 2023 | 0 | 0 | $0.00 | 0.0% | 0.0% | $0 | 0.0% | 0.0% |
| 2024 | 0 | 0 | $0.00 | 0.0% | 0.0% | $0 | 0.0% | 0.0% |
| 2025 | 0 | 0 | $0.00 | 0.0% | 0.0% | $0 | 0.0% | 0.0% |
| 2026 | 0 | 0 | $0.00 | 0.0% | 0.0% | $0 | 0.0% | 0.0% |
| 2027 | 0 | 0 | $0.00 | 0.0% | 0.0% | $0 | 0.0% | 0.0% |
| 2028 | 0 | 0 | $0.00 | 0.0% | 0.0% | $0 | 0.0% | 0.0% |
| 2029 | 0 | 0 | $0.00 | 0.0% | 0.0% | $0 | 0.0% | 0.0% |
| 2030 & Beyond | 1 | 257,028 | $41.38 | 100.0% | 100.0% | $10,634,556 | 100.0% | 100.0% |
| Vacant | 0 | 0 | $0.00 | 0.0% | 100.0% | $0 | 0.0% | 100.0% |
| Total/Wtd. Avg. | 1 | 257,028 | $41.38 | 100.0% | $10,634,556 | 100.0% | ||
Information is based on the underwritten rent roll.
The Market. The Ford Factory Property is located at 777 South Santa Fe Avenue in the Arts District neighborhood of downtown Los Angeles, California. According to the appraisal, the area was the former industrial center in Los Angeles during the early 20th century, but recently there has been a revitalization in the area. There has been a significant amount of development in the submarket, including the redevelopment of traditional and obsolete industrial and office spaces into modern creative office uses, the development of commercial retail/restaurant spaces, and a high concentration of multifamily development creating a live/work environment in the Downtown area. Creative users in the media, fashion, advertising, and architecture industries are attracted to the creative office space in the Downtown market, as a cheaper option compared to the West Los Angeles market. Adjacent to the Ford Factory Property will be the Soho House private club, currently under construction and taking over a former five-story warehouse building, which will feature three restaurants, six bars, a gym and a rooftop pool. Also under construction adjacent to the Ford Factory Property is a five-story multifamily building.
The area is accessed by the Interstates 5, 10 and 101 and State Route-60 each with interchanges approximately 0.5 miles west of the Ford Factory Property. The Los Angeles Metropolitan Transit Authority also provides public bus service in the area. The Los Angeles International Airport is located approximately ten miles southwest of the neighborhood.
According to the appraisal, the estimated 2018 population within a one-, three- and five-mile radius of the Ford Factory Property was 17,913, 399,186 and 1,238,309, respectively. The estimated 2018 average household income within the same radii was $50,383, $51,025 and $53,831, respectively.
The Ford Factory Property is located in the Downtown submarket of the Los Angeles office market. According to a third party research provider, as of the fourth quarter of 2018, the Downtown submarket contained approximately 40.3 million SF of Class A office product with a vacancy rate of 13.5% and average annual asking rents of $44.16 PSF. In the last five years, asking rents for Class A office space in the submarket have increased year-over-year by between 3.1% and 8.5%, while vacancy has decreased by an aggregate of 2.8%.
This is not a research report and was not prepared by any Underwriter’s research department. Please see additional important information and qualifications at the end of this Term Sheet.
T-52
| Office - CBD | Loan #3 | Cut-off Date Balance: | $95,000,000 | |
| 777 South Santa Fe Avenue | Ford Factory | Cut-off Date LTV: | 57.0% | |
| Los Angeles, CA 90021 | U/W NCF DSCR: | 1.81x | ||
| U/W NOI Debt Yield: | 8.5% |
The following table presents comparable creative office properties with respect to the Ford Factory Property:
| Comparable Property Summary | |||||||
| Property, Address | Distance | Year Built or | Total NRA (SF) / | Amenities | Recent | Recent Lease Date/ Term (Yrs) | Recent Lease SF / Rent NNN (PSF) |
Ford Factory 777 South Santa Fe Ave | N/A | 1912/2019 | 257,028 / 100.0%(1) | Fitness Center, On-site café, outdoor paseo, rooftop patio | WMG | Aug-17 / 12.75(1) | 257,028 / $41.38(1) |
At Mateo 555-581 Mateo St | 0.5 miles | 2017 | 185,554 / 84.4% | On-site commercial retail/restaurants, rooftop patio | Spotify(2) Confidential | Dec-18 / 9.42 Dec-17 / 10.58 | 109,706 / $45.00 28,860 / $42.67 |
ROW DTLA(3) 757, 767 & 777 S Alameda St | 0.7 miles | 1917/2017 | 995,182 / 26.7% | On-site retail/restaurants, athletic club, multiple outdoor patio spaces | Adidas J Brand | Feb-18 / 10.00 Oct-17 / 5.00 | 31,000 / $40.56 29,000 / $36.00 |
500 South Santa Fe Ave(4) 500 South Santa Fe Ave | 0.5 miles | 2018 | 97,916 / 1.7% | Penthouse view decks | NAV | NAV | NAV |
440 Seaton St 440 Seaton St | 1.1 miles | 1913/2019 | 85,392 / 29.0% | Outdoor patio space, balconies | NAV | NAV | NAV |
The Maxwell(5)(6) 405 Mateo St & 1003 E 4th Pl | 0.6 miles | 1924/2019 | 61,247 / 100.0% | Car charging station, on-site retail/restaurants, rooftop deck views | WeWork(2) | NAV | 61,247(2) |
Fourth & Traction(5) 963 E 4th St | 1.4 miles | 1915/2017 | 131,701 / 100.0% | Ground floor retail, rooftop deck entertainment area, office penthouse | Honey(2) | NAV | 131,701(2) |
Factory Place Arts Complex 1300-1330 Factory Pl & 1375 E 6th | 1.0 miles | 1920/1981/2010 | 177,128 / 100.0% | Ample retail, restaurants and fitness amenities nearby | Gridspace, Inc. | May-18 / 3.17 | 3,716 / $44.52 |
Brunswig Square 356-374 E 2nd St | 1.4 miles | 1934/2018 | 138,647 / 66.9% | Bicycle storage, car charging station, on-site retail/restaurants, shower facilities, rooftop patio and entertainment area | Confidential Confidential | Jan-19 / 11.00 Apr-18 / 5.44 | 29,396 / $37.80 5,440 / $33.60 |
Source: Appraisal.
| (1) | Information obtained from the underwritten rent roll. |
| (2) | Information obtained from a real estate data provider. |
| (3) | The appraisal notes that the ROW DTLA property is currently in development and will have a total of 1.3 million SF of office space when complete. Currently three of the six buildings are in lease-up. |
| (4) | The appraisal notes that the 500 South Santa Fe Ave property was delivered in October 2018 and is currently in lease-up. |
| (5) | The Maxwell and the Fourth & Traction properties are both owned by Hudson Pacific Properties. |
| (6) | The appraisal notes that The Maxwell property is under renovation and construction and upon completion will consist of two creative office buildings. |
The following table presents the appraiser’s market rent conclusions:
| Market Rent Summary | |
| Office | |
| Market Rent (PSF) | $42 |
| Lease Term (Years) | 10 |
| Rental Increase Projection | 3.0%per annum |
This is not a research report and was not prepared by any Underwriter’s research department. Please see additional important information and qualifications at the end of this Term Sheet.
T-53
| Office - CBD | Loan #3 | Cut-off Date Balance: | $95,000,000 | |
| 777 South Santa Fe Avenue | Ford Factory | Cut-off Date LTV: | 57.0% | |
| Los Angeles, CA 90021 | U/W NCF DSCR: | 1.81x | ||
| U/W NOI Debt Yield: | 8.5% |
Underwritten Net Cash Flow.The following table presents certain information relating to the Underwritten Net Cash Flow at the Ford Factory Property:
| Cash Flow Analysis(1) | ||
| UW | UW PSF | |
| Gross Potential Rent(2) | $10,634,556 | $41.38 |
| Reimbursements | $6,155,726 | $23.95 |
| Net Rental Income | $16,790,282 | $65.32 |
| Parking Income(2) | $1,712,412 | $6.66 |
| Vacancy and Concessions | ($839,514) | ($3.27) |
| Effective Gross Income | $17,663,180 | $68.72 |
| Taxes | $1,614,662 | $6.28 |
| Insurance | $375,899 | $1.46 |
| Other Operating Expenses | $4,165,165 | $16.21 |
| Total Operating Expenses | $6,155,726 | $23.95 |
| Net Operating Income | $11,507,454 | $44.77 |
| TI/LC | $257,028 | $1.00 |
| Capital Expenditures | $64,257 | $0.25 |
| Net Cash Flow | $11,186,169 | $43.52 |
| NOI DSCR | 1.86x | |
| NCF DSCR | 1.81x | |
| NOI Debt Yield | 8.5% | |
| NCF Debt Yield | 8.3% | |
| (1) | The Ford Factory Property was recently redeveloped to a single tenant office building, therefore historical financial statements are not applicable. |
| (2) | UW Gross Potential Rent and UW Parking Income are based on the rent in place effective August 1, 2019. |
Escrows and Reserves.
Taxes and Insurance Reserves.During the continuance of a Reserve Trigger Event (as defined below), the Ford Factory Borrower is required to reserve monthly 1/12th of the estimated property taxes and 1/12th of the estimated insurance premiumsprovidedthat the monthly tax reserve requirement will be waived if the property taxes are paid directly by the tenant(s) and the monthly insurance reserve will be waived if the insurance premiums are paid directly by the tenant(s) or if the Ford Factory Borrower is maintaining a blanket policy covering the Ford Factory Property.
Replacement Reserve.During the continuance of a Reserve Trigger Event, the Ford Factory Borrower is required to reserve monthly $5,355 for replacement reserves.
Tenant Improvements and Leasing Commissions Reserve.WMG was entitled to a landlord contribution of $18,763,044 for tenant improvements, of which $6,565,530 is still outstanding to be paid. At loan origination, the Ford Factory Borrower deposited to the leasing reserve $6,565,530 for such tenant improvements completed but not yet reimbursed to the tenant. During the continuance of a Reserve Trigger Event, the Ford Factory Borrower is required to deposit monthly $24,419 to the leasing reserve.
A “Reserve Trigger Event” will occur when the debt service coverage ratio is less than 1.60x for the preceding twelve months, tested quarterly.
Lockbox and Cash Management. The Ford Factory Whole Loan documents require a hard lockbox with springing cash management. Upon the occurrence and continuance of a Cash Sweep Period (as defined below), on each business day funds in the lockbox account will be transferred to the lender-controlled cash management account and disbursed according to the Ford Factory Whole Loan documents with all excess cash held by the lender as additional security for the Ford Factory Whole Loan (however, excess cash will be available to the Ford Factory Borrower to fund (x) tenant improvements and leasing commissions after depletion of funds in the leasing reserve and (y) replacements after depletion of funds in the replacement reserve.)
If the Cash Sweep Period has been caused by a WMG Sweep Cap Event (as defined below), for so long as (a) no event of default is continuing and (b) WMG remains bound by the terms of its lease, excess cash collected will be used solely to fund tenant improvements and leasing commissions that would be permitted to be disbursed from the leasing reserve and any excess cash collected above $12,851,400 (the “WMG Sweep Cap”) will be released to the Ford Factory Borrower; provided, however, if at least one other trigger is also occurring, all excess cash above the WMG Sweep Cap will remain in the excess cash reserve and be made available to the Ford Factory Borrower to fund tenant improvements, leasing commissions and replacements.
A “Cash Sweep Period” will occur during the period (i) commencing upon an event of default and expiring upon cure of such event of default, (ii) commencing upon the Ford Factory Borrower becoming the subject of any bankruptcy proceeding or having its assets made subject to the jurisdiction of a bankruptcy court and expiring upon the bankruptcy filing no longer being in effect, (iii) commencing when the trailing twelve month debt service coverage
This is not a research report and was not prepared by any Underwriter’s research department. Please see additional important information and qualifications at the end of this Term Sheet.
T-54
| Office - CBD | Loan #3 | Cut-off Date Balance: | $95,000,000 | |
| 777 South Santa Fe Avenue | Ford Factory | Cut-off Date LTV: | 57.0% | |
| Los Angeles, CA 90021 | U/W NCF DSCR: | 1.81x | ||
| U/W NOI Debt Yield: | 8.5% |
ratio is less than 1.50x, tested quarterly, and expiring upon the trailing twelve month debt service coverage ratio being equal to or greater than 1.55x for two consecutive quarters, or (iv) commencing upon a WMG Sweep Event and expiring upon cure of such WMG Sweep Event.
A “WMG Sweep Event” will commence upon:
| (i) | WMG vacating, ceasing to operate, or giving notice to vacate or cease to operate (a “WMG Sweep Cap Event”), or WMG terminating or giving notice to terminate, |
| (ii) | WMG’s failure to exercise its lease extension option at least twelve months prior to the Ford Factory Whole Loan maturity date; |
| (iii) | WMG defaulting in rent or having a material default under its lease beyond notice and cure periods; |
| (iv) | WMG becoming the subject of any bankruptcy proceeding or having its assets made subject to the jurisdiction of a bankruptcy court; |
| (v) | WMG or any of WMG’s direct or indirect parents having its long-term unsecured debt rating revoked or downgraded below B- (stable) / B3 (stable) by S&P and Moody’s; or |
| (vi) | WMG breaching a material monetary covenant of any corporate loan or credit facility to which it is a party. |
A WMG Sweep Event will end when:
| a. | if triggered by (i) or (ii) above, (1) the debt yield is equal to or greater than 8.3% and (2) any replacement tenant is in occupancy and paying full unabated rent under a lease expiring no earlier than April 1, 2031 with no outstanding tenant improvements or leasing commissions remaining owed; |
| b. | if triggered by (iii) above, the WMG lease default is cured; |
| c. | if triggered by (iv) above, the WMG lease is assumed without material alteration and WMG’s lease obligations remain unaltered, or the assets of WMG are no longer subject to the jurisdiction of the bankruptcy court; |
| d. | if triggered by (v) above, the long-term unsecured debt rating of WMG or WMG’s direct or indirect parents is equal to or greater than B- (stable) / B3 (stable) by S&P and Moody’s; and |
| e. | if triggered by (vi) above, the covenant breach is cured. |
Additional Secured Indebtedness (not including trade debts). In addition to the Ford Factory Mortgage Loan, the Ford Factory Property also secures the Ford FactoryPari Passu Companion Loan which has a Cut-off Date principal balance of $40,000,000. The Ford FactoryPari Passu Companion Loan accrues interest at the same rate as the Ford Factory Mortgage Loan. The Ford Factory Mortgage Loan is entitled to payments of interest and principal on apro rata andpari passu basis with the Ford FactoryPari Passu Companion Loan. The holders of the Ford Factory Mortgage Loan and the Ford FactoryPari Passu Companion Loan have entered into a co-lender agreement which sets forth the allocation of collections on the Ford Factory Whole Loan. See “Description of the Mortgage Pool—The Whole Loans—The Serviced Pari Passu Whole Loans” in the Preliminary Prospectus.
Mezzanine Loan and Preferred Equity.At any time after March 29, 2021, the Ford Factory Whole Loan documents permit future coterminous mezzanine financing secured by 100% of the direct or indirect equity ownership interests in the Ford Factory Borrowerprovidedamong other conditions, (i) the Ford Factory Borrower obtains the lender’s consent, (ii) no event of default is continuing, (iii) the debt service coverage ratio including the mezzanine loan is at least 1.80x, (iv) the loan-to-value ratio including the mezzanine loan is no greater than 57.0%, (v) the debt yield including the mezzanine loan is at least 8.3%, (vi) the mezzanine lender is a qualified institutional lender who has executed an intercreditor agreement with the lender, (vii) the Ford Factory Borrower has delivered a non-consolidation opinion, (viii) the lender has received rating agency confirmation, and (ix) the sum of outstanding principal balance of the Ford Factory Whole Loan and the mezzanine loan is not greater than $175,000,000.
Release of Property. Not permitted.
Ground Lease.None.
Right of First Refusal.None.
Letter of Credit.WMG delivered to the Ford Factory Borrower, as a security deposit under its lease, an irrevocable letter of credit in the original amount of $15,448,000, which letter of credit has been collaterally assigned to the lender.Providedthere is no event of default under the lease, the amount of the letter of credit reduces in 2021 (lease year 4) to $11,586,243, in 2022 (lease year 5) to $7,724,162, in 2023 (lease year 6) to $3,862,081, in 2024 (lease year 7) to $1,931,000, and in 2029 (lease year 12) to $0.The letter of credit is also subject to further reduction if WMG and Warner Music Group Corp. obtain a Moody’s or S&P rating as follows: to $12,448,000, if the Moody’s rating is “Ba3” or the S&P rating is “BB-”; to $9,448,000, if the Moody’s rating is “Ba2” or the S&P rating is “BB”; to $6,448,000, if the Moody’s rating is “Ba1” or the S&P rating is “BB+”; and to $0, if the Moody’s rating is “Baa3” (or higher) or the S&P rating is “BBB-” (or higher). Given Warner Music Group Corp.’s current rating of “BB-”, WMG has requested a reduction in the letter of credit amount.
Terrorism Insurance.The Ford Factory Borrower is required to obtain and maintain property insurance that covers perils of terrorism and acts of terrorism in an amount equal to the full replacement cost of the Ford Factory Property and business interruption insurance for 24 months with a twelve month extended period of indemnity. Notwithstanding, in order to obtain the terrorism coverage the Ford Factory Borrower will not be required to pay annual premiums for terrorism insurance in excess of two times the premium for a separate policy insuring only the Ford Factory Property on a stand-alone basis (but will be required to purchase the maximum amount of terrorism coverage available with such funds). See “Risk Factors—Risks Relating to the Mortgage Loans—Terrorism Insurance May Not Be Available for All Mortgaged Properties” in the Preliminary Prospectus.
Environmental Insurance. Due to the historical uses at the Ford Factory Property by Ford Motor Company, an opinion of probable cost was obtained for potential testing and remediation of the site which concluded to a worst-case estimate of $3,350,000. The Ford Factory Borrower has obtained and is required to maintain environmental insurance against claims for pollution and remediation legal liability with a limit of $10,000,000 and a deductible of $25,000 for a period three years past the Ford Factory Whole Loan maturity date. See “Description of the Mortgage Pool—Environmental Considerations” in the Preliminary Prospectus.
This is not a research report and was not prepared by any Underwriter’s research department. Please see additional important information and qualifications at the end of this Term Sheet.
T-55
| Office – Suburban | Loan #4 | Cut-off Date Balance: | $73,800,000 | |
| 3617, 3650 and 3655 131st Avenue Southeast; 3625 132nd Avenue | Newport Corporate Center | Cut-off Date LTV: | 34.5% | |
| Southeast; 12920 Southeast 38th Street | U/W NCF DSCR: | 5.63x | ||
| Bellevue, WA 98006 | U/W NOI Debt Yield: | 20.2% |
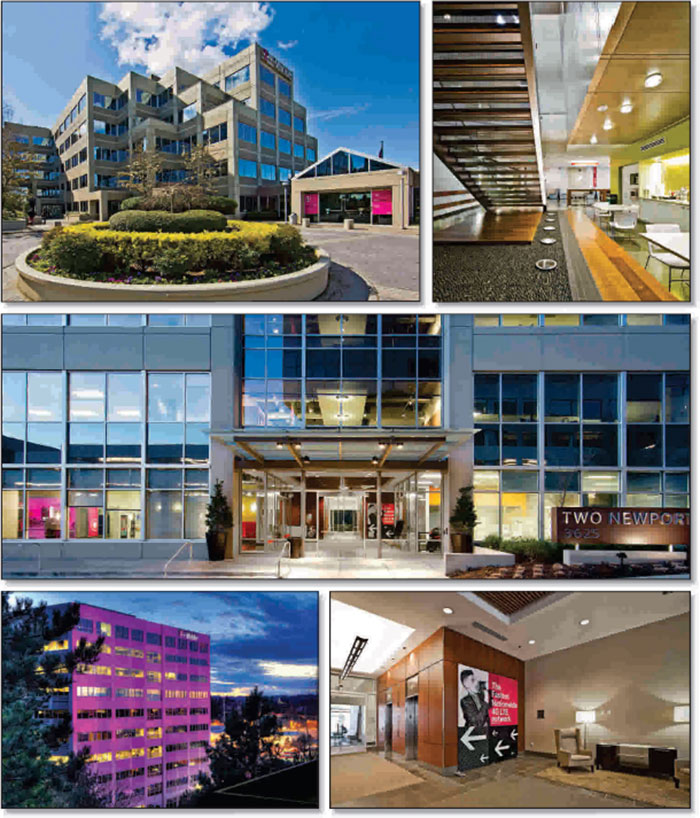
This is not a research report and was not prepared by any Underwriter’s research department. Please see additional important information and qualifications at the end of this Term Sheet.
T-56
| Office – Suburban | Loan #4 | Cut-off Date Balance: | $73,800,000 | |
| 3617, 3650 and 3655 131st Avenue Southeast; 3625 132nd Avenue | Newport Corporate Center | Cut-off Date LTV: | 34.5% | |
| Southeast; 12920 Southeast 38th Street | U/W NCF DSCR: | 5.63x | ||
| Bellevue, WA 98006 | U/W NOI Debt Yield: | 20.2% |

This is not a research report and was not prepared by any Underwriter’s research department. Please see additional important information and qualifications at the end of this Term Sheet.
T-57
| Office – Suburban | Loan #4 | Cut-off Date Balance: | $73,800,000 | |
| 3617, 3650 and 3655 131st Avenue Southeast; 3625 132nd Avenue | Newport Corporate Center | Cut-off Date LTV: | 34.5% | |
| Southeast; 12920 Southeast 38th Street | U/W NCF DSCR: | 5.63x | ||
| Bellevue, WA 98006 | U/W NOI Debt Yield: | 20.2% |

This is not a research report and was not prepared by any Underwriter’s research department. Please see additional important information and qualifications at the end of this Term Sheet.
T-58
| Office – Suburban | Loan #4 | Cut-off Date Balance: | $73,800,000 | |
| 3617, 3650 and 3655 131st Avenue Southeast; 3625 132nd Avenue | Newport Corporate Center | Cut-off Date LTV: | 34.5% | |
| Southeast; 12920 Southeast 38th Street | U/W NCF DSCR: | 5.63x | ||
| Bellevue, WA 98006 | U/W NOI Debt Yield: | 20.2% |
| Mortgage Loan No. 4 – Newport Corporate Center |
| Mortgage Loan Information | Property Information | |||||
| Mortgage Loan Seller: | WFB | Single Asset/Portfolio: | Single Asset | |||
| Credit Assessment (Fitch/KBRA/Moody’s): | BBB-sf/BBB+(sf)/NR | Location: | Bellevue, WA 98006 | |||
| Original Balance(1): | $73,800,000 | General Property Type: | Office | |||
| Cut-off Date Balance(1): | $73,800,000 | Detailed Property Type: | Suburban | |||
| % of Initial Pool Balance: | 7.1% | Title Vesting: | Fee | |||
| Loan Purpose: | Acquisition | Year Built/Renovated: | 1988-2010/2019 | |||
| Sponsors: | Farshid Steve Shokouhi; Brett Michael Lipman | Size: | 998,284 SF | |||
| Guarantors: | Farshid Steve Shokouhi; Brett Michael Lipman | Cut-off Date Balance per SF(1): | $164 | |||
| Mortgage Rate(2)(3): | 3.5432% | Maturity Date Balance per SF(1): | $164 | |||
| Note Date: | 4/10/2019 | Property Manager: | Preylock Real Estate Holdings, | |||
| First Payment Date: | 6/6/2019 | LLC (borrower-related) | ||||
| Anticipated Repayment Date(3): | 5/6/2029 | |||||
| Final Maturity Date(3): | 10/6/2030 | |||||
| Original Term to Maturity: | 120 months | |||||
| Original Amortization Term: | 0 months | |||||
| IO Period: | 120 months | |||||
| Seasoning: | 0 months | Underwriting and Financial Information | ||||
| Prepayment Provisions(4): | LO (24); DEF (89); O (7) | UW NOI: | $33,141,899 | |||
| Lockbox/Cash Mgmt Status: | Hard/Springing | UW NOI Debt Yield(1): | 20.2% | |||
| Additional Debt Type(1)(2)(5): | Pari Passu/Subordinate | UW NOI Debt Yield at Maturity(1): | 20.2% | |||
| Additional Debt Balance(1)(2)(5): | $90,200,000/$148,000,000 | UW NCF DSCR(1): | 5.63x | |||
| Future Debt Permitted (Type): | No (N/A) | Most Recent NOI: | $23,749,358 (12/31/2018) | |||
| Reserves | 2nd Most Recent NOI: | $24,641,331 (12/31/2017) | ||||
| Type | Initial | Monthly | Cap | 3rd Most Recent NOI: | $23,819,604 (12/31/2016) | |
| RE Tax: | $0 | Springing | N/A | Most Recent Occupancy: | 99.3% (3/25/2019) | |
| Insurance: | $0 | Springing | N/A | 2nd Most Recent Occupancy: | 99.3% (12/31/2018) | |
| Replacement Reserve: | $0 | $12,479 | $149,743 | 3rd Most Recent Occupancy: | 96.3% (12/31/2017) | |
| General CapEx and TI/LC: | $1,675,000 | N/A | N/A | Appraised Value (as of): | $476,000,000 (3/14/2019) | |
| T-Mobile TI/LC: | $60,072,224 | N/A | N/A | Appraised Value per SF: | $477 | |
| T-Mobile CapEx: | $5,357,554 | N/A | N/A | Cut-off Date LTV Ratio(1): | 34.5% | |
| Rent Concession Reserve: | $21,807,139 | N/A | N/A | Maturity Date LTV Ratio(1): | 34.5% | |
| Sources and Uses | ||||||
| Sources | Proceeds | % of Total | Uses | Proceeds | % of Total | |
| Senior Loan(1): | $164,000,000 | 34.4% | Gross Purchase Price: | $467,500,000 | 98.0% | |
| Subordinate Companion Loan(1): | $148,000,000 | 31.0% | Seller Credits(7): | ($88,911,917) | (18.6%) | |
| Equity(6): | $165,272,914 | 34.6% | Reserves: | $88,911,917 | 18.6% | |
| Closing Costs: | $9,772,914 | 2.0% | ||||
| Total Sources: | $477,272,914 | 100.0% | Total Uses: | $477,272,914 | 100.0% | |
| (1) | The Cut-off Date Balance per SF, Maturity Date Balance per SF, UW NOI Debt Yield, UW NOI Debt Yield at Maturity, UW NCF DSCR, Cut-off Date LTV Ratio and Maturity Date LTV Ratio numbers presented above are based on the Newport Corporate Center Senior Loan (as defined below). The Cut-off Date Balance per SF, Maturity Date Balance per SF, UW NOI Debt Yield, UW NOI Debt Yield at Maturity, UW NCF DSCR, Cut-off Date LTV Ratio and Maturity Date LTV Ratio numbers based on the Newport Corporate Center Whole Loan (as defined below) are $313, $313, 10.6%, 10.6%, 2.34x, 65.5% and 65.5%, respectively. |
| (2) | The Newport Corporate Center Senior Loan has an interest rate of 3.54323171% and the Newport Corporate Center Subordinate Companion Loan (as defined below) has interest rates of 4.6250% % for the B Note, 4.9500% for the C Note, and 6.500% for the D Note. See “Additional Secured Indebtedness (not including trade debts)” below for further discussion of additional debt. |
| (3) | The Newport Corporate Center Whole Loan has an anticipated repayment date of May 6, 2029 (the “Anticipated Repayment Date” or “ARD”) and a final maturity date of October 6, 2030. See “The Mortgage Loan” below for further discussion of the mortgage rate after the ARD. |
| (4) | Defeasance of the Newport Corporate Center Whole Loan is permitted at any time after the earlier to occur of (a) the end of the two-year period commencing on the closing date of the securitization of the last Newport Corporate Center Whole Loan note to be securitized and (b) April 10, 2022. The assumed defeasance lockout period of 24 payments is based on the closing date of this transaction in May 2019. |
| (5) | See “The Mortgage Loan” and “Additional Secured Indebtedness (not including trade debts)” below for further discussion of additional debt. |
| (6) | Square Mile Bellevue Preferred LLC made a $96,000,000 preferred equity investment in the Newport Corporate Center Borrower (see“Preferred Equity” below). |
| (7) | The Seller Credits are related to outstanding tenant improvement costs ($60,072,224), rent abatements ($21,807,139), capital expenditures ($5,357,554), and miscellaneous capital expenditures and tenant improvement costs ($1,675,000). |
This is not a research report and was not prepared by any Underwriter’s research department. Please see additional important information and qualifications at the end of this Term Sheet.
T-59
| Office – Suburban | Loan #4 | Cut-off Date Balance: | $73,800,000 | |
| 3617, 3650 and 3655 131st Avenue Southeast; 3625 132nd Avenue | Newport Corporate Center | Cut-off Date LTV: | 34.5% | |
| Southeast; 12920 Southeast 38th Street | U/W NCF DSCR: | 5.63x | ||
| Bellevue, WA 98006 | U/W NOI Debt Yield: | 20.2% |
The Mortgage Loan. The fourth largest mortgage loan (the “Newport Corporate Center Mortgage Loan”) is part of a whole loan (the “Newport Corporate Center Whole Loan”) in the original principal balance of $312,000,000. The Newport Corporate Center Whole Loan is secured by a first priority fee mortgage encumbering a 998,284 SF suburban office campus located in Bellevue, Washington (the “Newport Corporate Center Property”). The Newport Corporate Center Whole Loan consists of (i) six senior notes totaling $164,000,000, which arepari passu with each other (collectively, the “Newport Corporate Center Senior Loan”), and (ii) ten subordinate notes totaling $148,000,000 (collectively, the “Newport Corporate Center Subordinate Companion Loan”), which are expected to be sold to a third party purchaser and are subordinate to the Newport Corporate Center Senior Loan. The Newport Corporate Center Mortgage Loan will be serviced pursuant to the pooling and servicing agreement for the BANK 2019-BNK18 securitization trust. The Newport Corporate Center Mortgage Loan represents Notes A-2-A, A-2-B, and A-2-C, which have an aggregate original principal balance of $73,800,000. The remaining Newport Corporate Center Senior Loanpari passu notes are referred to herein as the “Newport Corporate CenterPari PassuCompanion Loans”. See “Description of the Mortgage Pool—The Whole Loans—The Newport Corporate Center A/B Whole Loan” and “Pooling and Servicing Agreement”in the Preliminary Prospectus.
| Newport Corporate Center Whole Loan Summary | ||||
| Note(1) | Original Balance | Cut-off Date Balance | Note Holder | Lead Servicing Interest |
| Newport Corporate Center Mortgage Loan | ||||
| A-2-A | $33,800,000 | $33,800,000 | BANK 2019-BNK18 | (2) |
| A-2-B | $20,000,000 | $20,000,000 | BANK 2019-BNK18 | No |
| A-2-C | $20,000,000 | $20,000,000 | BANK 2019-BNK18 | No |
| Newport Corporate CenterPari Passu Companion Loans | ||||
| A-1-A | $50,000,000 | $50,000,000 | Deutsche Bank AG, New York Branch | No |
| A-1-B | $30,000,000 | $30,000,000 | Deutsche Bank AG, New York Branch | No |
| A-1-C | $10,200,000 | $10,200,000 | Deutsche Bank AG, New York Branch | No |
| Newport Corporate Center Subordinate Companion Loan | ||||
| B-1-A | $7,150,000 | $7,150,000 | Deutsche Bank AG, New York Branch | No |
| B-1-B | $2,750,000 | $2,750,000 | Deutsche Bank AG, New York Branch | No |
| B-2-A | $5,850,000 | $5,850,000 | Wells Fargo Bank, National Association | No |
| B-2-B | $2,250,000 | $2,250,000 | Wells Fargo Bank, National Association | No |
| C-1-A | $22,000,000 | $22,000,000 | Deutsche Bank AG, New York Branch | No |
| C-1-B | $18,700,000 | $18,700,000 | Deutsche Bank AG, New York Branch | No |
| C-2-A | $18,000,000 | $18,000,000 | Wells Fargo Bank, National Association | No |
| C-2-B | $15,300,000 | $15,300,000 | Wells Fargo Bank, National Association | No |
| D-1(2) | $30,800,000 | $30,800,000 | Deutsche Bank AG, New York Branch | (2) |
| D-2(2) | $25,200,000 | $25,200,000 | Wells Fargo Bank, National Association | (2) |
| Total Newport Corporate Center Whole Loan | $312,000,000 | $312,000,000 | ||
| (1) | The Newport Corporate Center Subordinate Companion Loan is subordinate to the Newport Corporate Center Senior Loan. |
| (2) | The holders of a majority of the Newport Corporate Center Subordinate Companion Loan D Notes (by principal balance) will have the right to appoint the special servicer of the Newport Corporate Center Whole Loan and to direct certain decisions with respect to the Newport Corporate Center Whole Loan, until a control appraisal event exists under the related co-lender agreement with respect to the D Notes. Thereafter, the holders of a majority of the Newport Corporate Center Subordinate Companion Loan C Notes (by principal balance) will have such rights until a control appraisal event exists under the related co-lender agreement with respect to the C Notes, in which case, the holders of a majority of the Newport Corporate Center Subordinate Companion Loan B Notes (by principal balance) will have such rights until a control appraisal event exists under the related co-lender agreement with respect to the B Notes. If a control appraisal event under the related co-lender agreement exists with respect to the B Notes, the holder of the Newport Corporate Center Note A-2-A (or the directing certificate holder for the securitization trust that holds Note A-2-A) will have such rights. |
The Newport Corporate Center Whole Loan is structured with an Anticipated Repayment Date of May 6, 2029, a final maturity date of October 6, 2030, and will be interest-only prior to the Anticipated Repayment Date. From and after the Anticipated Repayment Date, the Newport Corporate Center Whole Loan accrues interest at a fixed rate that is equal to the sum of (i) 2.50% and (ii) the greater of (a) the initial interest rate applicable to such loan and (b) the sum of (1) the 10-year yield for the United States Treasury Note as displayed on Reuters Capital Markets 19901 as of the Anticipated Repayment Date (or the preceding business day if the Anticipated Repayment Date is not a business day), plus (2) (A) with respect to each A Note, 1.04323171%, (B) with respect to each B Note, 2.12500000%, (C) with respect to each C Note, 2.45000000% and (D) with respect to each D note, 4.00000000%. The ARD automatically triggers a Trigger Period (see “Lockbox and Cash Management” section) whereby all excess cash flow, after payments of debt service on the Newport Corporate Center Whole Loan, required deposits to escrows and reserves and budgeted operating expenses is required to be used to pay down the principal balance of the Newport Corporate Center Whole Loan (with paydown priority given to the Newport Corporate Center Senior Loan).
The Borrower and the Borrower Sponsors. The borrower is Preylock Bellevue, LLC, (the “Newport Corporate Center Borrower”) a Delaware limited liability company structured to be bankruptcy-remote with at least two independent directors. Legal counsel to the Newport Corporate Center Borrower delivered a non-consolidation opinion in connection with the origination of the Newport Corporate Center Mortgage Loan.
The borrower sponsors and non-recourse carveout guarantors are Farshid Steve Shokouhi and Brett Michael Lipman. Mr. Shokouhi and Mr. Lipman are both managing partners at Preylock Real Estate Holdings (“Preylock”) and oversee all aspects of the business. Founded in 2016 in Los Angeles, California, Preylock is a real estate acquisition and management company. Preylock has approximately $1.25 billion of assets under management and has a portfolio of approximately 3.0 million SF of office properties located in Southern California and Silicon Valley.
Prior to founding Preylock, Mr. Lipman was most recently a portfolio manager and a partner at RMA Real Estate Investment Advisors (“RMA”), a real estate private equity fund. At RMA, he was responsible for portfolio management, asset management and sourcing direct real estate investment
This is not a research report and was not prepared by any Underwriter’s research department. Please see additional important information and qualifications at the end of this Term Sheet.
T-60
| Office – Suburban | Loan #4 | Cut-off Date Balance: | $73,800,000 | |
| 3617, 3650 and 3655 131st Avenue Southeast; 3625 132nd Avenue | Newport Corporate Center | Cut-off Date LTV: | 34.5% | |
| Southeast; 12920 Southeast 38th Street | U/W NCF DSCR: | 5.63x | ||
| Bellevue, WA 98006 | U/W NOI Debt Yield: | 20.2% |
opportunities. Prior to joining RMA, Mr. Lipman worked for JP Morgan, most recently on the Global Real Assets platform, a large institutional real estate investor. Previously, Mr. Shokouhi was the Managing Principal of the Kalimian Organization, a real estate family office based in New York. Mr. Shokouhi focused on the firm’s business development, asset repositioning, and the assembly of a management team.
The Property. The Newport Corporate Center Property is a five-building, separately parceled, Class A office campus situated on approximately 15.5 acres. The Newport Corporate Center Property was built between 1988 and 2010 and is currently undergoing an approximately $165.8 million renovation, including $85.8 million in tenant improvements and capital work and an expected investment from T-Mobile of approximately $80.0 million. Renovations are expected to include elevator modernization, exterior improvements, roof repairs/replacements, HVAC repairs/replacements, new sky bridges/walkways and new amenities including an amphitheater, collaborative patio spaces, bocce courts, fitness centers and general tenant improvement work.
The Newport Corporate Center Property serves as the global headquarters of T-Mobile, which has been in occupancy since 2000 and recently extended its lease through October 31, 2030. As part of the tenant’s lease renewal, T-Mobile plans to invest its own money towards improving the interior tenant build outs, building systems, and interconnectivity of the campus. Since 2000, the Newport Corporate Center Property has maintained a 95.0% average occupancy rate and been institutionally owned and maintained. As of March 25, 2019, the Newport Corporate Center Property was 99.3% occupied by six tenants with T-Mobile accounting for 92.1% of the NRA and 94.2% of underwritten base rent.
The Newport Corporate Center Property offers natural light and views of the Olympic Mountains, Mt. Baker, and both the Downtown Seattle and Bellevue skylines with most floors offering panoramic views. The five buildings range from 151,414 SF to 288,428 SF and contain five to ten floors. The average floor plate size for the buildings is 28,700 SF, which allows for flexible and open floor plans. Each building has a parking garage (ranging from three to nine levels) and additional surface parking. The Newport Corporate Center Property contains 3,630 total parking spaces, which equates to approximately 3.6 spaces per 1,000 SF of rentable area.
Founded in 1994, T-Mobile is the nation’s third largest wireless telecommunications services provider and is a subsidiary of Deutsche Telekom AG. T-Mobile offers voice, messaging, and data services to over 79 million customers in the postpaid, prepaid, and wholesale markets in the United States, Puerto Rico, and the U.S. Virgin Islands. T-Mobile also provides wireless devices, including smartphones, tablets, and other mobile communication devices, as well as accessories that are manufactured by various suppliers. In addition, T-Mobile offers services, devices, and accessories under the T-Mobile and Metro by T-Mobile brands through its owned and operated retail stores, third party distributors, and its websites. For the fiscal year ended December 31, 2018, T-Mobile reported total revenues of approximately $43.3 billion, which is up approximately 7.0% from the prior year, and net income of approximately $2.9 billion. As of the fiscal year end December 31, 2018, T-Mobile recorded approximately 7.0 million total net additions to its customer base and approximately 1.4 million branded postpaid net additions in 2018.
The following table presents certain information relating to the tenants at the Newport Corporate Center Property:
| Tenant Summary | |||||||||
| Tenant Name | Credit Rating (Fitch/Moody’s/S&P) | Tenant SF | Approx. % of Total SF | Annual UW Rent | % of Total Annual UW Rent | Annual UW Rent PSF | Lease Expiration | Renewal Options | Termination Options |
| T-Mobile | BB+/Ba2/BB+(1) | 919,001 | 92.1% | $24,521,626(2)(3) | 94.2% | $26.68(2)(3) | 10/31/2030 | 2 x 7 Yrs | N |
| KLSY/KIXI | NR/NR/NR | 21,175 | 2.1% | $522,131 | 2.0% | $24.66 | 3/31/2026 | 1 x 5 Yrs | N |
| LifeCenter Northwest | NR/NR/NR | 20,713 | 2.1% | $462,893 | 1.8% | $22.35 | 8/31/2025 | 1 x 5 Yrs | N |
| Protingent, Inc. | NR/NR/NR | 11,314 | 1.1% | $271,536 | 1.0% | $24.00 | 4/30/2021 | None | N |
| Mobica US Inc. | NR/NR/NR | 5,763 | 0.6% | $152,720 | 0.6% | $26.50 | 5/31/2021 | None | N |
| PrivacyStar | NR/NR/NR | 3,486 | 0.3% | $87,150 | 0.3% | $25.00 | 3/31/2020 | None | N |
| Subtotal/Wtd. Avg. | 981,452 | 98.3% | $26,018,055 | 100.0% | $26.51 | ||||
| Other(4) | 9,878 | 1.0% | N/A | N/A | N/A | ||||
| Vacant Space | 6,954 | 0.7% | $0 | 0.0% | $0.00 | ||||
| Total/Wtd. Avg. | 998,284 | 100.0% | $26,018,055 | 100.0% | $26.25 | ||||
Information is based on the underwritten rent roll.
| (1) | The ratings shown represent T-Mobile USA Inc., which is the guarantor for T-Mobile’s lease. T-Mobile’s parent company, Deutsche Telekom AG, is rated BBB+/Baa1/BBB+ by Fitch/Moody’s/S&P. |
| (2) | The lender’s underwriting gives separate credit for straight-line rent averaging over the remaining lease term for T-Mobile totaling $6,136,929, which implies a total underwritten rental rate of $33.36 PSF (see “Operating History and Underwritten Net Cash Flow” below). |
| (3) | At closing, the Newport Corporate Center Borrower deposited an upfront reserve of $21,807,139 for free rent obligations related to T-Mobile. T-Mobile is currently in a free rent period related to 69,665 SF through December 31, 2020 and has an additional free rent period related to 747,091 SF from January 1, 2020 through October 31, 2020. |
| (4) | Other includes non-revenue generating space for the fitness center, conference center and engineering shop. |
This is not a research report and was not prepared by any Underwriter’s research department. Please see additional important information and qualifications at the end of this Term Sheet.
T-61
| Office – Suburban | Loan #4 | Cut-off Date Balance: | $73,800,000 | |
| 3617, 3650 and 3655 131st Avenue Southeast; 3625 132nd Avenue | Newport Corporate Center | Cut-off Date LTV: | 34.5% | |
| Southeast; 12920 Southeast 38th Street | U/W NCF DSCR: | 5.63x | ||
| Bellevue, WA 98006 | U/W NOI Debt Yield: | 20.2% |
The following table presents certain information relating to the lease rollover schedule at the Newport Corporate Center Property:
| Lease Rollover Schedule(1)(2) | ||||||||
| Year | # of Leases Rolling | SF Rolling | UW Rent PSF Rolling | Approx. % of Total SF Rolling | Approx. Cumulative % of SF Rolling | Total UW Rent Rolling | Approx. % of Total Rent Rolling | Approx. Cumulative % of Total Rent Rolling |
| 2019 | 0 | 0 | $0.00 | 0.0% | 0.0% | $0 | 0.0% | 0.0% |
| 2020 | 1 | 3,486 | $25.00 | 0.3% | 0.3% | $87,150 | 0.3% | 0.3% |
| 2021 | 2 | 17,077 | $24.84 | 1.7% | 2.1% | $424,256 | 1.6% | 2.0% |
| 2022 | 0 | 0 | $0.00 | 0.0% | 2.1% | $0 | 0.0% | 2.0% |
| 2023 | 0 | 0 | $0.00 | 0.0% | 2.1% | $0 | 0.0% | 2.0% |
| 2024 | 0 | 0 | $0.00 | 0.0% | 2.1% | $0 | 0.0% | 2.0% |
| 2025 | 1 | 20,713 | $22.35 | 2.1% | 4.1% | $462,893 | 1.8% | 3.7% |
| 2026 | 1 | 21,175 | $24.66 | 2.1% | 6.3% | $522,131 | 2.0% | 5.8% |
| 2027 | 0 | 0 | $0.00 | 0.0% | 6.3% | $0 | 0.0% | 5.8% |
| 2028 | 0 | 0 | $0.00 | 0.0% | 6.3% | $0 | 0.0% | 5.8% |
| 2029 | 0 | 0 | $0.00 | 0.0% | 6.3% | $0 | 0.0% | 5.8% |
| 2030 & Beyond(2) | 1 | 928,879 | $26.40 | 93.0% | 99.3% | $24,521,626 | 94.2% | 100.0% |
| Vacant | 0 | 6,954 | $0.00 | 0.7% | 100.0% | $0 | 0.0% | 100.0% |
| Total/Wtd. Avg. | 6 | 998,284 | $26.25(3) | 100.0% | $26,018,055 | 100.0% | ||
| (1) | Information is based on the underwritten rent roll. |
| (2) | 2030 & Beyond includes non-revenue generated space for the fitness center, conference center and engineering shop. |
| (3) | Wtd. Avg. UW Rent PSF Rolling excludes vacant space. |
The Market. The Newport Corporate Center Property is situated just southeast of the intersection of Interstate 90 and Interstate 405, which provide access to the Seattle central business district (approximately 9.2 miles west of the Newport Corporate Center Property) and the Bellevue central business district (3.7 miles north), respectively. The Newport Corporate Center Property is also within walking distance of five bus stops offering services on nine routes and is situated approximately 14.3 miles from the Seattle-Tacoma International Airport. The Newport Corporate Center is adjacent to the Market Place at Factoria, a Kimco-owned regional shopping center totaling over 500,000 SF with over 60 retail and restaurant outlets.
The Newport Corporate Center Property is located in the Puget Sound area within the I-90 Corridor submarket of the Eastside office market. In 2018, Amazon signed a lease for 413,100 SF in Downtown Bellevue, bringing its total footprint in the submarket to over 1.0 million SF of office space. Amazon has approximately 2,000 employees in Bellevue and plans to add capacity for an additional 4,500 employees by the year 2020. Furthermore, Facebook signed three leases across three buildings totaling approximately 423,000 SF in Downtown Bellevue in 2018. Notable existing office tenants in the Eastside office market include Microsoft, T-Mobile, Nintendo, REI, Google, Facebook, Oculus, Costco, AT&T, and Boeing.
Market Statistics – According to a market research report, as of the fourth quarter of 2018, the Eastside office market reported total inventory of approximately 50.5 million SF with a 4.6% vacancy rate and average asking rent of $37.18 PSF. For the same period, the market reported total Class A inventory of approximately 21.4 million SF with a 5.4% vacancy rate and average asking rent of $43.62 PSF.
Submarket Statistics – According to a market research report, as of the fourth quarter of 2018, the I-90 Corridor office submarket reported total inventory of approximately 6.2 million SF with a 10.1% vacancy rate and average asking rent of $35.22 PSF. For the same period, the submarket reported total Class A inventory of approximately 3.1 million SF with a 15.0% vacancy rate and average asking rent of $36.01 PSF.
The following table presents certain information relating to the appraisal’s market rent conclusion for the Newport Corporate Center Property:
| Market Rent Summary | ||
Office (Single Tenant Buildings) | Office (Tower Space)(1) | |
| Market Rent (PSF) | $29 | $29 |
| Lease Term (Years) | 10 | 5 |
| Lease Type (Reimbursements) | NNN | NNN |
| Rent Increase Projection | $1.00/SFper annum | $1.00/SFper annum |
| (1) | Represents the office space at the Newport Corporate Center Property that is not occupied by T-Mobile. |
This is not a research report and was not prepared by any Underwriter’s research department. Please see additional important information and qualifications at the end of this Term Sheet.
T-62
| Office – Suburban | Loan #4 | Cut-off Date Balance: | $73,800,000 | |
| 3617, 3650 and 3655 131st Avenue Southeast; 3625 132nd Avenue | Newport Corporate Center | Cut-off Date LTV: | 34.5% | |
| Southeast; 12920 Southeast 38th Street | U/W NCF DSCR: | 5.63x | ||
| Bellevue, WA 98006 | U/W NOI Debt Yield: | 20.2% |
The following table presents recent leasing data at comparable office properties with respect to the Newport Corporate Center Property. Initial base rent PSF ranges from $25.50 PSF to $31.50 PSF, with a weighted average initial rent of $27.70 PSF.
Comparable Lease Summary
| |||||||||
| Property/Location | Year Built/ Renovated | Occupancy | Distance from Subject | Tenant | Lease Area (SF) | Lease Date | Initial Rent PSF(1) | Lease Term (Yrs.) | TI PSF |
Newport Corporate Center (subject) Bellevue, WA | 1988-2010/ 2019 | 99.3% | -- | T-Mobile | 919,001 | Various | $26.68 | 12.8 | $70.00 |
Advanta Bellevue, WA | 2008/N/A | 100.0% | 1.7 miles | Microsoft | 601,081 | Jul-18 | $26.00 | 5.0 | $25.00 |
90 North Bellevue, WA | 1983/N/A | 100.0% | 1.6 miles | T-Mobile T-Mobile Mindtree | 70,170 94,169 93,840 | Jun-19 Jun-19 Mar-19 | $28.00 $29.50 $28.00 | 10.5 10.5 10.0 | $90.00 $90.00 $72.00 |
Sunset Corporate Campus Bellevue, WA | 1992/N/A | 72.0% | 0.4 miles | T-Mobile | 89,571 | Oct-18 | $28.00 | 5.5 | $35.00 |
Sunset North – Bldgs. 3, 4, & 5 Bellevue, WA | 1999/N/A | 70.0% | 0.6 miles | Confidential ArenaNet Farmers Insurance | 32,331 96,839 54,000 | Feb-19 Jan-19 Nov-18 | $29.00 $27.00 $27.00 | 7.0 10.0 10.6 | $50.00 $65.00 $70.00 |
3600 136th Place SE Bellevue, WA | 1986/N/A | 100.0% | 0.5 miles | Extraslice | 16,994 | May-19 | $27.00 | 10.5 | $45.00 |
Lincoln Executive Center Bellevue, WA | 1984/N/A | 99.0% | 0.9 miles | Air Reps | 14,873 | May-19 | $25.50 | 9.4 | $40.00 |
Bravern Office Towers and Garage Bellevue, WA | 2009/N/A | 100.0% | 3.0 miles | Microsoft | 255,171 | Feb-18 | $31.50 | 7.0 | $30.00 |
Redmond Town Centre Office Redmond, WA | 1997/N/A | 100.0% | 7.0 miles | Microsoft | 396,228 | Jan-19 | $27.50 | 8.0 | $40.00 |
Source:Appraisal.
| (1) | Initial Rent PSF is shown on a NNN basis. |
This is not a research report and was not prepared by any Underwriter’s research department. Please see additional important information and qualifications at the end of this Term Sheet.
T-63
| Office – Suburban | Loan #4 | Cut-off Date Balance: | $73,800,000 | |
| 3617, 3650 and 3655 131st Avenue Southeast; 3625 132nd Avenue | Newport Corporate Center | Cut-off Date LTV: | 34.5% | |
| Southeast; 12920 Southeast 38th Street | U/W NCF DSCR: | 5.63x | ||
| Bellevue, WA 98006 | U/W NOI Debt Yield: | 20.2% |
Operating History and Underwritten Net Cash Flow.The following table presents certain information relating to the historical operating performance and Underwritten Net Cash Flow at the Newport Corporate Center Property:
Cash Flow Analysis
| |||||
| 2016 | 2017 | 2018(1) | UW(1) | UW PSF | |
| Rents in Place | $21,396,135 | $21,656,883 | $21,408,105 | $26,018,055 | $26.06 |
| Credit Tenant Rent Steps(2) | $0 | $0 | $0 | $6,227,773 | $6.24 |
| Vacant Income | $0 | $0 | $0 | $169,285 | $0.17 |
| Gross Potential Rent | $21,396,135 | $21,656,883 | $21,408,105 | $32,415,113 | $32.47 |
| Reimbursements | $10,261,307 | $10,661,491 | $8,616,154 | $6,774,943 | $6.79 |
| Net Rental Income | $31,657,442 | $32,318,374 | $30,024,259 | $39,190,056 | $39.26 |
| Other Income(3) | $2,622,463 | $2,400,144 | $2,816,656 | $2,687,120 | $2.69 |
| (Vacancy) | $0 | $0 | $0 | ($1,959,503) | ($1.96) |
| Effective Gross Income | $34,279,904 | $34,718,517 | $32,840,915 | $39,917,673 | $39.99 |
| Taxes | $1,839,634 | $2,166,690 | $2,656,780 | $2,920,016 | $2.93 |
| Insurance | $392,799 | $415,287 | $348,923 | $554,198 | $0.56 |
| Other Operating Expenses(4) | $8,227,867 | $7,495,210 | $6,085,853 | $3,301,560 | $3.31 |
| Total Operating Expenses | $10,460,300 | $10,077,187 | $9,091,557 | $6,775,774 | $6.79 |
| Net Operating Income | $23,819,604 | $24,641,331 | $23,749,358 | $33,141,899 | $33.20 |
| CapEx & TI/LC(5) | $0 | $0 | $0 | $0 | $0.00 |
| Net Cash Flow | $23,819,604 | $24,641,331 | $23,749,358 | $33,141,899 | $33.20 |
| NOI DSCR(6) | 4.04x | 4.18x | 4.03x | 5.63x | |
| NCF DSCR(6) | 4.04x | 4.18x | 4.03x | 5.63x | |
| NOI Debt Yield(6) | 14.5% | 15.0% | 14.5% | 20.2% | |
| NCF Debt Yield(6) | 14.5% | 15.0% | 14.5% | 20.2% | |
| (1) | The increase in Gross Potential Rent and Net Operating Income from 2018 to UW is primarily due to free rent periods for T-Mobile that occurred in 2018, underwritten Credit Tenant Rent Steps for T-Mobile and T-Mobile’s assumption of certain expenses at the Newport Corporate Center Property (as further outlined in footnote 4 below). |
| (2) | Credit Tenant Rent Steps includes straight line rent credit through the loan term for T-Mobile (see“Tenant Summary” table above). |
| (3) | Other Income primarily consists of parking income and miscellaneous income. |
| (4) | UW Other Operating Expenses are less than historical expenses because, for the single tenant buildings occupied by T-Mobile, T-Mobile assumed responsibility for these expenses and contracts directly for janitorial, landscaping, parking area and sidewalk maintenance, parking control, HVAC maintenance, elevator maintenance, building maintenance, security, pest control, alarm service, access control, window cleaning, sky bridge maintenance, loading docks and directional and traffic control signage. |
| (5) | The Newport Corporate Center Borrower deposited $1.675 million into the General CapEx and TI/LC upfront reserve. |
| (6) | The debt service coverage ratios and debt yields shown are based on the Newport Corporate Center Senior Loan, and excludes the Newport Corporate Center Subordinate Companion Loan. |
Escrows and Reserves.
Real Estate Taxes - The Newport Corporate Center Whole Loan documents do not require ongoing monthly escrows for real estate taxes as long as no Trigger Period (as defined in the “Lockbox and Cash Management” section below) exists. Upon the occurrence and continuance of a Trigger Period, the Newport Corporate Center Borrower is required to deposit ongoing monthly deposits in an amount equal to one-twelfth of the estimated annual taxes.
Insurance - The Newport Corporate Center Whole Loan documents do not require ongoing monthly escrows for insurance premiums as long as (i) no event of default has occurred and is continuing and (ii) the Newport Corporate Center Borrower or an affiliate provides the lender with evidence that the Newport Corporate Center Property’s insurance coverage is included in a blanket policy and such policy is in effect.
Replacement Reserve - The Newport Corporate Center Borrower is required to deposit ongoing monthly escrows in an amount equal to approximately $12,479, subject to a cap of $149,743.
General CapEx and TI/LC Reserve - The Newport Corporate Center Borrower is required to deposit an upfront reserve of $1,675,000 for general capital expenditures and/or tenant improvements and leasing commissions.
T-Mobile TI/LC Reserve - The Newport Corporate Center Borrower is required to deposit an upfront reserve of $60,072,224 for certain outstanding tenant improvement and leasing obligations related to T-Mobile.
T-Mobile CapEx Reserve - The Newport Corporate Center Borrower is required to deposit an upfront reserve of $5,357,554 for outstanding capital expenditures related to T-Mobile.
Rent Concession Reserve - The Newport Corporate Center Borrower is required to deposit an upfront reserve of $21,807,139 for certain outstanding free rent obligations related to T-Mobile.
This is not a research report and was not prepared by any Underwriter’s research department. Please see additional important information and qualifications at the end of this Term Sheet.
T-64
| Office – Suburban | Loan #4 | Cut-off Date Balance: | $73,800,000 | |
| 3617, 3650 and 3655 131st Avenue Southeast; 3625 132nd Avenue | Newport Corporate Center | Cut-off Date LTV: | 34.5% | |
| Southeast; 12920 Southeast 38th Street | U/W NCF DSCR: | 5.63x | ||
| Bellevue, WA 98006 | U/W NOI Debt Yield: | 20.2% |
Lockbox and Cash Management. The Newport Corporate Center Whole Loan is structured with a hard lockbox and springing cash management. The Newport Corporate Center Borrower is required to direct all tenants to deposit rents directly into the clearing account controlled by the lender. The loan documents also require that all rents received by the Newport Corporate Center Borrower or the property manager be deposited into the clearing account within two business days of receipt. If no Trigger Period (as defined below) exists, all funds in the clearing account will be swept on each business day into the Newport Corporate Center Borrower’s operating account. Upon the occurrence and continuance of a Trigger Period, all funds will be swept on each business day into a deposit account controlled by the lender. During a Trigger Period, funds in the deposit account will be applied and disbursed in accordance with the Newport Corporate Center Whole Loan documents, and all excess cash after payment of the monthly debt service on the Newport Corporate Center Whole Loan, all required reserves and budgeted operating expenses, and certain other items in the waterfall described in the Newport Corporate Center Whole Loan documents will be reserved as additional collateral for the Newport Corporate Center Whole Loan. Under certain circumstances and for limited purposes described in the Newport Corporate Center Whole Loan documents, the Newport Corporate Center Borrower may request disbursements of such excess cash flow for approved leasing expenses related to Lease Sweep Tenant space.
A “Trigger Period” will commence upon the earlier of the following:
| (i) | the occurrence of an event of default; |
| (ii) | the net cash flow debt service coverage ratio (“NCF DSCR”) of the Newport Corporate Center Whole Loan (inclusive of the Newport Corporate Center Subordinate Companion Loan) falling below 1.15x at the end of any calendar quarter; |
| (iii) | the occurrence of a Lease Sweep Period (as defined below); or |
| (iv) | the Anticipated Repayment Date. |
A Trigger Period will end upon the occurrence of the following:
| ● | with regard to clause (i), the cure of such event of default; |
| ● | with regard to clause (ii), upon the NCF DSCR of the Newport Corporate Center Whole Loan (inclusive of the Newport Corporate Center Subordinate Companion Loan) being equal to or greater than 1.20x for two consecutive calendar quarters; |
| ● | with regard to clause (iii), such Lease Sweep Period has ended pursuant to the terms of the Newport Corporate Center Whole Loan documents; and |
| ● | with regard to clause (iv), the Newport Corporate Center Whole Loan being repaid in full in accordance with the Newport Corporate Center Whole Loan documents. |
A “Lease Sweep Period” will commence upon the earlier of the following:
| ● | (a) the earlier of (i) October 6, 2028 or (ii) the date by which the Lease Sweep Tenant is required under the Lease Sweep Lease (as defined below) to give notice of its exercise of a renewal option thereunder (the T-Mobile lease currently requires notice by October 31, 2029); |
| ● | (b) the early termination, early cancellation or early surrender of a Lease Sweep Lease or the borrower’s receipt of notice by a Lease Sweep Tenant of its intent to effect an early termination, early cancellation or early surrender of its Lease Sweep Lease; |
| ● | (c) a Lease Sweep Tenant ceasing to operate its business at the Newport Corporate Center Property (i.e., “going dark”) or giving notice that it intends to cease to operate its business in all or substantially all of its space; |
| ● | (d) a monetary or material non-monetary default under a Lease Sweep Lease by a Lease Sweep Tenant beyond any applicable notice and cure period; |
| ● | (e) an insolvency proceeding of a Lease Sweep Tenant or its parent if such parent provides a guaranty or similar credit support for such tenant’s obligations, and their respective successors and assigns; or |
| ● | (f) a decline in the credit rating of the Lease Sweep Tenant under a Lease Sweep Lease, its parent entity or any of their respective successors below “CCC+” or equivalent by any rating agency. |
A Lease Sweep Period will end upon the occurrence of the following:
| ● | (i) with respect to clauses (a), (b) and (c) above, upon some or all of the lease sweep space being leased pursuant to one or more qualified leases sufficient in lender’s reasonable judgment to achieve a net cash flow debt yield of not less than 8.0% based on the Newport Corporate Center Whole Loan (inclusive of the Newport Corporate Center Subordinate Companion Loan) (excluding from underwritten net cash flow the rent from each Lease Sweep Lease which is the subject of a Lease Sweep Period); |
| ● | (ii) with respect to clause (a) above, on the date on which the Lease Sweep Tenant exercises its renewal or extension option with respect to all of its lease sweep space and in lender’s reasonable judgment sufficient funds are held in the lease sweep account to cover leasing expenses and abatements; |
| ● | (iii) with respect to clause (d) above, on the date on which the subject default has been cured and no other default under such Lease Sweep Lease occurs for a period of two consecutive months following such cure; |
| ● | (iv) with respect to clause (e) above, upon either the applicable insolvency proceeding having terminated or the Lease Sweep Lease having been assumed, affirmed, or assigned to a third party in a manner reasonably satisfactory to the lender (provided, however, the Lease Sweep Period will automatically end if the applicable Lease Sweep Lease that was the subject of an applicable insolvency proceeding is affirmed in bankruptcy); or |
| ● | (v) with respect to clause (f) above, if the credit rating of the Lease Sweep Tenant under a Lease Sweep Lease (or its parent entity) has been restored to at least “CCC+” or equivalent by the relevant rating agencies. |
A “Lease Sweep Lease” means the lease with T-Mobile or any replacement lease covering 50% of the space currently demised under such lease.
A “Lease Sweep Tenant” means any tenant under a Lease Sweep Lease or its direct or indirect parent company (if any).
This is not a research report and was not prepared by any Underwriter’s research department. Please see additional important information and qualifications at the end of this Term Sheet.
T-65
| Office – Suburban | Loan #4 | Cut-off Date Balance: | $73,800,000 | |
| 3617, 3650 and 3655 131st Avenue Southeast; 3625 132nd Avenue | Newport Corporate Center | Cut-off Date LTV: | 34.5% | |
| Southeast; 12920 Southeast 38th Street | U/W NCF DSCR: | 5.63x | ||
| Bellevue, WA 98006 | U/W NOI Debt Yield: | 20.2% |
Additional Secured Indebtedness (not including trade debts). The Newport Corporate Center Property also secures the Newport Corporate CenterPari PassuCompanion Loans, which have an aggregate Cut-off Date principal balance of $90,200,000, and the Newport Corporate Center Subordinate Companion Loan, which has a Cut-off Date principal balance of $148,000,000. The Newport Corporate CenterPari PassuCompanion Loans and the Newport Corporate Center Subordinate Companion Loan are coterminous with the Newport Corporate Center Mortgage Loan. The Newport Corporate CenterPari PassuCompanion Loans accrue interest at the same rate as the Newport Corporate Center Mortgage Loan. The Newport Corporate Center Subordinate Companion Loan comprises (i) $18.0 million of B Notes which accrue interest at an initial interest rate of 4.6250%per annum, (ii) $74.0 million of C Notes which accrue interest at an initial interest rate of 4.9500%per annum, and (iii) $56.0 million of D Notes which accrue interest at an initial interest rate of 6.5000%per annum.
The Newport Corporate Center Mortgage Loan and the Newport Corporate CenterPari PassuCompanion Loans arepari passuin right of payment with each other and together are senior in right of payment to the Newport Corporate Center Subordinate Companion Loan. The holders of the Newport Corporate Center Mortgage Loan, the Newport Corporate CenterPari PassuCompanion Loans and the Newport Corporate Center Subordinate Companion Loan have entered into a co-lender agreement which sets forth the allocation of collections on the Newport Corporate Center Whole Loan. See “Description of the Mortgage Pool—The Whole Loans—The Newport Corporate Center A/B Whole Loan” in the Preliminary Prospectus. The Newport Corporate Center Subordinate Companion Loan is expected to be sold to a third party purchaser.
The following table presents certain information relating to the Newport Corporate Center Subordinate Companion Loan:
| Subordinate Companion Loan Summary | ||||||||
Subordinate Note Original Principal Balance | Subordinate Note Interest Rate | Original Term (mos.) | Original Amort. Term (mos.) | Original IO Term (mos.) | Total Debt UW NCF DSCR | Total Debt UW NOI Debt Yield | Total Debt Cutoff Date LTV | |
| B Notes | $18,000,000 | 4.6250% | 120 | 0 | 120 | 4.92x | 18.2% | 38.2% |
| C Notes | $74,000,000 | 4.9500% | 120 | 0 | 120 | 3.17x | 12.9% | 53.8% |
| D Notes | $56,000,000 | 6.5000% | 120 | 0 | 120 | 2.34x | 10.6% | 65.5% |
Preferred Equity. Square Mile Bellevue Preferred LLC, a Delaware limited liability company (the “Newport Corporate Center Preferred Equity Holder”), has made a $96,000,000 preferred equity investment in the Newport Corporate Center Borrower’s sole member, which equates to an indirect 56.74% preferred equity interest in the Newport Corporate Center Borrower. The rights of the Newport Corporate Center Preferred Equity Holder are governed by a certain Recognition Agreement, dated as of April 10, 2019 by and among Deutsche Bank AG, New York Branch, Wells Fargo Bank, National Association, the Newport Corporate Center Preferred Equity Holder, Square Mile PE Partners LP and Square Mile PE Partners A LP. The preferred equity return (based on a preferred rate of 10.25%) is required to be paid currently on a monthly basis (and it is a default and trigger event under the operating agreement of the Newport Corporate Center Borrower’s sole member (the “Holdco Organizational Agreement”) if payments are not made currently). However, in the event that property revenue less property expenses (including debt service) is insufficient to make a payment of the monthly current preferred return, any such unpaid monthly current preferred return will accrue and will be deemed added to the preferred equity investment, such that monthly current preferred return will be payable upon such accrued and unpaid amounts. In the event that the aggregate accrued and unpaid monthly current preferred return (inclusive of amounts that are deemed added to the preferred equity investment) exceeds $10,000,000, the same will constitute a default and trigger event under the Holdco Organizational Agreement.
The Newport Corporate Center Preferred Equity Holder may receive distributions of excess cash flow pursuant to the terms of the Holdco Organizational Agreement and solely with respect to excess net proceeds remitted to the Newport Corporate Center Borrower in accordance with the loan agreement for the Newport Corporate Center Whole Loan and pursuant to the terms of the Holdco Organizational Agreement. The Holdco Organizational Agreement contains certain rights of the Newport Corporate Center Preferred Equity Holder upon a trigger event or material default under the Holdco Organizational Agreement.
Release of Property. Not permitted.
Ground Lease.None
Right of First Refusal. None.
Letter of Credit. None.
Terrorism Insurance.The Newport Corporate Center Borrower is required to obtain and maintain property insurance that covers perils of terrorism and acts of terrorism in an amount equal to 100% of the full replacement cost of the Newport Corporate Center Property and business interruption insurance for 24-months with a 12-month extended period of indemnity. See “Risk Factors—Risks Relating to the Mortgage Loans—Terrorism Insurance May Not Be Available for All Mortgaged Properties” in the Preliminary Prospectus.
Earthquake Insurance.The Newport Corporate Center Whole Loan documents do not require earthquake insurance; however, at the time of loan origination, earthquake insurance coverage is in-place. The seismic report indicated a probable maximum loss of 10.0% for the Newport Corporate Center Property.
This is not a research report and was not prepared by any Underwriter’s research department. Please see additional important information and qualifications at the end of this Term Sheet.
T-66
(THIS PAGE INTENTIONALLY LEFT BLANK)
T-67
| Office - Medical | Loan #5 | Cut-off Date Balance: | $70,000,000 | |
| 9201 West Sunset Boulevard | 9201 West Sunset Boulevard | Cut-off Date LTV: | 64.6% | |
| West Hollywood, CA 90069 | U/W NCF DSCR: | 1.87x | ||
| U/W NOI Debt Yield: | 8.7% |
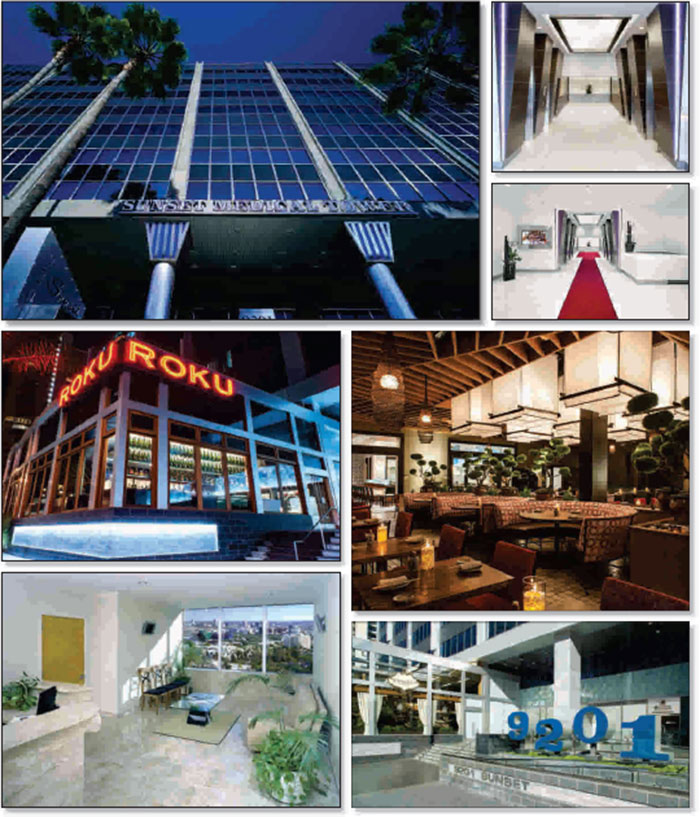
This is not a research report and was not prepared by any Underwriter’s research department. Please see additional important information and qualifications at the end of this Term Sheet.
T-68
| Office - Medical | Loan #5 | Cut-off Date Balance: | $70,000,000 | |
| 9201 West Sunset Boulevard | 9201 West Sunset Boulevard | Cut-off Date LTV: | 64.6% | |
| West Hollywood, CA 90069 | U/W NCF DSCR: | 1.87x | ||
| U/W NOI Debt Yield: | 8.7% |
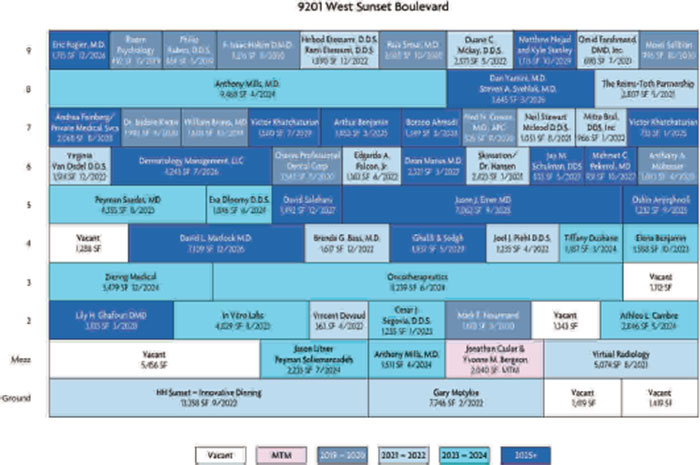
This is not a research report and was not prepared by any Underwriter’s research department. Please see additional important information and qualifications at the end of this Term Sheet.
T-69
| Office - Medical | Loan #5 | Cut-off Date Balance: | $70,000,000 | |
| 9201 West Sunset Boulevard | 9201 West Sunset Boulevard | Cut-off Date LTV: | 64.6% | |
| West Hollywood, CA 90069 | U/W NCF DSCR: | 1.87x | ||
| U/W NOI Debt Yield: | 8.7% |
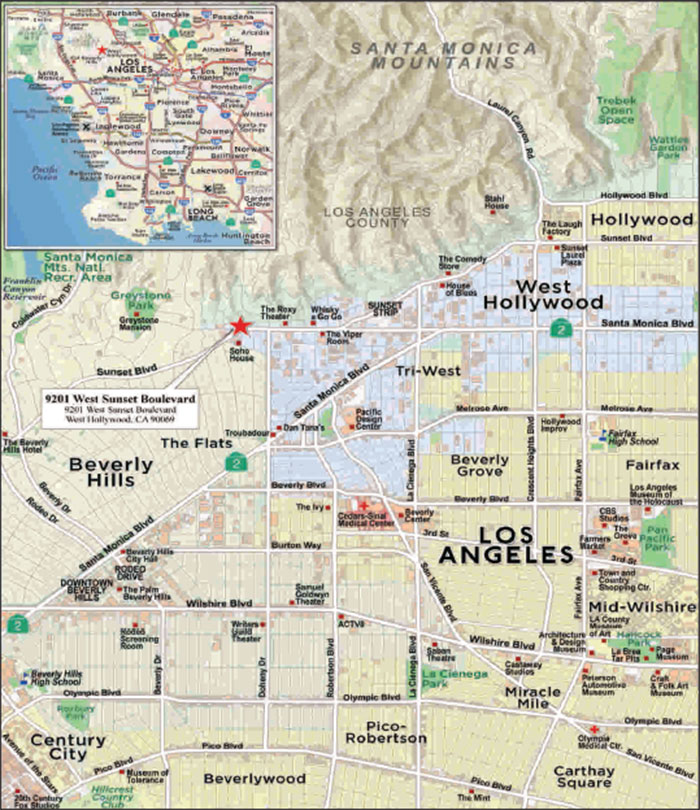
This is not a research report and was not prepared by any Underwriter’s research department. Please see additional important information and qualifications at the end of this Term Sheet.
T-70
| Office - Medical | Loan #5 | Cut-off Date Balance: | $70,000,000 | |
| 9201 West Sunset Boulevard | 9201 West Sunset Boulevard | Cut-off Date LTV: | 64.6% | |
| West Hollywood, CA 90069 | U/W NCF DSCR: | 1.87x | ||
| U/W NOI Debt Yield: | 8.7% |
| Mortgage Loan No. 5 – 9201 West Sunset Boulevard |
| Mortgage Loan Information | Property Information | ||||||
| Mortgage Loan Seller: | MSMCH | Single Asset/Portfolio: | Single Asset | ||||
| Credit Assessment (Fitch/KBRA/Moody’s): | NR/NR/NR | Location: | West Hollywood, CA 90069 | ||||
| Original Balance(1): | $70,000,000 | General Property Type: | Office | ||||
| Cut-off Date Balance(1): | $70,000,000 | Detailed Property Type: | Medical | ||||
| % of Initial Pool Balance: | 6.7% | Title Vesting: | Fee | ||||
| Loan Purpose: | Refinance | Year Built/Renovated: | 1963/2012 | ||||
| Sponsor: | Mani Brothers Real Estate Group | Size: | 166,599 SF | ||||
| Guarantors: | The Daniel Mani Family Trust; | Cut-off Date Balance per SF(1): | $810 | ||||
| The Simon Mani Family Trust; | Maturity Date Balance per SF(1): | $810 | |||||
| Daniel Mani; Simon Mani | Property Manager: | Mani Brothers, LLC | |||||
| Mortgage Rate: | 4.4450% | (borrower-related) | |||||
| Note Date: | 4/17/2019 | ||||||
| First Payment Date: | 6/5/2019 | ||||||
| Maturity Date: | 5/1/2029 | ||||||
| Original Term to Maturity: | 120 months | Underwriting and Financial Information | |||||
| Original Amortization Term: | 0 months | UW NOI: | $11,699,279 | ||||
| IO Period: | 120 months | UW NOI Debt Yield(1): | 8.7% | ||||
| Seasoning: | 0 months | UW NOI Debt Yield at Maturity(1): | 8.7% | ||||
| Prepayment Provisions(2): | LO (24); DEF (92); O (4) | UW NCF DSCR(1): | 1.87x | ||||
| Lockbox/Cash Mgmt Status: | Springing/Springing | Most Recent NOI: | $10,925,948 (12/31/2018) | ||||
| Additional Debt Type(1)(3): | Pari Passu | 2nd Most Recent NOI: | $9,814,705 (12/31/2017) | ||||
| Additional Debt Balance(1)(3): | $65,000,000 | 3rd Most Recent NOI: | $9,286,672 (12/31/2016) | ||||
| Future Debt Permitted (Type): | No (N/A) | Most Recent Occupancy: | 92.8% (3/31/2019) | ||||
| Reserves | 2nd Most Recent Occupancy: | 91.4% (12/31/2018) | |||||
| Type | Initial | Monthly | Cap | 3rd Most Recent Occupancy: | 90.0% (12/31/2017) | ||
| RE Tax: | $206,965 | $41,393 | N/A | Appraised Value (as of): | $209,000,000 (2/12/2019) | ||
| Insurance: | $0 | Springing | N/A | Appraised Value per SF: | $1,255 | ||
| Recurring Replacements: | $0 | $2,947 | N/A | Cut-off Date LTV Ratio(1): | 64.6% | ||
| TI/LC: | $1,500,000 | Springing | $1,000,000 | Maturity Date LTV Ratio(1): | 64.6% | ||
| Sources and Uses | ||||||
| Sources | Proceeds | % of Total | Uses | Proceeds | % of Total | |
| Whole Loan Amount(1): | $135,000,000 | 100.0% | Loan Payoff: | $73,699,450 | 54.6% | |
| Return of Equity: | $58,621,078 | 43.4% | ||||
| Reserves: | $1,706,965 | 1.3% | ||||
| Closing Costs: | $972,507 | 0.7% | ||||
| Total Sources: | $135,000,000 | 100.0% | Total Uses: | $135,000,000 | 100.0% | |
| (1) | The Cut-off Date Balance per SF, Maturity Date Balance per SF, UW NOI Debt Yield, UW NOI Debt Yield at Maturity, UW NCF DSCR, Cut-off Date LTV Ratio and Maturity Date LTV Ratio numbers presented above are based on the aggregate principal balance of the promissory notes comprising the 9201 West Sunset Boulevard Whole Loan (as defined below).. |
| (2) | Defeasance of the 9201 West Sunset Boulevard Whole Loan is permitted at any time after the earlier of (i) November 1, 2022, or (ii) two years from the closing date of the securitization that includes the lastpari passunote of the 9201 West Sunset Boulevard Whole Loan to be securitized. The assumed lockout period of 24 payments is based on the closing date of this transaction in May 2019. |
| (3) | See “The Mortgage Loan”and“Additional Secured Indebtedness (not including trade debts)” below for further discussion of additional debt. |
The Mortgage Loan. The fifth largest mortgage loan (the “9201 West Sunset Boulevard Mortgage Loan”) is part of a whole loan (the “9201 West Sunset Boulevard Whole Loan”) evidenced by twopari passupromissory notes in the aggregate original principal amount of $135,000,000, both of which are secured by a first priority fee mortgage encumbering a medical office property located in West Hollywood, California (the “9201 West Sunset Boulevard Property”). Promissory Note A-1, in the original principal amount of $70,000,000, represents the 9201 West Sunset Boulevard Mortgage Loan and will be included in the BANK 2019-BNK18 securitization trust. Promissory Note A-2, in the original principal amount of $65,000,000 (the “9201 West Sunset Boulevard ServicedPari Passu Companion Loan”), represents the non-controlling interest in the 9201 West Sunset Boulevard Whole Loan and is expected to be contributed to one or more securitization transactions. The 9201 West Sunset Boulevard Whole Loan will be serviced pursuant to the pooling and servicing agreement for the BANK 2019-BNK18 securitization trust. See “Description of the Mortgage Pool—The Whole Loans—The Serviced Pari Passu Whole Loans” and “Pooling and Servicing Agreement” in the Preliminary Prospectus.
This is not a research report and was not prepared by any Underwriter’s research department. Please see additional important information and qualifications at the end of this Term Sheet.
T-71
| Office - Medical | Loan #5 | Cut-off Date Balance: | $70,000,000 | |
| 9201 West Sunset Boulevard | 9201 West Sunset Boulevard | Cut-off Date LTV: | 64.6% | |
| West Hollywood, CA 90069 | U/W NCF DSCR: | 1.87x | ||
| U/W NOI Debt Yield: | 8.7% |
| 9201 West Sunset Boulevard Whole Loan Summary | |||||
| Note | Original Balance | Cut-off Date Balance | Note Holder | Lead Servicing Interest | |
| A-1 | $70,000,000 | $70,000,000 | BANK 2019-BNK18 | Yes | |
| A-2 | $65,000,000 | $65,000,000 | MSBNA | No | |
| Total | $135,000,000 | $135,000,000 | |||
The Borrower and the Borrower Sponsor.The borrower is Mani Brothers Sunset Medical Tower (DE), LLC (the “9201 West Sunset Boulevard Borrower”), a single-purpose Delaware limited liability company with one independent director. The borrower sponsor is Mani Brothers Real Estate Group and the non-recourse carveout guarantors are The Daniel Mani Family Trust, The Simon Mani Family Trust, Daniel Mani and Simon Mani. The 9201 West Sunset Boulevard Borrower is owned by The Daniel Mani Family Trust (50.0%) and The Simon Mani Family Trust (50.0%). Daniel Mani and Simon Mani foundedMani Brothers Real Estate Investment Group, aprivately-held real estate investment firm that owns, renovates, operates, manages and leases 1.3 million SF of commercial property.
The Property.The 9201 West Sunset Boulevard Property is a Class A, nine-story medical office property totaling 166,599 SF with ground floor retail, on an approximately 1.87 acre site in West Hollywood, California. The 9201 West Sunset Boulevard Property was built in 1963 and renovated in 2012. Amenities at the 9201 West Sunset Boulevard Property include air conditioning, security systems with video surveillance and tenant access key cards, energy-efficient designs and restaurants. There is on-site tenant and visitor parking, on-site storage and cable and satellite television is available in all offices. The 9201 West Sunset Boulevard Property is in close proximity to Beverly Hills and Cedars-Sinai Medical Center and is easily accessible from Sunset Boulevard. The 9201 West Sunset Boulevard Property contains approximately 507 parking spaces (3.0 spaces per 1,000 SF) in a three story parking structure that is open to the general public. Retail space at the 9201 West Sunset Boulevard Property includes the Roku Restaurant and two vacant units totaling 16,096 SF (9.7% of NRA). The 9201 West Sunset Boulevard Property includes a completely finished mezzanine area located above grade that is built-out with office suites and common area finishes comparable to other upper floors in the building. The 9201 West Sunset Boulevard Property also generates significant income from a wall mural (billboard) leased through November 2022. The 9201 West Sunset Boulevard Property was 92.8% leased as of March 31, 2019 to 55 tenants. Since 2017, eight new leases totaling 18,726 SF (11.2% of NRA) were executed at the 9201 West Sunset Boulevard Property.
Major Tenants.
HH Sunset – Innovative Dining (13,258 SF, 8.0% of NRA, 6.2% of underwritten rent).HH Sunset – Innovative Dining leases 13,258 SF at the 9201 West Sunset Boulevard Property, 4,640 SF of which is a Chinese restaurant and the remaining 8,618 SF is an Italian restaurant. HH Sunset – Innovative Dining has been a tenant at the 9201 West Sunset Boulevard Property since 2012, has a lease expiration date of September 30, 2022 and has two, five-year renewal options remaining.
Oncotherapeutics (11,239 SF, 6.7% of NRA, 6.5% of underwritten rent). Oncotherapeuticsoffers a service portfolio that supports preclinical studies and clinical trials.Oncotherapeuticsprovides deliverables to clients ranging from small start-up biotechs (16-50 employees) to large biotech and pharmaceutical companies (10,000+ employees). Oncotherapeutics has been a tenant at the 9201 West Sunset Boulevard Property since 2004, has a lease expiration date of June 30, 2024 and has two, five-year renewal options remaining.
Anthony Mills, M.D. (10,979 SF, 6.6% of NRA, 7.2% of underwritten rent).Anthony Mills, M.D. is a holistic healthcare practice that focuses on nutrition, exercise and wellness. Anthony Mills, M.D. has been a tenant at the 9201 West Sunset Boulevard Property since 2001 and has extended its original term of seven years to 22 years and seven months. Anthony Mills, M.D. has a lease expiration date of April 30, 2024 and two, five-year renewal options remaining.
The following table presents certain information relating to the major tenants at the 9201 West Sunset Boulevard Property:
| Tenant Summary(1) | ||||||||
| Tenant Name | Credit Rating (Fitch/Moody’s/S&P) | Tenant SF | Approx. % of SF | Annual UW Rent | % of Total Annual UW Rent | Annual UW Rent PSF(2) | Lease Expiration | Termination Option (Y/N) |
| HH Sunset - Innovative Dining | NR/NR/NR | 13,258 | 8.0% | $643,155 | 6.2% | $48.51 | 9/30/2022 | N |
| Oncotherapeutics | NR/NR/NR | 11,239 | 6.7% | $670,934 | 6.5% | $59.70 | 6/30/2024 | N |
| Anthony Mills, M.D. | NR/NR/NR | 10,979 | 6.6% | $748,596 | 7.2% | $68.18 | 4/30/2024 | N |
| Gary Motykie | NR/NR/NR | 7,746 | 4.6% | $603,181 | 5.8% | $77.87 | 2/28/2022 | N |
| David L. Matlock M.D | NR/NR/NR | 7,109 | 4.3% | $501,270 | 4.8% | $70.51 | 12/31/2026 | N |
| Subtotal/Wtd. Avg. | 50,331 | 30.2% | $3,167,136 | 30.5% | $62.93 | |||
| Other Tenants | 104,231 | 62.6% | $7,216,996 | 69.5% | $69.24 | |||
| Vacant Space | 12,037 | 7.2% | $0 | 0.0% | $0.00 | |||
| Total/Wtd. Avg. | 166,599 | 100.0% | $10,384,132 | 100.0% | $67.18 | |||
| (1) | Information is based on the underwritten rent roll as of March 31, 2019. |
| (2) | Total/Wtd. Avg. Annual UW Rent PSF excludes vacant space. |
This is not a research report and was not prepared by any Underwriter’s research department. Please see additional important information and qualifications at the end of this Term Sheet.
T-72
| Office - Medical | Loan #5 | Cut-off Date Balance: | $70,000,000 | |
| 9201 West Sunset Boulevard | 9201 West Sunset Boulevard | Cut-off Date LTV: | 64.6% | |
| West Hollywood, CA 90069 | U/W NCF DSCR: | 1.87x | ||
| U/W NOI Debt Yield: | 8.7% |
The following table presents certain information relating to the lease rollover schedule at the 9201 West Sunset Boulevard Property:
| Lease Rollover Schedule(1)(2) | ||||||||
| Year | # of Leases Rolling | SF Rolling | UW Rent PSF Rolling(3) | Approx. % of Total SF Rolling | Approx. Cumulative % of SF Rolling | Total UW Rent Rolling | Approx. % of Total Rent Rolling | Approx. Cumulative % of Total Rent Rolling |
| MTM | 1 | 2,040 | $46.73 | 1.2% | 1.2% | $95,325 | 0.9% | 0.9% |
| 2019 | 3 | 2,959 | $73.75 | 1.8% | 3.0% | $218,239 | 2.1% | 3.0% |
| 2020 | 8 | 12,952 | $76.99 | 7.8% | 10.8% | $997,114 | 9.6% | 12.6% |
| 2021 | 5 | 12,053 | $64.67 | 7.2% | 18.0% | $779,415 | 7.5% | 20.1% |
| 2022 | 10 | 32,323 | $62.44 | 19.4% | 37.4% | $2,018,381 | 19.4% | 39.6% |
| 2023 | 4 | 12,027 | $72.83 | 7.2% | 44.6% | $875,872 | 8.4% | 48.0% |
| 2024 | 7 | 33,809 | $64.72 | 20.3% | 64.9% | $2,187,973 | 21.1% | 69.1% |
| 2025 | 3 | 5,818 | $70.47 | 3.5% | 68.4% | $410,005 | 3.9% | 73.0% |
| 2026 | 4 | 16,712 | $68.78 | 10.0% | 78.4% | $1,149,383 | 11.1% | 84.1% |
| 2027 | 4 | 5,577 | $70.02 | 3.3% | 81.8% | $390,501 | 3.8% | 87.8% |
| 2028 | 4 | 13,662 | $67.84 | 8.2% | 90.0% | $926,769 | 8.9% | 96.8% |
| 2029 | 3 | 4,630 | $72.39 | 2.8% | 92.8% | $335,154 | 3.2% | 100.0% |
| 2030 & Beyond | 0 | 0 | $0.00 | 0.0% | 92.8% | $0 | 0.0% | 100.0% |
| Vacant Space | 0 | 12,037 | $0.00 | 7.2% | 100.0% | $0 | 0.0% | 100.0% |
| Total/Wtd. Avg. | 56 | 166,599 | $67.18 | 100.0% | $10,384,132 | 100.0% | ||
| (1) | Information is based on the underwritten rent roll as of March 31, 2019. |
| (2) | Certain tenants may have lease termination options that are exercisable prior to the stated expiration date of the subject lease or leases that are not considered in the lease rollover schedule. |
| (3) | Total/Wtd. Avg. UW Rent PSF Rolling excludes vacant space. |
The Market. The 9201 West Sunset Boulevard Property is located in West Hollywood, California, in Los Angeles County, approximately five miles west of downtown Los Angeles. The 9201 West Sunset Boulevard Property is located along a portion of Sunset Boulevard known as the Sunset Strip. This area is an active urban destination offering a range of boutiques, nightclubs, restaurants, hotels, and other entertainment venues that draw visitors from surrounding communities and tourists from around the world. The 9201 West Sunset Boulevard Property is located in the Santa Monica Mountains submarket of the Los Angeles office market. According to a third party market report, as of the fourth quarter of 2018, the vacancy rate in the Santa Monica Mountains submarket was approximately 13.5%, with average asking rents of $56.17 PSF and inventory of approximately 895,866 SF. According to a third party market report, as of the fourth quarter of 2018, the vacancy rate in the Los Angeles office market was approximately 9.9%, with average asking rents of $39.12 PSF and inventory of approximately 417 million SF.
According to the appraisal, the 2018 population within a one-, three- and five-mile radius of the 9201 West Sunset Boulevard Property was 19,030, 209,964 and 693,354, respectively. The 2018 average household income within the same one-, three- and five-mile radius was $149,470, $136,175 and $119,546, respectively.
The following table presents certain information relating to the appraiser’s market rent conclusion for the 9201 West Sunset Boulevard Property:
| Market Rent Summary | |||
| Medical | Mezzanine | Retail | |
| Market Rent (PSF) | $67.80 | $49.80 | $51.00 |
| Lease Term (Years) | 10 | 5 | 5 |
| Lease Type (Reimbursements) | Full service gross | Full service gross | NNN |
| Rent Increase Projection | 3.0%per annum | 3.0%per annum | 3.0%per annum |
This is not a research report and was not prepared by any Underwriter’s research department. Please see additional important information and qualifications at the end of this Term Sheet.
T-73
| Office - Medical | Loan #5 | Cut-off Date Balance: | $70,000,000 | |
| 9201 West Sunset Boulevard | 9201 West Sunset Boulevard | Cut-off Date LTV: | 64.6% | |
| West Hollywood, CA 90069 | U/W NCF DSCR: | 1.87x | ||
| U/W NOI Debt Yield: | 8.7% |
The following table presents comparable office leases with respect to the 9201 West Sunset Boulevard Property:
| Comparable Office Lease Summary | ||||||||
| Property/Location | Year Built | SF | Tenant Name | Lease Date | Lease Term (Mos.) | Rent PSF | Lease Type | |
| Size (SF) | ||||||||
Parkside Medical Center Santa Monica, CA | 1923 | 65,610 | Rapid Smile | 1,574 | July 2018 | 84 | $54.00 | Full Service |
2825 Santa Monica Santa Monica, CA | 1984 | 52,676 | Santa Monica Fertility | 7,604 | March 2017 | 60 | $61.20 | Mod. Gross |
| Medical Center of Santa Monica Santa Monica, CA | 1965 | 204,312 | Medical Tenant Medical Tenant | 1,462 1,014 | May 2017 Sept. 2015 | 120 60 | $61.20 $55.80 | Full Service Full Service |
Santa Monica Medical Plaza Santa Monica, CA | 1973 | 87,386 | Confidential | 1,300 | Aug. 2017 | 120 | $69.00 | Full Service |
Rox-San Medical Plaza Beverly Hills, CA | 1963 | 55,545 | Medical Tenant | 3,500 | March 2016 | 37 | $75.00 | Full Service |
Wilshire Linden Medical Beverly Hills, CA | 1958 | 72,800 | Medical Tenant | 1,500 | March 2017 | 60 | $69.00 | Full Service |
Roxbury Medical Building Beverly Hills, CA | 1952 | 37,924 | Medical Tenant | 1,158 | June 2017 | 60 | $60.00 | NNN |
Source:Appraisal.
Operating History and Underwritten Net Cash Flow. The following table presents certain information relating to the operating history and Underwritten Net Cash Flow at the 9201 West Sunset Boulevard Property:
| Cash Flow Analysis | |||||
| 2016 | 2017 | 2018 | UW | UW PSF | |
| Base Rent(1) | $9,272,739 | $9,781,200 | $10,323,694 | $10,705,926 | $64.26 |
| Total Recoveries | $264,687 | $201,603 | $273,209 | $273,209 | $1.64 |
| Discounts Concessions | ($206,798) | ($223,897) | ($242,369) | $0 | $0.00 |
| Other Income(2) | $3,461,852 | $3,503,433 | $4,036,562 | $4,036,562 | $24.23 |
| Less Vacancy & Credit Loss | $0 | $0 | $0 | $0 | $0.00 |
| Effective Gross Income | $12,792,481 | $13,262,339 | $14,391,096 | $15,015,696 | $90.13 |
| Real Estate Taxes | $787,559 | $631,892 | $644,872 | $644,872 | $3.87 |
| Insurance | $47,832 | $46,594 | $39,206 | $39,206 | $0.24 |
| Other Expenses | $2,670,419 | $2,769,148 | $2,781,069 | $2,632,339 | $15.80 |
| Total Expenses | $3,505,810 | $3,447,634 | $3,465,148 | $3,316,417 | $19.91 |
| Net Operating Income(3) | $9,286,672 | $9,814,705 | $10,925,948 | $11,699,279 | $70.22 |
| Capital Expenditures | $0 | $0 | $0 | $32,515 | $0.20 |
| TI/LC | $0 | $0 | $0 | $283,913 | $1.70 |
| Net Cash Flow | $9,286,672 | $9,814,705 | $10,925,948 | $11,382,851 | $68.32 |
| Occupancy % | 92.0% | 90.0% | 92.8%(4) | 92.8% | |
| NOI DSCR | 1.53x | 1.61x | 1.80x | 1.92x | |
| NCF DSCR | 1.53x | 1.61x | 1.80x | 1.87x | |
| NOI Debt Yield | 6.9% | 7.3% | 8.1% | 8.7% | |
| NCF Debt Yield | 6.9% | 7.3% | 8.1% | 8.4% | |
| (1) | UW Base Rent is based on the underwritten rent roll dated March 31, 2019 and includes rent steps through April 20, 2020 totaling $321,794. |
| (2) | UW Other Income includes signage ($1,192,868), parking ($2,605,994) and miscellaneous income ($237,700). |
| (3) | The increase from 2018 Net Operating Income to UW Net Operating Income is primarily due to two new leases executed in 2019, including Ghalili & Sedgh (1,937 SF, $133,653 of underwritten rent) and Victor Khatchaturian (1,580 SF, $109,020 of underwritten rent), rent steps totaling ($321,794) and a decrease in administrative expenses. |
| (4) | 2018 Occupancy % is as of March 31, 2019. Occupancy as of December 31, 2018 is 91.4%. |
This is not a research report and was not prepared by any Underwriter’s research department. Please see additional important information and qualifications at the end of this Term Sheet.
T-74
| Office - Medical | Loan #5 | Cut-off Date Balance: | $70,000,000 | |
| 9201 West Sunset Boulevard | 9201 West Sunset Boulevard | Cut-off Date LTV: | 64.6% | |
| West Hollywood, CA 90069 | U/W NCF DSCR: | 1.87x | ||
| U/W NOI Debt Yield: | 8.7% |
Escrows and Reserves.
Real Estate Taxes – The 9201 West Sunset Boulevard Whole Loan documents provide for an upfront reserve of $206,965 for real estate taxes and ongoing monthly reserves for real estate taxes in an amount equal to 1/12 of the real estate taxes that the lender estimates will be payable during the next twelve months (initially $41,393).
Insurance – The 9201 West Sunset Boulevard Whole Loan documents do not require ongoing monthly reserves for insurance as long as (i) no event of default is continuing, (ii) the insurance coverage for the 9201 West Sunset Boulevard Property is included in a blanket policy approved by the lender in its reasonable discretion, and (iii) the 9201 West Sunset Boulevard Borrower provides the lender with evidence of timely payment of the insurance premiums and renewals of the insurance policies, no later than ten days prior to the expiration of the current policy.
Recurring Replacements – The 9201 West Sunset Boulevard Whole Loan documents provide for monthly deposits of approximately $2,947 into a replacement reserve.
TI/LC Reserve – The 9201 West Sunset Boulevard Whole Loan documents provide for an upfront reserve of $1,500,000 for future tenant improvements and leasing commissions. In addition, if at any time the amount in such reserve (including the initial upfront deposit) is less than $1,000,000, monthly deposits of approximately $14,034 are required to be made into such reserve until the amount then on deposit in such reserve is at least equal to $1,000,000.
Lockbox and Cash Management. The 9201 West Sunset Boulevard Whole Loan is structured with a springing lockbox and springing cash management. Upon the first occurrence of a Cash Sweep Event Period (as defined below), the 9201 West Sunset Boulevard Borrower is required to establish a lockbox account, to direct tenants to pay rents directly into the lockbox account, and, if notwithstanding such direction, the 9201 West Sunset Boulevard Borrower or property manager receives any rents, to deposit or to cause to be deposited such rents into the lockbox account within one business day of receipt. Upon the first occurrence of a Cash Sweep Event Period, the lender is required to establish, and the 9201 West Sunset Boulevard Borrower is required to cooperate with a cash management bank chosen by the lender to establish, a lender-controlled cash management account, into which all funds in the lockbox account will be required to be deposited periodically so long as a Cash Sweep Event Period is continuing. So long as a Cash Sweep Event Period is continuing, and provided no event of default is continuing, funds in the cash management account are required to be applied (i) to make deposits into the tax and insurance escrows (if any are then required), as described above under “Escrows and Reserves”, (ii) to pay debt service on the 9201 West Sunset Boulevard Whole Loan, (iii) to make deposits into the capital expenditure reserve and (if then required) TI/LC reserve, as described above under “Escrows and Reserves,” (iv) to pay operating expenses set forth in the annual budget (which is required to be approved by the lender during a Cash Sweep Event Period) and extraordinary operating or capital expenses reasonably approved by the lender, and (v) to pay any remainder into an excess cash flow account to be held by the lender as additional security for the 9201 West Sunset Boulevard Whole Loan during the continuance of the Cash Sweep Event Period. If no Cash Sweep Event Period is continuing, all funds in the lockbox account are required to be disbursed to an account designated by the 9201 West Sunset Boulevard Borrower.
A “Cash Sweep Event Period” means a period:
| (a) | commencing upon an event of default under the 9201 West Sunset Boulevard Whole Loan and ending if no event of default exists; or |
| (b) | commencing upon the interest only debt service coverage ratio (assuming the actual loan constant) falling below 1.30x for 12 consecutive calendar months and ending upon the interest only debt service coverage ratio being at least 1.30x for the immediately preceding 12 consecutive calendar months. |
Additional Secured Indebtedness (not including trade debts). In addition to the 9201 West Sunset Boulevard Mortgage Loan, the 9201 West Sunset Boulevard Property also secures the 9201 West Sunset Boulevard ServicedPari Passu Companion Loan which has a Cut-off Date principal balance of $65,000,000. The 9201 West Sunset Boulevard ServicedPari Passu Companion Loan accrues interest at the same rate as the 9201 West Sunset Boulevard Mortgage Loan. The 9201 West Sunset Boulevard Mortgage Loan is entitled to payments of interest and principal on apro rata andpari passu basis with the 9201 West Sunset Boulevard ServicedPari Passu Companion Loan. The holders of the 9201 West Sunset Boulevard Mortgage Loan and the 9201 West Sunset Boulevard ServicedPari Passu Companion Loan have entered into a co-lender agreement which sets forth the allocation of collections on the 9201 West Sunset Boulevard Whole Loan. See “Description of the Mortgage Pool—The Whole Loans—The Serviced Pari Passu Whole Loans” in the Preliminary Prospectus.
Mezzanine Loan and Preferred Equity.Not permitted.
Release of Property.Not permitted.
Ground Lease.None.
Right of First Refusal.None.
Letter of Credit.None.
Terrorism Insurance. The 9201 West Sunset Boulevard Whole Loan documents require that the “all risk” insurance policy required to be maintained by the 9201 West Sunset Boulevard Borrower provide coverage for terrorism in an amount equal to the full replacement cost of the 9201 West Sunset Boulevard Property. The loan documents also require business interruption insurance covering no less than the 12-month period following the occurrence of a casualty event, together with a twelve-month extended period of indemnity. Notwithstanding the foregoing, for so long as the Terrorism Risk Insurance Act of 2002, as extended and modified by the Terrorism Risk Insurance Program Reauthorization Act of 2015 (“TRIPRA”) is in effect (including any extensions thereof or if another federal governmental program is in effect relating to “acts of terrorism” which provides substantially similar protections as TRIPRA), and covers both domestic and foreign acts of terrorism, the lender is required to accept terrorism insurance that insures against “covered acts” as defined by TRIPRA (or such other program). See “Risk Factors—Risks Relating to the Whole Loans—Terrorism Insurance May Not Be Available for All Mortgaged Properties”in the Preliminary Prospectus.
This is not a research report and was not prepared by any Underwriter’s research department. Please see additional important information and qualifications at the end of this Term Sheet.
T-75
| Office - CBD | Loan #6 | Cut-off Date Balance: | $63,700,000 | |
| 30, 32, 34 Third Street; | Central Tower | Cut-off Date LTV: | 52.6% | |
| 701, 703, 705 Market Street | U/W NCF DSCR: | 2.32x | ||
| U/W NOI Debt Yield: | 10.3% |
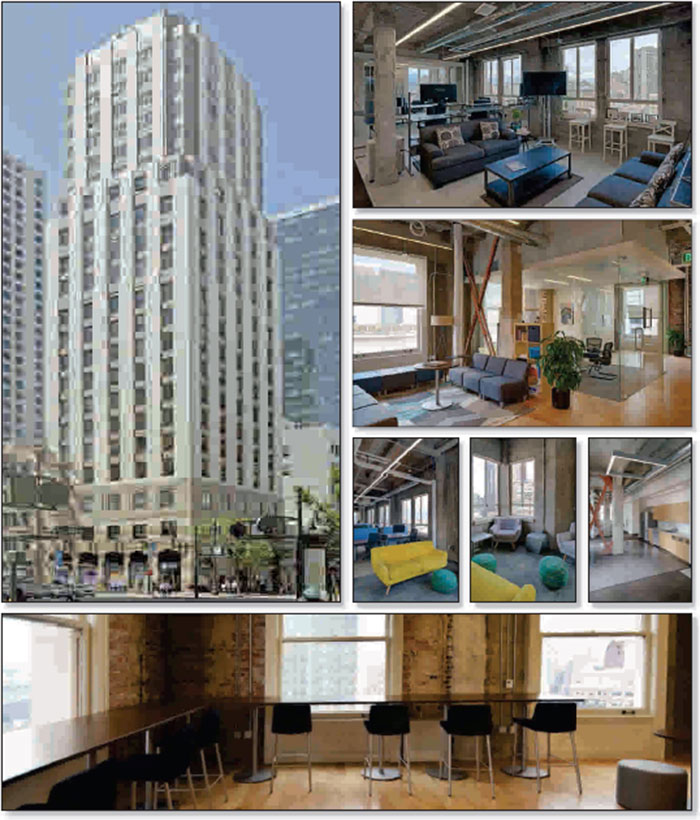
This is not a research report and was not prepared by any Underwriter’s research department. Please see additional important information and qualifications at the end of this Term Sheet.
T-76
| Office - CBD | Loan #6 | Cut-off Date Balance: | $63,700,000 | |
| 30, 32, 34 Third Street; | Central Tower | Cut-off Date LTV: | 52.6% | |
| 701, 703, 705 Market Street | U/W NCF DSCR: | 2.32x | ||
| U/W NOI Debt Yield: | 10.3% |

This is not a research report and was not prepared by any Underwriter’s research department. Please see additional important information and qualifications at the end of this Term Sheet.
T-77
| Office - CBD | Loan #6 | Cut-off Date Balance: | $63,700,000 | |
| 30, 32, 34 Third Street; | Central Tower | Cut-off Date LTV: | 52.6% | |
| 701, 703, 705 Market Street | U/W NCF DSCR: | 2.32x | ||
| U/W NOI Debt Yield: | 10.3% |
| Mortgage Loan No. 6 – Central Tower |
| Mortgage Loan Information | Property Information | ||||||
| Mortgage Loan Seller(1): | MSMCH | Single Asset/Portfolio: | Single Asset | ||||
| Credit Assessment (Fitch/KBRA/Moody’s): | NR/NR/NR | Location: | San Francisco, CA 94103 | ||||
| Original Balance(1): | $63,700,000 | General Property Type: | Office | ||||
| Cut-off Date Balance(1): | $63,700,000 | Detailed Property Type: | CBD | ||||
| % of Initial Pool Balance: | 6.1% | Title Vesting: | Fee | ||||
| Loan Purpose: | Refinance | Year Built/Renovated: | 1898/1908; 2015-2018 | ||||
| Sponsor: | CIM SMA I Investments, LLC | Size: | 164,848 SF | ||||
| Guarantor: | CIM SMA I Investments, LLC | Cut-off Date Balance Per SF(1): | $594 | ||||
| Mortgage Rate: | 4.0600% | Maturity Date Balance Per SF(1): | $594 | ||||
| Note Date: | 4/26/2019 | Property Manager: | CIM Management, Inc. | ||||
| First Payment Date: | 6/6/2019 | (borrower-related) | |||||
| Maturity Date: | 5/6/2029 | ||||||
| Original Term to Maturity: | 120 months | ||||||
| Original Amortization Term: | 0 months | Underwriting and Financial Information | |||||
| IO Period: | 120 months | UW NOI(4): | $10,056,841 | ||||
| Seasoning: | 0 months | UW NOI Debt Yield(1): | 10.3% | ||||
| Prepayment Provisions(2): | LO (24); DEF (89); O (7) | UW NOI Debt Yield at Maturity(1): | 10.3% | ||||
| Lockbox/Cash Mgmt Status: | Hard/Springing | UW NCF DSCR(1): | 2.32x | ||||
| Additional Debt Type(1)(3): | Pari Passu | Most Recent NOI: | $9,095,076 (12/31/2018) | ||||
| Additional Debt Balance(1)(3): | $34,300,000 | 2nd Most Recent NOI: | $5,199,935 (12/31/2017) | ||||
| Future Debt Permitted (Type)(3): | Yes (Mezzanine) | 3rd Most Recent NOI: | $539,194 (12/31/2016) | ||||
| Reserves | Most Recent Occupancy(4): | 98.5% (2/20/2019) | |||||
| Type | Initial | Monthly | Cap | 2nd Most Recent Occupancy: | 96.5% (12/31/2018) | ||
| RE Tax: | $0 | Springing | N/A | 3rd Most Recent Occupancy: | 90.8% (12/31/2017) | ||
| Insurance: | $0 | Springing | N/A | Appraised Value (as of): | $186,300,000 (2/26/2019) | ||
| Capital Expenditure: | $0 | Springing | N/A | Appraised Value per SF: | $1,130 | ||
| TI/LC: | $0 | Springing | N/A | Cut-off Date LTV Ratio(1): | 52.6% | ||
| Existing TI/LC: | $753,839 | $0 | N/A | Maturity Date LTV Ratio(1): | 52.6% | ||
| Sources and Uses | ||||||
| Sources | Proceeds | % of Total | Uses | Proceeds | % of Total | |
| Whole Loan Amount(1): | $98,000,000 | 100.0% | Loan Payoff: | $43,424,843 | 44.3% | |
| Return of Equity: | $53,254,440 | 54.3% | ||||
| Reserves: | $753,839 | 0.8% | ||||
| Closing Costs: | $566,878 | 0.6% | ||||
| Total Sources: | $98,000,000 | 100.0% | Total Uses: | $98,000,000 | 100.0% | |
| (1) | The Cut-off Date Balance per SF, Maturity Date Balance per SF, UW NOI Debt Yield, UW NOI Debt Yield at Maturity, UW NCF DSCR, Cut-off Date LTV Ratio and Maturity Date LTV Ratio numbers presented above are based on the aggregate principal balance of the promissory notes comprising the Central Tower Whole Loan (as defined below). The Central Tower Whole Loan was co-originated by Morgan Stanley Bank, National Association (“MSBNA”), an affiliate of MSMCH, and Deutsche Bank AG, New York Branch (“DBNY”) on April 26, 2019. |
| (2) | Defeasance of the Central Tower Whole Loan is permitted at any time after the earlier of (i) June 6, 2022, or (ii) two years from the closing date of the securitization that includes the lastpari passu promissory note of the Central Tower Whole Loan to be securitized. The assumed lockout period of 24 payments is based on the closing date of this transaction in May 2019. |
| (3) | See “The Mortgage Loan,” “Additional Secured Indebtedness (not including trade debts)” and “Mezzanine Loan and Preferred Equity” below for a discussion of additional indebtedness. |
| (4) | UW NOI and Most Recent Occupancy included (i) Seven Cities PTE, Ltd. (3.2% of NRA and 3.6% of underwritten rent), which occupies its space on a month-to-month basis and (ii) Blue Bottle Coffee, which has executed a lease for 1,268 SF that begins in July 2019, and represents $120,460 in underwritten rent. |
The Mortgage Loan. The sixth largest mortgage loan (the “Central Tower Mortgage Loan”) is part of a whole loan (the “Central Tower Whole Loan”) evidenced by twopari passu promissory notes in the aggregate original principal amount of $98,000,000, both of which are secured by a first priority mortgage encumbering two adjacent office buildings located in San Francisco, California (the “Central Tower Property”). The Central Tower Whole Loan was co-originated by MSBNA and DBNY on April 26, 2019. Promissory Note A-1, in the original principal balance of $63,700,000, represents the controlling interest in the Central Tower Whole Loan and will be included in the BANK 2019-BNK18 securitization trust. Promissory Note A-2, in the original principal balance of $34,300,000, represents the non-controlling interest in the Central Tower Whole Loan (the “Central Tower ServicedPari Passu Companion Loan”), is held by DBNY or an affiliate and is expected to be contributed to one or more future securitizations. The Central Tower Mortgage Loan will be serviced pursuant to the pooling and servicing agreement for the BANK 2019-BNK18 securitization trust. See “Description of the Mortgage Pool—The Whole Loans—The Serviced Pari Passu Whole Loans” and “Pooling and Servicing Agreement” in the Preliminary Prospectus.
This is not a research report and was not prepared by any Underwriter’s research department. Please see additional important information and qualifications at the end of this Term Sheet.
T-78
| Office - CBD | Loan #6 | Cut-off Date Balance: | $63,700,000 | |
| 30, 32, 34 Third Street; | Central Tower | Cut-off Date LTV: | 52.6% | |
| 701, 703, 705 Market Street | U/W NCF DSCR: | 2.32x | ||
| U/W NOI Debt Yield: | 10.3% |
| Central Tower Whole Loan Summary | ||||
Note | Original Balance | Cut-off Date Balance | Note Holder | Lead Servicing Interest |
| A-1 | $63,700,000 | $63,700,000 | BANK 2019-BNK18 | Yes |
| A-2 | $34,300,000 | $34,300,000 | DBNY | No |
| Total | $98,000,000 | $98,000,000 | ||
The Borrowers and the Borrower Sponsor.The borrowers are 703 Market Street (SF) Owner, LLC and 26 Third Street (SF) Owner, LLC (collectively, the “Central Tower Borrowers”), each a recycled, single-purpose Delaware limited liability company that is 100% owned by CIM SMA I Investments, LLC. CIM SMA I Investments, LLC is the borrower sponsor and non-recourse carveout guarantor and is controlled by CIM Group, LLC (“CIM”). Founded in 1994, CIM is a Los Angeles based real estate investment firm and private equity fund that focuses on property management, leasing, asset management, development and infrastructure investment. CIM’s portfolio of real estate assets is made up of residential, retail, mixed use, industrial and office properties. CIM employs over 925 people and has offices in Los Angeles, Phoenix, Bethesda, Chicago, Dallas, Oakland and New York. The Arizona State Retirement System owns a 95.238% interest in the non-recourse carveout guarantor.
The Property.The Central Tower Property is a Class A office property consisting of two office buildings, totaling 164,848 SF situated on a 0.3-acre site in San Francisco, California. The first building is a concrete encapsulated steel 21-story tower located at 701, 703, 705 Market Street (the “Tower”), totaling 106,072 SF of NRA and the second building is an adjacent 5-story office building located at 30, 32, 34 Third Street (the “Annex”), totaling 58,776 SF of NRA. The Tower was built in 1898 and the Annex was built in 1908. The borrower sponsor acquired the Central Tower Property in 2013 for a purchase price of approximately $50,000,000, at which point the Central Tower Property was approximately 87% leased to 91 office tenants and 3 retail tenants. The borrower sponsor vacated the Central Tower Property and in between 2015 and 2018 renovated the Central Tower Property. The Tower underwent approximately $29.1 million in renovations, including a lobby repositioning, elevator upgrades to all four elevators, and renovation of 20 floors. The Annex underwent approximately $16.6 million in renovations, including the renovation of the interiors, exterior paint and spalling repairs and the creation of a rooftop amenity deck. As of February 20, 2019, the Central Tower Property was 98.5% leased to 18 tenants. Additionally, the Central Tower Property includes approximately 2,552 SF of ground floor retail space that is currently vacant but being marketed.
Major Tenants.
Unity Technologies (85,783 SF, 52.0% of NRA, 49.3% of underwritten rent). Unity Technologies SF, a California corporation (“Unity”) has been a tenant at the Central Tower Property since 2016 and is a private video game development company that creates games and interactive 2D, 3D, VR and AR experiences. Unity has approximately 2,000 employees and 27 offices worldwide, with its global headquarters located at the Central Tower Property. Unity has a lease expiration of August 31, 2025 and one five-year renewal option remaining.
Maru Group, LLC (5,338 SF, 3.2% of NRA, 3.6% of underwritten rent). Maru Group, LLC (“Maru”) has been a tenant at the Central Tower Property since 2015 and is a customer intelligence professional services company that provides research and advisory services to large enterprises through the use of its proprietary technology. Maru has a lease expiration of March 15, 2021 and one five-year renewal option remaining. Maru subleases its entire space to Vision Critical Communications at $83.50 PSF. Vision Critical Communications is a cloud-based customer intelligence software company. The sublease is coterminous with the primary lease and the Central Tower Whole Loan was underwritten based on the primary lease rent.
Pivot Interiors, Inc. (5,337 SF, 3.2% of NRA, 3.4% of underwritten rent). Pivot Interiors, Inc. (“Pivot”) has been a tenant at the Central Tower Property since 2017 and is an office design company that sells furniture, designs office space and provides budget consultation. Pivot has a lease expiration of January 31, 2022 and one three-year renewal option remaining.
Google Inc. (5,334 SF, 3.2% of NRA, 3.5% of underwritten rent). Google Inc. (“Google”) has been a tenant at the Central Tower Property since 2016 and is a subsidiary of Alphabet Inc. Google is an American multinational technology company that specializes in internet services and products which include search engine, cloud computing, and online advertising. Google has more than 85,000 employees and over 70 offices worldwide. Google has a lease expiration of September 30, 2021. Google subleases its entire space to Civic Technologies, Inc. (“Civic Technologies”) at $75.19 PSF. Civic Technologies provides services to reduce consumer identity theft and online identity fraud. The sublease is coterminous with the primary lease and the Central Tower Whole Loan was underwritten based on the primary lease rent.
Buoyant, Inc. (5,334 SF, 3.2% of NRA, 3.4% of underwritten rent).Buoyant, Inc. (“Buoyant”) has been a tenant at the Central Tower Property since 2017 and is a software solutions company that builds service mesh software. Buoyant was founded in 2015. Buoyant has a lease expiration of September 30, 2022 and one five-year renewal option remaining.
This is not a research report and was not prepared by any Underwriter’s research department. Please see additional important information and qualifications at the end of this Term Sheet.
T-79
| Office - CBD | Loan #6 | Cut-off Date Balance: | $63,700,000 | |
| 30, 32, 34 Third Street; | Central Tower | Cut-off Date LTV: | 52.6% | |
| 701, 703, 705 Market Street | U/W NCF DSCR: | 2.32x | ||
| U/W NOI Debt Yield: | 10.3% |
The following table presents a summary regarding the major tenants at the Central Tower Property:
Tenant Summary(1)
| |||||||||
| Tenant Name | Credit Rating (Fitch/Moody’s/S&P)(2) | Tenant SF | Appr. % of SF | Annual UW Rent | Annual UW Rent PSF(3) | App. % of Total Annual UW Rent | Lease Expiration | Term. Option | |
| Unity | NR/NR/NR | 85,783 | 52.0% | $5,947,308 | $69.33 | 49.3% | 8/31/2025 | N | |
| Maru(4) | NR/NR/NR | 5,338 | 3.2% | $438,582 | $82.16 | 3.6% | 3/15/2021 | N | |
| Pivot | NR/NR/NR | 5,337 | 3.2% | $413,351 | $77.45 | 3.4% | 1/31/2022 | N | |
| Google(5) | NR/Aa2/AA+ | 5,334 | 3.2% | $419,679 | $78.68 | 3.5% | 9/30/2021 | N | |
| Buoyant | NR/NR/NR | 5,334 | 3.2% | $413,118 | $77.45 | 3.4% | 9/30/2022 | N | |
| Subtotal/Wtd. Avg. | 107,126 | 65.0% | $7,632,037 | $71.24 | 63.3% | ||||
| Other Tenants(6) | 55,170 | 33.5% | $4,422,641 | $80.16 | 36.7% | ||||
| Vacant Space | 2,552 | 1.5% | $0 | $0.00 | 0.0% | ||||
| Total/Wtd. Avg. | 164,848 | 100.0% | $12,054,679 | $74.28 | 100.0% | ||||
| (1) | Information is based on the underwritten rent roll as of February 20, 2019. |
| (2) | Certain ratings are those of the parent company whether or not the parent guarantees the lease. |
| (3) | Wtd. Avg. Annual UW Rent PSF excludes Vacant Space. |
| (4) | Maru Group, LLC subleases its entire space to Vision Critical Communications at $83.50 PSF. The sublease is coterminous with the primary lease and the Central Tower Whole Loan is underwritten based on the primary lease rent. |
| (5) | Google subleases its entire space to Civic Technologies at $75.19 PSF. The sublease is coterminous with the primary lease and the Central Tower Whole Loan is underwritten based on the primary lease rent. |
| (6) | Other Tenants include (i) Seven Cities PTE, Ltd. (3.2% of NRA and 3.6% of underwritten rent), which occupies its space on month-to-month basis and (ii) Blue Bottle Coffee, which has executed a lease for 1,268 SF that begins in July 2019. |
The following table presents certain information relating to the lease rollover at the Central Tower Property:
| Lease Rollover Schedule(1)(2) | ||||||||
| Year | # of Leases Rolling | SF Rolling | Approx. % of Total SF Rolling | Approx. Cumulative % of SF Rolling | Total UW Rent Rolling | Annual UW Rent PSF Rolling(3) | Approx. % of Total Rent Rolling | Approx. Cumulative % of Total Rent Rolling |
| MTM | 1 | 5,338 | 3.2% | 3.2% | $438,570 | $82.16 | 3.6% | 3.6% |
| 2019 | 0 | 0 | 0.0% | 3.2% | $0 | $0.00 | 0.0% | 3.6% |
| 2020 | 2 | 10,668 | 6.5% | 9.7% | $814,822 | $76.38 | 6.8% | 10.4% |
| 2021 | 4 | 19,441 | 11.8% | 21.5% | $1,508,656 | $77.60 | 12.5% | 22.9% |
| 2022 | 5 | 25,274 | 15.3% | 36.8% | $1,994,838 | $78.93 | 16.5% | 39.5% |
| 2023 | 3 | 12,524 | 7.6% | 44.4% | $921,025 | $73.54 | 7.6% | 47.1% |
| 2024 | 0 | 0 | 0.0% | 44.4% | $0 | $0.00 | 0.0% | 47.1% |
| 2025 | 2 | 85,783 | 52.0% | 96.5% | $5,947,308 | $69.33 | 49.3% | 96.4% |
| 2026 | 0 | 0 | 0.0% | 96.5% | $0 | $0.00 | 0.0% | 96.4% |
| 2027 | 0 | 0 | 0.0% | 96.5% | $0 | $0.00 | 0.0% | 96.4% |
| 2028 | 1 | 2,000 | 1.2% | 97.7% | $309,000 | $154.50 | 2.6% | 99.0% |
| 2029 | 1 | 1,268 | 0.8% | 98.5% | $120,460 | $95.00 | 1.0% | 100.0% |
| 2030 & Beyond | 0 | 0 | 0.0% | 98.5% | $0 | $0.00 | 0.0% | 100.0% |
| Vacant Space | 0 | 2,552 | 1.5% | 100.0% | $0 | $0.00 | 0.0% | 100.0% |
| Total/Wtd. Avg. | 19 | 164,848 | 100.0% | $12,054,679 | $74.28 | 100.0% | ||
| (1) | Information is based on the underwritten rent roll as of February 20, 2019. |
| (2) | Certain tenants may have lease termination options that are exercisable prior to the stated expiration date of the subject lease or leases which are not considered in the lease rollover schedule. |
| (3) | Wtd. Avg. Annual UW Rent PSF Rolling excludes Vacant Space. |
The Markets. The Central Tower Property is located in the San Francisco central business district which is at the center of the San Francisco Bay Area. The Central Tower Property has access to various highways, the BART and the Muni bus system, and is approximately a 30 minute drive to San Francisco International Airport. The Central Tower Property is located in the Yerba Buena submarket of the San Francisco metropolitan statistical area (“MSA”) market. The San Francisco MSA is made up of 87,200,762 SF and the Yerba Buena submarket is made up of 3,685,685 SF. As of the fourth quarter of 2018, the vacancy rate in the San Francisco MSA was 5.8% and the vacancy rate in the Yerba Buena submarket was 1.9%. As of the fourth quarter of 2018, the average monthly asking rents in the San Francisco MSA and the Yerba Buena submarket were $60.71 PSF and $63.96 PSF, respectively.
According to the appraisal, the 2018 estimated population within a one-, three- and five-mile radius of the Central Tower Property is 133,829, 425,372 and 698,650, respectively. The 2018 estimated average household income within a one-, three- and five-mile radius of the Central Tower Property is $104,630, $135,405 and $134,719, respectively.
This is not a research report and was not prepared by any Underwriter’s research department. Please see additional important information and qualifications at the end of this Term Sheet.
T-80
| Office - CBD | Loan #6 | Cut-off Date Balance: | $63,700,000 | |
| 30, 32, 34 Third Street; | Central Tower | Cut-off Date LTV: | 52.6% | |
| 701, 703, 705 Market Street | U/W NCF DSCR: | 2.32x | ||
| U/W NOI Debt Yield: | 10.3% |
The following table presents recent leasing data at comparable office properties to the Central Tower Property:
| Comparable Lease Summary | |||||||
| Property/Location | Year Built | SF | Tenant Name | Lease Date | Lease Term (Mos.) | Rent PSF | |
| Size (SF) | |||||||
30,32,34 Third Street; 701,703,705 Market Street San Francisco, CA | 1898/1908 | 164,848 | Unity | 85,783 | Aug. 2016/Aug. 2017 | 104 | $69.33 |
500 3rd Street San Francisco, CA | 1927 | 146,961 | Opus Bank | 1,559 | Dec. 2018
| 96
| $84.00
|
332 Pine Street San Francisco, CA | 1912 | 47,733 | Proxy Technology | 6,165
| Apr. 2019
| 48
| $78.00
|
115 Sansome Street San Francisco, CA | 1913 | 125,310 | Auto List | 6,345 | Feb. 2019
| 62 | $80.00
|
965 Mission Street San Francisco, CA | 1904 | 74,817 | Noodle Analytics, Inc. | 9,355
| Jan. 2019
| 62 | $77.00 |
275 Battery Street San Francisco, CA | 1988 | 485,000 | Credit Karma | 1,417 | Dec. 2018 | 43 | $80.86
|
Source: Appraisal and underwritten rent roll.
The following table presents certain information relating to the appraiser’s market rent conclusion for the Central Tower Property:
| Market Rent Summary | ||||||||
Tower Fls 2-7 | Tower Fls 8-17 | Tower Fls 18-21 | Tower Fl 18 | Corner-Retail | Market St- Retail | 3rdSt- Office | 3rdSt - Retail | |
| Market Rent (PSF) | $78 | $80 | $82 | $82 | $150 | $95 | $60 | $65 |
| Lease Term (Years) | 5 | 5 | 5 | 5 | 10 | 10 | 7 | 10 |
| Lease Type (Reimbursements) | Industrial Gross | Industrial Gross | Industrial Gross | Industrial Gross | Net | Net | Net | Net |
| Rent Increase Projectionper annum | 3.0% | 3.0% | 3.0% | 3.0% | 3.0% | 3.0% | 3.0% | 3.0% |
This is not a research report and was not prepared by any Underwriter’s research department. Please see additional important information and qualifications at the end of this Term Sheet.
T-81
| Office - CBD | Loan #6 | Cut-off Date Balance: | $63,700,000 | |
| 30, 32, 34 Third Street; | Central Tower | Cut-off Date LTV: | 52.6% | |
| 701, 703, 705 Market Street | U/W NCF DSCR: | 2.32x | ||
| U/W NOI Debt Yield: | 10.3% |
Operating History and Underwritten Net Cash Flow. The following table presents certain information relating to the historical operating performance and the Underwritten Net Cash Flow at the Central Tower Property:
| Cash Flow Analysis | |||||
| 2016 | 2017 | 2018 | UW | UW PSF | |
| Gross Potential Rent(1)(2) | $3,661,644 | $7,627,344 | $10,978,467 | $12,220,559(3) | $74.13 |
| Total Recoveries | $484,577 | $1,244,640 | $1,504,217 | $2,800,841 | $16.99 |
| Discount Concessions | $125 | $683 | $5,115 | $0 | $0.00 |
| Other Income | ($1,427,109) | ($1,165,656) | ($236,716) | $0 | $0.00 |
| Less Vacancy & Credit Loss | $0 | $0 | $0 | ($751,070) | ($4.56) |
| Effective Gross Income | $2,719,236 | $7,707,011 | $12,251,083 | $14,270,330 | $86.57 |
| Real Estate Taxes | $614,462 | $638,276 | $1,107,060 | $1,139,740 | $6.91 |
| Insurance | $36,978 | $31,561 | $27,902 | $28,050 | $0.17 |
| Other Expenses | $1,528,602 | $1,837,239 | $2,021,046 | $3,045,699 | $18.48 |
| Total Expenses | $2,180,042 | $2,507,075 | $3,156,008 | $4,213,489 | $25.56 |
| Net Operating Income(2) | $539,194 | $5,199,935 | $9,095,076 | $10,056,841(3) | $61.01 |
| Capital Expenditures | $0 | $0 | $0 | $32,970 | $0.20 |
| TI/LC | $0 | $0 | $0 | $646,204 | $3.92 |
| Net Cash Flow | $539,194 | $5,199,935 | $9,095,076 | $9,377,667 | $56.89 |
| Occupancy % | 45.9% | 90.8% | 98.5%(4) | 95.0%(3) | |
| NOI DSCR(5) | 0.13x | 1.29x | 2.25x | 2.49x | |
| NCF DSCR(5) | 0.13x | 1.29x | 2.25x | 2.32x | |
| NOI Debt Yield(5) | 0.6% | 5.3% | 9.3% | 10.3% | |
| NCF Debt Yield(5) | 0.6% | 5.3% | 9.3% | 9.6% | |
| (1) | UW Gross Potential Rent is based on the underwritten rent roll dated February 20, 2019 and includes rent steps through April 2020 totaling $401,502. |
| (2) | The Gross Potential Rent and Net Operating Income increase from 2016 to 2018 is due to lease up of space as the renovations of the various floors were completed. There were twelve new leases totaling 85,363 SF ($6,613,424 of gross potential rent) with lease commencement dates ranging from January 2017 to December 2018. The Central Tower Borrowers’ business plan was to (i)vacate all of the existing tenant in the Tower and then renovate and reconfigure the floorplates from small offices suites to large creative offices suites and (ii) renovate The Annex. The renovation and floor reconfigurations commenced in 2015 and the renovation was fully completed in 2018. Due to the floors being renovated and at a time the Central Tower Borrowers were able to sign lease with new tenant as each floor was completed. The Gross Potential Rent and Net Operating Income from 2018 to UW is due to the addition of two new leases, Blue Bottle and Sprint, total 3,268 SF ($429,460 of gross potential rent) and rent steps through April 2020 totaling $401,502. |
| (3) | UW Gross Potential Rent, UW Net Operating Income and UW Occupancy included (i) Seven Cities PTE, Ltd. (3.2% of NRA and 3.6% of UW Gross Potential Rent, which occupies its space on a month-to-month basis and (ii) Blue Bottle Coffee, which has executed a lease for 1,268 SF that beings in July 2019, and represents $120,460 in underwritten rent. |
| (4) | 2018 Occupancy % is as of February 20, 2019. |
| (5) | Debt service coverage ratios and debt yields are based on the Central Tower Whole Loan. |
Escrows and Reserves.
Real Estate Taxes – The Central Tower Whole Loan documents provide for monthly deposits to an ongoing monthly real estate tax reserve in an amount equal to 1/12 of the annual real estate taxes that the lender estimates will be payable during the next twelve months, provided, however, such monthly deposits are waived if (a) no Cash Sweep Event Period (as defined below) has occurred and is continuing and (b) the Central Tower Borrowers provide the lender with evidence that all taxes then due and payable in connection therewith have been paid on or prior to their due date, within 10 business days after the date that such real estate taxes are due and payable.
Insurance – The Central Tower Whole Loan documents do not require ongoing monthly reserves for insurance as long as (i) no Cash Sweep Event Period has occurred and is continuing, (ii) the liability and casualty policies maintained by the Central Tower Borrowers covering the Central Tower Property are included in a blanket policy approved by the lender in its reasonable discretion, and (iii) the Central Tower Borrowers provide the lender with evidence of (a) timely payment of the insurance premiums within 60 days after the beginning of the new policy year and (b) renewals of the insurance policies, no later than ten days prior to the expiration of the current policies. To the extent that the Central Tower Borrowers are required to make monthly deposits to the insurance reserve due to the occurrence of a Cash Sweep Event Period, the amount of such monthly deposits is required to be: (i) with respect to the liability and casualty policies maintained under a blanket policy, an amount equal to 1/12 of the annual insurance premium allocations relating to the Central Tower Property with respect to such liability and casualty policies, and (ii) to the extent that insurance funds have been deposited with the lender equal to the total annual insurance premium allocations with respect to such policies and the lender does not apply such insurance funds to pay for such insurance premiums as they become due and payable, the monthly insurance deposit is required to be suspended for so long as the lender holds such insurance funds (A) equal to the then current annual premium allocations for such blanket policies, (B) such premium allocations for the Central Tower Property do not increase, and (C) no event of default exists.
Capital Expenditure Funds – Upon the commencement and during the continuance of a Cash Sweep Event Period, the Central Tower Whole Loan documents provide for monthly deposits to a capital expenditure reserve of $3,434.
Rollover Funds – Upon the commencement and during the continuance of a Cash Sweep Event Period, the Central Tower Whole Loan documents provide for monthly deposits to a rollover reserve of $20,606.
Existing TI/LC Reserve – The Central Tower Whole Loan documents provide for an upfront reserve of $753,839 for existing tenant improvements and leasing commissions obligations detailed in the Central Tower Whole Loan documents.
This is not a research report and was not prepared by any Underwriter’s research department. Please see additional important information and qualifications at the end of this Term Sheet.
T-82
| Office - CBD | Loan #6 | Cut-off Date Balance: | $63,700,000 | |
| 30, 32, 34 Third Street; | Central Tower | Cut-off Date LTV: | 52.6% | |
| 701, 703, 705 Market Street | U/W NCF DSCR: | 2.32x | ||
| U/W NOI Debt Yield: | 10.3% |
Lockbox and Cash Management. The Central Tower Whole Loan is structured with a hard lockbox and springing cash management. The Central Tower Borrowers are required to direct each tenant of the Central Tower Property to deposit funds directly into the lockbox account, and to deposit any funds received by the Central Tower Borrowers and property manager, notwithstanding such direction, into the lockbox account within two business days of receipt. No later than the first occurrence of a Cash Sweep Event Period, the lender is required to establish, and the Central Tower Borrowers are required to cooperate with a cash management bank chosen by the lender to establish, a lender-controlled cash management account, into which all funds in the lockbox account will be required to be deposited periodically so long as a Cash Sweep Event Period is continuing. So long as a Cash Sweep Event Period is continuing, and provided no event of default is continuing, funds in the cash management account are required to be applied (i) to make deposits into the tax and insurance escrows (if any are then required), as described above under “Escrows and Reserves”, (ii) to pay debt service on the Central Tower Whole Loan, (iii) to pay operating expenses set forth in the annual budget (which is required to be approved by the lender) and extraordinary operating or capital expenses reasonably approved by the lender, (iv) to make deposits into the capital expenditure reserve and rollover reserve, as described above under “Escrows and Reserves,” (v) provided no event of default exists, and if the Central Tower Borrowers have exercised the right to obtain a mezzanine loan, as described below under “Mezzanine Loan and Preferred Equity,” to pay debt service then due on the Central Tower Mezzanine Loan (as defined below), as certified by the Central Tower mezzanine lender and (vi) to disburse any remainder into an excess cash flow account to be held by the lender as additional security for the Central Tower Whole Loan during the continuance of the Cash Sweep Event Period (except as described below). If the Central Tower Borrowers exercise their right to obtain the Central Tower Mezzanine Loan and the lender requests amendments to the cash management agreement pursuant to the Central Tower Whole Loan documents, so long as the Central Tower Mezzanine Loan remains outstanding and provided that no Cash Sweep Event Period is continuing, after amounts are applied as set forth in clauses (i)-(v) above, any funds remaining in the lockbox account are required to be disbursed to the Central Tower Borrowers (in lieu of being deposited in an excess cash flow account). Provided no event of default then exists, if no Cash Sweep Event Period is continuing, all funds in the lockbox account are required to be released to the Central Tower Borrowers (except funds deposited up to the Specified Tenant Cap (as defined below) to cure a Specified Tenant Trigger Event (as defined below).
A “Cash Sweep Event Period” means a period:
| (a) | commencing upon an event of default and ending if no event of default exists; or |
| (b) | commencing upon the debt service coverage ratio (based on the aggregate actual debt service due under both the Central Tower Whole Loan and Central Tower Mezzanine Loan (if any)) projected over the 12-month period subsequent to the date of calculation and tested as of the last day of the calendar quarter immediately preceding the applicable date of determination) falling below 1.70x for two consecutive calendar quarters and ending upon such debt service coverage ratio being at least 1.70x for two consecutive calendar quarters; provided, that the Central Tower Borrowers may prepay a portion of the outstanding principal balance of the Central Tower Whole Loan in accordance with the Central Tower Whole Loan documents in an amount sufficient to achieve a debt service coverage ratio of at least 1.70x for two consecutive calendar quarters (which prepayment does not require yield maintenance) or deliver an equivalent letter of credit that, if applied to reduce the outstanding principal balance of the Central Tower Whole Loan, would cause a similar result; or |
| (c) | commencing upon the occurrence of a Specified Tenant Trigger Event and ending upon the cure of a Specified Tenant Trigger Event as described in the definition of such term; or |
| (d) | commencing upon the occurrence of a bankruptcy or similar insolvency of the property manager and the failure to replace the property manager (i) within 60 days of the Central Tower Borrowers obtaining knowledge of such bankruptcy or insolvency if the property manager is not an affiliate of the Central Tower Borrowers, guarantor, or controlling party and (ii) within 15 days of obtaining such knowledge, if the property manager is an affiliate of such parties and ending upon the replacement of the property manager with a “qualified manager” pursuant to a “qualified management agreement” (as such terms are defined in the Central Tower Whole Loan documents); or |
| (e) | commencing upon the occurrence of any bankruptcy or insolvency proceeding concerning any of the Central Tower Borrowers. |
A “Specified Tenant Trigger Event” (A) commences upon the occurrence of the first to occur of: (i) a Specified Tenant failing to be in actual, physical possession of its space, failing to be open to the public for business during customary hours and/or “going dark” in its space on and after the date which is 12 months prior to the maturity date, (ii) a Specified Tenant giving notice that it does not intend to renew its lease or it is terminating its lease for any portion of its space, (iii) a Specified Tenant failing to extend or renew its lease on or prior to the date occurring 12 months prior to the expiration of the applicable lease upon terms and conditions reasonably acceptable to the lender or otherwise permitted to be entered into under the Central Tower Whole Loan documents, (iv) any termination or cancellation of any Specified Tenant’s lease or any such lease failing to otherwise be in full force and effect or (v) any bankruptcy or similar insolvency of Specified Tenant or its lease (including without limitation rejection of such lease in any bankruptcy or similar insolvency proceeding) and (B) expires upon the earlier to occur of (x) a Specified Tenant Re-Tenanting Event (as defined below) (including a Specified Tenant Re-Tenanting Event in connection with clause (y)(1) below) occurs and the debt service coverage ratio (based on the aggregate actual debt service due under both the Central Tower Whole Loan and Central Tower Mezzanine Loan (if any)) is at least 2.15x for two consecutive calendar quarters and or (y) the occurrence of the following, as applicable, (1) the applicable Specified Tenant, together with one or more new tenants pursuant to a Specified Tenant Re-Tenanting Event, is in actual, physical possession of the space demised pursuant to the applicable Specified Tenant lease, open to the public for business during customary hours and not “dark” and is paying the full amount of the rent then due under the applicable Specified Tenant lease, (2) in the event the Specified Tenant Trigger Event is due to the Specified Tenant delivering a notice of its intention to terminate its lease for all or any portion of its space, the applicable Specified Tenant has revoked or rescinded all termination or cancellation notices with respect to the applicable Specified Tenant lease and has re-affirmed the applicable Specified Tenant lease as being in full force and effect, (3) in the event the Specified Tenant Trigger Period is due to either the Specified Tenant delivering a notice of its intention not to renew its lease pursuant to the terms thereof or its failure to renew or extend its lease on or prior to the date that is 12 months prior to expiration, the applicable Specified Tenant has renewed or extended its lease in accordance with the terms of the loan documents for a period of at least five years, (4) with respect to any applicable bankruptcy or insolvency proceedings involving the applicable Specified Tenant, the applicable Specified Tenant (a) is no longer insolvent or subject to any bankruptcy or insolvency proceedings and did not reject the applicable Specified Tenant lease or (b) has affirmed the applicable lease pursuant to final, non-appealable order of a court of competent jurisdiction and (5) unless clause (4) applies, the applicable Specified Tenant is paying the full amount of rent then due under its lease (which condition will not be deemed satisfied until the Specified Tenant is in physical occupancy of its entire space, the effective date and rental commencement date under
This is not a research report and was not prepared by any Underwriter’s research department. Please see additional important information and qualifications at the end of this Term Sheet.
T-83
| Office - CBD | Loan #6 | Cut-off Date Balance: | $63,700,000 | |
| 30, 32, 34 Third Street; | Central Tower | Cut-off Date LTV: | 52.6% | |
| 701, 703, 705 Market Street | U/W NCF DSCR: | 2.32x | ||
| U/W NOI Debt Yield: | 10.3% |
the lease have occurred and any tenant improvements and leasing commissions under the applicable lease have been paid in full or reserved for). Notwithstanding the foregoing, each Specified Tenant Trigger Event will also end if there are funds in the excess cash flow account in at least the amount of the Specified Tenant Cap (as defined below). The funds on deposit in the excess cash flow account up to the amount of the Specified Tenant Cap may be disbursed to the Central Tower Borrowers for payment of tenant improvements and leasing commissions with respect to the applicable Specified Tenant space (or applicable portion thereof), which is the subject of such Specified Tenant Trigger Event.
“Specified Tenant” means each tenant under (i) the Unity Technologies lease and (ii) any lease which, individually or when aggregated with all other leases at the Central Tower Property with the same tenant or its affiliate, demises 16,000 SF or more of the Central Tower Property’s gross leasable area, assuming the exercise of all fixed expansion rights and other preferential rights to lease additional space at the Central Tower Property.
“Specified Tenant Cap” means, an amount equal to $70 PSF for (i) the entire Specified Tenant’s space as of the origination date less (ii) any portion of such leased space that may be subsequently subject to a Specified Tenant Re-Tenanting Event.
“Specified Tenant Re-Tenanting Event” means the Central Tower Borrowers leasing the applicable Specified Tenant space for a term of at least five years in accordance with the applicable terms and conditions of the Central Tower Whole Loan documents, and the applicable replacement tenant(s) under such replacement lease(s) being in actual, physical occupancy of the space demised under its lease(s) and paying the full amount of the rent then due under its lease(s).
Additional Secured Indebtedness (not including trade debts). In addition to the Central Tower Mortgage Loan, the Central Tower Property also secures the Central Tower ServicedPari Passu Companion Loan, which has a Cut-off Date principal balance of $34,300,000. The Central Tower ServicedPari Passu Companion Loan accrues interest at the same rate as the Central Tower Mortgage Loan. The Central Tower Mortgage Loan is entitled to payments of interest and principal on apro rata andpari passu basis with the Central Tower ServicedPari Passu Companion Loan. The holders of the Central Tower Mortgage Loan and the Central Tower ServicedPari Passu Companion Loan have entered into a co-lender agreement which sets forth the allocation of collections on the Central Tower Whole Loan. See “Description of the Mortgage Pool—The Whole Loans—The Serviced Pari Passu Whole Loans” in the Preliminary Prospectus.
Mezzanine Loan and Preferred Equity.Provided that no event of default is continuing, the Central Tower Whole Loan documents permit the holder of 100% of the equity interests in the Central Tower Borrowers to obtain a single mezzanine loan (the “Central Tower Mezzanine Loan”) secured only by such person’s ownership interest in the Central Tower Borrowers, provided, that, among other things, (i) the aggregate loan-to-value ratio is equal to or less than 57.0%; (ii) the aggregate debt service coverage ratio is equal to 2.15x or greater, (iii) the aggregate debt yield is not less than 9.25%, (iv) the Central Tower Mezzanine Loan is at least co-terminous with the Central Tower Whole Loan, (v) the lender and mezzanine lender have entered into an intercreditor agreement acceptable to the lender in its sole discretion, and (vi) if requested by the lender, the lender has received a rating agency confirmation with respect to the Central Tower Mezzanine Loan.
Release of Property. Not permitted.
Ground Lease.None.
Right of First Refusal.None.
Letter of Credit. The Central Tower Borrowers are permitted to post a letter of credit to avoid a Cash Sweep Event Period caused by a decline in debt service coverage ratio as described above under “—Lockbox and Cash Management”.
Terrorism Insurance. The Central Tower Whole Loan documents require that the “all risk” insurance policy required to be maintained by the Central Tower Borrowers provide coverage for terrorism in an amount not less than 100% of the full replacement cost of the Central Tower Property. The Central Tower Whole Loan documents also require business income/loss of rents insurance for a period of no less than the 18-month period commencing at the time of loss, together with a twelve month extended period of indemnity. Whether or not the Terrorism Risk Insurance Act of 2002, as extended and modified by the Terrorism Risk Insurance Program Reauthorization Act of 2015 (“TRIPRA”) or subsequent statute, extension, or reauthorization is in effect, the Central Tower Borrowers are required to carry terrorism insurance throughout the term of the Central Tower Whole Loan. Notwithstanding the foregoing, for so long as TRIPRA is in effect (including any extensions thereof or if another federal governmental program is in effect relating to “acts of terrorism” which provides substantially similar protections as TRIPRA), and covers both domestic and foreign acts of terrorism, the lender is required to accept terrorism insurance which insures against “covered acts” as defined by TRIPRA (or such other program);provided, however,if TRIPRA (or such subsequent statute, extension or reauthorization) is not in effect then the Central Tower Borrowers shall not be required to pay annual premiums in excess of the TC Cap (as defined below), and instead the Central Tower Borrowers shall be obligated to purchase the maximum amount of terrorism insurance available with funds equal to the TC Cap). “TC Cap” means an amount equal to two times the premium for separate “Special Form” or “All Risks” policy or equivalent policy insuring only the Central Tower Property on a stand-alone basis at the time that any terrorism insurance is excluded from any applicable policy.See “Risk Factors—Risks Relating to the Mortgage Loans—Terrorism Insurance May Not Be Available for All Mortgaged Properties”in the Preliminary Prospectus.
This is not a research report and was not prepared by any Underwriter’s research department. Please see additional important information and qualifications at the end of this Term Sheet.
T-84
(THIS PAGE INTENTIONALLY LEFT BLANK)
T-85
| Hospitality – Full Service | Loan #7 | Cut-off Date Balance: | $60,000,000 | |
| 1401 Route 10 East | Marriott Hanover | Cut-off Date LTV: | 58.1% | |
| Whippany, NJ 07981 | U/W NCF DSCR: | 1.85x | ||
| U/W NOI Debt Yield: | 13.6% | |||

This is not a research report and was not prepared by any Underwriter’s research department. Please see additional important information and qualifications at the end of this Term Sheet.
T-86
| Hospitality – Full Service | Loan #7 | Cut-off Date Balance: | $60,000,000 | |
| 1401 Route 10 East | Marriott Hanover | Cut-off Date LTV: | 58.1% | |
| Whippany, NJ 07981 | U/W NCF DSCR: | 1.85x | ||
| U/W NOI Debt Yield: | 13.6% | |||

This is not a research report and was not prepared by any Underwriter’s research department. Please see additional important information and qualifications at the end of this Term Sheet.
T-87
| Hospitality – Full Service | Loan #7 | Cut-off Date Balance: | $60,000,000 | |
| 1401 Route 10 East | Marriott Hanover | Cut-off Date LTV: | 58.1% | |
| Whippany, NJ 07981 | U/W NCF DSCR: | 1.85x | ||
| U/W NOI Debt Yield: | 13.6% | |||
| Mortgage Loan No. 7 – Marriott Hanover |
| Mortgage Loan Information | Property Information | ||||||
| Mortgage Loan Seller: | WFB | Single Asset/Portfolio: | Single Asset | ||||
| Credit Assessment (Fitch/KBRA/Moody’s): | NR/NR/NR | Location: | Whippany, NJ 07981 | ||||
| Original Balance: | $60,000,000 | General Property Type: | Hospitality | ||||
| Cut-off Date Balance: | $60,000,000 | Detailed Property Type: | Full Service | ||||
| % of Initial Pool Balance: | 5.7% | Title Vesting: | Fee | ||||
| Loan Purpose: | Acquisition | Year Built/Renovated: | 1986/2019 | ||||
| Sponsor: | Allan V. Rose | Size: | 353 Rooms | ||||
| Guarantor: | Allan V. Rose | Cut-off Date Balance per Room: | $169,972 | ||||
| Mortgage Rate: | 4.8500% | Maturity Date Balance per Room: | $156,640 | ||||
| Note Date: | 3/28/2019 | Property Manager: | Dimension Development Two, LLC | ||||
| First Payment Date: | 5/11/2019 | ||||||
| Maturity Date: | 4/11/2029 | ||||||
| Original Term to Maturity: | 120 months | Underwriting and Financial Information | |||||
| Original Amortization Term: | 360 months | UW NOI: | $8,179,355 | ||||
| IO Period: | 60 months | UW NOI Debt Yield: | 13.6% | ||||
| Seasoning: | 1 month | UW NOI Debt Yield at Maturity: | 14.8% | ||||
| Prepayment Provisions: | LO (25); DEF (91); O (4) | UW NCF DSCR: | 1.85x (P&I); 2.38x (IO) | ||||
| Lockbox/Cash Mgmt Status: | Hard / Springing | Most Recent NOI: | $6,961,711 (2/28/2019 TTM) | ||||
| Additional Debt Type: | N/A | 2nd Most Recent NOI: | $7,299,044 (12/31/2018) | ||||
| Additional Debt Balance: | N/A | 3rd Most Recent NOI: | $6,683,043 (12/31/2017) | ||||
| Future Debt Permitted (Type): | No (N/A) | Most Recent Occupancy: | 72.0% (2/28/2019) | ||||
| Reserves | 2nd Most Recent Occupancy: | 72.5% (12/31/2018) | |||||
| Type | Initial | Monthly | Cap | 3rd Most Recent Occupancy: | 70.8% (12/31/2017) | ||
| RE Tax: | $0 | $78,973 | N/A | Appraised Value (as of)(1): | $103,300,000 (2/25/2020) | ||
| Insurance: | $0 | Springing | N/A | Appraised Value per Room(1): | $292,635 | ||
| FF&E: | $670,000 | $89,192 | N/A | Cut-off Date LTV Ratio(1): | 58.1% | ||
| PIP Reserve: | $14,224,584 | $0 | N/A | Maturity Date LTV Ratio(1): | 53.5% | ||
| Sources and Uses | ||||||
| Sources | Proceeds | % of Total | Uses | Proceeds | % of Total | |
| Loan Amount: | $60,000,000 | 59.5% | Purchase Price: | $85,000,000 | 84.2% | |
| Cash Equity Contribution | $40,920,281 | 40.5% | Reserves: | $14,894,584 | 14.8% | |
| Closing Costs: | $1,025,697 | 1.0% | ||||
| Total Sources: | $100,920,281 | 100.0% | Total Uses: | $100,920,281 | 100.0% | |
| (1) | The Appraised Value shown reflects an “upon completion” value which assumes completion of a property improvement plan (“PIP”) and the addition of eight guestrooms (see “The Property” section below for further discussion). At loan closing, the Marriott Hanover Borrower (as defined in “The Borrower and Borrower Sponsor” section below) deposited $14,224,584 into a PIP reserve account and $670,000 into an FF&E reserve for the related work. The Cut-off Date LTV and Maturity Date LTV Ratio are calculated based upon the Appraised Value of $103,300,000. The “as-is” appraised value is $85,000,000 as of February 25, 2019, and equates to a Cut-off Date LTV Ratio of 70.6% and Maturity Date LTV Ratio of 65.1% for the Marriott Hanover Mortgage Loan (as defined in “The Mortgage Loan” below). |
The Mortgage Loan. The seventh largest mortgage loan (the “Marriott Hanover Mortgage Loan”) is evidenced by a single promissory note in the original principal amount of $60,000,000 secured by a first priority fee mortgage encumbering a full service hospitality property located in Whippany, New Jersey (the “Marriott Hanover Property”).
The Borrower and the Borrower Sponsor.The borrower is AVR Hanover Hotel LLC (the “Marriott Hanover Borrower”), a single-purpose Delaware limited liability company with one independent director. Legal counsel to the Marriott Hanover Borrower delivered a non-consolidation opinion in connection with the origination of the Marriott Hanover Mortgage Loan.
The borrower sponsor and non-recourse carveout guarantor is Allan V. Rose,owner and chief executive officer of AVR Realty, a privately held real estate development and management company. Founded by Mr. Rose over 45 years ago, AVR Realty has built, acquired, and developed more than 30 million SF of commercial and residential space, including office complexes, shopping centers, corporate and industrial parks, apartment complexes, residential communities and hotels. AVR Realty’s current portfolio includes 23 full service and limited service hotels in California, Colorado, Florida, Georgia, Louisiana, New Jersey, New York, Texas and Virginia.
This is not a research report and was not prepared by any Underwriter’s research department. Please see additional important information and qualifications at the end of this Term Sheet.
T-88
| Hospitality – Full Service | Loan #7 | Cut-off Date Balance: | $60,000,000 | |
| 1401 Route 10 East | Marriott Hanover | Cut-off Date LTV: | 58.1% | |
| Whippany, NJ 07981 | U/W NCF DSCR: | 1.85x | ||
| U/W NOI Debt Yield: | 13.6% | |||
The Property.The Marriott Hanover Property is an eight-story, 353-room, full service hotel located in Whippany, New Jersey, approximately 31.8 miles northwest of Manhattan. Built in 1986 and renovated in 2016-2017 and 2019, the Marriott Hanover Property is situated on a 13.3-acre site. Amenities at the Marriott Hanover Property include 18 meeting rooms totaling 28,149 SF of indoor/outdoor meeting space, a breakfast restaurant, pub, room service, indoor swimming pool, fitness center, business center, sundries shop, concierge lounge and guest laundry facilities. The Marriott Hanover Property contains 686 surface parking spaces, equating to a parking ratio of 1.9 spaces per room. The Marriott Hanover Property guestroom configuration includes 186 king bed guestrooms, 145 double beds guestrooms, 14 ADA accessible guestrooms and eight suites.
The Marriott Hanover Property is expected to undergo a 2019 brand-mandated PIP totaling approximately $14.2 million ($40,296 per key) in connection with a new 20-year franchise agreement with Marriott International, Inc. executed in connection with the Marriott Hanover Property acquisition. The franchise agreement expires on March 28, 2039. According to the borrower sponsor, the PIP is expected to begin in November 2019 and to be completed by May 2020 (and required to be completed by March 2021 per the terms of the franchise agreement) and includes renovations to the guestrooms and corridors, meeting rooms, the exterior of the building, mechanical systems and select public areas. The PIP work is expected to result in approximately 68 rooms (19.3% of the existing 353 rooms) being offline each month during the anticipated seven-month duration of the project. The borrower sponsor deposited an upfront reserve of $14.2 million, which represented the total estimated cost of the PIP work (see “Escrows and Reserves” section). In addition, the borrower sponsor plans to complete approximately $2.5 million in capital expenditures in addition to the scope of the brand-mandated PIP (the “Replacement Work”). The borrower sponsor plans to add eight guestrooms to the Marriott Hanover Property (for a total of 361 rooms) from the conversion of a suite on the 8th floor, and the conversion of excess office space and meeting space. The Marriott Hanover Borrower deposited an upfront reserve of $670K, which represented the estimated cost to add six guestrooms (the scope of the PIP includes the addition of two guestrooms, for a total of eight new guestrooms) at the time of the origination of the Marriott Hanover Mortgage Loan (see “Escrows and Reserves” section).
According to the appraisal, the demand segmentation at the Marriott Hanover Property is approximately 35% commercial, 32% leisure, 30% group and 3% extended-stay. In 2018, the top 10 corporate accounts (Accenture, Deloitte, Novartis, Verizon, CAE, Ernst & Young, Allergan, ADP, Bayer and PwC) totaled approximately 26,557 room nights (approximately 20.2% of total underwritten occupied rooms nights); and the top 3 corporate accounts totaled approximately 17,368 room nights (approximately 13.2% of total underwritten occupied rooms nights).
The following table presents historical occupancy, ADR, and RevPAR penetration rates of the Marriott Hanover Property.
| Historical Occupancy, ADR, RevPAR(1)(2) | ||||||||||||
| Competitive Set | Marriott Hanover Property | Penetration Factor | ||||||||||
| Year | Occupancy | ADR | RevPAR | Occupancy | ADR | RevPAR | Occupancy | ADR | RevPAR | |||
| 12/31/2015 | 70.8% | $168.72 | $119.48 | 72.9% | $182.28 | $132.84 | 102.9% | 108.0% | 111.2% | |||
| 12/31/2016 | 72.4% | $168.91 | $122.31 | 73.4% | $188.64 | $138.42 | 101.3% | 111.7% | 113.2% | |||
| 12/31/2017 | 73.2% | $170.06 | $124.46 | 70.8% | $192.08 | $135.94 | 96.7% | 112.9% | 109.2% | |||
| 2/28/2019 TTM | 72.7% | $176.69 | $128.37 | 72.0% | $195.72 | $140.89 | 99.1% | 110.8% | 109.8% | |||
Sources:Industry Report.
| (1) | According to a third party research report, the competitive set includes Hilton Parsippany, Westin Governor Morris Morristown, Hyatt Morristown @ Headquarters Plaza, Sheraton Parsippany Hotel and Wyndham Hamilton Park Hotel & Conference Center. |
| (2) | Variances between the underwriting, the appraisal, and third party research report with respect to Occupancy, ADR and RevPAR at the Marriott Hanover Property are attributable to variances in reporting methodologies and/or timing differences. |
The Market. The Marriott Hanover Property is located along Route 10 in Whippany, Morris County, New Jersey, approximately 0.5 miles northwest of the on/off ramps for Interstate 287 (which provides access northbound to New York), 3.9 miles southwest of Interstate 80 (which provides access westbound into Pennsylvania), 31.8 miles northwest of Manhattan and 21.6 miles northwest of Newark Liberty International Airport. The Marriott Hanover Property is situated approximately 0.1 miles northwest of the intersection of Mount Pleasant Avenue (Route 10) and Johnson Road, which, according to a third party market research provider, had a daily traffic count of approximately 77,600 vehicles as of 2017. According to a third party market research provider, the 2019 population within a three- and five-mile radius of the Marriott Hanover Property was 62,547 and 148,885, respectively. The 2019 average household income within the same radii was $133,011 and $139,519, respectively.
According to the appraisal, the Marriott Hanover Property is located in close proximity to local demand generators including major pharmaceutical companies (including Allergan, Bayer, GlaxoSmithKlein, Novartis, and Pfizer) as well as major consulting firms (Accenture, Deloitte, Ernst & Young and PwC). Within a five-mile radius of the Marriott Hanover Property, as of May 1, 2019, there were 746 office properties totaling approximately 33.5 million SF, per a third-party market research provider. In July 2018, Teva Pharmaceuticals USA announced plans to relocate its U.S. headquarters from North Wales, Pennsylvania to Parsippany, New Jersey (approximately 4.5 miles northwest of the Marriott Hanover Property), according to a third-party news provider. In addition, Barclays PLC acquired an office building in Whippany, New Jersey (approximately 2.2 miles southeast of the Marriott Hanover Property) for approximately $69 million in 2017 and announced plans to relocate employees from its Manhattan office.
Approximately 9.7 miles southeast of the Marriott Hanover Property is the Mall at Short Hills, an approximately 1.4 million SF Taubman Centers-owned super regional mall anchored by Nordstrom, Bloomingdale’s, Neiman Marcus and Macy’s, with approximately 150 boutiques and shops in addition to various dining and entertainment options, including Legal Sea Foods, California Pizza Kitchen, The Cheesecake Factory and an Apple store.
The appraisal did not identify any hotels that are proposed or currently under development that would be directly competitive with the Marriott Hanover Property.
This is not a research report and was not prepared by any Underwriter’s research department. Please see additional important information and qualifications at the end of this Term Sheet.
T-89
| Hospitality – Full Service | Loan #7 | Cut-off Date Balance: | $60,000,000 | |
| 1401 Route 10 East | Marriott Hanover | Cut-off Date LTV: | 58.1% | |
| Whippany, NJ 07981 | U/W NCF DSCR: | 1.85x | ||
| U/W NOI Debt Yield: | 13.6% | |||
Operating History and Underwritten Net Cash Flow. The following table presents certain information relating to the operating history and Underwritten Net Cash Flow at the Marriott Hanover Property:
| Cash Flow Analysis | |||||||||||||
| 2016 | 2017 | 2018 | TTM 2/28/2019 | UW | UW per Room(1) | ||||||||
| Occupancy | 73.4% | 70.8% | 72.5% | 72.0% | 72.0% | ||||||||
| ADR | $188.45 | $191.97 | $195.00 | $195.15 | $207.19(2) | ||||||||
| RevPAR | $138.28 | $135.94 | $141.33 | $140.48 | $149.14 | ||||||||
| Room Revenue | $17,865,842 | $17,515,510 | $18,209,514 | $18,099,528 | $19,651,219 | $54,436 | |||||||
| Food & Beverage Revenue | $8,952,765 | $8,146,681 | $8,511,363 | $8,320,016 | $8,540,835 | $23,659 | |||||||
| Parking Revenue | $0 | $0 | $0 | $33,782 | $200,000 | $554 | |||||||
| Other Revenue(3) | $341,784 | $264,501 | $308,921 | $304,387 | $308,921 | $856 | |||||||
| Total Revenue | $27,160,391 | $25,926,692 | $27,029,798 | $26,757,713 | $28,700,976 | $79,504 | |||||||
| Room Expense | $4,111,330 | $4,010,576 | $4,249,496 | $4,266,907 | $4,572,750 | $12,667 | |||||||
| Food & Beverage Expense | $5,980,380 | $5,653,744 | $5,897,442 | $5,881,536 | $5,960,928 | $16,512 | |||||||
| Other Departmental Expenses | $64,645 | $41,214 | $39,796 | $39,287 | $39,796 | $110 | |||||||
| Total Departmental Expenses | $10,156,355 | $9,705,534 | $10,186,734 | $10,187,730 | $10,573,474 | $29,289 | |||||||
| Gross Operating Income | $17,004,036 | $16,221,158 | $16,843,064 | $16,569,983 | $18,127,501 | $50,215 | |||||||
| Total Undistributed Expenses | $8,822,413 | $8,682,574 | $8,569,691 | $8,620,473 | $8,926,534 | $24,727 | |||||||
| Gross Operating Profit | $8,181,623 | $7,538,584 | $8,273,373 | $7,949,510 | $9,200,968 | $25,487 | |||||||
| Total Fixed Charges | $771,918 | $855,541 | $974,329 | $987,799 | $1,021,613 | $2,830 | |||||||
| Total Operating Expenses | $19,750,686 | $19,243,649 | $19,730,754 | $19,796,002 | $20,521,621 | $56,847 | |||||||
| Net Operating Income | $7,409,705 | $6,683,043 | $7,299,044 | $6,961,711 | $8,179,355 | $22,657 | |||||||
| FF&E | $0 | $0 | $0 | $0 | ($1,148,039) | ($3,180) | |||||||
| Net Cash Flow | $7,409,705 | $6,683,043 | $7,299,044 | $6,961,711 | $7,031,316 | $19,477 | |||||||
| NOI DSCR (IO) | 2.51x | 2.27x | 2.47x | 2.36x | 2.77x | ||||||||
| NOI DSCR(P&I) | 1.95x | 1.76x | 1.92x | 1.83x | 2.15x | ||||||||
| NCF DSCR (IO) | 2.51x | 2.27x | 2.47x | 2.36x | 2.38x | ||||||||
| NCF DSCR(P&I) | 1.95x | 1.76x | 1.92x | 1.83x | 1.85x | ||||||||
| NOI Debt Yield | 12.3% | 11.1% | 12.2% | 11.6% | 13.6% | ||||||||
| NCF Debt Yield | 12.3% | 11.1% | 12.2% | 11.6% | 11.7% | ||||||||
| (1) | UW per Room values reflect the 361 rooms online after the Replacement Work. See “The Property” section above for a full discussion of the additional rooms. |
| (2) | UW ADR is based on an average of the 2018 ADR of $195.00 and the Appraisal Stabilized post-PIP projected ADR of $219.37. |
| (3) | Other Revenue consists of revenue from the gift shop, telephones, space rental and other miscellaneous items. |
Escrows and Reserves.
Real Estate Taxes - The Marriott Hanover Borrower is required to deposit ongoing monthly escrows for real estate taxes in an amount equal to one-twelfth of the real estate taxes that the lender estimates will be payable during the next twelve months (initially $78,973).
Insurance- The Marriott Hanover Borrower is not required to deposit ongoing monthly escrows for insurance as long as (i) no event of default is continuing, (ii) the Marriott Hanover Borrower provides the lender with evidence that the insurance coverage for the Marriott Hanover Property is included in a blanket or umbrella policy approved by lender and such policy is in full force and effect, and (iii) the Marriott Hanover Borrower provides the lender with evidence of timely payment of the insurance premiums and renewals no later than when such premiums are due and payable.
FF&E Reserve - The Marriott Hanover Mortgage Loan documents require an upfront reserve of $670,000 for estimated remaining expenses related to the construction of six additional guest rooms at the Marriott Hanover Property, including, the procurement of all furniture, fixtures and equipment (“FF&E”) to be used in the operation of such guest rooms. In addition, the Marriott Hanover Borrower is required to deposit ongoing monthly escrows for the costs and expenses of replacement and maintenance of FF&E in an amount equal to $89,192. Based on the annual operating statements for the Marriott Hanover Property, the lender may adjust the FF&E Reserve monthly deposit to the greater of (x) the then-existing monthly deposit or (y) one-twelfth of 4.0% of the revenue for the prior fiscal year.
PIP Reserve - The Marriott Hanover Mortgage Loan documents require an upfront reserve of $14,224,584 for estimated expenses related to the brand-mandated PIP work. In addition, if the lender reasonably determines that the amount in the PIP Reserve is insufficient to complete such work, the Marriott Hanover Borrower is required to deposit an additional springing deposit in an amount equal to 100% of the lender’s reasonable estimate of the cost of remaining and unpaid PIP work.
This is not a research report and was not prepared by any Underwriter’s research department. Please see additional important information and qualifications at the end of this Term Sheet.
T-90
| Hospitality – Full Service | Loan #7 | Cut-off Date Balance: | $60,000,000 | |
| 1401 Route 10 East | Marriott Hanover | Cut-off Date LTV: | 58.1% | |
| Whippany, NJ 07981 | U/W NCF DSCR: | 1.85x | ||
| U/W NOI Debt Yield: | 13.6% | |||
Lockbox and Cash Management. A hard lockbox with springing cash management is in place with respect to the Marriott Hanover Mortgage Loan. The Marriott Hanover Borrower and property manager are required to deposit property income into the lockbox account within one business day of receipt, and credit card providers are required to deposit rents and income directly into the lockbox. During a Cash Trap Event Period (as defined below), all excess cash flow after satisfaction of the waterfall items is required to be held in the excess cash flow sub-account as additional security for the Marriott Hanover Mortgage Loan.
A “Cash Trap Event Period” will commence upon the earlier of the following:
| (i) | the occurrence of an event of default; |
| (ii) | the termination of the franchise agreement; or |
| (iii) | the net cash flow debt yield (“NCF DY”) falling below (a) 8.5% for the immediately preceding calendar quarter during the first three years of the Marriott Hanover Mortgage Loan term or (b) 9.0% for the immediately preceding calendar quarter during the remaining years of the Marriott Hanover Mortgage Loan term. |
A Cash Trap Event Period will end upon the occurrence of the following:
| ● | with regard to clause (i), the cure of such event of default; |
| ● | with regard to clause (ii), (a) the Marriott Hanover Borrower entering into and delivering to the lender a replacement franchise agreement for the Marriott Hanover Property having an initial term expiring no earlier than March 28, 2039, together with any PIP then in effect and (b) the Marriott Hanover Borrower delivering to the lender a replacement comfort letter with respect to such replacement franchise agreement in form and substance acceptable to the lender; and |
| ● | with regard to clause (iii), upon the NCF DY being equal to or greater than (a) 9.0% for two consecutive calendar quarters during the first three years of the Marriott Hanover Mortgage Loan term or (b) 9.5% for two consecutive calendar quarters during the remaining years of the Marriott Hanover Mortgage Loan term. |
Additional Secured Indebtedness (not including trade debts). None.
Mezzanine Loan and Preferred Equity.Not permitted.
Release of Property. Not Permitted.
Ground Lease. None.
Right of First Refusal. Marriott International, Inc. has a right of first refusal (“ROFR”) to acquire the Marriott Hanover Property if there is a transfer of the hotel or the controlling direct or indirect interest in the Marriott Hanover Borrower to a Competitor (as defined in the franchise agreement). The ROFR is not extinguished by a foreclosure or deed-in-lieu thereof, and if the transfer to a Competitor is by foreclosure, or if the franchisee or its affiliates become a Competitor, the franchisor has the right to purchase the Marriott Hanover Property upon notice to the franchisee.
Letter of Credit. None.
Terrorism Insurance. The Marriott Hanover Mortgage Loan documents require that the “all risk” insurance policy required to be maintained by the Marriott Hanover Borrower provide coverage for terrorism in an amount equal to the full replacement cost of the Marriott Hanover Property, as well as business interruption insurance covering no less than the 18-month period following the occurrence of a casualty event, together with a 6-month extended period of indemnity.
This is not a research report and was not prepared by any Underwriter’s research department. Please see additional important information and qualifications at the end of this Term Sheet.
T-91
| Hospitality – Full Service | Loan #8 | Cut-off Date Balance: | $45,441,378 | |
| 4736 Best Road | Westin Atlanta Airport | Cut-off Date LTV: | 69.1% | |
| College Park, GA 30337 | U/W NCF DSCR: | 2.07x | ||
| U/W NOI Debt Yield: | 14.6% | |||

This is not a research report and was not prepared by any Underwriter’s research department. Please see additional important information and qualifications at the end of this Term Sheet.
T-92
| Hospitality – Full Service | Loan #8 | Cut-off Date Balance: | $45,441,378 | |
| 4736 Best Road | Westin Atlanta Airport | Cut-off Date LTV: | 69.1% | |
| College Park, GA 30337 | U/W NCF DSCR: | 2.07x | ||
| U/W NOI Debt Yield: | 14.6% | |||

This is not a research report and was not prepared by any Underwriter’s research department. Please see additional important information and qualifications at the end of this Term Sheet.
T-93
| Hospitality – Full Service | Loan #8 | Cut-off Date Balance: | $45,441,378 | |
| 4736 Best Road | Westin Atlanta Airport | Cut-off Date LTV: | 69.1% | |
| College Park, GA 30337 | U/W NCF DSCR: | 2.07x | ||
| U/W NOI Debt Yield: | 14.6% | |||
| Mortgage Loan No. 8 – Westin Atlanta Airport |
| Mortgage Loan Information | Property Information | |||||
| Mortgage Loan Seller: | MSMCH | Single Asset/Portfolio: | Single Asset | |||
| Credit Assessment (Fitch/KBRA/Moody’s): | NR/NR/NR | Location: | College Park, GA 30337 | |||
| Original Balance(1): | $45,500,000 | General Property Type: | Hospitality | |||
| Cut-off Date Balance(1): | $45,441,378 | Detailed Property Type: | Full Service | |||
| % of Initial Pool Balance: | 4.3% | Title Vesting: | Fee | |||
| Loan Purpose: | Refinance | Year Built/Renovated: | 1982/2008 | |||
| Sponsor: | Columbia Sussex Corporation | Size: | 500 Rooms | |||
| Guarantor: | CSC Holdings, LLC | Cut-off Date Balance per Room(1): | $120,844 | |||
| Mortgage Rate: | 4.6200% | Maturity Date Balance per Room(1): | $98,475 | |||
| Note Date: | 3/8/2019 | Property Manager: | Columbia Sussex | |||
| First Payment Date: | 5/1/2019 | Management, LLC | ||||
| Maturity Date: | 4/1/2029 | (borrower-related) | ||||
| Original Term to Maturity: | 120 months | Underwriting and Financial Information | ||||
| Original Amortization Term: | 360 months | UW NOI: | $8,842,358 | |||
| IO Period: | 0 months | UW NOI Debt Yield(1): | 14.6% | |||
| Seasoning: | 1 month | UW NOI Debt Yield at Maturity(1): | 18.0% | |||
| Prepayment Provisions(2): | LO (25); DEF (90); O (5) | UW NCF DSCR(1): | 2.07x | |||
| Lockbox/Cash Mgmt Status: | Hard/Springing | Most Recent NOI: | $8,876,153 (3/31/2019 TTM) | |||
| Additional Debt Type(1)(3): | Pari Passu | 2nd Most Recent NOI: | $7,920,135 (12/31/2018) | |||
| Additional Debt Balance(1)(3): | $14,980,674 | 3rd Most Recent NOI: | $7,143,741 (12/31/2017) | |||
| Future Debt Permitted (Type): | No (N/A) | Most Recent Occupancy: | 86.0% (3/31/2019) | |||
| Reserves | 2nd Most Recent Occupancy: | 86.3% (12/31/2018) | ||||
| Type | Initial | Monthly | Cap | 3rd Most Recent Occupancy: | 89.4% (12/31/2017) | |
| RE Tax: | $178,421 | $89,211 | N/A | Appraised Value (as of): | $87,500,000 (3/1/2019) | |
| Insurance: | $0 | Springing | N/A | Appraised Value per Room: | $175,000 | |
| FF&E: | $0 | $89,164 | N/A | Cut-off Date LTV Ratio(1): | 69.1% | |
| PIP: | $3,500,000 | Springing | N/A | Maturity Date LTV Ratio(1): | 56.3% | |
| Sources and Uses | ||||||
| Sources | Proceeds | % of Total | Uses | Proceeds | % of Total | |
| Whole Loan Amount(1): | $60,500,000 | 100.0% | Loan Payoff: | $40,502,460 | 66.9% | |
| Return of Equity: | $15,629,533 | 25.8% | ||||
| Reserves: | $3,678,421 | 6.1% | ||||
| Closing Costs: | $689,586 | 1.1% | ||||
| Total Sources: | $60,500,000 | 100.0% | Total Uses: | $60,500,000 | 100.0% | |
| (1) | The Cut-off Date Balance per Room, Maturity Date Balance per Room, UW NOI Debt Yield, UW NOI Debt Yield at Maturity, UW NCF DSCR, Cut-off Date LTV Ratio and Maturity Date LTV Ratio numbers presented above are based on the aggregate principal balance of the promissory notes comprising the Westin Atlanta Airport Whole Loan (as defined below). |
| (2) | Defeasance of the Westin Atlanta Airport Whole Loan is permitted at any time after the earlier of (i) May 1, 2023, or (ii) two years from the closing date of the securitization that includes the lastpari passunote of the Westin Atlanta Airport Whole Loan to be securitized. The assumed lockout period of 25 payments is based on the closing date of this transaction in May 2019. |
| (3) | See “The Mortgage Loan” and “Additional Secured Indebtedness (not including trade debts)”below for further discussion of additional debt. |
The Mortgage Loan. The eighth largest mortgage loan (the “Westin Atlanta Airport Mortgage Loan”) is part of a whole loan (the “Westin Atlanta Airport Whole Loan”) evidenced by threepari passupromissory notes in the aggregate original principal amount of $60,500,000, all of which are secured by a first priority fee mortgage encumbering the full service, 500-room hotel known as Westin Atlanta Airport located in College Park, Georgia (the “Westin Atlanta Airport Property”). The controlling Promissory Note A-2 in the original principal amount of $25,500,000 and the non-controlling Promissory Note A-1-B in the original principal amount of $20,000,000, together having an aggregate original principal amount of $45,500,000, represent the Westin Atlanta Airport Mortgage Loan and will be included in the BANK 2019-BNK18 securitization trust. The non-controlling Promissory Note A-1-A in the original principal amount of $15,000,000 (the “Westin Atlanta Airport ServicedPari PassuCompanion Loan”) is expected to be contributed to one or more future securitization transactions. The Westin Atlanta Airport Whole Loan will be serviced pursuant to the pooling and servicing agreement for the BANK 2019-BNK18 securitization transaction. See “Description of the Mortgage Pool—The Whole Loans—The Serviced Pari Passu Whole Loans”and “Pooling and Servicing Agreement” in the Preliminary Prospectus.
This is not a research report and was not prepared by any Underwriter’s research department. Please see additional important information and qualifications at the end of this Term Sheet.
T-94
| Hospitality – Full Service | Loan #8 | Cut-off Date Balance: | $45,441,378 | |
| 4736 Best Road | Westin Atlanta Airport | Cut-off Date LTV: | 69.1% | |
| College Park, GA 30337 | U/W NCF DSCR: | 2.07x | ||
| U/W NOI Debt Yield: | 14.6% | |||
| Westin Atlanta Airport Whole Loan Summary | |||||
| Note | Original Balance | Cut-off Date Balance | Note Holder | Lead Servicing Interest | |
| A-1-A | $15,000,000 | $14,980,674 | MSBNA | No | |
| A-1-B | $20,000,000 | $19,974,232 | BANK 2019-BNK18 | No | |
| A-2 | $25,500,000 | $25,467,146 | BANK 2019-BNK18 | Yes | |
| Total | $60,500,000 | $60,422,052 | |||
The Borrower and the Borrower Sponsor.The borrower is CP Best Rd., LLC (the “Westin Atlanta Airport Borrower”), a single-purpose Delaware limited liability company with two independent directors. The borrower sponsor is Columbia Sussex Corporation (“Columbia Sussex”) and the non-recourse carveout guarantor is CSC Holdings, LLC. The Westin Atlanta Airport Borrower is wholly owned by CSC Holdings, LLC.
Founded in 1972, Columbia Sussex is a private hotel company operating in the United States.Columbia Sussex’sportfolio of hotels is made up primarily of upscale branded full-service properties under the Marriott and Hilton brands. Columbia Sussex is one of the largest full-service franchisees of Marriott Hotels, and currently owns and operates 39 hotels (including brands such as Marriott, Hilton, Westin, Renaissance, and Hyatt).
The Property. The Westin Atlanta Airport Property is a 10-story, full service hotel located in College Park, Georgia. The Westin Atlanta Airport Property contains 500 rooms, including 245 king bedrooms, 229 double/double bedrooms, and 26 suites. Amenities include three food and beverage venues (Revive Coffee House, Martini’s lobby bar and Cecilia’s Southern Table), an indoor/outdoor pool, a fitness center, a business center and a sundry shop. The Westin Atlanta Airport Property also features approximately 22,290 SF of meeting space spread across 20 rooms, the largest of which is 6,519 SF. There are 499 garage/surface parking spaces (1.0 space per room) located at the Westin Atlanta Airport Property. The Westin Atlanta Airport Property operates under a franchise agreement with Westin Hotel Management, L.P. that expires on March 31, 2037 with no renewal options remaining.
The Westin Atlanta Airport Borrower is required to complete a change of ownership property improvement plan (“PIP”) totaling $3.5 million ($7,000/room), which amount was reserved for at origination of the Westin Atlanta Airport Whole Loan. The majority of the planned renovations will be to guestrooms, lobby area, and shared amenity spaces. This includes replacing carpet, decorative light fixtures, vinyl wall, artwork, upholstered goods, desk chairs, full length mirrors and window treatments. The change of ownership PIP is required to be completed by September 28, 2020. The Westin Atlanta Airport Property was built in 1982 and underwent its last major renovation in 2008. Since 2008, the Westin Atlanta Airport Property has undergone approximately $22.8 million in renovations.
According to the appraisal, in 2018 the Westin Atlanta Airport Property generated approximately 35% of its room nights from commercial demand, 25% from meeting and group demand, 20% from leisure demand and 20% from contract demand.
More specific information about the Westin Atlanta Airport Property and the related competitive set is set forth in the following table:
| Historical Occupancy, ADR, RevPAR(1)(2) | |||||||||
| Competitive Set | Westin Atlanta Airport Property | Penetration Factor | |||||||
| Year | Occupancy | ADR | RevPAR | Occupancy | ADR | RevPAR | Occupancy | ADR | RevPAR |
| 12/31/2017 | 80.6% | $118.59 | $95.60 | 89.5% | $111.56 | $99.83 | 111.0% | 94.1% | 104.4% |
| 12/31/2018 | 80.0% | $121.39 | $97.05 | 86.4% | $117.19 | $101.20 | 108.0% | 96.5% | 104.3% |
| 3/31/2019 TTM | 79.7% | $125.98 | $100.41 | 86.1% | $120.30 | $103.54 | 108.0% | 95.5% | 103.1% |
Source: Industry Report.
| (1) | The competitive set includesHoliday Inn Atlanta Airport North, Crowne Plaza Atlanta Airport, Marriott Atlanta Airport, Hilton Atlanta Airport, Embassy Suites by Hilton Atlanta Airport, Renaissance Concourse Atlanta Airport Hotel and Hotel Indigo Atlanta Airport College Park. |
| (2) | The variances between the underwriting, the appraisal and the industry report data with respect to Occupancy, ADR and RevPAR at the Westin Atlanta Airport Property are attributable to variances in reporting methodologies and/or timing differences. |
The Market.The Westin Atlanta Airport Property is located in College Park, Georgia, approximately 11 miles southwest of the city of Atlanta. Primary commercial demand generators in the area include professional and business services, education and health services, government, retail trade and leisure. The main demand generating locations include the Delta Airlines Training Center which is approximately 3.5 miles northeast of the Westin Atlanta Airport Property and the Georgia International Convention Center which is 1.5 miles north of the Westin Atlanta Airport Property. Primary access to the Westin Atlanta Airport Property is provided by Interstate 285, which encircles Atlanta and connects to Interstate 20, and Interstate 285. The Westin Atlanta Airport Property is also in close proximity to the Hartsfield-Jackson Atlanta International Airport, which is the primary airport in Atlanta and maintains seven passenger terminals.
According to the appraisal, there are multiple planned developments for the College Park area. Airport City is a planned 320-acre mixed use development located west of Interstate 85 and the Hartsfield-Jackson Atlanta International Airport. 250 of the 320 acres is estimated to be developable and the remainder is expected to be used for a nine-hole golf course and green space. The project is envisioned to contain a mix of Class A office space, restaurants, as many as 10 new hotels, and retail space. Construction is slated to begin in the summer of 2019. Other developments include BMW of North America, LLC which is currently building its southern region training center in College Park on a 4.1 acre site.
This is not a research report and was not prepared by any Underwriter’s research department. Please see additional important information and qualifications at the end of this Term Sheet.
T-95
| Hospitality – Full Service | Loan #8 | Cut-off Date Balance: | $45,441,378 | |
| 4736 Best Road | Westin Atlanta Airport | Cut-off Date LTV: | 69.1% | |
| College Park, GA 30337 | U/W NCF DSCR: | 2.07x | ||
| U/W NOI Debt Yield: | 14.6% | |||
The following table presents certain information relating to the primary competitive properties to the Westin Atlanta Airport Property:
| Property Competitive Summary(1) | ||||||||||
| Property Name | No. of Rooms | Year Built | Meeting Space (SF) | Commercial | Meeting & Group | Leisure | Contract | Estimated Occupancy(2) | Estimated | Estimated |
| Westin Atlanta Airport | 500 | 1982 | 22,290 | 35% | 25% | 20% | 20% | 86.3% | $116.08 | $100.22 |
| Holiday Inn & Suites Atlanta Airport - North | 330 | 1967 | 12,203 | 40% | 20% | 25% | 15% | 75.0% - 80.0% | $100 - $105 | $75 - $80 |
| Crowne Plaza Atlanta Airport | 378 | 1973 | 14,727 | 35% | 25% | 25% | 15% | 75.0% - 80.0% | $105 - $110 | $80 - $85 |
| Atlanta Airport Marriott | 641 | 1981 | 30,178 | 30% | 30% | 20% | 20% | 80.0% - 85.0% | $125 - $130 | $100 - $105 |
| Hilton Atlanta Airport | 507 | 1989 | 23,052 | 30% | 30% | 20% | 20% | 85.0% - 90.0% | $130 - $135 | $110 - $115 |
| Embassy Suites by Hilton Atlanta Airport | 236 | 1989 | 7,542 | 45% | 25% | 15% | 15% | 80.0% - 85.0% | $120 - $125 | $100 - $105 |
| Renaissance Concourse Atlanta Airport Hotel | 387 | 1992 | 29,474 | 30% | 30% | 20% | 20% | 80.0% - 85.0% | $135 - $140 | $110 - $115 |
| Hotel Indigo Atlanta Airport College Park | 142 | 2012 | 1,242 | 45% | 20% | 25% | 10% | 70.0% - 75.0% | $105 - $110 | $70 - $75 |
Source:Appraisal.
| (1) | Variances between the underwriting, the appraisal and the Historical Occupancy, ADR, RevPAR table with respect to Occupancy, ADR and RevPAR at the Westin Atlanta Airport Property are attributable to variances in reporting methodologies and/or timing differences. |
| (2) | Estimated 2018 Occupancy, Estimated 2018 ADR and Estimated 2018 RevPAR are based on the appraisal’s estimated 2018 year-end figures. |
According to the appraisal, four major projects are currently under development or have been recently opened in the market. There is a 214-room luxury Solis Two Porsche Drive hotel that opened in November 2017, a 99 room Home2Suites by Hilton currently under construction, a 222 room AC by Marriot Hotel that was announced in September 2018 and a new full service InterContinental Hotel planned at the airport redevelopment which is in the early development stages. According to the appraisal, these developments are not expected to directly compete with the Westin Atlanta Airport Property.
Operating History and Underwritten Net Cash Flow. The following table presents certain information relating to the operating history and Underwritten Net Cash Flow at the Westin Atlanta Airport Property:
| Cash Flow Analysis | |||||||||||||
| 2016 | 2017 | 2018 | 3/31/2019 TTM | UW | UW per Room | ||||||||
| Occupancy | 89.6% | 89.4% | 86.3% | 86.0% | 86.0% | ||||||||
| ADR | $106.31 | $111.19 | $116.08 | $118.97 | $118.97 | ||||||||
| RevPAR | $95.26 | $99.35 | $100.22 | $102.37 | $102.37 | ||||||||
| Room Revenue | $17,432,692 | $18,131,982 | $18,289,690 | $18,683,174 | $18,683,174 | $37,366 | |||||||
| Food & Beverage Revenue | $8,027,694 | $7,393,307 | $7,088,220 | $7,794,130 | $7,794,130 | $15,588 | |||||||
| Other Income | $1,097,322 | $882,894 | $1,077,012 | $1,126,637 | $1,126,637 | $2,253 | |||||||
| Total Revenue | $26,557,708 | $26,408,183 | $26,454,922 | $27,603,941 | $27,603,941 | $55,208 | |||||||
| Real Estate Taxes | $852,000 | $1,067,326 | $1,070,999 | $1,074,395 | $1,070,520 | $2,141 | |||||||
| Insurance | $305,955 | $346,987 | $293,224 | $299,779 | $302,302 | $605 | |||||||
| Other Expenses | $19,642,359 | $17,850,129 | $17,170,564 | $17,353,614 | $17,388,761 | $34,778 | |||||||
| Total Expenses | $20,800,314 | $19,264,442 | $18,534,787 | $18,727,788 | $18,761,583 | $37,523 | |||||||
| Net Operating Income | $5,757,394 | $7,143,741 | $7,920,135 | $8,876,153 | $8,842,358 | $17,685 | |||||||
| FF&E | $1,062,308 | $1,056,327 | $1,058,197 | $1,104,157 | $1,104,158 | $2,208 | |||||||
| Net Cash Flow | $4,695,086 | $6,087,414 | $6,861,938 | $7,771,996 | $7,738,200 | $15,476 | |||||||
| NOI DSCR(1) | 1.54x | 1.91x | 2.12x | 2.38x | 2.37x | ||||||||
| NCF DSCR(1) | 1.26x | 1.63x | 1.84x | 2.08x | 2.07x | ||||||||
| NOI Debt Yield(1) | 9.5% | 11.8% | 13.1% | 14.7% | 14.6% | ||||||||
| NCF Debt Yield(1) | 7.8% | 10.1% | 11.4% | 12.9% | 12.8% | ||||||||
| (1) | Debt service coverage ratios and debt yields are based on the Westin Atlanta Airport Whole Loan. |
This is not a research report and was not prepared by any Underwriter’s research department. Please see additional important information and qualifications at the end of this Term Sheet.
T-96
| Hospitality – Full Service | Loan #8 | Cut-off Date Balance: | $45,441,378 | |
| 4736 Best Road | Westin Atlanta Airport | Cut-off Date LTV: | 69.1% | |
| College Park, GA 30337 | U/W NCF DSCR: | 2.07x | ||
| U/W NOI Debt Yield: | 14.6% | |||
Escrows and Reserves.
Real Estate Taxes - The Westin Atlanta Airport Mortgage Loan documents provide for an upfront reserve of $178,421 for real estate taxes and ongoing monthly reserves for real estate taxes in an amount equal to 1/12 of the real estate taxes that the lender estimates will be payable during the next twelve months (initially $89,211).
Insurance- The Westin Atlanta Airport Mortgage Loan documents do not require ongoing monthly reserves for insurance as long as (i) no event of default has occurred and is continuing, (ii) the insurance coverage for the Westin Atlanta Airport Property is included in a blanket or umbrella policy approved by the lender in its reasonable discretion, and (iii) the Westin Atlanta Airport Borrower provides the lender with evidence of timely payment of the insurance premiums and renewals of the insurance policies, no later than ten days prior to the expiration of the current policy.
FF&E Reserve - The Westin Atlanta Airport Mortgage Loan documents provide for ongoing monthly reserves for furniture, fixtures and equipment (“FF&E”) in an amount equal to the greater of (i) 1/12 of 4% of the operating income for the Westin Atlanta Airport Property for the preceding calendar year ($89,164 for the balance of 2019) and (ii) the amount of the deposit required by the franchisor on account of FF&E under the franchise agreement. The monthly deposit will be adjusted annually by the lender in January of each calendar year based on the foregoing.
PIP Reserve- The Westin Atlanta Airport Mortgage Loan documents provide for an upfront reserve of $3,500,000 for a scheduled property improvement plan applicable to the Westin Atlanta Airport Property.
Lockbox and Cash Management. The Westin Atlanta Airport Mortgage Loan is structured with a hard lockbox and springing cash management. At origination, the Westin Atlanta Airport Borrower and manager were required to direct credit card companies and credit card banks to deposit all credit card receipts with respect to the Westin Atlanta Airport Property into the lockbox account controlled by the lender. If notwithstanding the foregoing direction, the Westin Atlanta Airport Borrower or manager receives any rents from the Westin Atlanta Airport Property, it is required to deposit such amounts into the lockbox account within three business days of receipt. In the absence of a Cash Sweep Event Period (as defined below), the funds in the lockbox account will be swept each business day into an account controlled by the Westin Atlanta Airport Borrower. Upon the first Cash Sweep Event Period, the lender has the right to establish, and the Westin Atlanta Airport Borrower is required to cooperate to establish, a lender-controlled cash management account, and if a Cash Sweep Event Period is continuing, all funds in the lockbox account are required to be swept to such cash management account, and applied, provided that no event of default is continuing under the Westin Atlanta Airport Mortgage Loan, to fund the required tax and insurance reserves deposits as described above under “Escrows and Reserves”, to fund the payment of debt service on the Westin Atlanta Airport Mortgage Loan, to fund the required monthly deposit into the FF&E reserve, as described above under “Escrows and Reserves”, to pay monthly operating expenses referenced in the annual budget (which annual budget is required to be approved by the lender during a Cash Sweep Event Period), and extraordinary expenses approved by the lender, and to disburse the remainder into an excess cash flow sweep account to be held as additional collateral for the Westin Atlanta Airport Mortgage Loan during the continuance of such Cash Sweep Event Period.
A “Cash Sweep Event Period” will commence upon:
| a) | the occurrence of an event of default and continue until no event of default is continuing; |
| b) | the date that the debt service coverage ratio for the immediately preceding 12 consecutive calendar months falls below 1.20x (based upon the trailing 12-month period) and will continue until such time as the debt service coverage ratio has been at least 1.20x for the immediately preceding 12 consecutive calendar months (based upon the trailing 12-month period); |
| c) | the franchisor provides notice that (x) there is a default by the Westin Atlanta Airport Borrower under the franchise agreement or (y) the Westin Atlanta Airport Property is not being operated or maintained in accordance with the franchisor’s standards, resulting in the Westin Atlanta Airport Borrower no longer being in good standing with the franchisor, and such default is not cured within 30 days of such notice, and will continue until such default has been remedied to the satisfaction of the lender and the franchisor, as evidenced by an estoppel or comfort letter from the franchisor reasonably satisfactory to the lender; or |
| d) | the date that is the earlier to occur of (x) the date either the franchisor or the Westin Atlanta Airport Borrower gives notice to terminate the franchise agreement or (y) the date the franchise agreement expires, is cancelled or terminated, and will continue until a Replacement Franchise Agreement with a Qualified Franchisor has been entered into. |
A “Qualified Franchisor” means a reputable and experienced franchisor possessing experience in flagging hotel properties similar in size, scope, use and value as the Westin Atlanta Airport Property and approved by the lender.
A “Replacement Franchise Agreement” means a franchise, trademark or license agreement with a Qualified Franchisor that is either substantially the same in form and substance as the franchise agreement in effect on the loan origination date, or otherwise reasonably acceptable to the lender.
Additional Secured Indebtedness (not including trade debts). In addition to the Westin Atlanta Airport Mortgage Loan, the Westin Atlanta Airport Property also secures the Westin Atlanta Airport ServicedPari Passu Companion Loan which has a Cut-off Date principal balance of $14,980,674. The Westin Atlanta Airport ServicedPari Passu Companion Loan accrues interest at the same rate as the Westin Atlanta Airport Mortgage Loan. The Westin Atlanta Airport Mortgage Loan is entitled to payments of interest and principal on apro rata andpari passu basis with the Westin Atlanta Airport ServicedPari PassuCompanion Loan. The holders of the Westin Atlanta Airport Mortgage Loan and the Westin Atlanta Airport ServicedPari PassuCompanion Loan have entered into a co-lender agreement which sets forth the allocation of collections on the Westin Atlanta Airport Whole Loan. See “Description of the Mortgage Pool—The Whole Loans—The Serviced Pari Passu Whole Loans” in the Preliminary Prospectus.
Mezzanine Loan and Preferred Equity.Not permitted.
Release of Property. Not permitted.
Ground Lease. None.
Right of First Refusal.None.
This is not a research report and was not prepared by any Underwriter’s research department. Please see additional important information and qualifications at the end of this Term Sheet.
T-97
| Hospitality – Full Service | Loan #8 | Cut-off Date Balance: | $45,441,378 | |
| 4736 Best Road | Westin Atlanta Airport | Cut-off Date LTV: | 69.1% | |
| College Park, GA 30337 | U/W NCF DSCR: | 2.07x | ||
| U/W NOI Debt Yield: | 14.6% | |||
Letter of Credit.The Westin Atlanta Airport Borrower may, at its option but subject to no less than 30 days’ prior written notice to the lender, provide a letter of credit in lieu of any of the cash deposits required to be made pursuant to the Westin Atlanta Airport Mortgage Loan documents in connection with the PIP reserve, provided that such letter of credit is in the amount of the cash deposit required thereunder and otherwise meets all applicable requirements set forth in the Westin Atlanta Airport Mortgage Loan documents.
Terrorism Insurance. The Westin Atlanta Airport Mortgage Loan documents require that the “all risk” insurance policy required to be maintained by the Westin Atlanta Airport Borrower provide coverage for terrorism in an amount not less than 100% of the full replacement cost of the Westin Atlanta Airport Property. The Westin Atlanta Airport Mortgage Loan documents also require business income/loss of rents insurance for a period of no less than the 18-month period commencing at the time of loss, together with a twelve month extended period of indemnity. Notwithstanding the foregoing, for so long as the Terrorism Risk Insurance Act of 2002, as extended and modified by the Terrorism Risk Insurance Program Reauthorization Act of 2015 (“TRIPRA”) is in effect (including any extensions thereof or if another federal governmental program is in effect relating to “acts of terrorism” which provides substantially similar protections as TRIPRA), and covers both domestic and foreign acts of terrorism, the lender is required to accept terrorism insurance which insures against “covered acts” as defined by TRIPRA (or such other program).See “Risk Factors—Risks Relating to the Mortgage Loans—Terrorism Insurance May Not Be Available for All Mortgaged Properties”in the Preliminary Prospectus.
This is not a research report and was not prepared by any Underwriter’s research department. Please see additional important information and qualifications at the end of this Term Sheet.
T-98
(THIS PAGE INTENTIONALLY LEFT BLANK)
T-99
| Various | Loan #9 | Cut-off Date Balance: | $40,000,000 | |
| Various | ILPT Hawaii Portfolio | Cut-off Date LTV: | 45.2% | |
| Honolulu, HI Various | U/W NCF DSCR: | 2.40x | ||
| U/W NOI Debt Yield: | 10.6% |
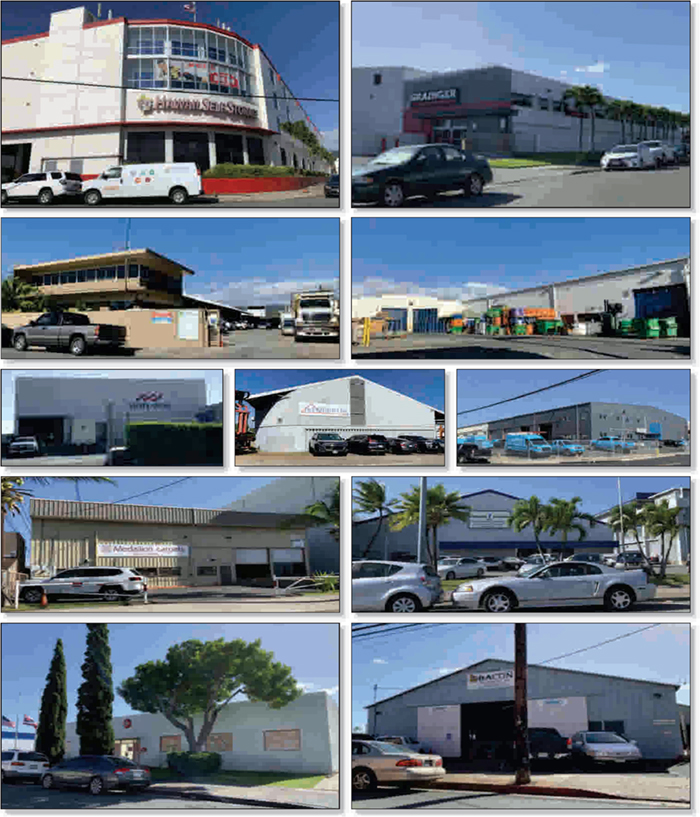
This is not a research report and was not prepared by any Underwriter’s research department. Please see additional important information and qualifications at the end of this Term Sheet.
T-100
| Various | Loan #9 | Cut-off Date Balance: | $40,000,000 | |
| Various | ILPT Hawaii Portfolio | Cut-off Date LTV: | 45.2% | |
| Honolulu, HI Various | U/W NCF DSCR: | 2.40x | ||
| U/W NOI Debt Yield: | 10.6% |
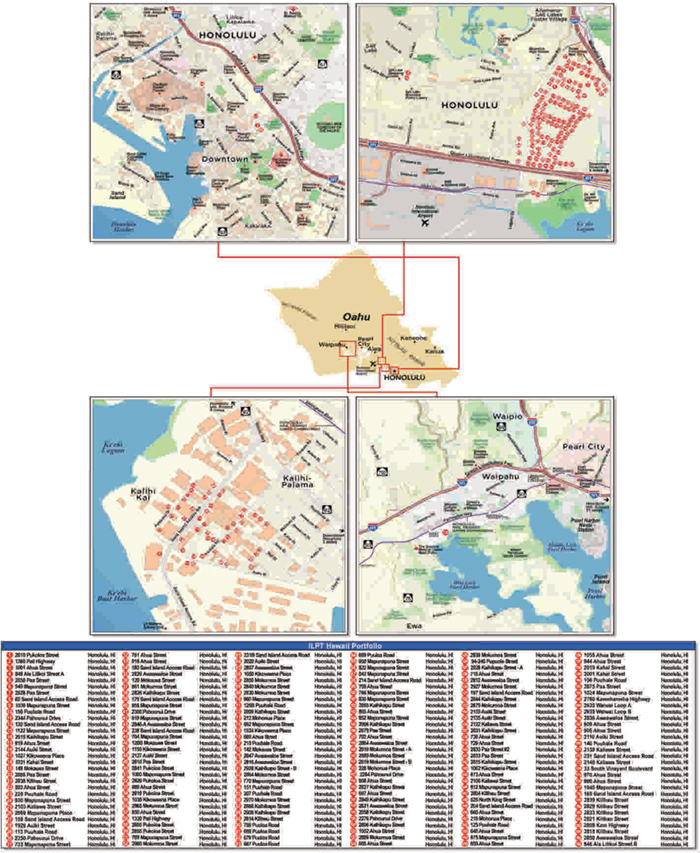
This is not a research report and was not prepared by any Underwriter’s research department. Please see additional important information and qualifications at the end of this Term Sheet.
T-101
| Various | Loan #9 | Cut-off Date Balance: | $40,000,000 | |
| Various | ILPT Hawaii Portfolio | Cut-off Date LTV: | 45.2% | |
| Honolulu, HI Various | U/W NCF DSCR: | 2.40x | ||
| U/W NOI Debt Yield: | 10.6% |
| Mortgage Loan No. 9 – ILPT Hawaii Portfolio |
| Mortgage Loan Information | Property Information | |||||||
| Mortgage Loan Seller(1): | MSMCH | Single Asset/Portfolio: | Portfolio | |||||
| Credit Assessment (Fitch/KBRA/Moody’s): | BBBsf/A+(sf)/Baa1(sf) | Location: | Honolulu, HI Various | |||||
| Original Balance(1): | $40,000,000 | General Property Type(4): | Various | |||||
| Cut-off Date Balance(1): | $40,000,000 | Detailed Property Type(4): | Various | |||||
| % of Initial Pool Balance: | 3.8% | Title Vesting: | Fee | |||||
| Loan Purpose: | Recapitalization | Year Built/Renovated: | Various/N/A | |||||
| Sponsor: | Industrial Logistics Properties Trust | Size(4): | 9,591,512 SF | |||||
| Guarantor: | Industrial Logistics Properties Trust | Cut-off Date Balance per SF(1): | $68 | |||||
| Mortgage Rate: | 4.3100% | Maturity Date Balance per SF(1): | $68 | |||||
| Note Date: | 1/29/2019 | Property Manager: | The RMR Group LLC | |||||
| First Payment Date: | 3/7/2019 | (borrower-related) | ||||||
| Maturity Date: | 2/7/2029 | |||||||
| Original Term to Maturity: | 120 months | Underwriting and Financial Information | ||||||
| Original Amortization Term: | 0 months | UW NOI: | $68,763,789 | |||||
| IO Period: | 120 months | UW NOI Debt Yield(1): | 10.6% | |||||
| Seasoning: | 3 months | UW NOI Debt Yield at Maturity(1): | 10.6% | |||||
| Prepayment Provisions(2): | LO (27); DEF/YM1 (86); O (7) | UW NCF DSCR(1): | 2.40x | |||||
| Lockbox/Cash Mgmt Status: | Hard/Springing | Most Recent NOI: | $57,840,197 (10/31/2018 TTM) | |||||
| Additional Debt Type(1)(3): | Pari Passu | 2nd Most Recent NOI: | $56,877,354 (12/31/2017) | |||||
| Additional Debt Balance(1)(3): | $610,000,000 | 3rd Most Recent NOI: | $55,544,563 (12/31/2016) | |||||
| Future Debt Permitted (Type): | No (N/A) | Most Recent Occupancy: | 100.0% (12/13/2018) | |||||
| Reserves | 2nd Most Recent Occupancy: | 100.0% (12/31/2017) | ||||||
| Type | Initial | Monthly | Cap | 3rd Most Recent Occupancy: | 99.5% (12/31/2016) | |||
| RE Tax: | $0 | Springing | N/A | Appraised Value (as of)(5): | $1,439,117,000 (Various) | |||
| Insurance: | $0 | Springing | N/A | Appraised Value per SF(5): | $150 | |||
| Recurring Replacements: | $0 | $0 | N/A | Cut-off Date LTV Ratio(1)(5): | 45.2% | |||
| TI/LC: | $0 | $0 | N/A | Maturity Date LTV Ratio(1)(5): | 45.2% | |||
| Sources and Uses | ||||||
| Sources | Proceeds | % of Total | Uses | Proceeds | % of Total | |
| Whole Loan Amount(1): | $650,000,000 | 100.0% | Paydown of Corporate Revolver(6): | $380,000,000 | 58.5% | |
| Return of Equity: | $267,194,938 | 41.1% | ||||
| Closing Costs: | $2,805,063 | 0.4% | ||||
| Total Sources: | $650,000,000 | 100.0% | Total Uses: | $650,000,000 | 100.0% | |
| (1) | The Cut-off Date Balance per SF, Maturity Date Balance per SF, UW NOI Debt Yield, UW NOI Debt Yield at Maturity, UW NCF DSCR, Cut-off Date LTV Ratio and Maturity Date LTV Ratio numbers presented above are based on the aggregate principal balance of the promissory notes comprising the ILPT Hawaii Portfolio Whole Loan (as defined below). The ILPT Hawaii Portfolio Whole Loan was co-originated by Morgan Stanley Bank, N.A. (“MSBNA”), Citi Real Estate Funding Inc. (“CREFI”), UBS AG, by and through its branch office at 1285 Avenue of the Americas, New York, New York (“UBS AG”) and JPMorgan Chase Bank, National Association (“JPMCB”) on January 9, 2019. |
| (2) | Following the lockout period, the ILPT Hawaii Portfolio Borrowers (as defined below) have the right to defease the entire ILPT Hawaii Portfolio Whole Loan, on any date after the earlier to occur of (i) two years after the closing date of the securitization that includes the lastpari passu note to be securitized and (ii) January 29, 2022 (the “Lockout Expiration Date”). After the Lockout Expiration Date, prepayment in full is permitted with payment of a prepayment fee equal to the greater of (a) 1% of the outstanding principal amount of the ILPT Hawaii Portfolio Whole Loan or (b) the “Yield Maintenance Amount”, which is the present value as of the prepayment date of the remaining monthly interest only payments that would be due through August 7, 2028 (the “Open Prepayment Date”) based on the principal amount of the ILPT Hawaii Portfolio Whole Loan being prepaid, discounted at an interest rate equal to the difference between (i) 4.3100% and (ii) the yield maintenance treasury rate (as defined in the ILPT Hawaii Portfolio Whole Loan documents). The ILPT Hawaii Portfolio Whole Loan is prepayable in full without penalty on or after the Open Prepayment Date. The assumed defeasance and prepayment lockout period of 27 payments is based on the closing date of this transaction in May 2019. |
| (3) | See “The Mortgage Loan” and “Additional Secured Indebtedness (not including trade debts)” below for a discussion of additional indebtedness. |
| (4) | The ILPT Hawaii Portfolio Whole Loan is secured by the fee simple interests of the ILPT Hawaii Portfolio Borrowers (as defined below) in an approximately 9,591,512 SF portfolio of 177 leased fee parcels (the “Leased Fee Properties”) and nine fee simple parcels (the “Fee Simple Properties”) located in Honolulu, Hawaii. |
| (5) | The Appraised Value, Appraised Value per SF, Cut-off Date LTV Ratio and Maturity Date LTV Ratio are based on the aggregate of the individual “as-is” appraised values of leased fee interests in the ILPT Hawaii Portfolio (as defined below) as of December 2018 of $1,439,117,000. |
| (6) | Prior to the origination of the ILPT Hawaii Portfolio Whole Loan, the ILPT Hawaii Portfolio was unencumbered. According to the borrower sponsor, the proceeds of the ILPT Hawaii Portfolio Whole Loan were used to, among other things, repay all outstanding borrowings under its unsecured revolving credit facility. As of September 30, 2018, the balance of the unsecured revolving credit facility was $380,000,000. |
This is not a research report and was not prepared by any Underwriter’s research department. Please see additional important information and qualifications at the end of this Term Sheet.
T-102
| Various | Loan #9 | Cut-off Date Balance: | $40,000,000 | |
| Various | ILPT Hawaii Portfolio | Cut-off Date LTV: | 45.2% | |
| Honolulu, HI Various | U/W NCF DSCR: | 2.40x | ||
| U/W NOI Debt Yield: | 10.6% |
The Mortgage Loan. The ninth largest mortgage loan (the “ILPT Hawaii Portfolio Mortgage Loan”) is part of a whole loan (the “ILPT Hawaii Portfolio Whole Loan”) in the original principal balance of $650,000,000. The ILPT Hawaii Portfolio Whole Loan is secured by a first priority fee mortgage encumbering 177 Leased Fee Properties and nine Fee Simple Properties located in Honolulu, Hawaii (the “ILPT Hawaii Portfolio”). The ILPT Hawaii Portfolio Whole Loan was co-originated by MSBNA, CREFI, UBS AG and JPMCB on January 9, 2019. The ILPT Hawaii Portfolio Whole Loan is comprised of 18 promissory notes, which arepari passu with each other, with an aggregate original principal balance of $650,000,000. Promissory Note A-5-4, in the original principal balance of $40,000,000, represents the ILPT Hawaii Portfolio Mortgage Loan and will be included in the BANK 2019-BNK18 securitization trust. Of the remaining 17 promissory notes representing the ILPT Hawaii Portfolio Whole Loan (collectively, the “ILPT Hawaii Portfolio Non-ServicedPari PassuCompanion Loans”), Promissory Notes A-1, A-2, A-3, A-4, A-5-1, A-6-1, A-7-1, A-8-1 and A-9, in the aggregate original principal balance of $390,000,000, were contributed to the ILPT Trust 2019-SURF securitization trust. The ILPT Hawaii Portfolio Whole Loan will be serviced pursuant to the trust and servicing agreement for the ILPT Trust 2019-SURF securitization trust. The remaining 8 ILPT Hawaii Portfolio Non-ServicedPari PassuCompanion Loans, which had an aggregate original principal balance of $220,000,000, have been or are expected to be contributed to one or more future securitization transactions or may be otherwise transferred at any time. See “Description of the Mortgage Pool—The Whole Loans—The Non-Serviced Pari Passu Whole Loans” and “Pooling and Servicing Agreement—Servicing of the Non-Serviced Mortgage Loans” in the Preliminary Prospectus.
| ILPT Hawaii Portfolio Whole Loan Summary | ||||
| Note | Original Balance | Cut-off Date Balance | Anticipated Note Holder | Lead Servicing Interest(1) |
| ILPT Hawaii Portfolio Mortgage Loan | ||||
| A-5-4 | $40,000,000 | $40,000,000 | BANK 2019-BNK18 | No |
| ILPT Hawaii Portfolio Non-ServicedPari Passu Companion Loans | ||||
| A-1 | $162,500,000 | $162,500,000 | ILPT Trust 2019-SURF | Yes |
| A-2 | $65,000,000 | $65,000,000 | ILPT Trust 2019-SURF | No |
| A-3 | $35,000,000 | $35,000,000 | ILPT Trust 2019-SURF | No |
| A-4 | $32,500,000 | $32,500,000 | ILPT Trust 2019-SURF | No |
| A-5-1 | $32,500,000 | $32,500,000 | ILPT Trust 2019-SURF | No |
| A-5-2 | $50,000,000 | $50,000,000 | BANK 2019-BNK17 | No |
| A-5-3 | $40,000,000 | $40,000,000 | MSBNA | No |
| A-6-1 | $13,000,000 | $13,000,000 | ILPT Trust 2019-SURF | No |
| A-6-2 | $22,000,000 | $22,000,000 | CREFI | No |
| A-6-3 | $30,000,000 | $30,000,000 | CREFI | No |
| A-7-1 | $13,000,000 | $13,000,000 | ILPT Trust 2019-SURF | No |
| A-7-2 | $23,000,000 | $23,000,000 | UBS 2019-C16 | No |
| A-8-1 | $6,500,000 | $6,500,000 | ILPT Trust 2019-SURF | No |
| A-8-2 | $26,000,000 | $26,000,000 | JPMCB | No |
| A-9 | $30,000,000 | $30,000,000 | ILPT Trust 2019-SURF | No |
| A-10 | $28,000,000 | $28,000,000 | UBS AG | No |
| A-11 | $1,000,000 | $1,000,000 | UBS AG | No |
| Total | $650,000,000 | $650,000,000 | ||
| (1) | All notes held in the ILPT Trust 2019-SURF securitization trust together constitute the controlling notes for the ILPT Hawaii Portfolio Whole Loan. |
The proceeds of the ILPT Hawaii Portfolio Whole Loan were used to pay down the borrower sponsor’s unsecured revolving credit facility, pay closing costs and return equity to the borrower sponsor.
The Borrower and the Sponsor. The borrowers are Higgins Properties LLC, Masters Properties LLC, Robin 1 Properties LLC, Tanaka Properties LLC, ILPT TSM Properties LLC, Z&A Properties LLC, LTMAC Properties LLC, ILPT Orville Properties LLC, RFRI Properties LLC, and TedCal Properties LLC (collectively, the “ILPT Hawaii Portfolio Borrowers”), each a Delaware limited liability company structured to be bankruptcy-remote with two independent directors. Legal counsel to the ILPT Hawaii Portfolio Borrowers delivered a non-consolidation opinion in connection with the origination of the ILPT Hawaii Portfolio Whole Loan. Industrial Logistics Properties Trust (“ILPT”) is the borrower sponsor and non-recourse carveout guarantor with respect to the ILPT Hawaii Portfolio Whole Loan. The obligations of ILPT for any guaranteed obligations for which the ILPT Hawaii Portfolio Whole Loan documents provide full recourse (consisting generally of bankruptcy related events) is capped at 15% of the outstanding principal balance of the ILPT Hawaii Portfolio Whole Loan.
ILPT is a real estate investment trust (“REIT”) formed to own and lease industrial and logistics properties throughout the United States. As of September 30, 2018, ILPT owned 269 industrial and logistics properties with approximately 29.2 million rentable SF, which were approximately 99.3% leased to 245 tenants with a weighted average remaining lease term of approximately 10.9 years. Approximately 58.8% of ILPT’s annualized rental revenues as of September 30, 2018 come from 226 properties (buildings, leasable land parcels and easements) with approximately 16.8 million SF located on the island of Oahu, Hawaii, most of which are long-term ground leases to tenants that have constructed buildings and operate businesses on land owned by ILPT.
This is not a research report and was not prepared by any Underwriter’s research department. Please see additional important information and qualifications at the end of this Term Sheet.
T-103
| Various | Loan #9 | Cut-off Date Balance: | $40,000,000 | |
| Various | ILPT Hawaii Portfolio | Cut-off Date LTV: | 45.2% | |
| Honolulu, HI Various | U/W NCF DSCR: | 2.40x | ||
| U/W NOI Debt Yield: | 10.6% |
The Properties. The ILPT Hawaii Portfolio consists of a total of 186 properties that are wholly owned in fee by the ILPT Hawaii Portfolio Borrowers, consisting of the 177 Leased Fee Properties (where the ILPT Hawaii Portfolio Borrowers own the land but not any of the related improvements, which improvements are owned by the applicable ground lessees) comprised of 9,266,124 SF of land and the nine Fee Simple Properties (where the ILPT Hawaii Portfolio Borrowers own both the land and the related improvements) comprised of 325,388 SF of building square footage. References herein to “SF” mean square feet of land with respect to the Leased Fee Properties and building square feet with respect to the Fee Simple Properties. Of the properties, 176 properties, comprising approximately 91.7% of ILPT Hawaii Portfolio SF, are primarily improved with industrial/warehouse distribution facilities that contribute 91.1% of underwritten base rent. The remaining properties are improved with (i) six retail properties comprising approximately 5.6% of ILPT Hawaii Portfolio SF and contributing 6.3% of underwritten base rent, and (ii) four office properties comprising approximately 2.7% of ILPT Hawaii Portfolio SF and 2.6% of underwritten base rent, along with a 30,000 SF fee simple-owned parking lot serving one such property. The ILPT Hawaii Portfolio has an average historical occupancy of approximately 99.5% from 2003 (when the ILPT Hawaii Portfolio was acquired by the borrower sponsor) through 2018. References herein to “occupancy” mean the percentage of the ILPT Hawaii Portfolio SF (including both land SF and building SF) that is occupied. During the same time period, ILPT has renewed ground leases with existing tenants at an annual rent increase of 20% above prior levels and has entered into ground leases with new tenants at an average rent premium of 28% above the prior comparable lease. Tenants of the ILPT Hawaii Portfolio have typically signed longer term leases and/or renewed their leases, with a weighted average tenancy of approximately 20.5 years as of the Cut-off Date.
Based on the rent roll as of December 13, 2018, the ILPT Hawaii Portfolio was over 99.9% leased by a diverse mix of both national and local tenants. The largest tenant, Servco Pacific, Inc., occupies approximately 5.6% of the ILPT Hawaii Portfolio SF and contributes approximately 5.5% of underwritten base rent. The top 10 largest tenants by SF occupy approximately 30.9% of the ILPT Hawaii Portfolio SF and contribute approximately 28.4% of underwritten base rent, and the top 20 largest tenants by SF occupy approximately 43.9% of the ILPT Hawaii Portfolio SF and contribute approximately 42.7% of underwritten base rent. Overall, the ILPT Hawaii Portfolio has more than 170 tenants, with only one vacant suite totaling 900 SF. The ILPT Hawaii Portfolio benefits from well distributed rollover during the loan term, with the largest amount of rollover occurring in 2022, when leases comprising approximately 22.7% of the ILPT Hawaii Portfolio SF and 22.3% of underwritten base rent expire. The weighted average remaining lease term at the ILPT Hawaii Portfolio is approximately 14.3 years as of May 2019, and approximately 52.9% of the ILPT Hawaii Portfolio SF and 50.2% of underwritten base rent rolls after the maturity of the ILPT Hawaii Portfolio Whole Loan.
The following table presents certain information relating to the ILPT Hawaii Portfolio:
ILPT Hawaii Portfolio Summary | ||||||||
| Property Type | Net Rentable Area (SF) | % SF | Occupancy | UW Base Rent(1) | UW Base Rent PSF(1) | % of UW Base Rent | Appraised Value(2) | Allocated Loan Amount |
| Leased Fee Industrial | 8,498,906 | 88.6% | 100.0% | $56,700,212 | $6.67 | 85.2% | $1,227,695,000 | $554,507,903 |
| Fee Simple Industrial(3) | 295,388 | 3.1% | 99.7% | $3,946,788 | $13.40 | 5.9% | $75,500,000 | $34,100,772 |
| Sub-total Industrial: | 8,794,294 | 91.7% | 100.0% | $60,647,000 | $6.90 | 91.1% | $1,303,195,000 | $588,608,675 |
| Leased Fee Retail | 533,736 | 5.6% | 100.0% | $4,204,900 | $7.88 | 6.3% | $96,265,000 | $43,479,613 |
| Leased Fee Office(4) | 263,482 | 2.7% | 100.0% | $1,699,820 | $6.45 | 2.6% | $39,657,000 | $17,911,713 |
| Total/Wtd. Avg.: | 9,591,512 | 100.0% | 100.0% | $66,551,720 | $6.94 | 100.0% | $1,439,117,000 | $650,000,000 |
| (1) | UW Base Rent and UW Base Rent PSF include $3,723,524 ($0.39 PSF) of rent steps through January 15, 2020. |
| (2) | Based on the appraisals as of December 2018. |
| (3) | Fee Simple Industrial UW Base Rent PSF excludes 900 SF of vacant space. |
| (4) | Leased Fee Office also includes a 30,000 SF fee simple-owned parking lot at 1052 Ahua Street, which serves as additional parking for the leased fee office asset at 2828 Paa Street. |
This is not a research report and was not prepared by any Underwriter’s research department. Please see additional important information and qualifications at the end of this Term Sheet.
T-104
| Various | Loan #9 | Cut-off Date Balance: | $40,000,000 | |
| Various | ILPT Hawaii Portfolio | Cut-off Date LTV: | 45.2% | |
| Honolulu, HI Various | U/W NCF DSCR: | 2.40x | ||
| U/W NOI Debt Yield: | 10.6% |
The following table presents certain information relating to the leases at the ILPT Hawaii Portfolio:
| Tenant Summary(1) | ||||||||
| Tenant Name | Credit Rating (Fitch/Moody’s/S&P)(2) | Tenant SF | Approximate % of SF | Annual UW Base Rent(3) | Annual UW Base Rent PSF(3) | % of Total Annual UW Base Rent | Lease Expiration | Termination Option |
| Servco Pacific, Inc. | NR/NR/NR | 537,302 | 5.6% | $3,672,284 | $6.83 | 5.5% | 1/31/2064 | N |
| Coca-Cola Bottling of Hawaii, LLC | NR/NR/NR | 350,869 | 3.7% | $2,014,399 | $5.74 | 3.0% | Various(4) | N |
| Manheim Remarketing, Inc. | BBB+/Baa2/BBB | 337,734 | 3.5% | $2,450,346 | $7.26 | 3.7% | 4/30/2021(5) | N |
| Bradley Shopping Center Company | NR/NR/NR | 333,887 | 3.5% | $1,515,847 | $4.54 | 2.3% | 4/22/2033 | N |
| Honolulu Warehouse Co., Ltd. | NR/NR/NR | 298,384 | 3.1% | $1,775,385 | $5.95 | 2.7% | 1/31/2044 | N |
| Warehouse Rentals, Inc. | NR/NR/NR | 277,830 | 2.9% | $1,877,409 | $6.76 | 2.8% | 12/31/2049 | N |
| A.L. Kilgo Company, Inc. | NR/NR/NR | 276,283 | 2.9% | $1,913,320 | $6.93 | 2.9% | 12/31/2028 | N |
| Kaiser Foundation Health Plan, Inc. | NR/NR/AA- | 217,264 | 2.3% | $1,393,324 | $6.41 | 2.1% | Various(6) | N |
| Pahounui Partners, LLC | NR/NR/NR | 190,836 | 2.0% | $1,269,059 | $6.65 | 1.9% | 6/30/2027 | N |
| New Age Service Hawaii, Inc. | NR/NR/NR | 147,444 | 1.5% | $1,039,548 | $7.05 | 1.6% | Various(7) | N |
| Subtotal/Wtd. Avg. | 2,967,833 | 30.9% | $18,920,921 | $6.38 | 28.4% | |||
| Other Tenants | 6,621,709 | 69.0% | $47,630,799 | $7.19 | 71.6% | |||
| Vacant Space(8) | 1,970 | 0.0% | $0 | $0.00 | 0.0% | |||
| Total/Wtd. Avg. | 9,591,512 | 100.0% | $66,551,720 | $6.94 | 100.0% | |||
| (1) | Information is based on the underwritten rent roll. |
| (2) | Certain ratings are those of the parent company, whether or not the parent guarantees the lease. |
| (3) | Annual UW Base Rent and Annual UW Base Rent PSF include contractual rent escalations of $3,723,524 ($0.39 PSF) through January 15, 2020. |
| (4) | Coca-Cola Bottling of Hawaii, LLC leases 34,755 SF through December 31, 2022 and 316,114 SF through July 31, 2039. |
| (5) | Manheim Remarketing, Inc. has one lease extension option through March 31, 2026 with an annual rent during the lease extension of the greater of (i) fair market rent and (ii) $7.40 PSF annually. |
| (6) | Kaiser Foundation Health Plan, Inc. leases 30,000 SF through April 30, 2026 and 187,264 SF through June 30, 2046. Kaiser Foundation Health Plan, Inc. has two, 10-year lease extension options for its 30,000 SF lease through April 30, 2046 at fixed rent and two, 10-year lease extension options for its 187,264 SF lease through June 30, 2066 at fixed rent. |
| (7) | New Age Service Hawaii, Inc. leases 52,250 SF through May 31, 2032, 38,294 SF through April 30, 2033 and 56,900 SF through June 30, 2035. |
| (8) | Vacant Space includes 1,070 of structurally non-rentable SF and 900 SF of rentable space. |
The following table presents certain information relating to the lease rollover schedule at the ILPT Hawaii Portfolio:
| Lease Rollover Schedule(1)(2) | ||||||||
| Year | # of Leases Rolling | SF Rolling | Approx. % of Total SF Rolling | Approx. Cumulative % of SF Rolling | UW Base Rent PSF Rolling(3) | Total UW Base Rent Rolling(3) | Approx. % of Base Rent Rolling | Approx. Cumulative % of Total Rent Rolling |
| 2019 | 3 | 15,075 | 0.2% | 0.2% | $11.86 | $178,748 | 0.3% | 0.3% |
| 2020 | 13 | 134,341 | 1.4% | 1.6% | $10.01 | $1,344,996 | 2.0% | 2.3% |
| 2021 | 18 | 423,540 | 4.4% | 6.0% | $8.19 | $3,468,102 | 5.2% | 7.5% |
| 2022 | 66 | 2,179,785 | 22.7% | 28.7% | $6.80 | $14,813,268 | 22.3% | 29.8% |
| 2023 | 9 | 158,095 | 1.6% | 30.3% | $8.14 | $1,286,858 | 1.9% | 31.7% |
| 2024 | 3 | 116,146 | 1.2% | 31.6% | $8.19 | $951,543 | 1.4% | 33.1% |
| 2025 | 5 | 96,154 | 1.0% | 32.6% | $8.47 | $814,396 | 1.2% | 34.3% |
| 2026 | 2 | 56,000 | 0.6% | 33.1% | $9.53 | $533,599 | 0.8% | 35.1% |
| 2027 | 3 | 338,166 | 3.5% | 36.7% | $7.49 | $2,534,423 | 3.8% | 39.0% |
| 2028 | 22 | 1,002,799 | 10.5% | 47.1% | $7.20 | $7,222,059 | 10.9% | 49.8% |
| 2029 | 3 | 122,819 | 1.3% | 48.4% | $7.48 | $918,544 | 1.4% | 51.2% |
| 2030 & Beyond | 79 | 4,946,622 | 51.6% | 100.0% | $6.57 | $32,485,183 | 48.8% | 100.0% |
| Vacant(4) | 0 | 1,970 | 0.0% | 100.0% | $0.00 | $0 | 0.0% | 100.0% |
| Total/Wtd. Avg.(5) | 226 | 9,591,512 | 100.0% | $6.94 | $66,551,720 | 100.0% | ||
| (1) | Information is based on the underwritten rent roll. |
| (2) | Certain tenants may have lease termination options that are exercisable prior to the originally stated expiration date of the related lease and that are not considered in the lease rollover schedule. |
| (3) | UW Base Rent PSF Rolling and Total UW Base Rent Rolling include $3,723,524 ($0.39 PSF) of rent steps through January 15, 2020. |
| (4) | Vacant space includes 1,070 SF of structurally non-rentable SF and 900 SF of rentable space. |
| (5) | Wtd. Avg. UW Base Rent PSF Rolling excludes vacant space. |
This is not a research report and was not prepared by any Underwriter’s research department. Please see additional important information and qualifications at the end of this Term Sheet.
T-105
| Various | Loan #9 | Cut-off Date Balance: | $40,000,000 | |
| Various | ILPT Hawaii Portfolio | Cut-off Date LTV: | 45.2% | |
| Honolulu, HI Various | U/W NCF DSCR: | 2.40x | ||
| U/W NOI Debt Yield: | 10.6% |
The Market. The properties that comprise the ILPT Hawaii Portfolio are primarily located in Honolulu’s industrial/commercial district, and comprise approximately 220 contiguous acres adjacent to Honolulu International Airport with direct access to the H-1 Freeway, Moanalua Freeway and Nimitz Highway, and are a two-mile drive from Honolulu Harbor. The ILPT Hawaii Portfolio is concentrated in two substantial infill locations and benefits from its proximity to Honolulu International Airport and Honolulu Harbor. Hawaii imports approximately 80% of what it consumes and approximately 95% of its imports enter through its commercial harbors. The ILPT Hawaii Portfolio’s location is a last-mile location for many institutional entities located in Oahu and an important one for many local businesses. The Oahu industrial market exhibited a 1.85% vacancy rate as of the third quarter of 2018 and has remained under 2% for the last three years. At the same time, rents have grown, with the market achieving a 5.9% average annual rent increase from 2011 to 2017.
| Oahu Industrial Market Statistics | |||||||||
| Period | Number of Buildings | Building Area (SF) | Available Space (SF) | YTD Net Absorption (SF) | Vacancy Rate | Wtd. Avg. Asking Rent (Monthly) | Wtd. Avg. Asking Rent (Annually) | Avg. Net Op. Exp. (Monthly) | Avg. Net Op. Exp. (Annually) |
| 2009 | 1,760 | 38,197,898 | 1,834,993 | -210,641 | 4.80% | $0.99 | $11.88 | $0.32 | $3.84 |
| 2010 | 1,777 | 38,530,034 | 1,828,951 | 6,042 | 4.75% | $0.99 | $11.88 | $0.32 | $3.84 |
| 2011 | 1,798 | 38,896,094 | 1,860,883 | -32,267 | 4.78% | $0.92 | $11.04 | $0.31 | $3.72 |
| 3Q2012(1) | 1,809 | 39,211,146 | 1,674,614 | 186,269 | 4.27% | $0.98 | $11.76 | $0.34 | $4.08 |
| 2013 | 1,854 | 40,372,428 | 1,093,009 | 375,959 | 2.71% | $0.99 | $11.88 | $0.37 | $4.44 |
| 2014 | 1,843 | 39,230,336 | 830,303 | 262,706 | 2.12% | $1.10 | $13.20 | $0.43 | $5.16 |
| 2015 | 1,799 | 39,768,281 | 657,117 | 173,186 | 1.65% | $1.13 | $13.56 | $0.35 | $4.20 |
| 2016 | 1,804 | 39,950,156 | 638,535 | 64,582 | 1.60% | $1.21 | $14.52 | $0.35 | $4.20 |
| 2017 | 1,781 | 40,193,894 | 795,757 | -157,222 | 1.98% | $1.30 | $15.60 | $0.37 | $4.44 |
| 3Q2018 | 1,788 | 40,415,322 | 746,038 | 49,719 | 1.85% | $1.23 | $14.76 | $0.40 | $4.80 |
Source:Appraisal.
| (1) | Year end 2012 figures were unavailable. |
170 of the 177 Leased Fee Properties, as well as all nine Fee Simple Properties, are in the Honolulu Industrial node, which consists of the Kalihi, Sand Island, Mapunapuna and Airport submarkets, which are comprised of a range of commercial and industrial uses. Market statistics as of the third quarter of 2018 are highlighted in the table below.
| Oahu Industrial Market Statistics | ||||||||
| Submarket | Number of Buildings | Building Area (SF) | Tenure | Available Space (SF) | 3Q 2018 Net Absorption (SF) | Vacancy Rate | Wtd. Avg. Asking Rent PSF (Monthly) | Avg. Net Op. Exp. PSF (Monthly) |
| Kalihi | 707 | 9,612,549 | Fee Simple | 215,094 | (9,129) | 2.24% | $1.19 | $0.42 |
| Sand Island | 74 | 663,005 | Leasehold | 1,125 | 1,240 | 0.17% | $1.40 | $0.33 |
| Mapunapuna | 107 | 4,214,301 | Leasehold | 20,900 | 0 | 0.50% | $1.41 | $0.31 |
| Airport | 125 | 4,641,933 | Fee Simple | 22,000 | 12,579 | 0.47% | $1.00 | $0.28 |
Source: Appraisal.
| Kalihi Submarket Area | Sand Island Submarket Area | |||||||||
| Period | Quarterly Net Absorption | Vacancy Rate | Wtd. Avg. Asking Rent PSF (Monthly) | Avg. Net Op. Exp. (Monthly) | Period | Quarterly Net Absorption | Vacancy Rate | Wtd. Avg. Asking Rent PSF (Monthly) | Avg. Net Op. Exp. (Monthly) | |
| 1Q2016 | 15,890 | 1.81% | $1.22 | $0.36 | 1Q2016 | (4,500) | 2.56% | $0.82 | $0.30 | |
| 2Q2016 | 19,548 | 1.60% | $1.12 | $0.33 | 2Q2016 | 0 | 2.56% | $0.82 | $0.30 | |
| 3Q2016 | (22,471) | 1.83% | $1.09 | $0.38 | 3Q2016 | (14,443) | 0.00% | $0.00 | $0.30 | |
| 4Q2016 | (32,539) | 2.17% | $1.17 | $0.41 | 4Q2016 | (5,500) | 0.97% | $1.36 | $0.30 | |
| 1Q2017 | 8,603 | 2.08% | $1.11 | $0.40 | 1Q2017 | 0 | 0.97% | $1.36 | $0.30 | |
| 2Q2017 | (73,547) | 2.85% | $1.29 | $0.48 | 2Q2017 | (4,080) | 1.68% | $1.36 | $0.30 | |
| 3Q2017 | 28,007 | 2.55% | $1.27 | $0.50 | 3Q2017 | 9,580 | 0.00% | $1.36 | $0.30 | |
| 4Q2017 | 30,749 | 2.23% | $1.28 | $0.38 | 4Q2017 | (5,097) | 0.77% | $1.36 | $0.32 | |
| 1Q2018 | (23,764) | 2.46% | $1.17 | $0.40 | 1Q2018 | 3,857 | 0.19% | $1.40 | $0.32 | |
| 2Q2018 | 28,970 | 2.16% | $1.17 | $0.40 | 2Q2018 | (1,125) | 0.36% | $1.40 | $0.32 | |
| 3Q2018 | (9,129) | 2.24% | $1.19 | $0.42 | 3Q2018 | 1,240 | 0.17% | $1.40 | $0.33 | |
Source: Appraisal.
This is not a research report and was not prepared by any Underwriter’s research department. Please see additional important information and qualifications at the end of this Term Sheet.
T-106
| Various | Loan #9 | Cut-off Date Balance: | $40,000,000 | |
| Various | ILPT Hawaii Portfolio | Cut-off Date LTV: | 45.2% | |
| Honolulu, HI Various | U/W NCF DSCR: | 2.40x | ||
| U/W NOI Debt Yield: | 10.6% |
| Mapunapuna Submarket Area | Airport Submarket Area | ||||||||
| Period | Quarterly Net Absorption | Vacancy Rate | Wtd. Avg. Asking Rent PSF (Monthly) | Avg. Net Op. Exp. (Monthly) | Period | Quarterly Net Absorption | Vacancy Rate | Wtd. Avg. Asking Rent PSF (Monthly) | Avg. Net Op. Exp. (Monthly) |
| 1Q2016 | 15,124 | 0.66% | $1.22 | $0.43 | 1Q2016 | 29,527 | 0.11% | $1.20 | $0.30 |
| 2Q2016 | (6,852) | 0.83% | $1.21 | $0.40 | 2Q2016 | 0 | 0.11% | $1.20 | $0.30 |
| 3Q2016 | 8,248 | 0.63% | $1.35 | $0.40 | 3Q2016 | (35,800) | 0.88% | $1.20 | $0.30 |
| 4Q2016 | 18,250 | 0.19% | $1.20 | $0.35 | 4Q2016 | 5,300 | 0.77% | $1.02 | $0.28 |
| 1Q2017 | (3,020) | 0.27% | $1.22 | $0.35 | 1Q2017 | 13,300 | 0.48% | $0.85 | $0.28 |
| 2Q2017 | 0 | 0.27% | $1.22 | $0.35 | 2Q2017 | 0 | 0.48% | $0.85 | $0.28 |
| 3Q2017 | 41,404 | 1.25% | $1.27 | $0.40 | 3Q2017 | 22,500 | 0.00% | $0.85 | $0.28 |
| 4Q2017 | 34,072 | 0.44% | $1.08 | $0.33 | 4Q2017 | 0 | 0.00% | $0.85 | $0.28 |
| 1Q2018 | 3,086 | 0.37% | $1.41 | $0.26 | 1Q2018 | (29,520) | 0.64% | $1.08 | $0.28 |
| 2Q2018 | (5,480) | 0.50% | $1.41 | $0.31 | 2Q2018 | (5,059) | 0.74% | $1.08 | $0.28 |
| 3Q2018 | 0 | 0.50% | $1.41 | $0.31 | 3Q2018 | 12,579 | 0.47% | $1.00 | $0.28 |
Source: Appraisal.
Summaries of the appraiser’s market ground rent conclusions for the Mapunapuna and Sand Island submarkets is presented in the below chart. The appraiser concluded market ground rent of $8.59 PSF for Mapunapuna and $7.75 PSF for Sand Island. The weighted average underwritten base rent for the 177 Leased Fee Properties is approximately $6.73 PSF, which is below market.
| Summary of Comparable Ground Rents - Mapunapuna | ||||||
| Property Location | Transaction Type | Reset Date | Size (Acres) | Size (SF) | Actual Annual Rent PSF | MC Adjusted Annual Rent PSF(1) |
| 1000 Mapunapuna Street | Ground Rent Reset | July 2017 | 0.960 | 41,833 | $8.23 | $8.58 |
| 803 Ahua Street | Ground Rent Reset | May 2018 | 1.676 | 73,013 | $8.88 | $8.88 |
| 669 Ahua Street | Ground Rent Reset | June 2018 | 0.803 | 35,000 | $8.25 | $8.25 |
| 842 Mapunapuna Street | Ground Rent Reset | November 2022 | 0.803 | 35,000 | $9.64 | $8.59 |
| 822 Mapunapuna Street | Ground Rent Reset | November 2022 | 0.803 | 35,000 | $9.64 | $8.59 |
| 692 Mapunapuna Street | Ground Rent Reset | January 2023 | 0.803 | 35,000 | $9.74 | $8.63 |
| 819 Ahua Street | Ground Rent Reset | January 2023 | 2.411 | 105,013 | $9.64 | $8.54 |
Source: Appraisal.
| Summary of Comparable Ground Rents – Sand Island | ||||||
| Property Location | Transaction Type | Reset Date | Size (Acres) | Size (SF) | Actual Annual Rent PSF | MC Adjusted Annual Rent PSF(1) |
| 158 Sand Island Access Road | Ground Rent Reset | January 2019 | 2.307 | 100,500 | $7.58 | $7.58 |
| 2250 Pahounui Drive | Ground Rent Reset | January 2019 | 1.736 | 75,627 | $7.70 | $7.70 |
| 2019 Kahai Street | Ground Rent Reset | January 2019 | 0.619 | 26,954 | $7.73 | $7.73 |
| 165 Sand Island Access Road | Ground Rent Reset | January 2019 | 0.359 | 15,677 | $7.73 | $7.73 |
| 218 Mohonua Place | Ground Rent Reset | January 2019 | 0.783 | 34,096 | $7.75 | $7.75 |
| 125 Puuhale Road | Ground Rent Reset | January 2019 | 0.712 | 31,006 | $7.75 | $7.75 |
| 2135 Auiki Street | Ground Rent Reset | January 2019 | 0.765 | 33,328 | $7.75 | $7.75 |
| 2264 Pahounui Drive | Ground Rent Reset | January 2019 | 0.760 | 33,103 | $7.75 | $7.75 |
| 2276 Pahounui Drive | Ground Rent Reset | January 2019 | 0.754 | 32,841 | $7.75 | $7.75 |
| 180 Sand Island Access Road | Ground Rent Reset | January 2019 | 1.534 | 66,828 | $7.89 | $7.89 |
| 2020 Auiki Street | Ground Rent Reset | January 2019 | 1.072 | 46,705 | $7.62 | $7.62 |
| 204 Sand Island Access Road | Ground Rent Reset | January 2019 | 0.759 | 33,078 | $7.75 | $7.75 |
Source: Appraisal.
| (1) | MC Adjusted Annual Rent PSF is equal to Actual Annual Rent PSF adjusted 3% annually for market conditions. |
This is not a research report and was not prepared by any Underwriter’s research department. Please see additional important information and qualifications at the end of this Term Sheet.
T-107
| Various | Loan #9 | Cut-off Date Balance: | $40,000,000 | |
| Various | ILPT Hawaii Portfolio | Cut-off Date LTV: | 45.2% | |
| Honolulu, HI Various | U/W NCF DSCR: | 2.40x | ||
| U/W NOI Debt Yield: | 10.6% |
Operating History and Underwritten Net Cash Flow.The following table presents certain information relating to the historical operating performance and the Underwritten Net Cash Flow of the ILPT Hawaii Portfolio:
| Cash Flow Analysis | ||||||
| 2015 | 2016 | 2017 | 10/31/2018 TTM | UW | UW PSF | |
| Total Rental Income | $57,794,802 | $59,050,133 | $60,614,287 | $62,463,516 | $72,071,712 | $7.51 |
| Total Recoveries | $11,804,235 | $12,418,670 | $13,144,715 | $13,907,140 | $14,798,912 | $1.54 |
| Total Other Income | $194,061 | $125,710 | $152,497 | $58,150 | $114,598 | $0.01 |
| Effective Gross Income | $69,793,098 | $71,594,513 | $73,911,499 | $76,428,806 | $86,985,222 | $9.07 |
| Real Estate Taxes | $11,203,237 | $11,786,584 | $12,396,068 | $13,111,618 | $14,032,983 | $1.46 |
| Insurance | $47,193 | $34,176 | $31,368 | $29,834 | $30,915 | $0.00 |
| Other Expenses | $2,871,227 | $4,229,190 | $4,606,709 | $5,447,157 | $4,157,535 | $0.43 |
| Total Expenses | $14,121,657 | $16,049,950 | $17,034,145 | $18,588,609 | $18,221,433 | $1.90 |
| Net Operating Income(1) | $55,671,441 | $55,544,563 | $56,877,354 | $57,840,197 | $68,763,789 | $7.17 |
| Capital Expenditures | $0 | $0 | $0 | $0 | $59,078 | $0.01 |
| TI/LC | $0 | $0 | $0 | $0 | $498,822 | $0.05 |
| Net Cash Flow | $55,671,441 | $55,544,563 | $56,877,354 | $57,840,197 | $68,205,889 | $7.11 |
| Occupancy %(2) | 100.0% | 99.5% | 100.0% | 100.0% | 100.0% | |
| NOI DSCR(3) | 1.96x | 1.96x | 2.00x | 2.04x | 2.42x | |
| NCF DSCR(3) | 1.96x | 1.96x | 2.00x | 2.04x | 2.40x | |
| NOI Debt Yield(3) | 8.6% | 8.5% | 8.8% | 8.9% | 10.6% | |
| NCF Debt Yield(3) | 8.6% | 8.5% | 8.8% | 8.9% | 10.5% | |
| (1) | The increase in UW Net Operating Income from 10/31/2018 TTM Net Operating Income is primarily attributed to (i) $3,723,524 ($0.39 PSF) of rent steps through January 15, 2020, (ii) $259,026 in percentage rent from three tenants based on certain sales/revenue figures: Bank of Hawaii (2969 Mapunapuna Street), SLSS Partners (808 Ahua Street), and Honolulu Warehouse Co., Ltd. (2850 Paa Street) and (iii) $5,260,967 in straight-line average of ground rent steps from January 2020 through January 2030. |
| (2) | As of the underwritten rent roll dated December 13, 2018, the ILPT Hawaii Portfolio is over 99.9% occupied. |
| (3) | Debt service coverage ratios and debt yields are based on the ILPT Hawaii Portfolio Whole Loan. |
Escrows and Reserves.
Real Estate Taxes - Solely during the continuance of a Cash Management Sweep Period (as defined below), the ILPT Hawaii Portfolio Borrowers are required to escrow monthly 1/12th of the annual estimated real estate taxes.
Insurance - Solely during the continuance of a Cash Management Sweep Period, the ILPT Hawaii Portfolio Borrowers are required to escrow monthly 1/12th of the annual estimated insurance premiums (unless the ILPT Hawaii Portfolio Borrowers maintain acceptable blanket insurance policies and the insurance premiums payable in connection therewith have been prepaid for not less than one year in advance, or, for the period of coverage under the insurance policies as to which certificates are delivered at loan origination, such period, if less than one year).
Lockbox and Cash Management.The ILPT Hawaii Portfolio Whole Loan is structured with a hard lockbox and springing cash management. The ILPT Hawaii Portfolio Borrowers are required to direct each tenant of the ILPT Hawaii Portfolio to deposit funds directly into the lockbox account, and to deposit any funds received by the ILPT Hawaii Portfolio Borrowers and property manager, notwithstanding such direction, into the lockbox account within two business days of receipt. If no Cash Management Sweep Period exists, amounts on deposit in the lockbox account are required to be disbursed to the ILPT Hawaii Portfolio Borrowers’ operating account on each business day. Upon the first occurrence of a Cash Management Sweep Period, the lender is required to establish, and the ILPT Hawaii Portfolio Borrowers are required to cooperate to establish, a lender-controlled cash management account. If a Cash Management Sweep Period exists, funds on deposit in the lockbox account are required to be transferred to a lender-controlled cash management account, and applied to make monthly deposits to the tax reserve and insurance reserve as described above under “Escrows and Reserves,” to pay debt service on the ILPT Hawaii Portfolio Whole Loan, to pay approved operating expenses in accordance with the annual budget (which is required to be reasonably approved by the lender during the continuance of a Cash Management Sweep Period) and extraordinary expenses approved by the lender, and to pay any remainder (i) during any Cash Management Sweep Period not caused by a Partial Debt Yield Event (as defined below) into a cash trap account or (ii) during a Cash Management Sweep Period caused by a Partial Debt Yield Event, 50% into the cash trap account, and 50% to the ILPT Hawaii Portfolio Borrowers. In each case, the amounts deposited in the cash trap account are required to be held as additional collateral for the ILPT Hawaii Portfolio Whole Loan during the continuance of the Cash Management Sweep Period; provided that, so long as no event of default is continuing under the ILPT Hawaii Portfolio Whole Loan, funds in the cash trap account are required to be applied to pay any shortfalls in debt service, to make deposits into the tax and insurance reserves to the extent amounts on deposit in the cash management account are insufficient, and, if requested by the ILPT Hawaii Portfolio Borrowers, to pay tenant improvements costs and allowances and leasing commissions for leases approved or deemed approved by the lender, capital expenditures set forth in the approved annual budget, management fees not to exceed 3.0% of operating income for the ILPT Hawaii Portfolio, and (subject to an annual cap of $100,000) REIT distributions to owners of the ILPT Hawaii Portfolio Borrowers.
A “Cash Management Sweep Period” will commence (a) upon the occurrence of an event of default under the loan documents, (b) upon the occurrence of a Debt Yield Event (as defined below) or (c) upon the occurrence of a Partial Debt Yield Event and will terminate upon (x) with respect to clause (a), the cure of such event of default, (y) with respect to clause (b), the termination of such Debt Yield Event, or (z) with respect to clause (c), the termination of such Partial Debt Yield Event.
This is not a research report and was not prepared by any Underwriter’s research department. Please see additional important information and qualifications at the end of this Term Sheet.
T-108
| Various | Loan #9 | Cut-off Date Balance: | $40,000,000 | |
| Various | ILPT Hawaii Portfolio | Cut-off Date LTV: | 45.2% | |
| Honolulu, HI Various | U/W NCF DSCR: | 2.40x | ||
| U/W NOI Debt Yield: | 10.6% |
A “Debt Yield Event” will commence if the debt yield for the ILPT Hawaii Portfolio Whole Loan is less than 6.75% at the end of two consecutive calendar quarters and will end if (i) the debt yield for the ILPT Hawaii Portfolio Whole Loan is equal to or greater than 6.75% for two consecutive calendar quarters, or (ii) the ILPT Hawaii Portfolio Borrowers have delivered to the lender a letter of credit in accordance with the loan documents in a face amount such that, if applied to reduce the principal balance of the ILPT Hawaii Portfolio Whole Loan, would result in a debt yield of at least 6.75%.
A “Partial Debt Yield Event” will occur if the debt yield for the ILPT Hawaii Portfolio Whole Loan is less than 7.25% at the end of two consecutive calendar quarters (and a Debt Yield Event does not exist) and will end if (i) the debt yield for the ILPT Hawaii Portfolio Whole Loan is equal to or greater than 7.25% for two consecutive calendar quarters, or (ii) the ILPT Hawaii Portfolio Borrowers have delivered to the lender a letter of credit in accordance with the loan documents in a face amount such that, if applied to reduce the principal balance of the ILPT Hawaii Portfolio Whole Loan, would result in a debt yield of at least 7.25%.
Additional Secured Indebtedness (not including trade debts).In addition to the ILPT Hawaii Portfolio Mortgage Loan, the ILPT Hawaii Portfolio also secures the ILPT Hawaii Portfolio Non-ServicedPari Passu Companion Loans, which have an aggregate Cut-off Date principal balance of $610,000,000. The ILPT Hawaii Portfolio Non-ServicedPari Passu Companion Loans accrue interest at the same rate as the ILPT Hawaii Portfolio Mortgage Loan. The ILPT Hawaii Portfolio Mortgage Loan ispari passu in right of payment with the ILPT Hawaii Portfolio Non-ServicedPari Passu Companion Loans. The holders of the ILPT Hawaii Portfolio Mortgage Loan and the ILPT Hawaii Portfolio Non-ServicedPari Passu Companion Loans have entered into a co-lender agreement which sets forth the allocation of collections on the ILPT Hawaii Portfolio Whole Loan. See “Description of the Mortgage Pool—The Whole Loans—The Non-Serviced Pari Passu Whole Loans” in the Preliminary Prospectus.
Mezzanine Loan and Preferred Equity.None.
Release of Property.Not permitted.
Right of First Refusal.A tenant at each of the 1052 Ahua Street, 2828 Paa Street, 2831 Kaihikapu Street, 2826 Kaihikapu Street, 1045 Mapunapuna Street and 918 Ahua Street Mortgaged Properties has a right of first refusal and/or right of first offer to purchase the related Mortgaged Property in the event of a proposed transfer of such Mortgaged Property. None of such rights of first refusal or first offer are applicable to a transfer of (i) any of the related Mortgaged Properties in connection with a foreclosure or deed-in-lieu of foreclosure or (ii) the entire ILPT Hawaii Portfolio.
Letter of Credit.None.
Terrorism Insurance.The ILPT Hawaii Portfolio Whole Loan documents require that the “all risk” insurance policy required to be maintained by the ILPT Hawaii Portfolio Borrowers provide coverage for terrorism in an amount equal to the full replacement cost of the ILPT Hawaii Portfolio and 24 months of business interruption insurance (in each case, subject to a cap with respect to non-owned improvements); provided that if the Terrorism Risk Insurance Program Reauthorization Act of 2015 or an extension thereof or a substantially similar program (“TRIPRA”) is in effect and continues to cover both foreign and domestic acts of terrorism, the lender is required to accept terrorism insurance with coverage against “covered acts” within the meaning of TRIPRA.
This is not a research report and was not prepared by any Underwriter’s research department. Please see additional important information and qualifications at the end of this Term Sheet.
T-109
| Hospitality – Full Service | Loan #10 | Cut-off Date Balance: | $40,000,000 | |
| 12681 Harbor Boulevard | Great Wolf Lodge Southern California | Cut-off Date LTV: | 49.5% | |
| Garden Grove, CA 92840 | U/W NCF DSCR: | 2.41x | ||
| U/W NOI Debt Yield: | 14.6% |
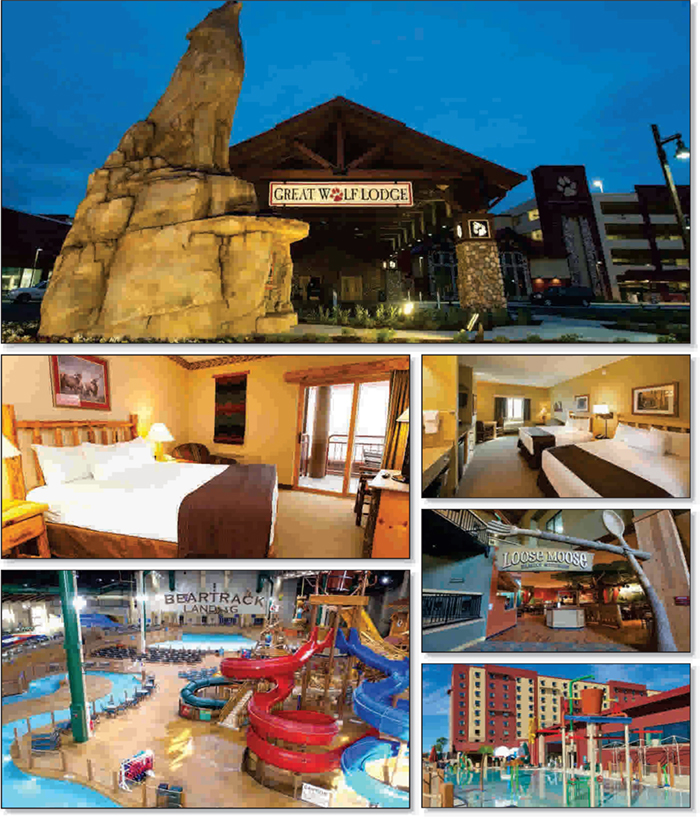
This is not a research report and was not prepared by any Underwriter’s research department. Please see additional important information and qualifications at the end of this Term Sheet.
T-110
| Hospitality – Full Service | Loan #10 | Cut-off Date Balance: | $40,000,000 | |
| 12681 Harbor Boulevard | Great Wolf Lodge Southern California | Cut-off Date LTV: | 49.5% | |
| Garden Grove, CA 92840 | U/W NCF DSCR: | 2.41x | ||
| U/W NOI Debt Yield: | 14.6% |
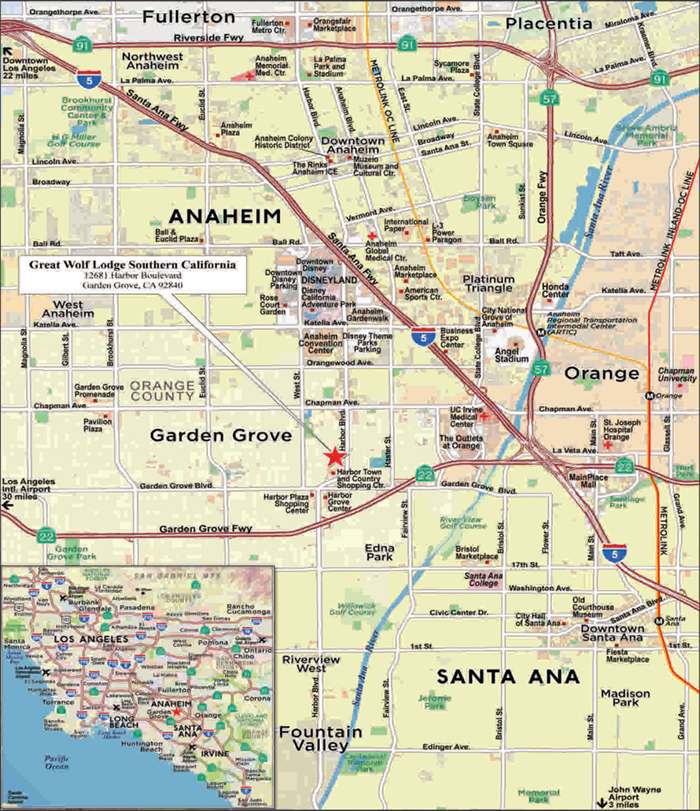
This is not a research report and was not prepared by any Underwriter’s research department. Please see additional important information and qualifications at the end of this Term Sheet.
T-111
| Hospitality – Full Service | Loan #10 | Cut-off Date Balance: | $40,000,000 | |
| 12681 Harbor Boulevard | Great Wolf Lodge Southern California | Cut-off Date LTV: | 49.5% | |
| Garden Grove, CA 92840 | U/W NCF DSCR: | 2.41x | ||
| U/W NOI Debt Yield: | 14.6% |
| Mortgage Loan No. 10 – Great Wolf Lodge Southern California |
| Mortgage Loan Information | Property Information | ||||||
| Mortgage Loan Seller: | WFB | Single Asset/Portfolio: | Single Asset | ||||
| Credit Assessment (Fitch/KBRA/Moody’s): | NR/NR/NR | Location: | Garden Grove, CA 92840 | ||||
| Original Balance(1): | $40,000,000 | General Property Type: | Hospitality | ||||
| Cut-off Date Balance(1): | $40,000,000 | Detailed Property Type: | Full Service | ||||
| % of Initial Pool Balance: | 3.8% | Title Vesting: | Fee | ||||
| Loan Purpose: | Refinance | Year Built/Renovated: | 2016/N/A | ||||
| Sponsors: | McWhinney Real Estate Services, Inc.; | Size: | 603 Rooms | ||||
| Chad McWhinney; Troy McWhinney; | Cut-off Date Balance per Room(1): | $248,756 | |||||
| Great Wolf Resorts, Inc. | Maturity Date Balance per Room(1): | $248,756 | |||||
| Guarantor: | McWhinney Holding Company, LLLP | Property Manager: | GWR Manager LLC | ||||
| Mortgage Rate(2): | 5.2533% | (borrower-related) | |||||
| Note Date: | 3/11/2019 | ||||||
| First Payment Date: | 4/11/2019 | ||||||
| Maturity Date: | 3/11/2029 | ||||||
| Original Term to Maturity: | 120 months | ||||||
| Original Amortization Term: | 0 months | ||||||
| IO Period: | 120 months | Underwriting and Financial Information | |||||
| Seasoning: | 2 months | UW NOI: | $21,885,939 | ||||
| Prepayment Provisions(3): | LO (26); DEF (87); O (7) | UW NOI Debt Yield(1): | 14.6% | ||||
| Lockbox/Cash Mgmt Status: | Soft/Springing | UW NOI Debt Yield at Maturity(1): | 14.6% | ||||
| Additional Debt Type(1)(4): | Pari Passu / Subordinate | UW NCF DSCR(1): | 2.41x | ||||
| Additional Debt Balance(1)(4): | $110,000,000 / $20,000,000 | Most Recent NOI: | $22,017,852 (1/31/2019 TTM) | ||||
| Future Debt Permitted (Type): | No (N/A) | 2nd Most Recent NOI(6): | $21,673,034 (12/31/2018) | ||||
| Reserves(5) | 3rd Most Recent NOI(6): | $16,784,192 (12/31/2017) | |||||
| Type | Initial | Monthly | Cap | Most Recent Occupancy: | 80.8% (1/31/2019) | ||
| RE Tax: | $0 | $244,016 | N/A | 2nd Most Recent Occupancy(6): | 80.3% (12/31/2018) | ||
| Insurance: | $0 | Springing | N/A | 3rd Most Recent Occupancy(6): | 69.6% (12/31/2017) | ||
| FF&E: | $0 | Springing | N/A | Appraised Value (as of): | $302,900,000 (11/28/2018) | ||
| Excess FF&E: | $2,000,000 | N/A | N/A | Appraised Value per Room(7): | $502,322 | ||
| Seasonality: | $0 | (5) | (5) | Cut-off Date LTV Ratio(7)(1): | 49.5% | ||
| Amortization: | $0 | Springing | N/A | Maturity Date LTV Ratio(1): | 49.5% | ||
| Sources and Uses | ||||||
| Sources | Proceeds | % of Total | Uses | Proceeds | % of Total | |
| Senior Loan(1): | $150,000,000 | 81.1% | Loan Payoff: | $180,192,917 | 97.4% | |
| Subordinate Loan(1): | $20,000,000 | 10.8% | Reserves: | $2,000,000 | 1.1% | |
| Cash Equity Contribution | $15,010,961 | 8.1% | Closing Costs: | $2,818,045 | 1.5% | |
| Total Sources: | $185,010,961 | 100.0% | Total Uses: | $185,010,961 | 100.0% | |
| (1) | The Cut-off Date Balance per Room, Maturity Date Balance per Room, UW NOI Debt Yield, UW NOI Debt Yield at Maturity, UW NCF DSCR, Cut-off Date LTV Ratio and Maturity Date LTV Ratio numbers presented above are based on the Great Wolf Lodge Southern California Senior Loan (as defined below). The Cut-off Date Balance per Room, Maturity Date Balance per Room, UW NOI Debt Yield, UW NOI Debt Yield at Maturity, UW NCF DSCR, Cut-off Date LTV Ratio and Maturity Date LTV Ratio numbers based on the Great Wolf Lodge Southern California Whole Loan (as defined below) are $281,924, $281,924, 12.9%, 12.9%, 1.89x, 56.1% and 56.1%, respectively. |
| (2) | The Great Wolf Lodge Southern California Mortgage Loan (as defined below) has an interest rate of 5.2533% and the Great Wolf Lodge Southern California Subordinate Companion Loan (as defined below) has an interest rate of 10.7500%. |
| (3) | Defeasance of the Great Wolf Lodge Southern California Whole Loan is permitted at any time after the earlier to occur of (a) the end of the two-year period commencing on the closing date of the securitization of the last Great Wolf Lodge Southern California Whole Loan to be securitized and (b) April 11, 2022. The assumed defeasance lockout period of 26 payments is based on the closing date of this transaction in May 2019. |
| (4) | See “The Mortgage Loan” and “Additional Secured Indebtedness (not including trade debts)” below for further discussion of additional debt. |
| (5) | See “Escrows and Reserves” below for further discussion of reserve requirements. |
| (6) | The increase in NOI and Occupancy from 2017 to 2018 was partly due to the fact that the Great Wolf Lodge Southern California Property opened in 2016 and was ramping up in performance over such time period. |
| (7) | The appraised value shown assumes that the Great Wolf Lodge Southern California Property is encumbered by the Disposition and Development Agreement and Transient Occupancy Tax rebates are due (See“Disposition and Development Agreement and Transient Occupancy Tax”below). The appraiser also concluded to a value of $293,300,000, which assumes that the Great Wolf Lodge Southern California Property is not encumbered by the Disposition and Development Agreement and no Transient Occupancy Tax rebates are due, which would equate to (i) a Cut-off Date LTV Ratio based on the Great Wolf Lodge Southern California Senior Loan of 51.1% and (ii) a Cut-off Date LTV Ratio based on the Great Wolf Lodge Southern California Whole Loan of 58.0%. |
This is not a research report and was not prepared by any Underwriter’s research department. Please see additional important information and qualifications at the end of this Term Sheet.
T-112
| Hospitality – Full Service | Loan #10 | Cut-off Date Balance: | $40,000,000 | |
| 12681 Harbor Boulevard | Great Wolf Lodge Southern California | Cut-off Date LTV: | 49.5% | |
| Garden Grove, CA 92840 | U/W NCF DSCR: | 2.41x | ||
| U/W NOI Debt Yield: | 14.6% |
The Mortgage Loan. The tenth largest mortgage loan (the “Great Wolf Lodge Southern California Mortgage Loan”) is part of a whole loan (the “Great Wolf Lodge Southern California Whole Loan”) in the original principal balance of $170,000,000. The Great Wolf Lodge Southern California Whole Loan is secured by a first priority fee mortgage encumbering a full service hospitality property located in Garden Grove, California (the “Great Wolf Lodge Southern California Property”). The Great Wolf Lodge Southern California Whole Loan consists of (i) five senior notes totaling $150,000,000, which arepari passu with each other (collectively, the “Great Wolf Lodge Southern California Senior Loan”), and (ii) a subordinate promissory note with an original principal balance of $20,000,000 (the “Great Wolf Lodge Southern California Subordinate Companion Loan”), which is held by KSL Capital Partners Co Trust II and is subordinate to the Great Wolf Lodge Southern California Senior Loan. The Great Wolf Lodge Southern California Mortgage Loan will be serviced pursuant to the pooling and servicing agreement for the WFCM 2019-C50 securitization trust. The Great Wolf Lodge Southern California Mortgage Loan represents the non-controlling Notes A-3 and A-5, which have an aggregate original principal balance of $40,000,000. The remaining Great Wolf Lodge Southern California Senior Loanpari passu notes are referred to herein as the “Great Wolf Lodge Southern CaliforniaPari PassuCompanion Loans”. See “Description of the Mortgage Pool—The Whole Loans—The Great Wolf Lodge Southern California Pari Passu A/B Whole Loan” and “Pooling and Servicing Agreement—Servicing of the Non-Serviced Mortgage Loans”in the Preliminary Prospectus.
| Great Wolf Lodge Southern California Whole Loan Summary | |||||
| Note(1) | Original Balance | Cut-off Date Balance | Note Holder | Lead Servicing Interest | |
| Great Wolf Lodge Southern California Mortgage Loan | |||||
| A-3 | $25,000,000 | $25,000,000 | BANK 2019-BNK18 | No | |
| A-5 | $15,000,000 | $15,000,000 | BANK 2019-BNK18 | No | |
| Great Wolf Lodge Southern California ServicedPari Passu Companion Loans | |||||
| A-1 | $35,000,000 | $35,000,000 | WFCM 2019-C50 | (2) | |
| A-2 | $25,000,000 | $25,000,000 | BANK 2019-BNK17 | No | |
| A-4(3) | $50,000,000 | $50,000,000 | Column Financial, Inc. | No | |
| Great Wolf Lodge Southern California Subordinate Companion Loan | |||||
| B-1 | $20,000,000 | $20,000,000 | KSL Capital Partners Co Trust II | (2) | |
| Total Great Wolf Lodge Southern California Whole Loan | $170,000,000 | $170,000,000 | |||
| (1) | The Great Wolf Lodge Southern California Subordinate Companion Loan is subordinate to the A-Notes. |
| (2) | The holder of the Great Wolf Lodge Southern California Subordinate Companion Loan will have the right to appoint the special servicer of the Great Wolf Lodge Southern California Whole Loan and to direct certain decisions with respect to the Great Wolf Lodge Southern California Whole Loan, unless a control appraisal event exists under the related co-lender agreement; provided that after the occurrence of a control appraisal event with respect to the Great Wolf Lodge Southern California Subordinate Companion Loan, the holder of the Great Wolf Lodge Southern California Note A-1 (or the directing certificate holder for the securitization trust that holds Note A-1) will have such rights. |
| (3) | The A-4 Note was sold to Column Financial, Inc. |
The Borrower and the Borrower Sponsors.The borrower is GWGG, LLC (the “Great Wolf Lodge Southern California Borrower”), a single-purpose Delaware limited liability company with two independent directors. The borrower sponsors are McWhinney Real Estate Services, Inc. (“McWhinney”), Chad McWhinney, Troy McWhinney, and Great Wolf Resorts, Inc. (“Great Wolf”); and the non-recourse carveout guarantor is McWhinney Holding Company, LLLP. The Great Wolf Lodge Southern California Borrower is owned by GWGG JV, LLC, a joint venture between MGWGG Investments, LLC (84.7% ownership interest), an entity managed by McWhinney and in which affiliates of McWhinney hold an ownership interest of at least 70.3%; and GWR Garden Grove, LLC (15.3% ownership interest), an affiliate of Great Wolf.
Founded in 1991 by Chad McWhinney, McWhinney’s holdings include approximately 1.2 million SF of commercial space (office, industrial, retail and mixed use), 2,293 hotel keys, 708 multifamily units and more than 2,700 acres of land. McWhinney holds ownership interest in three other hotels in the Anaheim area including the Hilton Garden Inn – Anaheim, Homewood Suites – Anaheim, and Hampton Inn – Anaheim.
Founded in 1997, Great Wolf is the largest indoor water park family resort company in North America and currently operates 15 properties across the United States and Canada, as well as two additional properties under construction and land owned for potential future developments. Great Wolf caters to family travelers, particularly those seeking a resort atmosphere that caters to both children and adults.
The Property.The Great Wolf Lodge Southern California Property is a nine-story, 603-room, full service water park resort hotel located in Garden Grove, California, approximately 2.2 miles south of Disneyland. Built in 2016, the Great Wolf Lodge Southern California Property is situated on an 11.7-acre site and amenities include a 105,000-square-foot indoor waterpark, fitness center, outdoor pool area, miniature golf course, bowling alley, movie theater, arcade, kid-friendly spa, 21,226 SF of meeting space, and multiple restaurants and retail outlets. The indoor waterpark includes a four-story treehouse water fort, 14 water slides, four splash pads and play pools, a surf simulator and large wave pool. In addition, the Great Wolf Lodge Southern California Property offers planned family activities and live performances.
The Great Wolf Lodge Southern California Property guestroom configuration includes 452 standard suites which sleep up to six people; 133 themed suites, including six-person Wolf Den suites with bunk beds and seven-person Kid Cabin suites with bunk beds and a day bed; and 18 premium suites which sleep six to eight people. The Great Wolf Lodge Southern California Property also contains a five-story parking garage with 1,048 parking spaces, equating to a parking ratio of 1.7 spaces per room. According to the appraisal, the demand segmentation at the Great Wolf Lodge Southern California Property is 91% leisure and 9% meeting & group.
The Great Wolf Lodge Southern California Property is not subject to a franchise agreement; however, a management and license agreement is in-place with GWR Manager LLC (an affiliate of Great Wolf) through February 2041. The loan documents require that the Great Wolf Lodge Southern California Property is managed by a “Qualified Manager”, which means one of the following entities: an affiliate of the current manager, Walt Disney Parks and Resorts, Kalahari, Wilderness, Marriott International, Hyatt Hotels Corporation, MGM Resorts International, Hilton Worldwide, IHG, Cedar Fair, Six Flags
This is not a research report and was not prepared by any Underwriter’s research department. Please see additional important information and qualifications at the end of this Term Sheet.
T-113
| Hospitality – Full Service | Loan #10 | Cut-off Date Balance: | $40,000,000 | |
| 12681 Harbor Boulevard | Great Wolf Lodge Southern California | Cut-off Date LTV: | 49.5% | |
| Garden Grove, CA 92840 | U/W NCF DSCR: | 2.41x | ||
| U/W NOI Debt Yield: | 14.6% |
Great Adventure, SeaWorld Parks and Entertainment, Merlin Entertainment, Wyndham, or an affiliate controlled by one of the foregoing operating any full service flag or brand with a STR Chainscale rating “Upscale” or higher, if such Qualified Manager has experience operating a substantial water amenity, or “Upper Upscale”, if such Qualified Manager does not have experience operating a substantial water amenity (or, in the case of IHG, “Upper Upscale” or higher), or a reputable and experienced organization possessing experience in managing or franchising full-service hotels (with waterpark) similar to the Great Wolf Lodge Southern California Property. Any replacement management agreement with a Qualified Manager is subject to written approval by the lender in the lender’s reasonable discretion, and such approval may be conditioned upon the lender’s receipt of rating agency confirmation.
The following table presents historical occupancy, ADR, and RevPAR penetration rates of the Great Wolf Lodge Southern California Property.
| Historical Occupancy, ADR, RevPAR(1)(2) | ||||||||||||
| Competitive Set | Great Wolf Lodge Southern California Property | Penetration Factor | ||||||||||
| Year | Occupancy | ADR | RevPAR | Occupancy | ADR(3) | RevPAR | Occupancy | ADR(3) | RevPAR | |||
| 1/31/2017 TTM(4) | 84.7% | $232.72 | $197.16 | 55.8% | $281.50 | $157.01 | 65.9% | 121.0% | 79.6% | |||
| 1/31/2018 TTM(4) | 84.8% | $238.85 | $202.59 | 71.2% | $264.26 | $188.19 | 84.0% | 110.6% | 92.9% | |||
| 1/31/2019 TTM | 84.3% | $249.47 | $210.31 | 82.1% | $251.45 | $206.42 | 97.4% | 100.8% | 98.2% | |||
Source:Industry Report.
| (1) | According to a third party research report, the competitive set includes Anaheim Majestic Garden Hotel, Hilton Anaheim, Disney’s Disneyland Hotel, Sheraton Park Hotel @ The Anaheim Resort, Disney’s Paradise Pier Hotel, Hyatt Regency Orange County, Delta Hotel Anaheim Garden Grove, Hyatt Regency Huntington Beach & Spa, Disney’s Grand Californian Hotel & Spa, DoubleTree by Hilton Suites Anaheim Resort Convention Center, Legoland California Resort Hotel, and Courtyard Anaheim Theme Park Entrance. |
| (2) | Variances between the underwriting, the appraisal, and third party research report with respect to Occupancy, ADR and RevPAR at the Great Wolf Lodge Southern California Property are attributable to variances in reporting methodologies and/or timing differences. |
| (3) | The ADRs shown above for the Great Wolf Lodge Southern California Property exclude the daily resort fee. The historical and underwritten ADRs represented in the“Operating History and Underwritten Net Cash Flow” section below are inclusive of the daily resort fee. |
| (4) | The increase in performance from 1/31/2017 TTM to 1/31/2018 TTM is partly due to the fact that the Great Wolf Lodge Southern California Property opened in 2016 and was ramping up in performance over such time period. |
The Market. The Great Wolf Lodge Southern California Property is located in Garden Grove, California, Orange County, approximately 4.3 miles south of downtown Anaheim, 2.2 miles south of Disneyland, 11.1 miles north of John Wayne Airport, 30.3 miles southeast of downtown Los Angeles, and 35.0 miles southeast of the Los Angeles International Airport. The Great Wolf Lodge Southern California Property is situated on Harbor Boulevard, which is a main north/south thoroughfare that connects the Great Wolf Lodge Southern California Property to the Anaheim Resort Area, Disneyland and the Interstate 5 on-ramp to the north. Additional attractions in the area include Knott’s Berry Farm (8.8 miles northwest), Angel Stadium (home to Major League Baseball’s Los Angeles Angels; 2.9 miles northeast) and the Anaheim Convention Center (1.7 miles north). The Anaheim Convention Center is the largest convention center on the West Coast and recently completed a $190.0 million expansion.
According to the appraisal, the Anaheim/Garden Grove market is experiencing a period of expansion, primarily led by the tourism and leisure industry. According to the appraisal, the Orange County economy is primarily driven by the tourism industry, which employs more than 140,000 people in the area. Orange County hosted approximately 49.5 million visitors in 2017, a 2.7% increase from 2016, which led to an economic impact of more than $12.5 billion, marking a 3.1% increase in visitor spending from 2016. The Walt Disney Corporation is the largest private-sector employer in Orange County, with approximately 31,000 employees, and Disneyland is one of the largest demand generators in the area. While Disney does not publish attendance data, a 2018 third party research report estimated that Disneyland hosted approximately 18.3 million visitors in 2017, which surpassed the previous peak in 2015 when the park celebrated its 60th anniversary.
According to the appraisal, the 2018 population within a three- and five-mile radius of the Great Wolf Lodge Southern California Property was 305,784 and 856,177, respectively. The 2018 average household income within the same radii was $76,916 and $76,996, respectively.
The appraisal identified six new hotels totaling approximately 2,000 rooms that are expected to have some degree of competitive interaction with the Great Wolf Lodge Southern California Property and are expected to be constructed in 2019 and 2020; however, none of these hotels are anticipated to compete directly with the Great Wolf Lodge Southern California Property.
This is not a research report and was not prepared by any Underwriter’s research department. Please see additional important information and qualifications at the end of this Term Sheet.
T-114
| Hospitality – Full Service | Loan #10 | Cut-off Date Balance: | $40,000,000 | |
| 12681 Harbor Boulevard | Great Wolf Lodge Southern California | Cut-off Date LTV: | 49.5% | |
| Garden Grove, CA 92840 | U/W NCF DSCR: | 2.41x | ||
| U/W NOI Debt Yield: | 14.6% |
Operating History and Underwritten Net Cash Flow. The following table presents certain information relating to the operating history and Underwritten Net Cash Flow at the Great Wolf Lodge Southern California Property:
| Cash Flow Analysis | ||||||
| 2016(1) | 2017(1) | 2018(1) | TTM 1/31/2019 | UW | UW per Room | |
| Occupancy | 56.0% | 69.6% | 80.3% | 80.8% | 80.8% | |
| ADR | $302.82 | $293.48 | $280.43 | $280.55 | $280.55 | |
| RevPAR | $174.35 | $204.29 | $225.14 | $226.80 | $226.80 | |
| Room Revenue | $37,321,683 | $44,962,428 | $49,532,819 | $49,916,915 | $49,916,915 | $82,781 |
| Food & Beverage Revenue | $12,651,097 | $15,786,521 | $18,549,243 | $18,659,206 | $18,659,206 | $30,944 |
| Other Income(2) | $9,801,978 | $12,432,751 | $15,836,332 | $16,156,718 | $16,156,718 | $26,794 |
| Total Revenue | $59,774,758 | $73,181,700 | $83,918,394 | $84,732,839 | $84,732,839 | $140,519 |
| Room Expense | $8,229,012 | $9,459,551 | $11,101,315 | $11,308,530 | $11,308,530 | $18,754 |
| Food & Beverage Expense | $10,057,613 | $11,069,358 | $11,906,573 | $12,095,948 | $12,095,948 | $20,060 |
| Other Departmental Expenses | $9,251,797 | $9,750,793 | $11,103,942 | $11,333,895 | $11,333,895 | $18,796 |
| Total Departmental Expenses | $27,538,422 | $30,279,702 | $34,111,830 | $34,738,373 | $34,738,373 | $57,609 |
| Gross Operating Income | $32,236,336 | $42,901,998 | $49,806,564 | $49,994,466 | $49,994,466 | $82,910 |
| Total Undistributed Expenses | $17,738,878 | $22,740,580 | $24,239,081 | $24,085,395 | $24,085,395 | $39,943 |
| Gross Operating Profit | $14,497,458 | $20,161,418 | $25,567,483 | $25,909,071 | $25,909,071 | $42,967 |
| Total Fixed Charges | $4,226,049 | $3,377,226 | $3,894,449 | $3,891,219 | $4,023,132 | $6,672 |
| Total Operating Expenses | $49,503,349 | $56,397,508 | $62,245,360 | $62,714,987 | $62,846,900 | $104,224 |
| Net Operating Income | $10,271,409 | $16,784,192 | $21,673,034 | $22,017,852 | $21,885,939 | $36,295 |
| FF&E | $0 | $0 | $0 | $0 | ($3,389,314) | ($5,621) |
| TOT Reimbursement(3) | $560,083 | $667,889 | $743,272 | $749,023 | $748,754 | $1,242 |
| Net Cash Flow | $10,831,492 | $17,452,081 | $22,416,306 | $22,766,875 | $19,245,379 | $31,916 |
| NOI DSCR(4) | 1.29x | 2.10x | 2.71x | 2.76x | 2.74x | |
| NCF DSCR(4) | 1.36x | 2.18x | 2.81x | 2.85x | 2.41x | |
| NOI Debt Yield(4) | 6.8% | 11.2% | 14.4% | 14.7% | 14.6% | |
| NCF Debt Yield(4) | 7.2% | 11.6% | 14.9% | 15.2% | 12.8% | |
| (1) | The increases in Net Operating Income from 2016 to 2018 were driven primarily by increases in Occupancy, Food & Beverage Revenue, and Other Income. The Great Wolf Lodge Southern California Property opened for business in 2016 and was ramping up performance over such time period. |
| (2) | Other Income consists of revenue from the waterpark, miniature golf, arcade games and other attractions, gift shop revenue, parking revenue, spa revenue, and other miscellaneous income. |
| (3) | Underwritten TOT Reimbursement is based on underwritten Room Revenue of $49,916,915 multiplied by the 2018 TOT Differential (as defined below) of 1.5% See“Disposition and Development Agreement and Transient Occupancy Tax” section below for further details on TOT reimbursement. |
| (4) | The debt service coverage ratios and debt yields shown are based on the Great Wolf Lodge Southern California Senior Loan, and excludes the Great Wolf Lodge Southern California Subordinate Companion Loan. |
Escrows and Reserves.
Real Estate Taxes - The Great Wolf Lodge Southern California Borrower is required to deposit ongoing monthly escrows for real estate taxes in an amount equal to one-twelfth of the real estate taxes that the lender estimates will be payable during the next twelve months (initially $244,016).
Insurance - The Great Wolf Lodge Southern California Borrower is not required to deposit ongoing monthly escrows for insurance as long as (i) no event of default has occurred and is continuing, (ii) the Great Wolf Lodge Southern California Borrower provides the lender with evidence that the insurance coverage for the Great Wolf Lodge Southern California Property is included in a blanket policy and such policy is in full force and effect, and (iii) the Great Wolf Lodge Southern California Borrower provides the lender with evidence of timely payment of the insurance premiums and renewals.
FF&E Reserve - The Great Wolf Lodge Southern California Borrower is not required to deposit ongoing monthly escrows for capital expenditures as long as (i) the current manager (or any affiliates) is the manager and the management agreement is in full force and effect, (ii) the manager reserves funds for capital expenditures which will be disbursed pursuant to the terms of the management agreement, and (iii) there is no default beyond any applicable notice and cure period under the management agreement.
Excess FF&E Reserve - The Great Wolf Lodge Southern California Borrower was required to deposit an upfront capital expenditure reserve of $2,000,000.
Seasonality Reserve - Upon the request of the lender, the Great Wolf Lodge Southern California Borrower is required to deposit monthly deposits from June 2019 through August 2019 and commencing in 2020 and each year thereafter, from March through August during the term of the Great Wolf Lodge
This is not a research report and was not prepared by any Underwriter’s research department. Please see additional important information and qualifications at the end of this Term Sheet.
T-115
| Hospitality – Full Service | Loan #10 | Cut-off Date Balance: | $40,000,000 | |
| 12681 Harbor Boulevard | Great Wolf Lodge Southern California | Cut-off Date LTV: | 49.5% | |
| Garden Grove, CA 92840 | U/W NCF DSCR: | 2.41x | ||
| U/W NOI Debt Yield: | 14.6% |
Southern California Whole Loan, into the seasonality reserve in an amount equal to the lesser of (a) $280,000 and (b) available net cash flow after all expenses and payments required under the loan documents. The Seasonality Reserve will be capped at an amount equal to two months of debt service (exclusive of any amortization payments).
Amortization Reserve – Based on the conditions outlined below, the Great Wolf Lodge Southern California Borrower will be required to commence depositing monthly payments into a reserve account consistent with the applicable hypothetical amortization schedules:
| (i) | As of April 1, 2022, if the net cash flow debt yield of the Great Wolf Lodge Southern California Whole Loan (inclusive of the Great Wolf Lodge Southern California Subordinate Companion Loan) is less than 12.0%, the Great Wolf Lodge Southern California Borrower will be required to deposit monthly payments consistent with a 30-year amortization schedule; |
| (ii) | As of April 1, 2024, if the net cash flow debt yield of the Great Wolf Lodge Southern California Whole Loan (inclusive of the Great Wolf Lodge Southern California Subordinate Companion Loan) is less than 13.0%, the Great Wolf Lodge Southern California Borrower will be required to deposit monthly payments consistent with a 27-year amortization schedule; and |
| (iii) | As of April 1, 2026, if the net cash flow debt yield of the Great Wolf Lodge Southern California Whole Loan (inclusive of the Great Wolf Lodge Southern California Subordinate Companion Loan) is less than 14.0%, the Great Wolf Lodge Southern California Borrower will be required to deposit monthly payments consistent with a 25-year amortization schedule. |
Lockbox and Cash Management. A soft lockbox with springing cash management is in-place with respect to the Great Wolf Lodge Southern California Whole Loan. The borrower and manager are required to deposit into the lockbox account (i) prior to a Great Wolf Cash Management Trigger Event (as defined below), only amounts payable (after operating expenses, management fees and transfers to the reserves) by the manager to the Great Wolf Lodge Southern California Borrower pursuant to the hotel management agreement on a weekly basis; and (ii) from and after a Great Wolf Cash Management Trigger Event, all income within three business days after receipt. Following a Great Wolf Cash Management Trigger Event, credit card providers are required to deposit rents and income directly into the lockbox account. Upon the occurrence and during the continuance of a Great Wolf Cash Management Trigger Event, all funds on deposit in the lockbox account are required to be transferred to the cash management account on a daily basis. Prior to a Cash Trap Event Period (as defined below), all funds on deposit in the cash management account will be disbursed (a) prior to a Great Wolf Cash Management Trigger Event, to the borrower’s operating account, and (b) after the date of a Great Wolf Cash Management Trigger Event, to the manager’s operating account. During a Cash Trap Event Period, all funds on deposit in the cash management account are required to be applied to the payment of, among other things, monthly escrows, debt service, operating expenses set forth in the lender-approved annual budget and extraordinary expenses approved by the lender; and all excess cash flow is required to be held in the excess cash flow subaccount as additional security for the Great Wolf Lodge Southern California Whole Loan.
A “Great Wolf Cash Management Trigger Event” will commence upon the earlier of the following:
| (i) | any Great Wolf Entity (as defined below) owning more than 25% of the direct or indirect interest in the Great Wolf Lodge Southern California Borrower; or |
| (ii) | any Great Wolf Entity controlling the Great Wolf Lodge Southern California Borrower. |
A “Great Wolf Entity” means (a) an entity that is controlled (directly or indirectly) by Great Wolf or any entity that controls Great Wolf; or (b) any entity that is under common control with Great Wolf.
A “Cash Trap Event Period” will commence upon the earlier of the following:
| (i) | the occurrence and continuance of an event of default; or |
| (ii) | the net cash flow debt yield of the Great Wolf Lodge Southern California Whole Loan (inclusive of the Great Wolf Lodge Southern California Subordinate Companion Loan) falling below 9.0% at the end of any calendar quarter. |
A Cash Trap Event Period will end upon the occurrence of the following:
| ● | with regard to clause (i), the cure of such event of default; or |
| ● | with regard to clause (ii), upon the net cash flow debt yield of the Great Wolf Lodge Southern California Whole Loan (inclusive of the Great Wolf Lodge Southern California Subordinate Companion Loan) being equal to or greater than 9.5% for two consecutive calendar quarters. |
Disposition and Development Agreement and Transient Occupancy Tax.McWhinney obtained the site to construct the Great Wolf Lodge Southern California Property through a disposition and development agreement (“DDA”) with the Garden Grove Agency of Community Development (“Agency”), which was signed in May 2009 and amended in April 2010. As part of the DDA, the Agency has the right to approve any transfer of the Great Wolf Lodge Southern California Property to a non-related entity, but such approval right does not apply to a foreclosure or deed in lieu of foreclosure or to a transfer by lender to a third party purchaser after foreclosure. In exchange for these protective covenants, the Agency provided approximately $47.0 million to McWhinney, with $5.0 million paid at the commencement of construction of the parking garage and $42.0 million at the opening of the Great Wolf Lodge Southern California Property. In addition, the Agency agreed to pay McWhinney, on an ongoing basis, an annual transient occupancy tax (“TOT”) reimbursement, which is based on the TOT Differential (as defined below) between the City of Anaheim and the City of Garden Grove and applied to total annual room revenue. See “Description of the Mortgage Pool—Mortgage Pool Characteristics—Property Types—Hospitality Properties” in the Preliminary Prospectus.
The “TOT Differential” is equal to (i) 2.0% (the “Benchmark TOT Variance”), minus (ii) the current TOT of the City of Anaheim minus the current TOT of the City of Garden Grove (the “Current TOT Variance”). In 2018, the TOTs of the City of Anaheim and the City of Garden Grove were 15.0% and 14.5%, respectively, resulting in a Current TOT Variance of 0.5% and a TOT Differential of 1.5% (TOT Differential calculated by subtracting the TOT Variance of 0.5% from the Benchmark TOT Variance of 2.0%). In 2018, based on room revenue of $49,532,819 and the TOT Differential of 1.5%, the TOT reimbursement was $743,272.
This is not a research report and was not prepared by any Underwriter’s research department. Please see additional important information and qualifications at the end of this Term Sheet.
T-116
| Hospitality – Full Service | Loan #10 | Cut-off Date Balance: | $40,000,000 | |
| 12681 Harbor Boulevard | Great Wolf Lodge Southern California | Cut-off Date LTV: | 49.5% | |
| Garden Grove, CA 92840 | U/W NCF DSCR: | 2.41x | ||
| U/W NOI Debt Yield: | 14.6% |
Additional Secured Indebtedness (not including trade debts). The Great Wolf Lodge Southern California Property also secures the Great Wolf Lodge Southern CaliforniaPari PassuCompanion Loans, which have an aggregate Cut-off Date principal balance of $110,000,000 and the Great Wolf Lodge Southern California Subordinate Companion Loan, which has a Cut-off Date principal balance of $20,000,000. The Great Wolf Lodge Southern CaliforniaPari PassuCompanion Loans and the Great Wolf Lodge Southern California Subordinate Companion Loan are coterminous with the Great Wolf Lodge Southern California Mortgage Loan. The Great Wolf Lodge Southern CaliforniaPari PassuCompanion Loans accrue interest at the same rate as the Great Wolf Lodge Southern California Mortgage Loan, and the Great Wolf Lodge Southern California Subordinate Companion Loan accrues interest at an interest rate of 10.7500%. The Great Wolf Lodge Southern California Mortgage Loan and the Great Wolf Lodge Southern CaliforniaPari passuCompanion Loans are eachpari passuin right of payment and together are senior in right of payment to the Great Wolf Lodge Southern California Subordinate Companion Loan. The holders of the Great Wolf Lodge Southern California Mortgage Loan, the Great Wolf Lodge Southern CaliforniaPari passuCompanion Loans and the Great Wolf Lodge Southern California Subordinate Companion Loan have entered into a co-lender agreement which sets forth the allocation of collections on the Great Wolf Lodge Southern California Whole Loan. See “Description of the Mortgage Pool—The Whole Loans—The Great Wolf Lodge Southern California Pari Passu A/B Whole Loan” in the Preliminary Prospectus. The Great Wolf Lodge Southern California Subordinate Companion Loan is held by KSL Capital Partners Co Trust II.
The following table presents certain information relating to the Great Wolf Lodge Southern California Subordinate Companion Loan:
| B-Note Summary | ||||||||
B-Note Original Principal Balance | B-Note Interest Rate | Original Term (mos.) | Original Amort. Term (mos.) | Original IO Term (mos.) | Total Debt UW NCF DSCR | Total Debt UW NOI Debt Yield | Total Debt Cutoff Date LTV | |
| Great Wolf Lodge Southern California Subordinate Companion Loan | $20,000,000 | 10.7500% | 120 | 0 | 120 | 1.89x | 12.9% | 56.1% |
Mezzanine Loan and Preferred Equity.Not permitted.
Release of Property. Not Permitted.
Ground Lease. None.
Right of First Refusal.None.
Letter of Credit.None.
Terrorism Insurance. The Great Wolf Lodge Southern California Whole Loan documents require that the “all risk” insurance policy required to be maintained by the Great Wolf Lodge Southern California Borrower provide coverage for terrorism in an amount equal to the full replacement cost of the Great Wolf Lodge Southern California Property. The loan documents also require business interruption insurance covering no less than the 18-month period following the occurrence of a casualty event, together with a six month extended period of indemnity.See “Risk Factors—Risks Relating to the Mortgage Loans—Terrorism Insurance May Not Be Available for All Mortgaged Properties” in the Preliminary Prospectus.
Earthquake Insurance.The loan documents do not require earthquake insurance; however, at the time of closing, earthquake insurance coverage is in-place for the Great Wolf Lodge Southern California Property through a blanket policy. The seismic report indicated a probable maximum loss of 4% for the Great Wolf Lodge Southern California Property.
This is not a research report and was not prepared by any Underwriter’s research department. Please see additional important information and qualifications at the end of this Term Sheet.
T-117
| Office - CBD | Loan #11 | Cut-off Date Balance: | $34,500,000 | |
| 801 Barton Springs Road | 801 Barton Springs | Cut-off Date LTV: | 54.6% | |
| Austin, TX 78704 | U/W NCF DSCR: | 2.52X | ||
| U/W NOI Debt Yield: | 10.5% |
| Mortgage Loan No. 11 – 801 Barton Springs |
| Mortgage Loan Information | Property Information | |||||||||
| Mortgage Loan Seller: | BANA | Single Asset/Portfolio: | Single Asset | |||||||
| Credit Assessment (Fitch/KBRA/Moody’s): | NR/NR/NR | Location: | Austin, TX 78704 | |||||||
| Original Balance: | $34,500,000 | General Property Type: | Office | |||||||
| Cut-off Date Balance: | $34,500,000 | Detailed Property Type: | CBD | |||||||
| % of Initial Pool Balance: | 3.3% | Title Vesting: | Fee | |||||||
| Loan Purpose: | Acquisition | Year Built/Renovated: | 2018/N/A | |||||||
| Sponsor: | WeWork Companies Inc. | Size: | 89,577 SF | |||||||
| Guarantors: | ARK Master Fund LP; ARK Master Fund AIV 1 LP | Cut-off Date Balance per SF: | $385 | |||||||
| Mortgage Rate: | 4.0150% | Maturity Date Balance per SF: | $385 | |||||||
| Note Date: | 4/18/2019 | Property Manager: | Self-managed | |||||||
| First Payment Date: | 6/1/2019 | |||||||||
| Maturity Date: | 5/1/2024 | |||||||||
| Original Term to Maturity: | 60 months | Underwriting and Financial Information | ||||||||
| Original Amortization Term: | 0 months | UW NOI: | $3,637,496 | |||||||
| IO Period: | 60 months | UW NOI Debt Yield: | 10.5% | |||||||
| Seasoning: | 0 months | UW NOI Debt Yield at Maturity: | 10.5% | |||||||
| Prepayment Provisions: | LO (24); DEF (32); O (4) | UW NCF DSCR: | 2.52x | |||||||
| Lockbox/Cash Mgmt Status: | Hard/In Place | Most Recent NOI(4): | N/A | |||||||
| Additional Debt Type: | N/A | 2nd Most Recent NOI(4): | N/A | |||||||
| Additional Debt Balance: | N/A | 3rd Most Recent NOI(4): | N/A | |||||||
| Future Debt Permitted (Type): | No (N/A) | Most Recent Occupancy: | 100.0% (5/1/2019) | |||||||
| Reserves | 2nd Most Recent Occupancy(4): | N/A | ||||||||
| Type | Initial | Monthly | Cap | 3rd Most Recent Occupancy(4): | N/A | |||||
| RE Tax: | $0 | Springing(1) | N/A | Appraised Value (as of): | $63,200,000 (3/25/2019) | |||||
| Insurance: | $0 | Springing(1) | N/A | Appraised Value per SF: | $706 | |||||
| Recurring Replacements: | $0 | Springing(2) | $27,000 | Cut-off Date LTV Ratio: | 54.6% | |||||
| TI/LC: | $0 | Springing(3) | $179,000 | Maturity Date LTV Ratio: | 54.6% | |||||
| Sources and Uses | ||||||
| Sources | Proceeds | % of Total | Uses | Proceeds | % of Total | |
| Loan Amount: | $34,500,000 | 59.7% | Purchase Price(5): | $56,975,595 | 98.7% | |
| Borrower Equity: | $23,247,103 | 40.3% | Closing Costs: | $771,507 | 1.3% | |
| Total Sources: | $57,747,103 | 100.0% | Total Uses: | $57,747,103 | 100.0% | |
| (1) | During the continuance of a cash sweep period (triggered by (a) the debt service coverage ratio falling below 1.15x, (b) WeWork (as defined below) vacating, going dark, defaulting on rent payment or being the subject of a bankruptcy proceeding or (c) termination of WeWork’s lease), the 801 Barton Springs Borrower (as defined below) is required to reserve monthly 1/12th of the estimated property taxes and insurance premiums that the lender estimates will be payable during the next 12 months;provided such deposits will be waived if (i) with respect to taxes, WeWork is paying taxes directly to the tax assessor pursuant to its lease (and no cash sweep period triggered by clause (b) or (c) exists); or (ii) with respect to insurance, required insurance is maintained under a blanket policy acceptable to the lender. |
| (2) | During the continuance of a cash sweep period, the 801 Barton Springs Borrower is required to reserve monthly $1,119 for replacement reserves, capped at $27,000. |
| (3) | During the continuance of a cash sweep period, the 801 Barton Springs Borrower is required to reserve monthly $7,465 for leasing reserves, capped at $179,000. |
| (4) | Historical financial statements and occupancy information are not available because the 801 Barton Springs Property (as defined below) was constructed and leased to a single tenant in 2018. |
| (5) | The borrower sponsor purchased the 801 Barton Springs Property pursuant to a purchase option in its lease that was negotiated prior to the property’s completion. |
The Mortgage Loan. The eleventh largest mortgage loan (the “801 Barton Springs Mortgage Loan”) is evidenced by a promissory note in the original principal amount of $34,500,000 and secured by a first priority fee mortgage on an 89,577 SF office building located in Austin, Texas (the “801 Barton Springs Property”).
The Borrower and the Borrower Sponsor. The borrower is 801 Barton Springs Owner LLC, a Delaware limited liability company structured to be bankruptcy-remote with at least two independent directors (the “801 Barton Springs Borrower”). The non-recourse carveout guarantors are ARK Master Fund LP and ARK Master Fund AIV 1 LP, each a Delaware limited partnership, both of which are in part indirectly owned by WeWork Companies Inc., the borrower sponsor.
WeWork Companies Inc. was founded in 2010 as a provider of co-working and flexible office spaces for individuals and start-up companies and since 2016 expanded its business to include corporate clients. As of year-end 2018, WeWork Companies Inc. was one of the largest corporate landlords, with reportedly 401,000 members worldwide, which include 30% of Fortune 500 companies, and with 425 facilities in 100 cities and 27 countries. WeWork Companies Inc. has five other locations in the Austin market: SXSW Center (1400 Lavaca Street – under construction), Westview (316 West 12th Street),
This is not a research report and was not prepared by any Underwriter’s research department. Please see additional important information and qualifications at the end of this Term Sheet.
T-118
| Office - CBD | Loan #11 | Cut-off Date Balance: | $34,500,000 | |
| 801 Barton Springs Road | 801 Barton Springs | Cut-off Date LTV: | 54.6% | |
| Austin, TX 78704 | U/W NCF DSCR: | 2.52X | ||
| U/W NOI Debt Yield: | 10.5% |
600 Congress Avenue, University Park (3300 N Interstate Hwy 35) and The Domain (11801 Domain Blvd). WeWork Companies Inc. is a part of The WeCompanies, which also includes WeLive which offers flexible living arrangements, and WeGrow which offers private elementary schooling. In April 2019, The WeCompanies announced that it had filed a draft registration statement with the Securities and Exchange Commission to start the process of potentially making an initial public securities offering.
801 Barton Springs Tenant LLC (“WeWork”) is the sole tenant at the 801 Barton Springs Property. WeWork is a subsidiary of the borrower sponsor and an affiliate of the 801 Barton Springs Borrower and the non-recourse carveout guarantors.
The Property. The 801 Barton Springs Property is a Class A, nine-story building located on the south side of the Austin, Texas central business district that contains 89,577 SF of office space across its top four floors plus 258 garage parking spaces (approximately 2.9 spaces per 1,000 SF) which occupy the bottom five floors of the building. Amenities include high speed internet, conference rooms with audio/visual features, unique common areas and collaborative lounge areas, business supplies and printing, soundproof phone booths, onsite staff and cleaning services, complimentary fruit water and coffee, and programming of professional and social events.
The 801 Barton Springs Property was constructed in 2018 and features a geometric, contemporary precast and glass façade and sweeping views of Downtown Austin and Lady Bird Lake. The 801 Barton Springs Property is proximate to shopping and dining in the South Congress neighborhood and outdoor attractions including Zilker Park, Auditorium Shores and Barton Springs Pool.
The 801 Barton Springs Property is 100% leased to 801 Barton Springs Tenant LLC (“WeWork”) on a 20-year, triple-net lease which commenced on March 20, 2018, and expires on March 31, 2038. Effective March 2020, the annual base rent is $39.54 PSF and the annual parking rent is $322,108, both with annual rent increases of 2.0%. The lease contains two 5-year renewal options at market rents with 15 to 18 months’ notice. WeWork received a rent abatement for the first 8 months of its lease and $75.00 PSF for tenant improvements, which the borrower sponsor is returning in full to the seller as a part of the purchase price for the 801 Barton Springs Property. The lease does not contain any termination options. In addition to a lease security deposit of $367,802, there is a corporate guaranty in place for the lease by WeWork Companies, Inc., capped at the current amount of $18,359,073, which capped amount reduces annually during the lease term and extension periods.
The following table presents certain information relating to the lease rollover schedule at the 801 Barton Springs Property:
| Lease Rollover Schedule | ||||||||
| Year | # of Leases Rolling | SF Rolling | UW Rent PSF Rolling | Approx. % of Total SF Rolling | Approx. Cumulative % of SF Rolling | Total UW Rent Rolling | Approx. % of Total Rent Rolling | Approx. Cumulative % of Total Rent Rolling |
| 2019 | 0 | 0 | $0.00 | 0.0% | 0.0% | $0 | 0.0% | 0.0% |
| 2020 | 0 | 0 | $0.00 | 0.0% | 0.0% | $0 | 0.0% | 0.0% |
| 2021 | 0 | 0 | $0.00 | 0.0% | 0.0% | $0 | 0.0% | 0.0% |
| 2022 | 0 | 0 | $0.00 | 0.0% | 0.0% | $0 | 0.0% | 0.0% |
| 2023 | 0 | 0 | $0.00 | 0.0% | 0.0% | $0 | 0.0% | 0.0% |
| 2024 | 0 | 0 | $0.00 | 0.0% | 0.0% | $0 | 0.0% | 0.0% |
| 2025 | 0 | 0 | $0.00 | 0.0% | 0.0% | $0 | 0.0% | 0.0% |
| 2026 | 0 | 0 | $0.00 | 0.0% | 0.0% | $0 | 0.0% | 0.0% |
| 2027 | 0 | 0 | $0.00 | 0.0% | 0.0% | $0 | 0.0% | 0.0% |
| 2028 | 0 | 0 | $0.00 | 0.0% | 0.0% | $0 | 0.0% | 0.0% |
| 2029 | 0 | 0 | $0.00 | 0.0% | 0.0% | $0 | 0.0% | 0.0% |
| 2030 & Beyond | 1 | 89,577 | $39.54 | 100.0% | 100.0% | $3,541,445 | 100.0% | 100.0% |
| Vacant | 0 | 0 | $0.00 | 0.0% | 100.0% | $0 | 0.0% | 100.0% |
| Total/Wtd. Avg. | 1 | 89,577 | $39.54 | 100.0% | $3,541,445 | 100.0% | ||
Information is based on the underwritten rent roll.
The Market. The 801 Barton Springs Property is located on Barton Springs Road which is the southern border of Auditorium Shores in the Austin, Texas central business district. The 801 Barton Springs Property is just west of South 1st Street, which heading north crosses Lady Bird Lake to the Austin Downtown. Immediately south of the 801 Barton Springs Property is the residential community of Bouldin Creek.
Austin is one of the fastest growing metropolitan areas by population. According to the appraisal, the Austin central business district continues to be the hub of economic activity in the metro area and through expanding residential, office and commercial development is becoming an urban lifestyle destination. The location benefits from its proximity to the University of Texas and the State Capitol Complex and to the various attractions of Auditorium Shores including Butler Metro Park, Palmer Events Center and The Long Center for the Performing Arts.
According to the appraisal, there has been significant leasing activity and expansion by both blue-chip companies, such as Google, Facebook and Amazon, and younger start-up companies in the Austin office market, as such users are looking for amenity-rich facilities and a live, work, play lifestyle to attract and retain talent. Austin is a global tech hub and benefits from its business friendly environment, relative low cost of doing business, fast population growth, and access to capital and major markets such as Houston and Dallas and a highly educated workforce.
The area is accessed by Interstate 35 and MoPac Expressway/Loop 1. Barton Springs Road is part of Austin’s dedicated bike lane network and there are two B-Cycle stations within one block of the 801 Barton Springs Property. Austin MetroRapid public bus also services the area.
This is not a research report and was not prepared by any Underwriter’s research department. Please see additional important information and qualifications at the end of this Term Sheet.
T-119
| Office - CBD | Loan #11 | Cut-off Date Balance: | $34,500,000 | |
| 801 Barton Springs Road | 801 Barton Springs | Cut-off Date LTV: | 54.6% | |
| Austin, TX 78704 | U/W NCF DSCR: | 2.52X | ||
| U/W NOI Debt Yield: | 10.5% |
According to the appraisal, the estimated 2018 population within a one-, three- and five-mile radius of the 801 Barton Springs Property was 18,519, 181,780 and 354,046, respectively. The estimated 2018 average household income within the same radii was $134,930, $90,625 and $90,529, respectively. Since 2000, with a three-mile radius, the primary demographic population and annual household income have grown at a compound annual rate of 1.2% and 3.5%, respectively.
According to a third party data provider, the 801 Barton Springs Property is located along the boundary between the Central Business District and South submarkets of the Austin office market, with its most direct competition is within the Central Business District submarket. As of year-end 2018, the Central Business District submarket had approximately 8.7 million SF of Class A inventory, with a vacancy rate of 10.3% and average asking rents of $44.56 PSF. From 2014 to 2018, the Central Business District Class A submarket had positive net absorption of 2.3 million SF while vacancy ranged between 13.9% and 8.9% and average asking rents ranged between $40.31 and $44.56 PSF.
The following table presents recent leasing data at comparable office properties with respect to the 801 Barton Springs Property:
| Comparable Property Summary | ||||||||
| Property, Address | Distance from Subject (miles) | Year Built | NRA (SF) | Occupancy | Tenant | Lease Date / Term (Yrs) | Lease Size (SF) / Rent NNN (PSF) | Annual Escalations/ Free Rent/TI’s (PSF) |
801 Barton Springs 801 Barton Springs Road | N/A | 2018 | 89,577 | 100% | WeWork(1) | Mar-18 / 20.0(1) | 89,577 / $39.54(1) | 2% / 8 mos / $75.00(1) |
501 Congress 501 Congress Avenue | 1.0 | 2015(2) | 126,100 | NAV | Confidential Co-Working Tenant | Mar-19 / 12.5 | 53,129(2)/ $34.26 | 3% / 6 mos / $70.00 |
Third & Shoal 208 Nueces Streets | 0.9 | 2019 | 347,637 | 100% | Bank Tenant | Feb-19 / 10.0 | 52,522 / $40.50 | $1 PSF / 6 mos / $61.38 |
JLL Plaza 1703 W. 5th Street | 1.8 | 2009 | 115,975 | NAV | Spanning | Jan-19 / 7.0 | 12,388 / $33.00 | 3% / 2 mos / $35.00 |
Indeed Tower 200 W. 6th Street | 1.0 | 2021(3) | 669,130 | NAV | Indeed.com | Nov-18 / 13.0 | 306,632 / $38.50 | $0.75 PSF / 4 mos / $80.00 |
100 Congress 100 Congress Avenue | 0.8 | 1987 | 411,536 | 99% | Jun-18 / 5.0 | 61,736 / $45.00 | 3% / none / $35.00 | |
Source: Appraisal.
(1) Information obtained from the underwritten rent roll and lease.
(2) The 501 Congress property was built in 1963 and redeveloped in 2015. The tenant lease encumbers non-contiguous space.
(3) The Indeed Tower property is currently under construction and is pre-leased to Indeed.com commencing in 2021.
The following table presents the appraiser’s market rent conclusions:
| Market Rent Summary | |
| Office | |
| Market Rent (PSF) | $40 |
| Lease Term (Years) | 7 |
| Rental Increase Projection | 3.0%per annum |
This is not a research report and was not prepared by any Underwriter’s research department. Please see additional important information and qualifications at the end of this Term Sheet.
T-120
| Office - CBD | Loan #11 | Cut-off Date Balance: | $34,500,000 | |
| 801 Barton Springs Road | 801 Barton Springs | Cut-off Date LTV: | 54.6% | |
| Austin, TX 78704 | U/W NCF DSCR: | 2.52X | ||
| U/W NOI Debt Yield: | 10.5% |
Underwritten Net Cash Flow.The following table presents certain information relating to the Underwritten Net Cash Flow at the 801 Barton Springs Property:
| Cash Flow Analysis(1) | ||
| UW | UW PSF | |
| Gross Potential Rent(2) | $3,541,445 | $39.54 |
| Reimbursements | $1,216,378 | $13.58 |
| Net Rental Income | $4,757,823 | $53.11 |
| Parking Income(2) | $322,108 | $3.60 |
| Vacancy and Concessions | ($126,998) | ($1.42) |
| Effective Gross Income | $4,952,933 | $55.29 |
| Taxes | $1,180,547 | $13.18 |
| Insurance | $35,831 | $0.40 |
| Other Operating Expenses | $99,059 | $1.11 |
| Total Operating Expenses | $1,315,437 | $14.68 |
| Net Operating Income | $3,637,496 | $40.61 |
| TI/LC | $89,578 | $1.00 |
| Capital Expenditures | $13,437 | $0.15 |
| Net Cash Flow | $3,534,481 | $39.46 |
| NOI DSCR | 2.59x | |
| NCF DSCR | 2.52x | |
| NOI Debt Yield | 10.5% | |
| NCF Debt Yield | 10.2% | |
| (1) | Historical financial statements are not available because the 801 Barton Springs Property was constructed and leased to a single tenant in 2018. |
| (2) | UW Gross Potential Rent and Parking Income are based on the rent in place effective March 2020. |
This is not a research report and was not prepared by any Underwriter’s research department. Please see additional important information and qualifications at the end of this Term Sheet.
T-121
| Retail – Anchored | Loan #12 | Cut-off Date Balance: | $23,000,000 | |
13110-13400 Middlebelt Road; 13550 Middlebelt Road; | Millennium Park | Cut-off Date LTV: | 67.6% | |
| 28511-28551 Schoolcraft Road | U/W NCF DSCR: | 1.49x | ||
| Livonia, MI 48150 | U/W NOI Debt Yield: | 9.9% |
| Mortgage Loan No. 12 – Millennium Park |
| Mortgage Loan Information | Property Information | ||||||
| Mortgage Loan Seller: | WFB | Single Asset/Portfolio: | Single Asset | ||||
| Credit Assessment (KBRA/Fitch/S&P): | NR/NR/NR | Location: | Livonia, MI 48150 | ||||
| Original Balance: | $23,000,000 | General Property Type: | Retail | ||||
| Cut-off Date Balance: | $23,000,000 | Detailed Property Type: | Anchored | ||||
| % of Initial Pool Balance: | 2.2% | Title Vesting: | Fee | ||||
| Loan Purpose: | Refinance | Year Built/Renovated: | 2000/2019 | ||||
| Sponsor: | Gary Sakwa | Size: | 163,887 SF | ||||
| Guarantor: | Gary Sakwa | Cut-off Date Balance per SF: | $140 | ||||
| Mortgage Rate: | 4.7000% | Maturity Date Balance per SF: | $121 | ||||
| Note Date: | 4/4/2019 | Property Manager: | Grand Sakwa Management, LLC (Borrower-related)
| ||||
| First Payment Date: | 5/11/2019 | ||||||
| Maturity Date: | 4/11/2029 | ||||||
| Original Term to Maturity: | 120 months | ||||||
| Original Amortization Term: | 360 months | ||||||
| IO Period: | 24 months | Underwriting and Financial Information | |||||
| Seasoning: | 1 month | UW NOI(5): | $2,266,104 | ||||
| Prepayment Provisions: | LO (25); DEF (88); O (7) | UW NOI Debt Yield: | 9.9% | ||||
| Lockbox/Cash Mgmt Status: | Springing/Springing | UW NOI Debt Yield at Maturity: | 11.5% | ||||
| Additional Debt Type: | N/A | UW NCF DSCR: | 1.49x (P&I); 1.95x (IO) | ||||
| Additional Debt Balance: | N/A | Most Recent NOI(5): | $1,756,713 (3/31/2019 TTM) | ||||
| Future Debt Permitted (Type): | No (N/A) | 2nd Most Recent NOI): | $1,759,735 (12/31/2018) | ||||
| Reserves | 3rd Most Recent NOI: | $1,805,505 (12/31/2017) | |||||
| Type | Initial | Monthly | Cap | Most Recent Occupancy: | 100.0% (4/25/2019) | ||
| RE Tax: | $101,910 | $33,970(1) | N/A | 2nd Most Recent Occupancy: | 100.0% (12/31/2018) | ||
| Insurance: | $0 | Springing(2) | N/A | 3rd Most Recent Occupancy: | 100.0% (12/31/2017) | ||
| Recurring Replacements: | $0 | $2,821 | $250,000 | Appraised Value (as of): | $34,000,000 (2/13/2019) | ||
| TI/LC: | $250,000 | $10,417 | $450,000(3) | Appraised Value per SF: | $207 | ||
| Rent Concession Reserve(4): | $78,840 | $0 | N/A | Cut-off Date LTV Ratio: | 67.6% | ||
| Existing TI/LC(4): | $770,880 | $0 | N/A | Maturity Date LTV Ratio: | 58.2% | ||
| Sources and Uses | ||||||
| Sources | Proceeds | % of Total | Uses | Proceeds | % of Total | |
| Loan Amount: | $23,000,000 | 48.4% | Total Prior Debt Payoff(6): | $42,209,405 | 88.8% | |
| Proceeds from Non-Collateral Refinance6): | $24,530,364 | 51.6% | Upfront Reserves: | $1,201,630 | 2.5% | |
| Closing Costs: | $170,742 | 0.4% | ||||
| Return of Equity(6): | $3,948,587 | 8.3% | ||||
| Total Sources: | $47,530,364 | 100.0% | Total Uses: | $47,530,364 | 100.0% | |
| (1) | The Millennium Park Mortgage Loan (as defined below) requires an additional springing deposit for real estate taxes for the Bob’s Discount Furniture space upon the following occurrences: (i) the Bob’s Discount Furniture lease does not obligate the tenant to pay taxes directly; (ii) Bob’s Discount Furniture fails to pays all applicable taxes prior to interest or penalties being incurred thereof; (iii) the Bob’s Discount Furniture lease not being in full force and effect; (iv) an event of default; (v) the debt service coverage ratio is less than 1.15x at the end of any calendar quarter; (vi) Bob’s Discount Furniture (or any successor, assign or replacement tenant in its space) (a) fails to renew or extend its lease on terms and conditions of its lease or acceptable to the lender on or prior to the earliest of (1) nine months prior to lease maturity, or (2) the date required under such lease to exercise a renewal option, (b) "going dark” or otherwise failing to occupy its space or delivering notice to the Millennium Park Borrower (as defined below) of its intention to commence the foregoing, (c) terminating or delivering notice to the Millennium Park Borrower (as defined below) of its intention to terminate its lease, or (d) files for bankruptcy or becomes involved in a bankruptcy. |
| (2) | The Millennium Park Mortgage Loan documents do not require ongoing monthly escrows for insurance premiums as long as (i) no event of default has occurred and is continuing, (ii) the borrower provides the lender with evidence that the Millennium Park Property’s (as defined below) insurance coverage is included in a lender-approved blanket policy and such policy is in full force and effect and (iii) the borrower pays all applicable insurance premiums and provides the lender with evidence of renewals. |
| (3) | The TI/LC Reserve Cap does not apply during the continuation of any event of default or the debt service coverage ratio being less than 1.25x. |
| (4) | Represents outstanding rent concessions and tenant improvement costs related to Bob’s Discount Furniture. Bob’s Discount Furniture is currently completing its build out and is expected to start paying rent at the earlier of: (i) store opening or (ii) 150 days from its lease commencement of January 17, 2019. Bob’s Discount Furniture is expected to open Mary 23, 2019. |
| (5) | See“Operating History and Underwritten Net Cash Flow” below for details regarding the increase from the Most Recent NOI to UW NOI. |
| (6) | The borrower sponsor used loan proceeds along with proceeds from the refinance of a non-collateral adjacent property to pay off a $42,209,405 mortgage loan that encumbered both the Millennium Park Property and the non-collateral adjacent property (collectively, the “Total Prior Debt”). The amounts shown above for loan payoff and return of equity reflect the payoff of the Total Prior Debt. |
The Mortgage Loan. The twelfth largest mortgage loan (the “Millennium Park Mortgage Loan”) is evidenced by a single promissory note in the original principal amount of $23,000,000 and secured by a first priority fee mortgage encumbering a 163,887 SF anchored retail center (the “Millennium Park Property”) located in Livonia, Michigan.
This is not a research report and was not prepared by any Underwriter’s research department. Please see additional important information and qualifications at the end of this Term Sheet.
T-122
| Retail – Anchored | Loan #12 | Cut-off Date Balance: | $23,000,000 | |
13110-13400 Middlebelt Road; 13550 Middlebelt Road; | Millennium Park | Cut-off Date LTV: | 67.6% | |
| 28511-28551 Schoolcraft Road | U/W NCF DSCR: | 1.49x | ||
| Livonia, MI 48150 | U/W NOI Debt Yield: | 9.9% |
The Borrowers and the Sponsor. The borrowers are Millennium Livonia Unit 2 LLC, Millennium Livonia Unit 3 LLC and Millennium Livonia Unit 5 LLC (collectively, the “Millennium Park Borrower”), each a single-purpose Delaware limited liability company. The borrower sponsor and non-recourse carveout guarantor is Gary Sakwa. Mr. Sakwa is the co-founder of Grand Sakwa Properties, L.L.C. Founded over 40 years ago, Grand Sakwa Properties, L.L.C. has developed millions of square feet of retail, mixed-use and residential properties and is one of the largest private real estate developers in the Midwestern United Stated. Mr. Sakwa has over 35 years of experience in the residential and commercial real estate industry, including development of over 10,000 residential lots, construction of over 3,000 homes, and development and/or acquisition in excess of 5.0 million SF of commercial property.
The Property.The Millennium Park Property is a 163,887 SF, anchored retail community center located in Livonia, Michigan. Built in 2000 and situated on a 34.5-acre parcel, the Millennium Park Property is anchored by Bob’s Discount Furniture (“Bob’s”), Marshalls, Michaels, PetSmart, and Ulta Salon and is shadow-anchored by Costco Wholesale, Home Depot and Meijer (shadow anchors are not part of the collateral). The Millennium Park Property comprises 1,095 surface parking spaces resulting in a parking ratio of 6.7 spaces per 1,000 SF of rentable area. As of April 25, 2019, the Millennium Park Property was 100.0% occupied by 15 tenants, including national retailers such as Panera, Wingstop, Famous Footwear, and Great Clips.
The Millennium Park Property has been 100.0% occupied since 2014. Six tenants representing approximately 40.4% of NRA and 41.3% of underwritten rent have been in place at the Millennium Park Property since 2001, and eight tenants representing approximately 41.5% of NRA and 44.9% of underwritten rent have renewed their lease at least once. Approximately 26.3% of the NRA and 22.8% of underwritten base rent at the Millennium Park Property is attributed to investment grade tenants.
According to the Millennium Park Mortgage Loan documents, prior to September 6, 2018 the Millennium Park Property was part of a larger parcel that contained additional adjacent retail tenants. As of September 6, 2018, the owner of the Millennium Park Property split the parent parcel by recording the Millennium Park Condominium. The condominium split resulted in the Millennium Park Property being on its own parcel (“Units 2, 3 and 5”), separate from the remainder of the shopping center. The owner of Units 2, 3 and 5 have a voting rights interest of approximately 53.19% in the related owners’ association. Each unit owner has sole responsibility for the maintenance of its respective property and the association’s duties are limited solely to any common areas. See “Description of the Mortgage Pool—Mortgage Pool Characteristics—Condominium and Other Shared Interests” in the Preliminary Prospectus.
The borrower has the right to the free release of two future outlot areas as defined in the Millennium Park Mortgage Loan documents in connection with a sale or conveyance to a third-party subject to certain conditions outlined in the Millennium Park Mortgage Loan documents. The current sites comprise approximately 8,555 SF (4,000 SF and 4,555 SF, respectively) of surface parking lot space with no improvements. The appraisal has attributed no value to the outlot areas and did not expect any negative impact on the value of the Millennium Park Property from such release. See “Description of the Mortgage Pool—Certain Terms of the Mortgage Loans—Partial Releases; Substitutions; Additions” in the Preliminary Prospectus.
Major Tenants.
Bob’s (35,040 SF, 21.4% of NRA, 20.0% of underwritten rent, lease expires 5/31/2029).Bob’s 10-year lease at the Millennium Park Property commenced in January 2018, and has three 5-year options remaining, each with 270 days’ notice at rental rates as specified in the lease. Rent is required to commence upon the earlier of (i) Bob’s store opening and (ii) 150 days from its lease commencement date of January 17, 2019. The Bob’s space was recently constructed by the borrower sponsor on a previously vacant parcel. Bob’s is currently expected to open May 23, 2019. The Millennium Park Mortgage Loan was structured with an upfront Rent Concession reserve of $78,840 for April and May rent.
Marshalls (30,195 SF, 18.4% of NRA, 12.5% of underwritten rent, lease expires 10/31/2020). Marshalls’ originally signed a 10-year lease at the Millennium Park Property in 2000 and exercised the first two of five 5-year renewal options. Marshalls has three 5-year renewal options remaining, each with 180 days’ notice at rental rates as specified in the lease.
Michaels (21,609 SF, 13.2% of NRA, 9.6% of underwritten rent, lease expires 2/29/2020). Michaels’ original 10-year lease at the Millennium Park Property commenced in 2005. Michaels exercised a 5-year renewal in 2015 and has three 5-year renewal options remaining, each with 180 days’ notice at rental rates as specified in the lease.
PetSmart (19,235 SF, 11.7% of NRA, 12.2% of underwritten rent, lease expires 5/31/2021). PetSmart’s original 15-year lease at the Millennium Park Property commenced in 2001. PetSmart exercised a 5-year renewal in 2016 and has three 5-year renewal options remaining, each with 270 days’ notice at rental rates as specified in the lease.
Ulta Salon (11,144 SF, 6.8% of NRA, 10.3% of underwritten rent, lease expires 9/30/2022). Ulta’s original 10-year lease at the Millennium Park Property commenced in 2012, and has two 5-year options remaining, each with 270 days’ notice at rental rates as specified in the lease.
Other than Bob’s, Marshalls, Michaels, PetSmart and Ulta, no tenant accounts for more than 6.3% of the NRA or 5.3% of underwritten base rent at the Millennium Park Property.
This is not a research report and was not prepared by any Underwriter’s research department. Please see additional important information and qualifications at the end of this Term Sheet.
T-123
| Retail – Anchored | Loan #12 | Cut-off Date Balance: | $23,000,000 | |
13110-13400 Middlebelt Road; 13550 Middlebelt Road; | Millennium Park | Cut-off Date LTV: | 67.6% | |
| 28511-28551 Schoolcraft Road | U/W NCF DSCR: | 1.49x | ||
| Livonia, MI 48150 | U/W NOI Debt Yield: | 9.9% |
The following table presents certain information relating to the leases at the Millennium Park Property:
| Tenant Summary(1) | ||||||||||||
| Tenant Name | Credit Rating (Fitch/ Moody’s/ S&P)(2) | Tenant SF | Approx. % of SF | Annual UW Rent(3) | % of Total Annual UW Rent | Annual UW Rent PSF(3) | Lease Expiration | 2018 Sales PSF | Occ. Cost %(4) | Term. Option (Y/N) | Exten. Options | |
| Bob’s Discount Furniture | NR/B2/NR | 35,040 | 21.4% | $473,040 | 20.0% | $13.50 | 5/31/2029 | N/A | N/A | N | 3, 5-year | |
| Marshalls | NR/A2/A+ | 30,195 | 18.4% | $294,401 | 12.5% | $9.75 | 10/31/2020 | N/A | N/A | N | 3, 5-year | |
| Michaels | NR/NR/BB- | 21,609 | 13.2% | $226,895 | 9.6% | $10.50 | 2/29/2020 | N/A | N/A | N | 3, 5-year | |
| PetSmart | NR/Caa1/CCC | 19,235 | 11.7% | $289,487 | 12.2% | $15.05 | 5/31/2021 | $316 | 6.75% | N | 3, 5-year | |
| Ulta Salon | NR/NR/NR | 11,144 | 6.8% | $242,382 | 10.3% | $21.75 | 9/30/2022 | N/A | N/A | N | 2, 5-year | |
| Subtotal/Wtd. Avg. | 117,223 | 71.5% | $1,526,205 | 64.5% | $13.02 | |||||||
| Other Tenants | 46,664 | 28.5% | $838,350 | 35.5% | $17.97 | |||||||
| Vacant Space | 0 | 0.0% | $0 | 0.0% | $0.00 | |||||||
| Total/Wtd. Avg. | 163,887 | 100.0% | $2,364,555 | 100.0% | $14.43 | |||||||
| (1) | Information is based on the underwritten rent roll. |
| (2) | Certain ratings are those of the parent company whether or not the parent company guarantees the lease. |
| (3) | Annual UW Rent and Annual UW Rent PSF include contractual rent steps through February 2020 for four tenants totaling $7,474, and straight line rent averaging for Panera through its lease expiration date (January 31, 2026) totaling $9,099. |
| (4) | Occ. Cost is based on Annual UW Rent and reimbursements. |
The following table presents certain information relating to the lease rollover schedule at the Millennium Park Property:
| Lease Rollover Schedule(1)(2) | ||||||||
| Year | # of Leases Rolling | SF Rolling | UW Rent PSF Rolling | % of Total SF Rolling | Cumulative % of SF Rolling | Total UW Rent Rolling | Approx. % of Total Rent Rolling | Approx. Cumulative % of Total Rent Rolling |
| 2019 | 0 | 0 | $0.00 | 0.0% | 0.0% | $0 | 0.0% | 0.0% |
| 2020 | 4 | 55,604 | $10.67 | 33.9% | 33.9% | $593,553 | 25.1% | 25.1% |
| 2021 | 2 | 21,559 | $15.43 | 13.2% | 47.1% | $332,667 | 14.1% | 39.2% |
| 2022 | 3 | 23,494 | $17.17 | 14.3% | 61.4% | $403,462 | 17.1% | 56.2% |
| 2023 | 2 | 12,700 | $15.42 | 7.7% | 69.2% | $195,890 | 8.3% | 64.5% |
| 2024 | 1 | 7,000 | $18.00 | 4.3% | 73.4% | $126,000 | 5.3% | 69.8% |
| 2025 | 0 | 0 | $0.00 | 0.0% | 73.4% | $0 | 0.0% | 69.8% |
| 2026 | 1 | 4,990 | $27.39 | 3.0% | 76.5% | $136,693 | 5.8% | 75.6% |
| 2027 | 1 | 3,500 | $29.50 | 2.1% | 78.6% | $103,250 | 4.4% | 80.0% |
| 2028 | 0 | 0 | $0.00 | 0.0% | 78.6% | $0 | 0.0% | 80.0% |
| 2029 | 1 | 35,040 | $13.50 | 21.4% | 100.0% | $473,040 | 20.0% | 100.0% |
| 2030 & Beyond | 0 | 0 | $0.00 | 0.0% | 100.0% | $0 | 0.0% | 100.0% |
| Vacant | 0 | 0 | $0.00 | 0.0% | 100.0% | $0 | 0.0% | 100.0% |
| Total/Wtd. Avg. | 15 | 163,887 | $14.43 | 100.0% | $2,364,555 | 100.0% | ||
| (1) | Information is based on the underwritten rent roll. |
| (2) | Certain tenants may have lease termination options that are exercisable prior to the originally stated expiration date of the subject lease and that are not considered in the lease rollover schedule. |
The Market. The Millennium Park Property is located immediately adjacent to Interstate 96, which provides access eastbound to Detroit, approximately 5.9 miles east of Interstate 275, 17.9 miles northwest of the Detroit central business district and 11.3 miles northeast of the Detroit Metropolitan Wayne County Airport. The Millennium Park Property is situated approximately 0.4 miles east of the intersection of Interstate 96 and Cardwell Street, which, according to a third party market research provider, had a daily traffic count of approximately 164,341 vehicles as of 2017.
According to the appraisal, Livonia is home to approximately 4,300 businesses and benefits from the presence of notable industrial plants, such as the Ford Motor Company’s transmission plant (approximately 4.5 miles southwest of the Millennium Park Property), United Parcel Services (approximately 0.7 miles northwest of the Millennium Park Property), Phillips Service Industries, Inc. (approximately 8.9 miles west of the Millennium Park Property) and McLaren Performance Technologies (approximately 6.0 miles northwest of the Millennium Park Property). New investment has been announced by Masco Corporation, a manufacturer of products for the home improvement and new home construction markets. Masco Corporation plans to move employees
This is not a research report and was not prepared by any Underwriter’s research department. Please see additional important information and qualifications at the end of this Term Sheet.
T-124
| Retail – Anchored | Loan #12 | Cut-off Date Balance: | $23,000,000 | |
13110-13400 Middlebelt Road; 13550 Middlebelt Road; | Millennium Park | Cut-off Date LTV: | 67.6% | |
| 28511-28551 Schoolcraft Road | U/W NCF DSCR: | 1.49x | ||
| Livonia, MI 48150 | U/W NOI Debt Yield: | 9.9% |
from the its current headquarters, located in Taylor, Michigan, and move them, into a new, 75,000 SF facility located at West Seven Mile Road and Haggerty Road in Livonia (approximately 8.7 miles northwest of the Millennium Park Property).
According to a third-party market research report, the estimated 2019 population within a three- and five-mile radius of the Millennium Park Property was approximately 92,643, and 285,188, respectively; while the 2019 estimated average household income within the same radii was $75,184, and $67,999, respectively.
According to a third-party market research report, the Millennium Park Property is situated within the Southern I-275 Corridor submarket of the Detroit Market. As of April 12, 2019, the Southern I-275 Corridor submarket reported a total inventory of approximately 27.6 million SF of retail space with a 7.8% vacancy rate and average asking rent of $16.11 PSF, triple net. The submarket vacancy rate has decreased from 11.5% in 2010 and has averaged 9.0% from 2010 through 2018. Within a three-mile radius of the Millennium Park Property, as of April 15, 2019, there were 709 retail properties totaling approximately 6.8 million SF with a 6.8% vacancy rate, per a third-party market research provider. The appraiser identified 16 competitive properties totaling 858,569 SF with an average vacancy of 5.5%.
The following table presents recent Jr. Anchor leasing data at comparable retail properties with respect to the Millennium Park Property:
| Comparable Lease Summary | ||||||||||
| Property Name/Address | Year Built/ Renovated | Size (SF) | Occupancy | Distance from Subject | Tenant Name | Lease Size (SF) | Lease Date | Lease Term (Yrs.) | Rent/SF | Lease Type |
Millennium Park Property 13050 Middlebelt Road Livonia, Michigan | 2000/2019 | 163,887 | 100.0% | N/A | ||||||
Fairlane Meadows 16201 Ford Road Dearborn, MI | 1987/2015 | 157,225 | 98.7% | 7.4 miles | Best Buy | 35,586 | Feb 2017 | 6.0 | $10.50 | NNN |
Fairlane Meadows 16201 Ford Road Dearborn, MI | 1987/2015 | 157,225 | 98.7% | 7.4 miles | David’s Bridal | 11,567 | Dec 2015 | 3.0 | $14.00 | NNN |
Freestanding Retail 29145 Telegraph Road Southfield, Michigan | 1966/2006 | 28,550 | 100.0% | 8.8 miles | Gorman’s Furniture | 28,550 | Jan 2017 | 5.0 | $12.16 | NNN |
Shops at Stony Creek 7644 26 Mile Road Shelby Twp., Michigan | 2017/N/A | 120,871 | 87.6% | 27.2 miles | Petco | 12,600 | Oct. 2017 | 10.0 | $18.00 | NNN |
Metro Place Center 35400 E Michigan Ave Wayne, Michigan | 1965/2014 | 48,205 | 98.0% | 7.5 miles | AV Pharmacy | 34,000 | March 2016 | 10.0 | $15.00 | NNN |
Source:Appraisal.
The following table presents certain information relating to the appraisal’s market rent conclusions for the Millennium Park Property:
| Market Rent Summary | |||
| General Retail | Jr. Anchor | Restaurant | |
| Market Rent (PSF) | $19.48 | $14.35 | $28.70 |
| Lease Term (Years) | 5 | 7 | 5 |
| Rent Increase Projection | CPI | CPI | CPI |
This is not a research report and was not prepared by any Underwriter’s research department. Please see additional important information and qualifications at the end of this Term Sheet.
T-125
| Retail – Anchored | Loan #12 | Cut-off Date Balance: | $23,000,000 | |
13110-13400 Middlebelt Road; 13550 Middlebelt Road; | Millennium Park | Cut-off Date LTV: | 67.6% | |
| 28511-28551 Schoolcraft Road | U/W NCF DSCR: | 1.49x | ||
| Livonia, MI 48150 | U/W NOI Debt Yield: | 9.9% |
Operating History and Underwritten Net Cash Flow.The following table presents certain information relating to the operating history and underwritten net cash flow at the Millennium Park Property:
| Cash Flow Analysis | ||||||
| 2016 | 2017 | 2019 | 3/31/2019 TTM(2) | UW(2) | UW PSF | |
| Gross Potential Base Rent(1)1) | $1,803,020 | $1,818,379 | $1,821,874 | $1,776,937 | $2,364,555 | $14.43 |
| Total Recoveries | $1,013,808 | $883,696 | $934,271 | $978,735 | $1,162,910 | $7.10 |
| Other Income | $15,374 | $6,276 | $405 | $993 | $405 | $0.00 |
| Less Vacancy & Credit Loss | $0 | $0 | $0 | $0 | ($118,228)(3) | ($0.72) |
| Effective Gross Income | $2,832,202 | $2,708,351 | $2,756,550 | $2,756,665 | $3,409,642 | $20.80 |
| Real Estate Taxes | $330,759 | $351,880 | $349,879 | $369,281 | $493,928 | $3.01 |
| Insurance | $32,354 | $37,956 | $24,799 | $26,975 | $29,869 | $0.18 |
| Other Operating Expenses | $565,644 | $513,010 | $622,138 | $603,696 | $619,741 | $3.78 |
| Total Operating Expenses | $928,757 | $902,846 | $996,816 | $999,952 | $1,143,538 | $6.98 |
| Net Operating Income | $1,903,445 | $1,805,505 | $1,759,735 | $1,756,713 | $2,266,104 | $13.83 |
| Capital Expenditures | $0 | $0 | $0 | $0 | $33,856 | $0.21 |
| TI/LC | $0 | $0 | $0 | $0 | $98,259 | $0.60 |
| Net Cash Flow | $1,903,445 | $1,805,505 | $1,759,735 | $1,756,713 | $2,133,989 | $13.02 |
| Occupancy % | 100.0% | 100.0% | 100.0% | 100.0% | 100.0%(3) | |
| NOI DSCR (IO) | 1.74x | 1.65x | 1.61x | 1.60x | 2.07x | |
| NOI DSCR (P&I) | 1.33x | 1.26x | 1.23x | 1.23x | 1.58x | |
| NCF DSCR (IO) | 1.74x | 1.65x | 1.61x | 1.60x | 1.95x | |
| NCF DSCR (P&I) | 1.33x | 1.26x | 1.23x | 1.23x | 1.49x | |
| NOI Debt Yield | 8.3% | 7.9% | 7.7% | 7.6% | 9.9% | |
| NCF Debt Yield | 8.3% | 7.9% | 7.7% | 7.6% | 9.3% | |
| (1) | UW Gross Potential Base Rent PSF and UW Gross Potential Base Rent include contractual rent steps through February 2020 for four tenants totaling $7,474, and straight line rent averaging through Panera’s lease expiration date (January 31, 2026) totaling $9,099. |
| (2) | The increase in Gross Potential Base Rent and Net Operating Income from 3/31/2019 to UW was driven partly by the inclusion of Bob‘s new lease, totaling approximately 20.0% of UW Gross Potential Base Rent with rent commencement expected to occur in May 2019. The Bob’s space was recently constructed by the borrower sponsor on a previously vacant parcel. |
| (3) | The underwritten economic vacancy is 5.0%. As of April 25, 2019, the Millennium Park Property was 100.0% physically occupied. |
This is not a research report and was not prepared by any Underwriter’s research department. Please see additional important information and qualifications at the end of this Term Sheet.
T-126
(THIS PAGE INTENTIONALLY LEFT BLANK)
T-127
| Self Storage | Loan #13 | Cut-off Date Balance: | $20,000,000 | |
| 2207 Albemarle Road | Cubesmart - Brooklyn | Cut-off Date LTV: | 59.2% | |
| Brooklyn, NY 11226 | U/W NCF DSCR: | 2.12x | ||
| U/W NOI Debt Yield: | 9.7% |
| Mortgage Loan No. 13 – Cubesmart - Brooklyn |
| Mortgage Loan Information | Property Information | ||||||
| Mortgage Loan Seller: | BANA | Single Asset/Portfolio: | Single Asset | ||||
| Credit Assessment (Fitch/KBRA/Moody’s): | NR/NR/NR | Location: | Brooklyn, NY 11226 | ||||
| Original Balance: | $20,000,000 | General Property Type: | Self Storage | ||||
| Cut-off Date Balance: | $20,000,000 | Detailed Property Type: | Self Storage | ||||
| % of Initial Pool Balance: | 1.9% | Title Vesting: | Fee | ||||
| Loan Purpose: | Refinance | Year Built/Renovated: | 1930/1998 | ||||
| Sponsor: | Gerald Sprayregen | Size: | 88,702 SF | ||||
| Guarantor: | Gerald Sprayregen | Cut-off Date Balance per SF: | $225 | ||||
| Mortgage Rate: | 4.4780% | Maturity Date Balance per SF: | $225 | ||||
| Note Date: | 4/15/2019 | Property Manager: | Cubesmart Asset Management, LLC | ||||
| First Payment Date: | 6/1/2019 | ||||||
| Maturity Date: | 5/1/2029 | ||||||
| Original Term to Maturity: | 120 months | Underwriting and Financial Information | |||||
| Original Amortization Term: | 0 months | UW NOI: | $1,942,231 | ||||
| IO Period: | 120 months | UW NOI Debt Yield: | 9.7% | ||||
| Seasoning: | 0 months | UW NOI Debt Yield at Maturity: | 9.7% | ||||
| Prepayment Provisions: | LO (24); DEF (92); O (4) | UW NCF DSCR: | 2.12x | ||||
| Lockbox/Cash Mgmt Status: | Soft/Springing | Most Recent NOI: | $1,956,393 (2/28/2019 TTM) | ||||
| Additional Debt Type: | N/A | 2nd Most Recent NOI: | $1,948,939 (12/31/2018) | ||||
| Additional Debt Balance: | N/A | 3rd Most Recent NOI: | $1,737,325 (12/31/2017) | ||||
| Future Debt Permitted (Type): | No (N/A) | Most Recent Occupancy(2): | 86.3% (3/28/2019) | ||||
| Reserves | 2nd Most Recent Occupancy(2): | 85.3% (12/31/2018) | |||||
| Type | Initial | Monthly | Cap | 3rd Most Recent Occupancy: | 86.7% (12/31/2017) | ||
| RE Tax: | $134,661 | $22,444 | N/A | Appraised Value (as of)(3): | $33,780,000 (3/9/2019) | ||
| Insurance(1): | $0 | Springing | N/A | Appraised Value per SF: | $381 | ||
| Recurring Replacements: | $0 | $1,109 | N/A | Cut-off Date LTV Ratio: | 59.2% | ||
| Deferred Maintenance(2): | $328,930 | $0 | N/A | Maturity Date LTV Ratio: | 59.2% | ||
| Sources and Uses | ||||||
| Sources | Proceeds | % of Total | Uses | Proceeds | % of Total | |
| Loan Amount: | $20,000,000 | 100.0% | Loan Payoff: | $15,181,077 | 75.9% | |
| Return of Equity: | $4,096,133 | 20.5% | ||||
| Reserves: | $463,591 | 2.3% | ||||
| Closing Costs: | $259,199 | 1.3% | ||||
| Total Sources: | $20,000,000 | 100.0% | Total Uses: | $20,000,000 | 100.0% | |
| (1) | The Cubesmart – Brooklyn Mortgage Loan (as defined below) documents do not require ongoing monthly insurance deposits so long as required insurance is maintained under a blanket policy acceptable to the lender. |
| (2) | Occupancy is based on SF for the self storage space. Due to recent roof issues and water intrusion there are currently 152 (7,420 SF) units either offline, damaged and / or not available for rent that have been underwritten as vacant by the lender. The lender has reserved 125% of the estimated cost of all immediate repairs, which includes $292,805 for the estimated cost to repair the offline units. |
| (3) | The appraiser assigned a value of $17,440,000 as of March 9, 2019 for the land-only portion of the Cubesmart – Brooklyn Property (as defined below). |
The Mortgage Loan. The thirteenth largest mortgage loan (the “Cubesmart - Brooklyn Mortgage Loan”) is evidenced by a promissory note in the original principal amount of $20,000,000, and is secured by a first priority fee mortgage encumbering an 88,702 SF self storage facility in Brooklyn, New York (the “Cubesmart - Brooklyn Property”).
The Borrower and the Sponsor. The borrower is Morningstar 123 LLC (the “Cubesmart - Brooklyn Borrower”), a single-purpose Delaware limited liability company structured to be bankruptcy-remote, with at least one independent director. The Cubesmart - Brooklyn Borrower is 100% indirectly owned by Gerald Sprayregen, the borrower sponsor and non-recourse carveout guarantor.
Mr. Sprayregen is a commercial real estate investor focused on self-storage and commercial properties whose current portfolio includes seven self storage facilities (including the Cubesmart – Brooklyn Property) located across New York, New Jersey, Maryland, Florida and Massachusetts. Mr. Sprayregen acquired the Cubesmart - Brooklyn Property in 1998 and converted it to a self-storage facility.
In 1977, Mr. Sprayregen was convicted for conspiracy, fraud and falsifying financial statements relating to his role as Chairman of Stratton Group, Ltd. Separately, in October 1968, it was charged that Mr. Sprayregen sold unregistered securities in the form of limited partnership interests and effected
This is not a research report and was not prepared by any Underwriter’s research department. Please see additional important information and qualifications at the end of this Term Sheet.
T-128
| Self Storage | Loan #13 | Cut-off Date Balance: | $20,000,000 | |
| 2207 Albemarle Road | Cubesmart - Brooklyn | Cut-off Date LTV: | 59.2% | |
| Brooklyn, NY 11226 | U/W NCF DSCR: | 2.12x | ||
| U/W NOI Debt Yield: | 9.7% |
transactions for those partnerships, in which he failed to disclose affiliations and adverse interests. Such charges were settled and Mr. Sprayregen was barred from association with any broker-dealer for two years. During the approximate 40 years since his conviction Mr. Sprayregen has been free of any criminal charges or material legal issues. See“Description of the Mortgage Pool—Litigation and Other Considerations”in the Preliminary Prospectus.
The Property. The Cubesmart - Brooklyn Property is an 88,702 SF, two-story self storage facility plus basement built in 1930 and converted by the borrower sponsor to a self storage facility in 1998. The Cubesmart - Brooklyn Property is located just east of Flatbush Avenue and south of Church Avenue in the Flatbush neighborhood of Brooklyn, New York. The Cubesmart - Brooklyn Property is currently configured with 2,008 interior climate controlled units, 43 interior non-climate controlled units and 24 container units with drive-up access, and offers 24-hour surveillance, two elevators, handcarts and dollies for rent, packing supplies for sale, and trucks and drivers for hire. Additionally, the Cubesmart - Brooklyn Property includes a 300 SF leasing office.
In the third quarter of 2018, roof and water intrusion damage was identified and 152 units were taken offline (138 interior climate controlled units, twelve interior non-climate controlled units and two container units), with any affected existing tenants moved to available units at the Cubesmart - Brooklyn Property. Repair and renovation of the offline units along with other immediate repairs is required by the Cubesmart – Brooklyn Mortgage Loan documents to be completed by April 2020 and 125% of the estimated cost of such repairs ($292,805) has been fully reserved with the lender. The repair work is not expected to significantly impact ongoing operations.
The following table presents the unit mix at the Cubesmart - Brooklyn Property:
| Unit Mix | |||||||
| Unit Type | Number of Units | Occupied Units | Occupancy by Unit | Average Unit Size (SF) | Total Size (SF) | Average Monthly GPR | % of GPR |
| Interior Climate Controlled | 2,008 | 1,745 | 86.9% | 41 | 82,615 | $114 | 92.6% |
| Interior Non-Climate Controlled | 43 | 25 | 58.1% | 52 | 2,247 | $162 | 2.8% |
| Container | 24 | 16 | 66.7% | 160 | 3,840 | $479 | 4.6% |
| Total/Wtd. Avg. | 2,075 | 1,786 | 86.1% | 88,702 | 100.0% | ||
Source:Borrower rent roll dated March 28, 2019.
The Market. The Cubesmart - Brooklyn Property is located in the Flatbush neighborhood of Brooklyn, New York. The major employers in the area include: American Airlines, Columbia University, JPMorgan Chase, Memorial Sloan Kettering Cancer Center, Morgan Stanley Children’s Hospital, Mount Sinai Hospital, New York-Presbyterian Hospital, Nielsen Company, Northwell Health, Inc. and Verizon Information. Over the past decade Brooklyn’s private employment sector grew by 19.8% and the number of businesses has grown by 21%, making it the fastest growing area compared to its neighboring boroughs. Approximately 15 million people visit Brooklyn each year contributing to the borough’s economy by expenditures in restaurants, hotels and other attractions.
According to the appraisal, the estimated 2018 population within a one-, two- and three-mile radius around the Cubesmart - Brooklyn Property was 193,938, 615,266 and 1,322,650 respectively. From 2010 to 2018, population within the same radii grew 5.6%, 5.0% and 5.5% respectively. The estimated 2018 average household income within a one-, two- and three-mile radius was $73,090, $82,849 and $83,158 respectively. In 2018, within a three-mile radius of the Cubesmart - Brooklyn Property, approximately 72.2% of households were renter-occupied. The immediate area surrounding the Cubesmart - Brooklyn Property is composed of 248 multifamily properties comprising 8,377,328 SF and retail, industrial and office spaces comprising 2,541,348 SF.
The appraiser determined a two-mile radius around the Cubesmart - Brooklyn Property to be its primary market area. The two-mile radius had a vacancy rate of 8.7% for stabilized self storage properties and the appraiser estimated the supply ratio to be 1.1 for 2018, assuming a population of 615,266 and current inventory of 673,743 SF of self storage space.
The following table presents certain competitive self storage rental comparables to the Cubesmart - Brooklyn Property:
| Property | Location | Total NRA | Year Built/Renovated | No. of Self Storage Units | Avg. SF/ Self Storage Unit | Occupancy % | Distance to Subject (mi.) |
| Cubesmart - Brooklyn | 2207 Albemarle Road, Brooklyn, NY | 88,702(1) | 1930/1998 | 2,075(1) | 43(1) | 86.3%(1) | N/A |
| Safeguard - 115 | 115 Empire Blvd, Brooklyn, NY | 45,725 | 2007/NA | 876 | 52 | 95.0% | 1.2 |
| Safeguard - 1635 | 1635 Albany Avenue, Brooklyn, NY | 62,820 | 2015/NA | 698 | 90 | 86.0% | 2.0 |
| Safeguard - 629 | 629 Utica Avenue, Brooklyn, NY | 55,163 | 2011/NA | 835 | 66 | 92.0% | 2.0 |
| Public Storage - 1534 | 1534 Utica Avenue, Brooklyn, NY | 82,495 | 1927/2005 | 1,033 | 80 | 91.6% | 2.4 |
| Public Storage - 1062 | 1062 St Johns Pl, Brooklyn, NY | 69,300 | 1912/2005 | 852 | 81 | 96.7% | 2.5 |
| Total/Wtd. Avg.(2) | 315,503 | 4,294 | 92.2% |
Source:Appraisal.
| (1) | Based on borrower rent roll as of March 28, 2019. Occupancy is based on SF for the self storage space and with offline units considered vacant. |
| (2) | Total/Wtd. Avg. excludes the Cubesmart - Brooklyn Property. |
This is not a research report and was not prepared by any Underwriter’s research department. Please see additional important information and qualifications at the end of this Term Sheet.
T-129
| Self Storage | Loan #13 | Cut-off Date Balance: | $20,000,000 | |
| 2207 Albemarle Road | Cubesmart - Brooklyn | Cut-off Date LTV: | 59.2% | |
| Brooklyn, NY 11226 | U/W NCF DSCR: | 2.12x | ||
| U/W NOI Debt Yield: | 9.7% |
Operating History and Underwritten Net Cash Flow.The following table presents certain information relating to the historical operating performance and the Underwritten Net Cash Flow at the Cubesmart - Brooklyn Property:
| Cash Flow Analysis | ||||||
| 2016 | 2017 | 2018 | 2/28/2019 TTM | UW | UW PSF | |
| Gross Potential Rent | $2,497,467 | $2,411,633 | $2,566,695 | $3,136,553 | $2,914,822 | $32.86 |
| Other Income(1) | $81,463 | $224,449 | $255,694 | $258,469 | $258,469 | $2.91 |
| Vacancy and Credit loss(2) | $0 | $0 | $0 | ($549,790) | ($363,456) | ($4.10) |
| Effective Gross Income | $2,578,930 | $2,636,082 | $2,822,389 | $2,845,232 | $2,809,835 | $31.68 |
| Taxes | $301,690 | $120,420 | $248,644 | $248,644 | $258,773 | $2.92 |
| Insurance | $7,342 | $25,084 | $14,067 | $12,457 | $9,834 | $0.11 |
| Other Operating Expenses | $428,398 | $753,253 | $610,739 | $627,738 | $598,997 | $6.75 |
| Total Operating Expenses | $737,430 | $898,757 | $873,450 | $888,839 | $867,604 | $9.78 |
| Net Operating Income | $1,841,500 | $1,737,325 | $1,948,939 | $1,956,393 | $1,942,231 | $21.90 |
| Capital Expenditures | $0 | $0 | $0 | $0 | $13,305 | $0.15 |
| Net Cash Flow | $1,841,500 | $1,737,325 | $1,948,939 | $1,956,393 | $1,928,926 | $21.75 |
| Occupancy % | 85.8% | 86.7% | 85.3% | 86.3%(3) | 87.5% | |
| NOI DSCR | 2.03x | 1.91x | 2.15x | 2.15x | 2.14x | |
| NCF DSCR | 2.03x | 1.91x | 2.15x | 2.15x | 2.12x | |
| NOI Debt Yield | 9.2% | 8.7% | 9.7% | 9.8% | 9.7% | |
| NCF Debt Yield | 9.2% | 8.7% | 9.7% | 9.8% | 9.6% | |
| (1) | Other income includes tenant insurance, late fees, administration fees, retail sales, forfeited deposits, and other miscellaneous income. |
| (2) | UW Vacancy is based on actual vacancy as of the March 28, 2019 rent roll with offline units considered vacant. |
| (3) | 2/28/2019 TTM occupancy shown in the occupancy is as of the March 28, 2019 rent roll based on SF for the self storage space. |
This is not a research report and was not prepared by any Underwriter’s research department. Please see additional important information and qualifications at the end of this Term Sheet.
T-130
(THIS PAGE INTENTIONALLY LEFT BLANK)
T-131
| Hospitality – Full Service | Loan #14 | Cut-off Date Balance: | $19,000,000 | |
| 7516 Las Colinas Boulevard | Hilton Garden Inn Las Colinas | Cut-off Date LTV: | 60.1% | |
| Irving, TX 75063 | U/W NCF DSCR: | 1.72x | ||
| U/W NOI Debt Yield: | 12.5% | |||
| Mortgage Loan No. 14 – Hilton Garden Inn Las Colinas |
| Mortgage Loan Information | Property Information | |||||
| Mortgage Loan Seller: | WFB | Single Asset/Portfolio: | Single Asset | |||
| Credit Assessment (Fitch/KBRA/Moody’s): | NR/NR/NR | Location: | Irving, TX 75063 | |||
| Original Balance: | $19,000,000 | General Property Type: | Hospitality | |||
| Cut-off Date Balance: | $19,000,000 | Detailed Property Type: | Full Service | |||
| % of Initial Pool Balance: | 1.8% | Title Vesting: | Fee | |||
| Loan Purpose: | Acquisition | Year Built/Renovated: | 1996/2017 | |||
| Sponsor: | Allan V. Rose | Size: | 173 Rooms | |||
| Guarantor: | Allan V. Rose | Cut-off Date Balance per Room: | $109,827 | |||
| Mortgage Rate: | 4.9000% | Maturity Date Balance per Room: | $97,206 | |||
| Note Date: | 4/17/2019 | Property Manager: | Dimension Development Two, LLC | |||
| First Payment Date: | 6/11/2019 | |||||
| Maturity Date: | 5/11/2029 | |||||
| Original Term to Maturity: | 120 months | Underwriting and Financial Information | ||||
| Original Amortization Term: | 360 months | UW NOI: | $2,366,461 | |||
| IO Period: | 36 months | UW NOI Debt Yield: | 12.5% | |||
| Seasoning: | 0 months | UW NOI Debt Yield at Maturity: | 14.1% | |||
| Prepayment Provisions: | LO (24); DEF (92); O (4) | UW NCF DSCR: | 1.72x (P&I); 2.21x (IO) | |||
| Lockbox/Cash Mgmt Status: | Hard/Springing | Most Recent NOI: | $2,267,062 (2/28/2019 TTM) | |||
| Additional Debt Type: | N/A | 2nd Most Recent NOI(3): | $2,314,940 (12/31/2018) | |||
| Additional Debt Balance: | N/A | 3rd Most Recent NOI(3): | $1,294,583 (12/31/2017) | |||
| Future Debt Permitted (Type): | No (N/A) | Most Recent Occupancy: | 67.1% (2/28/2019) | |||
| Reserves | 2nd Most Recent Occupancy(3): | 68.0% (12/31/2018) | ||||
| Type | Initial | Monthly | Cap | 3rd Most Recent Occupancy(3): | 54.5% (12/31/2017) | |
| RE Tax: | $27,632 | $27,635 | N/A | Appraised Value (as of)(4): | $31,600,000 (2/27/2020) | |
| Insurance(1): | $0 | Springing | N/A | Appraised Value per Room(4): | $182,659 | |
| FF&E Reserve: | $0 | $23,607(2) | N/A | Cut-off Date LTV Ratio(4): | 60.1% | |
| PIP Reserve: | $1,966,005 | $0 | N/A | Maturity Date LTV Ratio(4): | 53.2% | |
| Sources and Uses | ||||||
| Sources | Proceeds | % of Total | Uses | Proceeds | % of Total | |
| Loan Amount: | $19,000,000 | 62.2% | Purchase Price: | $27,750,000 | 90.8% | |
| Cash Equity Contribution | $11,554,227 | 37.8% | Reserves: | $1,993,637 | 6.5% | |
| Closing Costs: | $810,590 | 2.7% | ||||
| Total Sources: | $30,554,227 | 100.0% | Total Uses: | $30,554,227 | 100.0% | |
| (1) | The Hilton Garden Inn Las Colinas Mortgage Loan (as defined below) documents do not require ongoing monthly escrows for insurance premiums as long as (i) no event of default has occurred and is continuing, (ii) the borrower provides the lender with evidence that the Hilton Garden Inn Las Colinas Property’s (as defined below) insurance coverage is included in a lender-approved blanket policy and such policy is in full force and effect and (iii) the borrower pays all applicable insurance premiums and provides the lender with evidence of renewals. |
| (2) | The FF&E Reserve is subject to an adjustment to one-twelfth of 4.0% of the revenue for the prior fiscal year based on annual operating statements. |
| (3) | See “Operating History and Underwritten Net Cash Flow” and “The Property” sections below for explanations on historical fluctuations in NOI and Occupancy. |
| (4) | The Appraised Value reflects the “upon completion” value which assumes completion of a property improvement plan (“PIP”) at a total estimated cost of $1,966,005 (see “The Property” section below for further discussion). At closing, the Hilton Garden Inn Las Colinas Borrower (as defined in “The Borrower and Borrower Sponsor” section below) deposited $1,966,005 into the PIP Reserve account for the related work. The Cut-off Date LTV and Maturity Date LTV Ratio are calculated based upon the Appraised Value of $31,600,000. The “as-is” appraised value is $27,900,000 as of February 27, 2019 and equates to a Cut-off Date LTV Ratio of 68.1% and Maturity Date LTV Ratio of 60.3% for the Hilton Garden Inn Las Colinas Mortgage Loan. |
The Mortgage Loan. The fourteenth largest mortgage loan (the “Hilton Garden Inn Las Colinas Mortgage Loan”) is evidenced by a single promissory note in the original principal amount of $19,000,000 which is secured by a first priority fee mortgage encumbering a full service hospitality property located in Irving, Texas (the “Hilton Garden Inn Las Colinas Property”).
The Borrower and the Borrower Sponsor.The borrower is AVR Las Colinas LC Boulevard Hotel LLC (the “Hilton Garden Inn Las Colinas Borrower”), a single-purpose Delaware limited liability company with one independent director. Legal counsel to the Hilton Garden Inn Las Colinas Borrower delivered a non-consolidation opinion in connection with the origination of the Hilton Garden Inn Las Colinas Mortgage Loan.
The borrower sponsor and non-recourse carveout guarantor is Allan V. Rose,owner and chief executive officer of AVR Realty, a privately held real estate development and managementcompany. Founded by Mr. Rose over 45 years ago, AVR Realty has built, acquired, and developed more than 30 million SF of commercial and residential space, including office complexes, shopping centers, corporate and industrial parks, apartment complexes, residential
This is not a research report and was not prepared by any Underwriter’s research department. Please see additional important information and qualifications at the end of this Term Sheet.
T-132
| Hospitality – Full Service | Loan #14 | Cut-off Date Balance: | $19,000,000 | |
| 7516 Las Colinas Boulevard | Hilton Garden Inn Las Colinas | Cut-off Date LTV: | 60.1% | |
| Irving, TX 75063 | U/W NCF DSCR: | 1.72x | ||
| U/W NOI Debt Yield: | 12.5% | |||
communities and hotels. AVR Realty’s current portfolio includes 23 full service and limited service hotels in California, Colorado, Florida, Georgia, Louisiana, New Jersey, New York, Texas and Virginia.
The Property.The Hilton Garden Inn Las Colinas Property is a five-story, 173-room, full service hotel located in Irving, Texas, approximately 17.0 miles northwest of the Dallas central business district (“CBD”). Built in 1996 and renovated in 2017, the Hilton Garden Inn Las Colinas Property is situated on a 4.0-acre site and amenities include five event rooms totaling 3,128 SF of meeting space (three of which have the ability to convert into a ballroom), a restaurant and lounge, an outdoor swimming pool, grade level outdoor patio with fireplace, fitness center, business center, sundries shop, guest laundry, and a complimentary shuttle service (within a 5-mile radius). The Hilton Garden Inn Las Colinas Property contains 202 surface parking spaces, equating to a parking ratio of 1.2 spaces per room.
The Hilton Garden Inn Las Colinas Property guestroom configuration includes 65 king bed guestrooms, 64 double queen beds guestrooms, and 44 suites. All guestrooms feature a flat-panel television, a desk with ergonomic chair, bathrooms finished with tub/shower combinations, and appliances including full-sized iron and ironing board, coffee maker, and alarm clock. According to the appraisal, the demand segmentation at the Hilton Garden Inn Las Colinas Property is 61% commercial, 23% leisure, and 16% group.
The Hilton Garden Inn Las Colinas Property is expected to undergo a brand-mandated property improvement plan (“PIP”) totaling approximately $2.0 million ($11,364 per key) in connection with a new 15-year franchise agreement with Hilton Franchise Holdings, LLC executed in connection with the Hilton Garden Inn Las Colinas Property acquisition. The franchise agreement expires on April 30, 2034. The PIP is required to be completed by October 2020 and includes, but is not limited to, completing renovations to the lobby and corridors, meeting rooms, exterior of the building, restaurant and lounge and select public areas. The Hilton Garden Inn Las Colinas Property was previously renovated in 2017 at a total cost of approximately $6.0 million ($34,468 per room). The upcoming PIP work is expected to focus on public spaces, due to the previous renovations of guestrooms. The Hilton Garden Inn Las Colinas Borrower deposited an upfront reserve of approximately $2.0 million for the PIP work.
The following table presents historical occupancy, ADR, and RevPAR penetration rates of the Hilton Garden Inn Las Colinas Property.
| Historical Occupancy, ADR, RevPAR(1)(2) | ||||||||||||
| Competitive Set | Hilton Garden Inn Las Colinas Property | Penetration Factor | ||||||||||
| Year | Occupancy | ADR | RevPAR | Occupancy | ADR | RevPAR | Occupancy | ADR | RevPAR | |||
| 12/31/2016 | 75.4% | $117.71 | $88.75 | 68.7% | $133.20 | $91.53 | 91.1% | 113.2% | 103.1% | |||
| 12/31/2017(3) | 72.8% | $120.12 | $87.49 | 52.2%(3) | $138.69 | $72.40 | 71.7%(3) | 115.5% | 82.7% | |||
| 12/31/2018 | 70.7% | $123.26 | $87.14 | 67.0% | $144.90 | $97.13 | 94.8% | 117.6% | 111.5% | |||
| 2/28/2019 TTM | 70.7% | $124.00 | $87.67 | 67.1% | $145.07 | $97.31 | 94.9% | 117.0% | 111.0% | |||
Sources:Industry Report.
| (1) | According to a third party research report, the competitive set includes DoubleTree by Hilton Hotel Dallas Farmers Branch, Courtyard Dallas Las Colinas, Holiday Inn Express & Suites Irving Dallas Fort Worth Airport North, Hampton Inn Dallas Irving Las Colinas, Hyatt Place Dallas Las Colinas, Springhill Suites DFW Airport East Las Colinas Irving, and Tapestry Collection by Hilton NYLO Las Colinas Hotel. |
| (2) | Variances between the underwriting, the appraisal, and third party research report with respect to Occupancy, ADR and RevPAR at the Hilton Garden Inn Las Colinas Property are attributable to variances in reporting methodologies and/or timing differences. |
| (3) | Occupancy at the Hilton Garden Inn Las Colinas Property declined in 2017 due to PIP work, which resulted in approximately 12,096 lost room nights between March and September 2017. |
The Market. The Hilton Garden Inn Las Colinas Property is located approximately 7.1 miles east of the Dallas/Fort Worth International Airport, 12.8 miles northwest of the Dallas Love Field Airport, 17.1 miles northwest of the Dallas central business district and 27.7 miles northeast of the Fort Worth central business district. The Hilton Garden Inn Las Colinas Property is situated approximately 0.6 miles west of the Interstate 635/Route 161 interchange, which, according to a third party market research provider, had a daily traffic count of approximately 139,347 vehicles as of 2017. According to the third party market research provider, the 2019 population within a one-, three- and five-mile radius of the Hilton Garden Inn Las Colinas Property was 17,375, 75,897 and 213,691, respectively. The 2019 average household income within the same one-, three- and five-mile radii was $120,678, $105,025 and $95,623, respectively.
According to the appraisal, the Hilton Garden Inn Las Colinas Property is located within the Dallas - Fort Worth (“DFW”) Metroplex region, which is home to the global headquarters of 5 Fortune 500 corporations and more than 45 Fortune 1,000 companies. Within the City of Irving, major employers include Citi, Verizon, Allstate Insurance, Pioneer Natural Resources Co., Microsoft Corporation, Quest Diagnostics, Nokia, 7-Eleven, Michaels, Fluor, Commercial Metals, Darling Ingredients Inc., Celanese, Flowserve, and ExxonMobil. According to the Appraisal, the Hilton Garden Inn Las Colinas Property is situated approximately 3.6 southwest of the Cypress Water mixed-use development, an approximately 1,000-acre development expected to include approximately 4.5 million SF of office space and 10,000 multifamily units, expected for completion in 2020. Cypress Waters is home to the headquarters for CoreLogic, 7-Eleven, Nationstar Mortgage, OneSource Virtual, and Signet Jewelers (Zales). According to a third party market research report, within a three-mile radius of the Hilton Garden Inn Las Colinas Property, there are approximately 293 office buildings totaling 29.1 million SF with a weighted average occupancy rate of approximately 15.4%.
The appraisal did not identify any proposed hotels or properties that are currently under development that are expected to be directly competitive with the Hilton Garden Inn Las Colinas Property.
This is not a research report and was not prepared by any Underwriter’s research department. Please see additional important information and qualifications at the end of this Term Sheet.
T-133
| Hospitality – Full Service | Loan #14 | Cut-off Date Balance: | $19,000,000 | |
| 7516 Las Colinas Boulevard | Hilton Garden Inn Las Colinas | Cut-off Date LTV: | 60.1% | |
| Irving, TX 75063 | U/W NCF DSCR: | 1.72x | ||
| U/W NOI Debt Yield: | 12.5% | |||
Operating History and Underwritten Net Cash Flow. The following table presents certain information relating to the operating history and Underwritten Net Cash Flow at the Hilton Garden Inn Las Colinas Property:
| Cash Flow Analysis | ||||||
| 2016(1) | 2017(1) | 2018 | TTM 2/28/2019 | UW | UW per Room | |
| Occupancy | 68.9% | 54.5% | 68.0% | 67.1% | 67.1% | |
| ADR | $132.85 | $132.76 | $142.79 | $145.07 | $145.07 | |
| RevPAR | $91.53 | $72.42 | $97.14 | $97.31 | $97.31 | |
| Room Revenue | $5,795,543 | $4,572,745 | $6,133,932 | $6,144,346 | $6,144,346 | $35,516 |
| Food & Beverage Revenue | $555,116 | $699,684 | $882,751 | $866,429 | $874,590 | $5,055 |
| Other Revenue(2) | $66,675 | $49,166 | $77,115 | $71,173 | $74,144 | $429 |
| Total Revenue | $6,417,334 | $5,321,595 | $7,093,798 | $7,081,948 | $7,093,080 | $41,000 |
| Room Expense | $1,024,015 | $921,009 | $1,138,903 | $1,155,111 | $1,147,974 | $6,636 |
| Food & Beverage Expense | $537,342 | $628,746 | $719,211 | $717,856 | $718,590 | $4,154 |
| Other Departmental Expenses | $21,417 | $19,799 | $23,122 | $26,718 | $25,032 | $145 |
| Total Departmental Expenses | $1,582,774 | $1,569,554 | $1,881,236 | $1,899,685 | $1,891,596 | $10,934 |
| Gross Operating Income | $4,834,560 | $3,752,041 | $5,212,562 | $5,182,263 | $5,201,484 | $30,066 |
| Total Undistributed Expenses | $2,229,490 | $2,022,069 | $2,474,705 | $2,502,665 | $2,405,798 | $13,906 |
| Gross Operating Profit | $2,605,070 | $1,729,972 | $2,737,857 | $2,679,598 | $2,795,686 | $16,160 |
| Total Fixed Charges | $407,654 | $435,389 | $422,917 | $412,536 | $429,225 | $2,481 |
| Total Operating Expenses | $4,219,918 | $4,027,012 | $4,778,858 | $4,814,886 | $4,726,619 | $27,321 |
| Net Operating Income | $2,197,416 | $1,294,583 | $2,314,940 | $2,267,062 | $2,366,461 | $13,679 |
| FF&E | $0 | $0 | $0 | $0 | ($283,723) | ($1,640) |
| Net Cash Flow | $2,197,416 | $1,294,583 | $2,314,940 | $2,267,062 | $2,082,738 | $12,039 |
| NOI DSCR (IO) | 2.33x | 1.37x | 2.45x | 2.40x | 2.51x | |
| NOI DSCR (P&I) | 1.82x | 1.07x | 1.91x | 1.87x | 1.96x | |
| NCF DSCR (IO) | 2.33x | 1.37x | 2.45x | 2.40x | 2.21x | |
| NCF DSCR (P&I) | 1.82x | 1.07x | 1.91x | 1.87x | 1.72x | |
| NOI Debt Yield | 11.6% | 6.8% | 12.2% | 11.9% | 12.5% | |
| NCF Debt Yield | 11.6% | 6.8% | 12.2% | 11.9% | 11.0% | |
| (1) | The decline in occupancy inform 2016 to 2017 is attributable to approximate $5,962,974 ($34,468 per key) of PIP work completed at the Hilton Garden Inn Las Colinas Property, which resulted in an average 62 rooms offline for 27 days per month, totaling 12,096 rooms offline between March and September 2017. |
| (2) | Other Revenue consists of revenue from the gift shop, telephone, guest laundry, vending, attrition fees, and other miscellaneous items. |
This is not a research report and was not prepared by any Underwriter’s research department. Please see additional important information and qualifications at the end of this Term Sheet.
T-134
(THIS PAGE INTENTIONALLY LEFT BLANK)
T-135
| Multifamily - Cooperative | Loan #15 | Cut-off Date Balance: | $16,675,000 | |
| 141-24 78th Avenue, 141-48 78th Road | Regency Gardens Apartment Corp. | Cut-off Date LTV: | 11.0% | |
| & 141-02 79th Avenue | U/W NCF DSCR: | 6.05x | ||
| Kew Gardens Hills, NY 11367 | U/W NOI Debt Yield: | 35.0% | ||
| Mortgage Loan No. 15 – Regency Gardens Apartment Corp. |
| Mortgage Loan Information | Property Information | ||||||
| Mortgage Loan Seller: | NCB | Single Asset/Portfolio: | Single Asset | ||||
| Credit Assessment (Fitch/KBRA/Moody’s): | NR/AAA(sf)/AAA(sf) | Location: | Kew Gardens Hills, NY 11367 | ||||
| Original Balance: | $16,675,000 | General Property Type: | Multifamily | ||||
| Cut-off Date Balance: | $16,675,000 | Detailed Property Type: | Cooperative | ||||
| % of Initial Pool Balance: | 1.6% | Title Vesting: | Fee | ||||
| Loan Purpose: | Refinance | Year Built/Renovated: | 1938/1999 | ||||
| Sponsor(1): | N/A | Size: | 544 Units | ||||
| Guarantor(1): | N/A | Cut-off Date Balance per Unit: | $30,653 | ||||
| Mortgage Rate: | 3.9000% | Maturity Date Balance per Unit: | $24,331 | ||||
| Note Date: | 4/25/2019 | Property Manager: | Vision Enterprises Management, LLC. | ||||
| First Payment Date: | 6/1/2019 | Underwriting and Financial Information | |||||
| Maturity Date: | 5/1/2029 | UW NOI: | $5,828,612 | ||||
| Original Term to Maturity: | 120 months | UW NOI Debt Yield(2): | 35.0% | ||||
| Original Amortization Term: | 360 months | UW NOI Debt Yield at Maturity(2): | 44.0% | ||||
| IO Period: | 0 months | UW NCF DSCR(2): | 6.05x | ||||
| Seasoning: | 0 months | Most Recent NOI(5): | N/A | ||||
| Prepayment Provisions: | YM1 (113); 1% (3); O (4) | 2nd Most Recent NOI(5): | N/A | ||||
| Lockbox/Cash Mgmt Status: | None | 3rd Most Recent NOI(5): | N/A | ||||
| Additional Debt Type(2): | Floating | Most Recent Occupancy(6): | N/A | ||||
| Additional Debt Balance(2): | $0 | 2nd Most Recent Occupancy(6): | N/A | ||||
| Future Debt Permitted (Type)(3): | Yes (Secured) | 3rd Most Recent Occupancy(6): | N/A | ||||
| Appraised Value (as of)(7): | $151,400,000 (3/21/2019) | ||||||
| Appraised Value per Unit(7): | $278,309 | ||||||
| Reserves | Cut-off Date LTV Ratio(2)(7): | 11.0% | |||||
| Type | Initial | Monthly | Cap | Maturity Date LTV Ratio(2)(7): | 8.7% | ||
| RE Tax: | N/A | Springing(4) | N/A | Coop-Rental Value(8): | $114,300,000 | ||
| Insurance: | N/A | Springing(4) | N/A | Coop-LTV Rental(8): | 14.6% | ||
| Sources and Uses | ||||||
| Sources | Proceeds | % of Total | Uses | Proceeds | % of Total | |
| Loan Amount: | $16,675,000 | 100.0% | Loan Payoff: | $12,691,753 | 76.1% | |
| Proceeds to Borrower: | $3,697,464 | 22.2% | ||||
| Closing Costs: | $285,783 | 1.7% | ||||
| Total Sources: | $16,675,000 | 100.0% | Total Uses: | $16,675,000 | 100.0% | |
| (1) | The Regency Gardens Apartment Corp. Property (as defined below) is owned by the Regency Gardens Apartment Corp. Borrower (as defined below), which is a cooperative housing corporation. No individual or entity (other than the Regency Gardens Apartment Corp. Borrower) has recourse obligations with respect to the Regency Gardens Apartment Corp. Mortgage Loan (as defined below), including pursuant to any guaranty or environmental indemnity. |
| (2) | The Regency Gardens Apartment Corp. Property also secures a subordinate second lien mortgage loan to the Regency Gardens Apartment Corp. Borrower in the amount of up to $1,000,000 (the “Regency Gardens Apartment Corp. Subordinate Loan”) which permits advances from time to time. The outstanding balance of the Regency Gardens Apartment Corp. Subordinate Loan as of the cut-off date is $0. National Cooperative Bank, N.A. is the holder of the Regency Gardens Apartment Corp. Subordinate Loan. With regard to the interest rate, term, payment terms and other statistical information relating to the Regency Gardens Apartment Corp. Subordinate Loan, see “Description of the Mortgage Pool—Additional Indebtedness—Other Secured Indebtedness—Additional Debt Financing For Mortgage Loans Secured by Residential Cooperatives” in the Preliminary Prospectus. All statistical information presented above relating to balances per unit, debt yields, debt service coverage ratios and loan-to-value ratios are based solely on the Regency Gardens Apartment Corp. Mortgage Loan (as defined below). As of the Cut-off Date, on an aggregate basis (i.e., aggregating both the Regency Gardens Apartment Corp. Mortgage Loan and the Regency Gardens Apartment Corp. Subordinate Loan), the Cut-off Date Balance per Unit, Maturity Date Balance per Unit, UW NOI Debt Yield, UW NOI Debt Yield at Maturity, UW NCF DSCR, Cut-off Date LTV Ratio and Maturity Date LTV Ratio are $32,491, $26,169, 33.0%, 41.0%, 5.71x, 11.7% and 9.4%, respectively, with such figures being calculated assuming (with respect to the Regency Gardens Apartment Corp. Subordinate Loan) (i) that interest is accruing pursuant to the applicable loan document (with the applicable interest rate determined using the Prime Rate in effect as of April 30, 2019 and giving effect to any applicable interest rate floor), (ii) that the loan has been fully advanced, (iii) that any initial interest-only period has expired and the borrower is required to make scheduled payments of principal and interest as set forth in the promissory note and (iv) that the entire amount of the loan is outstanding as of the maturity date. |
| (3) | In addition to Regency Gardens Apartment Corp. Subordinate Loan as described in footnote (2) above, National Cooperative Bank, N.A., the applicable master servicer of the Regency Gardens Apartment Corp. Mortgage Loan, will be permitted to waive the enforcement of the “due-on-encumbrance” clause in the related mortgage instrument to permit subordinate debt secured by the Regency Gardens Apartment Corp. Property, subject to the satisfaction of various conditions and subject to certain parameters set forth in the pooling and servicing agreement for the BANK 2019-BNK18 securitization. See “Description of the Mortgage Pool—Additional Indebtedness—Other Secured Indebtedness—Additional Debt Financing For Mortgage Loans Secured by Residential Cooperatives” in the Preliminary Prospectus. |
| (4) | The Regency Gardens Apartment Corp. Borrower is required to deposit, simultaneously with each monthly loan payment, 1/12 of the estimated annual real estate tax payments upon (i) failure to provide evidence of the payment of such taxes within 60 days following the date on which such payment is due to the applicable taxing authority or (ii) the occurrence of an event of default under the applicable loan documents. In addition, the Regency Gardens Apartment Corp. Borrower may be required to deposit, simultaneously with each monthly loan payment, 1/12 of the annual insurance premiums upon the occurrence of an event of default under the applicable loan documents. |
This is not a research report and was not prepared by any Underwriter’s research department. Please see additional important information and qualifications at the end of this Term Sheet.
T-136
| Multifamily - Cooperative | Loan #15 | Cut-off Date Balance: | $16,675,000 | |
| 141-24 78th Avenue, 141-48 78th Road | Regency Gardens Apartment Corp. | Cut-off Date LTV: | 11.0% | |
| & 141-02 79th Avenue | U/W NCF DSCR: | 6.05x | ||
| Kew Gardens Hills, NY 11367 | U/W NOI Debt Yield: | 35.0% | ||
| (5) | Most Recent NOI, 2nd Most Recent NOI and 3rd Most Recent NOI are “not available”. Residential cooperatives are not-for-profit entities that set maintenance fees to cover current expenses and plan for future capital needs. A residential cooperative can increase or decrease maintenance fees according to its anticipated expenses and level of cash reserves. The historical NOI figures are not representative of the cash flow generated by the Regency Gardens Apartment Corp. Property if it were operated as a multifamily rental property. |
| (6) | Most Recent Occupancy, 2nd Most Recent Occupancy and 3rd Most Recent Occupancy is not reported as all residential units are owned by tenant-shareholders. |
| (7) | For purposes of determining the Appraised Value, the Appraised Value per Unit, the Cut-off Date LTV Ratio and the Maturity Date LTV Ratio, the value estimate reflected in the appraisal of the Regency Gardens Apartment Corp. Property is determined as if such residential cooperative property is operated as a residential cooperative and, in general, such value equals the sum of (i) the gross share value of all cooperative units in such residential cooperative property, based in part on various comparable sales of cooperative apartment units in the market, plus (ii) the amount of the underlying debt encumbering such residential cooperative property. See “Description of the Mortgage Pool-Certain Characteristics of Mortgage Loans Secured by Residential Cooperatives” in the Preliminary Prospectus. |
| (8) | The Coop-Rental Value and the Coop-LTV as Rental assumes the Regency Gardens Apartment Corp. Property is operated as a multifamily rental property. See“Risk Factors—Risks Relating to the Mortgage Loans—Residential Cooperative Properties Have Special Risks,” and “Description of the Mortgage Pool-Property Types-Multifamily Properties” in the Preliminary Prospectus. |
The Mortgage Loan.The fifteenth largest mortgage loan (the “Regency Gardens Apartment Corp. Mortgage Loan”) is evidenced by a promissory note in the original principal amount of $16,675,000 and secured by a first priority fee mortgage encumbering a residential cooperative building located in Kew Gardens Hills, New York (the “Regency Gardens Apartment Corp. Property”). Proceeds from the Regency Gardens Apartment Corp. Mortgage Loan were used to refinance the previous loan secured by the Regency Gardens Apartment Corp. Property, fund reserves and pay closing costs.
The Borrower. The borrower is Regency Gardens Apartment Corp., a cooperative housing corporation organized under the laws of the State of New York (the “Regency Gardens Apartment Corp. Borrower”). The Regency Gardens Apartment Corp. Property is owned in fee simple by the Regency Gardens Apartment Corp. Borrower. No individual or entity (other than the Regency Gardens Apartment Corp. Borrower) has recourse obligations with respect to the Regency Gardens Apartment Corp. Mortgage Loan, including pursuant to any guaranty or environmental indemnity.
The Property. The Regency Gardens Apartment Corp. Property consists of 544 units, with 543 residential units and one professional unit in 69, two to three story plus basement residential cooperative apartment buildings located in Kew Gardens Hill, New York. The Regency Gardens Apartment Corp. Property was constructed from 1938 to 1940 and converted to cooperative ownership in 1987. The Regency Gardens Apartment Corp. Property is 57.2% (311 units) shareholder-owned and 42.8% unsold (233 units). Of the 233 unsold units, 188 units are sponsor-owned units, 43 units are investor owned units and two units are cooperative owned. The 188 sponsor owned units generate a positive carry of approximately $1.16 million per year. The Regency Gardens Apartment Corp. Property also contains one superintendent unit and three handyman units without shares that are owned by the Regency Gardens Apartment Corp. Borrower.
The Regency Gardens Apartment Corp. Property features tenant storage areas, laundry rooms and two parking garages. The parking garages are located in the basements of the properties located at 141-02 78th Avenue and 141-02 79th Avenue, and consist of 133 total parking spaces, which are leased exclusively to tenant-shareholders of the Regency Gardens Apartment Corp. Borrower.
The table below shows the apartment unit mix at the Regency Gardens Apartment Corp. Property:
| Regency Gardens Apartment Corp. Unit Mix | ||||||||
| Unit Type | Units | % of Total Units | Average SF per Unit | Total SF | ||||
| 1 Bedroom 3 Rooms | 217 | 39.9% | 575 | 124,775 | ||||
| 1 Bedroom 3.5 Rooms | 45 | 8.3% | 675 | 30,375 | ||||
| 1 Bedroom 3.5 Rooms w Terrace | 14 | 2.6% | 675 | 9,450 | ||||
| 1 Bedroom 4 Rooms | 135 | 24.8% | 775 | 104,625 | ||||
| 2 Bedroom | 39 | 7.2% | 875 | 34,125 | ||||
| 3 Bedroom | 93 | 17.1% | 975 | 90,675 | ||||
| Professional Unit | 1 | 0.2% | 875 | 875 | ||||
| Total/Wtd. Avg. | 544 | 100% | 726 | 394,900 | ||||
| Source: Appraisal. | ||||||||
The Market. The subject property is located on the northerly side of Union Turnpike, and occupies three city blocks between Union Turnpike on the south and 78th Avenue on the north, between 141st Street on the west and Main Street on the east, in the Kew Gardens Hills neighborhood of Queens County, City and State of New York.
According to the appraisal, the Regency Gardens Apartment Corp. Property is located in Queens Community District 8. This district includes Pomonok, Kew Gardens Hills, Utopia, Fresh Meadows, Hillcrest, Briarwood, Jamaica Hills and Jamaica Estates. The district is bounded on the north by the Horace Harding Expressway and Reeves Avenue, on the east by the Oceania Street and the Clearview Expressway, on the south by Hillside Avenue and on the west by the Van Wyck Expressway. The district covers an area of 7.4 square miles. Most improvements in the immediate vicinity of the subject property were erected in the 1950’s and 1960’s, although there has been some new spot-construction/redevelopment since that time. Additionally, residential housing is considered stable in the area.
There are 32 public elementary and secondary schools, 19 private and parochial elementary schools, and four colleges and other post-secondary institutions within this district. Parks and recreation centers within this district include Flushing Meadow-Corona Park, Kissena Corridor Park and nine
This is not a research report and was not prepared by any Underwriter’s research department. Please see additional important information and qualifications at the end of this Term Sheet.
T-137
| Multifamily - Cooperative | Loan #15 | Cut-off Date Balance: | $16,675,000 | |
| 141-24 78th Avenue, 141-48 78th Road | Regency Gardens Apartment Corp. | Cut-off Date LTV: | 11.0% | |
| & 141-02 79th Avenue | U/W NCF DSCR: | 6.05x | ||
| Kew Gardens Hills, NY 11367 | U/W NOI Debt Yield: | 35.0% | ||
playgrounds, which are each within one mile of the subject. Queens Hospital and Medical Center is the nearest major medical facility and is located at 164th Street/Grand Central Parkway, within ½ mile of the subject. The New York City Fire Department and Police Department adequately service this area.
North and east of the subject property are other multi-family properties. To the west of the subject property is a park. To the south of the subject property are several small improvements, consisting of commercial and residential uses. Local shopping, including local and regional grocery stores, as well as fashion retailers, is available at the northeast corner of Union Turnpike and Main Street. CUNY-Queens College is approximately 1 mile north of the subject property.
According to a third-party market research report, the Regency Gardens Apartment Corp. Property is located in the Queens County submarket. According to the report, the Queens County submarket reported a 6.2% vacancy rate as of the first quarter of 2019.
Comparable rental properties to the Regency Gardens Apartment Corp. Property are shown in the table below:
| Comparable Rental Properties | ||||||||
| Property | City/State | Distance | Year Built | # Units | Occupancy | Average SF per Unit | Average Rent per Unit | Average Rent PSF |
| Regency Gardens Apartment Corp. | Kew Gardens Hills, NY | - | 1938 | 544 | 95.3%(1) | 726 | $1,720(2) | $2.37(2) |
| 123-30 83rd Ave. | Kew Gardens, NY | 1.3 miles | 1962 | 51 | 100.0% | 724 | $1,842 | $2.55 |
| 79-11 146th St. | Flushing, NY | 0.4 miles | 1956 | 47 | 97.9% | 577 | NAV | NAV |
| 83-55 Austin St. | Kew Gardens, NY | 2.0 miles | 1954 | 43 | 97.7% | 950 | $1,797 | $1.89 |
| 15009 Union Turnpike | Flushing, NY | 0.7 miles | 1966 | 200 | 98.5% | 745 | $1,572 | $2.11 |
Source: Appraisal and third-party reports and research.
| (1) | Occupancy reported as of March 21, 2019 reflects the vacancy/collection loss assumption in the related appraisal for purposes of determining the appraised value of the Regency Gardens Apartment Corp. Property as a multifamily rental property (i.e., the Coop-Rental Value) as of the appraisal valuation date. |
| (2) | The Average Rent per Unit and Average Rent PSF for the Regency Gardens Apartment Corp. Property is estimated using market rents for residential units as determined by the appraiser. |
Underwritten Net Cash Flow.The following table presents certain information relating to the Underwritten Net Cash Flow at the Regency Gardens Apartment Corp. Property
| Cash Flow Analysis(1) | |||||
| UW | UW per Unit | ||||
| Base Rent | $11,198,986 | $20,586 | |||
| Commercial Income(2) | $26,250 | $48 | |||
| Other Income(3) | $215,600 | $396 | |||
| Less Vacancy & Credit Loss(4) | ($537,963) | ($989) | |||
| Effective Gross Income | $10,902,873 | $20,042 | |||
| Total Operating Expenses | $5,074,261 | $9,328 | |||
| Net Operating Income | $5,828,612 | $10,714 | |||
| Capital Expenditures | $113,900 | $209 | |||
| Net Cash Flow | $5,714,712 | $10,505 | |||
| Occupancy % | 95.3%(4) | ||||
| NOI DSCR(5) | 6.18x | ||||
| NCF DSCR(5) | 6.05x | ||||
| NOI Debt Yield(5) | 35.0% | ||||
| NCF Debt Yield(5) | 34.3% | ||||
| | |||||
| (1) | Residential cooperatives are generally organized and operated as not-for-profit entities that set maintenance fees to cover current expenses and plan for future capital needs. The underwritten Net Operating Income and the underwritten Net Cash Flow for the Regency Gardens Apartment Corp. Property is the projected net operating income and projected net cash flow reflected in the appraisal. Underwritten Net Operating Income, in general, equals projected operating income at the Regency Gardens Apartment Corp. Property assuming such property is operated as a rental property with rents and other income set at the prevailing market rates, reduced by underwritten property operating expenses and a market-rate vacancy assumption – in each case as determined by the appraiser. Underwritten Net Cash Flow equals the projected net operating income less projected replacement reserves – as determined by the appraiser. However, the projected net cash flow used in such determinations may differ materially from the scheduled monthly maintenance payments from the tenant-shareholders upon which residential cooperatives depend. |
| (2) | Commercial Income includes shareholder-owned professional unit Income. |
| (3) | Other Income includes parking, storage and laundry income. |
| (4) | The vacancy reported reflects the vacancy assumption in the related appraisal for purposes of determining the appraised value of the Regency Gardens Apartment Corp. Property as a multifamily rental property. |
| (5) | Debt service coverage ratios and debt yields are based on the Regency Gardens Apartment Corp. Mortgage Loan only and do not include any subordinate debt that may be advanced under the Regency Gardens Apartment Corp. Subordinate Loan or otherwise. |
This is not a research report and was not prepared by any Underwriter’s research department. Please see additional important information and qualifications at the end of this Term Sheet.
T-138
| BANK 2019-BNK18 |
This material was prepared by sales, trading, banking or other non-research personnel of one of the following (or an affiliate thereof): BofA Securities, Inc. (together with its affiliates, “BofA”), Morgan Stanley & Co. LLC, Morgan Stanley & Co. International Limited, Morgan Stanley Japan Limited and/or Morgan Stanley Dean Witter Asia Limited (together with their affiliates, hereinafter “Morgan Stanley”), Wells Fargo Securities, LLC (together with its affiliates, “Wells Fargo”), Drexel Hamilton, LLC (together with its affiliates, “Drexel”) or Academy Securities, Inc. (together with its affiliates, “Academy”, and collectively with BofA, Morgan Stanley, Wells Fargo and Drexel, the “Underwriters”). This material was not produced by an Underwriter’s research analyst, although it may refer to an Underwriter’s research analyst or research report. Unless otherwise indicated, these views (if any) are the author’s and may differ from those of the fixed income or equity research departments of the Underwriters or others in those firms.
This material may have been prepared by or in conjunction with the respective trading desks of the Underwriters that may deal as principal in or own or act as market maker or liquidity provider for the securities/instruments (or related derivatives) mentioned herein. The trading desk of any Underwriter may have accumulated a position in the subject securities/instruments based on the information contained herein. Trading desk materials are not independent of the proprietary interests of the Underwriters, which may conflict with your interests. Each of the Underwriters may also perform or seek to perform investment banking services for the issuers of the securities and instruments mentioned herein.
The information contained in this material is subject to change, completion or amendment from time to time, and the information in this material supersedes information in any other communication relating to the securities referred to in this material. This material is not a solicitation to participate in any trading strategy, and is not an offer to sell any security or instrument or a solicitation of an offer to buy or sell any security or instrument in any jurisdiction where an offer, solicitation or sale is not permitted. Unless otherwise set forth in this material, any securities referred to in this material may not have been registered under the U.S. Securities Act of 1933, as amended, and, if not, may not be offered or sold absent an exemption therefrom. Recipients are required to comply with any legal or contractual restrictions on their purchase, holding, sale, exercise of rights or performance of obligations under any securities/instruments transaction.
The securities/instruments discussed in this material may not be suitable for all investors. This material has been prepared and issued by the Underwriters for intended distribution to market professionals and institutional investor clients. Other recipients should seek independent investment advice prior to making any investment decision based on this material. This material does not provide individually tailored investment advice or offer tax, regulatory, accounting or legal advice. Prior to entering into any proposed transaction, recipients should determine, in consultation with their own investment, legal, tax, regulatory and accounting advisors, the economic risks and merits, as well as the legal, tax, regulatory and accounting characteristics and consequences, of the transaction. You should consider this material as only a single factor in making an investment decision. The value of and income from investments may vary because of changes in interest rates, foreign exchange rates, default rates, prepayment rates, securities/instruments prices, market indexes, operational or financial conditions of companies or other factors. There may be time limitations on the exercise of options or other rights in securities/instruments transactions. Past performance is not necessarily a guide to future performance. Estimates of future performance are based on assumptions that may not be realized. Actual events may differ from those assumed and changes to any assumptions may have a material impact on any projections or estimates. Other events not taken into account may occur and may significantly affect the projections or estimates. Certain assumptions may have been made for modeling purposes only to simplify the presentation and/or calculation of any projections or estimates, and the Underwriters do not represent that any such assumptions will reflect actual future events. Accordingly, there can be no assurance that estimated returns or projections will be realized or that actual returns or performance results will not materially differ from those estimated herein. Some of the information contained in this document may be aggregated data of transactions in securities or other financial instruments executed by an Underwriter that has been compiled so as not to identify the underlying transactions of any particular customer.
Notwithstanding anything herein to the contrary, the Underwriters and each recipient hereof agree that they (and their employees, representatives, and other agents) may disclose to any and all persons, without limitation of any kind from the commencement of discussions, the U.S. federal and state income tax treatment and tax structure of the transaction and all materials of any kind (including opinions or other tax analyses) that are provided to it relating to the tax treatment and tax structure (as such terms are defined in Treasury Regulation 1.6011-4). For this purpose, “tax structure” is limited to facts relevant to the U.S. federal and state income tax treatment of the transaction and does not include information relating to the identity of the parties, their affiliates, agents or advisors. This authorization of tax disclosure is retroactively effective to the commencement of discussions with prospective investors regarding the transactions contemplated herein.
THE DISTRIBUTION OF THIS MATERIAL (A) IF MADE BY A PERSON WHO IS NOT AN AUTHORIZED PERSON UNDER THE FINANCIAL SERVICES AND MARKETS ACT 2000 (“FSMA”), IS BEING MADE ONLY TO, OR DIRECTED ONLY AT, PERSONS WHO (I) ARE OUTSIDE THE UNITED KINGDOM, OR (II) HAVE PROFESSIONAL EXPERIENCE IN MATTERS RELATING TO INVESTMENTS AND QUALIFY AS INVESTMENT PROFESSIONALS IN ACCORDANCE WITH ARTICLE 19(5) OF THE FINANCIAL SERVICES AND MARKETS ACT 2000 (FINANCIAL PROMOTION) ORDER 2005 (THE “FINANCIAL PROMOTION ORDER”), OR (III) ARE PERSONS FALLING WITHIN ARTICLE 49(2)(A) THROUGH (D) (HIGH NET WORTH COMPANIES, UNINCORPORATED ASSOCIATIONS, ETC.) OF THE FINANCIAL PROMOTION ORDER; AND (B) IF MADE BY A PERSON WHO IS AN AUTHORIZED PERSON UNDER THE FSMA, IS BEING MADE ONLY TO, OR DIRECTED ONLY AT, PERSONS WHO (I) ARE OUTSIDE THE UNITED KINGDOM, OR (II) HAVE PROFESSIONAL EXPERIENCE IN MATTERS RELATING TO INVESTMENTS AND QUALIFY AS INVESTMENT PROFESSIONALS IN ACCORDANCE WITH ARTICLE 14(5) OF THE FINANCIAL SERVICES AND MARKETS ACT 2000 (PROMOTION OF COLLECTIVE INVESTMENT SCHEMES) (EXEMPTIONS) ORDER 2001 (THE “PROMOTION OF COLLECTIVE INVESTMENT SCHEMES EXEMPTIONS ORDER”), OR (III) ARE PERSONS FALLING WITHIN ARTICLE 22(2)(A) THROUGH (D) (“HIGH NET WORTH COMPANIES, UNINCORPORATED ASSOCIATIONS, ETC.”) OF THE PROMOTION OF COLLECTIVE INVESTMENT SCHEMES EXEMPTIONS ORDER, OR (IV) ARE PERSONS TO WHOM THE ISSUING ENTITY MAY LAWFULLY BE PROMOTED IN ACCORDANCE WITH CHAPTER 4.12 OF THE UK FINANCIAL CONDUCT AUTHORITY’S CONDUCT OF BUSINESS SOURCEBOOK.
THE OFFERED CERTIFICATES HAVE NOT BEEN AND WILL NOT BE REGISTERED UNDER THE FINANCIAL INSTRUMENTS EXCHANGE ACT OF JAPAN (LAW NO. 25 OF 1948, AS AMENDED (THE “FIEL”)), AND EACH OF BOFA SECURITIES, INC., MORGAN STANLEY & CO. LLC, WELLS FARGO SECURITIES, LLC, ACADEMY SECURITIES, INC. AND DREXEL HAMILTON, LLC HAS AGREED THAT IT WILL NOT OFFER OR SELL ANY OFFERED CERTIFICATES, DIRECTLY OR INDIRECTLY, IN JAPAN OR TO, OR FOR THE BENEFIT OF, ANY JAPANESE PERSON, OR TO OTHERS FOR RE-OFFERING OR RESALE, DIRECTLY OR INDIRECTLY, IN JAPAN OR TO ANY JAPANESE PERSON, EXCEPT PURSUANT TO AN EXEMPTION FROM THE REGISTRATION REQUIREMENTS OF, AND OTHERWISE IN COMPLIANCE WITH, THE FIEL AND ANY OTHER APPLICABLE LAWS AND REGULATIONS. FOR THE PURPOSES OF THIS PARAGRAPH, “JAPANESE PERSON” SHALL MEAN ANY PERSON RESIDENT IN JAPAN, INCLUDING ANY CORPORATION OR OTHER ENTITY ORGANIZED UNDER THE LAWS AND REGULATIONS OF JAPAN.
This is not a research report and was not prepared by any Underwriter’s research department. Please see additional important information and qualifications at the end of this Term Sheet.
T-139