
ADVANTAGE SOLUTIONS INC. Q4 2021 Earnings Presentation March 1, 2022
DISCLAIMER 1 Forward - Looking Statements Certain statements in this press release may be considered forward - looking statements within the meaning of the federal securiti es laws, including statements regarding the expected future performance of Advantage's business. Forward - looking statements generally relate to future events or Advantage’s future financial or operating performance. These for ward - looking statements generally are identified by the words “may”, “should”, “expect”, “intend”, “will”, “would”, “estimate”, “anticipate”, “believe”, “predict”, “potential” or “continue”, or the negatives of these terms o r v ariations of them or similar terminology. Such forward - looking statements are predictions, projections and other statements about future events that are based on current expectations and assumptions and, as a result, are subject to ris ks, uncertainties, and other factors which could cause actual results to differ materially from those expressed or implied by such forward looking statements. These forward - looking statements are based upon estimates and assumptions that, while considered reasonable by Advantage and its management at the time of such statements, are inherently uncertain. Factors that may cause actual results to differ materially from current expectations include, but are not limited to, the COVID - 19 pandemic and the mea sures taken in response thereto; the availability, acceptance, administration and effectiveness of any COVID - 19 vaccine; market - driven wage changes or changes to labor laws or wage or job classification regulations, including minim um wage; Advantage’s ability to continue to generate significant operating cash flow; client procurement strategies and consolidation of Advantage’s clients’ industries creating pressure on the nature and pricing of it s s ervices; consumer goods manufacturers and retailers reviewing and changing their sales, retail, marketing, and technology programs and relationships; Advantage’s ability to successfully develop and maintain relevant omni - channel servic es for our clients in an evolving industry and to otherwise adapt to significant technological change; Advantage’s ability to maintain proper and effective internal controls in the future; potential and actual harms to Advantage ’s business arising from the Take 5 Matter; Advantage’s substantial indebtedness and our ability to refinance at favorable rates; and other risks and uncertainties set forth in the section titled “Risk Factors” in the Annual Report on For m 10 - K filed by the Company with the Securities and Exchange Commission (the “SEC”) on March 1, 2022 and in its other filings made from time to time with the SEC. These filings identify and address other important risks and uncert ain ties that could cause actual events and results to differ materially from those contained in the forward - looking statements. Forward - looking statements speak only as of the date they are made. Readers are cautioned not to put undue r eliance on forward - looking statements, and Advantage assumes no obligation and does not intend to update or revise these forward - looking statements, whether as a result of new information, future events, or otherwise, except a s required by law. Non - GAAP Financial Measures and Related Information This press release includes certain financial measures not presented in accordance with generally accepted accounting princip les (“GAAP”), Adjusted EBITDA and Net Debt. These are not measures of financial performance calculated in accordance with GAAP and may exclude items that are significant in understanding and assessing Advantage’s financial results. Th erefore, the measures are in addition to, and not a substitute for or superior to, measures of financial performance prepared in accordance with GAAP, and should not be considered in isolation or as an alternative to net income, c ash flows from operations or other measures of profitability, liquidity or performance under GAAP. You should be aware that Advantage’s presentation of these measures may not be comparable to similarly - titled measures used by other companies. Reconciliations of historical non - GAAP measures to their most directly comparable GAAP counterparts are included below. Advantage believes these non - GAAP measures provide useful information to management and investors regarding certain financial an d business trends relating to Advantage’s financial condition and results of operations. Advantage believes that the use of Adjusted EBITDA and Net Debt provides an additional tool for investors to use in evaluating ongoing ope rating results and trends and in comparing Advantage’s financial measures with other similar companies, many of which present similar non - GAAP financial measures to investors. Non - GAAP financial measures are subject to inherent limi tations as they reflect the exercise of judgments by management about which expense and income are excluded or included in determining these non - GAAP financial measures. Additionally, other companies may calculate non - GAAP meas ures differently, or may use other measures to calculate their financial performance, and therefore Advantage’s non - GAAP measures may not be directly comparable to similarly titled measures of other companies. Adjusted EBITDA means net income (loss) before ( i ) interest expense, net, (ii) provision for (benefit from) income taxes, (iii) depreciation, (iv) impairment of goodwill and ind efinite - lived assets, (v) amortization of intangible assets, (vi) equity based compensation of Karman Topco L.P. and Advantage’s private equity sponsors’ management fee, (vii) change in fair val ue of warrant liability, (viii) stock - based compensation expense, (ix) fair value adjustments of contingent consideration related to acquisitions, (x) acquisition - related expenses, (xi) costs associated with COVID - 19, net of benefits received, (xii) EBITDA for economic interests in investments, (xiii) restructuring expenses, (xiv) litigation expenses, (xv) (Recovery from) loss on Take 5, (xvi) costs associated with the Take 5 Matter and (xvii) other adju stm ents that management believes are helpful in evaluating our operating performance. Net Debt represents the sum of current portion of long - term debt and long - term debt, less cash and cash equivalents and debt iss uance costs. With respect to Net Debt, cash and cash equivalents are subtracted from the GAAP measure, total debt, because they could be used to reduce the debt obligations. Due to rounding, numbers presented throughout this document may not add up precisely to the totals provided and percentages m ay not precisely reflect the absolute figures.
Q4 KEY MESSAGES 2 • Delivered solid fourth quarter revenue and adjusted EBITDA growth, finishing strong in a challenging year • Seeing continued recovery in businesses most impacted by COVID, with sampling events up ~20% q/q • Seeing sustained at - home consumer goods demand – supported by healthy pricing and modest unit growth • Posting double - digit growth in higher margin digital services • Investing heavily in recruiting and retention to stand up thousands of new associates • Generating cost and revenue synergies from value accretive tuck in acquisitions • Delivering low double - digit incremental margins despite mix headwinds and investments in labor and wage • Preparing to accelerate reinvestment to strengthen and extend the Advantage franchise
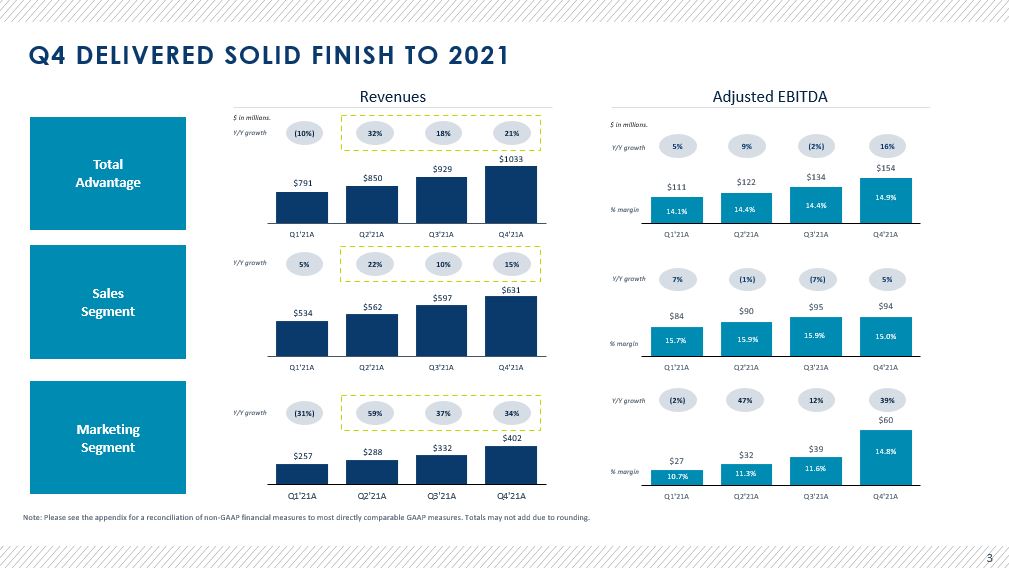
Note: Please see the appendix for a reconciliation of non - GAAP financial measures to most directly comparable GAAP measures . Totals may not add due to rounding. Total Advantage Sales Segment Marketing Segment $791 $850 $929 $1033 Q1'21A Q2'21A Q3'21A Q4'21A $111 $122 $134 $154 14.1% 14.4% 14.4% 14.9% Q1'21A Q2'21A Q3'21A Q4'21A 5% Y/Y growth 9% (2%) $534 $562 $597 $631 Q1'21A Q2'21A Q3'21A Q4'21A $84 $90 $95 $94 15.7% 15.9% 15.9% 15.0% Q1'21A Q2'21A Q3'21A Q4'21A 7% (1%) (7%) $257 $288 $332 $402 Q1'21A Q2'21A Q3'21A Q4'21A (10%) 32% 5% 22% 10% (31%) 59% 37% 18% Y/Y growth $27 $32 $39 $60 10.7% 11.3% 11.6% 14.8% Q1'21A Q2'21A Q3'21A Q4'21A (2%) 47% 12% % margin % margin % margin Y/Y growth Y/Y growth Y/Y growth Y/Y growth $ in millions. $ in millions. Revenues Adjusted EBITDA 21% 16% 15% 34% 5% 39% 3 Q4 DELIVERED SOLID FINISH TO 2021
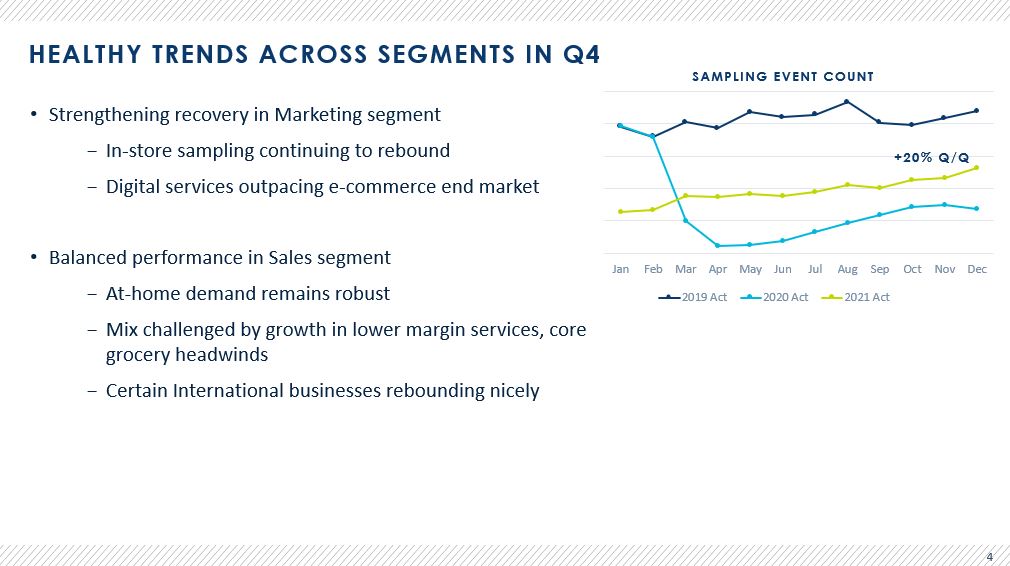
Jan Feb Mar Apr May Jun Jul Aug Sep Oct Nov Dec 2019 Act 2020 Act 2021 Act HEALTHY TRENDS ACROSS SEGMENTS IN Q4 • Strengthening recovery in Marketing segment − In - store sampling continuing to rebound − Digital services outpacing e - commerce end market • Balanced performance in Sales segment − At - home demand remains robust − Mix challenged by growth in lower margin services, core grocery headwinds − Certain International businesses rebounding nicely 4 SAMPLING EVENT COUNT +20% Q/Q
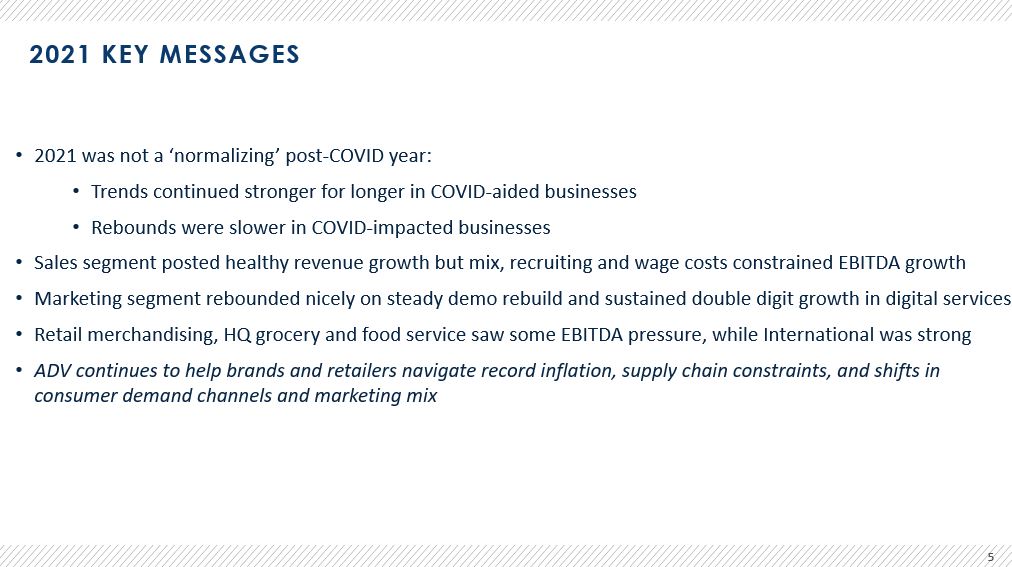
5 2021 KEY MESSAGES • 2021 was not a ‘normalizing’ post - COVID year: • Trends continued stronger for longer in COVID - aided businesses • Rebounds were slower in COVID - impacted businesses • Sales segment posted healthy revenue growth but mix, recruiting and wage costs constrained EBITDA growth • Marketing segment rebounded nicely on steady demo rebuild and sustained double digit growth in digital services • Retail merchandising, HQ grocery and food service saw some EBITDA pressure, while International was strong • ADV continues to help brands and retailers navigate record inflation, supply chain constraints, and shifts in consumer demand channels and marketing mix
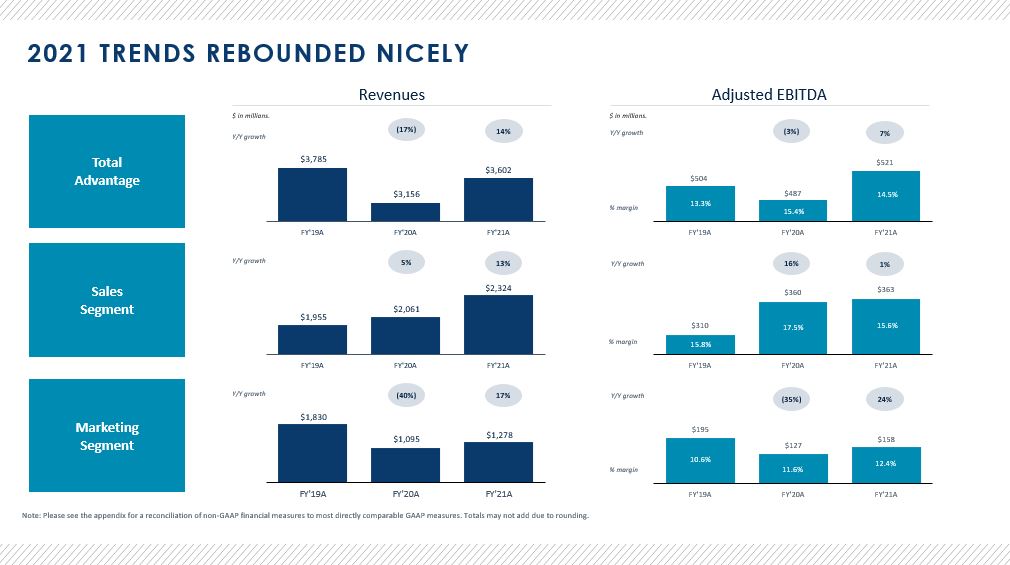
Note: Please see the appendix for a reconciliation of non - GAAP financial measures to most directly comparable GAAP measures . Totals may not add due to rounding. Total Advantage Sales Segment Marketing Segment $3,785 $3,156 $3,602 FY'19A FY'20A FY'21A Y/Y growth $1,955 $2,061 $2,324 FY'19A FY'20A FY'21A $504 $487 $521 5.8% FY'19A FY'20A FY'21A 13.3% 14.5% $1,830 $1,095 $1,278 FY'19A FY'20A FY'21A (17%) 5% Y/Y growth $195 $127 $158 10.6% 11.6% 12.4% FY'19A FY'20A FY'21A % margin % margin % margin Y/Y growth Y/Y growth Y/Y growth Y/Y growth $ in millions. $ in millions. Revenues Adjusted EBITDA 14% 13% 2021 TRENDS REBOUNDED NICELY (40%) 17% (3%) 16% 7% 1% (35%) 24% $310 $360 $363 15.8% 17.5% 15.6% FY'19A FY'20A FY'21A 15.4%

FINANCIAL PERFORMANCE
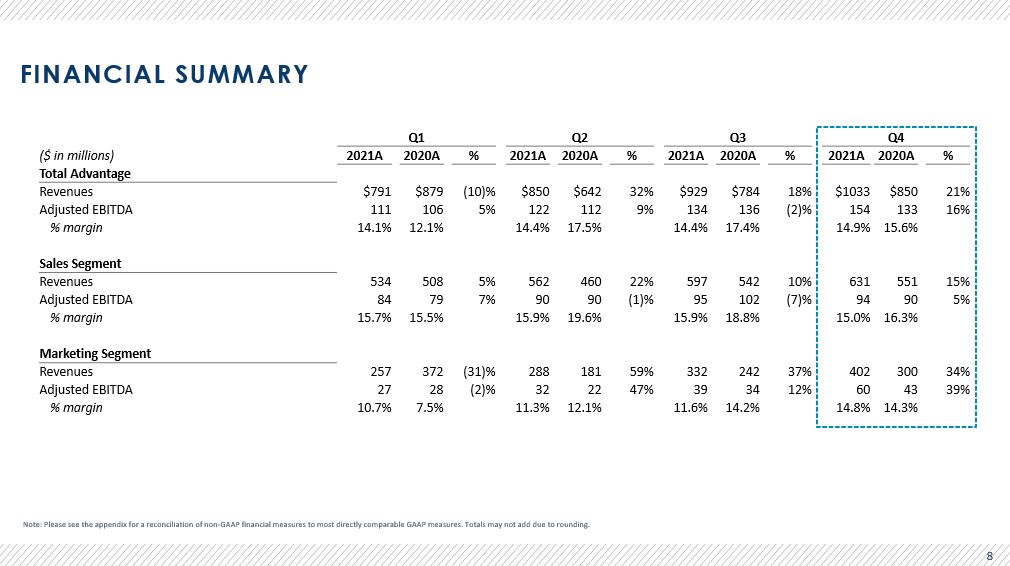
FINANCIAL SUMMARY Note: Please see the appendix for a reconciliation of non - GAAP financial measures to most directly comparable GAAP measures . Totals may not add due to rounding. 8 Q1 Q2 Q3 Q4 ($ in millions) 2021A 2020A % 2021A 2020A % 2021A 2020A % 2021A 2020A % Total Advantage Revenues $791 $879 (10)% $850 $642 32% $929 $784 18% $1033 $850 21% Adjusted EBITDA 111 106 5% 122 112 9% 134 136 (2)% 154 133 16% % margin 14.1% 12.1% 14.4% 17.5% 14.4% 17.4% 14.9% 15.6% Sales Segment Revenues 534 508 5% 562 460 22% 597 542 10% 631 551 15% Adjusted EBITDA 84 79 7% 90 90 (1)% 95 102 (7)% 94 90 5% % margin 15.7% 15.5% 15.9% 19.6% 15.9% 18.8% 15.0% 16.3% Marketing Segment Revenues 257 372 (31)% 288 181 59% 332 242 37% 402 300 34% Adjusted EBITDA 27 28 (2)% 32 22 47% 39 34 12% 60 43 39% % margin 10.7% 7.5% 11.3% 12.1% 11.6% 14.2% 14.8% 14.3%
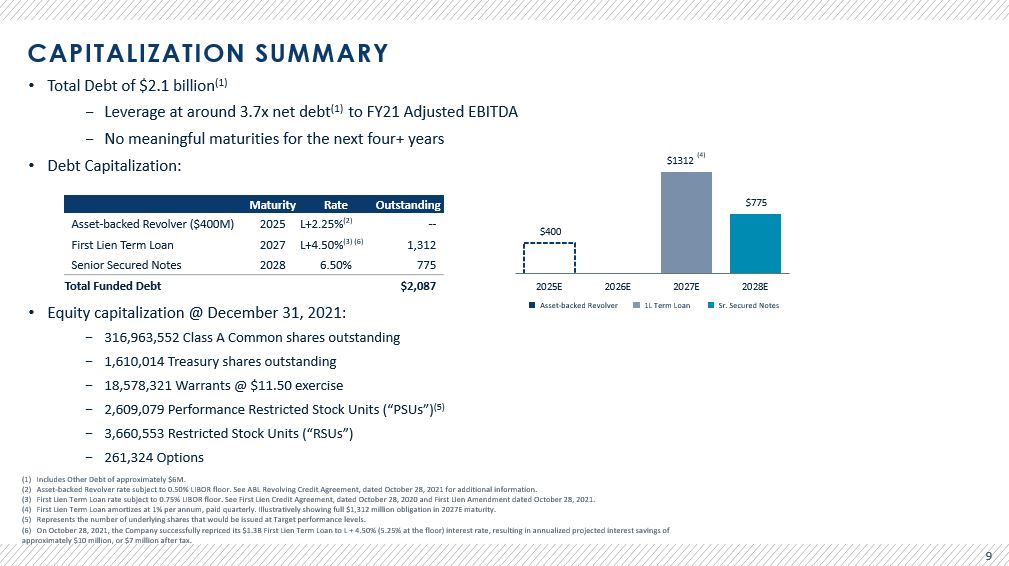
• Total Debt of $2.1 billion (1) − Leverage at around 3.7x net debt (1) to FY21 Adjusted EBITDA − No meaningful maturities for the next four+ years • Debt Capitalization: • Equity capitalization @ December 31, 2021: − 316,963,552 Class A Common shares outstanding − 1,610,014 Treasury shares outstanding − 18,578,321 Warrants @ $11.50 exercise − 2,609,079 Performance Restricted Stock Units (“PSUs”) (5) − 3,660,553 Restricted Stock Units (“RSUs”) − 261,324 Options CAPITALIZATION SUMMARY (1) Includes Other Debt of approximately $6M. (2) Asset - backed Revolver rate subject to 0.50% LIBOR floor. See ABL Revolving Credit Agreement, dated October 28, 2021 for addition al information. (3) First Lien Term Loan rate subject to 0.75% LIBOR floor. See First Lien Credit Agreement, dated October 28, 2020 and First Lie n A mendment dated October 28, 2021. (4) First Lien Term Loan amortizes at 1% per annum, paid quarterly. Illustratively showing full $1,312 million obligation in 2027 E m aturity. (5) Represents the number of underlying shares that would be issued at Target performance levels. (6) On October 28, 2021, the Company successfully repriced its $1.3B First Lien Term Loan to L + 4.50% (5.25% at the floor) inter est rate, resulting in annualized projected interest savings of approximately $10 million, or $7 million after tax. 9 Asset - backed Revolver 1L Term Loan Sr. Secured Notes $400 $1312 $775 2025E 2026E 2027E 2028E (4) Maturity Rate Outstanding Asset - backed Revolver ($400M) 2025 L+2.25% (2) -- First Lien Term Loan 2027 L+4.50% (3) (6) 1,312 Senior Secured Notes 2028 6.50% 775 Total Funded Debt $2,087
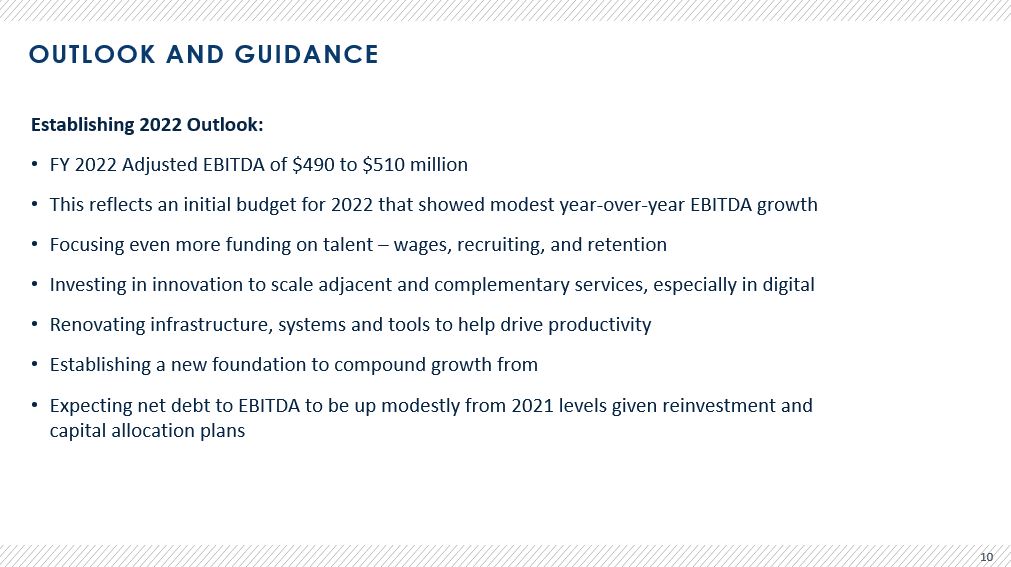
OUTLOOK AND GUIDANCE Establishing 2022 Outlook: • FY 2022 Adjusted EBITDA of $490 to $510 million • This reflects an initial budget for 2022 that showed modest year - over - year EBITDA growth • Focusing even more funding on talent – wages, recruiting, and retention • Investing in innovation to scale adjacent and complementary services, especially in digital • Renovating infrastructure, systems and tools to help drive productivity • Establishing a new foundation to compound growth from • Expecting net debt to EBITDA to be up modestly from 2021 levels given reinvestment and capital allocation plans 10

THANK YOU
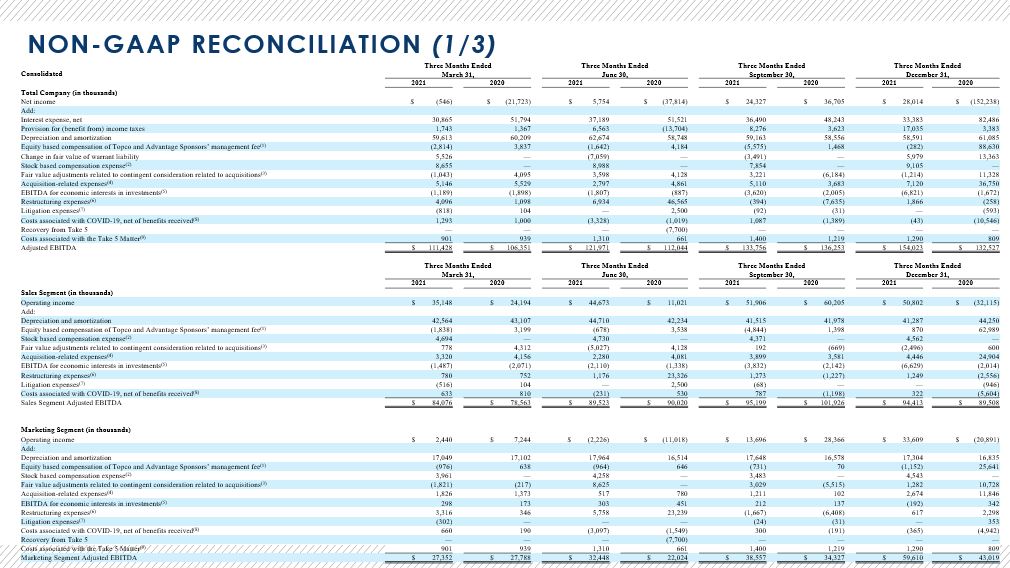
NON - GAAP RECONCILIATION (1/3) 12 Consolidated Three Months Ended March 31, Three Months Ended June 30, Three Months Ended September 30, Three Months Ended December 31, 2021 2020 2021 2020 2021 2020 2021 2020 Total Company (in thousands) Net income $ (546) $ (21,723) $ 5,754 $ (37,814) $ 24,327 $ 36,705 $ 28,014 $ (152,238) Add: Interest expense, net 30,865 51,794 37,189 51,521 36,490 48,243 33,383 82,486 Provision for (benefit from) income taxes 1,743 1,367 6,563 (13,704) 8,276 3,623 17,035 3,383 Depreciation and amortization 59,613 60,209 62,674 58,748 59,163 58,556 58,591 61,085 Equity based compensation of Topco and Advantage Sponsors’ management fee (1) (2,814) 3,837 (1,642) 4,184 (5,575) 1,468 (282) 88,630 Change in fair value of warrant liability 5,526 — (7,059) — (3,491) — 5,979 13,363 Stock based compensation expense (2) 8,655 — 8,988 — 7,854 — 9,105 — Fair value adjustments related to contingent consideration related to acquisitions (3) (1,043) 4,095 3,598 4,128 3,221 (6,184) (1,214) 11,328 Acquisition - related expenses (4) 5,146 5,529 2,797 4,861 5,110 3,683 7,120 36,750 EBITDA for economic interests in investments (5) (1,189) (1,898) (1,807) (887) (3,620) (2,005) (6,821) (1,672) Restructuring expenses (6) 4,096 1,098 6,934 46,565 (394) (7,635) 1,866 (258) Litigation expenses (7) (818) 104 — 2,500 (92) (31) — (593) Costs associated with COVID - 19, net of benefits received (8) 1,293 1,000 (3,328) (1,019) 1,087 (1,389) (43) (10,546) Recovery from Take 5 — — — (7,700) — — — — Costs associated with the Take 5 Matter (9) 901 939 1,310 661 1,400 1,219 1,290 809 Adjusted EBITDA $ 111,428 $ 106,351 $ 121,971 $ 112,044 $ 133,756 $ 136,253 $ 154,023 $ 132,527 Three Months Ended March 31, Three Months Ended June 30, Three Months Ended September 30, Three Months Ended December 31, 2021 2020 2021 2020 2021 2020 2021 2020 Sales Segment (in thousands) Operating income $ 35,148 $ 24,194 $ 44,673 $ 11,021 $ 51,906 $ 60,205 $ 50,802 $ (32,115) Add: Depreciation and amortization 42,564 43,107 44,710 42,234 41,515 41,978 41,287 44,250 Equity based compensation of Topco and Advantage Sponsors’ management fee (1) (1,838) 3,199 (678) 3,538 (4,844) 1,398 870 62,989 Stock based compensation expense (2) 4,694 — 4,730 — 4,371 — 4,562 — Fair value adjustments related to contingent consideration related to acquisitions (3) 778 4,312 (5,027) 4,128 192 (669) (2,496) 600 Acquisition - related expenses (4) 3,320 4,156 2,280 4,081 3,899 3,581 4,446 24,904 EBITDA for economic interests in investments (5) (1,487) (2,071) (2,110) (1,338) (3,832) (2,142) (6,629) (2,014) Restructuring expenses (6) 780 752 1,176 23,326 1,273 (1,227) 1,249 (2,556) Litigation expenses (7) (516) 104 — 2,500 (68) — — (946) Costs associated with COVID - 19, net of benefits received (8) 633 810 (231) 530 787 (1,198) 322 (5,604) Sales Segment Adjusted EBITDA $ 84,076 $ 78,563 $ 89,523 $ 90,020 $ 95,199 $ 101,926 $ 94,413 $ 89,508 Marketing Segment (in thousands) Operating income $ 2,440 $ 7,244 $ (2,226) $ (11,018) $ 13,696 $ 28,366 $ 33,609 $ (20,891) Add: Depreciation and amortization 17,049 17,102 17,964 16,514 17,648 16,578 17,304 16,835 Equity based compensation of Topco and Advantage Sponsors’ management fee (1) (976) 638 (964) 646 (731) 70 (1,152) 25,641 Stock based compensation expense (2) 3,961 — 4,258 — 3,483 — 4,543 — Fair value adjustments related to contingent consideration related to acquisitions (3) (1,821) (217) 8,625 — 3,029 (5,515) 1,282 10,728 Acquisition - related expenses (4) 1,826 1,373 517 780 1,211 102 2,674 11,846 EBITDA for economic interests in investments (5) 298 173 303 451 212 137 (192) 342 Restructuring expenses (6) 3,316 346 5,758 23,239 (1,667) (6,408) 617 2,298 Litigation expenses (7) (302) — — — (24) (31) — 353 Costs associated with COVID - 19, net of benefits received (8) 660 190 (3,097) (1,549) 300 (191) (365) (4,942) Recovery from Take 5 — — — (7,700) — — — — Costs associated with the Take 5 Matter (9) 901 939 1,310 661 1,400 1,219 1,290 809 Marketing Segment Adjusted EBITDA $ 27,352 $ 27,788 $ 32,448 $ 22,024 $ 38,557 $ 34,327 $ 59,610 $ 43,019
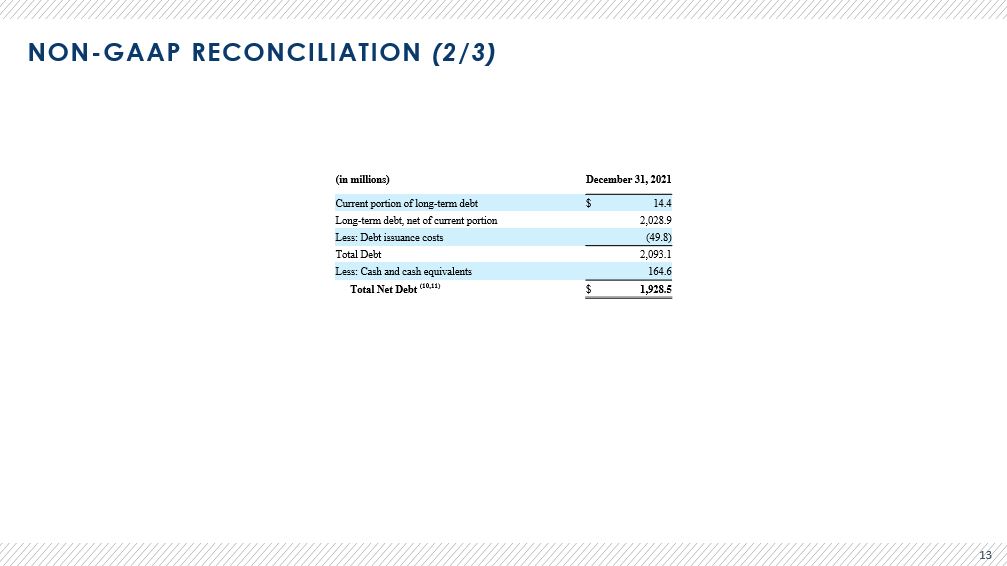
NON - GAAP RECONCILIATION (2/3) 13 (in millions) December 31, 2021 Current portion of long - term debt $ 14.4 Long - term debt, net of current portion 2,028.9 Less: Debt issuance costs (49.8) Total Debt 2,093.1 Less: Cash and cash equivalents 164.6 Total Net Debt (10,11) $ 1,928.5

NON - GAAP RECONCILIATION (3/3) Note: Dollars in millions. Numerical figures included in this slide have been subject to rounding adjustments (1) Equity based compensation of Karman Topco L.P. and Advantage’s private equity sponsors’ management fee. (2) Represents non - cash compensation expense related to issuance of performance restricted stock units, restricted stock units, and stock options with respect to our Class A common stock under the Advantage Solutions Inc. 2020 Incentive Award Plan and the Advanta ge Solutions 2020 Employee Stock Purchase Plan. (3) Represents adjustments to the estimated fair value of our contingent consideration liabilities related to our acquisitions, e xcl uding the present value accretion recorded in interest expense, net, for the applicable periods. (4) Represents fees and costs associated with activities related to our acquisitions and restructuring activities related to our equ ity ownership, including professional fees, due diligence, and integration activities. (5) Represents additions to reflect our proportional share of Adjusted EBITDA related to our equity method investments and reduct ion s to remove the Adjusted EBITDA related to the minority ownership percentage of the entities that we fully consolidate in our fina nci al statements. (6) One - time restructuring activities costs associated with non - recurring reorganization projects. (7) Represents legal settlements that are unusual or infrequent costs associated with our operating activities. (8) Represents (a) costs related to implementation of strategies for workplace safety in response to COVID - 19, including employee - re lief fund, additional sick pay for front - line associates, medical benefit payments for furloughed associates, and personal protective equip ment and (b) benefits received from government grants for COVID - 19 relief. (9) Represents costs associated with investigation and remediation activities related to the Take 5 Matter, primarily, profession al fees and other related costs. (10) Net Debt represents the sum of current portion of long - term debt and long - term debt, less cash and cash equivalents and debt iss uance costs. With respect to Net Debt, cash and cash equivalents are subtracted from the GAAP measure, total debt, because they cou ld be used to reduce the debt obligations. (11) On October 28, 2021, the Company successfully repriced its $1.3B First Lien Term Loan to L + 4.50% (5.25% at the floor) inter est rate, resulting in annualized projected interest savings of approximately $10 million, or $7 million after tax. 14