
Advantage Solutions Inc. Q3 Earnings Presentation
Disclaimer Forward-Looking Statements Certain statements in this presentation may be considered forward-looking statements within the meaning of the federal securities laws, including statements regarding the expected future performance of the business of Advantage Solutions. Forward-looking statements generally relate to future events or Advantage’s future financial or operating performance. These forward-looking statements generally are identified by the words “may”, “should”, “could”, “expect”, “intend”, “will”, “would”, “estimate”, “anticipate”, “believe”, “predict”, “confident”, “potential” or “continue”, or the negatives of these terms or variations of them or similar terminology. Such forward-looking statements are predictions, projections and other statements about future events that are based on current expectations and assumptions and, as a result, are subject to risks, uncertainties, and other factors which could cause actual results to differ materially from those expressed or implied by such forward looking statements. These forward-looking statements are based upon estimates and assumptions that, while considered reasonable by Advantage and its management at the time of such statements, are inherently uncertain. Factors that may cause actual results to differ materially from current expectations include, but are not limited to, market-driven wage changes or changes to labor laws or wage or job classification regulations, including minimum wage; the COVID-19 pandemic and the measures taken in response thereto; the availability, acceptance, administration and effectiveness of any COVID-19 vaccine; Advantage’s ability to continue to generate significant operating cash flow; client procurement strategies and consolidation of Advantage’s clients’ industries creating pressure on the nature and pricing of its services; consumer goods manufacturers and retailers reviewing and changing their sales, retail, marketing, and technology programs and relationships; Advantage’s ability to successfully develop and maintain relevant omni-channel services for our clients in an evolving industry and to otherwise adapt to significant technological change; Advantage’s ability to maintain proper and effective internal control over financial reporting in the future; potential and actual harms to Advantage’s business arising from the Take 5 Matter; Advantage’s substantial indebtedness and our ability to refinance at favorable rates; and other risks and uncertainties set forth in the section titled “Risk Factors” in the Annual Report on Form 10-K filed by the Company with the Securities and Exchange Commission (the “SEC”) on March 1, 2023, and in its other filings made from time to time with the SEC. These filings identify and address other important risks and uncertainties that could cause actual events and results to differ materially from those contained in the forward-looking statements. Forward-looking statements speak only as of the date they are made. Readers are cautioned not to put undue reliance on forward-looking statements, and Advantage assumes no obligation and does not intend to update or revise these forward-looking statements, whether as a result of new information, future events, or otherwise, except as required by law. Non-GAAP Financial Measures and Related Information This presentation includes certain financial measures not presented in accordance with generally accepted accounting principles (“GAAP”), Adjusted EBITDA, Adjusted EBITDA by Segment, Adjusted EBITDA margin, Net Debt, Adjusted Unlevered Free Cash Flow and Adjusted Unlevered Free Cash Flow as a percentage of Adjusted EBITDA. These are not measures of financial performance calculated in accordance with GAAP and may exclude items that are significant in understanding and assessing Advantage’s financial results. Therefore, the measures are in addition to, and not a substitute for or superior to, measures of financial performance prepared in accordance with GAAP, and should not be considered in isolation or as an alternative to net income, cash flows from operations or other measures of profitability, liquidity or performance under GAAP. You should be aware that Advantage’s presentation of these measures may not be comparable to similarly-titled measures used by other companies. Reconciliations of historical non-GAAP measures to their most directly comparable GAAP counterparts are included below. Advantage believes these non-GAAP measures provide useful information to management and investors regarding certain financial and business trends relating to Advantage’s financial condition and results of operations. Advantage believes that the use of Adjusted EBITDA, Adjusted EBITDA by Segment, Adjusted EBITDA margin, Net Debt, Adjusted Unlevered Free Cash Flow and Adjusted Unlevered Free Cash Flow as a percentage of Adjusted EBITDA provides an additional tool for investors to use in evaluating ongoing operating results and trends and in comparing Advantage’s financial measures with other similar companies, many of which present similar non-GAAP financial measures to investors. Non-GAAP financial measures are subject to inherent limitations as they reflect the exercise of judgments by management about which expense and income are excluded or included in determining these non-GAAP financial measures. Additionally, other companies may calculate non-GAAP measures differently, or may use other measures to calculate their financial performance, and therefore Advantage’s non-GAAP measures may not be directly comparable to similarly titled measures of other companies. Adjusted EBITDA and Adjusted EBITDA by Segment means net (loss) income before (i) interest expense, net, (ii) provision for (benefit from) income taxes, (iii) depreciation, (iv) impairment of goodwill and indefinite-lived assets, (v) amortization of intangible assets, (vi) equity-based compensation of Karman Topco L.P., (vii) changes in fair value of warrant liability, (viii) stock based compensation expense, (ix) fair value adjustments of contingent consideration related to acquisitions, (x) acquisition-related expenses, (xi) loss on disposal of assets (xii) costs associated with COVID-19, net of benefits received, (xiii) EBITDA for economic interests in investments, (xiv) reorganization and restructuring expenses, (xv) litigation expenses (recovery), (xvi) recovery from Take 5, (xvii) costs associated with the Take 5 Matter and (xviii) other adjustments that management believes are helpful in evaluating our operating performance. Adjusted EBITDA Margin means adjusting net (loss) income to exclude i) interest expense, net, (ii) provision for (benefit from) income taxes, (iii) depreciation, (iv) impairment of goodwill and indefinite-lived assets, (v) amortization of intangible assets, (vi) equity-based compensation of Karman Topco L.P., (vii) changes in fair value of warrant liability, (viii) stock based compensation expense, (ix) fair value adjustments of contingent consideration related to acquisitions, (x) acquisition-related expenses, (xi) loss on disposal of assets (xii) costs associated with COVID-19, net of benefits received, (xiii) EBITDA for economic interests in investments, (xiv) reorganization and restructuring expenses, (xv) litigation expenses (recovery), (xvi) recovery from Take 5, (xvii) costs associated with the Take 5 Matter and (xviii) other adjustments that management believes are helpful in evaluating our operating performance, and then dividing this adjusted earnings figure by total revenue. Net Debt represents the sum of current portion of long-term debt and long-term debt, less cash and cash equivalents and debt issuance costs. With respect to Net Debt, cash and cash equivalents are subtracted from the GAAP measure, total debt, because they could be used to reduce the debt obligations. We present Net Debt because we believe this non-GAAP measure provides useful information to management and investors regarding certain financial and business trends relating to the Company’s financial condition and to evaluate changes to the Company's capital structure and credit quality assessment. Adjusted Unlevered Free Cash Flow represents net cash provided by (used in) operating activities less purchase of property and equipment as disclosed in the Statements of Cash Flows further adjusted by (i) cash paid for income taxes; (ii) cash paid for acquisition-related expenses; (iii) cash paid for reorganization and restructuring expenses; (iv) cash paid for costs associated with COVID-19, net of benefits received; (v) net effect of foreign currency fluctuations on cash; (vi) cash paid for costs associated with the Take 5 Matter; and (vii) other adjustments that management believes are helpful in evaluating our operating performance. Adjusted Unlevered Free Cash Flow as a percentage of Adjusted EBITDA means Adjusted Unlevered Free Cash Flow divided by Adjusted EBITDA. The Company has presented the financial data for the last twelve-month (“LTM”) period ended September 30, 2023 by adding the unaudited results of operations for the nine-month period ended September 30, 2023 to its audited results of operations for the year ended December 31, 2022 and then subtracting the unaudited results of operations for the nine-month period ended September 30, 2022. The financial data for the LTM period ended September 30, 2023 does not comply with GAAP. Due to rounding, numbers presented throughout this document may not add up precisely to the totals provided and percentages may not precisely reflect the absolute figures.
Q3 Key Messages Continued trend of healthy financial performance Robust quarterly revenues of $1.1 billion, an increase of 4.3% year-over-year or 5.8% excluding unfavorable foreign exchange rates and acquisition and divestitures Adj. EBITDA of $113 million (10.3% margin), well ahead of consensus estimates Generated $107 million of adjusted unlevered free cash flow in Q3, representing approximately 94% of Adj. EBITDA Macroeconomic environment remains mixed Inflation and labor tightness moderating slowly Pricing realization represented ~1/3rd of YTD Q3 organic growth Made more than 1,200 net new hires in the quarter Disciplined and opportunistic capital allocation strategy to maximize returns for our equity holders Made $57 million voluntary repurchase of term loan during Q3 (~88% of debt is hedged / fixed interest rate; net leverage of 4.2x as of 9/30/2023 vs. 4.5x as of 12/31/2022) Increasing confidence in FY23 Adjusted EBITDA outlook See greater likelihood of performance around the upper end of the guidance range of $400 million to $420 million (including completed divestitures) Continuing to capture value for services and rebuild in-store sampling and demonstration program Additional investment behind technology and best-in-class talent management initiatives in Q4 and beyond Reorganizing our portfolio of businesses in 2024 New, simplified structure more closely aligns our business capabilities with economic buyers. Structural changes to coincide with the introduction of financial and operational KPIs that are aligned with how we measure success internally Executing strategic plan to maximize value creation Initiatives underway to strengthen culture, simplify business, improve financial discipline and enhance processes; significant room for improvement across the organization As we work to simplify our business, we divested of Atlas Technology Group, a niche analytics provider, to Crisp, a leading open-data retail platform, in Q4; continuing to assess portfolio of assets for strategic fit with more updates to come
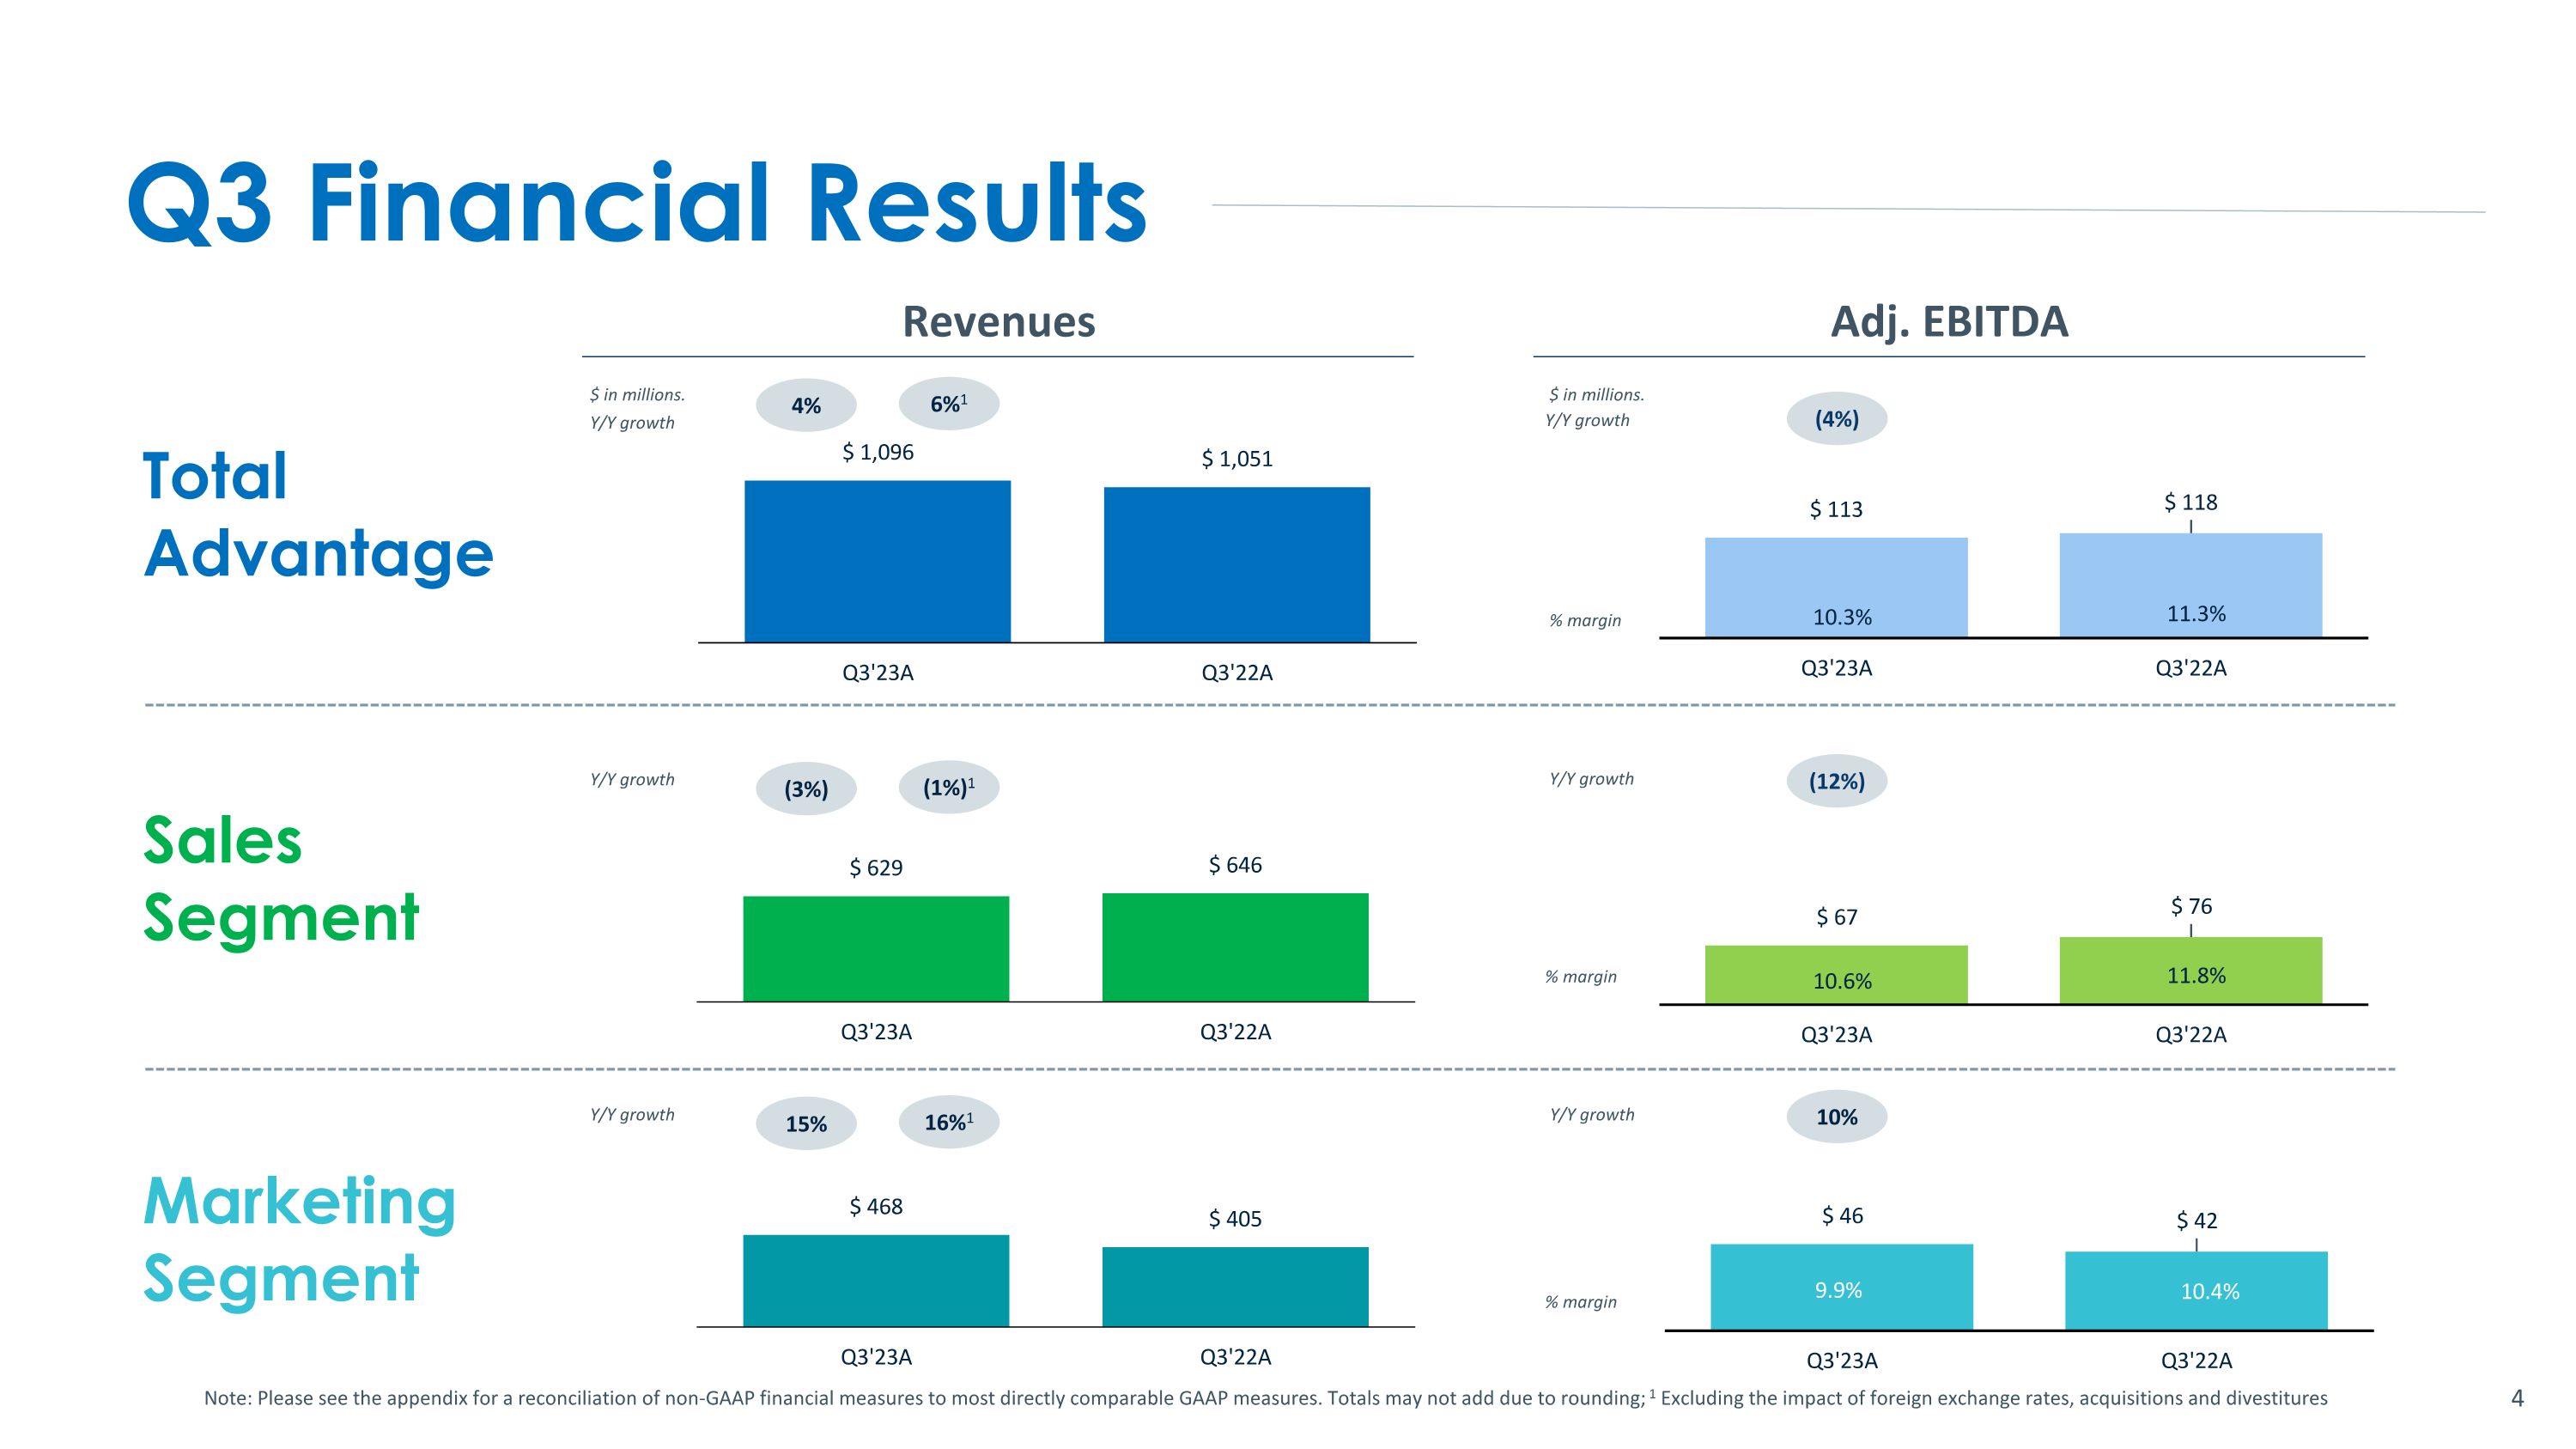
Q3 Financial Results Note: Please see the appendix for a reconciliation of non-GAAP financial measures to most directly comparable GAAP measures. Totals may not add due to rounding; 1 Excluding the impact of foreign exchange rates, acquisitions and divestitures Total Advantage Sales Segment $ in millions. $ in millions. % margin % margin (4%) (12%) 4% (3%) Y/Y growth Y/Y growth Y/Y growth Y/Y growth Revenues Adj. EBITDA 6%1 (1%)1 Marketing Segment % margin 10% 15% Y/Y growth Y/Y growth 16%1
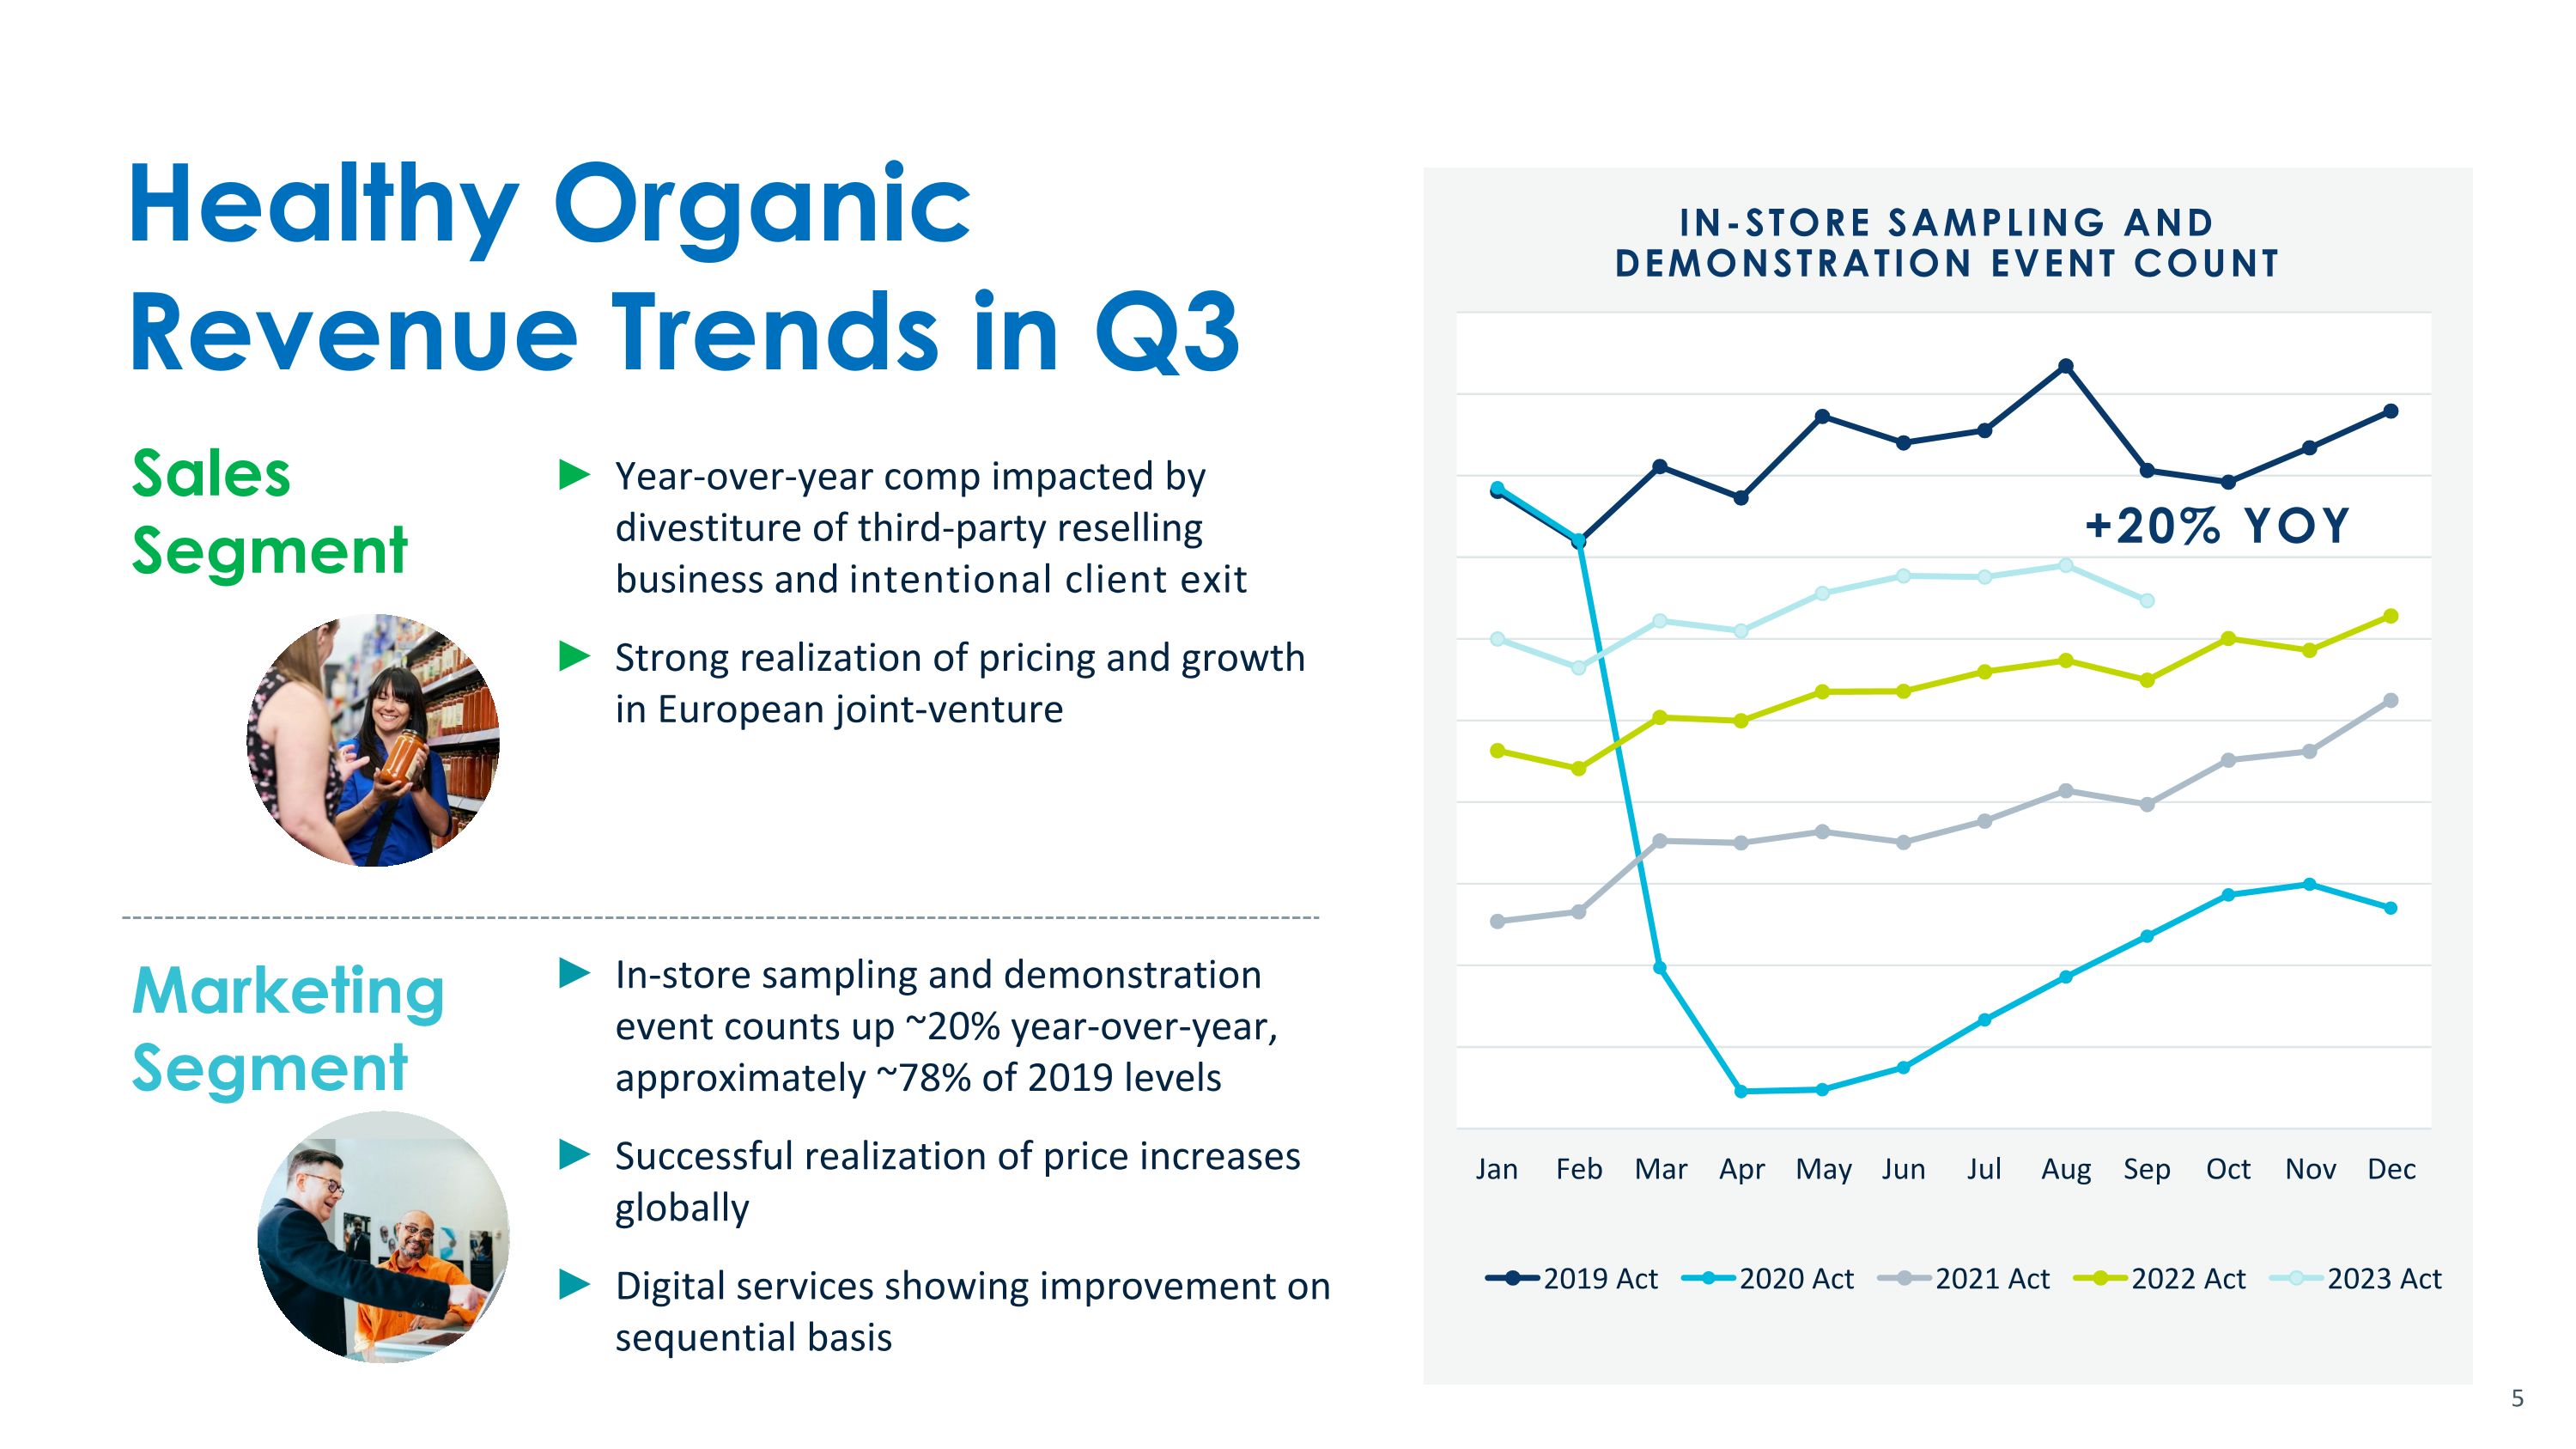
Sales Segment Healthy Organic Revenue Trends in Q3 In-Store sampling and Demonstration Event Count Year-over-year comp impacted by divestiture of third-party reselling business and intentional client exit Strong realization of pricing and growth in European joint-venture +20% YoY Marketing Segment In-store sampling and demonstration event counts up ~20% year-over-year, approximately ~78% of 2019 levels Successful realization of price increases globally Digital services showing improvement on sequential basis
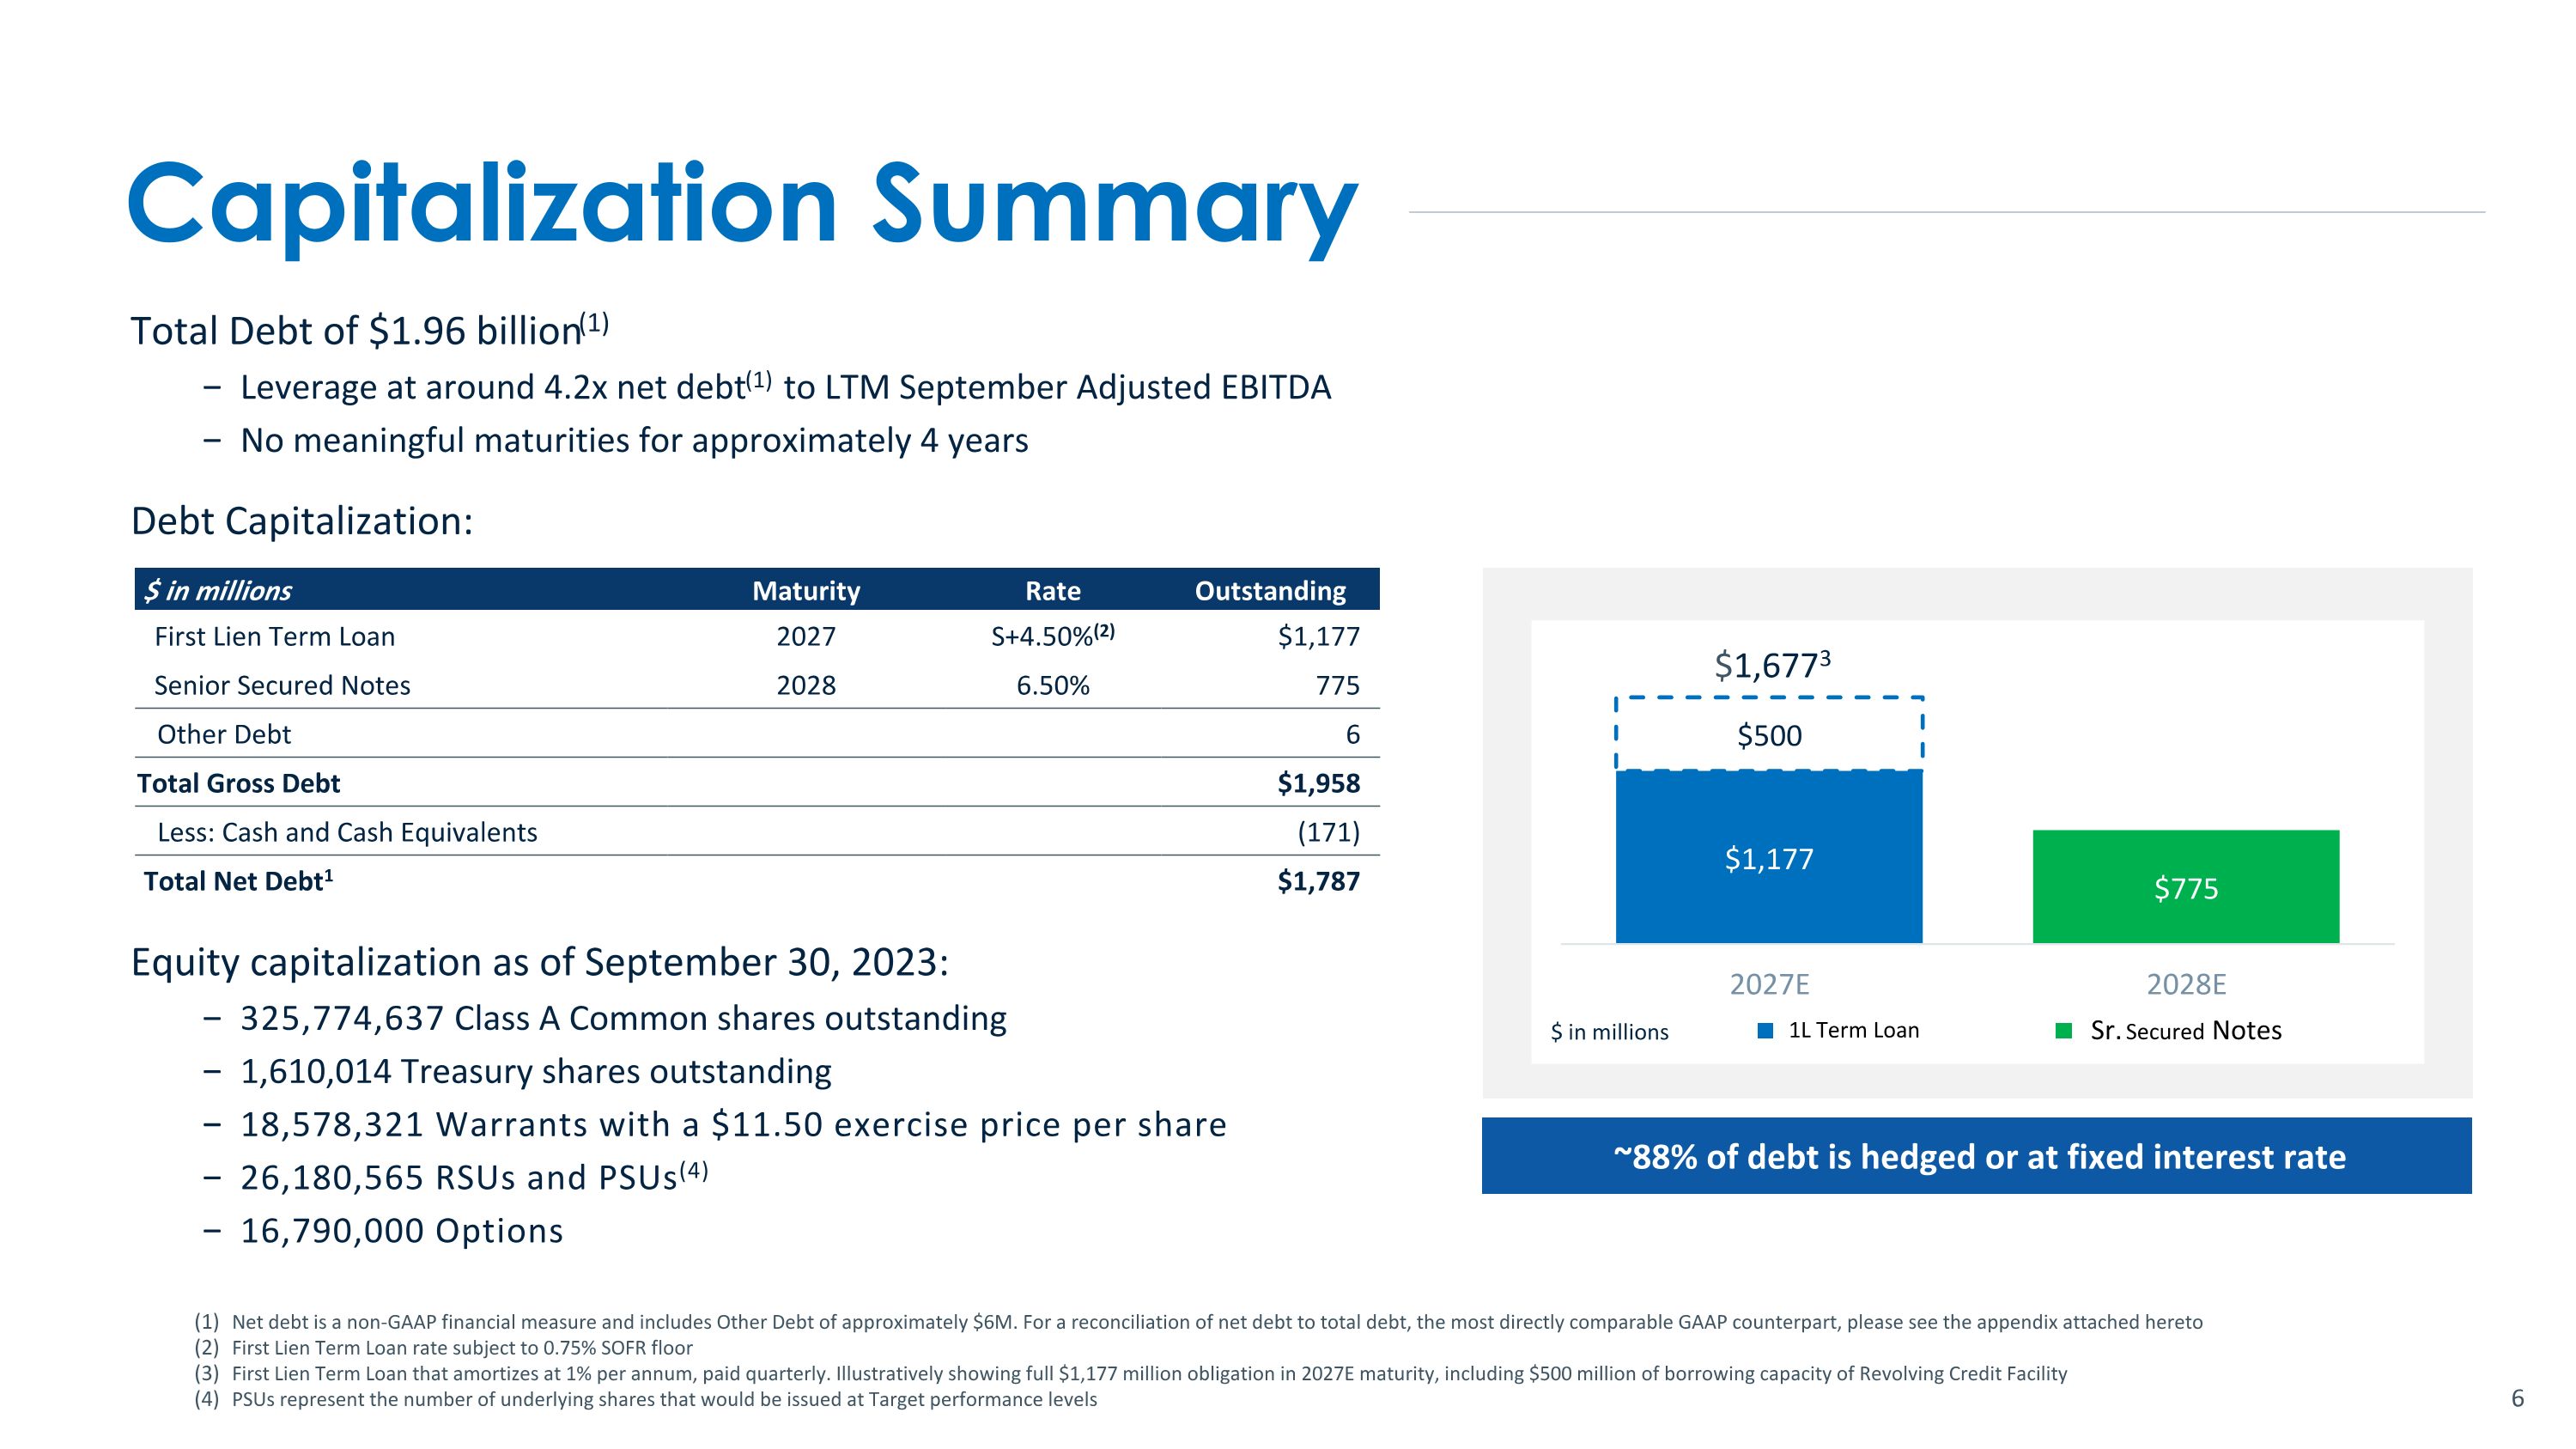
Capitalization Summary Total Debt of $1.96 billion(1) Leverage at around 4.2x net debt(1) to LTM September Adjusted EBITDA No meaningful maturities for approximately 4 years Debt Capitalization: Equity capitalization as of September 30, 2023: 325,774,637 Class A Common shares outstanding 1,610,014 Treasury shares outstanding 18,578,321 Warrants with a $11.50 exercise price per share 26,180,565 RSUs and PSUs(4) 16,790,000 Options Net debt is a non-GAAP financial measure and includes Other Debt of approximately $6M. For a reconciliation of net debt to total debt, the most directly comparable GAAP counterpart, please see the appendix attached hereto First Lien Term Loan rate subject to 0.75% SOFR floor First Lien Term Loan that amortizes at 1% per annum, paid quarterly. Illustratively showing full $1,177 million obligation in 2027E maturity, including $500 million of borrowing capacity of Revolving Credit Facility PSUs represent the number of underlying shares that would be issued at Target performance levels $ in millions Maturity Rate Outstanding First Lien Term Loan 2027 S+4.50%(2) $1,177 Senior Secured Notes 2028 6.50% 775 Other Debt 6 Total Gross Debt $1,958 Less: Cash and Cash Equivalents (171) Total Net Debt1 $1,787 ~88% of debt is hedged or at fixed interest rate 1L Term Loan Sr. Secured Notes $ in millions $1,6773
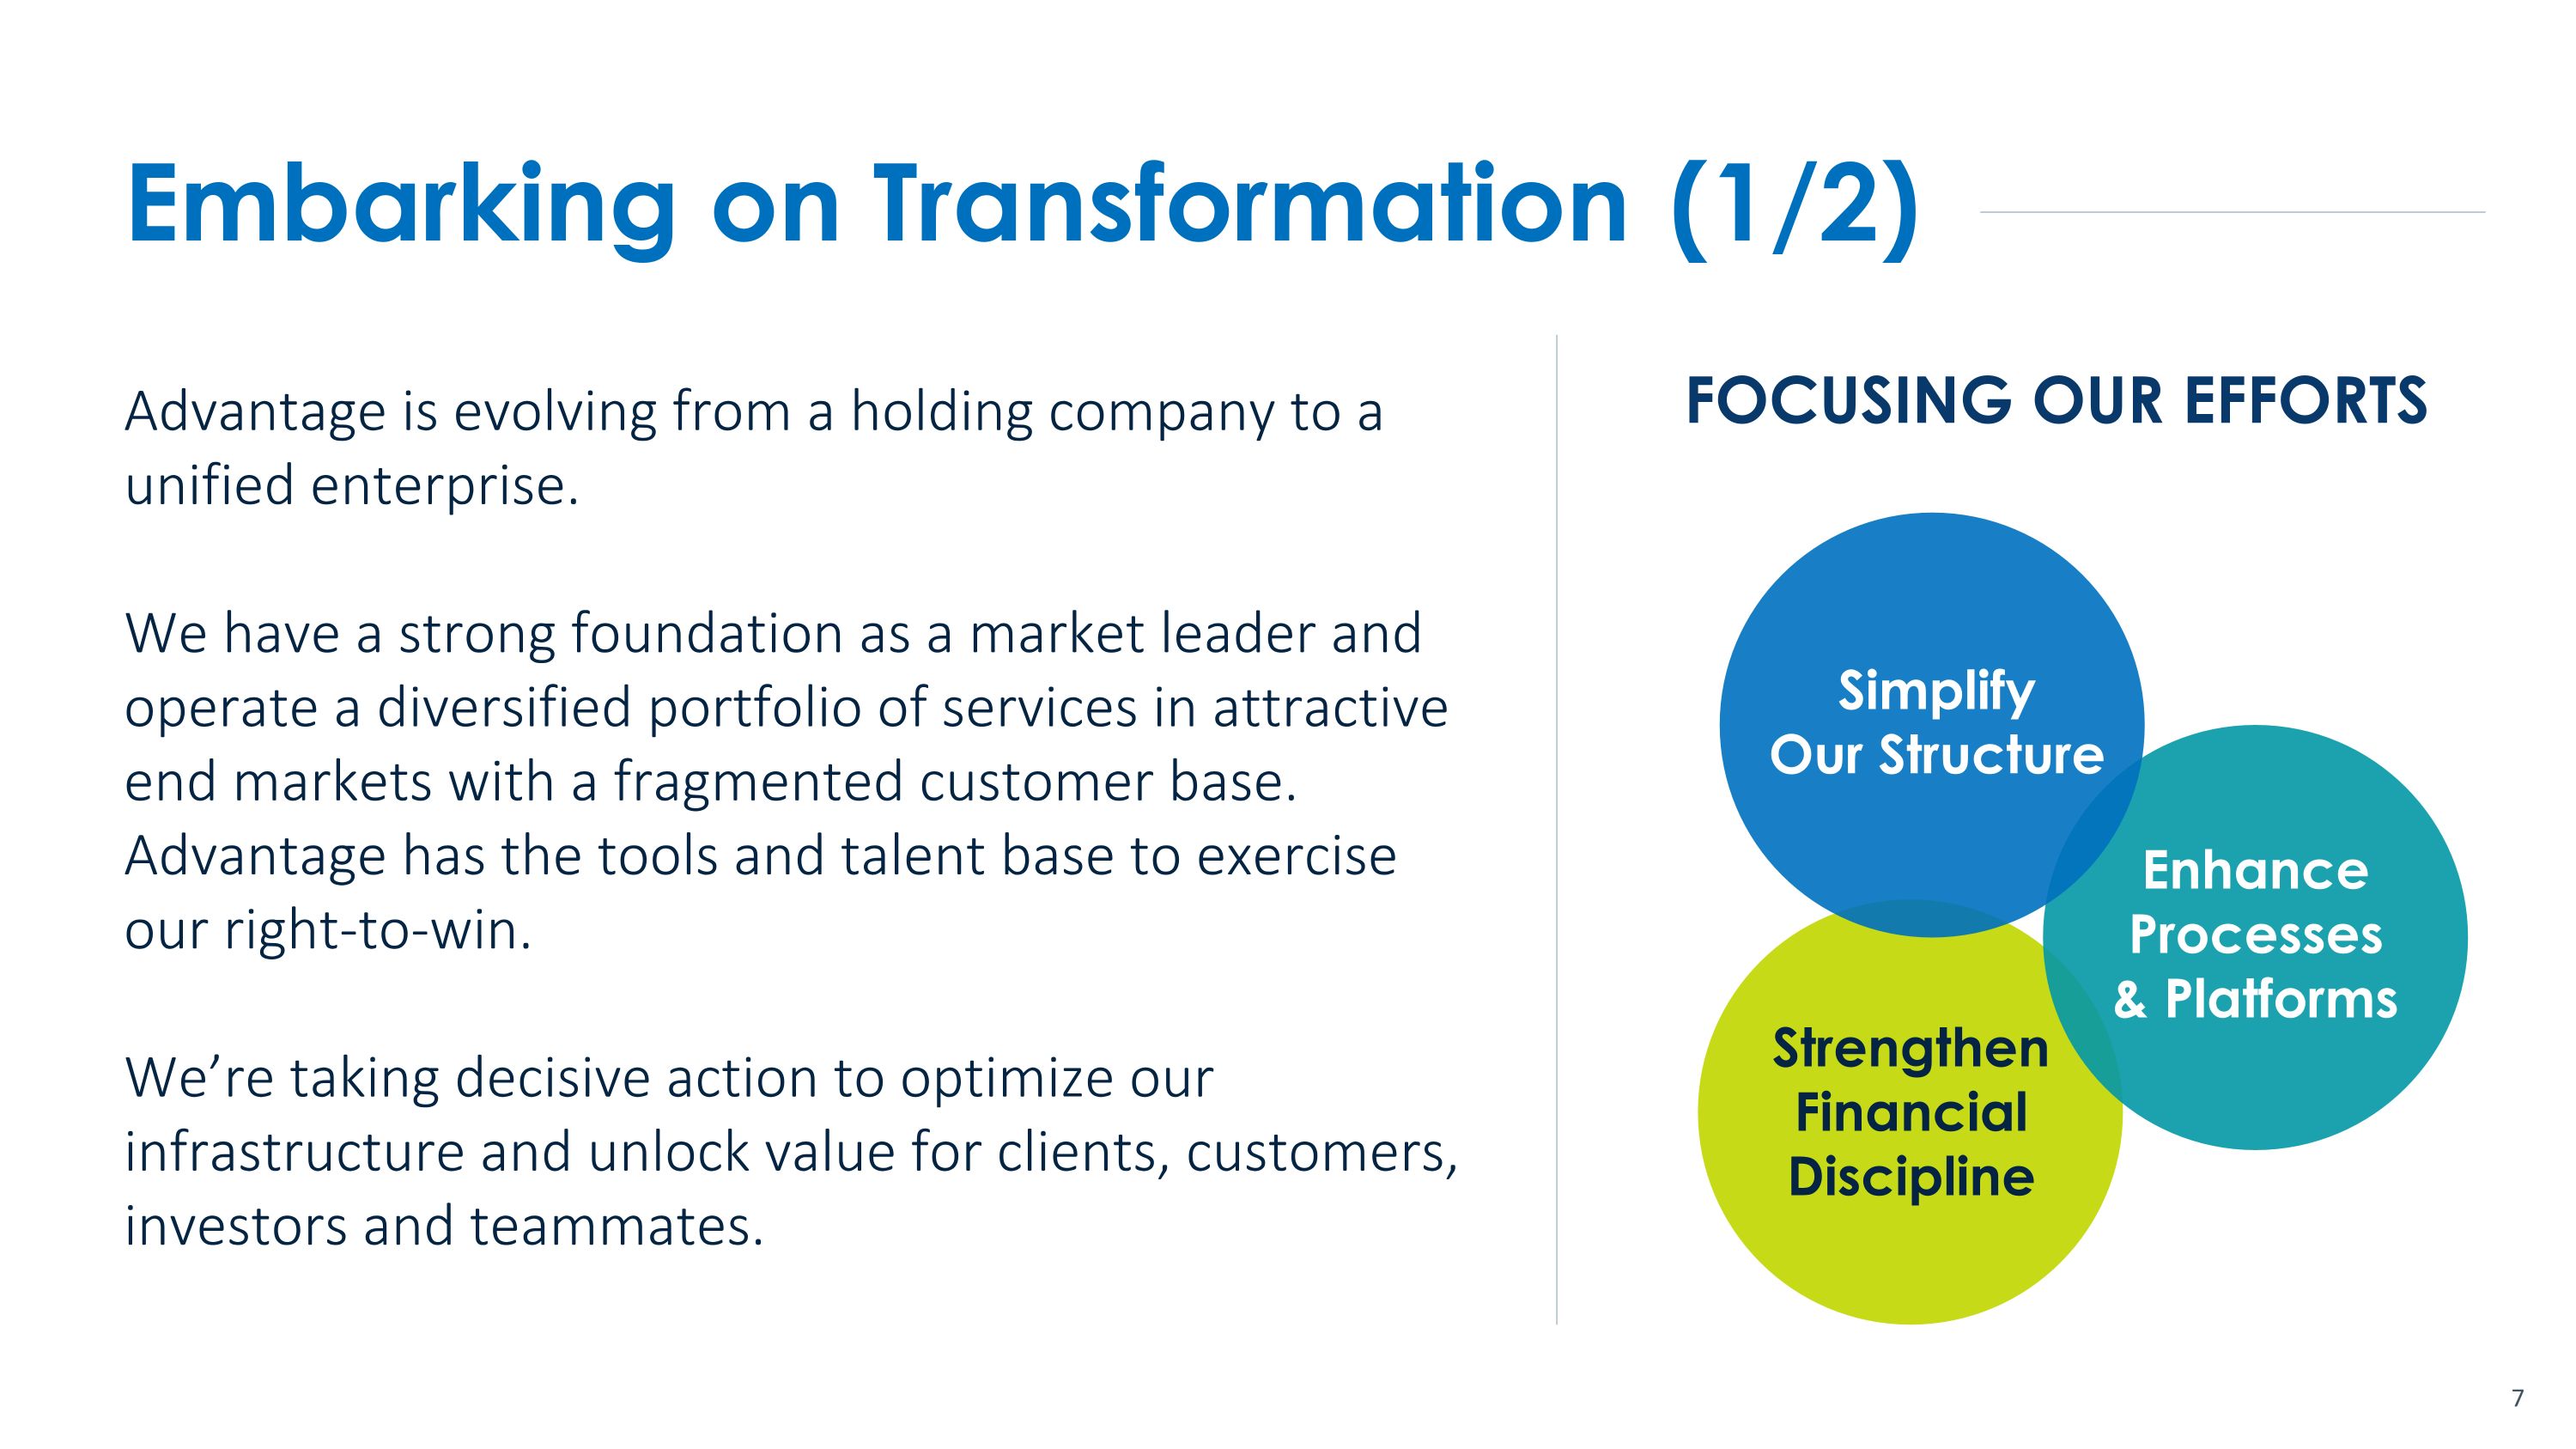
Embarking on Transformation (1/2) FOCUSING OUR EFFORTS Advantage is evolving from a holding company to a unified enterprise. We have a strong foundation as a market leader and operate a diversified portfolio of services in attractive end markets with a fragmented customer base. Advantage has the tools and talent base to exercise our right-to-win. We’re taking decisive action to optimize our infrastructure and unlock value for clients, customers, investors and teammates. Enhance Processes & Platforms Strengthen Financial Discipline Simplify Our Structure
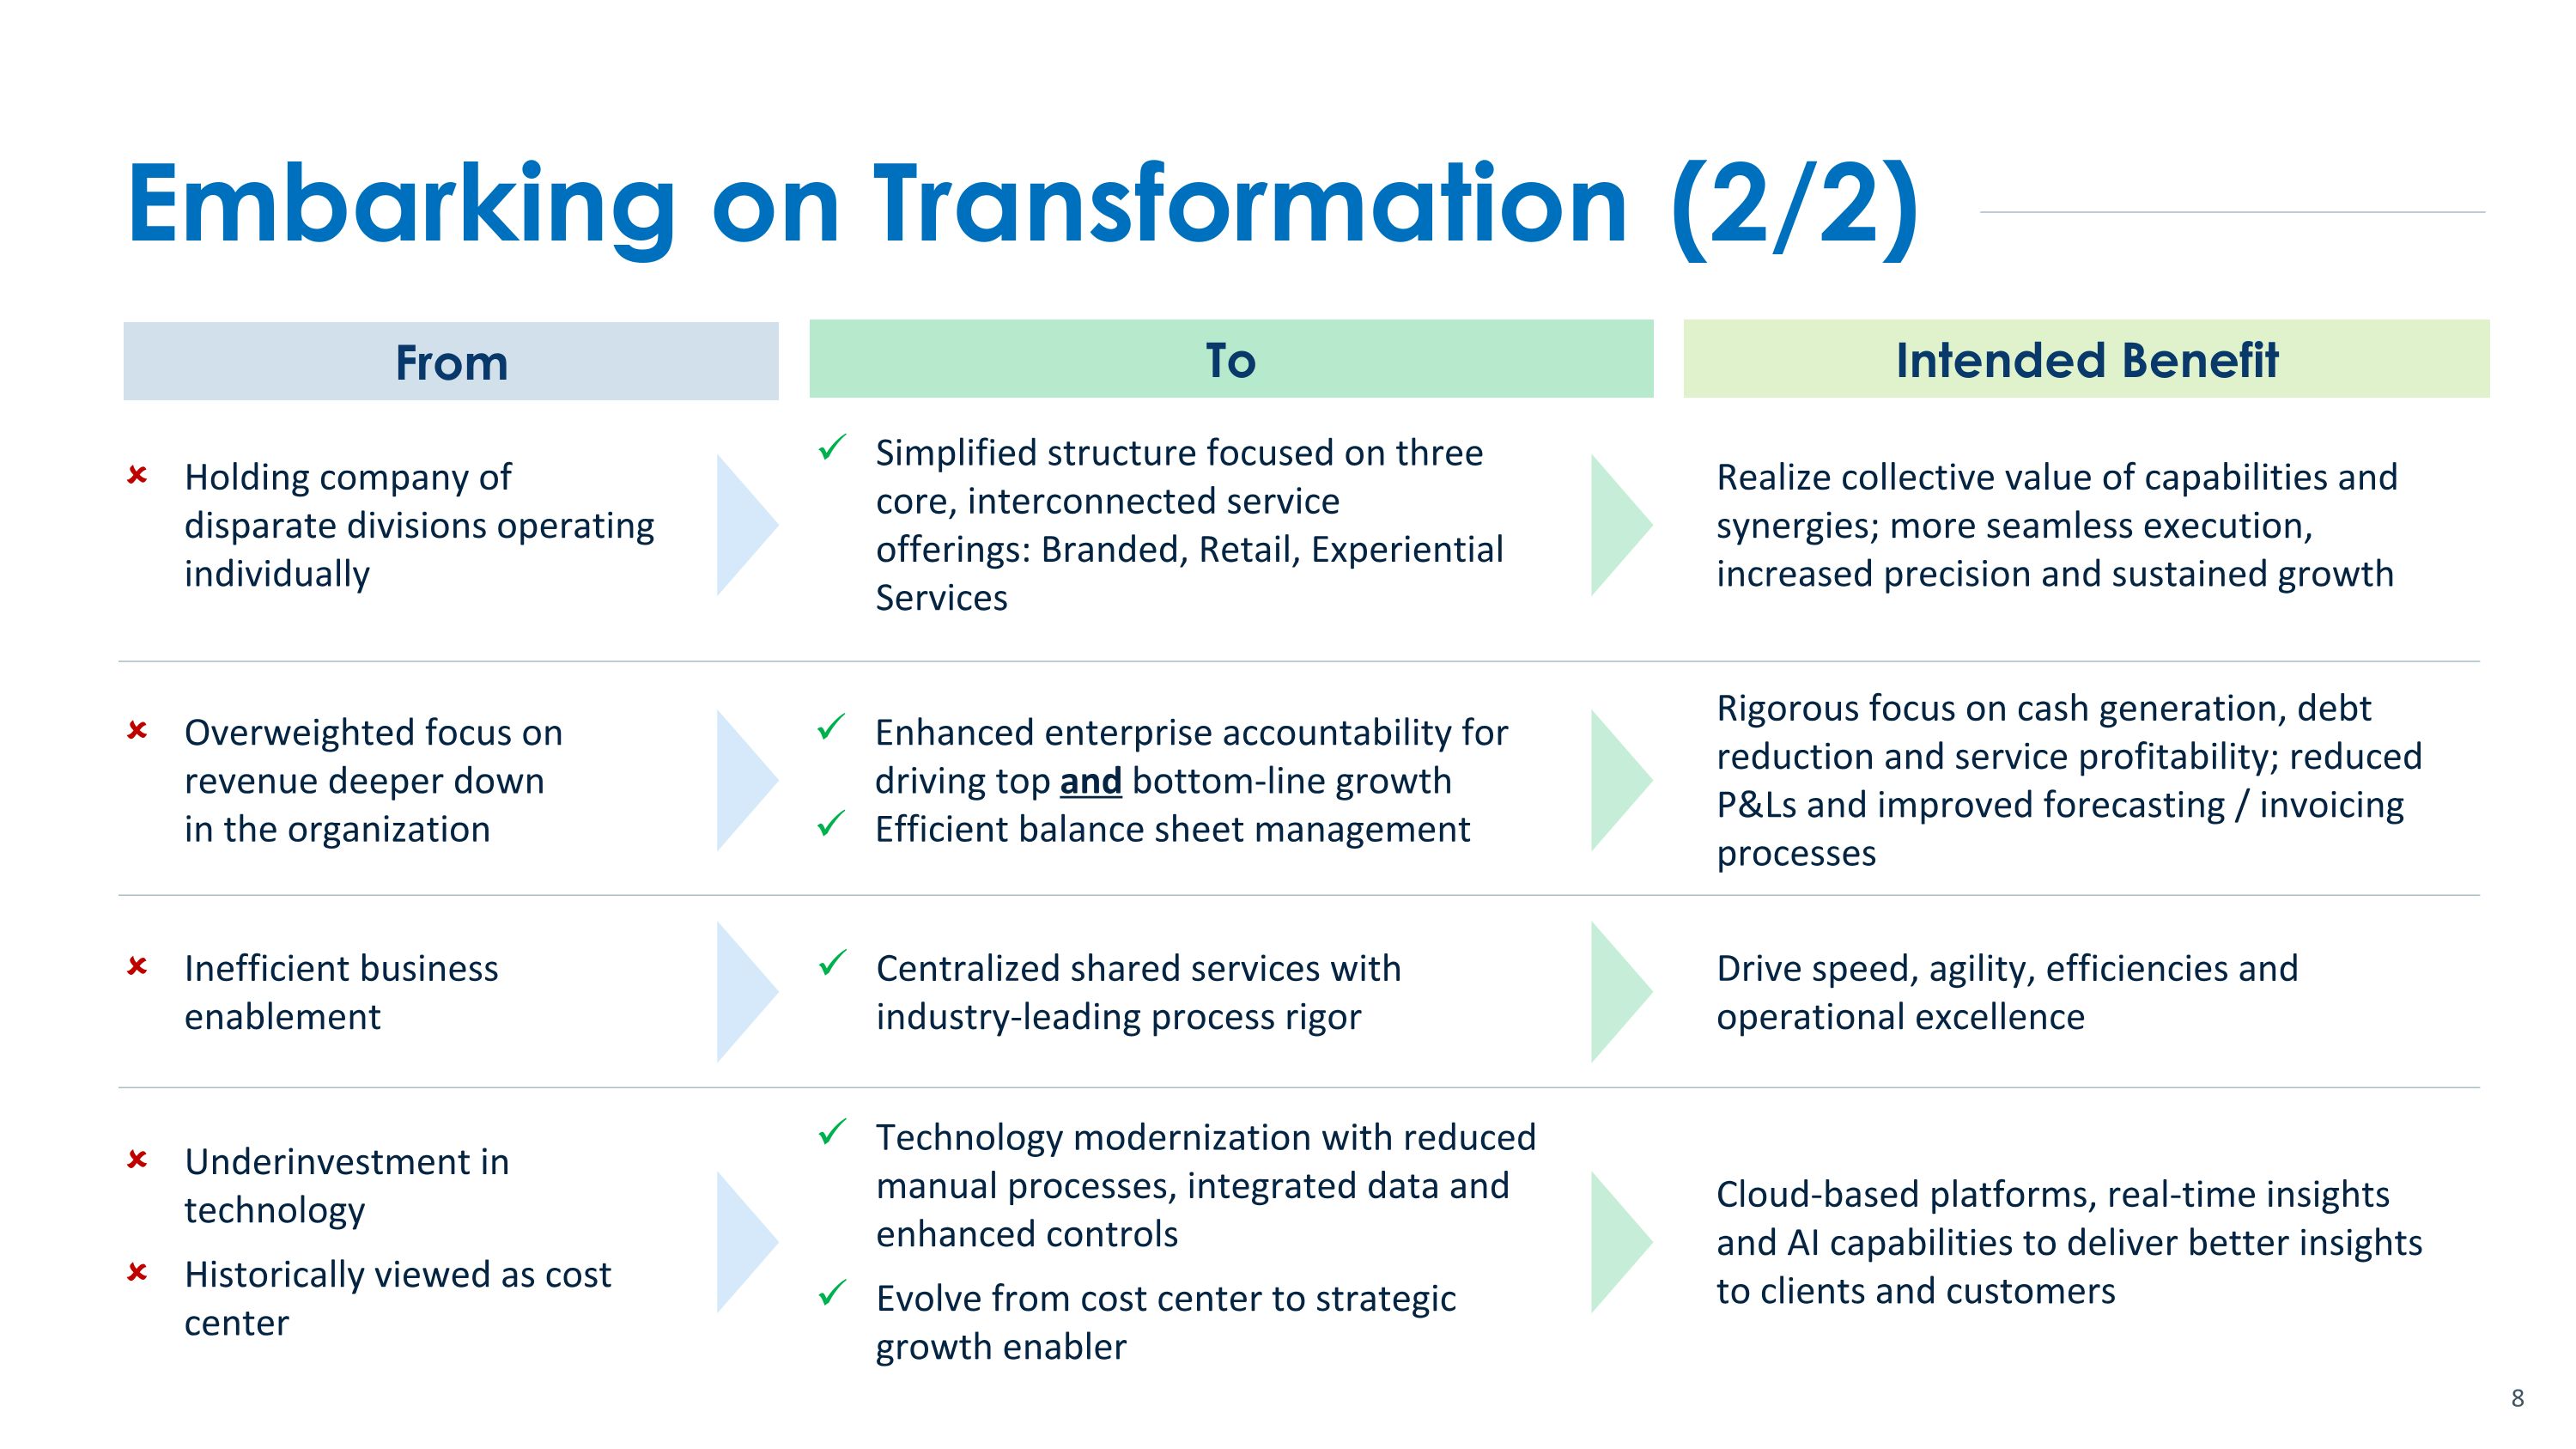
Embarking on Transformation (2/2) From To Intended Benefit Holding company of disparate divisions operating individually Inefficient business enablement Underinvestment in technology Historically viewed as cost center Simplified structure focused on three core, interconnected service offerings: Branded, Retail, Experiential Services Realize collective value of capabilities and synergies; more seamless execution, increased precision and sustained growth Centralized shared services with industry-leading process rigor Technology modernization with reduced manual processes, integrated data and enhanced controls Evolve from cost center to strategic growth enabler Drive speed, agility, efficiencies and operational excellence Cloud-based platforms, real-time insights and AI capabilities to deliver better insights to clients and customers Overweighted focus on revenue deeper down in the organization Enhanced enterprise accountability for driving top and bottom-line growth Efficient balance sheet management Rigorous focus on cash generation, debt reduction and service profitability; reduced P&Ls and improved forecasting / invoicing processes
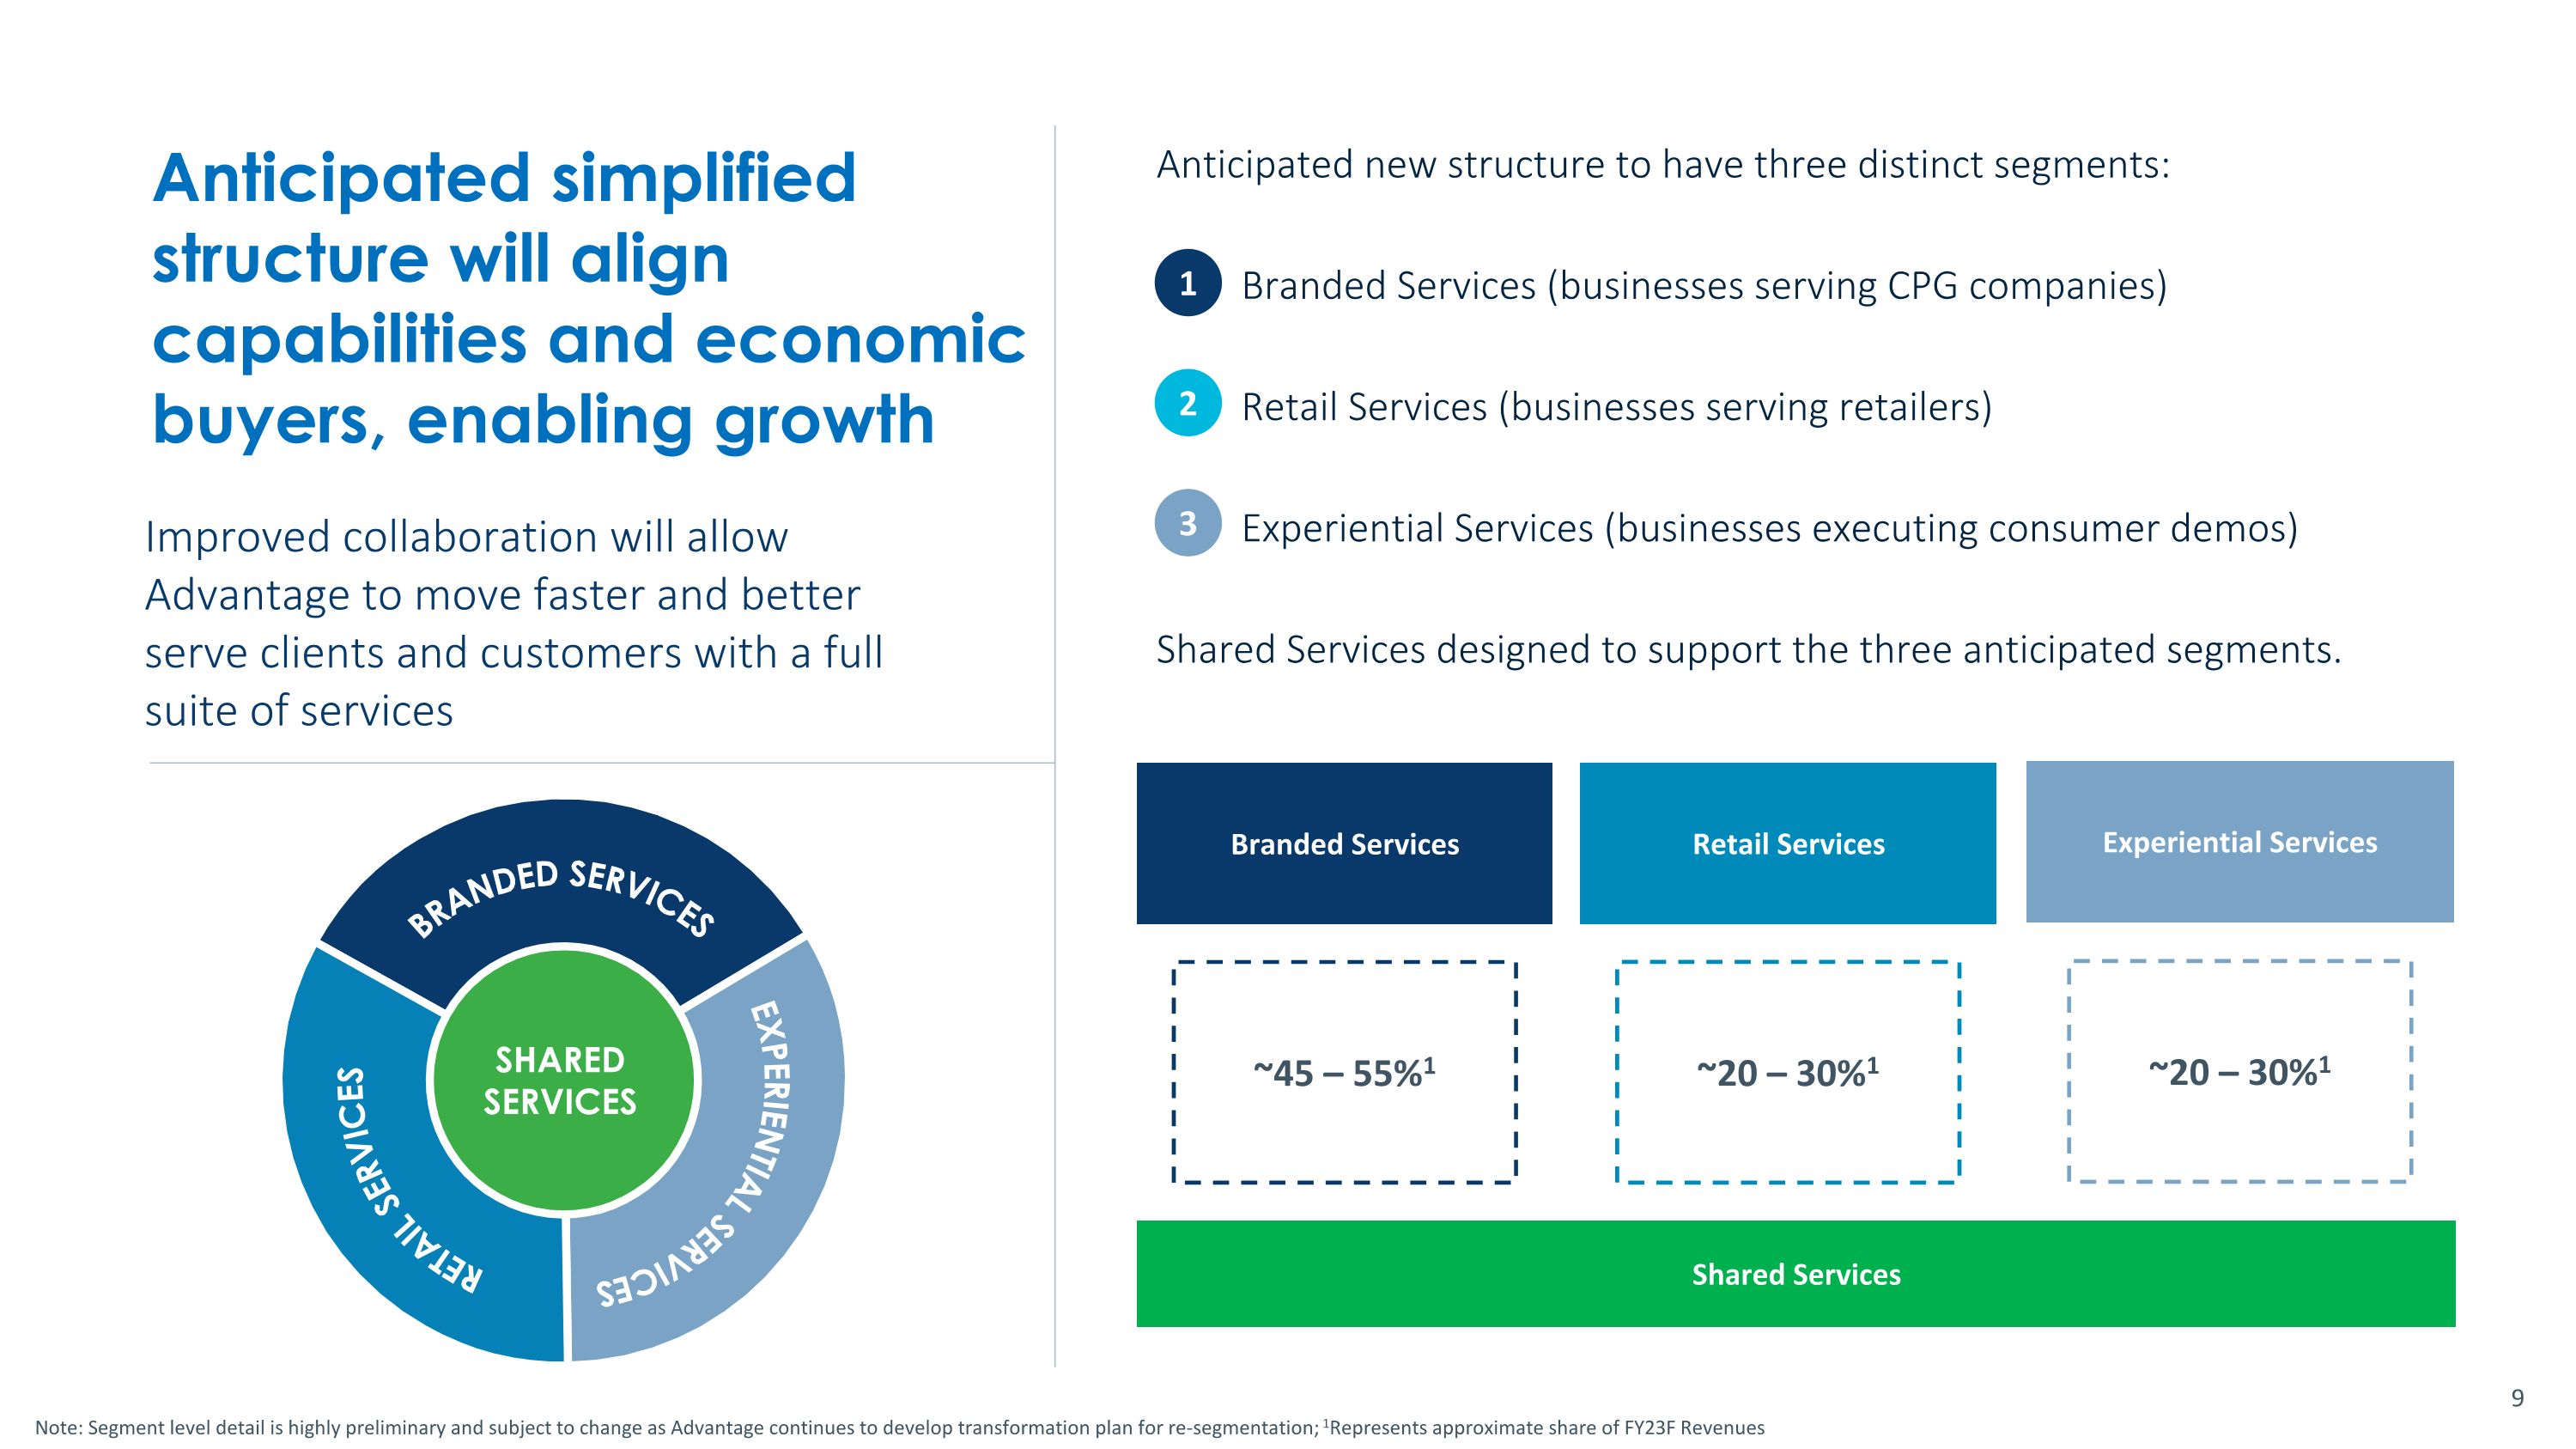
Anticipated simplified structure will align capabilities and economic buyers, enabling growth Anticipated new structure to have three distinct segments: Branded Services (businesses serving CPG companies) Retail Services (businesses serving retailers) Experiential Services (businesses executing consumer demos) Shared Services designed to support the three anticipated segments. Experiential Services Shared Services Retail Services Branded Services BRANDED SERVICES RETAIL SERVICES EXPERIENTIAL SERVICES SHARED SERVICES 1 2 3 Note: Segment level detail is highly preliminary and subject to change as Advantage continues to develop transformation plan for re-segmentation; 1Represents approximate share of FY23F Revenues ~45 – 55%1 ~20 – 30%1 ~20 – 30%1 Improved collaboration will allow Advantage to move faster and better serve clients and customers with a full suite of services
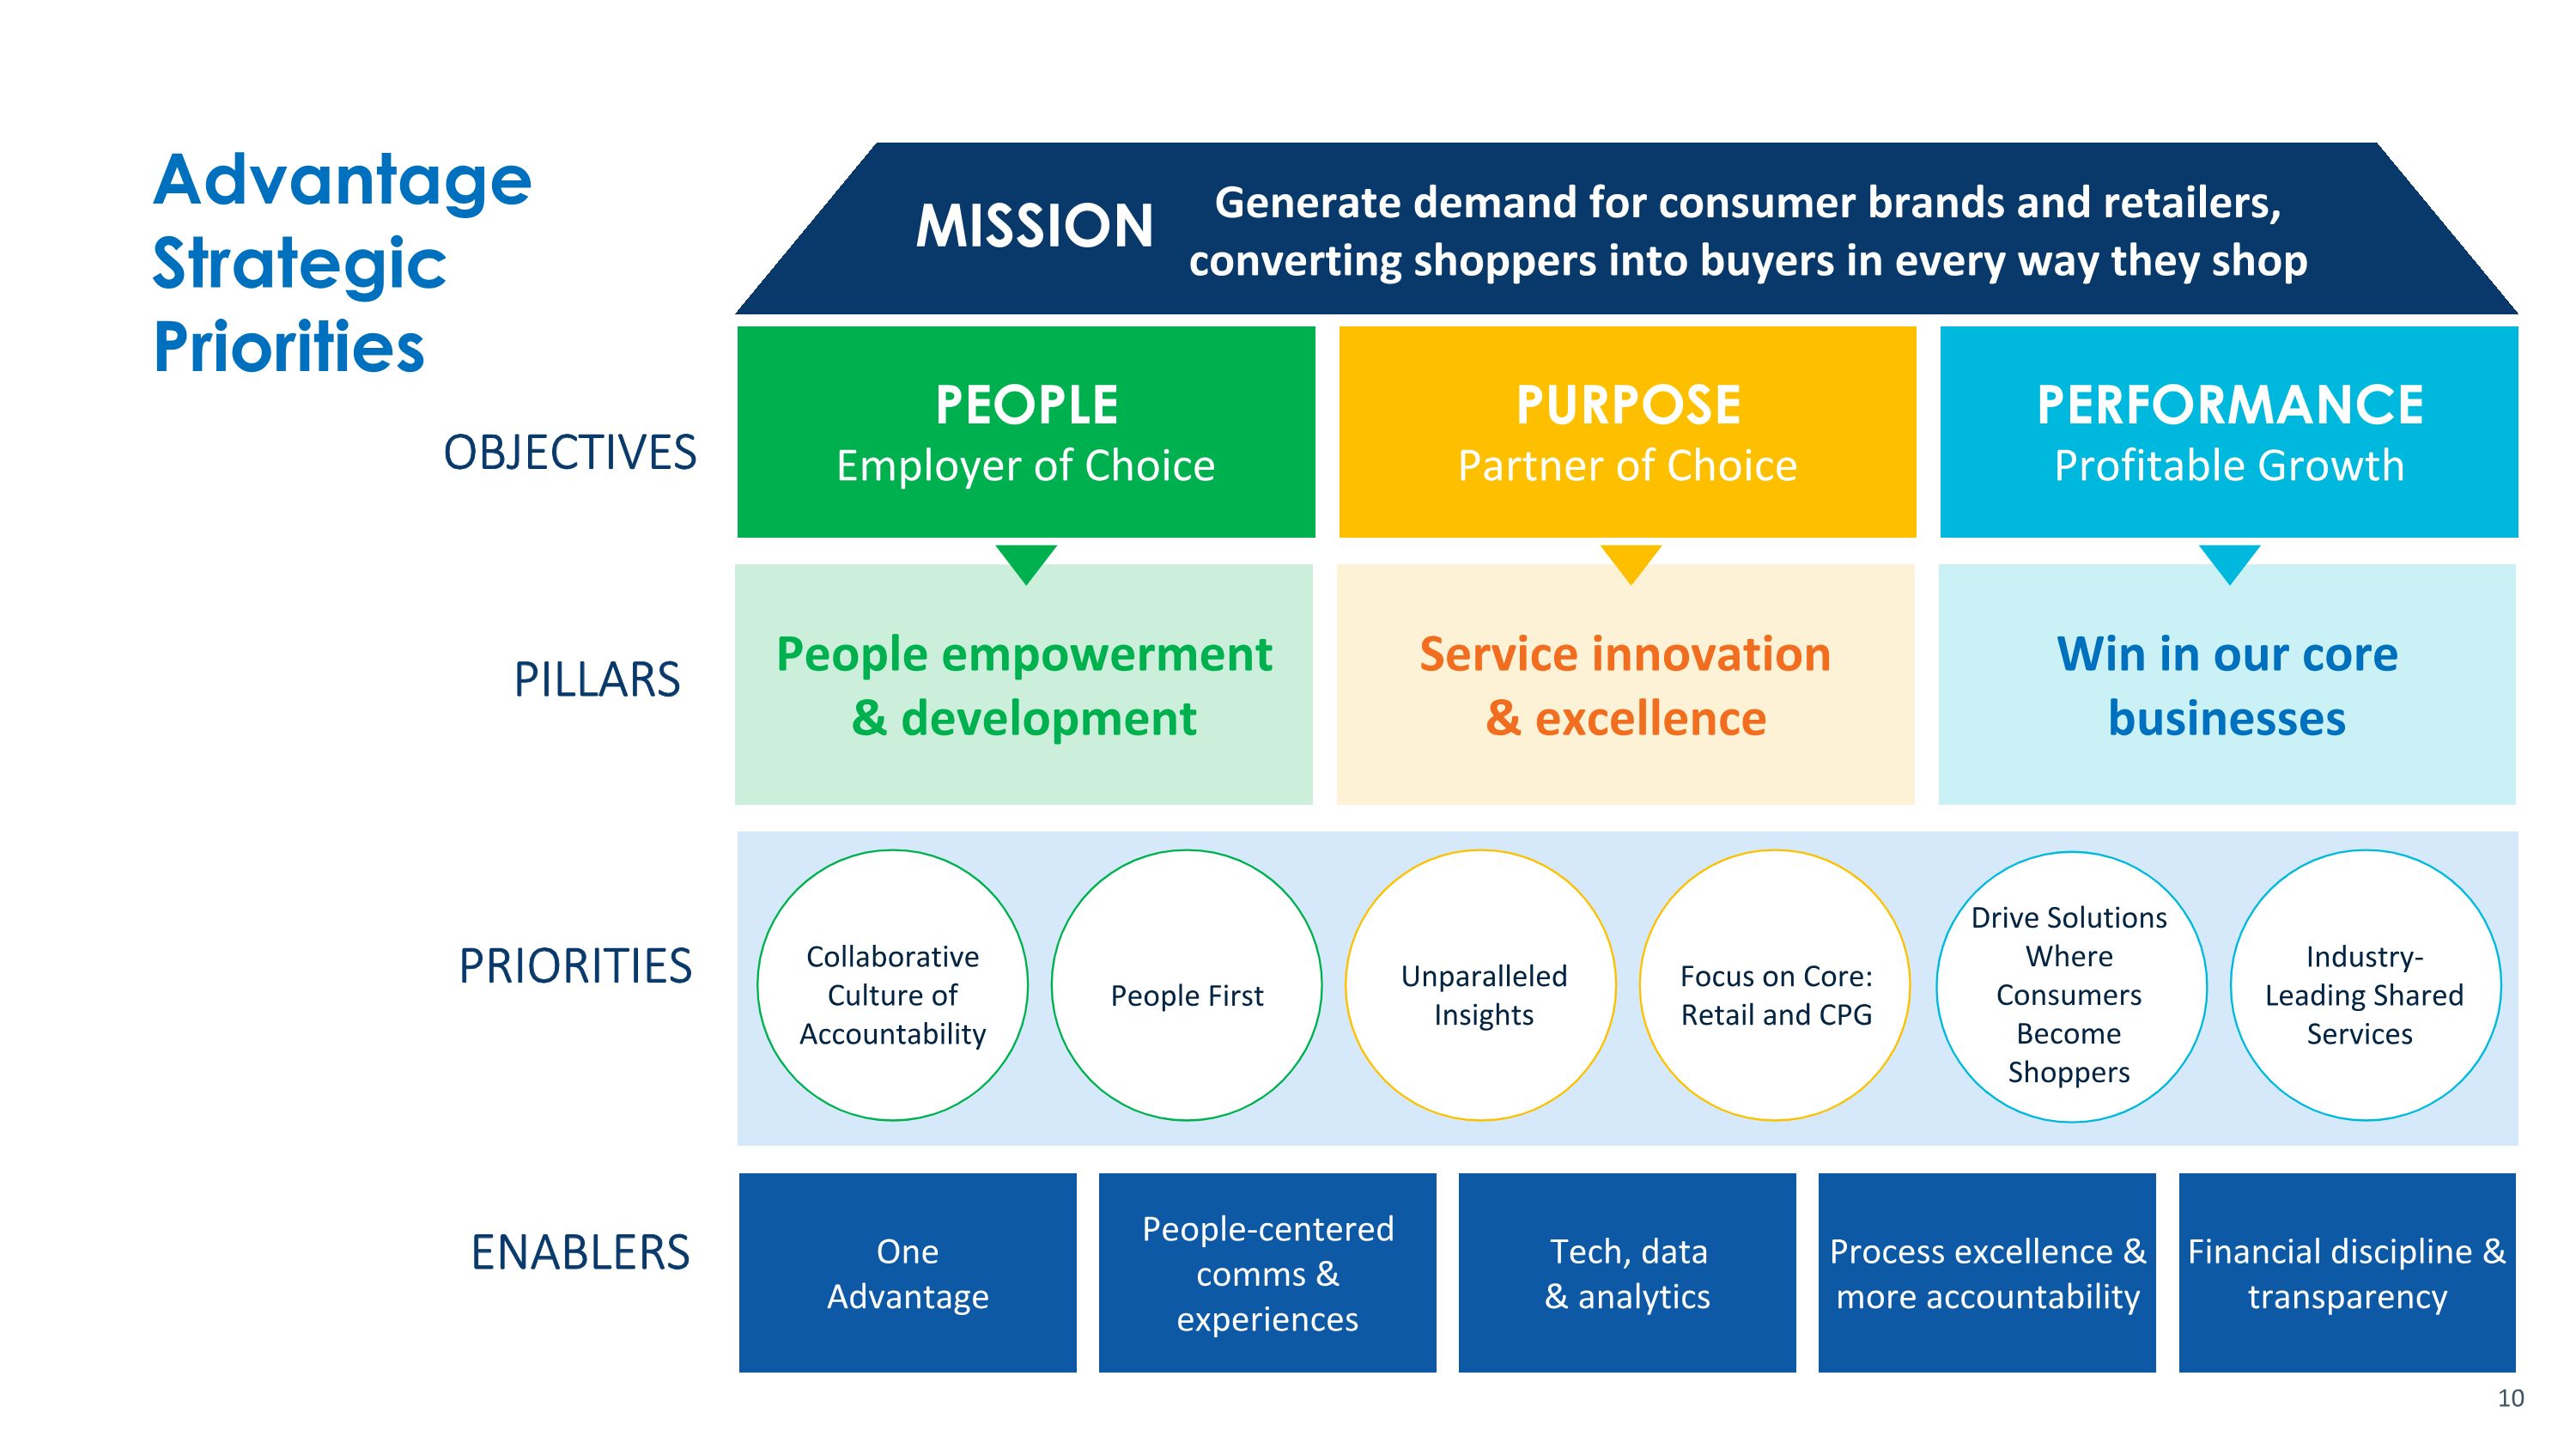
People empowerment�& development Service innovation �& excellence Win in our core businesses PEOPLE Employer of Choice PURPOSE Partner of Choice PERFORMANCE Profitable Growth MISSION PRIORITIES ENABLERS PILLARS OBJECTIVES Process excellence & �more accountability Tech, data �& analytics One�Advantage People-centered comms &�experiences Financial discipline & transparency Process & �ways of working Tech, data �& analytics One�Advantage People-centered comms &�experiences Financial discipline Drive Solutions Where Consumers Become Shoppers Unparalleled�Insights Focus on Core: Retail and CPG Industry-Leading Shared Services Collaborative�Culture of Accountability People First Generate demand for consumer brands and retailers, �converting shoppers into buyers in every way they shop Advantage Strategic Priorities
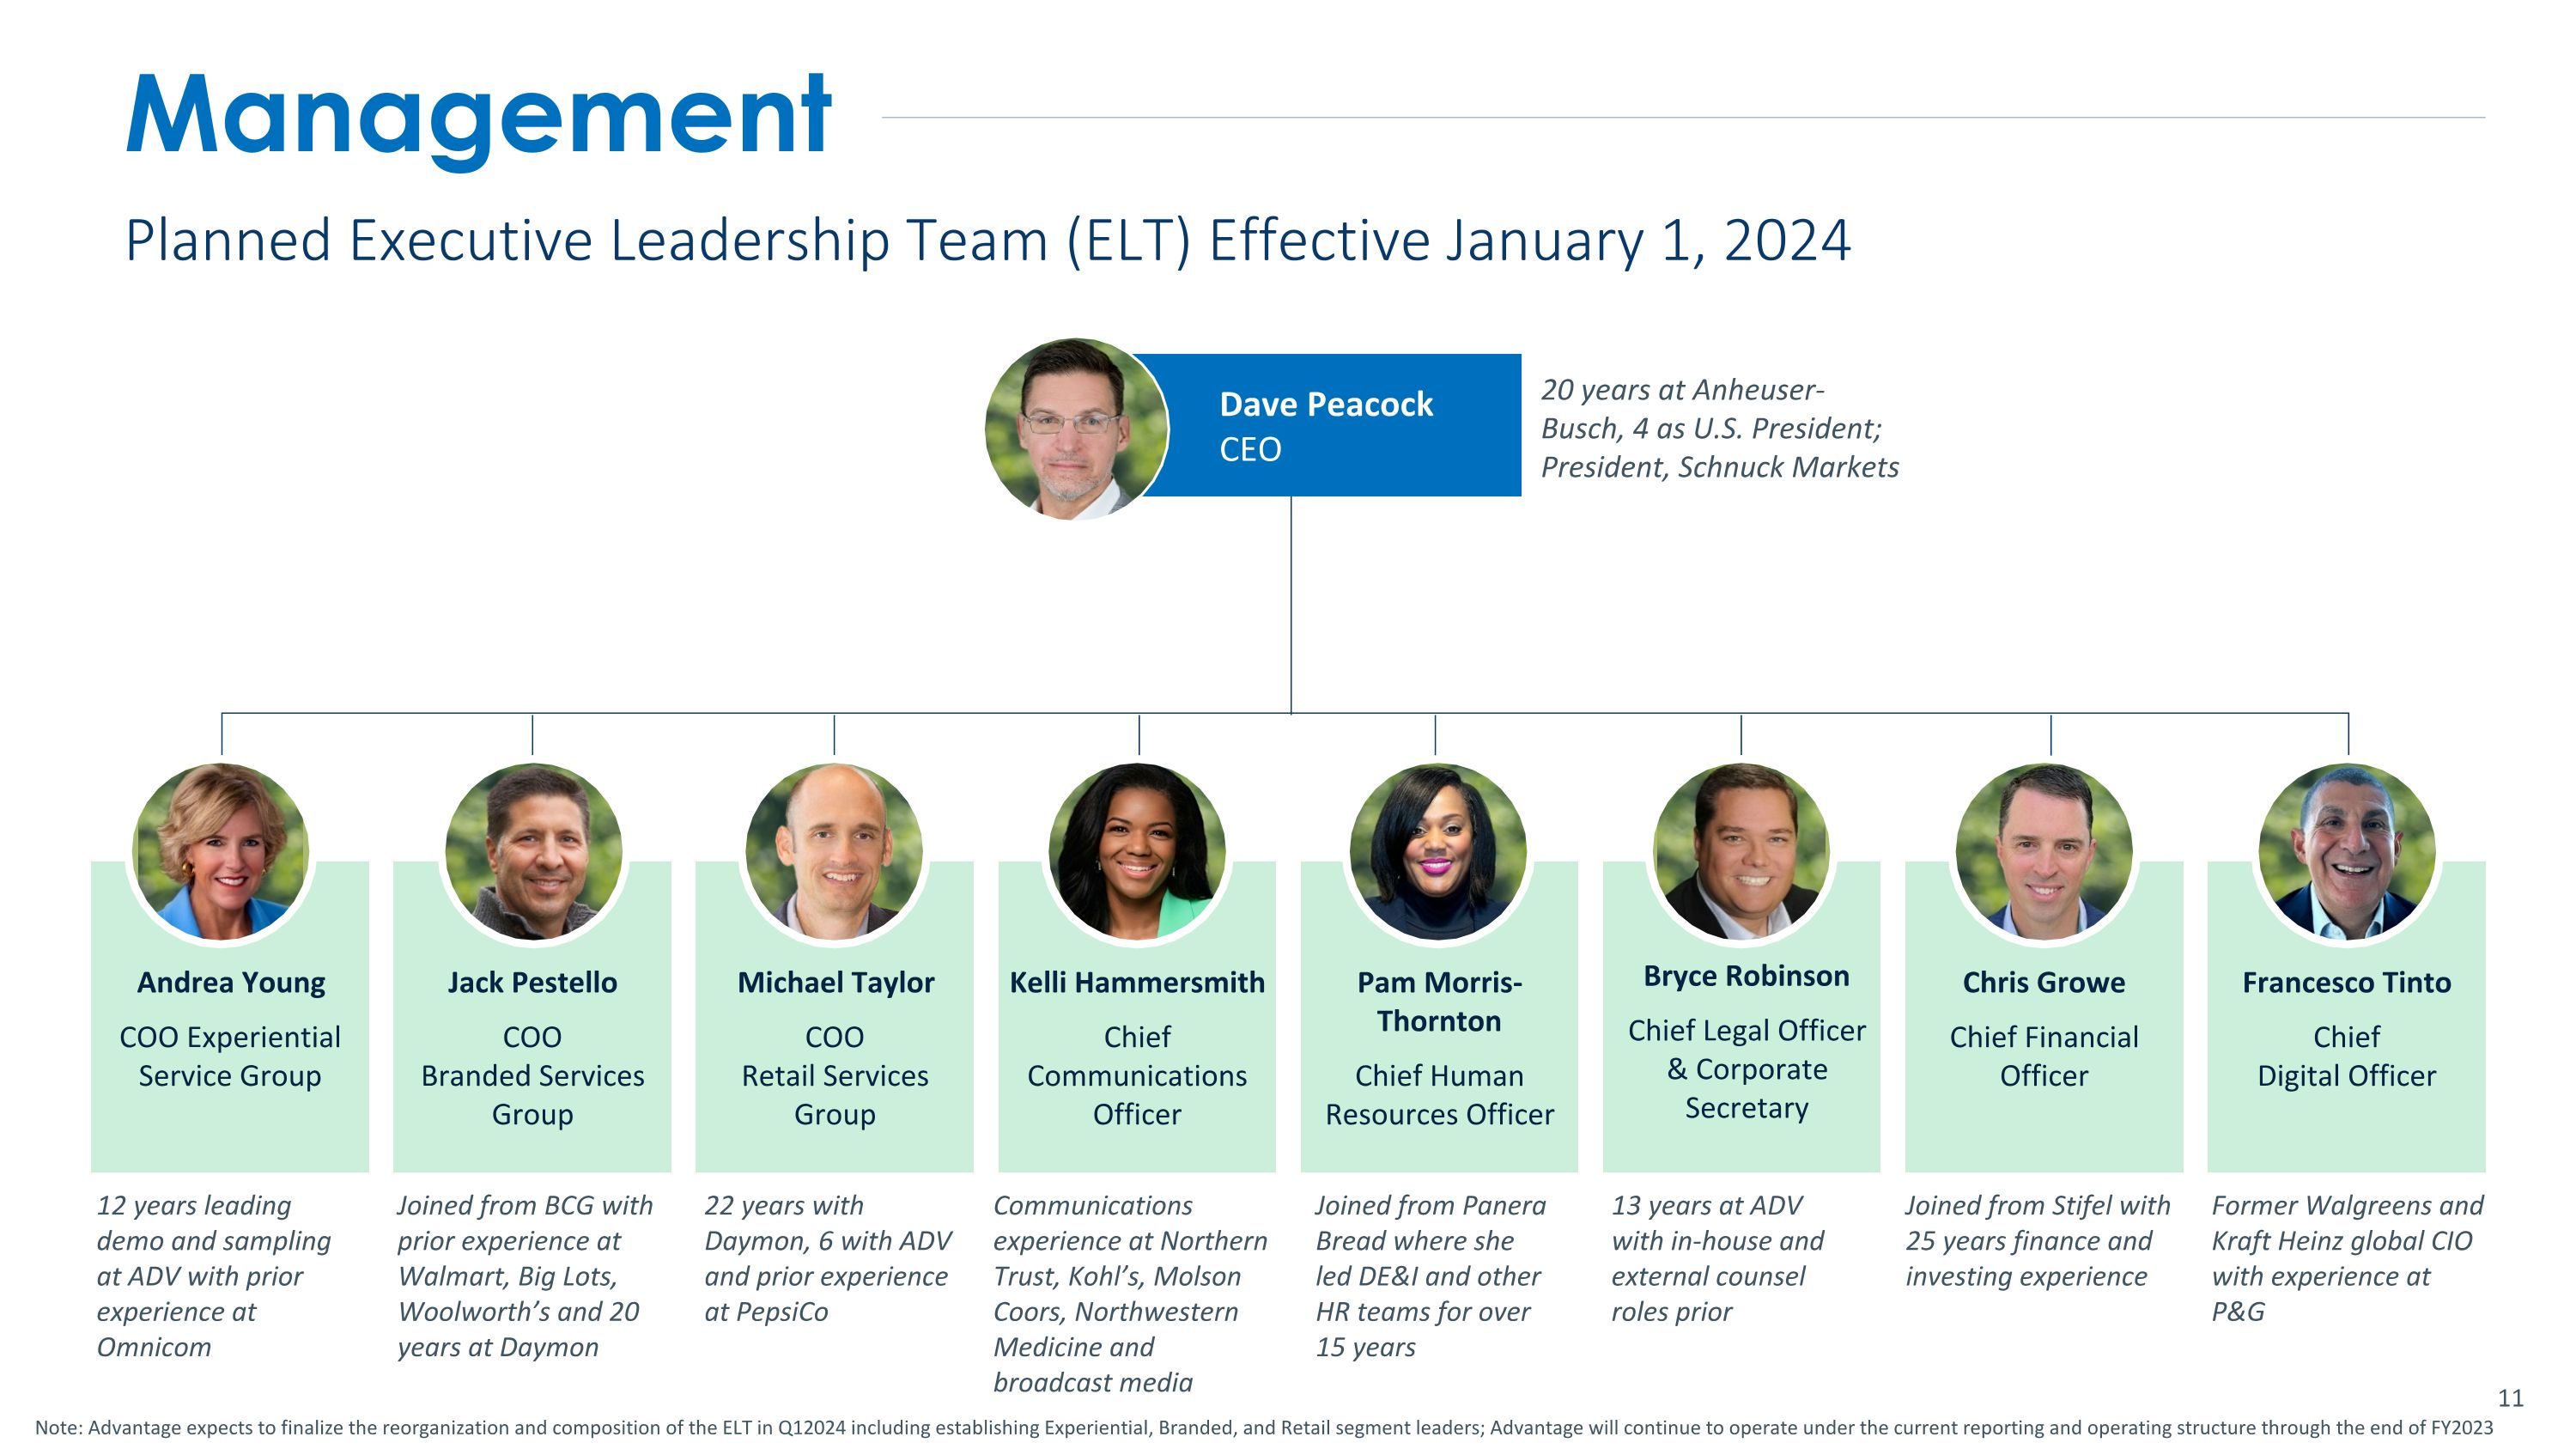
Dave Peacock CEO Andrea Young COO Experiential Service Group Jack Pestello COO Branded Services Group Michael Taylor COO Retail Services Group Kelli Hammersmith Chief Communications Officer Pam Morris- Thornton Chief Human Resources Officer Bryce Robinson Chief Legal Officer �& Corporate Secretary Chris Growe Chief Financial Officer Francesco Tinto Chief �Digital Officer Management Planned Executive Leadership Team (ELT) Effective January 1, 2024 12 years leading demo and sampling at ADV with prior experience at Omnicom Joined from BCG with prior experience at Walmart, Big Lots, Woolworth’s and 20 years at Daymon 22 years with Daymon, 6 with ADV and prior experience at PepsiCo Communications experience at Northern Trust, Kohl’s, Molson Coors, Northwestern Medicine and broadcast media Joined from Panera Bread where she led DE&I and other HR teams for over 15 years 13 years at ADV with in-house and external counsel roles prior Joined from Stifel with 25 years finance and investing experience Former Walgreens and Kraft Heinz global CIO with experience at P&G 20 years at Anheuser-Busch, 4 as U.S. President; President, Schnuck Markets Note: Advantage expects to finalize the reorganization and composition of the ELT in Q12024 including establishing Experiential, Branded, and Retail segment leaders; Advantage will continue to operate under the current reporting and operating structure through the end of FY2023

Non-GAAP�Reconciliation
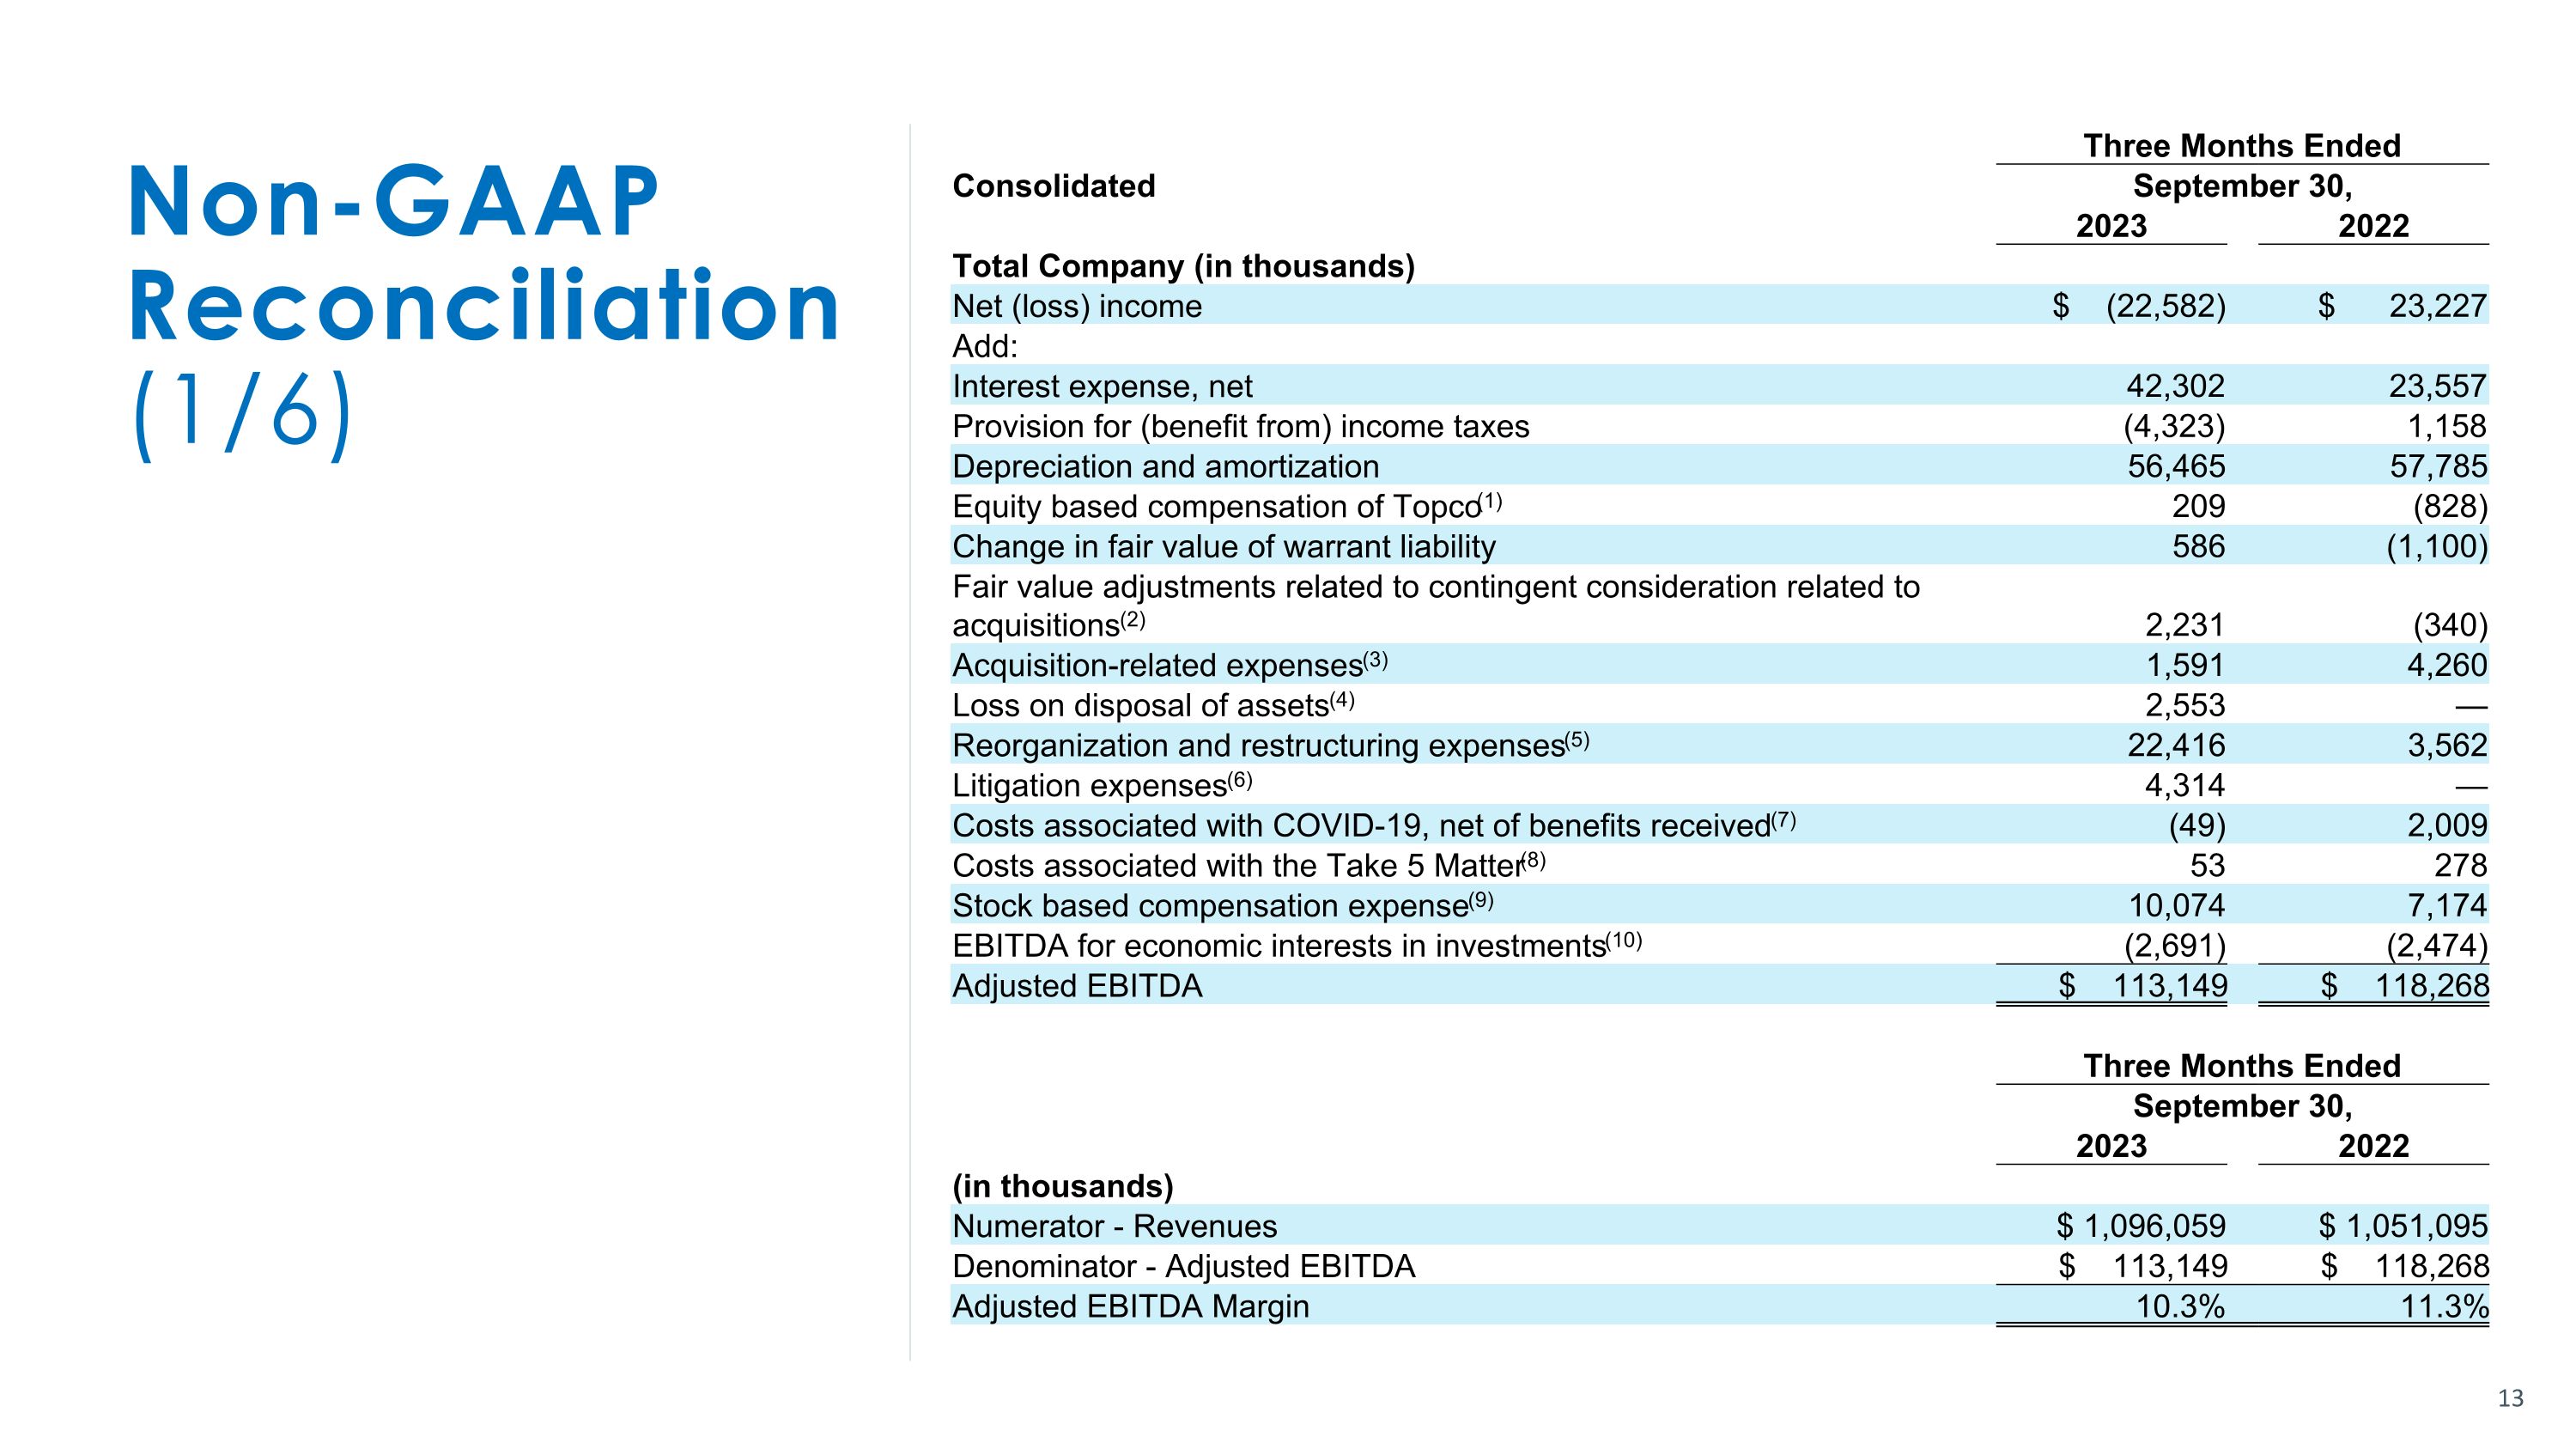
Non-GAAP �Reconciliation�(1/6) Three Months Ended Consolidated September 30, 2023 2022 Total Company (in thousands) Net (loss) income $ (22,582) $ 23,227 Add: Interest expense, net 42,302 23,557 Provision for (benefit from) income taxes (4,323) 1,158 Depreciation and amortization 56,465 57,785 Equity based compensation of Topco(1) 209 (828) Change in fair value of warrant liability 586 (1,100) Fair value adjustments related to contingent consideration related to acquisitions(2) 2,231 (340) Acquisition-related expenses(3) 1,591 4,260 Loss on disposal of assets(4) 2,553 — Reorganization and restructuring expenses(5) 22,416 3,562 Litigation expenses(6) 4,314 — Costs associated with COVID-19, net of benefits received(7) (49) 2,009 Costs associated with the Take 5 Matter(8) 53 278 Stock based compensation expense(9) 10,074 7,174 EBITDA for economic interests in investments(10) (2,691) (2,474) Adjusted EBITDA $ 113,149 $ 118,268 Three Months Ended September 30, 2023 2022 (in thousands) Numerator - Revenues $ 1,096,059 $ 1,051,095 Denominator - Adjusted EBITDA $ 113,149 $ 118,268 Adjusted EBITDA Margin 10.3% 11.3%
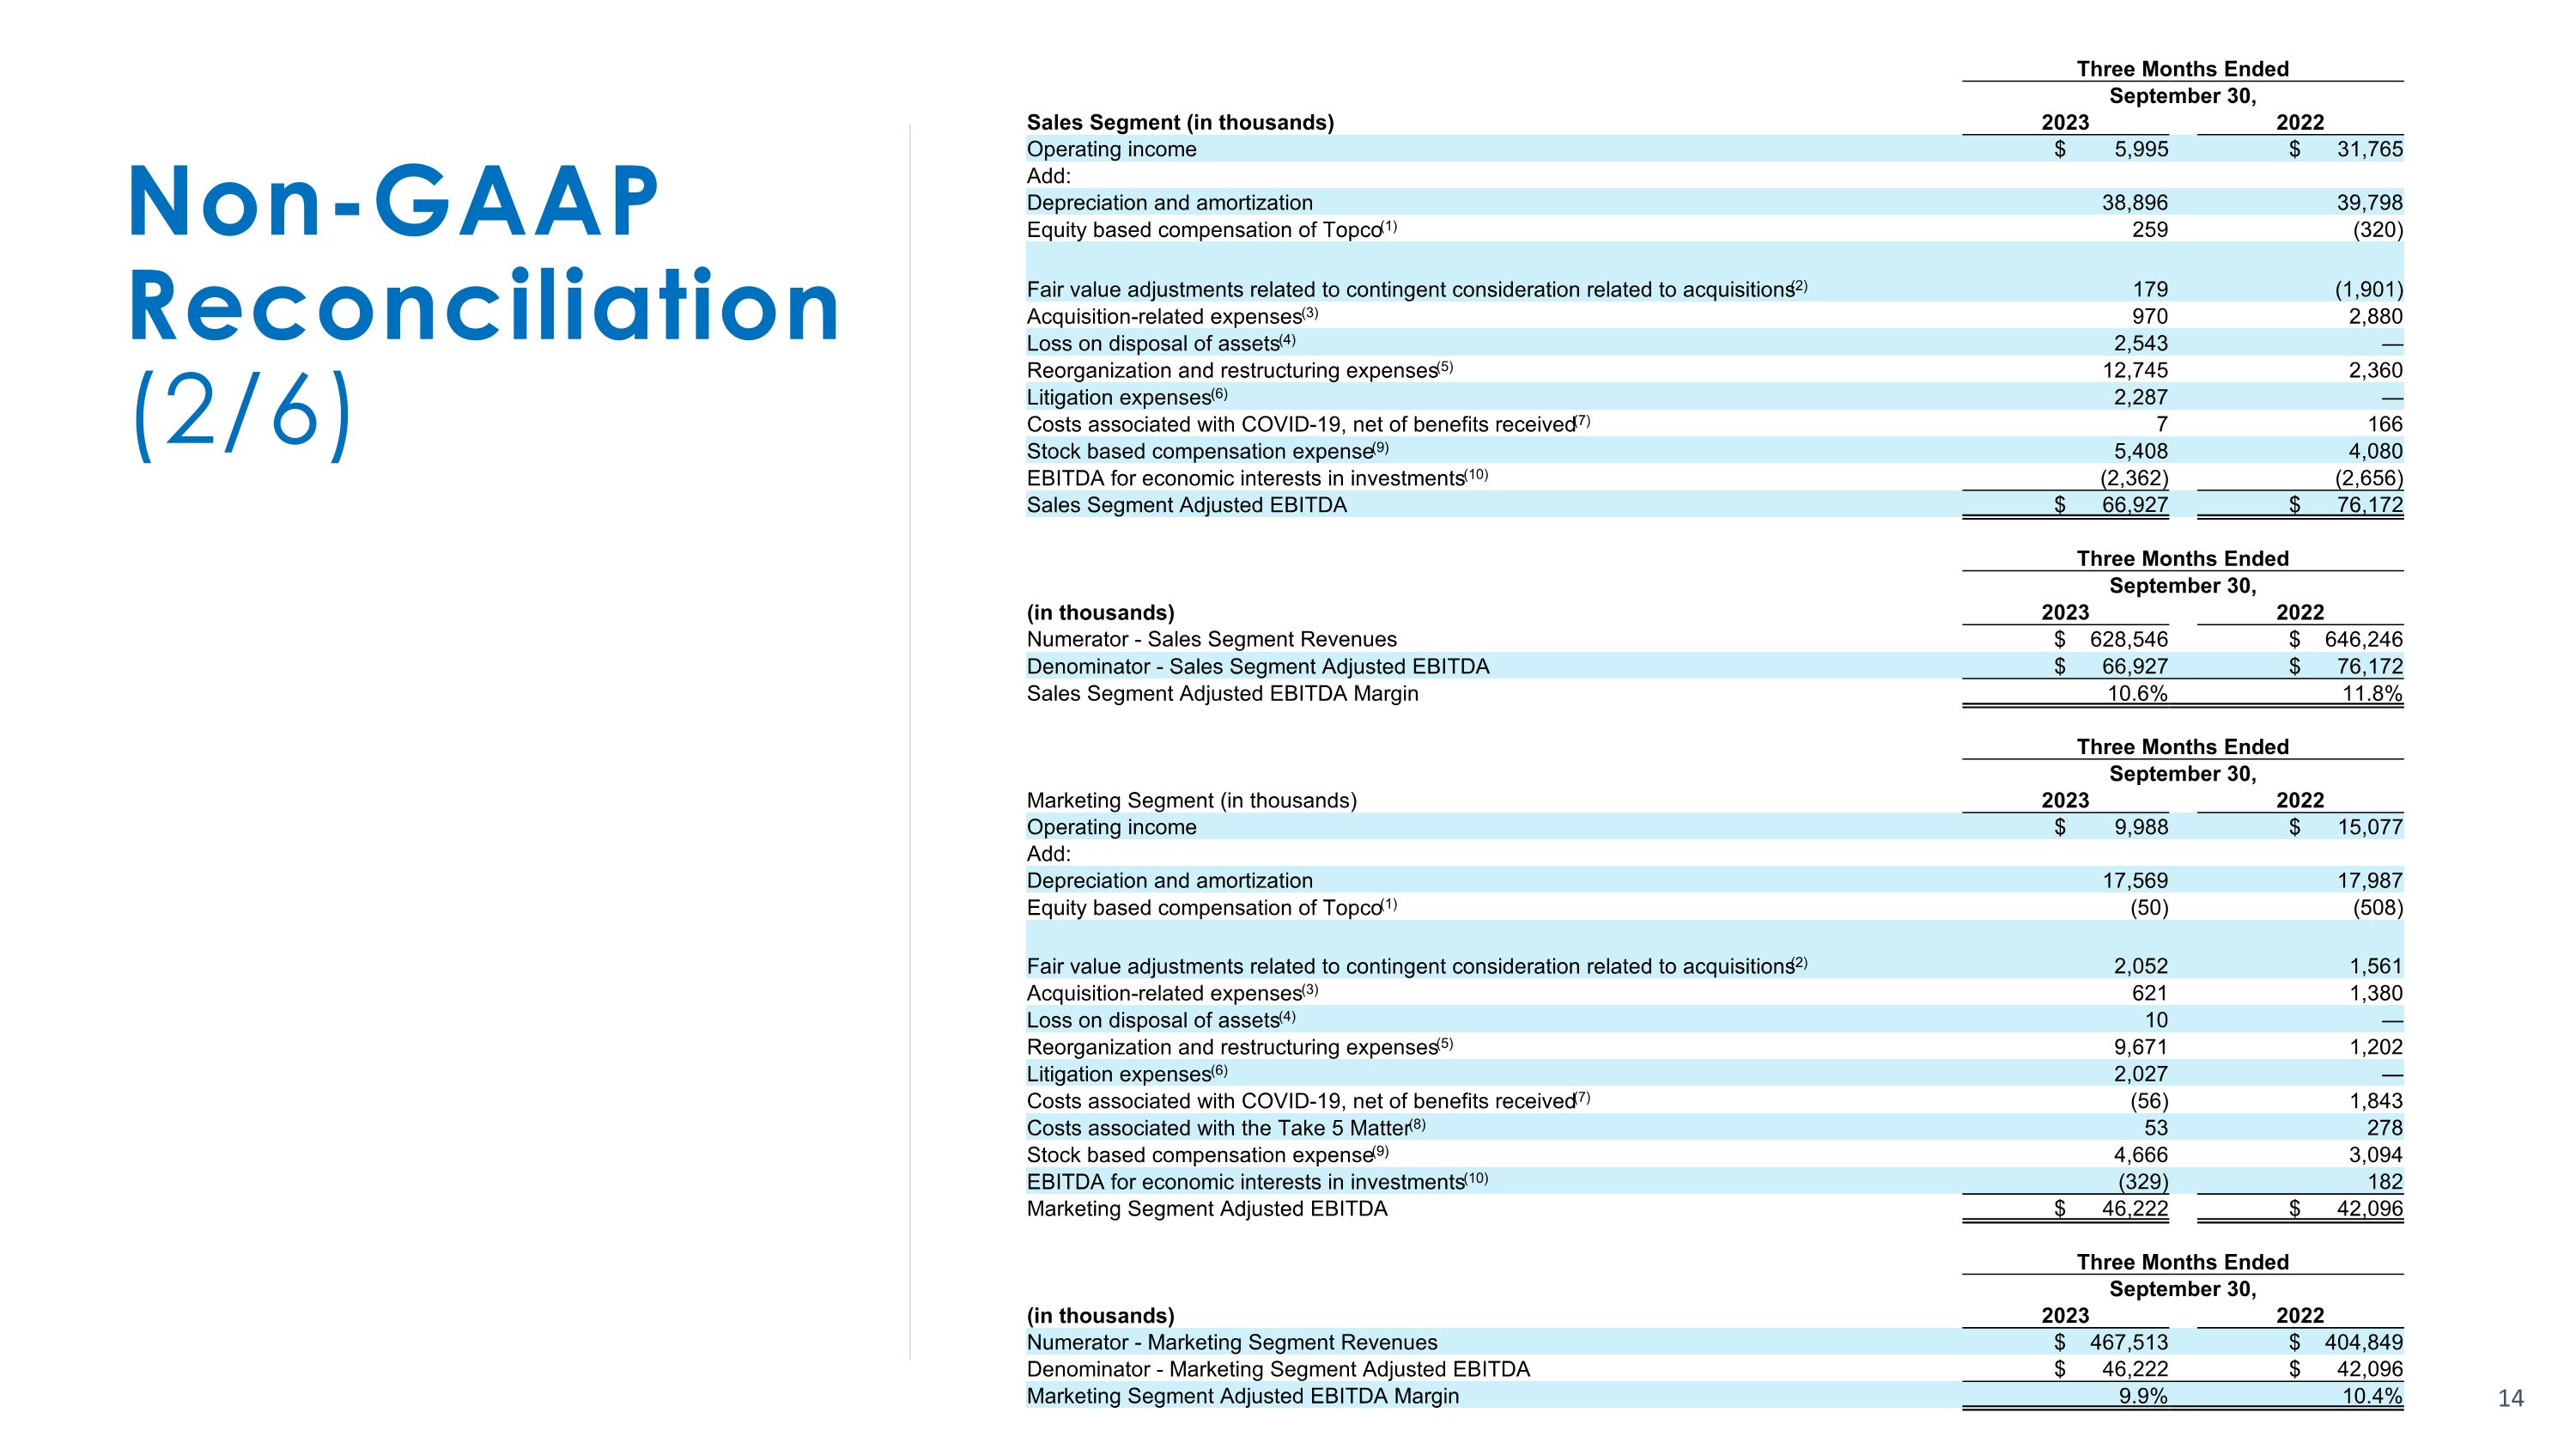
Non-GAAP �Reconciliation�(2/6) Three Months Ended September 30, Sales Segment (in thousands) 2023 2022 Operating income $ 5,995 $ 31,765 Add: Depreciation and amortization 38,896 39,798 Equity based compensation of Topco(1) 259 (320) Fair value adjustments related to contingent consideration related to acquisitions(2) 179 (1,901) Acquisition-related expenses(3) 970 2,880 Loss on disposal of assets(4) 2,543 — Reorganization and restructuring expenses(5) 12,745 2,360 Litigation expenses(6) 2,287 — Costs associated with COVID-19, net of benefits received(7) 7 166 Stock based compensation expense(9) 5,408 4,080 EBITDA for economic interests in investments(10) (2,362) (2,656) Sales Segment Adjusted EBITDA $ 66,927 $ 76,172 Three Months Ended September 30, (in thousands) 2023 2022 Numerator - Sales Segment Revenues $ 628,546 $ 646,246 Denominator - Sales Segment Adjusted EBITDA $ 66,927 $ 76,172 Sales Segment Adjusted EBITDA Margin 10.6% 11.8% Three Months Ended September 30, Marketing Segment (in thousands) 2023 2022 Operating income $ 9,988 $ 15,077 Add: Depreciation and amortization 17,569 17,987 Equity based compensation of Topco(1) (50) (508) Fair value adjustments related to contingent consideration related to acquisitions(2) 2,052 1,561 Acquisition-related expenses(3) 621 1,380 Loss on disposal of assets(4) 10 — Reorganization and restructuring expenses(5) 9,671 1,202 Litigation expenses(6) 2,027 — Costs associated with COVID-19, net of benefits received(7) (56) 1,843 Costs associated with the Take 5 Matter(8) 53 278 Stock based compensation expense(9) 4,666 3,094 EBITDA for economic interests in investments(10) (329) 182 Marketing Segment Adjusted EBITDA $ 46,222 $ 42,096 Three Months Ended September 30, (in thousands) 2023 2022 Numerator - Marketing Segment Revenues $ 467,513 $ 404,849 Denominator - Marketing Segment Adjusted EBITDA $ 46,222 $ 42,096 Marketing Segment Adjusted EBITDA Margin 9.9% 10.4%
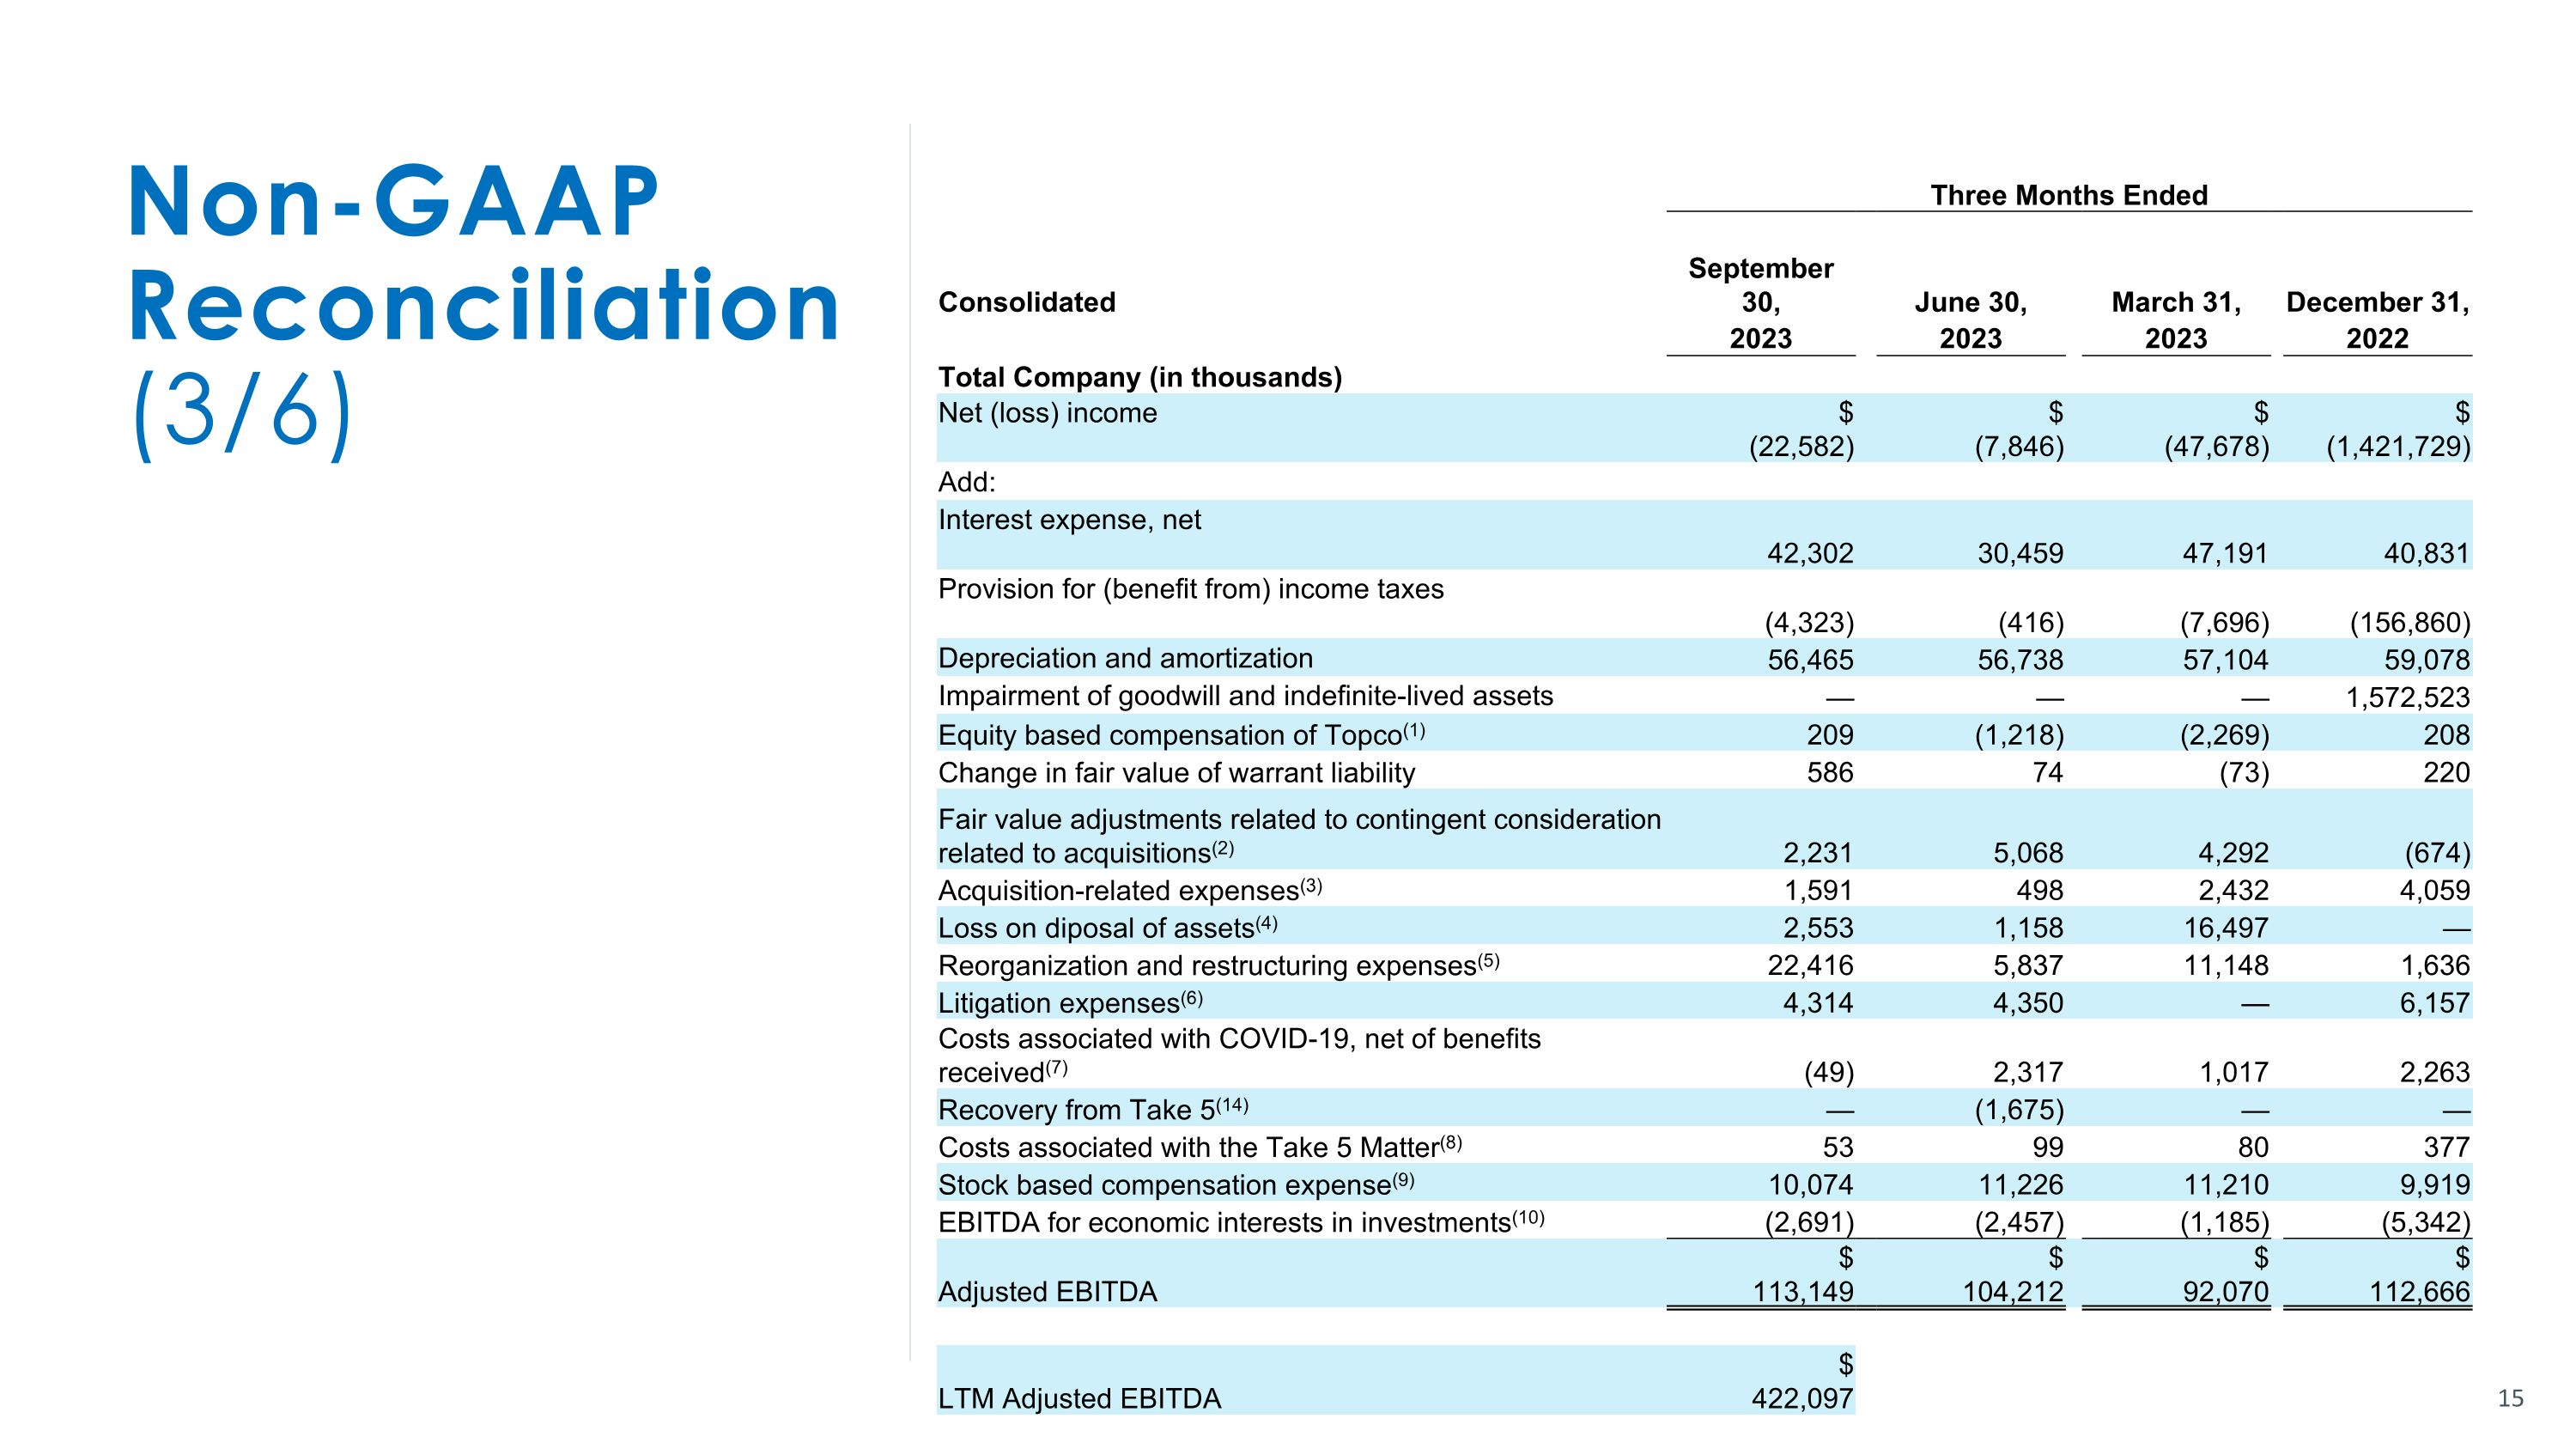
Non-GAAP �Reconciliation�(3/6) Three Months Ended Consolidated September 30, June 30, March 31, December 31, 2023 2023 2023 2022 Total Company (in thousands) Net (loss) income $ (22,582) $ (7,846) $ (47,678) $ (1,421,729) Add: Interest expense, net 42,302 30,459 47,191 40,831 Provision for (benefit from) income taxes (4,323) (416) (7,696) (156,860) Depreciation and amortization 56,465 56,738 57,104 59,078 Impairment of goodwill and indefinite-lived assets — — — 1,572,523 Equity based compensation of Topco(1) 209 (1,218) (2,269) 208 Change in fair value of warrant liability 586 74 (73) 220 Fair value adjustments related to contingent consideration related to acquisitions(2) 2,231 5,068 4,292 (674) Acquisition-related expenses(3) 1,591 498 2,432 4,059 Loss on diposal of assets(4) 2,553 1,158 16,497 — Reorganization and restructuring expenses(5) 22,416 5,837 11,148 1,636 Litigation expenses(6) 4,314 4,350 — 6,157 Costs associated with COVID-19, net of benefits received(7) (49) 2,317 1,017 2,263 Recovery from Take 5(14) — (1,675) — — Costs associated with the Take 5 Matter(8) 53 99 80 377 Stock based compensation expense(9) 10,074 11,226 11,210 9,919 EBITDA for economic interests in investments(10) (2,691) (2,457) (1,185) (5,342) Adjusted EBITDA $ 113,149 $ 104,212 $ 92,070 $ 112,666 LTM Adjusted EBITDA $ 422,097
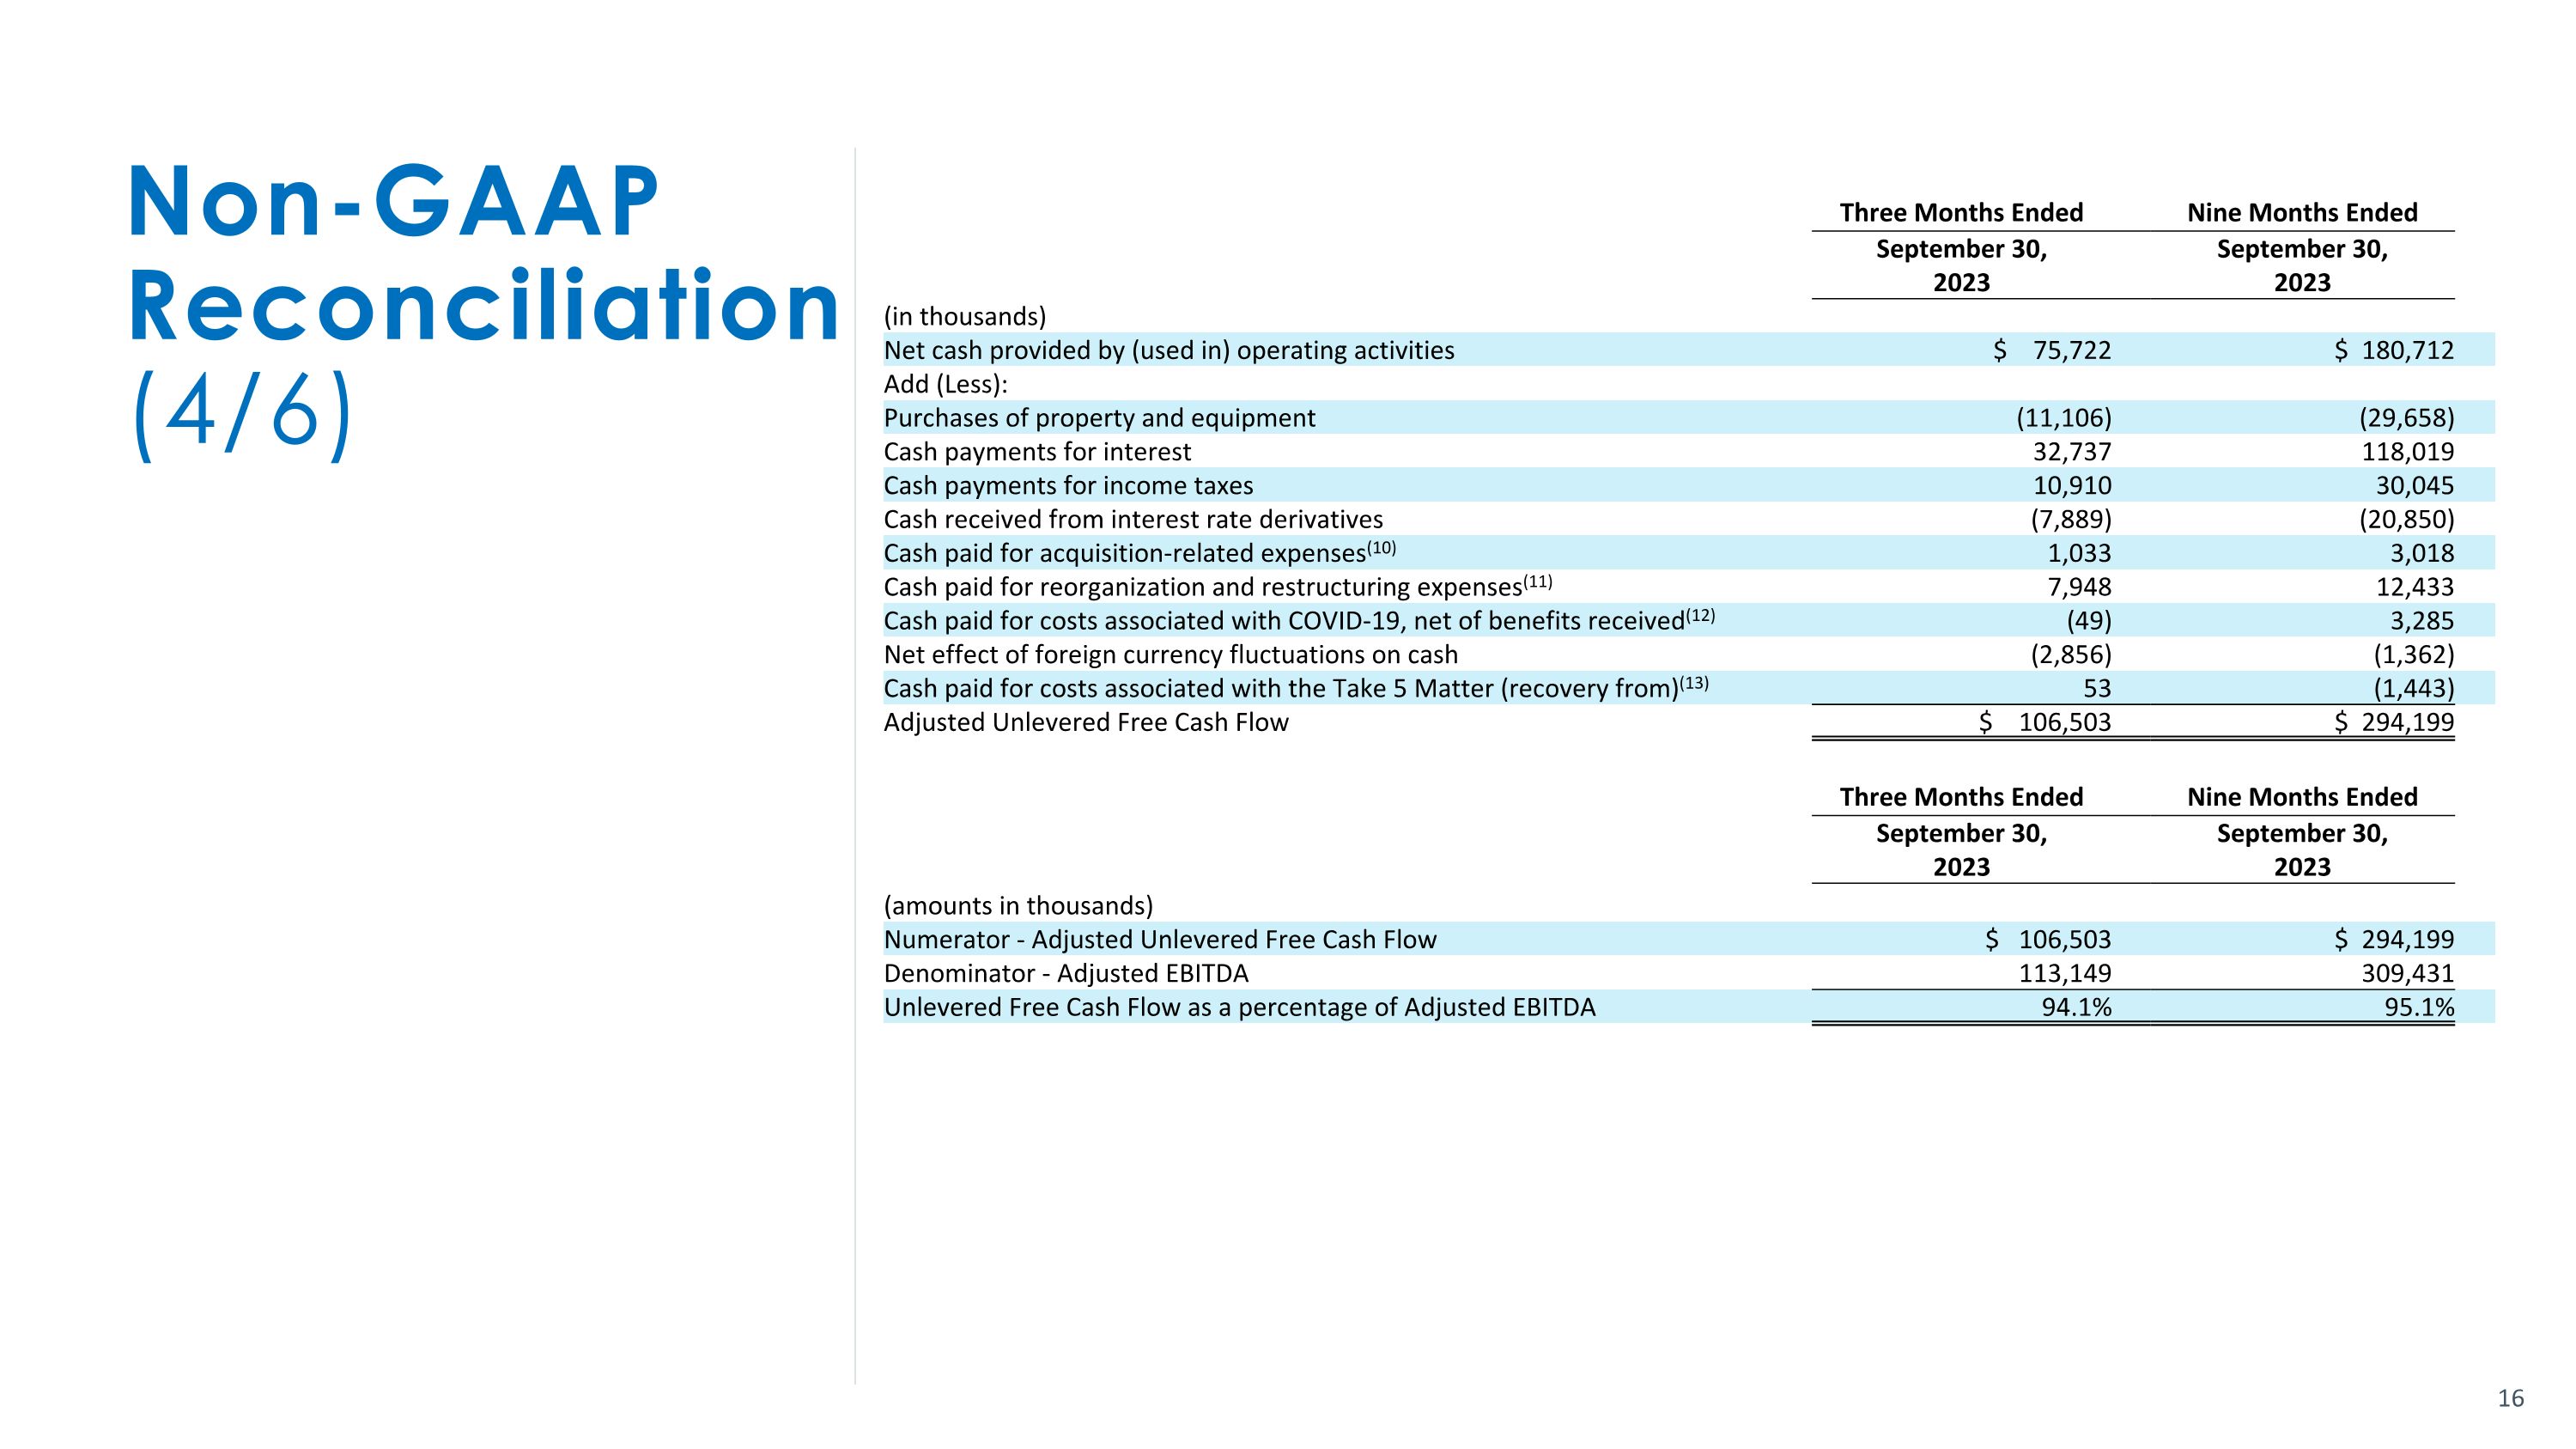
Non-GAAP �Reconciliation�(4/6) Three Months Ended Nine Months Ended September 30,�2023 September 30,�2023 (in thousands) Net cash provided by (used in) operating activities $ 75,722 $ 180,712 Add (Less): Purchases of property and equipment (11,106) (29,658) Cash payments for interest 32,737 118,019 Cash payments for income taxes 10,910 30,045 Cash received from interest rate derivatives (7,889) (20,850) Cash paid for acquisition-related expenses(10) 1,033 3,018 Cash paid for reorganization and restructuring expenses(11) 7,948 12,433 Cash paid for costs associated with COVID-19, net of benefits received(12) (49) 3,285 Net effect of foreign currency fluctuations on cash (2,856) (1,362) Cash paid for costs associated with the Take 5 Matter (recovery from)(13) 53 (1,443) Adjusted Unlevered Free Cash Flow $ 106,503 $ 294,199 Three Months Ended Nine Months Ended September 30,�2023 September 30,�2023 (amounts in thousands) Numerator - Adjusted Unlevered Free Cash Flow $ 106,503 $ 294,199 Denominator - Adjusted EBITDA 113,149 309,431 Unlevered Free Cash Flow as a percentage of Adjusted EBITDA 94.1% 95.1%
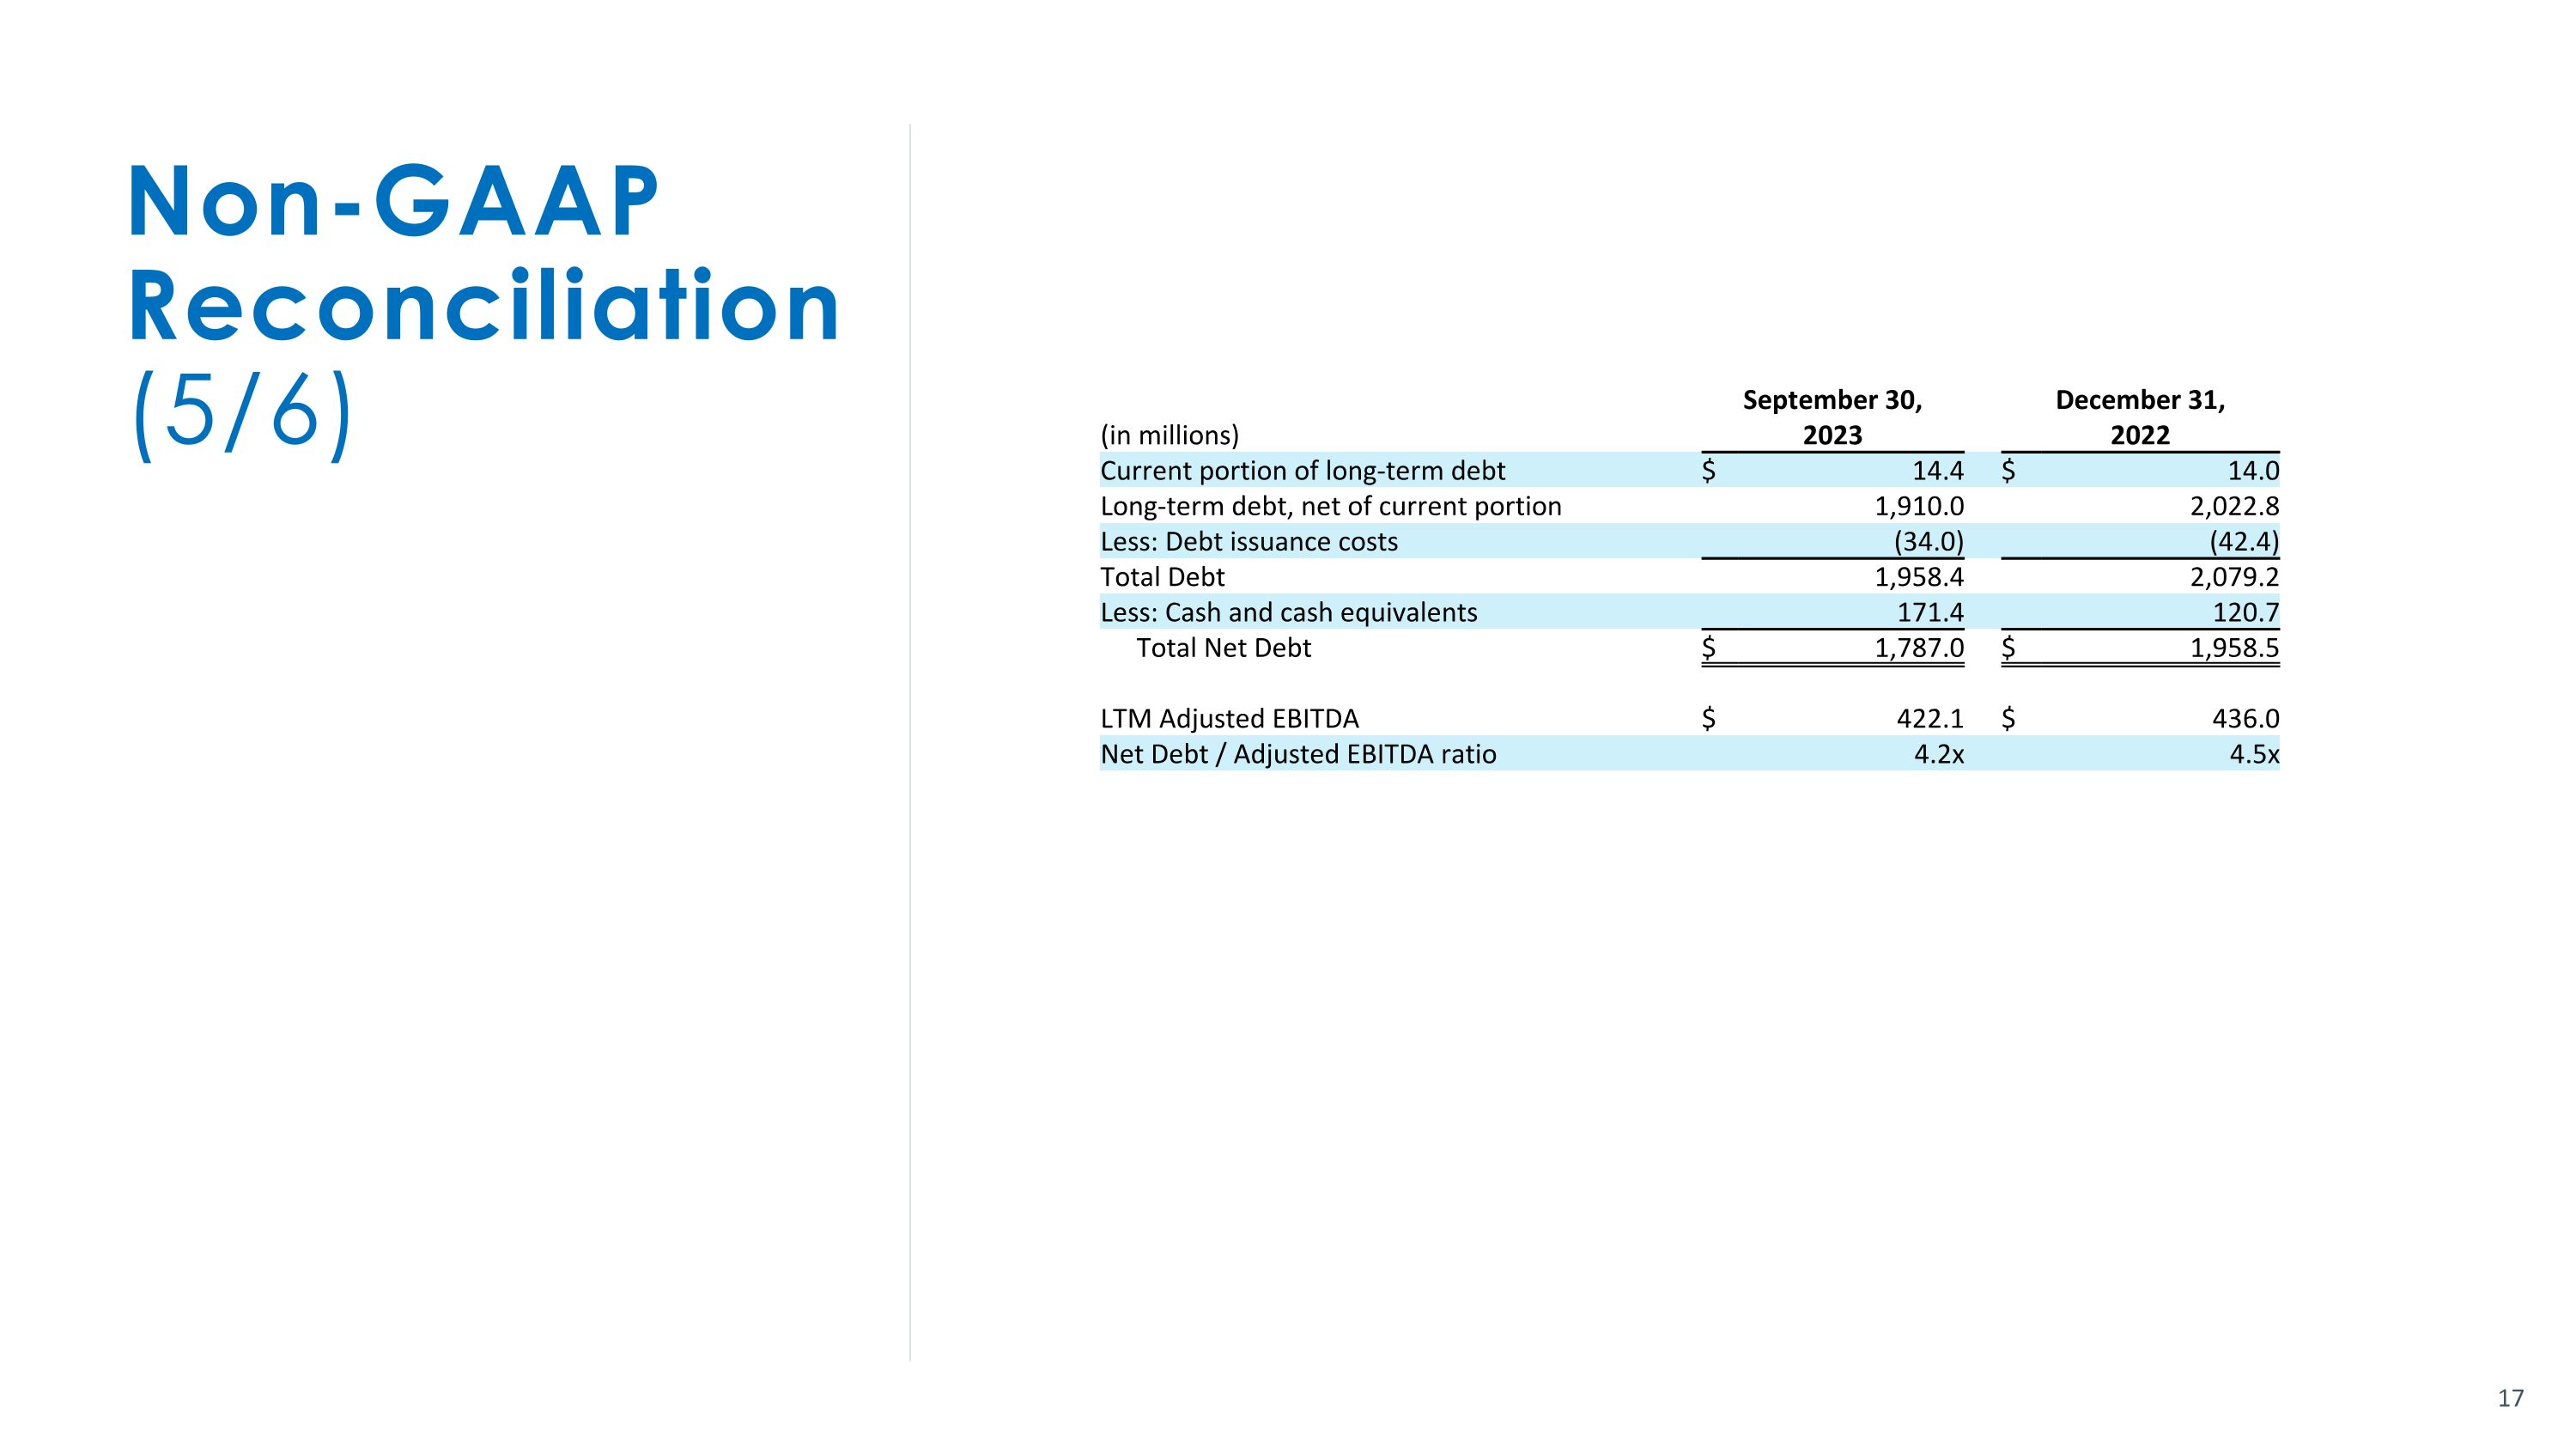
Non-GAAP �Reconciliation�(5/6) September 30, December 31, (in millions) 2023 2022 Current portion of long-term debt $ 14.4 $ 14.0 Long-term debt, net of current portion 1,910.0 2,022.8 Less: Debt issuance costs (34.0) (42.4) Total Debt 1,958.4 2,079.2 Less: Cash and cash equivalents 171.4 120.7 Total Net Debt $ 1,787.0 $ 1,958.5 LTM Adjusted EBITDA $ 422.1 $ 436.0 Net Debt / Adjusted EBITDA ratio 4.2x 4.5x
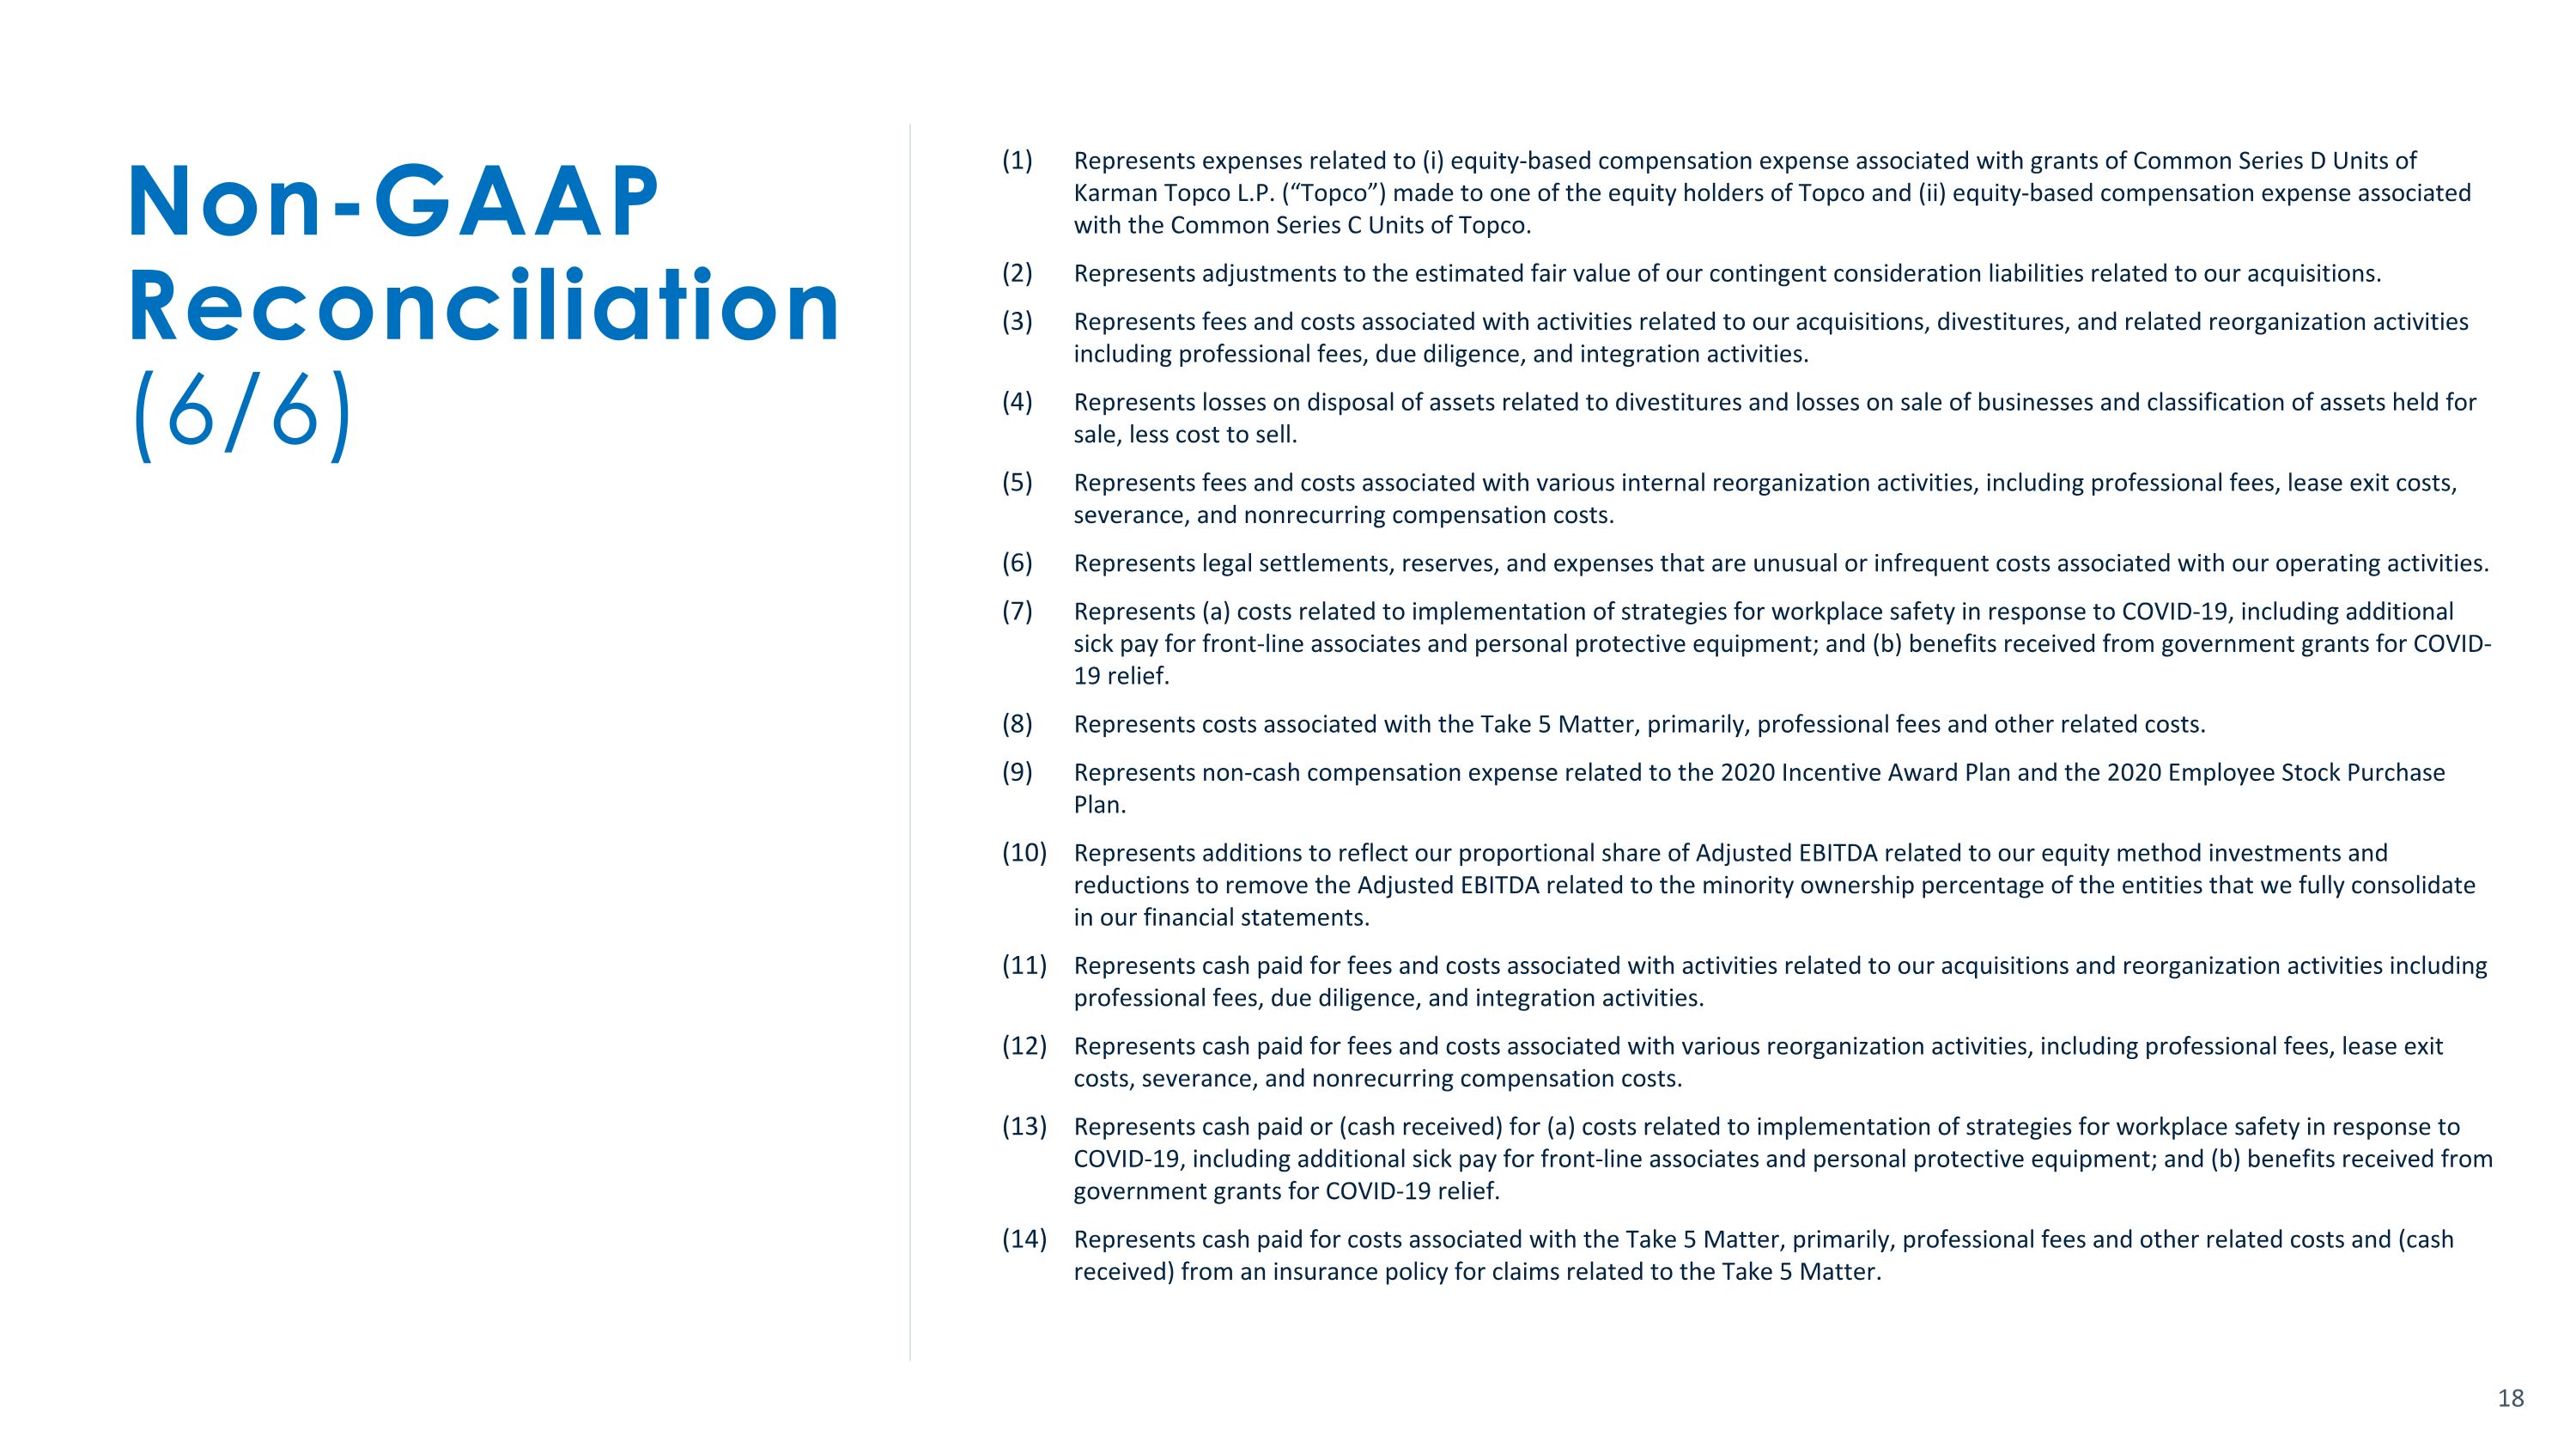
Non-GAAP �Reconciliation�(6/6) Represents expenses related to (i) equity-based compensation expense associated with grants of Common Series D Units of Karman Topco L.P. (“Topco”) made to one of the equity holders of Topco and (ii) equity-based compensation expense associated with the Common Series C Units of Topco. Represents adjustments to the estimated fair value of our contingent consideration liabilities related to our acquisitions. Represents fees and costs associated with activities related to our acquisitions, divestitures, and related reorganization activities including professional fees, due diligence, and integration activities. Represents losses on disposal of assets related to divestitures and losses on sale of businesses and classification of assets held for sale, less cost to sell. Represents fees and costs associated with various internal reorganization activities, including professional fees, lease exit costs, severance, and nonrecurring compensation costs. Represents legal settlements, reserves, and expenses that are unusual or infrequent costs associated with our operating activities. Represents (a) costs related to implementation of strategies for workplace safety in response to COVID-19, including additional sick pay for front-line associates and personal protective equipment; and (b) benefits received from government grants for COVID-19 relief. Represents costs associated with the Take 5 Matter, primarily, professional fees and other related costs. Represents non-cash compensation expense related to the 2020 Incentive Award Plan and the 2020 Employee Stock Purchase Plan. Represents additions to reflect our proportional share of Adjusted EBITDA related to our equity method investments and reductions to remove the Adjusted EBITDA related to the minority ownership percentage of the entities that we fully consolidate in our financial statements. Represents cash paid for fees and costs associated with activities related to our acquisitions and reorganization activities including professional fees, due diligence, and integration activities. Represents cash paid for fees and costs associated with various reorganization activities, including professional fees, lease exit costs, severance, and nonrecurring compensation costs. Represents cash paid or (cash received) for (a) costs related to implementation of strategies for workplace safety in response to COVID-19, including additional sick pay for front-line associates and personal protective equipment; and (b) benefits received from government grants for COVID-19 relief. Represents cash paid for costs associated with the Take 5 Matter, primarily, professional fees and other related costs and (cash received) from an insurance policy for claims related to the Take 5 Matter.
Thank you


