UNITED STATES
SECURITIES AND EXCHANGE COMMISSION
Washington, D.C. 20549
FORM 6-K
REPORT OF FOREIGN PRIVATE ISSUER PURSUANT TO RULE 13a-16 OR 15d-16 UNDER THE SECURITIES EXCHANGE ACT OF 1934
For the month of November, 2022
Commission File Number: 001-39169
Natura &Co Holding S.A.
(Exact name of registrant as specified in its charter)
Avenida Alexandre Colares, No. 1188, Sala A17-Bloco A
Parque Anhanguera
São Paulo, São Paulo 05106-000, Brazil
(Address of principal executive office)
Indicate by check mark whether the registrant files or will file annual reports under cover of Form 20-F or Form 40-F:
| Form 20-F | X | Form 40-F |
Indicate by check mark if the registrant is submitting the Form 6-K in paper as permitted by Regulation S-T Rule 101(b)(1):
| Yes | No | X |
Indicate by check mark if the registrant is submitting the Form 6-K in paper as permitted by Regulation S-T Rule 101(b)(7):
| Yes | No | X |
NATURA &CO HOLDING S.A.
TABLE OF CONTENTS
ITEM
| 1. | Earnings release of Natura &Co Holding S.A. for the nine-month period ended September 30, 2022. |
| 2. | Earnings presentation of Natura &Co Holding S.A. for the nine-month period ended September 30, 2022. |
SIGNATURE
Pursuant to the requirements of the Securities Exchange Act of 1934, the registrant has duly caused this report to be signed on its behalf by the undersigned, thereunto duly authorized.
| NATURA &CO HOLDING S.A. | |||
| By: | /s/ Guilherme Strano Castellan | ||
| Name: | Guilherme Strano Castellan | ||
| Title: | Principal Financial Officer | ||
| By: | /s/ Itamar Gaino Filho | ||
| Name: | Itamar Gaino Filho | ||
| Title: | Chief Legal and Compliance Officer | ||
Date: November 14, 2022.
Item 1
Earnings release of Natura &Co Holding S.A. for the nine-month period ended September 30, 2022.
 |  |  |  |
 |
São Paulo, November 09, 2022
Q3 22: Sales growth continues to improve in constant currency; Adj EBITDA margin stable yoy despite cost pressure
Latam shows double-digit growth in CC, boosted by Natura brand and Avon CFT; TBS still impacted by At Home channel decrease and slower Franchise recovery
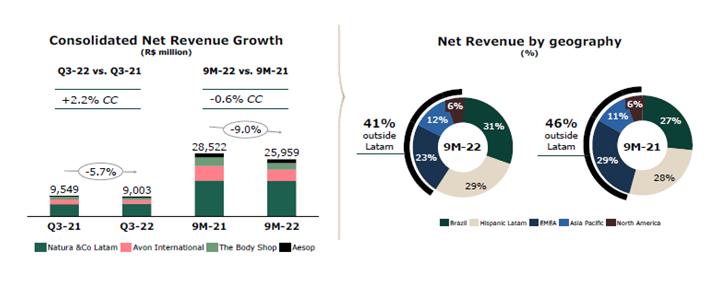
| · | Q3-22 consolidated net revenue of BRL 9.0 billion, -5.7% vs Q3-21 in BRL and +2.2% at constant currency (“CC”). Revenues grew in CC due to a strong performance at Natura &Co Latam (+10.2% in CC) and Aesop (+21.5% in CC), partially offset by continued challenges at The Body Shop (-19.5% in CC), and a softer performance at Avon International (improving sequentially at -8.1% in CC, -3.1% excluding Russia and Ukraine) |
| · | Q3-22 consolidated gross profit of BRL 5.8 billion, represented a 64.1% gross margin, down 120bps compared to Q3-21, pressured by all business units except Aesop. Although some commodities have shown corrections from the peak prices seen in H1, the continued impact of wage inflation, energy prices and FX continued to impact costs. These was partially offset by pricing and category management actions taken across the businesses |
| · | Q3-22 consolidated adjusted EBITDA stood at BRL773 million with margin of 8.6% (stable YoY), as improving margin at Natura &Co Latam combined with lower holding expenses were offset by sales deleverage at The Body Shop and Aesop’s investments for growth |
| · | Net Debt (excluding leasing) stood at BRL 8.8 billion (from BRL 8.5 billion in Q2-22). Following Q3 seasonality, especially considering working capital dynamics (building inventory for holiday season); actions taken to improve cash conversion are starting to take effect, with a significant improvement in cash conversion vs Q3-21, and initiatives are in place to continue to deliver further improvements on cash flow dynamics |
| · | Q3-22 Net loss of BRL560 million in the quarter, driven mainly by lower EBITDA and higher net financials expenses, partly offset by recovery of tax credits associated with Brazil’s tax on foreign income related to 2021. Q3-21 net income had also benefitted from tax gains related to credit recoveries in Brazil. |
| Consolidated Financial Results (R$ million) | Q3-22 | Q3-21 | ∆ | 9M-22 | 9M-21 | ∆ | |
| Net Revenue | 9,003.7 | 9,549.2 | - 5.7% | 25,959.4 | 28,521.5 | - 9.0% | |
| Constant Currency Change | 2.2% | - 0.6% | |||||
| Gross Profit | 5,774.1 | 6,236.2 | - 7.4% | 16,567.3 | 18,567.6 | - 10.8% | |
| Gross Margin | 64.1% | 65.3% | -120 bps | 63.8% | 65.1% | -130 bps | |
| Adjusted EBITDA | 772.5 | 819.1 | - 5.7% | 2,062.9 | 2,593.5 | - 20.5% | |
| Adjusted EBITDA Margin | 8.6% | 8.6% | 0 bps | 7.9% | 9.1% | -120 bps | |
| Net Income (loss) attributable to controlling shareholders | (559.8) | 272.9 | -305.1% | (1,969.6) | 352.6 | - 658.7% | |
| Net Margin | -6.2% | 2.9% | -900 bps | -7.6% | 1.2% | -880 bps |
Fabio Barbosa, Group CEO of Natura &Co, declared:
“Natura &Co posted results in line with the expectations we shared with the market in the previous quarter, with top line trending better, while margins continued to be pressured by the challenging macroeconomic environment marked by high inflation, lower discretionary spending, and foreign exchange impacts.
In Q3, Natura &Co Latam posted solid performance, notably the Natura brand and the Avon CFT segment in the region, while Avon International continued to show a sequential improvement in results and in key channel indicators. Aesop delivered another consistent strong quarter with sales growth more than 20% in CC. On the other hand, The Body Shop continued to post challenging results amid channel decline in the At-home segment and slower franchise recovery.
The Group reorganization that we announced last quarter has made good progress. The Transition Committee that was put in place to streamline the corporate structure has completed its work. We are implementing the steps to significantly reduce operating costs at the Holding and to give each brand more autonomy and accountability for results.
Other structural steps are also in motion, aiming to boost our performance. We are accelerating the integration of the Avon and Natura businesses in Latin America, informally known as Wave 2, starting in 2023 with Peru and Colombia, quickly followed by Brazil. In Avon International, we continue to optimize our geographic footprint, with significant changes in markets such as India and Saudi Arabia. We also announced the closing of Avon’s Suffern R&D facility in the US and the outsourcing of Avon’s IT infrastructure, which should result in considerable recurring savings beginning in 2023. The Body Shop has taken steps to rightsize its organization and as announced in the Material fact published on October 17th, we continue to analyse strategic alternatives for Aesop.
Taking into consideration the strategic moves mentioned above, the potential alternatives for Aesop currently under study and our expectations of a continued uncertain macro environment in some markets, we are withdrawing our mid-term guidance1. We will continue to work on the actions we have outlined to deliver sustainable shareholder return and achieve our ambition of making Natura &Co the best beauty company for the world.“
1 Guidance withdrawal announced in the Material fact published November 9th.
1
Key Financial Results per Business Unit
| Q3-22 vs. Q3-21 | 9M-22 vs. 9M-21 | ||||||||||
| Consolidated Financial Results (R$ million) | Net Revenue (R$ million) | ∆ % Reported Currency | ∆ % CC | Adj. EBITDA Margin | ∆ Adj. EBITDA | Net Revenue (R$ million) | ∆ % Reported Currency | ∆ % CC | Adj. EBITDA Margin | ∆ Adj. EBITDA | |
| Consolidated | 9,003.7 | -5.7% | 2.2% | 8.6% | 0 bps | 25,959.4 | -9.0% | -0.6% | 7.9% | -120 bps | |
| Natura & Co. Latam | 5,777.5 | 4.1% | 10.2% | 11.3% | 170 bps | 16,084.1 | -1.1% | 4.7% | 10.5% | -30 bps | |
| Avon International | 1,647.6 | -19.8% | -8.1% | 3.6% | -30 bps | 5,133.3 | -22.5% | -9.9% | 3.7% | -40 bps | |
| The Body Shop | 976.0 | -29.8% | -19.5% | 6.3% | -1170 bps | 2,902.9 | -26.1% | -16.0% | 5.4% | -990 bps | |
| Aesop | 602.6 | 8.9% | 21.5% | 16.8% | -280 bps | 1,839.1 | 8.1% | 22.5% | 17.7% | -480 bps | |
| · | Natura &Co Latam: Q3-22 net revenue up by +4.1% in BRL and by 10.2% in CC, driven by double-digit growth in CC at the Natura brand, partially offset by stable CC sales at Avon Latam and the BRL’s appreciation versus other Latam currencies. |
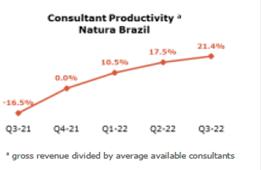
| o | Natura brand in Latam: Net revenue was up +11.0% in Q3-22 in BRL and +18.5% at CC, with strong momentum in Brazil and further growth in Hispanic Latam. In Brazil, net revenue grew +19.3% in Q3-22, supported by further acceleration in consultant productivity (+21.4%), boosted by pricing and a better mix proposition aligned with market demand. In Hispanic Latam, net revenue was up +0.3% in BRL and +17.3% at CC. Growth was mainly driven by Argentina and Colombia. However, excluding Argentina, Hispanic markets’ revenue was down in low single digits at CC, impacted by softer performance from Mexico and a decrease in Chile. |
| o | Avon brand in Latam: Net revenue was down -4.1% in Q3-22 in BRL, but up +0.7% at CC. In Brazil, net revenue continued to improve sequentially, but still decreased by -1.4%. This was mainly due to a reduction in Fashion and Home (“F&H”) sales of -26%, while beauty sales increased by +11% in the quarter, with a double-digit gain in productivity (for beauty only). In Hispanic markets, net revenue deteriorated -5.4% in Q3-22 in BRL, but was up +2.3% at CC, mainly driven by Ecuador and Argentina, but impacted by a decrease in Mexico and Chile. The beauty category grew +9.0% in CC, but was mostly offset by a drop in F&H. |
| o | Natura &Co Latam’s Q3-22 adjusted EBITDA margin was 11.3%, +170bps vs. Q3-21, supported by strong topline performance and strict financial discipline, partially offset by the impact of higher selling expenses increase as a percentage of net revenues, reflecting Natura brand investments, combined with a deteriorating gross margin. This deterioration is mainly due to value-added raw material price dynamics, which are pressured by rising energy prices, wage inflation and FX. |
• Avon International
| o | Q3-22 net revenue was down -19.8% in BRL and -8.1% at CC, mainly impacted by the war in Ukraine; excluding Russia and Ukraine, sales were down a more limited -3.1% at CC. Furthermore, TMEA and APAC regions are showing growth while Western Europe is showing softer performance. Although slightly negative, the sequential improvement versus previous quarters amid a rapid macro deterioration in Europe demonstrates that the new commercial model is moving in the right direction, with continued improvement in rep productivity, digitalization, and top products performance. |
| o | Q3-22 adjusted EBITDA margin stood at 3.6%, a -30 bps decrease YoY, impacted by gross margin dynamic, but partially offset by the acceleration of transformation savings. Excluding Russia and Ukraine Adj. EBITDA margin would have shown a significant improvement YoY. |
| · | The Body Shop |
| o | Q3-22 net revenue was down -29.8% in BRL and -19.5% at CC. Footfall to stores continues to show signs of recovery (store sales +7.7% YoY) though slower than anticipated as inflation and cost of living has impacted consumer confidence. However, this improvement is not currently at a sufficient pace to offset changes in TBS At Home and high product inventory levels held by our franchise partners during the year. That said, positive sell-out sales have allowed partner stock-on-hand levels to approach pre-pandemic levels. |
| o | Q3-22 EBITDA margin was 6.3%, down 11.7 p.p. on a YoY basis, as a consequence of sales deleverage and gross margin pressure, also impacted by input price and FX dynamics. Q3-21 EBITDA margin also had benefited from government support that ended in 2021. |
| · | Aesop |
| o | Q3-22 net revenue increased +8.9% in BRL and +21.5% at CC. All regions delivered double digit YoY growth, except for Europe, which showed high single digit growth, despite a deteriorating macro environment. Retail and wholesale showed solid growth, partially offset by a softer e-commerce performance reflecting consumer behavior normalizing post-Covid. |
| o | Q3-22 adjusted EBITDA margin was 16.8%, -280 bps YoY, pressured as expected by planned investments to deliver sustainable future growth. These investments relate primarily to technology and supply chain enhancements and to the preparation for Aesop’s upcoming China market entry. |
2
1. Results analysis
The Group segmentation is composed of:
· Natura &Co Latam, which includes all the brands in Latin America: Natura, Avon, The Body Shop and Aesop
· Avon international, which includes all markets, excluding Latin America
· The Body Shop ex-Latin America, and
· Aesop ex-Latin America
In addition, the results and analysis for the periods under comparison include the effects of the fair market value assessment as a result of the business combination with Avon as per the Purchase Price Allocation – PPA
|  |
| Profit and Loss by Business | |||||||||||||||
| Consolidateda | Natura &Co Latam footnote: b | Avon International | The Body Shop | Aesop | |||||||||||
| R$ million | Q3-22c | Q3-21c | Ch. % | Q3-22c | Q3-21c | Ch. % | Q3-22c | Q3-21c | Ch. % | Q3-22 | Q3-21 | Ch. % | Q3-22 | Q3-21 | Ch. % |
| Gross Revenue | 11,693.3 | 12,329.2 | (5.2) | 7,700.0 | 7,409.2 | 3.9 | 1,965.1 | 2,460.0 | (20.1) | 1,351.8 | 1,841.5 | (26.6) | 676.4 | 618.4 | 9.4 |
| Net Revenue | 9,003.7 | 9,549.2 | (5.7) | 5,777.5 | 5,551.5 | 4.1 | 1,647.6 | 2,053.7 | (19.8) | 976.0 | 1,390.6 | (29.8) | 602.6 | 553.4 | 8.9 |
| COGS | (3,229.7) | (3,313.1) | (2.5) | (2,280.7) | (2,158.9) | 5.6 | (665.6) | (794.3) | (16.2) | (231.0) | (309.5) | (25.4) | (52.3) | (50.4) | 3.7 |
| Gross Profit | 5,774.1 | 6.236.2 | (7.4) | 3,496.7 | 3,392.6 | 3.1 | 982.0 | 1,259.5 | (22.0) | 745.0 | 1,081.1 | (31.1) | 550.2 | 503.0 | 9.4 |
| Selling, Marketing and Logistics Expenses | (4,119.9) | (4,288.3) | (3.9) | (2,406.7) | (2,293.7) | 4.9 | (748.9) | (945.9) | (20.8) | (608.6) | (737.2) | (17.4) | (355.5) | (311.6) | 14.1 |
| Administrative, R&D, IT and Projects Expenses | (1,474.7) | (1,655.4) | (10.9) | (710.8) | (784.9) | (9.4) | (314.6) | (420.1) | (25.1) | (245.7) | (287.3) | (14.5) | (173.8) | (152.3) | 14.1 |
| Corporate Expenses | (72.5) | (142.3) | (49.1) | - | - | - | - | - | - | - | - | - | - | - | - |
| Other Operating Income/ (Expenses), Net | 22.6 | 244.6 | (90.8) | 58.1 | 247.7 | (76.5) | (19.6) | (7.4) | 164.5 | 1.8 | 2.7 | (33.7) | (17.7) | 0.1 | (17,837.6) |
| Transformation / Integration / Group Restructuring Costs | (162.4) | (105.1) | 54.5 | (64.1) | (51.7) | 24.1 | (88.9) | (44.1) | 101.6 | - | - | - | - | - | - |
| Depreciation | 622.3 | 664.4 | (6.3) | 214.3 | 209.3 | 2.4 | 160.9 | 194.7 | (17.4) | 169.3 | 191.3 | (11.5) | 77.8 | 69.0 | 12.7 |
| EBITDA | 589.5 | 953.9 | (38.2) | 587.5 | 719.4 | (18.3) | (29.2) | 36.7 | (179.6) | 61.8 | 250.6 | (75.3) | 81.0 | 108.2 | (25.2) |
| Depreciation | (622.3) | (664.4) | (6.3) | ||||||||||||
| Financial Income/(Expenses), Net | (563.9) | (293.0) | 92.4 | ||||||||||||
| Earnings Before Taxes | (596.8) | (3.5) | 17,048.4 | ||||||||||||
| Income Tax and Social Contribution | 112.8 | 312.0 | (63.8) | ||||||||||||
| Discontinued operationsd | (75.5) | (38.9) | 94.1 | ||||||||||||
| Consolidated Net Income | (559.5) | 269.6 | (307.5) | ||||||||||||
| Non-controlling Interest | (0.3) | 3.3 | (109.2) | ||||||||||||
| Net Income attributable to controlling shareholders | (559.8) | 272.9 | (305.1) | ||||||||||||
| Gross Margin | 64.1% | 65.3% | -120 bps | 60.5% | 61.1% | -60 bps | 59.6% | 61.3% | -170 bps | 76.3% | 77.7% | -140 bps | 91.3% | 90.9% | 40 bps |
| Selling, Marketing and Logistics Exp./Net Revenue | 45.8% | 44.9% | 90 bps | 41.7% | 41.3% | 40 bps | 45.5% | 46.1% | -60 bps | 62.4% | 53.0% | 940 bps | 59.0% | 56.3% | 270 bps |
| Admin., R&D, IT, and Projects Exp./Net Revenue | 16.4% | 17.3% | -90 bps | 12.3% | 14.1% | -180 bps | 19.1% | 20.5% | -140 bps | 25.2% | 20.7% | 450 bps | 28.8% | 27.5% | 130 bps |
| EBITDA Margin | 6.5% | 10.0% | -350 bps | 10.2% | 13.0% | -280 bps | (1.8)% | 1.8% | -360 bps | 6.3% | 18.0% | -1170 bps | 13.4% | 19.6% | -620 bps |
| Net Margin | (6.2)% | 2.8% | -900 bps | - | - | - | - | - | - | - | - | - | - | - | - |
a Consolidated results include Natura & Co Latam, Avon International, The Body Shop and Aesop, as well as the Natura subsidiaries in the U.S., France and the Netherlands.
b Natura & Co Latam: includes Natura, Avon, TBS Brazil and Hispanic Latam and Aesop Brazil
c Includes PPA – Purchase Price Allocation effects
d Related to business separation at Avon North America
| Profit and Loss by Business | |||||||||||||||
| Consolidateda | Natura &Co Latamb | Avon International | The Body Shop | Aesop | |||||||||||
| R$ million | 9M-22c | 9M-21c | Ch. % | 9M-22c | 9M-21c | Ch. % | 9M-22c | 9M-21c | Ch. % | 9M-22 | 9M-21 | Ch. % | 9M-22 | 9M-21 | Ch. % |
| Gross Revenue | 33,607.0 | 36,619.9 | (8.2) | 21,271.1 | 21,612.9 | (1.6) | 6,272.2 | 7,940.5 | (21.0) | 3,999.2 | 5,165.1 | (22.6) | 2,064.5 | 1,901.4 | 8.6 |
| Net Revenue | 25,959.4 | 28,521.5 | (9.0) | 16,084.1 | 16,271.1 | (1.1) | 5,133.3 | 6,621.2 | (22.5) | 2,902.9 | 3,927.9 | (26.1) | 1,839.1 | 1,701.3 | 8.1 |
| COGS | (9,392.1) | (9,953.8) | (5.6) | (6,469.9) | (6,383.4) | 1.4 | (2,088.4) | (2,582.7) | (19.1) | (658.7) | (832.6) | (20.9) | (175.2) | (155.2) | 12.9 |
| Gross Profit | 16,567.3 | 18,567.6 | (10.8) | 9,614.2 | 9,887.7 | (2.8) | 3,045.0 | 4,038.5 | (24.6) | 2,244.1 | 3,095.3 | (27.5) | 1,664.0 | 1,546.1 | 7.6 |
| Selling, Marketing and Logistics Expenses | (11,825.8) | (12,791.4) | (7.5) | (6,566.2) | (6,610.0) | (0.7) | (2,359.8) | (3,015.6) | (21.7) | (1,880.9) | (2,257.0) | (16.7) | (1,018.9) | (907.7) | 12.1 |
| Administrative, R&D, IT and Projects Expenses | (4,390.0) | (4,832.9) | (9.2) | (2,136.2) | (2,169.0) | (1.5) | (980.3) | (1,379.5) | (28.9) | (709.2) | (790.3) | (10.3) | (536.3) | (472.6) | 13.5 |
| Corporate Expenses | (270.3) | (401.9) | (32.7) | - | - | - | - | - | - | - | - | - | - | - | - |
| Other Operating Income/ (Expenses), Net | 137.3 | 232.4 | (40.9) | 114.1 | 251.7 | (54.7) | 91.1 | (8.2) | (1,211.0) | (44.7) | (17.7) | 152.3 | (26.1) | 3.5 | (853.7) |
| Transformation / Integration / Group Restructuring Costs | (523.9) | (420.5) | 24.6 | (199.3) | (145.5) | 37.0 | (154.7) | (246.5) | (37.2) | - | - | - | - | - | - |
| Depreciation | 1,901.3 | 2,059.6 | (7.7) | 659.8 | 638.5 | 3.3 | 507.8 | 635.2 | (20.1) | 511.3 | 571.6 | (10.6) | 222.2 | 214.3 | 3.7 |
| EBITDA | 1,595.9 | 2,413.0 | (33.9) | 1,486.5 | 1,853.6 | (19.8) | 149.1 | 24.0 | 522.1 | 120.7 | 601.9 | (79.9) | 304.9 | 382.5 | (20.3) |
| Depreciation | (1,901.3) | (2,059.6) | (7.7) | ||||||||||||
| Financial Income/(Expenses), Net | (1,377.3) | (726.4) | 89.6 | ||||||||||||
| Earnings Before Taxes | (1,682.6) | (373.1) | 351.0 | ||||||||||||
| Income Tax and Social Contribution | (104.8) | 749.3 | (114.0) | ||||||||||||
| Discontinued operationsd | (181.2) | (30.9) | 485.8 | ||||||||||||
| Consolidated Net Income | (1,968.6) | 345.3 | (670.1) | ||||||||||||
| Non-controlling Interest | (1.0) | 7.3 | (113.8) | ||||||||||||
| Net Income attributable to controlling shareholders | (1,969.6) | 352.6 | (658.7) | ||||||||||||
| Gross Margin | 63.8% | 65.1% | -130 bps | 59.8% | 60.8% | -100 bps | 59.3% | 61.0% | -170 bps | 77.3% | 78.8% | -150 bps | 90.5% | 90.9% | -40 bps |
| Selling, Marketing and Logistics Exp./Net Revenue | 45.6% | 44.8% | 80 bps | 40.8% | 40.6% | 20 bps | 46.0% | 45.5% | 50 bps | 64.8% | 57.5% | 730 bps | 55.4% | 53.4% | 200 bps |
| Admin., R&D, IT, and Projects Exp./Net Revenue | 16.9% | 16.9% | 0 bps | 13.3% | 13.3% | 0 bps | 19.1% | 20.8% | -170 bps | 24.4% | 20.1% | 430 bps | 29.2% | 27.8% | 140 bps |
| EBITDA Margin | 6.1% | 8.5% | -240 bps | 9.2% | 11.4% | -220 bps | 2.9% | 0.4% | 250 bps | 4.2% | 15.3% | -1110 bps | 16.6% | 22.5% | -590 bps |
| Net Margin | (7.6)% | 1.2% | -880 bps | - | - | - | - | - | - | - | - | - | - | - | - |
a Consolidated results include Natura & Co Latam, Avon International, The Body Shop and Aesop, as well as the Natura subsidiaries in the U.S., France and the Netherlands.
b Natura & Co Latam: includes Natura, Avon, TBS Brazil and Hispanic Latam and Aesop Brazil
c Includes PPA – Purchase Price Allocation effects
d Related to business separation at Avon North America
3
Consolidated net revenue
| · | Q3-22 consolidated net revenue was down -5.7% in BRL (+2.2% at CC), reflecting strong growth at the Natura brand and Aesop and improving trends at the Avon brand, but more than offset by The Body Shop’s decline |
| · | Q3 revenue from G12 market currencies at CC totaled 21.3% in Q3-22 vs 21.7% in Q3-21 (G12 market currencies are: GBP, EUR, USD, AUD, YEN, CAD, SEK and CHF) |
| · | With operations in 100+ countries, 41% of net revenue came from outside Latam year-to-date |
Digital Sales
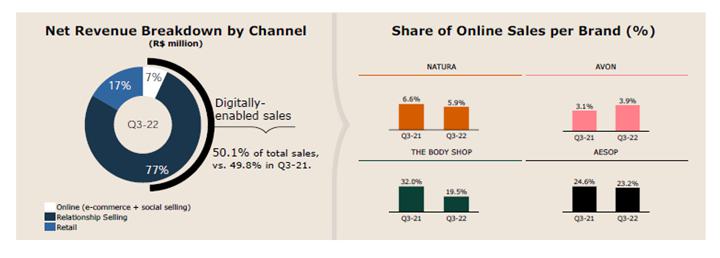
Digitally-enabled sales, which include online sales (e-commerce + social selling) and relationship selling using our main digital apps reached 50.1% of total net revenue, compared to 49.8% in Q3-21, with improving digital exposure at Natura and Avon.
Relationship selling using apps: At Avon International, penetration of the Avon On app (active representatives who logged in at least once in the last three campaigns) reached 19.7% in Q3-22, compared to nearly 13.7% in Q3-21. At Natura in Latam, the average number of consultants sharing content increased to 28.6% this quarter, compared to 23.9% in Q3-21, while orders through the 1.5 million+ consultant online stores increased by 15% in the region.
Gross margin
| · | Consolidated gross margin stood at 64.1% in Q3-22, -120 bps vs. Q3-21 (for both metrics, excluding and including PPA effect) |
| · | Gross margin was mainly impacted by continued pressure on profitability at Natura &Co Latam, Avon international and The Body Shop, which more than offset the slight improvement at Aesop |
| · | Although some commodity prices are recently showing a deflationary trend, Natura &Co buys the value-added material. The input prices are correlated to commodity prices, but that dynamic has been more than offset by rising energy prices and inflation as a whole (especially on wages) |
| · | Furthermore, although the BRL has been showing a more stable trend, FX also continues to impact COGS given the exposure to other currencies (especially GBP and other Latin America currencies) |
| · | Finally, the cost cycle and inventory turnover will continue to have an impact on COGS given the time lag between new purchases and sale of products |
4
Q3-22: excluding PPA effects at Natura &Co Latam and Avon International
| Consolidated | Natura &Co Latam | Avon International | The Body Shop | Aesop | |||||||||||
| R$ million | Q3-22 | Q3-21 | Ch. % | Q3-22 | Q3-21 | Ch. % | Q3-22 | Q3-21 | Ch. % | Q3-22 | Q3-21 | Ch. % | Q3-22 | Q3-21 | Ch. % |
| Net Revenue | 9,003.7 | 9,549.2 | (5.7) | 5,777.5 | 5,551.5 | 4.1 | 1,647.6 | 2,053.7 | (19.8) | 976.0 | 1,390.6 | (29.8) | 602.6 | 553.4 | 8.9 |
| COGS | (3,229.7) | (3,313.1) | (2.5) | (2,280.7) | (2,158.9) | 5.6 | (665.6) | (794.3) | (16.2) | (231.0) | (309.5) | (25.4) | (52.3) | (50.4) | 3.7 |
| Gross Profit | 5,774.0 | 6.236.2 | (7.4) | 3,496.8 | 3,392.6 | 3.1 | 982.0 | 1,259.5 | (22.0) | 745.0 | 1,081.1 | (31.1) | 550.3 | 503.0 | 9.4 |
| Gross Margin | 64.1% | 65.3% | -120 bps | 60.5% | 61.1% | -60 bps | 59.6% | 61.3% | -170 bps | 76.3% | 77.7% | -140 bps | 91.3% | 90.9% | 40 bps |
| PPA effect on COGS | (2.1) | (0.4) | 425.0 | (0.6) | (0.4) | 50.0 | (1.4) | 0.0 | - | - | - | - | - | - | - |
| Gross Profit ex PPA | 5,776.1 | 6,236.6 | (7.4) | 3,497.4 | 3,393.0 | 3.1 | 983.4 | 1,259.5 | (21.9) | 745.0 | 1,081.1 | (31.1) | 550.3 | 503.0 | 9.4 |
| Gross Margin ex PPA | 64.1% | 65.3% | -120 bps | 60.5% | 61.1% | -60 bps | 59.7% | 61.3% | -160 bps | 76.3% | 77.7% | -140 bps | 91.3% | 90.9% | 40 bps |
9M-22: excluding PPA effects at Natura &Co Latam and Avon International
| Consolidated | Natura &Co Latam | Avon International | The Body Shop | Aesop | |||||||||||
| R$ million | 9M-22 | 9M-21 | Ch. % | 9M-22 | 9M-21 | Ch. % | 9M-22 | 9M-21 | Ch. % | 9M-22 | 9M-21 | Ch. % | 9M-22 | 9M-21 | Ch. % |
| Net Revenue | 25,959.4 | 28,521.5 | (9.0) | 16,084.1 | 16,271.1 | (1.1) | 5,133.3 | 6,621.2 | (22.5) | 2,902.9 | 3,927.9 | (26.1) | 1,839.1 | 1,701.3 | 8.1 |
| COGS | (9,392.1) | (9,953.8) | (5.6) | (6,469.9) | (6,383.4) | 1.4 | (2,088.4) | (2,582.7) | (19.1) | (658.7) | (832.6) | (20.9) | (175.2) | (155.2) | 12.9 |
| Gross Profit | 16,567.3 | 18,567.6 | (10.8) | 9,614.2 | 9,887.7 | (2.8) | 3,044.9 | 4,038.5 | (24.6) | 2,244.2 | 3,095.3 | (27.5) | 1,663.9 | 1,546.1 | 7.6 |
| Gross Margin | 63.8% | 65.1% | -130 bps | 59.8% | 60.8% | -100 bps | 59.3% | 61.0% | -170 bps | 77.3% | 78.8% | -150 bps | 90.5% | 90.9% | -40 bps |
| PPA effect on COGS | (5.7) | (23.2) | (75.4) | (1.7) | (9.4) | (81.9) | (4.0) | (13.9) | (71.2) | - | - | - | - | - | - |
| Gross Profit ex PPA | 16,573.0 | 18,590.8 | (10.9) | 9,615.9 | 9,897.1 | (2.8) | 3,048.9 | 4,052.4 | (24.8) | 2,244.2 | 3,095.3 | (27.5) | 1,663.9 | 1,546.1 | 7.6 |
| Gross Margin ex PPA | 63.8% | 65.2% | -140 bps | 59.8% | 60.8% | -100 bps | 59.4% | 61.2% | -180 bps | 77.3% | 78.8% | -150 bps | 90.5% | 90.9% | -40 bps |
Operating Expenses
| · | Excluding PPA effects, consolidated Selling, Marketing & Logistics expenses reached 45.0% of net revenue (+80 bps vs. Q3-21) |
| · | Excluding PPA effects, consolidated Administrative, R&D, IT and Project expenses reached 15.6% of net revenue, (-100 bps vs Q3-21) |
| · | Excluding PPA effects, SG&A expenses (both lines above combined) decreased by -20 bps in Q3-22 on a YoY basis, benefiting from financial discipline across all businesses, with a focus on improving efficiency and simplifying the business model, but partially offset by sales deleverage impact at The Body Shop and Aesop’s planned investments for long-term sustainable growth |
| · | Corporate expenses stood at BRL 73 million, down an impressive 49.1% vs. Q3-21, benefiting from the initiatives implemented by the Transition Committee (aiming at a simpler and leaner structure) and BRL 25 million in cost containment and phasing effect of expenses |
| · | Other operating income/expenses were BRL 23 million (down from BRL 245 million in Q3-21), mostly impacted by lower other income at Natura &Co Latam, which benefited in the same period of 2021 from tax credit recoveries |
| · | Transformation / Integration / Group Restructuring costs were BRL 163 million, up +54.5% mainly impacted by the outsourcing of Avon’s IT infrastructure |
Q3-22: excluding PPA effects at Natura &Co Latam and Avon International
| Consolidated | Natura &Co Latam | Avon International | The Body Shop | Aesop | |||||||||||
| SG&A Expenses (R$ million) | Q3-22 | Q3-21 | Ch. % | Q3-22 | Q3-21 | Ch. % | Q3-22 | Q3-21 | Ch. % | Q3-22 | Q3-21 | Ch. % | Q3-22 | Q3-21 | Ch. % |
| Selling, Marketing and Logistics Expenses | (4,119.9) | (4,288.3) | (3.9) | (2,406.7) | (2,293.7) | 4.9 | (748.9) | (945.9) | (20.8) | (608.6) | (737.2) | (17.4) | (355.5) | (311.6) | 14.1 |
| Administrative, R&D, IT and Projects Expenses | (1,474.7) | (1,655.4) | (10.9) | (710.8) | (784.9) | (9.4) | (314.6) | (420.1) | (25.1) | (245.7) | (287.3) | (14.5) | (173.8) | (152.3) | 14.1 |
| SG& A Expenses | (5,594.6) | (5,943.8) | (5.9) | (3,117.5) | (3,078.6) | 1.3 | (1,063.5) | (1,366.0) | (22.1) | (854.3) | (1,024.5) | (16.6) | (529.3) | (463.9) | 14.1 |
| Selling, Marketing and Logistics Expenses (% of Net Revenue) | 45.8% | 44.9% | 90 bps | 41.7% | 41.3% | 40 bps | 45.5% | 46.1% | -60 bps | 62.4% | 53.0% | 940 bps | 59.0% | 56.3% | 270 bps |
| Admin, R&D, IT and Projects Exp. (% of Net Revenue) | 16.4% | 17.3% | -90 bps | 12.3% | 14.1% | -180 bps | 19.1% | 20.5% | -140 bps | 25.2% | 20.7% | 450 bps | 28.8% | 27.5% | 130 bps |
| SG&A Expenses ex-PPA | (5,462.8) | (5,807.5) | (5.9) | (3,086.3) | (3,057.6) | 0.9 | (963.1) | (1,250.8) | (23.0) | (854.3) | (1,024.5) | (16.6) | (529.3) | (463.9) | 14.1 |
| Selling, Marketing and Logistics ex-PPA (% of Net Revenue) | 45.0% | 44.2% | 80 bps | 41.1% | 40.7% | 40 bps | 43.5% | 44.3% | -80 bps | 62.4% | 53.0% | 940 bps | 59.0% | 56.3% | 270 bps |
| Admin, R&D, IT and Projects Exp. (% of Net Revenue) | 15.6% | 16.6% | -100 bps | 12.3% | 14.3% | -200 bps | 15.0% | 16.6% | -160 bps | 25.2% | 20.7% | 450 bps | 28.8% | 27.5% | 130 bps |
9M-22: excluding PPA effects at Natura &Co Latam and Avon International
| Consolidated | Natura &Co Latam | Avon International | The Body Shop | Aesop | |||||||||||
| SG&A Expenses (R$ million) | 9M-22 | 9M-21 | Ch. % | 9M-22 | 9M-21 | Ch. % | 9M-22 | 9M-21 | Ch. % | 9M-22 | 9M-21 | Ch. % | 9M-22 | 9M-21 | Ch. % |
| Selling, Marketing and Logistics Expenses | (11,825.8) | (12,791.4) | (7.5) | (6,566.2) | (6,610.0) | (0.7) | (2,359.8) | (3,015.6) | (21.7) | (1,880.9) | (2,257.0) | (16.7) | (1,018.9) | (908.7) | 12.1 |
| Administrative, R&D, IT and Projects Expenses | (4,390.0) | (4,832.9) | (9.2) | (2,136.2) | (2,169.0) | (1.5) | (980.3) | (1,379.5) | (28.9) | (709.2) | (790.3) | (10.3) | (536.3) | (472.6) | 13.5 |
| SG& A Expenses | (16,215.8) | (17,624.3) | (8.0) | (8,702.4) | (8,779.0) | (0.9) | (3,340.1) | (4,395.1) | (24.0) | (2,590.1) | (3,047.3) | (15.0) | (1,555.2) | (1,381.3) | 12.6 |
| Selling, Marketing and Logistics Expenses (% of Net Revenue) | 45.6% | 44.8% | 80 bps | 40.8% | 40.6% | 20 bps | 46.0% | 45.5% | 50 bps | 64.8% | 57.5% | 730 bps | 55.4% | 53.4% | 200 bps |
| Admin, R&D, IT and Projects Exp. (% of Net Revenue) | 16.9% | 16.9% | 0 bps | 13.3% | 13.3% | 0 bps | 19.1% | 20.8% | -170 bps | 24.4% | 20.1% | 430 bps | 29.2% | 27.8% | 140 bps |
| SG&A Expenses ex-PPA | (16,021.9) | (17,175.2) | (6.7) | (8,607.4) | (8,693.8) | (1.0) | (3,241.1) | (4,031.2) | (19.6) | (2,590.1) | (3,047.3) | (15.0) | (1,555.2) | (1,381.3) | 12.6 |
| Selling, Marketing and Logistics ex-PPA (% of Net Revenue) | 44.8% | 44.1% | 70 bps | 40.2% | 40.0% | 20 bps | 44.0% | 43.7% | 30 bps | 64.8% | 57.5% | 730 bps | 55.4% | 53.4% | 200 bps |
| Admin, R&D, IT and Projects Exp. (% of Net Revenue) | 16.9% | 16.1% | 80 bps | 13.3% | 13.4% | -10 bps | 19.1% | 17.2% | 190 bps | 24.4% | 20.1% | 430 bps | 29.2% | 27.8% | 140 bps |
Consolidated EBITDA
Q3-22 Adjusted EBITDA was BRL772 million, with an adjusted margin of 8.6% (stable YoY). Q3-22 margin reflected different moving parts and dynamics for each business unit and at the Holding level:
| · | improving margin at Natura &Co Latam, driven by strong top line performance and strict cost control |
| · | significant improvement of Holding expenses (-49.1% on a YoY basis) |
| · | sales deleverage at The Body Shop |
| · | Aesop’s planned investments for sustainable future growth |
| · | slight margin pressure from Avon International (mostly impacted by Russia/Ukraine) |
5
Q3-22: Adjusted EBITDA
| Consolidated EBITDA | Natura &Co Latam | Avon International | The Body Shop | Aesop | |||||||||||
| R$ million | Q3-22 | Q3-21 | Ch. % | Q3-22 | Q3-21 | Ch. % | Q3-22 | Q3-21 | Ch. % | Q3-22 | Q3-21 | Ch. % | Q3-22 | Q3-21 | Ch. % |
| Consolidated EBITDA | 589.5 | 953.9 | (38.2) | 587.5 | 719.4 | (18.3) | (29.2) | 36.7 | (179.6) | 61.8 | 250.6 | (75.3) | 81.0 | 108.2 | (25.2) |
| Transformation / Integration Costs (1) | 162.4 | 105.1 | 54.5 | 64.1 | 51.7 | 24.1 | 88.9 | 44.1 | 101.6 | - | - | - | - | - | - |
| (i) Transformation costs | 88.9 | 47.6 | 86.7 | - | - | - | 88.9 | 44.1 | 101.6 | - | - | - | - | - | - |
| (ii) Integ ration costs | 66.9 | 57.5 | 16.3 | 64.1 | 51.7 | 24.0 | - | - | - | - | - | - | - | - | - |
| (iii) Group Restructuring Cost | 6.7 | - | - | - | - | - | - | - | - | - | - | - | - | - | - |
| Tax credits, recoveries and provision reversal | - | (240.0) | (100.0) | - | (240.0) | (100.0) | - | - | - | - | - | - | - | - | - |
| Net non-recurring other (income)/ expenses | 20.5 | - | - | - | - | - | - | - | - | - | - | - | 20.5 | - | - |
| Adjusted EBITDA | 772.5 | 819.1 | (5.7) | 651.6 | 531.1 | 22.7 | 59.7 | 80.8 | (26.1) | 61.8 | 250.6 | (75.3) | 101.5 | 108.2 | (6.2) |
| Adjusted EBITDA Margin | 8.6% | 8.6% | 0 bps | 11.3% | 9.6% | 170 bps | 3.6% | 3.9% | -30 bps | 6.3% | 18.0% | -1170 bps | 16.8% | 19.6% | -280 bps |
9M-22: Adjusted EBITDA
| Consolidated EBITDA | Natura &Co Latam | Avon International | The Body Shop | Aesop | |||||||||||
| R$ million | 9M-22 | 9M-21 | Ch. % | 9M-22 | 9M-21 | Ch. % | 9M-22 | 9M-21 | Ch. % | 9M-22 | 9M-21 | Ch. % | 9M-22 | 9M-21 | Ch. % |
| Consolidated EBITDA | 1,595.9 | 2,413.0 | (33.9) | 1,486.5 | 1,853.6 | (19.8) | 149.1 | 24.0 | 522.1 | 120.7 | 601.9 | (79.9) | 304.9 | 382.5 | (20.3) |
| Transformation / Integration Costs | 523.9 | 420.5 | 24.6 | 199.3 | 145.5 | 37.0 | 154.7 | 246.5 | (37.2) | - | - | - | - | - | - |
| (i) Transformation costs | 154.7 | 252.4 | (38.7) | - | - | - | 154.7 | 246.5 | (37.2) | - | - | - | - | - | - |
| (ii) Integration costs | 211.4 | 168.1 | 25.8 | 199.3 | 145.5 | 37.0 | - | - | - | - | - | - | - | - | - |
| (iii) Group Restructuring Cost | 157.7 | - | - | - | - | - | - | - | - | - | - | - | - | - | - |
| Tax credits, recoveries and provision reversal | - | (240.0) | (100.0) | - | (240.0) | (100.0) | - | - | - | - | - | - | - | - | - |
| Net non-recurring other (income)/ expenses(1) | (56.9) | - | - | - | - | - | (113.7) | - | - | 36.3 | - | - | 20.5 | - | - |
| Adjusted EBITDA | 2,062.9 | 2,593.5 | (20.5) | 1,685.8 | 1,759.1 | (4.2) | 190.2 | 270.5 | (29.7) | 157.0 | 601.9 | (73.9) | 325.4 | 382.5 | (14.9) |
| Adjusted EBITDA Margin | 7.9% | 9.1% | -120 bps | 10.5% | 10.8% | -30 bps | 3.7% | 4.1% | -40 bps | 5.4% | 15.3% | -990 bps | 17.7% | 22.5% | -480bps |
(1) Net non-recurring other (income)/expenses: Net effect of gain from the favorable settlement of a legal dispute at Avon International, costs associated with The Body Shop’s suspension of operations in Russia and expenses related to studies on a potential Aesop transaction.
Financial income and expenses
The following table details the main changes in our financial income and expenses:
| R$ million | Q3-22 | Q3-21 | Ch. % | 9M-22 | 9M-21 | Ch % |
| 1. Financing, Short-Term Investments and Derivatives Gains (Losses) | (164.4) | (115.1) | 42.8 | (505.2) | (149.4) | 238.2 |
| 1.1 Financial Expenses | (192.2) | (170.2) | 12.9 | (519.1) | (481.9) | 7.7 |
| 1.2 Financial Income | 139.2 | 101.8 | 36.7 | 330.4 | 199.1 | 65.9 |
| 1.3 Foreign Exchange Variations from Financing Activities, Net | (167.4) | (456.0) | (63.3) | 207.8 | (102.1) | (303.5) |
| 1.4 Gains (Losses) on Foreign Exchange Derivatives from Financing Activities, Net | 151.9 | 460.1 | (67.0) | (212.9) | 121.0 | (276.0) |
| 1.5 Gains (Losses) on Interest Rate Derivatives and Other Operating Derivatives, Net | (95.9) | (50.8) | 88.8 | (311.4) | 114.5 | (372.0) |
| 2. Judicial Contingencies | (43.6) | (25.2) | 73.0 | (67.1) | (51.1) | 31.3 |
| 3. Other Financial Income and (Expenses) | (355.9) | (152.7) | 133.1 | (805.0) | (525.9) | 53.1 |
| 3.1 Lease Expenses | (48.1) | (45.3) | 6.2 | (143.2) | (151.3) | (5.4) |
| 3.2 Other | (32.3) | (61.4) | (47.4) | (216.1) | (355.8) | (39.3) |
| 3.3 Other Gains (Losses) From Hyperinflation and Foreign Exchange Variations on Operating Activities | (275.5) | (46.0) | 498.9 | (445.7) | (18.8) | 2,270.7 |
| Financial Income and Expenses, Net | (563.9) | (293.0) | 92.5 | (1,377.3) | (726.4) | 89.6 |
| · | Net financial expenses were BRL-564 million in Q3-22, up +92.5% vs. Q3-21 (or up BRL -271 million on a YoY basis), due mainly to the following effects: |
| o | Item 1.5 – in Q3-22 expenses were BRL -96 million vs. BRL -51 million in Q3-21, worsening by BRL -45 million. The increase in expenses is related to a higher CDI rate, which led to losses on derivates related to the interest rate on hedge debts, mainly on the 2028 Sustainability-Linked bond |
Item 3.3 – in Q3-22 the expenses were BRL -276 million compared to BRL – 46 million in the same period of 2022 (varying by BRL -230 million on a YoY basis). Higher losses from exchange rate variation impacting the company’s WK (mostly due to the depreciation of the GBP and ARG in Q3-22) and to increased inflation in Argentina and Turkey
Underlying net income (UNI) and net income
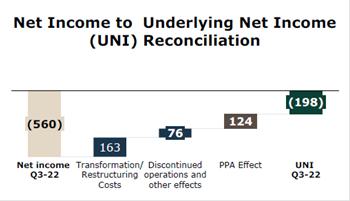 | Q3-22 reported net loss was BRL -560 million, compared to net income of BRL +273 million in Q3-21, driven mainly by lower EBITDA and higher net financial expenses, partly offset by some tax credits associated to Brazil’s tax on foreign income related to 2021. Q3-21 net income had also benefitted from even higher tax gains related to credit recoveries in Brazil.
|
6
Free cash flow and cash position
| R$ million | Q3-22 | Q3-21 | Ch. % | 9M-22 | 9M-21 | Ch % |
| Net income (loss) | (559.5) | 269.6 | (307.5) | (1,968.6) | 345.3 | (670.1) |
| Depreciation and amortization | 622.3 | 656.4 | (5.2) | 1,901.3 | 2,051.7 | (7.3) |
| Non-cash Adjustments to Net Income | 333.0 | (440.3) | (175.6) | 1,967.0 | (196.6) | (1,100.7) |
| Adjusted Net income | 395.9 | 485.7 | (18.5) | 1,900.0 | 2,200.4 | (13.7) |
| Decrease / (Increase) in Working Capital | 352.1 | (268.0) | (231.4) | (1,463.4) | (2,841.7) | (48.5) |
| Inventories | (92.8) | (604.2) | (84.6) | (284.0) | (1,627.6) | (82.6) |
| Accounts receivable | (242.4) | (382.3) | (36.6) | (344.0) | (563.2) | (38.9) |
| Accounts payable | 190.8 | (185.7) | (202.8) | (450.4) | (445.7) | 1.1 |
| Other assets and liabilities | 496.5 | 904.2 | (45.1) | (385.0) | (205.2) | 87.6 |
| Income tax and social contribution | (157.4) | (77.0) | 104.4 | (499.4) | (425.9) | 17.3 |
| Interest on debt | (210.4) | (230.2) | (8.6) | (573.0) | (657.0) | (12.8) |
| Lease payments | (302.4) | (324.9) | (6.9) | (906.9) | (1,010.2) | (10.2) |
| Other operating activities | 49.4 | (156.4) | (131.6) | (306.2) | 44.8 | (783.8) |
| Cash from Operations | 127.1 | (570.7) | (122.3) | (1,848.8) | (2,689.7) | (31.3) |
| Capex | (245.1) | (243.6) | 0.6 | (768.2) | (883.4) | (13.0) |
| Sale of Assets | 0.4 | 84.7 | (99.6) | 4.1 | 98.0 | (95.8) |
| Exchange rate variation | (11.4) | 187.1 | (106.1) | (312.7) | 171.0 | (282.8) |
| Free Cash Flow | (129.0) | (542.5) | (76.2) | (2,925.6) | (3,304.0) | (11.5) |
| Other financing and investing activities | 338.0 | (907.9) | (137.2) | 2,171.0 | 536.7 | 304.5 |
| Cash Balance Variation | 208.0 | (1,450.4) | (114.3) | (755.0) | (2,767.3) | (72.7) |
In Q3-22, free cash flow was an outflow of BRL 129 million, but free cash flow to firm was virtually flat this quarter. In Q3-22 Free cash flow improved by BRL 414 million versus Q3-21, mostly due to working capital management efforts across the Company and other operating activities mainly related to release of judicial deposits. Cash flow from operations was positive BRL 127 million in the quarter.
Improvement in working capital, which was BRL +352 million, is mainly explained by:
| o | Inventories, which despite the Q3 seasonality (building inventory for holiday season), were only BRL -93 million (vs. BRL -604 million in the same period of 2021), demonstrating management efforts to improve inventory efficiency |
| o | Accounts payable, which added BRL +191 million (compared to BRL -186 million in Q3-21) due to company focus on improving days of payables and implementation of strategic actions |
| o | Other assets and liabilities, which contributed BRL +497 million, mainly due to lower advance to suppliers |
Management is strongly focused on optimizing cash conversion and will continue to work on: (i) improving working capital management, (ii) thorough capital allocation and CAPEX optimization, and (iii) continued improvement cash tax rate.
Indebtedness ratios at both Natura &Co Holding and Natura Cosméticos
| Natura Cosméticos S.A. | Natura &Co Holding S.A. | |||
| R$ million | Q3-22 | Q3-21 | Q3-22 | Q3-21 |
| Short-Term | 320.5 | 924.6 | 429.3 | 1,155.7 |
| Long-Term | 7,814.0 | 7,463.6 | 12,971.5 | 11,133.1 |
| Gross Debta | 8,134.5 | 8,388.2 | 13,400.8 | 12,288.8 |
| Foreign currency hedging (Swaps) b | 59.2 | (229.9) | 52.2 | (229.9) |
| Total Gross Debt | 8,193.8 | 8,158.3 | 13,453.0 | 12,058.9 |
| (-) Cash, Cash Equivalents and Short-Term Investment c | (3,022.6) | (3,737.6) | (4,629.5) | (5,358.9) |
| (=) Net Debt | 5,171.2 | 4,420.7 | 8,823.5 | 6,699.9 |
| Indebtedness ratio excluding IFRS 16 effects | ||||
| Net Debt/EBITDA | 1.88x | 1.84x | 4.15x | 2.74x |
| Total Debt/EBITDA | 2.97x | 3.40x | 6.33x | 4.94x |
| Indebtedness ratio excluding IFRS 16 effects | ||||
| Net Debt/EBITDA | 1.49x | 1.32x | 2.85x | 1.83x |
| Total Debt/EBITDA | 2.36x | 2.43x | 4.35x | 3.29x |
| a | Gross debt excludes PPA impacts and lease agreements |
| b | Foreign currency debt hedging instruments, excluding mark-to-market effects |
| c | Short-Term Investments excludes non current balances |
7
The graph below demonstrates the indebtedness trajectory on a quarterly basis since Q3-21.

New bond issuance and liability management
In line with the Group’s liability management plan to improve its capital structure, Natura Cosméticos issued on 19th September BRL500 million in commercial notes maturing in 2025, guaranteed by Natura &Co Holding. The funds were used primarily to repay the maturity of the 9th issuance of debentures of Natura Cosméticos which matured on 21st September.
In October 2022, Natura Cosméticos completed the issuance of BRL1,050 million in Certificates backed by real estate receivables (CRI) maturing between 2027 and 2032, further extending the average debt maturity to 6.8 years. The average debt maturity improved from 5.0 years in Q1 to 6.8 years in Q3.
8
2. Performance by segment
NATURA &Co LATAM
| Net Revenue change (%) | Operational KPIs change (%) | ||||
| Natura &Co Latam | Q3-22 vs. Q3-21 | 9M-22 vs. 9M-21 | Q3-22 vs. Q3-21 | ||
| Reported (R$) | Constant Currency | Reported (R$) | Constant Currency | Consultants / Representativesb | |
| 11.0% | 18.5% | 7.5% | 13.2% | -0.2% | |
| Natura Brazil | 19.3% | 19.3% | 12.7% | 12.7% | -3.4% |
| Natura Hispanic | 0.3% | 17.3% | 0.1% | 13.7% | 4.3% |
| Avon Latam | -4.1% | 0.7% | -11.1% | -5.1% | -6.3% |
| Avon Brazil | -1.4% | -1.4% | -9.4% | -9.4% | -2.4% |
| Avon Hispanic | -5.4% | 2.3% | -11.8% | -2.9% | -9.6% |
a Natura Latam includes Natura Brazil, Hispanic and others
b Considers the Average Available Consultants / Representatives in the quarter
NATURA BRAND IN LATAM
Natura Brand in Brazil
· Consultant productivity was up by a strong +21.4% vs Q3-21, returning to the Q3-20 level and also improving sequentially. At the same time the average available consultant base is broadly stable, at 1.14 million in Q3, -3.4% vs. Q3-21 and +2.0% vs. Q2-22
· Retail sales (own and franchise stores) showed strong performance, with the number of own stores reaching 77 in the quarter (+5 vs Q3-21), while franchise stores increased to 610 (+34)
· Digital also showed solid performance, with online top line growth in Q3-22 of 42% driven by strong growth in visits and average ticket, boosted by branding media, fragrance mix and freight initiatives
|  |
| · | This led to 19.3% top-line growth for Natura Brazil, which was also boosted by pricing and a better mix proposition aligned with market demand, such as deodorant and fragrances. |
Natura Brand in Hispanic Latam
| · | Natura Hispanic delivered +0.3% revenue growth in BRL (+17.3% in CC). Growth was mainly driven by Argentina and Colombia, boosted by channel and productivity |
| · | However, excluding Argentina, Hispanic markets’ revenue was down in low single digits at CC, impacted by softer performance in Mexico and a decrease in Chile |
| · | The average available consultant base reached 0.89 million in Q3-22 (stable vs. the previous quarter and +4.3% vs. Q3- 21), with increased productivity |
AVON BRAND IN LATAM
Avon Brand in Brazil
| · | Q3 net revenue was down -1.4% YoY, another sequential improvement, driven by +11% top-line growth in the Beauty category, more than offset by a -26% drop in Fashion and Home sales |
| · | Representative productivity in the beauty segment again improved sequentially and continued to grow in double digits YoY |
| · | Fashion & Home continued to decrease in the quarter compared to the previous year but with a stable average order level in BRL, reaching the 2019 (pre-pandemic) level. Results were still impacted by portfolio optimization |
| · | The number of average available representatives was broadly flat compared to Q2-22 and to Q3-21 levels, underscoring the effective remedy actions implemented since that quarter and marking the first quarter showing a stabilization of the channel |
Avon Brand in Hispanic Latam
| · | Revenue was down -5.4% in BRL, but up +2.3% at CC, mainly benefiting from good performance in Ecuador and Argentina, but impacted by a decrease in Mexico (which has higher exposure to the Fashion and Home category) and Chile |
| · | The Beauty category grew 9.0% in CC, but was mostly offset by Fashion and Home category, which was down YoY |
| · | Total number of available representatives improved sequentially and was up +6.0% vs. Q2-22, but still down -9.6% YoY |
NATURA &Co LATAM
| · | All in, revenue was up +4.1% in BRL and +10.2% at CC, driven by strong growth at the Natura brand and Avon CFT, but still partially offset by the Fashion and Home category. |
| · | Gross margin was 60.5%, down 60 bps YoY, still pressured by input prices and FX dynamics (as mentioned in the consolidated |
9
| Natura &Co Latam (R$ million) | P&L | |||
| Q3-22 | Q3-21 | Ch. % | ||
| Gross Revenue | 7,700.0 | 7,409.2 | 3.9 | |
| Net Revenue | 5,777.5 | 5,551.5 | 4.1 | |
| Constant Currency | 10.2 | |||
| COGS | (2,280.7) | (2,158.9) | 5.6 | |
| Gross Profit | 3,496.7 | 3,392.6 | 3.1 | |
| Gross Margin | 60.5% | 61.1% | (60.0) | |
| Selling, Marketing and Logistics Expenses | (2,406.7) | (2,293.7) | 4.9 | |
| Administrative, R&D, IT and Projects Expenses | (710.8) | (784.9) | (9.4) | |
| Other Operating Income/ (Expenses), Net | 58.1 | 247.7 | (76.5) | |
| Transformation/Integration costs | (64.1) | (51.7) | 24.1 | |
| Depreciation | 214.3 | 209.3 | 2.4 | |
| EBITDA | 587.5 | 719.4 | (18.3) | |
| EBITDA Margin | 10.2% | 13.0% | (280.0) | |
| Transformation costs | 64.1 | 51.7 | 24.1 | |
| Tax credits, recoveries and provision reversal | - | (240.0) | - | |
| Adjusted EBITDA | 651.6 | 531.1 | 22.7 | |
| Adjusted EBITDA Margin | 11.3% | 9.6% | 170.0 | |
gross margin section), more than offsetting price increases, richer category mix and marketing efforts.
| · | Adjusted EBITDA margin was 11.3% (+170 bps YoY), supported by the strong top-line performance and strict financial control, partially offset by lower gross margin combined with higher selling expenses as a percentage of net revenues, amid Natura brand investments. |
| · | Wave 2 - Integration of Natura and Avon brand is being accelerated with a view to unify the value proposition for our Consultants and Representatives, so that 100% of them are able to operate with both brands simultaneously. In this phase the Natura brand's commercial and distribution platform will be used to commercialize Avon, offering a better service level, driving efficiencies, and unlocking profitability. Each brand will maintain and enhance its attributes, amplifying their distinctiveness and complementarity. Thus, the importance of Wave 1 which served to adjust commercial model rules. The behavior of multi-brand consultants and representatives allowed management to better understand what to expect during Wave 2 implementation. During this process, a fully dedicated team has been put in place to roll out this strategy across the region (starting with Peru and Colombia, followed by Brazil). |
| · | The adjustments on the fashion and home portfolio will also continue during Wave 2 and are being made based on criteria of profitability and return on invested capital. The adjusted portfolio aims to attract new reps and clients. |
| · | &Co Pay at Natura posted strong growth both in number of accounts, reaching approximately 500,000, and Total Payment Volume (“TPV”), which reached BRL8.1 billion in the quarter (BRL15.6 billion in 9 months). Natura consultants who use the platform generally record higher activity level and lower payment default. In early November, &Co Pay obtained the Central Bank of Brazil’s approval to operate as a financial institution, namely a Direct Credit Entity (Sociedade de Crédito Direto). Important levers for cash, funding, credit and inclusion for our consultants and representatives can now be explored in this new phase of the financial services business. |
10
AVON INTERNATIONAL
| · Sequential improvement in net revenue (excluding Russia and Ukraine), -3.1 at CC in Q3-22 (vs. -5.6% in Q2-22 and -9.0% in Q1-22). Overall, net revenue was down -8.1% at CC and -19.8% in BRL, negatively impacted by the BRL’s appreciation vs other currencies. | Operational KPIs change (%) |
| Q3-22 vs. Q3-21 | |
| Representatives | |
| -14.3% |
| Avon International (R$ million) | P&L | ||
| Q3-22 | Q3-21 | Ch. % | |
| Gross Revenue | 1,965.1 | 2,460.0 | (20.1) |
| Net Revenue | 1,647.6 | 2,053.7 | (19.8) |
| Constant Currency | (8.1) | ||
| COGS | (665.6) | (794.3) | (16.2) |
| Gross Profit | 982.0 | 1,259.5 | (22.0) |
| Gross Margin | 59.6% | 61.3% | (170.0) |
| Selling, Marketing and Logistics Expenses | (748.9) | (945.9) | (20.8) |
| Administrative, R&D, IT and Projects Expenses | (314.6) | (420.1) | (25.1) |
| Other Operating Income/ (Expenses), Net | (19.6) | (7.4) | 164.5 |
| Transformation/Integration costs | (88.9) | (44.1) | 101.6 |
| Depreciation | 160.9 | 194.7 | (17.4) |
| EBITDA | (29.2) | 36.7 | (179.6) |
| EBITDA Margin | -1.8% | 1.8% | (360.0) |
| Transformation costs | 88.9 | 44.1 | 101.6 |
| Adjusted EBITDA | 59.7 | 80.8 | (26.1) |
| Adjusted EBITDA Margin | 3.6% | 3.9% | (30.0) |
| · | Furthermore, TMEA and APAC regions are showing growth while Western Europe is showing softer performance. |
| · | Although revenue YoY change was slightly negative, the sequential improvement amid a rapid macro deterioration in Europe shows that the new commercial model (which completed one year and total 20 markets, implying 89% of revenues) is moving in the right direction, with continued improvement in representative productivity, digitalization, and top products performance. |
| · | Average number of Representatives is down -14% on a YoY basis, as expected, due to the new commercial model implementation, but improving sequentially. |
| · | Gross margin was 59.6%, down 170bps YoY, pressured by cost inflation and FX dynamics (as mentioned in the consolidated gross margin section) more than offsetting price increases and a positive product mix. |
| · | Adjusted EBITDA margin was 3.6%, down 30bps YoY, impacted by gross margin dynamics but benefiting from more efficient SG&A as a percentage of net revenues. The efficiencies were driven by transformational savings in a more difficult environment than in Q3-21 |
| · | Excluding impacts from Russia and the war in Ukraine, EBITDA margin would have shown a significant improvement YoY |
| · | Avon International is on track with its Open Up & Grow strategy, and taking decisive action focused on implementing critical accelerators and pivoting to end date state operating and commercial model. |
| · | The operating model transformation at Avon International is based on: |
| o | Focusing on financially accretive markets, incl. starting to invest in customer pull, rebuilding media investments in top markets and fixing or exiting profit-dilutive markets. Avon International exited Albania and initiated strategic partnerships with specialist beauty players in India, Saudi Arabia, and Kyrgyzstan |
| o | End-to-end operating model simplification incl. field optimization, IT, R&D, supply chain and organizational structures |
| · | Focusing on profitability, better capital allocation and operational agility, Avon announced last week the closing of its Suffern R&D facility in the US and the relocation of its R&D operations in Brazil and Poland. The change is expected to deliver significant cost savings and to speed up and open up the global innovation program. In this context, it expects to incur non- recurring restructuring costs related to the closure of the facility of up to ~USD 39.0 million and additional capex relating to its reallocation of up to ~USD 10.0 million to be incurred between 2022-2025. These amounts are expected to be offset by the divestment of the land and significant recurring cost savings in the next few years. Avon is also carrying out an impairment analysis on for this asset and, as a result, expects to record a potential impairment charge in the range of USD 35.0 – 40.0 million. |
| · | At the end of Q3 Avon outsourced its IT infrastructure and application services to top technology global partners, which should result, as well, in considerable savings on a recurring basis going forward and accelerate its ongoing digitalization strategy |
11
THE BODY SHOP
| · | Net revenue was down -29.8% in BRL and -19.5% at CC. Footfall to stores continues to show signs of recovery (store sales +7.7% YoY) though slower than anticipated as inflation and cost of living has impacted consumer confidence. However, this improvement is not currently at a sufficient pace to offset changes in TBS At Home and high product inventory levels held by our franchise partners during the year. |
| Operational KPIs | |||||
| Q3-22 | Q2-22 | Q3-21 | Change vs. Q2-22 | Change vs. Q3-21 | |
| The Body Shop (Total) | 2,443 | 2,455 | 2,556 | (12) | (113) |
| Own Stores | 977 | 989 | 1,009 | (12) | (32) |
| Franchise Stores | 1,466 | 1,466 | 1,547 | 0 | (81) |
| · | Although, top line figures are still negative, retail sales through core business distribution channels (sell-out SSS of own stores, e-commerce and franchise combined were up +0.6% on a YoY basis compared to down -6.9% in Q2-22) are showing improvements on a QoQ basis. Positive retail sales through franchise partners have allowed inventory levels to fall and partner stock-on- hand levels are now approaching pre-pandemic levels. |
| The Body Shop (R$ million) | P&L | ||
| Q3-22 | Q3-21 | Ch. % | |
| Gross Revenue | 1,351.8 | 1,841.5 | (26.6) |
| Net Revenue | 976.0 | 1,390.6 | (29.8) |
| Constant Currency | (19.5) | ||
| COGS | (231.0) | (309.5) | (25.4) |
| Gross Profit | 745.0 | 1,081.1 | (31.1) |
| Gross Margin | 76.3% | 77.7% | (140.0) |
| Selling, Marketing and Logistics Expenses | (608.6) | (737.2) | (17.4) |
| Administrative, R&D, IT and Projects Expense | (245.7) | (287.3) | (14.5) |
| Other Operating Income/ (Expenses), Net | 1.8 | 2.7 | (33.7) |
| Depreciation | 169.3 | 191.3 | (11.5) |
| EBITDA | 61.8 | 250.6 | (75.3) |
| EBITDA Margin | 6.3% | 18.0% | (1,170.0) |
| · | Like other business units, gross margin was impacted by input prices and FX dynamics, translating into a 76.3% margin, implying -140 bps YoY pressure. |
| · | EBITDA margin was 6.3%, down 11.7 p.p. on a YoY basis, as a consequence of the 1.4 p.p. gross margin pressure combined with a 10.3 p.p. increase in operating expenses as a percentage of net revenues. It is also worth remembering that Q3-21 EBITDA margin benefited from government support that ended in 2021. |
| · | The pressure on SG&A was mainly explained by sales deleverage, more than offsetting the recurring savings delivered with strict financial control, minimizing discretionary spend and rightsizing the overhead structure. |
| · | Management is looking closely at the business and continuing to act on all the fronts that are under our control, such as: |
| o | Head Franchise: stimulate demand by taking advantage of opportunities to manage inventory levels and focusing on positioning for peak fourth quarter sales. A new global structure was installed to provide support to HF. |
| o | Product: re-launch of a reformulated and repacked Vitamin C (+33% YoY) and the new skin care range, Edelweiss (+15% YoY) |
| o | Stores: continued store footprint optimization and deployment of the new Workshop store, which is showing a 15 p.p. uplift on sales compared to the traditional model. Furthermore, 103 franchise stores have also been refitted |
| o | Rightsizing channel overhead structure for sustainable profitability |
| · | The improvement in core business channel and recovery initiatives show that the initiatives are helping the underlying business to recover (though more slowly than originally anticipated). |
12
AESOP
| · | Revenues were BRL 603 million, up 8.9% YoY (or +21.5% in CC). All regions delivered double-digit YoY growth, except for Europe that showed high single-digit growth, despite a deteriorating macro environment. |
| · | Signature stores totaled 280 in Q3-22 (+24 LTM) and showed solid same-store sale growth of +20% |
| Aesop | Operational KPIs | |||||
| Q3-22 | Q2-22 | Q3-21 | Change vs. Q2-22 | Change vs. Q3-21 | ||
| Aesop (Total) | 385 | 376 | 352 | 9 | 33 | |
| Signature Stores | 280 | 275 | 256 | 5 | 24 | |
| Department Stores | 105 | 101 | 96 | 4 | 9 | |
| · | From a distribution channel perspective, retail and wholesale showed solid growth, partially offset by a softer e-commerce performance, reflecting consumer behavior normalizing post-Covid. Thus, combined SSS growth was a solid +14% (including retail, department stores concession and Aesop.com) |
| · | China entry plans are underway for launch by end-2022, including the opening of physical stores, launch of Aesop.com platform and T Mall (domestic) operation. |
| · | Gross margin was 91.3%, a 40bps improvement YoY mainly driven by favorable product (such as fragrances) and channel mix jointly with price increases, more than offsetting inflationary cost pressures. |
| · | Adjusted EBITDA margin was 16.8% down 280bps YoY, pressured by planned investments to deliver sustainable future growth. This was the result of a 320bps YoY increase in SG&A as a percentage of net revenues, more than offsetting a slight gross margin improvement. |
| Aesop (R$ million) | P&L | ||
| Q3-22 | Q3-21 | Ch. % | |
| Gross Revenue | 676.4 | 618.4 | 9.4 |
| Net Revenue | 602.6 | 553.4 | 8.9 |
| Constant Currency | 21.5 | ||
| COGS | (52.3) | (50.4) | 3.7 |
| Gross Profit | 550.2 | 503.0 | 9.4 |
| Gross Margin | 91.3% | 90.9% | 40.0 |
| Selling, Marketing and Logistics Expenses | (355.5) | (311.6) | 14.1 |
| Administrative, R&D, IT and Projects Expenses | (173.8) | (152.3) | 14.1 |
| Other Operating Income/ (Expenses), Net | (17.7) | 0.1 | (17,837.6) |
| Depreciation | 77.8 | 69.0 | 12.7 |
| EBITDA | 81.0 | 108.2 | (25.2) |
| EBITDA Margin | 13.4% | 19.6% | (620.0) |
| Net non-recurring other (income)/ expenses | 20.5 | - | - |
| Adjusted EBITDA | 101.5 | 108.2 | (6.2) |
| Adjusted EBITDA Margin | 16.8% | 19.6% | (280.0) |
| · | These investments relate primarily to technology and supply chain enhancements and to prepare Aesop's upcoming China market entry. |
| · | Aesop launched Eidesis, a new aromatic journey inspired by the myth of Narcissus. Reflections and refractions of resinous sandalwood are juxtaposed against a warm heart of cedar and cumin, with inviting top notes of petitgrain and spicy black pepper. |
| · | As mentioned in the material fact published on October 17th, the Board of Directors of Natura &Co has authorized management study strategic alternatives for Aesop. We will maintain the market updated. |
13
3. Social and environmental performance
(all actions refer to Natura &Co Group, unless stated otherwise)
This quarter, as Natura &Co transitions to a simpler corporate structure, we have embarked on a new process to update our Sustainability structure, ensuring that it best allows the Holding as well as the Business Units to face challenges in the ESG space with more accountability and autonomy. As part of this work, the Sustainability function will change, and our Commitment to Life targets will evolve, allowing the Business Units to reach their forecasts and address the challenges faced by our planet and people in the best way possible. We will provide more clarity and information on all aspects of Natura &Co’s Sustainability Vision in the new year.
Natura &Co was present at the New York Climate Week, sharing its perspective on how to tackle the world’s most pressing environmental and social issues. Hosted annually, the summit takes place alongside the UN General Assembly and brings together international leaders from business, government, and civil society to accelerate climate action and assess progress ahead of COP27. Focusing on the climate crisis, human rights, and circularity and regeneration, we participated in several meetings and engaged with our partners to find the best ways forward to achieving our goals, such as Building an Agreement on Nature by CBD COP15, and reducing scopes 1, 2 and 3 emissions, but also towards engaging in wider systems change to address the social and environmental challenges the world sees today.
In October 2022, Natura was awarded ‘Highly Commended’ in the Finance for the Future Awards in the “Embedding an integrated approach” category, recognizing finance teams’ critical role in delivering IP&L, where sustainability is embedded in the overall strategy and decision-making processes
Updates across the Commitment to Life pillars:
To address the Climate Crisis and protect the Amazon
| · | Amazon: In Q3-2022, Natura expanded the purchase of community inputs by 16% YoY and by 166% the purchase of carbon credit in setting. PlenaMata (DETER/INPE) detected 0.5 m ha deforested in Q3 in the Amazon, an increase of 39% YoY. Through the PlenaMata portal, Natura established partnerships and supported mobilization and communication actions for zero deforestation in the Amazon in Brazil at festivals (Rock in Rio and Coala), in communication channels, a panel in Brasília and in a session at the Federal Senate. Also, the portal was recognized with the Eco Amcham-Brasil Award. |
| · | Taskforce on Nature-related Financial Disclosures (TNFD): Taskforce members from all five continents gathered in London for an in-person plenary meeting. Natura &Co was present, represented by Sustainability VP Marcelo Behar, as TNFD Co-Chairs Elizabeth Mrema and David Craig guided the taskforce members through discussions of some key remaining design issues, in preparation for the coming iterations of the TNFD beta framework and the full framework that will launch in September 2023. While the 34 taskforce members serve in an individual capacity, they represent corporates, financial institutions, and market intermediaries with USD19.4trn in assets and a footprint in over 180 countries. |
| · | Avon completed this quarter its ENERGY REDUCTION PROJECT IN SOUTH AFRICA: Migration from diesel compressors to electrical compressors, resulting in a reduction of 225kwh/annum and Aesop´s operations in Australia and New Zealand have been awarded the Climate Active carbon-neutral certification for a fourth consecutive year |
To defend Human Rights and be Human-Kind
| · | Human Rights Statement: In September 2022, we proudly launched our Human Rights statement. Developed in line with the UN Guiding Principles on Business and Human Rights, this will act as a guide for how we work to protect the fundamental human rights of all those connected to our collective. Read our full Human Rights Statement: Natura &Co Group Human Rights Statement - Natura &Co (naturaeco.com) |
Investment in key causes:
| · | In August, The Body Shop’s Save Cruelty Free Cosmetics campaign collected over 1.4 million signatures and the issue of animal testing within the cosmetics industry will again be presented to the EU for debate. |
| · | To mark its 135th anniversary, Avon announced that it would be making USD 1.35M worth of grants in 2022 to help create better futures for women. More than 30 grants are being donated, with a focus on NGOs providing vital support services to survivors of gender-based violence. The donations include USD 160,000 to UNFPA in Ukraine to support women impacted by gender-based violence through the ongoing war. Avon and the Avon Foundation have also donated USD 200,000 to the Red Cross to support those impacted by the war in Ukraine and is continuing to help women and their families through donations of products and other support. |
| · | The Aesop Foundation approved AUD 1.6m grants for a range of partners working in support of advancing education, employment, the environment, and emergency response. |
| · | In partnership with more than 240 organizations Natura is supporting the “Amazônia de Pé” campaign, inviting its network of partners, consumers, employees and beauty consultants to sign a Public Demand Bill that establishes a robust policy of protection and sustainable development for the Amazon |
To embrace Circularity and Regeneration
| · | In Q3 as a Group, Natura &Co reached 11% of recycled plastic content of all plastic used cumulative Jan - Sept 2022. |
14
4. Capital Markets and Stock Performance
NTCO3 shares traded at BRL14.73 at the end of Q3-22 on the B3 stock exchange, +9.8% in the quarter. Average Daily Trading Volume (ADTV) for the quarter was BRL212.2 million, -35.5% vs Q3-21. NTCO traded at USD5.39 at the end of Q3-22 on NYSE, + 3.5% in the quarter.
On September 30, 2022, the Company’s market capitalization was BRL20.4 billion, and the Company’s capital was comprised of 1,383,088,200 common shares.
5. Fixed income
Below is a table with details of all public debt instruments outstanding per issuer as of September 30, 2022:
| Issuer | Type | Issuance | Maturity | Principal (million) | Nominal Cost (per year) |
| Natura Cosméticos S.A. | 08/28/2019 | 08/26/2024 | BRL 254.2 | DI + 1.00 per year | |
| Debenture - 10th issue | 08/29/2019 | 08/26/2024 | BRL 76.75 | DI + 1.15 per year | |
| BRL 391.0 | DI + 1.15 per year | ||||
| BRL 191.6 | DI + 1.15 per year | ||||
| Natura Cosméticos S.A. | Commercial Notes | 09/19/2022 | 09/19/2025 | BRL 500.0 | DI + 1.55 per year |
| Natura Cosméticos S.A. | Debenture - 11th issue | 07/25/2022 | 07/21/2027 | BRL 826.0 | DI + 1.65 per year |
| Natura Cosméticos S.A. | Bond - 2nd issue (Sustainability Linked Bond) | 05/03/2021 | 05/03/2028 | US$1,000.0(1) | 4.125% |
| Natura &Co International S.à r.l. (Natura Lux) | Bonds | 04/19/2022 | 04/19/2029 | US$ 600.0 | 6.000% |
| Avon Products, Inc. | Unsecured Bonds | 03/12/2013 | 03/15/2043 | US$ 216.1 | 8.450%(2) |
| (1) | Principal and interests fully hedged (swapped to BRL). For more information, see the explanatory notes to the Company’s financial statements. |
| (2) | Coupon based on current credit ratings, governed by interest rate adjustment clause |
Ratings
Below is a table with our current credit ratings:
| Natura &Co Holding S.A. | |||
| Agency | Global Scale | National Scale | Outlook |
| Standard & Poor’s | BB | AAA | Stable |
| Fitch Ratings | BB | AA+ | Positive |
| Moody’s | Ba3 | - | Stable |
| Natura Cosméticos S.A. | |||
| Agency | Global Scale | National Scale | Outlook |
| Standard & Poor’s | BB | AAA | Stable |
| Fitch Ratings | BB | AA+ | Positive |
| Moody’s | Ba2 | - | Stable |
| Avon International | |||
| Agency | Global Scale | National Scale | Outlook |
| Standard & Poor’s | BB- | - | Stable |
| Fitch Ratings | BB | - | Positive |
| Moody’s | Ba3 | - | Stable |
15
6. Appendix
FREE CASH FLOW RECONCILIATION
The correspondence between Free Cash Flow and Statements of Cash Flow is shown below:
| Statement of Cash Flows | Free Cash Flow Reconciliation | |
| CASH FLOW FROM OPERATING ACTIVITIES | ||
| Net (loss) income for the period | (a) | Net Income (loss) |
| Adjustments to reconciliate net (loss) income for the period with net cash used in operating activities: | ||
| Depreciation and amortization | (b) | Depreciation/amortization |
| Interest and exchange variation on short-term investments | (c) | Non-cash Adjustments to Net Income |
| Earnings (loss) from swap and forward derivative contracts | (c) | |
| Provision for tax, civil and labor risks | (c) | |
| Inflation adjustment of judicial deposits | (c) | |
| Inflation adjustment of provision for tax, civil and labor risks | (c) | |
| Income tax and social contribution | (c) | |
| Income from sale and write-off of property, plant and equipment, lease and non-current assets held for sale | (c) | |
| Interest and exchange rate variation on leases | (c) | |
| Interest and exchange rate variation on borrowings, financing and debentures, net of acquisition costs | (c) | |
| Inflation adjustment and exchange rate variation on other assets and liabilities | (c) | |
| Reversal of provision for losses from property, plant and equipment, intangible and leases | (c) | |
| Provision for stock option plans | (c) | |
| Provision for losses with trade accounts receivables, net of reversals | (c) | |
| Provision for inventory losses, net of reversals | (c) | |
| Reversal of provision for the provision for carbon credits | (c) | |
| Effect from hyperinflationary economy | (c) | |
| Other adjustments to reconcile net loss | (c) | |
| Increase (Decrease) in: | ||
| Trade accounts receivable and related parties | (d2) | Decrease (Increase) in Working Capital |
| Inventories | (d1) | |
| Recoverable taxes | (d4) | |
| Other assets | (d4) | |
| Domestic and foreign trade accounts payable and related parties | (d3) | |
| Payroll, profit sharing and social charges, net | (d4) | |
| Tax liabilities | (d4) | |
| Other liabilities | (d4) | |
| OTHER CASH FLOWS FROM OPERATING ACTIVITIES | ||
| Payment of income tax and social contribution | (e) | Income Tax and Social Contribution |
| Release of judicial deposits | (h) | Other Operating Activities |
| Payments related to tax, civil and labor lawsuits | (h) | |
| (Payments) proceeds due to settlement of derivative transactions | (h) | |
| Payment of interest on lease | (g) | Lease Payments |
| Payment of interest on borrowings, financing and debentures | (f) | Interest on Debt |
| NET CASH (USED IN) OPERATING ACTIVITIES | ||
| CASH FLOW FROM INVESTING ACTIVITIES | ||
| Cash from acquisition of subsidiary | (l) | Other financing/investing activities |
| Additions of property, plant and equipment and intangible | (j) | Capex |
| Proceeds from sale of property, plant and equipment, intangible and non-current assets held for sale | (i) | Sale of Assets |
| Acquisition of short-term investments | (l) | Other financing/investing activities |
| Redemption of short-term investments | (l) | |
| Redemption of interest on short-term investments | (l) | |
| NET CASH GENERATED BY (USED IN) INVESTING ACTIVITIES | ||
| CASH FLOW FROM FINANCING ACTIVITIES | ||
| Repayment of lease - principal | (g) | Lease Payments |
| Repayment of borrowings, financing and debentures – principal | (l) | Other financing/investing activities |
| New borrowings, financing, and debentures | (l) | |
| Acquisition of treasury shares, net of receipt of option strike price | (l) | |
| Receipt of funds due to settlement of derivative transactions | (l) | |
| Capital Increase | (l) | |
| NET CASH PROVIDED BY (USED IN) FINANCING ACTIVITIES | ||
| Effect of exchange rate variation on cash and cash equivalents | (k) | Exchange Rate Effect |
| DECREASE IN CASH AND CASH EQUIVALENTS | ||
| Opening balance of cash and cash equivalents | ||
| Closing balance of cash and cash equivalents | ||
| DECREASE IN CASH AND CASH EQUIVALENTS | ||
| Free Cash Flow | Cash Flow Reconciliation |
| Net income (loss) | (a) |
| Depreciation and amortization | (b) |
| Non-cash Adjustments to Net Income | (c) |
| Adjusted Net income | |
| Decrease / (Increase) in Working Capital | (d) |
| Inventories | (d1) |
| Accounts receivable | (d2) |
| Accounts payable | (d3) |
| Other assets and liabilities | (d4) |
| Income tax and social contribution | (e) |
| Interest on debt | (f) |
| Lease payments | (g) |
| Other operating activities | (h) |
| Cash from Operations | |
| Capex | (j) |
| Sale of Assets | (i) |
| Exchange rate variation | (k) |
| Free Cash Flow | |
| Other financing and investing activities | (l) |
| Cash Balance Variation |
16
CONSOLIDATED BALANCE SHEET
| ASSETS (R$ million) | Sep-22 | Dec-21 | LIABILITIES AND SHAREHOLDER’S EQUITY (R$ million) | Sep-22 | Dec-21 |
| CURRENT ASSETS | CURRENT LIABILITIES | ||||
| Cash and cash equivalents | 3,252.3 | 4,007.3 | Borrowings, financing and debentures | 429.3 | 945.1 |
| Short-term investments | 1,377.2 | 1,978.7 | Lease | 854.7 | 1,005.5 |
| Trade accounts receivable | 3,368.2 | 3,476.4 | Trade accounts payable and reverse factoring operations | 5,984.9 | 6,770.6 |
| Inventories | 5,410.5 | 5,403.5 | Dividends and interest on shareholders’ equity payable | 180.8 | 180.8 |
| Recoverable taxes | 974.1 | 973.3 | Payroll, profit sharing and social charges | 985.4 | 1,255.3 |
| Income tax and social contribution | 228.6 | 564.5 | Tax liabilities | 676.2 | 766.4 |
| Derivative financial instruments | 185.3 | 81.2 | Income tax and social contribution | 238.6 | 365.5 |
| Other current assets | 837.6 | 912.2 | Derivative financial instruments | 1,164.1 | 458.5 |
| Assets held for sale | 51.5 | 52.9 | Provision for tax, civil and labor risks | 321.2 | 230.1 |
| Total current assets | 15,685.3 | 17,449.9 | Other current liabilities | 1,468.5 | 1,716.1 |
| Total current liabilities | 12,303.6 | 13,693.9 | |||
| NON CURRENT ASSETS | |||||
| Recoverable taxes | 1,366.3 | 1,349.6 | NON CURRENT LIABILITIES | ||
| Income tax and social contribution | 238.5 | 84.7 | Borrowings, financing and debentures | 13,278.7 | 11,771.8 |
| Deferred income tax and social contribution | 3,704.9 | 2,954.1 | Lease | 2,440.0 | 2,542.3 |
| Judicial deposits | 475.5 | 585.3 | Payroll, profit sharing and social charges | 21.8 | 53.7 |
| Derivative financial instruments | 130.0 | 894.0 | Tax liabilities | 116.5 | 114.8 |
| Short-term investments | 36.5 | 36.9 | Deferred income tax and social contribution | 895.2 | 994.0 |
| Other non-current assets | 1,463.0 | 1,763.1 | Derivative financial instruments | - | - |
| Total long term assets | 7,414.6 | 7,667.7 | Provision for tax, civil and labor risks | 1,522.4 | 1,768.7 |
| Other non-current liabilities | 920.3 | 942.5 | |||
| Property, plant and equipment | 4,903.0 | 5,377.4 | Total non-current liabilities | 19,194.9 | 18,187.9 |
| Intangible | 23,509.8 | 26,857.6 | |||
| Right of use | 2,988.1 | 3,096.0 | SHAREHOLDERS’ EQUITY | ||
| Total non-current assets | 38,815.6 | 42,998.6 | Capital stock | 12,487.6 | 12,481.7 |
| Treasury shares | (262.4) | (151.3) | |||
| Capital reserves | 10,476.8 | 10,478.8 | |||
| Legal profit reserve | 866.8 | 871.2 | |||
| Retained (losses) income | (1,969.6) | - | |||
| Other comprehensive income | 1,385.8 | 4,865.2 | |||
| Equity attributable to owners of the Company | 22,985.0 | 28,545.6 | |||
| Non-controlling interest in shareholders’ equity of subsidiaries | 17.4 | 21.2 | |||
| TOTAL ASSETS | 54,500.8 | 60,448.5 | TOTAL LIABILITIES AND SHAREHOLDERS’ EQUITY | 54,500.8 | 60,448.5 |
CONSOLIDATED INCOME STATEMENT- INCLUDING PURCHASE PRICE ALLOCATION (PPA) AMORTIZATION
| R$ million | Q3-22 | Q3-21 | Ch. % | 9M-22 | 9M-21 | Ch. % |
| NET REVENUE | 9,003.7 | 9,549.2 | (5.7) | 25,959.4 | 28,521.5 | (9.0) |
| Cost of Products Sold | (3,229.7) | (3,313.1) | (2.5) | (9,392.1) | (9,953.8) | (5.6) |
| GROSS PROFIT | 5,774.1 | 6,236.2 | (7.4) | 16,567.4 | 18,567.6 | (10.8) |
| OPERATING EXPENSES | ||||||
| Selling, Marketing and Logistics Expenses | (3,968.7) | (4,068.0) | (2.4) | (11,360.4) | (12,120.9) | (6.3) |
| Administrative, R&D, IT and Project Expenses | (1,555.3) | (1,790.8) | (13.2) | (4,818.0) | (5,234.8) | (8.0) |
| Impairment losses on trade receivables | (151.1) | (220.3) | (31.4) | (465.4) | (670.5) | (30.6) |
| Other Operating Expenses, Net | (131.7) | 132.5 | (199.4) | (228.9) | (188.1) | 21.6 |
| LOSS FROM OPERATIONS BEFORE FINANCIAL RESULT | (32.8) | 289.5 | (111.3) | (305.3) | 353.3 | (186.4) |
| Financial Income | 876.7 | 874.6 | 0.2 | 4,191.5 | 3,139.0 | 33.5 |
| Financial Expenses | (1,440.7) | (1,167.6) | 23.4 | (5,568.8) | (3,865.4) | 44.1 |
| LOSS BEFORE INCOME TAX AND SOCIAL CONTRIBUTION | (596.8) | (3.5) | 17,033.8 | (1,682.6) | (373.1) | 351.0 |
| Income Tax and Social Contribution | 112.8 | 312.0 | (63.8) | (104.8) | 749.3 | (114.0) |
| (LOSS) INCOME FROM CONTINUED OPERATIONS | (483.9) | 308.5 | (256.9) | (1,787.4) | 376.2 | (575.1) |
| Income (Loss) from discontinued operations | (75.5) | (38.9) | 94.2 | (181.2) | (30.9) | 485.8 |
| (LOSS) INCOME FOR THE PERIOD | (559.5) | 269.6 | (307.5) | (1,968.6) | 345.3 | (670.1) |
| Attributable to controlling shareholders | (559.8) | 272.9 | (305.1) | (1,969.6) | 352.5 | (658.7) |
| Attributable to non-controlling shareholders | 0.3 | (3.3) | (109.3) | 1.0 | (7.3) | (113.5) |
PURCHASE PRICE ALLOCATION (PPA) AMORTIZATION
| R$ million | Q3-22 | Q3-21 | 9M-22 | 9M-21 |
| Net Revenue | - | - | - | - |
| Cost of Products Sold | (2.1) | (0.4) | (5.7) | (23.2) |
| Gross Profit | (2.1) | (0.4) | (5.7) | (23.2) |
| Selling, Marketing and Logistics Expenses | (64.3) | (68.9) | (193.9) | (219.8) |
| Administrative, R&D, IT and Project Expenses | (67.3) | (67.4) | 0 | (229.2) |
| Other Operating Income (Expenses), Net | 126.5 | 77.8 | 54.9 | 88.8 |
| Financial Income/(Expenses), net | 22.3 | 23.8 | (49.2) | 45.0 |
| Income Tax and Social Contribution | (10.3) | 213.2 | 0 | 376.0 |
| LOSS FROM CONTINUED OPERATIONS | 4.7 | 178.2 | (194.0) | 37.5 |
| Depreciation impact | (135.7) | (148.2) | (49.2) | (491.5) |
17
CONSOLIDATED STATEMENT OF CASH FLOW
| R$ million | 9M-22 | 9M-21 |
| CASH FLOW FROM OPERATING ACTIVITIES | ||
| Net (loss) income for the period | (1,968.6) | 345.3 |
| Adjustments to reconciliate net (loss) income for the period with net cash used in operating activities: | ||
| Depreciation and amortization | 1,901.3 | 2,051.7 |
| Interest and exchange variation on short-term investments | (330.4) | (149.8) |
| Earnings (loss) from swap and forward derivative contracts | 527.9 | (400.8) |
| Provision for tax, civil and labor risks | 144.9 | (64.0) |
| Inflation adjustment of judicial deposits | (26.8) | (8.8) |
| Inflation adjustment of provision for tax, civil and labor risks | 67.1 | 39.2 |
| Income tax and social contribution | 104.8 | (1,716.7) |
| Income from sale and write-off of property, plant and equipment, lease and non-current assets held for sale | (80.9) | 211.5 |
| Interest and exchange rate variation on leases | 143.2 | 151.3 |
| Interest and exchange rate variation on borrowings, financing and debentures, net of acquisition costs | 324.2 | 612.6 |
| Inflation adjustment and exchange rate variation on other assets and liabilities | 2.0 | 23.8 |
| Provision for losses from property, plant and equipment, intangible and leases | - | -4.1 |
| Provision for stock option plans | 194.3 | 205.0 |
| Provision for losses with trade accounts receivables, net of reversals | 465.4 | 670.5 |
| Provision for inventory losses, net of reversals | 303.8 | 275.4 |
| Reversal of provision for the provision for carbon credits | (8.3) | (6.4) |
| Effect from hyperinflationary economy | 123.2 | (43.4) |
| Other adjustments to reconcile net loss | 12.5 | (0.1) |
| Increase (Decrease) in: | ||
| Trade accounts receivable and related parties | (344.1) | (563.2) |
| Inventories | (284.1) | (1,627.6) |
| Recoverable taxes | (20.0) | (240.8) |
| Other assets | (131.8) | 171.5 |
| Domestic and foreign trade accounts payable and related parties | (450.4) | (445.7) |
| Payroll, profit sharing and social charges, net | (296.9) | 1.9 |
| Tax liabilities | (87.7) | (183.7) |
| Other liabilities | 151.6 | 45.9 |
| OTHER CASH FLOWS FROM OPERATING ACTIVITIES | ||
| Payment of income tax and social contribution | (499.4) | (425.9) |
| Release of judicial deposits | 134.2 | 4.0 |
| Payments related to tax, civil and labor lawsuits | (210.1) | (50.9) |
| (Payments) proceeds due to settlement of derivative transactions | (230.3) | 91.6 |
| Payment of interest on lease | (86.0) | (159.8) |
| Payment of interest on borrowings, financing and debentures | (573.0) | (657.0) |
| NET CASH (USED IN) OPERATING ACTIVITIES | (1,028.4) | (1,839.3) |
| CASH FLOW FROM INVESTING ACTIVITIES | ||
| Additions of property, plant and equipment and intangible | (768.2) | (883.4) |
| Proceeds from sale of property, plant and equipment, intangible and non-current assets held for sale | 4.1 | 98.0 |
| Acquisition of short-term investments | (8,005.9) | (8,679.7) |
| Redemption of short-term investments | 8,613.7 | 8,867.1 |
| Redemption of interest on short-term investments | 85.6 | 100.8 |
| NET CASH GENERATED BY (USED IN) INVESTING ACTIVITIES | (70.7) | (497.2) |
| CASH FLOW FROM FINANCING ACTIVITIES | ||
| Repayment of lease - principal | (820.9) | (850.4) |
| Repayment of borrowings, financing and debentures – principal | (4,591.3) | (7,609.2) |
| New borrowings, financing, and debentures | 6,051.1 | 6,323.6 |
| Acquisition of treasury shares, net of receipt of option strike price | (120.3) | (32.1) |
| Receipt of funds due to settlement of derivative transactions | 132.1 | 1,566.2 |
| Capital Increase | 5.9 | 0.0 |
| NET CASH PROVIDED BY (USED IN) FINANCING ACTIVITIES | 656.7 | (601.9) |
| Effect of exchange rate variation on cash and cash equivalents | (312.7) | 171.0 |
| DECREASE IN CASH AND CASH EQUIVALENTS | (755.0) | (2,767.3) |
| Opening balance of cash and cash equivalents | 4,007.3 | 5,821.7 |
| Closing balance of cash and cash equivalents | 3,252.3 | 3,054.4 |
| DECREASE IN CASH AND CASH EQUIVALENTS | (755.0) | (2,767.3) |
18
7. Conference call and webcast

19
8. Glossary
Abihpec: Brazilian Association of the Personal Hygiene, Perfumery and Cosmetics Industry
ADR: An American Depositary Receipt is a negotiable certificate issued by a U.S. depository bank representing a specified number of shares of a non-U.S. company stock.
ADS: The individual issuance of shares in a U.S. stock exchange by a non-U.S. company is referred to as American Depositary Shares (ADS)
Adjusted EBITDA: Excludes effects that are not considered usual, recurring or not-comparable between the periods under analysis
APAC: Asia and Pacific
Avon representatives: Self-employed resellers who do not have a formal labor relationship with Avon
B3: Brazilian Stock Exchange
Benefit Sharing: In accordance with Natura’s Policy for the Sustainable Use of Biodiversity and Associated Traditional Knowledge, benefits are shared whenever we perceive various forms of value in the access gained. Therefore, one of the practices that defines the way in which these resources are divided is to associate payments with the number of raw materials produced from each plant as well as the commercial success of the products in which these raw materials are used
BPS: Basis Points; a basis points is equivalent to one percentage point * 100
Brand Power: A methodology used by Natura &Co to measure how its brands are perceived by consumers, based on metrics of significance, differentiation and relevance.
BRL: Brazilian Reais
CDI: The overnight rate for interbank deposits
CEE: Central and Eastern Europe
CFT: Cosmetics, Fragrances and Toiletries Market (CFT = Fragrances, Body Care and Oil Moisture, Make-up (without Nails), Face Care, Hair Care (without
Colorants), Soaps, Deodorants, Men’s Grooming (without Razors) and Sun Protection
COGS: Costs of Goods Sold
Constant currency (“CC) or constant exchange rates: when exchange rates used to convert financial figures into a reporting currency are the same for the years under comparison, excluding foreign currency fluctuation effects
CO2e: Carbon dioxide equivalent; for any quantity and type of greenhouse gas, CO2e signifies the amount of CO2 which would have the equivalent global warming impact.
EBITDA: Earnings Before Interests, Tax, Depreciation and Amortization
EMEA: Europe, Middle East and Africa
EP&L: Environmental Profit & Loss
Foreign currency translation: conversion of figures from a foreign currency into the currency of the reporting entity
G&A: General and administrative expenses
GHG: Greenhouse gases
ICON: Consumer Stock Index of the B3 stock exchange, designed to track changes in the prices of the more actively traded and better representative cyclical and non-cyclical consumer stocks
Innovation Index: Share in the last 12 months of the sale of products launched in the last 24 months
IBOV: Ibovespa Index is the main performance indicator of the stocks traded in B3 and lists major companies in the Brazilian capital market
IFRS – International Financial Reporting Standards
Kantar: Data, insights and consulting company with global presence
Hispanic Latam: Often used to refer to the countries in Latin America, excluding Brazil
LFL: Like-for-Like, applicable to measure comparable growth
Natura Consultant: Self-employed resellers who do not have a formal labor relationship with Natura
Natura Crer Para Ver Program (CPV): Special line of non-cosmetic products whose profits are transferred to the Natura Institute, in Brazil, and invested by Natura in social initiatives in the other countries where we operate. Our consultants promote these sales to benefit society and do not obtain any gains.
Natura Institute: Is a nonprofit organization created in 2010 to strengthen and expand our Private Social Investment initiatives. The institute has enabled us to leverage our efforts and investments in actions that contribute to the quality of public education
NYSE: New York Stock Exchange
P&L: Profit and loss
PP: Percentage point
PPA: Purchase Price Allocation - effects of the fair market value assessment as a result of a business combination
Profit Sharing: The share of profit allocated to employees under the profit-sharing program
SEC: The U.S. Securities and Exchange Commission (SEC) is an independent federal government regulatory agency responsible for protecting investors, maintaining fair and orderly functioning of the securities markets, and facilitating capital formation
SG&A: Selling, general and administrative expenses
SM&L: Selling, marketing and logistics expenses
SLB: Sustainability Linked Bond
SPT: Sustainability Performance Targets
SSS: Same-Store-Sales
Supplier Communities: The communities of people involved in small–scale farming and extraction activities in a variety of locations in Brazil, especially in the Amazon Region, who extract the inputs used in our products from the social and biodiversity. We form production chains with these communities that are based on fair prices, the sharing of benefits gained from access to the genetic heritage and associated traditional knowledge and support for local sustainable development projects. This business model has proven effective in generating social, economic and environmental value for Natura and for the communities.
Synergies: Synergy is the concept that the value and performance of two companies combined will be greater than the sum of the separate individual parts.
TBS: The Body Shop.
TMEA: Turkey, Middle East and Africa
UNI: Underlying Net Income.
WE: Western Europe
20
9. Disclaimer
EBITDA is not a measure under BR GAAP and does not represent cash flow for the periods presented. EBITDA should not be considered an alternative to net income as an indicator of operating performance or an alternative to cash flow as an indicator of liquidity. EBITDA does not have a standardized meaning and the definition of EBITDA used by Natura may not be comparable with that used by other companies. Although EBITDA does not provide under BR GAAP a measure of cash flow, Management has adopted its use to measure the Company’s operating performance. Natura also believes that certain investors and financial analysts use EBITDA as an indicator of performance of its operations and/or its cash flow.
This report contains forward-looking statements. These forward-looking statements are not historical fact, but rather reflect the wishes and expectations of Natura’s management. Words such as “anticipate,” “wish,” “expect,” “foresee,” “intend,” “plan,” “predict,” “project,” “desire” and similar terms identify statements that necessarily involve known and unknown risks. Known risks include uncertainties that are not limited to the impact of price and product competitiveness, the acceptance of products by the market, the transitions of the Company’s products and those of its competitors, regulatory approval, currency fluctuations, supply and production difficulties and changes in product sales, among other risks. This report also contains certain pro forma data, which are prepared by the Company exclusively for informational and reference purposes and as such are unaudited. This report is updated up to the present date and Natura does not undertake to update it in the event of new information and/or future events.
Investor Relations Team
ri@natura.net
|
21
Item 2
Earnings presentation of Natura &Co Holding S.A. for the nine-month period ended September 30, 2022.

Thir d - Quarter 2022 Results November 10 th , 2022

The words "anticipates," "wishes,“ "expects," "estimates," "intends," "forecasts," "plans," "predicts," "projects," "targets" and similar words are intended to identify these statements, which necessarily involve known and unknown risks and uncertainties. Known risks and uncertainties include, but are not limited to, the impact of competitive products and pricing, market acceptance of products, product transitions by the Company and its competitors, regulatory approval, currency fluctuations, production and supply difficulties, changes in product sales mix, and other risks. This presentation also may include pro - forma and adjusted information prepared by the Company for information and reference purposes only, which has not been audited. Forward - looking statements speak only as of the date they are made, and the Company does not undertake any obligation to update them in light of new information or future developments. https://ri.naturaeco.com/en/ This presentation may contain forward - looking statements. Such statements are not statements of historical fact and reflect the beliefs and expectations of Natura &Co’s management . 2

Sales up 2.2% at constant currency • Strong performance by Natura &Co Latam and Aesop • Sequential improvement at Avon International • Continued challenges at The Body Shop, actions underway Stable YoY Adj EBITDA margin at 8.6% despite cost pressure Focus on cash flow showing initial improvements Group reorganization progressing • Significant cost reduction at Holding level • Acceleration of Natura and Avon integration in Latam • Avon International implementing critical accelerators aiming at transformation of the operating model • Strategic alternatives under study for Aesop Mid - term guidance withdrawn amid group reorganization and uncertain macro environment 3

Consolidated Financial Performance Guilherme Castellan, CFO

Net Revenue (BRL million) Highlights • Double - digit growth in CC at Natura &Co Latam, boosted by Natura brand and Avon CFT segment in the region • Strong performance at Aesop • Softer performance at Avon International, but improving sequentially at - 8.1% in CC and - 3.1% excluding Russia and Ukraine • Continued challenges at The Body Shop Ae sop +21.5% at CC +8.9% in BRL The Body Shop - 19.5% at CC - 29.8% in BRL Avon International - 8.1% at CC - 19.8% in BRL Natura &Co Latam +10.2% at CC +4.1% in BRL 9 , 5 49 . 2 Q 3 - 21 Q 3 - 22 9 , 0 03 . 7 ( - 5.7 % ) +2.2% CC 5 Natura &Co: Continued sales growth improvement in constant currency

Adj. EBITDA margin stable YoY despite cost pressure Q3 - 22 Consolidated Adjusted EBITDA Margin 6 1.2% 0.9% 1.5% 0.7% Gross Margin 8.6% Se lli n g A d j us ted EBITDA margin Q3 - 21 G&A Cor p or ate Expenses A d j us ted EBITDA margin Q3 - 22 Main Impacts • Improving margin at Natura &Co Latam combined with lower holding expenses • Partially offset by: Sales deleverage at The Body Shop Aesop’s investments for growth

7 (560) ( 1 98) ( 5 60) (198) 124 Net income Q3 - 22 163 Transformation/ Restructuring Costs 76 Discontinued operations and other effects PPA Effect UNI Q3 - 22 Net Income to Underlying Net Income (UNI) Reconciliation Q3 - 22 (BRL million) Underlying net income (UNI) and net income impacted by lower EBITDA and higher net financials, partly offset by some tax credit recovery Q3 - 21 net income benefited from tax gains related to credit recoveries in Brazil

8 Improvement YoY in free cash flow Main Highlights • Management efforts to improve cash conversion starting to show results • Free cash flow to firm was virtually flat • Working capital improvement reflecting: o improved inventory efficiency; o better accounts payable and; o lower advance to suppliers

BRL 1,050 million Natura Cosméticos completed the issuance of Real State Receivables Certificate (CRI) maturing between 2027 and 2032 BRL 4.6 billion Cash balance at end - September Q3 - 22 2.85x Group net debt - to - EBITDA ratio Net debt and net debt - to - EBITDA ratio (BRL billion) Amortization schedule (BRL billion) 9 (a) Does not consider the issuance of R$ 1.05 billion of Certificates of Real State Receivables (”CRI”), issued on 10/19/22. (b)) 2028+: BRL 9.9 billion includes US$ 1.0 billion of the sustainability - linked bond due 2028, Natura &Co Holding bonds of US$ 600 million due 2029, Avon Products Inc bonds of US$ 216 million due 2043 1 . 8 3 x Q3 - 21 1.52x Q 1 - 22 Q 4 - 21 2.13x 2.46 x Q2 - 22 2.85x Q 3 - 22 6 . 7 6 . 0 7 . 7 8 . 5 8.8 Net Debt Net Debt/EBITDA ratio Continued liability management Average Maturity: 6.8 years 0 . 8 2027 4.6 a Cash and s h or t - term deposits 2022 2023 2024 2025 2026 2028 o n w ards 0 . 2 0 . 2 1 . 8 0 . 5 - 9.9 b

Natura &Co Latam Financial Performance
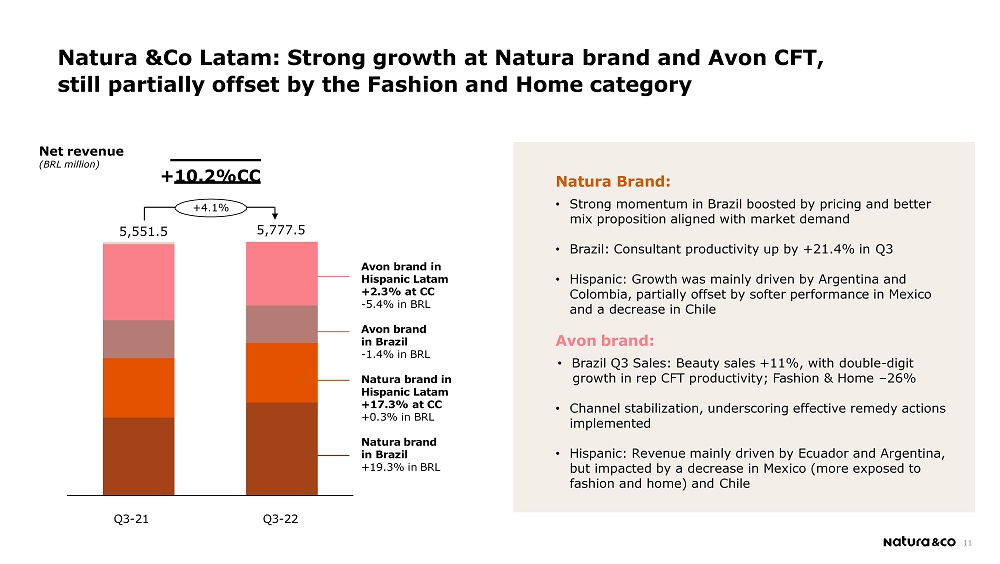
Avon brand in Hispanic Latam +2.3% at CC - 5.4% in BRL Avon brand in Brazil - 1.4% in BRL Natura brand in Hispanic Latam +17.3% at CC +0.3% in BRL Natura brand in Brazil +19.3% in BRL 5,551.5 5 , 777 . 5 Q3 - 21 Q3 - 22 + 10 . 2% C C +4.1% 11 Natura Brand: • Strong momentum in Brazil boosted by pricing and better mix proposition aligned with market demand • Brazil: Consultant productivity up by +21.4% in Q3 • Hispanic: Growth was mainly driven by Argentina and Colombia, partially offset by softer performance in Mexico and a decrease in Chile Avon brand: • Brazil Q3 Sales: Beauty sales +11%, with double - digit growth in rep CFT productivity; Fashion & Home – 26% • Channel stabilization, underscoring effective remedy actions implemented • Hispanic: Revenue mainly driven by Ecuador and Argentina, but impacted by a decrease in Mexico (more exposed to fashion and home) and Chile Natura &Co Latam: Strong growth at Natura brand and Avon CFT, still partially offset by the Fashion and Home category Net revenue (BRL million)
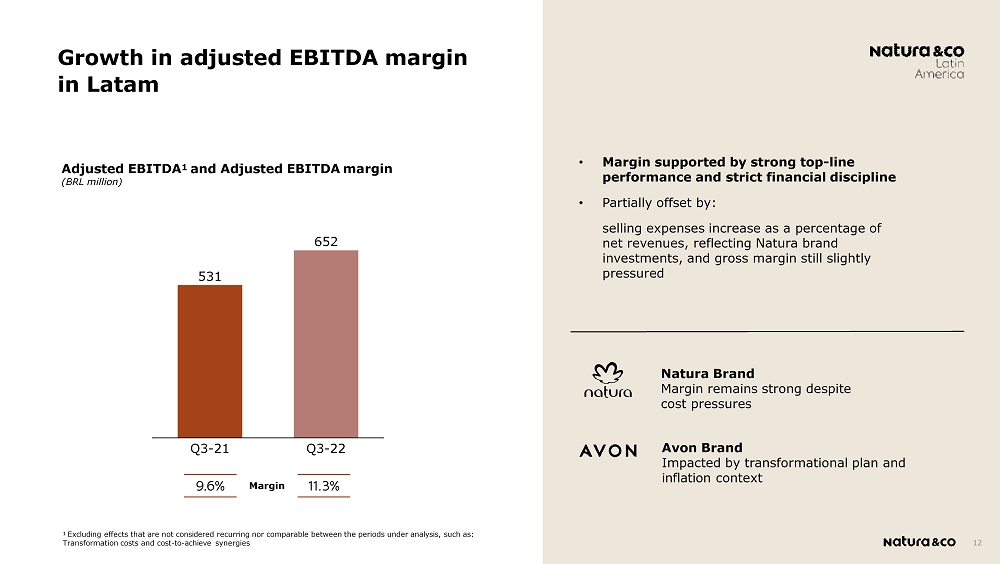
Adjusted EBITDA 1 and Adjusted EBITDA margin (BRL million) Mar g in • Margin supported by strong top - line performance and strict financial discipline • Partially offset by: selling expenses increase as a percentage of net revenues, reflecting Natura brand investments, and gross margin still slightly pressured 1 Excluding effects that are not considered recurring nor comparable between the periods under analysis, such as: Transformation costs and cost - to - achieve synergies 531 652 Q 3 - 22 Q 3 - 21 12 Natura Brand Margin remains strong despite cost pressures Avon Brand Impacted by transformational plan and inflation context Growth in adjusted EBITDA margin in Latam

Avon International Financial Performance

Ma rg in 81 60 Q 3 - 21 Q 3 - 22 2,054 1,648 Q 3 - 21 Q 3 - 22 - 19.8% - 8.1% CC ( - 3.1% Ex - Russia and Ukraine) Net revenue (BRL million) Adjusted EBITDA¹ and adjusted EBITDA margin (BRL million, %) 1 Excluding effects that are not considered recurring nor comparable between the periods under analysis, such as: Transformation costs and costs - to - achieve synergies i nt e rnat i o nal Revenue impacted by war in Ukraine • TMEA and APAC regions are showing growth, while Western Europe still showing softer performance • Further progress in new commercial model, with continued improvement in representative productivity, digitalization and top products performance Adjusted EBITDA margin slightly pressured by gross margin dynamic • Partially offset by the acceleration of transformation savings • Excluding Russia and Ukraine, Adj. EBITDA margin would have shown a significant improvement YoY 14 Sequential improvement in results, excluding Russia and Ukraine

The Body Shop Financial Performance
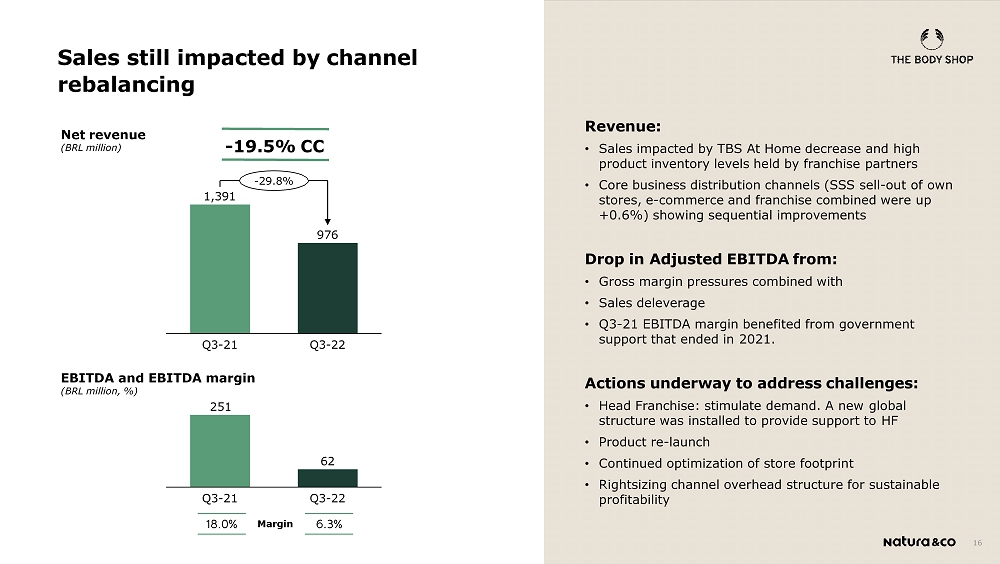
1,391 976 Q 3 - 21 Q 3 - 22 - 29.8% EBITDA and EBITDA margin (BRL million, %) 251 62 Q 3 - 21 Q 3 - 22 - 19.5% CC Net revenue (BRL million) Revenue: • Sales impacted by TBS At Home decrease and high product inventory levels held by franchise partners • Core business distribution channels (SSS sell - out of own stores, e - commerce and franchise combined were up +0.6%) showing sequential improvements Drop in Adjusted EBITDA from: • Gross margin pressures combined with • Sales deleverage • Q3 - 21 EBITDA margin benefited from government support that ended in 2021. Actions underway to address challenges: • Head Franchise: stimulate demand. A new global structure was installed to provide support to HF • Product re - launch • Continued optimization of store footprint • Rightsizing channel overhead structure for sustainable profitability Ma rg in 16 Sales still impacted by channel rebalancing

Aesop Financial Performance

553 603 Q 3 - 21 Q 3 - 22 + 8.9% Net revenue (BRL million) Adjusted EBITDA¹ and adjusted EBITDA margin (BRL million, %) +21.5% CC 108 102 Q 3 - 21 Q 3 - 22 Revenue growth driven by: • All regions delivered double - digit YoY growth , except for Europe that showed high single - digit growth, despite a deteriorating macro environment • Retail and wholesale showed solid growth , partially offset by a softer e - commerce performance, reflecting consumer behavior normalizing post - Covid China entry plans underway by year - end 2022 EBITDA margin reflects higher investments in: • Technology • Supply Chain • Sustainability to drive sustainable growth Mar g in 18 1 Excluding effects that are not considered recurring nor comparable between the periods under analysis, such as: expenses related to studies on a potential Aesop transaction Strong sales growth

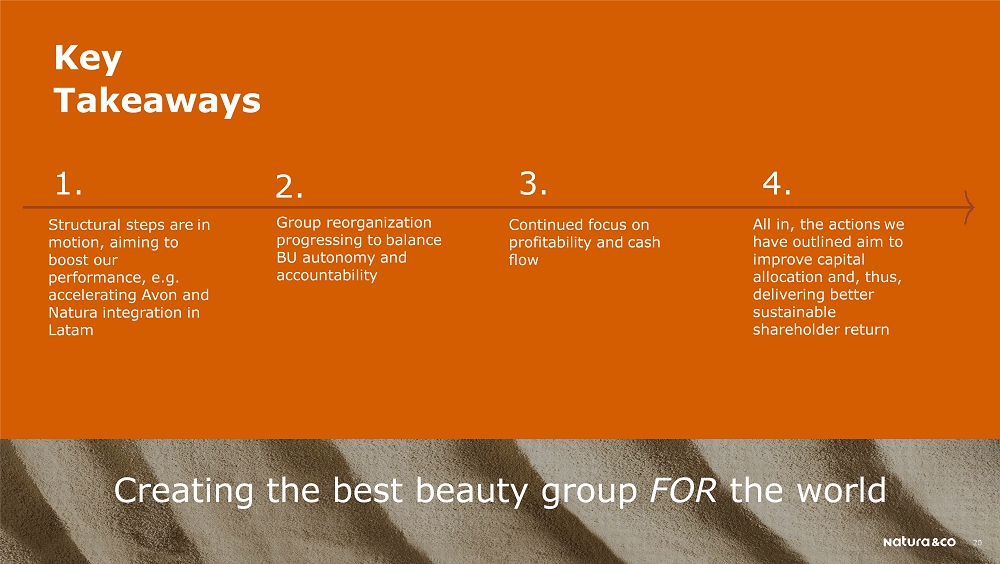
Continued focus on profitability and cash flow Creating the best beauty group FOR the world All in, the actions we have outlined aim to improve capital allocation and, thus, delivering better sustainable shareholder return 1. Structural steps are in motion, aiming to boost our performance, e.g. accelerating Avon and Natura integration in Latam 2. Group reorganization progressing to balance BU autonomy and accountability 3 . 4 . Key Tak e aways
Than k Y ou


Address the Climate Crisis & Protect the Amazon Protect Human Rights and be Human - Kind Embrace Circularity & Regeneration Human Rights Statement : In September 2022 , we proudly launched our Human Rights statement . Developed in line with the UN Guiding Principles on Business and Human Rights, this will act as a guide for how we work to protect the fundamental human rights of all those connected to our collective Investment in key causes: To mark its 135th anniversary, Avon announced that it would be making USD 1.35M worth of grants in 2022 to help create better futures for women. More than 30 grants are being donated, with a focus on NGOs providing vital support services to survivors of gender - based violence. The donations include USD 160,000 to UNFPA in Ukraine to support women impacted by gender - based violence through the ongoing war. The Aesop Foundation approved AUD 1.6m grants for a range of partners working in support of advancing education, employment, the environment, and emergency response. In Q3 as a Group, Natura &Co reached 11% of recycled plastic content of all plastic used cumulative Jan - Sept 2022) Amazon: In Q3 - 2022, Natura expanded the purchase of community inputs by 16% YoY and 166% the purchase of carbon credit in setting. PlenaMata (DETER/INPE) detected 0.5 m ha deforested in Q3 in the Amazon, an increase of 39% YoY. Through the PlenaMata portal, Natura established partnerships and supported mobilization and communication actions for zero deforestation in the Amazon in Brazil at festivals (Rock in Rio and Coala), in communication channels, a panel in Brasília and in a session at the Federal Senate. Also, the portal was recognized with the Eco Amcham - Brasil Award. TNFD: Taskforce Members from all five continents gathered in London for an in - person plenary meeting. Natura &Co was present, represented by f Sustainability VP Marcelo Behar, as TNFD Co - Chairs Elizabeth Mrema and David Craig guided the Taskforce Members through discussions of some key remaining design issues, in preparation for the coming iterations of the TNFD beta framework and the full framework that will launch in September 2023. While the 34 Taskforce Members serve in an individual capacity, they represent corporates, financial institutions, and market intermediaries with US$19.4trn in assets and a footprint in over 180 countries. 23 Advances on Sustainability Vision 2030 Commitment to Life
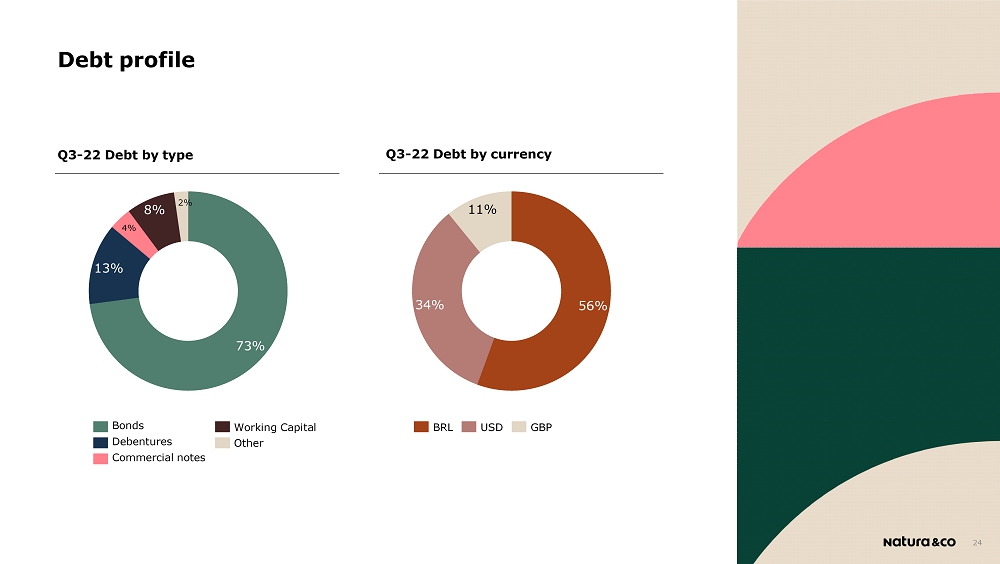
Q3 - 22 Debt by type Q3 - 22 Debt by currency 73% 13% 8% 4% 2% 56% 34% 11% Working Capital Other Bonds Debentures Commercial notes USD BRL G BP 24 Debt profile
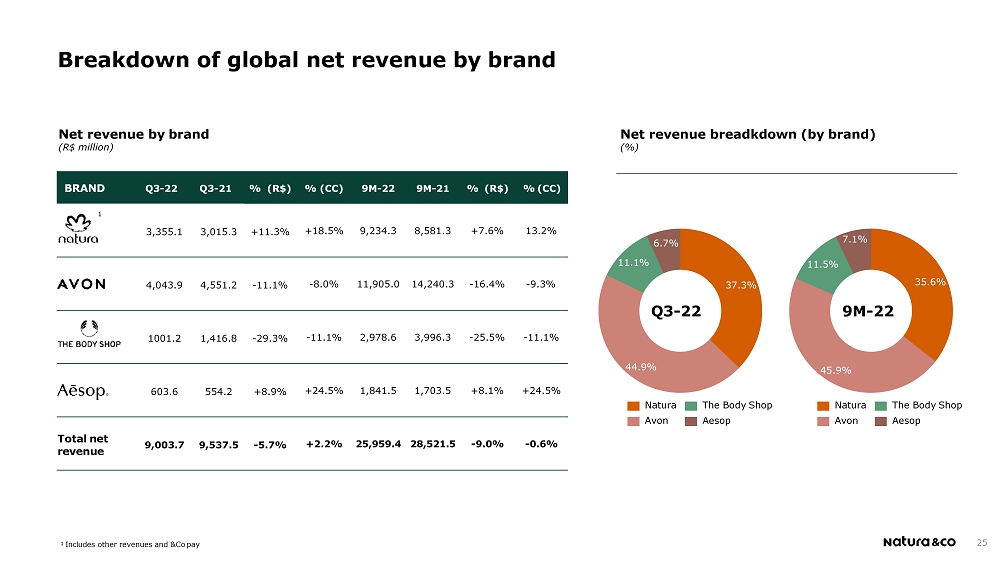
Net revenue by brand (R$ million) Net revenue breadkdown (by brand) (%) BRAND Q3 - 22 Q3 - 21 % (R$) % (CC) 9M - 22 9M - 21 % (R$) % (CC) 1 3,355.1 3,015.3 +11.3% +18.5% 9,234.3 8,581.3 + 7 . 6% 13 . 2% 4,043.9 4,551.2 - 11.1% - 8.0% 11,905.0 14,240.3 - 16 . 4% - 9.3% 1001.2 1,416.8 - 29.3% - 11.1% 2,978.6 3,996.3 - 25 . 5% - 11 . 1% 603.6 554.2 +8.9% +24.5% 1,841.5 1,703.5 + 8 . 1% + 24 . 5% Total net revenue 9,003.7 9,537.5 - 5.7% +2.2% 25,959.4 28,521.5 - 9 . 0 % - 0 . 6 % 1 Includes other revenues and &Co pay 37 . 3% 44 . 9% 11 . 1% 6.7% Nat u ra Avon The Body Shop Aesop Q 3 - 22 35 . 6% 45 . 9% 11 . 5% 7 . 1% Nat u ra Avon The Body Shop Aesop Breakdown of global net revenue by brand 9 M - 22