UNITED STATES
SECURITIES AND EXCHANGE COMMISSION
Washington, D.C. 20549
FORM 6-K
REPORT OF FOREIGN PRIVATE ISSUER PURSUANT TO RULE 13a-16 OR 15d-16 UNDER THE SECURITIES EXCHANGE ACT OF 1934
For the month of March, 2023
Commission File Number: 001-39169
Natura &Co Holding S.A.
(Exact name of registrant as specified in its charter)
Avenida Alexandre Colares, No. 1188, Sala A17-Bloco A
Parque Anhanguera
São Paulo, São Paulo 05106-000, Brazil
(Address of principal executive office)
Indicate by check mark whether the registrant files or will file annual reports under cover of Form 20-F or Form 40-F:
| Form 20-F | X | Form 40-F |
Indicate by check mark if the registrant is submitting the Form 6-K in paper as permitted by Regulation S-T Rule 101(b)(1):
| Yes | No | X |
Indicate by check mark if the registrant is submitting the Form 6-K in paper as permitted by Regulation S-T Rule 101(b)(7):
| Yes | No | X |
NATURA &CO HOLDING S.A.
TABLE OF CONTENTS
ITEM
| 1. | Earnings release of Natura &Co Holding S.A. for the fourth quarter of 2022. |
| 2. | Earnings presentation of Natura &Co Holding S.A. for the fourth quarter of 2022. |
SIGNATURE
Pursuant to the requirements of the Securities Exchange Act of 1934, the registrant has duly caused this report to be signed on its behalf by the undersigned, thereunto duly authorized.
| NATURA &CO HOLDING S.A. | |||
| By: | /s/ Guilherme Strano Castellan | ||
| Name: | Guilherme Strano Castellan | ||
| Title: | Principal Financial Officer | ||
| By: | /s/ Itamar Gaino Filho | ||
| Name: | Itamar Gaino Filho | ||
| Title: | Chief Legal and Compliance Officer | ||
Date: March 15, 2023.
Item 1
Earnings release of Natura &Co Holding S.A. for the fourth quarter of 2022.


São Paulo, March 13, 2023
Q4 22: Sales improvement in constant currency and continuous progress in cash conversion, despite pressure on adj. EBITDA margin
Strong momentum for Natura Brand and Avon CFT in Latam continues, especially Brazil; The Body Shop continues to show top line challenges
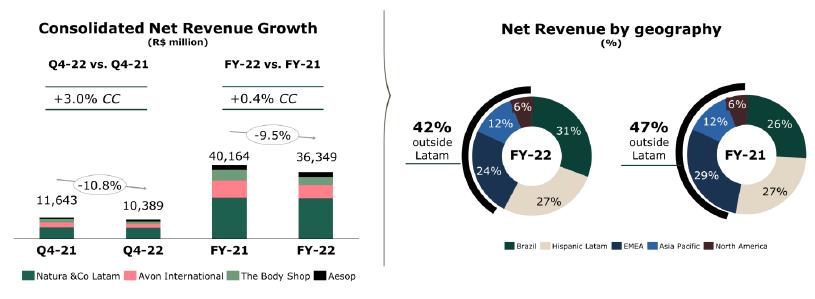
| · | Q4-22 consolidated net revenue of BRL 10.4 billion, +3.0% vs Q4-21 at constant currency and down 10.8% YoY in BRL due to a FX impact (mainly GBP, AUD and ARS depreciation against the BRL). Growth in CC was driven again by strong performance at Natura &Co Latam (+10.6% in CC) and Aesop (+18.2% in CC), partially offset by continued challenges at The Body Shop (-8.4% in CC) and Avon International (-9.9% in CC, -6.2% excluding Russia and Ukraine) |
| · | Q4-22 consolidated gross profit of BRL 6.6 billion, implying a 63.8% gross margin, down 60 bps compared to Q4-21. Margin was mostly impacted by The Body Shop and softer performance from Latam and Aesop, which more than offset YoY expansion at Avon International |
| · | Q4-22 consolidated adjusted EBITDA stood at BRL 1,095 million with margin of 10.5% (-280 bps YoY), as improving margin at Aesop combined with lower Holding expenses were offset by expected softer performances at Natura &Co Latam, Avon International and The Body Shop |
| · | Q4-22 Net Debt (excluding leasing) stood at BRL 7.4 billion (from BRL 8.8 billion in Q3-22). Despite softer EBITDA YoY, the BRL 1.4 billion QoQ improvement in net debt was stronger than the improvement delivered in Q4-21 (of BRL 1.2 billion), mainly on the back of better working capital and cash tax dynamics. This shows a continuation of cash conversion improvement |
| · | Q4-22 Net loss of BRL 890 million in the quarter, driven mainly by a soft EBITDA (impacted by BRL 383 million of non- cash impairment), high net financial expenses and losses from discontinued operations |
| Consolidated Financial Results (R$ million) | Q4-22 | Q4-21 | ∆ | FY 22 | FY 21 | ∆ |
| Net Revenue | 10,389.8 | 11,643.2 | - 10.8% | 36,349.6 | 40,164.7 | - 9.5% |
| Constant Currency Change | 3.0% | 0.4% | ||||
| Gross Profit | 6,626.9 | 7,499.2 | - 11.6% | 23,194.6 | 26,066.8 | - 11.0% |
| Gross Margin | 63.8% | 64.4% | -60 bps | 63.8% | 64.9% | -110 bps |
| Adjusted EBITDA | 1,095.4 | 1,542.9 | - 29.0% | 3,158.7 | 4,137.3 | - 23.7% |
| Adjusted EBITDA Margin | 10.5% | 13.3% | -280 bps | 8.7% | 10.3% | -160 bps |
| Net Income (loss) attributable to controlling shareholders | (890.4) | 695.5 | - 228.0% | (2,859.6) | 1,047.9 | - 372.9% |
| Net Margin | -8.6% | 6.0% | -1450 bps | -7.9% | 2.6% | -1050 bps |
Fabio Barbosa, Group CEO of Natura &Co, declared:
“We started 2022 navigating in a challenging macroenvironment, which worsened with the war in Ukraine, and uncertainty surrounding the performance of a few business units after a post-pandemic change in consumer behavior. In this environment, we decided in mid-2022 to reassess the group’s growth model to enter a new stabilization cycle. Important changes were carried out, such as a stronger focus on profitability and cash conversion (with incentives adjusted accordingly), a revision of the cost structure and the role of the Holding company, alongside important revisions in our global footprint in order to position the business for success going forward.
FY2022 showed stable revenue at constant currency while adjusted EBITDA margin decreased 160 bps. In the fourth quarter, sales growth improved at constant currency and we delivered further progress in cash conversion, in line with our priorities. We continued to see very strong momentum at the Natura brand, especially in Brazil, and at Aesop. We also saw a solid performance by Avon in the beauty category in Latin America, strengthening our confidence in the potential of the second wave of integration of our businesses in the region.
Structural steps to create sustainable shareholder value are in motion in all our brands. At Natura &Co Latam, we are accelerating the integration of Natura and Avon in order to capture the full benefits of the combination in the region. At Aesop, we are evaluating strategic options aiming to improve the Company’s capital structure. At Avon International, we are continuing to optimize its geographic footprint in order to concentrate on profitable markets while reducing the cost structure. At The Body Shop, we are rightsizing the business, focusing on efficiencies and the core retail model in the face of the challenging channel mix changes it has experienced.
Looking forward, we are confident that the actions we are taking will position Natura &Co to focus not only on profitability and cash, but also to return to growth. While we expect 2023 to be another challenging year, our focus on cash generation and improving the Company’s capital structure will allow us to invest in our priorities, building the path to unlock significant value. We expect a continuous improvement in revenues, as well as better adjusted profitability and cash generation, while continuing to invest in the transformational actions mentioned above.
At the same time, the Group continues to focus on what made the group what it is today, its ESG agenda: The Avon Foundation, The Body Shop and Aesop used their networks to make donations to the victims of the earthquakes in Turkey and Syria through such institutions as the Red Cross and Médecins sans Frontières. Natura &Co matched those efforts to support humanitarian relief. We remain as focused as ever on our commitment to the environment and social impact. We see our commitment on protecting the Amazon and its biodiversity, the social inclusion of ~8 million reps and constituting a platform for female empowerment as core elements of our DNA and true sources of competitive advantage.”
Key Financial Results per Business Unit
| Q4-22 vs. Q4-21 | FY22 vs. FY21 | ||||||||||
| Net Revenue (R$ million) | ∆ % Reported Currency | ∆ % CC | Adj. EBITD∆ Margin | ∆ Adj. EBITDA | Net Revenue (R$ million) | ∆ % Reported Currency | ∆ % CC | Adj. EBITDA Margin | ∆ Adj. EBITDA | ||
| Consolidated | 10,389.8 | -10.8% | 3.0% | 10.5% | -280 bps | 36,349.6 | -9.5% | 0.4% | 8.7% | -160 bps | |
| Natura &Co Latam | 5,943.2 | -3.2% | 10.6% | 8.9% | -320 bps | 22,027.3 | -1.7% | 6.3% | 10.0% | -120 bps | |
| Avon International | 2,062.6 | -23.8% | -9.9% | 5.8% | -490 bps | 7,196.0 | -22.9% | -9.9% | 4.3% | -170 bps | |
| The Body Shop | 1,504.4 | -20.6% | -8.4% | 21.4% | -80 bps | 4,407.2 | -24.3% | -13.5% | 10.9% | -670 bps | |
| Aesop | 879.6 | -2.1% | 18.2% | 28.6% | 190 bps | 2,718.7 | 4.6% | 21.0% | 21.7% | -230 bps | |
| · | Natura &Co Latam: Q4-22 net revenue up by +10.6% in CC, and down -3.2% in BRL, driven by strong double-digit growth in CC at the Natura brand, partially offset by slightly positive CC sales at Avon Latam and the BRL’s appreciation versus other Latam currencies |
| · | Natura brand in Latam: Net revenue was up +17.5% in Q4-22 in CC and +3.1% in BRL, with strong momentum in Brazil and further growth in Hispanic Latam. In Brazil, net revenue grew +17.9% in Q4-22, supported by strong consultant productivity growth combined with outstanding retail performance. Even amid political and economic turmoil, especially in Argentina, Chile and Peru, net revenue in Hispanic Latam was up +16.9% in CC, and down -18.6% in BRL. Growth was mainly driven by acceleration in Argentina, Colombia and Mexico. Excluding Argentina, revenue in Hispanic markets was up mid-single digits in CC, impacted by softer performance from Peru and Chile |
| · | Avon brand in Latam: Net revenue was up +2.2% in CC, and down -11.2% in BRL. In Brazil, net revenue continued to improve sequentially to +7.5%, entering positive territory, favored by a softer comparable base. The beauty category showed solid +12% top line growth, while the Fashion and Home category was down -10%, in line with our optimization process. In Hispanic markets, net revenue deteriorated -1.1% in Q4-22 in CC (or –19.5% in BRL), mainly due to Argentina, but also impacted by a decrease in Mexico, Peru and Chile. The beauty category grew +7.3% in CC, but was more than offset by F&H |
| · | Natura &Co Latam’s Q4-22 adjusted EBITDA margin was 8.9%, -320 bps vs. Q4-21. Strong top line performance and strict financial discipline were more than offset by the impact of higher G&A increase as a percentage of net revenues, reflecting inflationary pressures (which grew at higher rate than revenue at Avon Latam), higher investments in R&D (especially for the Natura brand, where we are accelerating investments in marketing and innovation) and increased quarterly phasing expenses including accrual for annual management compensation |
| · | Avon International |
| · | Q4-22 net revenue was down -9.9% YoY in CC (or -23.8% in BRL). Excluding Russia and Ukraine, revenue decreased -6.2% compared to Q4-21. One-off supply chain issues also had an estimated unfavorable impact of 2 p.p. of total sales. Although still impacted by the tough macro environment, Avon International was able to pass through inflation and FX pressure to prices, which also benefits rep productivity. Fundamentals of the distribution channel continue to show improvements (rep productivity, activity rate, digitalization, and top products performance) |
| · | Q4-22 adjusted EBITDA margin stood at 5.8%, down 490 bps YoY. The gross margin expansion of 230bps and continued focus on transformation savings, were more than offset by the sales deleverage, and other quarterly phasing of expenses. Q4-22 included an increase in costs related to management compensation, while the Q4-21 period benefited from a release of the incentives provisions, as indicated last year |
| · | The Body Shop |
| · | Q4-22 net revenue was down -8.4% in CC and -20.6% in BRL. Top line showed an improvement compared to Q3-22 (which was -19.5% in CC), but on the back of a softer comparable base. Combined sales of core business distribution channels (stores, e-commerce and franchise) showed a low single digit decline in CC, improving compared to Q3-22 (when sales dropped in high single digits) indicating the significant impact of The Body Shop at Home, which has returned to pre-pandemic levels |
| · | Q4-22 EBITDA margin was 21.4%, down 80 bps on a YoY basis. The 350 bps of gross margin pressure was partially offset by strict cost control and early returns on overhead restructuring efforts that led to a 270 bps efficiency gain of SG&A as a percentage of net revenues (despite the sales deleverage impact) |
| · | Aesop |
| · | Q4-22 net revenue increased +18.2% in CC and was down -2.1% in BRL. All regions delivered double-digit YoY growth, despite a deteriorating macro environment. Retail and wholesale showed solid growth, partially offset by a softer e-commerce performance reflecting post-Covid normalization of consumer behavior. The brand also made a successful entry into China, with very strong performance that exceeded expectations |
| · | Q4-22 adjusted EBITDA margin was 28.6%, up +190 bps YoY, still pressured by planned investments to deliver sustainable future growth, but more than offset by sales leverage |
1. Results analysis
The Group segmentation is composed of:
| · | Natura &Co Latam, which includes all the brands in Latin America: Natura, Avon, The Body Shop and Aesop |
| · | Avon international, which includes all markets, excluding Latin America |
| · | The Body Shop ex-Latin America, and |
| · | Aesop ex-Latin America |
In addition, the results and analysis for the periods under comparison include the effects of the fair market value assessment as a result of the business combination with Avon as per the Purchase Price Allocation - PPA
| Profit and Loss by Business | |||||||||||||||
| R$ million | Consolidated a Q4-22c Q4-21c Ch. % | Natura &Co Latam b Q4-22 c Q4-21 c Ch. % | Avon International Q4-22c Q4-21c Ch. % | The Body Shop Q4-22 Q4-21 Ch. % | Aesop Q4-22 Q4-21 Ch. % | ||||||||||
| Gross Revenue | 13,501.4 | 15,023.0 | (10.1) | 7,886.9 | 8,079.1 | (2.4) | 2,456.4 | 3,248.4 | (24.4) | 2,181.7 | 2,677.8 | (18.5) | 976.6 | 1,017.7 | (4.0) |
| Net Revenue | 10,389.8 | 11,643.2 | (10.8) | 5,943.2 | 6,142.3 | (3.2) | 2,062.6 | 2,708.1 | (23.8) | 1,504.4 | 1,893.9 | (20.6) | 879.6 | 898.9 | (2.1) |
| COGS | (3,762.9) | (4,144.1) | (9.2) | (2,410.4) | (2,449.7) | (1.6) | (802.2) | (1,115.5) | (28.1) | (373.8) | (404.1) | (7.5) | (176.6) | (174.7) | 1.1 |
| Gross Profit | 6,626.9 | 7,499.2 | (11.6) | 3,532.7 | 3,692.6 | (4.3) | 1,260.4 | 1,592.6 | (20.9) | 1,130.6 | 1,489.8 | (24.1) | 703.0 | 724.2 | (2.9) |
| Selling, Marketing and Logistics Expenses | (4,334.7) | (4,956.0) | (12.5) | (2,384.2) | (2,449.5) | (2.7) | (853.5) | (1,147.1) | (25.6) | (770.8) | (1,002.1) | (23.1) | (326.3) | (357.3) | (8.7) |
| Administrative, R&D, IT and Projects Expenses | (1,771.7) | (1,566.1) | 13.1 | (874.7) | (736.9) | 18.7 | (430.3) | (355.3) | 21.1 | (256.2) | (274.6) | (6.7) | (207.2) | (204.0) | 1.6 |
| Corporate Expenses | (121.0) | (157.4) | (23.1) | - | - | - | - | - | - | - | - | - | - | - | - |
| Other Operating Income/ (Expenses), Net | (435.2) | 34.9 | (1,348.0) | (43.4) | 45.2 | (195.9) | (316.9) | 5.0 | (6,380.0) | (41.5) | (15.6) | 165.4 | (31.1) | (1.7) | 1,736.2 |
| Transformation / Integration / Group Restructuring Costs | (117.0) | (89.7) | 30.5 | (56.9) | (42.6) | 33.6 | (59.5) | (42.9) | 38.7 | - | - | - | - | - | - |
| Depreciation | 690.6 | 731.9 | (5.6) | 252.6 | 233.5 | 8.2 | 176.0 | 195.7 | (10.1) | 180.8 | 223.5 | (19.1) | 81.2 | 79.2 | 2.5 |
| EBITDA | 537.8 | 1,496.8 | (64.1) | 426.2 | 742.3 | (42.6) | (223.8) | 248.1 | (190.2) | 242.9 | 421.0 | (42.3) | 219.6 | 240.4 | (8.7) |
Depreciation | (690.6) | (731.9) | (5.6) | ||||||||||||
| Financial Income/(Expenses), Net | (523.6) | (300.6) | 74.2 | ||||||||||||
| Earnings Before Taxes | (676.3) | 464.4 | (245.6) | ||||||||||||
| Income Tax and Social Contribution | (14.8) | 298.7 | (105.0) | ||||||||||||
| Discontinued operations d | (199.2) | (67.6) | 194.6 | ||||||||||||
| Consolidated Net Income | (890.4) | 695.4 | (228.0) | ||||||||||||
| Non-controlling Interest | - | - | - | ||||||||||||
| Net Income attributable to controlling shareholders | (890.4) | 695.4 | (228.0) | ||||||||||||
| Gross Margin | 63.8% | 64.4% | -60 bps | 59.4% | 60.1% | -70 bps | 61.1% | 58.8% | 230 bps | 75.2% | 78.7% | -350 bps | 79.9% | 80.6% | -70 bps |
| Selling, Marketing and Logistics Exp./Net Revenue | 41.7% | 42.6% | -90 bps | 40.1% | 39.9% | 20 bps | 41.4% | 42.4% | -100 bps | 51.2% | 52.9% | -170 bps | 37.1% | 39.7% | -260 bps |
| Admin., R& D, IT, and Projects Exp./Net Revenue | 17.1% | 13.5% | 360 bps | 14.7% | 12.0% | 270 bps | 20.9% | 13.1% | 780 bps | 17.0% | 14.5% | 250 bps | 23.6% | 22.7% | 90 bps |
| EBITDA Margin | 5.2% | 12.9% | -770 bps | 7.2% | 12.1% | -490 bps | (10.9)% | 9.2% | -2010 bps | 16.1% | 22.2% | -610 bps | 25.0% | 26.7% | -170 bps |
| Net Margin | (8.6)% | 6.0% | -1460 bps | - | - | - | - | - | - | - | - | - | - | - | - |
a Consolidated results include Natura &Co Latam, Avon International, The Body Shop and Aesop, as well as the Natura subsidiaries in the U.S., France and the Netherlands.
b Natura &Co Latam: includes Natura, Avon, TBS Brazil and Hispanic Latam, Aesop Brazil and &Co Pay
c Includes PPA – Purchase Price Allocation effects
d Related to business separation at Avon North America
| Profit and Loss by Business | |||||||||||||||
R$ million | Consolidated a FY22 c FY21 c Ch. % | Natura &Co Latam b FY22 c FY21 c Ch. % | Avon International FY22 c FY21 c Ch. % | The Body Shop FY22 FY21 Ch. % | Aesop FY22 FY21 Ch. % | ||||||||||
| Gross Revenue | 47,108.7 | 51,642.9 | (8.8) | 29,295.8 | 29,692.1 | (1.3) | 8,590.9 | 11,188.9 | (23.2) | 6,180.9 | 7,842.9 | (21.2) | 3,041.1 | 2,919.0 | 4.2 |
| Net Revenue | 36,349.6 | 40,164.7 | (9.5) | 22,027.3 | 22,413.4 | (1.7) | 7,196.0 | 9,329.3 | (22.9) | 4,407.2 | 5,821.8 | (24.3) | 2,718.7 | 2,600.2 | 4.6 |
| COGS | (13,155.0) | (14,097.9) | (6.7) | (8,880.2) | (8,833.1) | 0.5 | (2,890.6) | (3,698.2) | (21.8) | (1,032.5) | (1,236.7) | (16.5) | (351.7) | (329.9) | 6.6 |
| Gross Profit | 23,194.6 | 26,066.8 | (11.0) | 13,147.1 | 13,580.3 | (3.2) | 4,305.5 | 5,631.1 | (23.5) | 3,374.7 | 4,585.1 | (26.4) | 2,367.1 | 2,270.3 | 4.3 |
| Selling, Marketing and Logistics Expenses | (16,160.6) | (17,750.7) | (9.0) | (8,950.4) | (9,062.8) | (1.2) | (3,213.3) | (4,162.7) | (22.8) | (2,651.6) | (3,259.1) | (18.6) | (1,345.2) | (1,266.0) | 6.3 |
| Administrative, R&D, IT and Projects Expenses | (6,161.7) | (6,399.5) | (3.7) | (3,011.0) | (2,906.1) | 3.6 | (1,410.6) | (1,734.8) | (18.7) | (965.4) | (1,064.7) | (9.3) | (743.5) | (676.6) | 9.9 |
| Corporate Expenses | (391.3) | (559.4) | (30.0) | - | - | - | - | - | - | - | - | - | - | - | - |
| Other Operating Income/ (Expenses), Net | (297.9) | 272.0 | (209.5) | 70.7 | 301.2 | (76.5) | (225.7) | (2.4) | 9,344.7 | (86.2) | (33.4) | 158.4 | (44.9) | 1.8 | (2,638.0) |
| Transformation / Integration / Group Restructuring Costs | (640.9) | (511.0) | 25.4 | (256.2) | (188.9) | 35.6 | (214.3) | (289.4) | (25.9) | - | - | - | - | - | - |
| Depreciation | 2,591.9 | 2,791.5 | (7.2) | 912.4 | 872.0 | 4.6 | 683.8 | 830.9 | (17.7) | 692.1 | 795.1 | (13.0) | 303.4 | 293.5 | 3.4 |
| EBITDA | 2,134.1 | 3,909.7 | (45.4) | 1,912.6 | 2,595.7 | (26.3) | (74.7) | 272.8 | (127.4) | 363.6 | 1,023.1 | (64.5) | 536.7 | 622.9 | (13.8) |
| Depreciation | (2,591.9) | (2,791.5) | (7.2) | ||||||||||||
| Financial Income/(Expenses), Net | (1,900.9) | (1,027.0) | 85.1 | ||||||||||||
| Earnings Before Taxes | (2,358.6) | 91.2 | (2,685.3) | ||||||||||||
| Income Tax and Social Contribution | (119.6) | 1,048.0 | (111.4) | ||||||||||||
| Discontinued operations d | (380.4) | (98.5) | 286.0 | ||||||||||||
| Consolidated Net Income | (2,858.6) | 1,040.7 | (374.7) | ||||||||||||
| Non-controlling Interest | (1.0) | 7.3 | (113.8) | ||||||||||||
| Net Income attributable to controlling shareholders | (2,859.6) | 1,047.9 | (372.9) | ||||||||||||
| Gross Margin | 63.8% | 64.9% | -110 bps | 59.7% | 60.6% | -90 bps | 59.8% | 60.4% | -60 bps | 76.6% | 78.8% | -220 bps | 87.1% | 87.3% | -20 bps |
| Selling, Marketing and Logistics Exp./Net Revenue | 44.5% | 44.2% | 30 bps | 40.6% | 40.4% | 20 bps | 44.7% | 44.6% | 10 bps | 60.2% | 56.0% | 420 bps | 49.5% | 48.7% | 80 bps |
| Admin., R&D, IT, and Projects Exp./Net Revenue | 17.0% | 15.9% | 110 bps | 13.7% | 13.0% | 70 bps | 19.6% | 18.6% | 100 bps | 21.9% | 18.3% | 360 bps | 27.3% | 26.0% | 130 bps |
| EBITDA Margin | 5.9% | 9.7% | -380 bps | 8.7% | 11.6% | -290 bps | (1.0)% | 2.9% | -390 bps | 8.3% | 17.6% | -930 bps | 19.7% | 24.0% | -430 bps |
| Net Margin | (7.9)% | 2.6% | -1050 bps | - | - | - | - | - | - | - | - | - | - | ||
a Consolidated results include Natura &Co Latam, Avon International, The Body Shop and Aesop, as well as the Natura subsidiaries in the U.S., France and the Netherlands.
b Natura &Co Latam: includes Natura, Avon, TBS Brazil and Hispanic Latam, Aesop Brazil and &Co Pay
c Includes PPA – Purchase Price Allocation effects
d Related to business separation at Avon North America
Consolidated net revenue
| · | Q4-22 consolidated net revenue was up 3.0% in constant currency, and down -10.8% in BRL, reflecting strong growth at the Natura brand and Aesop and improving trends at the Avon brand in Latam, but partially offset by a decrease at The Body Shop and Avon International |
| · | Q4 revenue from G12 market currencies at CC totaled 24.0% in Q4-22 vs 24.2% in Q4-21 (G12 market currencies are: GBP, EUR, USD, AUD, YEN, CAD, SEK and CHF) |
| · | With operations in ~100 countries, 42% of net revenue came from outside Latam |
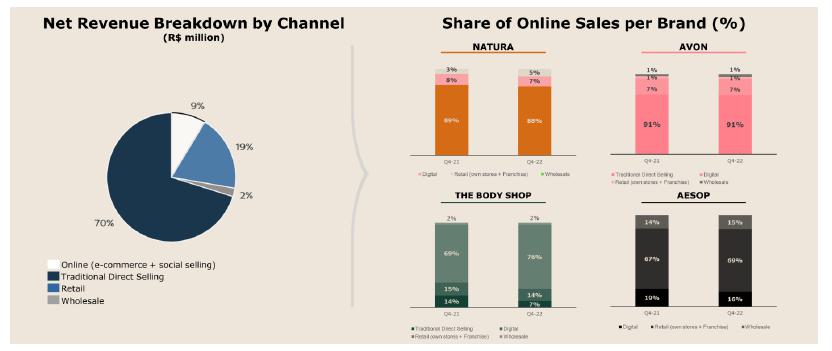
Digital Sales
Digital sales, which include online sales and social selling, were broadly stable as a percentage of revenues for all the business units, with the exception of Aesop, where they dropped three percentage points to 16% (vs. 19% Q4-21) on the back of very strong performance from the retail and wholesale channels. Still Aesop shows the highest level of digitalization of all the business units.
Relationship selling using apps: For Natura Latam the penetration of digital (consultants who logged in at least once to the digital catalog or the app during the quarter) reached an impressive 82.1% in Q4-22 compared to 80.5% in Q4-21. Furthermore, at Avon International, penetration of the Avon On app (active representatives who logged in at least once in the last three campaigns) reached 30.6% in Q4-22, compared to 25.5% in Q4-21.
Gross margin
| · | Consolidated gross margin stood at 63.8% in Q4-22, -60 bps vs. Q4-21 |
| · | Gross margin was mainly impacted by continued pressure on profitability at The Body Shop and softer performance from Natura &Co Latam and Aesop, which more than offset YoY expansion at Avon International |
| · | As previously mentioned, although some commodity prices decreased over the last months, Natura & Co buys the valued-added material. The input prices are correlated to commodity prices, but that dynamic has been more than offset by rising energy prices and overall inflation (especially on wages) |
Q4-22 Gross Margin
| R$ million | Consolidated | Natura &Co Latam | Avon International | The Body Shop | Aesop | ||||||||||
| Q4-22 | Q4-21 | Ch. % | Q4-22 | Q4-21 | Ch. % | Q4-22 | Q4-21 | Ch. % | Q4-22 | Q4-21 | Ch. % | Q4-22 | Q4-21 | Ch. % | |
| Net Revenue | 10,389.8 | 11,643.2 | (10.8) | 5,943.2 | 6,142.3 | (3.2) | 2,062.6 | 2,708.1 | (23.8) | 1,504.4 | 1,893.9 | (20.6) | 879.6 | 898.9 | (2.1) |
| COGS | (3,762.9) | (4,144.1) | (9.2) | (2,410.4) | (2,449.7) | (1.6) | (802.2) | (1,115.5) | (28.1) | (373.8) | (404.1) | (7.5) | (176.6) | (174.7) | 1.1 |
| Gross Profit | 6,626.9 | 7,499.2 | (11.6) | 3,532.9 | 3,692.6 | (4.3) | 1,260.4 | 1,592.6 | (20.9) | 1,130.6 | 1,489.8 | (24.1) | 703.0 | 724.2 | (2.9) |
| Gross Margin | 63.8% | 64.4% | -60 bps | 59.4% | 60.1% | -70 bps | 61.1% | 58.8% | 230 bps | 75.2% | 78.7% | -350 bps | 79.9% | 80.6% | -70 bps |
2022 Gross Margin
| R$ million | Consolidated | Natura &Co Latam | Avon International | The Body Shop | Aesop | ||||||||||
| FY22 | FY21 | Ch. % | FY22 | FY21 | Ch. % | FY22 | FY21 | Ch. % | FY22 | FY21 | Ch. % | FY22 | FY21 | Ch. % | |
| Net Revenue | 36,349.6 | 40,164.7 | (9.5) | 22,027.3 | 22,413.4 | (1.7) | 7,196.0 | 9,329.3 | (22.9) | 4,407.2 | 5,821.8 | (24.3) | 2,718.7 | 2,600.2 | 4.6 |
| COGS | (13,155.0) | (14,097.9) | (6.7) | (8,880.2) | (8,833.1) | 0.5 | (2,890.6) | (3,698.2) | (21.8) | (1,032.5) | (1,236.7) | (16.5) | (351.7) | (329.9) | 6.6 |
| Gross Profit | 23,194.6 | 26,066.8 | (11.0) | 13,147.1 | 13,580.3 | (3.2) | 4,305.4 | 5,631.1 | (23.5) | 3,374.7 | 4,585.1 | (26.4) | 2,367.0 | 2,270.3 | 4.3 |
| Gross Margin | 63.8% | 64.9% | -110 bps | 59.7% | 60.6% | -90 bps | 59.8% | 60.4% | -60 bps | 76.6% | 78.8% | -220 bps | 87.1% | 87.3% | -20 bps |
Operating Expenses
| · | Consolidated Selling, Marketing & Logistics expenses stood at 41.7% of net revenue (-90 bps vs. Q4-21) |
| · | Consolidated Administrative, R&D, IT and Project expenses reached 17.1% of net revenue, (+360 bps vs Q4-21) |
| · | SG&A expenses (both lines above combined) increased by +270 bps in Q4-22 on a YoY basis. This quarter was particularly impacted by increased costs related to phasing of expenses (including but not limited to annual management compensation and project related expenses) and inflationary pressures across all business units. Also, the YoY comparison is impacted by the fact that Q4-21 benefited from a release of incentives provisions |
| · | Corporate expenses stood at BRL 121 million, down an 23.1% vs. Q4-21, benefiting from the initiatives implemented by the Transition Committee (aiming at a simpler and leaner structure), but impacted by the BRL 25 million of phasing expenses mentioned last quarter. In FY22, corporate expenses have already showed a 30.0% decrease compared to FY21 |
| · | Other operating income/expenses were BRL -435 million (down from BRL +35 million in Q4-21), mostly impacted by BRL 383 million of non-cash impairment (related to primarily Avon International, with additional impairments at TBS in a lower proportion), with the remainder coming from The Body Shop restructuring costs and Aesop one-off expenses |
| · | Transformation / Integration / Group Restructuring costs were BRL 117 million, up +30.5% mainly impacted by severance costs as further integration of Natura and Avon accelerates and Avon International continues to adjust its cost structure |
Q4-22 Operating Expenses
| SG&A Expenses (R$ million) | Consolidated | Natura &Co Latam | Avon International | The Body Shop | Aesop | ||||||||||
| Q4-22 | Q4-21 | Ch. % | Q4-22 | Q4-21 | Ch. % | Q4-22 | Q4-21 | Ch. % | Q4-22 | Q4-21 | Ch. % | Q4-22 | Q4-21 | Ch. % | |
| Selling, Marketing and Logistics Expenses | (4,334.7) | (4,956.0) | (12.5) | (2,384.2) | (2,449.5) | (2.7) | (853.5) | (1,147.1) | (25.6) | (770.8) | (1,002.1) | (23.1) | (326.3) | (357.3) | (8.7) |
| Administrative, R&D, IT and Projects Expenses | (1,771.7) | (1,566.1) | 13.1 | (874.7) | (736.9) | 18.7 | (430.3) | (355.3) | 21.1 | (256.2) | (274.6) | (6.7) | (207.2) | (204.0) | 1.6 |
| SG&A Expenses | (6,106.4) | (6,522.1) | (6.4) | (3,258.9) | (3,186.4) | 2.3 | (1,283.8) | (1,502.4) | (14.5) | (1,027.0) | (1,276.6) | (19.6) | (533.5) | (561.3) | (5.0) |
| Selling, Marketing and Logistics (% of Net Revenue) | 41.7% | 42.6% | -90 bps | 40.1% | 39.9% | 20 bps | 41.4% | 42.4% | -100 bps | 51.2% | 52.9% | -170 bps | 37.1% | 39.7% | -260 bps |
| Admin., R&D, IT, and Projects Exp. (% of Net Revenue) | 17.1% | 13.5% | 360 bps | 14.7% | 12.0% | 270 bps | 20.9% | 13.1% | 780 bps | 17.0% | 14.5% | 250 bps | 23.6% | 22.7% | 90 bps |
2022 Operating Expenses
| SG&A Expenses (R$ million) | Consolidated | Natura &Co Latam | Avon International | The Body Shop | Aesop | ||||||||||
| FY22 | FY21 | Ch. % | FY22 | FY21 | Ch. % | FY22 | FY21 | Ch. % | FY22 | FY21 | Ch. % | FY22 | FY21 | Ch. % | |
| Selling, Marketing and Logistics Expenses | (16,160.6) | (17,750.7) | (9.0) | (8,950.4) | (9,062.8) | (1.2) | (3,213.3) | (4,162.7) | (22.8) | (2,651.6) | (3,259.1) | (18.6) | (1,345.2) | (1,266.0) | 6.3 |
| Administrative, R&D, IT and Projects Expenses | (6,161.7) | (6,399.5) | (3.7) | (3,011.0) | (2,906.1) | 3.6 | (1,410.6) | (1,734.8) | (18.7) | (965.4) | (1,064.7) | (9.3) | (743.5) | (676.6) | 9.9 |
| SG&A Expenses | (22,322.3) | (24,150.2) | (7.6) | (11,961.4) | (11,968.9) | (0.1) | (4,623.9) | (5,897.5) | (21.6) | (3,617.0) | (4,323.8) | (16.3) | (2,088.7) | (1,942.6) | 7.5 |
| Selling, Marketing and Logistics (% of Net Revenue) | 44.5% | 44.2% | 30 bps | 40.6% | 40.4% | 20 bps | 44.7% | 44.6% | 10 bps | 60.2% | 56.0% | 420 bps | 49.5% | 48.7% | 80 bps |
| Admin., R&D, IT, and Projects Exp. (% of Net Revenue) | 17.0% | 15.9% | 110 bps | 13.7% | 13.0% | 70 bps | 19.6% | 18.6% | 100 bps | 21.9% | 18.3% | 360 bps | 27.3% | 26.0% | 130 bps |
Consolidated EBITDA
Q4-22 Adjusted EBITDA was BRL1,095 million, with an adjusted margin of 10.5% (-280 bps YoY). Q4-22 margin reflected different moving parts and dynamics for each business unit and at the Holding level:
| · | improvement of Holding expenses (-23.1% on a YoY basis) |
| · | improving margin at Aesop amid strong top-line growth |
| · | slight margin pressure at The Body Shop mainly due to sales deleverage and channel mix, partially offset by strict financial discipline |
| · | Natura &Co Latam adjusted EBITDA margin pressure impacted by phasing of expenses and higher investments |
| · | margin pressure from Avon International also impacted by phasing of annual expenses |
Q4-22: Adjusted EBITDA
| R$ million | Consolidated EBITDA | Natura &Co Latam | Avon International | The Body Shop | Aesop | ||||||||||
| Q4-22 | Q4-21 | Ch. % | Q4-22 | Q4-21 | Ch. % | Q4-22 | Q4-21 | Ch. % | Q4-22 | Q4-21 | Ch. % | Q4-22 | Q4-21 | Ch. % | |
| Consolidated EBITDA | 537.8 | 1,496.9 | (64.1) | 426.2 | 742.3 | (42.6) | (223.8) | 248.1 | (190.2) | 242.9 | 421.0 | (42.3) | 219.6 | 240.4 | (8.7) |
| Transformation / Integration Costs (1) | 117.0 | 89.7 | 30.5 | 56.9 | 42.6 | 33.6 | 59.5 | 42.9 | 38.7 | - | - | - | - | - | - |
| (i) Transformation costs | 59.5 | 44.2 | 34.6 | - | - | - | 59.5 | 42.9 | 38.7 | - | - | - | - | - | - |
| (ii) Integration costs | 57.3 | 45.5 | 25.9 | 56.9 | 42.6 | 33.6 | - | - | - | - | - | - | - | - | - |
| (iii) Group Restructuring Cost | 0.2 | - | - | - | - | - | - | - | - | - | - | - | - | - | - |
| Tax credits, recoveries and provision reversal | - | (43.5) | (100.0) | - | (43.5) | (100.0) | - | - | - | - | - | - | - | - | - |
| Store and Goodwill Impairment | 382.9 | - | - | 31.1 | - | - | 282.9 | - | - | 58.7 | - | - | 7.1 | - | - |
| Restructuring Business Units | 32.9 | - | - | 12.4 | - | - | - | - | - | 20.5 | - | - | - | - | - |
| Net non-recurring other (income)/ expenses | 24.7 | - | - | - | - | - | - | - | - | - | - | - | 24.7 | - | - |
| Adjusted EBITDA | 1,095.4 | 1,543.0 | (29.0) | 526.6 | 741.4 | (29.0) | 118.7 | 291.0 | (59.2) | 322.1 | 421.0 | (23.5) | 251.4 | 240.4 | 4.6 |
| Adjusted EBITDA Margin | 10.5% | 13.3% | -280 bps | 8.9% | 12.1% | -320 bps | 5.8% | 10.7% | -490 bps | 21.4% | 22.2% | -80 bps | 28.6% | 26.7% | 190 bps |
2022: Adjusted EBITDA
| R$ million | Consolidated EBITDA | Natura &Co Latam | Avon International | The Body Shop | Aesop | ||||||||||
| FY22 | FY21 | Ch. % | FY22 | FY21 | Ch. % | FY22 | FY21 | Ch. % | FY22 | FY21 | Ch. % | FY22 | FY21 | Ch. % | |
| Consolidated EBITDA | 2,134.1 | 3,909.7 | (45.4) | 1,912.7 | 2,595.7 | (26.3) | (74.7) | 272.8 | (127.4) | 363.6 | 1,023.1 | (64.5) | 536.7 | 623.0 | (13.8) |
| Transformation / Integration Costs | 640.9 | 511.0 | 25.4 | 256.2 | 188.9 | 35.6 | 214.3 | 289.4 | (26.0) | - | - | - | - | - | - |
| (i) Transformation costs | 214.3 | 296.5 | (27.7) | - | - | - | 214.3 | 289.4 | (26.0) | - | - | - | - | - | - |
| (ii) Integration costs | 268.1 | 214.5 | 25.0 | 256.2 | 188.9 | 35.6 | - | - | - | - | - | - | - | - | - |
| (iii) Group Restructuring Cost | 158.5 | - | - | - | - | - | - | - | - | - | - | - | - | - | - |
| Tax credits, recoveries and provision reversal | - | (283.5) | (100.0) | - | (283.5) | (100.0) | - | - | - | - | - | - | - | - | - |
| Store and Goodwill Impairment | 382.9 | - | 0.0 | 31.1 | - | - | 282.9 | - | - | 58.7 | - | - | 7.1 | - | - |
| Restructuring Business Units | 32.9 | - | 0.0 | 12.4 | - | - | - | - | - | 20.5 | - | - | - | - | - |
| Net non-recurring other (income)/ expenses (1) | (32.0) | - | - | - | - | - | (113.6) | - | - | 36.3 | - | - | 45.3 | - | - |
| Adjusted EBITDA | 3,158.7 | 4,137.3 | (23.7) | 2,212.3 | 2,501.1 | (11.5) | 308.9 | 562.2 | (45.1) | 479.1 | 1,023.1 | (53.2) | 589.1 | 623.0 | (5.4) |
| Adjusted EBITDA Margin | 8.7% | 10.3% | -160 bps | 10.0% | 11.2% | -120 bps | 4.3% | 6.0% | -170 bps | 10.9% | 17.6% | -670 bps | 21.7% | 24.0% | -230 bps |
(1) Net non-recurring other (income)/expenses: Net effect of gain from the favorable settlement of a legal dispute at Avon International, costs associated with The Body Shop’s suspension of operations in Russia and other one-off expenses at Aesop (not only but including the studies on a potential transaction).
Financial income and expenses
The following table details the main changes in our financial income and expenses:
| R$ million | Q4-22 | Q4-21 | Ch. % | FY22 | FY21 | Ch. % |
| 1. Financing, Short-Term Investments and Derivatives Gains (Losses) | (296.9) | (188.8) | 57.3 | (805.7) | (346.0) | 132.9 |
| 1.1 Financial Expenses | (225.5) | (152.3) | 48.1 | (744.6) | (634.2) | 17.4 |
| 1.2 Financial Income | 206.9 | 65.7 | 214.9 | 537.3 | 264.8 | 102.9 |
| 1.3 Foreign Exchange Variations from Financing Activities, Net | 186.6 | (150.1) | (224.3) | 394.4 | (252.2) | (256.4) |
| 1.4 Gains (Losses) on Foreign Exchange Derivatives from Financing Activities, Net | (170.3) | 137.0 | (224.3) | (383.2) | 258.0 | (248.5) |
| 1.5 Gains (Losses) on Interest Rate Derivatives and Other Operating Derivatives, Net | (294.6) | (89.1) | 230.6 | (609.6) | 17.6 | (3,563.6) |
| 2. Judicial Contingencies | (12.2) | 25.4 | (148.0) | (79.3) | (25.7) | 208.6 |
| 3. Other Financial Income and (Expenses) | (214.5) | (137.2) | 56.3 | (1,015.9) | (655.3) | 55.0 |
| 3.1 Lease Expenses | (57.0) | (59.4) | (4.0) | (200.2) | (210.7) | (5.0) |
| 3.2 Other | (63.5) | (32.2) | 97.2 | (326.0) | (380.1) | (14.2) |
| 3.3 Other Gains (Losses) From Exchange Rates Variation | (43.9) | (26.2) | 67.6 | (302.1) | (38.0) | 695.0 |
| 3.4 Hyperinflation Gains (Losses) | (50.1) | (19.4) | 158.2 | (187.6) | (26.5) | 607.9 |
| Financial Income and Expenses, Net | (523.6) | (300.6) | 74.2 | (1,900.9) | (1,027.0) | 85.1 |
| · | Net financial expenses were BRL-524 million in Q4-22, up +74.2% vs. Q4-21 (or up BRL -223 million on a YoY basis), due mainly to the following effects: |
| · | Item 1.1. - Higher financial expenses due to higher gross debt and higher interest rates |
| · | Item 1.5 – in Q4-22 expenses were BRL -295 million vs. BRL -89 million in Q4-21, worsening by BRL -206 million. The increase in expenses is related to a higher CDI rate, which led to losses on derivates related to the interest rate on hedge debts, mainly on the 2028 Sustainability-Linked bond and the Certificates backed by real estate receivables (CRI) |
| · | Item 3.2 – in Q4-22 the expenses were BRL -64 million compared to BRL -32 million in the same period of 2021 (varying by BRL -31 million on a YoY basis). Higher losses from amortization of transaction costs and bank fees |
| · | Item 3.4 – in Q4-22 it stood at BRL -50 million, worsening by BRL -31 million YoY due primarily to higher hyperinflation in Argentina |
| · | This was partially offset by Item 1.2 – in Q4-22 financial income was BRL +207 million, improving by BRL +141 million compared to the same period last year. The improvement is mainly related to the increased cash balance during the quarter amid the issuance of Real estate certificates (CRI) in October |
Underlying net income (UNI) and net income
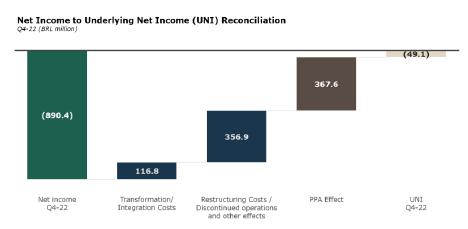
Q4-22 reported net loss was BRL -890 million, compared to net income of BRL +696 million in Q4-21, driven mainly by lower EBITDA (especially impacted by BRL 383 million of non-cash impairment), higher net financial expenses and losses from discontinued operations. Q4-21 net income had also benefitted from tax gains related to credit recoveries.
Q4-22 Underlying Net Income, which is net income excluding transformation costs, restructuring costs, discontinued operations and PPA effects, was a loss of BRL -49 million. This compares to a positive BRL +918 million in Q4-21.
Free cash flow and cash position
| R$ million | Q4-22 | Q4-21 | Ch. % | FY22 | FY21 | Ch. % |
| Net income (loss) | (890.0) | 695.4 | (228.0) | (2,858.6) | 1,040.7 | (374.7) |
| Depreciation and amortization | 690.6 | 739.8 | (6.7) | 2,591.9 | 2,791.5 | (7.2) |
| Non-cash Adjustments to Net Income | 1,551.5 | 1,430.8 | 8.4 | 3,518.5 | 1,234.3 | 185.1 |
| Adjusted Net income | 1,352.1 | 2,866.1 | (52.8) | 3,251.7 | 5,066.5 | (35.8) |
| Decrease / (Increase) in Working Capital | 1,288.0 | (212.9) | (705.1) | (175.4) | (3,054.9) | (94.3) |
| Inventories | 770.0 | 510.0 | 51.0 | 485.8 | (1,117.7) | (143.5) |
| Accounts receivable | (343.0) | (448.0) | (23.4) | (686.7) | (645.2) | 6.4 |
| Accounts payable | 490.0 | 913.2 | (46.3) | 39.7 | 467.5 | (91.5) |
| Other assets and liabilities | 371.0 | (1,188.0) | (131.2) | (14.2) | (1,759.6) | (99.2) |
| Income tax and social contribution | (80.8) | (550.6) | (85.3) | (580.2) | (976.5) | (40.6) |
| Interest on debt | (235.9) | (126.9) | 85.9 | (809.0) | (783.9) | 3.2 |
| Lease payments | (246.0) | (287.0) | (14.3) | (1,152.8) | (1,297.2) | (11.1) |
| Other operating activities | (509.7) | (190.5) | 167.6 | (815.9) | (145.7) | 460.0 |
| Cash from Operations | 1,567.7 | 1,498.2 | 4.6 | (281.5) | (1,191.7) | (76.4) |
| Capex | (334.7) | (595.9) | (43.8) | (1,102.8) | (1,479.2) | (25.4) |
| Sale of Assets | 10.7 | 16.5 | (34.8) | 14.8 | 114.5 | (87.1) |
| Exchange rate variation | 2.9 | 25.9 | (88.8) | (309.8) | 197.0 | (257.3) |
| Free Cash Flow | 1,246.7 | 944.7 | 32.0 | (1,679.3) | (2,359.5) | (28.8) |
| Other financing and investing activities | (303.2) | 8.4 | (3,698.9) | 1,867.8 | 545.6 | 242.3 |
| Cash Balance Variation | 943.4 | 953.2 | (1.0) | 188.5 | (1,813.9) | (110.4) |
In FY22, free cash flow was an outflow of BRL -1,679 million compared to outflow of BRL -2,360 million in the previous year. Despite the negative impact from net income in the year (from BRL +1,041 million in 2021 to BRL -2,859 million in 2022), cash flow from operations had a meaningful improvement to BRL – 282 million from BRL -1,192 million.
The improvements are mainly driven by:
| o | Operating working capital that improved across all business unit as a percentage of net revenues (with the exception of Aesop amid accelerated growth), which was partially offset by business unit mix. The business units that are growing the most carry higher structural WK |
| o | Main driver for working capital improvement was continued inventory optimization (especially finished goods), partially offset by increase in receivables as a result of sales growth in Latam. Accounts payables were almost flat as improvements were offset by lower level of inventories and lower Capex |
| o | Other assets and liabilities benefited from lower advance to suppliers as noticed in the previous quarter |
| o | Improvement in income tax and social contribution |
On top of the improvement in cash from operations, we continue our resources allocation efforts, which resulted in lower Capex in 2022 that represented an outflow of BRL -1,103 million, reducing 25% YoY, while still investing in our priorities to maintain a sustainable and healthy operating company.
As previously mentioned, management continues to be strongly focused on optimizing cash conversion and continues to work on:
(i) improving working capital management (where there are further opportunities despite the progress delivered to date), (ii) thorough discipline in capital allocation and CAPEX optimization, and (iii) continued improvement in the cash tax rate.
Indebtedness ratios at both Natura &Co Holding and Natura Cosméticos
| R$ million | Natura Cosméticos S.A. | Natura &Co Holding S.A. | ||
| Q4-22 | Q4-21 | Q4-22 | Q4-21 | |
| Short-Term | 134.1 | 681.5 | 331.2 | 945.1 |
| Long-Term | 7,488.1 | 7,614.9 | 12,987.6 | 11,380.8 |
| Gross Debt a | 7,622.2 | 8,296.4 | 13,318.8 | 12,325.9 |
| Foreign currency hedging (Swaps) b | 86.4 | (379.1) | 120.0 | (379.1) |
| Total Gross Debt | 7,708.6 | 7,917.3 | 13,438.8 | 11,946.8 |
| (-) Cash, Cash Equivalents and Short-Term Investment c | (3,844.5) | (4,669.4) | (5,996.2) | (5,986.0) |
| (=) Net Debt | 3,864.1 | 3,247.9 | 7,442.6 | 5,960.7 |
| Indebtedness ratio excluding IFRS 16 effects | ||||
| Net Debt/EBITDA | 1.59x | 1.21x | 7.83x | 2.19x |
| Total Debt/EBITDA | 3.16x | 2.95x | 14.13x | 4.40x |
| Indebtedness ratio including IFRS 16 effects | ||||
| Net Debt/EBITDA | 1.25x | 0.90x | 3.49x | 1.52x |
| Total Debt/EBITDA | 2.50x | 2.18x | 6.30x | 3.06x |
a Gross debt excludes PPA impacts of R$273.5 million in Q4-22 and R$ 1,880 million in Q4-21, and exclude lease agreements
b Foreign currency debt hedging instruments, excluding mark-to-market effects
c Short-Term Investments excludes non current balances
The graph below shows the indebtedness trajectory on a quarterly basis since Q4-21.
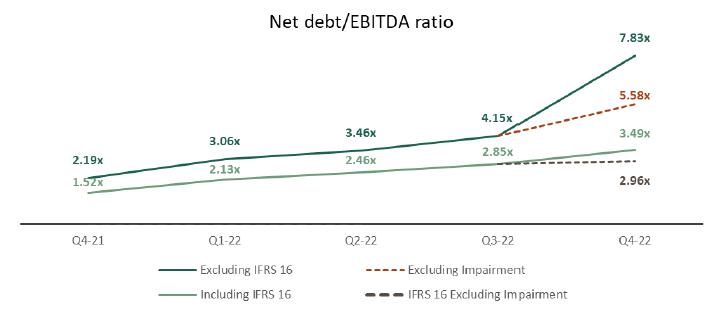
Although net debt improved on a QoQ basis to BRL 7.4 billion (from BRL 8.8 billion), Net debt / EBITDA was significantly impacted by the lower reported EBITDA in 2022. It is important to highlight that reported EBITDA in the last year was particularly impacted by non-underlying expenses (including the BRL 383 million non-cash impairment in Q4), which should not be recurring in the long term. As we have mentioned before, we are working to improve our capital structure while we continue to focus on improvements in margins and cash conversion.
New bond issuance and liability management
As part of the Group’s continuous efforts to improve its capital structure and actively address upcoming maturities, Natura &Co Luxembourg Holdings (Natura Lux) entered on 14th November in a USD 250 million Club Loan maturing in 2025, guaranteed by Natura &Co Holding and Natura Cosméticos S.A. The funds were used primarily to prepay a USD 150 million loan under the group Revolving Credit Facility maturing in 2024 and a GBP 70m loan of The Body Shop with the UK Export Finance agency.
Also, in December 2022 Natura Cosmeticos S.A. repaid BRL 913 million related to its 10th issuance of debentures. At the same time, the same company received an inflow of BRL 1,050 million in October 2022 resulting from the issuance of Certificates backed by real estate receivables (CRI). The repayment of the 10th issuance of debentures eliminates all Group financial covenants.
2. Performance by segment
| Natura &Co Latam | Net Revenue change (%) | Operational KPIs change (%) | |||
| Q4-22 vs. Q4-21 | FY22 vs. FY21 | Q4-22 vs. Q4-21 | |||
| Reported (R$) | Constant Currency | Reported (R$) | Constant Currency | Consultants / Representativesb | |
| Natura Latama | 3.1% | 17.5% | 6.2% | 14.5% | 1.9% |
| Natura Brazil | 17.9% | 17.9% | 14.3% | 14.4% | 1.7% |
| Natura Hispanic | -18.6% | 16.9% | -5.3% | 14.6% | 2.2% |
| Avon Latam | -11.2% | 2.2% | -11.2% | -3.4% | -10.7% |
| Avon Brazil | 7.5% | 7.5% | -5.7% | -5.7% | -0.4% |
| Avon Hispanic | -19.5% | -1.1% | -13.8% | -2.4% | -19.7% |
a Natura Latam includes Natura Brazil, Hispanic and others
b Considers the Average Available Consultants / Representatives in the quarter
NATURA BRAND IN LATAM
Natura Brand in Brazil
| · | Natura Brazil revenues were up 17.9% YoY, benefiting from price increases, combined with better mix. The gift category showed a better YoY performance compared to the brand’s total growth in the region, which is especially important during the holiday season |
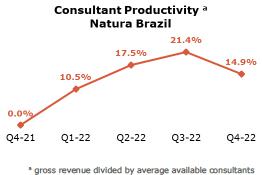
| · | Consultant productivity was up by a strong +14.9% vs Q4-21, a softer performance sequentially, but on the back of a tougher comparable base. At the same time the average available consultant base is broadly stable, at 1.16 million in Q4-22, +1.7% vs. Q4-21 and +0.9% vs. Q3-22. All in, this is aligned with our ongoing strategy of focusing on increasing productivity with a more stable consultant base |
| · | Retail sales (own and franchise stores) showed strong performance, driven by very strong same-store sales and accelerating store openings. The number of own stores reached 90 in the quarter (+18 vs Q4-21), while franchise stores increased to 649 (+74). Store openings (for both owned and franchise) showed an important acceleration, in line with our channel diversification strategy, aiming at better service for our end-consumers and solutions for our consultants |
| · | Digital was stable YoY, impacted by a lower level of discounts and important price rationalization of the distribution channel, which will be an important lever of the omnichannel strategy in the region and will also significantly improve the channel’s profitability. In FY22, however, digital was an important growth platform, up +19.8% YoY |
Natura Brand in Hispanic Latam
| · | Even amid political and economic turmoil, especially in Argentina, Chile and Peru, Natura Hispanic Latam delivered +16.9% revenue growth in CC (down -18.6% in BRL). Growth was mainly driven by acceleration in Argentina, Colombia and Mexico, boosted by channel mix and productivity gains |
| · | Excluding Argentina, revenue in Hispanic markets was up mid-single digits in CC, despite softer performance in Peru and a decrease in Chile, both impacted by the unstable macro environment |
| · | The average available consultant base reached 0.88 million in Q4-22 (broadly stable vs. the previous quarter and +2.2% vs. Q4-21), with increased productivity |
AVON BRAND IN LATAM
Avon Brand in Brazil
| · | Q4 net revenue was up +7.5% YoY, again improving sequentially and entering positive territory, but on the back of a much softer comparable base. The beauty category showed solid +12% top-line growth, while Fashion and Home sales were down -10%, in line with our portfolio optimization strategy |
| · | Representative productivity in the beauty segment again improved sequentially and continued to grow in double digits YoY boosted by core categories’ performance |
| · | Fashion & Home continued to decrease in the quarter compared to the previous year but with a stable average order level in BRL and lower impact on total consolidated sales, as expected |
| · | The number of average available representatives was broadly stable compared to Q3-22 and to Q4-21 levels, underscoring the effective remedy actions implemented since Q3-21 and showing a continuation of the channel stabilization delivered last quarter |
Avon Brand in Hispanic Latam
| · | Revenue was down -1.1% in CC (-19.5% in BRL), mainly benefiting from good performance in Argentina, but impacted by a decrease in Mexico (which has higher exposure to the Fashion and Home category), Peru and Chile (also suffering from political and economic volatility, like the Natura brand) |
| · | The Beauty category grew 7.3% in CC, but was more than offset by Fashion and Home |
| · | Total number of available representatives improved sequentially and was up +6.4% vs. Q3-22, but still down -14.4% YoY |
NATURA &Co LATAM
| · | All in, revenue was up +10.6% in CC, and down -3.2% in BRL, driven by strong growth at the Natura brand and Avon CFT, but still partially offset by the Fashion and Home category |
| · | Gross margin was 59.4%, down 60 bps YoY (in-line with Q3-22 YoY pressure) benefiting from by price increases, richer category mix and marketing efforts, but still impacted by input prices and FX dynamics |
| Natura &Co Latam (R$million) | P&L | ||
| Q4-22 | Q4-21 | Ch. % | |
| Gross Revenue | 7,886.9 | 8,079.1 | (2.4) |
| Net Revenue | 5,943.2 | 6,142.3 | (3.2) |
| Constant Currency | 10.6 | ||
| COGS | (2,410.4) | (2,449.7) | (1.6) |
| Gross Profit | 3,532.7 | 3,692.6 | (4.3) |
| Gross Margin | 59.4% | 60.1% | (60.0) |
| Selling, Marketing and Logistics Expenses | (2,384.2) | (2,449.5) | (2.7) |
| Administrative, R&D, IT and Projects Expenses | (874.7) | (736.9) | 18.7 |
| Other Operating Income/ (Expenses), Net | (43.4) | 45.2 | (195.9) |
| Transformation/Integration costs | (56.9) | (42.6) | 33.6 |
| Depreciation | 252.6 | 233.5 | 8.2 |
| EBITDA | 426.2 | 742.3 | (42.6) |
| EBITDA Margin | 7.2% | 12.1% | (490.0) |
| Integration costs | 56.9 | 42.6 | 33.6 |
| Tax credits, recoveries and provision reversal | - | (43.5) | - |
| Impairment on assets and other items | 31.1 | - | - |
| Restructuring Business Units | 12.4 | - | - |
| Adjusted EBITDA | 526.6 | 741.4 | (29.0) |
| Adjusted EBITDA Margin | 8.9% | 12.1% | (320.0) |
| · | Adjusted EBITDA margin was 8.9% (-320 bps YoY), still benefiting from strong top line performance and strict financial control, but more than offset by lower gross margin combined with higher G&A as a percentage of net revenues. G&A growth was mainly driven by inflationary pressures, which grew at a rate higher than revenue at Avon Latam, higher investments in R&D (especially for the Natura brand, where we are accelerating investments in marketing and innovation) and increased quarterly phasing expenses including accrual for management compensation |
| · | Natura & Avon integration costs were BRL 57 million, of which ~60% severance costs and the remaining opex investments to integrate logistics, industry, IT, etc. |
| · | Wave 2 – Natura & Co Latam is accelerating the second wave of the integration process of Natura and Avon brands, with a view to unifying the value proposition for our Consultants and Representatives so that 100% of them are able to operate with both brands simultaneously. The rollout process of Wave 2 starts even before the actual integration of our consultants and reps to the same value proposition |
| · | Communications and training for our sales force are being put in place to prepare them for this new reality, IT systems are already being adapted, the reorganization of our logistics infrastructure and teams are already underway. Additionally, the change in sales structure incentives, in place since Wave 1, is further accelerating given the better value proposition resulting from cross-selling of Natura and Avon products. With a unified value proposition, the portfolio optimization process (especially but not limited to the fashion and home category) will be more aggressive, to make it even more appealing to our final consumers, and especially attractive from a profitability perspective for both consultants / reps and the company |
| · | That said, it is important to highlight that as we accelerate the Wave 2 rollout process, we expect weaker top line performance across Avon, especially in some Hispanic Latam regions where Wave 1 and Wave 2 will occur simultaneously. Furthermore, this process will incur integration costs, that we plan to partially offset with some Latam asset divestments |
| · | &Co Pay at Natura posted strong growth in Brazil both in number of accounts, reaching approximately 500,000, and Total Payment Volume (“TPV”), which reached BRL 9.96 billion in the quarter (BRL 25.6 billion in 2022). In addition to capturing and processing 100% of payments from Natura's direct sales and e-commerce, with the launch of the Retail operation and the Avon brand in Q4, &Co Pay is present in all channels and brands in Brazil. The consultants that use the platform generally record a higher level of activity, productivity and lower defaults. We started the international expansion process with a pilot in Q4 in our operation in Argentina |
AVON INTERNATIONAL
| · | Net revenues stood at BRL 2,063 million, down 23.8% YoY (or - 9.9% in constant currency). Excluding Russia and Ukraine, revenue decreased -6.2% compared vs Q4-21. Net revenues were also impacted by a one-off supply chain challenge related to mascara products, which negatively impacted revenue by 2p.p., according to our estimate |
| Operational KPIs change (%) | |
| Q4-22 vs. Q4-21 | |
| Representatives | |
| Avon International | -20.1% |
| · | TMEA and APAC regions showed YoY growth, while Western Europe posted softer performance given the macro-economic headwinds. However, even in a tough macro environment, Avon International was able to pass through inflation and FX pressure to prices, which also benefits rep productivity |
| Avon International (R$ million) | P&L | ||
| Q4-22 | Q4-21 | Ch. % | |
| Gross Revenue | 2,456.4 | 3,248.4 | (24.4) |
| Net Revenue | 2,062.6 | 2,708.1 | (23.8) |
| Constant Currency | (9.9) | ||
| COGS | (802.2) | (1,115.5) | (28.1) |
| Gross Profit | 1,260.4 | 1,592.6 | (20.9) |
| Gross Margin | 61.1% | 58.8% | 230.0 |
| Selling, Marketing and Logistics Expenses | (853.5) | (1,147.1) | (25.6) |
| Administrative, R&D, IT and Projects Expenses | (430.3) | (355.3) | 21.1 |
| Other Operating Income/ (Expenses), Net | (316.9) | 5.0 | (6,380.0) |
| Transformation/Integration costs | (59.5) | (42.9) | 38.7 |
| Depreciation | 176.0 | 195.7 | (10.1) |
| EBITDA | (223.8) | 248.1 | (190.2) |
| EBITDA Margin | -10.9% | 9.2% | (2,010.0) |
| Transformation costs | 59.5 | 42.9 | 38.7 |
| Store and Goodwill Impairment | 282.9 | - | - |
| Adjusted EBITDA | 118.7 | 291.0 | (59.2) |
| Adjusted EBITDA Margin | 5.8% | 10.7% | (490.0) |
| · | As expected, the number of representatives is still down 20% amid the new commercial model roll- out and the footprint optimization impact. Digitalization is showing good progress and the use of digital tools reached 30.6% (see digital section – page 4) and other fundamental KPIs are also improving (like units per rep and activity rate) |
| · | Gross margin was 61.1%, up 230bps YoY, driven by price increases and a positive product mix, which more than offset pressure from cost inflation and FX headwinds |
| · | Adjusted EBITDA margin was 5.8%, down 490bps YoY. The gross margin expansion of 230bps and continued focus on transformation savings, were more than offset by the sales deleverage and other quarterly phasing of expenses. Q4- 22 included an increase in costs related to management compensation, while the Q4-21 period benefited from a release of the incentives provisions, as indicated last year |
| · | Despite the profitability pressure, cash conversion showed significant progress (and the Avon International business unit is one of the main drivers for the consolidated evolution of this figure) mainly driven by working capital improvement |
| · | Transformation costs this quarter were BRL 59.5 million, of which ~70% severance costs and the remaining related to IT outsourcing |
| · | From a contribution margin perspective, Central & Eastern Europe, South Africa and Philippines showed very healthy margins, demonstrating the importance of market portfolio focus and operating model transformation |
| · | Avon International continues its transformational journey at pace, drastically reshaping its costs to offset the external headwinds, provide funding for strategic investments and step-change the EBITDA margin profile through a focused market portfolio and a lean operating model |
| o | Focused market portfolio: (1) Focus and deliver transformation in financially accretive markets, incl. starting to invest in customer pull by rebuilding media investments (Top 4: South Africa, Philippines, Romania, Poland) (2) fix Western Europe profitability under the One Europe portfolio simplification and harmonization and restructured organization (3) continue evaluating the geographic footprint, exiting profit-dilutive markets with no further transformation potential |
| o | Lean operating model: Finalize the End-to-End operating model simplification with outsourcing IT, redesigning R&D, optimizing Supply Chain footprint and organizational structures across centre and markets |
| · | Turkey is an important market in our portfolio and a leading growth market for the last quarters. The recent catastrophic earthquakes have affected their performance since February. They have our full support, both for the impacted communities as well for the recovery of their growth momentum in the upcoming quarter |
THE BODY SHOP
| · | While an improvement compared to Q3-22, (-19.5% in CC), Q4-22 net revenue was down -8.4% in CC (but on the back of a soft comparable base) and -20.6% in BRL. 2022 was a very challenging year, and in response, management is focused on stabilizing the top line of core business and the implementation of cost savings initiatives to deliver margin expansion and support cash generation |
| Operational KPIs | ||||||
| Q4-22 | Q3-22 | Q4-21 | Change vs. Q3- 22 | Change vs. Q4- 21 | ||
| The Body Shop (Total) | 2,456 | 2,443 | 2,545 | 13 | (89) | |
| Own Stores | 979 | 977 | 997 | 2 | (18) | |
| Franchise Stores | 1,477 | 1,466 | 1,548 | 11 | (71) | |
| The Body Shop (R$ million) | P&L | ||
| Q4-22 | Q4-21 | Ch. % | |
| Gross Revenue | 2,181.7 | 2,677.8 | (18.5) |
| Net Revenue | 1,504.4 | 1,893.9 | (20.6) |
| Constant Currency | (8.4) | ||
| COGS | (373.8) | (404.1) | (7.5) |
| Gross Profit | 1,130.6 | 1,489.8 | (24.1) |
| Gross Margin | 75.2% | 78.7% | (350.0) |
| Selling, Marketing and Logistics Expenses | (770.8) | (1,002.1) | (23.1) |
| Administrative, R&D, IT and Projects Expenses | (256.2) | (274.6) | (6.7) |
| Other Operating Income/ (Expenses), Net | (41.5) | (15.6) | 165.4 |
| Depreciation | 180.8 | 223.5 | (19.1) |
| EBITDA | 242.9 | 421.0 | (42.3) |
| EBITDA Margin | 16.1% | 22.2% | (610.0) |
| Store and Goodwill Impairment | 58.7 | - | - |
| Restructuring Business Units | 20.5 | - | - |
| Adjusted EBITDA | 322.1 | 421.0 | (23.50) |
| Adjusted EBITDA Margin | 21.4% | 22.2% | (80.0) |
| · | Combined sales of core business distribution channels (stores, e- commerce and franchise) showed a low single-digit decline in CC in Q4- 22, improving from Q3-22 (when sales dropped in high single digits), indicating the significant impact of The Body Shop at Home, which returned to pre-pandemic levels |
| · | The tough macro environment (particularly in the UK and the rest of Western Europe) continued to impact retail sales through core business distribution channels (sell-out Same Store Sales of own stores, e-commerce and franchise combined were -4.8%) |
| · | Franchise sell-in grew in the quarter, but softer sales sell-out impacted the trend of franchise partner inventory normalization seen last quarter |
| · | Gross margin was impacted by input prices and FX dynamics amid macro headwinds, which translated into a 75.2% margin, implying -350 bps YoY pressure |
| · | Despite gross margin reduction and lower sales, Adjusted EBITDA margin, at 21.4%, was down 80 bps YoY (compared to 11.7 p.p. pressure in Q3-22). The 350 bps of gross margin pressure were partially offset by strict cost control that led to a 270 bps efficiency gain of SG&A as a percentage of net revenues (despite the sales deleverage impact) |
| · | Strict cost containment measures to manage headcount levels and discretionary spend were complemented in the quarter by the first phase of structural cost reductions including the rightsizing of the The Body Shop At Home (TBSAH) overhead structure, reductions in leadership and IT transformation |
| · | Commensurate with the restructuring actions described above, The Body Shop incurred non-recurring charges of BRL 79M, half of which is associated with severance and IT project impairments. The other half is driven by non-recurring, non-cash store related impairment charges. The restructuring of the business continues, and in early 2023, management announced several additional steps to improve the long-term profitability of the business unit in light of the continued macro-economic challenges |
| o | In January we announced the closure of the TBSAH business in the US and are closing our dedicated distribution center in the UK in recognition of the changing economics of the channel |
| o | In February we announced a restructuring of our global management structure, reducing leadership positions by 25%, as well as a 12% reduction in the rest of global overhead staffing |
| · | These actions are part of a broader recovery program that will support margin expansion, cash generation and net revenue stabilization in 2023 and beyond |

| · | Revenues were BRL 880 million, up 18.2% in CC (but down 2.1% in BRL). All regions delivered double-digit YoY growth, despite a deteriorating macro environment |
| · | Signature stores totaled 287 in Q4-22 (+18 LTM) and showed solid same-store sale growth of +9.3% |
| · | From a distribution channel perspective, retail and wholesale showed solid growth, partially offset by a softer e-commerce performance, reflecting consumer behavior normalizing post-Covid. Thus, combined Same Store Sales growth was a solid +7% (including retail, department stores concession and Aesop.com), on the back of a tough comparable base |
| Aesop | Operational KPIs | |||||
| Q4-22 | Q3-22 | Q4-21 | Change vs. Q3- 22 | Change vs. Q4- 21 | ||
| Aesop (Total) | 394 | 385 | 367 | 9 | 27 | |
| Signature Stores | 287 | 280 | 269 | 7 | 18 | |
| Department Stores | 107 | 105 | 98 | 2 | 9 | |
| Aesop (R$ million) | P&L | ||
| Q4-22 | Q4-21 | Ch. % | |
| Gross Revenue | 976.6 | 1,017.7 | (4.0) |
| Net Revenue | 679.6 | 698.9 | (2.1) |
| Constant Currency | 18.2 | ||
| COGS | (176.6) | (174.7) | 1.1 |
| Gross Profit | 703.0 | 724.2 | (2.9) |
| Gross Margin | 79.9% | 60.6% | (70.0) |
| Selling, Marketing and Logistics Expenses | (326.3) | (357.3) | (3.7) |
| Administrative, R&D, IT and Projects Expenses | (207.2) | (204.0) | 1.6 |
| Other Operating Income/ (Expenses), Net | (31.1) | (1.7) | 1,736.2 |
| Depreciation | 81.2 | 79.2 | 2.5 |
| EBITDA | 219.6 | 240.4 | (8.7) |
| EBITDA Margin | 25.0% | 26.7% | (170.0) |
| Store and Goodwill Impairment | 7.1 | - | - |
| Net non-recurring other (income)/expenses | 24.7 | - | - |
| Adjusted EBITDA | 251.4 | 240.4 | 4.6 |
| Adjusted EBITDA Margin | 26.6% | 26.7% | 190.0 |
· From a category perspective, fragrance sales YoY growth was more than double the brand’s consolidated YoY growth, aligned with our category diversification strategy. The fragrances market has outgrown the market as a whole, especially the premium segment (which is the one that Aesop is exposed to), indicating the importance of this category for future growth
· China entry was successfully delivered in Q4-22 with the launch of two physical stores, along with the Aesop.com platform and a domestic T-Mall operation, as planned. While still in a very early stage, the stores are performing above expectations and are already the top two sellers of Aesop’s signature stores worldwide
· Gross margin was 79.9%, compared to 80.6% in Q4-21, mainly driven by favorable product (such as fragrances) and channel mix, combined with price increases, but still impacted by inflationary cost pressures
| · | Adjusted EBITDA margin was 28.6%, up 190bps YoY, still pressured by planned investments to deliver sustainable future growth, but more than offset by leverage from higher revenues |
| · | As mentioned last quarter, these investments relate primarily to technology and supply chain enhancements and to prepare Aesop’s China market entry |
| · | The non-recurring expenses are mainly related to the evaluation of strategic alternatives involving Natura & Co’s investment in Aesop |
| · | As mentioned in the notice to the market published on November 30th, Natura & Co continues to evaluate strategic alternatives involving the investment in Aesop. Among the alternatives under study, Natura & Co continues to evaluate a possible sale of a stake in Aesop and will keep the market updated |
3. Social and environmental performance
(all actions refer to Natura &Co Group, unless stated otherwise)
This quarter saw a busy period for Natura &Co in the social and environmental space. In November, knowing that the outcomes of the 2022 United Nations Climate Change Conference (COP27) would have implications for the goals of the Paris Agreement, six representatives from Natura &Co were present at the conference in Sharm El Sheikh, Egypt. Natura &Co took three key messages to the conference: we must embrace the nexus between nature and climate; we must champion inclusion and step into our role as an ally; and we must advocate for strong institutions and strong policies. Natura &Co was a signatory of the ‘All in for 1.5°C’ pledge announced at COP27. This commitment to limit the rise of global temperatures to 1.5°C remains in line with the objectives of the Paris Agreement and the Glasgow Climate Pact.
The momentum generated in Sharm El Sheikh traveled with Natura &Co to Montreal, Canada for the 2022 United Nations Biodiversity Conference (CBD COP15) in December, where four of our representatives were present. Working with Business for Nature and other partners, in preceding months we signaled business support for the adoption of an ambitious Post-2020 Global Biodiversity Framework through participation in the CBD Geneva Meeting in March 2022, interaction with policy makers, participation in press conferences, and media campaigns. During CBD COP15, we joined a progressive business coalition playing an instrumental role in securing a strong Target 15 through the “Make it Mandatory” campaign, designed to clarify the role of business and financial institutions in halting and reversing nature loss. With the historic Kunming-Montreal Global Biodiversity Framework (GBF) adopted by 196 countries, our focus turns to implementation.
Updates across the Commitment to Life pillars:
To address the Climate Crisis and protect the Amazon
| · | COP27: Natura Cosméticos S.A. brought a Brazilian perspective to COP27, shining a light on the importance of the Amazon in addressing the climate and nature emergencies we are all facing. To convey this message, Natura Cosméticos S.A. amplified its focus on mobilization for protecting the forest |
| · | Natura Cosméticos S.A. intends to structure two financial instruments in partnership with Funbio and Vert to strengthen Amazon socio-biodiversity organizations, businesses and chains. These instruments promote a development model in the Amazon that combines conservation with income generation. One instrument focuses on the markets, and the other on philanthropy |
| · | Natura was able to expand their work with local communities from 40 to 41 |
To defend Human Rights and be Human-Kind
| · | The Body Shop - During COP27, as part of the Be Seen Be Heard campaign, The Body Shop Greece and partner Action Aid Hellas joined a range of other organizations from around Europe to lodge the Climate of Change petition, calling for the introduction of youth climate councils at EU and member state levels. With over 105,000 signatures and over 13,500 of these from visitors to The Body Shop in Greece, the Climate of Change petition is a massive step towards better youth representation in climate negotiations |
| · | Avon International - Recognizing the disproportionate impact of climate change on women and girls, and their critical role in finding solutions, Avon voiced support for the She Changes Climate call for equal and visible representation of women at COP27. |
| · | Gender Equality - Natura &Co increased gender balance in the organization from 50.4% to 52.7% (senior leadership including the Board of Directors) |
| · | Equitable pay – Natura & Co reduced its unexplained pay gap from 1.19% to 0.76%, putting the company at 0.76% away from what is considered to be pay equity for the same job, same location and same responsibility. While typically a gap below 1% is often considered negligible in statistical terms, we believe that any gap is unacceptable, so we are not complacent, and we are committed to closing the gap |
| · | Living Wage – Natura &Co increased the percentage of employees earning the minimum income necessary for them and their family to meet basic needs including discretionary income from 96% to 99% 1A (1 Adult) |
To embrace Circularity and Regeneration
| · | Natura &Co reached 11.5% of recycled plastic content of all plastic used in 2022 |
| · | Aesop - The start-up of operations in China at the end of 2022 was a pivotal moment within Aesop’s strategic ambitions. Aesop opened its first physical store in mainland China on Shanghai’s Dongping Road. The two-story building pays homage to Chinese craftsmanship, houses one Sensorium (the fragrance chamber), and is surrounded by a garden with Chinese medicine herbs. Aesop also launched its “Sustainable Concept Store” in the district of SeongSu, in Seoul, South Korea which features regenerative practices in the design of Aesop spaces across the globe |
Recognitions for Natura &Co
| · | Natura &Co was once again part of the B3 Corporate Sustainability Index (ISE) Ranking and is the only cosmetics company included in the prestigious listing. |
| · | Natura &Co was listed in Corporate Knights 2022 Top 100, which is based on public data relating to 24 key performance indicators including products and services aligned with sustainable goals, diversity and salaries, emissions and consumption. |
| · | Natura &Co was an inaugural recipient of the King Charles III´s Terra Carta Seal, which recognizes global companies which are driving innovation and demonstrating their commitment to, and momentum towards, the creation of genuinely sustainable markets. |
4. Markets and Stock Performance
NTCO3 shares traded at BRL11.61 at the end of Q4-22 on the B3 stock exchange, -21,18% in the quarter. Average Daily Trading Volume (ADTV) for the quarter was BRL 209.6 million, -38.1% vs Q4-21. NTCO traded at USD4.33 at the end of Q4-22 on NYSE, - 19.67% in the quarter.
On December 31, 2022, the Company’s market capitalization was BRL 16.1 billion, and the Company’s capital was comprised of 1,383,152,570 common shares.
5. Fixed income
Below is a table with details of all public debt instruments outstanding per issuer as of December 31, 2022:
| Issuer | Type | ||||
| Issuance | Maturity | Principal (million) | Nominal Cost (per year) | ||
| 10/06/2022 | 09/15/2025 | BRL 255.8 | DI + 0.80 per year | ||
| 10/06/2022 | 09/15/2027 | BRL 487.2 | IPCA + 6.80 per year | ||
| Natura Cosméticos S.A. | Debenture - 12th issue | 09/15/2031 | BRL 102.3 | IPCA + 6.90 per year | |
| 10/06/2022 | 09/15/2032 | BRL 102.3 | IPCA + 6.90 per year | ||
| 09/15/2033 | BRL 102.3 | IPCA + 6.90 per year | |||
| Natura Cosméticos S.A. | Commercial Notes | 09/19/2022 | 09/19/2025 | BRL 500.0 | DI + 1.55 per year |
| Natura &Co Luxembourg Holdings (Natura Lux) | Club Loan | 11/14/2022 | 11/14/2025 | US$ 250.0 | SOFR + 2.47% |
| Natura Cosméticos S.A. | Debenture - 11th issue | 07/25/2022 | 07/21/2027 | BRL 826.0 | DI + 1.65 per year |
| Natura Cosméticos S.A. | Bond - 2nd issue (Sustainability Linked Bond) | 05/03/2021 | 05/03/2028 | US$ 1,000.0 (1) | 4.13% |
| Natura &Co Luxembourg Holdings (Natura Lux) | Bonds | 04/19/2022 | 04/19/2029 | US$ 600.0 | 6.00% |
| Avon Products, Inc. | Unsecured Bonds | 03/12/2013 | 03/15/2043 | US$ 216.1 | 8.450%(2) |
(1) Principal and interests fully hedged (swapped to BRL). For more information, see the explanatory notes to the Company's financial statements.
(2) Coupon based on current credit ratings, governed by interest rate adjustment clause
Ratings
Below is a table with our current credit ratings:
| Natura &Co Holding S.A. | |||
| Agency | Global Scale | National Scale | Outlook |
| Standard & Poor’s | BB | AAA | Stable |
| Fitch Ratings | BB | AA+ | Positive |
| Moody’s | Ba3 | - | Stable |
| Natura Cosméticos S.A. | |||
| Agency | Global Scale | National Scale | Outlook |
| Standard & Poor’s | BB | AAA | Stable |
| Fitch Ratings | BB | AA+ | Positive |
| Moody’s | Ba2 | - | Stable |
| Avon International | |||
| Agency | Global Scale | National Scale | Outlook |
| Standard & Poor’s | BB- | - | Stable |
| Fitch Ratings | BB | - | Positive |
| Moody’s | Ba3 | - | Stable |
6. Appendix
FREE CASH FLOW RECONCILIATION
The correspondence between Free Cash Flow and Statements of Cash Flow is shown below:
| Statement of Cash Flows | Free Cash Flow Reconciliation | ||
| CASH FLOW FROM OPERATING CTIVITIES | |||
| Net (loss) income for the period | (a) | Net Income (loss) | |
| Adjustments to reconciliate net (loss) income for the period with net cash used in operating activities: | |||
| Depreciation and amortization | (b) | Depreciation/amortization | |
| Interest and exchange variation on short-term investments | (c) | ||
| Earnings (loss) from swap and forward derivative contracts | (c) | ||
| Provision for tax, civil and labor risks | (c) | ||
| Inflation adjustment of judicial deposits | (c) | ||
| Inflation adjustment of provision for tax, civil and labor risks | (c) | ||
| Income tax and social contribution | (c) | ||
| Income from sale and write-off of property, plant and equipment, lease and non-current assets held for sale | (c) | Non-cash Adjustments to Net | |
| Interest and exchange rate variation on leases | (c) | ||
| Interest and exchange rate variation on borrowings, financing and debentures, net of acquisition costs | (c) | ||
| Inflation adjustment and exchange rate variation on other assets and liabilities | (c) | ||
| Reversal of provision for losses from property, plant and equipment, intangible and leases | (c) | ||
| Provision for stock option plans | (c) | ||
| Provision for losses with trade accounts receivables, net of reversals | (c) | ||
| Provision for inventory losses, net of reversals | (c) | ||
| Reversal of provision for the provision for carbon credits | (c) | ||
| Effect from hyperinflationary economy | (c) | ||
| Other adjustments to reconcile net loss | (c) | ||
| Increase (Decrease) in: | |||
| Trade accounts receivable and related parties | (d2) | ||
| Inventories | (d1) | ||
| Recoverable taxes | (d4) | ||
| Other assets | (d4) | Decrease (Increase) in Working | |
| Domestic and foreign trade accounts payable and related parties | (d3) | Capital | |
| Payroll, profit sharing and social charges, net | (d4) | ||
| Tax liabilities | (d4) | ||
| Other liabilities | (d4) | ||
| OTHER CASH FLOWS FROM OPERATING ACTIVITIES | |||
| Payment of income tax and social contribution | (e) | Income Tax and Social Contribution | |
| Release of judicial deposits | (h) | ||
| Payments related to tax, civil and labor lawsuits | (h) | Other Operating Activities | |
| (Payments) proceeds due to settlement of derivative transactions | (h) | ||
| Payment of interest on lease | (g) | Lease Payments | |
| Payment of interest on borrowings, financing and debentures | (f) | Interest on Debt | |
| NET CASH (USED IN) OPERATING ACTIVITIES | |||
| CASH FLOW FROM INVESTING ACTIVITIES | |||
| Cash from acquisition of subsidiary | (i) | Other financing/investing activities | |
| Additions of property, plant and equipment and intangible | (j) | Capex | |
| Proceeds from sale of property, plant and equipment, intangible and non-current assets held for sale | (i) | Sale of Assets | |
| Acquisition of short-term investments | (l) | ||
| Redemption of short-term investments | (l) | Other financing/investing activities | |
| Redemption of interest on short-term investments | (l) | ||
| NET CASH GENERATED BY (USED IN) INVESTING ACTIVITIES | |||
| CASH FLOW FROM FINANCING ACTIVITIES | |||
| Repayment of lease - principal | (g) | Lease Payments | |
| Repayment of borrowings, financing and debentures – principal | (l) | ||
| New borrowings, financing, and debentures | (l) | ||
| Acquisition of treasury shares, net of receipt of option strike price | (l) | Other financing/investing activities | |
| Receipt of funds due to settlement of derivative transactions | (l) | ||
| Capital Increase | (l) | ||
| NET CASH PROVIDED BY (USED IN) FINANCING ACTIVITIES | |||
| Effect of exchange rate variation on cash and cash equivalents | (k) | Exchange Rate Effect | |
| DECREASE IN CASH AND CASH EQUIVALENTS | |||
| Opening balance of cash and cash equivalents | |||
| Closing balance of cash and cash equivalents | |||
| DECREASE IN CASH AND CASH EQUIVALENTS | |||
| Free Cash Flow | Cash Flow Reconciliation | |
| Net income (loss) | (a) | |
| Depreciation and amortization | (b) | |
| Non-cash Adjustments to Net Income | (c) | |
| Adjusted Net income | ||
| Decrease / (Increase) in Working Capital | (d) | |
| Inventories | (d1) | |
| Accounts receivable | (d2) | |
| Accounts payable | (d3) | |
| Other assets and liabilities | (d4) | |
| Income tax and social contribution | (e) | |
| Interest on debt | (f) | |
| Lease payments | (g) | |
| Other operating activities | (h) | |
| Cash from Operations | ||
| Capex | (j) | |
| Sale of Assets | (i) | |
| Exchange rate variation | (k) | |
| Free Cash Flow | ||
| Other financing and investing activities | (I) | |
| Cash Balance Variation |
CONSOLIDATED BALANCE SHEET
| ASSETS (R$ million) | Dec-22 | Dec-21 |
| CURRENT ASSETS | ||
| Cash and cash equivalents | 4,195.7 | 4,007.3 |
| Short-term investments | 1,800.4 | 1,978.7 |
| Trade accounts receivable | 3,502.4 | 3,476.4 |
| Inventories | 4,516.9 | 5,403.5 |
| Recoverable taxes | 911.4 | 1,029.6 |
| Income tax and social contribution | 196.1 | 446.4 |
| Derivative financial instruments | 235.1 | 81.2 |
| Other current assets | 763.4 | 912.2 |
| Assets held for sale | 0.1 | 52.9 |
| Total current assets | 16,121.5 | 17,388.2 |
| NON CURRENT ASSETS | ||
| Recoverable taxes | 1,356.9 | 1,349.6 |
| Deferred income tax and social contribution | 3,519.5 | 3,100.5 |
| Judicial deposits | 457.6 | 585.3 |
| Derivative financial instruments | 773.3 | 894.0 |
| Short-term investments | 35.2 | 36.9 |
| Other non-current assets | 1,252.4 | 1,763.1 |
| Total long term assets | 7,394.9 | 7,729.4 |
| Property, plant and equipment | 4,966.2 | 5,377.4 |
| Intangible | 23,261.0 | 26,857.6 |
| Right of use | 2,941.9 | 3,096.0 |
| Total non-current assets | 38,563.9 | 43,060.3 |
| LIABILITIES AND SHAREHOLDER'S EQUITY (R$ million) | Dec-22 | Dec-21 |
| CURRENT LIABILITIES | ||
| Borrowings, financing and debentures | 331.2 | 945.1 |
| Lease | 878.4 | 1,005.5 |
| Trade accounts payable and reverse factoring operations | 6,375.9 | 6,770.6 |
| Dividends and interest on shareholders' equity payable | 0.3 | 180.8 |
| Payroll, profit sharing and social charges | 1,277.0 | 1,255.3 |
| Tax liabilities | 828.1 | 766.4 |
| Income tax and social contribution | 70.3 | 272.8 |
| Derivative financial instruments | 1,614.0 | 458.5 |
| Provision for tax, civil and labor risks | 463.7 | 230.1 |
| Other current liabilities | 1,499.1 | 1,716.1 |
| Total current liabilities | 13,337.9 | 13,601.2 |
| NON CURRENT LIABILITIES | ||
| Borrowings, financing and debentures | 13,261.1 | 11,771.8 |
| Lease | 2,392.3 | 2,542.3 |
| Payroll, profit sharing and social charges | 26.2 | 53.7 |
| Tax liabilities | 117.4 | 114.8 |
| Deferred income tax and social contribution | 934.4 | 994.0 |
| Income tax and social contribution | 448.5 | 773.1 |
| Derivative financial instruments | 191.3 | - |
| Provision for tax, civil and labor risks | 873.6 | 1,088.3 |
| Other non-current liabilities | 751.6 | 942.5 |
| Total non-current liabilities | 18,996.3 | 18,280.5 |
| SHAREHOLDERS' EQUITY | ||
| Capital stock | 12,484.4 | 12,481.7 |
| Treasury shares | (262.4) | (151.3) |
| Capital reserves | 10,540.9 | 10,478.8 |
| Legal profit reserve | 0.0 | 871.2 |
| Retained (losses) income | (1,994.6) | - |
| Other comprehensive income | 1,564.3 | 4,865.2 |
| Equity attributable to owners of the Company | 22,332.7 | 28,545.6 |
| Non-controlling interest in shareholders' equity of subsidiaries | 18.5 | 21.2 |
| TOTAL ASSETS | 54,685.4 | 60,448.5 | TOTAL LIABILITIES AND SHAREHOLDERS' EQUITY | 54,685.4 | 60,448.5 |
CONSOLIDATED INCOME STATEMENT- INCLUDING PURCHASE PRICE ALLOCATION (PPA) AMORTIZATION
| R$ million | Q4-22 | Q4-21 | Ch. % | FY22 | FY21 | Ch. % |
| NET REVENUE | 10,390.2 | 11,643.2 | (10.8) | 36,349.6 | 40,164.7 | (9.5) |
| Cost of Products Sold | (3,762.9) | (4,144.1) | (9.2) | (13,155.0) | (14,097.9) | (6.7) |
| GROSS PROFIT | 6,627.3 | 7,499.2 | (11.6) | 23,194.6 | 26,066.8 | (11.0) |
| OPERATING EXPENSES | ||||||
| Selling, Marketing and Logistics Expenses | (4,194.1) | (4,792.0) | (12.5) | (15,554.6) | (16,912.9) | (8.0) |
| Administrative, R&D, IT and Project Expenses | (1,893.5) | (1,724.1) | 9.8 | (6,711.5) | (6,958.9) | (3.6) |
| Impairment losses on trade receivables | (140.6) | (167.3) | (15.9) | (606.0) | (837.8) | (27.7) |
| Other Operating Expenses, Net | (551.4) | (50.9) | 983.9 | (780.3) | (239.0) | 226.5 |
| LOSS FROM OPERATIONS BEFORE FINANCIAL RESULT | (152.4) | 764.9 | (119.9) | (457.8) | 1,118.2 | (140.9) |
| Financial Income | 1,189.3 | 867.6 | 37.1 | 5,380.8 | 4,006.6 | 34.3 |
| Financial Expenses | (1,712.9) | (1,168.2) | 46.6 | (7,281.7) | (5,033.5) | 44.7 |
| LOSS BEFORE INCOME TAX AND SOCIAL CONTRIBUTION | (676.0) | 464.4 | (245.6) | (2,358.6) | 91.3 | (2,684.7) |
| Income Tax and Social Contribution | (14.8) | 298.7 | (105.0) | (119.6) | 1,048.0 | (111.4) |
| (LOSS) INCOME FROM CONTINUED OPERATIONS | (690.8) | 763.0 | (190.5) | (2,478.2) | 1,139.2 | (317.5) |
| Income (Loss) from discontinued operations | (199.2) | (67.6) | 194.6 | (380.4) | (98.6) | 286.0 |
| (LOSS) INCOME FOR THE PERIOD | (890.0) | 695.4 | (228.0) | (2,858.6) | 1,040.7 | (374.7) |
| Attributable to controlling shareholders | (890.0) | 695.4 | (228.0) | (2,859.6) | 1,048.0 | (372.9) |
| Attributable to non-controlling shareholders | 0.0 | (0.0) | (258.8) | 1.0 | (7.3) | (113.8) |
PURCHASE PRICE ALLOCATION (PPA) AMORTIZATION
| R$ million | Q4-22 | Q4-21 | FY22 | FY21 |
| NET REVENUE | - | - | - | - |
| Cost of Products Sold | (1.8) | (1.3) | (7.6) | (24.6) |
| GROSS PROFIT | (1.8) | (1.3) | (7.6) | (24.6) |
| Selling, Marketing and Logistics Expenses | (64.1) | (70.3) | (258.0) | (290.1) |
| Administrative, R&D, IT and Project Expenses | (66.7) | (32.6) | (270.2) | (261.9) |
| Other Operating Income (Expenses), Net | (293.1) | 16.2 | (113.1) | 105.0 |
| Financial Income/(Expenses), net | 14.6 | 27.0 | 69.5 | 72.0 |
| Income Tax and Social Contribution | 43.6 | 63.3 | (5.6) | 439.3 |
| LOSS FROM CONTINUED OPERATIONS | (367.5) | 2.2 | (584.9) | 39.7 |
| Depreciation impact | (136.1) | (155.5) | (553.7) | (647.0) |
CONSOLIDATED STATEMENT OF CASH FLOW
| R$ million | FY22 | FY21 |
| CASH FLOW FROM OPERATING ACTIVITIES | ||
| Net (loss) income for the period | (2,858.6) | 1,040.7 |
| Adjustments to reconciliate net (loss) income for the period with net cash used in operating activities: | ||
| Depreciation and amortization | 2,591.9 | 2,791.5 |
| Interest and exchange variation on short-term investments | (537.3) | (264.8) |
| Earnings (loss) from swap and forward derivative contracts | 992.8 | (441.6) |
| Provision for tax, civil and labor risks | 409.3 | (56.2) |
| Inflation adjustment of judicial deposits | (35.5) | (15.2) |
| Inflation adjustment of provision for tax, civil and labor risks | 79.3 | 25.7 |
| Income tax and social contribution | 119.6 | (1,048.0) |
| Income from sale and write-off of property, plant and equipment, lease and non-current assets held for sale | 55.7 | 232.0 |
| Interest and exchange rate variation on leases | 200.2 | 210.7 |
| Interest and exchange rate variation on borrowings, financing and debentures, net of acquisition costs | 368.3 | 913.6 |
| Inflation adjustment and exchange rate variation on other assets and liabilities | 2.8 | 2.2 |
| Provision for losses from property, plant and equipment, intangible and leases | 348.7 | 3.0 |
| Provision for stock option plans | 258.5 | 275.6 |
| Provision for losses with trade accounts receivables, net of reversals | 606.0 | 837.8 |
| Provision for inventory losses, net of reversals | 305.7 | 407.2 |
| Reversal of provision for the provision for carbon credits | (17.9) | (13.6) |
| Effect from hyperinflationary economy | 349.9 | 165.8 |
| Other adjustments to reconcile net loss | 12.5 | (0.1) |
| Increase (Decrease) in: | ||
| Trade accounts receivable and related parties | (686.7) | (645.2) |
| Inventories | 485.8 | (1,117.7) |
| Recoverable taxes | 106.2 | (315.5) |
| Other assets | 223.5 | (1,223.2) |
| Domestic and foreign trade accounts payable and related parties | 39.7 | 467.5 |
| Payroll, profit sharing and social charges, net | (19.8) | (42.3) |
| Tax liabilities | 46.7 | (13.2) |
| Other liabilities | (370.9) | (165.4) |
| OTHER CASH FLOWS FROM OPERATING ACTIVITIES | ||
| Payment of income tax and social contribution | (580.2) | (976.5) |
| Release of judicial deposits | 40.1 | (3.9) |
| Payments related to tax, civil and labor lawsuits | (261.7) | (132.8) |
| (Payments) proceeds due to settlement of derivative transactions | (594.2) | (9.0) |
| Payment of interest on lease | (199.8) | (219.6) |
| Payment of interest on borrowings, financing and debentures | (809.0) | (783.9) |
| NET CASH (USED IN) OPERATING ACTIVITIES | 672 | (114) |
| CASH FLOW FROM INVESTING ACTIVITIES | ||
| Additions of property, plant and equipment and intangible | (1,102.8) | (1,479.2) |
| Proceeds from sale of property, plant and equipment, intangible and non-current assets held for sale | 14.8 | 114.5 |
| Acquisition of short-term investments | (12,764.0) | (11,739.9) |
| Redemption of short-term investments | 12,927.8 | 12,325.2 |
| Redemption of interest on short-term investments | 152.4 | 127.4 |
| NET CASH GENERATED BY (USED IN) INVESTING ACTIVITIES | (771.8) | (652.0) |
| CASH FLOW FROM FINANCING ACTIVITIES | ||
| Repayment of lease - principal | (953.0) | (1,077.6) |
| Repayment of borrowings, financing and debentures – principal | (6,826.6) | (7,989.6) |
| New borrowings, financing, and debentures | 8,557.5 | 6,425.6 |
| Acquisition of treasury shares, net of receipt of option strike price | (120.3) | (174.1) |
| Payment of dividends and interest on equity for the previous period | (180.5) | 0.0 |
| Receipt of funds due to settlement of derivative transactions | 118.7 | 1,570.6 |
| Capital Increase | 2.7 | 0.0 |
| NET CASH PROVIDED BY (USED IN) FINANCING ACTIVITIES | 598.5 | (1,245.2) |
| Effect of exchange rate variation on cash and cash equivalents | (309.8) | 197.0 |
| DECREASE IN CASH AND CASH EQUIVALENTS | 188.5 | (1,814.4) |
| Opening balance of cash and cash equivalents | 4,007.3 | 5,821.7 |
| Closing balance of cash and cash equivalents | 4,195.7 | 4,007.3 |
| DECREASE IN CASH AND CASH EQUIVALENTS | 188.5 | (1,814.4) |
7. Conference call and webcast

8. Glossary
Abihpec: Brazilian Association of the Personal Hygiene, Perfumery and Cosmetics Industry
ADR: An American Depositary Receipt is a negotiable certificate issued by a U.S. depository bank representing a specified number of shares of a non-U.S. company stock.
ADS: The individual issuance of shares in a U.S. stock exchange by a non-U.S. company is referred to as American Depositary Shares (ADS)
Adjusted EBITDA: Excludes effects that are not considered usual, recurring or not-comparable between the periods under analysis
APAC: Asia and Pacific
Avon representatives: Self-employed resellers who do not have a formal labor relationship with Avon
B3: Brazilian Stock Exchange
Benefit Sharing: In accordance with Natura’s Policy for the Sustainable Use of Biodiversity and Associated Traditional Knowledge, benefits are shared whenever we perceive various forms of value in the access gained. Therefore, one of the practices that defines the way in which these resources are divided is to associate payments with the number of raw materials produced from each plant as well as the commercial success of the products in which these raw materials are used
BPS: Basis Points; a basis points is equivalent to one percentage point * 100
Brand Power: A methodology used by Natura &Co to measure how its brands are perceived by consumers, based on metrics of significance, differentiation and relevance.
BRL: Brazilian Reais
CDI: The overnight rate for interbank deposits
CEE: Central and Eastern Europe
CFT: Cosmetics, Fragrances and Toiletries Market (CFT = Fragrances, Body Care and Oil Moisture, Make-up (without Nails), Face Care, Hair Care (without
Colorants), Soaps, Deodorants, Men’s Grooming (without Razors) and Sun Protection
COGS: Costs of Goods Sold
Constant currency (“CC) or constant exchange rates: when exchange rates used to convert financial figures into a reporting currency are the same for the years under comparison, excluding foreign currency fluctuation effects
CO2e: Carbon dioxide equivalent; for any quantity and type of greenhouse gas, CO2e signifies the amount of CO2 which would have the equivalent global warming impact.
EBITDA: Earnings Before Interests, Tax, Depreciation and Amortization
EMEA: Europe, Middle East and Africa
EP&L: Environmental Profit & Loss
Foreign currency translation: conversion of figures from a foreign currency into the currency of the reporting entity
G&A: General and administrative expenses
GHG: Greenhouse gases
ICON: Consumer Stock Index of the B3 stock exchange, designed to track changes in the prices of the more actively traded and better representative cyclical and non-cyclical consumer stocks
Innovation Index: Share in the last 12 months of the sale of products launched in the last 24 months
IBOV: Ibovespa Index is the main performance indicator of the stocks traded in B3 and lists major companies in the Brazilian capital market
IFRS – International Financial Reporting Standards
Kantar: Data, insights and consulting company with global presence
Hispanic Latam: Often used to refer to the countries in Latin America, excluding Brazil
LFL: Like-for-Like, applicable to measure comparable growth
Natura Consultant: Self-employed resellers who do not have a formal labor relationship with Natura
Natura Crer Para Ver Program (CPV): Special line of non-cosmetic products whose profits are transferred to the Natura Institute, in Brazil, and invested by Natura in social initiatives in the other countries where we operate. Our consultants promote these sales to benefit society and do not obtain any gains.
Natura Institute: Is a nonprofit organization created in 2010 to strengthen and expand our Private Social Investment initiatives. The institute has enabled us to leverage our efforts and investments in actions that contribute to the quality of public education
NYSE: New York Stock Exchange
P&L: Profit and loss
PP: Percentage point
PPA: Purchase Price Allocation - effects of the fair market value assessment as a result of a business combination
Profit Sharing: The share of profit allocated to employees under the profit-sharing program
SEC: The U.S. Securities and Exchange Commission (SEC) is an independent federal government regulatory agency responsible for protecting investors, maintaining fair and orderly functioning of the securities markets, and facilitating capital formation
SG&A: Selling, general and administrative expenses
SM&L: Selling, marketing and logistics expenses
SLB: Sustainability Linked Bond
SPT: Sustainability Performance Targets
SSS: Same-Store-Sales
Supplier Communities: The communities of people involved in small–scale farming and extraction activities in a variety of locations in Brazil, especially in the Amazon Region, who extract the inputs used in our products from the social and biodiversity. We form production chains with these communities that are based on fair prices, the sharing of benefits gained from access to the genetic heritage and associated traditional knowledge and support for local sustainable development projects. This business model has proven effective in generating social, economic and environmental value for Natura and for the communities.
Synergies: Synergy is the concept that the value and performance of two companies combined will be greater than the sum of the separate individual parts.
TBS: The Body Shop.
TMEA: Turkey, Middle East and Africa
UNI: Underlying Net Income.
WE: Western Europe
9. Disclaimer
EBITDA is not a measure under BR GAAP and does not represent cash flow for the periods presented. EBITDA should not be considered an alternative to net income as an indicator of operating performance or an alternative to cash flow as an indicator of liquidity. EBITDA does not have a standardized meaning and the definition of EBITDA used by Natura may not be comparable
with that used by other companies. Although EBITDA does not provide under BR GAAP a measure of cash flow, Management has adopted its use to measure the Company’s operating performance. Natura also believes that certain investors and financial analysts use EBITDA as an indicator of performance of its operations and/or its cash flow.
This report contains forward-looking statements. These forward-looking statements are not historical fact, but rather reflect the wishes and expectations of Natura’s management. Words such as “anticipate,” “wish,” “expect,” “foresee,” “intend,” “plan,” “predict,” “project,” “desire” and similar terms identify statements that necessarily involve known and unknown risks. Known risks include uncertainties that are not limited to the impact of price and product competitiveness, the acceptance of products by the market, the transitions of the Company’s products and those of its competitors, regulatory approval, currency fluctuations, supply and production difficulties and changes in product sales, among other risks. This report also contains certain pro forma data, which are prepared by the Company exclusively for informational and reference purposes and as such are unaudited. This report is updated up to the present date and Natura does not undertake to update it in the event of new information and/or future events.
Investor Relations Team
ri@natura.net
Item 2
Earnings presentation of Natura &Co Holding S.A. for the fourth quarter of 2022.
Fourt h - Quarter Results March 14 th , 2023
The words “anticipate," "wishes,“ "expects," "estimates," "intends," "forecasts," "plans," "predicts," "projects," "targets" and similar words are intended to identify these statements, which necessarily involve known and unknown risks and uncertainties. Known risks and uncertainties include, but are not limited to, the impact of competitive products and pricing, market acceptance of products, product transitions by the Company and its competitors, regulatory approval, currency fluctuations, production and supply difficulties, changes in product sales mix, and other risks. This presentation also may include pro - forma and adjusted information prepared by the Company for information and reference purposes only, which has not been audited. Forward - looking statements speak only as of the date they are made, and the Company does not undertake any obligation to update them in light of new information or future developments. https://ri.naturaeco.com/en/ This presentation may contain forward - looking statements. Such statements are not statements of historical fact and reflect the beliefs and expectations of Natura &Co’s management. 2
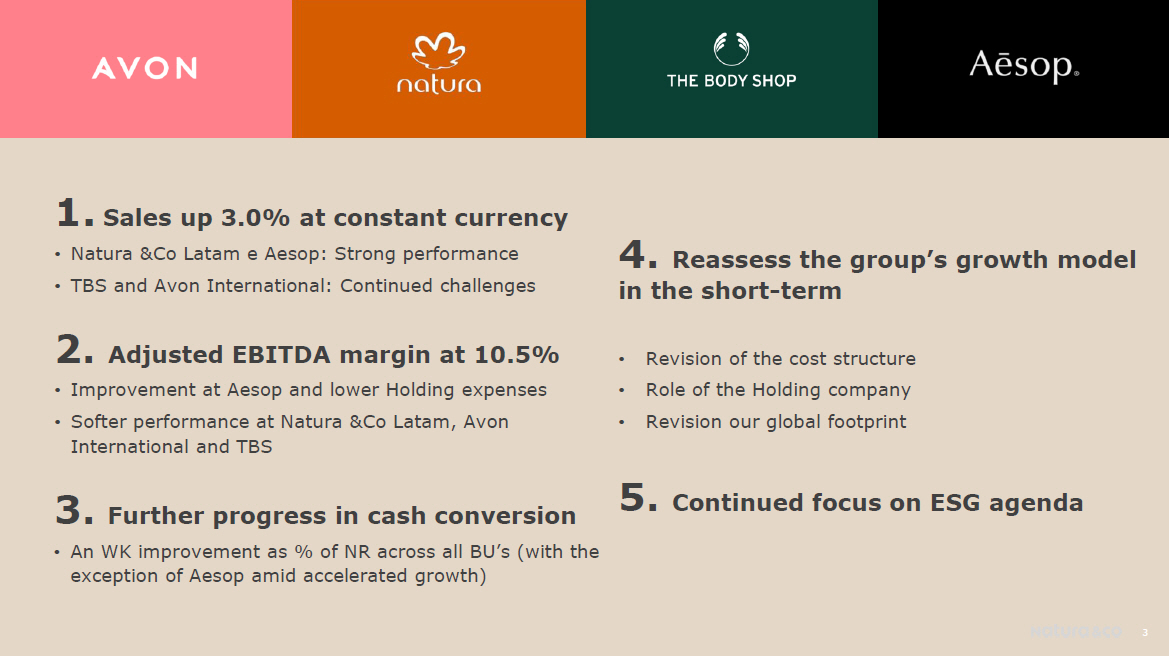
4 . Reassess the group’s growth model in the short - term • Revision of the cost structure • Role of the Holding company • Revision our global footprint 5 . Continued focus on ESG agenda 3 1. Sales up 3.0% at constant currency • Natura &Co Latam e Aesop: Strong performance • TBS and Avon International: Continued challenges 2 . Adjusted EBITDA margin at 10.5% • Improvement at Aesop and lower Holding expenses • Softer performance at Natura &Co Latam, Avon International and TBS 3 . Further progress in cash conversion • An WK improvement as % of NR across all BU’s (with the exception of Aesop amid accelerated growth)

Consolidated Financial Performance Guilherme Castellan, CFO
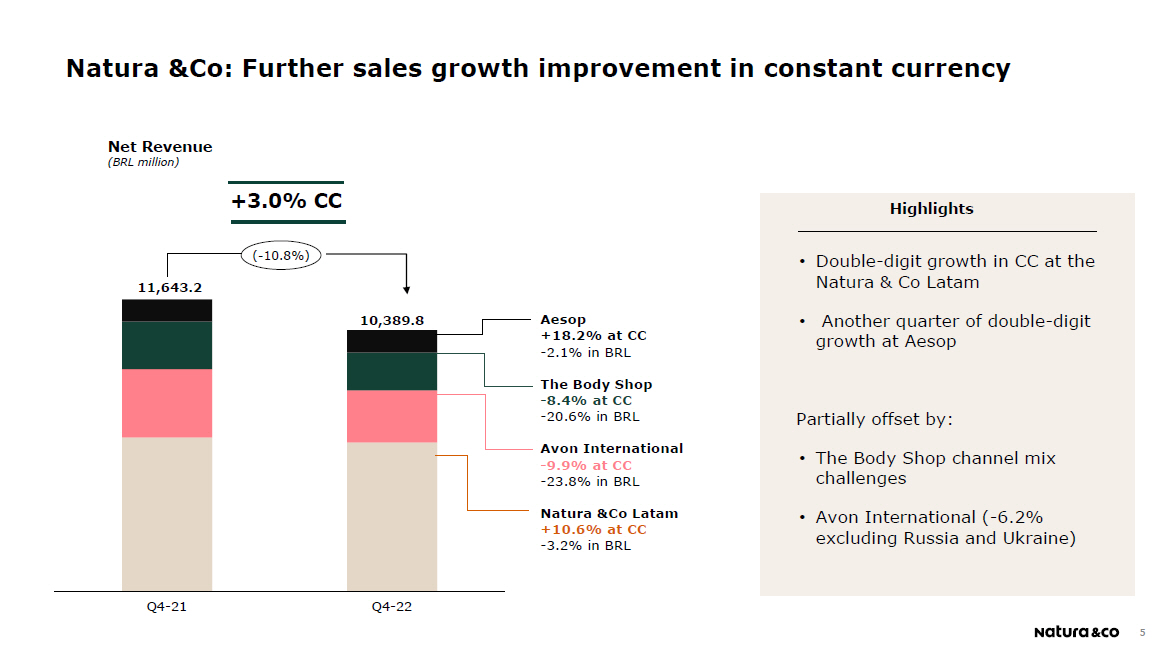
Net Revenue (BRL million) Highlights • Double - digit growth in CC at the Natura & Co Latam • Another quarter of double - digit growth at Aesop Partially offset by: • The Body Shop channel mix challenges • Avon International ( - 6.2% excluding Russia and Ukraine) 5 Natura &Co: Further sales growth improvement in constant currency Q 4 - 21 Q 4 - 22 ( - 10.8 % ) +3.0% CC 11 , 643 . 2 10,389.8 Aesop +18.2% at CC - 2.1% in BRL The Body Shop - 8.4% at CC - 20.6% in BRL Avon International - 9.9% at CC - 23.8% in BRL Natura &Co Latam +10.6% at CC - 3.2% in BRL
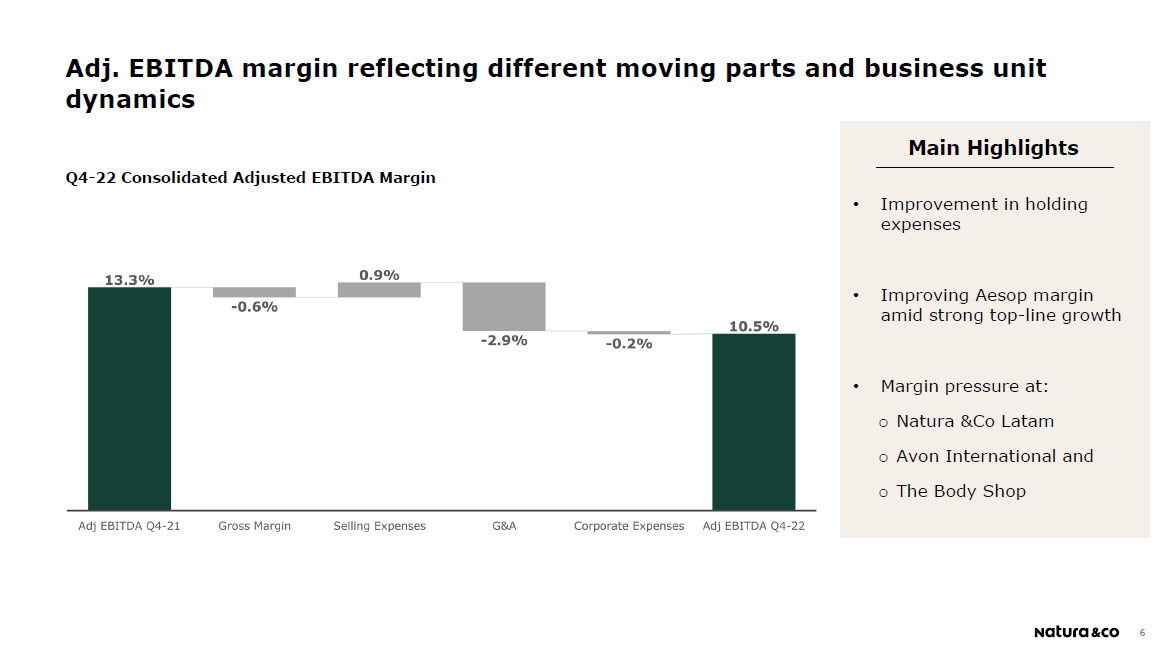
Adj. EBITDA margin reflecting different moving parts and business unit dynamics Q4 - 22 Consolidated Adjusted EBITDA Margin 6 Main Impacts Main Highlights • Improvement in holding expenses • Improving Aesop margin amid strong top - line growth • Margin pressure at: o Natura &Co Latam o Avon International and o The Body Shop
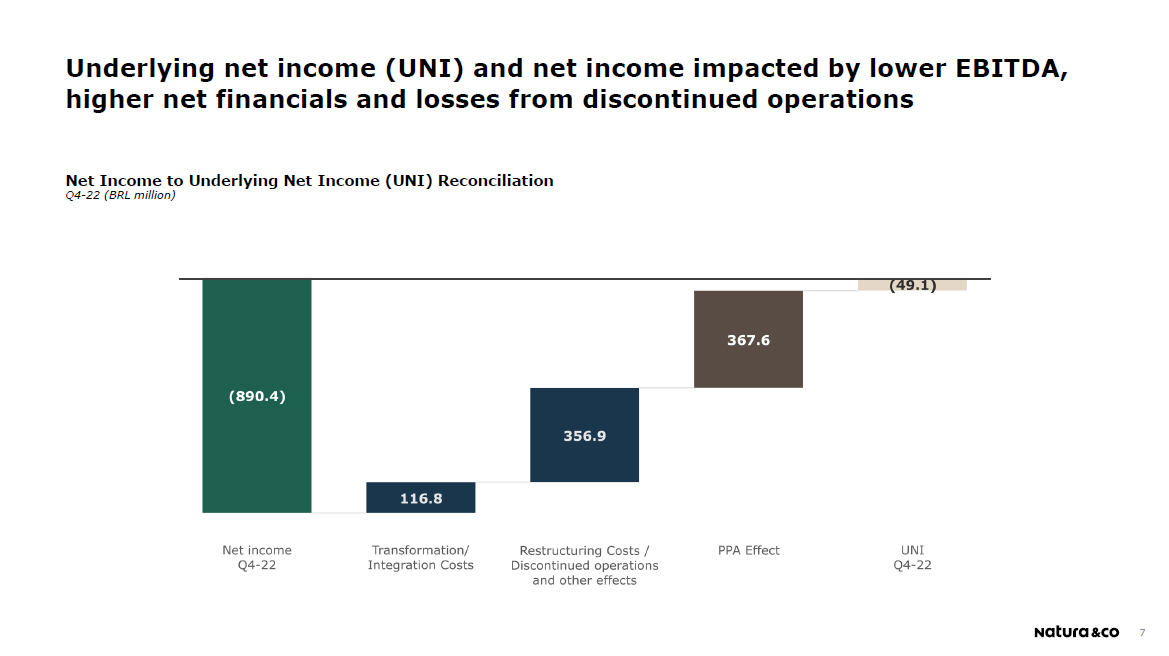
7 Net Income to Underlying Net Income (UNI) Reconciliation Q4 - 22 (BRL million) Underlying net income (UNI) and net income impacted by lower EBITDA, higher net financials and losses from discontinued operations
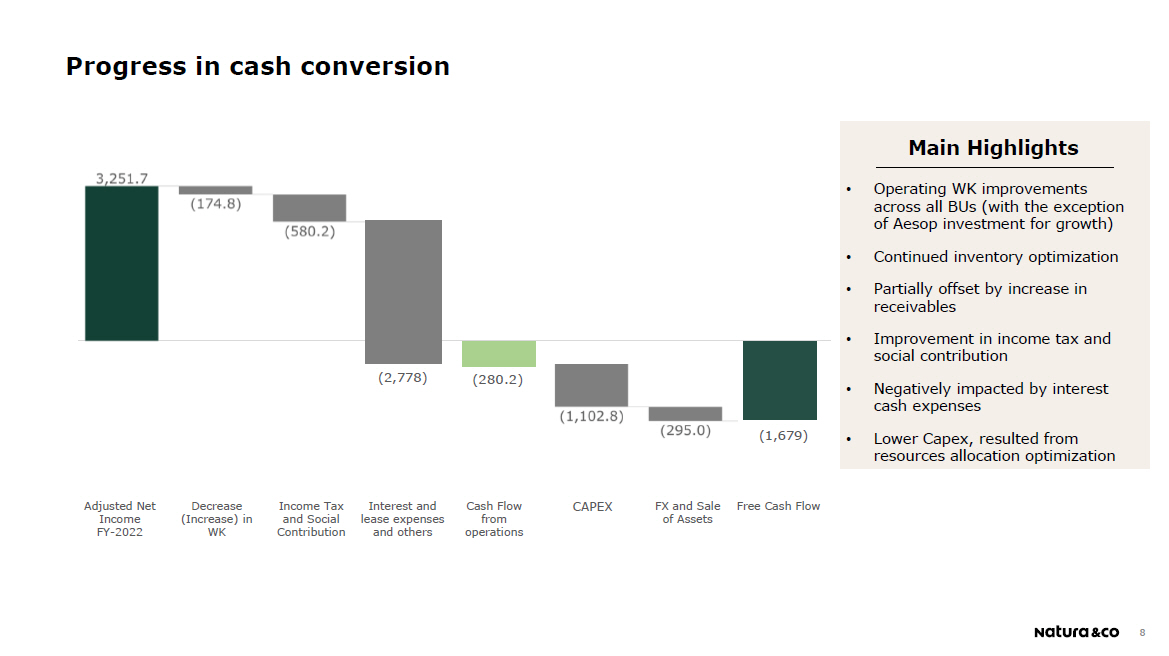
8 Progress in cash conversion • Operating WK improvements across all BUs (with the exception of Aesop investment for growth) • Continued inventory optimization • Partially offset by increase in receivables • Improvement in income tax and social contribution • Negatively impacted by interest cash expenses • Lower Capex, resulted from resources allocation optimization Main Highlights Adjusted Net Income FY - 2022 Decrease (Increase) in WK Income Tax and Social C o n trib u tion Interest and lease expenses and others Cash Flow from oper a tio n s C AP E X FX and Sale of Assets Free Cash Flow (2 80.2 ) (1,679) (2,778)
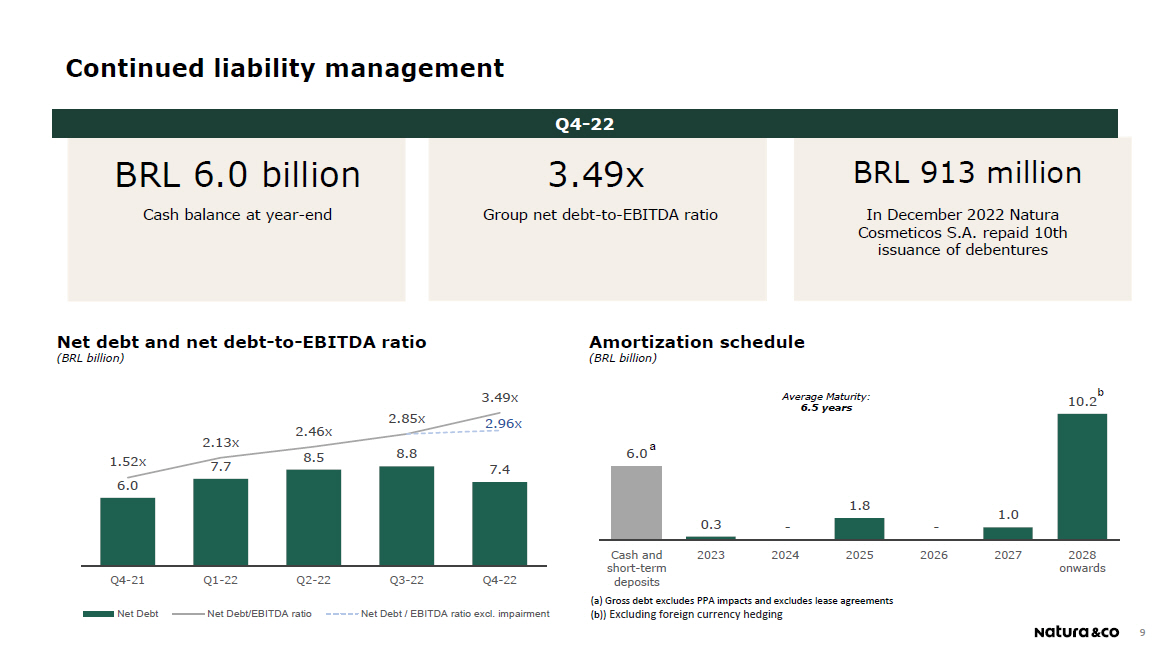
0.3 - 1.8 - 1.0 Cash and sh o rt - t erm deposits 2 0 23 2 0 24 2 0 25 2 0 26 2 0 27 2028 o n w ards BRL 913 million In December 2022 Natura Cosmeticos S.A. repaid 10th issuance of debentures BRL 6.0 billion Cash balance at year - end Q4 - 22 3.49x Group net debt - to - EBITDA ratio Net debt and net debt - to - EBITDA ratio (BRL billion) Amortization schedule (BRL billion) 9 (a) Gross debt excludes PPA impacts and excludes lease agreements (b)) Excluding foreign currency hedging 6.0 a b 10.2 Continued liability management Average Maturity: 6.5 years 6.0 8.8 7.4 1.52x 2.13x 7.7 2.46x 8.5 2.85x 3.49x 2.96x Q4 - 2 1 Q1 - 2 2 Q2 - 2 2 Q3 - 2 2 Q4 - 2 2 Net Debt Net Debt/EBITDA ratio Net Debt / EBITDA ratio excl. impairment
Natura &Co Latam Financial Performance
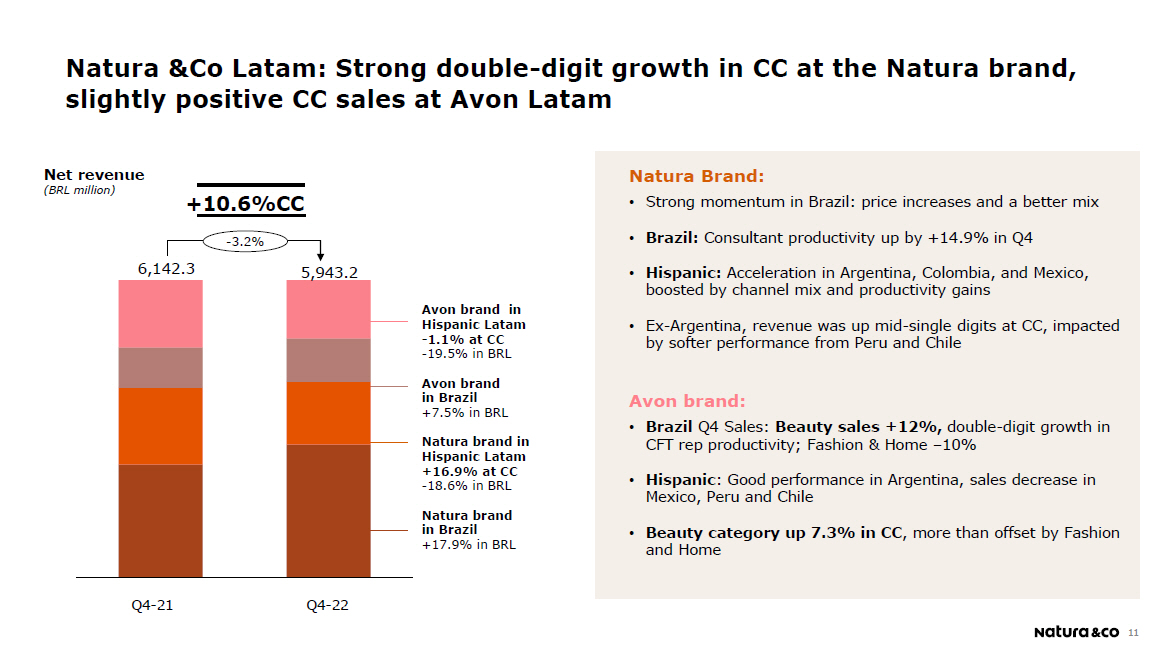
Q4 - 22 Avon brand in Hispanic Latam - 1.1% at CC - 19.5% in BRL Avon brand in Brazil +7.5% in BRL Natura brand in Hispanic Latam +16.9% at CC - 18.6% in BRL Natura brand in Brazil +17.9% in BRL 6,142.3 5,943.2 Q4 - 21 + 10 . 6% C C - 3.2% 11 Natura Brand: • Strong momentum in Brazil: price increases and a better mix • Brazil: Consultant productivity up by +14.9% in Q4 • Hispanic: Acceleration in Argentina, Colombia, and Mexico, boosted by channel mix and productivity gains • Ex - Argentina, revenue was up mid - single digits at CC, impacted by softer performance from Peru and Chile Avon brand: • Brazil Q4 Sales: Beauty sales +12%, double - digit growth in CFT rep productivity; Fashion & Home – 10% • Hispanic : Good performance in Argentina, sales decrease in Mexico, Peru and Chile • Beauty category up 7.3% in CC , more than offset by Fashion and Home Natura &Co Latam: Strong double - digit growth in CC at the Natura brand, slightly positive CC sales at Avon Latam Net revenue (BRL million)
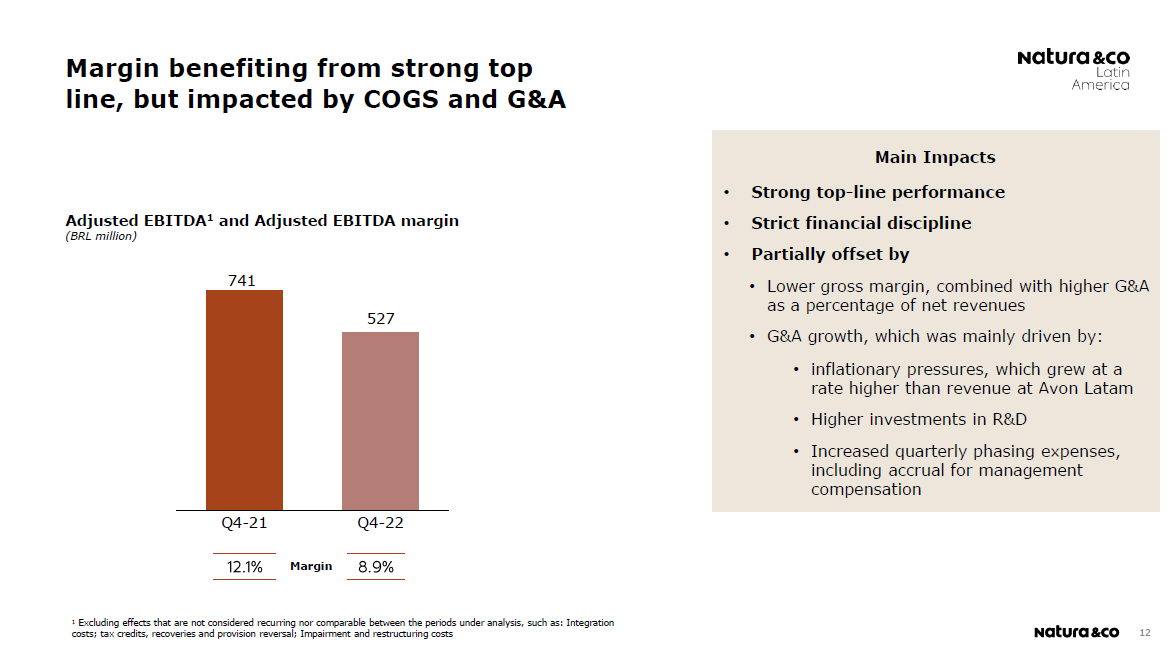
Adjusted EBITDA 1 and Adjusted EBITDA margin (BRL million) Ma rg in • Strong top - line performance • Strict financial discipline • Partially offset by • Lower gross margin, combined with higher G&A as a percentage of net revenues • G&A growth, which was mainly driven by: 1 Excluding effects that are not considered recurring nor comparable between the periods under analysis, such as: Integration costs; tax credits, recoveries and provision reversal; Impairment and restructuring costs 741 527 Q 4 - 22 Q 4 - 21 12 Margin benefiting from strong top line, but impacted by COGS and G&A Main Impacts • inflationary pressures, which grew at a rate higher than revenue at Avon Latam • Higher investments in R&D • Increased quarterly phasing expenses, including accrual for management compensation
Avon International Financial Performance
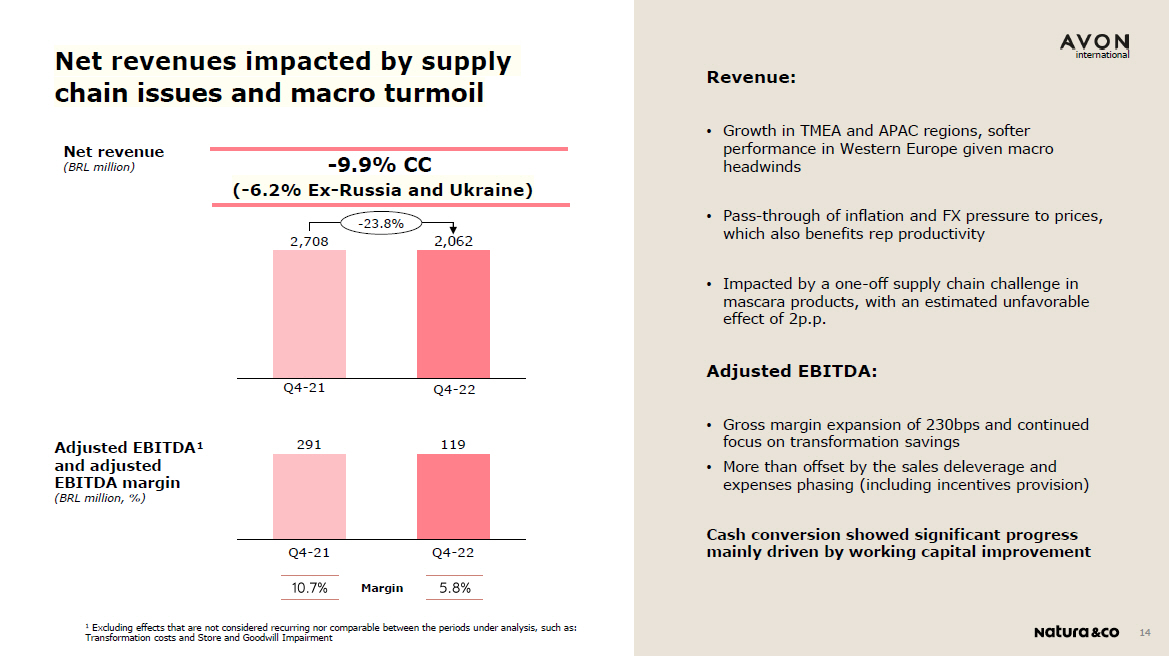
Ma rg in 291 119 Q 4 - 21 Q 4 - 22 2,708 2,062 Q 4 - 21 Q 4 - 22 - 23.8% - 9.9% CC ( - 6.2% Ex - Russia and Ukraine) Net revenue (BRL million) Adjusted EBITDA¹ and adjusted EBITDA margin (BRL million, %) 1 Excluding effects that are not considered recurring nor comparable between the periods under analysis, such as: Transformation costs and Store and Goodwill Impairment i nt e rnat i o nal Revenue: • Growth in TMEA and APAC regions, softer performance in Western Europe given macro headwinds • Pass - through of inflation and FX pressure to prices, which also benefits rep productivity • Impacted by a one - off supply chain challenge in mascara products, with an estimated unfavorable effect of 2p.p. Adjusted EBITDA: • Gross margin expansion of 230bps and continued focus on transformation savings • More than offset by the sales deleverage and expenses phasing (including incentives provision) Cash conversion showed significant progress mainly driven by working capital improvement 14 Net revenues impacted by supply chain issues and macro turmoil
The Body Shop Financial Performance
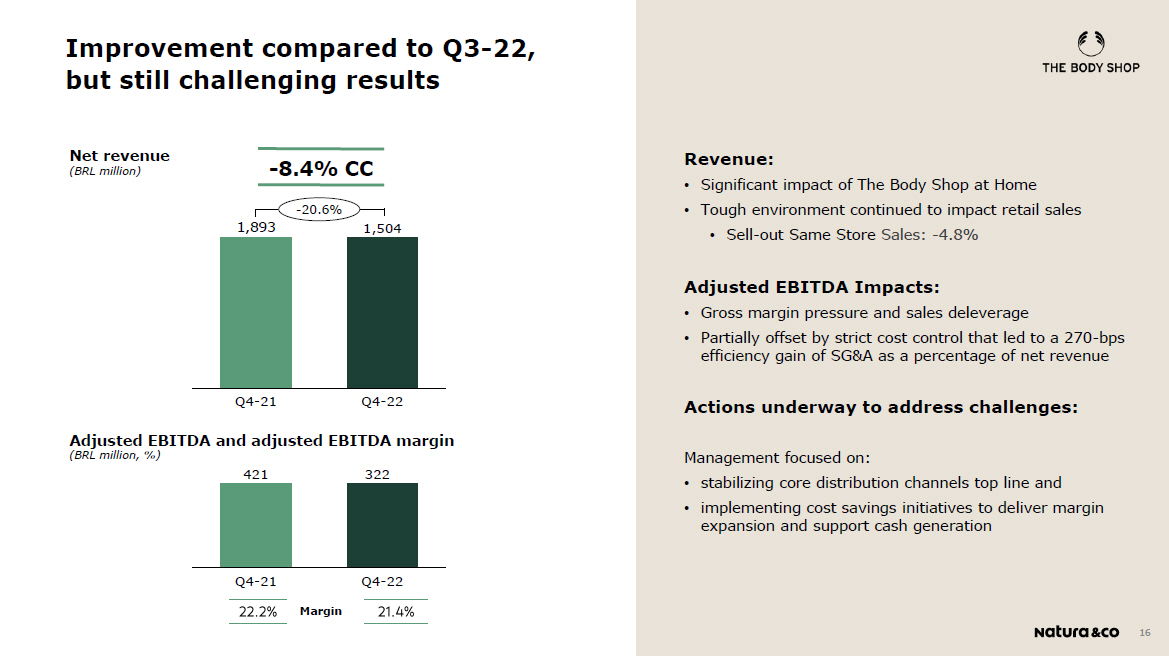
1,893 1,504 - 20.6% Q4 - 21 Q4 - 22 Adjusted EBITDA and adjusted EBITDA margin (BRL million, %) 421 322 Q 4 - 21 Q 4 - 22 - 8.4% CC Net revenue (BRL million) Revenue: • Significant impact of The Body Shop at Home • Tough environment continued to impact retail sales • Sell - out Same Store Sales: - 4.8% Adjusted EBITDA Impacts: • Gross margin pressure and sales deleverage • Partially offset by strict cost control that led to a 270 - bps efficiency gain of SG&A as a percentage of net revenue Actions underway to address challenges: Management focused on: • stabilizing core distribution channels top line and • implementing cost savings initiatives to deliver margin expansion and support cash generation Ma rg in 16 Improvement compared to Q3 - 22, but still challenging results
Aesop Financial Performance
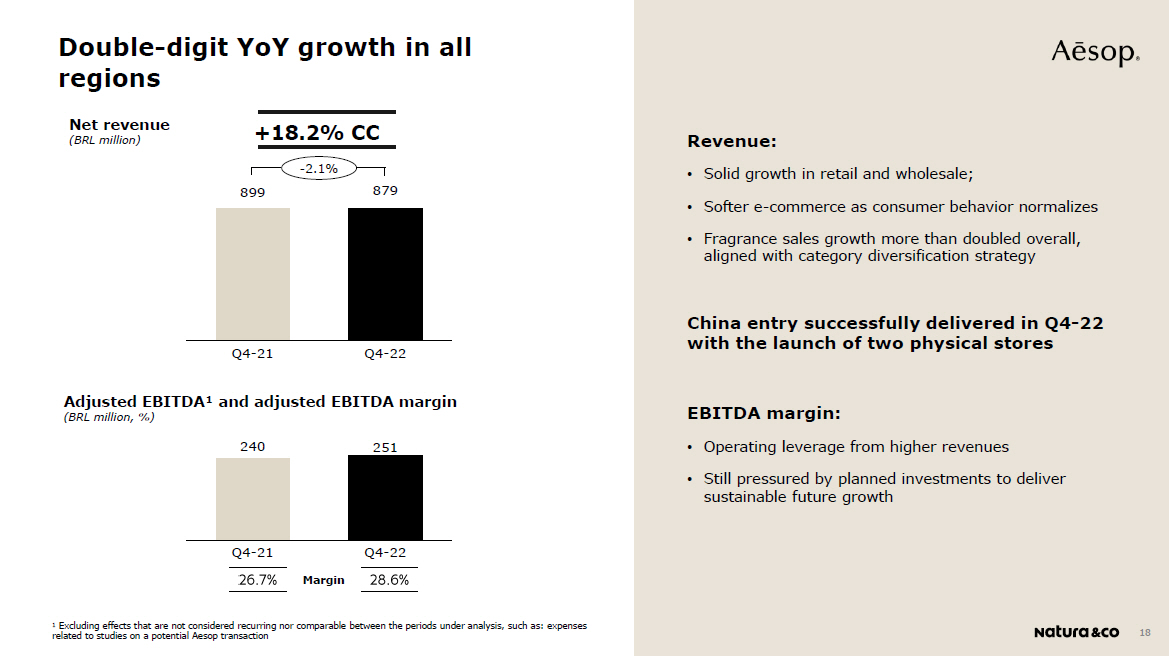
899 879 Q 4 - 21 Q 4 - 22 - 2.1% Net revenue (BRL million) +18.2% CC Adjusted EBITDA¹ and adjusted EBITDA margin (BRL million, %) 240 251 Q 4 - 21 Q 4 - 22 Revenue: • Solid growth in retail and wholesale; • Softer e - commerce as consumer behavior normalizes • Fragrance sales growth more than doubled overall, aligned with category diversification strategy China entry successfully delivered in Q4 - 22 with the launch of two physical stores EBITDA margin: • Operating leverage from higher revenues • Still pressured by planned investments to deliver sustainable future growth Ma rg in 18 1 Excluding effects that are not considered recurring nor comparable between the periods under analysis, such as: expenses related to studies on a potential Aesop transaction Double - digit YoY growth in all regions

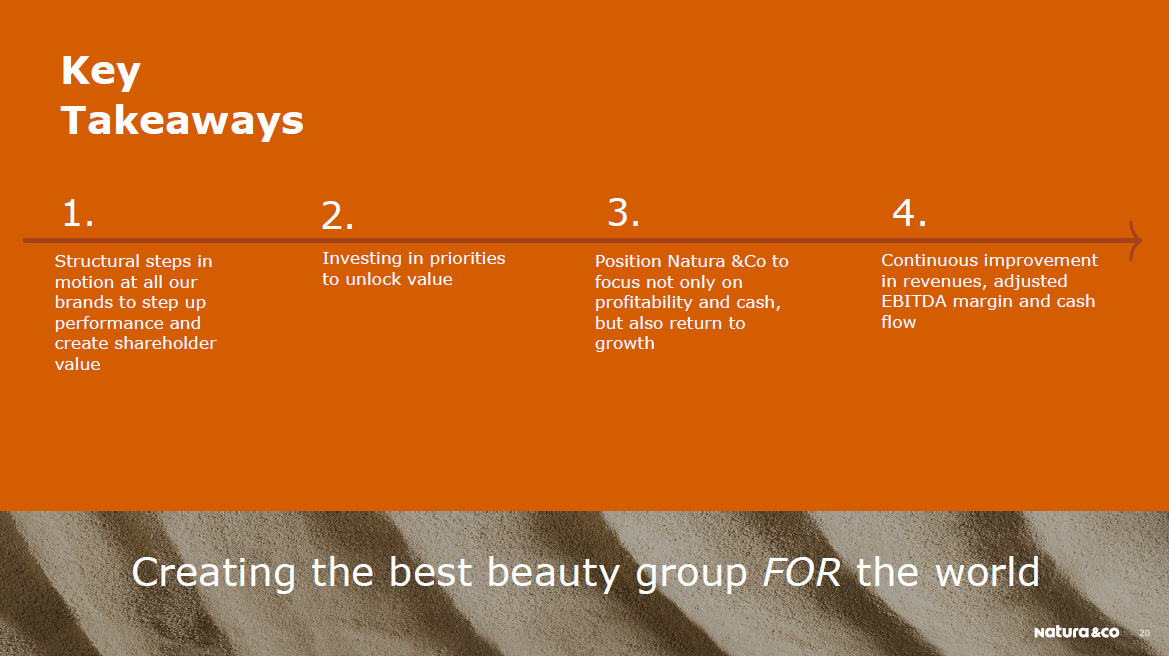
Position Natura &Co to focus not only on profitability and cash, but also return to growth Creating the best beauty group FOR the world Continuous improvement in revenues, adjusted EBITDA margin and cash flow 1. Structural steps in motion at all our brands to step up performance and create shareholder value 2. Investing in priorities to unlock value 3 . 4 . Key Tak e aways
Than k Y ou

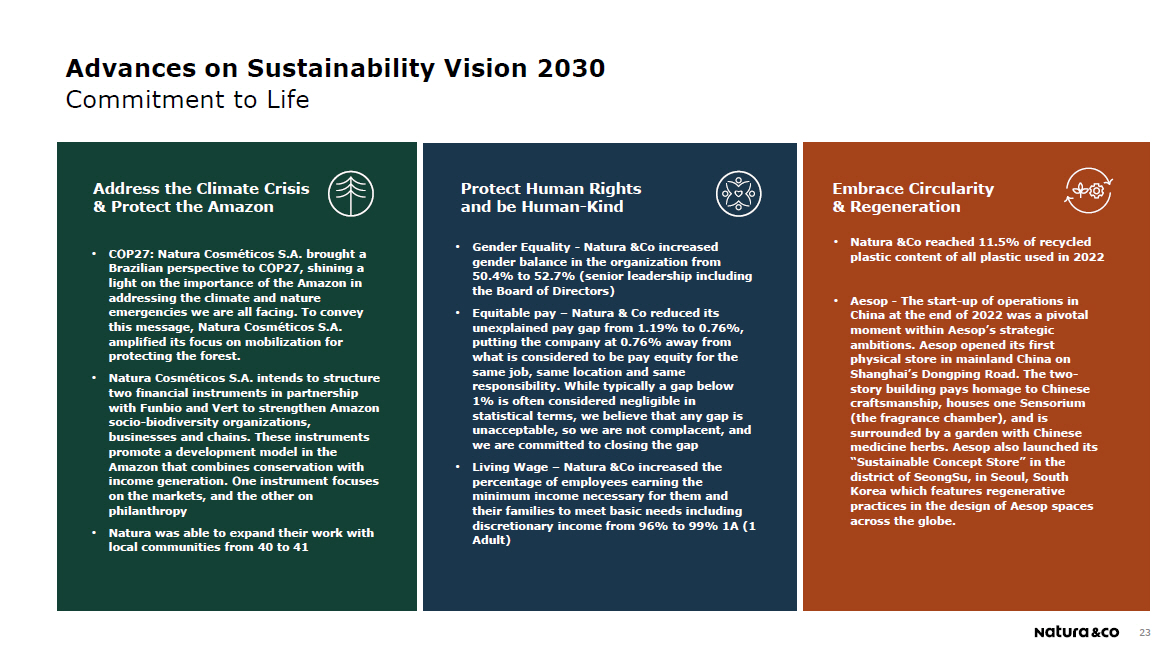
Address the Climate Crisis & Protect the Amazon Protect Human Rights and be Human - Kind Embrace Circularity & Regeneration • Gender Equality - Natura &Co increased gender balance in the organization from 50.4% to 52.7% (senior leadership including the Board of Directors) • Equitable pay – Natura & Co reduced its unexplained pay gap from 1.19% to 0.76%, putting the company at 0.76% away from what is considered to be pay equity for the same job, same location and same responsibility. While typically a gap below 1% is often considered negligible in statistical terms, we believe that any gap is unacceptable, so we are not complacent, and we are committed to closing the gap • Living Wage – Natura &Co increased the percentage of employees earning the minimum income necessary for them and their families to meet basic needs including discretionary income from 96% to 99% 1A (1 Adult) • Natura &Co reached 11.5% of recycled plastic content of all plastic used in 2022 • Aesop - The start - up of operations in China at the end of 2022 was a pivotal moment within Aesop’s strategic ambitions. Aesop opened its first physical store in mainland China on Shanghai’s Dongping Road. The two - story building pays homage to Chinese craftsmanship, houses one Sensorium (the fragrance chamber), and is surrounded by a garden with Chinese medicine herbs. Aesop also launched its “Sustainable Concept Store” in the district of SeongSu, in Seoul, South Korea which features regenerative practices in the design of Aesop spaces across the globe. • COP27: Natura Cosméticos S.A. brought a Brazilian perspective to COP27, shining a light on the importance of the Amazon in addressing the climate and nature emergencies we are all facing. To convey this message, Natura Cosméticos S.A. amplified its focus on mobilization for protecting the forest. • Natura Cosméticos S.A. intends to structure two financial instruments in partnership with Funbio and Vert to strengthen Amazon socio - biodiversity organizations, businesses and chains. These instruments promote a development model in the Amazon that combines conservation with income generation. One instrument focuses on the markets, and the other on philanthropy • Natura was able to expand their work with local communities from 40 to 41 23 Advances on Sustainability Vision 2030 Commitment to Life
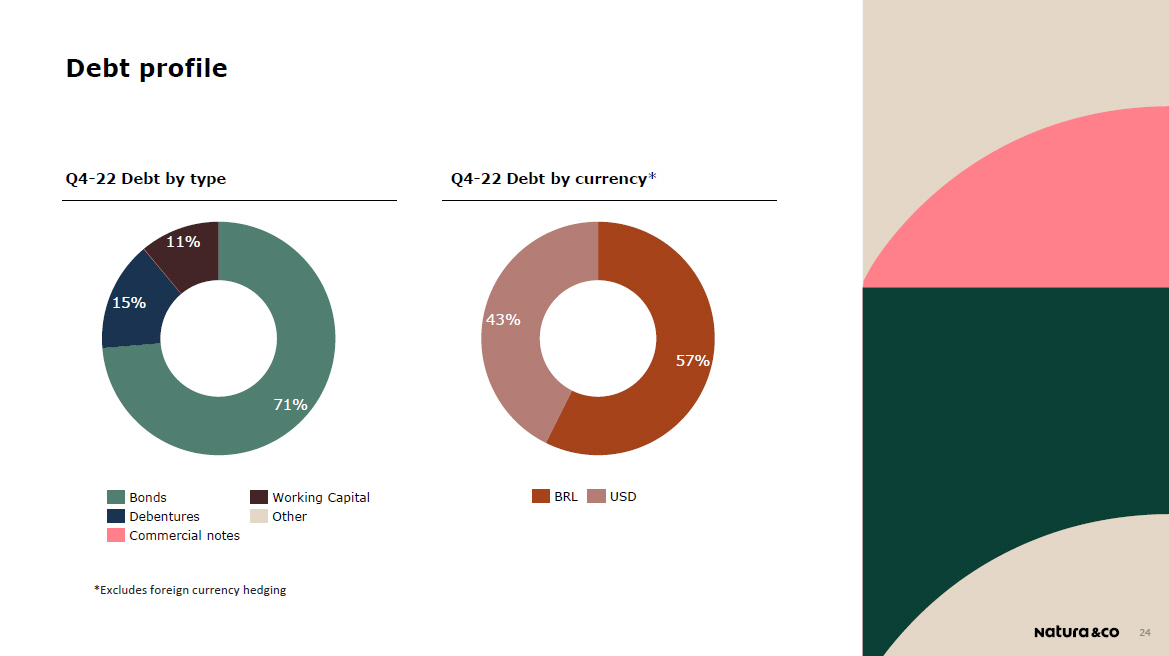
Q4 - 22 Debt by type Q4 - 22 Debt by currency* 71% 11% 15% 57% 43% Working Capital Other Bonds Debentures Commercial notes USD BRL 24 Debt profile * Excludes foreign currency hedging
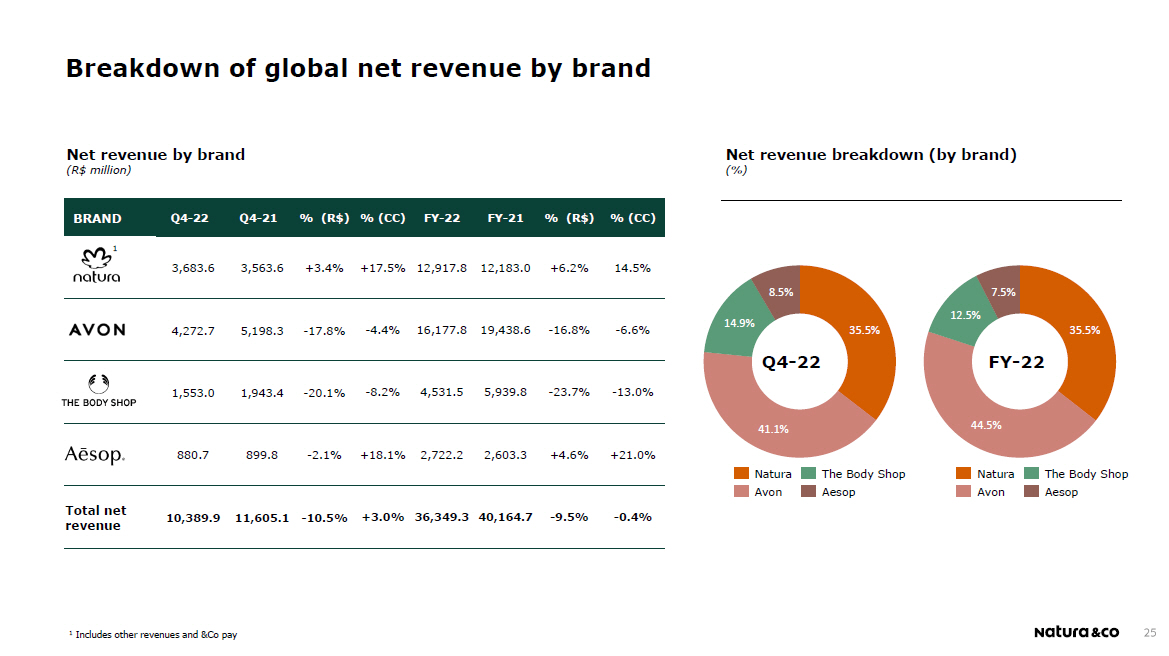
Net revenue by brand (R$ million) Net revenue breakdown (by brand) (%) BRAND Q4 - 22 Q4 - 21 % (R$) % (CC) FY - 22 FY - 21 % (R$) % (CC) 1 3,683.6 3,563.6 +3.4% +17.5% 12,917.8 12,183.0 + 6 . 2% 14 . 5% 4,272.7 5,198.3 - 17.8% - 4.4% 16,177.8 19,438.6 - 16 . 8% - 6.6% 1,553.0 1,943.4 - 20.1% - 8.2% 4,531.5 5,939.8 - 23 . 7% - 13 . 0% 880.7 899.8 - 2.1% +18.1% 2,722.2 2,603.3 + 4 . 6% + 21 . 0% Total net revenue 10,389.9 11,605.1 - 10.5% +3.0% 36,349.3 40,164.7 - 9 . 5 % - 0 . 4 % 1 Includes other revenues and &Co pay 35.5% 41.1% 14.9% 8.5% Nat u ra Avon The Body Shop Aesop Q 4 - 22 35.5% 44.5% 12.5% 7.5% Nat u ra Avon The Body Shop Aesop Breakdown of global net revenue by brand FY - 22