UNITED STATES
SECURITIES AND EXCHANGE COMMISSION
Washington, D.C. 20549
FORM 6-K
REPORT OF FOREIGN PRIVATE ISSUER PURSUANT TO RULE 13a-16 OR 15d-16 UNDER THE SECURITIES EXCHANGE ACT OF 1934
For the month of May, 2023
Commission File Number: 001-39169
Natura &Co Holding S.A.
(Exact name of registrant as specified in its charter)
Avenida Alexandre Colares, No. 1188, Sala A17-Bloco A
Parque Anhanguera
São Paulo, São Paulo 05106-000, Brazil
(Address of principal executive office)
Indicate by check mark whether the registrant files or will file annual reports under cover of Form 20-F or Form 40-F:
| Form 20-F | X | Form 40-F |
Indicate by check mark if the registrant is submitting the Form 6-K in paper as permitted by Regulation S-T Rule 101(b)(1):
| Yes | No | X |
Indicate by check mark if the registrant is submitting the Form 6-K in paper as permitted by Regulation S-T Rule 101(b)(7):
| Yes | No | X |
NATURA &CO HOLDING S.A.
TABLE OF CONTENTS
ITEM
| 1. | Earnings release of Natura &Co Holding S.A. for the first quarter of 2023. |
| 2. | Earnings presentation of Natura &Co Holding S.A. for the first quarter of 2023. |
SIGNATURE
Pursuant to the requirements of the Securities Exchange Act of 1934, the registrant has duly caused this report to be signed on its behalf by the undersigned, thereunto duly authorized.
| NATURA &CO HOLDING S.A. | |||
| By: | /s/ Guilherme Strano Castellan | ||
| Name: | Guilherme Strano Castellan | ||
| Title: | Principal Financial Officer | ||
| By: | /s/ Itamar Gaino Filho | ||
| Name: | Itamar Gaino Filho | ||
| Title: | Chief Legal and Compliance Officer | ||
Date: May 11, 2023.
Item 1
Earnings release of Natura &Co Holding S.A. for the first quarter of 2023.

Sao Paulo, May 08, 2023
Q1-23: Strong Profitability improvement
from revenue management and cost control
Continued good momentum at Natura brand and Avon CFT in Brazil; Avon International in positive
territory in CFT; The Body Shop still showing top line challenges
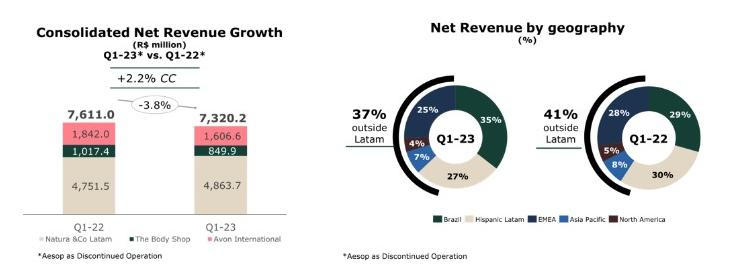
| • | Q1-23 consolidated net revenue of BRL 8.0 billion, +3.4% vs Q1-22 in constant currency (CC) and down -2.8% YoY in BRL. Growth in CC was driven again by a strong performance by Natura &Co Latam (+9.0% in CC) and Aesop (+16.8% in CC), partially offset by continued challenges at The Body Shop (-9.4% in CC) and, to a lesser extent, at Avon International (-7.5% in CC, -3.7% excluding Russia and Ukraine). Excluding Aesop, Q1-23 consolidated net revenue was BRL 7.3 billion, up +2.2 YoY at CC and down 3.8% YoY in BRL |
| • | Q1-23 consolidated gross profit stood at BRL 5.4 billion, implying a 67.7% gross margin, up 370 bps vs Q1-22. Margin improved YoY in all business units apart from Aesop. The improvement was mainly driven by pricing and mix, which more than offset continued inflation and FX pressures. Excluding Aesop, gross margin was 65.9%, up 380 bps YoY |
| • | Q1-23 consolidated adjusted EBITDA was BRL 842 million with margin of 10.5% (+330 bps YoY), as improving margin at Natura & Co Latam and Avon International, combined with lower Holding expenses, more than offset slight YoY pressure at The Body Shop and higher pressure at Aesop from continued investments. Adjusted EBITDA excluding Aesop was BRL 712 million, with margin up 370 bps vs Q1-22 to 9.7% |
| • | Q1-23 Net Debt (excluding leasing) stood at BRL 9.4 billion (from BRL 7.4 billion in Q4-22). Despite improving EBITDA YoY, the BRL 2.0 billion QoQ increase in net debt was mainly due to seasonal cash consumption, combined with increases in inventory and accounts receivable from strong growth at the Natura brand |
| • | Q1-23 Net loss of BRL 652 million in the quarter, broadly in line with last year, as better EBITDA (adjusted and reported) was more than offset by higher net financial expenses (which will be addressed with Aesop’s sale) and losses from discontinued operations |
Aesop as Discontinued Operation | |||||||
Consolidated Financial Results (R$ million)
| Q1-23 | Q1-22 | ∆ | Q1-23 | Q1-22 | ∆ | |
| Net Revenue | 8,021.4 | 8,253.3 | -2.8% | 7,320.2 | 7,611.0 | -3.8% | |
| Constant Currency Change | 3.4% | 2.2% | |||||
| Gross Profit | 5,428.4 | 5,282.4 | 2.8% | 4,825.5 | 4,728.0 | 2.1% | |
| Gross Margin | 67.7% | 64.0% | 370 bps | 65.9% | 62.1% | 380 bps | |
| Reported EBITDA | 760.4 | 515.8 | 47.4% | 630.9 | 376.0 | 67.8% | |
| Reported EBITDA Margin | 9.5% | 6.2% | 330 bps | 8.6% | 4.9% | 370 bps | |
| Adjusted EBITDA | 841.7 | 595.9 | 41.3% | 712.1 | 456.1 | 56.1% | |
| Adjusted EBITDA Margin | 10.5% | 7.2% | 330 bps | 9.7% | 6.0% | 370 bps | |
| Net Income (loss) attributable to controlling shareholders | (652.4) | (643.1) | 1.4% | | (652.4) | (643.1) | 1.4% | |
| Net Margin | -8.1% | -7.8% | -30 bps | -8.9% | -8.4% | -50 bps | |
Fábio Barbosa, Group CEO of Natura &Co, declared:
“Natura &Co’s performance in the first quarter is in line with our plan and with our previous communication, as Q1 numbers show a solid improvement both in gross and adjusted EBITDA margin, while the company continues to put in action important structural changes in its portfolio, focusing on simplifying its structure and improving its capital structure.
Excluding Aesop, Q1-23 showed a strong profitability improvement, mainly driven by gross margin expansion across all business units and continuous cost control, that were partially offset by sales deleverage at The Body Shop, Avon Latam and, to a lesser extent, Avon International. This quarter’s gross margin expansion is driven by price increases carry-over and more favorable mix, more than offsetting the inflationary environment we continue to experience. As per the normal seasonality of the business, cash consumption in Q1 was high, as planned, and working capital management was impacted by build-up of inventories for Q2 and changes related to the continued integration of Natura and Avon brands in Latam. From a revenue standpoint, the highlight remains the Natura brand, which continued its strong momentum from last year, with Natura Brazil sales growing 25%, led by volume and strong productivity growth.
Shortly after the close of the quarter, Natura & Co announced important milestones, which are transformational for the future of the group. First, the group announced it has entered into a binding agreement to sell Aesop to L’Oreal for an enterprise value of US$2.525 billion (subject to customary regulatory approvals). Furthermore, in April we had our first day of full integration of Natura and Avon in Peru as part of Wave 2, with sales forces completely integrated and sharing the same experience. Finally, The Body Shop announced it was entering its next chapter, with Ian Bickley taking over as interim chief executive after David Boynton stepped down.
Our triple bottom line agenda also showed important advances, with significant improvements in the share of renewable or natural ingredients and of biodegradable formulas. Natura &Co also released its third pay equity report, showing we maintained our target of equal representation, with 52.7% of women in leadership roles -Director and above- across the organization.
While 2023 continues to shape up as another challenging year, our strategic priorities are clear and, the first results give us confidence that we are on the right track. We believe that massively reducing the company’s net debt, combined with stronger EBITDA margins resulting from the businesses’ operational improvement, alongside our relentless focus on cash conversion, will pave the way for strong cash generation in the coming years, allowing us to make disciplined investments in our business priorities and unlocking value for our shareholders.”
Key Financial Results per Business Unit
Q1-23 vs. Q1-22 | |||||
Net | ∆ % | ∆ % CC | Adj. EBITDA Margin | ∆ Adj. | |
| Consolidated | 8,021.4 | -2.8% | 3.4% | 10.5% | 330 bps |
| Natura &Co Latam | 4,863.7 | 2.4% | 9.0% | 13.0% | 400 bps |
| Avon International | 1,606.6 | -12.8% | -7.5% | 6.1% | 170 bps |
| The Body Shop | 849.9 | -16.5% | -9.4% | 6.1% | -30 bps |
| Aesop | 701.3 | 9.2% | 16.8% | 18.5% | -320 bps |
| • | Natura &Co Latam: Q1-23 net revenue up by +9.0% in CC and +2.4% in BRL, driven by solid double-digit growth in CC at the Natura brand, partially offset by a high-single digit CC sales decline at Avon Latam |
| • | Natura brand in Latam: Net revenue was up +25.1% in Q1-23 in CC and +17.3% in BRL, with even stronger momentum in Brazil (vs. Q4-22) and further growth in Hispanic Latam. In Brazil, net revenue grew +24.9% in Q1-23, supported by strong consultant productivity growth combined with an outstanding retail performance. Even amid political and economic turmoil, especially in Argentina and Chile, net revenue in Hispanic Latam was up +25.5% in CC and +6.7% in BRL. Growth was mainly driven by acceleration in Argentina and Colombia. Excluding Argentina, revenue in Hispanic markets was up in mid-single digits in CC, impacted by a softer performance in Chile |
| • | Avon brand in Latam: Net revenue was down -9.8% in CC and -15.1% in BRL. In Brazil, net revenue was broadly flat (at -0.6%), a deceleration compared to the Q4 dynamic, but against a stronger comparable base. The beauty category showed +5.6% top-line growth, while Fashion and Home sales were down -18.0%, in line with our portfolio optimization strategy. In Hispanic markets, net revenue deteriorated by -14.8% in Q1-23 in CC (or -22.0% in BRL), mainly impacted by a decrease in Mexico and Chile. The Beauty category was broadly stable YoY in CC, amid the expected distribution channel reduction given the Wave 2 roll-out and its preparation in other Hispanic countries, but beauty productivity per representative is increasing more than 20% YoY |
| • | Natura &Co Latam’s Q1-23 adjusted EBITDA margin was 13.0% (+400 bps YoY), mainly driven by strong YoY gross margin improvement (+450 bps) across regions and brands, combined with SG&A efficiencies at the Avon Brand in Brazil, but partially offset by Avon Hispanic Latam deleverage and investments in the Natura brand (accelerating since Q3-22) |
• Avon International
| • | Q1-23 net revenue was down -7.5% YoY in constant currency and -12.8% in BRL. Excluding Russia and Ukraine, revenue decreased -3.7% compared to Q1-22 in CC. Net revenues were also impacted by the earthquakes in Turkey, which we estimate had a negative impact of 1p.p. In Q1-23 the Beauty category entered positive territory (excluding Russia and Ukraine), driven by the fragrance and color categories, while Fashion & Home decreased -21% (in CC) given the portfolio optimization strategy |
| • | Q1-23 adjusted EBITDA margin stood at 6.1%, up 170bps YoY. Gross margin expansion of +480bps, driven by price increases and a positive product mix, continued focus on transformation savings and phasing of expenses, were partially offset by sales deleverage, brand investment in lead markets and inflation increase in fixed expenses |
• The Body Shop
| • | Q1-23 net revenue was down -9.4% in CC and -16.5% in BRL. Combined sales of core business distribution channels (stores, e-commerce and franchise) showed a low-single digit decline in CC in Q1-23, similar to Q4-22 (but on the back of a softer comparable base), while The Body Shop at Home continued its steep decline. Franchise sell-in was weak in the quarter, amid the rising inventory level that was highlighted last quarter, but slightly better sales sell-out led to a better inventory level YoY (albeit still above 2019 in some regions) |
| • | Q1-23 adjusted EBITDA margin was 6.1%, down 30 bps YoY. Despite sales deleverage, the slight gross margin expansion and strict cost control (following last quarter’s trend) led to lower YoY margin pressure. In Q1-23, gross margin showed an inflection point, expanding by 50 bps YoY to 78.6%. This was mainly driven by mix and pricing, partially offset by continued higher inflation |
• Aesop
| • | Q1-23 net revenue increased +16.8% in CC and +9.2% in BRL. All regions delivered double-digit YoY growth, despite a deteriorating macro environment. From a distribution channel perspective, retail and wholesale showed solid growth, partially offset by a softer e-commerce performance, reflecting consumer behavior normalization post-Covid |
| • | Q1-23 adjusted EBITDA margin was 18.5%, down -320 bps YoY, still pressured by planned investments to deliver sustainable future growth |
1. Results analysis
The Group segmentation
is composed of:
| • | Natura &Co Latam, which includes all the brands in Latin America: Natura, Avon, The Body Shop and Aesop |
| • | Avon international, which includes all markets, excluding Latin America |
| • | The Body Shop ex-Latin America, and |
| • | Aesop ex-Latin America |
In addition, the results and analysis for the periods under comparison include the effects of the fair market value assessment as a result of the business combination with Avon as per the Purchase Price Allocation - PPA

| Profit and Loss by Business | ||||||||||||||||
R$ million
| Consolidated a | Natura &Co Latam b | Avon International | The Body Shop
| Aesop | |||||||||||
Q1-23c | Q1-22c | Ch. % | Q1-23c | Q1-22c | Ch. % | Q1-23c | Q1-22c | Ch. % | Q1-23 | Q1-22 | Ch. % | Q1-23 | Q1-22 | Ch. % | ||
| Gross Revenue | 10,342.4 | 10,642.0 | (2.8) | 6,445.3 | 6,286.7 | 2.5 | 1,921.0 | 2,207.4 | (13.0) | 1,191.1 | 1,426.7 | (16.5) | 785.0 | 721.2 | 8.8 | |
| Net Revenue | 8,021.4 | 8,253.3 | (2.8) | 4,863.7 | 4,751.5 | 2.4 | 1,606.6 | 1,842.0 | (12.8) | 849.9 | 1,017.4 | (16.5) | 701.3 | 642.4 | 9.2 | |
| COGS | (2,593.0) | (2,970.9) | (12.7) | (1,741.8) | (1,915.1) | (9.0) | (571.2) | (744.6) | (23.3) | (181.7) | (223.2) | (18.6) | (98.3) | (88.1) | 11.6 | |
| Gross Profit | 5,428.4 | 5,282.4 | 2.8 | 3,121.9 | 2,836.5 | 10.1 | 1,035.4 | 1,097.4 | (5.7) | 668.2 | 794.2 | (15.9) | 603.0 | 554.3 | 8.8 | |
| Selling, Marketing and Logistics Expenses | (3,690.5) | (3,823.9) | (3.5) | (2,004.0) | (1,992.2) | 0.6 | (754.8) | (848.5) | (11.0) | (561.5) | (668.1) | (16.0) | (370.1) | (315.1) | 17.5 | |
| Administrative, R&D, IT and Projects Expenses | (1,497.4) | (1,423.4) | 5.2 | (715.1) | (672.4) | 6.3 | (372.2) | (346.2) | 7.5 | (223.4) | (230.7) | (3.2) | (186.7) | (175.0) | 6.7 | |
| Corporate Expenses | (70.1) | (109.9) | (36.2) | - | - | - | - | - | - | - | - | - | - | - | - | |
| Other Operating Income/ (Expenses), Net | (12.3) | 21.4 | (157.5) | 34.0 | 37.0 | (8.1) | 0.6 | (0.0) | (1,720.3) | (46.4) | (8.1) | 474.5 | (0.4) | 1.7 | (123.1) | |
| Transformation / Integration / Group Restructuring Costs | (84.9) | (80.1) | 6.0 | (26.1) | (35.2) | (25.9) | (57.5) | (40.3) | 42.6 | - | - | - | - | - | - | |
| Depreciation | 687.2 | 649.3 | 5.8 | 226.9 | 219.6 | 3.3 | 189.1 | 178.4 | 6.0 | 187.5 | 177.4 | 5.7 | 83.7 | 73.8 | 13.3 | |
| EBITDA | 760.4 | 515.7 | 47.5 | 637.6 | 393.3 | 62.1 | 40.5 | 40.8 | (0.8) | 24.4 | 64.7 | (62.3) | 129.4 | 139.7 | (7.4) | |
| Depreciation | (687.2) | (649.3) | 5.8 | |
| Financial Income/(Expenses), Net | (495.3) | (386.6) | 28.1 | |
| Earnings Before Taxes | (422.1) | (520.2) | (18.9) | |
| Income Tax and Social Contribution | (88.1) | (82.5) | 6.8 | |
| Discontinued operationsd | (142.0) | (39.6) | 258.7 | |
| Consolidated Net (loss) Income | (652.2) | (642.3) | 1.5 | |
| Non-controlling Interest | (0.3) | (0.9) | (67.3) | |
| Net Income (loss) attributable to controlling shareholders | (652.4) | (643.1) | 1.4 |
| Gross Margin | 67.7% | 64.0% | 370 bps | 64.2% | 59.7% | 450 bps | 64.4% | 59.6% | 480 bps | 78.6% | 78.1% | 50 bps | 86.0% | 86.3% | -30 bps |
| Selling, Marketing and Logistics Exp./Net Revenue | 46.0% | 46.3% | -30 bps | 41.2% | 41.9% | -70 bps | 47.0% | 46.1% | 90 bps | 66.1% | 65.7% | 40 bps | 52.8% | 49.1% | 370 bps |
| Admin., R&D, IT, and Projects Exp./Net Revenue | 18.7% | 17.2% | 150 bps | 14.7% | 14.2% | 50 bps | 23.2% | 18.8% | 440 bps | 26.3% | 22.7% | 360 bps | 26.6% | 27.2% | -60 bps |
| EBITDA Margin | 9.5% | 6.2% | 330 bps | 13.1% | 8.3% | 480 bps | 2.5% | 2.2% | 30 bps | 2.9% | 6.4% | -350 bps | 18.5% | 21.7% | -320 bps |
| Net Margin | (8.1)% | (7.8)% | -30 bps | - | - | - | - | - | - | - | - | - | - | - | - |
a Consolidated results include Natura &Co Latam, Avon International, The Body Shop and Aesop, as well as the Natura subsidiaries in the U.S., France and the Netherlands.
b Natura &Co Latam: includes Natura, Avon, TBS Brazil and Hispanic Latam, Aesop Brazil and &Co Pay
c Includes PPA - Purchase Price Allocation effects
d Related to business separation at Avon North America
Profit and Loss by Business - Aesop as Discontinued Operation | ||||||||||||
| Consolidated a | Natura &Co Latam b | Avon International | The Body Shop | |||||||||
| R$ million | Q1-23c | Q1-22c | Ch. % | Q1-23c | Q1-22c | Ch. % | Q1-23c | Q1-22c | Ch. % | Q1-23 | Q1-22 | Ch. % |
| Gross Revenue | 9,557.4 | 9,921.0 | (3.7) | 6,445.3 | 6,286.7 | 2.5 | 1,921.0 | 2,207.4 | (13.0) | 1,191.1 | 1,426.7 | (16.5) |
| Net Revenue | 7,320.2 | 7,611.0 | (3.8) | 4,863.7 | 4,751.5 | 2.4 | 1,606.6 | 1,842.0 | (12.8) | 849.9 | 1,017.4 | (16.5) |
| COGS | (2,494.7) | (2,883.0) | (13.5) | (1,741.8) | (1,915.1) | (9.0) | (571.2) | (744.6) | (23.3) | (181.7) | (223.2) | (18.6) |
| Gross Profit | 4,825.5 | 4,728.0 | 2.1 | 3,121.9 | 2,836.5 | 10.1 | 1,035.4 | 1,097.4 | (5.7) | 668.2 | 794.2 | (15.9) |
| Selling, Marketing and Logistics Expenses | (3,320.4) | (3,509.0) | (5.4) | (2,004.0) | (1,992.2) | 0.6 | (754.8) | (848.5) | (11.0) | (561.5) | (668.1) | (16.0) |
| Administrative, R&D, IT and Projects Expenses | (1,310.9) | (1,248.0) | 5.0 | (715.1) | (672.4) | 6.3 | (372.2) | (346.2) | 7.5 | (223.4) | (230.7) | (3.2) |
| Corporate Expenses | (70.1) | (109.9) | (36.2) | - | - | - | - | - | - | - | - | - |
| Other Operating Income/ (Expenses), Net | (11.7) | 20.0 | (158.4) | 34.0 | 37.0 | (8.1) | 0.6 | (0.0) | (1,720.3) | (46.4) | (8.1) | 474.5 |
| Transformation / Integration / Group Restructuring Costs | (85.0) | (80.1) | 6.0 | (26.1) | (35.2) | (25.9) | (57.5) | (40.3) | 42.6 | - | - | - |
| Depreciation | 603.5 | 575.0 | 5.0 | 226.9 | 219.6 | 3.3 | 189.1 | 178.4 | 6.0 | 187.5 | 177.4 | 5.7 |
| EBITDA | 630.9 | 376.0 | 67.8 | 637.6 | 393.3 | 62.1 | 40.5 | 40.8 | (0.8) | 24.4 | 64.7 | (62.3) |
| Depreciation | (603.5) | (575.0) | 5.0 | |||||||||
| Financial Income/(Expenses), Net | (476.3) | (361.0) | 31.9 | |||||||||
| Earnings Before Taxes | (448.9) | (560.0) | (19.8) | |||||||||
| Income Tax and Social Contribution | (82.8) | (70.0) | 18.3 | |||||||||
| Discontinued operations d | (120.5) | (12.0) | 904.0 | |||||||||
| Consolidated Net (loss) Income | (652.2) | (642.0) | 1.6 | |||||||||
| Non-controlling Interest | (0.3) | (1.0) | (72.6) | |||||||||
| Net Income (loss) attributable to controlling shareholders | (652.4) | (643.1) | 1.4 | |||||||||
| Gross Margin | 65.9% | 62.1% | 380 bps | 64.2% | 59.7% | 450 bps | 64.4% | 59.6% | 480 bps | 78.6% | 78.1% | 50 bps |
| Selling, Marketing and Logistics Exp./Net Revenue | 45.4% | 46.1% | -70 bps | 41.2% | 41.9% | -70 bps | 47.0% | 46.1% | 90 bps | 66.1% | 65.7% | 40 bps |
| Admin., R&D, IT, and Projects Exp./Net Revenue | 17.9% | 16.4% | 150 bps | 14.7% | 14.2% | 50 bps | 23.2% | 18.8% | 440 bps | 26.3% | 22.7% | 360 bps |
| EBITDA Margin | 8.6% | 4.9% | 370 bps | 13.1% | 8.3% | 480 bps | 2.5% | 2.2% | 30 bps | 2.9% | 6.4% | -350 bps |
| Net Margin | (8.9)% | (8.4)% | -50 bps | - | - | - | - | - | - | - | - | - |
a Consolidated results include Natura &Co Latam, Avon International and The Body Shop, as well as the Natura subsidiaries in the U.S., France and the Netherlands.
b Natura &Co Latam: includes Natura, Avon, TBS Brazil and Hispanic Latam and &Co Pay
c Includes PPA - Purchase Price Allocation effects
d Related to business separation at Avon North America
Consolidated net revenue
| • | Q1-23 consolidated net revenue was BRL 8,021 million, up +3.4% YoY in constant currency and down -2.8% in BRL, reflecting strong performance at Natura &Co Latam and Aesop, partially offset by continued challenges at The Body Shop and, to a lesser extent, at Avon International |
| • | Excluding Aesop, Q1-23 consolidated net revenue stood at BRL 7,320 million, up +2.2% YoY in CC and down -3.8% in BRL |
| • | Q1 revenue from G12 market currencies at CC totalled 18.7% in Q1-23 vs 19.8% in Q1-22 (G12 market currencies are: GBP, EUR, USD, AUD, YEN, CAD, SEK and CHF) |
| • | With operations in ~100 countries, 37% of net revenue came from outside Latam |
Digital Sales
Digital sales, which include online sales and social selling, decreased slightly as a percentage of revenues at all brands (1-3 p.p.), given a normalization of consumer behavior after Covid-19 and a lower discount level in the e-commerce channel, aiming at a robust omnichannel strategy and better profitability (the latter particularly for the Natura brand).
Relationship selling using apps: At Natura Latam, the penetration of digital (consultants who logged in at least once to the digital catalog or the app during the quarter) reached an impressive 82.8% in Q1-23, up 2.3 p.p. YoY. Furthermore, at Avon International, penetration of the Avon On app (active representatives who logged in at least once in the last three campaigns) reached 30.4% in Q1-23, compared to 21.9% in Q1-22.

Gross margin
| • | Consolidated gross margin stood at 67.7% in Q1-23, +370 bps vs. Q1-22 |
| • | Excluding Aesop, gross margin was 65.9%, implying a +380 bps improvement compared to the same period last year |
| • | This quarter, all business units showed YoY expansion, benefiting from price increase carry-over and more favorable mix more than offsetting the still inflationary environment and FX pressure, with the exception of Aesop, whose margin was slightly pressured |
| • | It’s important to highlight that Q1-23 benefits from full price increase carry-over from the previous year (as most of price increases last year happened Q2 onwards). Also, there were additional price increases in some countries during Q1-23 related to expected commodity / FX pressure to arise in the upcoming quarters. While we expect to continue to see YoY gross margin expansion in the next few quarters, it won’t be of the same magnitude as in Q1 |
Q1-23 Gross Margin
R$ million
| Consolidated | Natura &Co Latam | Avon International | The Body Shop | Aesop | ||||||||||
Q1-23 | Q1-22 | Ch. % | Q1-23 | Q1-22 | Ch. % | Q1-23 | Q1-22 | Ch. % | Q1-23 | Q1-22 Ch. % | Q1-23 | Q1-22 | Ch. % | ||
| Net Revenue | 8,021.4 | 8,253.3 | (2.8) | 4,863.7 | 4,751.5 | 2.4 | 1,606.6 | 1,842.0 | (12.8) | 849.9 | 1,017.4 | (16.5) | 701.3 | 642.4 | 9.2 |
| COGS | (2,593.0) | (2,970.9) | (12.7) | (1,741.8) | (1,915.1) | (9.0) | (571.2) | (744.6) | (23.3) | (181.7) | (223.2) | (18.6) | (98.3) | (88.1) | 11.6 |
| Gross Profit | 5,428.4 | 5,282.4 | 2.8 | 3,121.9 | 2,836.5 | 10.1 | 1,035.4 | 1,097.4 | (5.7) | 668.2 | 794.2 | (15.9) | 603.0 | 554.3 | 8.8 |
| Gross Margin | 67.7% | 64.0% | 370 bps | 64.2% | 59.7% | 450 bps | 64.4% | 59.6% | 480 bps | 78.6% | 78.1% | 50 bps | 86.0% | 86.3% | -30 bps |
Q1-23 Gross Margin - Aesop as Discontinued Operation
R$ million
| Consolidated | Natura &Co Latam | Avon International | The Body Shop | ||||||||
Q1-23 | Q1-22 | Ch. % | Q1-23 | Q1-22 | Ch. % | Q1-23 | Q1-22 | Ch. % | Q1-23 | Q1-22 | Ch. % | |
| Net Revenue | 7,320.2 | 7,611.0 | (3.8) | 4,863.7 | 4,751.5 | 2.4 | 1,606.6 | 1,842.0 | (12.8) | 849.9 | 1,017.4 | (16.5) |
| COGS | (2,494.7) | (2,883.0) | (13.5) | (1,741.8) | (1,915.1) | (9.0) | (571.2) | (744.6) | (23.3) | (181.7) | (223.2) | (18.6) |
| Gross Profit | 4,825.5 | 4,728.1 | 2.1 | 3,121.9 | 2,836.5 | 10.1 | 1,035.4 | 1,097.4 | (5.7) | 668.2 | 794.2 | (15.9) |
| Gross Margin | 65.9% | 62.1% | 380 bps | 64.2% | 59.7% | 450 bps | 64.4% | 59.6% | 480 bps | 78.6% | 78.1% | 50 bps |
Operating Expenses
| • | Consolidated Selling, Marketing & Logistics expenses stood at 46.0% of net revenue (-30 bps vs. Q1-22), while consolidated Administrative, R&D, IT and Project expenses reached 18.7% of net revenue (+150 bps YoY). SG&A expenses (both lines above combined) increased by +120 bps in Q1-23 compared to the same period last year, mainly impacted by sales deleverage at The Body Shop and Avon International, combined with investments at Aesop |
| • | Excluding Aesop, consolidated Selling, Marketing & Logistics expenses stood at 45.4% of net revenue (-70 bps vs. Q1-22), while consolidated Administrative, R&D, IT and Project expenses reached 17.9% of net revenue (+150 bps YoY). SG&A expenses (both lines above combined) increased by 80 bps in Q1-23 compared to the same period last year |
| • | Corporate expenses stood at BRL 70 million, down -36% vs. Q1-22, benefiting from the initiatives implemented last year to create a simpler and leaner structure |
| • | Other operating income/expenses were BRL -12 million compared to income of BRL 21 million in Q1-22 (or BRL -12 million compared to BRL +20 million, ex-Aesop). The difference is mainly driven by an increase of other operating expenses at The Body Shop associated with restructuring activity, as mentioned last quarter |
| • | Transformation / Integration / Group Restructuring costs were BRL 85 million, up +6.0% (incl and ex. Aesop) mainly impacted by the Avon International transformational plan |
Q1-23 Operating Expenses
SG&A Expenses (R$ million)
| Consolidated | Natura &Co Latam | Avon International | The Body Shop | Aesop | ||||||||||
Q1-23 | Q1-22 | Ch. % | Q1-23 | Q1-22 | Ch. % | Q1-23 | Q1-22 | Ch. % | Q1-23 | Q1-22 | Ch. % | Q1-23 | Q1-22 | Ch. % | |
| Selling, Marketing and Logistics Expenses | (3,690.5) | (3,823.9) | (3.5) | (2,004.0) | (1,992.2) | 0.6 | (754.8) | (848.5) | (11.0) | (561.5) | (668.1) | (16.0) | (370.1) | (315.1) | 17.5 |
| Administrative, R&D, IT and Projects Expenses | (1,497.4) | (1,423.4) | 5.2 | (715.1) | (672.4) | 6.3 | (372.2) | (346.2) | 7.5 | (223.4) | (230.7) | (3.2) | (186.7) | (175.0) | 6.7 |
| SG&A Expenses | (5,187.9) | (5,247.3) | (1.1) | (2,719.1) | (2,664.6) | 2.0 | (1,127.0) | (1,194.6) | (5.7) | (784.9) | (898.8) | (12.7) | (556.8) | (490.1) | 13.6 |
| Selling, Marketing and Logistics (% of Net Revenue) | 46.0% | 46.3% | -30 bps | 41.2% | 41.9% | -70 bps | 47.0% | 46.1% | 90 bps | 66.1% | 65.7% | 40 bps | 52.8% | 49.1% | 370 bps |
| Admin., R&D, IT, and Projects Exp. (% of Net Revenue) | 18.7% | 17.2% | 150 bps | 14.7% | 14.2% | 50 bps | 23.2% | 18.8% | 440 bps | 26.3% | 22.7% | 360 bps | 26.6% | 27.2% | -60 bps |
Q1-23 Operating Expenses - Aesop as Discontinued Operation
SG&A Expenses (R$ million)
| Consolidated | Natura &Co Latam | Avon International | The Body Shop | ||||||||
Q1-23 | Q1-22 | Ch. % | Q1-23 | Q1-22 | Ch. % | Q1-23 | Q1-22 | Ch. % | Q1-23 | Q1-22 | Ch. % | |
| Selling, Marketing and Logistics Expenses | (3,320.4) | (3,509.0) | (5.4) | (2,004.0) | (1,992.2) | 0.6 | (754.8) | (848.5) | (11.0) | (561.5) | (668.1) | (16.0) |
| Administrative, R&D, IT and Projects Expenses | (1,310.9) | (1,248.0) | 5.0 | (715.1) | (672.4) | 6.3 | (372.2) | (346.2) | 7.5 | (223.4) | (230.7) | (3.2) |
| SG&A Expenses | (4,631.3) | (4,757.0) | (2.6) | (2,719.1) | (2,664.6) | 2.0 | (1,127.0) | (1,194.6) | (5.7) | (784.9) | (898.8) | (12.7) |
| Selling, Marketing and Logistics (% of Net Revenue) | 45.4% | 46.1% | -70 bps | 41.2% | 41.9% | -70 bps | 47.0% | 46.1% | 90 bps | 66.1% | 65.7% | 40 bps |
| Admin., R&D, IT, and Projects Exp. (% of Net Revenue) | 17.9% | 16.4% | 150 bps | 14.7% | 14.2% | 50 bps | 23.2% | 18.8% | 440 bps | 26.3% | 22.7% | 360 bps |
Consolidated EBITDA
Q1-23 Adjusted EBITDA was BRL 842 million, with an adjusted margin of 10.5% (+330 bps YoY). Q1-23 margin reflected:
| • | Strong Natura & Co Latam margin expansion (+400 bps YoY), mainly driven by higher gross margin |
| • | Margin improvement of +170 bps at Avon international vs. Q1-22, also driven by gross margin expansion, transformational initiatives (cost savings) and phasing of expenses, partially offset by sales deleverage, investments in lead markets and inflation increase on fixed expenses |
| • | Improvement of Holding expenses (-36% on a YoY basis) |
| • | Margin pressure at The Body Shop, chiefly due to sales deleverage and channel mix, partially offset by strict financial discipline and gross margin expansion |
| • | Continued investments at Aesop that led to a -320 bps YoY decrease |
Q1-23: Adjusted EBITDA
R$ million | Consolidated EBITDA | Natura &Co Latam | Avon International | The Body Shop | Aesop | |||||||||||
Q1-23 | Q1-22 | Ch. % | Q1-23 | Q1-22 | Ch. % | |||||||||||
Q1-23 | Q1-22 | Ch. % | Q1-23 | Q1-22 | Ch. % | Q1-23 | Q1-22 | Ch. % | ||||||||
| Consolidated EBITDA | 760.4 | 515.7 | 47.5 | 637.6 | 393.3 | 62.1 | 40.5 | 40.8 | (0.8) | 24.4 | 64.7 | (62.3) | 129.4 | 139.7 | (7.4) | |
| Transformation / Integration Costs (1) | 85.0 | 80.1 | 6.1 | 26.1 | 35.2 | (25.9) | 57.5 | 40.3 | 42.6 | - | - | - | - | - | - | |
| (i) Transformation costs | 57.5 | 40.5 | 41.9 | - | - | - | 57.5 | 40.3 | 42.6 | - | - | - | - | - | - | |
| (ii) Integration costs | 25.5 | 39.6 | (35.5) | 26.1 | 35.2 | (26.0) | - | - | - | - | - | - | - | - | - | |
| (iii) Group Restructuring Cost | 1.9 | - | - | - | - | - | - | - | - | - | - | - | - | - | - | |
| Restructuring Cost - Business Unit | 27.3 | - | - | - | - | - | - | - | - | 27.3 | - | - | - | - | - | |
| Net non-recurring other (income)/ expenses | (30.9) | - | (31.1) | - | - | - | - | - | - | - | - | 0.2 | - | - | ||
| Adjusted EBITDA | 841.7 | 595.8 | 41.3 | 632.5 | 428.5 | 47.6 | 98.0 | 81.1 | 20.8 | 51.7 | 64.7 | (20.2) | 129.7 | 139.7 | (7.1) | |
| Adjusted EBITDA Margin | 10.5% | 7.2% | 330 bps | 13.0% | 9.0% | 400 bps | 6.1% | 4.4% | 170 bps | 6.1% | 6.4% | -30 bps | 18.5% | 21.7% | -320 bps | |
Excluding Aesop, Q1-23 Adjusted EBITDA was BRL 712 million, with an adjusted margin of 9.7% (+370 bps YoY).
Q1-23: Adjusted EBITDA - Aesop as Discontinued Operation
R$ million | Consolidated EBITDA | Natura &Co Latam | Avon International | The Body Shop | ||||||||
Q1-23 | Q1-22 | Ch. % | Q1-23 | Q1-22 | Ch. % | Q1-23 | Q1-22 | Ch. % | Q1-23 | Q1-22 | Ch. % | |
| Consolidated EBITDA | 630.9 | 376.0 | 67.8 | 637.6 | 393.3 | 62.1 | 40.5 | 40.8 | (0.8) | 24.4 | 64.7 | (62.3) |
| Transformation / Integration Costs (1) | 85.0 | 80.1 | 6.1 | 26.1 | 35.2 | (26.0) | 57.5 | 40.3 | 42.6 | - | - | - |
| (i) Transformation costs | 57.5 | 40.5 | 41.9 | - | - | - | 57.5 | 40.3 | 42.6 | - | - | - |
| (ii) Integration costs | 25.5 | 39.6 | (35.5) | 26.1 | 35.2 | (26.0) | - | - | - | - | - | - |
| (iii) Group Restructuring Cost | 1.9 | - | - | - | - | - | - | - | - | - | - | - |
| Restructuring Cost - Business Unit | 27.3 | - | - | - | - | - | - | - | - | 27.3 | - | - |
| Net non-recurring other (income)/ expenses | (31.1) | - | - | (31.1) | - | - | - | - | - | - | - | - |
| Adjusted EBITDA | 712.1 | 456.1 | 56.1 | 632.5 | 428.5 | 47.6 | 98.0 | 81.1 | 20.8 | 51.7 | 64.7 | (20.2) |
| Adjusted EBITDA Margin | 9.7% | 6.0% | 370 bps | 13.0% | 9.0% | 400 bps | 6.1% | 4.4% | 170 bps | 6.1% | 6.4% | -30 bps |
| (1) | Net non-recurring other (income)/expenses: reversal of provision made in prior period |
Financial income and expenses
The following table details the main changes in our financial income and expenses:
R$ million | Q1-23 | Q1-22 | Ch. % |
| 1. Financing, Short-Term Investments and Derivatives Gains (Losses) | (279.4) | (156.8) | 78.2 |
| 1.1 Financial Expenses | (241.6) | (140.0) | 72.6 |
| 1.2 Financial Income | 190.7 | 86.2 | 121.2 |
| 1.3 Foreign Exchange Variations from Financing Activities, Net | 137.3 | 871.9 | (84.3) |
| 1.4 Gains (Losses) on Foreign Exchange Derivatives from Financing Activities, Net | (147.4) | (875.9) | (83.2) |
| 1.5 Gains (Losses) on Interest Rate Derivatives and Other Operating Derivatives, Net | (218.4) | (99.0) | 120.6 |
| 2. Judicial Contingencies | (15.9) | (11.1) | 43.2 |
| 3. Other Financial Income and (Expenses) | (181.0) | (192.7) | (6.1) |
| 3.1 Lease Expenses | (46.7) | (40.9) | 14.2 |
| 3.2 Other | (80.5) | (66.3) | 21.4 |
| 3.3 Other Gains (Losses) From Exchange Rates Variation | (12.6) | (66.0) | (80.9) |
| 3.4 Hyperinflation Gains (Losses) | (41.2) | (19.5) | 111.3 |
Financial Income and Expenses, Net | (476.3) | (360.6) | 32.1 |
Net financial expenses were BRL -476 million in Q1-23, up +32.1% vs. Q1-22 (or up BRL -116 million on a YoY basis), due mainly to the following effects:
| • | Item 1.1. - Higher financial expenses due to higher gross debt and higher interest rates |
| • | Item 1.5 - in Q1-23 expenses were BRL -218 million vs. BRL -99 million in Q1-22, worsening by BRL -119 million. The increase in expenses is related to a higher CDI rate, which led to losses on derivatives related to the interest rate hedge on debts, mainly on the 2028 Sustainability-Linked bond and the Certificates backed by real estate receivables (CRI) |
| • | This was partially offset by Item 1.2 - in Q1-23 financial income was BRL +191 million, improving by BRL +105 million compared to the same period last year. The improvement is mainly related to the higher interest income on cash due to higher interest rates |
Underlying net income (UNI) and net income
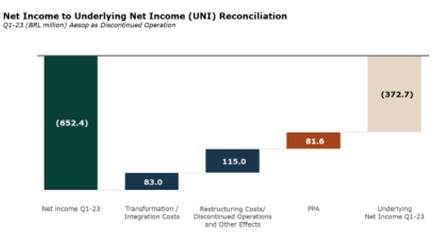
Q1-23 reported net loss was BRL -652 million, compared to a net loss of BRL -642 million in Q1- 22. Higher EBITDA (adjusted and reported), was more than offset by higher net financial expenses (addressed by the Aesop sale) and losses from discontinued operations.
Q1-23 Underlying Net Income, which is net income excluding transformation costs, restructuring costs, discontinued operations and PPA effects, was a loss of BRL -373 million. This compares to a loss of BRL -392 million in Q1-22.
Free cash flow and cash position
R$ million | Q1-23 | Q1-22 | Ch. % |
| Net income (loss) | (652.2) | (642.2) | 1.6 |
| Depreciation and amortization | 603.5 | 575.5 | 4.9 |
| Non-cash Adjustments to Net Income | 857.4 | 620.5 | 38.2 |
| Adjusted Net income | 808.7 | 553.8 | 46.0 |
| Decrease / (Increase) in Working Capital | (1,712.6) | (1,411.5) | 21.3 |
| Inventories | (483.3) | 86.1 | (661.4) |
| Accounts receivable | (195.4) | 289.5 | (167.5) |
| Accounts payable | (610.0) | (950.5) | (35.8) |
| Other assets and liabilities | (423.9) | (836.6) | (49.3) |
| Income tax and social contribution | (130.0) | (66.8) | 94.6 |
| Interest on debt | (200.4) | (211.7) | (5.3) |
| Lease payments | (213.0) | (277.7) | (23.3) |
| Other operating activities | (94.3) | (11.4) | 726.2 |
| Cash from Continuing Operations | (1,541.6) | (1,425.3) | 8.2 |
| Capex | (258.2) | (279.5) | (7.6) |
| Sale of Assets | 1.4 | 0.6 | 132.7 |
| Exchange rate variation on cash balance | (14.1) | (435.6) | (96.8) |
| Free Cash Flow - Continuing Operations | (1,812.5) | (2,139.9) | (15.3) |
| Other financing and investing activities | 181.6 | 1,241.6 | (85.4) |
| Operating activities - discontinued operations | (237.2) | 6.2 | (3,950.1) |
| Payment of lease - principal - discontinued operations | (59.7) | (46.6) | 28.3 |
| Capex - discountinued operations | (43.4) | (30.0) | 44.4 |
| Cash Balance Variation | (1,971.2) | (968.7) | 103.5 |
In Q1-23, free cash flow from continuing operations was an outflow of BRL -1,813 million compared to outflow of BRL -2,140 million in the previous year. Despite the positive impact from net income in the year (from BRL +554 million in Q1-22 to BRL +809 million in Q1-23), cash flow from continuing operations was slightly worse to BRL -1,542 million from BRL -1,425 million, driven by:
| • | Working capital increased in Natura &Co Latam, supporting the strong growth in the Natura brand, offset by improvement across TBS and Avon International as a percentage of net revenues as we continue to prioritize cash generation and working capital management |
| • | The primary increase in working capital was inventory that consumed BRL -483 million (vs. BRL +86 million in Q1-22) as inventory was replenished in the build-up for Q2-23 to support growing sales. In addition, inventories in Argentina increased to protect the market in case more supply chain restrictions are imposed |
| • | Furthermore, accounts receivable consumed BRL -195 million compared to an inflow of BRL +290 million in the same period last year chiefly on the stronger growth of Natura brand and adjustments to Avon Latam representative payment terms in several regions to be more aligned with Natura in anticipation of wave 2 integration. In addition, receivables acceleration activity was slowed down in Q1-23 relative to prior year |
| • | These effects were partially offset by continued working capital management activities, particularly in Accounts payable (as discussed in prior quarters) and other assets and liabilities, including recoverable taxes |
As mentioned last quarter, we continue our disciplined resource allocation efforts, which resulted in lower Capex in Q1-23, an outflow of BRL -258 million, 8% lower YoY, while still investing in our priorities to maintain a sustainable and healthy operating company.
As planned, cash consumption in Q1 was high following the normal seasonality of the business, and working capital management was impacted by the build-up of inventories for Q2 and changes related to the continued integration of Natura and Avon brands in Latam. Our priorities remain the same and we continue to expect improvement in cash conversion on a full-year basis, though we may experience some volatility between quarters.
Indebtedness ratios at both Natura &Co Holding and Natura Cosméticos
R$ million | Natura Cosméticos S.A. | Natura &Co Holding S.A. | ||
Q1-23 | Q1-22 | Q1-23 | Q1-22 | |
| Short-Term | 131.9 | 772.5 | 289.2 | 3,863.5 |
| Long-Term | 7,365.7 | 6,678.7 | 12,721.8 | 7,692.4 |
| Gross Debt a | 7,497.7 | 7,451.2 | 13,011.0 | 11,556.0 |
| Foreign currency hedging (Swaps) b | 419.7 | 628.8 | 445.2 | 627.6 |
| Total Gross Debt | 7,917.4 | 8,080.0 | 13,456.2 | 12,183.6 |
| (-) Cash, Cash Equivalents and Short-Term Investment c | (2,469.5) | (3,220.2) | (3,812.0) | (4,536.7) |
| (-) Aesop Cash, Cash Equivalents and Short-Term Investment c | (236.1) | - | (236.1) | - |
| (=) Net Debt | 5,211.8 | 4,859.8 | 9,408.2 | 7,646.9 |
| Indebtedness ratio excluding IFRS 16 effects | ||||
| Net Debt/EBITDA | 2.23x | 1.84x | 7.54x | 3.06x |
| Total Debt/EBITDA | 3.39x | 3.06x | 10.79x | 4.88x |
| Indebtedness ratio including IFRS 16 effects | ||||
| Net Debt/EBITDA | 1.65x | 1.38x | 3.96x | 2.13x |
| Total Debt/EBITDA | 2.51x | 2.30x | 5.66x | 3.39x |
a Gross debt excludes PPA impacts of R$243.9 million in Q1-23 and R$311.0 million in Q1-22, and exclude lease agreements
b Foreign currency debt hedging instruments, excluding mark-to-market effects
c Short-Term Investments excludes non current balances and Aesop figures marked as assets held for sale
The graph below shows the indebtedness trajectory on a quarterly basis since Q1-22.

New bond issuance and liability management
No relevant debt movements were made in the Q1-23 period. As a subsequent event, on April 5, 2023 Natura &Co Luxembourg Holdings (Natura Lux) entered in a USD 65 million loan under its committed revolving credit facility with maturity in October 2024.
2. Performance by segment
NATURA &Co LATAM
Natura &Co Latam | Net Revenue change (%) | Operational KPIs change (%) | |
Q1-23 vs. Q1-22 | Q1-23 vs. Q1-22 | ||
| Reported (R$) | Constant Currency | Consultants / Representativesb | |
| Natura Latama | 17.3% | 25.1% | 1.7% |
| Natura Brazil | 24.9% | 24.9% | 3.6% |
| Natura Hispanic | 6.7% | 25.5% | -0.6% |
| Avon Latam | -15.1% | -9.8% | -13.2% |
| Avon Brazil | -0.6% | -0.6% | 0.0% |
| Avon Hispanic | -22.0% | -14.8% | -25.4% |
a Natura Latam includes Natura Brazil, Hispanic and others
b Considers the Average Available Consultants / Representatives in the quarter
NATURA BRAND IN LATAM
Natura Brand in Brazil
| • | Natura Brazil revenues were up 24.9% YoY, benefiting from price increases (Q1 is the easiest comparable due to higher price increases in Q2-22 onwards), combined with better mix. Fragrances, soaps, deodorants and hair categories showed solid performances, while body and skin care were softer |
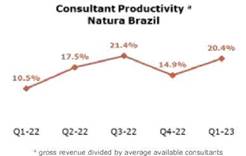
| • | Consultant productivity was up by a strong +20.4% vs Q1-22. At the same time, the average available consultant base showed a slight decrease compared to last quarter, reflecting normal seasonality, at 1.13 million in Q1-23, and was still up +3.6% YoY. This is aligned with our ongoing strategy of focusing on increasing productivity and a stable consultant base |
| • | Retail sales (own and franchise stores) showed a solid performance, driven by very strong same-store sales and accelerating store openings over the past 12 months, in line with our channel diversification strategy aiming at better service for our end-consumers and solutions for our consultants. The number of own stores reached 91 in the quarter (+20 vs Q1-22), while franchise stores increased to 666 (+101) |
| • | Digital (including social selling) showed a -13.1% decline YoY, impacted by a decrease in e-commerce (own and consultants) that more than offset the YoY increase in the social selling distribution channel. E-commerce continued to be impacted by the lower level of discounts and important price rationalization of the distribution channel (as mentioned last quarter), which is an important lever of the omnichannel strategy in the region and will also significantly improve the channel’s profitability. In addition, Q1-22 represented an especially tough comparable base following a softer Q4-21 holiday season |
Natura Brand in Hispanic Latam
| • | Even amid political and economic turmoil, particularly in Argentina and Chile, Natura Hispanic Latam delivered +25.5% revenue growth in CC (and +6.7% in BRL). Growth was mainly driven by Argentina and Colombia, boosted by channel and productivity gains |
| • | Excluding Argentina, revenue in Hispanic markets was up mid-single digits in CC, despite a decrease in Chile, impacted by the unstable macro environment |
| • | The average available consultant base reached 0.87 million in Q1-23 (a slight decrease vs. the previous quarter amid seasonality and down -0.6% vs. Q1-22), with increased productivity |
AVON BRAND IN LATAM
Avon Brand in Brazil
| • | Q1 net revenue was broadly flat (at -0.6%), a deceleration compared to Q4, but against a stronger comparable base. The Beauty category showed a +5.6% top-line growth, while Fashion and Home sales were down -18.0%, in line with our portfolio optimization strategy |
| • | Representative productivity in the beauty segment again improved sequentially and continued to grow in high-single YoY, boosted by core categories’ performance |
| • | Fashion & Home continued to decrease in the quarter compared to the previous year but with a stable average order level in BRL compared to previous quarters, as expected |
| • | The number of average available representatives showed a slight decrease compared to Q4-22 (like at the Natura brand), but was stable on a YoY basis, underscoring the effective remedial actions implemented since Q3-21 and showing a continuation of channel stabilization |
Avon Brand in Hispanic Latam
| • | The total number of available representatives decreased -15.3% QoQ and -25.4% YoY, as expected amid the roll out of Waves 1 and preparation for Wave 2 of integration in some countries. In addition, in preparation for this roll-out, adjustments to commercial incentives, minimum order ticket increases and Fashion & Home portfolio adjustments were made in several regions to move towards the integration, which also impacts the number of representatives |
| • | Thus, Avon Latam’s revenue was down -14.8% in CC (-22.0% in BRL), mainly impacted by a decrease in Mexico (which has higher exposure to the Fashion & Home category) and Chile. This performance is in line with expectations, as mentioned last quarter, amid political volatility in the region and the decrease in the distribution channel mentioned above |
| • | The Beauty category was broadly stable YoY in CC, amid the expected distribution channel reduction, but beauty productivity per representative increased more than 20% YoY |
NATURA &Co LATAM
| • | According to Euromonitor International, Natura &Co maintained broadly stable market share in Latin America (12.1% in 2022 vs 12.2% in 2021) with market share gains by the Natura brand (reaching its highest market share in the past 10 years) and a reduction in the Avon brand1 |
| • | Revenue was up +9.0% in CC, and +2.4% in BRL, driven by strong growth at the Natura brand and Avon CFT in Brazil, which was still partially offset by the Fashion and Home category and Avon in Latin America |
| • | Gross margin was 64.2%, up 450 bps YoY benefiting from price increases, richer category mix and marketing efforts, but still partially impacted by input prices and FX dynamics |
Natura &Co Latam (R$million) | P&L | ||
Q1-23 | Q1-22 | Ch. % | |
| Gross Revenue | 6,445.3 | 6,286.7 | 2.5 |
| Net Revenue | 4,863.7 | 4,751.5 | 2.4 |
| Constant Currency | 9.0 | ||
| COGS | (1,741.8) | (1,915.1) | (9.0) |
| Gross Profit | 3,121.9 | 2,836.5 | 10.1 |
| Gross Margin | 64.2% | 59.7% | 450.0 |
| Selling, Marketing and Logistics Expenses | (2,004.0) | (1,992.2) | 0.6 |
| Administrative, R&D, IT and Projects Expenses | (715.1) | (672.4) | 6.3 |
| Other Operating Income/ (Expenses), Net | 34.0 | 37.0 | (8.1) |
| Transformation/Integration costs | (26.1) | (35.2) | (25.9) |
| Depreciation | 226.9 | 219.6 | 3.3 |
| EBITDA | 637.6 | 393.3 | 62.1 |
| EBITDA Margin | 13.1% | 8.3% | 480.0 |
| Integration costs | 26.1 | 35.2 | (25.9) |
| Net non-recurring other (income)/ expenses | (31.1) | - | - |
| Adjusted EBITDA | 632.5 | 428.5 | 47.6 |
| Adjusted EBITDA Margin | 13.0% | 9.0% | 400.0 |
| • | Adjusted EBITDA margin was 13.0% (+400 bps YoY), mainly driven by strong YoY gross margin improvement across regions and brands, combined with SG&A efficiencies by the Avon Brand in Brazil. These were partially offset by investments in the Natura brand (accelerating since Q3-22) and deleverage at Avon Hispanic Latam, given the preparation and roll-out of Wave 2 |
| • | Natura & Avon integration costs were BRL 26 million, of which ~35% severance costs, ~15% legal and restructuring costs, ~15% IT investments and the remaining opex investments to integrate logistics, industry, etc. |
| • | Wave 2 – As planned, the acceleration of integration of the Natura and Avon brand started in Peru and the roll-out in Colombia was confirmed, in line with the initial schedule. Initial KPIs, such as increasing cross sell, activity level and consultant productivity (at both the Natura and Avon brands) were encouraging, although it’s still too early to report the underlying results |
| �� |
| • | &Co Pay at Natura presented consistent growth in Q1-23, reaching almost 600,000 accounts, with +10% productivity and -30% default among heavy user consultants (~10 transactions/month). 100% of owned stores and 60% of franchises use &Co Pay solutions. In the payments business, we reached BRL 7.9 billion in the quarter, with four-fold growth YoY, which captures and processes 100% of payments from direct sales and Natura and Avon’s e-commerce. Pix (the Brazilian instant payment system) is the main tool used by consultants to capture and receive payment for their sales, mitigating defaults and anticipating consultants' cash flow. The operation started this quarter in Argentina, assisting the e-commerce channel. |
1 (Natura &Co, based on Euromonitor International Limited, Beauty and Personal Care, May 8th, 2023, Retail Value RSP incl sales taxes, USD, Historic Year-on-Year Exchange Rates/ Forecast Fixed 2022 Exchange Rates, Historic Current Prices / Forecast Constant 2022 Prices)
AVON INTERNATIONAL
| • | Net revenue stood at BRL 1,607 million, down -7.5% YoY in constant currency (or -12.8% in BRL). Excluding Russia and Ukraine, revenue decreased -3.7% compared to Q1-22. Net revenue was also impacted by the earthquakes in Turkey, which we estimate had a negative impact of 1p.p. |
Operational KPIs change (%) | |
Q1-23 vs. Q1-22 | |
| Representatives | |
| Avon International | -19.1% |
Avon International (R$ million) | P&L | ||
Q1-23 | Q1-22 | Ch. % | |
| Gross Revenue | 1,921.0 | 2,207.4 | (13.0) |
| Net Revenue | 1,606.6 | 1,842.0 | (12.8) |
| Constant Currency | -7.5% | ||
| COGS | (571.2) | (744.6) | (23.3) |
| Gross Profit | 1,035.4 | 1,097.4 | (5.7) |
| Gross Margin | 64.4% | 59.6% | 480.0 |
| Selling, Marketing and Logistics Expenses | (754.8) | (848.5) | (11.0) |
| Administrative, R&D, IT and Projects Expenses | (372.2) | (346.2) | 7.5 |
| Other Operating Income/ (Expenses), Net | 0.6 | (0.0) | (1,720.3) |
| Transformation/Integration costs | (57.5) | (40.3) | 42.6 |
| Depreciation | 189.1 | 178.4 | 6.0 |
| EBITDA | 40.5 | 40.8 | (0.8) |
| EBITDA Margin | 2.5% | 2.2% | 30.0 |
| Transformation costs | 57.5 | 40.3 | 42.6 |
| Adjusted EBITDA | 98.0 | 81.1 | 20.8% |
| Adjusted EBITDA Margin | 6.1% | 4.4% | 170.0 |
• The TMEA region showed YoY growth, with CEE showing stabilization in its key markets outside Russia, while Western Europe showed a lesser decline vs. last year despite continued macroeconomic headwinds and while implementing radical cost transformation initiatives
• In Q1-23 the Beauty category entered positive territory, growing low single digits (excluding Russia and Ukraine), driven by the fragrance and color categories, with solid performance of Top Innovation Hydramatic Lipstick, the world’s first matte lipstick with a hyaluronic core
• Fashion & Home decreased -21% (in CC), with size of line reduction and resources focused on the Beauty category, especially on innovation and cult product activation
• As expected, the number of representatives was down 19% amid the new commercial model roll-out and the footprint optimization impact. Digitalization is showing good progress and the use of digital tools reached 30.4% (see digital section - page 4) and other KPIs such as units per Rep and activity rate, are also improving. Digital sales penetration increased by 1.1 ppt to 5.6% of total revenue
| • | Gross margin was 64.4%, up 480bps YoY, driven by carry-over of price increases (Q1 has the easiest comparable base due to higher price increases in Q2-22 onwards) and a positive product mix through improved contribution of innovation and cult products, which more than offset cost pressures and FX headwinds |
| • | Adjusted EBITDA margin was 6.1%, up 170bps YoY. Gross margin expansion of 480bps, the continued focus on transformation savings and phasing of expenses were partially offset by sales deleverage, brand investment in lead markets and inflation increase on fixed expenses. It is worth mentioning that the contribution margin in these lead markets continues to show a healthy level |
| • | Cash conversion continued to show significant progress, mainly driven by significantly improved working capital |
| • | Transformation costs this quarter were BRL 57.5 million, of which ~50% primarily related to severance costs of executing operating model transformation, ~35% commercial model adjustment roll-out, and the remaining related to IT outsourcing and Suffern R&D closure |
| • | As mentioned last quarter, Avon International continues its transformational journey at pace, drastically reshaping its costs to offset the external headwinds (such as the closure of Suffern R&D plant and IT outsource), provide funding for strategic growth investments in markets with growth potential and step-change the EBITDA margin profile through a focused market portfolio and a lean operating model |
| • | We continue to assess opportunities to optimize our footprint, with a focus to exit non/low-profitable markets and focus on the markets where we see potential to expand our growth and margin profile. Those changes, though in progress, may take some time to be executed and completed, and we will communicate to the market as we progress |
| • | Turkey is an important market in our portfolio. The recent catastrophic earthquakes have affected their performance in February. They have our full support and they recovered their growth momentum as of March |
THE BODY SHOP
• As disclosed in the notice to market published on April 19, David Boynton stepped down as Chief Executive Officer of The Body Shop and Ian Martin Bickley assumed as interim CEO. Jointly with the Executive Leadership team, he will be working to refine The Body Shop’s current business plan and transformation agenda, while continuing to prioritize profitability and cash conversion recovery
| Operational KPIs | |||||
| Change | Change | ||||
| Q1-23 | Q4-22 | Q1-22 | vs. Q4- 22 | vs. Q1- 22 | |
| The Body Shop (Total) | 2,390 | 2,456 | 2,497 | (66) | (107) |
| Own Stores | 945 | 979 | 1,001 | (34) | (56) |
| Franchise Stores | 1,445 | 1,477 | 1,496 | (32) | (51) |
The Body Shop (R$ million) | P&L | ||
Q1-23 | Q1-22 | Ch. % | |
| Gross Revenue | 1,191.1 | 1,426.7 | (16.5) |
| Net Revenue | 849.9 | 1,017.4 | (16.5) |
| Constant Currency | -9.4% | ||
| COGS | (181.7) | (223.2) | (18.6) |
| Gross Profit | 668.2 | 794.2 | (15.9) |
| Gross Margin | 78.6% | 78.1% | 50.0 |
| Selling, Marketing and Logistics Expenses | (561.5) | (668.1) | (16.0) |
| Administrative, R&D, IT and Projects Expenses | (223.4) | (230.7) | (3.2) |
| Other Operating Income/ (Expenses), Net | (46.4) | (8.1) | 474.5 |
| Depreciation | 187.5 | 177.4 | 5.7 |
| EBITDA | 24.4 | 64.7 | (62.3) |
| EBITDA Margin | 2.9% | 6.4% | (350.0) |
| Restructuring Business Units | 27.3 | - | - |
| Adjusted EBITDA | 51.7 | 64.7 | -20.2% |
| Adjusted EBITDA Margin | 6.1% | 6.4% | (30.0) |
• Q1-23 net revenue was BRL 850 million, down -9.4% in CC and -16.5% in BRL. Combined sales of core business distribution channels (stores, e-commerce and franchise) showed a low single-digit decline in CC in Q1-23, similar to Q4-22 (but on the back of a softer comparable base), and The Body Shop at Home continued its steep decline
• The tough macro environment (particularly in the UK and the rest of Western Europe) continued to impact retail sales through core business distribution channels (sell-out Same Store Sales of own stores, e-commerce and franchise combined were -0.4%)
• Franchise sell-in was weak in the quarter, amid the rising inventory level that was highlighted last quarter, but slightly better sales sell-out led to a better inventory level YoY (albeit still above 2019 in some regions)
| • | Gross margin showed an inflection point, expanding by 50 bps YoY to 78.6%. This was mainly driven by mix and pricing, partially offset by continued high inflation |
| • | Despite the operating deleverage, Adjusted EBITDA margin stood at 6.1%, down a limited 30 bps YoY, given the slight gross margin expansion and strict cost control (following the trend of the previous quarter) |
| • | As discussed last quarter, significant structural cost reduction programs are being implemented to right-size the The Body Shop At Home (TBSAH) and the global overhead structure including reductions in leadership, IT transformation and operating model simplification |
| o | In January we announced the closure of The Body Shop At Home (TBSAH) business in the US and are closing our dedicated distribution center in the UK in recognition of the changing economics of the channel |
| o | In February we announced a restructuring of our global management structure, reducing leadership positions by 25%, as well as a 12% reduction in the rest of global overhead staffing in order to both right-size the organization and simplify the operating model. The benefits of this restructuring will accelerate through the year |
| o | Thus, EBITDA adjustments are mainly related to severance costs (~50%) linked to overhead organization right-sizing, and the remaining are associated with the changes to the TBSAH channel including the closure of the US operation, the dedicated UK TBSAH distribution center and underperforming store locations |
| • | In addition to structural cost reduction, strict cost containment measures have been maintained to drive a culture of cost discipline through the organization as we work to stabilize net revenue and focus on margin expansion and cash generation in 2023 and beyond |
AESOP
| • | As disclosed in the Material fact dated April 3rd, Natura &Co announced it had entered into a binding agreement to sell Aesop to L’Oréal for an enterprise value of US$ 2.525 billion. Closing is expected in the third quarter of 2023 and Aesop will be classified as discontinued activities until then |
| Operational KPIs | |||||
| Aesop | Change | Change | |||
| Q1-23 | Q4-22 | Q1-22 | vs. | vs. Q1-22 | |
| Aesop (Total) | 397 | 394 | 368 | 3 | 29 |
| Signature Stores | 289 | 287 | 270 | 2 | 19 |
| Department Stores | 108 | 107 | 98 | 1 | 10 |
| • | Revenues were BRL 701 million, up +16.8% in CC (and up +9.2% in BRL). All regions delivered double-digit YoY growth, despite a deteriorating macro environment |
Aesop (R$ million) | P&L | ||
Q1-23 | Q1-22 | Ch. % | |
| Gross Revenue | 785.0 | 721.2 | 8.8 |
| Net Revenue | 701.3 | 642.4 | 9.2 |
| Constant Currency | 16.8% | ||
| COGS | (98.3) | (88.1) | 11.6 |
| Gross Profit | 603.0| | 554.3| | 8.8 |
| Gross Margin | 86.0% | 86.3% | (30.0) |
| Selling, Marketing and Logistics Expenses | (370.1) | (315.1) | 17.5 |
| Administrative, R&D, IT and Projects Expenses | (186.7) | (175.0) | 6.7 |
| Other Operating Income/ (Expenses), Net | (0.4) | 1.7 | (123.1) |
| Depreciation | 83.7 | 73.8 | 13.3 |
| EBITDA | 129.4 | 139.7| | (7.4) |
| EBITDA Margin | 18.5% | 21.7% | (320.0) |
| Net non-recurring other (income)/ expenses | 0.2 | - | - |
| Adjusted EBITDA | 129.7 | 139.7| | (7.1) |
| Adjusted EBITDA Margin | 18.5% | 21.7% | (320.0) |
• Signature stores totaled 289 in Q1-23 (+19 LTM) and posted solid same-store sale growth of +11%
• From a distribution channel perspective, retail and wholesale showed solid growth, partially offset by a softer e-commerce performance, reflecting consumer behavior normalizing post-Covid. Combined Same Store Sales growth was +5% (including retail, department store concessions and Aesop.com)
• From a category perspective, fragrance sales YoY growth was more than double the brand’s consolidated YoY growth, aligned with our category diversification strategy. The fragrances market has outgrown the market as a whole, especially the premium segment (which is the one that Aesop is exposed to), indicating the importance of this category for future growth
| • | Gross margin was 86.0%, compared to 86.3% in Q1-22, mainly driven by price increases, but still impacted by inflationary cost pressures (mainly higher freight costs) and unfavorable channel mix |
| • | Adjusted EBITDA margin was 18.5%, down 320bps YoY, still pressured by planned investments to deliver sustainable future growth and some gross margin pressure |
| • | These investments relate primarily to technology and supply chain enhancements and Aesop’s China market entry |
| • | The non-recurring expenses are mainly related to the transaction with L’Oréal |
3. Social and environmental performance
(all actions refer to Natura &Co Group, unless stated otherwise)
Natura&Co released its 2022 Annual Report and Sustainability Data, which provides a comprehensive update on the environmental and social performance of our four Business Units and insight into Natura &Co’s external partnerships, recognizing the importance of collaboration when it comes to addressing the interconnected crises we are facing. Natura &Co conducted its first formal materiality assessment to ensure we prioritize the issues that have the biggest impact on our business and governance, communities and the environment, and that matter most to our stakeholders. Our material issues were assessed applying double materiality, i.e. considering the impact of the company’s activities on economy, environment and people as well the impact of environmental and social issues on business success.
Some highlights from Natura &Co’s Commitment to Life Sustainability Vision include progress on our packaging circularity targets - all packaging material being reusable; recyclable or compostable increased from 81.2% to 82.3% and our formula circularity targets - renewable or natural ingredients increased from 89.6% to 93.7% as well as the biodegradable formulas which increased from 94.4% to 95.9%. For our six critical materials, to provide greater transparency, we disclosed both traceability and certification data where it was available. We also disclosed a snapshot of the results from our first global Diversity & Inclusion survey, which allows us to draw insights into key themes and areas that require focus.
Natura &Co also released its third pay equity report, an annual study of our position on equitable pay and gender balance across 73 markets. The study helps Natura &Co understand what is driving any inequalities, allowing us to make meaningful changes without detriment to the flexibility of work and career opportunities offered to women across the organization. We maintained our Commitment to Life target of equal representation, with 52.5% of women in leadership roles (Director and above). The unexplained gap (pay gap that cannot be explained by legitimate factors) fell from -1.19% to -0.76%. The raw gap between men’s and women’s pay improved once again by 5%, from -10.2% to -5.64% - the lowest level we have achieved at Natura &Co.
Updates across our Business Units:
Avon International
All our Business Units celebrated International Women’s Day. To mark this day, Avon launched its Global Progress for Women Report which is based on research carried out with 7000 women across seven countries. The report is centered on women’s lived experiences of equality and choice in the world of work and money, with a particular focus on flexibility, entrepreneurship, and access to earnings. The report finds that while over three-quarters would like to earn more money, over one-third believe access to setting up their own business is in favor of men. Through our global network of Representatives, we create opportunities for women around the world by providing them with the tools, training and support to start and scale their own businesses and gain financial independence.
Natura &Co Latin America
Together with its partners, Natura &Co Latin America’s activities in the Amazon contribute to the conservation of 2 million hectares and the value shared with communities increased from R$39.9m to $42.97m. In March, Natura &Co Latin America joined voices with people around the world in celebrating International Day for the Elimination of Racial Discrimination, a call to action against racial prejudice around the world. At Natura, initiatives such as the Avante Program accelerate the careers of black people, with a goal of 40% of black colleagues in its workforce by 2025 and 30% in managerial positions by 2030. Avon Latin America has launched a series of initiatives, including the DIVA Project, which aims to promote racial equity by attracting new talent, developing and empowering professionals and raising awareness amongst colleagues.
The Body Shop
The Body Shop took first place in the Beauty category as part of the Sustainable Brand Index -its fifth year in the number one spot. The Sustainable Brand Index is Europe’s largest independent brand study focused on sustainability. It includes nearly 1,600 brands, 36 industries, and 80,000 consumers across 8 countries. From marches, to meetings with local MPs and collecting more than 926,000 Canadian signatures, The Body Shop and Canada celebrated the historic win for cruelty free beauty following the Canadian government’s decision to end cosmetics animal testing and trade.
Aesop
With Aesop’s future transition from Natura &Co, we are proud to recognize its journey since 2012, becoming B Corp certified in 2020, supporting traditional communities in Australia and progressing with its circularity agenda. In March 2023, Aesop’s second in-store refill location was up and running in Melbourne, offering Aesop a new location and clientele for refill trialing. The Rinse and Return initiative was introduced in Japan, in partnership with TerraCycle, which means it is now available across four stores; Aesop Shinjuku, Aesop Sakae, Aesop Lucua, and Aesop Fukuoka.
4. Capital Markets and Stock Performance
NTCO3 shares traded at BRL13.20 at the end of Q1-23 on the B3 stock exchange, +13,70% in the quarter. Average Daily Trading Volume (ADTV) for the quarter was BRL 245.6 million, +17.2% vs Q4-22. NTCO traded at USD 5.22 at the end of Q1-23 on NYSE, +20.5% in the quarter.
On March 31, 2022, the Company’s market capitalization was BRL 18.3 billion, and the Company’s capital was comprised of 1,383,152,570 common shares.
5. Fixed income
Below is a table with details of all public debt instruments outstanding per issuer as of March 31, 2023:
Issuer | Type | Issuance | Maturity | Principal (million) | Nominal Cost |
| 10/06/2022 | 09/15/2027 | BRL 255.8 | DI + 0.80 per year | ||
| 10/06/2022 | 09/15/2029 | BRL 487.2 | IPCA + 6.80 per year | ||
| Natura Cosméticos S.A. | Debenture - 12th issue | 09/15/2031 | BRL 102.3 | IPCA + 6.90 per year | |
| 10/06/2022 | 09/15/2032 | BRL 102.3 | IPCA + 6.90 per year | ||
| 09/15/2033 | BRL 102.3 | IPCA + 6.90 per year | |||
| Natura Cosméticos S.A. | Commercial Notes | 09/19/2022 | 09/19/2025 | BRL 500.0 | DI + 1.55 per year |
| Natura &Co Luxembourg Holdings (Natura Lux) | Club Loan | 11/14/2022 | 11/14/2025 | US$ 250.0 | SOFR + 2.47% |
| Natura Cosméticos S.A. | Debenture - 11th issue | 07/25/2022 | 07/21/2027 | BRL 826.0 | DI + 1.65 per year |
| Natura Cosméticos S.A. | Bond - 2nd issue (Sustainability Linked Bond) | 05/03/2021 | 05/03/2028 | US$ 1,000.0 (1) | 4.13% |
| Natura &Co Luxembourg Holdings (Natura Lux) | Bonds | 04/19/2022 | 04/19/2029 | US$ 600.0 | 6.00% |
| Avon Products, Inc. | Unsecured Bonds | 03/12/2013 | 03/15/2043 | US$ 216.1 | 8.450%(2) |
(1) Principal and interests fully hedged (swapped to BRL). For more information, see the explanatory notes to the Company’s financial statements.
(2) Coupon based on current credit ratings, governed by interest rate adjustment clause
Ratings
Below is a table with our current credit ratings:
| Natura &Co Holding S.A. | |||
Agency | Global Scale | National Scale | Outlook |
| Standard & Poor's | BB | AAA | Stable |
| Fitch Ratings | BB | AA+ | Positive |
| Moody's | Ba3 | - | Negative |
| Natura Cosméticos S.A. | |||
Agency | Global Scale | National Scale | Outlook |
| Standard & Poor's | BB | AAA | Stable |
| Fitch Ratings | BB | AA+ | Positive |
| Moody's | Ba2 | - | Negative |
| Avon International | |||
Agency | Global Scale | National Scale | Outlook |
| Standard & Poor's | BB- | - | Stable |
| Fitch Ratings | BB | - | Positive |
| Moody's | Ba3 | - | Negative |
6. Appendix
FREE CASH FLOW RECONCILIATION
The correspondence between Free Cash Flow and Statements of Cash Flow is shown below:
Statement of Cash Flows | Free Cash Flow Reconciliation | ||
| CASH FLOW FROM OPERATING ACTIVITIES | |||
| Net (loss) income for the period | (a) | Net Income (loss) | |
| Adjustments to reconciliate net (loss) income for the period with net cash used in operating activities: | |||
| Depreciation and amortization | (b) | Depreciation/amortization | |
| Interest and exchange variation on short-term investments | (c) | ||
| Earnings (loss) from swap and forward derivative contracts | (c) | ||
| Provision for tax, civil and labor risks | (c) | ||
| Inflation adjustment of judicial deposits | (c) | ||
| Inflation adjustment of provision for tax, civil and labor risks | (c) | ||
| Income tax and social contribution | (c) | ||
| Income from sale and write-off of property, plant and equipment, lease and non-current assets held for sale | (c) | ||
Interest and exchange rate variation on leases
Interest and exchange rate variation on borrowings, financing and debentures, net of acquisition costs
Inflation adjustment and exchange rate variation on other assets and liabilities
| (c)
(c)
| Non-cash Adjustments to Net Income | |
| (c) | |||
| Reversal of provision for losses from property, plant and equipment, intangible and leases | (c) | ||
| Provision for stock option plans | (c) | ||
| Provision for losses with trade accounts receivables, net of reversals | (c) | ||
| Provision for inventory losses, net of reversals | (c) | ||
| Reversal of provision for the provision for carbon credits | (c) | ||
| Effect from hyperinflationary economy | (c) | ||
| Other adjustments to reconcile net loss | (c) | ||
| Increase (Decrease) in: | |||
| Trade accounts receivable and related parties | (d2) | Decrease (Increase) in Working Capital | |
| Inventories | (d1) | ||
| Recoverable taxes | (d4) | ||
| Other assets | (d4) | ||
| Domestic and foreign trade accounts payable and related parties | (d3) | ||
| Payroll, profit sharing and social charges, net | (d4) | ||
| Tax liabilities | (d4) | ||
| Other liabilities | (d4) | ||
| OTHER CASH FLOWS FROM OPERATING ACTIVITIES | |||
| Payment of income tax and social contribution | (e) | Income Tax and Social Contribution | |
| Release of judicial deposits | (h) | ||
| Payments related to tax, civil and labor lawsuits | (h) | Other Operating Activities | |
| (Payments) proceeds due to settlement of derivative transactions | (h) | ||
| Payment of interest on lease | (g) | Lease Payments | |
| Payment of interest on borrowings, financing and debentures | (f) | Interest on Debt | |
| NET CASH (USED IN) OPERATING ACTIVITIES | |||
| CASH FLOW FROM INVESTING ACTIVITIES | |||
| Cash from acquisition of subsidiary | (l) | Other financing/investing activities | |
| Additions of property, plant and equipment and intangible | (j) | Capex | |
| Proceeds from sale of property, plant and equipment, intangible and non-current assets held for sale | (i) | Sale of Assets | |
| Acquisition of short-term investments | (l) | ||
| Redemption of short-term investments | (l) | Other financing/investing activities | |
| Redemption of interest on short-term investments | (l) | ||
| NET CASH GENERATED BY (USED IN) INVESTING ACTIVITIES | |||
| CASH FLOW FROM FINANCING ACTIVITIES | |||
| Repayment of lease - principal | (g) | Lease Payments | |
| Repayment of borrowings, financing and debentures - principal | (l) | ||
| New borrowings, financing, and debentures | (l) | ||
| Acquisition of treasury shares, net of receipt of option strike price | (l) | Other financing/investing activities | |
| Receipt of funds due to settlement of derivative transactions | (l) | ||
| Capital Increase | (l) | ||
| NET CASH PROVIDED BY (USED IN) FINANCING ACTIVITIES | |||
| Effect of exchange rate variation on cash and cash equivalents | (k) | Exchange Rate Effect | |
| DECREASE IN CASH AND CASH EQUIVALENTS | |||
| Opening balance of cash and cash equivalents | |||
| Closing balance of cash and cash equivalents | |||
| DECREASE IN CASH AND CASH EQUIVALENTS | |||
| Free Cash Flow | Cash Flow Reconciliation | |
| Net income (loss) | (a) | |
| Depreciation and amortization | (b) | |
| Non-cash Adjustments to Net Income | (c) | |
| Adjusted Net income | ||
| Decrease / (Increase) in Working Capital | (d) | |
| Inventories | (d1) | |
| Accounts receivable | (d2) | |
| Accounts payable | (d3) | |
| Other assets and liabilities | (d4) | |
| Income tax and social contribution | (e) | |
| Interest on debt | (f) | |
| Lease payments | (g) | |
| Other operating activities | (h) | |
| Cash from Operations | ||
| Capex | (j) | |
| Sale of Assets | (i) | |
| Exchange rate variation | (k) | |
| Free Cash Flow | ||
| Other financing and investing activities | (l) | |
| Cash Balance Variation |
CONSOLIDATED BALANCE SHEET
ASSETS (R$ million) | Mar-23 | Dec-22 | LIABILITIES AND SHAREHOLDER'S EQUITY (R$ million) | Mar-23 | Dec-22 |
| CURRENT ASSETS | CURRENT LIABILITIES | ||||
| Cash and cash equivalents | 2,224.5 | 4,195.7 | Borrowings, financing and debentures | 289.2 | 331.2 |
| Short-term investments | 1,587.5 | 1,800.4 | Lease | 635.0 | 878.4 |
| Trade accounts receivable | 3,327.9 | 3,502.4 | Trade accounts payable and reverse factoring operations | 5,592.3 | 6,375.9 |
| Inventories | 4,382.4 | 4,516.9 | Dividends and interest on shareholders' equity payable | 0.2 | 0.3 |
| Recoverable taxes | 1,139.1 | 911.4 | Payroll, profit sharing and social charges | 1,087.8 | 1,277.0 |
| Income tax and social contribution | 233.6 | 196.1 | Tax liabilities | 730.6 | 828.1 |
| Derivative financial instruments | 168.3 | 235.1 | Income tax and social contribution | 194.1 | 70.3 |
| Other current assets | 722.2 | 763.4 | Derivative financial instruments | 1,628.2 | 1,614.0 |
| Assets held for sale | 2,582.5 | 0.1 | Provision for tax, civil and labor risks | 454.0 | 463.7 |
| Total current assets | 16,367.9 | 16,121.5 | Other current liabilities | 1,176.5 | 1,499.1 |
| Assets held for sale | 1,316.7 | 0 | |||
| NON CURRENT ASSETS | Total current liabilities | 13,104.6 | 13,337.9 | ||
| Recoverable taxes | 1,211.6 | 1,356.9 | |||
| Deferred income tax and social contribution | 3,462.7 | 3,519.5 | NON CURRENT LIABILITIES | ||
| Judicial deposits | 411.8 | 457.6 | Borrowings, financing and debentures | 12,965.7 | 13,261.1 |
| Derivative financial instruments | 830.7 | 773.3 | Lease | 1,644.7 | 2,392.3 |
| Short-term investments | 34.3 | 35.2 | Payroll, profit sharing and social charges | 12.1 | 26.2 |
| Other non-current assets | 1,198.6 | 1,252.4 | Tax liabilities | 121.3 | 117.4 |
| Total long term assets | 7,149.8 | 7,394.9 | Deferred income tax and social contribution | 879.2 | 934.4 |
| Income tax and social contribution | 431.7 | 448.5 | |||
| Property, plant and equipment | 4,537.9 | 4,966.2 | Derivative financial instruments | 443.4 | 191.3 |
| Intangible | 23,042.5 | 23,261.0 | Provision for tax, civil and labor risks | 799.1 | 873.6 |
| Right of use | 2,094.3 | 2,941.9 | Other non-current liabilities | 764.4 | 751.6 |
| Total non-current assets | 36,824.5 | 38,563.9 | Total non-current liabilities | 18,061.6 | 18,996.3 |
| SHAREHOLDERS' EQUITY | |||||
| Capital stock | 12,484.5 | 12,484.4 | |||
| Treasury shares | (262.4) | (262.4) | |||
| Capital reserves | 10,580.3 | 10,540.9 | |||
| Accumulated losses | (2,647.3) | (1,994.6) | |||
| Other comprehensive income | 1,852.6 | 1,564.3 | |||
| Equity attributable to owners of the Company | 22,007.7 | 22,332.7 | |||
| Non-controlling interest in shareholders' equity of subsidiaries | 18.5 | 18.5 | |||
TOTAL ASSETS | 53,192.5 | 54,685.4 | | TOTAL LIABILITIES AND SHAREHOLDERS' EQUITY | 53,192.4 | 54,685.4 |
CONSOLIDATED INCOME STATEMENT- INCLUDING PURCHASE PRICE ALLOCATION (PPA) AMORTIZATION
R$ million | Q1-23 | Q1-22 | Ch. % |
| NET REVENUE | 7,320.2 | 7,610.9 | (3.8) |
| Cost of Products Sold | (2,494.7) | (2,882.8) | (13.5) |
| GROSS PROFIT | 4,825.5 | 4,728.1 | 2.1 |
| OPERATING EXPENSES | |||
| Selling, Marketing and Logistics Expenses | (3,104.7) | (3,346.0) | (7.2) |
| Administrative, R&D, IT and Project Expenses | (1,381.0) | (1,358.3) | 1.7 |
| Impairment losses on trade receivables | (215.6) | (162.8) | 32.5 |
| Other Operating Expenses, Net | (96.6) | (60.4) | 59.9 |
| LOSS FROM OPERATIONS BEFORE FINANCIAL RESULT | 27.4 | (199.4) | (113.8) |
| Financial Income | 1,005.7 | 1,338.3 | (24.8) |
| Financial Expenses | (1,482.1) | (1,698.9) | (12.8) |
| LOSS BEFORE INCOME TAX AND SOCIAL CONTRIBUTION | (448.9) | (560.0) | (19.8) |
| Income Tax and Social Contribution | (82.8) | (70.0) | 18.3 |
| (LOSS) INCOME FROM CONTINUED OPERATIONS | (531.7) | (630.0) | (15.6) |
| Income (Loss) from discontinued operations | (120.5) | (12.2) | 890.2 |
| (LOSS) INCOME FOR THE PERIOD | (652.2) | (642.2) | 1.6 |
| Attributable to controlling shareholders | (652.4) | (643.1) | 1.5 |
| Attributable to non-controlling shareholders | 0.3 | 0.9 | (70.2) |
PURCHASE PRICE ALLOCATION (PPA) AMORTIZATION
| R$ million | Q1-23 | Q1-22 |
| Net Revenue | - | - |
| Cost of Products Sold | (1.5) | (2.0) |
| Gross Profit | (1.5) | (2.0) |
| Selling, Marketing and Logistics Expenses | (64.4) | (66.2) |
| Administrative, R&D, IT and Project Expenses | (75.5) | (69.4) |
| Other Operating Income (Expenses), Net | 28.6 | 49.0 |
| Financial Income/(Expenses), net | 15.8 | 18.0 |
| Income Tax and Social Contribution | 16.4 | 0.8 |
LOSS FROM CONTINUED OPERATIONS | (80.5) | (69.8) |
| Depreciation impact | (141.3) | (149.4) |
CONSOLIDATED STATEMENT OF CASH FLOW
R$ million | Q1-23 | Q1-22 |
| CASH FLOW FROM OPERATING ACTIVITIES | ||
| Net (loss) income for the period | (652.2) | (642.2) |
| Adjustments to reconciliate net (loss) income for the period with net cash used in operating activities: | ||
| Depreciation and amortization | 603.5 | 575.5 |
| Interest and exchange variation on short-term investments | (190.7) | (86.2) |
| Earnings (loss) from swap and forward derivative contracts | 365.9 | 974.9 |
| Provision for tax, civil and labor risks | (20.5) | (26.6) |
| Inflation adjustment of judicial deposits | (8.1) | (8.2) |
| Inflation adjustment of provision for tax, civil and labor risks | 15.9 | 11.1 |
| Income tax and social contribution | 82.8 | 70.0 |
| Income from sale and write-off of property, plant and equipment, lease and non-current assets held for sale | 47.4 | 9.8 |
| Interest and exchange rate variation on leases | 46.7 | 54.7 |
| Interest and exchange rate variation on borrowings, financing and debentures, net of acquisition costs | 109.3 | (727.5) |
| Inflation adjustment and exchange rate variation on other assets and liabilities | 0.7 | 2.2 |
| Impairment | (31.1) | 0.0 |
| Provision for stock option plans | (15.2) | 40.1 |
| Provision for losses with trade accounts receivables, net of reversals | 215.6 | 164.7 |
| Provision for inventory losses, net of reversals | 150.6 | 76.5 |
| Reversal of provision for the provision for carbon credits | (7.2) | (4.0) |
| Effect from hyperinflationary economy | 95.4 | 68.9 |
| Other adjustments to reconcile net loss | 0.0 | 0.0 |
| Increase (Decrease) in: | ||
| Trade accounts receivable and related parties | (195.4) | 289.5 |
| Inventories | (483.3) | 86.1 |
| Recoverable taxes | (90.5) | (3.1) |
| Other assets | (63.3) | 129.3 |
| Domestic and foreign trade accounts payable and related parties | (610.0) | (950.5) |
| Payroll, profit sharing and social charges, net | (94.2) | (273.7) |
| Tax liabilities | (37.5) | (198.9) |
| Other liabilities | (138.5) | (490.2) |
| OTHER CASH FLOWS FROM OPERATING ACTIVITIES | ||
| Payment of income tax and social contribution | (130.0) | (66.8) |
| Release of judicial deposits | 7.0 | (1.7) |
| Payments related to tax, civil and labor lawsuits | (11.2) | (22.8) |
| (Payments) proceeds due to settlement of derivative transactions | (90.2) | 13.1 |
| Payment of interest on lease | (58.5) | (51.5) |
| Payment of interest on borrowings, financing and debentures | (200.4) | (211.7) |
| Discontinued Operations | (237.2) | 6.2 |
| NET CASH (USED IN) OPERATING ACTIVITIES | (1,624) | (1,193) |
| Cash from acquisition of subsidiary | ||
| Additions of property, plant and equipment and intangible | (258.2) | (279.5) |
| Proceeds from sale of property, plant and equipment, intangible and non-current assets held for sale | 1.4 | 0.6 |
| Acquisition of short-term investments | (2,087.4) | (2,191.7) |
| Redemption of short-term investments | 2,306.5 | 2,566.1 |
| Redemption of interest on securities | 50.1 | 38.2 |
| Investing activities - discontinued operations | (43.4) | (30.0) |
| NET CASH GENERATED BY (USED IN) INVESTING ACTIVITIES | (30.9) | 103.7 |
| CASH FLOW FROM FINANCING ACTIVITIES | ||
| Repayment of lease - principal | (154.5) | (226.2) |
| Repayment of borrowings, financing and debentures - principal | (86.3) | (238.6) |
| New borrowings, financing, and debentures | 5.9 | 1,181.4 |
| Acquisition of treasury shares, net of receipt of option strike price | 0.0 | (120.3) |
| Payment of dividends and interest on equity for the previous period | (0.0) | 0.0 |
| Receipt of funds due to settlement of derivative transactions | (7.3) | 3.7 |
| Capital Increase | 0.1 | 2.6 |
| Financing activities - discontinued operations | (59.7) | (46.6) |
| NET CASH PROVIDED BY (USED IN) FINANCING ACTIVITIES | (301.9) | 556.1 |
| Effect of exchange rate variation on cash and cash equivalents | (14.1) | (435.6) |
| DECREASE IN CASH AND CASH EQUIVALENTS | (1,971.2) | (968.7) |
| Opening balance of cash and cash equivalents | 4,195.7 | 4,007.3 |
| Closing balance of cash and cash equivalents | 2,224.5 | 3,038.5 |
DECREASE IN CASH AND CASH EQUIVALENTS | (1,971.2) | (968.7) |
7. Conference call and webcast

8. Glossary
Abihpec: Brazilian Association of the Personal Hygiene, Perfumery and Cosmetics Industry
ADR: An American Depositary Receipt is a negotiable certificate issued by a U.S. depository bank representing a specified number of shares of a non-U.S. company stock.
ADS: The individual issuance of shares in a U.S. stock exchange by a non-U.S. company is referred to as American Depositary Shares (ADS)
Adjusted EBITDA: Excludes effects that are not considered usual, recurring or not-comparable between the periods under analysis
APAC: Asia and Pacific
Avon representatives: Self-employed resellers who do not have a formal labor relationship with Avon
B3: Brazilian Stock Exchange
Benefit Sharing: In accordance with Natura’s Policy for the Sustainable Use of Biodiversity and Associated Traditional Knowledge, benefits are shared whenever we perceive various forms of value in the access gained. Therefore, one of the practices that defines the way in which these resources are divided is to associate payments with the number of raw materials produced from each plant as well as the commercial success of the products in which these raw materials are used
BPS: Basis Points; a basis points is equivalent to one percentage point * 100
Brand Power: A methodology used by Natura &Co to measure how its brands are perceived by consumers, based on metrics of significance, differentiation and relevance.
BRL: Brazilian Reais
CDI: The overnight rate for interbank deposits
CEE: Central and Eastern Europe
CFT: Cosmetics, Fragrances and Toiletries Market (CFT = Fragrances, Body Care and Oil Moisture, Make-up (without Nails), Face Care, Hair Care (without Colorants), Soaps, Deodorants, Men’s Grooming (without Razors) and Sun Protection
COGS: Costs of Goods Sold
Constant currency (“CC) or constant exchange rates: when exchange rates used to convert financial figures into a reporting currency are the same for the years under comparison, excluding foreign currency fluctuation effects
CO2e: Carbon dioxide equivalent; for any quantity and type of greenhouse gas, CO2e signifies the amount of CO2 which would have the equivalent global warming impact.
EBITDA: Earnings Before Interests, Tax, Depreciation and Amortization
EMEA: Europe, Middle East and Africa
EP&L: Environmental Profit & Loss
Foreign currency translation: conversion of figures from a foreign currency into the currency of the reporting entity
G&A: General and administrative expenses
GHG: Greenhouse gases
ICON: Consumer Stock Index of the B3 stock exchange, designed to track changes in the prices of the more actively traded and better representative cyclical and non-cyclical consumer stocks
Innovation Index: Share in the last 12 months of the sale of products launched in the last 24 months
IBOV: Ibovespa Index is the main performance indicator of the stocks traded in B3 and lists major companies in the Brazilian capital market
IFRS - International Financial Reporting Standards
Kantar: Data, insights and consulting company with global presence
Hispanic Latam: Often used to refer to the countries in Latin America, excluding Brazil
LFL: Like-for-Like, applicable to measure comparable growth
Natura Consultant: Self-employed resellers who do not have a formal labor relationship with Natura
Natura Crer Para Ver Program (CPV): Special line of non-cosmetic products whose profits are transferred to the Natura Institute, in Brazil, and invested by Natura in social initiatives in the other countries where we operate. Our consultants promote these sales to benefit society and do not obtain any gains.
Natura Institute: Is a nonprofit organization created in 2010 to strengthen and expand our Private Social Investment initiatives. The institute has enabled us to leverage our efforts and investments in actions that contribute to the quality of public education
NYSE: New York Stock Exchange
P&L: Profit and loss
PP: Percentage point
PPA: Purchase Price Allocation - effects of the fair market value assessment as a result of a business combination
Profit Sharing: The share of profit allocated to employees under the profit-sharing program
SEC: The U.S. Securities and Exchange Commission (SEC) is an independent federal government regulatory agency responsible for protecting investors, maintaining fair and orderly functioning of the securities markets, and facilitating capital formation
SG&A: Selling, general and administrative expenses
SM&L: Selling, marketing and logistics expenses
SLB: Sustainability Linked Bond
SPT: Sustainability Performance Targets
SSS: Same-Store-Sales
Supplier Communities: The communities of people involved in small-scale farming and extraction activities in a variety of locations in Brazil, especially in the Amazon Region, who extract the inputs used in our products from the social and biodiversity. We form production chains with these communities that are based on fair prices, the sharing of benefits gained from access to the genetic heritage and associated traditional knowledge and support for local sustainable development projects. This business model has proven effective in generating social, economic and environmental value for Natura and for the communities.
Synergies: Synergy is the concept that the value and performance of two companies combined will be greater than the sum of the separate individual parts.
TBS: The Body Shop.
TMEA: Turkey, Middle East and Africa
UNI: Underlying Net Income.
WE: Western Europe
9. Disclaimer
EBITDA is not a measure under BR GAAP and does not represent cash flow for the periods presented. EBITDA should not be considered an alternative to net income as an indicator of operating performance or an alternative to cash flow as an indicator of liquidity. EBITDA does not have a standardized meaning and the definition of EBITDA used by Natura may not be comparable with that used by other companies. Although EBITDA does not provide under BR GAAP a measure of cash flow, Management has adopted its use to measure the Company’s operating performance. Natura also believes that certain investors and financial analysts use EBITDA as an indicator of performance of its operations and/or its cash flow.
This report contains forward-looking statements. These forward-looking statements are not historical fact, but rather reflect the wishes and expectations of Natura’s management. Words such as “anticipate,” “wish,” “expect,” “foresee,” “intend,” “plan,” “predict,” “project,” “desire” and similar terms identify statements that necessarily involve known and unknown risks. Known risks include uncertainties that are not limited to the impact of price and product competitiveness, the acceptance of products by the market, the transitions of the Company’s products and those of its competitors, regulatory approval, currency fluctuations, supply and production difficulties and changes in product sales, among other risks. This report also contains certain pro forma data, which are prepared by the Company exclusively for informational and reference purposes and as such are unaudited. This report is updated up to the present date and Natura does not undertake to update it in the event of new information and/or future events.
Investor Relations Team
ri@natura.net

Item 2
Earnings Presentation| Q1 - 23 First - Quarter 2023 Results May 09 th ,2023
Earnings Pre sentation| Q1 - 23 The words “anticipate," "wishes,“ "expects," "estimates," "intends," "forecasts," "plans," "predicts," "projects," "targets" and similar words are intended to identify these statements, which necessarily involve known and unknown risks and uncertainties . Known risks and uncertainties include, but are not limited to, the impact of competitive products and pricing, market acceptance of products, product transitions by the Company and its competitors, regulatory approval, currency fluctuations, production and supply difficulties, changes in product sales mix, and other risks . This presentation also may include pro - forma and adjusted information prepared by the Company for information and reference purposes only, which has not been audited . Forward - looking statements speak only as of the date they are made, and the Company does not undertake any obligation to update them in light of new information or future developments . https://ri.naturaeco.com/en/ This presentation may contain forward - looking statements. Such statements are not statements of historical fact and reflect the beliefs and expectations of Natura &Co’s management. 2

Earnings Presentation| Q1 - 23 3. Advances in ESG agenda • Further progress on renewable or natural ingredients • Continued focus on pay equity 1. Profitability improvement • 370 bps improvement in gross margin, driven by pricing and mix • Adj. EBITDA margin, at 10.5% (+330 bps), driven by: • Natura &Co Latam and Avon International, combined with lower Holding expenses • Negatively impacted by sales deleverage at TBS 2. Decisive strategic steps • Binding agreement to sell Aesop (EV US$2.525 billion), addressing leverage • Wave 2 implementation in Peru • New chapter at The Body Shop with CEO transition

Earnings Pre sentation| Q1 - 23 Consolidated Financial Performance Guilherme Castellan, CFO

Earnings Presentation| Q1 - 23 8,253.3 8,021.4 Net Revenue (BRL million) Highl i gh ts Strong performance at: • Natura &Co Latam Mid - twenties % growth at Natura brand • Growth in CFT for Avon Brazil and Avon Int Partially offset by: • Continued challenges at TBS, and • Significant decrease in Fashion and Home for Avon (Latam and Int) 5 Natura &Co: Continued sales growth in constant currency Aesop +16.8% at CC +9.2% in BRL The Body Shop - 9.4% at CC - 16.5% in BRL Avon International - 7.5% at CC - 12.8% in BRL Natura &Co Latam +9.0% at CC +2.4% in BRL +3.4% CC ( 2 . 8%) Q1 - 22 Q1 - 23 Excluding Aesop, Q1 - 23 consolidated net revenue was BRL 7.3 billion, up +2.2 YoY at CC and down 3.8% YoY in BRL

Earnings Presentation| Q1 - 23 Expansion in adjusted EBITDA margin Q1 - 23 Consolidated Adjusted EBITDA Margin 6 Adjusted EBITDA ex - Aesop was BRL 712 million , with margin up 370 bps vs Q1 - 22 to 9.7% Highlights • Improvement at Natura &Co Latam and Avon International • Lower Holding expenses More than offset by: • Slight YoY pressure at TBS from operating deleverage • Higher pressure at Aesop from continued investments
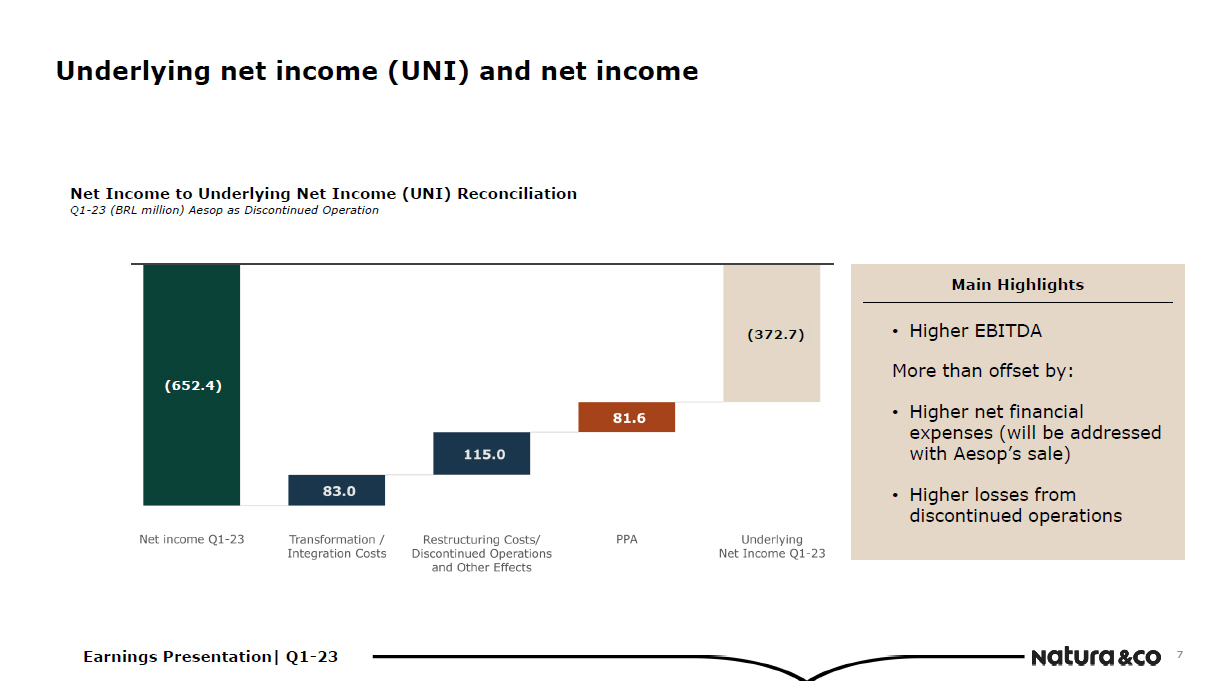
Earnings Presentation| Q1 - 23 Net Income to Underlying Net Income (UNI) Reconciliation Q1 - 23 (BRL million) Aesop as Discontinued Operation Underlying net income (UNI) and net income 7 Main Highlights • Higher EBITDA More than offset by: • Higher net financial expenses (will be addressed with Aesop’s sale) • Higher losses from discontinued operations (372.7) (652.4)

Earnings Presentation| Q1 - 23 Progress in cash conversion 8 Highlights ( 12 . 7) ( 1 , 812 . 5 ) (1,541.6) ( 2 5 8.2) Higher Adjusted Net Income Higher WK consumption: • Increase in Inventory • Increase in accounts receivable Partially offset by: • Increase in accounts payable • Improvements in other assets and liabilities Lower Capex

Earnings Presentation| Q1 - 23 0 . 3 - 1 . 7 - 1 . 0 Cash and sh o rt - t erm deposits 2 0 23 2 0 24 2 0 25 2 0 26 2 0 27 2028 o n wa rds Enterprise value of US$ 2.525 billion Binding agreement to sell Aesop BRL 4.0 billion Cash balance at period - end Q1 - 23 3.96x Group net debt - to - EBITDA ratio Net debt and net debt - to - EBITDA ratio (BRL billion) Amortization schedule (BRL billion) (a) Gross debt excludes PPA impacts and excludes lease agreements (b) Excluding foreign currency hedging 4.0 a 9.9 b Continued liability management Average Maturity: 6.5 years 9 7.7 8.5 8.8 7.4 9.4 2.13 x 2.46 x 2.85 x 3.49 x 3.96 x Q 1 - 2 2 Q 2 - 2 2 Net Debt Q 3 - 2 2 Q 4 - 2 2 Q 1 - 2 3 Net Debt/EBITDA including IFRS 16 effects

Natura &Co Latam Financial Performance
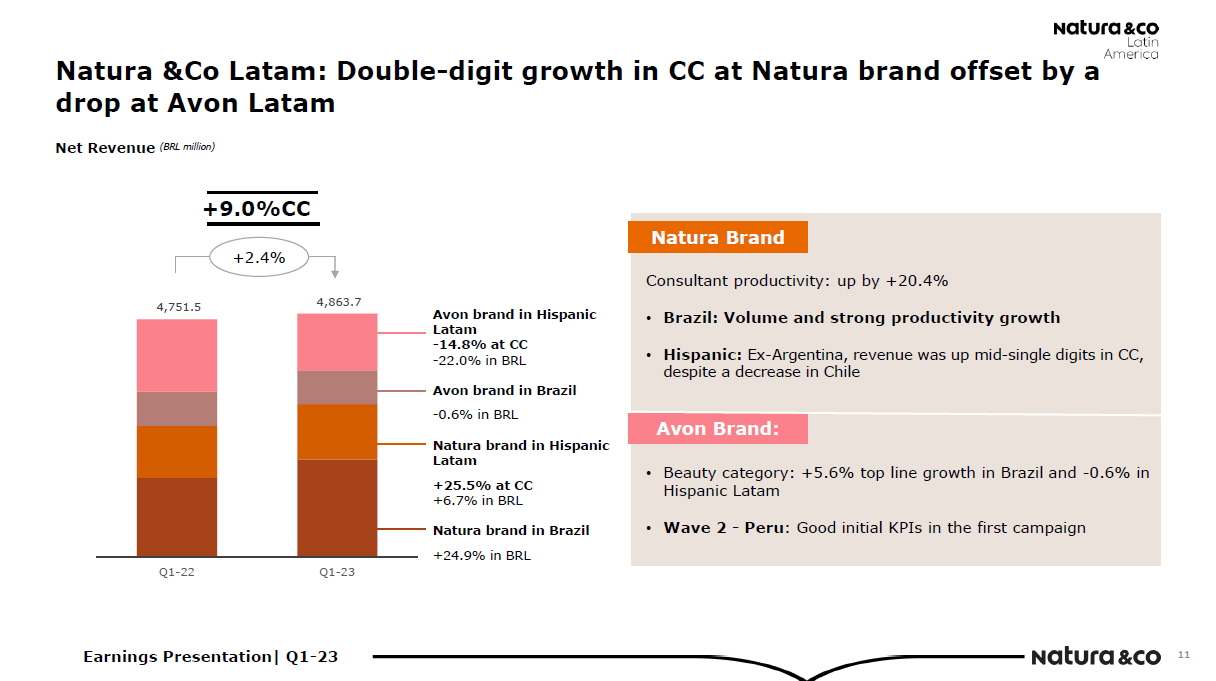
Earnings Presentation| Q1 - 23 Avon brand in Hispanic Latam - 14.8% at CC - 22.0% in BRL Avon brand in Brazil - 0.6% in BRL Natura brand in Hispanic Latam +25.5% at CC +6.7% in BRL Natura brand in Brazil +24.9% in BRL +9.0%CC Natura Brand Natura &Co Latam: Double - digit growth in CC at Natura brand offset by a drop at Avon Latam Net Revenue (BRL million) 11 Consultant productivity: up by +20.4% • Brazil: Volume and strong productivity growth • Hispanic: Ex - Argentina, revenue was up mid - single digits in CC, despite a decrease in Chile Avon Brand: • Beauty category: +5.6% top line growth in Brazil and - 0.6% in Hispanic Latam • Wave 2 - Peru : Good initial KPIs in the first campaign + 2 . 4% 4,751.5 4,863.7 Q 1 - 2 2 Q 1 - 2 3

Earnings Presentation| Q1 - 23 428 . 5 632.5 Adjusted EBITDA¹ and Adjusted EBITDA margin (BRL million) Ma rg in 9 . 0% • Gross Margin improvement • SG&A efficiencies at Avon Brand in Brazil Partially offset by: • Investments in Natura brand • Avon Latin America deleverage due to Wave 2 preparation in some countries Q1 - 22 Q1 - 23 1 Excluding effects that are not considered recurring nor comparable between the periods under analysis, such as: Integration costs and net non - recurring other (income)/expenses 13 . 0% 13.0% Adj. EBITDA margin, driven mainly by strong gross margin improvement Main highlights • Strong top line performance 12

Earnings Presentation| Q1 - 23 Avon International Financial Performance

81 . 1 98 . 0 1,606.6 Q 1 - 2 2 Q 1 - 2 3 AprEearsenintangsçãoPredeseRentasutltaion|doQ1s | - 1T23 - 23 Q1 - 22 Q1 - 23 1 Excluding effects that are not considered recurring nor comparable between the periods under analysis, such as transformation costs i nt e rnat i o nal Avon International: CFT in positive territory; improving margins Net Revenue (BRL million) Ma rg in 4.4% 6.1% Adjusted EBITDA¹ and adjusted EBITDA margin (BRL million, %) 14 Adjusted EBITDA: • Gross margin expansion of 480bps, continued focus on transformation savings and phasing of expenses partially offset by: • Sales deleverage • Brand investment in lead markets • Inflation increase in fixed expenses Revenue: • Beauty category entered positive territory in CC (ex Russia and Ukraine), driven by the fragrance and color categories • F&H decreased - 21% (in CC), in line with our strategy - 7.5%CC ( - 3.7% Ex - Russia and Ukraine) 1,842.0 - 12.8%

Earnings Presentation| Q1 - 23 The Body Shop Financial Performance

Earnings Presentation| Q1 - 23 64 . 7 51 . 7 6.4% 6.1% Ma rg in Revenue: • Low single - digit decline in CC in Q1 - 23 in core business distribution channels (stores, e - commerce and franchise) • The Body Shop at Home continued its steep decline Q 1 - 2 2 Q 1 - 2 3 The Body Shop: Challenging results; continued strict cost control Net Revenue (BRL million) Adjusted EBITDA¹ and adjusted EBITDA margin (BRL million, %) 16 Adjusted EBITDA: • Despite operating deleverage, margin decreased by a limited 30 bps, due to: Slight gross margin expansion Strict cost control 1,017.4 - 16.5% 849 . 9 - 9.4%CC Q1 - 22 Q1 - 23 1 Excluding effects that are not considered recurring nor comparable between the periods under analysis, such as restructuring business unit

Earnings Presentation| Q1 - 23 Aesop Financial Performance
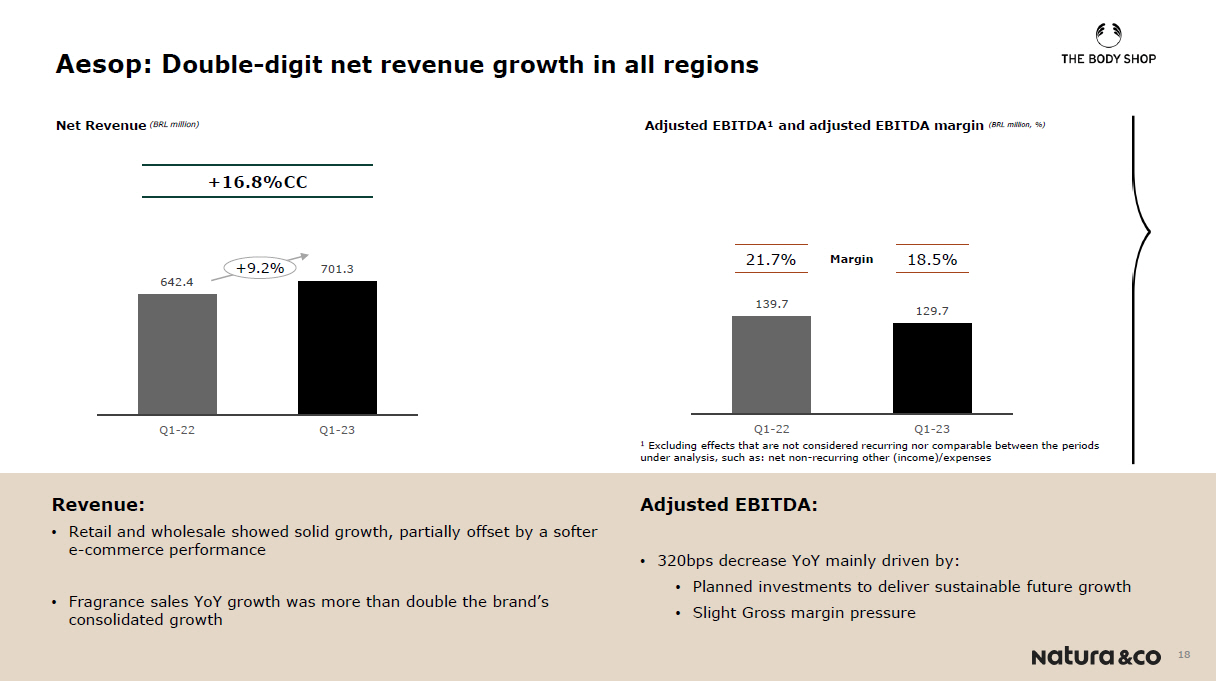
Earnings Presentation| Q1 - 23 Revenue: • Retail and wholesale showed solid growth, partially offset by a softer e - commerce performance • Fragrance sales YoY growth was more than double the brand’s consolidated growth 139.7 129 . 7 642 . 4 701 . 3 Q1 - 2 2 Q1 - 2 3 Aesop: D ouble - digit net revenue growth in all regions Net Revenue (BRL million) Ma rg in 2 1 . 7% 18 . 5% Adjusted EBITDA¹ and adjusted EBITDA margin (BRL million, %) 18 Adjusted EBITDA: • 320bps decrease YoY mainly driven by: • Planned investments to deliver sustainable future growth • Slight Gross margin pressure + 9.2 % +16.8%CC Q1 - 22 Q1 - 23 1 Excluding effects that are not considered recurring nor comparable between the periods under analysis, such as: net non - recurring other (income)/expenses

Earnings Presentation| Q1 - 23 Closing Remarks Fábio Barbosa

Earnings Presentation| Q1 - 23 Key Takeaways Creating the best beauty group FOR the world 1. • Strategic actions underway at all our brands to improve performance 2. • Deleveraging enabled by the Aesop transaction and disciplined investments going forward 3. • Natura &Co continues to focus on profitability and cash conversion 4. • Continuous improvement in FY adjusted EBITDA and cash flow, though we may experience some volatility between quarters
Earnings Presentation| Q1 - 23 Thank you


Earnings Presentation| Q1 - 23 58% 40% 2% BRL USD Other Q1 - 23 by type* 23 Debt Profile * Excludes foreign currency hedging Q1 - 23 by currency* 71% 15% 4% 10% Debentures Working Capital Bonds Commercial Notes Others
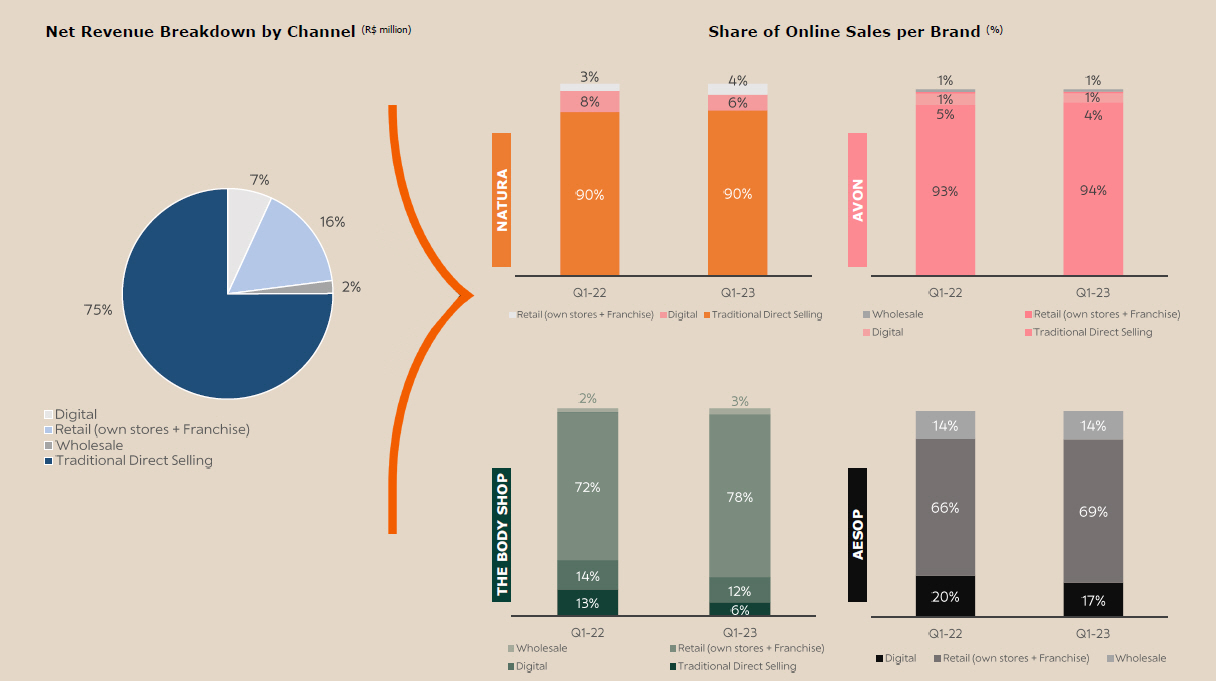
Earnings Presentation| Q1 - 23 Net Revenue Breakdown by Channel (R$ million) Share of Online Sales per Brand (%) N A T URA A VON THE BODY SHOP AE S OP
Earnings Presentation| Q1 - 23 First - Quarter 2023 Results May 09 th ,2023