UNITED STATES
SECURITIES AND EXCHANGE COMMISSION
Washington, D.C. 20549
FORM 6-K
REPORT OF FOREIGN PRIVATE ISSUER PURSUANT TO RULE 13a-16 OR 15d-16 UNDER THE SECURITIES EXCHANGE ACT OF 1934
For the month of August 2023 |
Commission File Number: 001-39169
Natura &Co Holding S.A.
(Exact name of registrant as specified in its charter)
Avenida Alexandre Colares, No. 1188, Sala A17-Bloco A
Parque Anhanguera
São Paulo, São Paulo 05106-000, Brazil
(Address of principal executive office)
Indicate by check mark whether the registrant files or will file annual reports under cover of Form 20-F or Form 40‑F:
Form 20-F ☒ Form 40-F ☐
Indicate by check mark if the registrant is submitting the Form 6-K in paper as permitted by Regulation S-T Rule 101(b)(1):
Yes ☐ No ☒
Indicate by check mark if the registrant is submitting the Form 6-K in paper as permitted by Regulation S-T Rule 101(b)(7):
Yes ☐ No ☒
NATURA &CO HOLDING S.A.
TABLE OF CONTENTS
ITEM
1. Earnings release of Natura &Co Holding S.A. for the second quarter of 2023.
2. Earnings presentation of Natura &Co Holding S.A. for the second quarter of 2023.
SIGNATURE
Pursuant to the requirements of the Securities Exchange Act of 1934, the registrant has duly caused this report to be signed on its behalf by the undersigned, thereunto duly authorized.
NATURA &CO HOLDING S.A. | |||
By: | /s/ Guilherme Strano Castellan | ||
| Name: | Guilherme Strano Castellan | |
| Title: | Principal Financial Officer | |
|
| ||
|
| ||
By: | /s/ Itamar Gaino Filho | ||
| Name: | Itamar Gaino Filho | |
| Title: | Chief Legal and Compliance Officer | |
|
| ||
Date: August 15, 2023
São Paulo, August 14, 2023
Q2-23: Continued improvement in adjusted EBITDA, mainly driven by gross margin
Good momentum of Natura brand in Latam amid kick-off of Wave 2; another quarter of improving trends at Avon International; The Body Shop’s top line remains challenging
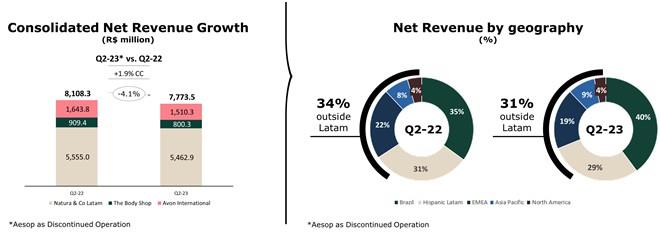
| • | Q2-23 consolidated net revenue of BRL 7.8 billion, +1.9% vs Q2-22 in constant currency (CC) and down -4.1% YoY in BRL. Growth in CC was driven by another strong performance by Natura Latam (+19.5% in CC), partially offset by continued challenges at The Body Shop (-12.5% in CC) and the expected drop in Avon’s Home & Style category in Latam (-36.9% in CC) linked to the Wave 2 preparation in some countries. Avon international’s top-line dynamic remains improving (-1.3% YoY vs. -7.5% YoY last quarter) |
| • | Q2-23 consolidated gross profit stood at BRL 5.1 billion, implying a 65.4% gross margin, up +430 bps vs Q2-22. Margin improved YoY in all business units. The improvement was mainly caused by pricing and mix, which more than offset persistent inflation and FX pressures |
| • | Q2-23 consolidated adjusted EBITDA was BRL 753 million with margin of 9.7% (+230 bps YoY), as strong gross margin improvements and continued strict cost control at TBS and the holding company were partially offset by planned investments at Natura &Co Latam and Avon International |
| • | Q2-23 Net loss of BRL 732 million, broadly in line with last year, as higher adjusted and reported EBITDA were partially offset by higher losses at discontinued operations (particularly impacted by lower margin at Aesop) |
| • | Q2-23 Net Debt (excluding leasing) stood at BRL 10.0 billion (from BRL 9.4 billion in Q1-23). Improving YoY reported EBITDA combined with better operating working capital dynamics across all BUs resulted in lower seasonal cash consumption from a free cash flow to firm dynamic, but higher net financial expenses still impacting free cash flow to equity and consequently, overall net debt figures. In a subsequent event, Natura &Co repaid in August 89.87% of Avon’s 2043 bonds through a cash tender offer for a value of USD 246m. This repayment is an important part of the company’s liability management strategy as it removes certain restrictive covenants and improves the average cost of debt |
| Consolidated Financial Results (Million) | Q2-23 | Q2-22 | Δ | H1-23 | H1-22 | Δ | |
| Net revenue | 7,773.5 | 8,108.3 | -4.1% | 15,093.7 | 15,719.3 | -4.0% | |
| Constant currency change | 1.9% | 2.0% | |||||
| Gross Profit | 5,085.6 | 4,951.4 | 2.7% | 9,911.1 | 9,679.4 | 2.4% | |
| Gross margin | 65.4% | 61.1% | 430 bps | 65.7% | 61.6% | 410 bps | |
| Reported EBITDA | 455.7 | 394.2 | 15.6% | 1,086.6 | 770.2 | 41.1% | |
| Reported EBITDA margin | 5.9% | 4.9% | 100 bps | 7.2% | 4.9% | 230 bps | |
| Adjusted EBITDA | 753.1 | 598.4 | 25.8% | 1,465.1 | 1,054.5 | 38.9% | |
| Adjusted EBITDA margin | 9.7% | 7.4% | 230 bps | 9.7% | 6.7% | 300 bps | |
| Net income (loss) attributable to controlling shareholders | (731.9) | (766.8) | -4.6% | (1,384.3) | (1,409.8) | -1.8% | |
| Net Margin | -9.4% | -9.5% | 10 bps | -9.2% | -9.0% | -20 bps |
Fábio Barbosa, Group CEO of Natura &Co, declared:
“Natura & Co’s second-quarter performance continued to show the improvement already observed in Q1, with low-single digit top line growth at constant currency and a significant improvement in adjusted EBITDA margin. This was mainly driven by gross margin, benefiting from mix effects, partially offset by investments and inflation. Net income was still impacted by high financial expenses, which will be addressed upon closing of the sale of Aesop, expected to occur in Q3-23.
Cash conversion remains our main focus, and this quarter we saw further improvement in operating working capital dynamics, partially offsetting seasonal cash consumption in the quarter. We continue to drive our cash conversion improvement, mainly through working capital and net Capex optimization, among others, and we still see more opportunities to be captured on each one of these fronts, although we might face volatility from quarter to quarter.
Q2 23 was also a landmark quarter for us, as we kicked off Wave 2 in Peru and Colombia, with quite compelling initial results. In both markets, we saw a meaningful acceleration of cross-selling between brands, and more importantly, significant CFT productivity growth, resulting in greater prosperity for our beauty consultants. As we enter H2, our focus turns to the roll out of Wave 2 in Brazil. We are pleased with the initial learnings from Peru and Colombia, and we are confident that they will support us to deliver strong results for our biggest market in the region and those that will follow.
ESG remains in the forefront of our strategy, and I’m pleased to announce that Natura &Co obtained approval from the Science Based Targets initiative (SBTi) for its ambitious plan to reduce absolute scopes 1, 2 and 3 Greenhouse Gas emissions by 42% by 2030 from a 2020 base year. Our target is in line with the 1.5°C trajectory required by the Paris Agreement.
Our results improved in H1 23, but we are still not satisfied with them. We look forward to delivering our strategy, continuing to position Natura &Co on the course towards strong profitability and low leverage, allowing us to pursue meaningful and sustainable growth in the future. Closing the sale of Aesop, implementing Wave 2 in Latam, further work on simplifying and turning around our international assets while delivering our ESG agenda are fundamental steps that will help us achieve our ambition.”
Key Financial Results per Business Unit
| Q2-23 vs. Q2-22 | H1-23 vs. H1-22 | ||||||||||
| Net Revenue (BRL million) | Δ% reported currency | Δ% CC | Adj. EBITDA margin | Δ% Adj. EBITDA | Net Revenue (BRL million) | Δ% reported currency | Δ% CC | Adj. EBITDA margin | Δ% Adj. EBITDA | ||
| Consolidated | 7,773.5 | -4.1% | 1.9% | 9.7% | 230 bps | 15,093.7 | -4.0% | 2.0% | 9.7% | 300 bps | |
| Natura &Co Latam | 5,462.9 | -1.7% | 5.8% | 13.3% | 250 bps | 10,326.6 | 0.2% | 7.3% | 13.2% | 320 bps | |
| Avon International | 1,510.3 | -8.1% | -1.3% | 4.4% | 110 bps | 3,116.9 | -10.6% | -4.5% | 5.3% | 140 bps | |
| The Body Shop | 800.3 | -12.0% | -12.5% | 5.4% | 210 bps | 1,650.2 | -14.4% | -10.9% | 5.8% | 90 bps | |
| • | Natura &Co Latam: Q2-23 net revenue up by +5.8% in CC and -1.7% in BRL, driven by solid double-digit growth in CC at the Natura brand, partially offset by a steep decline in the Home & Style category and mid-single digit decline in CC in the beauty category at the Avon brand |
| • | Natura brand in Latam: Net revenue was up +19.5% in Q2-23 in CC and +17.3% in BRL, with another quarter of solid growth in Brazil and further growth in Hispanic Latam (broadly similar to last quarter). In Brazil, net revenue grew +14.7% in Q2-23, supported by strong campaigns for Mother’s Day and Valentine’s Day. Net revenue in Hispanic Latam was up +30.0% in CC and +7.7% in BRL. Revenues in Peru and Colombia accelerated their growth, mainly driven by the roll-out of Wave 2 in those countries. Excluding Argentina, revenue in Hispanic markets was up in mid-single digits in CC, still impacted by a softer performance in Chile |
| • | Avon brand in Latam (Beauty category only): Net revenue was down -4.0% in CC. In Brazil, net revenue showed a slight decrease (at -1.8%), due to the hit in the distribution channel amid preparations for the roll-out of Wave 2 in the region. In Hispanic markets, net revenue deteriorated by -5.6% in Q2-23 in CC, mainly driven by a decrease in Mexico and Chile. That said, beauty productivity per representative evolved positively again, with significant growth compared to the previous year |
| • | Home & Style category (formerly known as Fashion & Home) showed a steeper decline YoY in CC at -36.9%, as expected, in line with our portfolio optimization strategy. Both regions, Brazil and Hispanic Latam, showed strong CC YoY top-line decrease at -28.5% and -39.9% respectively, amid the Wave 2 roll-out preparations in Brazil and actual roll-out in Peru and Colombia |
| • | Natura &Co Latam’s Q2-23 adjusted EBITDA margin was 13.3% (+250 bps YoY), mainly driven by strong YoY gross margin, partially offset by SG&A investments and deleverage at Avon Hispanic Latam, as expected. The investments are mainly related to Natura’s marketing and R&D expenses amid the roll-out of Wave 2 |
• Avon International
| • | Q2-23 net revenue was broadly stable (-1.3%) YoY in CC and -8.1% in BRL, with growth in TMEA and CEE, driven by discipline in executing our higher pricing strategy and improvements in channel’s dynamics (despite the expected hit in the distribution network of -15% YoY due to ongoing changes in the commercial model). The Beauty category was up +3% YoY, while Home & Style continuing last quarter’s trend, with a steep decline amid the planned portfolio reduction of more than 50% of SKUs |
| • | Q2-23 adjusted EBITDA margin stood at 4.4%, up +110 bps YoY. Gross margin expansion of +460 bps, driven by carry-over of price increases (as in Q1-23) and a positive product mix through improved contribution of innovation and cult products, more than offsetting investment in lead markets and phasing of expenses in this quarter |
• The Body Shop
| • | Q2-23 net revenue was BRL 800 million, down -12.5% in CC and -12.0% in BRL. Combined sales of core business distribution channels (stores, e-commerce and franchise) showed a mid-single-digit decline in CC in Q2-23, slightly worse than in Q1-23, while The Body Shop at Home continues to decline sharply. Retail sales through core business distribution channels showed a sell-out Same Store Sales of -3.5% |
| • | Q2-23 adjusted EBITDA margin reached 5.4%, up +210 bps YoY, despite operating deleverage, driven by slight gross margin expansion and strict cost control (following the trend of previous quarters). The YoY improvement in SG&A (ex depreciation) was mainly driven by rental costs amid the footprint optimization process and employee expenses, following the restructuring announced earlier this year |
1. Results analysis
The Group segmentation
is composed of:
| • | Natura &Co Latam, which includes all the brands in Latin America: Natura, Avon and The Body Shop | |
| • | Avon international, which includes all markets, excluding Latin America, and | |
| • | The Body Shop ex-Latin America |
In addition, the results and analysis for the periods under comparison include the effects of the fair market value
assessment as a result of the business combination with Avon as per the Purchase Price Allocation - PPA
| Profit and Loss by Business | ||||||||||||
| BRL million | Consolidateda | Natura &Co Latamb | Avon International | The Body Shop | ||||||||
| Q2-23c | Q2-22c | Ch. % | Q2-23c | Q2-22c | Ch. % | Q2-23c | Q2-22c | Ch. % | Q2-23 | Q2-22 | Ch. % | |
| Gross revenue | 10,185.8 | 10,604.8 | (4.0) | 7,274.0 | 7,284.4 | (0.1) | 1,795.1 | 2,099.7 | (14.5) | 1,116.6 | 1,220.7 | (8.5) |
| Net revenue | 7,773.5 | 8,108.3 | (4.1) | 5,462.9 | 5,555.0 | (1.7) | 1,510.3 | 1,643.8 | (8.1) | 800.3 | 909.4 | (12.0) |
| COGS | (2,687.9) | (3,156.8) | (14.9) | (1,956.9) | (2,274.0) | (13.9) | (553.6) | (678.2) | (18.4) | (177.5) | (204.6) | (13.2) |
| Gross profit | 5,085.6 | 4,951.4 | 2.7 | 3,506.0 | 3,281.0 | 6.9 | 956.7 | 965.5 | (0.9) | 622.8 | 704.9 | (11.6) |
| Selling, marketing and logistics expenses | (3,497.4) | (3,533.8) | (1.0) | (2,259.5) | (2,167.3) | 4.3 | (701.8) | (762.4) | (7.9) | (536.2) | (604.1) | (11.2) |
| Administrative, R&D, IT and projects expenses | (1,317.3) | (1,303.6) | 1.1 | (757.4) | (756.6) | 0.1 | (346.6) | (315.1) | 10.0 | (213.4) | (232.8) | (8.3) |
| Corporate expenses | (83.6) | (88.7) | (5.7) | - | - | - | - | - | - | - | - | - |
| Other operating income / (expenses), net | (80.2) | 91.3 | (187.8) | (4.5) | 18.7 | (124.0) | (46.4) | 111.1 | (141.8) | (29.2) | (38.5) | (24.1) |
| Transformation / Integration / Group restructuring costs | (239.1) | (281.6) | (15.1) | (98.7) | (99.9) | (1.2) | (138.8) | (25.5) | 443.6 | - | - | - |
| Depreciation | 587.8 | 559.1 | 5.1 | 239.0 | 226.0 | 5.8 | 169.5 | 168.6 | 0.6 | 179.3 | 164.6 | 8.9 |
| EBITDA | 455.7 | 394.2 | 15.6 | 625.0 | 501.8 | 24.6 | (107.4) | 142.2 | (175.5) | 23.3 | (5.8) | (499.2) |
| - | ||||||||||||
| Depreciation | (587.8) | (559.1) | 5.1 | |||||||||
| Financial income / (expenses), net | (402.1) | (430.5) | (6.6) | |||||||||
| Earnings before taxes | (534.2) | (595.4) | (10.3) | |||||||||
| Income tax and social contribution | (98.6) | (128.1) | (23.0) | |||||||||
| Discontinued operationsd | (99.1) | (43.5) | 127.8 | |||||||||
| Consolidated net (loss) income | (731.9) | (767.0) | (4.6) | |||||||||
| Non-controlling interest | 0.1 | 0.2 | (75.7) | |||||||||
| Net income (loss) attributable to controlling shareholders | (731.9) | (766.8) | (4.6) | |||||||||
| Gross margin | 65.4% | 61.1% | 430 bps | 64.2% | 59.1% | 510 bps | 63.3% | 58.7% | 460 bps | 77.8% | 77.5% | 30 bps |
| Selling, marketing and logistics as % net revenue | (45.0)% | (43.6)% | -140 bps | (41.4)% | (39.0)% | -240 bps | (46.5)% | (46.4)% | -10 bps | (67.0)% | (66.4)% | -60 bps |
| Admin., R&D, IT and projects exp. As % net revenue | (16.9)% | (16.1)% | -80 bps | (13.9)% | (13.6)% | -30 bps | (22.9)% | (19.2)% | -370 bps | (26.7)% | (25.6)% | -110 bps |
| EBITDA margin | 5.9% | 4.9% | 100 bps | 11.4% | 9.0% | 240 bps | (7.1)% | 8.6% | -1570 bps | 2.9% | (0.6)% | 350 bps |
| Net margin | (9.4)% | (9.5)% | 10 bps | - | - | - | - | - | - | - | - | - |
| a Consolidated results include Natura &Co Latam, Avon International and The Body Shop, as well as the Natura subsidiaries in the U.S., France and the Netherlands. | ||||||||||||
| b Natura &Co Latam: includes Natura, Avon, TBS Brazil and Hispanic Latam, Aesop Brazil and &Co Pay | ||||||||||||
| c Includes PPA – Purchase Price Allocation effects | ||||||||||||
| d Related to business separation at Avon North America | ||||||||||||
| Profit and Loss by Business | ||||||||||||
| BRL million | Consolidateda | Natura &Co Latamb | Avon International | The Body Shop | ||||||||
| H1-23c | H1-22c | Ch. % | H1-23c | H1-22c | Ch. % | H1-23c | H1-22c | Ch. % | H1-23 | H1-22 | Ch. % | |
| Gross revenue | 19,743.2 | 20,525.8 | (3.8) | 13,719.3 | 13,571.1 | 1.1 | 3,716.1 | 4,307.1 | (13.7) | 2,307.7 | 2,647.4 | (12.8) |
| Net revenue | 15,093.7 | 15,719.3 | (4.0) | 10,326.6 | 10,306.6 | 0.2 | 3,116.9 | 3,485.7 | (10.6) | 1,650.2 | 1,926.8 | (14.4) |
| COGS | (5,182.6) | (6,039.8) | (14.2) | (3,698.7) | (4,189.1) | (11.7) | (1,124.8) | (1,422.8) | (20.9) | (359.2) | (427.7) | (16.0) |
| Gross profit | 9,911.1 | 9,679.4 | 2.4 | 6,627.9 | 6,117.5 | 8.3 | 1,992.1 | 2,062.9 | (3.4) | 1,291.0 | 1,499.1 | (13.9) |
| Selling, marketing and logistics expenses | (6,817.8) | (7,042.8) | (3.2) | (4,263.5) | (4,159.5) | 2.5 | (1,456.6) | (1,610.9) | (9.6) | (1,097.7) | (1,272.2) | (13.7) |
| Administrative, R&D, IT and projects expenses | (2,628.2) | (2,551.6) | 3.0 | (1,472.5) | (1,429.0) | 3.0 | (718.8) | (661.2) | 8.7 | (436.8) | (463.5) | (5.8) |
| Corporate expenses | (153.8) | (198.6) | (22.6) | - | - | - | - | - | - | - | - | - |
| Other operating income / (expenses), net | (91.9) | 111.3 | (182.6) | 29.5 | 55.7 | (47.1) | (45.8) | 111.0 | (141.2) | (75.6) | (46.5) | 62.5 |
| Transformation / Integration / Group restructuring costs | (324.1) | (361.7) | (10.4) | (124.8) | (135.2) | (7.7) | (196.3) | (65.9) | 198.1 | - | - | - |
| Depreciation | 1,191.3 | 1,134.1 | 5.0 | 465.9 | 445.5 | 4.6 | 358.6 | 347.0 | 3.4 | 366.8 | 342.0 | 7.3 |
| EBITDA | 1,086.6 | 770.2 | 41.1 | 1,262.6 | 895.0 | 41.1 | (66.9) | 183.0 | (136.6) | 47.7 | 58.9 | (19.0) |
| Depreciation | (1,191.3) | (1,134.1) | 5.0 | |||||||||
| Financial income / (expenses), net | (878.4) | (791.5) | 11.0 | |||||||||
| Earnings before taxes | (983.1) | (1,155.4) | (14.9) | |||||||||
| Income tax and social contribution | (181.4) | (198.1) | (8.4) | |||||||||
| Discontinued operationsd | (219.6) | (55.5) | 295.7 | |||||||||
| Consolidated net (loss) income | (1,384.1) | (1,409.0) | (1.8) | |||||||||
| Non-controlling interest | (0.2) | (0.7) | (64.2) | |||||||||
| Net income (loss) attributable to controlling shareholders | (1,384.3) | (1,409.8) | (1.8) | |||||||||
| Gross margin | 65.7% | 61.6% | 410 bps | 64.2% | 59.4% | 480 bps | 63.9% | 59.2% | 470 bps | 78.2% | 77.8% | 40 bps |
| Selling, marketing and logistics as % net revenue | (45.2)% | (44.8)% | -40 bps | (41.3)% | (40.4)% | -90 bps | (46.7)% | (46.2)% | -50 bps | (66.5)% | (66.0)% | -50 bps |
| Admin., R&D, IT and projects exp. As % net revenue | (17.4)% | (16.2)% | -120 bps | (14.3)% | (13.9)% | -40 bps | (23.1)% | (19.0)% | -410 bps | (26.5)% | (24.1)% | -240 bps |
| EBITDA margin | 7.2% | 4.9% | 230 bps | 12.2% | 8.7% | 350 bps | (2.1)% | 5.3% | -740 bps | 2.9% | 3.1% | -20 bps |
| Net margin | (9.2)% | (9.0)% | -20 bps | - | - | - | - | - | - | - | - | - |
| a Consolidated results include Natura &Co Latam, Avon International and The Body Shop, as well as the Natura subsidiaries in the U.S., France and the Netherlands. | ||||||||||||
| b Natura &Co Latam: includes Natura, Avon, TBS Brazil and Hispanic Latam, Aesop Brazil and &Co Pay | ||||||||||||
| c Includes PPA – Purchase Price Allocation effects | ||||||||||||
| d Related to business separation at Avon North America | ||||||||||||
Consolidated net revenue
| • | Q2-23 consolidated net revenue was BRL 7,774 million, up +1.9% YoY in constant currency and down -4.1% in BRL, reflecting strong performance at the Natura brand and improvement at Avon international, partially offset by persistent challenges at The Body Shop and to Home & Style category in Latam, as originally expected |
| • | With operations in ~90 countries, 31% of net revenue came from outside Latam |
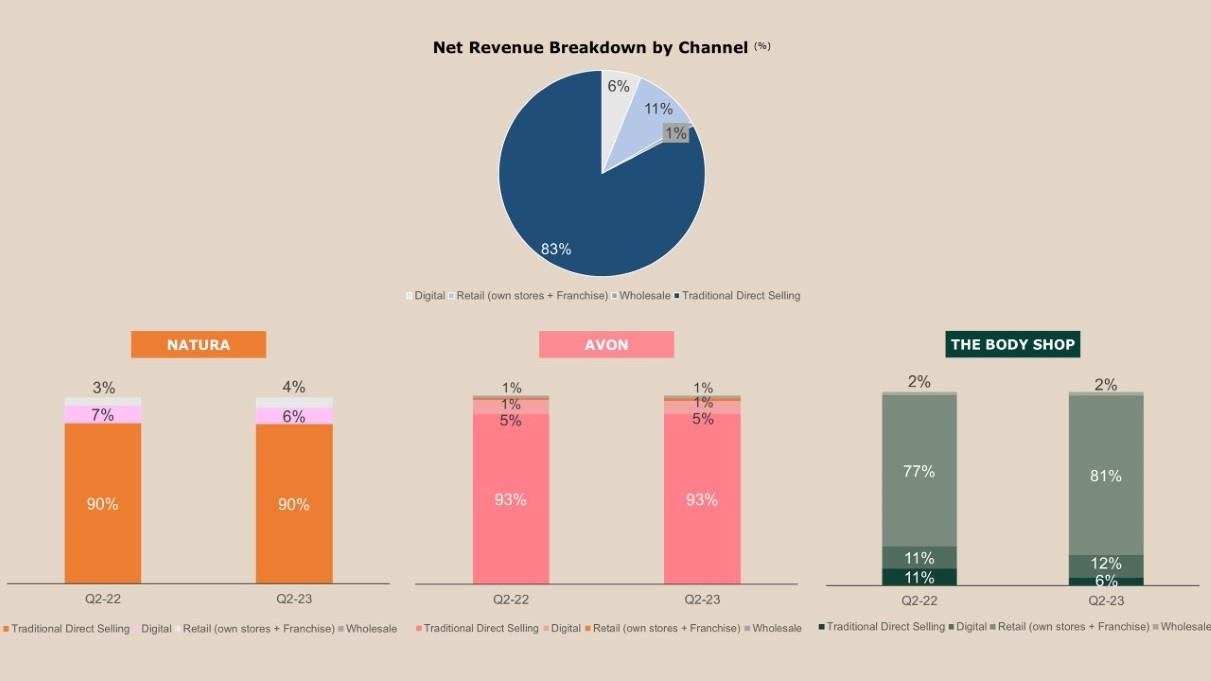
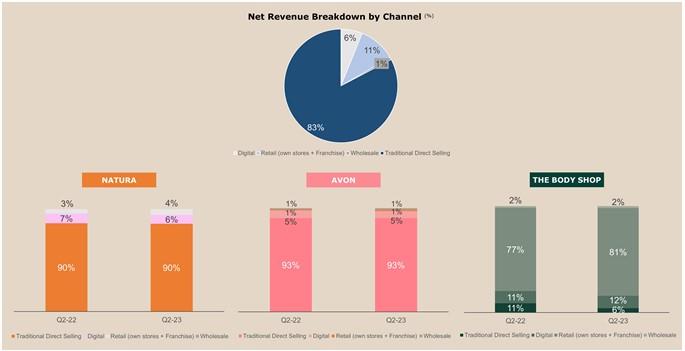
Distribution Channel Breakdown
Digital sales, which include online sales and social selling, showed mixed trends. At the Natura brand, despite a lower discount level in the e-commerce channel, digital sales resumed YoY growth, albeit at a lower pace than consolidated growth, leading to a slight decrease as a percentage of net revenues (~1 p.p.). At Avon, penetration was stable at 1%, while it increased slightly as a percentage of net revenues at The Body Shop due to the big drop in the At Home channel.
Use of digital tools: At Natura Latam, the penetration of digital (consultants who logged in at least once to the digital catalog or the app during the quarter) reached an impressive 82.9% in Q2-23, up 2.3 p.p. YoY. Furthermore, at Avon International, penetration of the Avon On app (active representatives who logged in at least once in the last three campaigns) reached 30.6% in Q2-23, +7.7 p.p. vs the previous year.
Gross margin
| • | Consolidated gross margin stood at 65.4% in Q2-23, +430 bps vs. Q2-22 |
| • | This quarter, all business units showed YoY expansion, benefiting from price increase carry-over and more favorable mix, more than offsetting the persistent inflationary environment and FX pressure |
| • | Q2-23 gross margin YoY expansion of +430 bps was even higher than the one presented in Q1-23 (+370 bps YoY). The main positive surprise came from Natura &Co Latam amid a richer mix of brands and countries (from Natura Brazil’s bigger weight in top line) |
Q2-23 Gross Margin
| BRL million | Consolidated | Natura &Co Latam | Avon International | The Body Shop | ||||||||
| Q2-23 | Q2-22 | Ch. % | Q2-23 | Q2-22 | Ch. % | Q2-23 | Q2-22 | Ch. % | Q2-23 | Q2-22 | Ch. % | |
| Net revenue | 7,773.5 | 8,108.3 | (4.1) | 5,462.9 | 5,555.0 | (1.7) | 1,510.3 | 1,643.8 | (8.1) | 800.3 | 909.4 | (12.0) |
| COGS | (2,687.9) | (3,156.8) | (14.9) | (1,956.9) | (2,274.0) | (13.9) | (553.6) | (678.2) | (18.4) | (177.5) | (204.6) | (13.2) |
| Gross profit | 5,085.6 | 4,951.4 | 2.7 | 3,506.0 | 3,281.0 | 6.9 | 956.7 | 965.5 | (0.9) | 622.8 | 704.9 | (11.6) |
| Gross margin | 65.4% | 61.1% | 430 bps | 64.2% | 59.1% | 510 bps | 63.3% | 58.7% | 460 bps | 77.8% | 77.5% | 30 bps |
H1-23 Gross Margin
| BRL million | Consolidated | Natura &Co Latam | Avon International | The Body Shop | ||||||||
| H1-23 | H1-22 | Ch. % | H1-23 | H1-22 | Ch. % | H1-23 | H1-22 | Ch. % | H1-23 | H1-22 | Ch. % | |
| Net revenue | 15,093.7 | 15,719.3 | (4.0) | 10,326.6 | 10,306.6 | 0.2 | 3,116.9 | 3,485.7 | (10.6) | 1,650.2 | 1,926.8 | (14.4) |
| COGS | (5,182.6) | (6,039.8) | (14.2) | (3,698.7) | (4,189.1) | (11.7) | (1,124.8) | (1,422.8) | (20.9) | (359.2) | (427.7) | (16.0) |
| Gross profit | 9,911.1 | 9,679.4 | 2.4 | 6,627.9 | 6,117.5 | 8.3 | 1,992.1 | 2,062.9 | (3.4) | 1,291.0 | 1,499.1 | (13.9) |
| Gross margin | 65.7% | 61.6% | 410 bps | 64.2% | 59.4% | 480 bps | 63.9% | 59.2% | 470 bps | 78.2% | 77.8% | 40 bps |
Operating Expenses
| • | Consolidated Selling, Marketing & Logistics expenses stood at 45.0% of net revenue (+140 bps vs. Q2-22), while consolidated Administrative, R&D, IT and Project expenses reached 16.9% of net revenue (+80 bps YoY). SG&A expenses (both lines above combined) increased by +220 bps in Q2-23 compared to the same period last year, mainly impacted by depreciation acceleration at The Body Shop, marketing investments at the Natura brand and G&A increase at Avon International (mainly explained by phasing of expenses) |
| • | Corporate expenses stood at BRL 84 million, down -5.7% YoY and -43.7% compared to Q2-21, benefiting from the initiatives implemented since Q2-22 to create a simpler and leaner structure, partially offset by one-off costs |
| • | Other operating income/expenses were BRL -80 million, compared to income of BRL +91 million in Q2-22. The difference is mainly driven by BRL -35 million of impairment at Avon International vs. a BRL 119 million revenue from the favorable settlement of a legal dispute at the same BU |
| • | Transformation/Integration/Group restructuring costs were BRL 239 million, down -15.1% mainly driven by lower group restructuring costs, which more than offset an increase at Avon International to BRL 139 million compared to BRL 26 million in Q2-22 |
Q2-23 Operating Expenses
| BRL million | Consolidated | Natura &Co Latam | Avon International | The Body Shop | ||||||||
| Q2-23 | Q2-22 | Ch. % | Q2-23 | Q2-22 | Ch. % | Q2-23 | Q2-22 | Ch. % | Q2-23 | Q2-22 | Ch. % | |
| Selling, marketing and logistics expenses | (3,497.4) | (3,533.8) | (1.0) | (2,259.5) | (2,167.3) | 4.3 | (701.8) | (762.4) | (7.9) | (536.2) | (604.1) | (11.2) |
| Administrative, R&D, IT and project expenses | (1,317.3) | (1,303.6) | 1.1 | (757.4) | (756.6) | 0.1 | (346.6) | (315.1) | 10.0 | (213.4) | (232.8) | (8.3) |
| Corporate expenses | (83.6) | (88.7) | (5.7) | - | - | - | ||||||
| Other operating income / (expenses), net | (80.2) | 91.3 | (187.8) | (4.5) | 18.7 | (124.0) | (46.4) | 111.1 | (141.8) | (29.2) | (38.5) | (24.1) |
| Transformation / integration / group reestructuring costs | (239.1) | (281.6) | (15.1) | (98.7) | (99.9) | (1.2) | (138.8) | (25.5) | 443.6 | - | - | - |
| Operating expenses | (5,217.6) | (5,116.4) | 2.0 | (3,120.1) | (3,005.2) | 3.8 | (1,233.6) | (991.9) | 24.4 | (778.8) | (875.3) | (11.0) |
| Selling, marketing and logistics expenses (% NR) | (45.0)% | (43.6)% | -140 bps | (41.4)% | (39.0)% | -240 bps | (46.5)% | (46.4)% | -10 bps | (67.0)% | (66.4)% | -60 bps |
| Administrative, R&D, IT and project expenses (% NR) | (16.9)% | (16.1)% | -80 bps | (13.9)% | (13.6)% | -30 bps | (22.9)% | (19.2)% | -370 bps | (26.7)% | (25.6)% | -110 bps |
| Corporate expenses (% NR) | (1.1)% | (1.1)% | 0 bps | |||||||||
| Other operating income / (expenses), net (% NR) | (1.0)% | 1.1% | -210 bps | (0.1)% | 0.3% | -40 bps | (3.1)% | 6.8% | -990 bps | (3.6)% | (4.2)% | 60 bps |
| Transformation/integration/group reestructuring costs (% NR) | (3.1)% | (3.5)% | 40 bps | (1.8)% | (1.8)% | 0 bps | (9.2)% | (1.6)% | -760 bps | 0.0% | 0.0% | 0 bps |
| Operating expenses (% NR) | (67.1)% | (63.1)% | -400 bps | (57.1)% | (54.1)% | -300 bps | (81.7)% | (60.3)% | -2140 bps | (97.3)% | (96.2)% | -110 bps |
H1-23 Operating Expenses
| BRL million | Consolidated | Natura &Co Latam | Avon International | The Body Shop | ||||||||
| H1-23 | H1-22 | Ch. % | H1-23 | H1-22 | Ch. % | H1-23 | H1-22 | Ch. % | H1-23 | H1-22 | Ch. % | |
| Selling, marketing and logistics expenses | (6,817.8) | (7,042.8) | (3.2) | (4,263.5) | (4,159.5) | 2.5 | (1,456.6) | (1,610.9) | (9.6) | (1,097.7) | (1,272.2) | (13.7) |
| Administrative, R&D, IT and project expenses | (2,628.2) | (2,551.6) | 3.0 | (1,472.5) | (1,429.0) | 3.0 | (718.8) | (661.2) | 8.7 | (436.8) | (463.5) | (5.8) |
| Corporate expenses | (153.8) | (198.6) | (22.6) | - | - | - | ||||||
| Other operating income / (expenses), net | (91.9) | 111.3 | (182.6) | 29.5 | 55.7 | (47.1) | (45.8) | 111.0 | (141.2) | (75.6) | (46.5) | 62.5 |
| Transformation / integration / group reestructuring costs | (324.1) | (361.7) | (10.4) | (124.8) | (135.2) | (7.7) | (196.3) | (65.9) | 198.1 | - | - | - |
| Operating expenses | (10,015.7) | (10,043.4) | (0.3) | (5,831.3) | (5,668.0) | 2.9 | (2,417.5) | (2,226.9) | 8.6 | (1,610.1) | (1,782.2) | (9.7) |
| Selling, marketing and logistics expenses (% NR) | (45.2)% | (44.8)% | -40 bps | (41.3)% | (40.4)% | -90 bps | (46.7)% | (46.2)% | -50 bps | (66.5)% | (66.0)% | -50 bps |
| Administrative, R&D, IT and project expenses (% NR) | (17.4)% | (16.2)% | -120 bps | (14.3)% | (13.9)% | -40 bps | (23.1)% | (19.0)% | -410 bps | (26.5)% | (24.1)% | -240 bps |
| Corporate expenses (% NR) | (1.0)% | (1.3)% | 30 bps | |||||||||
| Other operating income / (expenses), net (% NR) | (0.6)% | 0.7% | -130 bps | 0.3% | 0.5% | -20 bps | (1.5)% | 3.2% | -470 bps | (4.6)% | (2.4)% | -220 bps |
| Transformation/integration/group reestructuring costs (% NR) | (2.1)% | (2.3)% | 20 bps | (1.2)% | (1.3)% | 10 bps | (6.3)% | (1.9)% | -440 bps | 0.0% | 0.0% | 0 bps |
| Operating expenses (% NR) | (66.4)% | (63.9)% | -250 bps | (56.5)% | (55.0)% | -150 bps | (77.6)% | (63.9)% | -1370 bps | (97.6)% | (92.5)% | -510 bps |
Consolidated EBITDA
Q2-23 Adjusted EBITDA was BRL 753 million, with an adjusted margin of 9.7% (+230 bps YoY). Q2-23 margin reflected:
| • | Strong Natura & Co Latam margin expansion (+250 bps YoY), mainly driven by higher gross margin, partially offset by Natura investments and operating deleverage at Avon Hispanic Latam |
| • | A profitability improvement at The Body Shop of +210 bps compared to same period last year, driven by the slight gross margin expansion and SG&A (ex-depreciation) efficiencies from lower rental costs amid the footprint optimization process, as well as lower employee expenses |
| • | Margin improvement of +110 bps at Avon international vs. Q2-22, also driven by gross margin expansion, partially offset by investment in lead markets and phasing of expenses |
Q2-23: Adjusted EBITDA
| BRL million | Consolidated | Natura &Co Latam | Avon International | The Body Shop | ||||||||
| Q2-23 | Q2-22 | Ch. % | Q2-23 | Q2-22 | Ch. % | Q2-23 | Q2-22 | Ch. % | Q2-23 | Q2-22 | Ch. % | |
| Consolidated EBITDA | 455.7 | 394.2 | 15.6 | 625.0 | 501.8 | 24.6 | (107.4) | 142.2 | (175.5) | 23.3 | (5.8) | (499.2) |
| Transformation/Integration/Group reestructuring costs | 239.1 | 281.6 | (15.1) | 98.7 | 99.9 | (1.2) | 138.8 | 25.5 | 443.6 | - | - | - |
| Restructuring costs - business unit | 20.1 | - | - | - | - | - | - | - | - | 20.1 | - | - |
| Net non-recurring other (income) / expenses 1 | 38.2 | (77.4) | (149.4) | 3.3 | - | - | 34.9 | (113.7) | (130.7) | - | 36.3 | - |
| Adjusted EBITDA | 753.1 | 598.4 | 25.8 | 727.0 | 601.7 | 20.8 | 66.3 | 54.1 | 22.7 | 43.4 | 30.5 | 42.5 |
| Adjusted EBITDA margin % | 9.7% | 7.4% | 230 bps | 13.3% | 10.8% | 250 bps | 4.4% | 3.3% | 110 bps | 5.4% | 3.3% | 210 bps |
H1-23: Adjusted EBITDA
| BRL million | Consolidated | Natura &Co Latam | Avon International | The Body Shop | ||||||||
| H1-23 | H1-22 | Ch. % | H1-23 | H1-22 | Ch. % | H1-23 | H1-22 | Ch. % | H1-23 | H1-22 | Ch. % | |
| Consolidated EBITDA | 1,086.6 | 770.2 | 41.1 | 1,262.6 | 895.0 | 41.1 | (66.9) | 183.0 | (136.6) | 47.7 | 58.9 | (19.0) |
| Transformation/Integration/Group reestructuring costs | 324.1 | 361.7 | (10.4) | 124.8 | 135.2 | (7.7) | 196.3 | 65.9 | 198.1 | - | - | - |
| Restructuring costs - business unit | 47.4 | - | - | - | - | - | - | - | - | 47.4 | - | - |
| Net non-recurring other (income) / expenses 1 | 7.1 | (77.5) | (109.2) | (27.9) | - | - | 34.9 | (113.7) | (130.7) | - | 36.3 | - |
| Adjusted EBITDA | 1,465.1 | 1,054.5 | 38.9 | 1,359.5 | 1,030.2 | 32.0 | 164.3 | 135.2 | 21.5 | 95.1 | 95.2 | (0.1) |
| Adjusted EBITDA margin % | 9.7% | 6.7% | 300 bps | 13.2% | 10.0% | 320 bps | 5.3% | 3.9% | 140 bps | 5.8% | 4.9% | 90 bps |
(1) Net non-recurring other (income)/expenses: Latam and Avon international impairment in Q2-23, while Q2-22 reflected costs associated with The Body Shop’s suspension of operations in Russia and a favorable legal settlement at Avon International
Financial income and expenses
| BRL million | Q2-23 | Q2-22 | Ch. % | H1-23 | H1-22 | Ch. % |
| 1. Financing, short-term investments and derivatives gains (losses) | (190.3) | (174.9) | 8.8 | (469.7) | (331.7) | 41.6 |
| 1.1 Financial expenses | (243.0) | (186.9) | 30.0 | (484.6) | (326.9) | 48.2 |
| 1.2 Financial income | 192.5 | 92.8 | 107.4 | 383.2 | 179.0 | 114.1 |
| 1.3 Foreign exchange variations from financing activities, net | 258.8 | (496.7) | (152.1) | 396.1 | 375.2 | 5.6 |
| 1.4 Gain (losses) on foreing exchange derivatives from financing activities, net | (269.7) | 511.1 | (152.8) | (417.1) | (364.8) | 14.3 |
| 1.5 Gain (losses) on interest rate derivatives and other operating derivatives, net | (128.9) | (95.2) | 35.4 | (347.3) | (194.2) | 78.8 |
| 2. Judicial contigencies | (21.3) | (12.4) | 71.4 | (37.2) | (23.5) | 58.1 |
| 3. Other financial income and (expenses) | (190.5) | (243.2) | (21.7) | (371.5) | (435.9) | (14.8) |
| 3.1 Lease expenses | (32.8) | (40.3) | (18.6) | (79.5) | (81.2) | (2.1) |
| 3.2 Other | (117.4) | (127.1) | (7.6) | (197.9) | (193.4) | 2.3 |
| 3.3 Other gains (losses) from exchange rate variation | (18.3) | (24.5) | (25.3) | (30.9) | (90.5) | (65.9) |
| 3.4 Hyperinflation gains (losses) | (22.0) | (51.3) | (57.1) | (63.2) | (70.8) | (10.7) |
| Financial income and expenses, net | (402.1) | (430.5) | (6.6) | (878.4) | (791.1) | 11.0 |
The above table details the main changes in our financial income and expenses.
Net financial expenses were BRL -402 million in Q2-23, -6.6% vs. Q2-22 (or down BRL -28 million on a YoY basis), due mainly to the following effects:
| • | Item 1.1. - Higher financial expenses due to higher gross debt and higher interest rates |
| • | Item 1.5 – in Q2-23 expenses were BRL -129 million vs. BRL -95 million in Q2-23. The increase in expenses is related to a higher CDI rate, which led to losses on derivatives related to the interest rate hedge on debts, mainly on the 2028 Sustainability-Linked bond and the Certificates backed by real estate receivables (CRI) |
| • | This was partially offset by Item 1.2, in Q2-23 financial income was BRL +193 million, improving by BRL +100 million compared to the same period last year, given higher interest rates |
Underlying net income (UNI) and net income
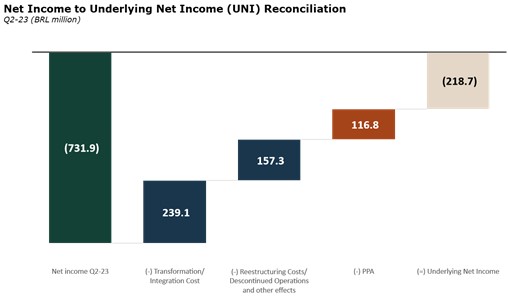 | Q2-23 reported net loss was BRL -732 million, compared to a net loss of BRL -767 million in Q2-22, as higher adjusted and reported EBITDA was partially offset by higher losses at discontinued operations (particularly impacted by lower margin at Aesop) | |
| Q2-23 Underlying Net Income, which is net income excluding transformation costs, restructuring costs, discontinued operations and PPA effects, was a loss of BRL -219 million. This compares to a loss of BRL -262 million in Q2-22. |
Free cash flow and cash position
| R$ million | Q2-23 | Q2-22 | Ch. % | H1-23 | H1-22 | Ch. % |
| Net income (loss) | (731.9) | (767.0) | (4.6) | (1,384.1) | (1,409.1) | (1.8) |
| Depreciation and amortization | 587.8 | 562.0 | 4.6 | 1,191.3 | 1,137.4 | 4.7 |
| Non-cash adjustments to net income | 754.7 | 905.6 | (16.7) | 1,612.1 | 1,526.1 | 5.6 |
| Adjusted net income | 610.7 | 700.6 | (12.8) | 1,419.4 | 1,254.4 | 13.2 |
| Decrease / (increase) in working capital | (275.0) | (419.6) | (34.5) | (1,987.6) | (1,831.1) | 8.5 |
| Inventories | (14.7) | (239.5) | (93.8) | (498.0) | (153.4) | 224.7 |
| Accounts receivable | (300.1) | (481.6) | (37.7) | (495.4) | (192.1) | 157.9 |
| Accounts payable | 197.5 | 47.6 | 315.3 | (412.4) | (903.0) | (54.3) |
| Other assets and liabilities | (157.7) | 253.9 | (162.1) | (581.7) | (582.7) | (0.2) |
| Income tax and social contribution | (99.6) | (187.2) | (46.8) | (229.6) | (254.0) | (9.6) |
| Interest on debt and derivative settlement | (662.4) | (420.8) | 57.4 | (953.0) | (619.4) | 53.9 |
| Lease payments | (263.1) | (235.3) | 11.8 | (476.1) | (513.0) | (7.2) |
| Other operating activities | (2.7) | (15.8) | (83.0) | (6.8) | (40.4) | (83.1) |
| Cash from continuing operations | (692.1) | (578.2) | 19.7 | (2,233.7) | (2,003.5) | 11.5 |
| Capex | (256.8) | (170.3) | 50.9 | (515.1) | (449.8) | 14.5 |
| Sale of assets | 12.6 | 3.1 | 304.8 | 14.0 | 3.7 | 277.0 |
| Exchange rate variation on cash balance | (28.7) | 134.4 | (121.4) | (42.8) | (301.3) | (85.8) |
| Free cash flow - continuing operations | (965.1) | (610.9) | 58.0 | (2,777.6) | (2,750.8) | 1.0 |
| Other financing and investing activities | 1,020.5 | 591.8 | 72.4 | 1,202.1 | 1,833.4 | (34.4) |
| Operating activities - discontinued operations | 121.3 | 112.6 | 7.8 | (115.9) | 118.7 | (197.6) |
| Payment of lease - principal - discontinued operations | (61.5) | (44.9) | 37.0 | (121.2) | (91.5) | 32.6 |
| Capex - discontinued operations | (64.7) | (43.3) | 49.5 | (108.1) | (73.3) | 47.4 |
| Cash balance variations | 50.6 | 5.3 | 853.5 | (1,920.7) | (963.4) | 99.4 |
In Q2-23, free cash flow from continuing operations was an outflow of BRL -965 million compared to an outflow of BRL -611 million in the previous year. The YoY deterioration of BRL -354 million is mainly related to high leverage and interest rates, which lead to interest on debt and derivative settlement increase of BRL -242 million and FX headwinds (which represented an outflow of BRL -29 million vs. BRL +134 million in the same period last year). On top of that, Q2-22 benefited from a positive one-off of BRL +136 million related to a legal dispute at Avon international. Excluding the one-off in Q2 last year, free cash flow to firm would have represented an outflow of BRL -303 million from BRL -326 million in Q2-22, mainly driven by:
| • | Improving operating working capital, with inventories and accounts receivable consuming less cash compared to the same period last year and accounts payable releasing more cash vs. Q2-22. Operating working capital improved at all BUs, even with solid growth of the Natura brand, and consumed BRL -117 million compared to BRL -674 million same period last year |
| • | These effects were partially offset by the other assets and liabilities line (BRL -158 million in Q2-23 from BRL +254 million in Q2-22) mainly due to further investments in transformation and restructuring plans |
| • | In addition, Capex cash consumption increased BRL 87 million YoY giving phasing between quarters |
Indebtedness ratios at both Natura &Co Holding and Natura Cosméticos
| R$ million | Natura Cosméticos S.A. | Natura &Co Holding S.A. | ||
| Q2-23 | Q2-22 | Q2-23 | Q2-22 | |
| Short-Term | 211.6 | 1,045.9 | 362.7 | 726.0 |
| Long-Term | 7,113.0 | 6,994.7 | 12,798.3 | 11,992.8 |
| Gross Debt a | 7,324.6 | 8,040.6 | 13,161.0 | 12,718.9 |
| Foreign currency hedging (Swaps)b | 508.5 | 75.5 | 553.8 | 54.8 |
| Total Gross Debt | 7,833.1 | 8,116.1 | 13,714.8 | 12,773.7 |
| (-) Cash, Cash Equivalents and Short-Term Investmentc | (2,120.8) | (3,041.6) | (3,455.5) | (4,275.0) |
| (-) Aesop Cash, Cash Equivalents and Short-Term Investmentc | (226.9) | - | (226.9) | - |
| (=) Net Debt | 5,485.4 | 5,074.5 | 10,032.5 | 8,498.7 |
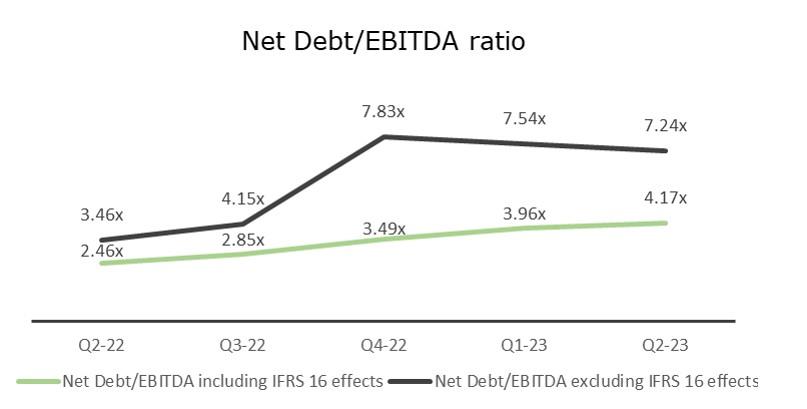
| Indebtedness ratio excluding IFRS 16 effects | ||||
| Net Debt/EBITDA | 2.19x | 1.83x | 7.24x | 3.46x |
| Total Debt/EBITDA | 3.13x | 2.93x | 9.90x | 5.20x |
| Indebtedness ratio including IFRS 16 effects | ||||
| Net Debt/EBITDA | 1.68x | 1.43x | 4.17x | 2.46x |
| Total Debt/EBITDA | 2.41x | 2.28x | 5.71x | 3.69x |
| a Gross debt excludes PPA impacts of R$227.8 million in Q2-23 and R$320.6 million in Q2-22, and exclude lease agreements | ||||
| b Foreign currency debt hedging instruments, excluding mark-to-market effects | ||||
| c Short-Term Investments excludes non current balances and Aesop figures marked as assets available for sale | ||||
The graph below shows the indebtedness trajectory on a quarterly basis since Q2-22.
Liability management
In Q2-23, Natura &Co Luxembourg Holdings (Natura Lux) drew down an additional USD 135 million loan under its committed revolving credit facility with maturity in October 2024, to support its operational cash needs.
In a subsequent event, Natura &Co Luxembourg Holdings (Natura Lux) drew down an additional USD 290 million loan under its committed revolving credit facility with maturity in October 2024. The majority of the proceeds were used to support the repayment of Avon’s 2043 bonds through a tender offer for a value of USD 246m. This repayment is an important part of the company’s liability management as it removes certain restrictive covenants and will streamline internal process, which are expected to deliver efficiency and cost savings.
2. Performance by segment
NATURA &Co LATAM
| Natura &Co Latam | Net revenue change (%) | Operational KPIs changea(%) | ||||
| Q2-23 vs. Q2-22 | Q2-23 vs. Q2-22 | |||||
| CFT Natura | CFT Avon | Home & Style | Natura | Avon | ||
| Δ% CC | Δ% CC | Δ% CC | Δ% | Δ% | ||
| Brazil | 14.7% | -1.8% | -28.5% | 1.9% | -5.5% | |
| Hispanic | 30.0% | -5.6% | -39.9% | -7.9% | -23.1% | |
| Total | 19.5% | -4.0% | -36.9% | -1.7% | -13.6% | |
| a Considers the Average Available Consultants/Representatives in the quarter and excluding Peru and Colombia | ||||||
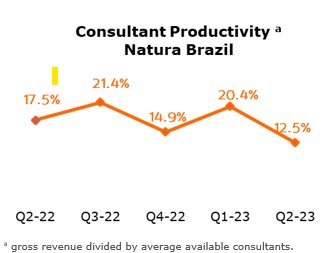
NATURA BRAND IN LATAM
Natura brand in Brazil
| • | Natura Brazil’s revenues were up 14.7% YoY on the back of a much tougher comparable base (Q1-22 was up +3.1% while Q2-22 was up +14.3%), supported by strong campaigns for Mother’s Day and Valentine’s Day. Top line benefited from price increases (as in Q1), combined with a better mix |
| • | Consultant productivity was up +12.5% vs Q2-22. At the same time, the average available consultant base showed a slight increase compared to last quarter (+1.3%) and YoY (+1.9%), at 1.15 million in Q2-23 |
| • | Retail sales (own and franchise stores) showed a solid performance, driven by very strong same-store sales and accelerating store openings. The number of own stores reached 96 in the quarter (+23 vs Q2-22), while franchise stores increased to 688 (+107) |
| • | Digital (including social selling) showed an inflection point and returned to positive territory with +3.9% YoY growth. E-commerce resumed growth even with the continued lower level of discounts and significant price rationalization of the distribution channel (as already mentioned in previous quarters), which is an important lever of the omnichannel strategy in the region and also improves the channel’s profitability |
Natura brand in Hispanic Latam
- Even amid political and economic turmoil, particularly in Argentina and Chile, Natura Hispanic Latam delivered +30.0% revenue growth in CC (+7.7% in BRL). Excluding Argentina, revenue in Hispanic markets was again up in mid-single digits in CC
- As in the previous quarter, Chile showed a slight revenue decrease YoY given macro headwinds, while Mexico decelerated. Revenues in Peru and Colombia accelerated their growth, mainly driven by the roll-out of Wave 2 in those countries
- The average available consultant base reached 1.1 million in Q2-23, down -7.9% YoY mainly driven by commercial model adjustments in Mexico. Including beauty consultants (Avon and Natura) in Peru and Colombia in the base, the distribution channel would have shown a steeper decrease amid the roll-out of Wave 2 in those regions, as expected. Next quarter, distribution channel KPIs will only be disclosed on a consolidated basis (Avon and Natura combined) given the roll-out in Brazil
AVON BRAND IN LATAM (BEAUTY CATEGORY ONLY)
Avon brand in Brazil
- Revenues were -1.8%, mainly driven by the roll-out preparation of Wave 2 in Brazil, including further portfolio optimization and an increase in Avon’s minimum order (among other adjustments) with an expected and temporary effect on our distribution channel (-5.5% YoY vs. the stability in previous quarters)
- At the same time, CFT representative productivity supports the good performance, in line with our strategy to focus on more productive reps and consequently adjust the brand’s profitability profile
Avon brand in Hispanic Latam
- The total number of available representatives decreased -8.8% QoQ and -23.1% YoY[1], as expected amid the roll out of Wave 1 and preparations for the roll-out of Wave 2 in some countries. As mentioned last quarter, in preparation for this roll-out, adjustments to commercial incentives and Avon’s minimum order ticket increases (among others) were made in several regions to move towards the integration, which also impacts the number of representatives
- As a result, Avon Latam’s revenue was down -5.6% in CC (-20.3% excluding Argentina), mainly driven by a decrease in Mexico (undergoing adjustments to Avon’s commercial model) and Chile. This performance is in line with expectations, as mentioned last quarter, amid political volatility in the region and the above-mentioned decrease in the distribution channel
- Beauty productivity evolved positively once again, with significant growth compared to the previous year, boosted by Mexico, Chile and CARD, along with price inflation in Argentina
HOME & STYLE IN LATAM
- The Home & Style category (which was previously called Fashion & Home) showed a steeper decline at -36.9% vs. Q2-22 in CC, given the preparations for the roll-out of Wave 2 and the actual roll-out in Peru and Colombia. In the Hispanic market, the decrease in CC was -39.9% vs. the same period last year, while in Brazil the decrease was -28.5% YoY
NATURA &Co LATAM
- Revenue was up +5.8% in CC, and -1.7% in BRL, driven by strong growth at the Natura brand, which was still partially offset by the Home & Style category and to a lesser extent by Avon in Hispanic Latam
- Gross margin was 64.2%, up a solid +510 bps YoY, benefiting from price increases (as in the previous quarter), richer mix (brand and countries) and marketing efforts
- Another important driver of improved gross margin was Avon Brazil, benefiting from further price increases during the quarter and better mix
- Adjusted EBITDA margin was 13.3% (+250 bps YoY), mainly driven by strong YoY gross margin, partially offset by SG&A investments and deleverage at Avon Hispanic Latam, as expected. The investments are mainly related to Natura’s marketing and R&D expenses amid the roll-out of Wave 2
- As the elections in Argentina near, concerns about the country’s macro-outlook are arising from investors. To punctually assist investors amid this volatile environment, the adjusted EBITDA margin excluding Argentina would be 13.0%
- Natura & Avon integration costs were BRL 99 million, of which ~53% severance costs and ~17% IT investments, with the remainder being opex investments to integrate logistics, industry etc.
- Wave 2 – As planned, the acceleration of integration of the Natura and Avon brands occurred in Peru and Colombia, and the roll-out in Brazil was confirmed, in line with the initial schedule. At this stage, we still see an improvement in cross-sell activity, an acceleration in CFT productivity (consolidating the Natura and Avon brands) in both regions and thus, an improvement in beauty consultants’ prosperity as a consequence of a more compelling portfolio offer, featuring the best of each brand. The integration also enables minimum order increases for Avon, but with an expected hit in the distribution channel, particularly among less productive beauty consultants (as already mentioned). We continue to simplify our cost structure to raise profitability in the region
- Initial underlying results and further information about this process will be released in our previously-announced conference call on August 16th at 09h am BRT, which can be accessed through the following link
- &Co Pay at Natura posted continued growth in Q2-23, reaching almost 640,000 accounts, with +10% productivity and -30% default among heavy user consultants (~10 transactions/month). 100% of owned stores and 70% of franchises use &Co Pay solutions. In YTD 2023, we reached BRL 17.7 billion of TPV, with +2.4x growth YoY, capturing and processing 100% of transactions from direct selling and e-commerce in Brazil. The Argentina operation started in Q1-23, supporting the e-commerce channel
| Natura &Co Latam (BRL million) | P&L | ||
| Q2-23 | Q2-22 | Ch. % | |
| Gross revenue | 7,274.0 | 7,284.4 | (0.1) |
| Net revenue | 5,462.9 | 5,555.0 | (1.7) |
| Constant currency | 5.8 | ||
| COGS | (1,956.9) | (2,274.0) | (13.9) |
| Gross profit | 3,506.0 | 3,281.0 | 6.9 |
| Gross margin | 64.2% | 59.1% | 510 bps |
| Selling, marketing and logistics expenses | (2,259.5) | (2,167.3) | 4.3 |
| Adminsitrative, R&D, IT and projects expenses | (757.4) | (756.6) | 0.1 |
| Other operating income / (expenses), net | (4.5) | 18.7 | (124.0) |
| Transformation / integration costs | (98.7) | (99.9) | (1.2) |
| Depreciation | 239.0 | 226.0 | 5.8 |
| EBITDA | 625.0 | 501.8 | 24.6 |
| EBITDA margin | 11.4% | 9.0% | 240 bps |
| Integration costs | 98.7 | 99.9 | (1.2) |
| Net non-recurring other (income)/ expenses | 3.3 | 0.0 | - |
| Adjusted EBITDA | 727.0 | 601.7 | 20.8 |
| Adjusted EBITDA margin | 13.3% | 10.8% | 250 bps |
AVON INTERNATIONAL
| • | Avon International posted broadly stable top line, with growth in TMEA and CEE, combined with improving profitability, driven by discipline in executing our higher pricing strategy and improvements in channel dynamics. Cash conversion was also a highlight, with continuous working capital improvements |
Operational KPIs change (%) | |
Q2-23 vs. Q2-22 | |
| Representatives | |
| Avon International | -15.0% |
| Avon International (BRL million) | P&L | ||
| Q2-23 | Q2-22 | Ch. % | |
| Gross revenue | 1,795.1 | 2,099.7 | (14.5) |
| Net revenue | 1,510.3 | 1,643.8 | (8.1) |
| Constant currency | (1.3) | ||
| COGS | (553.6) | (678.2) | (18.4) |
| Gross profit | 956.7 | 965.5 | (0.9) |
| Gross margin | 63.3% | 58.7% | 460 bps |
| Selling, marketing and logistics expenses | (701.8) | (762.4) | (7.9) |
| Administrative, R&D, IT and project expenses | (346.6) | (315.1) | 10.0 |
| Other operating income / (expenses), net | (46.4) | 111.1 | (141.8) |
| Transformation / integration costs | (138.8) | (25.5) | 443.6 |
| Depreciation | 169.5 | 168.6 | 0.6 |
| EBITDA | (107.4) | 142.2 | (175.5) |
| EBITDA margin | -7.1% | 8.6% | -1570 bps |
| Transformation costs | 138.8 | 25.5 | 443.6 |
| Net non-recurring other (income)/ expenses | 34.9 | (113.7) | (130.7) |
| Adjusted EBITDA | 66.3 | 54.1 | 22.7 |
| Adjusted EBITDA margin | 4.4% | 3.3% | 110 bps |
| • | Net revenue stood at BRL 1,510 million, down -1.3% YoY in constant currency (or -8.1% in BRL). This is the first quarter in which the comparable base is fully impacted by the war in Ukraine, and thus, from this quarter onwards, this adjustment will no longer be made |
| • | As expected, the number of representatives was still down 15% as a consequence of further commercial model adjustments (particularly a focus on leaders’ incentives and structure) and footprint optimization |
| • | Despite the hit in the distribution channel, the Beauty category was still up +3% YoY, while Home & Style continuing last quarter’s trend, with a steep decline amid the planned portfolio reduction of more than 50% of SKUs |
| • | The Beauty category’s growth benefitted from fragrance and color outperformance, demonstrating the impact of our long-term strategic direction of fewer, but bigger and better innovations |
| • | Digitalization is still showing good progress and the use of digital tools reached 30.6% (see digital section – page 4) and other KPIs such as units per Rep and activity rate are also improving. Digital sales penetration increased by 1.3 ppt YoY to 6.5% of total revenue |
| • | Gross margin was 63.3%, up +460 bps YoY, driven by carry-over of price increases (as in Q1) and a positive product mix through improved contribution of innovation and cult products |
| • | Adjusted EBITDA margin was 4.4%, up +110 bps YoY. Continuing last quarter’s trend, gross margin expansion was partially offset by investment in lead markets and phasing of expenses |
| • | Transformation costs this quarter were BRL 138.8 million, of which ~40% primarily related to severance costs linked to the execution of the operating model transformation, ~20% related to R&D transformation, and the remainder related to size-of-line reduction |
THE BODY SHOP
Since Ian Bickley’s arrival as CEO, the business is fundamentally reassessing every aspect of its business, including:
| Operational KPIs | |||||
| Q2-23 | Q1-23 | Q2-22 | Change vs. Q1-23 | Change vs. Q2-22 | |
| The Body Shop (total) | 2,368 | 2,390 | 2,455 | (22) | (87) |
| Own stores | 937 | 945 | 989 | (8) | (52) |
| Franchise stores | 1,431 | 1,445 | 1,466 | (14) | (35) |
· The distribution channel rebalance to meet beauty consumers where they like to shop including digital channels and wholesale, while better leveraging the competitive advantage of The Body Shop retail network
· Stronger optimization of the product portfolio to drive growth in Skincare while defending the leadership position in Bath & Body, and dominance as an all year-round gifting resource
· Reinvigorate the brand to establish a clear point of differentiation; refocus marketing efforts to fuel brand heat, driving a Social-First strategy augmented by digital and CRM, with focused investment in our Tier 1 markets like the UK; and creating a more streamlined and agile data-driven operating model to speed decision making and drive for results
| The Body Shop (BRL million) | P&L | ||
| Q2-23 | Q2-22 | Ch. % | |
| Gross revenue | 1,116.6 | 1,220.7 | (8.5) |
| Net revenue | 800.3 | 909.4 | (12.0) |
| Constant currency | (12.5) | ||
| COGS | (177.5) | (204.6) | (13.2) |
| Gross profit | 622.8 | 704.9 | (11.6) |
| Gross margin | 77.8% | 77.5% | 30 bps |
| Selling, marketing and logistics expenses | (536.2) | (604.1) | (11.2) |
| Administrative, R&D, IT and project expenses | (213.4) | (232.8) | (8.3) |
| Other operating income / (expenses), net | (29.2) | (38.5) | (24.1) |
| Depreciation | 179.3 | 164.6 | 8.9 |
| EBITDA | 23.3 | (5.8) | (499.2) |
| EBITDA margin | 2.9% | -0.6% | 350 bps |
| Restructuring costs - business unit | 20.1 | 36.3 | (44.6) |
| Adjusted EBITDA | 43.4 | 30.5 | 42.5 |
| Adjusted EBITDA margin | 5.4% | 3.3% | 210 bps |
| · | Q2-23 net revenue was BRL 800 million, down -12.5% in CC and -12.0% in BRL. Combined sales of core business distribution channels (stores, e-commerce and franchise) showed a mid-single digit decline in CC in Q2-23, slightly worse than in Q1-23, while The Body Shop at Home continued to decline sharply as the channel remains weak |
| · | Retail sales through core business distribution channels showed sell-out Same Store Sales (including own stores, e-commerce and franchise) of -3.5% |
| · | Franchise sell-in was weak in the quarter, still impacted by inventory levels, but slightly better sales sell-out led to a better inventory level YoY (albeit still above 2019 in some regions, particularly APAC) |
| • | Gross margin showed slight YoY improvement again in Q2-23, expanding by +30 bps YoY to 77.8%. This was mainly driven by mix and pricing, partially offset by persistent high inflation |
| • | Focused promotion of the ’10 Most Loved’ products, including Camomile Face Cleanser, Vitamin E Day Cream, Ginger Shampoo and Edelweiss Serum, proved effective, with the share of business of the 10 SKUs combined growing from 14.2% to 17.6% compared to Q2-22 |
| • | Despite the operating deleverage, Adjusted EBITDA margin improved by +210 bps YoY, at 5.4%, driven by the slight gross margin expansion and strict cost control (following the trend of previous quarters) |
| • | In connection with this, EBITDA adjustments of BRL 20 million were mostly related to severance and consultants hired to assist during this transformational process |
| • | As mentioned last quarter, The Body Shop is focusing on structural cost reduction and strict cost containment measures to drive a culture of cost discipline throughout the organization as we work to improve net revenue trends and focus on margin expansion and cash generation in 2023 and beyond |
3. Social and environmental performance
(all actions refer to Natura &Co Group, unless stated otherwise)
Natura &Co’s greenhouse gas emissions reduction targets submitted in 2022 were approved by the Science Based Targets Initiative (SBTi). Our target is in line with the Paris Agreement’s 1.5°C trajectory. Natura & Co has committed to reduce absolute scope 1 and 2 GHG emissions by 42% by 2030 from a 2020 base year. Natura &Co has also committed to reducing absolute scope 3 GHG emissions from purchased goods and services, upstream transportation and distribution, and end-of-life treatment of sold products by 42% by 2030 from a 2020 base year.
At Natura &Co, we strongly believe in the possibility of reconciling development and nature. Natura &Co was present at the London Climate Action Week in June, engaging in multistakeholder dialogue and speaking on panels organized by partners such as The UN High-Level Climate Champions. We continued to engage in discussions regarding responsible policy engagement and the transition to an equitable, net-zero, nature-positive world by addressing and building bridges at meaningful global events such as COP 28.
All of our Business Units celebrated Pride and to mark Pride Month, The Body Shop’s #FreedomToBe campaign was launched in North America in support of Drag & 2SLGBTQ+ youth. To provide crucial safety and protection for the community, the brand continues to partner with the Equality Federation, (a national non-profit organization that works to advance pro-LGBTQ+ policies across the country) to pass The Equality Act in the US. In Canada, The Body Shop is partnering with It Gets Better Canada, a non-profit organization with a mission to uplift, empower, and connect lesbian, gay, bisexual, transgender, and queer youth around the globe through inspiring media programming, educational resources, international affiliates in 19 countries, and access to an arsenal of community-based service providers. On International Pride Day, Natura &Co Latin America hosted an inspiring panel discussion for employees on intersectionality. Aesop brought back its Queer Libraries to continue raising awareness of Pride by championing marginalized voices. Avon highlighted its Equity and Inclusion position which ensures every single associate, no matter where they work, feels safe and empowered to bring their whole selves to work. In some countries, this means that Avon will go beyond the legal minimum to ensure all different types of family structures and relationships are recognized and treated with the same support and respect.
Updates across our Business Units:
Natura &Co Latin America
Natura was recognized by Merco (Corporate Reputation Business Monitor) as the company with the best corporate reputation in Brazil in 2022 for the ninth consecutive year. Natura &Co Latin released its FY22 Annual Report, continuing to evolve its integrated framework with the latest version of the GRI and Value Reporting Foundation (SASB and IIRC) standards. This year for the first time, Natura &Co Latin America released an ESG Scorecard, a dynamic platform to navigate its indicators and information.
Avon International
Avon International announced its partnership with Cruelty Free International, the globally recognizable gold standard for cruelty-free products. For three decades, Avon International has been at the forefront of beauty brands against animal testing and now Avon Fragrance, Care and Anew products have received Leaping Bunny approval. Avon International CEO Angela Cretu received the prestigious WBCSD – World Business Council for Sustainable Development Leading Women Awards, which is recognizes female leaders who have made remarkable contributions to sustainability and the achievement of the Sustainable Development Goals (SDGs). Avon International released its FY22 Annual Report with comprehensive sustainability data, in line with our Commitment to Life Sustainability Vision.
The Body Shop
The Body Shop was recognized for its Open Hiring Program as it received the Adyen Inclusion & Diversity Hero/Heroes Award at the UK Retail Week Awards in London, an event that celebrates corporate contributions within the retail industry through innovation, vision, resilience, and drive. The Body Shop joined other multinationals to address the largest refugee crisis since World War II by forming a partnership with Tent, an organization that seeks employment for refugees, committing to hire 200 refugees across its European operations over the next three years. In Canada, The Body Shop secured a major win for the fight against animal testing with the passing of Bill C-47 that now bans the testing of cosmetics on animals. Through the Forever Against Animal Testing campaign, The Body Shop presented over 625,000 petition signatures on Parliament Hill, becoming the largest petition in Canada’s history since the Bill of Rights.
Aesop
The Aesop Foundation has also announced its most recent grant of USD$100,000 in support of the ACLU (American Civil Liberty Union) in partnership with the Americas. The ACLU Foundation works to defend freedom of expression, both in the courts and beyond. A partnership with the ACLU will directly support access to literature and the custodians of books nationwide via a campaign to support librarians.
4. Performance including Aesop
| Profit and Loss by Business | |||||||||||||||
| BRL million | Consolidateda | Natura & Co Latamb | Avon International | The Body Shop | Aesop | ||||||||||
| Q2-23c | Q2-22c | Ch. % | Q2-23c | Q2-22c | Ch. % | Q2-23c | Q2-22c | Ch. % | Q2-23 | Q2-22 | Ch. % | Q2-23 | Q2-22 | Ch. % | |
| Gross revenue | 10,944.7 | 11,271.7 | (2.9) | 7,274.0 | 7,284.4 | (0.1) | 1,795.1 | 2,099.7 | (14.5) | 1,116.6 | 1,220.7 | (8.5) | 758.9 | 666.9 | 13.8 |
| Net revenue | 8,452.0 | 8,702.4 | (2.9) | 5,462.9 | 5,555.0 | (1.7) | 1,510.3 | 1,643.8 | (8.1) | 800.3 | 909.4 | (12.0) | 678.5 | 594.2 | 14.2 |
| COGS | (2,783.0) | (3,234.7) | (14.0) | (1,956.9) | (2,274.0) | (13.9) | (553.6) | (678.2) | (18.4) | (177.5) | (204.6) | (13.2) | (95.0) | (77.9) | 22.0 |
| Gross profit | 5,669.1 | 5,467.7 | 3.7 | 3,506.0 | 3,281.0 | 6.9 | 956.7 | 965.5 | (0.9) | 622.8 | 704.9 | (11.6) | 583.5 | 516.3 | 13.0 |
| Selling, marketing and logistics expenses | (3,869.6) | (3,838.9) | 0.8 | (2,259.5) | (2,167.3) | 4.3 | (701.8) | (762.4) | (7.9) | (536.2) | (604.1) | (11.2) | (372.2) | (305.1) | 22.0 |
| Administrative, R&D, IT and projects expenses | (1,512.4) | (1,491.1) | 1.4 | (757.4) | (756.6) | 0.1 | (346.6) | (315.1) | 10.0 | (213.4) | (232.8) | (8.3) | (195.0) | (187.5) | 4.0 |
| Corporate expenses | (83.6) | (88.7) | (5.7) | - | - | - | - | - | - | - | - | - | - | - | - |
| Other operating income / (expenses), net | (121.5) | 93.6 | (229.8) | (20.4) | 18.7 | (208.9) | (46.4) | 111.1 | (141.8) | (29.2) | (38.5) | (24.1) | (16.0) | 2.2 | (814.9) |
| Transformation / Integration / Group restructuring costs | (238.2) | (132.0) | 80.4 | (98.7) | (99.9) | (1.3) | (138.8) | (25.5) | 443.6 | - | - | - | - | - | - |
| Depreciation | 673.3 | 629.7 | 6.9 | 239.0 | 226.0 | 5.8 | 169.5 | 168.6 | 0.6 | 179.3 | 164.6 | 8.9 | 85.4 | 70.5 | 21.1 |
| EBITDA | 516.1 | 490.7 | 5.2 | 609.0 | 501.8 | 21.4 | (107.4) | 142.2 | (175.5) | 23.3 | (5.8) | (499.2) | 85.7 | 96.5 | (11.2) |
| - | |||||||||||||||
| Depreciation | (673.3) | (629.7) | 6.9 | ||||||||||||
| Financial income / (expenses), net | (432.6) | (426.8) | 1.4 | ||||||||||||
| Earnings before taxes | (589.8) | (565.8) | 4.2 | ||||||||||||
| Income tax and social contribution | (93.9) | (135.1) | (30.5) | ||||||||||||
| Discontinued operationsd | (48.3) | (66.1) | (26.9) | ||||||||||||
| Consolidated net (loss) income | (731.9) | (767.0) | (4.6) | ||||||||||||
| Non-controlling interest | 0.1 | 0.2 | (76.9) | ||||||||||||
| Net income (loss) attributable to controlling shareholders | (731.9) | (766.7) | (4.5) | ||||||||||||
| Gross margin | 67.1% | 62.8% | 430 bps | 64.2% | 59.1% | 510 bps | 63.3% | 58.7% | 460 bps | 77.8% | 77.5% | 30 bps | 86.0% | 86.9% | -90 bps |
| Selling, marketing and logistics as % net revenue | (45.8)% | (44.1)% | -170 bps | (41.4)% | (39.0)% | -240 bps | (46.5)% | (46.4)% | -10 bps | (67.0)% | (66.4)% | -60 bps | (54.9)% | (51.3)% | -360 bps |
| Admin., R&D, IT and projects exp. As % net revenue | (17.9)% | (17.1)% | -80 bps | (13.9)% | (13.6)% | -30 bps | (22.9)% | (19.2)% | -370 bps | (26.7)% | (25.6)% | -110 bps | (28.7)% | (31.6)% | 290 bps |
| EBITDA margin | 6.1% | 5.6% | 50 bps | 11.1% | 9.0% | 210 bps | (7.1)% | 8.6% | -1570 bps | 2.9% | (0.6)% | 350 bps | 12.6% | 16.2% | -360 bps |
| Net margin | (8.7)% | (8.8)% | 10 bps | - | - | - | - | - | - | - | - | - | |||
| a Consolidated results include Natura &Co Latam, Avon International, The Body Shop and Aesop, as well as the Natura subsidiaries in the U.S., France and the Netherlands. | |||||||||||||||
| b Natura &Co Latam: includes Natura, Avon, TBS Brazil and Hispanic Latam, Aesop Brazil and &Co Pay | |||||||||||||||
| c Includes PPA – Purchase Price Allocation effects | |||||||||||||||
| d Related to business separation at Avon North America | |||||||||||||||
AESOP
| · | As disclosed in the Material fact dated April 3rd, 2023, Natura &Co announced it had entered into a binding agreement to sell Aesop to L’Oréal for an enterprise value of US$ 2.525 billion. Closing is still expected to be in the third quarter of 2023 and Aesop has been classified as discontinued activities |
| Operational KPIs | |||||
| Q2-23 | Q1-23 | Q2-22 | Change vs. Q1-23 | Change vs. Q2-22 | |
| Aesop (total) | 403 | 397 | 376 | 6 | 27 |
| Signature stores | 293 | 289 | 275 | 4 | 18 |
| Department stores | 110 | 108 | 101 | 2 | 9 |
| · | Revenues were BRL 759 million, up +16.4% in CC (and up +14.2% in BRL). All regions delivered double-digit YoY growth, except for the Americas, where, unlike other regions, there were no significant store openings to boost YoY growth |
| · | Asia’s revenue grew sequentially (+18% in Q2 vs +14% in Q1), driven partly by Korea returning to growth amid an improving macroeconomic environment and internal efforts to boost retail performance |
| · | Signature stores totaled 293 in Q2-23 (+18 LTM) and posted same-store sale growth of +8% |
| · | From a distribution channel perspective, retail and wholesale showed solid growth, partially offset by a softer e-commerce performance. Combined same store sales growth was +8% (including retail, department store concessions and Aesop.com) |
| Aesop (BLR million) | P&L | ||
| Q2-23 | Q2-22 | Ch. % | |
| Gross revenue | 758.9 | 666.9 | 13.8 |
| Net revenue | 678.5 | 594.2 | 14.2 |
| Constant currency | 16.4 | ||
| COGS | (95.0) | (77.9) | 22.0 |
| Gross profit | 583.5 | 516.3 | 13.0 |
| Gross margin | 86.0% | 86.9% | -90 bps |
| Selling, marketing and logistics expenses | (372.2) | (305.1) | 22.0 |
| Administrative, R&D, IT and project expenses | (195.0) | (187.5) | 4.0 |
| Other operating income / (expenses), net | (16.0) | 2.2 | (816.0) |
| Depreciation | 85.4 | 70.5 | 21.1 |
| EBITDA | 85.7 | 96.5 | (11.1) |
| EBITDA margin | 12.6% | 16.2% | -360 bps |
| · | In line with previous trends, the fragrance category continued to significantly outperform Aesop’s overall top line growth |
| · | Gross margin was 86.0%, compared to 86.9% in Q2-22, impacted by unfavorable FX, channel mix and category mix shift in Asia |
| · | Adjusted EBITDA margin was 12.6%, down 360bps YoY, still pressured by planned investments to deliver sustainable future growth and some gross margin pressure. In addition, China is slightly pressuring profitability as we ramp up our store opening schedule |
| · | These investments relate primarily to technology (fewer investments in supply chain this quarter in particular) |
5. Capital Markets and Stock Performance
NTCO3 shares traded at BRL 16.74 at the end of Q2-23 on the B3 stock exchange, +23.4% in the quarter. Average Daily Trading Volume (ADTV) for the quarter was BRL 269.2 million, +12.1% vs Q2-22. NTCO traded at USD 6.98 at the end of Q2-23 on NYSE, +30.8% in the quarter.
On Jun 30, 2022, the Company’s market capitalization was BRL 21.2 billion, and the Company’s capital was comprised of 1,386,848,066 common shares.
6. Fixed income
Below is a table with details of all public debt instruments outstanding per issuer as of June 30, 2023:
Issuer | Type | Issuance | Maturity | Principal (million) | Nominal Cost |
| Debenture - 12th issue | 10/06/2022 | 09/15/2027 | BRL 255.8 | DI + 0.80 per year | |
| 10/06/2022 | 09/15/2029 | BRL 487.2 | IPCA + 6.80 per year | ||
| Natura Cosméticos S.A. | 10/06/2022 | 09/15/2030 | BRL 102.3 | IPCA + 6.90 per year | |
| 09/15/2031 | BRL 102.3 | IPCA + 6.90 per year | |||
| 09/15/2032 | BRL 102.3 | IPCA + 6.90 per year | |||
| Natura Cosméticos S.A. | Commercial Notes | 09/19/2022 | 09/19/2025 | BRL 500.0 | DI + 1.55 per year |
| Natura &Co Luxembourg Holdings (Natura Lux) | Club Loan | 11/14/2022 | 11/14/2025 | US$ 250.0 | SOFR + 2.47% |
| Natura Cosméticos S.A. | Debenture - 11th issue | 07/25/2022 | 07/21/2027 | BRL 826.0 | DI + 1.65 per year |
| Natura Cosméticos S.A. | Bond - 2nd issue (Sustainability Linked Bond) | 05/03/2021 | 05/03/2028 | US$ 1,000.0 (1) | 4.13% |
| Natura &Co Luxembourg Holdings (Natura Lux) | Bonds | 04/19/2022 | 04/19/2029 | US$ 600.0 | 6.00% |
| Avon Products, Inc. | Unsecured Bonds | 03/12/2013 | 03/15/2043 | US$ 216.1 | 8.450%(2) |
(1) Principal and interests fully hedged (swapped to BRL). For more information, see the explanatory notes to the Company’s financial statements.
(2) Coupon based on current credit ratings, governed by interest rate adjustment clause
Ratings
Below is a table with our current credit ratings:
| Natura &Co Holding S.A. | |||
Agency | Global Scale | National Scale | Outlook |
| Standard & Poor's | BB | AAA | Stable |
| Fitch Ratings | BB | AA+ | Positive |
| Moody's | Ba3 | - | Negative |
| Natura Cosméticos S.A. | |||
Agency | Global Scale | National Scale | Outlook |
| Standard & Poor's | BB | AAA | Stable |
| Fitch Ratings | BB | AA+ | Positive |
| Moody's | Ba2 | - | Negative |
| Avon International | |||
Agency | Global Scale | National Scale | Outlook |
| Standard & Poor's | BB- | - | Stable |
| Fitch Ratings | BB | - | Positive |
| Moody's | Ba3 | - | Negative |
7. Appendix
FREE CASH FLOW RECONCILIATION
The correspondence between Free Cash Flow and Statements of Cash Flow is shown below:
| R$ million | H1-23 | H1-22 | Free Cash Flow Reconciliation | ||||||||
| CASH FLOW FROM OPERATING ACTIVITIES | |||||||||||
| Net (loss) income for the period | (1,384.1) | (1,409.1) | (a) | Net income | |||||||
| Adjustments to reconciliate net (loss) income for the period with net cash used in operating activities: | |||||||||||
| Depreciation and amortization | 1,191.3 | 1,137.4 | (b) | Depreciation/amortization | |||||||
| Interest and exchange variation on short-term investments | (383.2) | (179.1) | (c) | Non-cash adjustments to net income | Free Cash Flow | Cash Flow Reconciliation | |||||
| Earnings (loss) from swap and forward derivative contracts | 764.4 | 559.0 | (c) | Net income (loss) | (a) | ||||||
| Provision for tax, civil and labor risks | 31.9 | 15.5 | (c) | Depreciation and amortization | (b) | ||||||
| Inflation adjustment of judicial deposits | (13.3) | (17.2) | (c) | Non-cash adjustments to net income | (c) | ||||||
| Inflation adjustment of provision for tax, civil and labor risks | 37.2 | 23.5 | (c) | Adjusted net income | |||||||
| Income tax and social contribution | 181.4 | 198.0 | (c) | Decrease / (increase) in working capital | (d) | ||||||
| Income from sale and write-off of property, plant and equipment, lease and non-current assets held for sale | 38.3 | 22.1 | (c) | Inventories | (d1) | ||||||
| Interest and exchange rate variation on leases | 79.5 | 108.9 | (c) | Accounts payable | (d3) | ||||||
| Interest and exchange rate variation on borrowings, financing and debentures, net of acquisition costs | 98.4 | (39.6) | (c) | Other assets and liabilities | (d4) | ||||||
| Inflation adjustment and exchange rate variation on other assets and liabilities | 1.5 | 1.3 | (c) | Income tax and social contribution | (e) | ||||||
| Impairment | 11.1 | 0.0 | (c) | Interest on debt and derivative settlement | (f) | ||||||
| Provision for stock option plans | 23.2 | 144.2 | (c) | Lease payments | (g) | ||||||
| Provision for losses with trade accounts receivables, net of reversals | 317.8 | 315.1 | (c) | Other operating activities | (h) | ||||||
| Provision for inventory losses, net of reversals | 251.5 | 201.8 | (c) | Cash from continuing operations | |||||||
| Reversal of provision for the provision for carbon credits | (5.7) | (6.8) | (c) | Capex | (i) | ||||||
| Effect from hyperinflationary economy | 178.2 | 179.4 | (c) | Sale of assets | (j) | ||||||
| Free cash flow - continuing operations | |||||||||||
| Increase (Decrease) in: | Other financing and investing activities | (l) | |||||||||
| Trade accounts receivable and related parties | (495.4) | (192.1) | (d2) | Accounts receivable | Operating activities - discontinued operations | (m) | |||||
| Inventories | (498.0) | (153.4) | (d1) | Inventories | Payment of lease - principal - discontinued operations | (n) | |||||
| Recoverable taxes | (7.3) | (9.8) | (d4) | Other Assets and Liabilities | Capex - discontinued operations | (o) | |||||
| Other assets | 37.6 | 32.0 | (d4) | Cash balance variations | |||||||
| Domestic and foreign trade accounts payable and related parties | (412.4) | (903.0) | (d3) | Accounts payable | |||||||
| Payroll, profit sharing and social charges, net | (225.3) | (292.0) | (d4) | Other Assets and Liabilities | |||||||
| Tax liabilities | (158.2) | (133.9) | (d4) | ||||||||
| Other liabilities | (228.1) | (178.9) | (d4) | ||||||||
| OTHER CASH FLOWS FROM OPERATING ACTIVITIES | |||||||||||
| Payment of income tax and social contribution | (229.6) | (254.0) | (e) | Income Tax and Social Contribuion | |||||||
| Release of judicial deposits | 23.9 | 13.8 | (h) | Other Operating Activities | |||||||
| Payments related to tax, civil and labor lawsuits | (30.7) | (54.1) | (h) | ||||||||
| (Payments) proceeds due to settlement of derivative transactions | (481.8) | (256.7) | (f) | Interest on Debt and derivative settlement | |||||||
| Payment of interest on lease | (82.4) | (77.7) | (g) | Lease Payments | |||||||
| Payment of interest on borrowings, financing and debentures | (471.2) | (362.7) | (f) | Interest on Debt and derivative settlement | |||||||
| Discontinued Operations | (115.9) | 118.7 | (m) | Operating activities - discountinued operations | |||||||
| NET CASH (USED IN) OPERATING ACTIVITIES | (1,956) | (1,449) | |||||||||
| CASH FLOW FROM INVESTING ACTIVITIES | |||||||||||
| Additions of property, plant and equipment and intangible | (515.4) | (449.8) | (i) | Capex | |||||||
| Proceeds from sale of property, plant and equipment, intangible and non-current assets held for sale | 14.0 | 3.7 | (j) | Sale of Assets | |||||||
| Acquisition of short-term investments | (4,760.1) | (4,753.0) | (l) | Other financing and investing activities | |||||||
| Redemption of short-term investments | 5,389.2 | 5,446.7 | (l) | ||||||||
| Redemption of interest on short-term investments | 76.2 | 59.9 | (l) | ||||||||
| Investing activities - discontinued operations | (108.1) | (73.3) | (o) | Capex - discountinued operations | |||||||
| NET CASH GENERATED BY (USED IN) INVESTING ACTIVITIES | 96 | 234 | |||||||||
| CASH FLOW FROM FINANCING ACTIVITIES | |||||||||||
| Repayment of lease - principal | (393.7) | (435.3) | (g) | Lease payments | |||||||
| Repayment of borrowings, financing and debentures – principal | (118.8) | (3,638.7) | (l) | Other financing and investing activities | |||||||
| New borrowings, financing, and debentures | 654.9 | 4,727.0 | (l) | ||||||||
| Acquisition of treasury shares, net of receipt of option strike price | 0.0 | (120.3) | (l) | ||||||||
| Payment of dividends and interest on equity for the previous period | (0) | 0.0 | (l) | ||||||||
| Receipt of funds due to settlement of derivative transactions | (39.4) | 109.2 | (l) | ||||||||
| Capital Increase | 0.1 | 2.7 | (l) | ||||||||
| Financing activities - discontinued operations | (121.2) | (91.5) | (n) | Payment of lease - discountinued operations | |||||||
| NET CASH PROVIDED BY (USED IN) FINANCING ACTIVITIES | (18) | 553 | |||||||||
| Effect of exchange rate variation on cash and cash equivalents | (42.8) | (301.3) | (k) | Exchange Rate Effect | |||||||
| DECREASE IN CASH AND CASH EQUIVALENTS | (1,921) | (963) | |||||||||
| Opening balance of cash and cash equivalents | 4,195.7 | 4,007.3 | |||||||||
| Closing balance of cash and cash equivalents | 2,275.1 | 3,043.8 | |||||||||
| DECREASE IN CASH AND CASH EQUIVALENTS | (1,920.7) | (963.4) | |||||||||
CONSOLIDATED BALANCE SHEET
| ASSETS (R$ million) | Jun-23 | Dec-22 | LIABILITIES AND SHAREHOLDER'S EQUITY (R$ million) | Jun-23 | Dec-22 | |
| CURRENT ASSETS | CURRENT LIABILITIES | |||||
| Cash and cash equivalents | 2,275.1 | 4,195.7 | Borrowings, financing and debentures | 362.7 | 331.2 | |
| Short-term investments | 1,180.4 | 1,800.4 | Lease | 607.6 | 878.4 | |
| Trade accounts receivable | 3,452.6 | 3,502.4 | Trade accounts payable and reverse factoring operations | 5,648.9 | 6,375.9 | |
| Inventories | 4,207.4 | 4,516.9 | Dividends and interest on shareholders' equity payable | 0.2 | 0.3 | |
| Recoverable taxes | 1,275.2 | 911.4 | Payroll, profit sharing and social charges | 941.3 | 1,277.0 | |
| Income tax and social contribution | 194.8 | 196.1 | Tax liabilities | 607.1 | 828.1 | |
| Derivative financial instruments | 268.0 | 235.1 | Income tax and social contribution | 173.6 | 70.3 | |
| Other current assets | 691.6 | 763.4 | Derivative financial instruments | 848.6 | 1,614.0 | |
| Assets held for sale | 2,726.6 | 0.1 | Provision for tax, civil and labor risks | 419.1 | 463.7 | |
| Total current assets | 16,271.7 | 16,121.5 | Other current liabilities | 1,096.2 | 1,499.1 | |
| Assets held for sale | 1,246.9 | 0 | ||||
| NON CURRENT ASSETS | Total current liabilities | 11,952.1 | 13,337.9 | |||
| Recoverable taxes | 909.0 | 1,356.9 | ||||
| Deferred income tax and social contribution | 3,399.0 | 3,519.5 | NON CURRENT LIABILITIES | |||
| Judicial deposits | 397.9 | 457.6 | Borrowings, financing and debentures | 13,026.1 | 13,261.1 | |
| Derivative financial instruments | - | 773.3 | Lease | 1,539.1 | 2,392.3 | |
| Short-term investments | 32.6 | 35.2 | Payroll, profit sharing and social charges | 9.3 | 26.2 | |
| Other non-current assets | 1,119.8 | 1,252.4 | Tax liabilities | 122.7 | 117.4 | |
| Total long term assets | 5,858.3 | 7,394.9 | Deferred income tax and social contribution | 898.4 | 934.4 | |
| Property, plant and equipment | 4,123.5 | 4,966.2 | Derivative financial instruments | 608.1 | 191.3 | |
| Intangible | 22,357.4 | 23,261.0 | Provision for tax, civil and labor risks | 1,152.0 | 1,322.2 | |
| Right of use | 1,982.6 | 2,941.9 | Other non-current liabilities | 725.4 | 751.6 | |
| Total non-current assets | 34,321.9 | 38,564.0 | Total non-current liabilities | 18,081.2 | 18,996.3 | |
| SHAREHOLDERS' EQUITY | ||||||
| Capital stock | 12,484.5 | 12,484.4 | ||||
| Treasury shares | (196.5) | (262.4) | ||||
| Capital reserves | 10,498.1 | 10,540.9 | ||||
| Accumulated losses | (3,378.7) | (1,994.6) | ||||
| Other comprehensive income | 1,136.5 | 1,564.3 | ||||
| Equity attributable to owners of the Company | 20,543.9 | 22,332.7 | ||||
| Non-controlling interest in shareholders' equity of subsidiaries | 16.3 | 18.5 | ||||
| TOTAL ASSETS | 50,593.5 | 54,685.5 | TOTAL LIABILITIES AND SHAREHOLDERS' EQUITY | 50,593.5 | 54,685.4 |
CONSOLIDATED INCOME STATEMENT- INCLUDING PURCHASE PRICE ALLOCATION (PPA) AMORTIZATION
| R$ million | Q2-23 | Q2-22 | Ch. % | H1-23 | H1-22 | Ch. % |
| NET REVENUE | 7,773.5 | 8,108.2 | (4.1) | 15,093.7 | 15,719.2 | (4.0) |
| Cost of Products Sold | (2,687.9) | (3,093.4) | (13.1) | (5,182.6) | (6,039.6) | (14.2) |
| GROSS PROFIT | 5,085.6 | 5,014.8 | 1.4 | 9,911.1 | 9,679.6 | 2.4 |
| OPERATING EXPENSES | ||||||
| Selling, Marketing and Logistics Expenses | (3,395.2) | (3,446.6) | (1.5) | (6,499.9) | (6,729.2) | (3.4) |
| Administrative, R&D, IT and Project Expenses | (1,401.0) | (1,541.9) | (9.1) | (2,782.0) | (2,900.2) | (4.1) |
| Impairment losses on trade receivables | (102.2) | (150.6) | (32.2) | (317.8) | (313.4) | 1.4 |
| Other Operating Expenses, Net | (319.3) | (40.7) | 685.5 | (416.0) | (101.1) | 311.4 |
| (LOSS) FROM OPERATIONS BEFORE FINANCIAL RESULT | (132.1) | (164.9) | (19.9) | (104.7) | (364.3) | (71.3) |
| Financial Income | 1,854.6 | 1,934.1 | (4.1) | 2,860.3 | 3,272.3 | (12.6) |
| Financial Expenses | (2,256.7) | (2,364.5) | (4.6) | (3,738.7) | (4,063.4) | (8.0) |
| (LOSS) BEFORE INCOME TAX AND SOCIAL CONTRIBUTION | (534.2) | (595.4) | (10.3) | (983.1) | (1,155.4) | (14.9) |
| Income Tax and Social Contribution | (98.6) | (128.1) | (23.0) | (181.4) | (198.0) | (8.4) |
| (LOSS) INCOME FROM CONTINUED OPERATIONS | (632.8) | (723.5) | (12.5) | (1,164.5) | (1,353.5) | (14.0) |
| Income (Loss) from discontinued operations | (99.1) | (43.5) | 127.7 | (219.6) | (55.7) | 294.3 |
| (LOSS) INCOME FOR THE PERIOD | (731.9) | (767.0) | (4.6) | (1,384.1) | (1,409.1) | (1.8) |
| Attributable to controlling shareholders | (731.9) | (766.7) | (4.5) | (1,384.3) | (1,409.8) | (1.8) |
| Attributable to non-controlling shareholders | (0.1) | (0.2) | (76.6) | 0.2 | 0.7 | (67.8) |
PURCHASE PRICE ALLOCATION (PPA) AMORTIZATION
| R$ million | Q2-23 | Q2-22 | H1-23 | H1-22 |
| Net Revenue | - | - | - | - |
| Cost of Products Sold | (1.9) | (1.7) | (3.4) | (3.7) |
| Gross Profit | (1.9) | (1.7) | (3.4) | (3.7) |
| Selling, Marketing and Logistics Expenses | (62.3) | (63.4) | (126.6) | (129.6) |
| Administrative, R&D, IT and Project Expenses | (71.9) | (66.8) | (147.4) | (136.1) |
| Other Operating Income (Expenses), Net | (5.0) | 4.6 | 23.7 | 53.6 |
| Financial Income/(Expenses), net | (5.0) | 14.6 | 10.8 | 39.1 |
| Income Tax and Social Contribution | (27.6) | (39.7) | (11.2) | (35.6) |
| LOSS FROM CONTINUED OPERATIONS | (173.7) | (152.4) | (254.2) | (212.4) |
| Depreciation impact | (136.1) | (132.6) | (277.5) | (282.0) |
CONSOLIDATED STATEMENT OF CASH FLOW
| R$ million | H1-23 | H1-22 |
| CASH FLOW FROM OPERATING ACTIVITIES | ||
| Net (loss) income for the period | (1,384.1) | (1,409.1) |
| Adjustments to reconciliate net (loss) income for the period with net cash used in operating activities: | ||
| Depreciation and amortization | 1,191.3 | 1,137.4 |
| Interest and exchange variation on short-term investments | (383.2) | (179.1) |
| Earnings (loss) from swap and forward derivative contracts | 764.4 | 559.0 |
| Provision for tax, civil and labor risks | 31.9 | 15.5 |
| Inflation adjustment of judicial deposits | (13.3) | (17.2) |
| Inflation adjustment of provision for tax, civil and labor risks | 37.2 | 23.5 |
| Income tax and social contribution | 181.4 | 198.0 |
| Income from sale and write-off of property, plant and equipment, lease and non-current assets held for sale | 38.3 | 22.1 |
| Interest and exchange rate variation on leases | 79.5 | 108.9 |
| Interest and exchange rate variation on borrowings, financing and debentures, net of acquisition costs | 98.4 | (39.6) |
| Inflation adjustment and exchange rate variation on other assets and liabilities | 1.5 | 1.3 |
| Impairment | 11.1 | 0.0 |
| Provision for stock option plans | 23.2 | 144.2 |
| Provision for losses with trade accounts receivables, net of reversals | 317.8 | 315.1 |
| Provision for inventory losses, net of reversals | 251.5 | 201.8 |
| Reversal of provision for the provision for carbon credits | (5.7) | (6.8) |
| Effect from hyperinflationary economy | 178.2 | 179.4 |
| Increase (Decrease) in: | ||
| Trade accounts receivable and related parties | (495.4) | (192.1) |
| Inventories | (498.0) | (153.4) |
| Recoverable taxes | (7.3) | (9.8) |
| Other assets | 37.6 | 32.0 |
| Domestic and foreign trade accounts payable and related parties | (412.4) | (903.0) |
| Payroll, profit sharing and social charges, net | (225.3) | (292.0) |
| Tax liabilities | (158.2) | (133.9) |
| Other liabilities | (228.1) | (178.9) |
| OTHER CASH FLOWS FROM OPERATING ACTIVITIES | ||
| Payment of income tax and social contribution | (229.6) | (254.0) |
| Release of judicial deposits | 23.9 | 13.8 |
| Payments related to tax, civil and labor lawsuits | (30.7) | (54.1) |
| (Payments) proceeds due to settlement of derivative transactions | (481.8) | (256.7) |
| Payment of interest on lease | (82.4) | (77.7) |
| Payment of interest on borrowings, financing and debentures | (471.2) | (362.7) |
| Discontinued Operations | (115.9) | 118.7 |
| NET CASH (USED IN) OPERATING ACTIVITIES | (1,956) | (1,449) |
| CASH FLOW FROM INVESTING ACTIVITIES | ||
| Additions of property, plant and equipment and intangible | (515.4) | (449.8) |
| Proceeds from sale of property, plant and equipment, intangible and non-current assets held for sale | 14.0 | 3.7 |
| Acquisition of short-term investments | (4,760.1) | (4,753.0) |
| Redemption of short-term investments | 5,389.2 | 5,446.7 |
| Redemption of interest on short-term investments | 76.2 | 59.9 |
| Investing activities - discontinued operations | (108.1) | (73.3) |
| NET CASH GENERATED BY (USED IN) INVESTING ACTIVITIES | 96 | 234 |
| CASH FLOW FROM FINANCING ACTIVITIES | ||
| Repayment of lease - principal | (393.7) | (435.3) |
| Repayment of borrowings, financing and debentures – principal | (118.8) | (3,638.7) |
| New borrowings, financing, and debentures | 654.9 | 4,727.0 |
| Acquisition of treasury shares, net of receipt of option strike price | 0.0 | (120.3) |
| Payment of dividends and interest on equity for the previous period | (0) | 0.0 |
| Receipt of funds due to settlement of derivative transactions | (39.4) | 109.2 |
| Capital Increase | 0.1 | 2.7 |
| Financing activities - discontinued operations | (121.2) | (91.5) |
| NET CASH PROVIDED BY (USED IN) FINANCING ACTIVITIES | (18) | 553 |
| Effect of exchange rate variation on cash and cash equivalents | (42.8) | (301.3) |
| DECREASE IN CASH AND CASH EQUIVALENTS | (1,921) | (963) |
| Opening balance of cash and cash equivalents | 4,195.7 | 4,007.3 |
| Closing balance of cash and cash equivalents | 2,275.1 | 3,043.8 |
| DECREASE IN CASH AND CASH EQUIVALENTS | (1,920.7) | (963.4) |

Abihpec: Brazilian Association of the Personal Hygiene, Perfumery and Cosmetics Industry
ADR: An American Depositary Receipt is a negotiable certificate issued by a U.S. depository bank representing a specified number of shares of a non-U.S. company stock.
ADS: The individual issuance of shares in a U.S. stock exchange by a non-U.S. company is referred to as American Depositary Shares (ADS)
Adjusted EBITDA: Excludes effects that are not considered usual, recurring or not-comparable between the periods under analysis
APAC: Asia and Pacific
Avon representatives: Self-employed resellers who do not have a formal labor relationship with Avon
B3: Brazilian Stock Exchange
Benefit Sharing: In accordance with Natura’s Policy for the Sustainable Use of Biodiversity and Associated Traditional Knowledge, benefits are shared whenever we perceive various forms of value in the access gained. Therefore, one of the practices that defines the way in which these resources are divided is to associate payments with the number of raw materials produced from each plant as well as the commercial success of the products in which these raw materials are used
BPS: Basis Points; a basis points is equivalent to one percentage point * 100
Brand Power: A methodology used by Natura &Co to measure how its brands are perceived by consumers, based on metrics of significance, differentiation and relevance.
BRL: Brazilian Reais
CDI: The overnight rate for interbank deposits
CEE: Central and Eastern Europe
CFT: Cosmetics, Fragrances and Toiletries Market (CFT = Fragrances, Body Care and Oil Moisture, Make-up (without Nails), Face Care, Hair Care (without Colorants), Soaps, Deodorants, Men’s Grooming (without Razors) and Sun Protection
COGS: Costs of Goods Sold
Constant currency (“CC) or constant exchange rates: when exchange rates used to convert financial figures into a reporting currency are the same for the years under comparison, excluding foreign currency fluctuation effects
CO2e: Carbon dioxide equivalent; for any quantity and type of greenhouse gas, CO2e signifies the amount of CO2 which
would have the equivalent global warming impact.
EBITDA: Earnings Before Interests, Tax, Depreciation and Amortization
EMEA: Europe, Middle East and Africa
EP&L: Environmental Profit & Loss
Foreign currency translation: conversion of figures from a foreign currency into the currency of the reporting entity
G&A: General and administrative expenses
GHG: Greenhouse gases
ICON: Consumer Stock Index of the B3 stock exchange, designed to track changes in the prices of the more actively traded and better representative cyclical and non-cyclical consumer stocks
Innovation Index: Share in the last 12 months of the sale of products launched in the last 24 months
IBOV: Ibovespa Index is the main performance indicator of the stocks traded in B3 and lists major companies in the Brazilian capital market
IFRS – International Financial Reporting Standards
Kantar: Data, insights and consulting company with global presence
Hispanic Latam: Often used to refer to the countries in Latin America, excluding Brazil
LFL: Like-for-Like, applicable to measure comparable growth
Natura Consultant: Self-employed resellers who do not have a formal labor relationship with Natura
Natura Crer Para Ver Program (CPV): Special line of non-cosmetic products whose profits are transferred to the Natura Institute, in Brazil, and invested by Natura in social initiatives in the other countries where we operate. Our consultants promote these sales to benefit society and do not obtain any gains.
Natura Institute: Is a nonprofit organization created in 2010 to strengthen and expand our Private Social Investment initiatives. The institute has enabled us to leverage our efforts and investments in actions that contribute to the quality of public education
NYSE: New York Stock Exchange
P&L: Profit and loss
PP: Percentage point
PPA: Purchase Price Allocation - effects of the fair market value assessment as a result of a business combination
Profit Sharing: The share of profit allocated to employees under the profit-sharing program
SEC: The U.S. Securities and Exchange Commission (SEC) is an independent federal government regulatory agency responsible for protecting investors, maintaining fair and orderly functioning of the securities markets, and facilitating capital formation
SG&A: Selling, general and administrative expenses
SM&L: Selling, marketing and logistics expenses
SLB: Sustainability Linked Bond
SPT: Sustainability Performance Targets
SSS: Same-Store-Sales
Supplier Communities: The communities of people involved in small–scale farming and extraction activities in a variety of locations in Brazil, especially in the Amazon Region, who extract the inputs used in our products from the social and biodiversity. We form production chains with these communities that are based on fair prices, the sharing of benefits gained from access to the genetic heritage and associated traditional knowledge and support for local sustainable development projects. This business model has proven effective in generating social, economic and environmental value for Natura and for the communities.
Synergies: Synergy is the concept that the value and performance of two companies combined will be greater than the sum of the separate individual parts.
TBS: The Body Shop.
TMEA: Turkey, Middle East and Africa
UNI: Underlying Net Income.
WE: Western Europe
EBITDA is not a measure under BR GAAP and does not represent cash flow for the periods presented. EBITDA should not be considered an alternative to net income as an indicator of operating performance or an alternative to cash flow as an indicator of liquidity. EBITDA does not have a standardized meaning and the definition of EBITDA used by Natura may not be comparable with that used by other companies. Although EBITDA does not provide under BR GAAP a measure of cash flow, Management has adopted its use to measure the Company’s operating performance. Natura also believes that certain investors and financial analysts use EBITDA as an indicator of performance of its operations and/or its cash flow.
This report contains forward-looking statements. These forward-looking statements are not historical fact, but rather reflect the wishes and expectations of Natura’s management. Words such as “anticipate,” “wish,” “expect,” “foresee,” “intend,” “plan,” “predict,” “project,” “desire” and similar terms identify statements that necessarily involve known and unknown risks. Known risks include uncertainties that are not limited to the impact of price and product competitiveness, the acceptance of products by the market, the transitions of the Company’s products and those of its competitors, regulatory approval, currency fluctuations, supply and production difficulties and changes in product sales, among other risks. This report also contains certain pro forma data, which are prepared by the Company exclusively for informational and reference purposes and as such are unaudited. This report is updated up to the present date and Natura does not undertake to update it in the event of new information and/or future events.
Investor Relations Team
ri@natura.net

Second-Quarter 2023 Results August 15th,2023 Second-Quarter

This presentation may contain forward-looking statements. Such statements are not statements of historical fact and reflect the beliefs and expectations of Natura &Co’s management.The words “anticipate," "wishes,“ "expects," "estimates," "intends," "forecasts," "plans," "predicts," "projects," "targets" and similar words are intended to identify these statements, which necessarily involve known and unknown risks and uncertainties. Known risks and uncertainties include, but are not limited to, the impact of competitive products and pricing, market acceptance of products, product transitions by the Company and its competitors, regulatory approval, currency fluctuations, production and supply difficulties, changes in product sales mix, and other risks. This presentation also may include pro-forma and adjusted information prepared by the Company for information and reference purposes only, which has not been audited. Forwardlooking statements speak only as of the date they are made, and the Company does not undertake any obligation to update them in light of new information or future developments. https://ri.naturaeco.com/en Second-Quarter
3. Continued focus on cash conversion • Further improvement in operating working capital dynamics… • …partially offsetting seasonal cash consumption in the quarter 1. Improvement in adjusted EBITDA, mainly driven by gross margin • Net Revenue: +1.9% in constant currency (CC) • Gross Margin: +430 bps • Adj. EBITDA margin: +230 bps 2. Top Line Performance of our brands • Growth in CC at Natura &Co Latam, driven by Natura brand • Improving fundamentals at Avon International • Persistent challenges at The Body Shop 4. Further advances in ESG • GHG emissions targets approved by SBTi
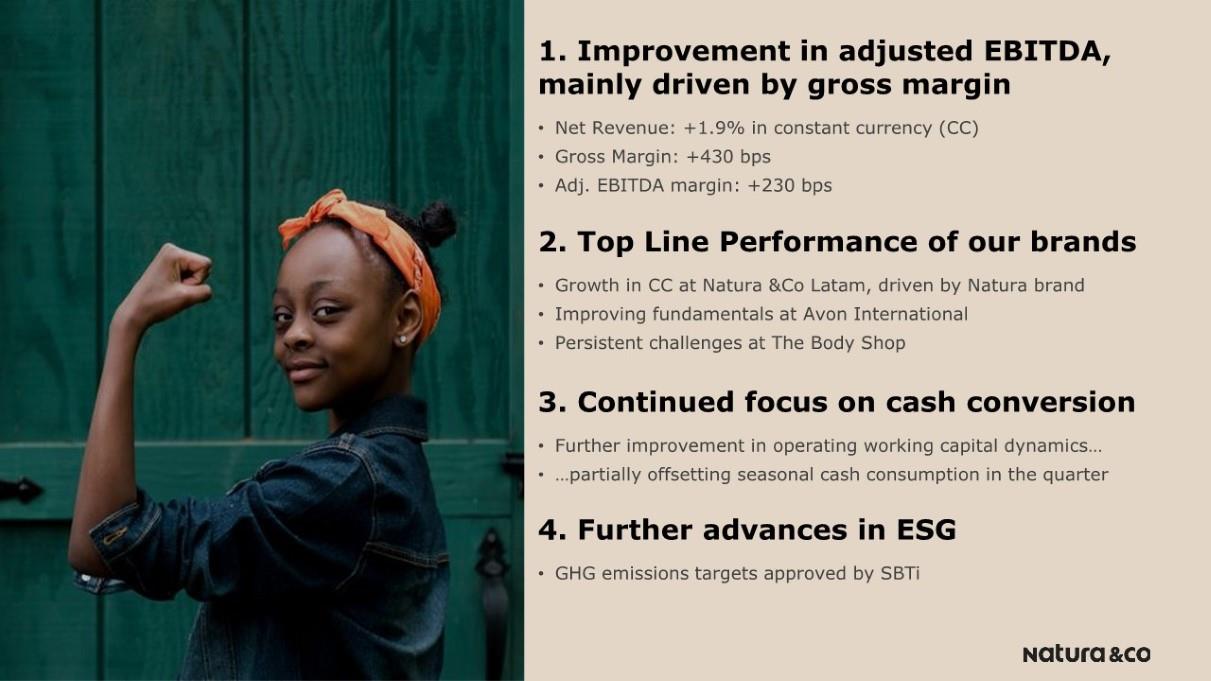
Consolidated Financial Performance Guilherme Castellan, CFO

Natura &Co: Sales growth in constant currencyNet Revenue (BRL million) Highlights • Strong performance by the Natura brand • Continuous improvement at Avon international Partially offset by: • Challenges at The Body Shop • Significant decrease in Home & Style, as expected 5 Natura &Co: Sales growth in constant currency The Body Shop -12.5% at CC -12.0% in BRL Avon International -1.3% at CC -8.1% in BRL Natura &Co Latam +5.8% at CC -1.7% in BRL +1.9% CCEarnings Presentation| Q2-23
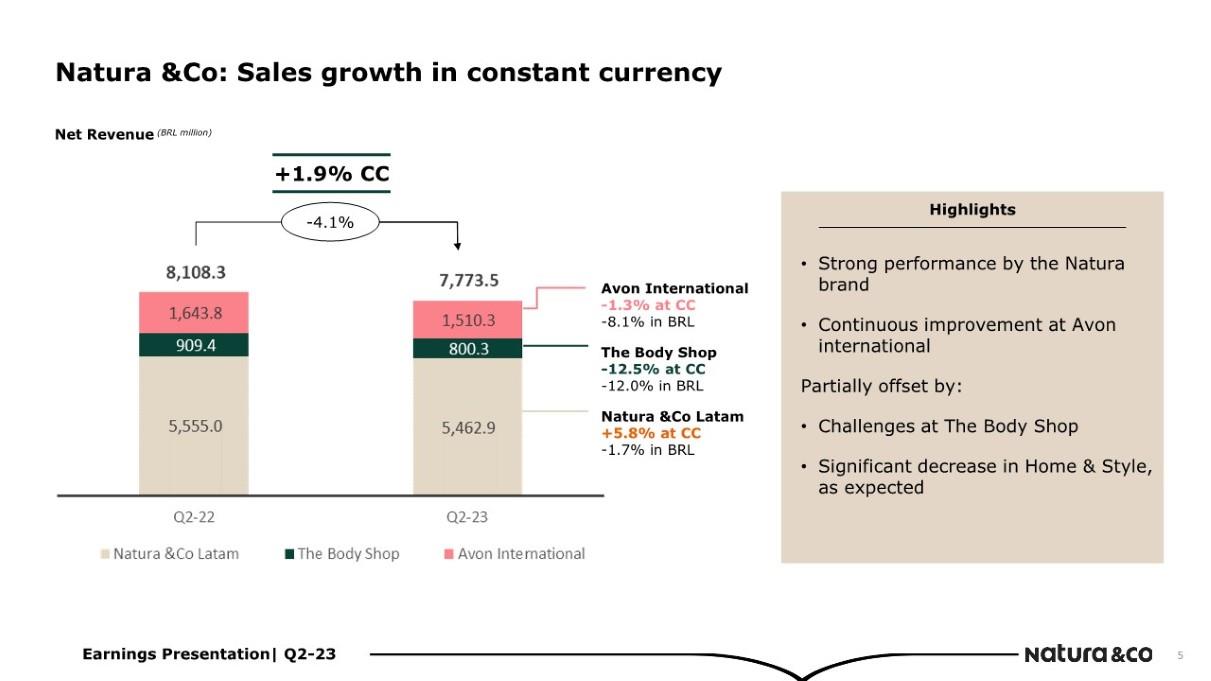
Expansion in adjusted EBITDA margin across all businesses Q2-23 Consolidated Adjusted EBITDA Margin Highlights Strong Gross Margin improvements • Strict cost control Partially offset by: • Planned investments at Natura brand • Deleverage in Avon Hispanic Latam and • Investment in lead markets and phasing of expenses at Avon International Earnings Presentation| Q2-23
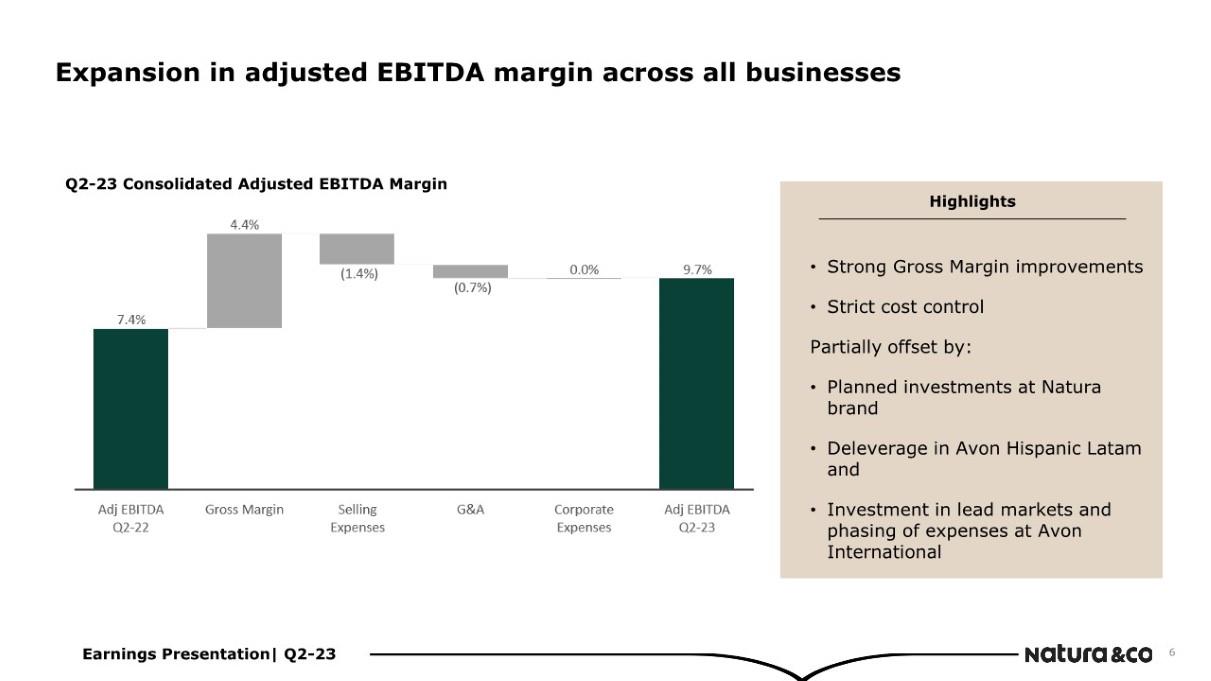
Underlying net income (UNI) and net income Net Income to Underlying Net Income (UNI) Reconciliation Q2-23 (BRL million) Main Highlights Higher EBITDA Partially offset by: • High Integration and transformation cost, and • Higher losses from discontinued operations – specially impacted by lower margin at Aesop Earnings Presentation| Q2-23
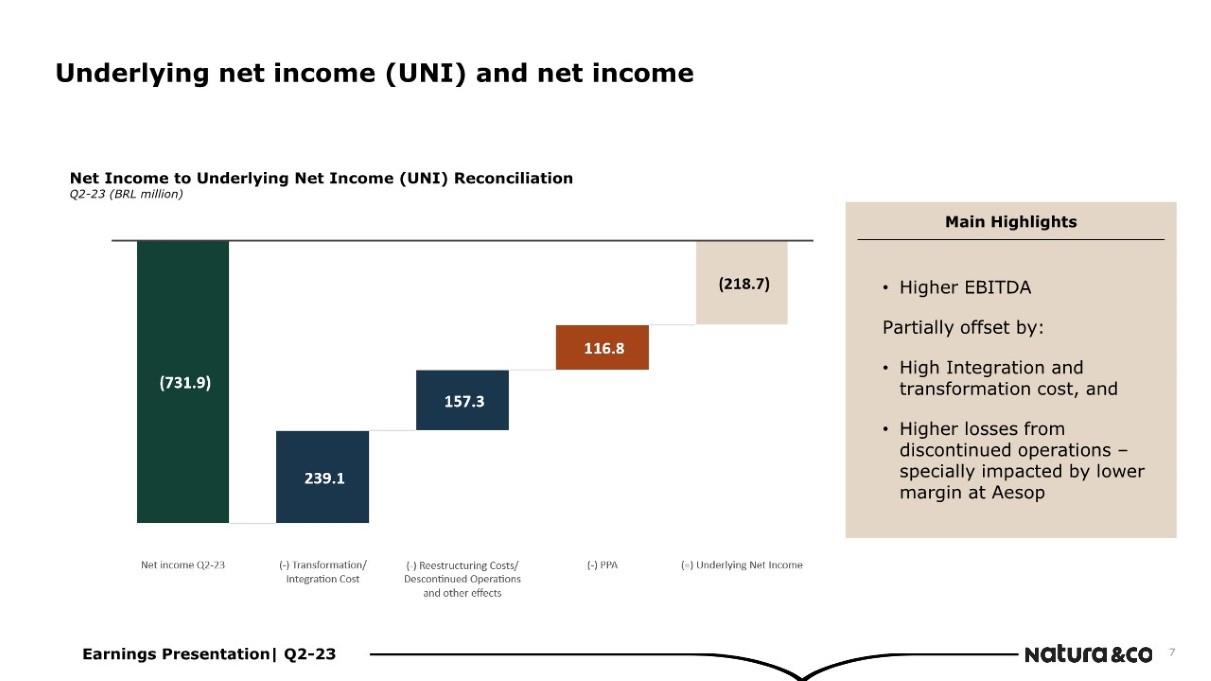
Operating Working Capital improved at all BUs Highlights Improving operating working capital: • Improved at all BUs, even with solid growth of Natura brand Partially offset by: • Other assets and liabilities given further investments linked to transformation and restructuring plans Capex impacted by phasing between quarters Earnings Presentation| Q2-23
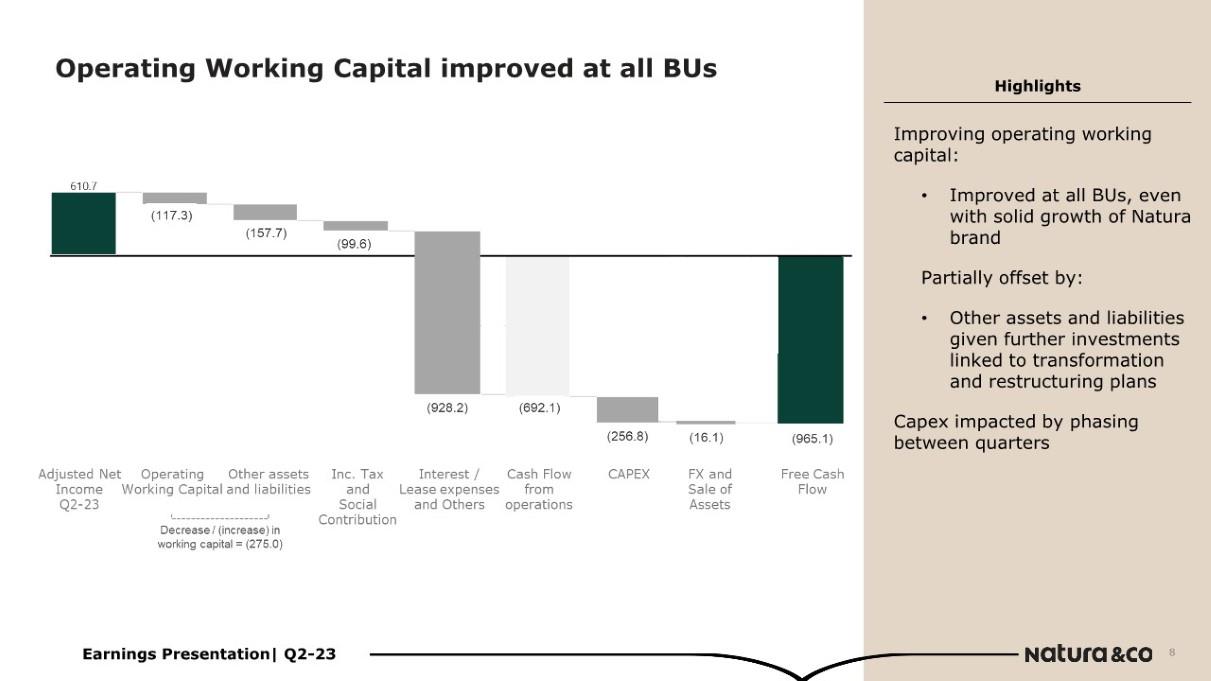
Continued liability management Q2-23 BRL 3.7 billion Cash balance at period-end 4.17x Group net debt-to-EBITDA ratio Repayment of Avon’s 2043 bond (~90%) through a tender offer for a value of US$ 246 million Net debt and net debt-to-EBITDA ratio (BRL billion) Amortization schedule (BRL billion) (a) Gross debt excludes PPA impacts and excludes lease agreements (b) Excluding foreign currency hedging and including Avon’s Bond 2043 Earnings Presentation| Q2-23
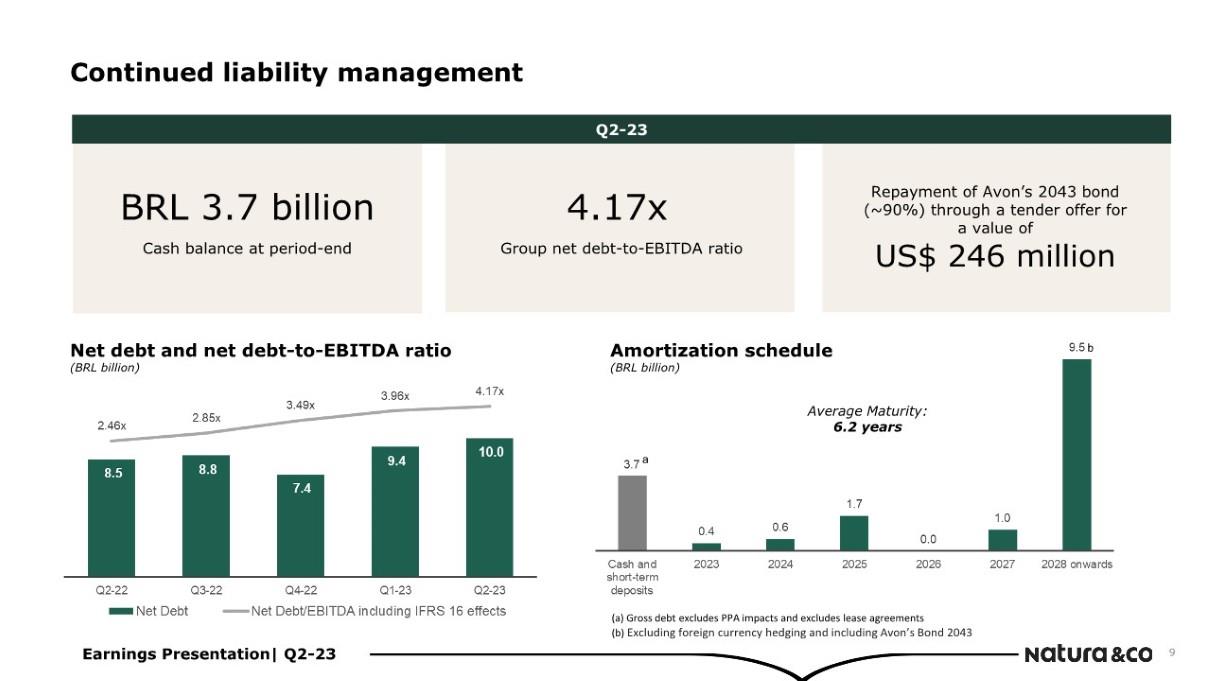
Natura &Co Latam Financial Performance

Natura Beauty: Natura &Co Latam: Solid double-digit growth in CC at Natura brand, partially offset by Home & Style and, to a lesser extent, Avon brand Net Revenue (BRL million) 11 • Brazil: Strong campaigns for Mother’s day and Valentine’s day • Hispanic: Ex-Argentina, revenue was up mid-single digits in CC, mainly driven by an acceleration in Peru and Colombia Avon Beauty: • Brazil and Hispanic: • Distribution channel hit, as expected, amid the roll-out preparations for Wave 2… • …while CFT productivity improved -1.7% Home & Style: • Preparations for the roll-out of Wave 2 and actual roll-out in Peru and Colombia, as expected +5.8%CC Home & Style Hispanic -39.9% at CC Home & Style Brazil -28.5% at CC Avon CFT Hispanic -5.6% at CC Avon CFT Brazil -1.8% in CC Natura CFT Hispanic +30.0% at CC Natura CFT Brazil +14.7% in CC Earnings Presentation| Q2-23
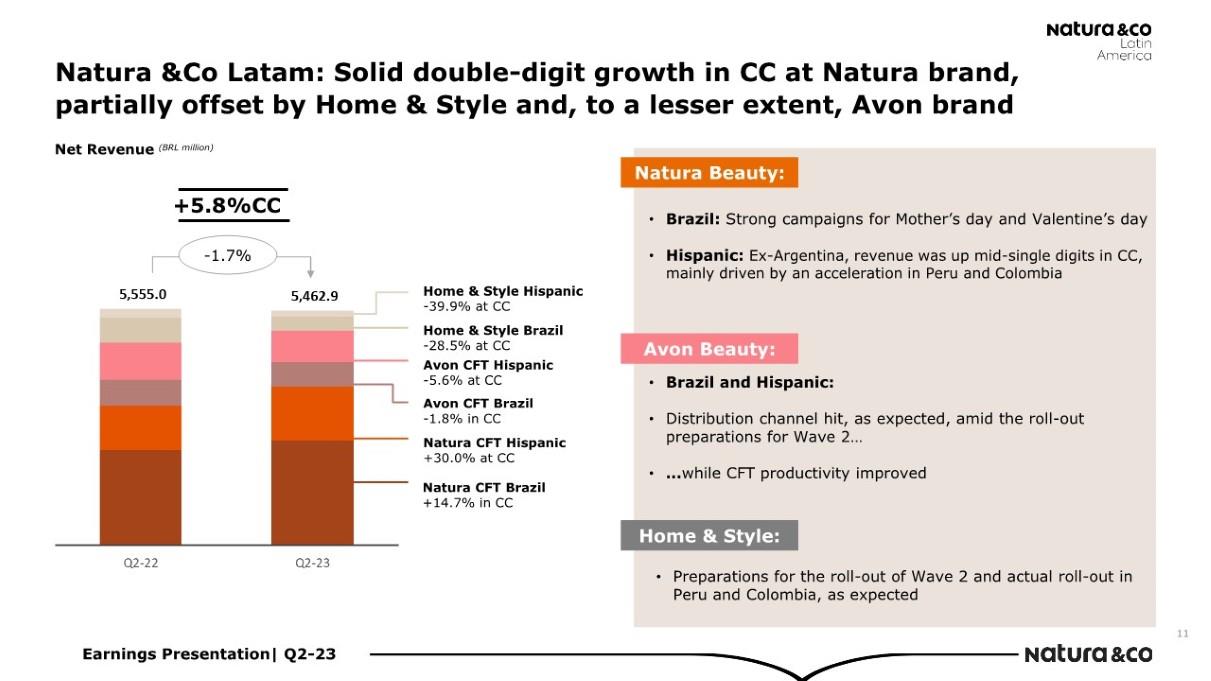
13.3% Adj. EBITDA margin, mainly driven by strong gross margin improvement Adjusted EBITDA¹ and Adjusted EBITDA margin (BRL million) 10.8% Margin 13.3% 601.7 727 1 Excluding effects that are not considered recurring nor comparable between the periods under analysis, such as: Integration costs and net non-recurring other (income)/expenses Main highlights 510 bps improvement in Gross Margin Partially offset by: SG&A investments related to marketing and R&D expenses at Natura brand Deleverage at Avon Hispanic Latam
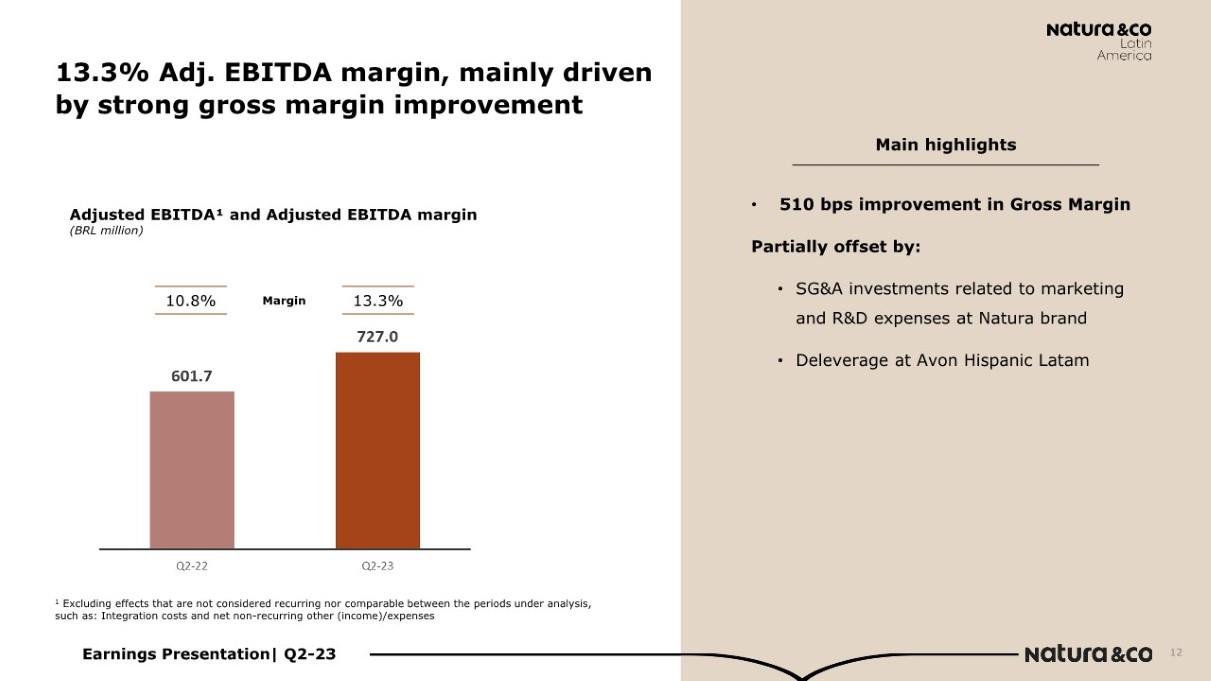
Avon International Financial Performance

Avon International: Broadly stable top line combined with improving profitability Net Revenue (BRL million) -1.3% CC 1,643.8 -8.1 1,510.3 Revenue: Beauty category up +3% YoY Steep decline of Home & Style amid the planned portfolio reduction of more than 50% of SKUs Adjusted EBITDA¹ and adjusted EBITDA margin (BRL million, %) 3.3% Margin 4.4% 54.1 66.3 1 Excluding effects that are not considered recurring nor comparable between the periods under analysis, such as transformation costs Adjusted EBITDA: Gross margin expansion of 460bps, driven by pricing and positive product mix partially offset by: Investments in lead markets Phasing of expenses
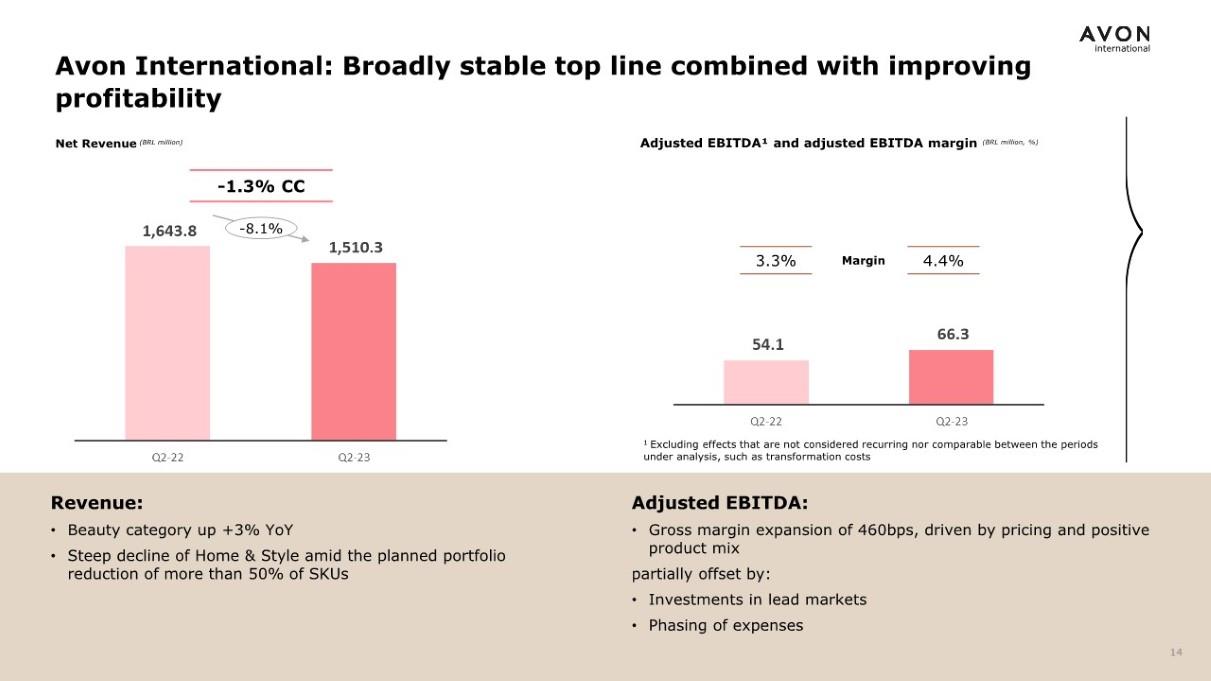
The Body Shop Financial Performance

The Body Shop: Margin improvement YoY despite top-line challenges Net Revenue (BRL million) Adjusted EBITDA¹ and adjusted EBITDA margin (BRL million, %) -12.5%CC 909.4 -12.0% 800.3 3.3% Margin 5.4% 30.5 43.4 1 Excluding effects that are not considered recurring nor comparable between the periods under analysis, such as restructuring business unit Revenue: Core business distribution channels (stores, e-commerce and franchise) showed mid single-digit decline in CC The Body Shop at Home still declining sharply The Body Shop: Margin improvement YoY despite top-line challenges Net Revenue (BRL million) Adjusted EBITDA¹ and adjusted EBITDA margin (BRL million, %) 16 Adjusted EBITDA: Despite operating deleverage, margin improving YoY, driven by: Slight gross margin expansion Strict cost control
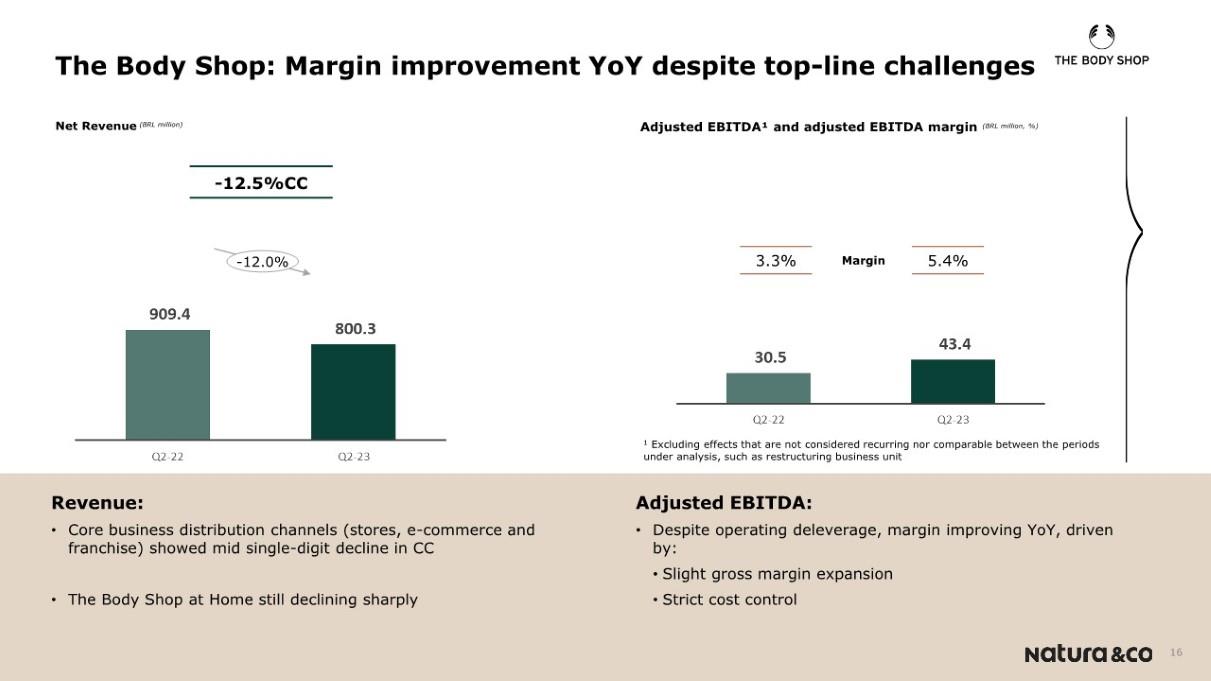
Closing Remarks Fábio Barbosa

Key takeaways Strengthening balance sheet, addressed by Aesop closing in Q3 Continuous focus on profitability and cash conversion 1. Unlocking sustainable shareholder value … …through our triple bottom line agenda Wave 2 underway, launch in Brazil in Q3 2. Further simplification and turnaround of international assets 3. Strengthening balance sheet, addressed by Aesop closing in Q3 4. Continuous focus on profitability and cash conversion
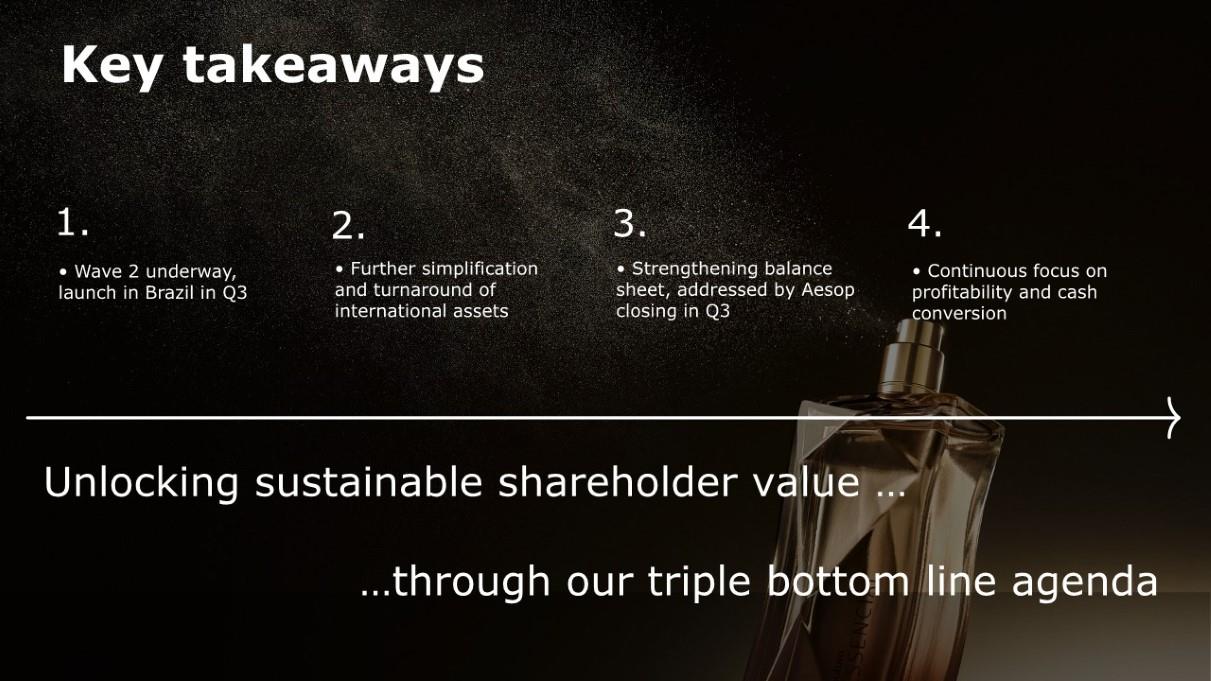
Thank you

Appendix Q2 - 23

Debt Profile Q2-23 by type* 14% 4 % 15% 67% Bonds Debentures Commercial Notes Working Capital Q2-23 by currency* 44% 56% BRL USD
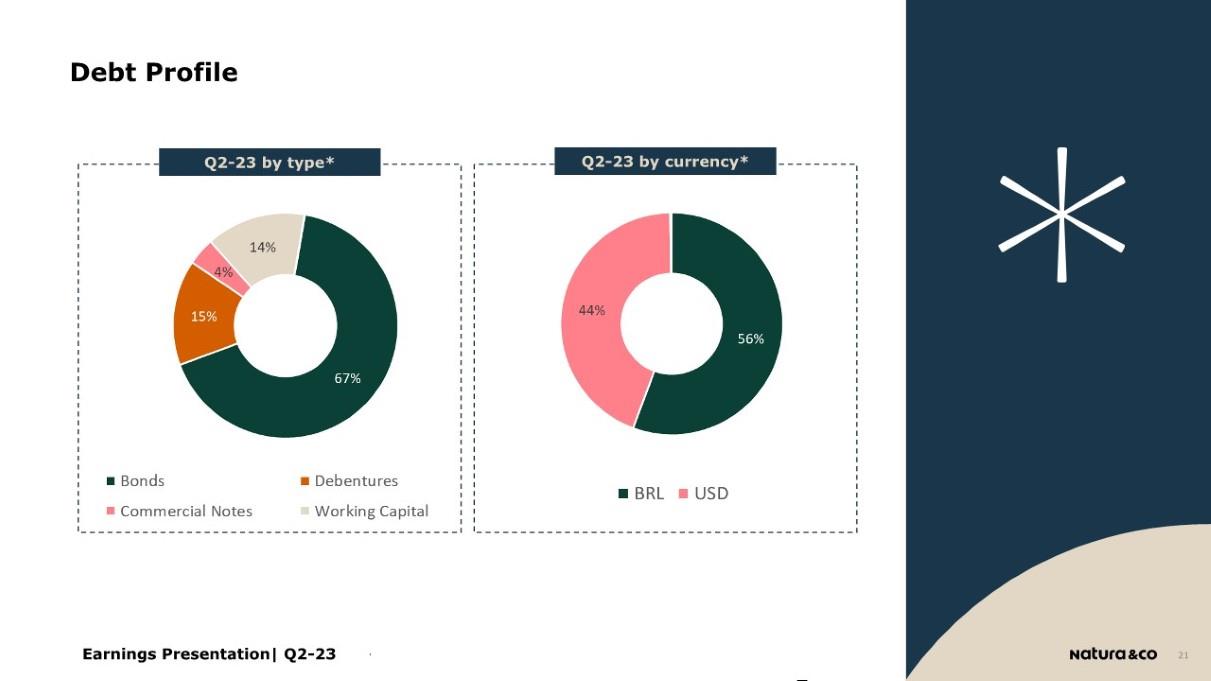
Net Revenue Breakdown by Channel (%) Digital Retail (own stores + Franchise) Wholesale Traditional Direct Selling AVON NATURA THE BODY SHOP Traditional Direct Selling Digital Retail (own stores + Franchise) Wholesale Traditional Direct Selling Digital Retail (own stores + Franchise) Wholesale Traditional Direct Selling Digital Retail (own stores + Franchise) Wholesale 3% 7% 90% 4% 6% 90% 1% 1% 5% 93% 1% 1% 5% 93% 2% 77% 11% 11% 2% 81% 12% 6%