UNITED STATES
SECURITIES AND EXCHANGE COMMISSION
Washington, D.C. 20549
FORM 6-K
REPORT OF FOREIGN PRIVATE ISSUER PURSUANT TO RULE 13a-16 OR 15d-16 UNDER THE SECURITIES EXCHANGE ACT OF 1934
For the month of March 2024
|
Commission File Number: 001-39169
Natura &Co Holding S.A.
(Exact name of registrant as specified in its charter)
Avenida Alexandre Colares, No. 1188, Sala A17-Bloco A
Parque Anhanguera
São Paulo, São Paulo 05106-000, Brazil
(Address of principal executive office)
Indicate by check mark whether the registrant files or will file annual reports under cover of Form 20-F or Form 40‑F:
Form 20-F ☒ Form 40-F ☐
Indicate by check mark if the registrant is submitting the Form 6-K in paper as permitted by Regulation S-T Rule 101(b)(1):
Yes ☐ No ☒
Indicate by check mark if the registrant is submitting the Form 6-K in paper as permitted by Regulation S-T Rule 101(b)(7):
Yes ☐ No ☒
NATURA &CO HOLDING S.A.
TABLE OF CONTENTS
ITEM |
| 1. Earnings release of Natura &Co Holding S.A. for the fourth quarter of 2023. |
| 2. Earnings presentation of Natura &Co Holding S.A. for the fourth quarter of 2023. |
SIGNATURE
Pursuant to the requirements of the Securities Exchange Act of 1934, the registrant has duly caused this report to be signed on its behalf by the undersigned, thereunto duly authorized.
NATURA &CO HOLDING S.A. | |||
By: | /s/ Guilherme Strano Castellan | ||
| Name: | Guilherme Strano Castellan | |
| Title | Principal Financial Officer | |
|
| ||
|
| ||
By: | /s/ Itamar Gaino Filho | ||
| Name: | Itamar Gaino Filho | |
| Title: | Chief Legal and Compliance Officer | |
|
| ||
|
| ||
Date: March 12, 2024

Another Quarter of Solid Profitability Improvement
and Positive FY23 Free Cash Flow to Firm
Improving results from Wave 2 in Brazil driven by continued strong performance from Natura brand, and
Avon International showing further profitability expansion despite revenue contraction
| Q4-23 | 2023 | ||||||||||||
| BRL million | Consolidated | Natura &Co Latam | Avon International | Consolidated | Natura &Co Latam | Avon International | |||||||
| YoY Ch. % | YoY Ch. % | YoY Ch. % | YoY Ch. % | YoY Ch. % | YoY Ch. % | ||||||||
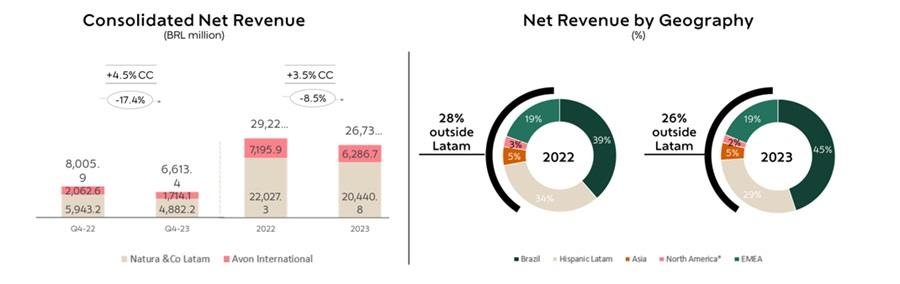
| Net revenue | 6,613.4 | (17.4) | 4,882.2 | (17.9) | 1,714.1 | (16.9) | 26,737.3 | (8.5) | 20,440.8 | (7.2) | 6,286.7 | (12.6) | |
| Constant Currency | 4.5% | 8.5% | -6.1% | 3.5% | 6.4% | -4.4% | |||||||
| Gross profit | 4,168.6 | (13.0) | 3,084.8 | (12.7) | 1,069.0 | (15.2) | 17,061.8 | (2.2) | 13,045.6 | (0.8) | 3,999.5 | (7.1) | |
| Gross Margin | 63.0% | 310 bps | 63.2% | 380 bps | 62.4% | 130 bps | 63.8% | 410 bps | 63.8% | 410 bps | 63.6% | 380 bps | |
| Reported EBITDA | (55.7) | (185.4) | 554.7 | 30.1 | (530.3) | 136.9 | 1,433.1 | 18.2 | 2,239.6 | 17.1 | (493.5) | 560.8 | |
| Reported EBITDA margin | -0.8% | -160 bps | 11.4% | 420 bps | -30.9% | -2000 bps | 5.4% | 130 bps | 11.0% | 230 bps | -7.8% | -680 bps | |
| Adjusted EBITDA | 670.6 | 31.0 | 557.4 | 5.8 | 194.5 | 63.9 | 2,724.9 | 31.7 | 2,560.6 | 15.8 | 475.9 | 54.0 | |
| Adjusted EBITDA margin | 10.1% | 370 bps | 11.4% | 250 bps | 11.3% | 550 bps | 10.2% | 310 bps | 12.5% | 250 bps | 7.6% | 330 bps | |
| Net income (loss) | (2,662.8) | 199.1 | - | - | - | - | 2,973.7 | (204.0) | - | - | - | - | |
01 Consolidated Net Revenue of BRL 6.6 billion, up 4.5% vs Q4-22 in constant currency (CC) (-5.1% ex-Argentina) and down -17.4%1 year-on-year (YoY) in BRL. The items impacting revenue are mainly explained by the following:
- Natura &Co Latam: Q4-23 revenues were up 8.5% YoY in CC (-4.7% ex-Argentina) led by a solid performance from Natura Brazil up 8.6% YoY, a smaller declining trend from Avon in the same market (-11.9% YoY)2, broadly stable performance from Natura Hispanic ex-Argentina, and a decline of 18.9% YoY from Avon Hispanic markets ex-Argentina amid Wave 2 roll-out
- Avon International: Q4-23 revenues declined 6.1% YoY in CC, compared with generally stable top-line delivered in the last couple of quarters, primarily impacted by Home & Style amid further portfolio adjustments, while Beauty showed a small decline (-2.6% YoY in CC)
02 Adjusted EBITDA of BRL 671 million in 4Q-23 with a 10.1% margin, representing another quarter of solid YoY profitability with a 370 basis points (bps) YoY expansion (or ex-hyperinflation accounting of +510 bps). The margin improvement was mainly driven by:
- Natura &Co Latam: 250 bps YoY margin expansion given 380 bps YoY gross margin improvement and lower G&A expenses, partially offset by planned investments at the Natura brand. Excluding Argentina hyperinflation accounting impacts, the EBITDA margin would be up +410 bps YoY
- Avon International: 550 bps YoY margin improvement, driven by 130 bps YoY gross margin evolution and savings from both selling and G&A expenses, supported by an easy comparable in 4Q-22
03 Q4-23 Net loss of BRL 2.7 billion compared to a net loss of BRL 890 million in the same period in 2022, impacted by BRL -1.0 billion (vs. BRL –121 million in Q4-22) associated with discontinued operations (including The Body Shop sale) and Avon’s impairment of BRL -664 million. Tax expenses were also higher this quarter compared to the same period in 2022 given the mix of profitable and unprofitable countries. On a FY base, Net income was BRL +3.0 billion, and in light of the consistent improvement in profitability and comfortable cash position, the Board approved a BRL 979 million dividends
04 Q4-23 Net Cash (excluding leasing) was BRL 1.7 billion (from BRL 0.7 billion in Q3-23) mainly driven by seasonal cash generation, even amid higher receivables consumption due to a very strong performance of Natura Brazil. In the FY, free cash flow to firm was BRL +59 million as higher cash EBITDA in 2023 was partially offset by higher working capital consumption in the year
1 Argentina’s annual hyperinflation impact fully calculated in Q4 as part of IFRS rules
2 Avon CFT Performance, excluding Home & Style
Fábio Barbosa Group CEO of Natura &Co, declared “2023 was a landmark year for Natura &Co, with important and significant advances on the (i) strategy, (ii) operational and financial, and (iii) balance sheet fronts accomplished.
(i) On our corporate strategy, we continued to pursue a leaner holding structure enabling the Business units to operate with more autonomy. We also had important advances on the Company’s simplification side, as a result of the Aesop and The Body Shop divestments.
(ii) On the operational and financial side, we prioritized profitability and cash conversion in lieu of revenue growth, as announced in June-22. As a result, our adjusted EBITDA margin expanded 310 bps YoY, showing growth versus prior year in every quarter, and our FCFF turned positive again in the year. Q4-23 earnings reinforced the consistent execution of our financial and operational strategy throughout the year, with another quarter of significant financial improvement, even taking into consideration the Argentinean hyperinflation accounting impacts.
(iii) Lastly, our balance sheet was strengthened as we used the proceeds from the sale of Aesop to retire more than BRL 7.6 billion in debt, ending the year with a strong net cash position of BRL 1.7 billion. The positive FCFF, alongside our much stronger balance sheet, allows us to start moving to a more optimal capital structure, and to announce BRL 979 million in dividend payments for this year.
Structural projects continue underway in both Latam and Avon International, with the latter delivering further simplification this quarter as the entire business is now managed from two lead regions (down from four previously). In Latam, Wave 2 continues to evolve, with a solid performance from the Natura brand in Brazil and a recovering trend from Avon, with improvements noticed during the quarter on the initial challenges mentioned in Q3-23: delayed deliveries; inventory shortage; and reorganization of sales leaders. The level of service in Peru and Colombia also showed improvements, which enabled the team to implement a softer integration of Natura and Avon in Chile in early 2024.
Following this challenging but rewarding year, we announced the ADR3 NYSE delisting in January 2024, as another step towards simplifying our structure. On a separate note, we also announced in February of 20244 the study of a potential separation of Natura &Co and Avon. We continue to assess the merits of such a potential transaction, and we will provide updates when the studies are finalized.
Recognizing Natura &Co’s social achievements, the Company is proud to have reached its goal of providing a living wage for all employees across Natura &Co. This commitment extends beyond the notion of a minimum wage, embracing a comprehensive understanding of a dignified life. Our approach reflects a deep commitment to improving the quality of life for our employees and their families, thereby contributing to the construction of a more equitable society. Natura &Co also maintained its commitment to closing its pay gap between men and women for the whole Group.
2023 marked a pivotal chapter in the Company's history, setting the stage for the ambitious horizons we aim to reach in 2024 onwards. We are encouraged with the positive results from the strategy set approximately 18 months ago, but we must continue evolving in our strategy, as margins and cash remain as priorities in the short term, paving the way for additional investments in brands and technology. During 2024, resource allocation will continue to be a critical driver for future value creation, with a focus on investments in key growth markets and projects. We continue to expect volatility in top-line, but with margins improvements in the full-year, particularly ex-Argentina.” |
3 Material Fact released on January 18, 2024
4 Material Fact released on February 05, 2024
01 Results analysis
The Group segmentation is composed of:
- Natura &Co Latam, which includes all the brands in Latin America: Natura, Avon and the distribution of The Body Shop; and
- Avon International, which includes all markets, excluding Latin America
In addition, the results and analysis for the periods under comparison include the effects of the fair market value assessment arising from the business combination with Avon as per the Purchase Price Allocation – PPA.
| Profit and Loss by Business | |||||||||
| BRL million | Consolidateda | Natura &Co Latamb | Avon International | ||||||
| Q4-23c | Q4-22c | Ch. % | Q4-23c | Q4-22c | Ch. % | Q4-23c | Q4-22c | Ch. % | |
| Gross revenue | 8,627.0 | 10,343.1 | (16.6) | 6,571.3 | 7,886.9 | (16.7) | 2,038.6 | 2,456.5 | (17.0) |
| Net revenue | 6,613.4 | 8,005.9 | (17.4) | 4,882.2 | 5,943.2 | (17.9) | 1,714.1 | 2,062.6 | (16.9) |
| COGS | (2,444.8) | (3,212.5) | (23.9) | (1,797.4) | (2,410.3) | (25.4) | (645.0) | (802.2) | (19.6) |
| Gross profit | 4,168.6 | 4,793.4 | (13.0) | 3,084.8 | 3,532.9 | (12.7) | 1,069.0 | 1,260.4 | (15.2) |
| Selling, marketing and logistics expenses | (3,023.2) | (3,237.7) | (6.6) | (2,341.7) | (2,384.2) | (1.8) | (683.6) | (853.5) | (19.9) |
| Administrative, R&D, IT and projects expenses | (699.1) | (1,318.4) | (47.0) | (349.9) | (874.7) | (60.0) | (344.9) | (430.3) | (19.9) |
| Corporate expenses | (94.8) | (121.0) | (21.7) | - | - | - | - | - | - |
| Other operating income / (expenses), net | (544.8) | (362.6) | 50.3 | 118.2 | (43.4) | (372.3) | (664.0) | (316.9) | 109.5 |
| Transformation / Integration / Group restructuring costs | (226.8) | (117.0) | 93.8 | (167.0) | (56.9) | 193.4 | (60.9) | (59.5) | 2.4 |
| Depreciation | 364.4 | 428.6 | (15.0) | 210.3 | 252.6 | (16.7) | 154.0 | 176.0 | (12.5) |
| EBITDA | (55.7) | 65.3 | (185.4) | 554.7 | 426.3 | 30.1 | (530.3) | (223.8) | 136.9 |
| Depreciation | (364.4) | (428.6) | (15.0) | ||||||
| Financial income / (expenses), net | (629.9) | (496.9) | 26.8 | ||||||
| Earnings before taxes | (1,050.0) | (860.2) | 22.1 | ||||||
| Income tax and social contribution | (580.3) | 90.7 | (739.8) | ||||||
| Discontinued operationsd | (1,031.5) | (120.9) | 753.2 | ||||||
| Consolidated net (loss) income | (2,661.8) | (890.4) | 198.9 | ||||||
| Non-controlling interest | (1.0) | - | - | ||||||
| Net income (loss) attributable to controlling shareholders | (2,662.8) | (890.4) | 199.1 | ||||||
| Gross margin | 63.0% | 59.9% | 310 bps | 63.2% | 59.4% | 380 bps | 62.4% | 61.1% | 130 bps |
| Selling, marketing and logistics as % net revenue | (45.7)% | (40.4)% | -530 bps | (48.0)% | (40.1)% | -790 bps | (39.9)% | (41.4)% | 150 bps |
| Admin., R&D, IT and projects exp. as % net revenue | (10.6)% | (16.5)% | 590 bps | (7.2)% | (14.7)% | 750 bps | (20.1)% | (20.9)% | 80 bps |
| EBITDA margin | (0.8)% | 0.8% | -160 bps | 11.4% | 7.2% | 420 bps | (30.9)% | (10.9)% | -2000 bps |
| Net margin | (40.3)% | (11.1)% | -2920 bps | - | - | - | - | - | - |
| a Consolidated results include Natura &Co Latam, Avon International and Natura &Co International (Luxembourg) |
| b Natura &Co Latam: includes Natura, Avon, TBS Brazil and Hispanic Latam and &Co Pay, as well as the Natura subsidiaries in the U.S., France and the Netherlands. |
| c Includes PPA – Purchase Price Allocation effects |
| d Related to business separation at Avon North America, TBS and Aesop |
| Profit and Loss by Business | |||||||||
| BRL million | Consolidateda | Natura &Co Latamb | Avon International | ||||||
| 2023c | 2022c | Ch. % | 2023c | 2022c | Ch. % | 2023c | 2022c | Ch. % | |
| Gross revenue | 34,718.6 | 37,886.4 | (8.4) | 27,220.8 | 29,158.1 | (6.6) | 7,488.0 | 8,728.7 | (14.2) |
| Net revenue | 26,737.3 | 29,223.3 | (8.5) | 20,440.8 | 22,027.3 | (7.2) | 6,286.7 | 7,196.0 | (12.6) |
| COGS | (9,675.4) | (11,770.6) | (17.8) | (7,395.3) | (8,880.2) | (16.7) | (2,287.3) | (2,890.6) | (20.9) |
| Gross profit | 17,061.8 | 17,452.6 | (2.2) | 13,045.6 | 13,147.1 | (0.8) | 3,999.5 | 4,305.4 | (7.1) |
| Selling, marketing and logistics expenses | (11,621.8) | (12,163.8) | (4.5) | (8,884.3) | (8,950.4) | (0.7) | (2,738.0) | (3,213.3) | (14.8) |
| Administrative, R&D, IT and projects expenses | (3,901.8) | (4,473.1) | (12.8) | (2,456.9) | (3,011.0) | (18.4) | (1,438.9) | (1,410.6) | 2.0 |
| Corporate expenses | (323.3) | (392.1) | (17.6) | - | - | - | - | - | - |
| Other operating income / (expenses), net | (599.7) | (166.3) | 260.6 | 111.9 | 70.4 | 58.9 | (710.9) | (225.7) | 214.9 |
| Transformation / Integration / Group restructuring costs | (770.2) | (640.9) | 20.2 | (498.2) | (256.2) | 94.5 | (270.7) | (214.3) | 26.4 |
| Depreciation | 1,588.0 | 1,595.9 | (0.5) | 921.5 | 912.4 | 1.0 | 665.7 | 683.8 | (2.7) |
| EBITDA | 1,433.1 | 1,212.3 | 18.2 | 2,239.6 | 1,912.4 | 17.1 | (493.5) | (74.7) | 560.8 |
| Depreciation | (1,588.0) | (1,595.9) | (0.5) | ||||||
| Financial income / (expenses), net | (2,513.5) | (1,785.0) | 40.8 | ||||||
| Earnings before taxes | (2,668.5) | (2,168.6) | 23.1 | ||||||
| Income tax and social contribution | 86.4 | (92.4) | (193.5) | ||||||
| Discontinued operationsd | 5,556.5 | (597.6) | (1,029.8) | ||||||
| Consolidated net (loss) income | 2,974.4 | (2,858.6) | (204.1) | ||||||
| Non-controlling interest | (0.8) | (1.0) | (17.7) | ||||||
| Net income (loss) attributable to controlling shareholders | 2,973.7 | (2,859.5) | (204.0) | ||||||
| Gross margin | 63.8% | 59.7% | 410 bps | 63.8% | 59.7% | 410 bps | 63.6% | 59.8% | 380 bps |
| Selling, marketing and logistics as % net revenue | (43.5)% | (41.6)% | -190 bps | (43.5)% | (40.6)% | -290 bps | (43.6)% | (44.7)% | 110 bps |
| Admin., R&D, IT and projects exp. as % net revenue | (14.6)% | (15.3)% | 70 bps | (12.0)% | (13.7)% | 170 bps | (22.9)% | (19.6)% | -330 bps |
| EBITDA margin | 5.4% | 4.1% | 130 bps | 11.0% | 8.7% | 230 bps | (7.8)% | (1.0)% | -680 bps |
| Net margin | 11.1% | (9.8)% | 2090 bps | - | - | - | - | - | - |
| a Consolidated results include Natura &Co Latam, Avon International and Natura &Co International (Luxembourg) |
| b Natura &Co Latam: includes Natura, Avon, TBS Brazil and Hispanic Latam and &Co Pay, as well as the Natura subsidiaries in the U.S., France and the Netherlands. |
| c Includes PPA – Purchase Price Allocation effects |
| d Related to business separation at Avon North America, TBS and Aesop |
Consolidated net revenue
- Q4-23 consolidated net revenue was BRL 6,613 million, up 4.5% YoY in CC (-5.1% ex-Argentina) and down 17.4% in BRL, reflecting solid performance at the Natura brand partially offset by the expected reduction at Avon Latam (both Beauty and Home & Style) and mid-single digit decline at Avon International
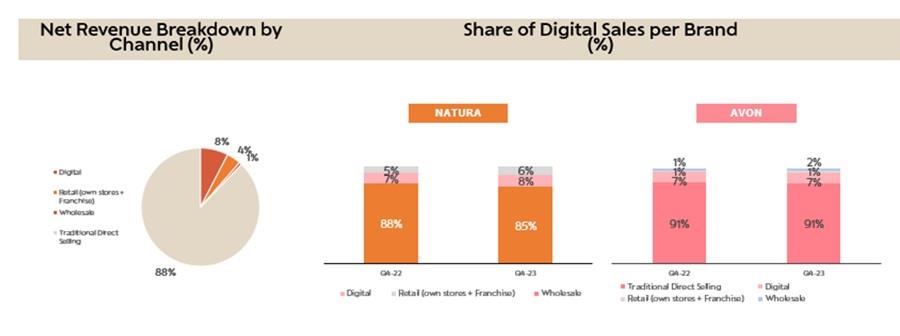
Distribution channel breakdown
Digital sales, which include online sales and social selling, showed some improvement in the quarter. Natura reported a 1 percentage point (p.p.) increase to 8% of total sales, while at Avon penetration was stable at 7%.
Use of digital tools: The penetration of digital tools in the consultant base reached 73.9% in Q4-23 for Natura &Co Latam. Given the change in methodology with the consolidation of a single beauty app, there is no YoY comparable base. Furthermore, at Avon International, penetration of the Avon On app (active representatives who logged in at least once in the last three campaigns) reached 34.3% in Q4-23, +3.7 p.p. vs the previous year.
Gross margin
- Consolidated gross margin was 63.0% in Q4-23, up 310 bps vs. Q4-22 and closing the year as planned with all 2023 quarters showing profitability expansion amid pricing increases and favorable mix mainly driven by the portfolio optimization underway
- Fourth quarter gross margin YoY expansion was broadly in-line with Q3-23 pro-forma (excluding TBS) with stronger expansion from Natura &Co Latam and Avon International upholding its sequential trend of improving margins
Q4-23 Gross Margin
| BRL million | Consolidated | Natura &Co Latam | Avon International | ||||||
| Q4-23 | Q4-22 | Ch. % | Q4-23 | Q4-22 | Ch. % | Q4-23 | Q4-22 | Ch. % | |
| Net revenue | 6,613.4 | 8,005.9 | (17.4) | 4,882.2 | 5,943.2 | (17.9) | 1,714.1 | 2,062.6 | (16.9) |
| COGS | (2,444.8) | (3,212.5) | (23.9) | (1,797.4) | (2,410.3) | (25.4) | (645.0) | (802.2) | (19.6) |
| Gross profit | 4,168.6 | 4,793.4 | (13.0) | 3,084.8 | 3,532.9 | (12.7) | 1,069.0 | 1,260.4 | (15.2) |
| Gross margin | 63.0% | 59.9% | 310 bps | 63.2% | 59.4% | 380 bps | 62.4% | 61.1% | 130 bps |
2023 Gross Margin
| BRL million | Consolidated | Natura &Co Latam | Avon International | ||||||
| 2023 | 2022 | Ch. % | 2023 | 2022 | Ch. % | 2023 | 2022 | Ch. % | |
| Net revenue | 26,737.3 | 29,223.3 | (8.5) | 20,440.8 | 22,027.3 | (7.2) | 6,286.7 | 7,196.0 | (12.6) |
| COGS | (9,675.4) | (11,770.6) | (17.8) | (7,395.3) | (8,880.2) | (16.7) | (2,287.3) | (2,890.6) | (20.9) |
| Gross profit | 17,061.8 | 17,452.6 | (2.2) | 13,045.6 | 13,147.1 | (0.8) | 3,999.5 | 4,305.4 | (7.1) |
| Gross margin | 63.8% | 59.7% | 410 bps | 63.8% | 59.7% | 410 bps | 63.6% | 59.8% | 380 bps |
Operating expenses
- Consolidated Selling, Marketing & Logistics expenses in Q4-23 were 45.7% of net revenue (+530 bps vs. Q4-22), while consolidated Administrative, R&D, IT and Project expenses declined 590 bps YoY to 10.6% of net revenue. SG&A expenses (both lines above combined) as a percent of revenue decreased by 60 bps in Q4-23 compared to the same period last year benefiting from transformational savings at Avon International and lower G&A of Latam (given the impact of phasing expenses in Q4-22 and BRL 204 million reallocation from G&A to selling expenses line), partially offset by planned increases in Natura marketing investments
- Corporate expenses in Q4-23 were BRL 95 million, down 21.7% YoY and 39.8% compared to same period in 2021. On a full year (FY) basis, corporate expenses were BRL 323 million, representing declines of 17.6% and 42.2% vs. FY22 and FY21, respectively, and fully aligned with the Company’s plans announced in June/2022
- Other operating income/expenses in Q4-23 were an expense of BRL 545 million, compared to an expense of BRL 363 million in Q4-22. During 4Q-23 Avon International reported a BRL -664 million of non-cash goodwill impairment, while in the same period last year the impairment was BRL -317 million. In addition, Natura &Co Latam reported a BRL 118 million income mainly driven by tax revenues
- Transformation/Integration/Group restructuring costs in Q4-23 were BRL 227 million, up +93.8%, reflecting ongoing increasing integration costs at Natura &Co Latam (amid the Wave 2 roll-out) and stable costs at Avon International. On a FY basis, Natura &Co Latam reported BRL 498 million of integration costs, while Avon International incurred BRL 271 million of transformation costs. These were partially offset by the sale of the Interlagos industry plant and the Suffern R&D Center in the quarter (see more information in the cash flow section – page 8)
Q4-23 Operating Expenses
| BRL million | Consolidated | Natura &Co Latam | Avon International | ||||||
| Q4-23 | Q4-22 | Ch. % | Q4-23 | Q4-22 | Ch. % | Q4-23 | Q4-22 | Ch. % | |
| Selling, marketing and logistics expenses | (3,023.2) | (3,237.7) | (6.6) | (2,341.7) | (2,384.2) | (1.8) | (683.6) | (853.5) | (19.9) |
| Administrative, R&D, IT and project expenses | (699.1) | (1,318.4) | (47.0) | (349.9) | (874.7) | (60.0) | (344.9) | (430.3) | (19.9) |
| Corporate expenses | (94.8) | (121.0) | (21.7) | - | - | ||||
| Other operating income / (expenses), net | (544.8) | (362.6) | 50.3 | 118.2 | (43.4) | (372.3) | (664.0) | (316.9) | 109.5 |
| Transformation / integration / group reestructuring costs | (226.8) | (117.0) | 93.8 | (167.0) | (56.9) | 193.4 | (60.9) | (59.5) | 2.4 |
| Operating expenses | (4,588.7) | (5,156.7) | (11.0) | (2,740.4) | (3,359.2) | (18.4) | (1,753.4) | (1,660.2) | 5.6 |
| Selling, marketing and logistics expenses (% NR) | (45.7)% | (40.4)% | -530 bps | (48.0)% | (40.1)% | -790 bps | (39.9)% | (41.4)% | 150 bps |
| Administrative, R&D, IT and project expenses (% NR) | (10.6)% | (16.5)% | 590 bps | (7.2)% | (14.7)% | 750 bps | (20.1)% | (20.9)% | 80 bps |
| Corporate expenses (% NR) | (1.4)% | (1.5)% | 10 bps | ||||||
| Other operating income / (expenses), net (% NR) | (8.2)% | (4.5)% | -370 bps | 2.4% | (0.7)% | 310 bps | (38.7)% | (15.4)% | -2330 bps |
| Transformation/integration/group reestructuring costs (% NR) | (3.4)% | (1.5)% | -190 bps | (3.4)% | (1.0)% | -240 bps | (3.6)% | (2.9)% | -70 bps |
| Operating expenses (% NR) | (69.4)% | (64.4)% | -500 bps | (56.1)% | (56.5)% | 40 bps | (102.3)% | (80.5)% | -2180 bps |
2023 Operating Expenses
| BRL million | Consolidated | Natura &Co Latam | Avon International | ||||||
| 2023 | 2022 | Ch. % | 2023 | 2022 | Ch. % | 2023 | 2022 | Ch. % | |
| Selling, marketing and logistics expenses | (11,621.8) | (12,163.8) | (4.5) | (8,884.3) | (8,950.4) | (0.7) | (2,738.0) | (3,213.3) | (14.8) |
| Administrative, R&D, IT and project expenses | (3,901.8) | (4,473.1) | (12.8) | (2,456.9) | (3,011.0) | (18.4) | (1,438.9) | (1,410.6) | 2.0 |
| Corporate expenses | (323.3) | (392.1) | (17.6) | - | - | ||||
| Other operating income / (expenses), net | (599.7) | (166.3) | 260.6 | 111.9 | 70.4 | 58.9 | (710.9) | (225.7) | 214.9 |
| Transformation / integration / group reestructuring costs | (770.2) | (640.9) | 20.2 | (498.2) | (256.2) | 94.5 | (270.7) | (214.3) | 26.4 |
| Operating expenses | (17,216.8) | (17,836.2) | (3.5) | (11,727.5) | (12,147.2) | (3.5) | (5,158.6) | (5,063.9) | 1.9 |
| Selling, marketing and logistics expenses (% NR) | (43.5)% | (41.6)% | -190 bps | (43.5)% | (40.6)% | -290 bps | (43.6)% | (44.7)% | 110 bps |
| Administrative, R&D, IT and project expenses (% NR) | (14.6)% | (15.3)% | 70 bps | (12.0)% | (13.7)% | 170 bps | (22.9)% | (19.6)% | -330 bps |
| Corporate expenses (% NR) | (1.2)% | (1.3)% | 10 bps | ||||||
| Other operating income / (expenses), net (% NR) | (2.2)% | (0.6)% | -160 bps | 0.5% | 0.3% | 20 bps | (11.3)% | (3.1)% | -820 bps |
| Transformation/integration/group reestructuring costs (% NR) | (2.9)% | (2.2)% | -70 bps | (2.4)% | (1.2)% | -120 bps | (4.3)% | (3.0)% | -130 bps |
| Operating expenses (% NR) | (64.4)% | (61.0)% | -340 bps | (57.4)% | (55.1)% | -230 bps | (82.1)% | (70.4)% | -1170 bps |
Consolidated EBITDA
Q4-23 Adjusted EBITDA was BRL 671 million up from BRL 512 million in Q4-22, with an adjusted EBITDA margin of 10.1% (+370 bps YoY). Q4-23 margin reflected:
- Strong margin expansion of +550 bps YoY at Avon International, mainly driven by higher gross margin and YoY improvement in selling and G&A expenses
- Solid margin expansion at Natura & Co Latam of +250 bps YoY, also driven by higher gross margin and improving G&A expenses, partially offset by investments at the Natura brand
- Natura &Co Latam adjusted EBITDA margin which was impacted by the hyperinflation accounting effect (aligned with IAS 29). Excluding this effect the expansion would have been of +410 bps YoY (see more details on Latam section – page 13)
- Further reduction of corporate expenses, which in Q4-22 were impacted by phasing of expenses
Q4-23: Adjusted EBITDA
| BRL million | Consolidated | Natura &Co Latam | Avon International | ||||||
| Q4-23 | Q4-22 | Ch. % | Q4-23 | Q4-22 | Ch. % | Q4-23 | Q4-22 | Ch. % | |
| Consolidated EBITDA | (55.7) | 65.3 | (185.4) | 554.7 | 426.3 | 30.1 | (530.3) | (223.8) | 136.9 |
| Transformation/Integration/Group reestructuring costs | 226.8 | 117.0 | 93.8 | 167.0 | 56.9 | 193.4 | 60.9 | 59.5 | 2.4 |
| Restructuring costs - business unit/Impairment and Goodwill | 663.9 | 329.6 | - | - | 43.4 | - | 663.9 | 282.9 | - |
| Net non-recurring other (income) / expenses1 | (164.3) | - | (149.9) | (164.3) | - | - | - | - | 134.7 |
| Adjusted EBITDA | 670.6 | 511.9 | 31.0 | 557.4 | 526.6 | 5.8 | 194.5 | 118.7 | 63.9 |
| Adjusted EBITDA margin % | 10.1% | 6.4% | 370 bps | 11.4% | 8.9% | 250 bps | 11.3% | 5.8% | 550 bps |
2023: Adjusted EBITDA
| BRL million | Consolidated | Natura &Co Latam | Avon International | ||||||
| 2023 | 2022 | Ch. % | 2023 | 2022 | Ch. % | 2023 | 2022 | Ch. % | |
| Consolidated EBITDA | 1,433.1 | 1,212.3 | 18.2 | 2,239.6 | 1,912.4 | 17.1 | (493.5) | (74.7) | 560.8 |
| Transformation/Integration/Group reestructuring costs | 770.2 | 640.9 | 20.2 | 498.2 | 256.2 | 94.5 | 270.7 | 214.3 | 26.4 |
| Restructuring costs - business unit/Impairment and Goodwill | 685.9 | 317.8 | 115.9 | (12.8) | 43.4 | (129.5) | 698.6 | 282.9 | 146.9 |
| Net non-recurring other (income) / expenses1 | (164.3) | (101.3) | 62.2 | (164.3) | - | - | - | (113.6) | - |
| Adjusted EBITDA | 2,724.9 | 2,069.6 | 31.7 | 2,560.6 | 2,212.0 | 15.8 | 475.9 | 308.9 | 54.0 |
| Adjusted EBITDA margin % | 10.2% | 7.1% | 310 bps | 12.5% | 10.0% | 250 bps | 7.6% | 4.3% | 330 bps |
Net non-recurring other (income)/expenses: 2023 related to Tax Credit at Natura &Co Latam and 2022 Net effect of gain from the favorable settlement of a legal dispute at Avon International
Financial income and expenses
| BRL million | Q4-23 | Q4-22 | Ch. % | 2023 | 2022 | Ch. % |
| 1. Financing, short-term investments and derivatives gains (losses) | 127.4 | (302.5) | (142.1) | (1,361.3) | (798.5) | 70.5 |
| 1.1 Financial expenses | (144.4) | (217.6) | (33.6) | (868.6) | (721.1) | 20.5 |
| 1.2 Financial income | 335.8 | 208.0 | 61.4 | 977.2 | 535.6 | 82.4 |
| 1.3 Foreign exchange variations from financing activities, net | (14.9) | 115.7 | (112.9) | 322.0 | 323.5 | (0.5) |
| 1.4 Gain (losses) on foreing exchange derivatives from financing activities, net | (10.8) | (170.3) | (93.7) | (342.0) | (383.2) | (10.8) |
| 1.5 Gain (losses) on interest rate derivatives and other operating derivatives, net | (38.3) | (238.3) | (83.9) | (1,449.9) | (553.3) | 162.0 |
| 2. Judicial contigencies | (14.5) | (12.2) | 18.9 | (73.0) | (79.3) | (7.9) |
| 3. Other financial income and (expenses) | (730.4) | (187.5) | 289.5 | (1,080.3) | (908.4) | 18.9 |
| 3.1 Lease expenses | (33.1) | (30.8) | 7.3 | (110.4) | (112.5) | (1.9) |
| 3.2 Other | (247.6) | (116.1) | - | (523.7) | (328.7) | 17.5 |
| 3.3 Other gains (losses) from exchange rate variation | (328.0) | 9.6 | 4.8 | (328.6) | (279.6) | 59.3 |
| 3.4 Hyperinflation gains (losses) | (121.7) | (50.1) | 394.2 | (117.6) | (187.6) | (37.3) |
| Financial income and expenses, net | (617.4) | (502.2) | 23.0 | (2,514.6) | (1,786.2) | 40.8 |
The table above details the main changes in financial income and expenses.
Total net financial expenses were BRL -617 million in Q4-23, compared to BRL -502 million in Q4-22, following the liability management plan implemented in Q3-23 and benefitting from the proceeds from the sale of Aesop and subsequent debt repayment, which resulted in financing and short-term investments being an income versus an expense in Q4-23. By contrast, the other financial income and expenses was mostly impacted by the Argentinian peso devaluation and hyperinflation accounting.
The main drivers this quarter were:
- Item 1. Financing, short-term investments and derivatives gains (losses) of BRL +127 million compared to BRL -303 million in Q4-22, reflecting the stronger balance sheet position with a net cash position that stood at BRL 1.7 billion at YE23
- Item 3.2. Other which this quarter was BRL -248 million (vs. BRL -116 million in same period last year) mostly impacted by BRL -60 million of PIS Cofins on IOC paid in Q3-23
- Item 3.3. Other gains (losses) from exchange rate variation of BRL -328 million reflecting intercompany non-cash accounts payables
- Item 3.4. Hyperinflation gains (losses) mostly impacted by the Argentinian peso devaluation, which stood at ARS 166.61/BRL at YE23 compared to ARS/BRL 69.64 at the end of Q3-23 and its consequent impact on hyperinflation accounting
Underlying net income (UNI) and net income
- Q4-23 reported net loss was BRL -2.7 billion, compared to a net loss of BRL -890 million in Q4-22, impacted by the capital loss from the sale of The Body Shop, which closed in December/23 and the Avon International goodwill impairment
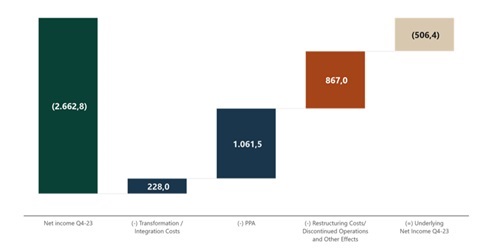
- Q4-23 Underlying Net Income, which is net income excluding transformation costs, restructuring costs, discontinued operations and PPA effects, was BRL 506 million (vs. a loss of BRL -49 million in Q4-22) as higher adjusted EBITDA was more than offset by higher net financials (as mentioned above) and tax expenses given mix of profitable and unprofitable countries
Net Income to Underlying net income (UNI) reconciliation
Free cash flow and cash position
| R$ million | Q4-23 | Q4-22 | Ch. % | 2023 | 2022 | Ch. % |
| Net income (loss) | (2,661.8) | (890.4) | 198.9 | 2,974.5 | (2,858.6) | (204.1) |
| Depreciation and amortization | 364.4 | 428.6 | (15.0) | 1,588.0 | 1,596.3 | (0.5) |
| Non-cash adjustments to net income | 1,662.3 | 1,623.2 | 2.4 | 3,458.0 | 3,327.2 | 3.9 |
| Discountinued Operations Results | 1,031.5 | 120.9 | 753.2 | (5,556.5) | 597.6 | (1,029.8) |
| Adjusted net income | 396.4 | 1,282.3 | (69.1) | 2,464.0 | 2,662.5 | (7.5) |
| Decrease / (increase) in working capital | 668.5 | 1,222.3 | (45.3) | (1,277.2) | (201.9) | 532.6 |
| Inventories | 638.6 | 769.9 | (17.1) | (140.4) | 485.8 | (128.9) |
| Accounts receivable | (542.5) | (342.6) | 58.3 | (1,137.7) | (686.7) | 65.7 |
| Accounts payable | 336.2 | 490.1 | (31.4) | (110.6) | 39.7 | (378.6) |
| Other assets and liabilities | 236.2 | 304.9 | (22.5) | 111.5 | (40.7) | (374.0) |
| Income tax and social contribution | (95.2) | (70.5) | 35.0 | (381.5) | (434.7) | (12.2) |
| Interest on debt and derivative settlement | (42.4) | (589.0) | (92.8) | (2,554.8) | (1,383.8) | 84.6 |
| Lease payments | (110.6) | (88.7) | 24.7 | (427.8) | (425.4) | 0.6 |
| Other operating activities | (9.8) | (244.0) | (96.0) | (38.1) | (221.7) | (82.8) |
| Cash from continuing operations | 806.9 | 1,512.4 | (46.6) | (2,215.4) | (5.0) | 44,327.7 |
| Capex | (291.9) | (262.0) | 11.4 | (805.2) | (765.9) | 5.1 |
| Sale of assets | 507.7 | 66.5 | 663.5 | 524.4 | 70.6 | 642.8 |
| Exchange rate variation on cash balance | (190.6) | 2.9 | (6,672.4) | (288.9) | (309.8) | (6.7) |
| Free cash flow - continuing operations | 832.1 | 1,319.8 | (37.0) | (2,785.1) | (1,010.1) | 175.7 |
| Other financing and investing activities | (353.4) | 143.8 | (345.8) | 3,502.0 | 2,314.8 | 51.3 |
| Operating activities - discontinued operations | (45.7) | 118.8 | (138.5) | (435.5) | 343.6 | (226.7) |
| Payment of lease - principal - discontinued operations | (104.4) | (425.3) | (75.5) | (584.1) | (676.0) | (13.6) |
| Payment of borrowings - discontinued operations | - | (447.0) | - | - | (447.0) | - |
| Capex - discontinued operations | 86.1 | 233.1 | (63.1) | (141.9) | (337.0) | (57.9) |
| Cash balance variations | 414.6 | 943.2 | (56.0) | (444.6) | 188.3 | (336.1) |
In FY2023, free cash flow from continuing operation was BRL -2,785 million, mainly impacted by the -BRL 1.5 billion settlement of the derivatives related to the liability management exercise and a higher working capital consumption in the year.
Free Cash flow to firm in the same period was BRL +59 million (adding back the BRL -2,555 from interest on debt and derivative and BRL – 289 million from FX) vs. BRL -561 million reported in FY22 including TBS and Aesop.
The working capital was mainly impacted by:
- Accounts receivable, that consumed BRL 1,138 million vs. BRL 687 million in FY22. This result was mainly impacted by higher revenues sales in Natura Brazil (which is exposed to the longest receivable terms), plus a non-underlying impact from TBS receivable classification to third party
- Inventories, that showed a consumption of BRL 140 million compared to a cash release of BRL 486 million. The gross inventories cash release of BRL 282 million was more than offset by write-offs of BRL 422 million due to portfolio optimization in Latam Wave 2
Indebtedness ratios at both Natura &Co Holding and Natura Cosméticos
| R$ million | Natura Cosméticos S.A. | Natura &Co Holding S.A. | ||
| Q4-23 | Q4-22 | Q4-23 | Q4-22 | |
| Short-Term | 158.7 | 134.1 | 163.8 | 331.2 |
| Long-Term | 2,353.6 | 7,488.1 | 5,947.9 | 12,987.6 |
| Gross Debt a | 2,512.3 | 7,622.2 | 6,111.7 | 13,318.8 |
| Foreign currency hedging (Swaps) b | (52.3) | 86.4 | 5.7 | 120.0 |
| Total Gross Debt | 2,460.0 | 7,708.7 | 6,117.4 | 13,438.8 |
| (-) Cash, Cash Equivalents and Short-Term Investment c | (3,214.1) | (3,844.5) | (7,775.0) | (5,996.2) |
| (=) Net Debt | (754.2) | 3,864.2 | (1,657.6) | 7,442.6 |
| Indebtedness ratio excluding IFRS 16 effects | ||||
| Net Debt/EBITDA | -0.32x | 1.59x | -0.94x | 7.83x |
| Total Debt/EBITDA | 1.03x | 3.16x | 3.47x | 14.13x |
| Indebtedness ratio including IFRS 16 effects | ||||
| Net Debt/EBITDA | -0.30x | 1.25x | -0.79x | 3.49x |
| Total Debt/EBITDA | 0.97x | 2.50x | 2.92x | 6.30x |
The graph below shows the indebtedness trajectory on a quarterly basis since Q4-22.

Liability management
In Q4-23, Natura &Co Luxembourg Holding (Natura Lux) concluded the Tender Offer of USD 550m for Bonds with maturity in May 2028 and USD 330m for Bonds with Maturity in April 2029. The repayment was in line with the Company’s deleveraging plan following the completion of the sale of Aesop (see Material Fact dated April 3, 2023)
02 Natura & Co LATAM
- Q4-23 financial results underscore the Company’s firm commitment to achieving the strategic goals set for FY2023, with a particular focus on enhancing profitability rather than pursuing revenue growth. This approach resulted in a slight YoY revenue increase in CC, albeit with a minor decline when excluding Argentina, and marked improvements in profitability across each quarter of the year
- FY23 Revenue trends were shaped by robust performance in the Natura Brazil segment and decelerating yet positive growth in Natura Hispanic, primarily due to the commercial model adjustments in Mexico. Performance in the Avon segment showed volatility, influenced by the Wave 2 roll-outs in Brazil, Peru, and Colombia, and preparations for expansion into additional Latin American markets
- FY23 Profitability enhancements were principally attributed to gross margin expansion, driven by effective pricing strategies, product mix enhancements, portfolio optimization, and reductions in G&A expenses. These gains were partially balanced by a planned YoY increase in marketing investments
Wave 2 Status
- Brazil update – Wave 2 roll-out took place in August 2023 and led to a Q4-23 marked by enhanced productivity and cross-selling, coupled with a recovering distribution channel activity. This period saw the Natura brand revenue rise by 8.6%, while Avon CFT experienced a recovery trend, improving from a 24.8% YoY decline in Q3-23 to an 11.9% YoY decrease in Q4-23. Consequently, Q4-23 experienced improved consolidated CFT revenue growth YoY compared to Q3-23
- Initial challenges highlighted in Q3-23 have been addressed. These included: 1) resolving the backlog of delayed deliveries by early 2024, restoring on-time delivery and lead times for Avon and Natura brands to their pre-disruption levels; 2) reorganizing sales leadership which are showing promising signs of stabilization, with performance indicators now aligning with historical norms; and 3) improving the level of inventory shortage on a QoQ basis, despite the seasonal strong demand in Q4. Adjustments are ongoing as understanding of the new demand levels from the combined business improves
- Hispanic Latam update – During Q4-23, Peru and Colombia followed Brazil's trends, albeit with distinct recovery and maturity levels, while still noting improved consultant satisfaction. Lessons from Brazil, Peru, and Colombia were applied to the Wave 2 deployment in Chile, achieving a smoother implementation than seen in the other regions
Channel Performance in Latam
| Natura &Co Latam | Net revenue change (%) | Operational KPIs change(%) | ||
| Q4-23 vs. Q4-22 | Q4-23 vs. Q4-22 | |||
| CFT Natura | CFT Avon | Home & Style | Beauty Consultanta | |
| Δ% CC | Δ% CC | Δ% CC | Δ% | |
| Brazil | 8.6% | -11.9% | -40.7% | -15.3% |
| Hispanic | 48.7% | 0.7% | -27.1% | -18.1% |
| Total | 20.6% | -5.0% | -30.8% | -16.7% |
| a Considers the Average Available Beauty Consultants in the quarter |
- In Q4-23, Brazil experienced a 15.3% YoY reduction in consultants to 1.8 million, mainly due to the exit of the least productive consultants, consistent with trends from Q3-23. Further declines are anticipated due to the consultant availability waiver implemented post-Wave 2 roll-out, similar to adjustments in Peru and Colombia post-integration as outlined in the “Wave 2 Kick-Off Presentation”
- The Hispanic Latam region saw an 18.1% decrease in consultants YoY, led by cuts among the least productive in Peru and Colombia, yet showing signs of stabilization and recovery. Mexico's network, despite commercial model adjustments, is reporting smaller quarter-on-quarter declines
- The Latam region saw a 16.7% decrease in beauty consultants YoY, reflecting the Company's strategy to prioritize productivity enhancement over consultant quantity expansion
Natura Brand in Latam
- Natura Brazil experienced an 8.6% increase in Q4-23 revenues YoY, demonstrating strong performance despite operational challenges related to the Wave 2 roll-out. A significant inventory shortfall remained a primary obstacle, limiting regional performance. With improved inventory management, the brand's results would be enhanced
- In fourth quarter, a period characterized by strong seasonality, Brazil's non-direct selling channels (including retail and digital) saw significant growth, contributing to a larger share of total revenues and improved contribution margins
- Q4-23 retail sales in Brazil showed robust growth, fueled by impressive same-store sales and an accelerated pace of store openings. The brand expanded to 112 own stores (+22 compared to Q4-22) and 773 franchised stores (+125 compared to Q4-22), underscoring its potential for future growth
- Q4-23 digital sales, encompassing social selling, was up by 27% YoY as the brand adjusted its strategy across e-commerce and social selling platforms to enhance its omnichannel approach. A highlight was achieving the highest Share of Voice on TikTok during Black Friday
- Natura Hispanic Latam reported a 48.7% Q4-23 YoY revenue increase in CC but a 27.7% decrease in Brazilian Reais (BRL). Excluding Argentina, revenues in Hispanic markets remained broadly stable YoY in CC. Mexico faced challenges due to adjustments in its commercial model, while Chile experienced a dip in performance as it prepared for the early 2024 Wave 2 roll-out
Avon Brand in Latam (Beauty Category Only)
- Avon Brazil experienced an 11.9% YoY decline in Q4-23 revenues within the Beauty category, a lessening of the declining trend, attesting to a recovery path from Q3-23, which saw significant impacts from the Wave 2 roll-out across the region. Growth in the digital channel indicates positive prospects for future revenue and brand sustainability
- Avon Hispanic Latam’s revenue remained stable YoY in CC but fell 18.9% when excluding Argentina. This performance reflects ongoing challenges and similar trends to the previous quarter, particularly due to the preparation and execution of the Wave 2 roll-out. Specifically, temporary operational issues in Peru and Colombia adversely affected the brand's performance, though these have begun to stabilize in recent cycles
Home & Style in Latam
- Following the Wave 2 roll-out in Brazil, Peru, and Colombia, and its ongoing preparation in other regions, the Company’s Q4-23 Home & Style category mirrored Q3-23 trends, recording a 30.8% revenue decrease in CC from Q4-22. This decline was driven by decreases of 27.1% in the Hispanic market and 40.7% in Brazil, directly related to the portfolio optimization strategy
- Despite a significant decline in the Home & Style category, efforts to mitigate challenges are fostering recovery trends in channel activity. The Company continues to address the revenue impacts of this non-core category, aiming for improvement
Natura &Co Latam
| Natura &Co Latam (BRL million) | P&L | ||
| Q4-23 | Q4-22 | Ch. % | |
| Gross revenue | 6,571.3 | 7,886.9 | (16.7) |
| Net revenue | 4,882.2 | 5,943.2 | (17.9) |
| Constant currency | 8.5 | ||
| COGS | (1,797.4) | (2,410.3) | (25.4) |
| Gross profit | 3,084.8 | 3,532.9 | (12.7) |
| Gross margin | 63.2% | 59.4% | 380 bps |
| Selling, marketing and logistics expenses | (2,341.7) | (2,384.2) | (1.8) |
| Adminsitrative, R&D, IT and projects expenses | (349.9) | (874.7) | (60.0) |
| Other operating income / (expenses), net | 118.2 | (43.4) | (372.3) |
| Transformation / integration costs | (167.0) | (56.9) | 193.4 |
| Depreciation | 210.3 | 252.6 | (16.7) |
| EBITDA | 554.7 | 426.3 | 30.1 |
| EBITDA margin | 11.4% | 7.2% | 420 bps |
| Integration costs | 167.0 | 56.9 | 193.4 |
| Net non-recurring other (income)/ expenses | (164.3) | 43.4 | - |
| Adjusted EBITDA | 557.4 | 526.6 | 5.8 |
| Adjusted EBITDA margin | 11.4% | 8.9% | 250 bps |
- Q4-23 Revenue was up 8.5% YoY in CC, and down 17.9% in BRL, driven by healthy growth at the Natura brand in Brazil, still partially offset by the Home & Style category and by Avon adjustments across the region
- Gross margin in Q4-23 increased to 63.2%, +380 bps YoY, supported by ongoing price increases from
Q1-23, improved product mix, and marketing initiatives
- Fourth quarter's gross margin benefited from Natura brand's solid performance in Brazil, Avon Brazil's slowing declining trend, and significant gross margin expansion in Hispanic markets, amid adjustments to the commercial model
- Adjusted EBITDA margin in Q4-23 reached 11.4%, +250 bps increase YoY, due to significant gross margin growth and a considerable decrease in G&A expenses, which were elevated in 2022 due to expense phasing, partially offset by higher selling expenses
- Selling expenses in Q4-23 increased YoY as percentage of net revenues, continuing the previous quarter's trend, with additional marketing investments aiming to support channel stability following the implementation of Wave 2. The increase also reflects a BRL 204 million expense reallocation from G&A to Selling line
- Natura & Avon integration costs were BRL 167 million, of which ~30% were severance costs, 20% write-off of some Avon assets primarily driven by Avon Brazil acquisition made by Natura Cosméticos, and ~15% IT investments, with the remainder being Opex investments to integrate logistics and industry
- Following Argentina elections, the official ARS FX rate showed a steep and quick devaluation, which impacts fourth quarter given the accounting particularities of a hyperinflation economy. According to IAS 29, the inflation YTD and the FX end of period are used to translate each line of the YTD Argentina P&L (which in the case of Q4 implies the FY). However, 9M results were already published with a much stronger FX rate, implying that the FY FX end of period devaluation impacts in full the Q4 figures. See the table below for a reconciliation of these accounting effects:
| Q4-23 (ex-accounting) | Hiperinflation | FX EoP | Q4-23 (reported) | Q4-22 (ex-accounting) | Hiperinflation | FX EoP | Q4-22 (reported) | |||
| Net revenues | 5,882 | 209 | -1,209 | 4,882 | Net revenues | 6,087 | 282 | -425 | 5,943 | |
| Adjusted EBITDA | 822 | 104 | -369 | 557 | Adjusted EBITDA | 599 | 27 | -99 | 527 | |
| % Adj. EBITDA margin | 14.0% | 11.4% | % Adj. EBITDA margin | 9.8% | 8.9% |
- &Co Pay at Natura and Avon significantly enhanced Consultant’s financials in 2023, establishing another profitable source of revenue alongside cosmetics. The platform secured nearly 800,000 accounts since its inception and recorded a 60% YoY growth in TPV, reaching BRL 41 billion in FY23. This growth was accompanied by an increase in contribution margin and net income. Engagement with high-usage consultants - who show a 10% increase in productivity and a 30% reduction in default rates - expanded by nearly 50%. In the franchise network, &Co Pay was integrated into 600 stores (70% of the total), doubling its transaction volume to capture 40% of sell-out. Emana Pay Gateway further boosted Natura &Co Latam's performance, improving sales approval by ~3 percentage points and reducing chargebacks across all channels
03 Avon International
| Avon International Operational KPIs change (%) Q4-23 vs. Q4-22 | |
| Representatives | ||
| -11.2% |
| Avon International (BRL million) | P&L | ||
| Q4-23 | Q4-22 | Ch. % | |
| Gross revenue | 2,038.6 | 2,456.5 | (17.0) |
| Net revenue | 1,714.1 | 2,062.6 | (16.9) |
| Constant currency | (6.1) | ||
| COGS | (645.0) | (802.2) | (19.6) |
| Gross profit | 1,069.0 | 1,260.4 | (15.2) |
| Gross margin | 62.4% | 61.1% | 130 bps |
| Selling, marketing and logistics expenses | (683.6) | (853.5) | (19.9) |
| Administrative, R&D, IT and project expenses | (344.9) | (430.3) | (19.9) |
| Other operating income / (expenses), net | (664.0) | (316.9) | 109.5 |
| Transformation / integration costs | (60.9) | (59.5) | 2.4 |
| Depreciation | 154.0 | 176.0 | (12.5) |
| EBITDA | (530.3) | (223.8) | 136.9 |
| EBITDA margin | -30.9% | -10.9% | -2000 bps |
| Transformation costs | 60.9 | 59.5 | 2.4 |
| Restructuring costs - business unit/Impairment and Goodwill | 663.9 | 283.0 | 134.6 |
| Adjusted EBITDA | 194.5 | 118.7 | 63.9 |
| Adjusted EBITDA margin | 11.3% | 5.8% | 550 bps |
- Net revenue in Q4-23 was BRL 1,714 million (-6.1% YoY in CC) impacted by the expected reduction in number of active representatives (-11.2%) partially offset by improving productivity which benefited from higher pricing and mix
- Despite the reduction in the distribution channel, the Beauty category was broadly stable during Q4-23 at
-2.6% YoY, benefited by color and fragrances but offset by toiletries and face categories impacted by promotional execution which is now being gradually adjusted
- Home & Style showed a steeper decline from Q3-23, impacted by further portfolio adjustments undertaken during the quarter
- Innovation (new products) as percentage of Beauty revenues accelerated QoQ and YoY even taking into consideration the significant reduction of SKUs launches. This reinforces the Company’s strategy that fewer but better and more assertive product launches is the right long-term strategy for sustainable revenue and profitability evolution
- Avon International continues to make good progress with its digital strategy as the use of digital tools reached 34.3% of total reps (see distribution channel breakdown section – page 4). Digital sales penetration increased by 2.2 percentage points YoY to 8.3% of total revenue
- Gross margin was 62.4%, up 130 bps YoY, even with the tough comparison base of Q4-22, when gross margin was up 230 bps YoY. The margin evolution was driven by price increases and favorable product mix due to improved contribution of Beauty sales, innovation and on-trend products
- Adjusted EBITDA margin in Q4-23 reached 11.3%, +550 bps YoY, reflecting the gross margin expansion and a YoY decline in selling and G&A expenses (continuing to benefit from transformational savings). The YoY comparison base was easier as Q4-22 was significantly impacted by phasing of expenses, which helped margin expansion despite sales deleverage
- Transformation costs in fourth quarter were BRL 61 million, mainly related to R&D transformation and one-off consultancy costs. During Q4-23 the Company announced and executed further structural simplification with the entire business now being managed from two regions down from four regions previously
- From a cash conversion perspective, fourth quarter benefited from improved cash EBITDA and the sale of the Suffern R&D Center (proceeds of USD 39 million) following its closure in Q3-22 and partially offsetting transformational costs incurred in FY23. However, cash flow reflects higher capex investments (mainly focused on digital transformation) and working-capital dynamics particularly impacted by a receivable of USD 11 million from The Body Shop (that was previously accounted for as intercompany before TBS sale)
04 Social and environmental performance
(all actions refer to Natura &Co Group, unless stated otherwise)
Recognizing Natura &Co’s social achievements, the Company is proud to have reached its goal of providing a living wage for all employees across Natura &Co. This commitment extends beyond the notion of a minimum wage, embracing a comprehensive understanding of a dignified life that includes access to food, water, housing, education, healthcare, transportation, and other essential needs. Our approach reflects a deep commitment to improving the quality of life for our employees and their families, thereby contributing to the construction of a more equitable society. Natura &Co also maintained its commitment of closing its pay gap between men and women for the whole Group.
At the 2023 United Nations Climate Change Conference (COP28) in November in Dubai, Natura &Co was present advocating for the climate-nature nexus and raising voices for gender equality. COP28 was a crucial platform for Natura &Co to advocate for system-level change, including changes to policies, regulations, and culture. During COP28, our CEO Fábio Barbosa signed a letter on behalf of Natura &Co alongside over 1700 leaders from around the world which was delivered to the COP28 Presidency signaling the importance of delivering the strongest possible outcome to keep the threshold of 1.5 degrees within reach. There was a strong focus on the road from Dubai to Belém in preparation for COP30 where the Amazon will be the center of discussions for world leaders.
In preparation for COP29, representatives from Natura &Co, alongside over 80 women leaders from across the globe, endorsed the ‘We Mean Business’ letter from the We Mean Business Coalition, advocating for the inclusion of women in the Azerbaijan COP29 Organizing Committee. Gender diversity is crucial to successful negotiations and in response to the letter, COP29 host Azerbaijan has now included 12 women in its organizational committee.
Following the Company’s contribution to the development of the Taskforce on Nature-related Financial Disclosures (TNFD) framework and commitment from Fábio Barbosa at the New York Stock Exchange event during the New York Climate Week, Natura Cosméticos is one of the hundreds of businesses that have committed to adopting TNFD’s recommendations, marking a significant move towards harmonizing corporate disclosures on nature-related risks and impacts.
Business Units Update
Natura &Co Latin America
In 2023, Natura &Co Latin America embarked on a transformative journey, further solidifying its commitment to creating a more equitable, sustainable, and regenerative future. The Company achieved a significant milestone by eliminating salary disparities between men and women across Latin America and took an additional step in Brazil by addressing and eliminating racial pay gaps. This initiative underscores our dedication to fostering an inclusive workplace and sets a new standard for corporate responsibility within the region.
The Company’s environmental efforts have been equally impactful, with a notable focus on expanding Agroforestry Systems (AFS) for palm oil and implementing the 'Amazônia Viva Mechanism'. This innovative financial instrument is designed to lend resources for the development, expansion, and professionalization of Natura's bio-ingredient supplier chain in the Amazon across 44 communities. Employing a blended finance model, this initiative combines investment capital with philanthropic funds to create significant socio-environmental impact, illustrating our pioneering approach to sustainable development.
At COP28 in Dubai, Natura’s commitment to regeneration took center stage as Angela Pinhati, Head of Sustainability, introduced the Company’s new business strategy. This strategy is rooted in the broad concept of regeneration, which goes beyond sustainability to restore life to individuals, communities, nature, and their interconnections. Regeneration forms the core of our business philosophy, influencing our products, brands, and corporate actions, and is a testament to Natura’s commitment to well-being and sustainability.
Through these actions, Natura &Co Latin America continues to lead by example, advocating for systemic change and demonstrating an unwavering commitment to its vision. As the Company advances, it remains dedicated to its goals of fostering social equity, environmental regeneration, and sustainable development, paving the way for a better future for all.
Avon International
Avon International made significant progress on its climate reporting in 2023, disclosing against CDP Climate for the first time in five years, achieving a B score. Following the path and direction of Natura Cosméticos which maintained an A- score, it attests that Avon International is addressing the environmental impacts of its business and is on the correct path towards becoming an environmental leader. The scores achieved by both Natura Cosméticos and Avon International recognize the advancements both brands have made towards the adoption of the Taskforce for Financial-related Climate Disclosures (TCFD) framework.
Avon International launched a 16-day activism campaign in line with United Nations’ 16 Days of Activism where they shed light on the pervasive issue of Coercive Control, affecting 1 in 3 women who may experience sexual or physical violence in their lifetime. Avon’s powerful “The Reverse Makeup Tutorial” film raises awareness about gender-based abuse, illustrating how makeup can be used as a manipulative tool within relationships for control.
Avon’s make-up range is now Leaping Bunny approved, which means that the company has pledged to and has undergone independent verification for adhering to cruelty-free practices as outlined by the Leaping Bunny Program standards. Avon started its journey to Leaping Bunny approval in July 2023, when Avon Fragrance, Care, and Anew products received the Leaping Bunny label. And while the brand is delighted to celebrate another significant milestone in its animal welfare journey, it is not stopping there. Avon is actively progressing through its remaining product portfolio and is set to secure approval for all Avon beauty products within this year.
06 Performance including The Body Shop
| Pró-Forma | Profit and Loss by Business | |||||||||||
| R$ million | Consolidateda | Natura &Co Latam b | Avon International | The Body Shop | ||||||||
| Q4-23 c | Q4-22 c | Ch. % | Q4-23 c | Q4-22 c | Ch. % | Q4-23 c | Q4-22 c | Ch. % | Q4-23 c | Q4-22 c | Ch. % | |
| Gross revenue | 10,478.9 | 12,524.8 | (16.3) | 6,571.3 | 7,886.9 | (16.7) | 2,038.6 | 2,456.5 | (17.0) | 1,869.0 | 2,181.7 | (14.3) |
| Net revenue | 7,885.9 | 9,510.2 | (17.1) | 4,882.2 | 5,943.2 | (17.9) | 1,714.1 | 2,062.6 | (16.9) | 1,289.6 | 1,504.4 | (14.3) |
| COGS | (2,762.9) | (3,586.3) | (23.0) | (1,797.4) | (2,410.4) | (25.4) | (645.0) | (802.2) | (19.6) | (320.4) | (373.8) | (14.3) |
| Gross profit | 5,123.0 | 5,923.9 | (13.5) | 3,084.8 | 3,532.9 | (12.7) | 1,069.0 | 1,260.4 | (15.2) | 969.2 | 1,130.6 | (14.3) |
| Selling, marketing and logistics expenses | (3,647.0) | (4,008.4) | (9.0) | (2,341.7) | (2,384.2) | (1.8) | (683.6) | (853.5) | (19.9) | (621.6) | (770.8) | (19.4) |
| Administrative, R&D, IT and projects expenses | (918.1) | (1,564.5) | (41.3) | (349.9) | (874.7) | (60.0) | (344.9) | (430.3) | (19.9) | (223.4) | (256.2) | (12.8) |
| Corporate expenses | (94.8) | (121.0) | (21.6) | - | - | - | - | - | - | - | - | - |
| Other operating income / (expenses), net | (611.5) | (404.1) | 51.3 | 118.2 | (43.4) | (372.2) | (664.0) | (316.9) | 109.5 | (65.7) | (41.5) | 58.4 |
| Transformation / Integration / Group restructuring costs | (226.8) | (117.0) | 93.8 | (167.0) | (56.9) | 193.4 | (60.9) | (59.5) | 2.4 | - | - | - |
| Corporate Restructuring Cost | 1.2 | (0.2) | (715.6) | - | - | - | - | - | - | - | - | - |
| Depreciation | 529.0 | 609.4 | (13.2) | 210.3 | 252.6 | (16.7) | 154.0 | 176.0 | (12.5) | 164.6 | 180.8 | (8.9) |
| EBITDA | 153.9 | 318.3 | (51.6) | 554.7 | 426.2 | 30.2 | (530.3) | (223.7) | 137.0 | 223.1 | 242.9 | (8.1) |
| Depreciation | (529.0) | (609.4) | (13.2) | |||||||||
| Financial Income/(Expenses), Net | (644.9) | (525.9) | 22.6 | |||||||||
| Earnings Before Taxes | (1,020.0) | (817.0) | 24.8 | |||||||||
| Income Tax and Social Contribution | (560.9) | 34.3 | (1,737.2) | |||||||||
| Discontinued operations d | (1,084.6) | (107.6) | 908.2 | |||||||||
| Consolidated Net Income | (2,665.4) | (890.3) | 199.4 | |||||||||
| Non-controlling Interest | (1.0) | (0.0) | 3,737.3 | |||||||||
| Net Income Attributable to controlling shareholders | (2,666.4) | (890.3) | 199.5 | |||||||||
| Gross margin | 65.0% | 62.3% | 270 bps | 63.2% | 59.4% | 380 bps | 62.4% | 61.1% | 130 bps | 75.2% | 75.2% | 0 bps |
| Selling, marketing and logistics as % net revenue | 46.2% | 42.1% | 410 bps | 48.0% | 40.1% | 790 bps | 39.9% | 41.4% | -150 bps | 48.2% | 51.2% | -300 bps |
| Admin., R&D, IT and projects exp. as % net revenue | 11.6% | 16.5% | -490 bps | 7.2% | 14.7% | -750 bps | 20.1% | 20.9% | -80 bps | 17.3% | 17.0% | 30 bps |
| EBITDA margin | 2.0% | 3.3% | -130 bps | 11.4% | 7.2% | 420 bps | (30.9)% | (10.8)% | -2010 bps | 17.3% | 16.1% | 120 bps |
| Net margin | (33.8)% | (9.4)% | -2440 bps | - | - | - | - | - | - | - | - | - |
| a Consolidated results include Natura &Co Latam, Avon International and Natura &Co International (Luxembourg) |
| b Natura &Co Latam: includes Natura, Avon, TBS Brazil and Hispanic Latam and &Co Pay, as well as the Natura subsidiaries in the U.S., France and the Netherlands. |
| c Includes PPA – Purchase Price Allocation effects |
| d Related to business separation at Avon North America |
| Pró-Forma | Profit and Loss by Business | |||||||||||
| R$ million | Consolidateda | Natura &Co Latam b | Avon International | The Body Shop | ||||||||
| 12M-23 c | 12M-22 c | Ch. % | 12M-23 c | 12M-22 c | Ch. % | 12M-23 c | 12M-22 c | Ch. % | 12M-23 c | 12M-22 c | Ch. % | |
| Gross Revenue | 40,044.5 | 44,067.3 | (9.1) | 27,220.8 | 29,158.1 | (6.6) | 7,488.0 | 8,728.7 | (14.2) | 5,335.6 | 6,180.9 | (13.7) |
| Net Revenue | 30,496.9 | 33,630.5 | (9.3) | 20,440.8 | 22,027.3 | (7.2) | 6,286.7 | 7,195.9 | (12.6) | 3,769.3 | 4,407.2 | (14.5) |
| COGS | (10,556.5) | (12,803.2) | (17.5) | (7,395.3) | (8,880.2) | (16.7) | (2,287.3) | (2,890.6) | (20.9) | (874.0) | (1,032.5) | (15.4) |
| Gross Profit | 19,940.4 | 20,827.3 | (4.3) | 13,045.6 | 13,147.1 | (0.8) | 3,999.5 | 4,305.4 | (7.1) | 2,895.3 | 3,374.7 | (14.2) |
| Selling, Marketing and Logistics Expenses | (13,859.5) | (14,815.4) | (6.5) | (8,884.3) | (8,950.4) | (0.7) | (2,738.0) | (3,213.3) | (14.8) | (2,237.2) | (2,651.6) | (15.6) |
| Administrative, R&D, IT and Projects Expenses | (4,747.8) | (5,417.0) | (12.4) | (2,456.9) | (3,011.0) | (18.4) | (1,438.9) | (1,410.6) | 2.0 | (852.0) | (965.4) | (11.8) |
| Corporate Expenses | (323.4) | (392.1) | (17.5) | - | - | - | - | - | - | - | - | - |
| Other Operating Income/ (Expenses), Net | (769.2) | (253.0) | 204.0 | 111.9 | 70.4 | 58.9 | (711.0) | (225.7) | 214.9 | (170.0) | (86.2) | 97.3 |
| Transformation/Integration costs | (770.1) | (640.9) | 20.2 | (498.2) | (256.2) | 94.5 | (270.7) | (214.3) | 26.4 | - | - | - |
| Corporate Restructuring Cost | (0.7) | (158.5) | (99.5) | - | - | - | - | - | - | - | - | - |
| Depreciation | 2,259.5 | 2,288.0 | (1.2) | 921.5 | 912.4 | 1.0 | 665.7 | 683.8 | (2.7) | 672.3 | 692.1 | (2.9) |
| EBITDA | 1,729.9 | 1,596.9 | 8.3 | 2,239.6 | 1,912.4 | 17.1 | (493.5) | (74.7) | 560.8 | 308.4 | 363.6 | (15.2) |
| Depreciation | (2,259.5) | (2,288.0) | (1.2) | |||||||||
| Financial Income/(Expenses), Net | (2,588.2) | (1,866.7) | 38.7 | |||||||||
| Earnings Before Taxes | (3,117.9) | (2,557.8) | 21.9 | |||||||||
| Income Tax and Social Contribution | 219.7 | (53.1) | (513.7) | |||||||||
| Discontinued operations d | 5,872.7 | (247.7) | (2,470.5) | |||||||||
| Consolidated Net Income | 2,974.5 | (2,858.7) | (204.1) | |||||||||
| Non-controlling Interest | (0.8) | (1.0) | (22.3) | |||||||||
| Net Income Attributable to controlling shareholders | 2,973.7 | (2,859.7) | (204.0) | |||||||||
| Gross Margin | 65.4% | 61.9% | 350 bps | 63.8% | 59.7% | 410 bps | 63.6% | 59.8% | 380 bps | 76.8% | 76.6% | 20 bps |
| Selling, Marketing and Logistics Exp./Net Revenue | 45.4% | 44.1% | 130 bps | 43.5% | 40.6% | 290 bps | 43.6% | 44.7% | -110 bps | 59.4% | 60.2% | -80 bps |
| Admin., R&D, IT, and Projects Exp./Net Revenue | 15.6% | 16.1% | -50 bps | 12.0% | 13.7% | -170 bps | 22.9% | 19.6% | 330 bps | 22.6% | 21.9% | 70 bps |
| EBITDA Margin | 5.7% | 4.7% | 100 bps | 11.0% | 8.7% | 230 bps | (7.8)% | (1.0)% | -680 bps | 8.2% | 8.3% | -10 bps |
| Net Margin | 9.8% | (8.5)% | 1830 bps | - | - | - | - | - | - | - | - | - |
| a Consolidated results include Natura &Co Latam, Avon International and Natura &Co International (Luxembourg) |
| b Natura &Co Latam: includes Natura, Avon, TBS Brazil and Hispanic Latam and &Co Pay, as well as the Natura subsidiaries in the U.S., France and the Netherlands. |
| c Includes PPA – Purchase Price Allocation effects |
| d Related to business separation at Avon North America |
07 Capital Markets and Stock Performance
NTCO3 share price on the Brazilian stock exchange (B3) at the end of Q4-23 was BRL 16.89, +16.0% in the quarter. Average Daily Trading Volume (ADTV) for the quarter was BRL 154.9 million, -26.1% vs Q4-22. NTCO traded on NYSE at USD 6.84 at the end of Q4-23,+18.5% in the quarter.
On December 31, 2023, the Company’s market capitalization was BRL 23.4 billion, and the Company’s capital was comprised of 1,386,848,066 common shares.
In January 2024, the Company announced its delisting from the NYSE. NTCO last day of trading was February 9, 2024.
08 Fixed income
Below is a table with details of all public debt instruments outstanding per issuer as of Dec 31, 2023:
| Issuer | Type | Issuance | Maturity | Principal (million) | Nominal Cost (per year) |
| 6/10/2022 | 9/15/2027 | BRL 255.9 million | DI + 0.8 per year | ||
| Natura Cosméticos S.A. | Debenture - 12th issue | 6/10/2022 | 9/15/2029 | BRL 487.2 million | IPCA + 6.80% |
| 6/10/2022 | 09/15/2032 | BRL 306.9 million | IPCA + 6.90% | ||
| Natura Cosméticos S.A. | Commercial Notes | 9/19/2022 | 9/19/2025 | BRL 500.0 million | DI + 1.55 per year |
| Natura &Co Luxemburg Holding (Natura Lux) | Club Loan | 11/14/2022 | 11/14/2025 | SOFR + 2.47% | |
| Natura Cosméticos S.A. | Debenture - 11th issue | 7/21/2022 | 7/21/2027 | BRL 826.0 million | DI + 1.65 per year |
| Natura &Co Luxemburg Holding (Natura Lux) | Bond - 2nd issue (Sustainability Linked Bond) | 5/3/2021 | 5/3/2028 | US$ 450.0 million | 4.125% |
| Natura &Co Luxemburg Holding (Natura Lux) | Bonds | 4/19/2022 | 4/19/2029 | US$ 270.0 million | 6.00% |
| Issuer: Avon Products, Inc. | Unsecured Bonds | 3/15/2013 | 3/15/2043 | US$ 21.8 million | 8.450%(1) |
(1) Coupon based on current credit ratings, governed by interest rate adjustment clause
Ratings
Below is a table with current credit ratings:
| Natura &Co Holding S.A. | |||
| Agency | Global Scale | National Scale | Outlook |
| Standard & Poor's | BB | AAA | Stable |
| Fitch Ratings | BB | AA+ | Positive |
| Moody's | Ba3 | - | Negative |
| Natura &Co Cosméticos S.A. | |||
| Agency | Global Scale | National Scale | Outlook |
| Standard & Poor's | BB | AAA | Stable |
| Fitch Ratings | BB | AA+ | Positive |
| Moody's | Ba2 | - | Negative |
| Avon International | |||
| Agency | Global Scale | National Scale | Outlook |
| Standard & Poor's | BB- | - | Stable |
| Fitch Ratings | BB | - | Positive |
| Moody's | Ba3 | - | Negative |
09 Appendix
Natura &Co Latam Revenue Breakdown
| Natura &Co Latam | Net Revenue change (%) | |
| Q4-23 vs. Q4-22 | ||
| Reported (R$) | Constant Currency | |
| Natura Latama | -17.9% | 8.5% |
| Natura Brazil | 8.6% | 8.6% |
| Natura Hispanic | -27.7% | 48.6% |
| Avon Latam | -48.2% | 39.9% |
| Avon Brazil | -17.9% | -17.9% |
| Avon Hispanic | -59.5% | -9.8% |
Free Cash Flow Reconciliation
The correspondence between Free Cash Flow and Statements of Cash Flow is shown below:
| R$ million | Free Cash Flow Reconciliation | ||||||||
| CASH FLOW FROM OPERATING ACTIVITIES | |||||||||
| Net (loss) income for the period | (a) | Net income | |||||||
| Adjustments to reconciliate net (loss) income for the period with net cash used in operating activities: | |||||||||
| Depreciation and amortization | (b) | Depreciation/amortization | |||||||
| Interest and exchange variation on short-term investments | (c) | Non-cash adjustments to net income | |||||||
| Loss from swap and forward derivative contracts | (c) | ||||||||
| Increse (reversion) of provision for tax, civil and labor risks | (c) | ||||||||
| Monetary adjustment of judicial deposits | (c) | ||||||||
| Monetary adjustment of provision for tax, civil and labor risks | (c) | ||||||||
| Income tax and social contribution | (c) | ||||||||
| Income from sale and write-off of property, plant and equipment and intagible | (c) | ||||||||
| Interest and exchange rate variation on leases | (c) | ||||||||
| Interest and exchange rate variation on borrowings, financing and debentures, net of acquisition costs | (c) | ||||||||
| Adjustment and exchange rate variation on other assets and liabilities | (c) | ||||||||
| Provision (reversal) for losses on property, plant and equipment, intangible assets and leases | (c) | ||||||||
| Provision for impairment | (c) | ||||||||
| Increase (reversion) of provision for stock option plans | (c) | ||||||||
| Provision for losses with trade accounts receivables, net of reversals | (c) | ||||||||
| Provision for inventory losses, net of reversals | (c) | ||||||||
| Provision for carbon credits | (c) | ||||||||
| Effect from hyperinflationary economy | (c) | ||||||||
| Reversal of fair value recognized in business combinations | (c) | ||||||||
| Increase (Decrease) in: | |||||||||
| Trade accounts receivable and related parties | (d2) | Accounts receivable | |||||||
| Inventories | (d1) | Inventories | |||||||
| Recoverable taxes | (d4) | Other Assets and Liabilities | |||||||
| Other assets | (d4) | Other Assets and Liabilities | |||||||
| Domestic and foreign trade accounts payable and related parties | (d3) | Accounts payable | |||||||
| Payroll, profit sharing and social charges, net | (d4) | Other Assets and Liabilities | |||||||
| Tax liabilities | (d4) | Other Assets and Liabilities | |||||||
| Other liabilities | (d4) | Other Assets and Liabilities | |||||||
| OTHER CASH FLOWS FROM OPERATING ACTIVITIES | |||||||||
| Payment of income tax and social contribution | (e) | Income Tax and Social Contribuion | |||||||
| Release of judicial deposits | (h) | Other Operating Activities | |||||||
| Payments related to tax, civil and labor lawsuits | (h) | ||||||||
| (Payments) proceeds due to settlement of derivative transactions | (f) | Interest on Debt and derivative settlement | |||||||
| Payment of interest on lease | (g) | Lease Payments | |||||||
| Payment of interest on borrowings, financing and debentures | (f) | Interest on Debt and derivative settlement | |||||||
| Operating Activities Discontinued Operations | (m) | Operating activities - discountinued operations | |||||||
| NET CASH (USED IN) OPERATING ACTIVITIES | |||||||||
| Free Cash Flow | Cash Flow Reconciliation | ||||||||
| CASH FLOW FROM INVESTING ACTIVITIES | Net income (loss) | (a) | |||||||
| Additions of property, plant and equipment and intangible | (j) | Capex | Depreciation and amortization | (b) | |||||
| Proceeds from sale of property, plant and equipment and intangible | (i) | Capex | Non-cash Adjustments to Net Income | (c) | |||||
| Short-term acquisition | (j) | Sale of Assets | Operating activities - discontinued operations | (m) | |||||
| Redemption of short-term investments | (l) | Other financing and investing activities | Adjusted Net income | ||||||
| Redemption of interest on short-term investments | (l) | Decrease / (Increase) in Working Capital | (d) | ||||||
| Investing activities - discontinued operations | (o) & (l) | Capex - discountinued operations & Other financing and investing activities | Inventories | (d1) | |||||
| Accounts receivable | (d2) | ||||||||
| NET CASH GENERATED BY (USED IN) INVESTING ACTIVITIES | Accounts payable | (d3) | |||||||
| Other assets and liabilities | (d4) | ||||||||
| CASH FLOW FROM FINANCING ACTIVITIES | Income tax and social contribution | (e) | |||||||
| Repayment of lease - principal | (g) | Lease payments | Interest on debt and derivative settletment | (f) | |||||
| Repayment of borrowings, financing and debentures – principal | (l) | Other financing and investing activities | Lease payments | (g) | |||||
| New borrowings, financing, and debentures | (l) | Other operating activities | (h) | ||||||
| Acquisition of treasury shares, net of receipt of option strike price | (l) | Cash from Operations | |||||||
| Payment of dividends and interest on equity | (l) | Capex | (j) | ||||||
| Receipt (payment) of funds due to settlement of derivative transactions | (l) | Sale of Assets | (i) | ||||||
| Capital Increase | (l) | Exchange rate variation | (k) | ||||||
| Financing activities - discontinued operations | (n) | Payment of lease - discountinued operations | Free Cash Flow | ||||||
| NET CASH PROVIDED BY (USED IN) FINANCING ACTIVITIES | Other financing and investing activities | (l) | |||||||
| Effect of exchange rate variation on cash and cash equivalents | (k) | Exchange Rate Effect | Payment of lease - principal discountinued operation | (n) | |||||
| DECREASE IN CASH AND CASH EQUIVALENTS | Capex - discountinued operation | (o) | |||||||
| Opening balance of cash and cash equivalents | Cash Balance Variation | ||||||||
| Closing balance of cash and cash equivalents | |||||||||
| DECREASE IN CASH AND CASH EQUIVALENTS | |||||||||
Consolidated Balance Sheet
| ASSETS (R$ million) | Dec-23 | Dec-22 | LIABILITIES AND SHAREHOLDER'S EQUITY (R$ million) | Dec-23 | Dec-22 | |
| CURRENT ASSETS | CURRENT LIABILITIES | |||||
| Cash and cash equivalents | 3,750.9 | 4,195.7 | Borrowings, financing and debentures | 163.8 | 331.2 | |
| Short-term investments | 4,024.1 | 1,800.4 | Lease | 298.6 | 878.4 | |
| Trade accounts receivable | 3,524.4 | 3,502.4 | Trade accounts payable and reverse factoring operations | 5,302.5 | 6,375.9 | |
| Accounts receivable - sale of subsidiary | 22.9 | - | Dividends and interest on shareholders' equity payable | 294.2 | 0.3 | |
| Inventories | 3,087.4 | 4,516.9 | Payroll, profit sharing and social charges | 1,019.7 | 1,277.0 | |
| Recoverable taxes | 608.5 | 911.4 | Tax liabilities | 634.8 | 828.1 | |
| Income tax and social contribution | 175.6 | 196.1 | Income tax and social contribution | 908.4 | 70.3 | |
| Derivative financial instruments | 189.0 | 235.1 | Derivative financial instruments | 329.7 | 1,614.0 | |
| Other current assets | 604.4 | 763.4 | Provision for tax, civil and labor risks | 491.3 | 463.7 | |
| Assets held for sale | - | 0.1 | Other current liabilities | 970.5 | 1,499.1 | |
| Total current assets | 15,987.2 | 16,121.5 | Total current liabilities | 10,413 | 13,337.9 | |
| NON CURRENT ASSETS | NON CURRENT LIABILITIES | |||||
| Accounts receivable - sale of subsidiary | 806.6 | - | Borrowings, financing and debentures | 5,947.9 | 13,261.1 | |
| Recoverable taxes | 1,112.4 | 1,356.9 | Lease | 851.8 | 2,392.3 | |
| Deferred income tax and social contribution | 2,200.7 | 3,519.5 | Payroll, profit sharing and social charges | 16.1 | 26.2 | |
| Judicial deposits | 408.0 | 457.6 | Tax liabilities | 127.2 | 117.4 | |
| Derivative financial instruments | 89.5 | 773.3 | Deferred income tax and social contribution | 328.1 | 934.4 | |
| Short-term investments | 36.7 | 35.2 | Derivative financial instruments | - | 191.3 | |
| Other non-current assets | 1,027.7 | 1,252.4 | Provision for tax, civil and labor risks | 1,255.5 | 1,322.2 | |
| Total long term assets | 5,681.5 | 7,394.9 | Other non-current liabilities | 686.5 | 751.6 | |
| Property, plant and equipment | 3,457.6 | 4,966.2 | Total non-current liabilities | 9,213.1 | 18,996.3 | |
| Intangible | 16,569.9 | 23,261.0 | SHAREHOLDERS' EQUITY | |||
| Right of use | 1,050.8 | 2,941.9 | Capital stock | 12,484.5 | 12,484.4 | |
| Total non-current assets | 26,760 | 38,564 | Treasury shares | (164.2) | (262.4) | |
| Capital reserves | 10,467 | 10,540.9 | ||||
| Accumulated losses | 780.3 | 0.0 | ||||
| Other comprehensive income | 0.0 | (1,994.6) | ||||
| Shareholders' equity attributed to the Company's shareholders | (463.8) | 1,564 | ||||
| Equity attributable to owners of the Company | 23,103.2 | 22,332.7 | ||||
| Non-controlling interest in shareholders' equity of subsidiaries | 17.2 | 18.5 | ||||
| TOTAL ASSETS | 42,747.0 | 54,685.4 | TOTAL LIABILITIES AND SHAREHOLDERS' EQUITY | 42,747.0 | 54,685.4 |
Consolidated Income Statement- Including Purchase Price Allocation (PPA) Amortization
| R$ million | Q4-23 | Q4-22 | Ch. % | 2023 | 2022 | Ch. % |
| NET REVENUE | 6,613.4 | 8,005.9 | (17.4) | 26,737.3 | 29,223.7 | (8.5) |
| Cost of Products Sold | (2,444.8) | (3,212.5) | (23.9) | (9,675.4) | (11,770.8) | (17.8) |
| GROSS PROFIT | 4,168.6 | 4,793.4 | (13.0) | 17,061.8 | 17,452.9 | (2.2) |
| OPERATING EXPENSES | ||||||
| Selling, Marketing and Logistics Expenses | (3,023.2) | (3,237.7) | (6.6) | (11,015.9) | (11,558.9) | (4.7) |
| Administrative, R&D, IT and Project Expenses | (699.1) | (1,318.4) | (47.0) | (4,225.0) | (5,023.6) | (15.9) |
| Impairment losses on trade receivables | (146.2) | (141.0) | 3.7 | (605.9) | (604.8) | 0.2 |
| Other Operating Expenses, Net | (720.1) | (459.5) | 56.7 | (1,369.9) | (649.2) | 111.0 |
| LOSS FROM OPERATIONS BEFORE FINANCIAL RESULT | (420.1) | (363.3) | 15.6 | (154.8) | (383.6) | (59.6) |
| Net Financials | (629.9) | (496.9) | 26.8 | (2,513.5) | (1,785.0) | 40.8 |
| LOSS BEFORE INCOME TAX AND SOCIAL CONTRIBUTION | (1,050.0) | (860.2) | 22.1 | (2,668.3) | (2,168.6) | 23.0 |
| Income Tax and Social Contribution | (580.3) | 90.7 | (739.8) | 86.4 | (92.4) | (193.6) |
| (LOSS) INCOME FROM CONTINUED OPERATIONS | (1,630.3) | (769.5) | 111.9 | (2,581.9) | (2,261.0) | 14.2 |
| Income (Loss) from discontinued operations | (1,031.5) | (120.9) | 753.2 | 5,556.5 | (597.7) | (1,029.7) |
| (LOSS) INCOME FOR THE PERIOD | (2,661.8) | (890.4) | 198.9 | 2,974.5 | (2,858.6) | (204.1) |
| Attributable to controlling shareholders | (2,660.8) | (890.4) | 198.8 | 2,973.7 | (2,859.6) | (204.0) |
| Attributable to non-controlling shareholders | (1.0) | 0 | - | 0.8 | 1.0 | (22.3) |
Purchase Price Allocation (PPA) Amortization
| Consolidated | Natura &Co Latam | Avon International | ||||
| R$ million | Q4-23 | Q4-22 | Q4-23 | Q4-22 | Q4-23 | Q4-22 |
| Net Revenue | - | - | - | - | - | - |
| Cost of Products Sold | (1.6) | (1.8) | (1.0) | (0.6) | (0.6) | (1.2) |
| Gross Profit | (1.6) | (1.8) | (1.0) | (0.6) | (0.6) | (1.2) |
| Selling, Marketing and Logistics Expenses | (62.0) | (64.1) | (32.5) | (32.0) | (29.5) | (32.1) |
| Administrative, R&D, IT and Project Expenses | (71.8) | (66.7) | (1.2) | 2.1 | (70.6) | (68.8) |
| Other Operating Income (Expenses), Net | (841.1) | (293.1) | (177.2) | 5.0 | (663.9) | (298.2) |
| Financial Income/(Expenses), net | (5.0) | 14.6 | - | - | - | - |
| Income Tax and Social Contribution | (80.0) | 43.6 | - | - | - | - |
| LOSS FROM CONTINUED OPERATIONS | (1,061.5) | (367.5) | (211.8) | (25.5) | (764.7) | (400.3) |
| Depreciation | (135.4) | (136.1) | (34.6) | (33.9) | (100.8) | (102.1) |
Consolidated Statement of Cash Flow
| R$ million | 2023 | 2022 |
| CASH FLOW FROM OPERATING ACTIVITIES | ||
| Net (loss) income for the period | 2,974.5 | (2,858.6) |
| Adjustments to reconciliate net (loss) income for the period with net cash used in operating activities: | ||
| Depreciation and amortization | 1,588.0 | 1,596.3 |
| Interest and exchange variation on short-term investments | (977.2) | (537.3) |
| Loss from swap and forward derivative contracts | 1,791.9 | 992.8 |
| Increse (reversion) of provision for tax, civil and labor risks | 71.2 | 28.8 |
| Monetary adjustment of judicial deposits | (28.5) | (35.5) |
| Monetary adjustment of provision for tax, civil and labor risks | 73.0 | 79.3 |
| Income tax and social contribution | (86.4) | 119.6 |
| Income from sale and write-off of property, plant and equipment and intagible | 174.2 | 55.7 |
| Interest and exchange rate variation on leases | 187.4 | 115.9 |
| Interest and exchange rate variation on borrowings, financing and debentures, net of acquisition costs | 517.5 | 348.7 |
| Adjustment and exchange rate variation on other assets and liabilities | 2.8 | 2.8 |
| Provision (reversal) for losses on property, plant and equipment, intangible assets and leases | 22.0 | 34.2 |
| Provision for impairment | 663.9 | 282.9 |
| Increase (reversion) of provision for stock option plans | 118.9 | 258.5 |
| Provision for losses with trade accounts receivables, net of reversals | 605.9 | 606.0 |
| Provision for inventory losses, net of reversals | 422.5 | 305.7 |
| Provision for carbon credits | (12.5) | (17.9) |
| Effect from hyperinflationary economy | 117.6 | 349.9 |
| Reversal of fair value recognized in business combinations | (206.2) | 12.5 |
| Increase (Decrease) in: | ||
| Trade accounts receivable and related parties | (1,137.7) | (686.7) |
| Inventories | (140.4) | 485.8 |
| Recoverable taxes | 491.0 | 106.2 |
| Other assets | (406.7) | 197.0 |
| Domestic and foreign trade accounts payable and related parties | (110.6) | 39.7 |
| Payroll, profit sharing and social charges, net | 41.5 | (19.8) |
| Tax liabilities | (8.8) | 46.7 |
| Other liabilities | (5.5) | (370.9) |
| OTHER CASH FLOWS FROM OPERATING ACTIVITIES | 6,743.3 | 1,538.4 |
| Payment of income tax and social contribution | (381.5) | (434.7) |
| Release of judicial deposits | 21.7 | 40.1 |
| Payments related to tax, civil and labor lawsuits | (59.9) | (125.6) |
| (Payments) proceeds due to settlement of derivative transactions | (1,487.1) | (594.2) |
| Payment of interest on lease | (124.5) | (148.3) |
| Payment of interest on borrowings, financing and debentures | (1,067.7) | (789.6) |
| Operating Activities Discontinued Operations | (5,992.0) | 1,185.5 |
| NET CASH (USED IN) OPERATING ACTIVITIES | -2,347.7 | 671.5 |
| CASH FLOW FROM INVESTING ACTIVITIES | ||
| Additions of property, plant and equipment and intangible | (947.1) | (765.9) |
| Proceeds from sale of property, plant and equipment and intangible | 524.4 | 14.8 |
| Short-term acquisition | (18,867.6) | (12,764.0) |
| Redemption of short-term investments | 16,744.7 | 12,927.8 |
| Redemption of interest on short-term investments | 212.0 | 152.4 |
| Investing activities - discontinued operations | 12,287.2 | (337.0) |
| NET CASH GENERATED BY (USED IN) INVESTING ACTIVITIES | 9,953.6 | (771.8) |
| CASH FLOW FROM FINANCING ACTIVITIES | ||
| Repayment of lease - principal | (303.3) | (277.1) |
| Repayment of borrowings, financing and debentures – principal | (8,057.7) | (6,379.6) |
| New borrowings, financing, and debentures | 1,494.1 | 8,557.5 |
| Acquisition of treasury shares, net of receipt of option strike price | 0.0 | (120.3) |
| Payment of dividends and interest on equity | 0.0 | (180.5) |
| Receipt (payment) of funds due to settlement of derivative transactions | (310.9) | 118.7 |
| Capital Increase | 0.1 | 2.7 |
| Financing activities - discontinued operations | (584.1) | (1,123.0) |
| NET CASH PROVIDED BY (USED IN) FINANCING ACTIVITIES | (7,761.8) | 598.5 |
| Effect of exchange rate variation on cash and cash equivalents | (288.9) | (309.8) |
| DECREASE IN CASH AND CASH EQUIVALENTS | (444.8) | 188.5 |
| Opening balance of cash and cash equivalents | 4,195.7 | 4,007.3 |
| Closing balance of cash and cash equivalents | 3,750.9 | 4,195.7 |
| DECREASE IN CASH AND CASH EQUIVALENTS | (444.8) | 188.5 |
08 Conference call and webcast
09 Glossary
ADR: An American Depositary Receipt is a negotiable certificate issued by a U.S. depository bank representing a specified number of shares of a non-U.S. company stock.
ADS: The individual issuance of shares in a U.S. stock exchange by a non-U.S. company is referred to as American Depositary Shares (ADS)
Adjusted EBITDA: Excludes effects that are not considered usual, recurring or not-comparable between the periods under analysis
APAC: Asia and Pacific
ARS: the foreign exchange market symbol for the Argentine peso
Avon representatives: Self-employed resellers who do not have a formal labor relationship with Avon
B3: Brazilian Stock Exchange
BPS: Basis Points; a basis points is equivalent to one percentage point * 100
Brand Power: A methodology used by Natura &Co to measure how its brands are perceived by consumers, based on metrics of significance, differentiation and relevance.
BRL: Brazilian Reais
CDI: The overnight rate for interbank deposits
CEE: Central and Eastern Europe
CFT: Cosmetics, Fragrances and Toiletries Market (CFT = Fragrances, Body Care and Oil Moisture, Make-up (without Nails), Face Care, Hair Care (without Colorants), Soaps, Deodorants, Men’s Grooming (without Razors) and Sun Protection
COGS: Costs of Goods Sold
Constant currency (“CC) or constant exchange rates: when exchange rates used to convert financial figures into a reporting currency are the same for the years under comparison, excluding foreign currency fluctuation effects
CO2e: Carbon dioxide equivalent; for any quantity and type of greenhouse gas, CO2e signifies the amount of CO2 which
would have the equivalent global warming impact.
EBITDA: Earnings Before Interests, Tax, Depreciation and Amortization
EMEA: Europe, Middle East and Africa
EP&L: Environmental Profit & Loss
Foreign currency translation: conversion of figures from a foreign currency into the currency of the reporting entity
FX: foreign exchange
FY: fiscal year
G&A: General and administrative expenses
IAS 29: “Financial Reporting in Hyperinflationary Economies' requires the financial statements of any entity whose functional currency is the currency of a hyperinflationary economy to be restated for changes in the general purchasing power of that currency so that the financial information provided is more meaningful
IBOV: Ibovespa Index is the main performance indicator of the stocks traded in B3 and lists major companies in the Brazilian capital market
IFRS – International Financial Reporting Standards
Hispanic Latam: Often used to refer to the countries in Latin America, excluding Brazil
NYSE: New York Stock Exchange
P&L: Profit and loss
PP: Percentage point
PPA: Purchase Price Allocation - effects of the fair market value assessment as a result of a business combination
Profit Sharing: The share of profit allocated to employees under the profit-sharing program
Quarter on quarter (“QoQ): is a measuring technique that calculates the change between one fiscal quarter and the previous fiscal quarter
SEC: The U.S. Securities and Exchange Commission (SEC) is an independent federal government regulatory agency responsible for protecting investors, maintaining fair and orderly functioning of the securities markets, and facilitating capital formation
SG&A: Selling, general and administrative expenses
TBS: The Body Shop.
Task Force on Climate-Related Financial Disclosures (“TCFD): climate-related disclosure recommendations enable stakeholders to understand carbon-related assets and their exposures to climate-related risks
Task force on Nature-related Financial Disclosures (“TNFD): The TNFD Framework seeks to provide organisations and financial institutions with a risk management and disclosure framework to identify, assess, manage and report on nature-related dependencies, impacts, risks and opportunities ("nature-related issues"), encouraging organisations to integrate nature into strategic and capital allocation decision making
TPV: Total Payment Volume
UNI: Underlying Net Income, which is net income excluding transformation costs, restructuring costs, discontinued operations and PPA effects
Year-over-year (“YOY): is a financial term used to compare data for a specific period of time with the corresponding period from the previous year. It is a way to analyze and assess the growth or decline of a particular variable over a twelve-month period
Year to date (“YTD): refers to the period of time beginning the first day of the current calendar year or fiscal year up to the current date. YTD information is useful for analyzing business trends over time or comparing performance data to competitors or peers in the same industry
10 Disclaimer
EBITDA is not a measure under BR GAAP and does not represent cash flow for the periods presented. EBITDA should not be considered an alternative to net income as an indicator of operating performance or an alternative to cash flow as an indicator of liquidity. EBITDA does not have a standardized meaning and the definition of EBITDA used by Natura may not be comparable with that used by other companies. Although EBITDA does not provide under BR GAAP a measure of cash flow, Management has adopted its use to measure the Company’s operating performance. Natura also believes that certain investors and financial analysts use EBITDA as an indicator of performance of its operations and/or its cash flow.
This report contains forward-looking statements. These forward-looking statements are not historical fact, but rather reflect the wishes and expectations of Natura’s management. Words such as “anticipate,” “wish,” “expect,” “foresee,” “intend,” “plan,” “predict,” “project,” “desire” and similar terms identify statements that necessarily involve known and unknown risks. Known risks include uncertainties that are not limited to the impact of price and product competitiveness, the acceptance of products by the market, the transitions of the Company’s products and those of its competitors, regulatory approval, currency fluctuations, supply and production difficulties and changes in product sales, among other risks. This report also contains certain pro forma data, which are prepared by the Company exclusively for informational and reference purposes and as such are unaudited. This report is updated up to the present date and Natura does not undertake to update it in the event of new information and/or future events.
Investor Relations Team
ri@natura.net
Fourth-QuarterAnd Full-Year2023 ResultsMarch 12, 2024
 .
.
Disclaimer This presentation may contain forward-looking statements. Such statements are not statements of historical facts and reflect the beliefs and expectations of Natura &Co’s management The words “anticipate," "wishes,“ "expects," "estimates," "intends," "forecasts," "plans," "predicts," "projects," "targets" and similar words are intended to identify these statements, which necessarily involve known and unknown risks and uncertainties. Known risks and uncertainties include, but are not limited to, the impact of competitive products and pricing, market acceptance of products, product transitions by the Company and its competitors, regulatory approval, currency fluctuations, production and supply difficulties, changes in product sales mix, and other risks. This presentation also may include pro-forma and adjusted information prepared by the Company for information and reference purposes only, which has not been audited. Forward-looking statements speak only as of the date they are made, and the Company does not undertake any obligation to update them in light of new information or future developments. https://ri.naturaeco.com/en/
 .
.
Natura &Co Performance 2023 was a landmark year for Natura &Co, with important and significant advances on the strategy, operational, financial, and balance sheet fronts Simplification Gross Margin, main driver of profitability improvement: +310 bps Adjusted EBITDA margin: +370 bps FCFF in positive territory in the year Net Cash of BRL 1.7 billion, allowing us to announce BRL 979 million of dividends Aug 2023 Closing of Aesop sale Dec 2023 Closing of TBS sale Jan 2024 ADR NYSE delisting Feb 2024 Study of the potential separation of Natura &Co and Avon In addition, we continued to simplify our corporate expenses, as announced in Jul/22 Natura &Co Performance 2023 was a landmark year for Natura &Co, with important and significant advances on the strategy, operational, financial, and balance sheet fronts Structure Projects Natura &Co Latam–Wave 2 Solid performance from the Natura brand in Brazil and a recovering trend from Avon Avon International Further simplification, business is now managed from two lead regions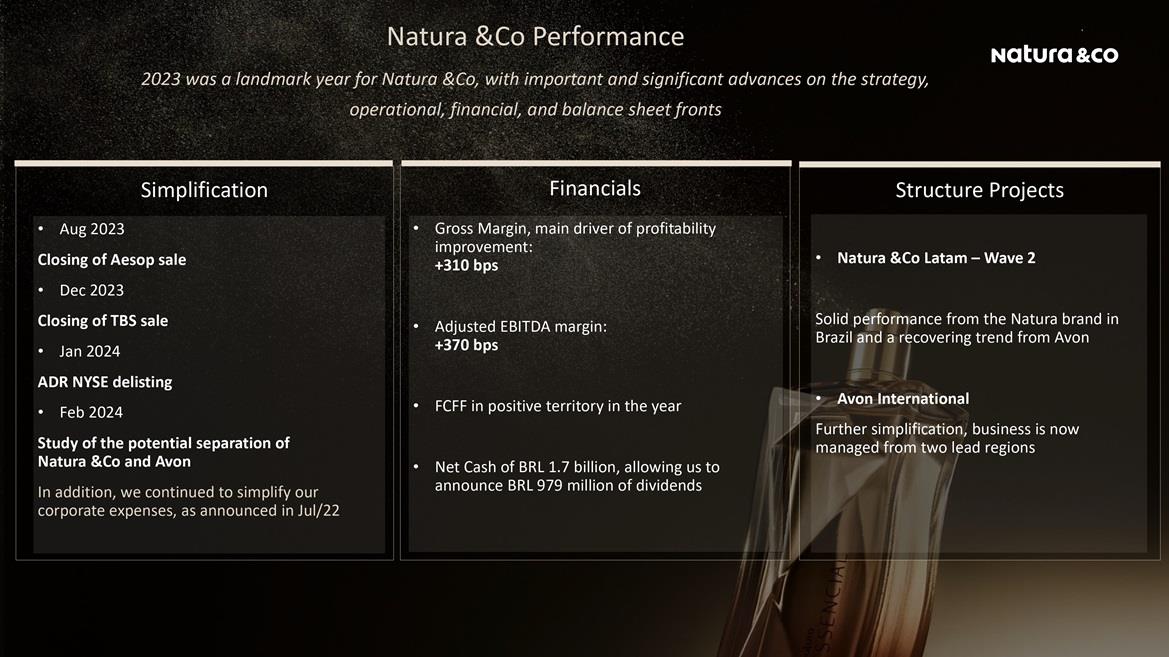
Advances on ESG Agenda Natura &Co Natura &Co Latam Avon International Expanding Agroforestry Systems (AFS) for palm oil and implementing the 'Amazônia Viva Mechanism' Avon’s make-up range is now Leaping Bunny approved, the company has pledged to and has undergone independent verification for adhering to cruelty-free practices as outlined by the Leaping Bunny Program standards
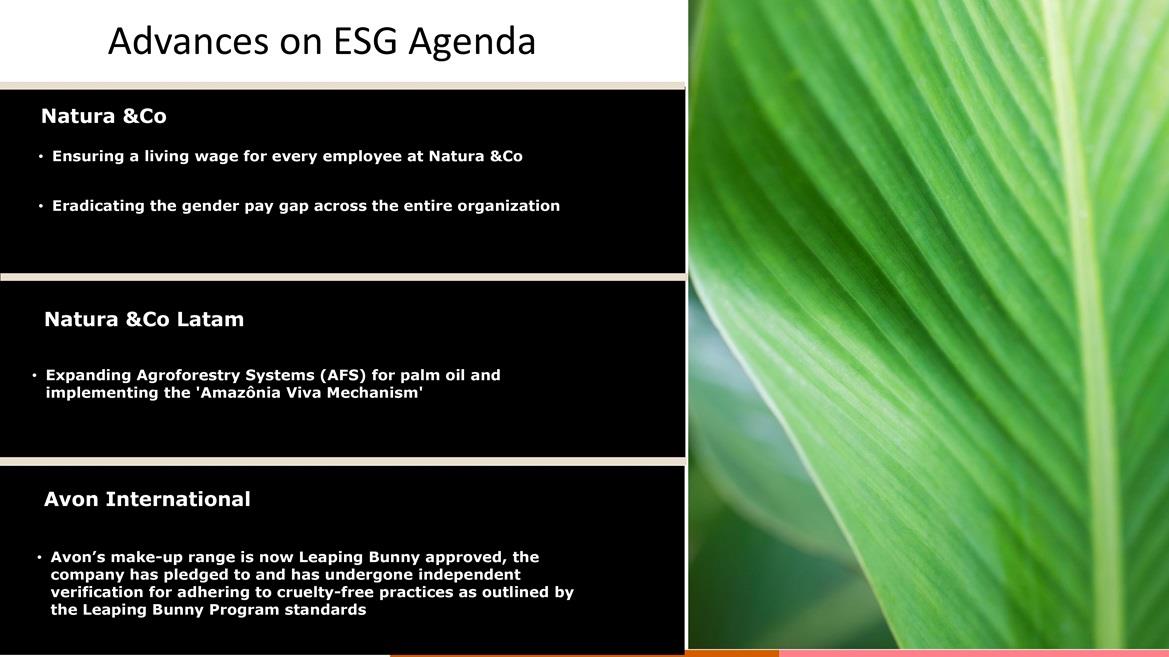 .
.
Consolidated Financial Performance Guilherme Castellan, CFO
Natura &Co: Solid performance from Natura Brazil offset by Avon brand Net Revenue (BRL million) +4.5% in CC |-5.1% CC Ex-Argentina Avon International -6.1% at CC-16.9% in BRL Natura &Co Latam + 8.5% at CC-17.9% in BRL Highlights Robust performance from Natura Brazil +8.6% YoY Offset by: Expected reduction at Avon Latam, although a slowing of the downward trend in Brazil Decline at Avon International, primarily impacted by the Home & Style category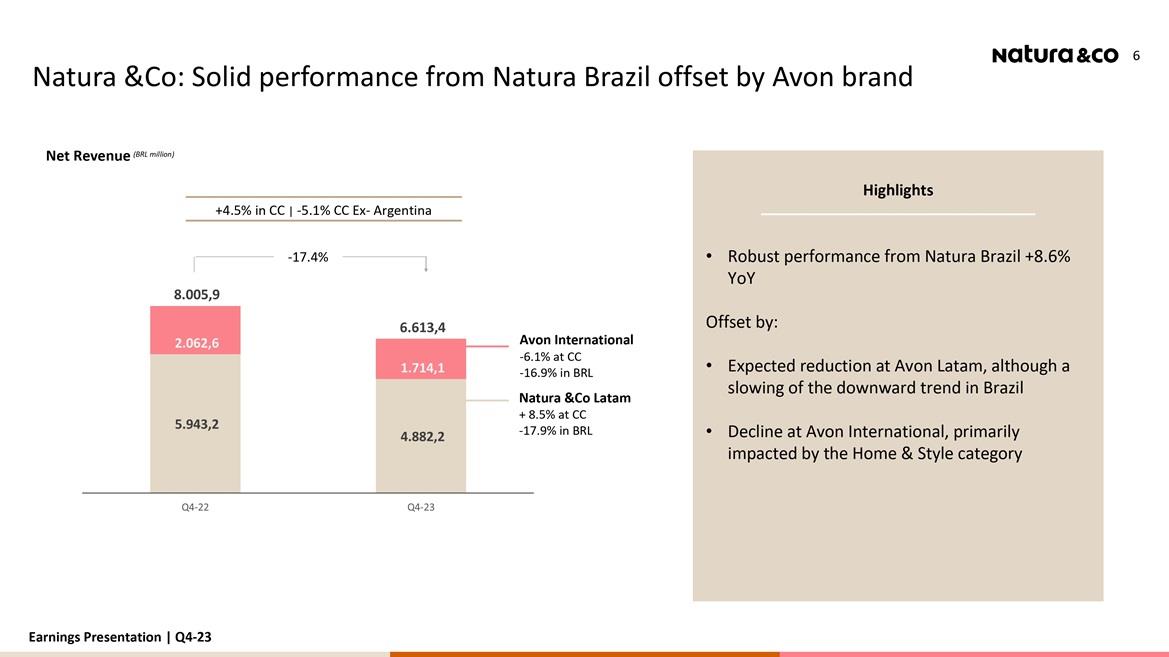
Another quarter of solid Adjusted EBITDA margin expansion Q4-23 Consolidated Adjusted EBITDA Margin Adjusted EBITDA Margin expansion YoY The increase also reflects a BRL 204 million expense reallocation from G&A to Selling line driven by gross margin and transformational savings impacting SG&A expenses +550 bps YoY Avon International driven by gross margin and improvement in G&A expenses +250 bps YoY Natura &Co Latam ˜-40% YoY Reduction of corporate expenses in two years Partially offset by: Investments in the Natura brand
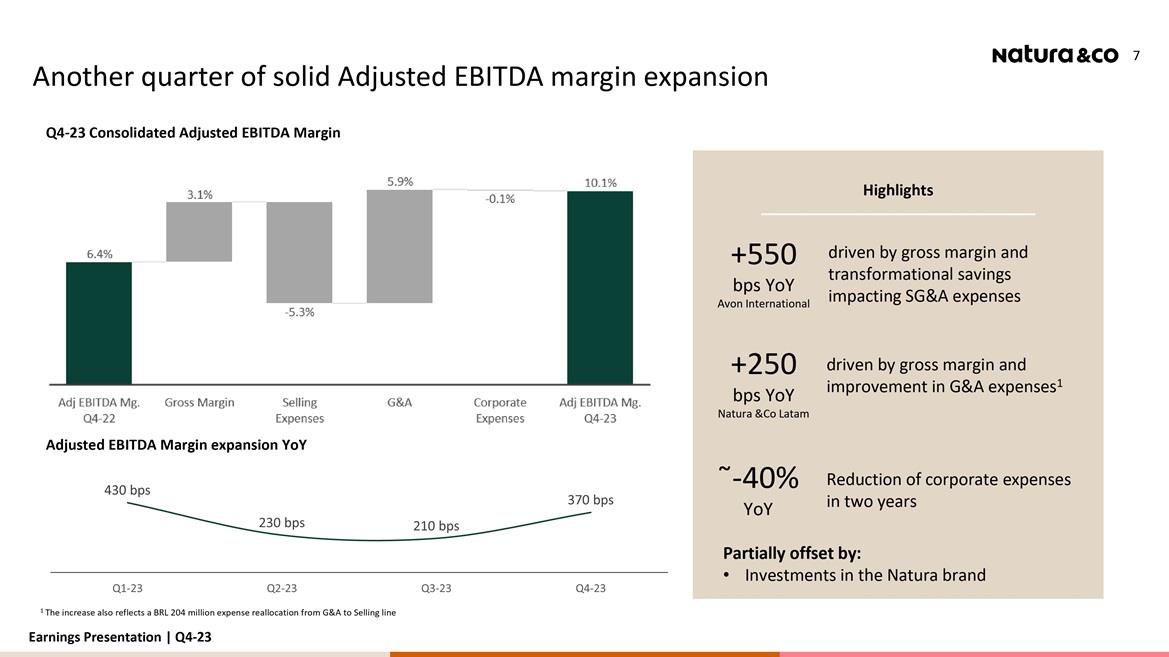 .
.
Highlights Underlying net income (UNI) and net income Net income to underlying net income (UNI) reconciliation Q4-23 (BRL million) Expansion in adjusted and cash EBITDA Offset by: Higher net financials impacted by Argentina hyperinflation and FX Tax expenses given mix of profitable and unprofitable countries FY 2023 Reported Net Income was BRL +3.0 bn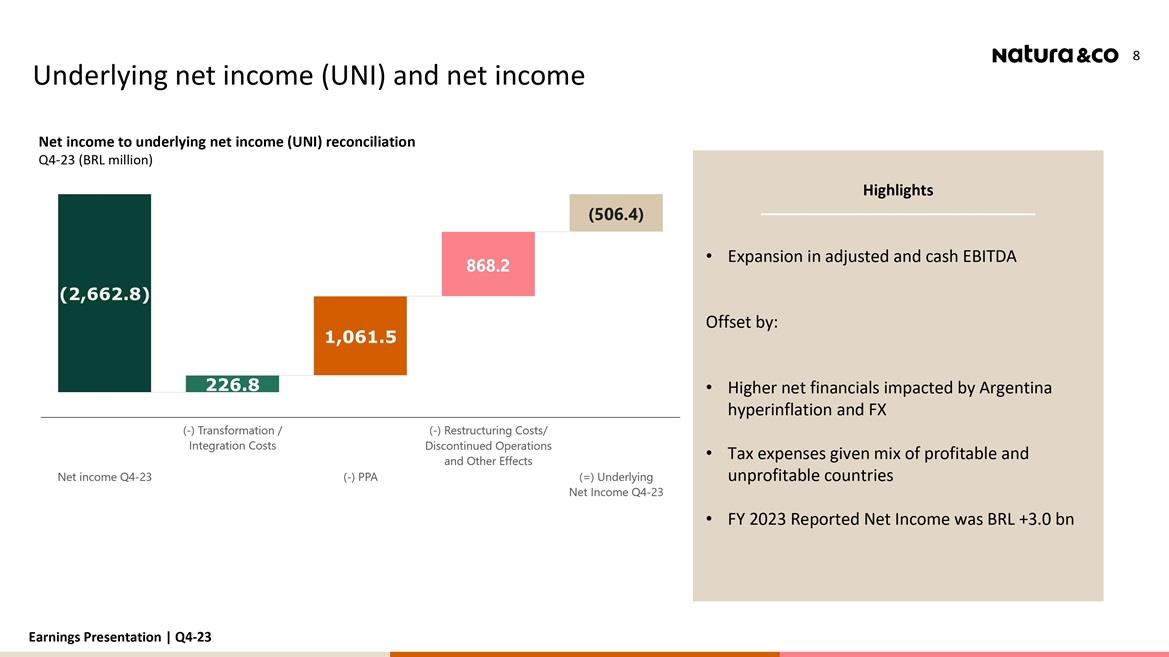
.
FCFF in FY23 turn positive to BRL +59 million Highlights FCFF in FY23 turn positive to BRL +59 million Free cash flow is mainly impacted by: BRL 1.5 billion settlement of the derivatives related to liability management and higher WK consumption Working capital was impacted by: accounts receivables, given higher revenue sales from Natura Brazil, inventories impacted by write-offs as a consequence ofportfolio optimization in Latam Wave 2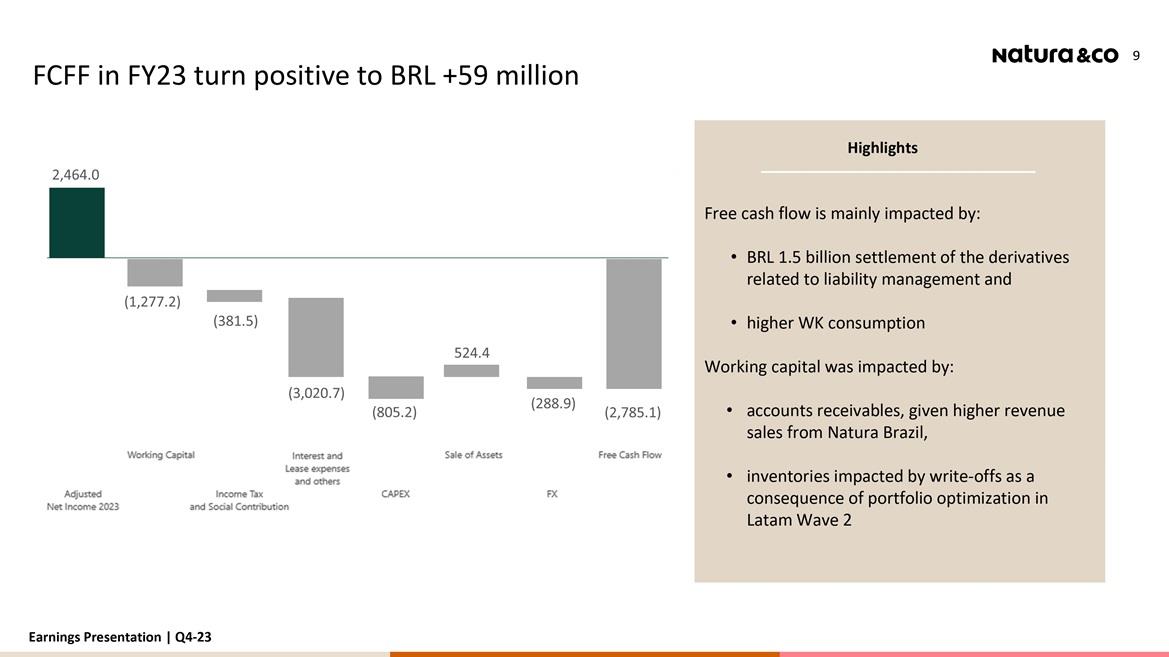
.
Net cash position and further liability management Q4-23 BRL7.8 billion Cash balance at period-end -0.79x Group net debt-to-EBITDA ratio Concluded the Tender Offer ofUSD 880 million Bonds maturing in May 2028 and April 2029 Net debt and net debt-to-EBITDA ratio (BRL billion) Amortization schedule (BRL billion) (a) Gross debt excludes PPA impacts and excludes lease agreements (b) Excluding foreign currency hedging and including Avon’s Bond 2043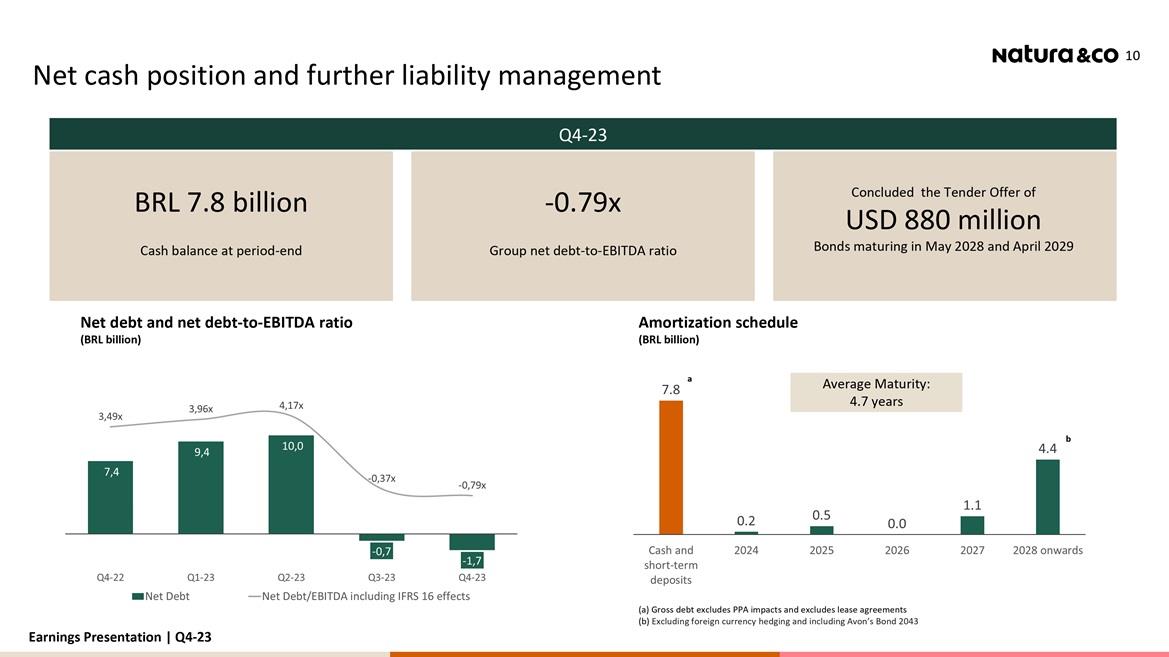
.
Brazil The challenges highlighted in Q3-23 have been mitigated Delayed deliveries were resolved by early 2024 Reorganization of sales leadership is showing promising signs of stabilization Level of inventory shortage has seen improvements Adjustments are ongoing as understanding of the new demand levels from the combined business improves Improving consultant satisfaction both quarterly and annually Smoother implementation in Chile, due to the lessons from Brazil, Peru and Colombia Hispanic Latam Peru and Colombia followed Brazil's trends, with distinct recovery scales and maturity levels Wave 2 update Results in Brazil already show enhanced productivity and cross-selling, coupled with a recovering distribution channel activity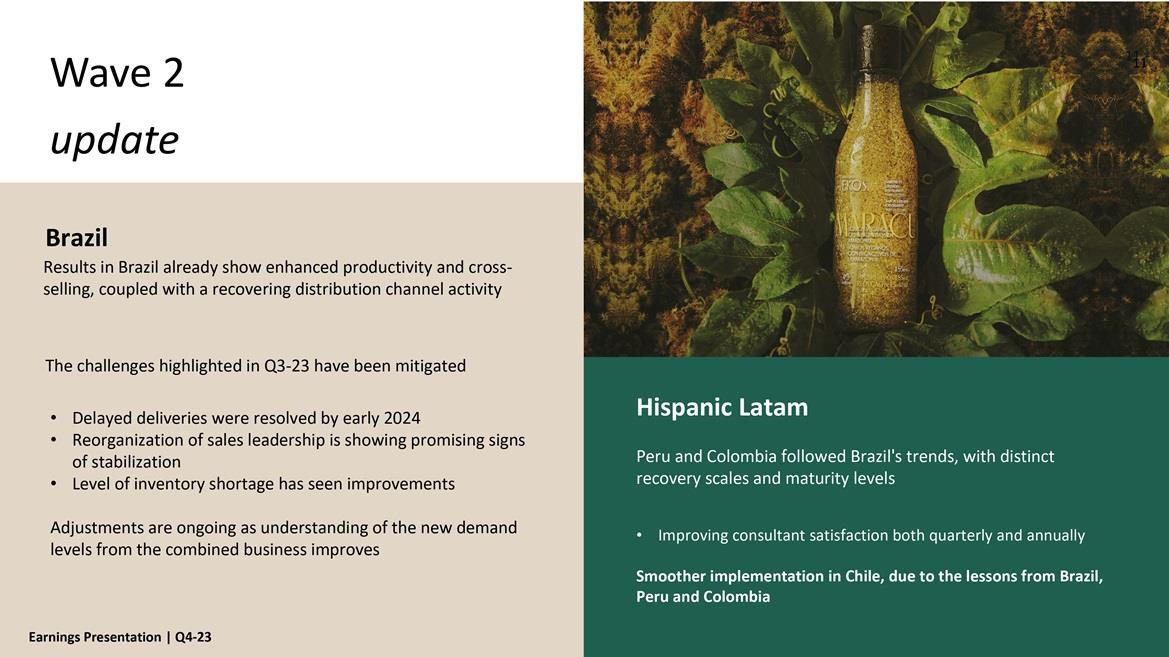
.
Natura &Co Latam Financial Performance
 .
.
Natura &Co Latam: Revenue trends were shaped by robust Natura Brazil and a lesser decline of Avon in the same market Net Revenue(BRL million) +8.5% in CC |-4.7% CC Ex-Argentina -17.9% + 8.6% in CC + 48.7% in CC -11.9% in CC + 0.7% in CC -40.7% in CC -27.1% in CC Natura CFT: Avon CFT: Home & Style: Decline in CC, directly related to the portfolio optimization strategy Brazil: 11.9% YoY decline, showing lesser decline versus Q3-23 Hispanic: Continue to suffer amid Wave 2 roll-out Brazil: shortage of inventory is still a challenge despite quarterly improvements, which could have further improved performance Hispanic: Broadly stable revenue in CC excluding Argentina 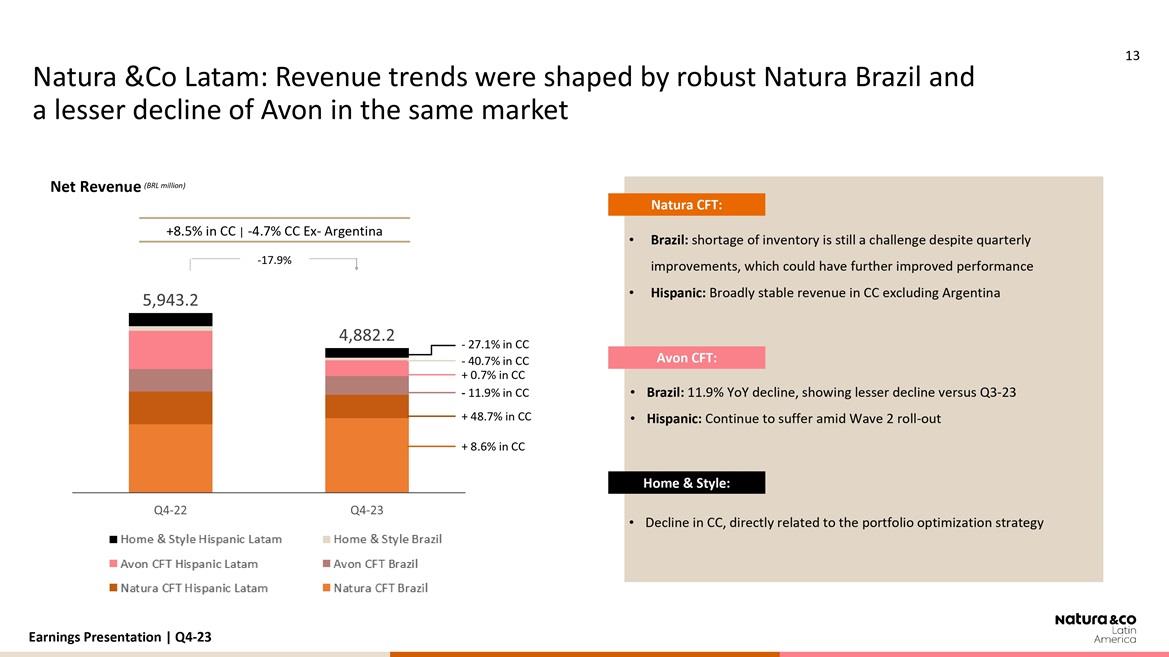
.
Adjusted EBITDA margin expanded 250 bps YoY to 11.4% Adjusted EBITDA¹ and Adjusted EBITDA margin (BRL million, %) 8.9% 11.4% 1Excluding effects that are not considered recurring nor comparable between the periods under analysis, such as integration costs and net non-recurring other (income)/expenses Highlights +380 bps YoY Gross margin expansion driven mainly by Avon Hispanic boosted by commercial adjustments Considerable decrease in G&A expenses, which were elevated in 2022 due to expense phasing, partially offset by higher selling expenses -40 bps YoYas % of net revenue SG&A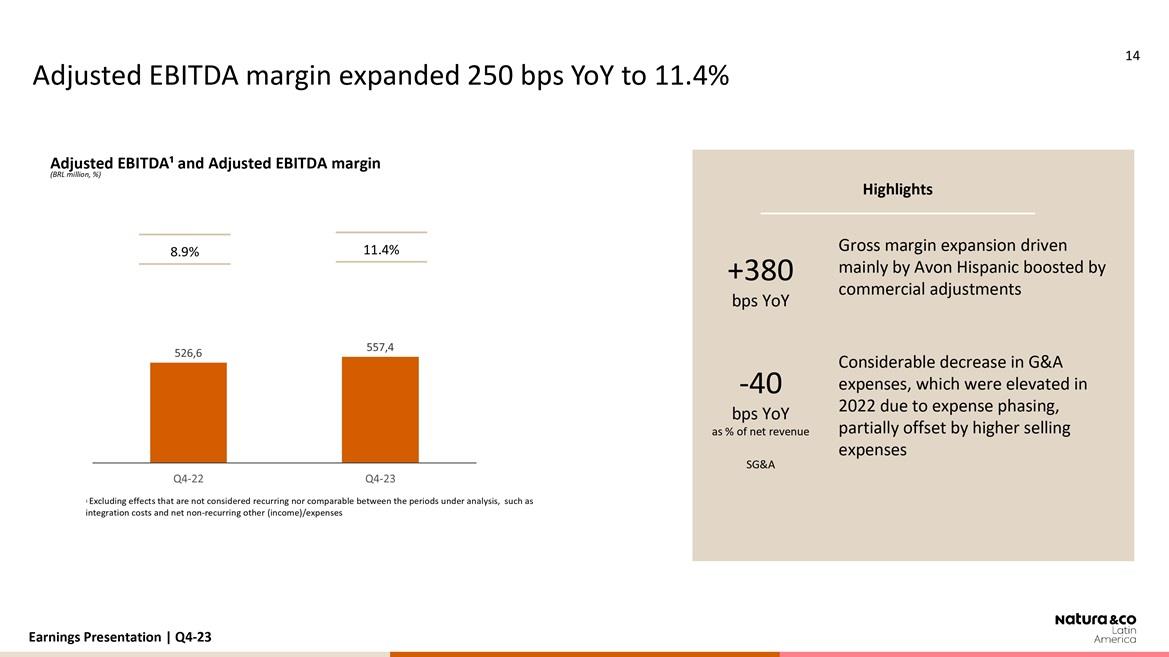
.
Avon International Financial Performance 
.
Avon International: Further profitability expansion despite revenue contraction Net Revenue(BRL million) -6.1% CC -16.9% Adjusted EBITDA¹ and Adjusted EBITDA margin (BRL million, %) 5.8% 11.3% 1 Excluding effects that are not considered recurring nor comparable between the periods under analysis, such as transformation costs and restructuring costs -business unit/Impairment and Goodwill Highlights -6.1% YoY in CC Driven by: small drop in Beauty revenue (-2.6%) steeper decline in Home & Style Adjusted EBITDA +550 bps YoY Net Revenue Driven by: 130 bps YoY gross margin evolution savings from both selling and G&A expenses, supported by an easy comparable in 4Q-22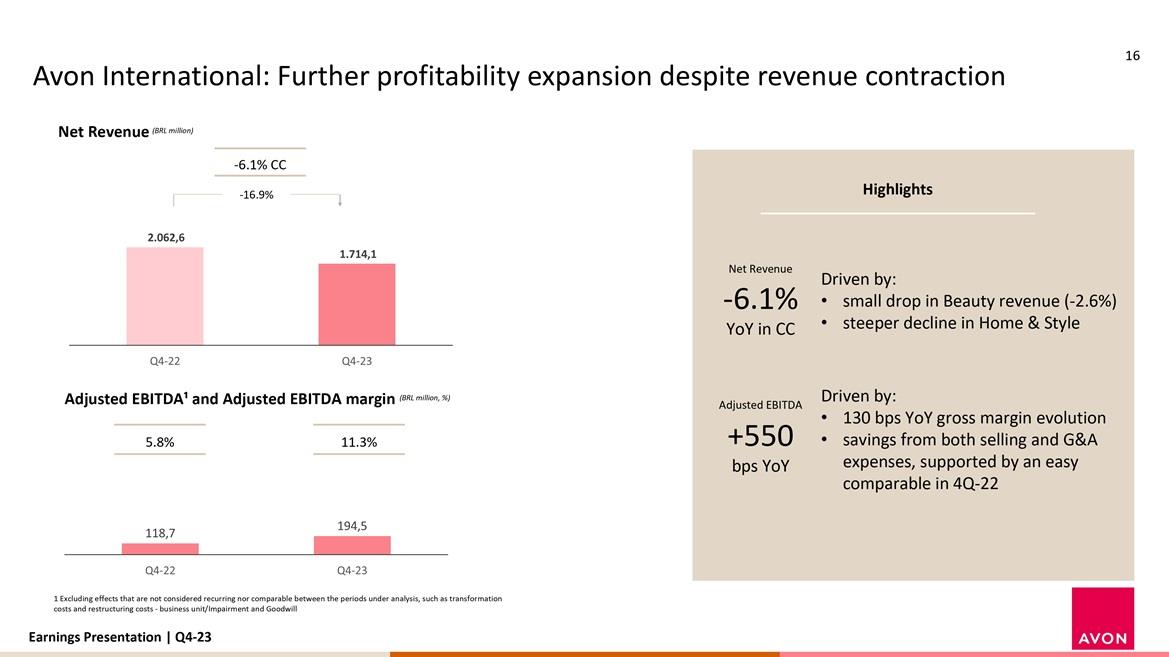
.
Closing Remarks Fábio Barbosa, CEO
Key takeaways Unlocking sustainable shareholder value … Continue to expect volatility in top-line but with margins improvements in the FY, particularly ex-Argentina Marginsand cash continue to be short term priorities, paving the way for additionalinvestments in brands and technology 2. Resource allocation is still a critical driver for value generation in the future as we prioritize investments in key growth markets and projects …through our triple bottom line agenda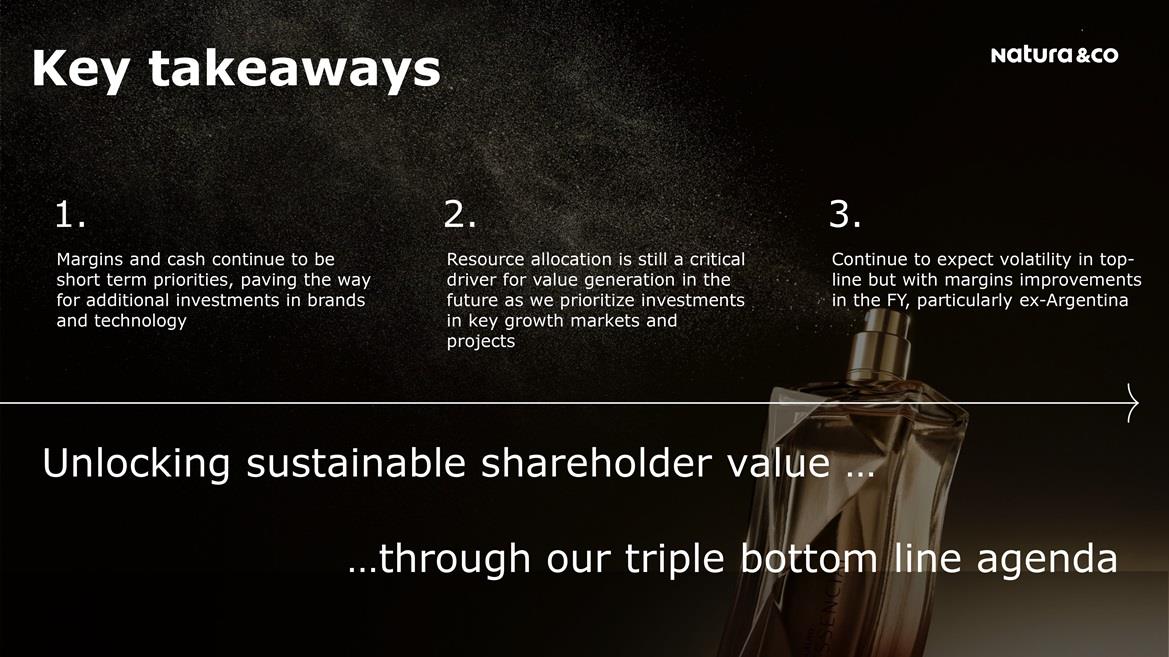
.
Thank You 
.
 .
.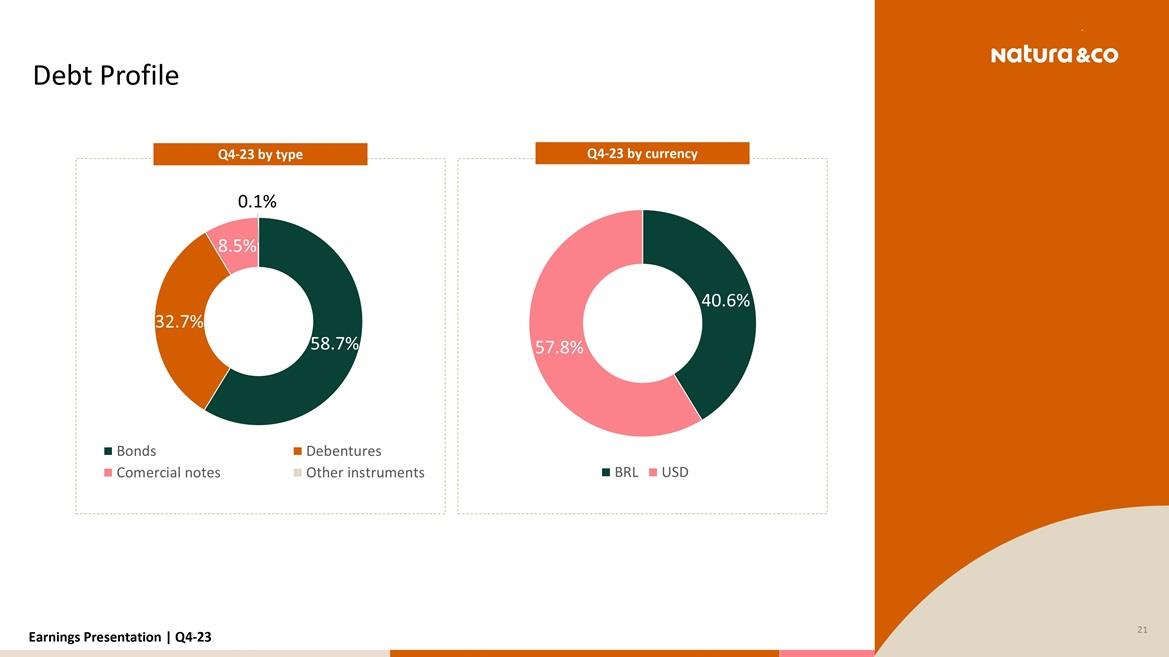 ..
..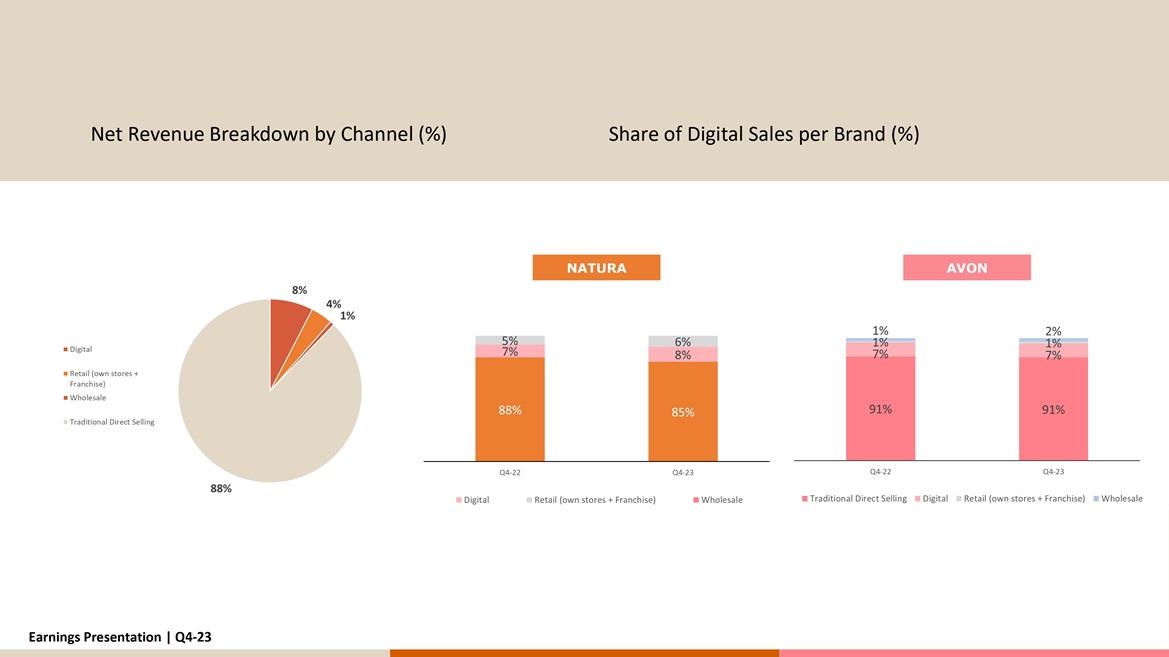
.