UNITED STATES
SECURITIES AND EXCHANGE COMMISSION
Washington, D.C. 20549
FORM 6-K
REPORT OF FOREIGN PRIVATE ISSUER PURSUANT TO RULE 13a-16 OR 15d-16 UNDER THE SECURITIES EXCHANGE ACT OF 1934
For the month of May 2024
Commission File Number: 001-39169
Natura &Co Holding S.A.
(Exact name of registrant as specified in its charter)
Avenida Alexandre Colares, No. 1188, Sala A17-Bloco A
Parque Anhanguera
São Paulo, São Paulo 05106-000, Brazil
(Address of principal executive office)
Indicate by check mark whether the registrant files or will file annual reports under cover of Form 20-F or Form 40‑F:
Form 20-F ☒ Form 40-F ☐
Indicate by check mark if the registrant is submitting the Form 6-K in paper as permitted by Regulation S-T Rule 101(b)(1):
Yes ☐ No ☒
Indicate by check mark if the registrant is submitting the Form 6-K in paper as permitted by Regulation S-T Rule 101(b)(7):
Yes ☐ No ☒
NATURA &CO HOLDING S.A.
TABLE OF CONTENTS
ITEM
| 1. Earnings release of Natura &Co Holding S.A. for the first quarter of 2024. |
| 2. Earnings presentation of Natura &Co Holding S.A. for the first quarter of 2024. |
SIGNATURE
Pursuant to the requirements of the Securities Exchange Act of 1934, the registrant has duly caused this report to be signed on its behalf by the undersigned, thereunto duly authorized.
NATURA &CO HOLDING S.A. | |||
By: | /s/ Guilherme Strano Castellan | ||
| Name: | Guilherme Strano Castellan | |
| Title | Principal Financial Officer | |
|
| ||
|
| ||
By: | /s/ Itamar Gaino Filho | ||
| Name: | Itamar Gaino Filho | |
| Title: | Chief Legal and Compliance Officer | |
|
| ||
|
| ||
Date: May 14, 2024

Q1-24
Natura and Avon Integration in Latam Continuing to Drive Stronger Profitability
Earnings release of Natura &Co Holding S.A. for the first quarter of 2024.
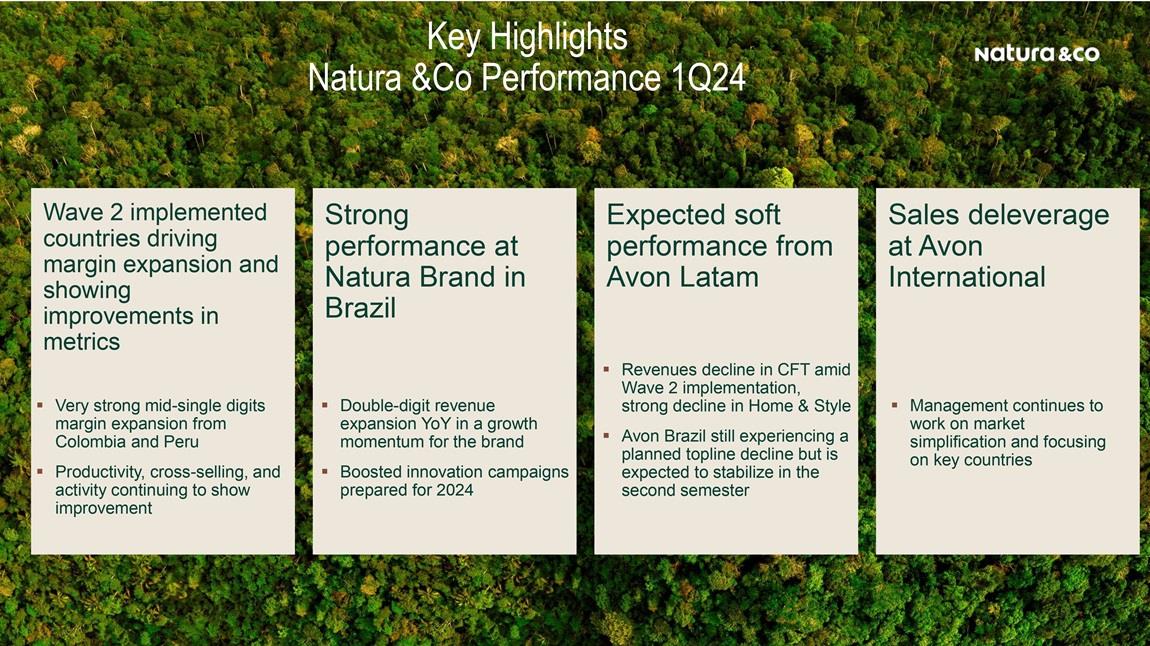
Strong performance of Natura Brand in Brazil combined with solid margin results from the Wave 2-implemented countries led to YoY profitability evolution and more than offset Avon International margin contraction amid sales deleverage
| Q1-24 | ||||||
| BRL million | Consolidated | Natura &Co Latam | Avon International | |||
| YoY Ch. % | YoY Ch. % | YoY Ch. % | ||||
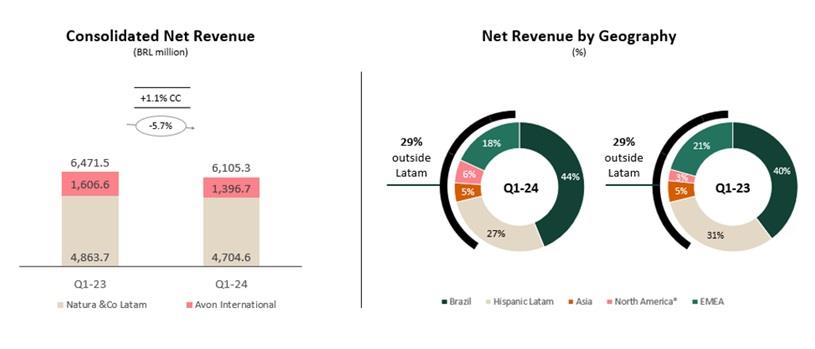
| Net revenue | 6,105.3 | (5.7) | 4,704.6 | (3.3) | 1,396.7 | (13.1) |
| Constant Currency | 1.1% | 3.1% | -4.7% | |||
| Gross profit | 3,978.2 | (4.3) | 3,100.6 | (0.7) | 876.9 | (15.3) |
| Gross Margin | 65.2% | 90 bps | 65.9% | 170 bps | 62.8% | -160 bps |
| Reported EBITDA | 547.4 | (9.1) | 730.6 | 14.6 | (111.2) | (374.8) |
| Reported EBITDA margin | 9.0% | -30 bps | 15.5% | 240 bps | -8.0% | -1050 bps |
| Adjusted EBITDA | 682.8 | 4.1 | 666.5 | 5.4 | 74.6 | (23.9) |
| Adjusted EBITDA margin | 11.2% | 110 bps | 14.2% | 120 bps | 5.3% | -80 bps |
| Net income (loss) | (934.9) | 43.3 | - | - | - | - |
01 Consolidated Net Revenue of BRL 6.1 billion, up 1.1% vs Q1-23 in constant currency (CC) (-3.9% ex-Argentina and The Body Shop – “TBS” - revenues) and down -5.7% in Brazilian Reais. The items impacting revenue are mainly explained by the following:
- Natura &Co Latam: Q1-24 revenues up 3.1% year on year (YoY) in CC (-2.7% ex-Argentina) led by a solid performance from Natura Brazil (+11.3% YoY) and partially offset by an 11.3% YoY decline from Avon Brazil1. A higher indirect tax burden of ~BRL 50 million, impacted Brazilian consolidated net revenues growth in the quarter by 2p.p.. Avon Brazil also showed improving top-line trends throughout the quarter. Hispanic markets ex-Argentina posted a broadly stable performance from Natura and a steep decline from Avon (-24.5% YoY) amid Wave 2 roll-out
- Avon International: Q1-24 revenues down 4.7% YoY in CC. Excluding TBS revenues2, top-line decreased -7.2% YoY in CC, with Beauty down 4.2% and steeper decline from Home & Style. Productivity improved YoY, but this was more than offset by reduced representative activity from fewer available reps and the continuation of weaker promotional execution as noted in Q4-23
02 Adjusted EBITDA of BRL 683 million in Q1-24 with an 11.2% margin, up by 110 basis points (bps) YoY, representing another quarter of solid profitability expansion. The margin improvement was mainly driven by:
- Natura &Co Latam: 120 bps YoY margin expansion reflecting 170 bps YoY gross margin and Wave 2 SG&A efficiencies, partially offset by investments related to marketing, particularly for the Natura brand, and to improving service level
- Avon International: 80 bps YoY margin contraction mostly explained by sales deleverage that more than offset the improvement in selling expenses as a percentage of net revenues compared to Q1-23 amid market simplification (from four to two lead regions)
03 Q1-24 Net loss of BRL 935 million compared to a net loss of BRL 652 million in the same period in 2023. Higher adjusted EBITDA and lower financial expenses were more than offset by a write-off of TBS earn-out receivables of BRL 485 million and an impairment/write-off of BRL 139 million from Avon International (also mainly explained by TBS receivables) as well as by higher tax expenses given the mix of profitable and unprofitable countries
04 Q1-24 Net Debt (excluding leasing) was BRL 275 million (compared with a net cash of BRL 1.7 billion in Q4-23) mainly driven by annual seasonality, which resulted in a cash consumption quarter of BRL -1.0 billion (showing an important YoY improvement) combined with cash tax payment related to discontinued operations
1 Avon CFT Performance, Excluding Home & Style
2 Avon International continues to produce products for TBS, following its sale. For more details please see Avon’s International section
Fábio Barbosa Group CEO of Natura &Co, stated “We are encouraged that the first quarter of the year showed positive results with a consolidated margin expansion of 110 bps vs previous year, driven by solid results from Natura &Co Latam, benefiting from the Natura and Avon integration in the region (“Wave 2”), coupled with richer country and brand mix. This more than offset the margin contraction at Avon International amid sales deleveraging. From a cash conversion perspective, seasonal cash consumption also improved on a YoY basis to BRL -1.0 billion (excluding one-off disc. Op. tax payments), compared to pro-forma (excluding TBS) of BRL -1.4 billion in the same period last year or BRL -1.8 billion reported in Q1-23.
The ongoing roll-out of Wave 2 is a pivotal step in our transformational process, and although we have experienced expected and unexpected challenges in its implementation, we continue to see sustainable improvements in key metrics such as productivity, cross selling, and better portfolio mix, resulting in gross margin improvement in all countries where Wave 2 was implemented. In Brazil, Avon still experienced headwinds impacting the top-line, but with an improving trend month over month, and we expect Avon’s top-line to stabilize in the second half of the year. We also saw significant margin expansion in Peru and Colombia as Wave 2 results start to impact the P&L in full while investments in channel and other one-offs start to fade away. As expected, our integration initiative is driving improved savings in both G&A and selling expenses, although the latter is being offset by higher marketing investments and other initiatives focused on improving service levels. The solid start to the year gives us confidence that the initiatives we are implementing are beginning to deliver the expected results and we remain extremely confident with the potential of the integration of both brands in Latam.
Avon International had another challenging quarter with top-line down, impacted by a steep Fashion and Home decline and a softer impact of CFT categories. The management team is working on simplifying the market, focusing on key countries, and enhancing our portfolio with superior promotional execution. We believe these steps are crucial to stabilize revenues and keep us on track to improve profitability.
We are also continuing to evolve on the studies of a potential separation of Avon, and we will keep the market informed as soon as we conclude such studies.
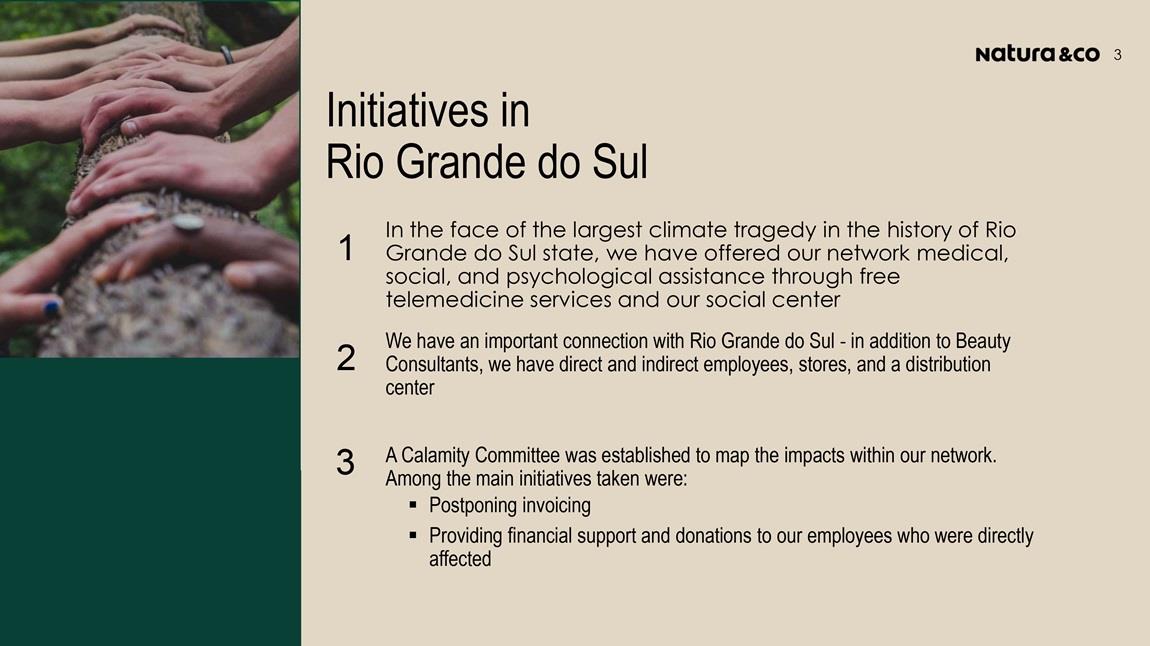
Finally, and most important, our hearts and minds are with our consultants, teammates/employees, suppliers, and all stakeholders in Rio Grande do Sul in light of the recent natural disasters the region has experienced in the last couple of weeks. Since the first emergency reports, we established a calamity committee (as we did during the Pandemic), to map not only the accidents of the tragedy in our network, but also to connect as quickly as possible with emergency support institutions for those affected throughout the entire State.
The initiatives taken, includes: (i) made our social center available for social and psychological assistance, in addition to free telemedicine assistance to meet the most urgent needs of our consultants’ networks; (ii) postponed payments for impacted consultants and franchisees; and (iii) gave financial and other donations support. In this challenging moment, we convey a message of solidarity and hope: together we can overcome this natural disaster.
|
01 Results analysis
The Group segmentation is composed of:
- Natura &Co Latam, which includes all the brands in Latin America: Natura, Avon and the distribution of The Body Shop; and
- Avon International, which includes all global markets, excluding Latin America
In addition, the results and analysis for the periods under comparison include the effects of the fair market value assessment arising from the business combination with Avon as per the Purchase Price Allocation – PPA.
| Profit and Loss by Business | ||||||||||||
| BRL million | Consolidateda | Holdingb | Natura &Co Latamc | Avon International | ||||||||
| Q1-24d | Q1-23d | Ch. % | Q1-24d | Q1-23d | Ch. % | Q1-24d | Q1-23d | Ch. % | Q1-24d | Q1-23d | Ch. % | |
| Gross revenue | 8,039.0 | 8,367.6 | (3.9) | 4.0 | 1.3 | 217.4 | 6,371.9 | 6,445.3 | (1.1) | 1,663.0 | 1,921.0 | (13.4) |
| Net revenue | 6,105.3 | 6,471.5 | (5.7) | 4.0 | 1.2 | 227.4 | 4,704.6 | 4,863.7 | (3.3) | 1,396.7 | 1,606.6 | (13.1) |
| COGS | (2,127.1) | (2,313.2) | (8.0) | (3.3) | (0.2) | 2,045.2 | (1,604.0) | (1,741.8) | (7.9) | (519.8) | (571.2) | (9.0) |
| Gross profit | 3,978.2 | 4,158.3 | (4.3) | 0.7 | 1.1 | (31.7) | 3,100.6 | 3,121.9 | (0.7) | 876.9 | 1,035.4 | (15.3) |
| Selling, marketing and logistics expenses | (2,640.5) | (2,759.3) | (4.3) | - | (0.5) | - | (2,009.9) | (2,004.0) | 0.3 | (630.6) | (754.8) | (16.5) |
| Administrative, R&D, IT and projects expenses | (987.8) | (1,091.9) | (9.5) | (3.9) | (4.6) | (15.4) | (647.5) | (715.1) | (9.5) | (336.4) | (372.2) | (9.6) |
| Corporate expenses | (55.3) | (70.1) | (21.2) | (55.3) | (70.1) | (21.2) | - | - | - | - | - | - |
| Other operating income / (expenses), net | (50.4) | 34.1 | (247.7) | (13.5) | (0.5) | 2,537.7 | 103.1 | 34.0 | 203.3 | (139.9) | 0.6 | - |
| Transformation / Integration / Group restructuring costs | (89.0) | (84.9) | 4.9 | (0.2) | (1.3) | (84.6) | (42.1) | (26.1) | 61.4 | (46.7) | (57.5) | (18.8) |
| Depreciation | 392.1 | 416.0 | (5.8) | - | - | - | 226.5 | 226.9 | (0.2) | 165.6 | 189.1 | (12.4) |
| EBITDA | 547.4 | 602.2 | (9.1) | (72.0) | (75.8) | (5.0) | 730.6 | 637.6 | 14.6 | (111.2) | 40.5 | (374.8) |
| Depreciation | (392.1) | (416.0) | (5.8) | |||||||||
| Financial income / (expenses), net | (361.2) | (460.1) | (21.5) | |||||||||
| Earnings before taxes | (206.0) | (273.9) | (24.8) | |||||||||
| Income tax and social contribution | (237.1) | (122.2) | 94.0 | |||||||||
| Discontinued operationse | (492.1) | (256.0) | 92.3 | |||||||||
| Consolidated net (loss) income | (935.2) | (652.1) | 43.4 | |||||||||
| Non-controlling interest | 0.3 | (0.3) | (213.3) | |||||||||
| Net income (loss) attributable to controlling shareholders | (934.9) | (652.4) | 43.3 | |||||||||
| Gross margin | 65.2% | 64.3% | 90 bps | - | - | - | 65.9% | 64.2% | 170 bps | 62.8% | 64.4% | -160 bps |
| Selling, marketing and logistics as % net revenue | (43.3)% | (42.6)% | -70 bps | - | - | - | (42.7)% | (41.2)% | -150 bps | (45.2)% | (47.0)% | 180 bps |
| Admin., R&D, IT and projects exp. as % net revenue | (16.2)% | (16.9)% | 70 bps | - | - | - | (13.8)% | (14.7)% | 90 bps | (24.1)% | (23.2)% | -90 bps |
| EBITDA margin | 9.0% | 9.3% | -30 bps | - | - | - | 15.5% | 13.1% | 240 bps | (8.0)% | 2.5% | -1050 bps |
| Net margin | (15.3)% | (10.1)% | -520 bps | - | - | - | - | - | - | - | - | - |
| a Consolidated results include Holding, Natura &Co Latam and Avon International | |||||||||
| b Holding results include Natura &Co International (Luxembourg) and TBS Shanghai | |||||||||
| c Natura &Co Latam: includes Natura, Avon, TBS Brazil and Hispanic Latam and &Co Pay, as well as the Natura subsidiaries in the U.S., France and the Netherlands. | |||||||||
| d Includes PPA – Purchase Price Allocation effects | |||||||||
| e Related to business separation at Avon North America | |||||||||
Consolidated net revenue
- Q1-24 consolidated net revenue was BRL 6,105 million, up 1.1% YoY in CC (-3.9% ex-Argentina and TBS) and down 5.7% in BRL, reflecting solid performance at the Natura brand partially offset by the expected reduction at Avon Latam (both Beauty and Home & Style) and high-single-digit decline at Avon International
Distribution channel breakdown
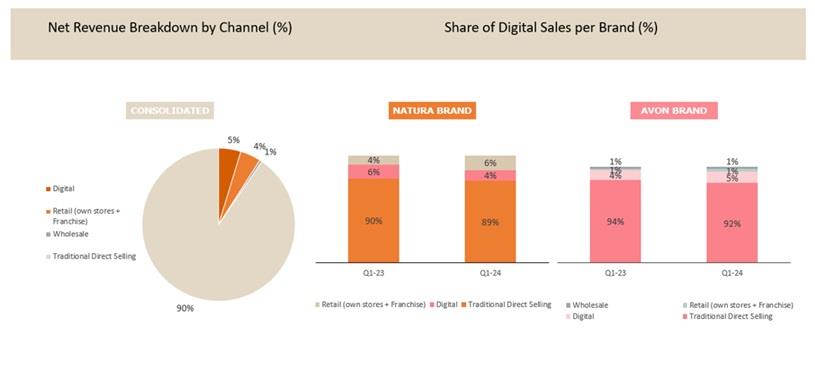
Digital sales, which include online sales and social selling, showed some deceleration in the quarter. Natura reported a 2 percentage point (p.p.) decrease to 4% of total sales, offset by the solid retail channel performance, amid omnichannel investments and strategic fundamentals buildup. By contrast, at Avon, penetration was slightly higher at 5%.
Use of digital tools: The penetration of digital tools in the consultant base reached 79.7% in Q1-24 for Natura &Co Latam. Given the change in methodology with the consolidation of a single beauty app, there is no YoY comparable base. Furthermore, at Avon International, penetration of the Avon On app (active representatives who logged in at least once in the last three campaigns) reached 36.5% in Q1-24, +4.2 p.p. vs the previous year.
Gross margin
- Consolidated gross margin was 65.2% in Q1-24, up 90 bps vs. Q1-23 mostly driven by the strong +170 bps gross margin expansion from Latam which benefited from a richer product and countries mix
- Avon International gross margin contracted by 160 bps YoY, mainly impacted by TBS. Excluding the TBS consolidation effect, the margin improved YoY as price increases and favorable product mix more than offset FX headwinds and cost pressures
Q1-24 Gross Margin
| BRL million | Consolidated | Holding | Natura &Co Latam | Avon International | ||||||||
| Q1-24 | Q1-23 | Ch. % | Q1-24 | Q1-23 | Ch. % | Q1-24 | Q1-23 | Ch. % | Q1-24 | Q1-23 | Ch. % | |
| Net revenue | 6,105.3 | 6,471.5 | (5.7) | 4.0 | 1.2 | 227.4 | 4,704.6 | 4,863.7 | (3.3) | 1,396.7 | 1,606.6 | (13.1) |
| COGS | (2,127.1) | (2,313.2) | (8.0) | (3.3) | (0.2) | 2,045.2 | (1,604.0) | (1,741.8) | (7.9) | (519.8) | (571.2) | (9.0) |
| Gross profit | 3,978.2 | 4,158.3 | (4.3) | 0.7 | 1.1 | (31.7) | 3,100.6 | 3,121.9 | (0.7) | 876.9 | 1,035.4 | (15.3) |
| Gross margin | 65.2% | 64.3% | 90 bps | - | - | - | 65.9% | 64.2% | 170 bps | 62.8% | 64.4% | -160 bps |
Operating expenses
- Consolidated Selling, Marketing & Logistics expenses in Q1-24 were 43.3% of net revenue (+70 bps vs. Q1-23), while consolidated Administrative, R&D, IT and Project expenses declined 70 bps YoY to 16.2% of net revenue. SG&A expenses (both lines above combined) as a percent of net revenue was flat in Q1-24 compared to same period last year mainly driven by Wave 2 efficiencies and Avon International transformational savings more than offset by Natura &Co Latam investments and Avon International sales deleverage effect
- Corporate expenses in Q1-24 were BRL 55 million, down 21.2% YoY as the group continues its effort to streamline the holding company structure
- Other operating income/expenses in Q1-24 were an expense of BRL 50 million, compared to an income of BRL 34 million in Q1-23. Natura &Co Latam reported income of BRL 103 million related to tax credits in the quarter which was offset by a BRL 140 million expense at Avon International mostly driven by The Body Shop accounts receivables write-off of BRL 92 million
Transformation/Integration/Group restructuring costs in Q1-24 were BRL 89 million, broadly flat YoY, reflecting slightly higher investments in Latam offset by lower transformational investments from Avon International
Q1-24 Operating Expenses
| BRL million | Consolidated | Holding | Natura &Co Latam | Avon International | ||||||||
| Q1-24 | Q1-23 | Ch. % | Q1-24 | Q1-23 | Ch. % | Q1-24 | Q1-23 | Ch. % | Q1-24 | Q1-23 | Ch. % | |
| Selling, marketing and logistics expenses | (2,640.5) | (2,759.3) | (4.3) | 0.0 | (0.5) | - | (2,009.9) | (2,004.0) | 0.3 | (630.6) | (754.8) | (16.5) |
| Administrative, R&D, IT and project expenses | (987.8) | (1,091.9) | (9.5) | (3.9) | (4.6) | (15.4) | (647.5) | (715.1) | (9.5) | (336.4) | (372.2) | (9.6) |
| Corporate expenses | (55.3) | (70.1) | (21.2) | (55.3) | (70.1) | (21.2) | - | - | - | - | - | - |
| Other operating income / (expenses), net | (50.4) | 34.1 | (247.7) | (13.5) | (0.5) | 2,537.7 | 103.1 | 34.0 | 203.3 | (139.9) | 0.6 | (23,421.4) |
| Transformation / integration / group reestructuring costs | (89.0) | (84.9) | 4.9 | (0.2) | (1.3) | (84.6) | (42.1) | (26.1) | 61.4 | (46.7) | (57.5) | (18.8) |
| Operating expenses | (3,823.0) | (3,972.1) | (3.8) | (72.9) | (77.0) | (5.3) | (2,596.4) | (2,711.2) | (4.2) | (1,153.7) | (1,183.9) | (2.6) |
| Selling, marketing and logistics expenses (% NR) | (43.3)% | (42.6)% | -70 bps | - | - | - | (42.7)% | (41.2)% | -150 bps | (45.2)% | (47.0)% | 180 bps |
| Administrative, R&D, IT and project expenses (% NR) | (16.2)% | (16.9)% | 70 bps | - | - | - | (13.8)% | (14.7)% | 90 bps | (24.1)% | (23.2)% | -90 bps |
| Corporate expenses (% NR) | (0.9)% | (1.1)% | 20 bps | - | - | - | - | - | - | - | - | - |
| Other operating income / (expenses), net (% NR) | (0.8)% | 0.5% | -130 bps | - | - | - | 2.2% | 0.7% | 150 bps | (10.0)% | 0.0% | -1000 bps |
| Transformation/integration/group reestructuring costs (% NR) | (1.5)% | (1.3)% | -20 bps | - | - | - | (0.9)% | (0.5)% | -40 bps | (3.3)% | (3.6)% | 30 bps |
| Operating expenses (% NR) | (62.6)% | (61.4)% | -120 bps | - | - | - | (55.2)% | (55.7)% | 50 bps | (82.6)% | (73.7)% | -890 bps |
Consolidated EBITDA
Q1-24 Adjusted EBITDA was BRL 683 million, a slight improvement from BRL 656 million in Q1-23, with an adjusted EBITDA margin of 11.2% (+110 bps YoY). Q1-24 margin reflected:
- Solid margin expansion of +120 bps YoY at Latam, mainly driven by Wave 2 initiative and better countries mix
- Further reduction of corporate expenses, which accounted for 0.9% of net sales during the quarter, improving by 20 bps YoY
- Margin contraction of -80 bps YoY from Avon International amid sales deleverage
Q1-24: Adjusted EBITDA
| BRL million | Consolidated | Holding | Natura &Co Latam | Avon International | ||||||||
| Q1-24 | Q1-23 | Ch. % | Q1-24 | Q1-23 | Ch. % | Q1-24 | Q1-23 | Ch. % | Q1-24 | Q1-23 | Ch. % | |
| Consolidated EBITDA | 547.4 | 602.2 | (9.1) | (72.0) | (75.8) | (5.0) | 730.6 | 637.6 | 14.6 | (111.2) | 40.5 | (374.8) |
| Transformation/Integration/Group reestructuring costs | 89.0 | 85.0 | 4.7 | 0.2 | 1.4 | (85.7) | 42.1 | 26.1 | 61.4 | 46.7 | 57.5 | (18.8) |
| Impairment and Goodwill | 46.7 | - | - | - | - | - | - | - | - | 46.7 | - | - |
| Net non-recurring other (income) / expenses1 | (0.3) | (31.1) | (98.9) | 13.5 | - | - | (106.3) | (31.1) | - | 92.4 | - | - |
| Adjusted EBITDA | 682.8 | 656.0 | 4.1 | (58.3) | (74.5) | (21.8) | 666.5 | 632.5 | 5.4 | 74.6 | 98.0 | (23.9) |
| Adjusted EBITDA margin % | 11.2% | 10.1% | 110 bps | - | - | - | 14.2% | 13.0% | 120 bps | 5.3% | 6.1% | -80 bps |
Net non-recurring other (income)/expenses: related to tax credits from Natura &Co Latam, TBS receivables write-off from Avon International and expenses related to strategic projects from the Holding company
Financial income and expenses
| BRL million | Q1-24 | Q1-23 | Ch. % |
| 1. Financing, short-term investments and derivatives gains (losses) | 64.1 | (280.4) | (122.9) |
| 1.1 Financial expenses | (110.9) | (241.6) | (54.1) |
| 1.2 Financial income | 156.1 | 190.4 | (18.0) |
| 1.3 Foreign exchange variations from financing activities, net | 28.4 | 116.6 | (75.6) |
| 1.4 Gain (losses) on foreign exchange derivatives from financing activities, net | (8.8) | (127.4) | (93.1) |
| 1.5 Gain (losses) on interest rate derivatives and other operating derivatives, net | (0.7) | (218.4) | (99.7) |
| 2. Judicial contingencies | (14.9) | (15.9) | (6.3) |
| 3. Other financial income and (expenses) | (410.3) | (163.9) | 150.3 |
| 3.1 Lease expenses | (43.3) | (32.8) | 32.0 |
| 3.2 Other | (71.3) | (77.3) | (7.8) |
| 3.3 Other gains (losses) from exchange rate variation | (197.9) | (12.6) | 26.5 |
| 3.4 Hyperinflation gains (losses) | (97.8) | (41.2) | 73.1 |
| Financial income and expenses, net | (361.1) | (460.2) | (21.5) |
The table above details the main changes in financial income and expenses.
Total net financial expenses were BRL -361 million in Q1-24, compared to BRL -460 million in Q1-23, following the liability management plan implemented in Q3-23 and benefitting from the proceeds from the sale of Aesop and subsequent debt repayment, which resulted in financing and short-term investments being an income versus an expense in Q1-23. By contrast, the other financial income and expenses was mostly impacted by the Argentinian peso devaluation and hyperinflation accounting.
The main drivers this quarter were:
- Item 1. Financing, short-term investments and derivatives gains (losses) of BRL +64 million compared to BRL -280 million in Q1-23, reflecting the stronger balance sheet position with quarter end net debt position of BRL 275 million, amid normal seasonal cash consumption
- Item 3.2. Other which this quarter was BRL -71 million (vs. BRL -77 million in same period last year) mostly driven by BRL -11 million bank fees from strategic projects and BRL -21 million (BRL -17 million YoY) related to offshore cash transactions, reflecting Aesop proceeds that were received in USD
- Item 3.3. Other gains (losses) from exchange rate variation of BRL -198 million, impacted by BRL -137 million of losses related to transferring cash out from Argentina
- Item 3.4. Hyperinflation gains (losses) of BRL -98 million mostly related to Argentina macro scenario
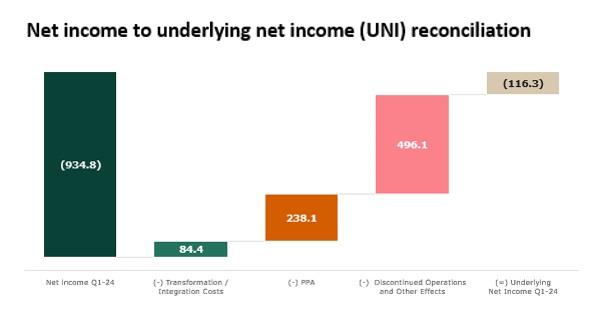
Underlying net income (UNI) and net income
- Q1-24 reported net loss was BRL -935 million, compared to a net loss of BRL -652 million in Q1-23, impacted by discontinued operations, higher taxes from country mix and FX losses and hyperinflation accounting impacts
- Q1-24 Underlying Net Income, which is net income excluding transformation costs, restructuring costs, discontinued operations and PPA effects, was BRL -116 million (vs. a loss of BRL -373 million in Q1-23 or BRL -260 million excluding TBS and Aesop) as higher adjusted EBITDA and slightly lower net financial expenses more than offset higher tax expenses
- Excluding the one-off BRL -137 million of losses related to transferring cash out from Argentina, Underlying Net Income would be a profit of BRL 21 million in Q1-24
Free cash flow and cash position
| R$ million | Q1-24 | Q1-23 | Ch. % |
| Net income (loss) | (935.2) | (652.4) | 43.4 |
| Depreciation and amortization | 392.1 | 416.0 | (5.8) |
| Non-cash adjustments to net income | 1,069.3 | 863.9 | 23.8 |
| Discountinued Operations Results | 492.1 | 256.0 | 92.3 |
| Adjusted net income | 1,018.3 | 883.5 | 15.3 |
| Decrease / (increase) in working capital | (1,455.9) | (1,520.3) | (4.2) |
| Inventories | (677.6) | (502.3) | 34.9 |
| Accounts receivable | (385.1) | (235.4) | 63.6 |
| Accounts payable | (7.9) | (485.1) | (98.4) |
| Other assets and liabilities | (385.4) | (297.5) | 29.5 |
| Income tax and social contribution | (141.1) | (124.6) | 13.2 |
| Interest on debt and derivative settlement | (202.6) | (290.6) | (30.3) |
| Lease payments | (157.2) | (91.2) | 72.3 |
| Other operating activities | (21.3) | (4.2) | 413.3 |
| Cash from continuing operations | (959.9) | (1,147.5) | (16.3) |
| Capex | (119.9) | (218.5) | (45.1) |
| Sale of assets | 0.0 | 1.4 | - |
| Exchange rate variation on cash balance | 69.5 | (14.1) | (593.6) |
| Free cash flow - continuing operations | (1,010.3) | (1,378.7) | (26.7) |
| Other financing and investing activities | 2,328.6 | 181.6 | 1,182.3 |
| Operating activities - discontinued operations | (878.8) | (523.5) | 67.9 |
| Financing activities - discontinued operations | 0.0 | (167.6) | - |
| Capex - discontinued operations | 0.0 | (83.1) | - |
| Cash balance variations | 439.5 | (1,971.2) | (122.3) |
In Q1-24, free cash flow from continuing operations was BRL -1,010 million improving BRL +368 million on a pro forma YoY basis or BRL +803 million compared to Q1-23 reported cash outflow of BRL -1,813 million. The improvement was due to a combination of higher adjusted net income, slightly better working capital dynamic and lower capex, which was driven by phasing of investments.
Working capital improved YoY amid the seasonal cash consumption and was driven by:
- Improved accounts payable from higher purchases in Q1-24 compared to same period last year explained by higher inventory build-up and phasing of higher cash outflow in Q4-23 that benefited this quarter
That more than offset:
- Accounts receivable, that used BRL 385 million in Q1-24 compared to BRL 235 million in Q1-23, primarily due to higher sales in Natura Brazil linked to longer receivable terms. Additionally, an increase in cash consumption by BRL -176 million from inventory build-up for Q2-24 intended to support growing sales further impacted this line
- The Body Shop effect from the reclassification to a third party, combined with business’ entrance into administration, impacted overall working capital by BRL -86 million
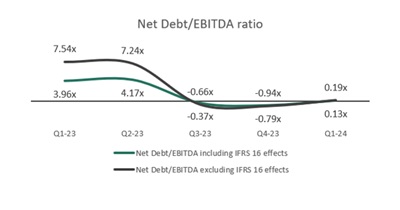
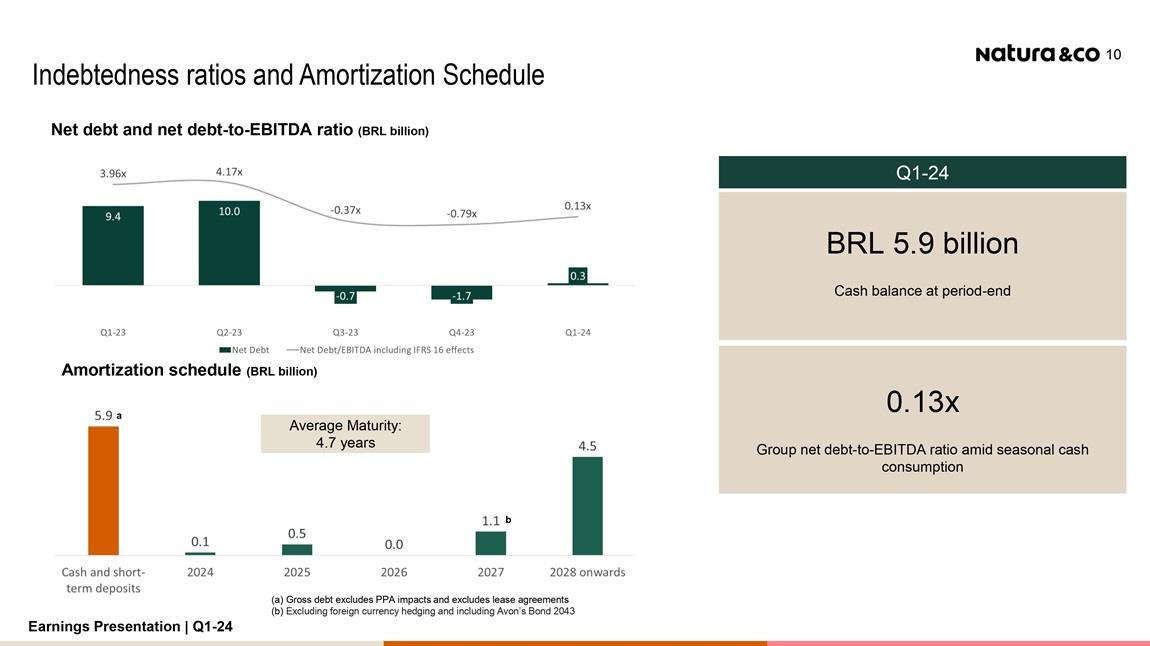
Indebtedness ratios at both Natura &Co Holding and Natura Cosméticos
The graph below shows the indebtedness trajectory on a quarterly basis since Q1-23.
| R$ million | Natura Cosméticos S.A. | Natura &Co Holding S.A. | ||
| Q1-24 | Q1-23 | Q1-24 | Q1-23 | |
| Short-Term | 80.0 | 131.9 | 128.1 | 289.2 |
| Long-Term | 2,354.6 | 7,365.7 | 6,059.1 | 12,721.8 |
| Gross Debt a | 2,434.6 | 7,497.7 | 6,187.1 | 13,011.0 |
| Foreign currency and/or Interest hedging (Swaps and/or NDFs)b | (56.8) | 419.7 | (55.8) | 445.2 |
| Total Gross Debt | 2,377.9 | 7,917.5 | 6,131.3 | 13,456.2 |
| (-) Cash, Cash Equivalents and Short-Term Investmentc | (4,657.2) | (2,705.6) | (5,856.0) | (4,048.1) |
| (=) Net Debt | (2,279.3) | 5,211.9 | 275.3 | 9,408.2 |
| Indebtedness ratio excluding IFRS 16 effects | ||||
| Net Debt/EBITDA | -0.24x | 2.23x | 0.19x | 7.54x |
| Total Debt/EBITDA | 0.26x | 3.39x | 4.18x | 10.79x |
| Indebtedness ratio including IFRS 16 effects | ||||
| Net Debt/EBITDA | -0.23x | 1.65x | 0.13x | 3.96x |
| Total Debt/EBITDA | 0.25x | 2.51x | 3.00x | 5.66x |
| a Gross debt excludes PPA impacts of R$22 million in Q1-24 and R$244 million in Q1-23, and exclude lease agreements | |||
| b Exchange rate and interest rate hedging instruments- Including mark-to-market effects SWAP(CRI) as well as liabilities | |||
| c Short-Term Investments excludes non current balances | |||
02 Natura &Co LATAM
- Brazilian revenue growth trend accelerated in Q1-24, despite the tough comp base for the Natura brand and lower price increase on a YoY basis. This performance was leveraged by a successful Natura Fragrance sales campaign launched during the quarter, which also led to a richer mix. Hispanic markets continue to show softer performance from Wave 2 adjustments, although with some acceleration from Natura in key regions such as Mexico and Peru. Profitability improvement was noteworthy with the fifth consecutive quarter of YoY expansion even with higher investments and indirect tax burden in Brazil
Wave 2 Status
- Brazil update – the available consultants are down on a YoY basis, as expected and mentioned last quarter, but remained flat from a QoQ perspective, despite the strong seasonality of the fourth quarter. Activity continues solid, boosted by cross-selling despite maintaining two minimum order split between Avon and Natura. Those KPIs translated into accelerating revenue trends with Natura growing +11.3% and Avon losing -11.3%, even considering the higher indirect tax burden of ~BRL 50 million, which impacted Brazilian net revenue growth by 2p.p.3. Avon also showed improving top-line trends throughout the quarter
- During Q1-24, delivery service KPIs were back to pre-Wave 2 levels, even in March when volumes pick-up on the back of Mother’s day preparation. The coordination of delivery time frames for Natura and Avon was also initiated. As a result, both brands now have similar average delivery times for most of the Brazilian regions. Noteworthy is the high correlation between better service level, consultant and consumer satisfaction, and productivity level
- Sales leadership were also more stable and no significant changes were made during the quarter. Inventory shortage continues to improve on a QoQ basis but remains challenging. However, from key categories perspective, those SKUs showed inventories levels back to normal and as a result, enabled healthy performance from Natura
- Hispanic Latam update – Similar to Brazil, although in different maturity levels, Peru and Colombia distribution channels are still impacted on a YoY basis but showing recovering trends from a QoQ perspective. Productivity continues to show impressive YoY growth, partially offsetting the decreasing, but recovering, activity
- Despite all, expected and unexpected challenges faced during Wave 2 roll-out in the last year, Euromonitor data still showed a solid market share performance from Natura &Co Latam, led by the Natura brand. Strong innovation pipeline should continue to boost the brand’s performance
Channel Performance in Latam
| Natura &Co Latam | Net revenue change (%) | Operational KPIs change(%) | |||
| Q1-24 vs. Q1-23 | Q1-24 vs. Q1-23a | ||||
| CFT Natura | CFT Avon | Home & Style | Beauty Consultanta | ||
| Δ% CC | Δ% CC | Δ% CC | Δ% | ||
| Brazil | 11.3% | -11.3% | -42.1% | -21.8% | |
| Hispanic | 22.3% | -11.8% | -26.1% | -19.1% | |
| Total | 14.4% | -11.6% | -31.3% | -20.4% | |
| a Considers the Average Available Beauty Consultants in the quarter | |||||
- Available consultants in Brazil declined 21.8% YoY to 1.6 million in Q1-24, mainly due to the exit of the least productive consultants, consistent with trends from last couple of quarters. As mentioned in the last earnings release, the consultant availability waiver implemented post-Wave 2 roll-out drove the steeper decline this quarter compared to Q4-23
- The Hispanic Latam region saw a 19.1% decrease in consultants YoY, but down 5.8% on a QoQ basis, still impacted by the Wave 2 preparation and implementation but pointing to the recovery trend mentioned in the “Wave 2” section. The decrease continues to be led by termination among the least productive consultants, as mentioned during the last couple of quarters
- As a result, the Latam region reported a 20.4% consolidated decrease in beauty consultants YoY, reflecting the Company's ongoing strategy to prioritize productivity evolution over number of consultants expansion
3 Including BRL 50 million in Brazilian net revenues, YoY growth would be 5.9% YoY instead of 3.9% YoY
Natura Brand in Latam
- Natura Brazil reported an 11.3% YoY increase in Q1-24 revenues, attesting strong momentum despite the tough comp base (in Q1-23 the brand had grown +24.9% in the region) and the lower YoY price increases. The performance includes a successful Fragrance sales campaign, called “Perfumada”, which also drove richer mix
- Q1-24 retail sales in Brazil showed robust growth, fueled by solid same-store sales and a still strong pace of store openings. The brand expanded to 115 own stores (+19 compared to Q1-23) and 781 franchised stores (+113 compared to Q1-23), underscoring its potential for future growth
- Q1-24 digital sales, encompassing social selling, was up by 8.8% YoY as the brand is setting the base for its omnichannel strategy implementing fundamental changes in its ecommerce engine and commercial rules
- Natura Hispanic Latam reported a 22.3% Q1-24 YoY revenue increase in CC. Excluding Argentina, revenues in Hispanic markets remained broadly stable YoY in CC. Mexico, Chile and Peru top-lines showed some evolution compared to Q4-23 growth performance even with the commercial model adjustments in Mexico and the roll-out of Wave 2 in the other countries
Avon Brand in Latam (Beauty Category Only)
- Avon Brazil revenue declined 11.3% YoY in Q1-24 within the Beauty category. Channel decline continues to impact top-line performance, partially offset by improving productivity. Some planned SKUs reduction also drove the YoY revenue decrease but led to YoY margin expansion amid a richer mix. In addition, a slight increase in marketing investments and some product innovation (e.g. the Power Stay line) translated into some progression in Avon’s brand equity in the region
- Avon Hispanic Latam revenue decreased 11.8% YoY and 24.1% YoY when excluding Argentina, particularly impacted by the regions where Wave 2 was rolled out. Although showing improving operational KPIs and leading to important YoY profitability expansion, top-line still posted soft performance from the planned consultants and SKUs reduction
Home & Style in Latam
- Home & Style performance mirrored last quarter trends, recording a 31.3% revenue decrease in CC from Q1-23. This decline was due to the 26.1% and 42.1% declines in the Hispanic market and in Brazil, respectively, both directly related to the planned portfolio optimization strategy and commercial incentives reduction
Natura &Co Latam
| Natura &Co Latam (BRL million) | P&L | ||
| Q1-24 | Q1-23 | Ch. % | |
| Gross revenue | 6,371.9 | 6,445.3 | (1.1) |
| Net revenue | 4,704.6 | 4,863.7 | (3.3) |
| Constant currency | 3.1% | ||
| COGS | (1,604.0) | (1,741.8) | (7.9) |
| Gross profit | 3,100.6 | 3,121.9 | (0.7) |
| Gross margin | 65.9% | 64.2% | 170 bps |
| Selling, marketing and logistics expenses | (2,009.9) | (2,004.0) | 0.3 |
| Adminsitrative, R&D, IT and projects expenses | (647.5) | (715.1) | (9.5) |
| Other operating income / (expenses), net | 103.1 | 34.0 | 203.3 |
| Transformation / integration costs | (42.1) | (26.1) | 61.4 |
| Depreciation | 226.5 | 226.9 | (0.2) |
| EBITDA | 730.6 | 637.6 | 14.6 |
| EBITDA margin | 15.5% | 13.1% | 240 bps |
| Integration costs | 42.1 | 26.1 | 61.4 |
| Net non-recurring other (income)/ expenses | (106.3) | (31.1) | 241.9 |
| Adjusted EBITDA | 666.5 | 632.5 | 5.4 |
| Adjusted EBITDA margin | 14.2% | 13.0% | 120 bps |
- Q1-24 Revenue was up 3.1% YoY in CC, and down 3.3% in BRL, driven by healthy growth at the Natura brand in Brazil, partially offset by the Home & Style category and by Avon adjustments across the region
- Gross margin in Q1-24 reached 65.9%, +170 bps YoY, boosted by richer mix of products and countries, and higher participation of Natura brand on total sales, despite the indirect tax burden increase of ~BRL 50 million in Brazil
- Adjusted EBITDA margin in Q1-24 reached 14.2%, +120 bps YoY increase, driven by gross margin expansion, partially offset by planned investments acceleration that led to YoY selling expenses increase. Investments are related to marketing, particularly for the Natura brand, and to improving service levels. The increase also reflects a BRL 44 million expense reallocation from G&A to Selling expenses line
- Natura & Avon integration costs were BRL 42 million in the quarter, of which ~30% were severance costs, ~13% IT and ~11% logistics investments, with the remainder being Opex investments to integrate production facilities and some legal expenses
- Argentina macro scenario continues to be uncertain and volatile. Adjusted EBITDA margin ex-Argentina was 13.2% and expanded 130 bps YoY. In addition, the table below shows the accounting effects related to the hyperinflation impact (IAS 29) in Q1-24:
| Q1-24 (ex-hyperinflation) | Hiperinflation | FX EoP | Q1-24 (reported) | Q1-23 (ex-hyperinflation) | Hiperinflation | FX EoP | Q1-23 (reported) | |||
| Net revenues | 4.650 | 64 | -9 | 4.705 | Net revenues | 4.883 | 33 | -53 | 4.864 | |
| Adjusted EBITDA | 738 | -69 | -3 | 667 | Adjusted EBITDA | 698 | -53 | -13 | 633 | |
| % Adj. EBITDA margin | 15,9% | 14,2% | % Adj. EBITDA margin | 14,3% | 13,0% |
- Emana Pay at Natura and Avon significantly enhanced the Consultant’s financials in Q1-24, establishing another profitable source of revenue alongside cosmetics. The platform secured nearly 838,000 accounts since its inception and recorded a 57% YoY growth in TPV, reaching BRL 12.4 billion in Q1-24. This growth was followed by an increase in contribution margin and net income
- Other operating KPIs continues to show that the high-usage consultants had a 10% increase in productivity, combined with a 30% reduction in default rates. Within the franchise network, the &Co Pay was integrated in 600 stores (70% of the total Natura Stores)
- In the last quarter, the on-us credit portfolio reached BRL 105 million, enhancing payment terms, reducing default rates, and optimizing capital allocation
03 Avon International
| Avon International Operational KPIs change (%) Q1-24 vs. Q1-23 | |
| Representatives | ||
| -12.0% |
| Avon International (BRL million) | P&L | ||
| Q1-24 | Q1-23 | Ch. % | |
| Gross revenue | 1,663.0 | 1,921.0 | (13.4) |
| Net revenue | 1,396.7 | 1,606.6 | (13.1) |
| Constant currency | -4.7% | ||
| COGS | (519.8) | (571.2) | (9.0) |
| Gross profit | 876.9 | 1,035.4 | (15.3) |
| Gross margin | 62.8% | 64.4% | -160 bps |
| Selling, marketing and logistics expenses | (630.6) | (754.8) | (16.5) |
| Administrative, R&D, IT and project expenses | (336.4) | (372.2) | (9.6) |
| Other operating income / (expenses), net | (139.9) | 0.6 | - |
| Transformation / integration costs | (46.7) | (57.5) | (18.8) |
| Depreciation | 165.6 | 189.1 | (12.4) |
| EBITDA | (111.2) | 40.6 | (374.1) |
| EBITDA margin | -8.0% | 2.5% | -1050 bps |
| Transformation costs | 46.7 | 57.5 | (18.8) |
| Impairment and Goodwill | 46.7 | - | - |
| Net non-recurring other (income) / expenses | 92.4 | - | - |
| Adjusted EBITDA | 74.6 | 98.0 | (23.9) |
| Adjusted EBITDA margin | 5.3% | 6.1% | -80 bps |
- Avon International continued to manufacture products for The Body Shop following the sale of the business. As a result, from Q1-24 onwards revenues and costs from the sales of those products will be recognized in Avon’s P&L (vs. considered an intercompany before). Overall, from a gross profit perspective, the effect is broadly neutral, but revenues and COGS are higher (by ~BRL 40 million in this quarter), pressuring gross margin and adjusted EBITDA margin on a YoY comparison (although in a lesser extent for adjusted EBITDA). For further details, please see the table reconciling such effects in the appendix section
- Net revenue in Q1-24 was BRL 1,397 million (-4.7% YoY in CC or -7.2% excluding TBS revenues) impacted by lower rep count (-12.0% YoY) and a continuation of weaker promotional execution mentioned in Q4-23, which will be more meaningfully adjusted from Q3-24 onwards. Available representatives decline was explained by lower appointments more than offsetting churn reduction, while productivity was up on a YoY basis
- From a category perspective, Beauty performance was also impacted by promotional execution and declined -4.2% (ex-TBS), with the exception of Fragrances, while Home & Style was down -22% amid planned portfolio reduction
- Exploring opportunities from other distribution channels, including retailers, has been a strategic priority for Avon International, which translates to improving brand awareness and equity, that also pushes appointments up. This initiative is still in early stages, but Avon is already being sold in the UK via Superdrug, in Italy via Naima stores and in Turkey via reps retail franchise stores. This early initiative has showed improvements in sales, in regions where it is more actively exploring other distribution options
- In this sense, the business unit continues to make good progress with its digital strategy as the use of digital tools reached 36.5% of total reps (see distribution channel breakdown section – page 4). In addition, digital sales penetration increased by 1.7 percentage points YoY to 7.1% of total revenue
- Gross margin was 62.8%, down 160 bps YoY. Excluding the TBS consolidation effect, the margin improved YoY due to price increases and favorable product mix more than offsetting cost pressures and FX headwinds
- Adjusted EBITDA margin in Q1-24 was 5.3% (down -80 bps YoY) or 5.5% excluding TBS (-60 bps YoY), primarily impacted by sales deleverage. Despite the revenue performance, transformational savings led to a reduction of selling expenses as a percentage of net revenues mainly driven by the corporate structure simplification mentioned in Q4-23 (from four to two leading regions)
- Transformation costs in Q1-24 were BRL 42 million, mainly related to Digital and R&D transformation. This quarter, adjustments were also related to BRL 47 million impairment of a facility and BRL 92 million write-off of TBS receivables, amid the administration announcement
- From a cash conversion perspective, this first quarter was impacted by lower cash EBITDA and working capital dynamics, mainly related to a BRL 86 million impact related to The Body Shop (as mentioned in the cash flow section)
04 Social and environmental performance
(all actions refer to Natura &Co Group, unless stated otherwise)
Natura &Co released its 2023 Integrated Annual Report on April 16, 2024, which provides a comprehensive update on the environmental and social performance of Natura &Co Latin America and Avon International, as well as insights on how Natura &Co has focused on both addressing sustainability within its own business operations while also actively advocating for system-level change.
Some highlights from Natura &Co Integrated Annual Report include our Taskforce on Climate-related Financial Disclosure (TCFD). Natura &Co Holding, Natura &Co Latin America and Avon International took a consistent approach to identifying and assessing climate-related risks and opportunities and conducting climate scenario analysis. In 2024, we commenced the integration of climate-related risks and opportunities into our strategic planning processes which will be underpinned by financial impact calculations and increased business awareness to manage climate risks and opportunities.
Following Natura &Co’s Commitment to Life Sustainability Vision results on pay equity and living wage shared in Q4-23, there was also progress on our packaging circularity targets – all packaging material that are reusable, recyclable or compostable increased from 82.3% to 86.2%. Although we have achieved our biodegradable formula target which increased from 95.9% to 96.1%, we are continuing to advance on improving our results.
Business Units Update
Natura &Co Latin America
Natura &Co Latin America has sustained its transformative impact, pushing forward with substantial advancements in both environmental efforts and community engagement. The company reported a significant increase in the income of its beauty consultants and progressed in emission reduction and logistics efficiency. The innovative "Natura Innovation Challenge" seeks cutting-edge carbon offsetting solutions in collaboration with Amazon communities. This challenge seeks to address key issues such as land tenure regularization and innovative payment formats for environmental services. Natura has completed its first Integrated Profit & Loss results considering the timing of integrating the Avon Latin America business, maintaining strong socio-environmental impacts with a 1:2.7 (2.7 dollars generated in socio-environmental impact per dollar of net income) impact intensity and aiming for a fourfold return by 2030.
Additionally, Natura reinforced its commitment to socio-environmental returns at the South by Southwest (SXSW) event, where it brought Amazonian issues to an international stage, engaging an audience from 97 countries. The event underscored Natura's role in leading discussions on regeneration and bio-innovation, with significant contributions from key activists and the company’s Sustainability Director, Angela Pinhati. This aligns with Natura's ongoing goal to quadruple its socio-environmental return on revenue by 2030, maintaining a strong trajectory towards sustainable development and corporate responsibility.
Avon International
During International Women's Month, Avon advanced its commitment to women's empowerment with notable initiatives, including the release of the annual Global Progress for Women report, which highlighted setbacks in gender equality and safety. The report received significant attention in major media outlets, and in response, Avon strengthened its partnerships with NGOs to combat gender-based violence (GBV), highlighted by product launches like the Hydramatic Shine Lipstick, with profits supporting anti-GBV NGOs.
Avon also made strides in sustainability and ethical practices, pledging to make all packaging reusable, recyclable, or compostable by 2030 and launching product innovations such as plastic-free eyeshadows made from FSC certified paper. A notable partnership with Cotton made in Africa (CmiA) marked Avon's commitment to using ethically sourced cotton, supporting both environmental sustainability and the empowerment of women in Africa’s workforce.
07 Capital Markets and Stock Performance
NTCO3 share price on the Brazilian stock exchange (B3) at the end of Q1-24 was BRL 17.88, +5.9% in the quarter. Average Daily Trading Volume (ADTV) for the quarter was BRL 183.5 million, -25.3% vs Q1-23.
On March 31, 2024, the Company’s market capitalization was BRL 24.8 billion, and the Company’s capital was comprised of 1,386,848,066 common shares.
Following the announcement of January 2024, on April 10, the Company announced the termination of the ADS program, the effective date of termination of the deposit agreement for our ADS program and of the ADS program will be August 7, 2024.
08 Fixed income
Below is a table with details of all public debt instruments outstanding per issuer as of Mar 31, 2024:
| Issuer | Type | Issuance | Maturity | Principal (million) | Nominal Cost (per year) |
| 10/06/2022 | 09/15/2027 | BRL 255.9 million | DI + 0.8 per year | ||
| Natura Cosméticos S.A. | Debenture - 12th issue | 10/06/2022 | 09/15/2029 | BRL 487.2 million | IPCA + 6.80% |
| 10/06/2022 | 09/15/2032 | BRL 306.9 million | IPCA + 6.90% | ||
| Natura Cosméticos S.A. | Commercial Notes | 09/19/2022 | 09/19/2025 | BRL 500.0 million | DI + 1.55 per year |
| Natura Cosméticos S.A. | Debenture - 11th issue | 07/21/2022 | 07/21/2027 | BRL 826.0 million | DI + 1.65 per year |
| Natura &Co Luxemburg Holding (Natura Lux) | Bond - 2nd issue (Sustainability Linked Bond) | 05/03/2021 | 05/03/2028 | US$ 450.0 million | 4.125% |
| Natura &Co Luxemburg Holding (Natura Lux) | Bonds | 04/19/2022 | 04/19/2029 | US$ 270.0 million | 6.00% |
| Issuer: Avon Products, Inc. | Unsecured Bonds | 03/15/2013 | 03/15/2043 | US$ 21.8 million | 8,450%(1) |
| (1) Coupon based on current credit rating, governed by interest rate adjustment provisions | |||||
Ratings
Below is a table with current credit ratings:
| Natura &Co Holding S.A. | |||
| Agency | Global Scale | National Scale | Outlook |
| Fitch Ratings | BB+ | AAA | Stable |
| Moody's | Ba3 | - | Negative |
| Standard & Poor's | BB | AAA | Stable |
| Natura &Co Cosméticos S.A. | |||
| Agency | Global Scale | National Scale | Outlook |
| Fitch Ratings | BB+ | AAA | Stable |
| Moody's | Ba2 | - | Negative |
| Standard & Poor's | BB | AAA | Stable |
| Avon International | |||
| Agency | Global Scale | National Scale | Outlook |
| Fitch Ratings | BB | - | Stable |
| Moody's | Ba3 | - | Negative |
| Standard & Poor's | BB- | - | Stable |
09 Appendix
Natura &Co Latam Revenue Breakdown
| Natura &Co Latam | Net Revenue change (%) | |
| Q1-24 vs. Q1-23 | ||
| Reported (R$) | Constant Currency | |
| Natura Latama | 7.3% | 14.4% |
| Natura Brazil | 11.3% | 11.3% |
| Natura Hispanic | 0.4% | 22.3% |
| Avon Beauty + Home & Style | -21.2% | -17.1% |
| Avon Brazil | -17.8% | -17.8% |
| Avon Hispanic | -23.2% | -16.6% |
| a Natura Latam includes Natura Brazil, Hispanic and others | |||
Avon International ex TBS impacts
| Avon International Ex TBS | ||||
| Q1-24 | Q1-23 | |||
| Consolidated | TBS | Avon Ex TBS | ||
| Net revenues | 1,396.7 | 40.0 | 1,356.7 | 1,606.6 |
| COGS | (519.8) | (40.0) | (479.8) | (571.2) |
| Gross profit | 876.9 | - | 876.9 | 1,035.4 |
| Gross margin | 62.8% | 64.6% | 64.4% | |
| Selling, marketing and logistics expenses | (630.6) | (630.6) | (754.8) | |
| % of NR | -45.2% | -46.5% | -47.0% | |
| Administrative, R&D, IT and project expenses | (336.4) | (336.4) | (372.2) | |
| % of NR | -24.1% | -24.8% | -23.2% | |
| Other operating income / (expenses), net | (0.8) | (0.8) | 0.6 | |
| % of NR | -0.1% | -0.1% | - | |
| Depreciation | 165.6 | 165.6 | 189.1 | |
| % of NR | 11.9% | 12.2% | 11.8% | |
| Adjusted EBITDA | 74.6 | 74.6 | 98.1 | |
| Adjusted EBITDA margin | 5.3% | 5.5% | 6.1% | |
Free Cash Flow Reconciliation
The correspondence between Free Cash Flow and Statements of Cash Flow is shown below:
| R$ million | Free Cash Flow Reconciliation | ||||||||
| CASH FLOW FROM OPERATING ACTIVITIES | |||||||||
| Net (loss) income for the period | (a) | Net income | |||||||
| Adjustments to reconciliate net (loss) income for the period with net cash used in operating activities: | |||||||||
| Depreciation and amortization | (b) | Depreciation/amortization | |||||||
| Interest and exchange variation on short-term investments | (c) | Non-cash adjustments to net income | |||||||
| Loss from swap and forward derivative contracts | (c) | ||||||||
| Increse (reversion) of provision for tax, civil and labor risks | (c) | ||||||||
| Monetary adjustment of judicial deposits | (c) | ||||||||
| Monetary adjustment of provision for tax, civil and labor risks | (c) | ||||||||
| Income tax and social contribution | (c) | ||||||||
| Income from sale and write-off of property, plant and equipment and intagible | (c) | ||||||||
| Interest and exchange rate variation on leases | (c) | ||||||||
| Interest and exchange rate variation on borrowings, financing and debentures, net of acquisition costs | (c) | ||||||||
| Adjustment and exchange rate variation on other assets and liabilities | (c) | ||||||||
| Provision (reversal) for losses on property, plant and equipment, intangible assets and leases | (c) | ||||||||
| Provision for impairment | (c) | ||||||||
| Increase (reversion) of provision for stock option plans | (c) | ||||||||
| Provision for losses with trade accounts receivables, net of reversals | (c) | ||||||||
| Provision for inventory losses, net of reversals | (c) | ||||||||
| Provision for carbon credits | (c) | ||||||||
| Effect from hyperinflationary economy | (c) | ||||||||
| Increase (Decrease) in: | |||||||||
| Trade accounts receivable and related parties | (d2) | Accounts receivable | |||||||
| Inventories | (d1) | Inventories | |||||||
| Recoverable taxes | (d4) | Other Assets and Liabilities | |||||||
| Other assets | (d4) | Other Assets and Liabilities | |||||||
| Domestic and foreign trade accounts payable and related parties | (d3) | Accounts payable | |||||||
| Payroll, profit sharing and social charges, net | (d4) | Other Assets and Liabilities | |||||||
| Tax liabilities | (d4) | Other Assets and Liabilities | |||||||
| Other liabilities | (d4) | Other Assets and Liabilities | |||||||
| OTHER CASH FLOWS FROM OPERATING ACTIVITIES | |||||||||
| Payment of income tax and social contribution | (e) | Income Tax and Social Contribuion | |||||||
| Release of judicial deposits | (h) | Other Operating Activities | |||||||
| Payments related to tax, civil and labor lawsuits | (h) | ||||||||
| (Payments) proceeds due to settlement of derivative transactions | (f) | Interest on Debt and derivative settlement | |||||||
| Payment of interest on lease | (g) | Lease Payments | |||||||
| Payment of interest on borrowings, financing and debentures | (f) | Interest on Debt and derivative settlement | |||||||
| Operating Activities Discontinued Operations | (m) | Operating activities - discountinued operations | |||||||
| NET CASH (USED IN) OPERATING ACTIVITIES | |||||||||
| CASH FLOW FROM INVESTING ACTIVITIES | |||||||||
| Additions of property, plant and equipment and intangible | (j) | Capex | Free Cash Flow | Cash Flow Reconciliation | |||||
| Proceeds from sale of property, plant and equipment and intangible | (i) | Capex | Net income (loss) | (a) | |||||
| Short-term acquisition | (j) | Sale of Assets | Depreciation and amortization | (b) | |||||
| Redemption of short-term investments | (l) | Other financing and investing activities | Non-cash Adjustments to Net Income | (c) | |||||
| Redemption of interest on short-term investments | (l) | Operating activities - discontinued operations | (m) | ||||||
| Investing activities - discontinued operations | (o) & (l) | Capex - discountinued operations & Other financing and investing activities | Adjusted Net income | ||||||
| Decrease / (Increase) in Working Capital | (d) | ||||||||
| NET CASH GENERATED BY (USED IN) INVESTING ACTIVITIES | Inventories | (d1) | |||||||
| Accounts receivable | (d2) | ||||||||
| CASH FLOW FROM FINANCING ACTIVITIES | Accounts payable | (d3) | |||||||
| Repayment of lease - principal | (g) | Lease payments | Other assets and liabilities | (d4) | |||||
| Repayment of borrowings, financing and debentures – principal | (l) | Other financing and investing activities | Income tax and social contribution | (e) | |||||
| New borrowings, financing, and debentures | (l) | Interest on debt and derivative settletment | (f) | ||||||
| Acquisition of treasury shares, net of receipt of option strike price | (l) | Lease payments | (g) | ||||||
| Payment of dividends and interest on equity | (l) | Other operating activities | (h) | ||||||
| Receipt (payment) of funds due to settlement of derivative transactions | (l) | Cash from Operations | |||||||
| Capital Increase | (l) | Capex | (j) | ||||||
| Financing activities - discontinued operations | (n) | Payment of lease - discountinued operations | Sale of Assets | (i) | |||||
| NET CASH PROVIDED BY (USED IN) FINANCING ACTIVITIES | Exchange rate variation | (k) | |||||||
| Effect of exchange rate variation on cash and cash equivalents | (k) | Exchange Rate Effect | Free Cash Flow | ||||||
| DECREASE IN CASH AND CASH EQUIVALENTS | Other financing and investing activities | (l) | |||||||
| Opening balance of cash and cash equivalents | Payment of lease - principal discountinued operation | (n) | |||||||
| Closing balance of cash and cash equivalents | Capex - discountinued operation | (o) | |||||||
| DECREASE IN CASH AND CASH EQUIVALENTS | Cash Balance Variation | ||||||||
Consolidated Balance Sheet
| ASSETS (R$ million) | Mar-24 | Dec-23 | LIABILITIES AND SHAREHOLDER'S EQUITY (R$ million) | Mar-24 | Dec-23 | |
| CURRENT ASSETS | CURRENT LIABILITIES | |||||
| Cash and cash equivalents | 4,190.6 | 3,750.9 | Borrowings, financing and debentures | 128.1 | 163.8 | |
| Short-term investments | 1,665.4 | 4,024.1 | Lease | 307.4 | 298.6 | |
| Trade accounts receivable | 3,698.9 | 3,524.4 | Trade accounts payable and reverse factoring operations | 5,350.7 | 5,302.5 | |
| Accounts receivable - sale of subsidiary | - | 22.9 | Dividends and interest on shareholders' equity payable | 1,018.3 | 294.2 | |
| Inventories | 3,709.5 | 3,087.4 | Payroll, profit sharing and social charges | 1,138.6 | 1,019.7 | |
| Recoverable taxes | 705.8 | 608.5 | Tax liabilities | 593.3 | 634.8 | |
| Income tax and social contribution | 246.5 | 175.6 | Income tax and social contribution | 225.3 | 908.4 | |
| Derivative financial instruments | 94.7 | 189.0 | Derivative financial instruments | 132.8 | 329.7 | |
| Other current assets | 778.2 | 604.4 | Provision for tax, civil and labor risks | 593.0 | 491.3 | |
| Assets held for sale | 92.9 | - | Other current liabilities | 808.7 | 970.5 | |
| Total current assets | 15,182.6 | 15,987.2 | Total current liabilities | 10,296.1 | 10,413.5 | |
| NON CURRENT ASSETS | NON CURRENT LIABILITIES | |||||
| Accounts receivable - sale of subsidiary | 332.5 | 806.6 | Borrowings, financing and debentures | 6,059.1 | 5,947.9 | |
| Recoverable taxes | 1,031.8 | 1,112.4 | Lease | 756.9 | 851.8 | |
| Deferred income tax and social contribution | 2,421.4 | 2,200.7 | Payroll, profit sharing and social charges | 17.5 | 16.1 | |
| Judicial deposits | 382.2 | 408.0 | Tax liabilities | 161.0 | 127.2 | |
| Derivative financial instruments | 84.7 | 89.5 | Deferred income tax and social contribution | 361.1 | 328.1 | |
| Short-term investments | 37.8 | 36.7 | Derivative financial instruments | - | - | |
| Other non-current assets | 1,021.5 | 1,027.7 | Provision for tax, civil and labor risks | 1,303.4 | 1,255.5 | |
| Total long term assets | 5,311.8 | 5,681.5 | Other non-current liabilities | 603.9 | 686.5 | |
| Property, plant and equipment | 3,405.2 | 3,457.6 | Total non-current liabilities | 9,262.9 | 9,213.1 | |
| Intangible | 16,730.6 | 16,569.9 | SHAREHOLDERS' EQUITY | |||
| Right of use | 1,016.3 | 1,050.8 | Capital stock | 12,484.5 | 12,484.5 | |
| Total non-current assets | 26,463.8 | 26,759.8 | Treasury shares | (83.8) | (164.2) | |
| Capital reserves | 10,420.3 | 10,558.5 | ||||
| Profit Reserves | 51.7 | 780.3 | ||||
| Accumulated Losses | (934.8) | - | ||||
| Other comprehensive income | 132.8 | (555.8) | ||||
| Equity attributable to owners of the Company | 22,070.7 | 23,103.2 | ||||
| Non-controlling interest in shareholders' equity of subsidiaries | 16.7 | 17.2 | ||||
| TOTAL ASSETS | 41,646.4 | 42,747.0 | TOTAL LIABILITIES AND SHAREHOLDERS' EQUITY | 41,646.4 | 42,747.0 |
Consolidated Income Statement- Including Purchase Price Allocation (PPA) Amortization
| R$ million | Q1-24 | Q1-23 | Ch. % |
| NET REVENUE | 6,105.3 | 6,471.5 | (5.7) |
| Cost of Products Sold | (2,127.1) | (2,313.2) | (8.0) |
| GROSS PROFIT | 3,978.2 | 4,158.3 | (4.3) |
| OPERATING EXPENSES | |||
| Selling, Marketing and Logistics Expenses | (2,497.1) | (2,543.8) | (1.8) |
| Administrative, R&D, IT and Project Expenses | (1,043.0) | (1,162.2) | (10.3) |
| Impairment losses on trade receivables | (235.9) | (215.5) | 9.5 |
| Other Operating Expenses, Net | (46.9) | (50.7) | (7.4) |
| LOSS FROM OPERATIONS BEFORE FINANCIAL RESULT | 155.2 | 186.2 | (16.6) |
| Net Financials | (361.2) | (460.2) | (21.5) |
| LOSS BEFORE INCOME TAX AND SOCIAL CONTRIBUTION | (206.0) | (274.0) | (24.8) |
| Income Tax and Social Contribution | (237.1) | (122.2) | 94.0 |
| (LOSS) INCOME FROM CONTINUED OPERATIONS | (443.1) | (396.2) | 11.8 |
| Income (Loss) from discontinued operations | (492.1) | (256.0) | 92.2 |
| (LOSS) INCOME FOR THE PERIOD | (935.1) | (652.2) | 43.4 |
| Attributable to controlling shareholders | (934.8) | (652.4) | 43.3 |
| Attributable to non-controlling shareholders | (0.3) | 0.3 | (213.1) |
Purchase Price Allocation (PPA) Amortization
| Consolidated | Natura &Co Latam | Avon International | ||||
| R$ million | Q1-24 | Q1-23 | Q1-24 | Q1-23 | Q1-24 | Q4-23 |
| Net Revenue | - | - | - | - | - | - |
| Cost of Products Sold | (2.4) | (1.5) | (1.7) | (0.6) | (0.7) | (0.8) |
| Gross Profit | (2.4) | (1.5) | (1.7) | (0.6) | (0.7) | (0.8) |
| Selling, Marketing and Logistics Expenses | (67.1) | (64.4) | (37.4) | (32.4) | (29.7) | (32.0) |
| Administrative, R&D, IT and Project Expenses | (71.9) | (75.5) | (1.3) | (1.4) | (70.6) | (74.1) |
| Other Operating Income (Expenses), Net | (39.1) | 28.6 | 7.5 | 5.7 | (46.7) | 22.9 |
| Financial Income/(Expenses), net | (6.6) | 15.8 | - | - | - | - |
| Income Tax and Social Contribution | (51.0) | 16.4 | - | - | - | - |
| LOSS FROM CONTINUED OPERATIONS | (238.1) | (80.5) | (32.8) | (28.6) | (147.7) | (84.1) |
| Depreciation | (141.4) | (141.3) | (40.4) | (34.4) | (101.0) | (107.0) |
Consolidated Statement of Cash Flow
| R$ million | Mar - 24 | Mar - 23 |
| CASH FLOW FROM OPERATING ACTIVITIES | ||
| Net (loss) income for the period | (935.1) | (652.2) |
| Adjustments to reconciliate net (loss) income for the period with net cash used in operating activities: | ||
| Depreciation and amortization | 392.2 | 416.0 |
| Interest and exchange variation on short-term investments | (24.5) | (190.7) |
| Loss from swap and forward derivative contracts | 9.5 | 365.9 |
| Increse (reversion) of provision for tax, civil and labor risks | 49.7 | (20.5) |
| Monetary adjustment of judicial deposits | (6.6) | (8.1) |
| Monetary adjustment of provision for tax, civil and labor risks | 15.2 | 15.9 |
| Income tax and social contribution | 237.1 | 122.2 |
| Income from sale and write-off of property, plant and equipment and intagible | 43.4 | 32.2 |
| Interest and exchange rate variation on leases | 43.3 | 33.8 |
| Interest and exchange rate variation on borrowings, financing and debentures, net of acquisition costs | 114.2 | 109.3 |
| Adjustment and exchange rate variation on other assets and liabilities | 0.0 | 0.7 |
| Provision (reversal) for losses on property, plant and equipment, intangible assets and leases | 46.7 | 0.0 |
| Provision for impairment | 0.0 | (31.1) |
| Increase (reversion) of provision for stock option plans | (22.0) | (15.2) |
| Provision for losses with trade accounts receivables, net of reversals | 235.9 | 215.8 |
| Provision for inventory losses, net of reversals | 91.6 | 145.7 |
| Provision for carbon credits | 12.2 | (7.2) |
| Effect from hyperinflationary economy | 223.5 | 95.4 |
| Increase (Decrease) in: | ||
| Trade accounts receivable and related parties | (385.1) | (235.4) |
| Inventories | (677.6) | (502.3) |
| Recoverable taxes | (9.3) | (98.9) |
| Other assets | (219.1) | (59.0) |
| Domestic and foreign trade accounts payable and related parties | (7.9) | (485.1) |
| Payroll, profit sharing and social charges, net | 74.3 | (86.5) |
| Tax liabilities | (20.5) | 32.0 |
| Other liabilities | (210.8) | (58.4) |
| OTHER CASH FLOWS FROM OPERATING ACTIVITIES | 6,743.3 | 1,538.4 |
| Payment of income tax and social contribution | (141.1) | (124.6) |
| Release of judicial deposits | 13.4 | 7.0 |
| Payments related to tax, civil and labor lawsuits | (34.7) | (11.2) |
| (Payments) proceeds due to settlement of derivative transactions | (38.3) | (90.2) |
| Payment of interest on lease | (42.7) | (31.6) |
| Payment of interest on borrowings, financing and debentures | (164.3) | (200.4) |
| Operating Activities Discontinued Operations | (386.7) | (267.8) |
| NET CASH (USED IN) OPERATING ACTIVITIES | (1,724.0) | (1,584.6) |
| CASH FLOW FROM INVESTING ACTIVITIES | ||
| Additions of property, plant and equipment and intangible | (119.9) | (218.5) |
| Proceeds from sale of property, plant and equipment and intangible | 0.0 | 1.4 |
| Short-term acquisition | (6,926.8) | (2,087.4) |
| Redemption of short-term investments | 9,194.0 | 2,306.5 |
| Redemption of interest on short-term investments | 114.9 | 50.1 |
| Investing activities - discontinued operations | 0.0 | (83.1) |
| NET CASH GENERATED BY (USED IN) INVESTING ACTIVITIES | 2,262.2 | (30.9) |
| CASH FLOW FROM FINANCING ACTIVITIES | ||
| Repayment of lease - principal | (114.5) | (86.4) |
| Repayment of borrowings, financing and debentures – principal | (25.9) | (86.3) |
| New borrowings, financing, and debentures | 28.9 | 5.9 |
| Acquisition of treasury shares, net of receipt of option strike price | 0.0 | 0.0 |
| Payment of dividends and interest on equity | 0.0 | (0.0) |
| Receipt (payment) of funds due to settlement of derivative transactions | (56.5) | (7.3) |
| Capital Increase | 0.0 | 0.1 |
| Financing activities - discontinued operations | 0.0 | (167.6) |
| NET CASH PROVIDED BY (USED IN) FINANCING ACTIVITIES | (168.0) | (341.6) |
| Effect of exchange rate variation on cash and cash equivalents | 69.5 | (14.1) |
| DECREASE IN CASH AND CASH EQUIVALENTS | 439.7 | (1,971.2) |
| Opening balance of cash and cash equivalents | 3,750.9 | 4,195.7 |
| Closing balance of cash and cash equivalents | 4,190.6 | 2,224.5 |
| DECREASE IN CASH AND CASH EQUIVALENTS | 439.7 | (1,971.2) |
08 Conference call and webcast
.
09 Glossary
ADR: An American Depositary Receipt is a negotiable certificate issued by a U.S. depository bank representing a specified number of shares of a non-U.S. company stock.
ADS: The individual issuance of shares in a U.S. stock exchange by a non-U.S. company is referred to as American Depositary Shares (ADS)
Adjusted EBITDA: Excludes effects that are not considered usual, recurring or not-comparable between the periods under analysis
APAC: Asia and Pacific
ARS: the foreign exchange market symbol for the Argentine peso
Avon representatives: Self-employed resellers who do not have a formal labor relationship with Avon
B3: Brazilian Stock Exchange
BPS: Basis Points; a basis points is equivalent to one percentage point * 100
Brand Power: A methodology used by Natura &Co to measure how its brands are perceived by consumers, based on metrics of significance, differentiation and relevance.
BRL: Brazilian Reais
CDI: The overnight rate for interbank deposits
CEE: Central and Eastern Europe
CFT: Cosmetics, Fragrances and Toiletries Market (CFT = Fragrances, Body Care and Oil Moisture, Make-up (without Nails), Face Care, Hair Care (without Colorants), Soaps, Deodorants, Men’s Grooming (without Razors) and Sun Protection
COGS: Costs of Goods Sold
Constant currency (“CC) or constant exchange rates: when exchange rates used to convert financial figures into a reporting currency are the same for the years under comparison, excluding foreign currency fluctuation effects
CO2e: Carbon dioxide equivalent; for any quantity and type of greenhouse gas, CO2e signifies the amount of CO2 which
would have the equivalent global warming impact.
EBITDA: Earnings Before Interests, Tax, Depreciation and Amortization
EMEA: Europe, Middle East and Africa
EP&L: Environmental Profit & Loss
Foreign currency translation: conversion of figures from a foreign currency into the currency of the reporting entity
FX: foreign exchange
FY: fiscal year
G&A: General and administrative expenses
IAS 29: “Financial Reporting in Hyperinflationary Economies' requires the financial statements of any entity whose functional currency is the currency of a hyperinflationary economy to be restated for changes in the general purchasing power of that currency so that the financial information provided is more meaningful
IBOV: Ibovespa Index is the main performance indicator of the stocks traded in B3 and lists major companies in the Brazilian capital market
IFRS – International Financial Reporting Standards
Hispanic Latam: Often used to refer to the countries in Latin America, excluding Brazil
NYSE: New York Stock Exchange
P&L: Profit and loss
PP: Percentage point
PPA: Purchase Price Allocation - effects of the fair market value assessment as a result of a business combination
Profit Sharing: The share of profit allocated to employees under the profit-sharing program
Quarter on quarter (“QoQ): is a measuring technique that calculates the change between one fiscal quarter and the previous fiscal quarter
SEC: The U.S. Securities and Exchange Commission (SEC) is an independent federal government regulatory agency responsible for protecting investors, maintaining fair and orderly functioning of the securities markets, and facilitating capital formation
SG&A: Selling, general and administrative expenses
TBS: The Body Shop.
Task Force on Climate-Related Financial Disclosures (“TCFD): climate-related disclosure recommendations enable stakeholders to understand carbon-related assets and their exposures to climate-related risks
Task force on Nature-related Financial Disclosures (“TNFD): The TNFD Framework seeks to provide organisations and financial institutions with a risk management and disclosure framework to identify, assess, manage and report on nature-related dependencies, impacts, risks and opportunities ("nature-related issues"), encouraging organisations to integrate nature into strategic and capital allocation decision making
TPV: Total Payment Volume
UNI: Underlying Net Income, which is net income excluding transformation costs, restructuring costs, discontinued operations and PPA effects
Year-over-year (“YOY): is a financial term used to compare data for a specific period of time with the corresponding period from the previous year. It is a way to analyze and assess the growth or decline of a particular variable over a twelve-month period
Year to date (“YTD): refers to the period of time beginning the first day of the current calendar year or fiscal year up to the current date. YTD information is useful for analyzing business trends over time or comparing performance data to competitors or peers in the same industry
10 Disclaimer
EBITDA is not a measure under BR GAAP and does not represent cash flow for the periods presented. EBITDA should not be considered an alternative to net income as an indicator of operating performance or an alternative to cash flow as an indicator of liquidity. EBITDA does not have a standardized meaning and the definition of EBITDA used by Natura may not be comparable with that used by other companies. Although EBITDA does not provide under BR GAAP a measure of cash flow, Management has adopted its use to measure the Company’s operating performance. Natura also believes that certain investors and financial analysts use EBITDA as an indicator of performance of its operations and/or its cash flow.
This report contains forward-looking statements. These forward-looking statements are not historical fact, but rather reflect the wishes and expectations of Natura’s management. Words such as “anticipate,” “wish,” “expect,” “foresee,” “intend,” “plan,” “predict,” “project,” “desire” and similar terms identify statements that necessarily involve known and unknown risks. Known risks include uncertainties that are not limited to the impact of price and product competitiveness, the acceptance of products by the market, the transitions of the Company’s products and those of its competitors, regulatory approval, currency fluctuations, supply and production difficulties and changes in product sales, among other risks. This report also contains certain pro forma data, which are prepared by the Company exclusively for informational and reference purposes and as such are unaudited. This report is updated up to the present date and Natura does not undertake to update it in the event of new information and/or future events.
Investor Relations Team
ri@natura.net

First-Quarter 2024 Results May 14, 2024Earnings presentation

Disclaimer The words “anticipate," "wishes,“ "expects," "estimates," "intends," "forecasts," "plans," "predicts," "projects," "targets" and similar words are intended to identify these statements, which necessarily involve known and unknown risks and uncertainties. Known risks and uncertainties include, but are not limited to, the impact of competitive products and pricing, market acceptance of products, product transitions by the Company and its competitors, regulatory approval, currency fluctuations, production and supply difficulties, changes in product sales mix, and other risks.This presentation also may include pro-forma and adjusted information prepared by the Company for information and reference purposes only, which has not been audited. Forward-looking statements speak only as of the date they are made, and the Company does not undertake any obligation to update them in light of new information or future developments.https://ri.naturaeco.com/en/
Initiatives in Rio Grande do SulIn the face of the largest climate tragedy in the history of Rio Grande do Sul state, we have offered our network medical, social, and psychological assistance through free telemedicine services and our social center 1 We have an important connection with Rio Grande do Sul - in addition to Beauty Consultants, we have direct and indirect employees, stores, and a distribution centerA Calamity Committee was established to map the impacts within our network. Among the main initiatives taken were: Postponing invoicing Providing financial support and donations to our employees who were directly affected
Key Highlights 4Natura &Co Performance 1Q24 Sales deleverage at Avon International Wave 2 implemented countries driving margin expansion and showing improvements in metrics Strong performance at Natura Brand in BrazilExpected soft performance from Avon Latam Very strong mid-single digits margin expansion from Colombia and Peru Productivity, cross-selling, and activity continuing to show improvement Double-digit revenue expansion YoY in a growth momentum for the brand Boosted innovation campaigns prepared for 2024 Management continues to work on market simplification and focusing on key countries Revenues decline in CFT amid Wave 2 implementation, strong decline in Home & Style Avon Brazil still experiencing a planned topline decline but is expected to stabilize in the second semester
Consolidated Financial Performance Guilherme Castellan, CFO

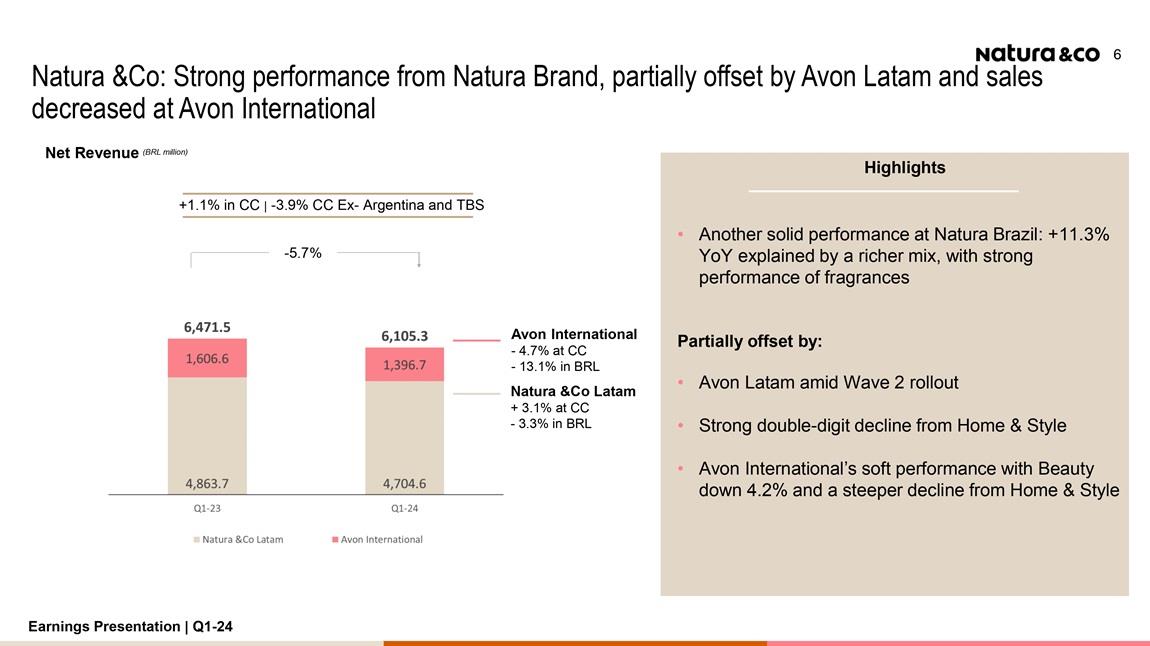
Natura &Co: Strong performance from Natura Brand, partially offset by Avon Latam and sales decreased at Avon International Net Revenue (BRL million) Highlights Natura &Co Latam + 3.1% at CC - 3.3% in BRL Avon International- 4.7% at CC - 13.1% in BRL -5.7% 6 • Another solid performance at Natura Brazil: +11.3% YoY explained by a richer mix, with strong performance of fragrances Partially offset by:• Avon Latam amid Wave 2 rollout • Strong double-digit decline from Home & Style • Avon International’s soft performance with Beauty down 4.2% and a steeper decline from Home & Style
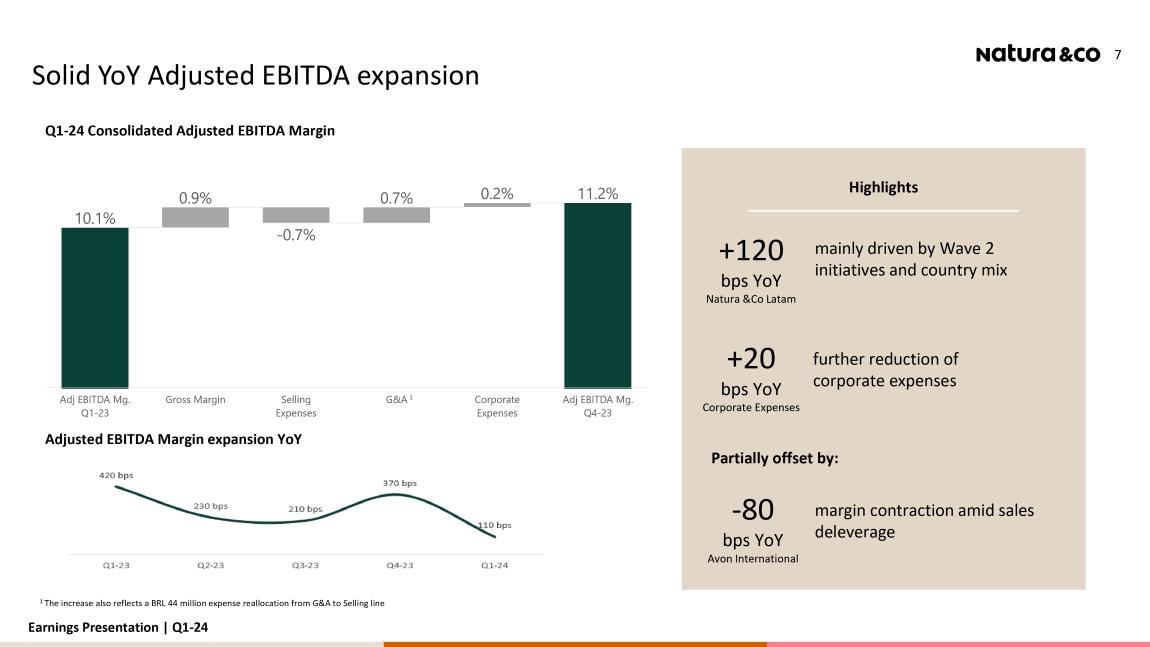
Solid YoY Adjusted EBITDA expansion Partially offset by: +120 bps YoY Natura &Co Latam mainly driven by Wave 2 initiatives and country mix further reduction of corporate expenses +20 bps YoY Corporate Expenses Highlights Adjusted EBITDA Margin expansion YoY1 The increase also reflects a BRL 44 million expense reallocation from G&A to Selling line margin contraction amid sales deleverage
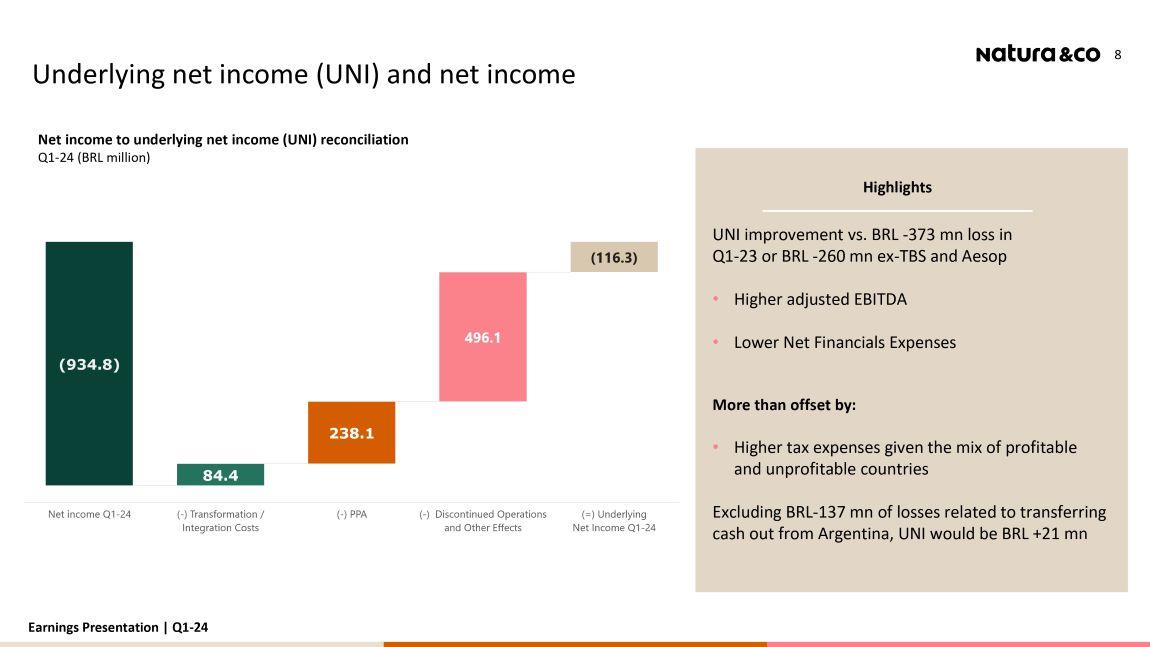
Underlying net income (UNI) and net income UNI improvement vs. BRL -373 mn loss in Q1-23 or BRL -260 mn ex-TBS and Aesop • Higher adjusted EBITDA • Lower Net Financials Expenses More than offset by:• Higher tax expenses given the mix of profitable and unprofitable countriesExcluding BRL-137 mn of losses related to transferring cash out from Argentina, UNI would be BRL +21 mn
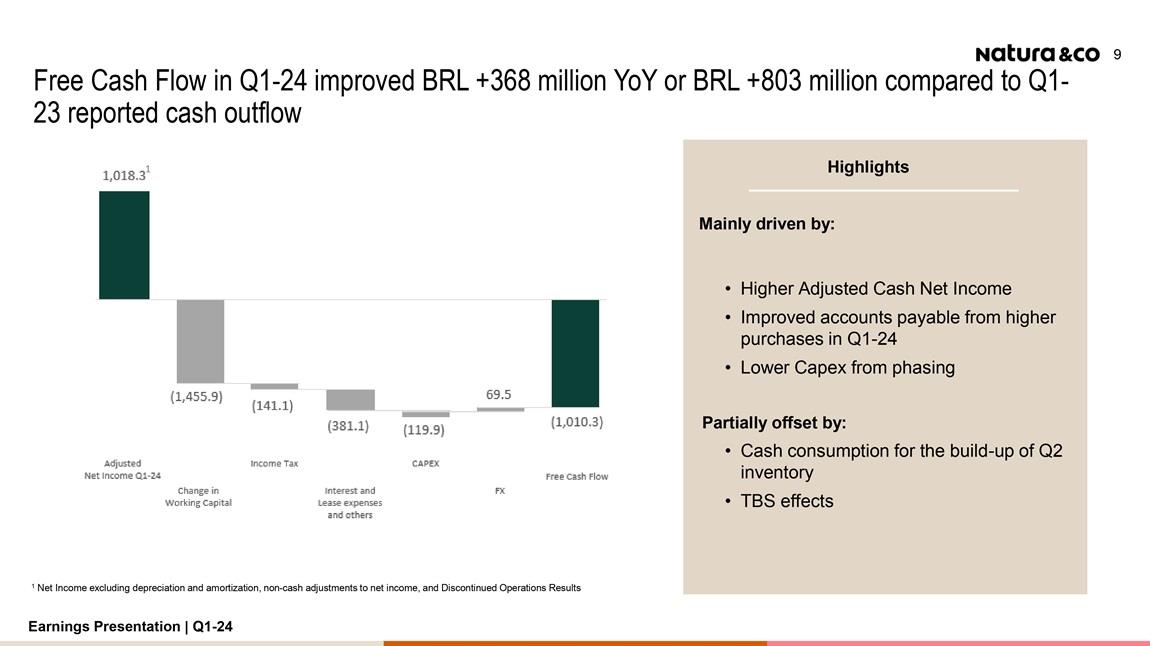
Free Cash Flow in Q1-24 improved BRL +368 million YoY or BRL +803 million compared to Q1- 23 reported cash outflow Mainly driven by: • Higher Adjusted Cash Net Income • Improved accounts payable from higher purchases in Q1-24 • Lower Capex from phasing Partially offset by:• Cash consumption for the build-up of Q2 inventory • TBS effects
Indebtedness ratios and Amortization Schedule Q1-24 Net debt and net debt-to-EBITDA ratio (BRL billion) Amortization schedule (BRL billion)(a) Gross debt excludes PPA impacts and excludes lease agreements(b) Excluding foreign currency hedging and including Avon’s Bond 2043 BRL 5.9 billion Cash balance at period-end 0.13x Group net debt-to-EBITDA ratio amid seasonal cash consumption
Natura &Co Latam Financial Performance

Coordination of delivery time frames • Inventory • shortage continues to improve but remains challenging • SKUs from key categories showed inventories levels back to normality which enabled a healthy performance at Natura • Stable base of consultants QoQ and its relationship with leadersHispanic Latam • Peru and Colombia distribution channels still impacted YoY but showing recovering trends QoQ; productivity showing YoY growth, partially offsetting YoY decreased activity
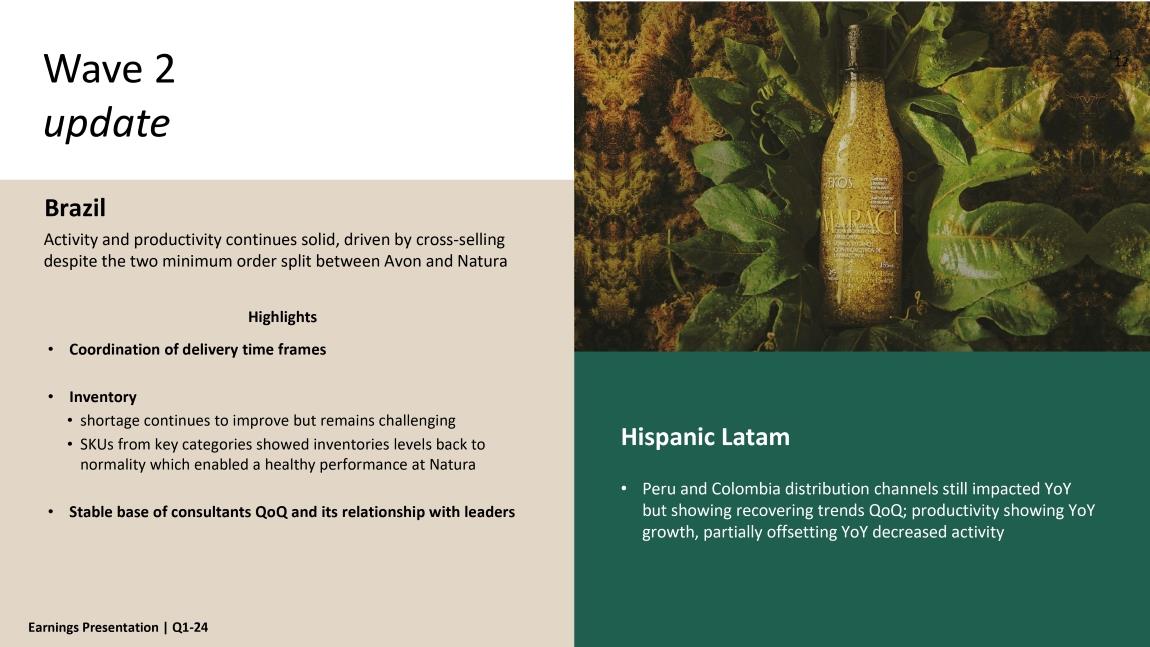
Net Revenue (BRL million) Natura CFT: Avon CFT: Home & Style: • D ecline in C C , directly related to the planned portfolio optim ization strategy and com m ercial incentives reduction• Brazil: 11.3% YoY decrease, im pacted m ainly by the channel and SKU reduction • Hispanic: 11.8% decrease and -24.1% YoY ex A rgentina, still im pacted by Wave 2 im plem entation and preparation • Brazil: 11.3% YoY increase, despite the tough com p base • Hispanic: R em ained broadly stable revenue in C C excluding A rgentina-3.3%+ 11.3% in CC + 22.3% in CC - 11.3% in CC - 11.8% in CC - 42.1% in CC- 26.1% in CC Natura &Co Latam: accelerating momentum in Brazil, even considering higher indirect tax burden in the country +3.1% in CC | -2.7% CC Ex- Argentina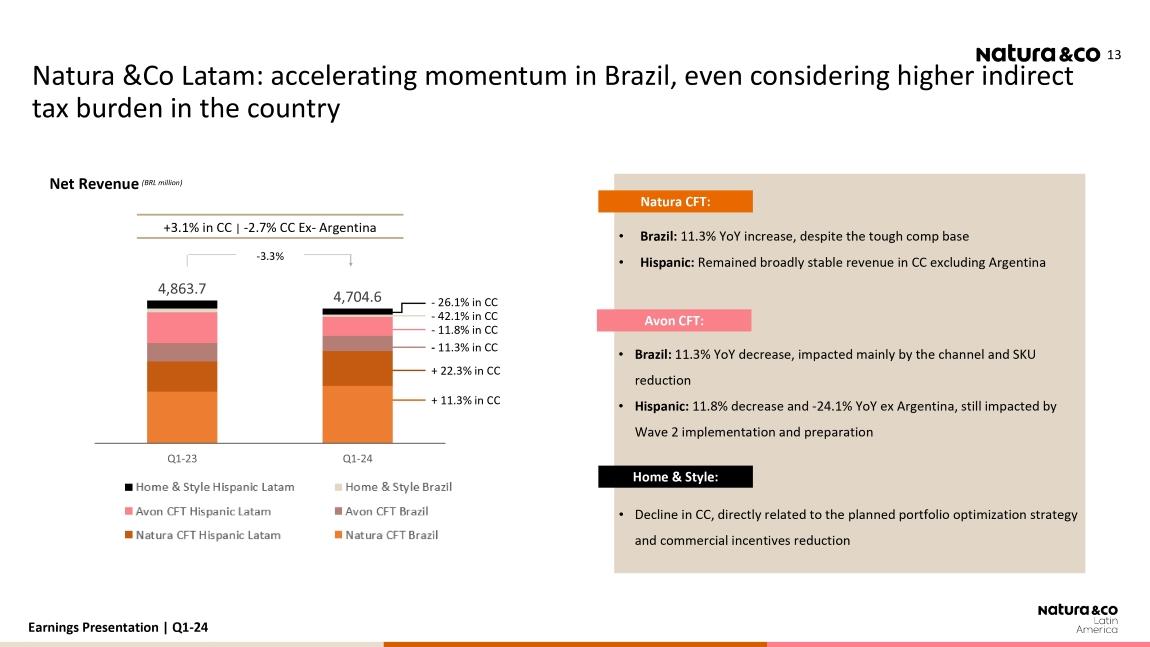
Adjusted EBITDA¹ and Adjusted EBITDA margin (BRL million, %) 1 Excluding effects that are not considered recurring nor com parable betw een the periods under analysis, such as integration costs and net n on-recurring other (incom e)/expenses 13.0% 14 Fifth consecutive quarter of profitability expansion YoY even with higher investments and indirect tax burden Highlights Driven by gross margin improvement 14.2% Partially offset by: • Planned investments, mainly related to marketing for Natura Brazil • Initiatives focused on improving service levels +120bps YoY Adj EBITDA Margin
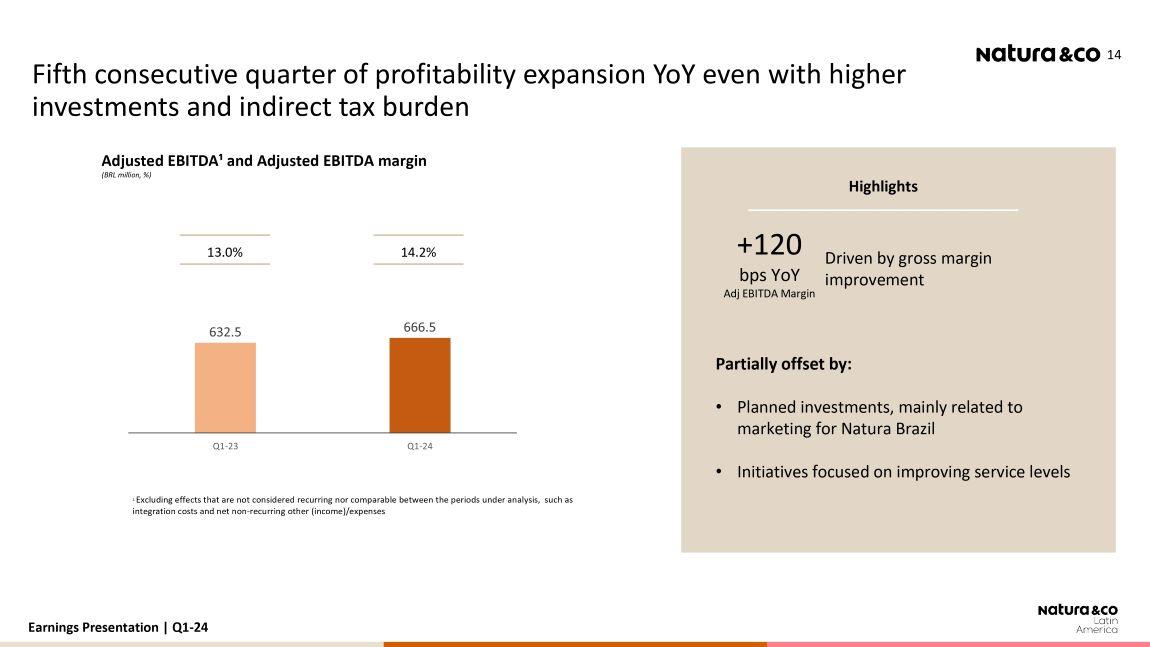
Avon International Financial Performance

Avon International: Challenging quarter with topline decline Net Revenue (BRL million) Adjusted EBITDA¹ and Adjusted EBITDA margin (BRL million, %)1 Excluding effects that are not considered recurring nor com parable betw een the periods under analysis, such as tra nsfo rm a tion costs and restructuring costs - business unit/Im pairm ent and Goodw ill-4.7% CC l -7.2% Ex-TBS -13.1% 16 6.1% 5.3% Highlights -7.2% YoY in CC Driven by: • drop in Beauty revenue (-4%) • decline in Home & Style (-22%) • lower rep count • weaker promotion execution -80 bps YoY Net Revenue Driven by: • sales deleverage Partially offset by: • reduction of selling expenses amid transformation savings
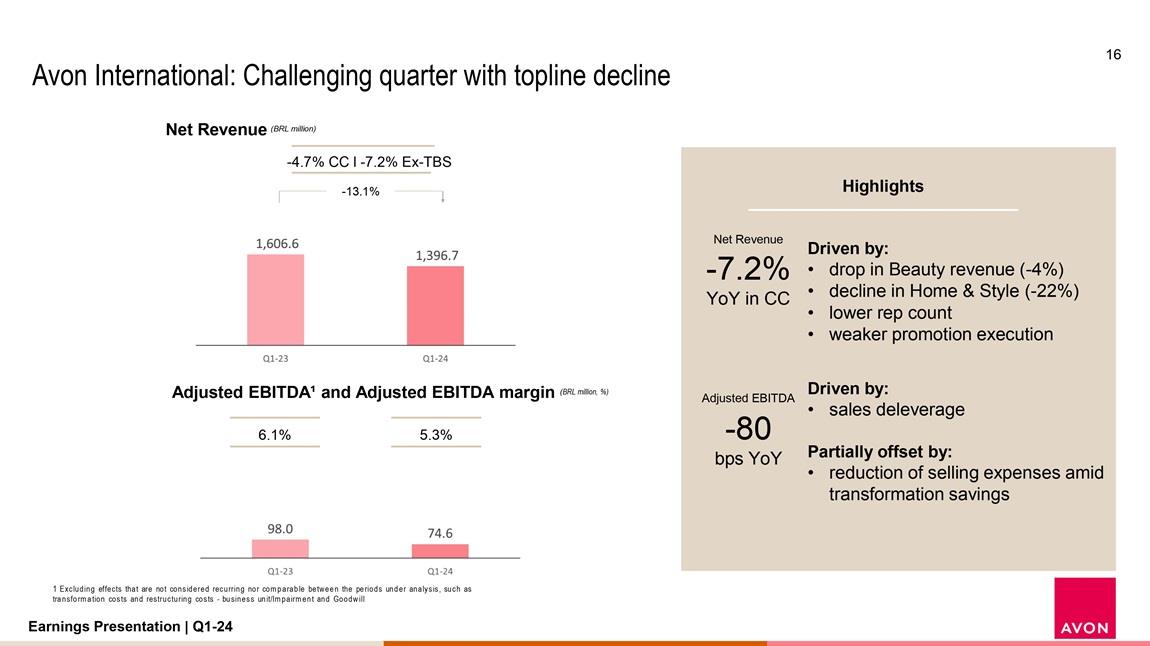
Closing Remarks Fábio Barbosa, CEO
Key Takeaways 1 2 3 Continuing to evolve on the studies of a potential separation of AvonThe solid start to the year gives us confidence that the initiatives we are implementing are starting to deliver the expected results Margin and cash continue our priorities in the short term, while resource allocation will continue to be a critical driver for sustainable value creation 4 As was the case during the pandemic, our top priority remains the same: to take care of our greatest asset – our People Unlocking sustainable shareholder value … …through our triple-bottom-line agenda
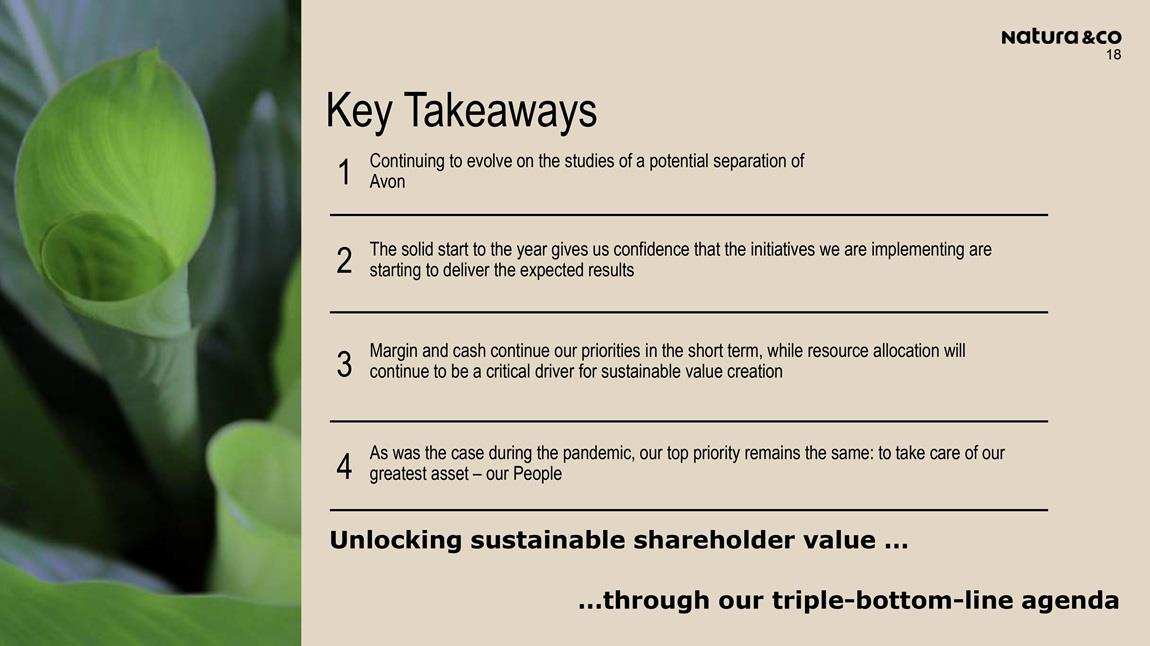
Thank You

Q1-24 by type 20 Q1-24 by currency Debt Profile Earnings Presentation | Q1-24 39% 61% BRL USD 61.1% 30.7% 8.1% 0.1% Bonds Debentures Comercial notes Other instruments
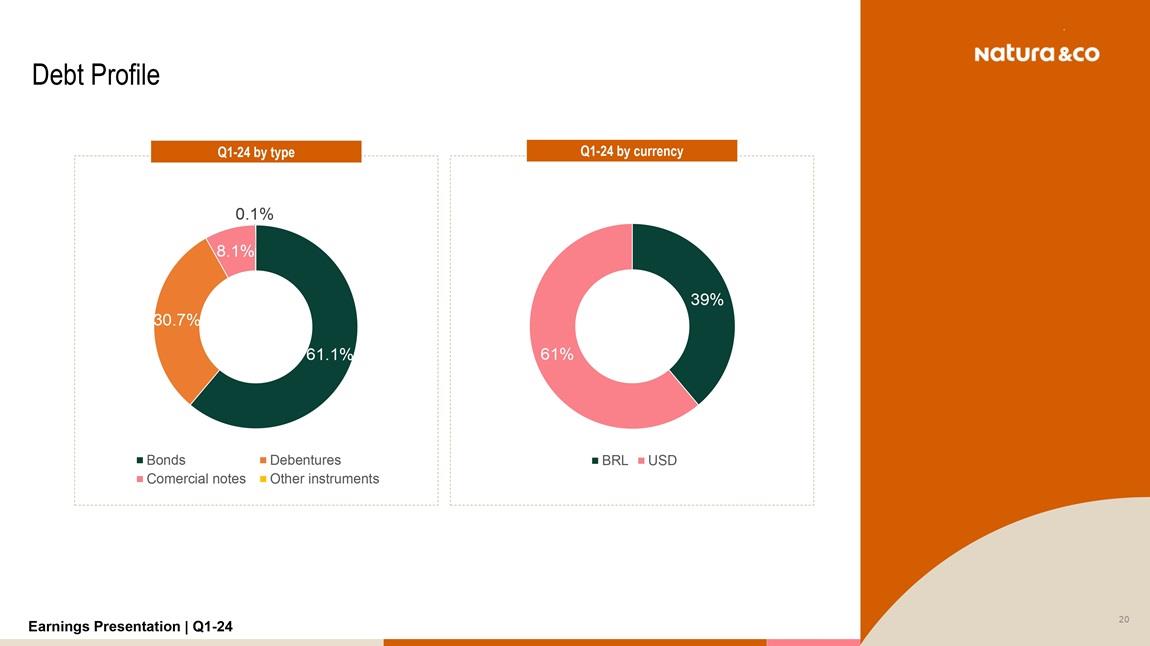
Net Revenue Breakdown by Channel (%) Share of Digital Sales per Brand (%) NATURA BRAND AVON BRAND Earnings Presentation | Q1-24 5% 4%1% 90% Digital Retail (own stores + Franchise) Wholesale Traditional Direct Selling 94% 92% 4% 5% 1% 1% 1% 1% Q1-23 Q1-24 Wholesale Retail (own stores + Franchise) 90% 89% 6% 4% 4% 6
