Wells Fargo Commercial Mortgage Trust 2019-C52
Filed: 30 Jul 19, 2:02pm
| FREE WRITING PROSPECTUS | ||
| FILED PURSUANT TO RULE 433 | ||
| REGISTRATION FILE NO.: 333-226486-08 | ||
 |  |
Free Writing Prospectus
Structural and Collateral Term Sheet
$900,240,222
(Approximate Initial Pool Balance)
$804,589,000
(Approximate Aggregate Certificate Balance of Offered Certificates)
Wells Fargo Commercial Mortgage Trust 2019-C52
as Issuing Entity
Wells Fargo Commercial Mortgage Securities, Inc.
as Depositor
Argentic Real Estate Finance LLC
Rialto Mortgage Finance, LLC
Barclays Capital Real Estate Inc.
Ladder Capital Finance LLC
BSPRT CMBS Finance, LLC
Wells Fargo Bank, National Association
as Sponsors and Mortgage Loan Sellers
Commercial Mortgage Pass-Through Certificates
Series 2019-C52
July 30, 2019
WELLS FARGO SECURITIES
Co-Lead Manager and Joint Bookrunner | BARCLAYS
Co-Lead Manager and Joint Bookrunner | |
Academy Securities Co-Manager | Drexel Hamilton Co-Manager |
STATEMENT REGARDING THIS FREE WRITING PROSPECTUS
The depositor has filed a registration statement (including a prospectus) with the Securities and Exchange Commission (‘‘SEC’’) (SEC File No. 333-226486) for the offering to which this communication relates. Before you invest, you should read the prospectus in the registration statement and other documents the depositor has filed with the SEC for more complete information about the depositor, the issuing entity and this offering. You may get these documents for free by visiting EDGAR on the SEC Web site at www.sec.gov. Alternatively, the depositor, any underwriter, or any dealer participating in the offering will arrange to send you the prospectus after filing if you request it by calling toll free 1-800-745-2063 (8 a.m. – 5 p.m. EST) or by emailing wfs.cmbs@wellsfargo.com.
Nothing in this document constitutes an offer of securities for sale in any jurisdiction where the offer or sale is not permitted. The information contained herein is preliminary as of the date hereof, supersedes any such information previously delivered to you and will be superseded by any such information subsequently delivered and ultimately by the final prospectus relating to the securities. These materials are subject to change, completion, supplement or amendment from time to time.
This free writing prospectus has been prepared by the underwriters for information purposes only and does not constitute, in whole or in part, a prospectus for the purposes of Directive 2003/71/EC (as amended) and/or Part VI of the Financial Services and Markets Act 2000, as amended, or other offering document.
STATEMENT REGARDING ASSUMPTIONS AS TO SECURITIES, PRICING ESTIMATES AND OTHER INFORMATION
The attached information contains certain tables and other statistical analyses (the “Computational Materials”) which have been prepared in reliance upon information furnished by the Mortgage Loan Sellers. Numerous assumptions were used in preparing the Computational Materials, which may or may not be reflected herein. As such, no assurance can be given as to the Computational Materials’ accuracy, appropriateness or completeness in any particular context; or as to whether the Computational Materials and/or the assumptions upon which they are based reflect present market conditions or future market performance. The Computational Materials should not be construed as either projections or predictions or as legal, tax, financial or accounting advice. You should consult your own counsel, accountant and other advisors as to the legal, tax, business, financial and related aspects of a purchase of these securities. Any weighted average lives, yields and principal payment periods shown in the Computational Materials are based on prepayment and/or loss assumptions, and changes in such prepayment and/or loss assumptions may dramatically affect such weighted average lives, yields and principal payment periods. In addition, it is possible that prepayments or losses on the underlying assets will occur at rates higher or lower than the rates shown in the attached Computational Materials. The specific characteristics of the securities may differ from those shown in the Computational Materials due to differences between the final underlying assets and the preliminary underlying assets used in preparing the Computational Materials. The principal amount and designation of any security described in the Computational Materials are subject to change prior to issuance. None of Wells Fargo Securities, LLC, Barclays Capital Inc., Academy Securities, Inc., Drexel Hamilton, LLC, or any of their respective affiliates, make any representation or warranty as to the actual rate or timing of payments or losses on any of the underlying assets or the payments or yield on the securities. The information in this presentation is based upon management forecasts and reflects prevailing conditions and management’s views as of this date, all of which are subject to change. In preparing this presentation, we have relied upon and assumed, without independent verification, the accuracy and completeness of all information available from public sources or which was provided to us by or on behalf of the Mortgage Loan Sellers or which was otherwise reviewed by us.
This free writing prospectus contains certain forward-looking statements. If and when included in this free writing prospectus, the words “expects”, “intends”, “anticipates”, “estimates” and analogous expressions and all statements that are not historical facts, including statements about our beliefs or expectations, are intended to identify forward-looking statements. Any forward-looking statements are made subject to risks and uncertainties which could cause actual results to differ materially from those stated. Those risks and uncertainties include, among other things, declines in general economic and business conditions, increased competition, changes in demographics, changes in political and social conditions, regulatory initiatives and changes in customer preferences, many of which are beyond our control and the control of any other person or entity related to this offering. The forward-looking statements made in this free writing prospectus are made as of the date stated on the cover. We have no obligation to update or revise any forward-looking statement.
Wells Fargo Securities is the trade name for the capital markets and investment banking services of Wells Fargo & Company and its subsidiaries, including but not limited to Wells Fargo Securities, LLC, a member of NYSE, FINRA, NFA and SIPC, Wells Fargo Prime Services, LLC, a member of FINRA, NFA and SIPC, and Wells Fargo Bank, N.A. Wells Fargo Securities, LLC and Wells Fargo Prime Services, LLC are distinct entities from affiliated banks and thrifts.
IMPORTANT NOTICE REGARDING THE OFFERED CERTIFICATES
The information herein is preliminary and may be supplemented or amended prior to the time of sale. In addition, the Offered Certificates referred to in these materials and the asset pool backing them are subject to modification or revision (including the possibility that one or more classes of certificates may be split, combined or eliminated at any time prior to issuance or availability of a final prospectus) and are offered on a “when, as and if issued” basis.
The underwriters described in these materials may from time to time perform investment banking services for, or solicit investment banking business from, any company named in these materials. The underwriters and/or their affiliates or respective employees may from time to time have a long or short position in any security or contract discussed in these materials.
The information contained herein supersedes any previous such information delivered to any prospective investor and will be superseded by information delivered to such prospective investor prior to the time of sale.
IMPORTANT NOTICE RELATING TO AUTOMATICALLY-GENERATED EMAIL DISCLAIMERS
Any legends, disclaimers or other notices that may appear at the bottom of any email communication to which this free writing prospectus is attached relating to (1) these materials not constituting an offer (or a solicitation of an offer), (2) any representation that these materials are accurate or complete and may not be updated or (3) these materials possibly being confidential, are not applicable to these materials and should be disregarded. Such legends, disclaimers or other notices have been automatically generated as a result of these materials having been sent via Bloomberg or another system.
THE INFORMATION IN THIS STRUCTURAL AND COLLATERAL TERM SHEET IS NOT COMPLETE AND MAY BE AMENDED PRIOR TO THE TIME OF SALE. THIS TERM SHEET IS NOT AN OFFER TO SELL THESE SECURITIES AND IT IS NOT A SOLICITATION OF AN OFFER TO BUY THESE SECURITIES IN ANY JURISDICTION WHERE THE OFFER OR SALE IS NOT PERMITTED.
2
| Wells Fargo Commercial Mortgage Trust 2019-C52 | Certificate Structure |
I. Certificate Structure
| Class | Expected Ratings (Fitch/KBRA/Moody’s)(1) | Approximate Initial | Approx. Initial Credit Support(3) | Pass-Through Rate Description | Weighted Average Life (Years)(4) | Expected Principal Window(4) | Certificate Principal to Value Ratio(5) | Certificate Principal U/W NOI Debt Yield(6) | ||
| Offered Certificates | ||||||||||
| A-1 | AAAsf/AAA(sf)/Aaa(sf) | $26,626,000 | 30.000% | (7) | 2.67 | 09/19 – 05/24 | 43.1% | 16.4% | ||
| A-2 | AAAsf/AAA(sf)/Aaa(sf) | $43,907,000 | 30.000% | (7) | 4.85 | 05/24 – 07/24 | 43.1% | 16.4% | ||
| A-3 | AAAsf/AAA(sf)/Aaa(sf) | $28,568,000 | 30.000% | (7) | 6.94 | 06/26 – 08/26 | 43.1% | 16.4% | ||
| A-SB | AAAsf/AAA(sf)/Aaa(sf) | $47,444,000 | 30.000% | (7) | 7.39 | 07/24 – 05/29 | 43.1% | 16.4% | ||
| A-4 | AAAsf/AAA(sf)/Aaa(sf) | (8) | 30.000% | (7) | (8) | (8) | 43.1% | 16.4% | ||
| A-5 | AAAsf/AAA(sf)/Aaa(sf) | (8) | 30.000% | (7) | (8) | (8) | 43.1% | 16.4% | ||
| X-A | AAAsf/AAA(sf)/Aaa(sf) | $630,168,000(9) | N/A | Variable(10) | N/A | N/A | N/A | N/A | ||
| X-B | A-sf/AAA(sf)/NR | $174,421,000(11)(12) | N/A | Variable(13) | N/A | N/A | N/A | N/A | ||
| A-S | AAAsf/AAA(sf)/Aa3(sf) | $93,400,000 | 19.625% | (7) | 9.99 | 08/29 – 08/29 | 49.5% | 14.3% | ||
| B | AA-sf/AA-(sf)/NR | $45,012,000 | 14.625% | (7) | 9.99 | 08/29 – 08/29 | 52.6% | 13.5% | ||
| C | A-sf/A-(sf)/NR | $36,009,000(12) | 10.625% | (7) | 9.99 | 08/29 – 08/29 | 55.0% | 12.9% | ||
| Risk Retention Certificates | ||||||||||
| D-RR | BBBsf/BBB(sf)/NR | $23,632,000(12) | 8.000% | (7) | 9.99 | 08/29 – 08/29 | 56.6% | 12.5% | ||
| E-RR | BBB-sf/BBB-(sf)/NR | $16,879,000 | 6.125% | (7) | 9.99 | 08/29 – 08/29 | 57.8% | 12.3% | ||
| F-RR | BB-sf/BB-(sf)/NR | $15,754,000 | 4.375% | (7) | 9.99 | 08/29 – 08/29 | 58.9% | 12.0% | ||
| G-RR | B-sf/B-(sf)/NR | $9,003,000 | 3.375% | (7) | 9.99 | 08/29 – 08/29 | 59.5% | 11.9% | ||
| H-RR | NR/NR/NR | $30,383,221 | 0.000% | (7) | 9.99 | 08/29 – 08/29 | 61.6% | 11.5% | ||
| Notes: | |
| (1) | The expected ratings presented are those of Fitch Ratings, Inc. (“Fitch”), Kroll Bond Rating Agency, Inc. (“KBRA”) and Moody’s Investors Service, Inc. (“Moody’s”), which the depositor hired to rate the Offered Certificates. One or more other nationally recognized statistical rating organizations that were not hired by the depositor may use information they receive pursuant to Rule 17g-5 under the Securities Exchange Act of 1934, as amended (the “Exchange Act”) or otherwise, to rate or provide market reports and/or published commentary related to the Offered Certificates. We cannot assure you as to what ratings a non-hired nationally recognized statistical rating organization would assign or that its reports will not express differing, possibly negative, views of the mortgage loans and/or the Offered Certificates. The ratings of each Class of Offered Certificates address the likelihood of the timely distribution of interest and, except in the case of the Class X-A and X-B Certificates, the ultimate distribution of principal due on those Classes on or before the Rated Final Distribution Date. See “Risk Factors—Other Risks Relating to the Certificates—Nationally Recognized Statistical Rating Organizations May Assign Different Ratings to the Certificates; Ratings of the Certificates Reflect Only the Views of the Applicable Rating Agencies as of the Dates Such Ratings Were Issued; Ratings May Affect ERISA Eligibility; Ratings May Be Downgraded” and “Ratings” in the Preliminary Prospectus, expected to be dated July 20, 2019 (the “Preliminary Prospectus”). Fitch, KBRA and Moody’s have informed us that the “sf” designation in their ratings represents an identifier for structured finance product ratings. |
| (2) | The Certificate Balances and Notional Amounts set forth in the table are approximate. The actual initial Certificate Balances and Notional Amounts may be larger or smaller depending on the initial pool balance of the mortgage loans definitively included in the pool of mortgage loans, which aggregate cut-off date balance may be as much as 5% larger or smaller than the amount presented in the Preliminary Prospectus. In addition, the Notional Amounts of the Class X-A and X-B Certificates may vary depending upon the final pricing of the Classes of Principal Balance Certificates (as defined in the Preliminary Prospectus) whose Certificate Balances comprise such Notional Amounts, and, if, as a result of such pricing, the pass-through rate of the Class X-A or X-B Certificates, as applicable, would be equal to zero at all times, such Class of Certificates may not be issued on the closing date of this securitization. |
| (3) | The approximate initial credit support with respect to the Class A-1, A-2, A-3, A-SB, A-4 and A-5 Certificates represents the approximate credit enhancement for the Class A-1, A-2, A-3, A-SB, A-4 and A-5 Certificates in the aggregate. |
| (4) | Weighted Average Lives and Expected Principal Windows are calculated based on an assumed prepayment rate of 0% CPR and the “Structuring Assumptions” described under “Yield and Maturity Considerations—Weighted Average Life” in the Preliminary Prospectus. |
| (5) | The Certificate Principal to Value Ratio for each Class of Certificates (other than the Class A-1, A-2, A-3, A-SB, A-4 and A-5 Certificates) is calculated as the product of (a) the weighted average Cut-off Date LTV Ratio for the mortgage loans and (b) a fraction, the numerator of which is the total initial Certificate Balance of such Class of Certificates and all Classes of Principal Balance Certificates senior to such Class of Certificates and the denominator of which is the total initial Certificate Balance of all of the Principal Balance Certificates. The Certificate Principal to Value Ratio for each of the Class A-1, A-2, A-3, A-SB, A-4 and A-5 Certificates is calculated in the aggregate for those Classes as if they were a single Class and is calculated as the product of (a) the weighted average Cut-off Date LTV Ratio for the mortgage loans and (b) a fraction, the numerator of which is the total initial aggregate Certificate Balances of such Classes of Certificates and the denominator of which is the total initial Certificate Balance of all of the Principal Balance Certificates. In any event, however, excess mortgaged property value associated with a mortgage loan will not be available to offset losses on any other mortgage loan. |
| (6) | The Certificate Principal U/W NOI Debt Yield for each Class of Certificates (other than the Class A-1, A-2, A-3, A-SB, A-4 and A-5 Certificates) is calculated as the product of (a) the weighted average U/W NOI Debt Yield for the mortgage loans and (b) a fraction, the numerator of which is the total initial Certificate Balance of all of the Classes of Principal Balance Certificates and the denominator of which is the total initial Certificate Balance for such Class of Certificates and all Classes of Principal Balance Certificates senior to such Class of Certificates. The Certificate Principal U/W NOI Debt Yield for each of the Class A-1, A-2, A-3, A-SB, A-4 and A-5 Certificates is calculated in the aggregate for those Classes as if they were a single Class and is calculated as the product of (a) the weighted average U/W NOI Debt Yield for the mortgage loans and (b) a fraction, the numerator of which is the total initial Certificate Balance of all of the Classes of Principal Balance Certificates and the denominator of which is the total aggregate initial Certificate Balances for the Class A-1, A-2, A-3, A-SB, A-4 and A-5 Certificates. In any event, however, cash flow from each mortgaged property supports only the related mortgage loan and will not be available to support any other mortgage loan. |
| (7) | The pass-through rates for the Class A-1, A-2, A-3, A-SB, A-4, A-5, A-S, B, C, D-RR, E-RR, F-RR, G-RR and H-RR Certificates in each case will be one of the following: (i) a fixed rateper annum, (ii) a variable rate per annum equal to the weighted average of the net mortgage interest rates on the mortgage loans for the related distribution date, (iii) a variable rateper annumequal to the lesser of (a) a fixed rate and (b) the weighted average of the net mortgage interest rates on the mortgage loans for the related distribution date or (iv) a variable rateper annum equal to the weighted average of the net mortgage interest rates on the mortgage loans for the related distribution date minus a specified percentage. For purposes of the calculation of the weighted average of the net mortgage interest rates on the mortgage loans for each distribution date, the mortgage interest rates will be adjusted as necessary to a 30/360 basis. |
THE INFORMATION IN THIS STRUCTURAL AND COLLATERAL TERM SHEET IS NOT COMPLETE AND MAY BE AMENDED PRIOR TO THE TIME OF SALE. THIS TERM SHEET IS NOT AN OFFER TO SELL THESE SECURITIES AND IT IS NOT A SOLICITATION OF AN OFFER TO BUY THESE SECURITIES IN ANY JURISDICTION WHERE THE OFFER OR SALE IS NOT PERMITTED.
3
| Wells Fargo Commercial Mortgage Trust 2019-C52 | Certificate Structure |
| (8) | The exact initial certificate balances of the Class A-4 and A-5 Certificates are unknown and will be determined based on the final pricing of those Classes of certificates. However, the respective initial certificate balances, weighted average lives and principal windows of the Class A-4 and A-5 Certificates are expected to be within the applicable ranges reflected in the following chart. The aggregate initial certificate balance of the Class A-4 and A-5 Certificates is expected to be approximately $483,623,000, subject to a variance of plus or minus 5%. |
Class of Certificates | Expected Range of Approximate Initial | Expected Range of Weighted Average Life (Years) | Expected Range of Principal Window |
| Class A-4 | $100,000,000 - $240,000,000 | 9.76 – 9.81 | 05/29 – 06/29 / 05/29 – 07/29 |
| Class A-5 | $243,623,000 - $383,623,000 | 9.89 – 9.92 | 06/29 – 08/29 / 07/29 – 08/29 |
| (9) | The Class X-A Certificates are notional amount certificates. The Notional Amount of the Class X-A Certificates will be equal to the aggregate Certificate Balance of the Class A-1, A-2, A-3, A-SB, A-4 and A-5 Certificates outstanding from time to time. The Class X-A Certificates will not be entitled to distributions of principal. |
| (10) | The pass-through rate for the Class X-A Certificates for any distribution date will be aper annum rate equal to the excess, if any, of (a) the weighted average of the net mortgage interest rates on the mortgage loans for the related distribution date, over (b) the weighted average of the pass-through rates on the Class A-1, A-2, A-3, A-SB, A-4 and A-5 Certificates for the related distribution date, weighted on the basis of their respective Certificate Balances outstanding immediately prior to that distribution date. For purposes of the calculation of the weighted average of the net mortgage interest rates on the mortgage loans for each distribution date, the mortgage interest rates will be adjusted as necessary to a 30/360 basis. |
| (11) | The Class X-B Certificates are notional amount certificates. The Notional Amount of the Class X-B Certificates will be equal to the aggregate Certificate Balance of the Class A-S, B and C Certificates outstanding from time to time. The Class X-B Certificates will not be entitled to distributions of principal. |
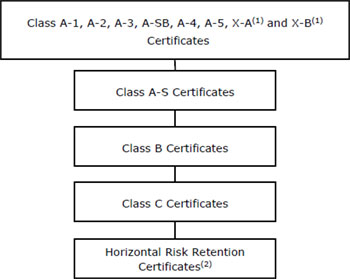
| (12) | The initial Notional Amount of the X-B Certificates and the initial Certificate Balance of each of the Class C and D-RR Certificates are subject to change based on final pricing of all Certificates and the final determination of the Class D-RR. Class E-RR, F-RR, G-RR and H-RR Certificates (collectively, the “horizontal risk retention certificates”) that will be retained by the retaining sponsor through a majority-owned affiliate as part of the U.S. risk retention requirements. For more information regarding the methodology and key inputs and assumptions used to determine the sizing of the horizontal risk retention certificates, see “Credit Risk Retention” in the Preliminary Prospectus. |
| (13) | The pass-through rate for the Class X-B Certificates for any distribution date will be aper annum rate equal to the excess, if any, of (a) the weighted average of the net mortgage interest rates on the mortgage loans for the related distribution date, over (b) the weighted average of the pass-through rates on the Class A-S, B and C Certificates for the related distribution date, weighted on the basis of their respective Certificate Balances outstanding immediately prior to that distribution date. For purposes of the calculation of the weighted average of the net mortgage interest rates on the mortgage loans for each distribution date, the mortgage interest rates will be adjusted as necessary to a 30/360 basis. |
THE INFORMATION IN THIS STRUCTURAL AND COLLATERAL TERM SHEET IS NOT COMPLETE AND MAY BE AMENDED PRIOR TO THE TIME OF SALE. THIS TERM SHEET IS NOT AN OFFER TO SELL THESE SECURITIES AND IT IS NOT A SOLICITATION OF AN OFFER TO BUY THESE SECURITIES IN ANY JURISDICTION WHERE THE OFFER OR SALE IS NOT PERMITTED.
4
| Wells Fargo Commercial Mortgage Trust 2019-C52 | Transaction Highlights |
II. Transaction Highlights
Mortgage Loan Sellers:
Mortgage Loan Seller | Number of | Number of | Aggregate Cut-off Date Balance | % of Initial Pool | ||||||||
| Argentic Real Estate Finance LLC | 10 | 24 | $196,152,533 | 21.8 | % | |||||||
| Rialto Mortgage Finance, LLC | 12 | 13 | 156,301,747 | 17.4 | ||||||||
| Barclays Capital Real Estate Inc. | 7 | 38 | 149,435,533 | 16.6 | ||||||||
| Ladder Capital Finance LLC | 16 | 20 | 140,673,066 | 15.6 | ||||||||
| BSPRT CMBS Finance, LLC | 9 | 14 | 131,071,354 | 14.6 | ||||||||
| Wells Fargo Bank, National Association | 13 | 17 | 126,605,989 | 14.1 | ||||||||
Total | 67 | 126 | $900,240,222 | 100.0 | % | |||||||
Loan Pool:
| Initial Pool Balance: | $900,240,222 |
| Number of Mortgage Loans: | 67 |
| Average Cut-off Date Balance per Mortgage Loan: | $13,436,421 |
| Number of Mortgaged Properties: | 126 |
| Average Cut-off Date Balance per Mortgaged Property(1): | $7,144,764 |
| Weighted Average Mortgage Interest Rate: | 4.399% |
| Ten Largest Mortgage Loans as % of Initial Pool Balance: | 39.2% |
| Weighted Average Original Term to Maturity or ARD (months): | 116 |
| Weighted Average Remaining Term to Maturity or ARD (months): | 115 |
| Weighted Average Original Amortization Term (months)(2): | 357 |
| Weighted Average Remaining Amortization Term (months)(2): | 357 |
| Weighted Average Seasoning (months): | 1 |
| (1) | Information regarding mortgage loans secured by multiple properties is based on an allocation according to relative appraised values or the allocated loan amounts or property-specific release prices set forth in the related loan documents or such other allocation as the related mortgage loan seller deemed appropriate. |
| (2) | Excludes any mortgage loan that does not amortize. |
Credit Statistics:
| Weighted Average U/W Net Cash Flow DSCR(1): | 2.14x |
| Weighted Average U/W Net Operating Income Debt Yield(1): | 11.5% |
| Weighted Average Cut-off Date Loan-to-Value Ratio(1): | 61.6% |
| Weighted Average Balloon or ARD Loan-to-Value Ratio(1): | 55.8% |
| % of Mortgage Loans with Additional Subordinate Debt(2): | 9.4% |
| % of Mortgage Loans with Single Tenants(3): | 15.9% |
| (1) | With respect to any mortgage loan that is part of a whole loan, loan-to-value ratio, debt service coverage ratio and debt yield calculations include the relatedpari passucompanion loan(s) but exclude any related subordinate companion loans (unless otherwise stated). The debt service coverage ratio, debt yield and loan-to-value ratio information do not take into account any subordinate debt (whether or not secured by the related mortgaged property), that currently exists or is allowed under the terms of any mortgage loan. See “Description of the Mortgage Pool—Mortgage Pool Characteristics” in the Preliminary Prospectus and Annex A-1 to the Preliminary Prospectus. |
| (2) | The percentage figure expressed as “% of Mortgage Loans with Additional Subordinate Debt” is determined as a percentage of the initial pool balance and does not take into account any future subordinate debt (whether or not secured by the mortgaged property), if any, that may be permitted under the terms of any mortgage loan or the pooling and servicing agreement. See “Description of the Mortgage Pool—Additional Indebtedness—Other Unsecured Indebtedness” in the Preliminary Prospectus. |
| (3) | Excludes mortgage loans that are secured by multiple single tenant properties. |
THE INFORMATION IN THIS STRUCTURAL AND COLLATERAL TERM SHEET IS NOT COMPLETE AND MAY BE AMENDED PRIOR TO THE TIME OF SALE. THIS TERM SHEET IS NOT AN OFFER TO SELL THESE SECURITIES AND IT IS NOT A SOLICITATION OF AN OFFER TO BUY THESE SECURITIES IN ANY JURISDICTION WHERE THE OFFER OR SALE IS NOT PERMITTED.
5
| Wells Fargo Commercial Mortgage Trust 2019-C52 | Transaction Highlights |
Loan Structural Features:
Amortization:Based on the Initial Pool Balance, 58.4% of the mortgage pool (41 mortgage loans) has scheduled amortization, as follows:
30.2% (17 mortgage loans) provides for an interest-only period followed by an amortization period; and
28.2% (24 mortgage loans) requires amortization during the entire loan term.
Interest-Only:Based on the Initial Pool Balance, 41.6% of the mortgage pool (26 mortgage loans) provides for interest-only payments during the entire loan term through maturity or ARD. The Weighted Average Cut-off Date Loan-to-Value Ratio and Weighted Average U/W Net Cash Flow DSCR for those mortgage loans are 56.8% and 2.72x, respectively.
Hard Lockboxes: Based on the Initial Pool Balance, 43.4% of the mortgage pool (20 mortgage loans) have hard lockboxes in place.
Reserves: The mortgage loans require amounts to be escrowed monthly as follows (excluding any mortgage loans with springing provisions):
| Real Estate Taxes: | 78.6% of the pool |
| Insurance: | 53.3% of the pool |
| Capital Replacements: | 75.1% of the pool |
| TI/LC: | 51.7% of the pool(1) |
| (1) The percentage of Initial Pool Balance for mortgage loans with TI/LC reserves is based on the aggregate principal balance allocable to loans that include retail, office, mixed use and industrial properties. | |
Call Protection/Defeasance: Based on the Initial Pool Balance, the mortgage pool has the following call protection and defeasance features:
70.5% of the mortgage pool (52 mortgage loans) features a lockout period, then defeasance only until an open period;
19.1% of the mortgage pool (8 mortgage loans) features a lockout period, then the greater of a prepayment premium (1%) or yield maintenance until an open period;
5.5% of the mortgage pool (1 mortgage loan) features a lockout period, then the greater of a prepayment premium (1%) or yield maintenance, then the greater of a prepayment premium (1%) or yield maintenance or defeasance until an open period;
4.0% of the mortgage pool (3 mortgage loans) features a lockout period, then the greater of a prepayment premium (1%) or yield maintenance or defeasance until an open period; and
0.9% of the mortgage pool (3 mortgage loans) features yield maintenance, then yield maintenance or defeasance until an open period.
Prepayment restrictions for each mortgage loan reflect the entire life of the mortgage loan. Please refer to Annex A-1 to the Preliminary Prospectus and the footnotes related thereto for further information regarding individual loan call protection.
THE INFORMATION IN THIS STRUCTURAL AND COLLATERAL TERM SHEET IS NOT COMPLETE AND MAY BE AMENDED PRIOR TO THE TIME OF SALE. THIS TERM SHEET IS NOT AN OFFER TO SELL THESE SECURITIES AND IT IS NOT A SOLICITATION OF AN OFFER TO BUY THESE SECURITIES IN ANY JURISDICTION WHERE THE OFFER OR SALE IS NOT PERMITTED.
6
| Wells Fargo Commercial Mortgage Trust 2019-C52 | Issue Characteristics |
III. Issue Characteristics
| Securities Offered: | $804,589,000 approximate monthly pay, multi-class, commercial mortgage REMIC pass-through certificates consisting of eleven classes (Classes A-1, A-2, A-3, A-SB, A-4, A-5, A-S, B, C, X-A and X-B), which are offered pursuant to a registration statement filed with the SEC (such classes of certificates, the “Offered Certificates”). |
| Mortgage Loan Sellers: | Argentic Real Estate Finance LLC (“AREF”), Rialto Mortgage Finance, LLC (“RMF”), Barclays Capital Real Estate Inc. (“Barclays”), Ladder Capital Finance LLC (“LCF”), BSPRT CMBS Finance, LLC (“BSPRT”) and Wells Fargo Bank, National Association (“WFB”). |
| Joint Bookrunners and Co-Lead Managers: | Wells Fargo Securities, LLC and Barclays Capital Inc. |
| Co-Manager: | Academy Securities, Inc. and Drexel Hamilton, LLC |
| Rating Agencies: | Fitch Ratings, Inc., Kroll Bond Rating Agency, Inc. and Moody’s Investors Service, Inc. |
| Master Servicer: | Wells Fargo Bank, National Association |
| Special Servicer: | LNR Partners, LLC |
| Certificate Administrator: | Wells Fargo Bank, National Association |
| Trustee: | Wilmington Trust, National Association |
| Operating Advisor: | Pentalpha Surveillance LLC |
| Asset Representations Reviewer: | Pentalpha Surveillance LLC |
| Initial Majority Controlling Class Certificateholder: | Argentic Securities Holdings Cayman Limited or an affiliate |
| U.S. Credit Risk Retention: | For a discussion on the manner in which the U.S. credit risk retention requirements will be satisfied by Argentic Real Estate Finance LLC, as the retaining sponsor, see “Credit Risk Retention” in the Preliminary Prospectus.
A majority-owned affiliate of Argentic Real Estate Finance LLC, as retaining sponsor, will acquire an “eligible horizontal residual interest” comprised of the Class D-RR, E-RR, F-RR, G-RR and H-RR certificates (the “horizontal risk retention certificates”). Under the credit risk retention rules, AREF or such majority-owned affiliate will be permitted to transfer the horizontal risk retention certificates to a subsequent third-party purchaser. For additional information, see “Credit Risk Retention” in the Preliminary Prospectus.
|
| EU Credit Risk Retention | None of the sponsors, the depositor or any other party to the transaction intends or is required to retain a material net economic interest in the securitization constituted by the issue of the certificates in a manner that would satisfy the requirements of the European Union Regulation (EU) 2017/2402. In addition, no such person undertakes to take any other action which may be required by any investor for the purposes of its compliance with any applicable requirement under such Regulation. Furthermore, the arrangements described under “Credit Risk Retention” in the Preliminary Prospectus have not been structured with the objective of ensuring compliance by any person with any requirements of such Regulation. |
| Cut-off Date: | The Cut-off Date with respect to each mortgage loan is the due date for the monthly debt service payment that is due in August 2019 (or, in the case of any mortgage loan that has its first due date in September 2019, the date that would have been its due date in August 2019 under the terms of that mortgage loan if a monthly debt service payment were scheduled to be due in that month). |
| Expected Closing Date: | On or about August 20, 2019. |
| Determination Dates: | The 11th day of each month (or if that day is not a business day, the next succeeding business day), commencing in September 2019. |
| Distribution Dates: | The fourth business day following the Determination Date in each month, commencing in September 2019. |
| Rated Final Distribution Date: | The Distribution Date in August 2052. |
| Interest Accrual Period: | With respect to any Distribution Date, the calendar month immediately preceding the month in which such Distribution Date occurs. |
| Day Count: | The Offered Certificates will accrue interest on a 30/360 basis. |
THE INFORMATION IN THIS STRUCTURAL AND COLLATERAL TERM SHEET IS NOT COMPLETE AND MAY BE AMENDED PRIOR TO THE TIME OF SALE. THIS TERM SHEET IS NOT AN OFFER TO SELL THESE SECURITIES AND IT IS NOT A SOLICITATION OF AN OFFER TO BUY THESE SECURITIES IN ANY JURISDICTION WHERE THE OFFER OR SALE IS NOT PERMITTED.
7
| Wells Fargo Commercial Mortgage Trust 2019-C52 | Issue Characteristics |
| Minimum Denominations: | $10,000 for each Class of Offered Certificates (other than the Class X-A and X-B Certificates) and $1,000,000 for the Class X-A and X-B Certificates. Investments may also be made in any whole dollar denomination in excess of the applicable minimum denomination. |
| Clean-up Call: | 1.0% |
| Delivery: | DTC, Euroclear and Clearstream Banking |
| ERISA/SMMEA Status: | Each Class of Offered Certificates is expected to be eligible for exemptive relief under ERISA. No Class of Offered Certificates will be SMMEA eligible. |
| Risk Factors: | THE CERTIFICATES INVOLVE CERTAIN RISKS AND MAY NOT BE SUITABLE FOR ALL INVESTORS. SEE THE “RISK FACTORS” SECTION OF THE PRELIMINARY PROSPECTUS. |
| Bond Analytics Information: | The Certificate Administrator will be authorized to make distribution date statements, CREFC® reports and certain supplemental reports (other than confidential information) available to certain financial modeling and data provision services, including Bloomberg, L.P., Trepp, LLC, Intex Solutions, Inc., Interactive Data Corp., Markit Group Limited, BlackRock Financial Management, Inc., CMBS.com, Inc., Moody’s Analytics, MBS Data, LLC and Thomson Reuters Corporation and RealINSIGHT. |
| Tax Treatment | For U.S. federal income tax purposes, the issuing entity will consist of one or more REMICs and the Offered Certificates will represent REMIC regular interests. |
THE INFORMATION IN THIS STRUCTURAL AND COLLATERAL TERM SHEET IS NOT COMPLETE AND MAY BE AMENDED PRIOR TO THE TIME OF SALE. THIS TERM SHEET IS NOT AN OFFER TO SELL THESE SECURITIES AND IT IS NOT A SOLICITATION OF AN OFFER TO BUY THESE SECURITIES IN ANY JURISDICTION WHERE THE OFFER OR SALE IS NOT PERMITTED.
8
| Wells Fargo Commercial Mortgage Trust 2019-C52 | Characteristics of the Mortgage Pool |
IV. Characteristics of the Mortgage Pool(1)
A. Ten Largest Mortgage Loans
| Mortgage Loan Seller | Mortgage Loan Name | City | State | Number of Mortgage Loans / Mortgaged Properties | Mortgage Loan Cut-off Date Balance ($) | % of Initial Pool Balance (%) | Property Type | Number of Rooms/SF/Units | Cut-off Date Balance Per Room/SF/Unit | Cut-off Date LTV Ratio (%) | Balloon or ARD LTV Ratio (%) | U/W NCF DSCR (x) | U/W NOI Debt Yield (%) | |||||||||||||||||||
| Barclays | Moffett Towers II - Buildings 3 & 4 | Sunnyvale | CA | 1 / 1 | $49,750,000 | 5.5 | % | Office | 701,266 | $499 | 44.3 | % | 44.3 | % | 3.45 | x | 13.2 | % | ||||||||||||||
| RMF | University Town Center | Norman | OK | 1 / 1 | 41,580,000 | 4.6 | Retail | 348,877 | 119 | 63.0 | 63.0 | 2.86 | 12.4 | |||||||||||||||||||
| AREF | SoCal Retail Portfolio | Various | CA | 1 / 14 | 40,000,000 | 4.4 | Various | 1,481,231 | 145 | 52.0 | 52.0 | 2.28 | 9.9 | |||||||||||||||||||
| AREF | Embassy Suites at Centennial Olympic Park | Atlanta | GA | 1 / 1 | 38,455,033 | 4.3 | Hospitality | 321 | 259,821 | 68.4 | 55.5 | 1.72 | 11.7 | |||||||||||||||||||
| Barclays | Capital Plaza | Jacksonville | FL | 1 / 1 | 36,190,000 | 4.0 | Office | 417,513 | 87 | 64.6 | 59.1 | 1.86 | 12.0 | |||||||||||||||||||
| Barclays | Inland Life Storage Portfolio | Various | Various | 1 / 32 | 31,297,500 | 3.5 | Self Storage | 17,278 | 8,051 | 61.8 | 53.2 | 1.68 | 9.5 | |||||||||||||||||||
| WFB | Olympia Medical Office | Los Angeles | CA | 1 / 1 | 30,000,000 | 3.3 | Office | 90,549 | 331 | 59.2 | 59.2 | 2.07 | 10.7 | |||||||||||||||||||
| RMF | Sugar Creek Center | Sugar Land | TX | 1 / 1 | 28,929,851 | 3.2 | Office | 193,996 | 149 | 70.4 | 57.4 | 1.57 | 11.0 | |||||||||||||||||||
| AREF | 3300 Renner | Richardson | TX | 1 / 1 | 28,560,000 | 3.2 | Office | 185,078 | 154 | 63.4 | 63.4 | 2.59 | 11.1 | |||||||||||||||||||
| AREF | Mahwah Business Park | Mahwah | NJ | 1 / 1 | 28,500,000 | 3.2 | Industrial | 380,346 | 75 | 66.4 | 56.1 | 1.41 | 8.8 | |||||||||||||||||||
| Top Three Total/Weighted Average | 3 / 16 | $131,330,000 | 14.6 | % | 52.6 | % | 52.6 | % | 2.91 | x | 11.9 | % | ||||||||||||||||||||
| Top Five Total/Weighted Average | 5 / 18 | $205,975,033 | 22.9 | % | 57.6 | % | 54.3 | % | 2.50 | x | 11.9 | % | ||||||||||||||||||||
| Top Ten Total/Weighted Average | 10 / 54 | $353,262,384 | 39.2 | % | 60.4 | % | 55.7 | % | 2.23 | x | 11.2 | % | ||||||||||||||||||||
| Non-Top Ten Total/Weighted Average | 57 / 72 | $546,977,837 | 60.8 | % | 62.3 | % | 55.9 | % | 2.08 | x | 11.7 | % | ||||||||||||||||||||
| (1) | With respect to any mortgage loan that is part of a whole loan, the Cut-off Date Balance Per Room/SF/Unit, loan-to-value ratio, debt service coverage ratio and debt yield calculations include the relatedpari passu companion loan(s) but exclude any related subordinate companion loans (unless otherwise stated). With respect to each mortgage loan, debt service coverage ratio, debt yield and loan-to-value ratio information do not take into account any subordinate debt (whether or not secured by the related mortgaged property) that currently exists or is allowed under the terms of such mortgage loan. |
THE INFORMATION IN THIS STRUCTURAL AND COLLATERAL TERM SHEET IS NOT COMPLETE AND MAY BE AMENDED PRIOR TO THE TIME OF SALE. THIS TERM SHEET IS NOT AN OFFER TO SELL THESE SECURITIES AND IT IS NOT A SOLICITATION OF AN OFFER TO BUY THESE SECURITIES IN ANY JURISDICTION WHERE THE OFFER OR SALE IS NOT PERMITTED.
9
| Wells Fargo Commercial Mortgage Trust 2019-C52 | Characteristics of the Mortgage Pool |
B. Summary of the Whole Loans
| Property Name | Mortgage Loan Seller in WFCM 2019-C52 | Note(s)(1) | Original Balance | Holder of Note(1) | Lead Servicer for Whole Loan | Master Servicer Under Lead Securitization Servicing Agreement | Special Servicer Under Lead Securitization Servicing Agreement | |
| Moffett Towers II - Buildings 3 & 4 | Barclays | A-1-A, A-2-A, A-3-A | $5,000,000 | MFTII 2019-B3B4 | No | KeyBank National Association | Situs Holdings, LLC | |
| A-1-B(2) | $65,000,000 | Barclays | (2) | |||||
| A-1-C | $50,000,000 | BANK 2019-BNK19 | No | |||||
| A-1-D | $49,750,000 | WFCM 2019-C52 | No | |||||
| A-1-E | $25,000,000 | Barclays | No | |||||
| A-2-B | $50,000,000 | Deutsche Bank AG, New York Branch | No | |||||
| A-3-B | $50,000,000 | Goldman Sachs Bank USA | ||||||
| A-2-C, A-3-C | $55,250,000 | CGCMT 2019-GC41(3) | No | |||||
| B-1, B-2, B-3(2) | $155,000,000 | MFTII 2019-B3B4 | Yes | |||||
| SoCal Retail Portfolio | AREF | A-1 | $40,000,000 | MSC 2019-H7 | Yes | Midland Loan Services | LNR Partners, LLC | |
| A-2, A-7, A-8 | $64,785,000 | MSC 2019-H6 | No | |||||
| A-3 | $40,000,000 | WFCM 2019-C52 | No | |||||
| A-4, A-6 | $50,000,000 | AREF | No | |||||
| A-5 | $20,000,000 | MSC 2019-H7 | No | |||||
| Embassy Suites at Centennial Olympic Park | AREF | A-1 | $30,000,000 | MSC 2019-H7 | Yes | Midland Loan Services | LNR Partners, LLC | |
| A-2, A-4, A-5, A-6 | $38,500,000 | WFCM 2019-C52 | No | |||||
| A-3 | $15,000,000 | MSC 2019-H7 | No | |||||
| Inland Life Storage Portfolio | Barclays | A-1-A | $39,505,000 | KeyBank National Association | Yes | Wells Fargo Bank, National Association(4) | LNR Partners, LLC(4) | |
| A-1-B, A-1-C | $37,000,000 | KeyBank National Association | No | |||||
| A-2-A | $31,297,500 | Barclays | No | |||||
| A-2-B | $31,297,500 | WFCM 2019-C52 | No | |||||
| Renaissance Center VI | BSPRT | A-1 | $22,500,000 | WFCM 2019-C52 | Yes | Wells Fargo Bank, National Association | LNR Partners, LLC | |
| A-2 | $12,500,000 | RREF III-D Repo Sub, LLC | No | |||||
| 188 Spear Street | Barclays | A-1 | $47,000,000 | WFCM 2019-C51 | No | Wells Fargo Bank, National Association(5) | C-III Asset Management LLC(5) | |
| A-2 | $60,000,000 | Barclays | Yes | |||||
| A-3 | $18,000,000 | WFCM 2019-C52 | No | |||||
| El Con Center | RMF | A-1 | $45,000,000 | WFCM 2019-C51 | Yes | Wells Fargo Bank, National Association | C-III Asset Management LLC | |
| A-2 | $18,000,000 | WFCM 2019-C52 | No | |||||
| Mount Kemble | BSPRT | A-1 | $17,000,000 | WFCM 2019-C52 | Yes | Wells Fargo Bank, National Association | LNR Partners, LLC | |
| A-2 | $14,000,000 | RREF III-D Repo Sub, LLC | No | |||||
| Shetland Park | RMF | A-1 | $45,000,000 | WFCM 2019-C51 | Yes | Wells Fargo Bank, National Association | C-III Asset Management LLC | |
| A-2 | $13,000,000 | WFCM 2019-C52 | No | |||||
THE INFORMATION IN THIS STRUCTURAL AND COLLATERAL TERM SHEET IS NOT COMPLETE AND MAY BE AMENDED PRIOR TO THE TIME OF SALE. THIS TERM SHEET IS NOT AN OFFER TO SELL THESE SECURITIES AND IT IS NOT A SOLICITATION OF AN OFFER TO BUY THESE SECURITIES IN ANY JURISDICTION WHERE THE OFFER OR SALE IS NOT PERMITTED.
10
| Wells Fargo Commercial Mortgage Trust 2019-C52 | Characteristics of the Mortgage Pool |
| Property Name | Mortgage Loan Seller in WFCM 2019-C52 | Note(s)(1) | Original Balance | Holder of Note(1) | Lead Servicer for Whole Loan | Master Servicer Under Lead Securitization Servicing Agreement | Special Servicer Under Lead Securitization Servicing Agreement | |
| Smoke Tree Village and Smoke Tree Commons | RMF | A-1 | $25,500,000 | RMF | Yes | Wells Fargo Bank, National Association(4) | LNR Partners, LLC(4) | |
| A-2 | $10,000,000 | WFCM 2019-C52 | No | |||||
| Del Mar Terrace Apartments | BSPRT | A-1 | $9,500,000 | WFCM 2019-C52 | Yes | Wells Fargo Bank, National Association | LNR Partners, LLC | |
| A-2 | $6,700,000 | BSPRT | No | |||||
| (1) | Unless otherwise indicated, each note not currently held by a securitization trust is expected to be contributed to a future securitization. No assurance can be provided that any such note will not be split further. |
| (2) | The controlling note holder with respect to Moffett Towers II – Buildings 3 & 4 Whole Loan will be (i) prior to a control appraisal period, the controlling class certificateholder under the MFTII 2019-B3B4 securitization, or (ii) during a control appraisal period, the holder of Note A-1-B or the directing certificateholder of the securitization trust that holds Note A-1-B. See “Description of the Mortgage Pool — The Whole Loans — The Non-Serviced AB Whole Loan” in the Preliminary Prospectus. |
| (3) | The CGCMT 2019-GC41 transaction is expected to close on or about August 15, 2019. |
| (4) | The related whole loan is expected to initially be serviced under the WFCM 2019-C52 pooling and servicing agreement until the securitization of the related “lead” pari passu note (namely, the related pari passu note marked “Yes” in the column entitled “Lead Servicer for Whole Loan”), after which the related whole loan will be serviced under the pooling and servicing agreement governing such securitization of the related “lead” pari passu note. The master servicer and special servicer for such securitization will be identified in a notice, report or statement to holders of the WFCM 2019-C52 certificates after the closing of such securitization. |
| (5) | The 188 Spear Street Whole Loan is currently being serviced under the WFCM 2019-C51 PSA. On and after the securitization of the related “lead” pari passu note (namely, the related pari passu note marked “Yes” in the column entitled “Lead Servicer for Whole Loan”), the 188 Spear Street Whole Loan will be serviced under the pooling and servicing agreement for such securitization. The master servicer and special servicer for such securitization will be identified in a notice, report or statement to holders of the WFCM 2019-C52 certificates after the closing of such securitization. |
THE INFORMATION IN THIS STRUCTURAL AND COLLATERAL TERM SHEET IS NOT COMPLETE AND MAY BE AMENDED PRIOR TO THE TIME OF SALE. THIS TERM SHEET IS NOT AN OFFER TO SELL THESE SECURITIES AND IT IS NOT A SOLICITATION OF AN OFFER TO BUY THESE SECURITIES IN ANY JURISDICTION WHERE THE OFFER OR SALE IS NOT PERMITTED.
11
| Wells Fargo Commercial Mortgage Trust 2019-C52 | Characteristics of the Mortgage Pool |
C. Mortgage Loans with Additional Secured and Mezzanine Financing
| Loan No. | Mortgage Loan Seller | Mortgage Loan Name | Mortgage Loan Cut-off Date Balance ($) | % of Initial Pool Balance (%) | Sub Debt Cut-off Date Balance ($) | Mezzanine Debt Cut-off Date Balance ($) | Total Debt Interest Rate (%)(1) | Mortgage Loan U/W NCF DSCR (x)(2) | Total Debt U/W NCF DSCR (x) | Mortgage Loan Cut-off Date U/W NOI Debt Yield (%)(2) | Total Debt Cut-off Date U/W NOI Debt Yield (%) | Mortgage Loan Cut-off Date LTV Ratio (%)(2) | Total Debt Cut-off Date LTV Ratio (%) | ||||||||||||||||||||||||
| 1 | Barclays | Moffett Towers II - Buildings 3 & 4 | $49,750,000 | 5.5 | % | $155,000,000 | $85,000,000 | 4.0500 | % | 3.45 | x | 1.90 | x | 13.2 | % | 7.9 | % | 44.3 | % | 74.7 | % | ||||||||||||||||
| 21 | BSPRT | Mount Kemble | 17,000,000 | 1.9 | NAP | 3,950,000 | 4.7500 | 2.45 | 1.87 | 11.1 | 9.9 | 66.2 | 74.7 | ||||||||||||||||||||||||
| Total/Weighted Average | $66,750,000 | 7.4 | % | $155,000,000 | $88,950,000 | 4.2283 | % | 3.20 | x | 1.89 | x | 12.7 | % | 8.4 | % | 49.9 | % | 74.7 | % | ||||||||||||||||||
| (1) | Total Debt Interest Rate for any specified mortgage loan reflects the weighted average of the interest rates on the respective components of the total debt. |
| (2) | With respect to any mortgage loan that is part of a whole loan, the loan-to-value ratio, debt service coverage ratio and debt yield calculations include the related pari passu companion loan(s). |
THE INFORMATION IN THIS STRUCTURAL AND COLLATERAL TERM SHEET IS NOT COMPLETE AND MAY BE AMENDED PRIOR TO THE TIME OF SALE. THIS TERM SHEET IS NOT AN OFFER TO SELL THESE SECURITIES AND IT IS NOT A SOLICITATION OF AN OFFER TO BUY THESE SECURITIES IN ANY JURISDICTION WHERE THE OFFER OR SALE IS NOT PERMITTED.
12
| Wells Fargo Commercial Mortgage Trust 2019-C52 | Characteristics of the Mortgage Pool |
D. Previous Securitization History(1)
| Loan No. | Mortgage Loan Seller | Mortgage Loan or Mortgaged Property Name | City | State | Property Type | Mortgage Loan or Mortgaged Property Cut-off Date Balance ($) | % of Initial Pool Balance (%) | Previous Securitization |
| 4 | AREF | Embassy Suites at Centennial Olympic Park | Atlanta | GA | Hospitality | $38,455,033 | 4.3% | JPMCC 2014-FL5 |
| 7 | WFB | Olympia Medical Office | Los Angeles | CA | Office | 30,000,000 | 3.3 | GSMS 2012-GC6 |
| 12 | BSPRT | Grand Traverse Crossing | Traverse City | MI | Retail | 24,300,000 | 2.7 | BSPRT 2018-FL4 |
| 18 | Barclays | 188 Spear Street | San Francisco | CA | Office | 18,000,000 | 2.0 | WFRBS 2013-C13 |
| 19 | RMF | El Con Center | Tucson | AZ | Retail | 18,000,000 | 2.0 | MSBAM 2014-C17 |
| 21 | BSPRT | Mount Kemble | Morristown | NJ | Office | 17,000,000 | 1.9 | GACM 2019-FL1 |
| 30 | BSPRT | Del Mar Terrace Apartments | Phoenix | AZ | Multifamily | 9,500,000 | 1.1 | MSCR 2016-MDN2 |
| 35 | WFB | Cordelia Road | Fairfield | CA | Industrial | 8,400,000 | 0.9 | WFRBS 2012-C8 |
| 40 | Barclays | East River Plaza | Princeton | WV | Retail | 7,390,055 | 0.8 | GSMS 2011-GC5 |
| 52 | RMF | Neighborhood Shoppes at Polaris | Columbus | OH | Retail | 4,875,000 | 0.5 | CFCRE 2011-C2 |
| 55 | Barclays | Red Roof Inn & Suites - Savannah | Pooler | GA | Hospitality | 4,286,125 | 0.5 | JPMBB 2015-C32 |
| 56 | LCF | Walgreens Elkton | Elkton | MD | Retail | 4,250,000 | 0.5 | COMM 2010-C1 |
| 63 | LCF | Walgreens Spartanburg | Spartanburg | SC | Retail | 3,250,000 | 0.4 | DBUBS 2011-LC1A |
| Total | $187,706,212 | 20.9% |
| (1) | The table above represents the most recent securitization with respect to the mortgaged property securing the related mortgage loan, based on information provided by the related borrower or obtained through searches of a third-party database. While loans secured by the above mortgaged properties may have been securitized multiple times in prior transactions, mortgage loans in this securitization are only listed in the above chart if the mortgage loan paid off a loan in another securitization. The information has not otherwise been confirmed by the mortgage loan sellers. |
THE INFORMATION IN THIS STRUCTURAL AND COLLATERAL TERM SHEET IS NOT COMPLETE AND MAY BE AMENDED PRIOR TO THE TIME OF SALE. THIS TERM SHEET IS NOT AN OFFER TO SELL THESE SECURITIES AND IT IS NOT A SOLICITATION OF AN OFFER TO BUY THESE SECURITIES IN ANY JURISDICTION WHERE THE OFFER OR SALE IS NOT PERMITTED.
13
| Wells Fargo Commercial Mortgage Trust 2019-C52 | Characteristics of the Mortgage Pool |
E. Mortgage Loans with Scheduled Balloon Payments and Related Classes
| Class A-2(1) | ||||||||||||||||||||||||||||||||||||||
| Loan No. | Mortgage Loan Seller | Mortgage Loan Name | State | Property Type | Mortgage Loan Cut-off Date Balance ($) | % of Initial Pool Balance (%) | Mortgage Loan Balance at Maturity or ARD ($) | % of Class A-2 Certificate Principal Balance (%)(2) | SF | Loan per SF ($) | U/W NCF DSCR (x) | U/W NOI Debt Yield (%) | Cut-off Date LTV Ratio (%) | Balloon or ARD LTV Ratio (%) | Rem. IO Period (mos.) | Rem. Term to Maturity or ARD (mos.) | ||||||||||||||||||||||
| 7 | WFB | Olympia Medical Office | CA | Office | $30,000,000 | 3.3 | % | $30,000,000 | 68.3 | % | 90,549 | $331 | 2.07 | x | 10.7 | % | 59.2 | % | 59.2 | % | 59 | 59 | ||||||||||||||||
| 25 | RMF | Shetland Park | MA | Mixed Use | 12,957,960 | 1.4 | 12,018,634 | 27.4 | 1,191,297 | $49 | 1.52 | 11.5 | 72.8 | 67.5 | 0 | 57 | ||||||||||||||||||||||
| Total/Weighted Average | $42,957,960 | 4.8 | % | $42,018,634 | 95.7 | % | 1.90 | x | 10.9 | % | 63.3 | % | 61.7 | % | 41 | 58 | ||||||||||||||||||||||
| (1) | The table above presents the mortgage loan(s) whose balloon payments would be applied to pay down the principal balance of the Class A-2 Certificates, assuming a 0% CPR and applying the “Structuring Assumptions” described in the Preliminary Prospectus, including the assumptions that (i) none of the mortgage loans in the pool experience prepayments prior to maturity (or, in the case of an ARD loan, its anticipated repayment date), defaults or losses; (ii) there are no extensions of maturity dates of any mortgage loans in the pool; and (iii) each mortgage loan in the pool is paid in full on its stated maturity date (or, in the case of an ARD loan, its anticipated repayment date). Each Class of Certificates evidences undivided ownership interests in the entire pool of mortgage loans. Debt service coverage ratio, debt yield and loan-to-value ratio information do not take into account any subordinate debt (whether or not secured by the related mortgaged property) that currently exists or is allowed under the terms of any mortgage loan. See Annex A-1 to the Preliminary Prospectus. |
| (2) | Reflects the percentage equal to the Balloon Balance divided by the initial Class A-2 Certificate Balance. |
| Class A-3(1) | ||||||||||||||||||||||||||||||||||||||||||
| Loan No. | Mortgage Loan Seller | Mortgage Loan Name | State | Property Type | Mortgage Loan Cut-off Date Balance ($) | % of Initial Pool Balance (%) | Mortgage Loan Balance at Maturity or ARD ($) | % of Class A-3 Certificate Principal Balance (%)(2) | SF/Units | Loan per SF/Unit ($) | U/W NCF DSCR (x) | U/W NOI Debt Yield (%) | Cut-off Date LTV Ratio (%) | Balloon or ARD LTV Ratio (%) | Rem. IO Period (mos.) | Rem. Term to Maturity or ARD (mos.) | ||||||||||||||||||||||||||
| 15 | BSPRT | Renaissance Center VI | FL | Office | $22,500,000 | 2.5 | % | $21,068,303 | 73.7 | % | 150,000 | $233 | 1.42 | x | 8.9 | % | 69.4 | % | 65.0 | % | 36 | 84 | ||||||||||||||||||||
| 38 | WFB | Sonoma Point Apartments - CA | CA | Multifamily | 7,500,000 | 0.8 | 7,500,000 | 26.3 | 70 | $107,143 | 2.98 | 13.2 | 40.5 | 40.5 | 82 | 82 | ||||||||||||||||||||||||||
| Total/Weighted Average | $30,000,000 | 3.3 | % | $28,568,303 | 100.0 | % | 1.81 | x | 10.0 | % | 62.2 | % | 58.9 | % | 48 | 84 | ||||||||||||||||||||||||||
| (1) | The table above presents the mortgage loan(s) whose balloon payments would be applied to pay down the principal balance of the Class A-3 Certificates, assuming a 0% CPR and applying the “Structuring Assumptions” described in the Preliminary Prospectus, including the assumptions that (i) none of the mortgage loans in the pool experience prepayments prior to maturity (or, in the case of an ARD loan, its anticipated repayment date), defaults or losses; (ii) there are no extensions of maturity dates of any mortgage loans in the pool; and (iii) each mortgage loan in the pool is paid in full on its stated maturity date (or, in the case of an ARD loan, its anticipated repayment date). Each Class of Certificates evidences undivided ownership interests in the entire pool of mortgage loans. Debt service coverage ratio, debt yield and loan-to-value ratio information do not take into account any subordinate debt (whether or not secured by the related mortgaged property) that currently exists or is allowed under the terms of any mortgage loan. See Annex A-1 to the Preliminary Prospectus. |
| (2) | Reflects the percentage equal to the Balloon Balance divided by the initial Class A-3 Certificate Balance. |
THE INFORMATION IN THIS STRUCTURAL AND COLLATERAL TERM SHEET IS NOT COMPLETE AND MAY BE AMENDED PRIOR TO THE TIME OF SALE. THIS TERM SHEET IS NOT AN OFFER TO SELL THESE SECURITIES AND IT IS NOT A SOLICITATION OF AN OFFER TO BUY THESE SECURITIES IN ANY JURISDICTION WHERE THE OFFER OR SALE IS NOT PERMITTED.
14
| Wells Fargo Commercial Mortgage Trust 2019-C52 | Characteristics of the Mortgage Pool |
F. Property Type Distribution(1)
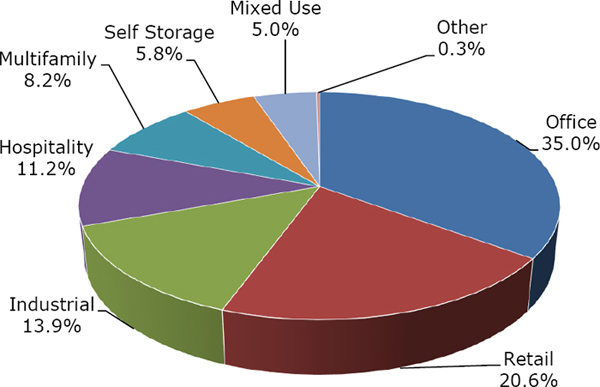
| Property Type | Number of Mortgaged Properties | Aggregate Cut-off Date Balance ($) | % of Initial Pool Balance (%) | Weighted Average Cut-off Date LTV Ratio (%) | Weighted Average Balloon or ARD LTV Ratio (%) | Weighted Average U/W NCF DSCR (x) | Weighted Average U/W NOI Debt Yield (%) | Weighted Average U/W NCF Debt Yield (%) | Weighted Average Mortgage Rate (%) | |||||||||||||||||
| Office | 18 | $314,972,731 | 35.0 | % | 61.1 | % | 56.6 | % | 2.31 | x | 11.7 | % | 11.1 | % | 4.284 | % | ||||||||||
| Suburban | 16 | 266,972,731 | 29.7 | 61.6 | 56.2 | 2.30 | 11.9 | 11.2 | 4.258 | |||||||||||||||||
| Medical | 1 | 30,000,000 | 3.3 | 59.2 | 59.2 | 2.07 | 10.7 | 10.4 | 4.950 | |||||||||||||||||
| CBD | 1 | 18,000,000 | 2.0 | 57.6 | 57.6 | 2.82 | 10.5 | 10.2 | 3.570 | |||||||||||||||||
| Retail | 28 | 185,685,711 | 20.6 | 63.2 | 58.7 | 2.01 | 10.5 | 9.9 | 4.444 | |||||||||||||||||
| Anchored | 22 | 170,097,243 | 18.9 | 63.2 | 58.4 | 2.03 | 10.6 | 9.9 | 4.430 | |||||||||||||||||
| Single Tenant | 3 | 8,431,000 | 0.9 | 67.3 | 67.3 | 1.78 | 8.5 | 8.5 | 4.707 | |||||||||||||||||
| Unanchored | 1 | 4,875,000 | 0.5 | 59.8 | 54.9 | 1.77 | 11.8 | 11.0 | 4.650 | |||||||||||||||||
| Shadow Anchored | 2 | 2,282,469 | 0.3 | 52.0 | 52.0 | 2.28 | 9.9 | 9.4 | 4.059 | |||||||||||||||||
| Industrial | 20 | 124,934,433 | 13.9 | 60.6 | 53.8 | 1.86 | 11.1 | 10.4 | 4.272 | |||||||||||||||||
| Flex | 4 | 46,540,000 | 5.2 | 62.0 | 55.7 | 1.79 | 9.4 | 8.9 | 4.176 | |||||||||||||||||
| Warehouse Distribution | 8 | 35,531,519 | 3.9 | 63.0 | 55.2 | 1.83 | 11.6 | 11.0 | 4.416 | |||||||||||||||||
| Manufacturing | 5 | 27,100,000 | 3.0 | 50.0 | 45.4 | 2.13 | 13.0 | 12.2 | 3.990 | |||||||||||||||||
| Warehouse | 3 | 15,762,913 | 1.8 | 69.4 | 59.4 | 1.70 | 11.6 | 10.6 | 4.716 | |||||||||||||||||
| Hospitality | 10 | 100,886,177 | 11.2 | 63.3 | 51.0 | 1.93 | 13.8 | 12.3 | 4.759 | |||||||||||||||||
| Limited Service | 8 | 56,437,520 | 6.3 | 61.3 | 48.9 | 2.06 | 15.0 | 13.4 | 4.848 | |||||||||||||||||
| Full Service | 1 | 38,455,033 | 4.3 | 68.4 | 55.5 | 1.72 | 11.7 | 10.6 | 4.590 | |||||||||||||||||
| Select Service | 1 | 5,993,624 | 0.7 | 49.5 | 40.8 | 1.99 | 15.5 | 12.8 | 5.000 | |||||||||||||||||
| Multifamily | 6 | 74,250,000 | 8.2 | 58.1 | 56.3 | 2.96 | 12.5 | 12.1 | 4.537 | |||||||||||||||||
| Garden | 4 | 39,500,000 | 4.4 | 48.5 | 48.5 | 4.24 | 15.7 | 15.1 | 4.159 | |||||||||||||||||
| Mid Rise | 1 | 18,750,000 | 2.1 | 67.4 | 67.4 | 1.49 | 7.9 | 7.8 | 5.150 | |||||||||||||||||
| Student Housing | 1 | 16,000,000 | 1.8 | 71.1 | 62.6 | 1.52 | 9.7 | 9.5 | 4.750 | |||||||||||||||||
| Self Storage | 37 | 52,286,813 | 5.8 | 60.0 | 53.2 | 1.88 | 10.2 | 10.1 | 4.087 | |||||||||||||||||
| Self Storage | 37 | 52,286,813 | 5.8 | 60.0 | 53.2 | 1.88 | 10.2 | 10.1 | 4.087 | |||||||||||||||||
| Mixed Use | 6 | 44,954,814 | 5.0 | 65.3 | 58.9 | 1.70 | 10.3 | 9.5 | 4.683 | |||||||||||||||||
| Retail/Office | 3 | 20,975,000 | 2.3 | 62.6 | 53.9 | 1.51 | 9.3 | 8.9 | 4.644 | |||||||||||||||||
| Industrial/Office/Self Storage | 1 | 12,957,960 | 1.4 | 72.8 | 67.5 | 1.52 | 11.5 | 10.0 | 5.150 | |||||||||||||||||
| Office/Retail | 2 | 11,021,854 | 1.2 | 61.8 | 58.4 | 2.28 | 10.7 | 10.3 | 4.207 | |||||||||||||||||
| Other | 1 | 2,269,542 | 0.3 | 41.0 | 33.5 | 1.49 | 9.7 | 9.3 | 4.730 | |||||||||||||||||
| Leased Fee | 1 | 2,269,542 | 0.3 | 41.0 | 33.5 | 1.49 | 9.7 | 9.3 | 4.730 | |||||||||||||||||
| Total/Weighted Average: | 126 | $900,240,222 | 100.0 | % | 61.6 | % | 55.8 | % | 2.14 | x | 11.5 | % | 10.8 | % | 4.399 | % | ||||||||||
| (1) | Because this table presents information relating to the mortgaged properties and not the mortgage loans, the information for mortgage loans secured by more than one mortgaged property is based on allocated amounts (allocating the principal balance of the mortgage loan to each of those properties according to the relative appraised values of the mortgaged properties or the allocated loan amounts or property-specific release prices set forth in the related mortgage loan documents or such other allocation as the related mortgage loan seller deemed appropriate). With respect to any mortgage loan that is part of a whole loan, the loan-to-value ratio, debt service coverage ratio and debt yield calculations include the related pari passu companion loan(s) but exclude any related subordinate companion loans (unless otherwise stated). With respect to each mortgage loan, debt service coverage ratio, debt yield and loan-to-value ratio information do not take into account any subordinate debt (whether or not secured by the related mortgaged property) that currently exists or is allowed under the terms of such mortgage loan. See Annex A-1 to the Preliminary Prospectus. |
THE INFORMATION IN THIS STRUCTURAL AND COLLATERAL TERM SHEET IS NOT COMPLETE AND MAY BE AMENDED PRIOR TO THE TIME OF SALE. THIS TERM SHEET IS NOT AN OFFER TO SELL THESE SECURITIES AND IT IS NOT A SOLICITATION OF AN OFFER TO BUY THESE SECURITIES IN ANY JURISDICTION WHERE THE OFFER OR SALE IS NOT PERMITTED.
15
| Wells Fargo Commercial Mortgage Trust 2019-C52 | Characteristics of the Mortgage Pool |
G. Geographic Distribution(1)
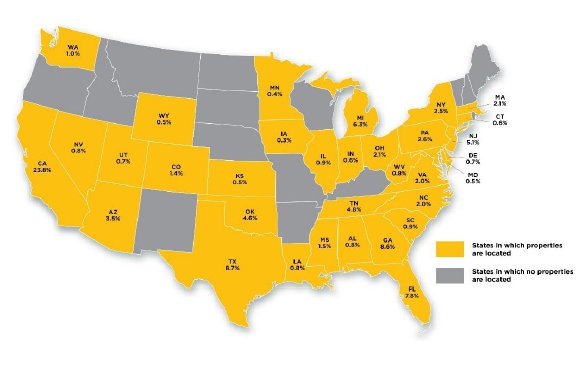
| Location | Number of Mortgaged Properties | Aggregate Cut-off Date Balance ($) | % of Initial Pool Balance (%) | Weighted Average Cut-off Date LTV Ratio (%) | Weighted Average Balloon or ARD LTV Ratio (%) | Weighted Average U/W NCF DSCR (x) | Weighted Average U/W NOI Debt Yield (%) | Weighted Average U/W NCF Debt Yield (%) | Weighted Average Mortgage Rate (%) | |||||||||||||||||
| California | 30 | $214,056,104 | 23.8 | % | 52.4 | % | 51.1 | % | 2.51 | x | 11.3 | % | 11.0 | % | 4.202 | % | ||||||||||
| Northern California | 7 | 109,673,933 | 12.2 | 49.5 | 47.9 | 2.96 | 12.6 | 12.3 | 3.950 | |||||||||||||||||
| Southern California | 23 | 104,382,171 | 11.6 | 55.4 | 54.5 | 2.04 | 10.0 | 9.6 | 4.467 | |||||||||||||||||
| Texas | 10 | 78,601,879 | 8.7 | 66.9 | 59.2 | 1.99 | 11.0 | 10.2 | 4.313 | |||||||||||||||||
| Georgia | 6 | 77,805,785 | 8.6 | 64.5 | 53.8 | 1.70 | 11.3 | 10.5 | 4.573 | |||||||||||||||||
| Florida | 4 | 69,890,000 | 7.8 | 63.8 | 58.8 | 1.76 | 11.2 | 10.6 | 4.451 | |||||||||||||||||
| Michigan | 5 | 56,981,000 | 6.3 | 66.8 | 60.0 | 1.59 | 9.7 | 8.9 | 4.719 | |||||||||||||||||
| New Jersey | 2 | 45,500,000 | 5.1 | 66.3 | 59.9 | 1.80 | 9.7 | 9.0 | 4.187 | |||||||||||||||||
| Tennessee | 3 | 42,928,160 | 4.8 | 71.5 | 57.8 | 1.81 | 12.1 | 10.9 | 4.491 | |||||||||||||||||
| Oklahoma | 1 | 41,580,000 | 4.6 | 63.0 | 63.0 | 2.86 | 12.4 | 11.7 | 4.000 | |||||||||||||||||
| Arizona | 3 | 31,200,000 | 3.5 | 47.1 | 46.5 | 4.66 | 17.3 | 16.5 | 4.137 | |||||||||||||||||
| Pennsylvania | 3 | 23,640,550 | 2.6 | 68.7 | 58.0 | 1.61 | 11.2 | 10.6 | 4.930 | |||||||||||||||||
| New York | 2 | 22,390,000 | 2.5 | 67.0 | 67.0 | 1.71 | 8.6 | 8.5 | 4.969 | |||||||||||||||||
| Massachusetts | 2 | 18,701,350 | 2.1 | 71.0 | 63.5 | 1.54 | 11.2 | 9.9 | 5.000 | |||||||||||||||||
| Ohio | 3 | 18,637,670 | 2.1 | 60.9 | 51.4 | 1.83 | 13.0 | 11.5 | 4.767 | |||||||||||||||||
| Virginia | 3 | 18,450,000 | 2.0 | 56.9 | 54.9 | 2.82 | 12.4 | 11.9 | 4.101 | |||||||||||||||||
| North Carolina | 6 | 17,721,917 | 2.0 | 68.0 | 58.3 | 1.77 | 11.9 | 11.0 | 4.646 | |||||||||||||||||
| Mississippi | 9 | 13,290,375 | 1.5 | 64.2 | 54.4 | 1.70 | 10.2 | 9.8 | 4.046 | |||||||||||||||||
| Colorado | 2 | 12,486,084 | 1.4 | 59.2 | 48.4 | 2.28 | 16.1 | 14.4 | 4.800 | |||||||||||||||||
| Washington | 1 | 8,715,000 | 1.0 | 64.6 | 64.6 | 2.96 | 14.6 | 13.2 | 4.380 | |||||||||||||||||
| Illinois | 2 | 7,823,919 | 0.9 | 71.7 | 58.1 | 1.72 | 11.5 | 10.6 | 4.544 | |||||||||||||||||
| South Carolina | 6 | 7,725,266 | 0.9 | 63.7 | 58.7 | 1.74 | 9.0 | 9.0 | 4.115 | |||||||||||||||||
| Louisiana | 9 | 7,571,882 | 0.8 | 61.8 | 53.2 | 1.68 | 9.5 | 9.4 | 3.809 | |||||||||||||||||
| Alabama | 1 | 7,500,000 | 0.8 | 59.1 | 44.4 | 2.12 | 17.7 | 15.1 | 5.150 | |||||||||||||||||
| West Virginia | 1 | 7,390,055 | 0.8 | 66.6 | 52.9 | 1.82 | 11.4 | 10.4 | 3.950 | |||||||||||||||||
| Nevada | 1 | 7,050,000 | 0.8 | 50.0 | 45.4 | 2.13 | 13.0 | 12.2 | 3.990 | |||||||||||||||||
| Utah | 1 | 6,742,134 | 0.7 | 74.9 | 60.9 | 1.43 | 9.3 | 8.8 | 4.600 | |||||||||||||||||
| Delaware | 1 | 6,000,000 | 0.7 | 47.6 | 39.7 | 2.07 | 14.0 | 12.7 | 4.550 | |||||||||||||||||
| Indiana | 1 | 5,400,000 | 0.6 | 71.1 | 58.4 | 1.78 | 12.8 | 11.4 | 4.990 | |||||||||||||||||
| Connecticut | 1 | 5,150,000 | 0.6 | 50.0 | 45.4 | 2.13 | 13.0 | 12.2 | 3.990 | |||||||||||||||||
| Maryland | 1 | 4,250,000 | 0.5 | 67.5 | 67.5 | 1.78 | 8.4 | 8.4 | 4.657 | |||||||||||||||||
| Wyoming | 1 | 4,200,000 | 0.5 | 60.4 | 60.4 | 2.15 | 10.7 | 10.4 | 4.750 | |||||||||||||||||
| Kansas | 1 | 4,160,849 | 0.5 | 70.5 | 57.4 | 1.74 | 11.9 | 10.8 | 4.660 | |||||||||||||||||
| Minnesota | 1 | 3,640,000 | 0.4 | 63.9 | 58.6 | 1.85 | 12.1 | 11.4 | 4.650 | |||||||||||||||||
| Iowa | 3 | 3,060,244 | 0.3 | 59.4 | 54.2 | 1.88 | 11.4 | 11.1 | 4.300 | |||||||||||||||||
| Total/Weighted Average | 126 | $900,240,222 | 100.0 | % | 61.6 | % | 55.8 | % | 2.14 | x | 11.5 | % | 10.8 | % | 4.399 | % | ||||||||||
| (1) | Because this table presents information relating to the mortgaged properties and not the mortgage loans, the information for mortgage loans secured by more than one mortgaged property is based on allocated amounts (allocating the principal balance of the mortgage loan to each of those properties according to the relative appraised values of the mortgaged properties or the allocated loan amounts or property-specific release prices set forth in the related mortgage loan documents or such other allocation as the related mortgage loan seller deemed appropriate). With respect to any mortgage loan that is part of a whole loan, the loan-to-value ratio, debt service coverage ratio and debt yield calculations include the relatedpari passu companion loan(s) but exclude any related subordinate companion loans (unless otherwise stated). With respect to each mortgage loan, debt service coverage ratio, debt yield and loan-to-value ratio information do not take into account any subordinate debt (whether or not secured by the related mortgaged property) that currently exists or is allowed under the terms of such mortgage loan. See Annex A-1 to the Preliminary Prospectus. |
THE INFORMATION IN THIS STRUCTURAL AND COLLATERAL TERM SHEET IS NOT COMPLETE AND MAY BE AMENDED PRIOR TO THE TIME OF SALE. THIS TERM SHEET IS NOT AN OFFER TO SELL THESE SECURITIES AND IT IS NOT A SOLICITATION OF AN OFFER TO BUY THESE SECURITIES IN ANY JURISDICTION WHERE THE OFFER OR SALE IS NOT PERMITTED.
16
| Wells Fargo Commercial Mortgage Trust 2019-C52 | Characteristics of the Mortgage Pool |
H. Characteristics of the Mortgage Pool(1)
| CUT-OFF DATE BALANCE | ||||||||
| Range of Cut-off Date Balances ($) | Number of Mortgage Loans | Aggregate Cut- off Date Balance | Percent by Aggregate Cut- off Date Pool Balance (%) | |||||
| 931,000 - 1,000,000 | 1 | $931,000 | 0.1 | % | ||||
| 1,000,001 - 2,000,000 | 1 | 1,200,000 | 0.1 | |||||
| 2,000,001 - 3,000,000 | 2 | 4,791,396 | 0.5 | |||||
| 3,000,001 - 4,000,000 | 5 | 17,563,854 | 2.0 | |||||
| 4,000,001 - 5,000,000 | 7 | 30,882,134 | 3.4 | |||||
| 5,000,001 - 6,000,000 | 7 | 40,137,014 | 4.5 | |||||
| 6,000,001 - 7,000,000 | 3 | 19,442,134 | 2.2 | |||||
| 7,000,001 - 8,000,000 | 6 | 45,465,055 | 5.1 | |||||
| 8,000,001 - 9,000,000 | 4 | 34,605,660 | 3.8 | |||||
| 9,000,001 - 10,000,000 | 5 | 48,148,996 | 5.3 | |||||
| 10,000,001 - 15,000,000 | 3 | 38,478,664 | 4.3 | |||||
| 15,000,001 - 20,000,000 | 7 | 122,250,000 | 13.6 | |||||
| 20,000,001 - 30,000,000 | 10 | 259,071,784 | 28.8 | |||||
| 30,000,001 - 49,750,000 | 6 | 237,272,533 | 26.4 | |||||
| Total: | 67 | $900,240,222 | 100.0 | % | ||||
| Weighted Average | $13,436,421 | |||||||
| UNDERWRITTEN NOI DEBT SERVICE COVERAGE RATIO | ||||||||
| Range of U/W NOI DSCRs (x) | Number of Mortgage Loans | Aggregate Cut- off Date Balance | Percent by Aggregate Cut- off Date Pool Balance (%) | |||||
| 1.43 - 1.50 | 5 | $90,000,000 | 10.0 | % | ||||
| 1.51 - 1.60 | 6 | 71,011,676 | 7.9 | |||||
| 1.61 - 1.70 | 3 | 37,971,890 | 4.2 | |||||
| 1.71 - 1.80 | 5 | 61,428,471 | 6.8 | |||||
| 1.81 - 1.90 | 7 | 92,726,887 | 10.3 | |||||
| 1.91 - 2.00 | 14 | 137,280,037 | 15.2 | |||||
| 2.01 - 2.50 | 14 | 190,840,178 | 21.2 | |||||
| 2.51 - 3.00 | 6 | 90,946,084 | 10.1 | |||||
| 3.01 - 3.50 | 5 | 111,185,000 | 12.4 | |||||
| 3.51 - 4.00 | 1 | 7,350,000 | 0.8 | |||||
| 4.01 - 11.61 | 1 | 9,500,000 | 1.1 | |||||
| Total: | 67 | $900,240,222 | 100.0 | % | ||||
| Weighted Average | 2.27x | |||||||
| UNDERWRITTEN NCF DEBT SERVICE COVERAGE RATIO | ||||||||
| Range of U/W NCF DSCRs (x) | Number of Mortgage Loans | Aggregate Cut- off Date Balance | Percent by Aggregate Cut- off Date Pool Balance (%) | |||||
| 1.36 - 1.40 | 2 | $34,300,000 | 3.8 | % | ||||
| 1.41 - 1.50 | 8 | 110,711,676 | 12.3 | |||||
| 1.51 - 1.60 | 6 | 73,552,861 | 8.2 | |||||
| 1.61 - 1.70 | 3 | 40,119,354 | 4.5 | |||||
| 1.71 - 1.80 | 12 | 136,802,516 | 15.2 | |||||
| 1.81 - 1.90 | 10 | 104,581,550 | 11.6 | |||||
| 1.91 - 2.00 | 2 | 10,279,749 | 1.1 | |||||
| 2.01 - 2.50 | 14 | 208,897,517 | 23.2 | |||||
| 2.51 - 3.00 | 7 | 114,395,000 | 12.7 | |||||
| 3.01 - 3.50 | 1 | 49,750,000 | 5.5 | |||||
| 3.51 - 4.00 | 1 | 7,350,000 | 0.8 | |||||
| 4.01 - 11.08 | 1 | 9,500,000 | 1.1 | |||||
| Total: | 67 | $900,240,222 | 100.0 | % | ||||
| Weighted Average | 2.14x | |||||||
| LOAN PURPOSE | ||||||||
| Loan Purpose | Number of Mortgage Loans | Aggregate Cut- off Date Balance | Percent by Aggregate Cut- off Date Pool Balance (%) | |||||
| Refinance | 41 | $502,031,562 | 55.8 | % | ||||
| Acquisition | 24 | 374,508,659 | 41.6 | |||||
| Recapitalization | 2 | 23,700,000 | 2.6 | |||||
| Total: | 67 | $900,240,222 | 100.0 | % | ||||
| MORTGAGE RATE | ||||||||
Range of Mortgage Rates (%) | Number of Mortgage Loans | Aggregate Cut- off Date Balance | Percent by Aggregate Cut- off Date Pool Balance (%) | |||||
| 2.900 - 3.500 | 1 | $9,500,000 | 1.1 | % | ||||
| 3.501 - 3.750 | 1 | 18,000,000 | 2.0 | |||||
| 3.751 - 4.000 | 8 | 179,267,555 | 19.9 | |||||
| 4.001 - 4.250 | 9 | 164,112,500 | 18.2 | |||||
| 4.251 - 4.500 | 7 | 91,714,354 | 10.2 | |||||
| 4.501 - 4.750 | 24 | 259,870,498 | 28.9 | |||||
| 4.751 - 5.000 | 10 | 121,005,145 | 13.4 | |||||
| 5.001 - 5.250 | 5 | 51,757,473 | 5.7 | |||||
| 5.251 - 5.500 | 1 | 4,081,696 | 0.5 | |||||
| 5.501 - 5.530 | 1 | 931,000 | 0.1 | |||||
| Total: | 67 | $900,240,222 | 100.0 | % | ||||
| Weighted Average | 4.399% | |||||||
| UNDERWRITTEN NOI DEBT YIELD | ||||||||
Range of U/W NOI Debt Yields (%) | Number of Mortgage Loans | Aggregate Cut- off Date Balance | Percent by Aggregate Cut- off Date Pool Balance (%) | |||||
| 7.9 - 8.0 | 1 | $18,750,000 | 2.1 | % | ||||
| 8.1 - 9.0 | 10 | 98,106,000 | 10.9 | |||||
| 9.1 - 10.0 | 12 | 190,259,176 | 21.1 | |||||
| 10.1 - 11.0 | 7 | 97,895,095 | 10.9 | |||||
| 11.1 - 12.0 | 14 | 225,338,140 | 25.0 | |||||
| 12.1 - 13.0 | 8 | 101,458,996 | 11.3 | |||||
| 13.1 - 14.0 | 5 | 91,926,813 | 10.2 | |||||
| 14.1 - 15.0 | 4 | 29,390,170 | 3.3 | |||||
| 15.1 - 16.0 | 3 | 17,629,749 | 2.0 | |||||
| 16.1 - 17.0 | 1 | 12,486,084 | 1.4 | |||||
| 17.1 - 20.0 | 1 | 7,500,000 | 0.8 | |||||
| 20.1 - 34.2 | 1 | 9,500,000 | 1.1 | |||||
| Total: | 67 | $900,240,222 | 100.0 | % | ||||
| Weighted Average | 11.5% | |||||||
| UNDERWRITTEN NCF DEBT YIELD | ||||||||
| Range of U/W NCF Debt Yields (%) | Number of Mortgage Loans | Aggregate Cut- off Date Balance | Percent by Aggregate Cut- off Date Pool Balance (%) | |||||
| 7.8 - 8.0 | 1 | $18,750,000 | 2.1 | % | ||||
| 8.1 - 9.0 | 16 | 180,648,134 | 20.1 | |||||
| 9.1 - 10.0 | 9 | 155,348,243 | 17.3 | |||||
| 10.1 - 11.0 | 15 | 208,949,534 | 23.2 | |||||
| 11.1 - 12.0 | 11 | 165,198,996 | 18.4 | |||||
| 12.1 - 13.0 | 6 | 54,234,174 | 6.0 | |||||
| 13.1 - 14.0 | 5 | 80,275,058 | 8.9 | |||||
| 14.1 - 15.0 | 2 | 19,836,084 | 2.2 | |||||
| 15.1 - 16.0 | 1 | 7,500,000 | 0.8 | |||||
| 16.1 - 32.7 | 1 | 9,500,000 | 1.1 | |||||
| Total: | 67 | $900,240,222 | 100.0 | % | ||||
| Weighted Average | 10.8% | |||||||
| ORIGINAL TERM TO MATURITY or ARD | ||||||||
| Original Terms to Maturity or ARD (months) | Number of Mortgage Loans | Aggregate Cut- off Date Balance | Percent by Aggregate Cut- off Date Pool Balance (%) | |||||
| 60 | 2 | $42,957,960 | 4.8 | % | ||||
| 84 | 2 | 30,000,000 | 3.3 | |||||
| 120 | 62 | 808,532,261 | 89.8 | |||||
| 123 | 1 | 18,750,000 | 2.1 | |||||
| Total: | 67 | $900,240,222 | 100.0 | % | ||||
| Weighted Average | 116 months | |||||||
| (1) | With respect to any mortgage loan that is part of a whole loan, the loan-to-value ratio, debt service coverage ratio and debt yield calculations include the relatedpari passu companion loan(s) but exclude any related subordinate debt (unless otherwise stated). With respect to each mortgage loan, debt service coverage ratio, debt yield and loan-to-value ratio information do not take into account any subordinate debt (whether or not secured by the related mortgaged property) that currently exists or is allowed under the terms of such mortgage loan. See Annex A-1 to the Preliminary Prospectus. Prepayment provisions for each mortgage loan reflects the entire life of the loan (from origination to maturity or ARD). |
THE INFORMATION IN THIS STRUCTURAL AND COLLATERAL TERM SHEET IS NOT COMPLETE AND MAY BE AMENDED PRIOR TO THE TIME OF SALE. THIS TERM SHEET IS NOT AN OFFER TO SELL THESE SECURITIES AND IT IS NOT A SOLICITATION OF AN OFFER TO BUY THESE SECURITIES IN ANY JURISDICTION WHERE THE OFFER OR SALE IS NOT PERMITTED.
17
| Wells Fargo Commercial Mortgage Trust 2019-C52 | Characteristics of the Mortgage Pool |
| REMAINING TERM TO MATURITY or ARD | ||||||||
| Range of Remaining Terms to Maturity or ARD (months) | Number of Mortgage Loans | Aggregate Cut- off Date Balance | Percent by Aggregate Cut- off Date Pool Balance (%) | |||||
| 57 - 60 | 2 | $42,957,960 | 4.8 | % | ||||
| 61 - 84 | 2 | 30,000,000 | 3.3 | |||||
| 85 - 120 | 63 | 827,282,261 | 91.9 | |||||
| Total: | 67 | $900,240,222 | 100.0 | % | ||||
| Weighted Average | 115 months | |||||||
| ORIGINAL AMORTIZATION TERM(2) | ||||||||
| Range of Original Amortization Terms (months) | Number of Mortgage Loans | Aggregate Cut- off Date Balance | Percent by Aggregate Cut- off Date Pool Balance (%) | |||||
| Non-Amortizing | 26 | $374,251,000 | 41.6 | % | ||||
| 300 | 4 | 19,426,674 | 2.2 | |||||
| 324 - 360 | 37 | 506,562,547 | 56.3 | |||||
| Total: | 67 | $900,240,222 | 100.0 | % | ||||
| Weighted Average(3) | 357 months | |||||||
| (2) | The original amortization term shown for any mortgage loan that is interest-only for part of its term does not include the number of months in its interest-only period and reflects only the number of months as of the commencement of amortization remaining from the end of such interest-only period. |
| (3) | Excludes the non-amortizing mortgage loans. |
| REMAINING AMORTIZATION TERM(4) | ||||||||
| Range of Remaining Amortization Terms (months) | Number of Mortgage Loans | Aggregate Cut- off Date Balance | Percent by Aggregate Cut- off Date Pool Balance (%) | |||||
| Non-Amortizing | 26 | $374,251,000 | 41.6 | % | ||||
| 297 - 300 | 4 | 19,426,674 | 2.2 | |||||
| 301 - 360 | 37 | 506,562,547 | 56.3 | |||||
| Total: | 67 | $900,240,222 | 100.0 | % | ||||
| Weighted Average(5) | 357 months | |||||||
| (4) | The remaining amortization term shown for any mortgage loan that is interest-only for part of its term does not include the number of months in its interest-only period and reflects only the number of months as of the commencement of amortization remaining from the end of such interest-only period. |
| (5) | Excludes the non-amortizing mortgage loans. |
| LOCKBOXES | ||||||||
| Type of Lockbox | Number of Mortgage Loans | Aggregate Cut- off Date Balance | Percent by Aggregate Cut- off Date Pool Balance (%) | |||||
| Springing | 33 | $342,223,221 | 38.0 | % | ||||
| Hard/Springing Cash Management | 15 | 305,449,095 | 33.9 | |||||
| Soft/Springing Cash Management | 9 | 121,897,592 | 13.5 | |||||
| Hard/Upfront Cash Management | 5 | 85,281,000 | 9.5 | |||||
| None | 4 | 26,639,313 | 3.0 | |||||
| Soft/Upfront Cash Management | 1 | 18,750,000 | 2.1 | |||||
| Total: | 67 | $900,240,222 | 100.0 | % | ||||
| PREPAYMENT PROVISION SUMMARY(6) | ||||||||
| Prepayment Provision | Number of Mortgage Loans | Aggregate Cut- off Date Balance | Percent by Aggregate Cut- off Date Pool Balance (%) | |||||
| Lockout / Defeasance / Open | 52 | $634,387,237 | 70.5 | % | ||||
| Lockout / GRTR 1% or YM / Open | 8 | 171,569,485 | 19.1 | |||||
| Lockout / GRTR 1% or YM / GRTR 1% or YM or Defeasance / Open | 1 | 49,750,000 | 5.5 | |||||
| Lockout / GRTR 1% or YM or Def. / Open | 3 | 36,102,500 | 4.0 | |||||
| YM / YM or Defeasance / Open | 3 | 8,431,000 | 0.9 | |||||
| Total: | 67 | $900,240,222 | 100.0 | % | ||||
| (6) | As a result of property releases or the application of funds in a performance reserve, partial principal prepayments could occur during a period that voluntary principal prepayments are otherwise prohibited. |
| CUT-OFF DATE LOAN-TO-VALUE RATIO | ||||||||
| Range of Cut-off Date LTV Ratios (%) | Number of Mortgage Loans | Aggregate Cut- off Date Balance | Percent by Aggregate Cut- off Date Pool Balance (%) | |||||
| 16.2 - 40.0 | 1 | $9,500,000 | 1.1 | % | ||||
| 40.1 - 45.0 | 3 | 59,519,542 | 6.6 | |||||
| 45.1 - 50.0 | 5 | 44,782,937 | 5.0 | |||||
| 50.1 - 55.0 | 5 | 68,150,000 | 7.6 | |||||
| 55.1 - 60.0 | 12 | 144,219,328 | 16.0 | |||||
| 60.1 - 65.0 | 15 | 232,713,050 | 25.9 | |||||
| 65.1 - 70.0 | 15 | 197,105,973 | 21.9 | |||||
| 70.1 - 75.0 | 11 | 144,249,391 | 16.0 | |||||
| Total: | 67 | $900,240,222 | 100.0 | % | ||||
| Weighted Average | 61.6% | |||||||
| BALLOON or ARD LOAN-TO-VALUE RATIO | ||||||||
| Range of Balloon or ARD LTV Ratios (%) | Number of Mortgage Loans | Aggregate Cut- off Date Balance | Percent by Aggregate Cut- off Date Pool Balance (%) | |||||
| 16.2 - 30.0 | 1 | $9,500,000 | 1.1 | % | ||||
| 30.1 - 35.0 | 1 | 2,269,542 | 0.3 | |||||
| 35.1 - 40.0 | 1 | 6,000,000 | 0.7 | |||||
| 40.1 - 45.0 | 8 | 93,753,682 | 10.4 | |||||
| 45.1 - 50.0 | 5 | 56,476,633 | 6.3 | |||||
| 50.1 - 55.0 | 13 | 174,518,444 | 19.4 | |||||
| 55.1 - 60.0 | 17 | 280,070,826 | 31.1 | |||||
| 60.1 - 65.0 | 14 | 215,012,134 | 23.9 | |||||
| 65.1 - 70.0 | 7 | 62,638,960 | 7.0 | |||||
| Total: | 67 | $900,240,222 | 100.0 | % | ||||
| Weighted Average | 55.8% | |||||||
| AMORTIZATION TYPE | ||||||||
| Amortization Type | Number of Mortgage Loans | Aggregate Cut- off Date Balance | Percent by Aggregate Cut- off Date Pool Balance (%) | |||||
| Interest-only, Balloon | 21 | $312,430,000 | 34.7 | % | ||||
| Amortizing Balloon | 24 | 254,099,222 | 28.2 | |||||
| Interest-only, Amortizing Balloon | 16 | 244,790,000 | 27.2 | |||||
| Interest-only, ARD | 5 | 61,821,000 | 6.9 | |||||
| Interest-only, Amortizing ARD | 1 | 27,100,000 | 3.0 | |||||
| Total: | 67 | $900,240,222 | 100.0 | % | ||||
| ORIGINAL TERM OF INTEREST-ONLY PERIOD FOR PARTIAL IO LOANS | ||||||||
| IO Terms (months) | Number of Mortgage Loans | Aggregate Cut- off Date Balance | Percent by Aggregate Cut- off Date Pool Balance (%) | |||||
| 12 | 2 | $23,500,000 | 2.6 | % | ||||
| 16 | 1 | 7,725,000 | 0.9 | |||||
| 18 | 1 | 24,300,000 | 2.7 | |||||
| 24 | 2 | 29,700,000 | 3.3 | |||||
| 36 | 4 | 74,497,500 | 8.3 | |||||
| 60 | 7 | 85,067,500 | 12.5 | |||||
| Total: | 17 | $271,890,000 | 30.2 | % | ||||
| Weighted Average | 40 months | |||||||
| SEASONING | ||||||||
| Seasoning (months) | Number of Mortgage Loans | Aggregate Cut- off Date Balance | Percent by Aggregate Cut- off Date Pool Balance (%) | |||||
| 0 | 26 | $368,003,500 | 40.9 | % | ||||
| 1 | 20 | 283,226,448 | 31.5 | |||||
| 2 | 15 | 146,505,617 | 16.3 | |||||
| 3 | 5 | 83,754,656 | 9.3 | |||||
| 4 | 1 | 18,750,000 | 2.1 | |||||
| Total: | 67 | $900,240,222 | 100.0 | % | ||||
| Weighted Average | 1 month | |||||||
THE INFORMATION IN THIS STRUCTURAL AND COLLATERAL TERM SHEET IS NOT COMPLETE AND MAY BE AMENDED PRIOR TO THE TIME OF SALE. THIS TERM SHEET IS NOT AN OFFER TO SELL THESE SECURITIES AND IT IS NOT A SOLICITATION OF AN OFFER TO BUY THESE SECURITIES IN ANY JURISDICTION WHERE THE OFFER OR SALE IS NOT PERMITTED.
18
| Wells Fargo Commercial Mortgage Trust 2019-C52 | Certain Terms and Conditions |
V. Certain Terms and Conditions
| Interest Entitlements: | The interest entitlement of each Class of Certificates on each Distribution Date generally will be the interest accrued during the related Interest Accrual Period on the related Certificate Balance or Notional Amount at the related pass-through rate, net of any prepayment interest shortfalls allocated to that Class for such Distribution Date as described below. If prepayment interest shortfalls arise from voluntary prepayments (without Master Servicer consent) on particular non-specially serviced loans during any collection period, the Master Servicer is required to make a compensating interest payment to offset those shortfalls, generally up to an amount equal to the portion of its master servicing fees that accrue at 0.25 basis pointsper annum. The remaining amount of prepayment interest shortfalls will be allocated to reduce the interest entitlement on all Classes of Certificates entitled to interest, on apro rata basis, based on their respective amounts of accrued interest for the related Distribution Date. If a Class receives less than the entirety of its interest entitlement on any Distribution Date, then the shortfall (excluding any shortfall due to prepayment interest shortfalls), together with interest thereon, will be added to its interest entitlement for the next succeeding Distribution Date. |
| Principal Distribution Amount: | The Principal Distribution Amount for each Distribution Date generally will be the aggregate amount of principal received or advanced in respect of the mortgage loans, net of any non-recoverable advances and interest thereon and workout-delayed reimbursement amounts that are reimbursed to the Master Servicer, the Special Servicer or the Trustee during the related collection period. Non-recoverable advances and interest thereon are reimbursable from principal collections and advances before reimbursement from other amounts. Workout-delayed reimbursement amounts are reimbursable from principal collections. |
| Subordination, Allocation of Losses and Certain Expenses | The chart below describes the manner in which the payment rights of certain Classes of Certificates will be senior or subordinate, as the case may be, to the payment rights of other Classes of Certificates. The chart also shows the corresponding entitlement to receive principal and/or interest of certain Classes of Certificates (other than excess interest that accrues on each mortgage loan that has an anticipated repayment date) on any distribution date in descending order. It also shows the manner in which losses are allocated to certain Classes of Certificates in ascending order (beginning with the Non-Offered Certificates, and other than the Class V and Class R certificates) to reduce the balance of each such Class to zero;provided that no principal payments or mortgage loan losses will be allocated to the Class X-A, X-B, V or R Certificates, although principal payments and losses may reduce the Notional Amounts of the Class X-A and X-B certificates and, therefore, the amount of interest they accrue. |
THE INFORMATION IN THIS STRUCTURAL AND COLLATERAL TERM SHEET IS NOT COMPLETE AND MAY BE AMENDED PRIOR TO THE TIME OF SALE. THIS TERM SHEET IS NOT AN OFFER TO SELL THESE SECURITIES AND IT IS NOT A SOLICITATION OF AN OFFER TO BUY THESE SECURITIES IN ANY JURISDICTION WHERE THE OFFER OR SALE IS NOT PERMITTED.
19
| Wells Fargo Commercial Mortgage Trust 2019-C52 | Certain Terms and Conditions |
(1) The Class X-A and X-B Certificates are interest-only certificates. (2) Non-Offered Certificates. | |
| Distributions: | On each Distribution Date, funds available for distribution from the mortgage loans, net of specified trust fees, expenses and reimbursements will generally be distributed in the following amounts and order of priority (in each case to the extent of remaining available funds): |
| 1. Class A-1, A-2, A-3, A-SB, A-4, A-5, X-A and X-B Certificates: To interest on the Class A-1, A-2, A-3, A-SB, A-4, A-5, X-A and X-B Certificates,pro rata, according to their respective interest entitlements. | |
| 2. Class A-1, A-2, A-3, A-SB, A-4 and A-5 Certificates: To principal on the Class A-1, A-2, A-3, A-SB, A-4 and A-5 Certificates in the following amounts and order of priority: (i) first, to principal on the Class A-SB Certificates, in an amount up to the Principal Distribution Amount for such Distribution Date until their Certificate Balance is reduced to the Class A-SB Planned Principal Balance for such Distribution Date; (ii) second, to principal on the Class A-1 Certificates until their Certificate Balance is reduced to zero, up to the remainder of the Principal Distribution Amount for such Distribution Date; (iii) third, to principal on the Class A-2 Certificates until their Certificate Balance is reduced to zero, up to the remainder of the Principal Distribution Amount for such Distribution Date; (iv) fourth, to principal on the Class A-3 Certificates until their Certificate Balance is reduced to zero, up to the remainder of the Principal Distribution Amount for such Distribution Date; (v) fifth, to principal on the Class A-4 Certificates until their Certificate Balance is reduced to zero, up to the remainder of the Principal Distribution Amount for such Distribution Date; (vi) sixth, to principal on the Class A-5 Certificates until their Certificate Balance is reduced to zero, up to the remainder of the Principal Distribution Amount for such Distribution Date; and (vii) seventh, to principal on the Class A-SB Certificates until their Certificate Balance is reduced to zero, up to the remainder of the Principal Distribution Amount for such Distribution Date. However, if the Certificate Balance of each Class of Principal Balance Certificates, other than the Class A-1, A-2, A-3, A-SB, A-4 and A-5 Certificates, has been reduced to zero as a result of the allocation of Mortgage Loan losses and expenses and any of the Class A-1, A-2, A-3, A-SB, A-4 and A-5 Certificates remains outstanding, then the Principal Distribution Amount will be distributed to the Class A-1, A-2, A-3, A-SB, A-4 and A-5 Certificates,pro rata, based on their respective outstanding Certificate Balances, until their Certificate Balances have been reduced to zero. | |
| 3. Class A-1, A-2, A-3, A-SB, A-4 and A-5 Certificates: To reimburse the holders of the Class A-1, A-2, A-3, A-SB, A-4 and A-5 Certificates,pro rata, on the basis of previously allocated unreimbursed losses, for any previously unreimbursed losses (plus interest thereon) on the mortgage loans that were previously allocated in reduction of the Certificate Balances of such Classes. | |
4. Class A-S Certificates: To make distributions on the Class A-S Certificates as follows: (a) first, to interest on the Class A-S Certificates in the amount of the interest entitlement for that Class; (b) next, to the extent of the portion of the Principal Distribution Amount remaining after distributions in respect of principal to each Class with a higher distribution |
THE INFORMATION IN THIS STRUCTURAL AND COLLATERAL TERM SHEET IS NOT COMPLETE AND MAY BE AMENDED PRIOR TO THE TIME OF SALE. THIS TERM SHEET IS NOT AN OFFER TO SELL THESE SECURITIES AND IT IS NOT A SOLICITATION OF AN OFFER TO BUY THESE SECURITIES IN ANY JURISDICTION WHERE THE OFFER OR SALE IS NOT PERMITTED.
20
| Wells Fargo Commercial Mortgage Trust 2019-C52 | Certain Terms and Conditions |
priority (in this case, the Class A-1, A-2, A-3, A-SB, A-4 and A-5 Certificates), to principal on the Class A-S Certificates until their Certificate Balance is reduced to zero; and (c) next, to reimburse the holders of the Class A-S Certificates for any previously unreimbursed losses (plus interest thereon) on the mortgage loans that were previously allocated to that Class in reduction of their Certificate Balance.
5. Class B Certificates: To make distributions on the Class B Certificates as follows: (a) first, to interest on the Class B Certificates in the amount of the interest entitlement for that Class; (b) next, to the extent of the portion of the Principal Distribution Amount remaining after distributions in respect of principal to each Class with a higher distribution priority (in this case, the Class A-1, A-2, A-3, A-SB, A-4, A-5 and A-S Certificates), to principal on the Class B Certificates until their Certificate Balance is reduced to zero; and (c) next, to reimburse the holders of the Class B Certificates for any previously unreimbursed losses (plus interest thereon) on the mortgage loans that were previously allocated to that Class in reduction of their Certificate Balance.
6. Class C Certificates: To make distributions on the Class C Certificates as follows: (a) first, to interest on the Class C Certificates in the amount of the interest entitlement for that Class; (b) next, to the extent of the portion of the Principal Distribution Amount remaining after distributions in respect of principal to each Class with a higher distribution priority (in this case, the Class A-1, A-2, A-3, A-SB, A-4, A-5, A-S and B Certificates), to principal on the Class C Certificates until their Certificate Balance is reduced to zero; and (c) next, to reimburse the holders of the Class C Certificates for any previously unreimbursed losses (plus interest thereon) on the mortgage loans that were previously allocated to that Class in reduction of their Certificate Balance.
7. After the Class A-1, A-2, A-3, A-SB, A-4, A-5, X-A, X-B, A-S, B and C Certificates are paid all amounts to which they are entitled, the remaining funds available for distribution will be used to pay interest, principal and loss reimbursement amounts on the Class D-RR, E-RR, F-RR, G-RR and H-RR Certificates sequentially in that order in a manner analogous to the Class C Certificates. | |
| Allocation of Yield Maintenance Charges and Prepayment Premiums: | If any yield maintenance charge or prepayment premium is collected during any particular collection period with respect to any mortgage loan, then on the Distribution Date corresponding to that collection period, the certificate administrator will pay that yield maintenance charge or prepayment premium (net of liquidation fees payable therefrom) in the following manner: (1) to each of the Class A-1, A-2, A-3, A-SB, A-4, A-5, A-S, B and C Certificates, the product of (a) the yield maintenance charge or prepayment premium, (b) the related Base Interest Fraction (as defined in the Preliminary Prospectus) for such Class, and (c) a fraction, the numerator of which is equal to the amount of principal distributed to such Class for that Distribution Date, and the denominator of which is the total amount of principal distributed to all Principal Balance Certificates for that Distribution Date, (2) to the Class X-A Certificates, the excess, if any, of (a) the product of (i) such yield maintenance charge or prepayment premium and (ii) a fraction, the numerator of which is equal to the amount of principal distributed to the Class A-1, A-2, A-3, A-SB, A-4 and A-5 Certificates for that Distribution Date, and the denominator of which is the total amount of principal distributed to all Principal Balance Certificates for that Distribution Date, over (b) the amount of such yield maintenance charge or prepayment premium distributed to the Class A-1, A-2, A-3, A-SB, A-4 and A-5 Certificates as described above, and (3) to the Class X-B Certificates, any remaining portion of such yield maintenance charge or prepayment premium not distributed as described above.
No prepayment premiums or yield maintenance charges will be distributed to the holders of the Class D-RR, E-RR, F-RR, G-RR, H-RR, V or R certificates. For a description of when prepayment premiums and yield maintenance charges are generally required on the mortgage loans, see Annex A-1 to the Preliminary Prospectus. See also “Risk Factors—Risks Relating to the Mortgage Loans—Risks Relating to Enforceability of Yield Maintenance Charges, Prepayment Premiums or Defeasance Provisions” and “Risk Factors—Other Risks Relating to the Certificates—Your Yield May Be Affected by Defaults, Prepayments and Other Factors” in the Preliminary Prospectus. Prepayment premiums and yield maintenance charges will be distributed on each Distribution Date only to the extent they are actually received on the mortgage loans as of the related Determination Date. |
THE INFORMATION IN THIS STRUCTURAL AND COLLATERAL TERM SHEET IS NOT COMPLETE AND MAY BE AMENDED PRIOR TO THE TIME OF SALE. THIS TERM SHEET IS NOT AN OFFER TO SELL THESE SECURITIES AND IT IS NOT A SOLICITATION OF AN OFFER TO BUY THESE SECURITIES IN ANY JURISDICTION WHERE THE OFFER OR SALE IS NOT PERMITTED.
21
| Wells Fargo Commercial Mortgage Trust 2019-C52 | Certain Terms and Conditions |
| Realized Losses: | The Certificate Balances of the Class A-1, A-2, A-3, A-SB, A-4, A-5, A-S, B, C, D-RR, E-RR, F-RR, G-RR and H-RR Certificates will be reduced without distribution on any Distribution Date as a write-off to the extent of any losses realized on the mortgage loans allocated to such Class on such Distribution Date. Such losses will be applied in the following order, in each case until the related Certificate Balance is reduced to zero: first, to the Class H-RR Certificates; second, to the Class G-RR Certificates; third, to the Class F-RR Certificates; fourth, to the Class E-RR Certificates; fifth, to the Class D-RR Certificates; sixth, to the Class C Certificates; seventh, to the Class B Certificates; eighth, to the Class A-S Certificates; and, finally,pro rata, to the Class A-1, A-2, A-3, A-SB, A-4 and A-5 Certificates based on their outstanding Certificate Balances.
The Notional Amount of the Class X-A Certificates will be reduced by the amount of all losses that are allocated to the Class A-1, A-2, A-3, A-SB, A-4 or A-5 Certificates as write-offs in reduction of their Certificate Balances. The Notional Amount of the Class X-B Certificates will be reduced by the amount of all losses that are allocated to the Class A-S, B or C Certificates as write-offs in reduction of their Certificate Balances. |
| P&I Advances: | The Master Servicer or, if the Master Servicer fails to do so, the Trustee, will be obligated to advance delinquent debt service payments (other than balloon payments, excess interest and default interest) and assumed debt service payments on mortgage loans with delinquent balloon payments (excluding any related companion loan), except to the extent any such advance is deemed non-recoverable from collections on the related mortgage loan. In addition, if an Appraisal Reduction Amount exists for a given mortgage loan, the interest portion of any P&I advance for such mortgage loan will be reduced, which will have the effect of reducing the amount of interest available for distribution to the Certificates in reverse alphabetical order of their Class designations (except that interest payments on the Class A-1, A-2, A-3, A-SB, A-4, A-5, X-A and X-B Certificates would be affected on apari passu basis). |
| Servicing Advances: | The Master Servicer or, if the Master Servicer fails to do so, the Trustee, will be obligated to make servicing advances, including the payment of delinquent property taxes, insurance premiums and ground rent, except to the extent that those advances are deemed non-recoverable from collections on the related mortgage loan. The Master Servicer or the Trustee, as applicable, will have the primary obligation to make any required servicing advances with respect to any serviced whole loan. With respect to any non-serviced whole loan, the master servicer or trustee, as applicable, under the related lead securitization servicing agreement will have the primary obligation to make any required servicing advances with respect to such non-serviced whole loan. |
Appraisal Reduction Amounts and Collateral Deficiency Amounts:
| An “Appraisal Reduction Amount” generally will be created in the amount, if any, by which the principal balance of a required appraisal loan (which is a mortgage loan (other than a non-serviced mortgage loan) with respect to which certain defaults, modifications or insolvency events have occurred as further described in the Preliminary Prospectus) plus other amounts overdue or advanced in connection with such mortgage loan exceeds 90% of the appraised value of the related mortgaged property plus certain escrows and reserves (including letters of credit) held with respect to the mortgage loan. With respect to any serviced whole loan, any Appraisal Reduction Amount will be allocated,pro rata, to the related mortgage loan and the relatedpari passu companion loan(s). With respect to any non-serviced mortgage loan, appraisal reduction amounts are expected to be calculated in a similar manner under the related non-serviced pooling and servicing agreement.
A mortgage loan will cease to be a required appraisal loan when the same has ceased to be a specially serviced loan (if applicable), has been brought current for at least three consecutive months and no other circumstances exist that would cause such mortgage loan to be a required appraisal loan.
A “Collateral Deficiency Amount” will exist with respect to any mortgage loan that is modified into an AB loan structure and remains a corrected mortgage loan and will generally equal the excess of (i) the stated principal balance of such AB modified loan (taking into account the related junior note(s) and anypari passu notes included therein), over (ii) the sum of (in the case of a whole loan, solely to the extent allocable to the subject mortgage loan) (x) the most recent appraised value of the related mortgaged property plus (y) solely to the extent not reflected or taken into account in such appraised value and to the extent on deposit with, or otherwise under the control of, the lender as of the date of such determination, any capital or additional collateral contributed by the related borrower at the time the mortgage loan (and as part of the modification thereto) became an AB modified loan plus (z) any other escrows or reserves (in addition to any amounts set forth in the immediately preceding clause (y)) held with respect to the mortgage loan as of the date of such determination.
A “Cumulative Appraisal Reduction Amount” with respect to any mortgage loan will be the sum of any Appraisal Reduction Amount and any Collateral Deficiency Amount.
Appraisal Reduction Amounts will affect the amount of debt service advances in respect of the related mortgage loan. Additionally, Cumulative Appraisal Reduction Amounts will be taken into |
THE INFORMATION IN THIS STRUCTURAL AND COLLATERAL TERM SHEET IS NOT COMPLETE AND MAY BE AMENDED PRIOR TO THE TIME OF SALE. THIS TERM SHEET IS NOT AN OFFER TO SELL THESE SECURITIES AND IT IS NOT A SOLICITATION OF AN OFFER TO BUY THESE SECURITIES IN ANY JURISDICTION WHERE THE OFFER OR SALE IS NOT PERMITTED.
22
| Wells Fargo Commercial Mortgage Trust 2019-C52 | Certain Terms and Conditions |
| account in the determination of the identity of the Class whose majority constitutes the “majority controlling class certificateholder” and is entitled to appoint the directing certificateholder. | |
Clean-Up Call and Exchange Termination:
| On each Distribution Date occurring after the aggregate unpaid principal balance of the pool of mortgage loans is less than 1.0% of the principal balance of the mortgage loans as of the cut-off date (solely for the purposes of this calculation, if such right is being exercised after the distribution date in August 2029 and any of the Moffett Towers II – Buildings 3 & 4 mortgage loan, the Sequa Corporation Industrial Portfolio mortgage loan, the Walgreens Elkton mortgage loan, the Cintas Rochester mortgage loan, the Walgreens Spartanburg mortgage loan or the Dollar General Houghton Lake mortgage loan is still an asset of the issuing entity, then such mortgage loan will be excluded from the then-aggregate stated principal balance of the pool of mortgage loans and from the initial pool balance), certain specified persons will have the option to purchase all of the remaining mortgage loans (and the trust’s interest in all property acquired through exercise of remedies in respect of any mortgage loan) at the price specified in the Preliminary Prospectus. Exercise of the option will terminate the trust and retire the then-outstanding certificates.
If the aggregate Certificate Balances of each of the Class A-1, A-2, A-3, A-SB, A-4, A-5, A-S, B and C Certificates have been reduced to zero, the trust may also be terminated in connection with an exchange of all the then-outstanding certificates (other than the Class V and Class R Certificates) for the mortgage loans and REO properties then remaining in the issuing entity, subject to payment of a price specified in the Preliminary Prospectus, but all of the holders of those outstanding Classes (other than the Class V and Class R Certificates) of certificates would have to voluntarily participate in the exchange. |
| Liquidation Loan Waterfall: | Following the liquidation of any loan or property, the net liquidation proceeds generally will be applied (after reimbursement of advances and certain trust fund expenses), first, as a recovery of accrued interest, other than delinquent interest that was not advanced as a result of Appraisal Reduction Amounts, second, as a recovery of principal until all principal has been recovered, and then as a recovery of delinquent interest that was not advanced as a result of Appraisal Reduction Amounts. Please see “Description of the Certificates—Distributions—Application Priority of Mortgage Loan Collections or Whole Loan Collections” in the Preliminary Prospectus. |
| Control Eligible Certificates: | The Class D-RR, E-RR, F-RR, G-RR and H-RR Certificates. |
| Directing Certificateholder/ Controlling Class: | A directing certificateholder may be appointed by the “majority controlling class certificateholder”, which will be the holder(s) of a majority of the Controlling Class.
The “Controlling Class” will be, as of any time of determination, the most subordinate Class of Control Eligible Certificates then outstanding that has an aggregate Certificate Balance (as notionally reduced by any Cumulative Appraisal Reduction Amounts allocable to such Class(es)) at least equal to 25% of the initial Certificate Balance of that Class;provided,however, that if at any time the Certificate Balances of the certificates other than the Control Eligible Certificates have been reduced to zero as a result of principal payments on the Mortgage Loans, then the Controlling Class will be the most subordinate Class of Control Eligible Certificates that has a Certificate Balance greater than zero without regard to any Cumulative Appraisal Reduction Amounts. The Controlling Class as of the Closing Date will be the Class H-RR Certificates. |
| Control and Consultation: | The rights of various parties to replace the Special Servicer and approve or consult with respect to major actions of the Special Servicer will vary according to defined periods.
A “Control Termination Event” will occur when the Class D-RR Certificates have a Certificate Balance (taking into account the application of any Cumulative Appraisal Reduction Amounts to notionally reduce the Certificate Balance of such Class) of less than 25% of the initial Certificate Balance of that Class;provided,however, that a Control Termination Event will not be deemed continuing in the event that the Certificate Balances of the certificates other than the Control Eligible Certificates have been reduced to zero as a result of principal payments on the Mortgage Loans.
A “Consultation Termination Event” will occur when there is no Class of Control Eligible Certificates that has a then-outstanding Certificate Balance at least equal to 25% of the initial Certificate Balance of that Class, in each case, without regard to the application of any Cumulative Appraisal Reduction Amounts;provided,however, that a Consultation Termination Event will not be deemed continuing in the event that the Certificate Balances of the certificates other than the Control Eligible Certificates have been reduced to zero as a result of principal payments on the Mortgage Loans.
If no Control Termination Event has occurred and is continuing, except with respect to the Excluded Loans (as defined below) and Servicing Shift Whole Loans (as defined below) (i) the directing certificateholder will be entitled to grant or withhold approval of asset status reports prepared, and material servicing actions proposed, by the Special Servicer, and (ii) the directing certificateholder will be entitled to terminate and replace the Special Servicer with or without cause, and appoint itself or another person as the successor special servicer. It will be a condition |
THE INFORMATION IN THIS STRUCTURAL AND COLLATERAL TERM SHEET IS NOT COMPLETE AND MAY BE AMENDED PRIOR TO THE TIME OF SALE. THIS TERM SHEET IS NOT AN OFFER TO SELL THESE SECURITIES AND IT IS NOT A SOLICITATION OF AN OFFER TO BUY THESE SECURITIES IN ANY JURISDICTION WHERE THE OFFER OR SALE IS NOT PERMITTED.
23
| Wells Fargo Commercial Mortgage Trust 2019-C52 | Certain Terms and Conditions |
to such appointment that KBRA, Fitch and Moody’s (and any rating agency rating any securities backed by anypari passu companion loan(s) serviced under this transaction) confirm that the appointment would not result in a qualification, downgrade or withdrawal of any of their then-current ratings of certificates (and any certificates backed by anypari passu companion loan(s) serviced under this transaction).
If a Control Termination Event has occurred and is continuing but no Consultation Termination Event has occurred and is continuing, the Special Servicer will be required to consult with the directing certificateholder (other than with respect to Excluded Loans) in connection with asset status reports and material special servicing actions.
If a Consultation Termination Event has occurred and is continuing, no directing certificateholder will be recognized or have any right to terminate the Special Servicer or approve, direct or consult with respect to servicing matters.
With respect to each serviced whole loan that is not a Servicing Shift Whole Loan, the rights of the directing certificateholder described above will be subject to the consultation rights of the holders of the related pari passu companion loans. Those consultation rights will generally extend to asset status reports and material special servicing actions involving the related whole loan, will be as set forth in the related intercreditor agreement, and will be in addition to the rights of the directing certificateholder in this transaction described above.
With respect to each whole loan marked with footnote (4) under “IV. Characteristics of the Mortgage Pool—B. Summary of the Whole Loans” (each, a “Servicing Shift Whole Loan”), prior to the date of securitization of the related controlling pari passu companion loan (such date, a “Servicing Shift Securitization Date”), the holder of the related controlling pari passu companion loan will have certain control rights regarding the servicing of the related whole loan under the WFCM 2019-C52 pooling and servicing agreement, including the right to approve or disapprove various material servicing actions involving the related whole loan. For purposes of the servicing of any such whole loan contemplated by this paragraph, the occurrence and continuance of a Control Termination Event or Consultation Termination Event under this securitization will not limit the control or other rights of the holder of the related controllingpari passu companion loan(s).
With respect to (x) each non-serviced whole loan, and (y) each Servicing Shift Whole Loan after its Servicing Shift Securitization Date, the applicable servicing agreement for the related controllingpari passu companion loan(s) generally grants (or will grant) the directing certificateholder under the related securitization control rights that may include the right to approve or disapprove various material servicing actions involving the related whole loan. The directing certificateholder for this securitization (so long as no Consultation Termination Event has occurred and is occurring) generally will nonetheless have the right to be consulted on a non-binding basis with respect to such actions. For purposes of the servicing of any such whole loan contemplated by this paragraph, the occurrence and continuance of a Control Termination Event or Consultation Termination Event under this securitization will not limit the control or other rights of the directing certificateholder (or equivalent) under the securitization of the related controllingpari passu companion loan(s).
The control rights and consent and consultation rights described in the preceding paragraphs are subject to various limitations, conditions and exceptions as described in the Preliminary Prospectus.
Notwithstanding any contrary description set forth above, in the event that, with respect to any mortgage loan, the majority controlling class certificateholder or the directing certificateholder is a Borrower Party, the majority controlling class certificateholder and the directing certificateholder will have no right to receive asset status reports or such other information as may be specified in the WFCM 2019-C52 pooling and servicing agreement, or to grant or withhold approval of, or consult with respect to, asset status reports prepared, and material servicing actions proposed, by the Special Servicer, with respect to such mortgage loan, and such mortgage loan will be referred to as an “Excluded Loan” as to such party.
In addition, notwithstanding any contrary description set forth above, in the event that, with respect to any mortgage loan, a controlling class certificateholder is a Borrower Party, such controlling class certificateholder will have no right to receive asset status reports or such other information as may be specified in the WFCM 2019-C52 pooling and servicing agreement with respect to such mortgage loan.
“Borrower Party” means a borrower, a mortgagor or a manager of a mortgaged property, an Accelerated Mezzanine Loan Lender, or any Borrower Party Affiliate. “Accelerated Mezzanine Loan Lender” means a mezzanine lender under a mezzanine loan that has been accelerated or as to which foreclosure or enforcement proceedings have been commenced against the equity collateral pledged to secure such mezzanine loan. “Borrower Party Affiliate” means, with respect |
THE INFORMATION IN THIS STRUCTURAL AND COLLATERAL TERM SHEET IS NOT COMPLETE AND MAY BE AMENDED PRIOR TO THE TIME OF SALE. THIS TERM SHEET IS NOT AN OFFER TO SELL THESE SECURITIES AND IT IS NOT A SOLICITATION OF AN OFFER TO BUY THESE SECURITIES IN ANY JURISDICTION WHERE THE OFFER OR SALE IS NOT PERMITTED.
24
| Wells Fargo Commercial Mortgage Trust 2019-C52 | Certain Terms and Conditions |
| to a borrower, a mortgagor, a manager of a Mortgaged Property or an Accelerated Mezzanine Loan Lender, (x) any other person controlling or controlled by or under common control with such borrower, mortgagor, manager or Accelerated Mezzanine Loan Lender, as applicable, or (y) any other person owning, directly or indirectly, 25% or more of the beneficial interests in such borrower, mortgagor, manager or Accelerated Mezzanine Loan Lender. | |
| Replacement of Special Servicer: | If a Control Termination Event has occurred and is continuing, the Special Servicer (other than with respect to a Servicing Shift Whole Loan) may be removed and replaced without cause upon the affirmative direction of certificate owners holding not less than 66-2/3% of a certificateholder quorum, following a proposal from certificate owners holding not less than 25% of the appraisal-reduced voting rights of all Certificates. The certificateholders who initiate a vote on a termination and replacement of the Special Servicer without cause must cause KBRA, Fitch and Moody’s to confirm the then-current ratings of the certificates (or decline to review the matter) and cause the payment of the fees and expenses incurred in the replacement. If no Control Termination Event has occurred and is continuing, the Special Servicer (other than with respect to a Servicing Shift Whole Loan) may be replaced by the directing certificateholder, subject to KBRA, Fitch and Moody’s (and any Rating Agency rating any securities backed by anypari passu companion loan(s) serviced under this transaction) confirming the then-current ratings of the Certificates (and any certificates backed by anyparipassu companion loans serviced under this transaction) or declining to review the matter.
In addition, if at any time the Operating Advisor determines, in its sole discretion exercised in good faith, that (i) the Special Servicer is not performing its duties as required under the pooling and servicing agreement in accordance with the Servicing Standard and (ii) the replacement of the Special Servicer would be in the best interest of the certificateholders as a collective whole, then, the Operating Advisor will have the right to recommend the replacement of the Special Servicer and will submit its formal recommendation to the Trustee and the Certificate Administrator (along with its rationale, its proposed replacement special servicer and other relevant information justifying its recommendation).
The Operating Advisor’s recommendation to replace the Special Servicer must be confirmed by an affirmative vote of holders of Principal Balance Certificates evidencing at least a majority of a quorum of certificateholders (which, for this purpose, is the holders of Principal Balance Certificates that (i) evidence at least 20% of the Voting Rights (taking into account the application of any cumulative appraisal reduction amounts to notionally reduce the respective Certificate Balances) of all Principal Balance Certificates on an aggregate basis, and (ii) consist of at least three certificateholders or certificate owners that are not risk retention affiliated with each other). In the event the holders of Principal Balance Certificates evidencing at least a majority of a quorum of certificateholders elect to remove and replace the Special Servicer (which requisite affirmative votes must be received within 180 days of the posting of the notice of the Operating Advisor’s recommendation to replace the Special Servicer to the Certificate Administrator’s website), the Certificate Administrator will be required to receive a Rating Agency Confirmation from each of the Rating Agencies at that time. |
| Excluded Special Servicer: | In the event that, with respect to any mortgage loan, the Special Servicer is a Borrower Party, the Special Servicer will be required to resign as special servicer of such mortgage loan (referred to as an “excluded special servicer loan”). If no Control Termination Event has occurred and is continuing, the directing certificateholder will be entitled to appoint (and may replace with or without cause) a separate special servicer that is not a Borrower Party (referred to as an “excluded special servicer”) with respect to such excluded special servicer loan unless such excluded special servicer loan is also an excluded loan. Otherwise, upon resignation of the Special Servicer with respect to an excluded special servicer loan, the resigning Special Servicer will be required to appoint the excluded special servicer. |
| Appraisal Remedy: | If the Class of Certificates comprising the Controlling Class loses its status as Controlling Class because of the application of an Appraisal Reduction Amount or Collateral Deficiency Amount, the holders of a majority of the voting rights of such Class may require the Special Servicer to order a second appraisal for any mortgage loan in respect of which an Appraisal Reduction Amount or Collateral Deficiency Amount has been applied. The Special Servicer must thereafter determine whether, based on its assessment of such second appraisal, any recalculation of the Appraisal Reduction Amount or Collateral Deficiency Amount is warranted. Such Class will not be able to exercise any direction, control, consent and/or similar rights of the Controlling Class unless and until reinstated as the Controlling Class through such determination; and pending such determination, the rights of the Controlling Class will be exercised by the Control Eligible Certificates, if any, that would be the Controlling Class taking into account the subject appraisal reduction amount. |
THE INFORMATION IN THIS STRUCTURAL AND COLLATERAL TERM SHEET IS NOT COMPLETE AND MAY BE AMENDED PRIOR TO THE TIME OF SALE. THIS TERM SHEET IS NOT AN OFFER TO SELL THESE SECURITIES AND IT IS NOT A SOLICITATION OF AN OFFER TO BUY THESE SECURITIES IN ANY JURISDICTION WHERE THE OFFER OR SALE IS NOT PERMITTED.
25
| Wells Fargo Commercial Mortgage Trust 2019-C52 | Certain Terms and Conditions |
| Sale of Defaulted Assets: | There will be no “fair value” purchase option. Instead, the WFCM 2019-C52 pooling and servicing agreement will authorize the Special Servicer to sell defaulted mortgage loans serviced by such Special Servicer to the highest bidder in a manner generally similar to sales of REO properties.
The sale of a defaulted loan (other than a non-serviced whole loan) for less than par plus accrued interest and certain other fees and expenses owed on the loan will be subject to consent or consultation rights of the directing certificateholder and/or Operating Advisor, as described in the Preliminary Prospectus. Generally speaking, the holder of apari passu companion loan will have consent and/or consultation rights, as described in the Preliminary Prospectus.
With respect to (x) any serviced whole loan and (y) any Servicing Shift Whole Loan prior to its Servicing Shift Securitization Date, if such whole loan becomes a defaulted loan under the WFCM 2019-C52 pooling and servicing agreement, the Special Servicer will generally be required to sell both the mortgage loan and the related pari passu companion loan(s) as a single whole loan.
With respect to (x) each non-serviced whole loan and (y) each Servicing Shift Whole Loan after its related Servicing Shift Securitization Date, the applicable servicing agreement governing the servicing of such whole loan generally provides (or is expected to provide) that, if the relatedpari passu companion loan(s) serviced under such agreement become a defaulted loan under such servicing agreement, then the related special servicer may offer to sell to any person (or may offer to purchase) for cash such whole loan during such time as such applicablepari passucompanion loan(s) constitutes a defaulted loan under such servicing agreement. Generally speaking, in connection with any such sale, the related special servicer is required to sell both the mortgage loan and the related pari passu companion loan(s) as a whole loan. The directing certificateholder for this securitization generally will have consent and/or consultation rights as the holder of an interest in the related mortgage loan, as described in the Preliminary Prospectus.
The procedures for the sale of any whole loan that becomes a defaulted whole loan, and any associated consultation rights, are subject to various limitations, conditions and exceptions as described in the Preliminary Prospectus. |
| “As-Is” Appraisals: | Appraisals must be conducted on an “as-is” basis, and must be no more than 12 months old, for purposes of determining Appraisal Reduction Amounts and market value in connection with REO sales. Required appraisals may consist of updates of prior appraisals. Internal valuations by the Special Servicer are permitted if the principal balance of a mortgage loan is less than $2,000,000. |
THE INFORMATION IN THIS STRUCTURAL AND COLLATERAL TERM SHEET IS NOT COMPLETE AND MAY BE AMENDED PRIOR TO THE TIME OF SALE. THIS TERM SHEET IS NOT AN OFFER TO SELL THESE SECURITIES AND IT IS NOT A SOLICITATION OF AN OFFER TO BUY THESE SECURITIES IN ANY JURISDICTION WHERE THE OFFER OR SALE IS NOT PERMITTED.
26
| Wells Fargo Commercial Mortgage Trust 2019-C52 | Certain Terms and Conditions |
| Operating Advisor: | The Operating Advisor will have certain review and consultation rights relating to the performance of the Special Servicer and with respect to its actions taken in connection with the resolution and/or liquidation of Specially Serviced Loans. With respect to each mortgage loan (other than a Non-Serviced Mortgage Loan) or serviced whole loan, the Operating Advisor will be responsible for:
● reviewing the actions of the Special Servicer with respect to any Specially Serviced Loan;
● reviewing (i) all reports by the Special Servicer made available to Privileged Persons on the Certificate Administrator’s website and (ii) each Asset Status Report (as defined in the Preliminary Prospectus) (after the occurrence and during the continuance of an Operating Advisor Consultation Event (as defined below)) and Final Asset Status Report (as defined in the Preliminary Prospectus);
● recalculating and reviewing for accuracy and consistency with the WFCM 2019-C52 pooling and servicing agreement the mathematical calculations by the special servicer and the corresponding application of the non-discretionary portion of the applicable formulas required to be utilized in connection with Appraisal Reduction Amounts, Collateral Deficiency Amounts and net present value calculations used in the Special Servicer’s determination of what course of action to take in connection with the workout or liquidation of a Specially Serviced Loan; and
● preparing an annual report (if any mortgage loan (other than any Non-Serviced Mortgage Loan) or serviced whole loan was a Specially Serviced Loan at any time during the prior calendar year or an Operating Advisor Consultation Event (as defined below) occurred during the prior calendar year) that sets forth whether the Operating Advisor believes, in its sole discretion exercised in good faith, that the Special Servicer is operating in compliance with the Servicing Standard with respect to its performance of its duties under the pooling and servicing agreement with respect to Specially Serviced Loans (and, after the occurrence and continuance of an Operating Advisor Consultation Event (as defined below), with respect to major decisions on non-Specially Serviced Loans) during the prior calendar year on a “trust-level basis”. The Operating Advisor will identify (1) which, if any, standards the Operating Advisor believes, in its sole discretion exercised in good faith, the Special Servicer has failed to comply with and (2) any material deviations from the Special Servicer’s obligations under the pooling and servicing agreement with respect to the resolution or liquidation of any Specially Serviced Loan or REO Property (other than with respect to any REO Property related to any Non-Serviced Mortgage Loan). In preparing any Operating Advisor Annual Report (as defined in the Preliminary Prospectus), the Operating Advisor will not be required to report on instances of non-compliance with, or deviations from, the Servicing Standard or the Special Servicer’s obligations under the pooling and servicing agreement that the Operating Advisor determines, in its sole discretion exercised in good faith, to be immaterial.
With respect to each mortgage loan (other than any Non-Serviced Mortgage Loan) or serviced whole loan, after the Operating Advisor has received notice that an Operating Advisor Consultation Event (as defined below) has occurred and is continuing, in addition to the duties described above, the Operating Advisor will be required to perform the following additional duties:
● to consult (on a non-binding basis) with the Special Servicer in respect of asset status reports and
● to consult (on a non-binding basis) with the Special Servicer with respect to “major decisions” processed by the Special Servicer.
An “Operating Advisor Consultation Event” will occur when the Certificate Balances of the Class D-RR, E-RR, F-RR, G-RR and H-RR Certificates in the aggregate (taking into account the application of any Cumulative Appraisal Reduction Amounts to notionally reduce the Certificate Balances of such Classes) is 25% or less of the initial Certificate Balances of such Classes in the aggregate. |
| Asset Representations Reviewer: | The Asset Representations Reviewer will be required to review certain delinquent mortgage loans after a specified delinquency threshold has been exceeded (an “Asset Review Trigger”) and the required percentage of certificateholders vote to direct a review of such delinquent loans. An Asset Review Trigger will occur when either (1) mortgage loans with an aggregate outstanding principal balance of 25.0% or more of the aggregate outstanding principal balance of all of the mortgage loans (including any REO loans (or a portion of any REO loan in the case of a whole loan)) held by the issuing entity as of the end of the applicable collection period are delinquent loans or (2) at least 15 mortgage loans are delinquent loans as of the end of the applicable collection period and the outstanding principal balance of such delinquent loans in the aggregate |
THE INFORMATION IN THIS STRUCTURAL AND COLLATERAL TERM SHEET IS NOT COMPLETE AND MAY BE AMENDED PRIOR TO THE TIME OF SALE. THIS TERM SHEET IS NOT AN OFFER TO SELL THESE SECURITIES AND IT IS NOT A SOLICITATION OF AN OFFER TO BUY THESE SECURITIES IN ANY JURISDICTION WHERE THE OFFER OR SALE IS NOT PERMITTED.
27
| Wells Fargo Commercial Mortgage Trust 2019-C52 | Certain Terms and Conditions |
constitutes at least 20.0% of the aggregate outstanding principal balance of all of the mortgage loans (including any REO loans (or a portion of any REO loan in the case of a whole loan)) held by the issuing entity as of the end of the applicable collection period. See “Pooling and Servicing Agreement—The Asset Representations Reviewer—Asset Review” in the Preliminary Prospectus.
The Asset Representations Reviewer may be terminated and replaced without cause. Upon (i) the written direction of certificateholders evidencing not less than 25% of the voting rights (without regard to the application of any Cumulative Appraisal Reduction Amounts) requesting a vote to terminate and replace the Asset Representations Reviewer with a proposed successor Asset Representations Reviewer that is an eligible asset representations reviewer, and (ii) payment by such holders to the certificate administrator of the reasonable fees and expenses to be incurred by the certificate administrator in connection with administering such vote, the certificate administrator will promptly provide notice to all certificateholders and the Asset Representations Reviewer of such request by posting such notice on its internet website, and by mailing such notice to all certificateholders and the Asset Representations Reviewer. Upon the written direction of certificateholders evidencing at least 75% of a certificateholder quorum (without regard to the application of any Cumulative Appraisal Reduction Amounts), the Trustee will terminate all of the rights and obligations of the Asset Representations Reviewer under the WFCM 2019-C52 pooling and servicing agreement by written notice to the Asset Representations Reviewer, and the proposed successor Asset Representations Reviewer will be appointed. See “Pooling and Servicing Agreement—The Asset Representations Reviewer” in the Preliminary Prospectus. | |
| Dispute Resolution Provisions: | The mortgage loan sellers will be subject to the dispute resolution provisions set forth in the WFCM 2019-C52 pooling and servicing agreement to the extent those provisions are triggered with respect to any mortgage loan sold to the depositor by a mortgage loan seller and such mortgage loan seller will be obligated under the related mortgage loan purchase agreement to comply with all applicable provisions and to take part in any mediation or arbitration proceedings that may result.
Generally, in the event that a Repurchase Request (as defined in the Preliminary Prospectus) is not “Resolved” (as defined below) within 180 days after the related mortgage loan seller receives such Repurchase Request, then the enforcing servicer will be required to send a notice to the “Initial Requesting Certificateholder” (if any) and the Certificate Administrator indicating the enforcing servicer’s intended course of action with respect to the Repurchase Request. If (a) the enforcing servicer’s intended course of action with respect to the Repurchase Request does not involve pursuing further action to exercise rights against the related mortgage loan seller with respect to the Repurchase Request and the Initial Requesting Certificateholder, if any, or any other certificateholder or certificate owner wishes to exercise its right to refer the matter to mediation (including non-binding arbitration) or arbitration, or (b) the enforcing servicer’s intended course of action is to pursue further action to exercise rights against the related mortgage loan seller with respect to the Repurchase Request but the Initial Requesting Certificateholder, if any, or any other certificateholder or certificate owner does not agree with the dispute resolution method selected by the enforcing servicer, then the Initial Requesting Certificateholder, if any, or such other certificateholder or certificate owner may deliver a written notice to the Special Servicer indicating its intent to exercise its right to refer the matter to either mediation or arbitration.
“Resolved” means, with respect to a Repurchase Request, (i) that the related Material Defect has been cured, (ii) the related mortgage loan has been repurchased in accordance with the related mortgage loan purchase agreement, (iii) a mortgage loan has been substituted for the related mortgage loan in accordance with the related mortgage loan purchase agreement, (iv) the applicable mortgage loan seller has made a Loss of Value Payment (as defined in the Preliminary Prospectus), (v) a contractually binding agreement is entered into between the enforcing servicer, on behalf of the issuing entity, and the related mortgage loan seller that settles the related mortgage loan seller’s obligations under the related mortgage loan purchase agreement or (vi) the related mortgage loan is no longer property of the issuing entity as a result of a sale or other disposition in accordance with the WFCM 2019-C52 pooling and servicing agreement. See “Pooling and Servicing Agreement—Dispute Resolution Provisions” in the Preliminary Prospectus.
|
| Investor Communications: | The certificate administrator is required to include on any Form 10–D any request received from a certificateholder to communicate with other certificateholders related to certificateholders exercising their rights under the terms of the WFCM 2019-C52 pooling and servicing agreement. Any certificateholder wishing to communicate with other certificateholders regarding the exercise of its rights under the terms of the WFCM 2019-C52 pooling and servicing agreement will be able to deliver a written request signed by an authorized representative of the requesting investor to the certificate administrator. |
THE INFORMATION IN THIS STRUCTURAL AND COLLATERAL TERM SHEET IS NOT COMPLETE AND MAY BE AMENDED PRIOR TO THE TIME OF SALE. THIS TERM SHEET IS NOT AN OFFER TO SELL THESE SECURITIES AND IT IS NOT A SOLICITATION OF AN OFFER TO BUY THESE SECURITIES IN ANY JURISDICTION WHERE THE OFFER OR SALE IS NOT PERMITTED.
28
| Wells Fargo Commercial Mortgage Trust 2019-C52 | Certain Terms and Conditions |
| Certain Fee Offsets: | If a workout fee is earned by the Special Servicer following a loan default with respect to any mortgage loan that it services, then certain limitations will apply based on modification fees paid by the borrower. The modification fee generally must not exceed 1% of the principal balance of the loan as modified in any 12-month period. In addition, if the loan re-defaults, any subsequent workout fee on that loan must be reduced by a portion of the modification fees paid by the borrower in the previous 12-months. Likewise, liquidation fees collected in connection with a liquidation or partial liquidation of a mortgage loan must be reduced by a portion of the modification fees paid by the borrower in the previous 12 months. |
| Deal Website: | The Certificate Administrator will be required to maintain a deal website, which will include, among other items: (a) summaries of asset status reports prepared by the Special Servicer, (b) inspection reports, (c) appraisals, (d) various “special notices” described in the Preliminary Prospectus, (e) the “Investor Q&A Forum”, (f) a voluntary “Investor Registry” and (g) the “Risk Retention Special Notices” tab. Investors may access the deal website following execution of a certification and confidentiality agreement. |
| Initial Majority Controlling Class Certificateholder: | It is expected that Argentic Securities Holdings Cayman Limited or an affiliate will be the initial majority controlling class certificateholder. |
| Whole Loans: | Each of the mortgaged properties identified above under “IV. Characteristics of the Mortgage Pool—B. Summary of the Whole Loans” secures both a mortgage loan to be included in the trust fund and one or more other mortgage loans that will not be included in the trust fund, each of which will bepari passu or subordinate in right of payment with the mortgage loan included in the trust fund. We refer to each such group of mortgage loans as a “whole loan”. Such “—Summary of the Whole Loans” section includes further information regarding the various notes in each whole loan, the holders of such notes, the lead servicing agreement for each such whole loan, and the master servicer and special servicer under such lead servicing agreement. |
THE INFORMATION IN THIS STRUCTURAL AND COLLATERAL TERM SHEET IS NOT COMPLETE AND MAY BE AMENDED PRIOR TO THE TIME OF SALE. THIS TERM SHEET IS NOT AN OFFER TO SELL THESE SECURITIES AND IT IS NOT A SOLICITATION OF AN OFFER TO BUY THESE SECURITIES IN ANY JURISDICTION WHERE THE OFFER OR SALE IS NOT PERMITTED.
29
| Office - Suburban | Loan #1 | Cut-off Date Balance: | $49,750,000 | |
| 1190 Discovery Way & 900 5th Avenue | Moffett Towers II – Buildings 3 & 4 | Cut-off Date LTV: | 44.3% | |
| Sunnyvale, CA 94089 | U/W NCF DSCR: | 3.45x | ||
| U/W NOI Debt Yield: | 13.2% |
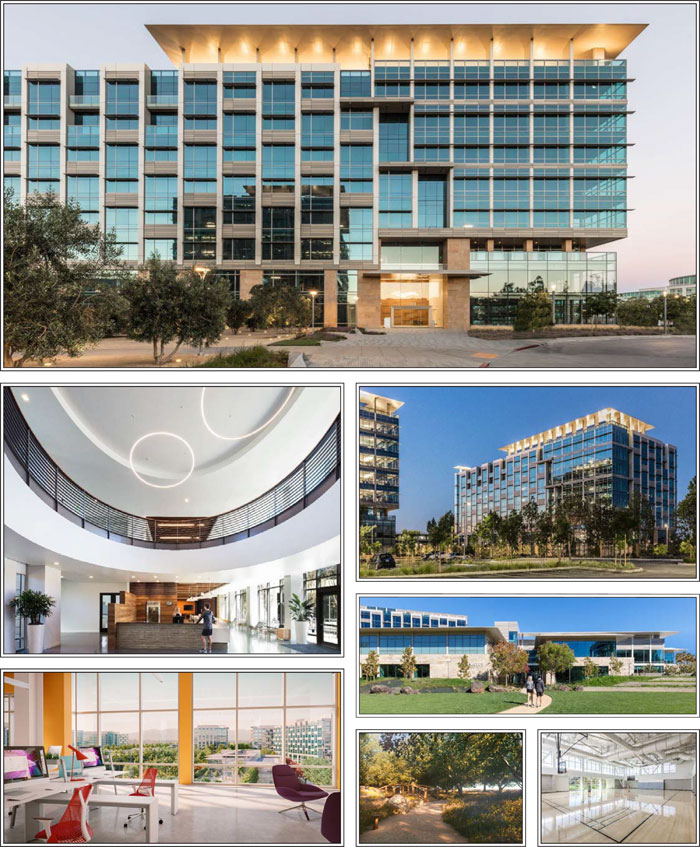
THE INFORMATION IN THIS STRUCTURAL AND COLLATERAL TERM SHEET IS NOT COMPLETE AND MAY BE AMENDED PRIOR TO THE TIME OF SALE. THIS TERM SHEET IS NOT AN OFFER TO SELL THESE SECURITIES AND IT IS NOT A SOLICITATION OF AN OFFER TO BUY THESE SECURITIES IN ANY JURISDICTION WHERE THE OFFER OR SALE IS NOT PERMITTED.
30
| Office - Suburban | Loan #1 | Cut-off Date Balance: | $49,750,000 | |
| 1190 Discovery Way & 900 5th Avenue | Moffett Towers II – Buildings 3 & 4 | Cut-off Date LTV: | 44.3% | |
| Sunnyvale, CA 94089 | U/W NCF DSCR: | 3.45x | ||
| U/W NOI Debt Yield: | 13.2% |
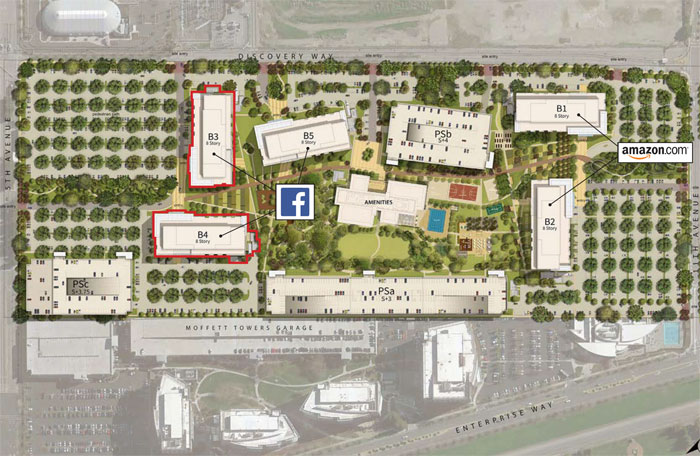
THE INFORMATION IN THIS STRUCTURAL AND COLLATERAL TERM SHEET IS NOT COMPLETE AND MAY BE AMENDED PRIOR TO THE TIME OF SALE. THIS TERM SHEET IS NOT AN OFFER TO SELL THESE SECURITIES AND IT IS NOT A SOLICITATION OF AN OFFER TO BUY THESE SECURITIES IN ANY JURISDICTION WHERE THE OFFER OR SALE IS NOT PERMITTED.
31
| Office - Suburban | Loan #1 | Cut-off Date Balance: | $49,750,000 | |
| 1190 Discovery Way & 900 5th Avenue | Moffett Towers II – Buildings 3 & 4 | Cut-off Date LTV: | 44.3% | |
| Sunnyvale, CA 94089 | U/W NCF DSCR: | 3.45x | ||
| U/W NOI Debt Yield: | 13.2% |
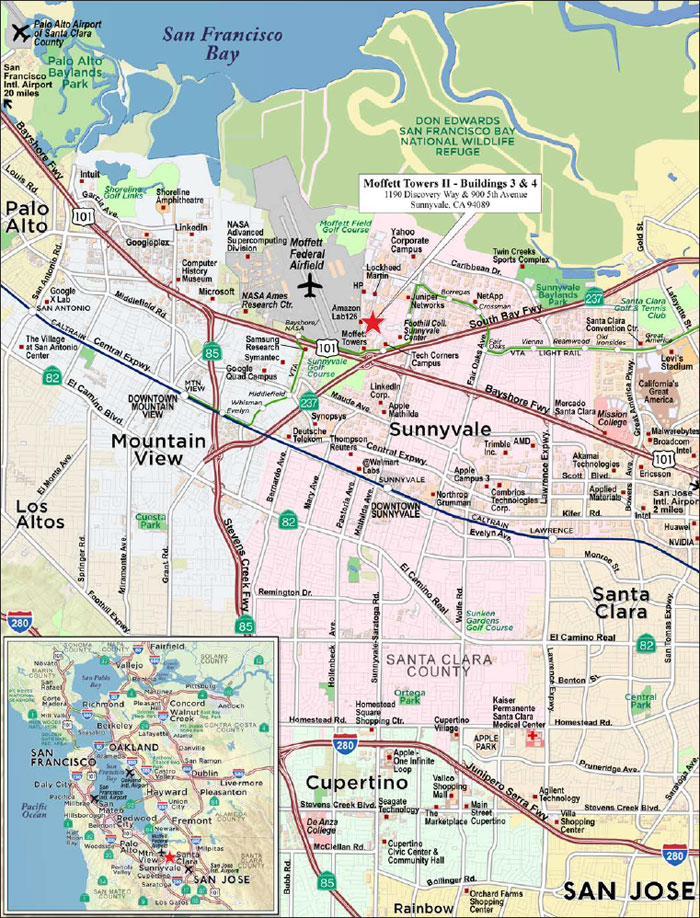
THE INFORMATION IN THIS STRUCTURAL AND COLLATERAL TERM SHEET IS NOT COMPLETE AND MAY BE AMENDED PRIOR TO THE TIME OF SALE. THIS TERM SHEET IS NOT AN OFFER TO SELL THESE SECURITIES AND IT IS NOT A SOLICITATION OF AN OFFER TO BUY THESE SECURITIES IN ANY JURISDICTION WHERE THE OFFER OR SALE IS NOT PERMITTED.
32
| No. 1 – Moffett Towers II – Buildings 3 & 4 | ||||||
| Mortgage Loan Information | Mortgaged Property Information | |||||
| Mortgage Loan Seller: | Barclays Capital Real Estate Inc. | Single Asset/Portfolio: | Single Asset | |||
Credit Assessment (KBRA/Fitch/Moody’s): | BBB/BBB-sf/NR | Property Type – Subtype: | Office – Suburban | |||
| Original Principal Balance(1): | $49,750,000 | Location: | Sunnyvale, CA | |||
| Cut-off Date Balance(1): | $49,750,000 | Size: | 701,266 SF | |||
| % of Initial Pool Balance: | 5.5% | Cut-off Date Balance Per SF(1): | $499.10 | |||
| Loan Purpose: | Refinance | Maturity Date Balance Per SF(1): | $499.10 | |||
| Borrower Sponsor: | Jay Paul Company | Year Built/Renovated: | 2019/NAP | |||
| Guarantor: | Paul Guarantor LLC | Title Vesting: | Fee | |||
| Mortgage Rate: | 3.76386% | Property Manager: | Self-managed | |||
| Note Date: | June 19, 2019 | Current Occupancy (As of): | 100.0% (8/1/2019) | |||
| Seasoning: | 1 month | YE 2018 Occupancy(6): | NAP | |||
| Anticipated Repayment Date(2): | July 6, 2029 | YE 2017 Occupancy(6): | NAP | |||
| Final Maturity Date(2): | June 6, 2034 | YE 2016 Occupancy(6): | NAP | |||
| IO Period: | 120 months | YE 2015 Occupancy(6): | NAP | |||
| Loan Term (Original): | 120 months | Appraised Value(7): | $790,000,000 | |||
| Amortization Term (Original): | NAP | Appraised Value Per SF(7): | $1,126.53 | |||
| Loan Amortization Type: | Interest-only, ARD | Appraisal Valuation Date(7): | Various | |||
| Call Protection(3): | L(24),GRTR 1% or YM(1), GRTR 1% or YM or D(88),O(7) | |||||
| Lockbox Type: | Hard/Upfront Cash Management | Underwriting and Financial Information | ||||
| Additional Debt(1): | Yes | TTM NOI(6): | NAP | |||
| Additional Debt Type (Balance)(1): | Pari Passu($300,250,000); Subordinate B-Notes ($155,000,000); Mezzanine Debt ($85,000,000) | YE 2018 NOI(6): | NAP | |||
| YE 2017 NOI(6): | NAP | |||||
| YE 2016 NOI(6): | NAP | |||||
| U/W Revenues: | $57,629,637 | |||||
| U/W Expenses: | $11,259,997 | |||||
| Escrows and Reserves(4) | U/W NOI: | $46,369,641 | ||||
| Initial | Monthly | Cap | U/W NCF: | $46,224,616 | ||
| Taxes | $525,523 | $87,587 | NAP | U/W DSCR based on NOI/NCF(1): | 3.46x / 3.45x | |
| Insurance | $0 | Springing | NAP | U/W Debt Yield based on NOI/NCF(1): | 13.2% / 13.2% | |
| Replacement Reserve | $0 | Springing | NAP | U/W Debt Yield at Maturity based on NOI/NCF(1): | 13.2% / 13.2% | |
| Free Rent Reserve | $16,127,329 | $0 | NAP | Cut-off Date LTV Ratio(1): | 44.3% | |
| Outstanding TI/LC Reserve | $23,165,933 | $0 | NAP | LTV Ratio at Maturity or ARD(1): | 44.3% | |
| Lease Sweep Reserve | $0 | Springing | (5) | |||
| Sources and Uses | |||||||
| Sources | Uses | ||||||
| Original whole loan amount(1) | $505,000,000 | 85.6% | Loan payoff(8) | $408,943,870 | 69.3 | % | |
| Mezzanine loan | 85,000,000 | 14.4 | Upfront reserves | 39,818,785 | 6.7 | ||
| Closing costs(9) | 26,972,612 | 4.6 | |||||
| Return of equity | 114,264,733 | 19.4 | |||||
| Total Sources | $590,000,000 | 100.0% | Total Uses | $590,000,000 | 100.0 | % | |
| (1) | The Moffett Towers II – Buildings 3 & 4 Mortgage Loan (as defined below) is part of the Moffett Towers II – Buildings 3 & 4 Whole Loan (as defined below), which is evidenced by (i) elevenpari passunotes with an aggregate original balance of $350,000,000 (the “Moffett Towers II – Buildings 3 & 4 Senior Loan”) and (ii) three subordinate B-notes with an aggregate original principal balance of $155,000,000 (the “Moffett Towers II – Buildings 3 & 4 B Notes”). The Cut-off Date Balance Per SF, Maturity Date Balance Per SF, U/W NOI Debt Yield, U/W NCF Debt Yield, U/W NOI DSCR, U/W NCF DSCR, Cut-off Date LTV Ratio and LTV Ratio at Maturity or ARD numbers presented above are based on the aggregate principal balance of the promissory notes comprising the Moffett Towers II – Buildings 3 & 4 Senior Loan, without regard to the Moffett Towers II – Buildings 3 & 4 B Notes. The Cut-off Date Balance Per SF, Maturity or ARD Date Balance Per SF, U/W Debt Yield based on NOI/NCF, U/W DSCR based on NOI/NCF, Cut-off Date LTV Ratio and LTV Ratio at Maturity or ARD numbers presented above based on the combined balance of the entire Moffett Towers – Buildings 3 & 4 Whole Loan are $720, $720, 9.2%, 9.2%, 2.40x, 2.39x, 63.9% and 63.9%, respectively. |
| (2) | The Moffett Towers II – Buildings 3 & 4 Whole Loan is structured with an anticipated repayment date of July 6, 2029 (the “ARD”). If the Moffett Towers II – Buildings 3 & 4 Whole Loan is not paid off before the ARD, then the Moffett Towers II – Buildings 3 & 4 Whole Loan will accrue interest at the Adjusted Interest Rate (as defined below); however, interest accrued at the excess of the Adjusted Interest Rate over the initial interest rate will be deferred. In addition, from and after the ARD, all excess cash flow from the Moffett Towers II – Buildings 3 & 4 Property after the payment of the reserves for tax and insurance, and mortgage and mezzanine interest calculated at the initial interest rate will be applied (i) first, to repay the outstanding principal balance of the Moffett Towers II – Buildings 3 & 4 Senior Loan, in the amount required to fully amortize (based on a 30-year amortization schedule) the outstanding principal balance of the entire Moffett Towers II – Buildings 3 & 4 Whole Loan, (ii) second, if the Moffett Towers II – Buildings 3 & 4 Senior Loan has been repaid in full, to repay the outstanding principal balance of the Moffett Towers II – Buildings 3 & 4 B Notes, in the amount required |
THE INFORMATION IN THIS STRUCTURAL AND COLLATERAL TERM SHEET IS NOT COMPLETE AND MAY BE AMENDED PRIOR TO THE TIME OF SALE. THIS TERM SHEET IS NOT AN OFFER TO SELL THESE SECURITIES AND IT IS NOT A SOLICITATION OF AN OFFER TO BUY THESE SECURITIES IN ANY JURISDICTION WHERE THE OFFER OR SALE IS NOT PERMITTED.
33
| Office - Suburban | Loan #1 | Cut-off Date Balance: | $49,750,000 | |
| 1190 Discovery Way & 900 5th Avenue | Moffett Towers II – Buildings 3 & 4 | Cut-off Date LTV: | 44.3% | |
| Sunnyvale, CA 94089 | U/W NCF DSCR: | 3.45x | ||
| U/W NOI Debt Yield: | 13.2% |
| to fully amortize (based on a 30-year amortization schedule) the outstanding principal balance of the Moffett Towers II – Buildings 3 & 4 B Notes, (iii) third, if the lender elects, to make reserve payments for capital expenditures, (iv) fourth, to pay operating costs, (v) fifth, to repay the outstanding principal balance of the Moffett Towers II – Buildings 3 & 4 Senior Loan until the entire outstanding principal balance is paid, (vi) sixth, to repay the outstanding principal balance of the Moffett Towers II – Buildings 3 & 4 B Notes until the entire outstanding principal balance is paid, (vii) seventh, to the payment of accrued interest under the Moffett Towers II – Buildings 3 & 4 Senior Loan and (viii) eighth, to the payment of accrued interest under the Moffett Towers II – Buildings 3 & 4 B Notes. The final maturity date of the Moffett Towers II – Buildings 3 & 4 Whole Loan is June 6, 2034. |
| (3) | Defeasance of the Moffett Towers II – Buildings 3 & 4 Whole Loan is permitted at any time after the earlier of (i) two years after the closing date that includes the last note to be securitized or (ii) June 19, 2022. The assumed defeasance lockout period of 25 payments is based on the WFCM 2019-C52 securitization trust closing date of August 2019. |
| (4) | See “Escrows” section. |
| (5) | See “Lockbox and Cash Management” section. |
| (6) | Historical occupancy and historical NOI are unavailable for the Moffett Towers II – Buildings 3 & 4 Property since it was built in 2019. |
| (7) | See “Appraisal” section. The appraised value is a prospective market value that assumes that any remaining construction costs have been paid and Facebook, the sole tenant, has taken occupancy, completed construction and commenced rental payments (expected January 1, 2020 for Building 3 and December 1, 2019 for Building 4, pursuant to its leases). The borrower reserved $23,165,933 for remaining construction costs and $16,127,329 representing 100% of the free rent. Facebook has taken possession of its space and is currently constructing its interior improvements. The as-is appraised value is $726.0 million as of May 3, 2019 and is inclusive of deductions for rent concessions and outstanding tenant improvements and leasing commissions, equating to a Cut-off Date LTV Ratio and LTV Ratio at Maturity or ARD of 48.2%. |
| (8) | In May 2018, Goldman Sachs Bank USA (“GS Bank”) funded a $795.0 million loan to an affiliate of the borrower to construct the Moffett Towers II – Buildings 3 & 4 Property. GS Bank subsequently syndicated $690.0 million of such loan to third parties, including one syndication partner who placed its $100.0 million allocation on a warehouse line with GS Bank. GS Bank retained $105.0 million of such loan on its balance sheet. The Moffett Towers II – Buildings 3 & 4 Whole Loan was used in part to pay off the existing GS Bank loan. |
| (9) | Approximately $18.4 million of closing costs are expenses associated with Level 10 Construction LP, an affiliate of the borrower. |
The Mortgage Loan. The mortgage loan (the “Moffett Towers II – Buildings 3 & 4 Mortgage Loan”) is part of a whole loan (the “Moffett Towers II – Buildings 3 & 4 Whole Loan”) evidenced by (i) elevenpari passupromissory notes with an aggregate original principal balance of $350,000,000 (the “Moffett Towers II – Buildings 3 & 4 Senior Loan”) and (ii) three B-notes with an aggregate original principal balance of $155,000,000 (the “Moffett Towers II – Buildings 3 & 4 B Notes”). The Moffett Towers II – Buildings 3 & 4 Whole Loan is secured by a first lien mortgage encumbering the borrower’s fee interest in 701,266 square feet of office buildings located in Sunnyvale, California (the “Moffett Towers II – Buildings 3 & 4 Property”). See “Description of the Mortgage Pool – The Whole Loans – The Non-Serviced AB Whole Loan” and“Pooling and Servicing Agreement – Servicing of the Non-Serviced Mortgage Loans” in the Preliminary Prospectus.
The Moffett Towers II– Buildings 3 & 4 Whole Loan requires interest-only payments through the ARD and accrues at a rate of 3.76386%per annum(the “Initial Interest Rate”) through the ARD. Following the ARD, to the extent that the loan is outstanding, the Moffett Towers II – Buildings 3 & 4 Whole Loan will accrue interest at a rate of the greater of (a) 5.26386%per annum, (b) the 10-year swap rate on the ARD plus 150 basis points or (c) the default rate as defined in the loan documents (the “Adjusted Interest Rate”). In addition, to the extent that there is excess cash flow after the payment of reserves, the excess cash flow will be applied as described in footnote 2 above.
Note Summary
| Notes | Original Principal Balance | Cut-off Date Balance | Note Holder | Controlling Interest |
| A-1-A | $2,750,000 | $2,750,000 | MFTII 2019-B3B4 | No |
| A-2-A | $1,125,000 | $1,125,000 | MFTII 2019-B3B4 | No |
| A-3-A | $1,125,000 | $1,125,000 | MFTII 2019-B3B4 | No |
| A-1-B | $65,000,000 | $65,000,000 | An affiliate of Barclays Capital Real Estate Inc. | (1) |
| A-1-C | $50,000,000 | $50,000,000 | BANK 2019-BNK19 | No |
| A-1-D | $49,750,000 | $49,750,000 | WFCM 2019-C52 | No |
| A-1-E | $25,000,000 | $25,000,000 | Barclays Capital Real Estate Inc. or an affiliate | No |
| A-2-B | $50,000,000 | $50,000,000 | Deutsche Bank AG, New York Branch | No |
| A-2-C | $27,625,000 | $27,625,000 | CGCMT 2019-GC41 | No |
| A-3-B | $50,000,000 | $50,000,000 | Goldman Sachs Bank USA | No |
| A-3-C | $27,625,000 | $27,625,000 | CGCMT 2019-GC41 | No |
| B-1 | $85,250,000 | $85,250,000 | MFTII 2019-B3B4 | Yes(1) |
| B-2 | $34,875,000 | $34,875,000 | MFTII 2019-B3B4 | Yes(1) |
| B-3 | $34,875,000 | $34,875,000 | MFTII 2019-B3B4 | Yes(1) |
| Total | $505,000,000 | $505,000,000 |
| (1) | When a control appraisal period is in effect, Note A-1-B will be the controlling note. See “Description of the Mortgage Pool—The Whole Loans—The Non-Serviced AB Whole Loan” in the Preliminary Prospectus. |
The Borrower and Borrower Sponsor.The borrower is MT2 B3-4 LLC, a Delaware limited liability company and single purpose entity with two independent directors. Legal counsel to the borrower delivered a non-consolidation opinion in connection with the origination of the Moffett Towers II – Buildings 3 & 4 Whole Loan. The non-recourse carve-out guarantor of the Moffett Towers II – Buildings 3 & 4 Whole Loan is Paul Guarantor LLC, and the borrower sponsor is The Jay Paul Company.
THE INFORMATION IN THIS STRUCTURAL AND COLLATERAL TERM SHEET IS NOT COMPLETE AND MAY BE AMENDED PRIOR TO THE TIME OF SALE. THIS TERM SHEET IS NOT AN OFFER TO SELL THESE SECURITIES AND IT IS NOT A SOLICITATION OF AN OFFER TO BUY THESE SECURITIES IN ANY JURISDICTION WHERE THE OFFER OR SALE IS NOT PERMITTED.
34
| Office - Suburban | Loan #1 | Cut-off Date Balance: | $49,750,000 | |
| 1190 Discovery Way & 900 5th Avenue | Moffett Towers II – Buildings 3 & 4 | Cut-off Date LTV: | 44.3% | |
| Sunnyvale, CA 94089 | U/W NCF DSCR: | 3.45x | ||
| U/W NOI Debt Yield: | 13.2% |
Founded in 1975, Jay Paul Company is a privately-held real estate firm based in San Francisco, California that concentrates on the acquisition, development, and management of commercial properties throughout California with a special focus on creating the best-in-class projects for leading technology firms. According to the borrower sponsor, since 2000, Jay Paul Company has closed on more than $12.0 billion in debt and equity financings through a variety of large financial institutions. Jay Paul Company has developed over 13.0 million square feet of institutional quality space including projects for Apple, Google, Amazon, Facebook, Motorola, Microsoft, Boeing, Philips Electronics, Ariba, HP, Rambus, Synopsys, Nokia, DreamWorks and Tencent. Jay Paul Company is committed to green, sustainable development with over 11.0 million square feet of LEED certified office space and over 9.0 million square feet of LEED Platinum certified office space. Jay Paul Company has 25 office/R&D buildings in Moffett Park, totaling nearly 7.2 million square feet, including Moffett Place, Moffett Gateway, Technology Corners, Moffett Towers and Moffett Towers II.
The Property.The Moffett Towers II – Buildings 3 & 4 Property consists of two identical, newly-constructed eight-story buildings totaling 701,266 square feet of Class A office space that is 100.0% leased to Facebook through May 31, 2034 and is located in Sunnyvale, California. The Moffett Towers II - Buildings 3 & 4 Property is the third and final phase of the approximately 1.8 million square foot, five-building Moffett Towers II Campus and is situated on 13.4 acres of the 47.4 acre campus. In addition to approximately $80.5 million in allocated land acquisition costs, according to the borrower sponsor, the construction and development of the collateral buildings, exclusive of tenant-funded build outs, will result in approximately $506.2 million of capital improvements to the buildings, comprised of approximately $483.0 million in construction costs and approximately $23.2 million in tenant improvement allowances which were reserved at origination. The Moffett Towers II – Buildings 3 & 4 Property also features access to a 59,648 square foot non-collateral fitness/amenities building and separate parking structures with an overall parking ratio of 3.3 spaces per 1,000 square feet. With respect to the fitness/amenities space and parking structure, the borrower is subject to a declaration of covenants, conditions, restrictions and easement and charges agreement made by Moffett Towers II Association LLC, an affiliate of the borrower sponsor, and the owner of the common area non-collateral buildings at the Moffett Towers II Campus (see “Amenities and Common Areas” section). As of August 1, 2019, the Moffett Towers II – Buildings 3 & 4 Property was 100.0% leased to Facebook.
Sole Tenant.
Facebook, Inc. (701,266 square feet; 100.0% of net rentable area; 100.0% of underwritten base rent; 5/31/2034 lease expiration) –Facebook, Inc. (“Facebook”) is leasing both buildings on two separate 350,633 square-foot triple-net leases, each with two seven-year extension options and no termination options. Facebook is a global technology and media company focused on building products that enable people to connect and share with friends and family through mobile devices, personal computers and other digital platforms. Facebook’s products include Facebook, Instagram, Messenger, WhatsApp and Oculus. As of year end 2018, daily and monthly active users were 1.52 billion and 2.32 billion, respectively, representing a 9% increase year-over-year. Facebook’s 2018 revenue was $55.84 billion, up 37.4% from year end 2017. Facebook executed its leases at the Moffett Towers II – Buildings 3 & 4 Property in March 2018 and took possession of the spaces in May and June 2019. According to the borrower sponsor, Facebook is currently utilizing Level10 (Jay Paul Company’s related contracting company) to complete its build out of Building 5 (non-collateral) and is expected to move employees into that building by August 2019. Facebook is expected to begin its first phase of build out in August 2019 of Building 3 and move employees in by the end of 2019 or early 2020. The last building which Facebook will phase in will be Building 4.
THE INFORMATION IN THIS STRUCTURAL AND COLLATERAL TERM SHEET IS NOT COMPLETE AND MAY BE AMENDED PRIOR TO THE TIME OF SALE. THIS TERM SHEET IS NOT AN OFFER TO SELL THESE SECURITIES AND IT IS NOT A SOLICITATION OF AN OFFER TO BUY THESE SECURITIES IN ANY JURISDICTION WHERE THE OFFER OR SALE IS NOT PERMITTED.
35
| Office - Suburban | Loan #1 | Cut-off Date Balance: | $49,750,000 | |
| 1190 Discovery Way & 900 5th Avenue | Moffett Towers II – Buildings 3 & 4 | Cut-off Date LTV: | 44.3% | |
| Sunnyvale, CA 94089 | U/W NCF DSCR: | 3.45x | ||
| U/W NOI Debt Yield: | 13.2% |
The following table presents certain information relating to the tenancy at the Moffett Towers II – Buildings 3 & 4 Property:
Major Tenant
| Tenant Name | Credit Rating (Fitch/ Moody’s/ S&P) | Tenant NRSF(1) | % of NRSF | Annual U/W Rent PSF(2)(3) | Annual U/W Rent(2)(3) | % of Total Annual U/W Rent | Lease Expiration Date | Extension Options | Termination Option (Y/N) |
| Major Tenant | |||||||||
| NR/NR/NR | 701,266 | 100.0% | $65.98(3) | $46,272,943(2) | 100.0% | 5/31/2034 | 2, 7-year(4) | N | |
| Vacant Space | 0 | 0.0% | |||||||
| Collateral Total | 701,266 | 100.0% | |||||||
| (1) | Tenant NRSF excludes the 23,860 square feet of shared building amenities space. |
| (2) | Annual U/W Rent PSF and Annual U/W Rent include straight-line rent for Facebook from February 2020 through Facebook’s lease term totaling $8,564,468. Facebook has executed a lease for and has taken possession of each of its spaces but has not yet commenced paying rent. Facebook is required to commence paying rent as of the related rent commencement date of each respective Facebook lease. On the origination date, the borrower reserved approximately $16.1 million for the free rent period preceding the December 2019 and January 2020 rent commencement dates for each of the two Facebook leases. |
| (3) | U/W Rent PSF and U/W Rent includes average rent for each of the two Facebook leases from February 2020 through the maturity of the Moffett Towers II – Buildings 3 & 4 Whole Loan and excludes the related amenities rent. |
| (4) | Facebook has two, seven-year renewal option at 95% of the fair market rent at the time of the renewal. |
The following table presents certain information relating to the lease rollover schedule at the Moffett Towers II – Buildings 3 & 4 Property:
Lease Expiration Schedule(1)
| Year Ending December 31, | No. of Leases Expiring | Expiring NRSF(2) | % of Total NRSF | Cumulative Expiring NRSF(2) | Cumulative % of Total NRSF | Annual U/W Rent(3) | % of Total Annual U/W Rent | Annual U/W Rent PSF(3) |
| MTM | 0 | 0 | 0.0% | 0 | 0.0% | $0 | 0.0% | $0.00 |
| 2019 | 0 | 0 | 0.0% | 0 | 0.0% | $0 | 0.0% | $0.00 |
| 2020 | 0 | 0 | 0.0% | 0 | 0.0% | $0 | 0.0% | $0.00 |
| 2021 | 0 | 0 | 0.0% | 0 | 0.0% | $0 | 0.0% | $0.00 |
| 2022 | 0 | 0 | 0.0% | 0 | 0.0% | $0 | 0.0% | $0.00 |
| 2023 | 0 | 0 | 0.0% | 0 | 0.0% | $0 | 0.0% | $0.00 |
| 2024 | 0 | 0 | 0.0% | 0 | 0.0% | $0 | 0.0% | $0.00 |
| 2025 | 0 | 0 | 0.0% | 0 | 0.0% | $0 | 0.0% | $0.00 |
| 2026 | 0 | 0 | 0.0% | 0 | 0.0% | $0 | 0.0% | $0.00 |
| 2027 | 0 | 0 | 0.0% | 0 | 0.0% | $0 | 0.0% | $0.00 |
| 2028 | 0 | 0 | 0.0% | 0 | 0.0% | $0 | 0.0% | $0.00 |
| 2029 | 0 | 0 | 0.0% | 0 | 0.0% | $0 | 0.0% | $0.00 |
| Thereafter | 2 | 701,266 | 100.0% | 701,266 | 100.0% | $46,272,943 | 100.0% | $65.98 |
| Vacant | 0 | 0 | 0.0% | 701,266 | 100.0% | $0 | 0.0% | $0.00 |
| Total/Weighted Average | 2 | 701,266 | 100.0% | $46,272,943 | 100.0% | $65.98 |
| (1) | Information obtained from the underwritten rent roll. |
| (2) | Expiring NRSF and Cumulative Expiring NRSF excludes 23,860 square feet of shared amenities space. |
| (3) | Annual U/W Rent PSF and Annual U/W Rent include straight-line rent for Facebook from February 2020 through Facebook’s lease term totaling $8,564,468. Facebook has executed a lease for and has taken possession of each of its spaces but has not yet commenced paying rent. Facebook is required to commence paying rent as of the related rent commencement date of each respective Facebook lease. On the origination date, the borrower reserved approximately $16.1 million for the free rent period preceding the December 2019 and January 2020 rent commencement dates for each of the two Facebook leases. |
THE INFORMATION IN THIS STRUCTURAL AND COLLATERAL TERM SHEET IS NOT COMPLETE AND MAY BE AMENDED PRIOR TO THE TIME OF SALE. THIS TERM SHEET IS NOT AN OFFER TO SELL THESE SECURITIES AND IT IS NOT A SOLICITATION OF AN OFFER TO BUY THESE SECURITIES IN ANY JURISDICTION WHERE THE OFFER OR SALE IS NOT PERMITTED.
36
| Office - Suburban | Loan #1 | Cut-off Date Balance: | $49,750,000 | |
| 1190 Discovery Way & 900 5th Avenue | Moffett Towers II – Buildings 3 & 4 | Cut-off Date LTV: | 44.3% | |
| Sunnyvale, CA 94089 | U/W NCF DSCR: | 3.45x | ||
| U/W NOI Debt Yield: | 13.2% |
The following table presents historical occupancy percentages at the Moffett Towers II – Buildings 3 & 4 Property:
Historical Occupancy
12/31/2015(1) | 12/31/2016(1) | 12/31/2017(1) | 12/31/2018(1) | 8/1/2019(2) | ||||
| NAP | NAP | NAP | NAP | 100.0% |
| (1) | Historical occupancy is not available as the Moffett Towers II – Buildings 3 & 4 Property was constructed in 2019. |
| (2) | Information obtained from the underwritten rent roll. |
Operating History and Underwritten Net Cash Flow. The following table presents certain information relating to the historical operating performance and underwritten net cash flow at the Moffett Towers II – Buildings 3 & 4 Property:
Cash Flow Analysis(1)
| U/W | %(2) | U/W $ per SF(3) | ||||
| Base Rent(4) | $37,708,475 | 63.8% | $52.00 | |||
| Amenities Rent(4) | 1,282,857 | 2.2 | 1.77 | |||
| Straight-line Office Rent(4) | 8,564,468 | 14.5 | 11.81 | |||
| Straight-line Amenities Rent(4) | 291,524 | 0.5 | 0.40 | |||
| Grossed Up Vacant Space | 0 | 0.0 | 0.00 | |||
| Gross Potential Rent | $47,847,323 | 80.9% | $65.98 | |||
| Other Income | 0 | 0.0 | 0.00 | |||
| Total Recoveries | 11,259,997 | 19.1 | 15.53 | |||
| Net Rental Income | $59,107,320 | 100.0% | $81.51 | |||
| (Vacancy & Credit Loss) | (1,477,683)(5) | (3.1) | (2.04) | |||
| Effective Gross Income | $57,629,637 | 97.5% | $79.48 | |||
| Real Estate Taxes | 6,490,000 | 11.3 | 8.95 | |||
| Insurance | 430,152 | 0.7 | 0.59 | |||
| Management Fee | 1,152,593 | 2.0 | 1.59 | |||
| Other Operating Expenses | 3,187,252 | 5.5 | 4.40 | |||
| Total Operating Expenses | $11,259,997 | 19.5% | $15.53 | |||
| Net Operating Income | $46,369,641 | 80.5% | $63.95 | |||
| Replacement Reserves | 145,025 | 0.3 | 0.20 | |||
| TI/LC | 0 | 0.0 | 0.00 | |||
| Net Cash Flow | $46,224,616 | 80.2% | $63.75 | |||
| NOI DSCR(6) | 3.46x | |||||
| NCF DSCR(6) | 3.45x | |||||
| NOI Debt Yield(6) | 13.2% | |||||
| NCF Debt Yield(6) | 13.2% |
| (1) | Historical financial information is not available as the Moffett Towers II – Buildings 3 & 4 Property was constructed in 2019. |
| (2) | Represents (i) percent of Net Rental Income for all revenue fields, (ii) percent of Gross Potential Rent for Vacancy & Credit Loss and (iii) percent of Effective Gross Income for all other fields. |
| (3) | Based on 725,126 square feet which is inclusive of 23,860 square feet of the non-collateral fitness/amenities building. The amenities building is a two-story structure located at the center of the Moffett Towers II Campus that contains 59,648 square feet of net rentable area. Each building is assessed a 20% portion for common use of this facility. |
| (4) | Straight-line Office Rent includes straight-line rent for Facebook from February 2020 through its lease term totaling $8,564,468. Facebook has executed a lease for and has taken possession of each of its spaces but has not yet commenced paying rent. Facebook is required to commence paying rent as of the related rent commencement date of each respective Facebook lease. Base Rent PSF and Base Rent reflect annualized amounts due in February 2020, after the dates in which Facebook is required to commence paying rent. On the origination date, the borrower reserved approximately $16.1 million for the free rent period preceding the December 2019 and January 2020 rent commencement dates for each of the two Facebook leases. Rents in place also includes approximately $1.3 million in amenities rent and $291,524 in straight-lined amenities rent. |
| (5) | The underwritten economic vacancy is 2.5%. The Moffett Towers II – Buildings 3 & 4 Property was 100.0% physically occupied as of August 1, 2019. |
| (6) | Based on the Moffett Towers II – Buildings 3 & 4 Senior Loan. |
THE INFORMATION IN THIS STRUCTURAL AND COLLATERAL TERM SHEET IS NOT COMPLETE AND MAY BE AMENDED PRIOR TO THE TIME OF SALE. THIS TERM SHEET IS NOT AN OFFER TO SELL THESE SECURITIES AND IT IS NOT A SOLICITATION OF AN OFFER TO BUY THESE SECURITIES IN ANY JURISDICTION WHERE THE OFFER OR SALE IS NOT PERMITTED.
37
| Office - Suburban | Loan #1 | Cut-off Date Balance: | $49,750,000 | |
| 1190 Discovery Way & 900 5th Avenue | Moffett Towers II – Buildings 3 & 4 | Cut-off Date LTV: | 44.3% | |
| Sunnyvale, CA 94089 | U/W NCF DSCR: | 3.45x | ||
| U/W NOI Debt Yield: | 13.2% |
Appraisal.The appraiser concluded to an appraised value for the Moffett Towers II – Buildings 3 & 4 Property of $790,000,000. The valuation date for Building 3 is January 1, 2020, and the valuation date for Building 4 is December 1, 2019. The appraised value assumes that any rent concessions and/or outstanding tenant improvements and leasing commissions are deposited into a reserve account. At loan origination, the borrower deposited $16,127,329 for free rent for Facebook and $23,165,933 for outstanding tenant improvements and leasing commissions for Facebook. As of the valuation date of May 3, 2019, the Moffett Towers II – Buildings 3 & 4 Property had an “as-is” appraised value of $726,000,000. The appraiser also concluded a “hypothetical go-dark” appraised value of $610,000,000 equating to a Cut-off Date LTV Ratio and LTV Ratio at Maturity or ARD of 57.4%.
Environmental Matters. According to the Phase I environmental site assessment dated May 13, 2019, there was no evidence of any recognized environmental conditions at the Moffett Towers II – Buildings 3 & 4 Property.
Market Overview and Competition.The Moffett Towers II – Buildings 3 & 4 Property is located in Moffett Park, in Sunnyvale, California within Silicon Valley. Moffett Park is an approximately 519-acre area comprised of recently redeveloped office spaces and research and development buildings. Notable technology firms currently in Moffett Park include Google, Hewlett Packard, Juniper Networks, Amazon, Lockheed Martin, Microsoft, Motorola, NetApp and Rambus. The Moffett Towers II – Buildings 3 & 4 Property is north of State Highway 237, which forms the southern border of the Moffett Park area and provides access from Interstate 680 and Interstate 280 to the northeast and U.S. Highway 101 in Sunnyvale to the southwest. U.S. Highway 101 runs northward through San Francisco and southward through San Jose, terminating in Los Angeles. The Santa Clara County Transit System station is located across the street from the Moffett Towers II Campus and services the surrounding residential communities. Moffett Towers II is comprised of five buildings owned by members of Moffett Towers II Association, LLC, whose current members include the Moffett Towers II – Buildings 3 & 4 Borrower and three other members, all of which are currently indirectly owned by the parent of the borrower sponsor. See “Description of the Mortgage Pool – Tenant Issues – Competition from Certain Nearby Properties.”
Submarket Information -According to the appraisal, the Moffett Towers II – Buildings 3 & 4 Property is located in the Moffett Park office submarket of Silicon Valley. As of the first quarter of 2019, the submarket contained approximately 10.3 million square feet of office inventory with a vacancy rate of approximately 0.8%. The overall NNN asking rental rate for office space in Sunnyvale, which includes the Moffett Park submarket, is $6.55 per square foot per month.
The following table presents certain information relating to the appraiser’s market rent conclusions for the Moffett Towers II – Buildings 3 & 4 Property:
Market Rent Summary(1)
| Market Rent (PSF) | $60.00 |
| Lease Term (Years) | 10 |
| Concessions | 6 mos. |
| Lease Type (Reimbursements) | NNN |
| Rent Increase Projection | 3.0% per annum |
| Tenant Improvements (New Tenants) (PSF) | $40.00 |
| Tenant Improvements (Renewals) (PSF) | $20.00 |
| (1) | Information obtained from the appraisal. |
The table below presents certain information relating to comparable sales pertaining to the Moffett Towers II – Buildings 3 & 4 Property identified by the appraiser:
Comparable Sales(1)
| Property Name | Location | Rentable Area (SF) | Sale Date | Sale Price | Sale Price (PSF) |
| 221 North Mathilda Avenue | Sunnyvale, CA | 154,987 | Mar-19 | $182,999,350 | $1,180.74 |
| 601 South California Avenue | Palo Alto, CA | 111,653 | Apr-18 | $145,099,773 | $1,299.56 |
| 1001 North Shoreline Boulevard | Mountain View, CA | 132,960 | Mar-18 | $153,999,590 | $1,158.24 |
| 10900 North Tantau Avenue | Cupertino, CA | 100,481 | Feb-17 | $78,000,386 | $776.27 |
| 410-430 North Mary Avenue | Sunnyvale, CA | 349,758 | Feb-17 | 290,701,362 | $831.15 |
| (1) | Information obtained from the appraisal. |
THE INFORMATION IN THIS STRUCTURAL AND COLLATERAL TERM SHEET IS NOT COMPLETE AND MAY BE AMENDED PRIOR TO THE TIME OF SALE. THIS TERM SHEET IS NOT AN OFFER TO SELL THESE SECURITIES AND IT IS NOT A SOLICITATION OF AN OFFER TO BUY THESE SECURITIES IN ANY JURISDICTION WHERE THE OFFER OR SALE IS NOT PERMITTED.
38
| Office - Suburban | Loan #1 | Cut-off Date Balance: | $49,750,000 | |
| 1190 Discovery Way & 900 5th Avenue | Moffett Towers II – Buildings 3 & 4 | Cut-off Date LTV: | 44.3% | |
| Sunnyvale, CA 94089 | U/W NCF DSCR: | 3.45x | ||
| U/W NOI Debt Yield: | 13.2% |
The following table presents certain information relating to comparable properties to Moffett Towers II – Buildings 3 & 4 Property:
Comparable Leases(1)
| Property Name/Location | Year Built/ Renovated | Total GLA (SF) | Distance from Subject | Occupancy | Lease Term | Tenant Size (SF) | Adjusted Annual Base Rent PSF | TI Allowance PSF | Lease Type |
Moffett Towers II 1111 Lockheed Martin Way Sunnyvale, CA | 2017/NAP | 350,663 | 1.0 miles | 100.0% | 10.5 Yrs | 350,663 | $51.60 | $65.00 | NNN |
520 Almanor Avenue 520 Almanor Avenue Sunnyvale, CA | 2019/NAP | 231,000 | 1.6 miles | 100.0% | 12.5 Yrs | 231,000 | $58.08 | $80.00 | NNN |
599 North Mathilda Avenue 599 North Mathilda Avenue Sunnyvale, CA | 2000/NAP | 76,031 | 1.6 miles | 100.0% | 5.3 Yrs | 76,031 | $50.16 | $10.00 | NNN |
Grove 221 221 North Mathilda Avenue Sunnyvale, CA | 2018/NAP | 154,987 | 2.2 miles | 100.0% | 12.0 Yrs | 154,987 | $69.60 | $83.71 | NNN |
Pathline Park Phase A Building 10 North Mary Avenue Sunnyvale, CA | 2019/NAP | 360,100 | 3.3 miles | 100.0% | 12.0 Yrs | 360,100 | $60.36 | $70.00 | NNN |
1001 North Shoreline Boulevard 1001 North Shoreline Boulevard Mountain View, CA | 2017/NAP | 132,960 | 3.9 miles | 100.0% | 12.0 Yrs | 132,960 | $67.20 | $50.00 | NNN |
| (1) | Information obtained from appraisal. |
Escrows.
Real Estate Taxes – At origination, the borrower was required to escrow $525,523 for real estate taxes. The borrower is required to make monthly payments of one-twelfth of the taxes payable during the next twelve months, currently equal to $87,587, adjusted to reflect a credit for any prepaid taxes.
Insurance – The borrower will not be required to make monthly payments of one-twelfth of the insurance premiums the lender estimates will be payable during the next twelve months as long as the borrower maintains a blanket policy acceptable to the lender.
Replacement Reserve – The borrower is required to make monthly payments of $12,085 into the replacement reserve account upon the occurrence and continuance of a Trigger Period.
Free Rent Reserve –The borrower is required to deposit $16,127,329 into a free rent reserve fund at closing to fund free rent for Facebook from August 2019 to December 2019.
Outstanding TI/LC Reserve –The borrower is required to deposit $23,165,933 into a reserve to fund outstanding tenant improvements and leasing commissions for Facebook.
Lease Sweep Reserve –Upon the occurrence of a Lease Sweep Period (as defined below), the borrower is required to escrow $1,031,600 on each monthly payment date during the continuance of such Lease Sweep Period up to the Lease Sweep and Debt Service Reserve Cap (as defined below).
Lockbox and Cash Management.The Moffett Towers II – Buildings 3 & 4 Whole Loan documents require a hard lockbox with upfront cash management. At origination, the borrower was required to deliver written instructions to tenants directing them to deposit all rents payable under such leases directly into a lender-controlled lockbox account. The Moffett Towers II – Buildings 3 & 4 Whole Loan documents require that all rents and other funds from operations received by the borrower or the property manager be deposited into the lockbox within one business day after receipt. Funds on deposit in the lockbox account are required to be swept on each business day into a lender-controlled cash management account and applied on each payment date to the payment of debt service, the funding of required reserves, budgeted monthly operating expenses, common charges under various reciprocal easement agreements, including the CCR (as defined below), approved extraordinary operating expenses, debt service on the Moffett Towers II – Buildings 3 & 4 Mezzanine Loan (as defined below) and, during a Lease Sweep Period, to the payment of an amount equal to $1,031,600 on each monthly payment date to fund a lease sweep reserve account (the “Lease Sweep Reserve Account”) until the aggregate funds swept in the Lease Sweep Reserve Account during such lease sweep equals the Lease Sweep and Debt Service Reserve Cap. Provided no Trigger Period is continuing, excess cash in the deposit account will be disbursed to the borrower in accordance with the Moffett Towers II – Buildings 3 & 4 Whole Loan documents. If a Trigger Period is continuing (other than a Trigger Period due to a Lease Sweep Period), excess cash in the deposit account will be transferred to an account (the “Cash Collateral Account”) held by the lender as additional collateral for the Moffett Towers II – Buildings 3 & 4 Whole Loan.
THE INFORMATION IN THIS STRUCTURAL AND COLLATERAL TERM SHEET IS NOT COMPLETE AND MAY BE AMENDED PRIOR TO THE TIME OF SALE. THIS TERM SHEET IS NOT AN OFFER TO SELL THESE SECURITIES AND IT IS NOT A SOLICITATION OF AN OFFER TO BUY THESE SECURITIES IN ANY JURISDICTION WHERE THE OFFER OR SALE IS NOT PERMITTED.
39
| Office - Suburban | Loan #1 | Cut-off Date Balance: | $49,750,000 | |
| 1190 Discovery Way & 900 5th Avenue | Moffett Towers II – Buildings 3 & 4 | Cut-off Date LTV: | 44.3% | |
| Sunnyvale, CA 94089 | U/W NCF DSCR: | 3.45x | ||
| U/W NOI Debt Yield: | 13.2% |
A “Trigger Period” will commence following the occurrence of (i) July 6, 2029; (ii) an event of default under the Moffett Towers II – Buildings 3 & 4 Whole Loan or Moffett Towers II – Buildings 3 & 4 Mezzanine Loan; (ii) a Low DSCR Period (as defined below); (iv) a Lease Sweep Period; or (v) an event of default under the mezzanine loan and end at such time, if ever, as the foregoing clauses (i) to (v) giving rise to the Trigger Period have been cured in the manner set forth in the Moffett Towers II – Buildings 3 & 4 Whole Loan documents.
A “Low DSCR Period” will commence if as on any calculation date (i) the Moffett Towers II – Buildings 3 & 4 Property is not fully leased to either (a) Facebook or (b) one or more investment grade entities pursuant to a lease(s) that is substantially on the same or better terms as the Facebook lease and (ii) the debt service coverage ratio is less than 1.90x or the combined debt service coverage ratio being less than 1.50x.
A “Lease Sweep Period” means, prior to the ARD, any period (i) commencing upon the date that Facebook (or any replacement tenant) cancels, terminates or delivers notice of cancellation or termination of its lease with respect to all or a material portion of its space (at least 40,000 or more square feet of space (or, if a full floor of space is less than 40,000 square feet of space, a full floor of space)) and ending when (a) both (1) a replacement tenant acceptable to the lender has accepted delivery of the premises in question and the occupancy conditions are satisfied and (2) the debt service coverage ratio (as calculated under the Moffett Towers II – Buildings 3 & 4 Whole Loan documents) is at least equal to the debt service coverage ratio immediately prior to such period or (b) $35.00 per rentable square foot for the terminated space has been reserved, (ii) commencing upon the date that Facebook (or any replacement tenant) goes dark at 20% or more of its leased space (unless such tenant or replacement tenant is an investment grade entity) and ending when (a) a replacement tenant acceptable to the lender has accepted delivery of the premises in question and is paying rent under a qualified replacement lease or an investment grade subtenant has assumed the lease or (b) $50.00 per rentable square foot for the terminated space has been reserved, (iii) during the continuance of a default of the lease of Facebook (or any replacement tenant) beyond any applicable notice and cure period and ending when (a) such default is cured and no other default occurs for three consecutive months following such cure or (b) $35.00 per rentable square foot for the terminated space has been reserved, (iv) commencing upon the occurrence of an insolvency proceeding involving Facebook (or any replacement tenant) (an “Insolvency Trigger”) and ending when such insolvency proceedings have been terminated and the lease has been affirmed, assumed or assigned in a manner satisfactory to the lender, or (v) commencing upon the date on which Facebook becomes rated by at least two Fitch Ratings, Inc., Moody’s Investors Service, Inc., and S&P Global Ratings, acting through Standard & Poor’s Financial Services LLC) and is subsequently downgraded below investment grade and ending when (a) a replacement tenant or an investment grade subtenant has assumed the lease, (b) Facebook (or its parent entity) is restored as an investment grade entity or (c) $50.00 per rentable square foot for terminated space has been reserved.
A Lease Sweep Period (other than a Lease Sweep Period triggered by an Insolvency Trigger) will not be triggered (or, if already triggered, may be terminated) if the borrower delivers to the lender an acceptable letter of credit in an amount equal to the Lease Sweep and Debt Service Reserve Cap.
The “Lease Sweep and Debt Service Reserve Cap” means (i) with respect to a Lease Sweep Period continuing solely pursuant to clause (iii) above, $24,544,310 ($35.00 per square foot), (ii) with respect to a Lease Sweep Period continuing solely pursuant to clause (i) above, $35.00 per square foot of terminated space, (iii) with respect to a Lease Sweep Period continuing pursuant to clause (ii) above, whether or not a Lease Sweep Period pursuant to clause (i) and/or (iii) above is concurrently continuing, $50.00 per square foot of dark space or (iv) with respect to clause (v) above, whether or not a Lease Sweep Period pursuant to clause (i), (ii) and/or (iii) above, $35,063,300 ($50.00 per square foot).
The “Lease Sweep Reserve Threshold” means (i) with respect to a Lease Sweep Period continuing under clauses (iii) and/or (v) of the definition thereof, $21,037,980 or (ii) with respect to a Lease Sweep Period continuing under clauses (i) and/or (ii) of the definition thereof, $30.00 per rentable square foot of dark space and/or terminated space, as applicable.
Property Management. The Moffett Towers II – Buildings 3 & 4 Property is managed by an affiliate of the borrower.
Partial Release. Not permitted.
Real Estate Substitution.Not permitted.
Subordinate and Mezzanine Indebtedness.The Moffett Towers II – Buildings 3 & 4 B Notes, which have an aggregate principal balance of $155,000,000, are subordinate to the Moffett Towers II – Buildings 3 & 4 Senior Loan and accrue at an interest rate of 3.76386%per annum. The Moffett Towers II – Buildings 3 & 4 B Notes are coterminous with the Moffett Towers II – Buildings 3 & 4 Senior Loan. The holders of the Moffett Towers II – Buildings 3 & 4 B Notes and the Moffett Towers II – Buildings 3 & 4 Senior Loan have entered into a co-lender agreement that sets forth the allocation of collections on the Moffett Towers II – Buildings 3 & 4 Whole Loan. Based on the Moffett Towers II – Buildings 3 & 4 Whole Loan, the cumulative Cut-off Date LTV, cumulative UW NCF DSCR and cumulative UW NOI Debt Yield are 63.9%, 2.39x and 9.2%, respectively.
Additionally, a $85,000,000 mezzanine loan was funded concurrently with the origination of the Moffett Towers II – Buildings 3 & 4 Whole Loan (the “Moffett Towers II – Buildings 3 & 4 Mezzanine Loan”), which is secured by the direct equity ownership in the borrower. Following loan origination, the Moffett Towers II – Buildings 3 & 4 Mezzanine Loan was sold to a third-party investor. The Moffett Towers II – Buildings 3 & 4 Mezzanine Loan accrues interest at a rate of (i) prior to the ARD, 5.75000%per annumand (ii) from and after the ARD, the greater of (a) 7.25000% and (b) the 10-year swap rate on the ARD plus 150 basis points. The Moffett Towers II – Buildings 3 & 4 Mezzanine Loan is coterminous with the Moffett Towers II – Buildings 3 & 4 Whole Loan. Based on the Moffett Towers
THE INFORMATION IN THIS STRUCTURAL AND COLLATERAL TERM SHEET IS NOT COMPLETE AND MAY BE AMENDED PRIOR TO THE TIME OF SALE. THIS TERM SHEET IS NOT AN OFFER TO SELL THESE SECURITIES AND IT IS NOT A SOLICITATION OF AN OFFER TO BUY THESE SECURITIES IN ANY JURISDICTION WHERE THE OFFER OR SALE IS NOT PERMITTED.
40
| Office - Suburban | Loan #1 | Cut-off Date Balance: | $49,750,000 | |
| 1190 Discovery Way & 900 5th Avenue | Moffett Towers II – Buildings 3 & 4 | Cut-off Date LTV: | 44.3% | |
| Sunnyvale, CA 94089 | U/W NCF DSCR: | 3.45x | ||
| U/W NOI Debt Yield: | 13.2% |
II – Buildings 3 & 4 Whole Loan and Moffett Towers II – Buildings 3 & 4 Mezzanine Loan, the total Cut-off Date LTV, total UW NCF DSCR and total UW NOI Debt Yield are 74.7%, 1.90x and 7.9%, respectively. The lenders of the Moffett Towers II – Buildings 3 & 4 Whole Loan have entered into an intercreditor agreement with the Moffett Towers II – Buildings 3 & 4 Mezzanine Loan lenders, which agreement governs their relationship.
Ground Lease. None.
Amenities and Common Areas. The Moffett Towers II – Buildings 3 & 4 Property features access to the fitness/amenities building and the enclosed parking structure (the “Common Area Spaces”). To govern access to the Common Area Spaces, the borrower is subject to a declaration of covenants, conditions, restrictions and easement and charges agreement (the “CCR”) made by MT II LLC, an affiliate of the borrower sponsor and the owner of the common area non-collateral buildings at the Moffett Towers II Campus. The CCR grants the borrower non-exclusive easement rights over the Common Area Spaces. Ownership of the Common Area Spaces governed by the CCR is held by Moffett Towers II Association LLC (the “Association”), whose membership is comprised of the borrower and the owners of buildings 1, 2 and 5. The Association is obligated to maintain insurance coverage for the Common Area Spaces and is also responsible for the maintenance of the Common Area Spaces, subject to the terms of the Facebook leases. The CCR delineates shares of the voting interest in the Association based on the number of buildings at the Moffett Towers II Campus, with each completed building entitled to a proportionate share of the voting interest. Each building is entitled to a one-fifth share (20.0%) share of the voting interest in the Association.
The borrower may consent to a subdivision of the Common Area Spaces to a reduced common area parcel and a separate parcel owned by and on which an affiliate of the borrower may construct an office building, additional parking and other common area improvements.
Such subdivision would be subject to certain conditions, including but not limited to, lender’s consent (not to be unreasonably withheld) and provided that the release may not adversely affect use or access to or from the common area and the Moffett Towers II – Buildings 3 & 4 Property.
Right of First Refusal. Pursuant to its leases, Facebook has the right of first refusal to purchase Building 3 and/or Building 4 upon a proposed sale to a direct competitor (which currently includes Alphabet Inc., Amazon, Inc., Apple Inc. and Microsoft Corporation, subject to change each year and capped at four entities).
Terrorism Insurance.The Moffett Towers II – Buildings 3 & 4 Whole Loan documents require that the “all risk” insurance policy required to be maintained by the borrower provides coverage for terrorism in an amount equal to the full replacement cost of the Moffett Towers II – Buildings 3 & 4 Property, as well as business interruption insurance covering no less than the 24-month period following the occurrence of a casualty event, together with a 12-month extended period of indemnity.
Earthquake Insurance:The Moffett Towers II – Buildings 3 & 4 Property is located within seismic zone 4 and has a probable maximum loss of 3%. The borrower obtained earthquake insurance under a blanket policy with a limit of $170.0 million per occurrence.
THE INFORMATION IN THIS STRUCTURAL AND COLLATERAL TERM SHEET IS NOT COMPLETE AND MAY BE AMENDED PRIOR TO THE TIME OF SALE. THIS TERM SHEET IS NOT AN OFFER TO SELL THESE SECURITIES AND IT IS NOT A SOLICITATION OF AN OFFER TO BUY THESE SECURITIES IN ANY JURISDICTION WHERE THE OFFER OR SALE IS NOT PERMITTED.
41
| Retail - Anchored | Loan #2 | Cut-off Date Balance: | $41,580,000 | |
| 1400 24th Avenue Northwest | University Town Center | Cut-off Date LTV: | 63.0% | |
| Norman, OK 73069 | U/W NCF DSCR: | 2.86x | ||
| U/W NOI Debt Yield: | 12.4% |
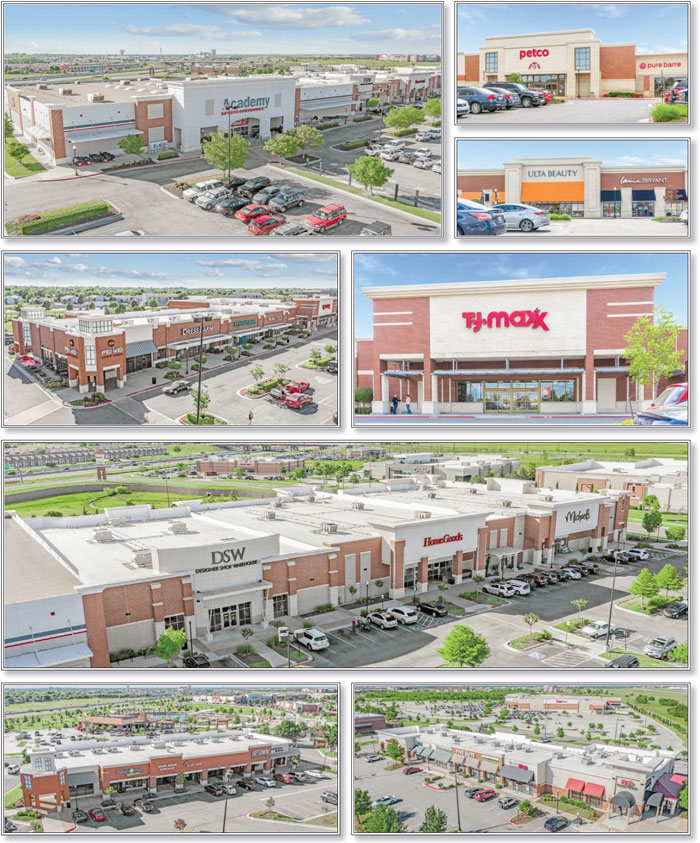
THE INFORMATION IN THIS STRUCTURAL AND COLLATERAL TERM SHEET IS NOT COMPLETE AND MAY BE AMENDED PRIOR TO THE TIME OF SALE. THIS TERM SHEET IS NOT AN OFFER TO SELL THESE SECURITIES AND IT IS NOT A SOLICITATION OF AN OFFER TO BUY THESE SECURITIES IN ANY JURISDICTION WHERE THE OFFER OR SALE IS NOT PERMITTED.
42
| Retail - Anchored | Loan #2 | Cut-off Date Balance: | $41,580,000 | |
| 1400 24th Avenue Northwest | University Town Center | Cut-off Date LTV: | 63.0% | |
| Norman, OK 73069 | U/W NCF DSCR: | 2.86x | ||
| U/W NOI Debt Yield: | 12.4% |
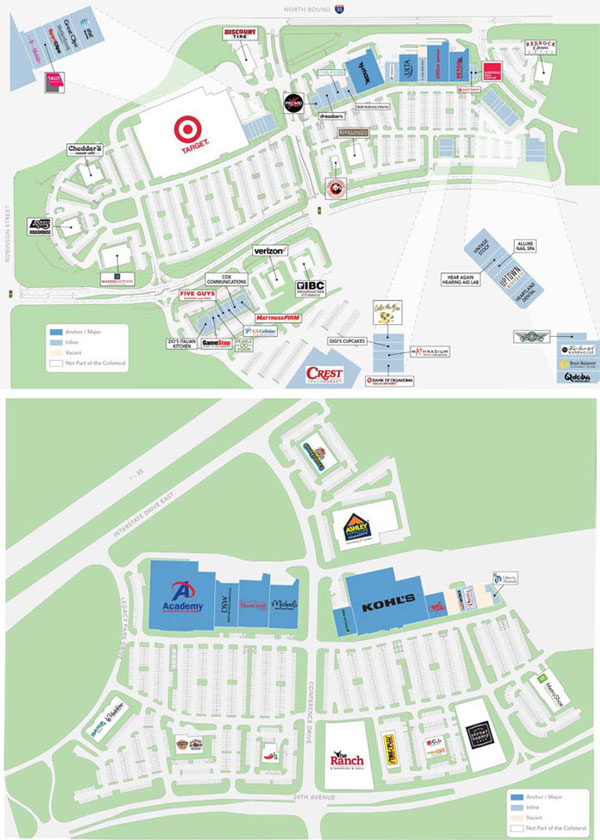
THE INFORMATION IN THIS STRUCTURAL AND COLLATERAL TERM SHEET IS NOT COMPLETE AND MAY BE AMENDED PRIOR TO THE TIME OF SALE. THIS TERM SHEET IS NOT AN OFFER TO SELL THESE SECURITIES AND IT IS NOT A SOLICITATION OF AN OFFER TO BUY THESE SECURITIES IN ANY JURISDICTION WHERE THE OFFER OR SALE IS NOT PERMITTED.
43
| Retail - Anchored | Loan #2 | Cut-off Date Balance: | $41,580,000 | |
| 1400 24th Avenue Northwest | University Town Center | Cut-off Date LTV: | 63.0% | |
| Norman, OK 73069 | U/W NCF DSCR: | 2.86x | ||
| U/W NOI Debt Yield: | 12.4% |
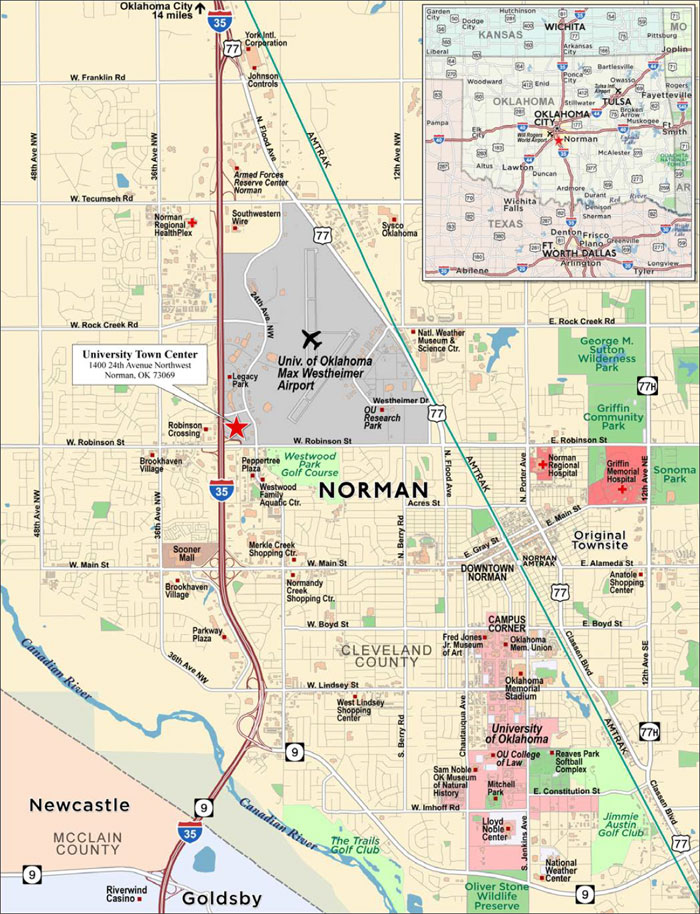
THE INFORMATION IN THIS STRUCTURAL AND COLLATERAL TERM SHEET IS NOT COMPLETE AND MAY BE AMENDED PRIOR TO THE TIME OF SALE. THIS TERM SHEET IS NOT AN OFFER TO SELL THESE SECURITIES AND IT IS NOT A SOLICITATION OF AN OFFER TO BUY THESE SECURITIES IN ANY JURISDICTION WHERE THE OFFER OR SALE IS NOT PERMITTED.
44
| No. 2 – University Town Center | |||||||
| Mortgage Loan Information | Mortgaged Property Information | ||||||
| Mortgage Loan Seller: | Rialto Mortgage Finance, LLC | Single Asset/Portfolio: | Single Asset | ||||
Credit Assessment (Fitch/KBRA/Moody’s): | NR/NR/NR | Property Type – Subtype: | Retail – Anchored | ||||
| Original Principal Balance: | $41,580,000 | Location: | Norman, OK | ||||
| Cut-off Date Balance: | $41,580,000 | Size: | 348,877 SF | ||||
| % of Initial Pool Balance: | 4.6% | Cut-off Date Balance Per SF: | $119.18 | ||||
| Loan Purpose: | Acquisition | Maturity Date Balance Per SF: | $119.18 | ||||
| Borrower Sponsors: | J. Kenneth Dunn | Year Built/Renovated: | 2007/NAP | ||||
| Guarantors: | J. Kenneth Dunn | Title Vesting: | Fee | ||||
| Mortgage Rate: | 4.0000% | Property Manager: | Self-managed | ||||
| Note Date: | June 24, 2019 | Current Occupancy (As of): | 94.4% (5/9/2019) | ||||
| Seasoning: | 1 month | YE 2018 Occupancy: | 88.5% | ||||
| Maturity Date: | July 6, 2029 | YE 2017 Occupancy: | 88.0% | ||||
| IO Period: | 120 months | YE 2016 Occupancy: | 86.9% | ||||
| Loan Term (Original): | 120 months | YE 2015 Occupancy: | NAV | ||||
| Amortization Term (Original): | NAP | As-Is Appraised Value: | $66,000,000 | ||||
| Loan Amortization Type: | Interest-only, Balloon | As-Is Appraised Value Per SF: | $189.18 | ||||
| Call Protection: | L(25),D(91),O(4) | As-Is Appraisal Valuation Date: | May 3, 2019 | ||||
| Lockbox Type: | Springing | Underwriting and Financial Information | |||||
| Additional Debt: | None | TTM NOI (4/30/2019): | $5,108,043 | ||||
| Additional Debt Type (Balance): | NAP | YE 2018 NOI: | $5,047,012 | ||||
| YE 2017 NOI: | $4,791,393 | ||||||
| YE 2016 NOI: | $4,534,865 | ||||||
| U/W Revenues: | $6,783,922 | ||||||
| U/W Expenses: | $1,625,824 | ||||||
| Escrows and Reserves(1) | U/W NOI: | $5,158,098 | |||||
| Initial | Monthly | Cap | U/W NCF: | $4,844,107 | |||
| Taxes | $397,688 | $47,344 | NAP | U/W DSCR based on NOI/NCF: | 3.05x / 2.86x | ||
| Insurance | $0 | Springing | NAP | U/W Debt Yield based on NOI/NCF: | 12.4% / 11.7% | ||
| Replacement Reserve | $0 | $4,361 | NAP | U/W Debt Yield at Maturity based on NOI/NCF: | 12.4% / 11.7% | ||
| TI/LC Reserve | $1,500,000 | Springing | $1,500,000 | Cut-off Date LTV Ratio: | 63.0% | ||
| Deferred Maintenance | $20,250 | $0 | NAP | LTV Ratio at Maturity: | 63.0% | ||
| Sources and Uses | ||||||||
| Sources | Uses | |||||||
| Original loan amount | $41,580,000 | 59.9% | Purchase Price | $63,000,000 | 90.8% | |||
| Sponsors contribution | 27,799,091 | 40.1 | Closing Costs | 4,461,153 | 6.4 | |||
| Upfront Reserves | 1,917,938 | 2.8 | ||||||
| Total Sources | $69,379,091 | 100.0% | Total Uses | $69,379,091 | 100.0% | |||
| (1) | See “Escrows” section for a full description of Escrows and Reserves. |
The Mortgage Loan. The mortgage loan (the “University Town Center Mortgage Loan”) is evidenced by a single promissory note secured by a first mortgage encumbering the fee interest in a 348,877 square feet power center located in Norman, Oklahoma (the “University Town Center Property”).
The Borrower and Borrower Sponsor.The borrower is Rainier UTC Acquisitions, LLC (the “University Town Center Borrower”) a Delaware limited liability company and single purpose entity with two independent directors. Legal counsel to the University Town Center Borrower delivered a non-consolidation opinion in connection with the origination of the University Town Center Mortgage Loan. The nonrecourse carve-out guarantor and borrower sponsor of the University Town Center Mortgage Loan is J. Kenneth Dunn.
J. Kenneth Dunn is cofounder of The Rainier Companies (“Rainier”), which are based in Dallas, Texas. Founded in 2003, Rainier has over $2.0 billion of investment assets under management for individual, corporate and institutional investment partners. Rainier’s portfolio includes multifamily, office, retail, medical office, hotel/lifestyle, and government building assets. Co-founders Tim Nichols and J. Kenneth Dunn have been investing together since 1996, and the principals at Rainier have more than one hundred years of collective experience in real estate acquisitions, financing and operations. Rainier specializes in value-add equity investing, preferred equity and mezzanine debt investments, and third-party asset management.
The Property.The University Town Center Property is a power center containing 348,878 square feet of net rentable area located in Norman, Oklahoma. Built in phases between 2007 and 2013, the University Town Center Property consists of eight, one-story retail
THE INFORMATION IN THIS STRUCTURAL AND COLLATERAL TERM SHEET IS NOT COMPLETE AND MAY BE AMENDED PRIOR TO THE TIME OF SALE. THIS TERM SHEET IS NOT AN OFFER TO SELL THESE SECURITIES AND IT IS NOT A SOLICITATION OF AN OFFER TO BUY THESE SECURITIES IN ANY JURISDICTION WHERE THE OFFER OR SALE IS NOT PERMITTED.
45
| Retail - Anchored | Loan #2 | Cut-off Date Balance: | $41,580,000 | |
| 1400 24th Avenue Northwest | University Town Center | Cut-off Date LTV: | 63.0% | |
| Norman, OK 73069 | U/W NCF DSCR: | 2.86x | ||
| U/W NOI Debt Yield: | 12.4% |
buildings located on a 52.9 acre parcel. The University Town Center Property is anchored by Academy Sports, Kohl’s and TJ Maxx, and junior-anchored by HomeGoods, Michaels, Office Depot, DSW Shoe Warehouse, Ulta, Petco, Dollar Tree and Guitar Center. Kohl’s tenant space is not accounted for in the University Town Center Property’s overall square footage as the tenant ground leases its premises from the University Town Center Borrower. Additionally, the University Town Center Property is shadow anchored by Target (not part of the collateral). The University Town Center Property contains 1,174 surface parking spaces, resulting in a parking ratio of 3.37 spaces per 1,000 square feet of net rentable area. As of May 9, 2019, the University Town Center Property was 94.4% occupied by 46 national, regional and local tenants. Color Me Mine recently signed a 5-year lease for 1,335 square feet at $26.00 per square foot and is expected to take occupancy in September 2019. Dress Barn, currently a tenant, was underwritten as vacant due to its liquidation filing.
Major Tenants.
Largest Tenant: Academy Sports (A/A by Fitch/S&P; 69,330 square feet; 10.8% of underwritten base rent; 1/31/2025 lease expiration) –Academy Sports + Outdoors is a sports, outdoor, and recreation lifestyle retailer that carries an assortment of hunting, fishing and camping equipment and gear along with sports and leisure products, footwear, apparel, patio sets, and barbecue grills, among other products. The company operates over 250 stores in 16 states with more than 23,000 team members throughout the South, Southeast and Midwest of the United States. Academy Sports was acquired by the global investment firm KKR in 2011, which is rated A/A by Fitch/S&P. Academy Sports has been a tenant at the University Town Center Property since 2009 and has three, 5-year renewal options remaining.
2nd Largest Tenant: Kohl’s (BBB/Baa2/BBB by Fitch/Moody’s/S&P; 3.6% of underwritten base rent; 1/31/2028 lease expiration) –Kohl’s was founded in 1988 and operates department stores that sell moderately-priced private label, exclusive and national brand apparel, footwear, accessories, beauty and home products. Kohl’s merchandise mix includes both, national brands and private and exclusive brands. As of February 2, 2019, Kohl’s reported net income of $927 million and retail sales of $19.2 billion. Kohl’s operates under a 20-year ground lease, has been a tenant at the University Town Center Property since 2007 and has eight, 5-year renewal options remaining. Its overall square footage was not accounted for in the University Town Center Property’s overall square footage.
3rd Largest Tenant: TJ Maxx (A2/A+ by Moody’s/S&P; 26,000 square feet; 4.7% of underwritten base rent; 10/31/2022 lease expiration) –TJ Maxx is owned by the TJX Companies, Inc., a leading off-price apparel and home fashions retailer in the United States and worldwide. The company offers a changing assortment of brand name and designer merchandise generally at discounted prices. TJ Maxx and Marshall’s chains are collectively the largest off-price retailer in the United States with a total of 2,343 stores, which include 1,252 TJ Maxx stores at the end of fiscal year 2019. TJX Companies, Inc. reported sales of approximately $39 billion and net income of approximately $3.1 billion as of February 2, 2019. TJ Maxx has been a tenant at the University Town Center Property since 2007 and has three, 5-year renewal options remaining.
THE INFORMATION IN THIS STRUCTURAL AND COLLATERAL TERM SHEET IS NOT COMPLETE AND MAY BE AMENDED PRIOR TO THE TIME OF SALE. THIS TERM SHEET IS NOT AN OFFER TO SELL THESE SECURITIES AND IT IS NOT A SOLICITATION OF AN OFFER TO BUY THESE SECURITIES IN ANY JURISDICTION WHERE THE OFFER OR SALE IS NOT PERMITTED.
46
| Retail - Anchored | Loan #2 | Cut-off Date Balance: | $41,580,000 | |
| 1400 24th Avenue Northwest | University Town Center | Cut-off Date LTV: | 63.0% | |
| Norman, OK 73069 | U/W NCF DSCR: | 2.86x | ||
| U/W NOI Debt Yield: | 12.4% |
The following table presents certain information relating to the tenancy at the University Town Center Property:
Major Tenants
| Tenant Name | Credit Rating (Fitch/Moody’s/ S&P)(1) | Tenant NRSF | % of NRSF | Annual U/W Base Rent PSF(2) | Annual U/W Base Rent(2) | % of Total Annual U/W Base Rent | Lease Expiration Date | Extension Options | Termination Option (Y/N) |
| Anchor Tenants | |||||||||
| Academy Sports | A/NR/A | 69,330 | 19.9% | $8.50 | $589,305 | 10.8% | 1/31/2025 | 3, 5-year | N |
| Kohl’s (Ground Lease) | BBB/Baa2/BBB | 0(3) | 0.0%(3) | N/A | $195,000 | 3.6% | 1/31/2028 | 8, 5-year | N |
| TJ Maxx | NR/A2/A+ | 26,000 | 7.5% | $10.00 | $260,000 | 4.7% | 10/31/2022 | 3, 5-year | N |
| Total Anchor Tenants | 95,330 | 27.3% | $10.95 | $1,044,305 | 19.1% | ||||
| Major Tenants | |||||||||
| HomeGoods | NR/A2/A+ | 25,000 | 7.2% | $10.49 | $262,250 | 4.8% | 9/30/2023 | 4, 5-year | N |
| Michaels | NR/NR/BB- | 21,216 | 6.1% | $10.50 | $222,768 | 4.1% | 9/30/2023 | 4, 5-year | N |
| Office Depot | NR/Ba3/B | 20,813 | 6.0% | $15.00 | $312,195 | 5.7% | 2/28/2023 | 2, 5-year | N |
| DSW Shoe Warehouse | NR/NR/NR | 18,000 | 5.2% | $15.00 | $270,000 | 4.9% | 1/31/2024 | 2, 5-year | N |
| Ulta | NR/NR/NR | 15,284 | 4.4% | $12.75 | $194,871 | 3.6% | 1/31/2023 | 3, 5-year | N |
| Petco | NR/B3/CCC+ | 15,000 | 4.3% | $19.00 | $285,000 | 5.2% | 11/30/2027 | 2, 5-year | N |
| Dollar Tree | NR/Baa3/BBB- | 9,000 | 2.6% | $10.50 | $94,500 | 1.7% | 1/31/2021 | 3, 5-year | N |
| Guitar Center | BBB+/NR/BBB+ | 8,000 | 2.3% | $15.00 | $120,000 | 2.2% | 8/31/2026 | 4, 5-year | N |
| Total Major Tenants | 132,313 | 37.9% | $13.31 | $1,761,584 | 32.2% | ||||
| Non-Major Tenant | 101,852 | 29.2% | $26.20 | $2,668,292 | 48.7% | ||||
| Occupied Collateral Total | 329,495 | 94.4% | $16.61 | $5,474,181 | 100.0% | ||||
| Vacant Space | 19,382 | 5.6% | |||||||
| Collateral Total | 348,877 | 100.0% | |||||||
| (1) | Certain ratings are those of the parent company whether or not the parent company guarantees the lease. |
| (2) | Annual U/W Base Rent PSF and Annual U/W Base Rent include contractual rent steps through May 2020 totaling $53,874. |
| (3) | Kohl’s operates under a 20-year ground lease and its overall square footage was not accounted for in the University Town Center Property’s overall square footage. |
The following table presents certain information relating to tenant sales at the University Town Center Property:
Tenant Sales (PSF)
| Major Tenant Name | % of Total Annual U/W Base Rent | 2016 | 2017 | 2018 | Major Tenant Occupancy Cost(1) |
| TJ Maxx | 4.7% | $346 | $368 | $403 | 3.6% |
| HomeGoods | 4.8% | $293 | $315 | $339 | 4.0% |
| DSW Shoe Warehouse | 4.9% | $161 | $179 | $191 | 9.4% |
| In-Line Sales PSF | $249(2) | $255(3) | $264(4) | ||
| In-Line Occupancy Cost | 10.3% | 10.4% | 10.4% |
| (1) | Major Occupancy Cost is based on the underwritten base rent and underwritten reimbursements. |
| (2) | 2016 In-Line Sales PSF consist of Lane Bryant, Maurices, Vintage Stock, Gigi’s Cupcakes, and Pearle Vision. |
| (3) | 2017 In-Line Sales PSF consist of Cato, Lane Bryant, Bath and Body Works, Vintage Stock, Gigi’s Cupcakes, Pearle Vision and European Wax Center. |
| (4) | 2018 In-Sales PSF consist of Cato, Lane Bryant, Bath and Body Works, Maurices, Vintage Stock, Motherhood Maternity, Gigi’s Cupcakes, Allure Nail Spa, Pearle Vision, Mathnasium and European Wax Center. |
THE INFORMATION IN THIS STRUCTURAL AND COLLATERAL TERM SHEET IS NOT COMPLETE AND MAY BE AMENDED PRIOR TO THE TIME OF SALE. THIS TERM SHEET IS NOT AN OFFER TO SELL THESE SECURITIES AND IT IS NOT A SOLICITATION OF AN OFFER TO BUY THESE SECURITIES IN ANY JURISDICTION WHERE THE OFFER OR SALE IS NOT PERMITTED.
47
| Retail - Anchored | Loan #2 | Cut-off Date Balance: | $41,580,000 | |
| 1400 24th Avenue Northwest | University Town Center | Cut-off Date LTV: | 63.0% | |
| Norman, OK 73069 | U/W NCF DSCR: | 2.86x | ||
| U/W NOI Debt Yield: | 12.4% |
The following table presents certain information relating to the lease rollover schedule at the University Town Center Property:
Lease Expiration Schedule(1)(2)
| Year Ending December 31, | No. of Leases Expiring | Expiring NRSF | % of Total NRSF | Cumulative Expiring NRSF | Cumulative % of Total NRSF | Annual U/W Base Rent(4) | % of Total Annual U/W Base Rent | Annual U/W Base Rent PSF(4) |
| MTM | 0 | 0 | 0.0% | 0 | 0.0% | $0 | 0.0% | $0.00 |
| 2019 | 0 | 0 | 0.0% | 0 | 0.0% | $0 | 0.0% | $0.00 |
| 2020 | 3 | 8,902 | 2.6% | 8,902 | 2.6% | $225,563 | 4.1% | $25.34 |
| 2021 | 14 | 41,175 | 11.8% | 50,077 | 14.4% | $946,205 | 17.3% | $22.98 |
| 2022 | 7 | 43,274 | 12.4% | 93,351 | 26.8% | $769,981 | 14.1% | $17.79 |
| 2023 | 13 | 108,879 | 31.2% | 202,230 | 58.0% | $1,712,818 | 31.3% | $15.73 |
| 2024 | 3 | 26,335 | 7.5% | 228,565 | 65.5% | $430,710 | 7.9% | $16.36 |
| 2025 | 1 | 69,330 | 19.9% | 297,895 | 85.4% | $589,305 | 10.8% | $8.50 |
| 2026 | 3 | 15,000 | 4.3% | 312,895 | 89.7% | $268,000 | 4.9% | $17.87 |
| 2027 | 1 | 15,000 | 4.3% | 327,895 | 94.0% | $285,000 | 5.2% | $19.00 |
| 2028(3) | 2 | 1,600 | 0.5% | 329,495 | 94.4% | $246,600 | 4.5% | $154.13 |
| 2029 | 0 | 0 | 0.0% | 329,495 | 94.4% | $0 | 0.0% | $0.00 |
| Thereafter | 0 | 0 | 0.0% | 329,495 | 94.4% | $0 | 0.0% | $0.00 |
| Vacant | 0 | 19,382 | 5.6% | 348,877 | 100.0% | $0 | 0.0% | $0.00 |
| Total/Weighted Average | 47 | 348,877 | 100.0% | $5,474,181 | 100.0% | $16.61 |
| (1) | Information obtained from the underwritten rent roll. |
| (2) | Certain tenants may have lease termination options that are exercisable prior to the originally stated expiration date of the subject lease and that are not considered in the Lease Expiration Schedule. |
| (3) | The 2028 Annual U/W Base Rent PSF results from the 2028 expirations on the Kohl’s ground lease, whose rent is included in the underwriting analysis, but the square footage was not. |
| (4) | Total/Weighted Average Annual U/W Base Rent and Annual U/W Base Rent PSF exclude vacant space. |
The following table presents historical occupancy percentages at the University Town Center Property:
Historical Occupancy
12/31/2016(1) | 12/31/2017(1) | 12/31/2018(1) | 5/9/2019(2) |
| 86.9% | 88.0% | 88.5% | 94.4% |
| (1) | Information obtained from the University Town Center Borrower. |
| (2) | Information obtained from the underwritten rent roll. |
THE INFORMATION IN THIS STRUCTURAL AND COLLATERAL TERM SHEET IS NOT COMPLETE AND MAY BE AMENDED PRIOR TO THE TIME OF SALE. THIS TERM SHEET IS NOT AN OFFER TO SELL THESE SECURITIES AND IT IS NOT A SOLICITATION OF AN OFFER TO BUY THESE SECURITIES IN ANY JURISDICTION WHERE THE OFFER OR SALE IS NOT PERMITTED.
48
| Retail - Anchored | Loan #2 | Cut-off Date Balance: | $41,580,000 | |
| 1400 24th Avenue Northwest | University Town Center | Cut-off Date LTV: | 63.0% | |
| Norman, OK 73069 | U/W NCF DSCR: | 2.86x | ||
| U/W NOI Debt Yield: | 12.4% |
Operating History and Underwritten Net Cash Flow. The following table presents certain information relating to the underwritten net cash flow at the University Town Center Property:
Cash Flow Analysis
| 2016 | 2017 | 2018 | TTM 4/30/2019 | U/W | %(1) | U/W $ per SF | |
| Rents in Place | $5,034,861 | $5,166,461 | $5,426,978 | $5,512,160 | $5,420,307 | 74.8% | $15.54 |
| Contractual Rent Steps(2) | 0 | 0 | 0 | 0 | 53,874 | 0.7 | 0.15 |
| Grossed Up Vacant Space | 0 | 0 | 0 | 0 | 464,696 | 6.4 | 1.33 |
| Gross Potential Rent | $5,034,861 | $5,166,461 | $5,426,978 | $5,512,160 | $5,938,877 | 81.9% | $17.02 |
| Other Income | 1,717 | 36,291 | 794 | (80) | 6,000 | 0.1 | 0.02 |
| Total Recoveries | 1,056,109 | 1,063,889 | 1,158,509 | 1,221,552 | 1,303,741 | 18.0 | 3.74 |
| Net Rental Income | $6,092,687 | $6,266,641 | $6,586,282 | $6,733,632 | $7,248,618 | 100.0% | $20.78 |
| (Vacancy & Credit Loss) | 0 | 0 | 0 | 0 | (464,696)(3) | (7.8) | (1.33) |
| Effective Gross Income | $6,092,687 | $6,266,641 | $6,586,282 | $6,733,632 | $6,783,922 | 93.6% | $19.44 |
| Real Estate Taxes | 577,504 | 578,177 | 572,125 | 568,153 | 568,125 | 8.4 | 1.63 |
| Insurance | 50,122 | 54,573 | 63,477 | 65,048 | 154,621 | 2.3 | 0.44 |
| Management Fee | 262,363 | 285,486 | 289,252 | 292,827 | 203,518 | 3.0 | 0.58 |
| Other Operating Expenses | 667,834 | 557,013 | 614,415 | 699,561 | 699,561 | 10.3 | 2.01 |
| Total Operating Expenses | $1,557,822 | $1,475,248 | $1,539,270 | $1,625,589 | $1,625,824 | 24.0% | $4.66 |
| Net Operating Income | $4,534,865 | $4,791,393 | $5,047,012 | $5,108,043 | $5,158,098 | 76.0% | $14.78 |
| Replacement Reserves | 0 | 0 | 0 | 0 | 52,332 | 0.8 | 0.15 |
| TI/LC | 0 | 0 | 0 | 0 | 261,659 | 3.9 | 0.75 |
| Net Cash Flow | $4,534,865 | $4,791,393 | $5,047,012 | $5,108,043 | $4,844,107 | 71.4% | $13.88 |
| NOI DSCR | 2.68x | 2.83x | 2.98x | 3.02x | 3.05x | ||
| NCF DSCR | 2.68x | 2.83x | 2.98x | 3.02x | 2.86x | ||
| NOI Debt Yield | 10.9% | 11.5% | 12.1% | 12.3% | 12.4% | ||
| NCF Debt Yield | 10.9% | 11.5% | 12.1% | 12.3% | 11.7% |
| (1) | Represents (i) percent of Net Rental Income for all revenue fields, (ii) percent of Gross Potential Rent for Vacancy & Credit Loss and (iii) percent of Effective Gross Income for all other fields. |
| (2) | Represents contractual rent steps through May 2020. |
| (3) | The underwritten economic vacancy is 6.4%.The University Town Center Property was 94.4% leased as of May 9, 2019. |
Appraisal. As of the appraisal valuation date of May 3, 2019, the University Town Center Property had an “as-is” appraised value of $66,000,000.
Environmental Matters. According to a Phase I environmental site assessment dated May 6, 2019, there was no evidence of any recognized environmental conditions at the University Town Center Property.
Market Overview and Competition.The University Town Center Property is located in Norman, Cleveland County, Oklahoma, within the Oklahoma City metropolitan statistical area (the “Oklahoma City MSA”). The Oklahoma City MSA is one of the top 50 largest MSA’s in the United States with a population of over 1.39 million. As of February 2019, the Oklahoma City MSA had a 3.3% unemployment rate, which was below the national average of 3.8%. Oklahoma City has diversified its economy to include sectors such as information technology services, health services, defense, aerospace, and public administration. Oklahoma City is home to Chesapeake Energy Corporation and Devon Energy Corporation, each a Fortune 500 company. Other major employers within the Oklahoma MSA include Tinker Air Force Base, University of Oklahoma – Norman, FAA Mike Monroney Aeronautical Center, Integris Health, Hobby Lobby and University of Oklahoma Health Sciences Center.
Access to the University Town Center Property’s neighborhood is provided by I-35 connecting the University Town Center Property with the Oklahoma City central business district to the north and the Dallas-Fort Worth MSA to the south. Secondary access is provided by Highway 9 connecting the University Town Center Property’s neighborhood with Bridge Creek to the west and Tecumseh to the east. The University Town Center Property’s neighborhood is considered suburban with a major retail corridor and single-family developments dispersed throughout. The immediate area is served by the public transit system due to its proximity to the University of Oklahoma. The University of Oklahoma (“OU”) is located 3.0 miles south of the University Town Center Property. As the largest university in the state, with a total enrollment of 31,702 students OU is the primary economic driver for the city of Norman, employing 12,941 people. Additionally, the college’s football program contributes to Norman’s economy, drawing over 80,000 spectators to each football game and bringing in out-of-town traffic from all over the country during game day weekends. The University Town Center Property is located adjacent to the Embassy Suites Hotel & Convention Center, a 65,000 square foot conference center and a 10-story, 240-room hotel,
THE INFORMATION IN THIS STRUCTURAL AND COLLATERAL TERM SHEET IS NOT COMPLETE AND MAY BE AMENDED PRIOR TO THE TIME OF SALE. THIS TERM SHEET IS NOT AN OFFER TO SELL THESE SECURITIES AND IT IS NOT A SOLICITATION OF AN OFFER TO BUY THESE SECURITIES IN ANY JURISDICTION WHERE THE OFFER OR SALE IS NOT PERMITTED.
49
| Retail - Anchored | Loan #2 | Cut-off Date Balance: | $41,580,000 | |
| 1400 24th Avenue Northwest | University Town Center | Cut-off Date LTV: | 63.0% | |
| Norman, OK 73069 | U/W NCF DSCR: | 2.86x | ||
| U/W NOI Debt Yield: | 12.4% |
the Max Westheimer Airport, and a new Hampton Inn, which is under construction. Additionally, there is a mixed-use development being planned adjacent to the University Town Center Property called The University North Park Entertainment District. This planned project will consist of 150,000 square feet of retail and restaurant space, a 10,000 seat arena, a conference center, a new hotel and more than 1,600 senior family, multi-family and single family housing units at a projected completed cost of $460 million. According to a third party market research report, the 2019 estimated population within a one, three, and five-mile radius is 6,345, 53,526 and 109,775. The average household income within the same radii is $97,432, $83,344, and $76,555.
Submarket Information – According to the appraisal, the University Town Center Property is situated within the Norman retail submarket. As of the first quarter of 2019, the submarket reported a total inventory of 9.9 million square feet with 3.6% vacancy rate and an average quoted rental rate of $16.40 per square feet. As of the first quarter of 2019, the Norman retail submarket reported positive net absorption of 19,696 square feet and completions of 89,793 square feet.
Appraiser’s Comp Set – The appraiser identified four primary competitive properties for the University Town Center Property totaling approximately 215,317 square feet, which reported an average occupancy rate of approximately 93.8%. The appraiser concluded to net market rents for the University Town Center Property of $28.00 per square foot, for in-line tenants, $18.00 per square foot for Jr. anchor tenants, and $35.00 per square foot for restaurant/high visibility tenants.
The following table presents certain information relating to the appraiser’s market rent conclusion for the University Town Center Property:
Market Rent Summary(1)
| In-Line | Jr. Anchor | Restaurant/High Visibility | |
| Market Rent (PSF) | $28.00 | $18.00 | $35.00 |
| Lease Term (Years) | 5 | 10 | 5 |
| Lease Type (Reimbursements) | NNN | NNN | NNN |
| Rent Increase Projection | 2.0% | 2.0% | 2.0% |
| (1) | Information obtained from the appraisal. |
The table below presents certain information relating to comparable sales for the University Town Center Property identified by the appraiser:
Comparable Sales(1)
| Property Name | Location | Rentable Area (SF) | Sale Date | Sale Price | Sale Price (PSF) |
| Tulsa Hills Shopping Center | Tulsa, OK | 473,254 | Sep-18 | $70,000,000 | $147.91 |
| Bryant Square | Edmond, OK | 265,606 | Feb-18 | $38,000,000 | $143.07 |
| Quail Springs Marketplace | Oklahoma City, OK | 293,788 | Jan-18 | $43,500,000 | $148.07 |
| Kyle Crossing | Kyle, TX | 121,485 | Dec-18 | $28,000,000 | $230.48 |
| Moore Plaza | Corpus Christi, TX | 380,600 | Jan-18 | $71,000,000 | $186.55 |
| (1) | Information obtained from the appraisal. |
THE INFORMATION IN THIS STRUCTURAL AND COLLATERAL TERM SHEET IS NOT COMPLETE AND MAY BE AMENDED PRIOR TO THE TIME OF SALE. THIS TERM SHEET IS NOT AN OFFER TO SELL THESE SECURITIES AND IT IS NOT A SOLICITATION OF AN OFFER TO BUY THESE SECURITIES IN ANY JURISDICTION WHERE THE OFFER OR SALE IS NOT PERMITTED.
50
| Retail - Anchored | Loan #2 | Cut-off Date Balance: | $41,580,000 | |
| 1400 24th Avenue Northwest | University Town Center | Cut-off Date LTV: | 63.0% | |
| Norman, OK 73069 | U/W NCF DSCR: | 2.86x | ||
| U/W NOI Debt Yield: | 12.4% |
The following table presents certain information relating to four comparable leases of inline tenants to those at the University Town Center Property:
Comparable Leases(1)
| Property Name/Location | Year Built/ Renovated | Total GLA (SF) | Distance from Subject | Occupancy | Lease Term | Tenant Size | Annual Base Rent PSF | Reimbursement Amount PSF | Lease Type |
OKC Retail 13230 Pawnee Drive Oklahoma City, OK | 2016/NAP | 76,360 | 28.8 miles | 100.0% | 5.0 Yrs | 3,813 SF | $32.00 | $15.00 | NNN |
Spring Creek Plaza 1440-1472 S. Bryant Avenue Edmond, OK | 1999/NAP | 35,974 | 32.2 miles | 91.0% | 5.0 Yrs | 2,200 SF | $28.00 | $15.00 | NNN |
Shoppes at McAuley Plaza 4210 W. Memorial Road Oklahoma City, OK | 2016/NAP | 13,500 | 32.7 miles | 92.0% | 5.0 Yrs | 1,400 SF | $28.00 | $15.00 | NNN |
Rockwell Plaza 8503-8549 N. Rockwell Avenue Oklahoma City, OK | 1981/NAP | 89,483 | 29.8 miles | 92.0% | 5.0 Yrs | 1,870 SF | $24.00 | $15.00 | NNN |
| (1) | Information obtained from the appraisal. |
Escrows.
Real Estate Taxes – The University Town Center Mortgage Loan documents require an upfront real estate tax reserve of $397,688 and ongoing monthly real estate tax reserves in an amount equal to one-twelfth of the real estate taxes that the lender estimates will be necessary to pay taxes over the then succeeding twelve months (initially $47,344). Academy Sports and Kohl’s pay their real estate taxes directly to the taxing authority.
Insurance – The University Town Center Mortgage Loan documents do not require ongoing monthly escrows for insurance premiums so long as (i) no event of default has occurred and is continuing, (ii) the University Town Center Borrower provides the lender with evidence that the University Town Center Property insurance coverage is included in an acceptable blanket policy, (iii) the University Town Center Borrower provides the lender with satisfactory evidence of renewal of the insurance policy, and (iv) the University Town Center Borrower provides the lender with evidence of timely payments of the insurance premiums no later than ten business days prior to the expiration of the polices.
Replacement Reserves – The University Town Center Mortgage Loan documents require ongoing monthly replacement reserves of $4,361.
TI/LC Reserve – The University Town Center Mortgage Loan documents require an upfront tenant improvements and leasing commissions (“TI/LC”) reserve of $1,500,000. Ongoing monthly TI/LC reserve deposits will not be required so long as the TI/LC subaccount equals (i) $1,500,000 so long as no Critical Tenant Trigger Event (see “Lockbox and Cash Management” section) exists, and (ii) $2,000,000 if a Critical Tenant Trigger Event exists (such amount, the “TI/LC Cap”). Ongoing monthly TI/LC reserves of (a) $21,805 (subject to the TI/LC Cap) will be required if no Critical Tenant Trigger Event exists, and (b) $58,146 (subject to the TI/LC Cap) will be required if Critical Tenant Trigger Event exists.
Deferred Maintenance Reserve – The University Town Center Mortgage Loan documents require an upfront reserve of $20,250 for immediate repairs.
Lockbox and Cash Management.The University Town Center Mortgage Loan requires a springing lockbox and a springing cash management. Upon the occurrence and continuance of a Cash Management Trigger Event (as defined below) the borrower is required to establish a lender-controlled lockbox account and instruct tenants to deposit rents into such lockbox account. All revenues received by the University Town Center Borrower or the property manager are required to be deposited into the lockbox account within one business day of receipt. Pursuant to the University Town Center loan documents, all excess funds on deposit are required to be applied as follows (a) if a Cash Sweep Event (as defined below) is not in effect, to the University Town Center Borrower; and (b) if a Cash Sweep Event is in effect, to an excess cash flow account to be held as additional security for the University Town Center Loan. The University Town Center Borrower may avoid a Cash Sweep DSCR Trigger Event upon satisfaction of the Avoidance Conditions (as defined below), and in this case, the related funds will also be deposited to the excess cash flow account.
A “Cash Management Trigger Event” will commence upon the occurrence of the following:
| (i) | an event of default; |
| (ii) | a bankruptcy action of the University Town Center Borrower, guarantor or property manager; provided that if the bankruptcy action of the manager involves a property manager who is not affiliated with the University Town Center Borrower, then the University Town Center Borrower will have a period of 30 days to terminate and replace the property manager before a Cash Management Trigger Event occurs; or |
| (iii) | a Cash Management DSCR Trigger Event (as defined below). |
THE INFORMATION IN THIS STRUCTURAL AND COLLATERAL TERM SHEET IS NOT COMPLETE AND MAY BE AMENDED PRIOR TO THE TIME OF SALE. THIS TERM SHEET IS NOT AN OFFER TO SELL THESE SECURITIES AND IT IS NOT A SOLICITATION OF AN OFFER TO BUY THESE SECURITIES IN ANY JURISDICTION WHERE THE OFFER OR SALE IS NOT PERMITTED.
51
| Retail - Anchored | Loan #2 | Cut-off Date Balance: | $41,580,000 | |
| 1400 24th Avenue Northwest | University Town Center | Cut-off Date LTV: | 63.0% | |
| Norman, OK 73069 | U/W NCF DSCR: | 2.86x | ||
| U/W NOI Debt Yield: | 12.4% |
A Cash Management Trigger Event will end upon the occurrence of:
| ● | with regard to clause (i) above, the cure of such event of default having been accepted or waived by lender; |
| ● | with regard to clause (ii) above, such bankruptcy action petition having been discharged, stayed, or dismissed within 30 days of such filing among other conditions for the University Town Center Borrower or guarantor and within 120 days for the property manager or, with respect to the manager, the University Town Center Borrower replacing the property manager with a qualified manager acceptable to the lender; and |
| ● | with regard to clause (iii) above, the date the amortizing debt service coverage ratio based on the trailing 12-month period immediately preceding the date of such determination is greater than 1.20x for two consecutive quarters. |
A “Cash Management DSCR Trigger Event” will occur on any day the debt service coverage ratio, based on the trailing 12-month period immediately preceding the date of determination, is less than 1.15x.
A “Cash Sweep Event” will commence upon the occurrence of the following:
| (i) | an event of default; |
| (ii) | a bankruptcy action of the University Town Center Borrower, guarantor or property manager; provided that if the bankruptcy action of the property manager involves a property manager who is not affiliated with the University Town Center Borrower, then the University Town Center Borrower will have a period of 30 days to terminate and replace the property manager before a Cash Sweep Event occurs; or |
| (iii) | a Cash Sweep DSCR Trigger Event (as defined below). |
A Cash Sweep Event will end upon the occurrence of:
| ● | with regard to clause (i) above, the cure of such event of default having been accepted or waived by lender; |
| ● | with regard to clause (ii) above, such bankruptcy action petition having been discharged, stayed, or dismissed within 60 days of such filing among other conditions for the University Town Center Borrower or guarantor and within 120 days for the property manager or, with respect to the property manager, the University Town Center Borrower replacing the property manager with a qualified manager acceptable to the lender; and |
| ● | with regard to clause (iii) above, the date the amortizing debt service coverage ratio based on the trailing 12-month period immediately preceding the date of such determination is greater than 1.20x for two consecutive quarters. |
A “Cash Sweep DSCR Trigger Event” will occur on any day the debt service coverage ratio, based on the trailing 12-month period immediately preceding the date of determination, is less than 1.15x; provided that the University Town Center Borrower may avoid the Cash Sweep DSCR Trigger Event by satisfying the Avoidance Conditions.
The “Avoidance Conditions” require that the University Town Center Borrower, within five days of the Cash Sweep Trigger Event (and provided no other Cash Sweep Event exists), deposit in the excess cash flow account an amount equal to the Avoidance Deposit (as defined below) for each year the University Town Center Borrower desires to avoid the existence of a Cash Sweep Event period.
The “Avoidance Deposit” means, (i) $1,340,000 if the TI/LC account equals or exceeds the required TI/LC Cap and (ii) $1,075,000 if the balance of funds in the TI/LC account is less than or equal to the required TI/LC Cap.
A “Critical Tenant Trigger Event” will occur upon:
| (i) | Academy Sports or any other tenant occupying the space currently occupied by Academy Sports (a “Critical Tenant” and each related lease, a “Critical Tenant Lease”) giving notice of its intention to not extend or renew its lease; |
| (ii) | the date that is six months prior to the related lease expiration date if the Critical Tenant has failed to give notice of its election to renew its lease; |
| (iii) | the date on which the Critical Tenant is required under its lease to notify the University Town Center Borrower of its election to renew its lease, if the Critical Tenant fails to give such notice; |
| (iv) | an event of default under the Critical Tenant Lease occurring or continuing; |
| (v) | a bankruptcy action with respect to the Critical Tenant or guarantor of any Critical Tenant occurring; or |
| (vi) | the Critical Tenant discontinuing its normal business operations. |
A “Critical Tenant Trigger Event Cure” will occur upon:
| ● | with regard to clause (i), (ii) or (iii) above, (x) the date that (1) the Critical Tenant Lease extension is executed and delivered to the lender by the University Town Center Borrower and the related tenant improvement costs, leasing commissions and other material costs and expenses have been deposited into the Critical Tenant TI/LC account; or (2) a Critical Tenant Space Re-Tenanting Event (as defined below) has occurred; |
| ● | with regard to clause (iv) above, a cure of the applicable default; |
| ● | with regard to clause (v) above, an affirmation of the Critical Tenant lease in the applicable bankruptcy proceeding and confirmation that the Critical Tenant is actually paying all rents and other amounts under the lease; or |
| ● | with regard to clause (vi) above, the Critical Tenant re-commencing its normal business operations or a Critical Tenant Space Re-Tenanting Event (as defined below) occurring. |
THE INFORMATION IN THIS STRUCTURAL AND COLLATERAL TERM SHEET IS NOT COMPLETE AND MAY BE AMENDED PRIOR TO THE TIME OF SALE. THIS TERM SHEET IS NOT AN OFFER TO SELL THESE SECURITIES AND IT IS NOT A SOLICITATION OF AN OFFER TO BUY THESE SECURITIES IN ANY JURISDICTION WHERE THE OFFER OR SALE IS NOT PERMITTED.
52
| Retail - Anchored | Loan #2 | Cut-off Date Balance: | $41,580,000 | |
| 1400 24th Avenue Northwest | University Town Center | Cut-off Date LTV: | 63.0% | |
| Norman, OK 73069 | U/W NCF DSCR: | 2.86x | ||
| U/W NOI Debt Yield: | 12.4% |
A “Critical Tenant Space Re-Tenanting Event” will occur on the date each of the following conditions has been satisfied: (i) the Critical Tenant space (or not less than 41,598 square feet of the related Critical Tenant space, as long as the aggregate annual rent and reimbursements from the re-tenanted portion of the Critical Tenant space is not less than $445,000) is leased to one or more replacement tenants for a term of at least five years and on terms that are acceptable to the lender; (ii) all tenant improvement costs, leasing commissions and other material costs and expenses relating to the re-letting of the space have been paid in full; and (iii) the replacement tenant(s) are conducting normal business operations at the related Critical Tenant space.
Property Management. The University Town Center Property is managed by Rainier Realty Management, LLC, an affiliate of the University Town Center Borrower sponsor.
Partial Release. Not permitted.
Real Estate Substitution.Not permitted.
Subordinate and Mezzanine Indebtedness.Not permitted.
Ground Lease. None.
Terrorism Insurance.The University Town Center Mortgage Loan documents require that the “all risk” insurance policy required to be maintained by the University Town Center Borrower provides coverage for terrorism in an amount equal to the full replacement cost of the University Town Center Property, as well as business interruption insurance covering no less than the 18-month period following the occurrence of a casualty event, together with a 12-month extended period of indemnity.
THE INFORMATION IN THIS STRUCTURAL AND COLLATERAL TERM SHEET IS NOT COMPLETE AND MAY BE AMENDED PRIOR TO THE TIME OF SALE. THIS TERM SHEET IS NOT AN OFFER TO SELL THESE SECURITIES AND IT IS NOT A SOLICITATION OF AN OFFER TO BUY THESE SECURITIES IN ANY JURISDICTION WHERE THE OFFER OR SALE IS NOT PERMITTED.
53
| Loan #3 | Cut-off Date Balance: | $40,000,000 | ||
| Property Type - Various | SoCal Retail Portfolio | Cut-off Date LTV: | 52.0% | |
| Property Addresses - Various | U/W NCF DSCR: | 2.28x | ||
| U/W NOI Debt Yield: | 9.9% |
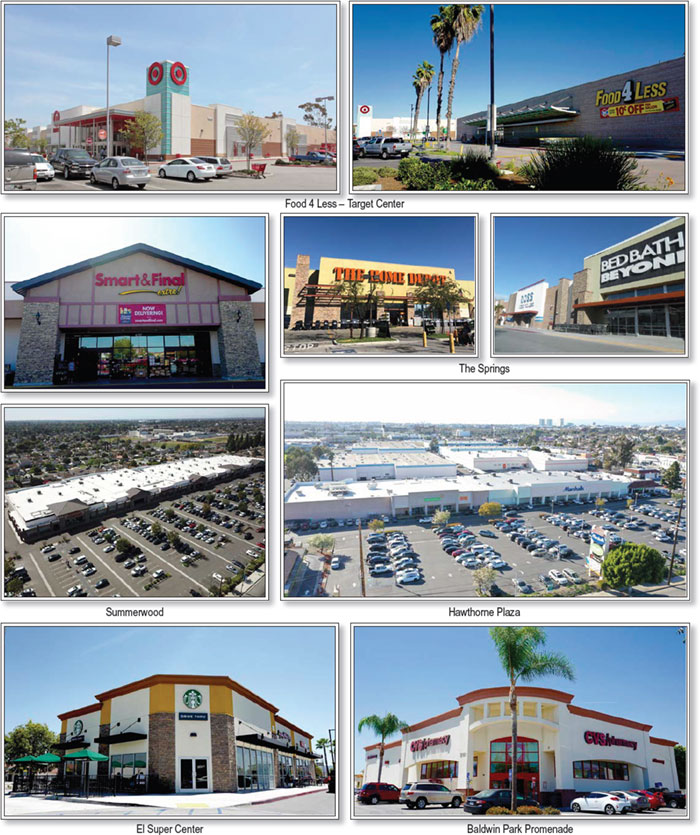
THE INFORMATION IN THIS STRUCTURAL AND COLLATERAL TERM SHEET IS NOT COMPLETE AND MAY BE AMENDED PRIOR TO THE TIME OF SALE. THIS TERM SHEET IS NOT AN OFFER TO SELL THESE SECURITIES AND IT IS NOT A SOLICITATION OF AN OFFER TO BUY THESE SECURITIES IN ANY JURISDICTION WHERE THE OFFER OR SALE IS NOT PERMITTED.
54
| Loan #3 | Cut-off Date Balance: | $40,000,000 | ||
| Property Type - Various | SoCal Retail Portfolio | Cut-off Date LTV: | 52.0% | |
| Property Addresses - Various | U/W NCF DSCR: | 2.28x | ||
| U/W NOI Debt Yield: | 9.9% |
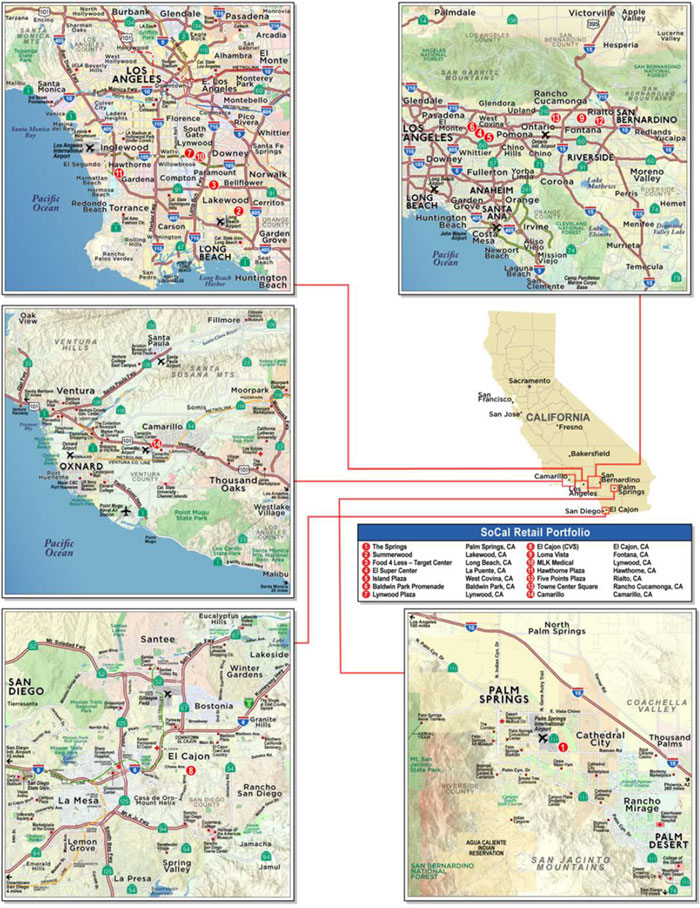
THE INFORMATION IN THIS STRUCTURAL AND COLLATERAL TERM SHEET IS NOT COMPLETE AND MAY BE AMENDED PRIOR TO THE TIME OF SALE. THIS TERM SHEET IS NOT AN OFFER TO SELL THESE SECURITIES AND IT IS NOT A SOLICITATION OF AN OFFER TO BUY THESE SECURITIES IN ANY JURISDICTION WHERE THE OFFER OR SALE IS NOT PERMITTED.
55
| No. 3 –SoCal Retail Portfolio | |||||||
| Mortgage Loan Information | Mortgaged Property Information | ||||||
| Mortgage Loan Seller: | Argentic Real Estate Finance LLC | Single Asset/Portfolio: | Portfolio | ||||
Credit Assessment (Fitch/KBRA/Moody’s): | NR/NR/NR | Property Type – Subtype(5): | Various – Retail/Office | ||||
| Original Principal Balance(1): | $40,000,000 | Location: | Various, CA | ||||
| Cut-off Date Balance(1): | $40,000,000 | Size(5): | 1,481,231 SF | ||||
| % of Initial Pool Balance: | 4.4% | Cut-off Date Balance Per SF(1): | $145.00 | ||||
| Loan Purpose: | Refinance | Maturity Date Balance Per SF(1): | $145.00 | ||||
| Borrower Sponsor: | Mark Gabay | Year Built/Renovated: | Various/Various | ||||
| Guarantor: | Mark Gabay | Title Vesting: | Fee | ||||
| Mortgage Rate: | 4.0590% | Property Manager: | Excel Property Management (borrower-related) | ||||
| Note Date: | April 25, 2019 | Current Occupancy (As of): | 99.0% (3/1/2019) | ||||
| Seasoning: | 3 months | YE 2018 Occupancy: | 94.6% | ||||
| Maturity Date: | May 6, 2029 | YE 2017 Occupancy: | 95.4% | ||||
| IO Period: | 120 months | YE 2016 Occupancy: | 96.4% | ||||
| Loan Term (Original): | 120 months | YE 2015 Occupancy: | 89.8% | ||||
| Amortization Term (Original): | NAP | Appraised Value: | $413,250,000 | ||||
| Loan Amortization Type: | Interest-only, Balloon | Appraised Value Per SF: | $278.99 | ||||
| Call Protection(2): | L(27),GRTR 1% or YM(88),O(5) | Appraisal Valuation Date: | Various | ||||
| Lockbox Type: | Hard / Springing Cash Management | Underwriting and Financial Information | |||||
| Additional Debt(1)(3): | Yes | ||||||
| Additional Debt Type (Balance)(1) (3): | Pari Passu($174,785,000) | YE 2018 NOI: | $20,078,785 | ||||
| YE 2017 NOI: | $19,757,624 | ||||||
| YE 2016 NOI: | $17,772,993 | ||||||
| YE 2015 NOI: | $17,266,996 | ||||||
| U/W Revenues: | $27,692,309 | ||||||
| U/W Expenses: | $6,462,745 | ||||||
| U/W NOI: | $21,229,564 | ||||||
| U/W NCF: | $20,192,702 | ||||||
| Escrows and Reserves(3) | U/W DSCR based on NOI/NCF(1): | 2.40x / 2.28x | |||||
| Initial | Monthly | Cap | U/W Debt Yield based on NOI/NCF(1): | 9.9% / 9.4% | |||
| Real Estate Taxes | $680,770 | $226,923 | NAP | U/W Debt Yield at Maturity based on NOI/NCF(1): | 9.9% / 9.4% | ||
| Insurance | $0 | Springing | NAP | Cut-off Date LTV Ratio(1): | 52.0% | ||
| Replacement Reserve | $0 | $24,687 | $592,492 | LTV Ratio at Maturity(1): | 52.0% | ||
| TI/LC Reserve | $3,000,000 | Springing | $3,000,000 | ||||
| Other(4) | $729,724 | $0 | NAP | ||||
| Sources and Uses | ||||||||
| Sources | Uses | |||||||
| Original whole loan amount(1) | $214,785,000 | 100.0% | Loan payoff | $193,896,558 | 90.3% | |||
| Upfront reserves | 4,410,494 | 2.1 | ||||||
| Closing costs | 1,326,506 | 0.6 | ||||||
| Return of equity | 15,151,442 | 7.1 | ||||||
| Total Sources | $214,785,000 | 100.0% | Total Uses | $214,785,000 | 100.0% | |||
| (1) | The SoCal Retail Portfolio Mortgage Loan (as defined below) is part of the SoCal Retail Portfolio Whole Loan (as defined below), which comprises eightpari passunotes with an aggregate original balance of $214,785,000. All statistical information related to the Cut-off Date Balance Per SF, Maturity Date Balance Per SF, U/W DSCR based on NOI/NCF, U/W Debt Yield based on NOI/NCF, U/W Debt Yield at Maturity based on NOI/NCF, Cut-off Date LTV Ratio and LTV Ratio at Maturity are based on the SoCal Retail Portfolio Whole Loan. |
| (2) | After the earlier of (i) April 25, 2022 or (ii) two years from the closing date of the securitization that includes the lastpari passu note of the SoCal Retail Portfolio Whole Loan to be securitized, and prior to January 6, 2029, the SoCal Retail Portfolio Whole Loan may be prepaid in whole, but not in part, subject to payment of the greater of (a) 1% of any applicable prepayment, or (b) a yield maintenance premium. |
| (3) | See “Escrows and Reserves” below for further discussion of reserve requirements. |
| (4) | Other Reserves include a Free Rent Reserve ($729,724). |
| (5) | The SoCal Retail Portfolio Properties (as defined below) consist of 13 retail properties comprising 1,448,731 square feet and one office property comprising 32,500 square feet, of which 5,000 square feet is retail. |
THE INFORMATION IN THIS STRUCTURAL AND COLLATERAL TERM SHEET IS NOT COMPLETE AND MAY BE AMENDED PRIOR TO THE TIME OF SALE. THIS TERM SHEET IS NOT AN OFFER TO SELL THESE SECURITIES AND IT IS NOT A SOLICITATION OF AN OFFER TO BUY THESE SECURITIES IN ANY JURISDICTION WHERE THE OFFER OR SALE IS NOT PERMITTED.
56
| Loan #3 | Cut-off Date Balance: | $40,000,000 | ||
| Property Type - Various | SoCal Retail Portfolio | Cut-off Date LTV: | 52.0% | |
| Property Addresses - Various | U/W NCF DSCR: | 2.28x | ||
| U/W NOI Debt Yield: | 9.9% |
The Mortgage Loan. The mortgage loan (the “SoCal Retail Portfolio Mortgage Loan”) is part of a whole loan (the “SoCal Retail Portfolio Whole Loan”) evidenced by eightpari passu notes with an original principal balance of $214,785,000 and an outstanding principal balance as of the Cut-off Date of $214,785,000 secured by a first mortgage encumbering the fee interest in one office and 13 retail properties located in various cities throughout Southern California (the “SoCal Retail Portfolio Properties” or the “SoCal Retail Portfolio”). The SoCal Retail Portfolio Mortgage Loan represents non-controlling Note A-3, which has an original principal balance of $40,000,000, and will be included in the WFCM 2019-C52 securitization trust. The controlling Note A-1 and non-controlling Note A-5, with an aggregate original principal balance of $60,000,000 were contributed to the MSC 2019-H7 securitization transaction. The non-controlling Notes A-2, A-7, and A-8, with an aggregate original principal balance of $64,785,000 were contributed to the MSC 2019-H6 securitization transaction. The non-controlling Notes A-4, and A-6, with an aggregate original principal balance of $50,000,000 (together with Notes A-1, A-2, A-5, A-7, and A-8, the “SoCal Retail Portfolio Non-ServicedPari Passu Companion Loans”), are expected to be contributed to one or more future securitization transactions. See“Description of the Mortgage Pool – The Whole Loans – The Non Serviced Pari Passu Whole Loans”, and “Pooling and Servicing Agreement – Servicing of the Non-Serviced Mortgage Loans” in the Preliminary Prospectus.
Note Summary
| Notes | Original Principal Balance | Cut-off Date Balance | Note Holder | Controlling Interest |
| SoCal Retail Portfolio Mortgage Loan | ||||
| A-3 | $40,000,000 | $40,000,000 | WFCM 2019-C52 | No |
| SoCal Retail Portfolio Non-ServicedPari Passu Companion Loans | ||||
| A-1, A-5 | $60,000,000 | $60,000,000 | MSC 2019-H7 | Yes |
| A-2, A-7, A-8 | $64,785,000 | $64,785,000 | MSC 2019-H6 | No |
| A-4 | $35,000,000 | $35,000,000 | AREF or an affiliate | No |
| A-6 | $15,000,000 | $15,000,000 | AREF or an affiliate | No |
| Total | $214,785,000 | $214,785,000 |
The Borrowers and Borrower Sponsor.The borrowers are Iris19 LP, Azalea19 LP, Camellia19 LP, Magnolia19 LP, Carnation19 LP, Lilac19 LP, Lily19 LP, Dahlia19 LP, Marigold19 LP, Lavender19 LP, Primrose19 LP, Gardenia19 LP, Orchid19 LP, Daphne19 LP and Tulip19 LP (the “SoCal Retail Portfolio Borrowers”), each a Delaware limited partnership structured to be a bankruptcy-remote entity. The general partner of the SoCal Retail Portfolio Borrowers is Flowerfield19 LLC, a Delaware limited liability company with two independent directors. The borrower sponsor and nonrecourse carve-out guarantor of the SoCal Retail Portfolio Whole Loan is Mark Gabay.
Mark Gabay owns approximately 50.5% of the ownership interest in the SoCal Retail Portfolio Borrowers and is a co-managing partner at the Charles Company. Headquartered in West Hollywood, the Charles Company is a family-owned real estate development group established in 1979. The Charles Company controls and administers all aspects of acquisition, design planning, property management, and leasing through its in-house staff. It has developed projects throughout California, accumulating over 4.0 million square feet of commercial real estate, with a focus on eight Southern California counties (Imperial, Los Angeles, Orange, Riverside, Sacramento, San Bernardino, San Diego and Ventura) and one Nevada county (Washoe).
The borrower sponsor was the sponsor of a mortgage loan that went into monetary default and was transferred to special servicing in March 2009. Following a loan modification, the special servicer initiated foreclosure proceedings in April 2010 and the related mortgaged property was sold in December 2013. See“Description of the Mortgage Pool—Loan Purpose; Default History, Bankruptcy Issues and Other Proceedings” in the Preliminary Prospectus.
Arman Gabay, the holder of a non-controlling 49.5% limited interest in the SoCal Retail Portfolio Borrowers and the brother of the borrower sponsor, is a defendant in a criminal complaint alleging, among other things, three felony counts of wire fraud and two felony counts of federal program bribery relating to Arman’s allegedly having conspired with and bribing a senior Los Angeles County Official who had responsibility for Los Angeles County’s process for leasing office space for various of its agencies for the purpose of securing leases in properties in which he owned an interest. None of the properties or leases associated with the criminal proceeding are SoCal Retail Portfolio Properties or leases related to the SoCal Retail Portfolio Properties. The borrower sponsor is not a named defendant in such criminal complaint and the SoCal Retail Portfolio Whole Loan documents prohibit the transfer of a controlling interest in the SoCal Retail Portfolio Borrowers, the general partner of the SoCal Retail Portfolio Borrowers, or any SoCal Retail Portfolio Property to Arman Gabay.
The Properties. The SoCal Retail Portfolio is a 14-property, 1,448,731 square-foot portfolio of 13 retail properties and one office property located throughout Southern California. The properties were constructed from 1958 to 2014 and range in size from 10,324 square feet to 397,718 square feet, with no property comprising of more than 27.0% of the total net rentable area. As of March 1, 2019, the SoCal Retail Portfolio Properties were occupied by 138 tenants and have a portfolio occupancy of 99.0% with six vacant spaces totaling 14,190 square feet. The tenant roster is granular, with no tenant comprising more than 10.1% of the portfolio’s total net rentable area or 5.7% of underwritten base income. In addition, the lease expiration schedule is dispersed with no more than
THE INFORMATION IN THIS STRUCTURAL AND COLLATERAL TERM SHEET IS NOT COMPLETE AND MAY BE AMENDED PRIOR TO THE TIME OF SALE. THIS TERM SHEET IS NOT AN OFFER TO SELL THESE SECURITIES AND IT IS NOT A SOLICITATION OF AN OFFER TO BUY THESE SECURITIES IN ANY JURISDICTION WHERE THE OFFER OR SALE IS NOT PERMITTED.
57
| Loan #3 | Cut-off Date Balance: | $40,000,000 | ||
| Property Type - Various | SoCal Retail Portfolio | Cut-off Date LTV: | 52.0% | |
| Property Addresses - Various | U/W NCF DSCR: | 2.28x | ||
| U/W NOI Debt Yield: | 9.9% |
14.9% of net rentable area and 14.8% of underwritten base income expiring during any one year of the SoCal Retail Portfolio Whole Loan term. Ten of the 14 properties are 100.0% occupied. Current tenants have a weighted average remaining lease term of approximately 6.5 years, excluding month-to-month tenants. Approximately 43 tenants (or 50.6% of NRA) have been at the respectiveproperties for over 10 years. Furthermore, investment grade tenants lease 43.9% of the net rentable square footage and contribute to approximately 35.7% of the underwritten base rent.
The following table presents certain information regarding the SoCal Retail Portfolio Properties:
| Portfolio Summary(1) | ||||||||
| Property Name | Allocated Whole Loan Cut-off Date Balance | % of Portfolio Whole Loan Cut-off Date Balance | Occupancy | Year Built/ Renovated | Net Rentable Area (SF) | Appraised Value | U/W NCF | % of U/W NCF |
| The Springs | $45,650,000 | 21.3% | 98.4% | 2008/2015 | 397,718 | $87,000,000 | $3,830,786 | 19.0% |
| Summerwood | $31,687,000 | 14.8% | 100.0% | 1968/2011 | 178,770 | $58,000,000 | $2,931,334 | 14.5% |
| Food 4 Less - Target Center | $21,690,000 | 10.1% | 100.0% | 1993, 2007/NAP | 196,436 | $45,000,000 | $1,985,727 | 9.8% |
| El Super Center | $21,219,000 | 9.9% | 100.0% | 2012, 2014/NAP | 117,230 | $40,000,000 | $2,058,807 | 10.2% |
| Island Plaza | $16,220,000 | 7.6% | 100.0% | 1967,1968, 1980, 1995/NAP | 77,772 | $30,500,000 | $1,572,064 | 7.8% |
| Baldwin Park Promenade | $11,505,000 | 5.4% | 100.0% | 2006, 2007/NAP | 49,906 | $23,700,000 | $1,203,691 | 6.0% |
| Lynwood Plaza | $11,411,000 | 5.3% | 96.0% | 2003/NAP | 75,245 | $23,500,000 | $1,150,049 | 5.7% |
| El Cajon (CVS) | $9,902,000 | 4.6% | 100.0% | 2005/NAP | 29,986 | $15,500,000 | $974,290 | 4.8% |
| Loma Vista | $8,771,000 | 4.1% | 99.2% | 1990/NAP | 97,547 | $17,000,000 | $921,060 | 4.6% |
| MLK Medical | $8,441,000 | 3.9% | 100.0% | 1958/2005 | 32,500 | $15,200,000 | $823,913 | 4.1% |
| Hawthorne Plaza | $8,111,000 | 3.8% | 100.0% | 1978/NAP | 70,750 | $17,500,000 | $728,567 | 3.6% |
| Five Points Plaza | $7,922,000 | 3.7% | 95.6% | 1985-1986/NAP | 89,537 | $17,100,000 | $865,842 | 4.3% |
| Towne Center Square | $7,261,000 | 3.4% | 100.0% | 1995/NAP | 57,510 | $14,600,000 | $682,915 | 3.4% |
| Camarillo | $4,995,000 | 2.3% | 100.0% | 2014/NAP | 10,324 | $8,650,000 | $463,657 | 2.3% |
| Total/Wtd. Avg. | $214,785,000 | 100.0% | 99.0% | 1,481,231 | $413,250,000 | $20,192,702 | 100.0% | |
| (1) | Information obtained from the underwritten rent roll. |
THE INFORMATION IN THIS STRUCTURAL AND COLLATERAL TERM SHEET IS NOT COMPLETE AND MAY BE AMENDED PRIOR TO THE TIME OF SALE. THIS TERM SHEET IS NOT AN OFFER TO SELL THESE SECURITIES AND IT IS NOT A SOLICITATION OF AN OFFER TO BUY THESE SECURITIES IN ANY JURISDICTION WHERE THE OFFER OR SALE IS NOT PERMITTED.
58
| Loan #3 | Cut-off Date Balance: | $40,000,000 | ||
| Property Type - Various | SoCal Retail Portfolio | Cut-off Date LTV: | 52.0% | |
| Property Addresses - Various | U/W NCF DSCR: | 2.28x | ||
| U/W NOI Debt Yield: | 9.9% |
The following table presents certain information relating to the SoCal Retail Portfolio Properties:
| Property Summary(1) | |||||||
| Property Name | City | State | Property SF | Year Built/Renovated | Physical Occupancy | # of Tenants | Major Tenants |
| The Springs | Palm Springs | CA | 397,718 | 2008/2015 | 98.4% | 25 | The Home Depot(2), Ross Dress for Less, Marshalls, Bed Bath and Beyond, Burlington Coat Factory and Aldi |
| Summerwood | Lakewood | CA | 178,770 | 1968/2011 | 100.0% | 13 | Smart & Final, Marshalls, Henry’s Market/Sprouts, Alin Party Supply, HomeGoods |
| Food 4 Less – Target Center | Long Beach | CA | 196,436 | 1993, 2007/NAP | 100.0% | 7 | Target(2), Food 4 Less |
| El Super Center | La Puente | CA | 117,230 | 2012, 2014/NAP | 100.0% | 14 | El Super |
| Island Plaza | West Covina | CA | 77,772 | 1967, 1968, 1980, 1995/NAP | 100.0% | 11 | Island Pacific Market |
| Baldwin Park Promenade | Baldwin Park | CA | 49,906 | 2006, 2007/NAP | 100.0% | 11 | Smart & Final, CVS(2) |
| Lynwood Plaza | Lynwood | CA | 75,245 | 2003/NAP | 96.0% | 9 | Smart & Final, 99cents Only Store, Goodwill |
| El Cajon (CVS) | El Cajon | CA | 29,986 | 2005/NAP | 100.0% | 7 | CVS |
| Loma Vista | Fontana | CA | 97,547 | 1990/NAP | 99.2% | 13 | Superior Super Warehouse |
| MLK Medical | Lynwood | CA | 32,500 | 1958/2005 | 100.0% | 3 | ALTAMED Health Services, Kaiser Foundation Health Plan |
| Hawthorne Plaza | Hawthorne | CA | 70,750 | 1978/NAP | 100.0% | 2 | Marshalls, Walmart |
| Five Points Plaza | Rialto | CA | 89,537 | 1985-1986/NAP | 95.6% | 15 | El Super, Planet Fitness |
| Towne Center Square | Rancho Cucamonga | CA | 57,510 | 1995/NAP | 100.0% | 3 | Seafood City Supermarket |
| Camarillo | Camarillo | CA | 10,324 | 2014/NAP | 100.0% | 5 | NAP(3) |
| Total/Wtd. Avg. | 1,481,231 | 99.0% | 138 | ||||
| (1) | Information obtained from the underwritten rent roll. |
| (2) | The tenants lease their spaces pursuant to a ground lease. |
| (3) | Camarillo consists of in-line tenants but is a part of a power/outlet shopping center (the remainder of which is not collateral for the SoCal Retail Portfolio Whole Loan) anchored by Saks Off 5th, Neiman Marcus Last Call, Forever 21, and Gap. |
The following table presents historical occupancy percentages at the SoCal Retail Portfolio:
Historical Occupancy
12/31/2015(1) | 12/31/2016(1) | 12/31/2017(1) | 12/31/2018(1) | 3/1/2019(2) |
| 89.8% | 96.4% | 95.4% | 94.6% | 99.0% |
| (1) | Information provided by the SoCal Retail Portfolio Borrower. |
| (2) | Information obtained from the underwritten rent roll. |
THE INFORMATION IN THIS STRUCTURAL AND COLLATERAL TERM SHEET IS NOT COMPLETE AND MAY BE AMENDED PRIOR TO THE TIME OF SALE. THIS TERM SHEET IS NOT AN OFFER TO SELL THESE SECURITIES AND IT IS NOT A SOLICITATION OF AN OFFER TO BUY THESE SECURITIES IN ANY JURISDICTION WHERE THE OFFER OR SALE IS NOT PERMITTED.
59
| Loan #3 | Cut-off Date Balance: | $40,000,000 | ||
| Property Type - Various | SoCal Retail Portfolio | Cut-off Date LTV: | 52.0% | |
| Property Addresses - Various | U/W NCF DSCR: | 2.28x | ||
| U/W NOI Debt Yield: | 9.9% |
The following table presents historical occupancy percentages at each of the properties in the SoCal Retail Portfolio:
Historical Occupancy(1)
| Property Name | 2015 | 2016 | 2017 | 2018 | 3/1/2019 |
| The Springs | 80.3% | 91.8% | 91.1% | 95.7% | 98.4% |
| Summerwood | 98.0% | 99.2% | 100.0% | 100.0% | 100.0% |
| Food 4 Less - Target Center | 100.0% | 100.0% | 100.0% | 100.0% | 100.0% |
| El Super Center | 62.2% | 92.6% | 77.4% | 77.4% | 100.0% |
| Island Plaza | 80.7% | 100.0% | 100.0% | 100.0% | 100.0% |
| Baldwin Park Promenade | 93.0% | 93.0% | 97.0% | 100.0% | 100.0% |
| Lynwood Plaza | 94.4% | 90.4% | 96.0% | 80.1% | 96.0% |
| El Cajon (CVS) | 100.0% | 100.0% | 100.0% | 100.0% | 100.0% |
| Loma Vista | 100.0% | 100.0% | 99.2% | 99.2% | 99.2% |
| MLK Medical | 100.0% | 100.0% | 100.0% | 100.0% | 100.0% |
| Hawthorne Plaza | 100.0% | 100.0% | 100.0% | 100.0% | 100.0% |
| Five Points Plaza | 98.0% | 100.0% | 100.0% | 77.7% | 95.6% |
| Towne Center Square | 100.0% | 100.0% | 100.0% | 100.0% | 100.0% |
| Camarillo | 100.0% | 100.0% | 100.0% | 100.0% | 100.0% |
| Total/Wtd. Avg. | 89.8% | 96.4% | 95.4% | 94.6% | 99.0% |
| (1) | Information obtained from the underwritten rent roll. |
The four largest SoCal Retail Portfolio Properties (The Springs, Summerwood, Food 4 Less – Target Center and El Super Center) represent 56.1% of the total Cut-off Date Balance of the SoCal Retail Portfolio Whole Loan, comprise 60.1% of the net rentable area and account for 53.5% of the underwritten base rent.
The Springs (21.3% of Allocated Cut-off Date Balance; 26.9% of NRA; 19.0% of U/W NCF) – The Springs property is a 397,718 square foot, multi-tenant anchored neighborhood center featuring nine, single-story buildings located in Palm Springs, California. The Springs property is 98.4% leased as of March 1, 2019 and includes three pad sites that are ground leased to Jack in the Box and Wells Fargo, and one single-tenant outparcel building that is ground leased to The Home Depot. The improvements were constructed in 2008. The Springs property is served by 1,748 open parking spaces providing for a parking ratio of approximately 4.4 spaces per 1,000 square feet of net rentable area.
Summerwood(14.8% of Allocated Cut-off Date Balance; 12.1% of NRA; 14.5% of U/W NCF) – The Summerwood property is a 178,770 square foot multi-tenant anchored neighborhood center featuring four, single-story buildings in Lakewood, California. The Summerwood property is 100.0% leased as of March 1, 2019 and includes three pad sites that are leased to Chase Bank, US Army, US Air Force, Der Wienerschnitzel, Burgerhim, and IP Nails Spa. The majority of the improvements (main building) were constructed in 1968. The Summerwood property is anchored by Smart & Final, Marshalls, Henry’s Market/Sprouts, Alin Party Supply, and Home Goods with the remaining tenants representing a mix of local and national retailers. The Summerwood property is served by 674 open parking spaces providing for a parking ratio of approximately 3.8 spaces per 1,000 square feet of net rentable area.
Food 4 Less – Target Center (10.1% of Allocated Cut-off Date Balance; 13.3% of NRA; 9.8% of U/W NCF) – The Food 4 Less – Target Center property is a 196,436 square foot, multi-tenant anchored neighborhood center featuring four, single-story buildings located in Long Beach, California. The Food 4 Less – Target Center property is 100.0% leased as of March 1, 2019. The majority of the improvements (main building) were constructed in 1993 and 2007. The Food 4 Less – Target Center property is anchored by Target and Food 4 Less with the remaining tenants representing a mix of local and national retailers. Target and Taco Bell are leased pursuant to ground leases. The Food 4 Less – Target Center property is served by 782 open parking spaces providing for a parking ratio of approximately 4.0 spaces per 1,000 square feet of net rentable area.
El Super Center (9.9% of Allocated Cut-off Date Balance; 7.9% of NRA; 10.2% of U/W NCF) – The El Super Center property is a 117,230 square foot, multi-tenant anchored neighborhood center featuring three, single-story buildings located in La Puente, California. The majority of the improvements (main building) were constructed in 2012 and 2014. The El Super Center property is 100.0% leased as of March 1, 2019 and is anchored by El Super with the remaining tenants representing a mix of local and national retailers. The El Super Center property is served by 478 open parking spaces providing for a parking ratio of approximately 4.1 spaces per 1,000 square feet of net rentable area.
THE INFORMATION IN THIS STRUCTURAL AND COLLATERAL TERM SHEET IS NOT COMPLETE AND MAY BE AMENDED PRIOR TO THE TIME OF SALE. THIS TERM SHEET IS NOT AN OFFER TO SELL THESE SECURITIES AND IT IS NOT A SOLICITATION OF AN OFFER TO BUY THESE SECURITIES IN ANY JURISDICTION WHERE THE OFFER OR SALE IS NOT PERMITTED.
60
| Loan #3 | Cut-off Date Balance: | $40,000,000 | ||
| Property Type - Various | SoCal Retail Portfolio | Cut-off Date LTV: | 52.0% | |
| Property Addresses - Various | U/W NCF DSCR: | 2.28x | ||
| U/W NOI Debt Yield: | 9.9% |
The following table presents certain information relating to the leases at the SoCal Retail Portfolio Properties:
Tenant Summary(1)
| Tenant Name |
Locations | Credit Rating (Fitch/ S&P)(2) | Tenant NRSF | % of NRSF | Annual U/W Base Rent PSF | Annual U/W Base Rent(3) | % of Total Annual U/W Base Rent | Lease Expiration Date | Extension Options | Term. Options (Y/N) | 2018 Sales PSF / Occupancy Cost % |
| RETAIL PROPERTIES | |||||||||||
| Anchor Tenants | |||||||||||
| The Home Depot | 1 | A/A2/A | 149,591 | 10.1% | $3.82 | $572,180 | 2.4% | 1/31/2034 | 5, 5-year | N | $401 / 1.0% |
| Target | 1 | A-/A2/A | 133,987 | 9.0% | $8.72 | $1,168,940 | 5.0% | 1/31/2028 | 8, 5-year | N | $261 / 4.4% |
| Marshalls(4) | 3 | NR/A2/A+ | 92,132 | 6.2% | $13.18 | $1,214,542 | 5.2% | Various | Various | N | (5) |
| El Super(6) | 2 | NR/NR/NR | 91,967 | 6.2% | $10.70 | $984,419 | 4.2% | Various | Various | N | (7) |
| Superior Super Warehouse | 1 | NR/NR/NR | 81,071 | 5.5% | $7.45 | $603,979 | 2.6% | 4/30/2021 | 3, 5-year | N | $176 / 4.8% |
| Smart & Final(8) | 3 | NR/NR/B | 73,150 | 4.9% | $18.16 | $1,328,265 | 5.7% | Various | Various | N | (9) |
| Food 4 Less | 1 | NR/Baa1/BBB | 52,924 | 3.6% | $17.00 | $899,708 | 3.8% | 6/30/2033 | 3, 5-year | N | $505 / 4.2% |
| Walmart | 1 | AA/Aa2/AA | 35,500 | 2.4% | $11.80 | $419,000 | 1.8% | 7/9/2023 | 4, 5-year | N | N/A |
| Ross Dress for Less | 1 | NR/A3/A- | 30,000 | 2.0% | $8.75 | $262,500 | 1.1% | 2/1/2029 | 4, 5-year | N | $433 / 2.7% |
| Seafood City Supermarket | 1 | NR/NR/NR | 28,583 | 1.9% | $13.50 | $385,871 | 1.6% | 10/31/2023 | 3, 5-year | N | $455 / 4.1% |
| Bed Bath & Beyond | 1 | NR/Baa3/BB+ | 28,245 | 1.9% | $13.20 | $372,834 | 1.6% | 1/31/2025 | 4, 5-year | N | $276 / 5.7% |
| Party City | 2 | NR/NR/NR | 27,724 | 1.9% | $17.86 | $495,203 | 2.1% | Various | Various | N | $166 / 14.1%(10) |
| Henry’s Market/Sprouts | 1 | NR/NR/NR | 27,072 | 1.8% | $19.80 | $536,026 | 2.3% | 6/30/2021 | 4, 5-year | N | $768 / 2.8% |
| Alin Party Supply | 1 | NR/NR/NR | 27,004 | 1.8% | $20.76 | $560,603 | 2.4% | 5/31/2024 | 3, 5-year | N | N/A |
| Home Goods | 1 | NR/A2/A+ | 24,000 | 1.6% | $10.50 | $252,000 | 1.1% | 2/28/2023 | 4, 5-year | N | $325 / 3.8% |
| Planet Fitness | 1 | NR/NR/NR | 19,700 | 1.3% | $15.00 | $295,500 | 1.3% | 5/31/2029 | 2, 5-year | N | N/A |
| Subtotal/Wtd. Avg. | 922,650 | 62.3% | $11.22 | $10,351,569 | 44.1% | ||||||
| Major Tenants | 101,738 | 6.9% | $18.53 | $1,885,286 | 8.0% | ||||||
| In Line Tenants | 389,148 | 26.3% | $25.05 | $9,746,706 | 41.6% | ||||||
| Remaining Outparcel Tenants | 20,505 | 1.4% | $25.24 | $517,454 | 2.2% | ||||||
| Other Tenants | 500 | 0.0% | $127.87 | $63,937 | 0.3% | ||||||
| Subtotal/Wtd. Avg. | 511,891 | 34.6% | $23.86 | $12,213,382 | 52.1% | ||||||
| Vacant Retail | 14,190 | 1.0% | |||||||||
| Retail Collateral Subtotal | 1,448,731 | 97.8% | $15.73 | $22,564,951 | 96.2% | ||||||
| Office Collateral Subtotal(11) | 32,500 | 2.2% | $27.29 | $886,881 | 3.8% | ||||||
| Total/Wtd. Avg. | 1,481,231 | 100.0% | $15.99 | $23,451,832 | 100.0% | ||||||
| (1) | Information is based on the underwritten rent roll. |
| (2) | Certain ratings are those of the parent company, whether or not the parent guarantees the lease. |
| (3) | Annual UW Rent PSF and Annual UW Rent include contractual rent steps through March 2020 totaling $168,288 and straight-line rent totaling $176,105 for investment grade rated tenants through their respective lease terms within the SoCal Retail Portfolio Whole Loan term. |
| (4) | Marshalls leases 35,250 square feet at the Hawthorne Plaza property expiring October 31, 2020, 28,652 square feet at The Springs property expiring April 30, 2024 and 28,230 square feet at the Summerwood property expiring September 30, 2022. |
| (5) | The 2018 Sales PSF / Occupancy Cost % for Marshalls at the Hawthorne Plaza property, The Springs property, and the Summerwood property were $336 / 5.0%, $234 / 7.4%, and $336 / 4.1%, respectively. |
| (6) | El Super leases 46,967 square feet at the Five Points Plaza property expiring March 31, 2025 and 45,000 square feet at the El Super Center property expiring March 31, 2027. |
| (7) | The 2018 Sales PSF / Occupancy Cost % for El Super at the Five Points Plaza property and El Super Center property were $516 / 1.9% and $476 / 4.2%, respectively. |
| (8) | Smart & Final leases 31,500 square feet at the Summerwood property expiring June 30, 2021, 20,925 square feet at the Lynwood Plaza property expiring September 30, 2023 and 20,725 square feet at the Baldwin Park Promenade property expiring December 31, 2022. |
| (9) | The 2018 Sales PSF / Occupancy Cost % for Smart & Final at the Summerwood property, the Lynwood Plaza property, and the Baldwin Park Promenade property were $619 / 4.1%, $516 / 3.6%, and $753 / 3.3%, respectively. |
| (10) | 2018 Sales PSF / Occupancy Cost % is for the Party City located at the Towne Center Square property. |
| (11) | 5,000 square feet of the MLK Medical property is leased to Chase Bank as retail space. |
THE INFORMATION IN THIS STRUCTURAL AND COLLATERAL TERM SHEET IS NOT COMPLETE AND MAY BE AMENDED PRIOR TO THE TIME OF SALE. THIS TERM SHEET IS NOT AN OFFER TO SELL THESE SECURITIES AND IT IS NOT A SOLICITATION OF AN OFFER TO BUY THESE SECURITIES IN ANY JURISDICTION WHERE THE OFFER OR SALE IS NOT PERMITTED.
61
| Loan #3 | Cut-off Date Balance: | $40,000,000 | ||
| Property Type - Various | SoCal Retail Portfolio | Cut-off Date LTV: | 52.0% | |
| Property Addresses - Various | U/W NCF DSCR: | 2.28x | ||
| U/W NOI Debt Yield: | 9.9% |
The following table presents certain information relating to the lease rollover schedule at the SoCal Retail Portfolio Properties:
Lease Expiration Schedule(1)(2)
| Year Ending December 31, | No. of Leases Expiring | Expiring NRSF | % of Total NRSF | Cumulative Expiring NRSF | Cumulative % of Total NRSF | Annual U/W Base Rent(3) | % of Total Annual U/W Base Rent | Annual U/W Base Rent PSF(3) |
| MTM | 15 | 27,215 | 1.8% | 27,215 | 1.8% | $673,216 | 2.9% | $24.74 |
| 2019 | 8 | 12,218 | 0.8% | 39,433 | 2.7% | $515,232 | 2.2% | $42.17 |
| 2020 | 13 | 72,769 | 4.9% | 112,202 | 7.6% | $1,776,342 | 7.6% | $24.41 |
| 2021 | 16 | 221,015 | 14.9% | 333,217 | 22.5% | $3,481,695 | 14.8% | $15.75 |
| 2022 | 16 | 128,134 | 8.7% | 461,351 | 31.1% | $2,295,693 | 9.8% | $17.92 |
| 2023 | 22 | 195,734 | 13.2% | 657,085 | 44.4% | $3,266,662 | 13.9% | $16.69 |
| 2024 | 12 | 114,267 | 7.7% | 771,352 | 52.1% | $2,371,547 | 10.1% | $20.75 |
| 2025 | 9 | 103,441 | 7.0% | 874,793 | 59.1% | $1,600,345 | 6.8% | $15.47 |
| 2026 | 3 | 31,483 | 2.1% | 906,276 | 61.2% | $481,336 | 2.1% | $15.29 |
| 2027 | 5 | 64,986 | 4.4% | 971,262 | 65.6% | $1,113,493 | 4.7% | $17.13 |
| 2028 | 6 | 163,984 | 11.1% | 1,135,246 | 76.6% | $1,908,358 | 8.1% | $11.64 |
| 2029 | 7 | 86,866 | 5.9% | 1,222,112 | 82.5% | $1,604,278 | 6.8% | $18.47 |
| 2030 & Beyond | 6 | 244,929 | 16.5% | 1,467,041 | 99.0% | $2,363,634 | 10.1% | $9.65 |
| Vacant | 0 | 14,190 | 1.0% | 1,481,231 | 100.0% | $0 | 0.0% | $0.00 |
| Total/Wtd. Avg.(3) | 138 | 1,481,231 | 100.0% | $23,451,832 | 100.0% | $15.99 | ||
| (1) | Information is based on the underwritten rent roll. |
| (2) | Certain tenants may have lease termination options that are exercisable prior to the originally stated expiration date of the subject lease and that are not considered in the Lease Rollover Schedule. |
| (3) | Total/Wtd. Avg. UW Base Rent PSF Rolling excludes vacant space. |
THE INFORMATION IN THIS STRUCTURAL AND COLLATERAL TERM SHEET IS NOT COMPLETE AND MAY BE AMENDED PRIOR TO THE TIME OF SALE. THIS TERM SHEET IS NOT AN OFFER TO SELL THESE SECURITIES AND IT IS NOT A SOLICITATION OF AN OFFER TO BUY THESE SECURITIES IN ANY JURISDICTION WHERE THE OFFER OR SALE IS NOT PERMITTED.
62
| Loan #3 | Cut-off Date Balance: | $40,000,000 | ||
| Property Type - Various | SoCal Retail Portfolio | Cut-off Date LTV: | 52.0% | |
| Property Addresses - Various | U/W NCF DSCR: | 2.28x | ||
| U/W NOI Debt Yield: | 9.9% |
Operating History and Underwritten Net Cash Flow. The following table presents certain information relating to the historical operating performance and underwritten net cash flow at the SoCal Retail Portfolio Properties:
Cash Flow Analysis
| 2015 | 2016 | 2017 | 2018 | U/W | %(1) | U/W $ Per SF | |
| Gross Potential Rent(2) | $17,808,656 | $19,501,322 | $20,755,370 | $21,205,934 | $23,849,512 | 86.1% | $16.10 |
| Total Recoveries | 4,098,198 | 3,632,909 | 4,616,106 | 4,506,449 | 5,509,490 | 19.9 | $3.72 |
| Total Other Income(3) | 46,737 | 65,476 | 72,632 | 60,051 | 60,051 | 0.2 | $0.04 |
| Less Vacancy | 0 | 0 | 0 | 0 | (1,726,743) | (6.2) | ($1.17) |
| Effective Gross Income | $21,953,591 | $23,199,707 | $25,444,108 | $25,772,434 | $27,692,309 | 100.0% | $18.70 |
| Real Estate Taxes | 1,903,334 | 2,101,831 | 2,356,042 | 2,309,614 | 3,044,165 | 11.0 | $2.06 |
| Insurance | 336,737 | 392,448 | 370,666 | 398,828 | 375,777 | 1.4 | $0.25 |
| Management Fee | 658,608 | 695,991 | 763,323 | 773,173 | 830,769 | 3.0 | $0.56 |
| Other Operating Expenses | 1,787,917 | 2,236,444 | 2,196,453 | 2,212,034 | 2,212,034 | 8.0 | $1.49 |
| Total Expenses | $4,686,595 | $5,426,714 | $5,686,484 | $5,693,649 | $6,462,745 | 23.3% | $4.36 |
| Net Operating Income(4) | $17,266,996 | $17,772,993 | $19,757,624 | $20,078,785 | $21,229,564 | 76.7% | $14.33 |
| Capital Expenditures | 0 | 0 | 0 | 0 | 296,246 | 1.1 | $0.20 |
| TI/LC | 0 | 0 | 0 | 0 | 740,616 | 2.7 | $0.50 |
| Net Cash Flow | $17,266,996 | $17,772,993 | $19,757,624 | $20,078,785 | $20,192,703 | 72.9% | $13.63 |
| Occupancy % | 88.7% | 96.3% | 95.4% | 99.0%(5) | 94.1% | ||
| NOI DSCR(6) | 1.95x | 2.01x | 2.23x | 2.27x | 2.40x | ||
| NCF DSCR(6) | 1.95x | 2.01x | 2.23x | 2.27x | 2.28x | ||
| NOI Debt Yield(6) | 8.0% | 8.3% | 9.2% | 9.3% | 9.9% | ||
| NCF Debt Yield(6) | 8.0% | 8.3% | 9.2% | 9.3% | 9.4% | ||
| (1) | Represents percent of Effective Gross Income. |
| (2) | Includes contractual rent steps through March 2020 totaling $168,288 and straight-line rent totaling $176,105 for investment grade rated tenants through their respective lease terms within the SoCal Retail Portfolio Whole Loan term. |
| (3) | Total Other Income is comprised of miscellaneous fees and expenses. |
| (4) | The difference in net operating income between 2016 and 2017 is primarily due to contractual rent steps and increase in rent from new and renewal leases. The increase in UW Net Operating Income from 2018 Net Operating Income is primarily due to $344,394 of rent steps and straight-line rent and new leases executed at higher rents. |
| (5) | Based on the underwritten rent roll as of March 1, 2019. |
| (6) | Debt service coverage ratios and debt yields are calculated based on the SoCal Retail Portfolio Whole Loan. |
Appraisal.The appraiser concluded to an “as-is” Appraised Value for the SoCal Retail Portfolio Properties of $413,250,000 in appraisals dated from March 20, 2019 to April 9, 2019.
Environmental Matters.According to Phase I environmental site assessments dated from March 5, 2019 to April 3, 2019, there was no evidence of any recognized environmental conditions at the SoCal Retail Portfolio Properties.
Market Overview.The SoCal Retail Portfolio Properties are located in 13 cities and nine submarkets throughout Southern California. For the fourth quarter of 2018, the submarket vacancies for the respective submarkets ranged between 2.7% and 10.1% and asking rent ranged from $17.17 to $28.89 per square foot. The population within a three-mile radius of the SoCal Retail Portfolio Properties ranged from 48,516 to 429,921. The median household income within a three-mile radius of the SoCal Retail Portfolio Properties ranged from $42,214 to $94,080.
THE INFORMATION IN THIS STRUCTURAL AND COLLATERAL TERM SHEET IS NOT COMPLETE AND MAY BE AMENDED PRIOR TO THE TIME OF SALE. THIS TERM SHEET IS NOT AN OFFER TO SELL THESE SECURITIES AND IT IS NOT A SOLICITATION OF AN OFFER TO BUY THESE SECURITIES IN ANY JURISDICTION WHERE THE OFFER OR SALE IS NOT PERMITTED.
63
| Loan #3 | Cut-off Date Balance: | $40,000,000 | ||
| Property Type - Various | SoCal Retail Portfolio | Cut-off Date LTV: | 52.0% | |
| Property Addresses - Various | U/W NCF DSCR: | 2.28x | ||
| U/W NOI Debt Yield: | 9.9% |
The following table presents certain information relating to market statistics for the SoCal Retail Portfolio Properties:
Market Statistics(1)
| Submarket | Property Type | Submarket | Inventory (SF) | Completions (SF) | Submarket Vacancy | Asking Rent ($/SF NNN) | Net Absorption (SF) |
| The Springs | Retail | Coachella Valley | 27,060,941 | 6,004 | 9.6% | $21.03 | (38,054) |
| Summerwood | Retail | Long Beach | 13,077,931 | 1,958 | 5.4% | $27.09 | (6,302) |
| Food 4 Less - Target Center | Retail | Long Beach | 13,077,931 | 1,958 | 5.4% | $27.09 | (6,302) |
| El Super Center | Retail | Eastern SGV | 42,865,608 | - | 3.9% | $23.63 | (35,787) |
| Island Plaza | Retail | Eastern SGV | 42,865,608 | - | 3.9% | $23.63 | (35,787) |
| Baldwin Park Promenade | Retail | Eastern SGV | 42,865,608 | - | 3.9% | $23.63 | (35,787) |
| Lynwood Plaza | Retail | Mid-Cities Retail | 50,095,580 | 3,595 | 4.2% | $25.31 | (149,897) |
| El Cajon (CVS) | Retail | El Cajon | 9,188,919 | - | 3.6% | $22.41 | (44,004) |
| Loma Vista | Retail | Airport Area | 25,730,577 | 49,335 | 4.4% | $23.81 | 45,463 |
| MLK Medical | Office | Mid-Cities Office | 12,718,440 | - | 8.4% | $26.05 | (8,101) |
| Hawthorne Plaza | Retail | Hawthorne/Gardena | 13,056,068 | (5,679) | 8.6% | $24.87 | (10,996) |
| Five Points Plaza | Retail | East San Bernardino | 30,615,010 | 324,545 | 10.1% | $17.17 | 240,319 |
| Towne Center Square | Retail | Airport Area | 25,730,577 | 49,335 | 4.4% | $23.81 | 45,463 |
| Camarillo | Retail | Camarillo/Point Mugu | 3,969,547 | - | 2.7% | $28.89 | 56,988 |
Source: Appraisal
| (1) | Information is as of fourth quarter of 2018. |
The following table presents certain information relating to demographics for the SoCal Retail Portfolio Properties:
Demographics(1)
| Population | Median Household Income | |||||
| Property Name | 1-Mile | 3-Mile | 5-Mile | 1-Mile | 3-Mile | 5-Mile |
| The Springs | 6,790 | 76,543 | 110,219 | $46,718 | $49,891 | $53,041 |
| Summerwood | 25,194 | 189,839 | 694,263 | $97,235 | $84,591 | $68,307 |
| Food 4 Less – Target Center | 32,522 | 325,054 | 729,684 | $50,603 | $53,094 | $57,644 |
| El Super Center | 35,118 | 227,960 | 517,284 | $61,130 | $65,727 | $65,131 |
| Island Plaza | 29,058 | 184,247 | 452,622 | $67,837 | $71,080 | $73,079 |
| Baldwin Park Promenade | 36,573 | 246,866 | 550,678 | $54,003 | $57,071 | $61,888 |
| Lynwood Plaza | 53,533 | 429,921 | 1,019,580 | $44,938 | $42,214 | $41,818 |
| El Cajon (CVS) | 30,732 | 159,196 | 323,928 | $42,689 | $57,248 | $62,408 |
| Loma Vista | 25,643 | 184,192 | 353,738 | $47,165 | $60,000 | $67,422 |
| MLK Medical | 50,648 | 401,924 | 993,087 | $52,947 | $45,187 | $45,113 |
| Hawthorne Plaza | 32,586 | 301,044 | 616,823 | $63,030 | $69,015 | $66,332 |
| Five Points Plaza | 28,601 | 168,909 | 369,807 | $45,520 | $49,344 | $46,296 |
| Towne Center Square | 18,587 | 138,763 | 277,709 | $77,844 | $77,476 | $77,923 |
| Camarillo | 9,811 | 48,516 | 87,345 | $70,983 | $94,080 | $91,576 |
Source: Appraisal
| (1) | Information is as of 2018. |
Escrows.
Real Estate Taxes –The SoCal Retail Portfolio Mortgage Loan documents require an upfront real estate tax reserve of $680,770 and ongoing monthly real estate tax reserves in an amount equal to one-twelfth of the real estate taxes that the lender estimates will be payable during the next 12 months (initially $226,923).
Insurance- The SoCal Retail Portfolio Mortgage Loan documents require ongoing monthly insurance reserves in an amount equal to one-twelfth of the annual estimated insurance premiums (unless the SoCal Retail Portfolio Borrowers maintain acceptable blanket insurance policies and no event of default is continuing).
THE INFORMATION IN THIS STRUCTURAL AND COLLATERAL TERM SHEET IS NOT COMPLETE AND MAY BE AMENDED PRIOR TO THE TIME OF SALE. THIS TERM SHEET IS NOT AN OFFER TO SELL THESE SECURITIES AND IT IS NOT A SOLICITATION OF AN OFFER TO BUY THESE SECURITIES IN ANY JURISDICTION WHERE THE OFFER OR SALE IS NOT PERMITTED.
64
| Loan #3 | Cut-off Date Balance: | $40,000,000 | ||
| Property Type - Various | SoCal Retail Portfolio | Cut-off Date LTV: | 52.0% | |
| Property Addresses - Various | U/W NCF DSCR: | 2.28x | ||
| U/W NOI Debt Yield: | 9.9% |
Replacement Reserves –The SoCal Retail Portfolio Mortgage Loan documents require ongoing monthly replacement reserves of $24,687, capped at $592,492.
TI/LC Reserve – The SoCal Retail Portfolio Mortgage Loan documents require an upfront TI/LC reserve of $3,000,000 and ongoing monthly TI/LC reserves of $123,436 upon the TI/LC reserve balance being less than $1,000,000, capped at $3,000,000.
Free Rent Reserve – The SoCal Retail Portfolio Mortgage Loan documents require an upfront Free Rent Reserve of $729,724 on account of outstanding free rent.
Lockbox and Cash Management. The SoCal Retail Portfolio Whole Loan is structured with a hard lockbox and springing cash management. The SoCal Retail Portfolio Borrowers are required to direct each tenant of the SoCal Retail Portfolio Properties to deposit funds directly into the lockbox account and to deposit any funds received by the SoCal Retail Portfolio Borrowers and the property manager, notwithstanding such direction, into the lockbox account within one business day of receipt. If no Cash Management Period (as defined below) exists, amounts on deposit in the lockbox account are required to be disbursed to the SoCal Retail Portfolio Borrowers’ operating account on each business day. Upon the occurrence of a Cash Management Period, the lender may establish, and the SoCal Retail Portfolio Borrowers are required to cooperate to establish, a lender-controlled cash management account. If a Cash Management Period exists, funds on deposit in the lockbox account are required to be transferred to a lender-controlled cash management account, and applied to make monthly deposits to the tax reserve and insurance reserve as described above under “Escrows and Reserves,” to pay debt service on the SoCal Retail Portfolio Whole Loan, to make monthly deposits to the replacement reserve, to make monthly deposits to the TI/LC reserve, to pay approved operating expenses in accordance with the annual budget (which is required to be reasonably approved by the lender during the continuance of a Cash Management Period) and pay extraordinary expenses approved by the lender, and to pay any remainder into a cash collateral account. In each case, the amounts deposited in the cash collateral account are required to be held as additional collateral for the SoCal Retail Portfolio Whole Loan during the continuance of the Cash Management Period; provided that during the continuance of an event of default under the SoCal Retail Portfolio Whole Loan such amounts may be applied to prepay the debt.
A “Cash Management Period” will commence (i) upon the stated maturity date, (ii) upon the occurrence of an event of default under the loan documents, or (iii) if, as of the last day of each calendar quarter, the interest only debt service coverage ratio is less than 1.45x. A Cash Management Period will terminate if (i) the SoCal Retail Portfolio Whole Loan and all other obligations under the loan documents have been repaid in full or (ii) the stated maturity date has not occurred and (A) with respect to the matters described in clause (ii) above, such event of default has been cured (or has been otherwise waived in writing) and no other event of default is continuing or (B) with respect to the matter described in clause (iii) above, the SoCal Retail Portfolio Properties have achieved an interest only debt service coverage ratio of at least 1.50x for two consecutive calendar quarters.
Property Management.The SoCal Retail Portfolio Properties are self-managed by Excel Property Management, an affiliate of the SoCal Retail Portfolio Borrowers. Excel Property Management provides management and leasing services for approximately 120 properties owned by the Sponsor throughout Southern California and Nevada.
Release of Property. On any business day after the earlier to occur of (i) the third anniversary date of the SoCal Retail Portfolio Whole Loan origination date or (ii) two years after the final note is securitized (the “Release Date”), the SoCal Retail Portfolio Whole Loan documents permit any of the SoCal Retail Portfolio Borrowers to obtain the release of any property in the SoCal Retail Portfolio Properties upon a bona fide third-party sale of such property subject to among other things, the following: (i) no default or event of default has occurred or is continuing, (ii) payment of principal in an amount equal to 120% of the allocated loan amount of the applicable property; provided however, in the event that the debt yield of the SoCal Retail Portfolio Properties is equal to or greater than 10.25%, the foregoing release condition will instead be 110% of the allocated loan amount of the applicable property, (iii) payment of any yield maintenance premium (if then applicable), (iv) the debt yield for all the properties then remaining will be no less than the greater of (A) the lesser of (x) the debt yield immediately preceding such release and (y) 10.00% and (B) 9.25%, and (v) customary REMIC requirements are satisfied.
Transfer and Assumption. In connection with an arms’ length sale of one or more of the SoCal Retail Portfolio Properties to a third party unaffiliated with the SoCal Retail Portfolio Borrowers or the related guarantor (“New Borrower”), the SoCal Retail Portfolio Whole Loan documents grant the SoCal Retail Portfolio Borrowers the one-time right to request the lender’s consent to sever the SoCal Retail Portfolio Whole Loan and have such New Borrower partially assume the SoCal Retail Portfolio Whole Loan, whereby (i) the SoCal Retail Portfolio Properties that are then serving as collateral will be divided into two or more pools of properties (the severed loan(s) that is secured by the SoCal Retail Portfolio Properties being assumed in connection with such partial transfer and assumption (the “New Severed Loan”) and the severed loan which is secured by the remaining SoCal Retail Portfolio Properties (the “Existing Severed Loan”)) and (ii) the New Severed Loan(s) and Existing Severed Loan(s) will each be in the principal amount corresponding to the sum of the respective allocated loan amounts of the SoCal Retail Portfolio Properties in the related pool. The lender’s consent to such request may be withheld in its reasonable discretion and will be subject to the satisfaction of certain conditions, including, among other things, the following: (i) no default or event of default is continuing, (ii) the transferee is a special purpose bankruptcy remote entity, (iii) receipt of a rating agency confirmation, (iv) receipt of satisfactory public record searches of such transferee, (v) customary REMIC requirements are satisfied, (vi) delivery of an assumption fee in the amount of 0.25% of the amount of the New Severed Loan; (vii) each pool of properties consists of no less than one property; (viii) after giving effect to such partial transfer and assumption, the debt yield for each of the severed loans will be no less than the greater of (a) the debt yield of the SoCal Retail Portfolio Whole Loan preceding such partial transfer and assumption and (b) 9.25%; (ix) after giving effect to such partial transfer and assumption, the principal balance for each of the severed loans will be no more than 65% of the appraised value of all of the respective properties included in the related pool securing such severed loans; (x) the weighted average of the remaining unexpired lease terms in the pool
THE INFORMATION IN THIS STRUCTURAL AND COLLATERAL TERM SHEET IS NOT COMPLETE AND MAY BE AMENDED PRIOR TO THE TIME OF SALE. THIS TERM SHEET IS NOT AN OFFER TO SELL THESE SECURITIES AND IT IS NOT A SOLICITATION OF AN OFFER TO BUY THESE SECURITIES IN ANY JURISDICTION WHERE THE OFFER OR SALE IS NOT PERMITTED.
65
| Loan #3 | Cut-off Date Balance: | $40,000,000 | ||
| Property Type - Various | SoCal Retail Portfolio | Cut-off Date LTV: | 52.0% | |
| Property Addresses - Various | U/W NCF DSCR: | 2.28x | ||
| U/W NOI Debt Yield: | 9.9% |
of SoCal Retail Portfolio Properties securing the New Severed Loan is greater than the weighted average of the remaining unexpired lease terms included in the pools securing all other severed loans; and (xi) the debt service coverage ratio (on an interest-only basis) applicable to each severed loan and the related pool of SoCal Retail Portfolio Properties is no less than 2.28x. Additionally, the related co-lender agreement requires the holders of the SoCal Retail Portfolio Mortgage Loan and the SoCal Retail Portfolio Non-ServicedPari Passu Companion Loans to cooperate (i) to execute amendments to the related co-lender agreement to reflect the SoCal Retail Portfolio Properties securing the Existing Severed Loan following such partial transfer and assumption and the reduction in the principal balances of the promissory notes evidencing the Existing Severed Loan in an amount corresponding to the principal amount of the New Severed Loan and (ii) to execute a separate co-lender agreement on terms substantially similar to those in the related co-lender agreement with respect to the new promissory notes evidencing the New Severed Loan.
Real Estate Substitution. On any business day after the Release Date, the SoCal Retail Portfolio Whole Loan documents permit any SoCal Retail Portfolio Borrower to obtain the release of a property from the lien of the mortgage and the release of such SoCal Retail Portfolio Borrower’s obligations under the SoCal Retail Portfolio Whole Loan documents with respect to such released property by simultaneously substituting another property for the released property, subject to the satisfaction of certain conditions, including, among other things, that: (i) no monetary event of default has occurred and is continuing; (ii) the allocated loan amounts for all properties substituted would not exceed 20% of the original principal balance of the SoCal Retail Portfolio Whole Loan; (iii) such substitution would not occur in the 12-month period prior to the stated maturity date of the SoCal Retail Portfolio Whole Loan; (iv) after giving effect to such substitution, the debt service coverage ratio for all remaining SoCal Retail Portfolio Properties subject to the lien of the mortgage is greater than or equal to the debt service coverage ratio for all SoCal Retail Portfolio Properties subject to the lien of the mortgage immediately preceding such substitution; (v) the borrower delivers to the lender an appraisal with respect to the released property and the substitute property indicating that the appraised value of such substitute property is greater than or equal to 110% of the appraised value of the released property, (vi) delivery of a rating agency confirmation letter to the lender; (vii) delivery to the lender of all industry standard due diligence materials similar to those delivered at the origination of the SoCal Retail Portfolio Whole Loan; and (viii) customary REMIC requirements are satisfied. Additionally, if two substitutions have previously been requested by a SoCal Retail Portfolio Borrower, any additional substitutions will only be permitted by the lender in its sole discretion.
Right of First Offer/Right of First Refusal.A tenant or tenants at each of Food 4 Less – Target Center, Baldwin Park Promenade, Lynwood Plaza and Loma Vista properties has a right of first refusal to purchase the related SoCal Retail Portfolio Property (or the applicable portion thereof) in the event of a proposed transfer of such property (or the applicable portion of such property). A tenant or tenants at each of Hawthorne Plaza and The Springs properties has a right of first offer to purchase the related SoCal Retail Portfolio Property (or a portion thereof) in the event the applicable SoCal Retail Portfolio Borrower desires to sell such property (or the applicable portion thereof). None of such rights of first refusal or rights of first offer are applicable to a transfer of (i) any of the related SoCal Retail Portfolio Properties in connection with any foreclosure sale, deed-in-lieu of foreclosure or other similar sale or (ii) the entire portfolio of properties.
Subordinate and Mezzanine Indebtedness.None.
Ground Lease.None.
Terrorism Insurance.The SoCal Retail Portfolio Whole Loan documents require that the “all risk” insurance policy required to be maintained by the SoCal Retail Portfolio Borrower provides coverage for terrorism in an amount equal to the full replacement cost of the SoCal Retail Portfolio Properties, as well as business interruption insurance covering no less than the 18-month period following the occurrence of a casualty event.
Earthquake Insurance.The SoCal Retail Portfolio Mortgage Loan documents do not require earthquake insurance. The seismic reports for all of the properties in the portfolio indicated Scenario Expected Losses ranging between 11.0% and 17.0%.
THE INFORMATION IN THIS STRUCTURAL AND COLLATERAL TERM SHEET IS NOT COMPLETE AND MAY BE AMENDED PRIOR TO THE TIME OF SALE. THIS TERM SHEET IS NOT AN OFFER TO SELL THESE SECURITIES AND IT IS NOT A SOLICITATION OF AN OFFER TO BUY THESE SECURITIES IN ANY JURISDICTION WHERE THE OFFER OR SALE IS NOT PERMITTED.
66
(THIS PAGE INTENTIONALLY LEFT BLANK)
THE INFORMATION IN THIS STRUCTURAL AND COLLATERAL TERM SHEET IS NOT COMPLETE AND MAY BE AMENDED PRIOR TO THE TIME OF SALE. THIS TERM SHEET IS NOT AN OFFER TO SELL THESE SECURITIES AND IT IS NOT A SOLICITATION OF AN OFFER TO BUY THESE SECURITIES IN ANY JURISDICTION WHERE THE OFFER OR SALE IS NOT PERMITTED.
67
| Hospitality – Full Service | Loan #4 | Cut-off Date Balance: | $38,455,033 | |
| 267 Marietta Street | Embassy Suites at Centennial Olympic Park | Cut-off Date LTV: | 68.4% | |
| Atlanta, GA 30313 | U/W NCF DSCR: | 1.72x | ||
| U/W NOI Debt Yield: | 11.7% |

THE INFORMATION IN THIS STRUCTURAL AND COLLATERAL TERM SHEET IS NOT COMPLETE AND MAY BE AMENDED PRIOR TO THE TIME OF SALE. THIS TERM SHEET IS NOT AN OFFER TO SELL THESE SECURITIES AND IT IS NOT A SOLICITATION OF AN OFFER TO BUY THESE SECURITIES IN ANY JURISDICTION WHERE THE OFFER OR SALE IS NOT PERMITTED.
68
| Hospitality – Full Service | Loan #4 | Cut-off Date Balance: | $38,455,033 | |
| 267 Marietta Street | Embassy Suites at Centennial Olympic Park | Cut-off Date LTV: | 68.4% | |
| Atlanta, GA 30313 | U/W NCF DSCR: | 1.72x | ||
| U/W NOI Debt Yield: | 11.7% |
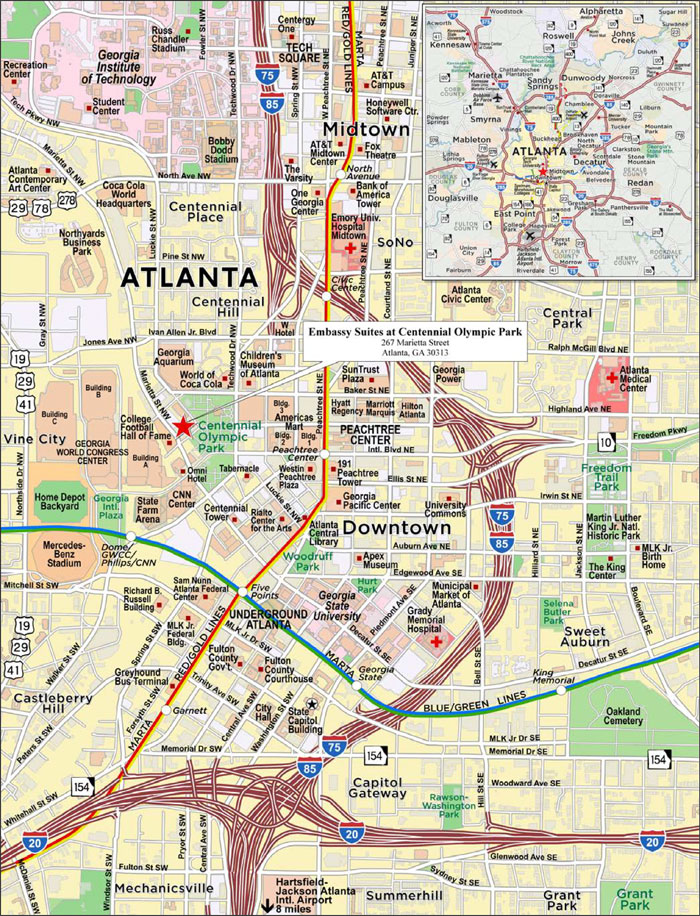
THE INFORMATION IN THIS STRUCTURAL AND COLLATERAL TERM SHEET IS NOT COMPLETE AND MAY BE AMENDED PRIOR TO THE TIME OF SALE. THIS TERM SHEET IS NOT AN OFFER TO SELL THESE SECURITIES AND IT IS NOT A SOLICITATION OF AN OFFER TO BUY THESE SECURITIES IN ANY JURISDICTION WHERE THE OFFER OR SALE IS NOT PERMITTED.
69
| No. 4 – Embassy Suites at Centennial Olympic Park | |||||||
| Mortgage Loan Information | Mortgaged Property Information | ||||||
| Mortgage Loan Seller: | Argentic Real Estate Finance LLC | Single Asset/Portfolio: | Single Asset | ||||
Credit Assessment (Fitch/KBRA/Moody’s): | NR/NR/NR | Property Type – Subtype: | Hospitality – Full Service | ||||
| Location: | Atlanta, GA | ||||||
Original Principal Balance(1): Cut-off Date Balance(1): | $38,500,000 $38,455,033 | Size: | 321 Rooms | ||||
| % of Initial Pool Balance: | 4.3% | Cut-off Date Balance Per Room(1): | $259,820.79 | ||||
| Loan Purpose: | Refinance | Maturity Date Balance Per Room(1): | $210,999.63 | ||||
| Borrower Sponsor: | David D. Marvin | Year Built/Renovated: | 1999/2017 | ||||
| Title Vesting: | Fee | ||||||
| Guarantor: | David D. Marvin | Property Manager: | LHP ES1, LLC (borrower related) | ||||
| Mortgage Rate: | 4.5900% | Current Occupancy (As of): | 84.2% (4/30/2019) | ||||
| Note Date: | June 7, 2019 | YE 2018 Occupancy: | 82.2% | ||||
| Seasoning: | 1 month | YE 2017 Occupancy: | 79.4% | ||||
| Maturity Date: | July 6, 2029 | YE 2016 Occupancy: | 76.0% | ||||
| IO Period: | 0 months | ||||||
| Loan Term (Original): | 120 months | Appraised Value(4): | $122,000,000 | ||||
| Amortization Term (Original): | 360 months | Appraised Value Per Room(4): | $380,062 | ||||
| Loan Amortization Type: | Amortizing Balloon | Appraisal Valuation Date: | May 7, 2019 | ||||
| Call Protection(2): | L(25),D(91),O(4) | ||||||
| Lockbox Type: | Hard/Springing Cash Management | ||||||
| Additional Debt(1)(3): | Yes | Underwriting and Financial Information | |||||
| Additional Debt Type (Balance)(1)(3): | Pari Passu($44,947,441.39) | TTM NOI (4/30/2019): | $9,786,692 | ||||
| YE 2018 NOI: | $8,476,039 | ||||||
| YE 2017 NOI: | $8,144,924 | ||||||
| YE 2016 NOI: | $7,150,917 | ||||||
| U/W Revenues: | $23,146,771 | ||||||
| Escrows and Reserves(3) | U/W Expenses: | $13,382,534 | |||||
| Initial | Monthly | Cap | U/W NOI: | $9,764,237 | |||
| Taxes | $275,906 | $68,977 | NAP | U/W NCF: | $8,838,366 | ||
| Insurance | $38,455 | $12,818 | NAP | U/W DSCR based on NOI/NCF(1): | 1.90x / 1.72x | ||
| FF&E Reserve | $0 | $79,022 | NAP | U/W Debt Yield based on NOI/NCF(1): | 11.7% / 10.6% | ||
| Rent Reserve | $50,000 | $0 | NAP | U/W Debt Yield at Maturity based on NOI/NCF(1): | 14.4% / 13.0% | ||
| Cut-off Date LTV Ratio(1): | 68.4% | ||||||
| LTV Ratio at Maturity(1): | 55.5% | ||||||
| Sources and Uses | |||||||||
| Sources | Uses | ||||||||
| Original whole loan amount | $83,500,000 | 100.0% | Loan payoff | $81,124,085 | 97.2 | % | |||
| Upfront reserves | 364,361 | 0.4 | |||||||
| Closing costs | 1,250,137 | 1.5 | |||||||
| Return of Equity | $761,417 | 0.9 | |||||||
| Total Sources | $83,500,000 | 100.0% | Total Uses | $83,500,000 | 100.0 | % | |||
| (1) | The Embassy Suites at Centennial Olympic Park Mortgage Loan (as defined below) is part of the Embassy Suites at Centennial Olympic Park Whole Loan (as defined below), which is comprised of sixpari passu promissory notes with an aggregate original principal balance of $83,500,000. The Cut-off Date Balance Per Room, Maturity Date Balance Per Room, U/W DSCR based on NOI/NCF, U/W Debt Yield based on NOI/NCF, U/W NOI Debt Yield at Maturity based on NOI/NCF, UW NCF DSCR, Cut-off Date LTV Ratio and LTV Ratio at Maturity numbers presented above are based on the aggregate principal balance of the promissory notes comprising the Embassy Suites at Centennial Olympic Park Whole Loan. |
| (2) | Defeasance of the Embassy Suites at Centennial Olympic Park Whole Loan is permitted at any time after the earlier to occur of (a) the end of the two-year period commencing on the closing date of the securitization of the last Embassy Suites at Centennial Olympic Park Non-ServicedPari Passu Companion Loans (as defined below) to be securitized and (b) June 7, 2022. |
| (3) | See “Escrows and Reserves” below for further discussion of reserve requirements. |
| (4) | The appraised value consists of $87,700,000 ($273,000 per room) for the hotel component, $17,200,000 for the parking component, and $17,100,000 for the retail component of the Embassy Suites at Centennial Olympic Park Property, respectively. |
THE INFORMATION IN THIS STRUCTURAL AND COLLATERAL TERM SHEET IS NOT COMPLETE AND MAY BE AMENDED PRIOR TO THE TIME OF SALE. THIS TERM SHEET IS NOT AN OFFER TO SELL THESE SECURITIES AND IT IS NOT A SOLICITATION OF AN OFFER TO BUY THESE SECURITIES IN ANY JURISDICTION WHERE THE OFFER OR SALE IS NOT PERMITTED.
70
| Hospitality – Full Service | Loan #4 | Cut-off Date Balance: | $38,455,033 | |
| 267 Marietta Street | Embassy Suites at Centennial Olympic Park | Cut-off Date LTV: | 68.4% | |
| Atlanta, GA 30313 | U/W NCF DSCR: | 1.72x | ||
| U/W NOI Debt Yield: | 11.7% |
The Mortgage Loan. The mortgage loan (the “Embassy Suites at Centennial Olympic Park Mortgage Loan”) is part of a whole loan (the “Embassy Suites at Centennial Olympic Park Whole Loan”) evidenced by sixpari passu notes with an original principal balance of $83,500,000 secured by a first mortgage encumbering the fee interest in a full service hospitality property located in Atlanta, Georgia (the “Embassy Suites at Centennial Olympic Park Property”).
The non-controlling Notes A-2, A-4, A-5, and A-6, in the aggregate original principal balance of $38,500,000, represent the Embassy Suites at Centennial Olympic Park Mortgage Loan and will be included in the WFCM 2019-C52 securitization trust. The controlling Note A-1 and non-controlling Note A-3, in the aggregate original principal balance of $45,000,000, (the “Embassy Suites at Centennial Olympic Park Non-ServicedPari Passu Companion Loans”), were contributed to the MSC 2019-H7 securitization trust. The Embassy Suites at Centennial Olympic Park Whole Loan will be serviced pursuant to the pooling and servicing agreement for the MSC 2019-H7 securitization transaction. See“Description of the Mortgage Pool—The Whole Loans—The Non-Serviced Pari Passu Whole Loans” and “Pooling and Servicing Agreement – Servicing of the Non-Serviced Mortgage Loans”in the Preliminary Prospectus.
Embassy Suites at Centennial Olympic Park Whole Loan Summary
| Notes | Original Balance | Cut-off Date Balance | Note Holder | Controlling Piece |
| Embassy Suites at Centennial Olympic Park Mortgage Loan | ||||
| A-2, A-4, A-5, A-6 | $38,500,000 | $38,455,033 | WFCM 2019-C52 | No |
| Embassy Suites at Centennial Olympic Park Non-ServicedPari Passu Companion Loans | ||||
| A-1, A-3 | $45,000,000 | $44,947,441 | MSC 2019-H7 | Yes |
| Total Embassy Suites at Centennial Olympic Park Mortgage Whole Loan | $83,500,000 | $83,402,475 | ||
The Borrower and the Borrower Sponsor.The borrower is Centennial Hotel Company I, LLC (the “Embassy Suites at Centennial Olympic Park Borrower”), a single-purpose Delaware limited liability company with two independent directors. The borrower sponsor and the non-recourse carve-out guarantor is David D. Marvin. David D. Marvin owns 14.23% of the Embassy Suites at Centennial Olympic Park Borrower.
David D. Marvin is the founder and President of Legacy Ventures, a hospitality investment, development, and management company founded in 1994. Legacy Ventures is based in Atlanta and has development projects which have ranged in size from $500,000 restaurants to $100 million mixed-use projects. Legacy Ventures currently operates eight hotels (1,819 keys) and over fifteen restaurant venues.
The Property. The Embassy Suites at Centennial Olympic Park Property is an eight-story, full service hotel located adjacent to the Centennial Olympic Park in downtown Atlanta, Georgia. The Embassy Suites at Centennial Olympic Park Property is also located next to the 3.9 million square foot Georgia World Congress Center (“GWCC”), which is the fourth largest convention center in the country. The Embassy Suites at Centennial Olympic Park Property was developed by the borrower sponsor in 1999 and contains approximately 313,072 square feet of gross building area. The Embassy Suites at Centennial Olympic Park Property underwent approximately $10.8 million of capital expenditures since 2014, of which approximately $8.7 million ($26,959 per key) was spent in 2017. The 2017 renovation included the replacement of all soft goods, case goods, tiles in the guest bathrooms, replacement of 22 bathtubs with walk-in showers, and replacement of lobby furniture. Approximately $169,068 has also been spent year-to date through March 2019 on items including valet garage doors, washer/dryer units and meeting room access keys. According to information provided by the borrower sponsor, approximately $820,500 is expected to be spent in capital expenditures in 2019 for items such as high speed internet access/connected room Wi-Fi upgrades, new guestroom TV’s in half of all guestrooms, and resurfacing the pool and spa. Such capital expenditures are not required by the Embassy Suites at Centennial Olympic Park Whole Loan documents or mandated by the franchise agreement and have not been reserved for.
The Embassy Suites at Centennial Olympic Park Property features 321 guestrooms comprised of 169 king suites, 149 double/double suites, one centennial suite, one governor suite, and one presidential suite. Amenities include an outdoor pool, fitness center, complimentary breakfast area/evening reception area, guest laundry facilities, business center, sundry shop, approximately 7,855 square feet of meeting space and three food and beverage outlets (Ruth’s Chris Steak House, Kwan’s Deli and Korean Kitchen, and Starbucks). In addition to the three food and beverage outlets that are operated by third parties pursuant to leases, the retail component of the Embassy Suites at Centennial Olympic Park Property also includes a gift shop and three leases associated with antenna and signage tenants, which in aggregate represents approximately $1.1 million or 4.6% of the underwritten revenue.
Although not required for zoning, parking via valet service is available to guests at the Embassy Suites at Centennial Olympic Park Property. There are two levels of underground parking onsite, of which the hotel uses 106 spaces (or 120+ spaces when double stacked) on the first level while the lower level is reserved for residents of an adjacent condominium development (the “Centennial Park West Condominium” or the “Condominium”). There is a parking easement agreement between the Embassy Suites at Centennial Olympic Park Borrower and the Centennial Park West Condominium which provides residents of the adjacent Condominium with access to the parking spaces within the Embassy Suites at Centennial Olympic Park Property. Additional parking (approximately 45 spaces) is also available at the adjacent surface lot. The parking component represents approximately $1.7 million or 7.4% of the underwritten revenue.
THE INFORMATION IN THIS STRUCTURAL AND COLLATERAL TERM SHEET IS NOT COMPLETE AND MAY BE AMENDED PRIOR TO THE TIME OF SALE. THIS TERM SHEET IS NOT AN OFFER TO SELL THESE SECURITIES AND IT IS NOT A SOLICITATION OF AN OFFER TO BUY THESE SECURITIES IN ANY JURISDICTION WHERE THE OFFER OR SALE IS NOT PERMITTED.
71
| Hospitality – Full Service | Loan #4 | Cut-off Date Balance: | $38,455,033 | |
| 267 Marietta Street | Embassy Suites at Centennial Olympic Park | Cut-off Date LTV: | 68.4% | |
| Atlanta, GA 30313 | U/W NCF DSCR: | 1.72x | ||
| U/W NOI Debt Yield: | 11.7% |
The Embassy Suites at Centennial Olympic Park Borrower, the hotel operator which is a borrower affiliate engaged through a hotel management agreement to operate the Embassy Suites at Centennial Olympic Park Property (“Operator”), and Centennial Park West Condominium Association, Inc. (the “Association”) are parties to a service agreement dated April 10, 2014 (“Service Agreement”) whereby the Association provides payment of certain fees and expenses to the Embassy Suites at Centennial Olympic Park Borrower for services rendered by the Operator. Operator agrees to (i) provide the occupants of the Condominium with concierge coverage in the lobby of the Condominium, housekeeping of the common elements, maintenance and repair of the common elements and security services and (ii) permit condominium occupants to have access to the pool, exercise room, business center, restaurant and concierge at the Embassy Suites at Centennial Olympic Park Property. The Operator is compensated separately by the Embassy Suites at Centennial Olympic Park Borrower under the terms of a hotel management agreement. The Service Agreement has automatic and successive one year renewal terms unless a party terminates the agreement with a 30-day written notice prior to the expiration of the then current renewal term or at any time with a 60-day written notice. The Embassy Suites at Centennial Olympic Park Borrower currently receives a net income of approximately $76,000 per year through the terms of the Service Agreement.
The Embassy Suites at Centennial Olympic Park Property operates under a franchise agreement with Embassy Suites Franchise, LLC that expires on April 30, 2034 with no renewal options remaining.
Operating History and Underwritten Net Cash Flow. The following table presents certain information relating to the historical operating performance and the underwritten net cash flow at the Embassy Suites at Centennial Olympic Park Property:
Cash Flow Analysis
| 2016 | 2017 | 2018 | TTM 4/30/2019 | U/W | % of U/W Total Revenue | U/W $ per Room | ||||||||
| Occupancy | 76.0% | 79.4% | 82.2% | 84.2% | 83.7% | |||||||||
| ADR | $184.55 | $189.23 | $194.49 | $205.35 | $200.39 | |||||||||
| RevPAR | $140.21 | $150.21 | $159.86 | $172.83 | $167.63 | |||||||||
| Room Revenue | 16,473,158 | 17,598,923 | 18,730,111 | 20,249,957 | 19,640,044 | 84.9% | $61,184 | |||||||
| Parking Operations Revenue | 1,434,606 | 1,588,244 | 1,673,911 | 1,703,619 | 1,703,619 | 7.4 | $5,307 | |||||||
| Retail Rent Revenue | 762,662 | 800,812 | 812,385 | 899,822 | 1,059,873 | 4.6 | $3,302 | |||||||
| Other Income(1) | 678,451 | 781,352 | 592,353 | 743,234 | 743,234 | 3.2 | $2,315 | |||||||
| Total Revenue | $19,348,877 | $20,769,330 | $21,808,761 | $23,596,632 | $23,146,771 | 100.0 | $72,108 | |||||||
| Rooms Expense | 4,262,331 | 4,287,575 | 4,445,855 | 4,696,101 | 4,554,658 | 19.7 | $14,189 | |||||||
| Parking Operations Expense | 583,127 | 662,131 | 667,207 | 673,380 | 673,380 | 2.9 | $2,098 | |||||||
| Other Departmental Expense | 426,937 | 445,730 | 370,329 | 398,653 | 398,653 | 1.7 | $1,242 | |||||||
| Real Estate Taxes | 774,403 | 679,532 | 900,930 | 853,434 | 827,719 | 3.6 | $2,579 | |||||||
| Insurance | 162,789 | 181,840 | 196,180 | 197,541 | 153,819 | 0.7 | $479 | |||||||
| Other Expenses | 5,988,374 | 6,367,598 | 6,752,221 | 6,990,831 | 6,774,304 | 29.3 | $21,104 | |||||||
| Total Expenses | $12,197,960 | $12,624,406 | $13,332,721 | $13,809,940 | $13,382,534 | 57.8 | $41,690 | |||||||
| Net Operating Income | $7,150,917 | $8,144,924 | $8,476,039 | $9,786,692 | $9,764,237 | 42.2 | $30,418 | |||||||
| FF&E | 773,955 | 830,773 | 872,350 | 943,865 | 925,871 | 4.0 | $2,884 | |||||||
| Net Cash Flow | $6,376,962 | $7,314,151 | $7,603,689 | $8,842,826 | $8,838,366 | 38.2 | $27,534 | |||||||
| NOI DSCR(2) | 1.39x | 1.59x | 1.65x | 1.91x | 1.90x | |||||||||
| NCF DSCR(2) | 1.24x | 1.43x | 1.48x | 1.72x | 1.72x | |||||||||
| NOI Debt Yield(2) | 8.6% | 9.8% | 10.2% | 11.7% | 11.7% | |||||||||
| NCF Debt Yield(2) | 7.6% | 8.8% | 9.1% | 10.6% | 10.6% | |||||||||
| (1) | Other Income consists of reimbursements from the Condominium, equipment rental income, meeting room rental income, guest laundry, vending machines and miscellaneous income. |
| (2) | Debt service coverage ratios and debt yields are calculated based on the Embassy Suites at Centennial Olympic Park Whole Loan. |
| (3) | The difference between the 2018 Net Operating Income and U/W Net Operating Income is primarily due to improved performance post the 2017 renovation as well as increase in leisure demand due to the Super Bowl LIII which was held at the Mercedes-Benz Stadium in February 2019 in downtown Atlanta. |
Appraisal.The appraiser concluded to an “as-is” appraised value of $122,000,000 with an appraisal valuation date of May 7, 2019.
Environmental Matters. According to the Phase I environmental assessments dated May 17, 2019, there was no evidence of any recognized environmental conditions at the Embassy Suites at Centennial Olympic Park Property.
THE INFORMATION IN THIS STRUCTURAL AND COLLATERAL TERM SHEET IS NOT COMPLETE AND MAY BE AMENDED PRIOR TO THE TIME OF SALE. THIS TERM SHEET IS NOT AN OFFER TO SELL THESE SECURITIES AND IT IS NOT A SOLICITATION OF AN OFFER TO BUY THESE SECURITIES IN ANY JURISDICTION WHERE THE OFFER OR SALE IS NOT PERMITTED.
72
| Hospitality – Full Service | Loan #4 | Cut-off Date Balance: | $38,455,033 | |
| 267 Marietta Street | Embassy Suites at Centennial Olympic Park | Cut-off Date LTV: | 68.4% | |
| Atlanta, GA 30313 | U/W NCF DSCR: | 1.72x | ||
| U/W NOI Debt Yield: | 11.7% |
Market Overview and Competition.The Embassy Suites at Centennial Olympic Park Property is located along Marietta Street adjacent to Centennial Olympic Park in downtown Atlanta, Georgia. The Embassy Suites at Centennial Olympic Park Property offers a location proximate to downtown Atlanta leisure demand generators such as Centennial Olympic Park, the Chick-Fil-A College Football Hall of Fame, the Georgia Aquarium, the World of Coca-Cola, the State Farm Arena, the GWCC, and the Mercedes-Benz Stadium. The closest public transportation is the MARTA Peachtree Center station, approximately one-half mile east of the Embassy Suites at Centennial Olympic Park Property. Hartsfield-Jackson Atlanta International Airport is located approximately ten miles south of the Embassy Suites at Centennial Olympic Park Property.
New development in downtown Atlanta includes Centennial Yards, which is a $5 billion large scale mixed use development on a 40 acre site located south of the GWCC. The project is expected to create up to 15 new city blocks and 12 million square feet of residential space, office space, hotel space, retail space, and pedestrian-friendly green space. Construction of Centennial Yards is expected to ramp up in 2020 and full development is expected to take approximately 15 years. We cannot assure you as to whether, or when such development will occur.
According to a third party report, Downtown Atlanta had nearly 17.5 million square feet of office space as of the first quarter of 2019. There are a variety of industries located within the market represented by banking, finance, real estate, hospitality, healthcare, television, and technology firms. The market draws demand from nearby companies such as Coca-Cola, the American Cancer Society, Delta Airlines, Time Warner, AT&T, Ernst & Young, Southern Company, Accenture, U.S. Department of Commerce, Microsoft, Georgia State University, General Electric, Deloitte, SunTrust Banks, KPMG, Oracle, and IBM.
The Downtown Atlanta market also benefits from convention business including annual events such as the Atlanta Gift & Home Furnishings Market, Cheersport, and Dragon Con as well as the Southeastern Conference football championships and Chick-fil-A Peach Bowl to be hosted in the Mercedes Benz Stadium every December. According to the appraisal, there is a planned convention center hotel to be built at the GWCC, which is expected to induce additional room night demand and have a positive net effect for the surrounding hotels in the core of Atlanta.
According to the appraisal, in 2018 the Embassy Suites at Centennial Olympic Park Property generated approximately 45% of its room nights from meeting and group demand, 30% from leisure demand, and 25% from commercial demand. The top five corporate accounts as of April 2019 at the Embassy Suites at Centennial Olympic Park Property are The Coca-Cola Company, IBM, American Cancer Society, General Electric, and One Coast.
According to the appraisal, three hotels that are under construction, totaling 639 rooms, are deemed competitive with the Embassy Suites at Centennial Olympic Park Property including a 265-room, The Candler Hotel Atlanta, Curio Collection by Hilton (50.0% competitive), a 174-room, Hyatt Place Centennial Park (100.0% competitive), and a 200-room, Reverb by Hard Rock Atlanta Downtown (25.0% competitive). The three hotels are expected to open between August 2019 and February 2020. In addition, a 1,000-room Signia Hotel Atlanta, which will be connected to the GWCC is expected to break ground in 2020 and open between 2023 and 2024. The Signia Hotel Atlanta is expected to contain roughly 75,000 SF of meeting space and given the size, would have limited competitiveness with the Embassy Suites at Centennial Olympic Park Property according to the appraisal.
The Embassy Suites at Centennial Olympic Park Property’s occupancy, ADR, and RevPAR were 84.2%, $205.88 and $173.27 respectively, during the trailing twelve months ended April 30, 2019, resulting in penetration rates of 107.0%, 121.2% and 129.7% respectively against its competitive set.
Subject and Market Historical Occupancy, ADR and RevPAR(1)(2)
The following table presents historical occupancy, ADR, RevPAR and penetration rates relating to the Embassy Suites at Centennial Olympic Park Property’s competitive set:
Competitive Set | Embassy Suites at Centennial Olympic Park | Penetration Factor | |||||||
Year | Occupancy | ADR | RevPAR | Occupancy | ADR | RevPAR | Occupancy | ADR | RevPAR |
| 12/31/2017 | 75.3% | $159.29 | $119.90 | 79.8% | $188.43 | $150.44 | 106.1% | 118.3% | 125.5% |
| 12/31/2018 | 77.4% | $161.53 | $125.08 | 82.2% | $194.94 | $160.24 | 106.2% | 120.7% | 128.1% |
| 4/30/2019 TTM | 78.7% | $169.87 | $133.63 | 84.2% | $205.88 | $173.27 | 107.0% | 121.2% | 129.7% |
Source: Industry Report
| (1) | The competitive set includes theHyatt Regency Atlanta, Sheraton Atlanta Hotel, Marriot Atlanta Marquis, Omni Hotel at CNN Center, Hilton Atlanta, Westin Peachtree Plaza Atlanta, and Ritz-Carlton Atlanta. Such competitive set is different from the competitive set used in the Property Competitive Summary table below. |
| (2) | The variances between the underwriting, the appraisal and the industry report data with respect to Occupancy, ADR and RevPAR at the Embassy Suites at Centennial Olympic Park Property are attributable to variances in reporting methodologies and/or timing differences. |
THE INFORMATION IN THIS STRUCTURAL AND COLLATERAL TERM SHEET IS NOT COMPLETE AND MAY BE AMENDED PRIOR TO THE TIME OF SALE. THIS TERM SHEET IS NOT AN OFFER TO SELL THESE SECURITIES AND IT IS NOT A SOLICITATION OF AN OFFER TO BUY THESE SECURITIES IN ANY JURISDICTION WHERE THE OFFER OR SALE IS NOT PERMITTED.
73
| Hospitality – Full Service | Loan #4 | Cut-off Date Balance: | $38,455,033 | |
| 267 Marietta Street | Embassy Suites at Centennial Olympic Park | Cut-off Date LTV: | 68.4% | |
| Atlanta, GA 30313 | U/W NCF DSCR: | 1.72x | ||
| U/W NOI Debt Yield: | 11.7% |
The following table presents certain information relating to the primary competitive properties to the Embassy Suites at Centennial Olympic Park Property:
Property Competitive Summary(1)(2)
| Property Name | No. of Rooms | Year Built | Meeting Space (SF) | Commercial | Meeting & Group | Leisure | Estimated 2018 | Estimated 2018 ADR(3) | Estimated 2018 |
| Embassy Suites at Centennial Olympic Park (Subject) | 321 | 1999 | 7,855 | 25% | 45% | 30% | 82.2% | $194.49 | $159.86 |
| The Ritz-Carlton, Atlanta | 444 | 1984 | 16,173 | 50% | 30% | 20% | 75.0%-80.0% | $230 - $235 | $170 - $175 |
| Ellis Hotel, Atlanta, a Tribute Portfolio Hotel | 127 | 1913 | 1,475 | 45% | 25% | 30% | 70.0%-75.0% | $160 - $165 | $115 - $120 |
| Glenn Hotel, Autograph Collection | 110 | 1923 | 1,510 | 50% | 25% | 25% | 75.0%-80.0% | $190 - $195 | $145 - $150 |
| The American Hotel Atlanta Downtown – a DoubleTree by Hilton | 315 | 1962 | 13,025 | 30% | 50% | 20% | 65.0%-70.0% | $160 - $165 | $110 - $115 |
| AC Hotel Atlanta Downtown | 255 | 1985 | 1,470 | 45% | 25% | 30% | 65.0%-70.0% | $160 - $165 | $110 - $115 |
| Twelve Downtown, Autograph Collection | 102 | 2007 | 4,282 | 55% | 20% | 25% | 70.0%-75.0% | $195 - $200 | $140 - $145 |
| Hilton Garden Inn Atlanta Downtown | 242 | 2008 | 7,574 | 35% | 35% | 30% | 80.0%-85.0% | $175 - $180 | $140 - $145 |
| W Atlanta – Downtown | 237 | 2009 | 8,900 | 35% | 40% | 25% | 70.0%-75.0% | $220 - $225 | $160 - $165 |
| Hyatt House Atlanta/Downtown | 150 | 2015 | 800 | 55% | 20% | 25% | 75.0%-80.0% | $180 - $185 | $140 - $145 |
| Hotel Indigo Atlanta Downtown | 206 | 2015 | 18,466 | 35% | 40% | 25% | 70.0%-75.0% | $165 - $170 | $120 - $125 |
Source:Appraisal
| (1) | The variances between the underwriting, the appraisal and the industry report data with respect to Occupancy, ADR and RevPAR at the Embassy Suites at Centennial Olympic Park Property are attributable to variances in reporting methodologies and/or timing differences. |
| (2) | The competitive set identified in the table above is different from the competitive set used in the Historical Occupancy, ADR, RevPAR table above. |
| (3) | Estimated 2018 Occupancy, Estimated 2018 ADR and Estimated 2018 RevPAR are based on the appraisal’s estimated 2018 year-end figures. |
Escrows.
Real Estate Taxes - The Embassy Suites at Centennial Olympic Park Whole Loan documents provide for an upfront reserve of $275,906 for real estate taxes and ongoing monthly reserves for real estate taxes in an amount equal to one-twelfth of the real estate taxes that the lender estimates will be payable during the next twelve months (initially $68,977).
Insurance - The Embassy Suites at Centennial Olympic Park Whole Loan documents provide for an upfront reserve of $38,455 for insurance and ongoing monthly reserves for insurance in an amount equal to one-twelfth of the insurance premiums that the lender estimates will be payable during the next twelve months (initially $12,818).
FF&E Reserve – The Embassy Suites at Centennial Olympic Park Whole Loan documents provide for ongoing monthly reserves for furniture, fixtures and equipment (“FF&E”) in an amount equal to the greater of one-twelfth of (i) 4% of the operating income for the Embassy Suites at Centennial Olympic Park Property for the preceding calendar year ($79,022 for the balance of 2019) and (ii) the amount of the deposit required by the franchisor on account of FF&E under the franchise agreement. The monthly deposit may be adjusted by the lender upon 30 days’ written notice to the Embassy Suites at Centennial Olympic Park Borrower.
Rent Reserve -The Embassy Suites at Centennial Olympic Park Whole Loan documents provide for an upfront reserve of $50,000 for gap rent associated with the Orange Barrel Media signage tenant.
Lockbox and Cash Management. The Embassy Suites at Centennial Olympic Park Property is structured with a hard lockbox and springing cash management. At origination, the Embassy Suites at Centennial Olympic Park Borrower and the manager were required to direct credit card companies to deposit all credit card receipts with respect to the Embassy Suites at Centennial Olympic Park Property into a lockbox account controlled by the lender. If, notwithstanding the foregoing, the Embassy Suites at Centennial Olympic Park Borrower and the manager receive any rents from the Embassy Suites at Centennial Olympic Park Property, they are required to deposit such amounts into the lockbox account within two business days of receipt. In the absence of a Cash Management Period (as defined below), the funds in the lockbox account will be swept each business day into an account controlled by the Embassy Suites at Centennial Olympic Park Borrower. Upon the first Cash Management Period, the lender has the right to establish, and the Embassy Suites at Centennial Olympic Park Borrower is required to cooperate to establish, a lender-controlled cash management account, and if a Cash Management Period is continuing, all funds in the lockbox account are required to be swept to such cash management account, and applied, provided that no event of default is continuing under the Embassy Suites at Centennial Olympic Park Whole Loan, on each monthly payment date to fund the required tax and insurance reserves deposits as described above under “—Escrows and Reserves”, to pay debt service on the Embassy Suites at Centennial Olympic Park Whole Loan, to fund the required monthly deposit into the FF&E
THE INFORMATION IN THIS STRUCTURAL AND COLLATERAL TERM SHEET IS NOT COMPLETE AND MAY BE AMENDED PRIOR TO THE TIME OF SALE. THIS TERM SHEET IS NOT AN OFFER TO SELL THESE SECURITIES AND IT IS NOT A SOLICITATION OF AN OFFER TO BUY THESE SECURITIES IN ANY JURISDICTION WHERE THE OFFER OR SALE IS NOT PERMITTED.
74
| Hospitality – Full Service | Loan #4 | Cut-off Date Balance: | $38,455,033 | |
| 267 Marietta Street | Embassy Suites at Centennial Olympic Park | Cut-off Date LTV: | 68.4% | |
| Atlanta, GA 30313 | U/W NCF DSCR: | 1.72x | ||
| U/W NOI Debt Yield: | 11.7% |
reserve, as described above under “—Escrows and Reserves”, to pay monthly operating expenses referenced in the annual budget (which is required to be approved by the lender during the continuance of a Cash Management Period) and extraordinary expenses approved by the lender, and to disburse the remainder into an excess cash flow sweep account to be held as additional collateral for the Embassy Suites at Centennial Olympic Park Whole Loan during the continuance of such Cash Management Period.
A “Cash Management Period” will commence upon:
| a) | the stated maturity date; |
| b) | the occurrence of an event of default and continue until no event of default is continuing; |
| c) | the date that the debt service coverage ratio as of any Calculation Date (as defined below) falls below 1.25x (amortizing) and will continue until such time as the debt service coverage ratio is at least 1.30x (amortizing) for two consecutive Calculation Dates; |
| d) | the date that is twelve months prior to the expiration of the franchise agreement or any Replacement Franchise Agreement (as defined below) then in existence to the extent the Embassy Suites at Centennial Olympic Park Borrower has not previously provided evidence of the satisfaction of the New License Conditions (as defined below) until the lender has determined that the Embassy Suites at Centennial Olympic Park Borrower has satisfied the New License Conditions; or |
| e) | a property improvement plan (“PIP”) is required by the franchisor or Qualified Franchisor (as defined below) and will end when an amount equal to 115.0% of the estimated cost to complete such PIP has been deposited with the lender, or when the Embassy Suites at Centennial Olympic Park Borrower provides evidence that the PIP has been completed. |
A “Calculation Date” means the last day of each calendar quarter during the term of the Embassy Suites at Centennial Olympic Park Whole Loan.
“New License Conditions” means the delivery to the lender of the following items, each of which is satisfactory to the lender in its commercially reasonable discretion: (i) a Replacement Franchise Agreement with the franchisor or a Qualified Franchisor for a term that extends at least five years beyond the stated maturity date and which contains market terms consistent with other license agreements then being issued by such franchisor for other hotel properties of similar size, location, class, use, operation and value, (ii) a related tri-party agreement or comfort letter issued by such franchisor for the benefit of the lender in substantially the same form and substance as was provided to the lender prior to origination or as otherwise approved by the lender in its sole, good faith discretion and (iii) the satisfaction and payment in full of all repairs and renovations required in connection with any PIP required by such franchisor.
A “Qualified Franchisor” means any of (i) Embassy Suites Franchise LLC, or (ii) any other reputable and experienced franchisor possessing experience in flagging hotel properties similar in size, scope, use, operation and value as the Embassy Suites at Centennial Olympic Park Property and approved by the lender.
A “Replacement Franchise Agreement” means a franchise, trademark and license agreement with a Qualified Franchisor that is either substantially the same in form and substance as the franchise agreement in effect on the loan origination date, or otherwise reasonably acceptable to the lender.
Property Management.The Embassy Suites at Centennial Olympic Park Property is managed by LHP ES1, LLC, an affiliate of the borrower.
Partial Release.Not permitted.
Real Estate Substitution.Not permitted.
Ground Lease.None.
Subordinate and Mezzanine Indebtedness.Not permitted.
Terrorism Insurance.The Embassy Suites at Centennial Olympic Park Whole Loan documents require that the “all risk” insurance policy required to be maintained by the Embassy Suites at Centennial Olympic Park Borrower provide coverage for terrorism in an amount equal to the full replacement cost of the Embassy Suites at Centennial Olympic Park Property. The loan documents also require business interruption insurance covering no less than the 18-month period following the occurrence of a casualty event, together with a six-month extended period of indemnity. Notwithstanding the foregoing, for so long as the Terrorism Risk Insurance Act of 2002, as extended and modified by the Terrorism Risk Insurance Program Reauthorization Act of 2015 (“TRIPRA”) is in effect (including any extensions thereof or if another federal governmental program is in effect relating to “acts of terrorism” which provides substantially similar protections as TRIPRA), and covers both domestic and foreign acts of terrorism, the lender is required to accept terrorism insurance which insures against “covered acts” as defined by TRIPRA (or such other program).See “Risk Factors—Risks Relating to the Mortgage Loans—Terrorism Insurance May Not Be Available for All Mortgaged Properties”in the Preliminary Prospectus.
THE INFORMATION IN THIS STRUCTURAL AND COLLATERAL TERM SHEET IS NOT COMPLETE AND MAY BE AMENDED PRIOR TO THE TIME OF SALE. THIS TERM SHEET IS NOT AN OFFER TO SELL THESE SECURITIES AND IT IS NOT A SOLICITATION OF AN OFFER TO BUY THESE SECURITIES IN ANY JURISDICTION WHERE THE OFFER OR SALE IS NOT PERMITTED.
75
| Office - Suburban | Loan #5 | Cut-off Date Balance: | $36,190,000 | |
| 10301 & 10401 Deerwood Park Boulevard | Capital Plaza | Cut-off Date LTV: | 64.6% | |
| Jacksonville, FL 32256 | U/W NCF DSCR: | 1.86x | ||
| U/W NOI Debt Yield: | 12.0% |
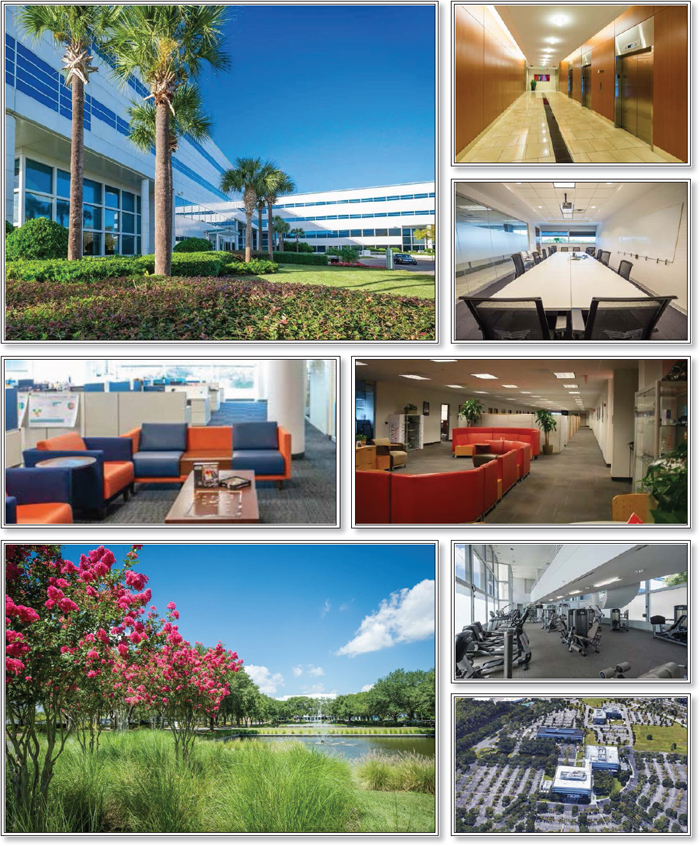
THE INFORMATION IN THIS STRUCTURAL AND COLLATERAL TERM SHEET IS NOT COMPLETE AND MAY BE AMENDED PRIOR TO THE TIME OF SALE. THIS TERM SHEET IS NOT AN OFFER TO SELL THESE SECURITIES AND IT IS NOT A SOLICITATION OF AN OFFER TO BUY THESE SECURITIES IN ANY JURISDICTION WHERE THE OFFER OR SALE IS NOT PERMITTED.
76
| Office - Suburban | Loan #5 | Cut-off Date Balance: | $36,190,000 | |
| 10301 & 10401 Deerwood Park Boulevard | Capital Plaza | Cut-off Date LTV: | 64.6% | |
| Jacksonville, FL 32256 | U/W NCF DSCR: | 1.86x | ||
| U/W NOI Debt Yield: | 12.0% |
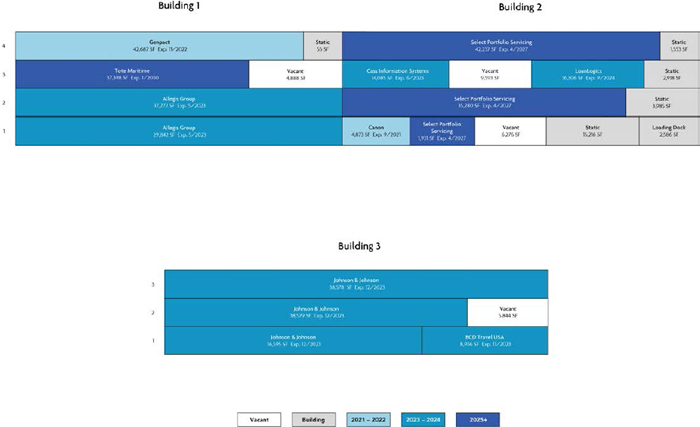
THE INFORMATION IN THIS STRUCTURAL AND COLLATERAL TERM SHEET IS NOT COMPLETE AND MAY BE AMENDED PRIOR TO THE TIME OF SALE. THIS TERM SHEET IS NOT AN OFFER TO SELL THESE SECURITIES AND IT IS NOT A SOLICITATION OF AN OFFER TO BUY THESE SECURITIES IN ANY JURISDICTION WHERE THE OFFER OR SALE IS NOT PERMITTED.
77
| Office - Suburban | Loan #5 | Cut-off Date Balance: | $36,190,000 | |
| 10301 & 10401 Deerwood Park Boulevard | Capital Plaza | Cut-off Date LTV: | 64.6% | |
| Jacksonville, FL 32256 | U/W NCF DSCR: | 1.86x | ||
| U/W NOI Debt Yield: | 12.0% |
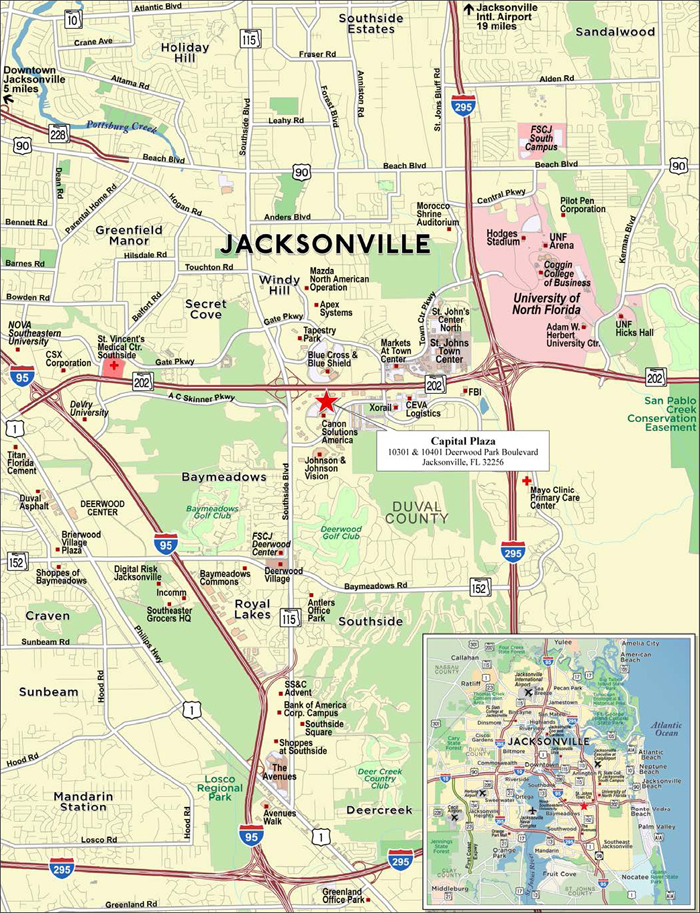
THE INFORMATION IN THIS STRUCTURAL AND COLLATERAL TERM SHEET IS NOT COMPLETE AND MAY BE AMENDED PRIOR TO THE TIME OF SALE. THIS TERM SHEET IS NOT AN OFFER TO SELL THESE SECURITIES AND IT IS NOT A SOLICITATION OF AN OFFER TO BUY THESE SECURITIES IN ANY JURISDICTION WHERE THE OFFER OR SALE IS NOT PERMITTED.
78
| No. 5 – Capital Plaza | |||||||
| Mortgage Loan Information | Mortgaged Property Information | ||||||
| Mortgage Loan Seller: | Barclays Capital Real Estate Inc. | Single Asset/Portfolio: | Single Asset | ||||
Credit Assessment (KBRA/Fitch/Moody’s): | NR/NR/NR | Property Type – Subtype: | Office – Suburban | ||||
| Original Principal Balance: | $36,190,000 | Location: | Jacksonville, FL | ||||
| Cut-off Date Balance: | $36,190,000 | Size: | 417,513 SF | ||||
| % of Initial Pool Balance: | 4.0% | Cut-off Date Balance Per SF: | $86.68 | ||||
| Loan Purpose: | Acquisition | Maturity Date Balance Per SF: | $79.22 | ||||
| Borrower Sponsors(1): | Various | Year Built/Renovated: | 1990-1999/2005 | ||||
| Guarantors: | TCM Capital Plaza LLC; Somerset Real Estate Opportunity Fund II, LP; Benjamin Adams | Title Vesting: | Fee | ||||
| Mortgage Rate: | 4.4200% | Property Manager: | Self-managed | ||||
| Note Date: | July 10, 2019 | Current Occupancy (As of)(3)(4): | 87.3% (4/25/2019) | ||||
| Seasoning: | 0 months | YE 2018 Occupancy(4): | 80.9% | ||||
| Maturity Date: | August 6, 2029 | YE 2017 Occupancy(4): | 63.9% | ||||
| IO Period: | 60 months | YE 2016 Occupancy(4): | 61.4% | ||||
| Loan Term (Original): | 120 months | YE 2015 Occupancy(4): | 95.3% | ||||
| Amortization Term (Original): | 360 months | Appraised Value: | $56,000,000 | ||||
| Loan Amortization Type: | Interest-only, Amortizing Balloon | Appraised Value Per SF: | $134.13 | ||||
| Call Protection: | L(24),D(91),O(5) | Appraisal Valuation Date: | April 9, 2019 | ||||
| Lockbox Type: | Hard/Springing Cash Management | Underwriting and Financial Information | |||||
| Additional Debt: | No | TTM NOI (5/31/2019)(5): | $2,621,235 | ||||
| Additional Debt Type (Balance): | NAP | YE 2018 NOI(5): | $2,479,797 | ||||
| YE 2017 NOI(5): | $737,942 | ||||||
| YE 2016 NOI(5): | $1,130,842 | ||||||
| U/W Revenues: | $8,541,766 | ||||||
| U/W Expenses: | $4,203,944 | ||||||
| Escrows and Reserves(2) | U/W NOI(5): | $4,337,822 | |||||
| Initial | Monthly | Cap | U/W NCF(5): | $4,062,279 | |||
| Taxes | $425,302 | $47,256 | NAP | U/W DSCR based on NOI/NCF: | 1.99x / 1.86x | ||
| Insurance | $19,980 | $9,990 | NAP | U/W Debt Yield based on NOI/NCF: | 12.0% / 11.2% | ||
| Replacement Reserve | $0 | $8,002 | NAP | U/W Debt Yield at Maturity based on NOI/NCF: | 13.1% / 12.3% | ||
| TI/LC Reserve | $3,900,000 | $34,793 | $3,900,000 | Cut-off Date LTV Ratio: | 64.6% | ||
| Immediate Repairs | $3,750 | $0 | NAP | LTV Ratio at Maturity: | 59.1% | ||
| HOA Common Charges Reserve | $11,532 | $3,844 | NAP | ||||
| Free Rent Reserve | $356,921 | $0 | NAP | ||||
| Outstanding TI/LC Reserve | $1,570,784 | $0 | NAP | ||||
| Sources and Uses | ||||||||
| Sources | Uses | |||||||
| Original loan amount | $36,190,000 | 63.6% | Purchase price | $51,469,000 | 90.5% | |||
| Borrower equity | 20,695,256 | 36.4 | Purchase credits(6) | (1,912,254) | (3.4) | |||
| Upfront reserves | 6,288,269 | 11.1 | ||||||
| Closing costs | 1,040,241 | 1.8 | ||||||
| Total Sources | $56,885,256 | 100.0% | Total Uses | $56,885,256 | 100.0% | |||
| (1) | The borrower sponsors of the Capital Plaza Mortgage Loan (as defined below) are Ten Capital Management and Somerset Properties, Inc.. |
| (2) | See “Escrows” below for a full description of the Escrows and Reserves. |
| (3) | Current Occupancy counts 26,313 square feet of static space (management office, fitness center, vault, loading dock, and other un-tenantable space) as vacant. Current Occupancy excluding the static space would equal 93.2%. |
| (4) | Refer to “Historical Occupancy” below. |
| (5) | See “Operating History and Underwritten Net Cash Flow” section for a discussion of historical NOI increases and increase of U/W NOI. |
| (6) | Purchase credits include outstanding tenant improvement costs and remaining free rent, all of which was reserved by the lender. |
The Mortgage Loan. The mortgage loan (the “Capital Plaza Mortgage Loan”) is evidenced by a single promissory note secured by a first mortgage encumbering the fee interest in a 417,513 square foot office building located in Jacksonville, Florida.
The Borrower and Borrower Sponsor.The borrower is SPI TCM Capital Plaza LLC, a Delaware limited liability company and single purpose entity. The borrower’s managing member has two independent managers. Legal counsel to the borrower delivered a non-consolidation opinion in connection with the origination of the Capital Plaza Mortgage Loan. The non-recourse carve-out guarantors of
THE INFORMATION IN THIS STRUCTURAL AND COLLATERAL TERM SHEET IS NOT COMPLETE AND MAY BE AMENDED PRIOR TO THE TIME OF SALE. THIS TERM SHEET IS NOT AN OFFER TO SELL THESE SECURITIES AND IT IS NOT A SOLICITATION OF AN OFFER TO BUY THESE SECURITIES IN ANY JURISDICTION WHERE THE OFFER OR SALE IS NOT PERMITTED.
79
| Office - Suburban | Loan #5 | Cut-off Date Balance: | $36,190,000 | |
| 10301 & 10401 Deerwood Park Boulevard | Capital Plaza | Cut-off Date LTV: | 64.6% | |
| Jacksonville, FL 32256 | U/W NCF DSCR: | 1.86x | ||
| U/W NOI Debt Yield: | 12.0% |
the Capital Plaza Mortgage Loan are TCM Capital Plaza LLC, Somerset Real Estate Opportunity Fund II, LP and Benjamin Adams. The borrower sponsors are Ten Capital Management and Somerset Properties, Inc.
Ten Capital Management is a privately held real estate investment company with Benjamin Adams as its founder and chief executive officer. Headquartered in Cleveland, Ten Capital Management is a real estate investment management company that manages capital on behalf of high net worth individuals and institutions. Ten Capital Management has partnered as borrower sponsor with Somerset Properties, Inc.. Founded in 1996, Somerset Properties, Inc. is a full service commercial real estate operating company specializing in managing, leasing and redeveloping commercial properties. Since inception, Somerset Properties, Inc. has operated approximately 8.0 million square feet and currently has 73 properties under their operating platform. Somerset Properties, Inc. disclosed three pre-recession foreclosures. See “Description of the Mortgage Pool – Loan Purpose; Default History, Bankruptcy Issues and Other Proceedings” in the Preliminary Prospectus.
The Property.The Capital Plaza Property consists of three, mid-rise office buildings constructed between 1990 and 1999 in Jacksonville, Florida (the “Capital Plaza Property”), approximately 10.0 miles southeast of downtown Jacksonville within the Deerwood Office Park. The Capital Plaza Property was fully renovated in 2005, and the building has undergone approximately $4.0 million in renovations since 2015. Additionally, approximately $10.2 million of tenant-funded improvements and leasing commissions have been incurred at the Capital Plaza Property since 2016. Amenities at the Capital Plaza Property include 24/7 building security, a fitness center open floor plans and a property-wide uninterruptible power supply system. The Capital Plaza Property contains 2,549 parking spaces, resulting in a parking ratio of 6.1 spaces per 1,000 square feet.As of April 25, 2019, the Capital Plaza Property was 87.3% leased to nine tenants. As of April 25, 2019 and excluding 26,313 square feet of static space (management office, fitness center, vault, loading dock, and other un-tenantable space), the Capital Plaza Property was 93.2% leased to nine tenants.
Major Tenants.
Largest Tenant: Johnson & Johnson (93,752 square feet; 22.5% of net rentable area; 25.5% of underwritten base rent; 12/31/2023 lease expiration) –Johnson & Johnson (Moody’s/S&P: Aaa/AAA and NYSE: JNJ) is a large multinational corporation with more than 275 subsidiaries and operations in more than 60 countries. Johnson & Johnson is a producer of medical devices and pharmaceuticals, and the owner of many well-known consumer brands such as Band-Aid, Aveeno, Splenda, Tylenol and Zyrtec. Johnson & Johnson has over 128,700 employees worldwide and total annual revenue exceeding $70 billion. The Capital Plaza Property houses vision offices for Johnson & Johnson and is located 0.7 miles away from the Johnson & Johnson Institute, its training facility for eye care professionals and its vision global headquarters. Johnson & Johnson has been a tenant at the Capital Plaza Property since 2002 and expanded by 16,595 square feet in 2012 with plans to expand an additional 9,593 square feet in 2019. Johnson & Johnson has one, five-year renewal option. Johnson & Johnson has a one-time termination option effective December 31, 2021 with notice given between December 1, 2020 and April 1, 2021 and payment of a termination fee equal to $545,605. If Johnson & Johnson provides notice to terminate a cash flow sweep would commence (see “Lockbox and Cash Management” below).
2nd Largest Tenant: Select Portfolio Servicing (79,448 square feet; 19.0% of net rentable area; 20.2% of underwritten base rent; 4/30/2027 lease expiration)– Select Portfolio Servicing operates as a mortgage servicing company specializing in single-family residential mortgages. Select Portfolio Servicing also offers mortgage assistance programs such as modification, payment deferral, repayment plan, short sale and deed-in-lieu of foreclosure. Select Portfolio Servicing has been a tenant at the Capital Plaza Property since 2002 and has two remaining five-year renewal options. Select Portfolio Servicing has the one-time option to terminate any or all portions of the premises effective April 30, 2024 with nine months’ notice and a contraction fee of $19.00 per square foot. Additionally, Select Portfolio Servicing has a two-time option to terminate the entire second floor (35,280 square feet) effective April 30, 2022 or April 30, 2023 with nine months’ notice and a contraction fee of $925,000 for the 2022 date or $800,000 for the 2023 date.
3rd Largest Tenant: Allegis Group (67,114 square feet; 16.1% of net rentable area; 19.5% of underwritten base rent; 5/31/2023 lease expiration) –Allegis Group is a global leader in talent solutions, connecting employees with businesses through a network of specialized companies. Allegis Group offers staffing and recruiting services, search services, talent advisory services, managed delivery services and workforce management services. Allegis Group originally occupied the Capital Plaza Property in 2018 (18,739 square feet), expanded twice in 2019 (48,375 square feet) and has one, five-year renewal option.
4th Largest Tenant: Genpact (42,687 square feet; 10.2% of net rentable area; 11.7% of underwritten base rent; 11/30/2022 lease expiration) – Genpact (Moody’s/S&P: Baa3/BBB- and NYSE:G) is a global professional services firm offering an artificial intelligence based platform for data and analytics of Fortune 500 companies. As of December 31, 2018, Genpact had annual revenues of approximately $3.0 billion and over 87,000 employees. Genpact originally occupied the Capital Plaza Property in 2017 and has two, five-year renewal options.
5th Largest Tenant: Tote Maritime (37,398 square feet; 9.0% of net rentable area; 10.7% of underwritten base rent; 1/31/2030 lease expiration) –Tote Maritime provides off-shore domestic liner, ship management and logistics services with technical ship management and vessel crewing services, such as vessel operations and engineering, crew management, voyage repairs, shipyard overhauls, insurance and claims handling. Tote Maritime has a termination option effective April 2027 with nine to 15 months’ notice and a termination fee of $594,236. Tote Maritime became a tenant at the Capital Plaza Property in February 2019 and has two, five-year renewal options.
THE INFORMATION IN THIS STRUCTURAL AND COLLATERAL TERM SHEET IS NOT COMPLETE AND MAY BE AMENDED PRIOR TO THE TIME OF SALE. THIS TERM SHEET IS NOT AN OFFER TO SELL THESE SECURITIES AND IT IS NOT A SOLICITATION OF AN OFFER TO BUY THESE SECURITIES IN ANY JURISDICTION WHERE THE OFFER OR SALE IS NOT PERMITTED.
80
| Office - Suburban | Loan #5 | Cut-off Date Balance: | $36,190,000 | |
| 10301 & 10401 Deerwood Park Boulevard | Capital Plaza | Cut-off Date LTV: | 64.6% | |
| Jacksonville, FL 32256 | U/W NCF DSCR: | 1.86x | ||
| U/W NOI Debt Yield: | 12.0% |
The following table presents certain information relating to the tenancy at the Capital Plaza Property:
Major Tenants
| Tenant Name | Credit Rating (Fitch/ Moody’s/ S&P)(1) | Tenant NRSF | % of NRSF | Annual U/W Base Rent PSF(2) | Annual U/W Base Rent(2) | % of Total Annual U/W Base Rent | Lease Expiration Date | Extension Options | Termination Option (Y/N) |
| Major Tenants | |||||||||
| Johnson & Johnson | NR/Aaa/AAA | 93,752 | 22.5% | $21.32 | $1,998,793 | 25.5% | 12/31/2023 | 1, 5-year(3) | Y(4) |
| Select Portfolio Servicing | NR/NR/NR | 79,448 | 19.0% | $19.94 | $1,584,193 | 20.2% | 4/30/2027 | 2, 5-year(5) | Y(6) |
| Allegis Group | NR/NR/NR | 67,114 | 16.1% | $22.81 | $1,530,870 | 19.5% | 5/31/2023 | 1, 5-year(7) | N |
| Genpact | NR/Baa3/BBB- | 42,687 | 10.2% | $21.49 | $917,344 | 11.7% | 11/30/2022 | 2, 5-year(8) | N |
| Tote Maritime | NR/NR/NR | 37,398 | 9.0% | $22.55 | $843,325 | 10.7% | 1/31/2030 | 2, 5-year(9) | Y(10) |
| Total Major Tenants | 320,399 | 76.7% | $21.46 | $6,874,525 | 87.6% | ||||
| Non-Major Tenants | 44,200 | 10.6% | $22.10 | $977,023 | 12.4% | ||||
| Occupied Collateral Total | 364,599 | 87.3% | $21.53 | $7,851,548 | 100.0% | ||||
| Vacant Space(11) | 52,914 | 12.7% | |||||||
| Collateral Total | 417,513 | 100.0% | |||||||
| (1) | Certain ratings are those of the parent company whether or not the parent company guarantees the lease. |
| (2) | Annual U/W Base Rent includes $403,851 of rent steps. |
| (3) | Johnson & Johnson has one, five-year renewal option at the value of the fair market rent 180 days’ prior to the renewal. |
| (4) | Johnson & Johnson has a one-time option to terminate its lease effective in December 31, 2021 with notice given between December 31, 2020 and April 1, 2021 and a termination fee of $545,605. |
| (5) | Select Portfolio Servicing has two, five-year renewal options at the value of the fair market rent 180 days’ prior to the renewal. |
| (6) | Select Portfolio Servicing has the one-time option to terminate any or all portions of the premises effective April 30, 2024 with nine months’ notice and a contraction fee of $19.00 per square foot. Additionally, Select Portfolio Servicing has a two-time option to terminate the entire second floor (35,280 square feet) effective April 30, 2022 or April 30, 2023 with nine months’ notice and a contraction fee of $925,000 for the 2022 date or $800,000 for the 2023 date. |
| (7) | Allegis Group has one, five-year renewal option at fair market value. |
| (8) | Genpact has two, five-year renewal options at fair market value. |
| (9) | Tote Maritime has two, five-year renewal options at fair market value. |
| (10) | Tote Maritime has a one-time termination option effective April 2027 with nine to 15 months’ notice and a termination fee of $594,236. |
| (11) | Excluding 26,313 square feet of static space (management office, fitness center, vault, loading dock, and other un-tenantable space) that is being counted as vacant, the Capital Plaza Property was 93.2% leased to nine tenants. |
THE INFORMATION IN THIS STRUCTURAL AND COLLATERAL TERM SHEET IS NOT COMPLETE AND MAY BE AMENDED PRIOR TO THE TIME OF SALE. THIS TERM SHEET IS NOT AN OFFER TO SELL THESE SECURITIES AND IT IS NOT A SOLICITATION OF AN OFFER TO BUY THESE SECURITIES IN ANY JURISDICTION WHERE THE OFFER OR SALE IS NOT PERMITTED.
81
| Office - Suburban | Loan #5 | Cut-off Date Balance: | $36,190,000 | |
| 10301 & 10401 Deerwood Park Boulevard | Capital Plaza | Cut-off Date LTV: | 64.6% | |
| Jacksonville, FL 32256 | U/W NCF DSCR: | 1.86x | ||
| U/W NOI Debt Yield: | 12.0% |
The following table presents certain information relating to the lease rollover schedule at the Capital Plaza Property:
Lease Expiration Schedule(1)(2)
| Year Ending December 31, | No. of Leases Expiring | Expiring NRSF | % of Total NRSF | Cumulative Expiring NRSF | Cumulative % of Total NRSF | Annual U/W Base Rent(3) | % of Total Annual U/W Base Rent | Annual U/W Base Rent PSF(3) |
| MTM | 0 | 0 | 0.0% | 0 | 0.0% | $0 | 0.0% | $0.00 |
| 2019 | 0 | 0 | 0.0% | 0 | 0.0% | $0 | 0.0% | $0.00 |
| 2020 | 0 | 0 | 0.0% | 0 | 0.0% | $0 | 0.0% | $0.00 |
| 2021 | 1 | 4,873 | 1.2% | 4,873 | 1.2% | $106,475 | 1.4% | $21.85 |
| 2022 | 1 | 42,687 | 10.2% | 47,560 | 11.4% | $917,344 | 11.7% | $21.49 |
| 2023 | 4 | 183,887 | 44.0% | 231,447 | 55.4% | $4,041,479 | 51.5% | $21.98 |
| 2024 | 1 | 16,306 | 3.9% | 247,753 | 59.3% | $358,732 | 4.6% | $22.00 |
| 2025 | 0 | 0 | 0.0% | 247,753 | 59.3% | $0 | 0.0% | $0.00 |
| 2026 | 0 | 0 | 0.0% | 247,753 | 59.3% | $0 | 0.0% | $0.00 |
| 2027 | 1 | 79,448 | 19.0% | 327,201 | 78.4% | $1,584,193 | 20.2% | $19.94 |
| 2028 | 0 | 0 | 0.0% | 327,201 | 78.4% | $0 | 0.0% | $0.00 |
| 2029 | 0 | 0 | 0.0% | 327,201 | 78.4% | $0 | 0.0% | $0.00 |
| Thereafter | 1 | 37,398 | 9.0% | 364,599 | 87.3% | $843,325 | 10.7% | $22.55 |
| Vacant(4) | 0 | 52,914 | 12.7% | 417,513 | 100.0% | $0 | 0.0% | $0.00 |
| Total/Weighted Average | 9 | 417,513 | 100.0% | $7,851,548 | 100.0% | $21.53 |
| (1) | Information obtained from the underwritten rent roll. |
| (2) | Certain tenants may have lease termination options that are exercisable prior to the originally stated expiration date of the subject lease and that are not considered in the Lease Expiration Schedule. |
| (3) | Annual U/W Base Rent includes $403,851 of rent steps. |
| (4) | Excluding 26,313 square feet of static space (management office, fitness center, vault, loading dock, and other un-tenantable space) that is being counted as vacant, the Capital Plaza Property was 93.2% leased to nine tenants. |
The following table presents historical occupancy percentages at the Capital Plaza Property:
Historical Occupancy
12/31/2015(1) | 12/31/2016(1) | 12/31/2017(2) | 12/31/2018(2) | 4/25/2019(2)(3)(4) |
| 95.3% | 61.4% | 63.9% | 80.9% | 87.3% |
| (1) | The decrease in occupancy from 2015 to 2016 is largely due to Wachovia Bank (approximately 149,000 square feet) vacating the Capital Plaza Property in December 2015. |
| (2) | The increase in occupancy from 2017 to Current Occupancy is a result of increased leasing activity driven by (i) Allegis, that signed a new lease in 2018 and expanded in 2019 for a total of 67,114 square feet, (ii) Tote Maritime, that signed a new lease in 2019 for 37,398 square feet, and (iii) Cass Information Systems, that signed a new lease in 2018 for 2,977 square feet. |
| (3) | Information obtained from the underwritten rent roll. |
| (4) | Current Occupancy counts 26,313 square feet of static space (management office, fitness center, vault, loading dock, and other un-tenantable space) as vacant. Current Occupancy excluding the static space would equal 93.2%. |
THE INFORMATION IN THIS STRUCTURAL AND COLLATERAL TERM SHEET IS NOT COMPLETE AND MAY BE AMENDED PRIOR TO THE TIME OF SALE. THIS TERM SHEET IS NOT AN OFFER TO SELL THESE SECURITIES AND IT IS NOT A SOLICITATION OF AN OFFER TO BUY THESE SECURITIES IN ANY JURISDICTION WHERE THE OFFER OR SALE IS NOT PERMITTED.
82
| Office - Suburban | Loan #5 | Cut-off Date Balance: | $36,190,000 | |
| 10301 & 10401 Deerwood Park Boulevard | Capital Plaza | Cut-off Date LTV: | 64.6% | |
| Jacksonville, FL 32256 | U/W NCF DSCR: | 1.86x | ||
| U/W NOI Debt Yield: | 12.0% |
Operating History and Underwritten Net Cash Flow. The following table presents certain information relating to the historical operating performance and underwritten net cash flow at the Capital Plaza Property:
Cash Flow Analysis
| 2016(1) | 2017(1)(2) | 2018(2) | TTM 5/31/2019(2)(3) | U/W(3) | %(4) | U/W $ per SF | |
| Base Rent | $4,410,987 | $4,942,513 | $5,929,719 | $6,283,510 | $7,447,697 | 80.4% | $17.84 |
| Contractual Rent Steps | 0 | 0 | 0 | 0 | 403,851 | 4.4 | 0.97 |
| Grossed Up Vacant Space | 0 | 0 | 0 | 0 | 604,211 | 6.5 | 1.45 |
| Gross Potential Rent | $4,410,987 | $4,942,513 | $5,929,719 | $6,283,510 | $8,455,759 | 91.3% | $20.25 |
| Other Income | 56,651 | 115,111 | 133,465 | 96,324 | 69,659 | 0.8 | 0.17 |
| Total Recoveries | 357,681 | 369,446 | 402,060 | 570,757 | 735,088 | 7.9 | 1.76 |
| Net Rental Income | $4,825,319 | $5,427,070 | $6,465,244 | $6,950,591 | $9,260,505 | 100.0% | $22.18 |
| (Vacancy & Credit Loss)(5) | (27,022) | (1,092,754) | (214,891) | (379,543) | (718,739)(6) | (8.5) | (1.72) |
| Effective Gross Income | $4,798,297 | $4,334,316 | $6,250,353 | $6,571,047 | $8,541,766 | 92.2% | $20.46 |
| Real Estate Taxes | 497,068 | 472,165 | 517,293 | 531,192 | 738,524 | 8.6 | 1.77 |
| Insurance | 130,938 | 126,633 | 128,869 | 132,201 | 119,880 | 1.4 | 0.29 |
| Management Fee | 246,770 | 130,029 | 187,511 | 197,131 | 256,253 | 3.0 | 0.61 |
| Other Operating Expenses | 2,792,680 | 2,867,547 | 2,936,884 | 3,089,287 | 3,089,287 | 36.2 | 7.40 |
| Total Operating Expenses | $3,667,455 | $3,596,374 | $3,770,556 | $3,949,812 | $4,203,944 | 49.2% | $10.07 |
| Net Operating Income | $1,130,842 | $737,942 | $2,479,797 | $2,621,235 | $4,337,822 | 50.8% | $10.39 |
| Replacement Reserves | 0 | 0 | 0 | 0 | 96,028 | 1.1 | 0.23 |
| TI/LC | 0 | 0 | 0 | 0 | 179,515 | 2.1 | 0.43 |
| Net Cash Flow | $1,130,842 | $737,942 | $2,479,797 | $2,621,235 | $4,062,279 | 47.6% | $9.73 |
| NOI DSCR | 0.52x | 0.34x | 1.14x | 1.20x | 1.99x | ||
| NCF DSCR | 0.52x | 0.34x | 1.14x | 1.20x | 1.86x | ||
| NOI Debt Yield | 3.1% | 2.0% | 6.9% | 7.2% | 12.0% | ||
| NCF Debt Yield | 3.1% | 2.0% | 6.9% | 7.2% | 11.2% |
| (1) | The decrease in Net Operating Income from 2016 to 2017 is due to an increase in free rent packages being offered to new tenants at the Capital Plaza Property in an effort to increase occupancy after Wachovia Bank (approximately 149,000 square feet) vacated in December 2015. |
| (2) | The increase in Net Operating Income from 2017 to TTM 5/31/2019 is due to (i) reduction and expiration of free rent and (ii) the increase in occupancy driven by (a) Allegis, that signed a new lease in 2018 and expanded in 2019 for a total of 67,114 square feet, (b) Tote Maritime that signed a new lease in 2019 for 37,398 square feet, and (c) Cass Information Systems that signed a new lease in 2018 for 2,977 square feet. |
| (3) | The increase in Net Operating Income from TTM 5/31/2019 to U/W is due to (i) $403,851 of rent steps; (ii) no free rent reduction as all free rent was reserved at origination; and (iii) rental income from new tenants, Allegis and Tote Maritime (approximately $1.6 million increase from TTM 5/31/2019 to U/W Base Rent), as well as expansion tenant, Johnson & Johnson, not being fully captured in the TTM 5/31/ 2019 period. |
| (4) | Represents (i) percent of Net Rental Income for all revenue fields, (ii) percent of Gross Potential Rent for Vacancy & Credit Loss and (iii) percent of Effective Gross Income for all other fields. |
| (5) | Historical (Vacancy & Credit Loss) reflect free rent amounts provided to tenants. |
| (6) | The underwritten economic vacancy is 8.5%. The Capital Plaza Property was 87.3% physically occupied (inclusive of static space) as of April 25, 2019. |
Appraisal. The appraiser concluded to an “as-is” appraised value of $56,000,000 as of April 9, 2019.
Environmental Matters. According to the Phase I environmental site assessment dated April 16, 2019, there was no evidence of any recognized environmental conditions at the Capital Plaza Property.
Market Overview and Competition.The Capital Plaza Property is located in Jacksonville, Florida in Duval County. Jacksonville is the most populous city in Florida with 1.5 million residents and the third most populous city on the east coast behind New York and Philadelphia. According to the appraisal, the Jacksonville region experienced solid economic growth throughout 2018, adding over 12,000 jobs for a 1.9% growth rate. Access to the Capital Plaza Property is provided by Interstate 95 (approximately 4.2 miles west of the Capital Plaza Property) and Interstate 295 (approximately 2.0 miles east of the Capital Plaza Property). Interstate 95 is a north-south highway spanning from Canada to Florida while Interstate 295 provides access to the local Jacksonville area. According to a third party report, this network of roads allows over one million people to access the Capital Plaza Property within a half-hour commute. The University of North Florida is a Florida public university with approximately 17,000 students and is located 3.2 miles from the Capital Plaza Property. Additionally, the Capital Plaza Property is located 1.5 miles away from St. John’s Town Center, an open-air lifestyle center containing approximately 1.4 million square feet of space anchored by Dillard’s, Target, Nordstrom, Dick’s Sporting Goods, Ashley Furniture, Apple and other major tenants as well as numerous options for dining and entertainment.
Submarket Information -According to the appraisal, the Capital Plaza Property is located in the Southside office submarket of the Jacksonville office market. As of year-end 2018, the submarket contained 6.8 million square feet of Class A office inventory with a
THE INFORMATION IN THIS STRUCTURAL AND COLLATERAL TERM SHEET IS NOT COMPLETE AND MAY BE AMENDED PRIOR TO THE TIME OF SALE. THIS TERM SHEET IS NOT AN OFFER TO SELL THESE SECURITIES AND IT IS NOT A SOLICITATION OF AN OFFER TO BUY THESE SECURITIES IN ANY JURISDICTION WHERE THE OFFER OR SALE IS NOT PERMITTED.
83
| Office - Suburban | Loan #5 | Cut-off Date Balance: | $36,190,000 | |
| 10301 & 10401 Deerwood Park Boulevard | Capital Plaza | Cut-off Date LTV: | 64.6% | |
| Jacksonville, FL 32256 | U/W NCF DSCR: | 1.86x | ||
| U/W NOI Debt Yield: | 12.0% |
vacancy rate of approximately 8.1%. The asking rental rate for Class A office space in the Southside submarket is $22.46 per square foot.
The following table presents certain information relating to the appraiser’s market rent conclusions for the Capital Plaza Property:
Market Rent Summary(1)
| <10,000 SF | 10,000-20,000 SF | >20,000 SF | |
| Market Rent (PSF) | $23.50 | $23.50 | $23.50 |
| Lease Term (Years) | 5 | 7 | 10 |
| Free Rent Months (New/Renewal) | 3/1 | 3/1 | 6/3 |
| Lease Type (Reimbursements) | Gross | Gross | Gross |
| Rent Increase Projection | 3% per annum | 3% per annum | 3% per annum |
| Tenant Improvements (New Tenants) (PSF) | $12.00 | $12.00 | $14.00 |
| Tenant Improvements (Renewals) (PSF) | $4.00 | $4.00 | $4.00 |
| (1) | Information obtained from the appraisal. |
The table below presents certain information relating to comparable sales pertaining to the Capital Plaza Property identified by the appraiser:
Comparable Sales(1)
| Property Name | Location | Rentable Area (SF) | Sale Date | Sale Price | Sale Price (PSF)(2) |
| Deerwood Park Office Portfolio | Jacksonville, FL | 1,271,759 | Apr-19 | $231,000,000 | $181.64 |
| Summit at Southpoint | Jacksonville, FL | 261,335 | Sep-18 | $29,550,000 | $113.07 |
| Concourse I, II & III | Jacksonville, FL | 288,147 | Jul-18 | $36,100,000 | $125.28 |
| Flagler Center Portfolio | Jacksonville, FL | 1,000,000 | Mar-18 | $136,000,000 | $136.00 |
| Gramercy Woods | Jacksonville, FL | 822,530 | May-17 | $115,000,000 | $139.81 |
| (1) | Information obtained from the appraisal. |
| (2) | Adjusted Sales Price (PSF) ranges from $121.52 to $147.37. |
THE INFORMATION IN THIS STRUCTURAL AND COLLATERAL TERM SHEET IS NOT COMPLETE AND MAY BE AMENDED PRIOR TO THE TIME OF SALE. THIS TERM SHEET IS NOT AN OFFER TO SELL THESE SECURITIES AND IT IS NOT A SOLICITATION OF AN OFFER TO BUY THESE SECURITIES IN ANY JURISDICTION WHERE THE OFFER OR SALE IS NOT PERMITTED.
84
| Office - Suburban | Loan #5 | Cut-off Date Balance: | $36,190,000 | |
| 10301 & 10401 Deerwood Park Boulevard | Capital Plaza | Cut-off Date LTV: | 64.6% | |
| Jacksonville, FL 32256 | U/W NCF DSCR: | 1.86x | ||
| U/W NOI Debt Yield: | 12.0% |
The following table presents certain information relating to comparable properties to Capital Plaza Property:
Comparable Leases(1)
| Property Name/Location | Year Built/ Renovated | Total GLA (SF) | Distance from Subject | Occupancy | Lease Term | Tenant Size (SF) | Adjusted Annual Base Rent PSF | TI Allowance PSF | Lease Type |
Centurion Centre II 10407 Centurion Parkway North Jacksonville, FL | 1996/NAP | 92,687 | 0.4 miles | NAV | 5.0 Yrs | 8,800 | $23.75 | $6.00 | Base Year Stop |
Centurion Centre II 10407 Centurion Parkway North Jacksonville, FL | 1996/NAP | 87,600 | 0.4 miles | NAV | 5.0 Yrs | 3,040 | $21.75 | $20.00 | Base Year Stop |
Deerwood South 200 10151 Deerwood Park Boulevard Jacksonville, FL | 1996/NAP | 126,274 | 0.6 miles | NAV | 5.0 Yrs | 7,000 | $24.00 | NAV | Base Year Stop |
One Deerwood / CIT Building 10201 Centurion Parkway North Jacksonville, FL | 1999/NAP | 161,000 | 0.8 miles | NAV | 10.0 Yrs | 114,247 | $21.50 | $18.00 | Base Year Stop |
Deerwood North 100 4600 Touchton Road Jacksonville, FL | 1999/NAP | 135,413 | 2.3 miles | 87.0% | 10.0 Yrs | 57,668 | $20.00 | NAV | Base Year Stop |
Baywood Center Buildings 1, 2, and 3 9428 Baymeadows Road Jacksonville, FL | 1985/NAP | 162,824 | 2.8 miles | 84.0% | 5.0 Yrs | 1,710 | $18.25 | NAV | Base Year Stop |
Concourse I, II, & III 5200-5220 Belfort Road Jacksonville, FL | 2000/NAP | 288,147 | 3.7 miles | 94.0% | 6.5 Yrs | 11,000 | $20.00 | NAV | Base Year Stop |
Baymeadows Office Building 8800 Baymeadows Way West Jacksonville, FL | 1993/NAP | 219,126 | 4.9 miles | NAV | 3.0 Yrs | 2,935 | $22.50 | NAV | Base Year Stop |
| (1) | Information obtained from appraisal. |
Escrows.
Immediate Repairs –At origination, the borrower was required to escrow $3,750 for immediate repairs at the Capital Plaza Property.
Real Estate Taxes – At origination, the borrower was required to escrow $425,302 for real estate taxes. The borrower is required to make monthly payments of one-twelfth of the taxes payable during the next twelve months, currently equal to $47,256.
Insurance – At origination, the borrower was required to escrow $19,980 for insurance premiums. The borrower is required to make monthly payments of one-twelfth of the insurance premiums payable during the next twelve months, currently equal to $9,990.
HOA Common Charges Reserve – The Capital Plaza Property is subject to a declaration of protective covenants establishing the Deerwood Park Owner’s Association, Inc., which provides rights to use of certain common elements and establishes certain use and development standards for the office park. At origination, the borrower was required to escrow $11,532 for common area charges under the park association. The borrower is required to make monthly payments of one-twelfth of the common area charges payable during the next twelve months, currently equal to $3,844.
Replacement Reserve – The borrower is required to make monthly payments of $8,002 into the replacement reserve account.
TI/LC Reserve –The borrower is required to deposit $3,900,000 into a tenant improvements and leasing commissions reserve at origination. The borrower will be required to make monthly deposits of $34,793 at any time the TI/LC Reserve balance is less than $3,900,000. Upon the occurrence of a Johnson & Johnson Re-Tenanting Event (as defined below), any amount in the TI/LC reserve account in excess of $2.0 million will be disbursed to the borrower.
Outstanding TI/LC Reserve –The borrower is required to deposit $1,570,784 into a reserve to fund outstanding tenant improvements and leasing commissions for Johnson & Johnson, Select Portfolio Servicing and LoanLogics.
Free Rent Reserve –The borrower is required to deposit $356,921 into a free rent reserve for rent abatement for Tote Maritime and LoanLogics.
Lockbox and Cash Management.The Capital Plaza Mortgage Loan requires a hard lockbox with springing cash management. The borrower was required at origination of the Capital Plaza Mortgage Loan to deliver written instructions to tenants directing them to deposit all rents payable under such leases directly into a lender-controlled lockbox account. The Capital Plaza Mortgage Loan documents require that all rents received by the borrower or the property manager be deposited into the lockbox account within one business day of receipt. Funds in the lockbox account, absent the occurrence and continuance of a Triggering Event (as defined below), are required to be transferred daily to a borrower operating account. Upon the first occurrence of a Triggering Event, the borrower is required to establish a cash management account under sole control of the lender, to which during a Triggering Event, all amounts in
THE INFORMATION IN THIS STRUCTURAL AND COLLATERAL TERM SHEET IS NOT COMPLETE AND MAY BE AMENDED PRIOR TO THE TIME OF SALE. THIS TERM SHEET IS NOT AN OFFER TO SELL THESE SECURITIES AND IT IS NOT A SOLICITATION OF AN OFFER TO BUY THESE SECURITIES IN ANY JURISDICTION WHERE THE OFFER OR SALE IS NOT PERMITTED.
85
| Office - Suburban | Loan #5 | Cut-off Date Balance: | $36,190,000 | |
| 10301 & 10401 Deerwood Park Boulevard | Capital Plaza | Cut-off Date LTV: | 64.6% | |
| Jacksonville, FL 32256 | U/W NCF DSCR: | 1.86x | ||
| U/W NOI Debt Yield: | 12.0% |
the lockbox account are required to be automatically transferred daily for the payment, among other things, of the debt service, monthly escrows, default interest and late payment charges. Any remaining funds after such disbursements are required to be (i) during a Low DSCR Period (as defined below), a Johnson & Johnson Trigger Event (as defined below) or a Select Portfolio Trigger Event (as defined below), deposited into an excess cash reserve account, and otherwise, (ii) to the borrower if no event of default has occurred and is continuing.
A “Triggering Event” will commence upon the earliest to occur of the following:
| (i) | an event of default under the Capital Plaza Mortgage Loan documents; |
| (ii) | the net operating income debt service coverage ratio falling below 1.25x based on a thirty-year amortization schedule; |
| (iii) | a Johnson & Johnson Trigger Event; or |
| (iv) | a Select Portfolio Trigger Event. |
A Triggering Event will end upon the occurrence of:
| ● | with regard to clause (i) above, the cure of such event of default; |
| ● | with regard to clause (ii) above, the net operating income debt service coverage ratio for the Capital Plaza Mortgage Loan being equal to or greater than 1.30x based on a 30-year amortization schedule (approximately 1.74x based on the interest only debt service payment) for two consecutive calendar quarters; |
| ● | with regard to clause (iii) above, a Johnson & Johnson Re-Tenanting Event; or |
| ● | with regard to clause (iii) above, a Select Portfolio Re-Tenanting Event (as defined below). |
A “Low DSCR Period” will commence upon the last day of the calendar quarter for which the debt service coverage ratio is less than 1.25x for two consecutive calendar quarters based on a thirty year amortization schedule and will end upon the last day of any two consecutive calendar quarters thereafter for each of which the debt service coverage ratio is greater than or equal to 1.30x based on a thirty year amortization schedule.
A “Johnson & Johnson Trigger Event” will commence upon the occurrence of:
| (i) | December 31, 2022 (or any date 12 months prior to Johnson & Johnson’s lease expiration date) provided a Johnson & Johnson Re-Tenanting Event (as defined below) has not occurred; |
| (ii) | Johnson & Johnson giving notice that it intends to terminate its lease pursuant to the terms of its lease provided a Johnson & Johnson Re-Tenanting Event has not occurred; |
| (iii) | Johnson & Johnson giving notice to the borrower in writing of its intent not to renew its lease pursuant to the terms of its lease provided a Johnson & Johnson Re-Tenanting Event has not occurred; |
| (iv) | Johnson & Johnson abandoning its leased space or failing to operate in one-third or more of its leased space for six months or longer provided a Johnson & Johnson Re-Tenanting Event has not occurred; |
| (v) | Johnson & Johnson or any guarantor of its lease filing for bankruptcy, insolvency, or reorganization; |
| (vi) | the Johnson & Johnson lease having in fact been terminated provided a Johnson & Johnson Re-Tenanting Event has not occurred; or |
| (vii) | Johnson & Johnson becoming delinquent under the payment obligations of its lease or being in material default under its lease, which delinquency or default remains uncured past the applicable notice and grace periods set forth in the lease, provided that a Johnson & Johnson Re-Tenanting Event has not occurred. |
A “Johnson & Johnson Re-Tenanting Event” will occur when the borrower has delivered to the lender:
| (i) | evidence reasonably satisfactory to the lender that (a) Johnson & Johnson has given notice of renewal under the terms of its lease (a tenant estoppel will not be required if Johnson & Johnson has given notice of renewal under the terms of its lease); (b) at least 80% or more of the Johnson & Johnson space has been re-tenanted under one or more Qualified Replacement Leases (as defined below); or (c) the Johnson & Johnson lease has been affirmed by Johnson & Johnson in a bankruptcy proceeding; and |
| (ii) | tenant estoppel(s) reasonably satisfactory to the lender. |
A “Select Portfolio Trigger Event” will commence upon the occurrence of, in the absence of a Select Portfolio Re-Tenanting Event (as defined below):
| (i) | August 31, 2026 (or any such date nine months prior to Select Portfolio Servicing’s lease expiration date); |
| (ii) | Select Portfolio Servicing giving notice that it intends to terminate its lease pursuant to the terms of its lease; |
| (iii) | Select Portfolio Servicing giving notice to the borrower in writing of its intent not to renew its lease pursuant to the terms of its lease; or |
| (iv) | the Select Portfolio Servicing lease has in fact been terminated. |
A “Select Portfolio Re-Tenanting Event” will occur when the borrower has delivered to the lender:
| (i) | evidence reasonably satisfactory to the lender that (a) Select Portfolio Servicing has given notice of renewal under the terms of its lease (a tenant estoppel will not be required if Select Portfolio Servicing has given notice of renewal under the terms of its lease); (b) at least 80% or more of the Select Portfolio Servicing space has been re-tenanted under one or more Qualified Replacement Leases; and |
| (ii) | tenant estoppel(s) reasonably satisfactory to the lender. |
THE INFORMATION IN THIS STRUCTURAL AND COLLATERAL TERM SHEET IS NOT COMPLETE AND MAY BE AMENDED PRIOR TO THE TIME OF SALE. THIS TERM SHEET IS NOT AN OFFER TO SELL THESE SECURITIES AND IT IS NOT A SOLICITATION OF AN OFFER TO BUY THESE SECURITIES IN ANY JURISDICTION WHERE THE OFFER OR SALE IS NOT PERMITTED.
86
| Office - Suburban | Loan #5 | Cut-off Date Balance: | $36,190,000 | |
| 10301 & 10401 Deerwood Park Boulevard | Capital Plaza | Cut-off Date LTV: | 64.6% | |
| Jacksonville, FL 32256 | U/W NCF DSCR: | 1.86x | ||
| U/W NOI Debt Yield: | 12.0% |
A “Qualified Replacement Lease” means a lease (i) with a term no less than five years; (ii) with a tenant reasonably acceptable to the lender; (iii) containing rental rates of at least $21.50 per square foot; (iv) does not have a material adverse effect on the use, value, or operation of the Capital Plaza Property; (v) is an arms-length transaction with a bona-fide independent third party tenant; (vi) is in compliance with the Capital Plaza Mortgage Loan documents; (vii) is subject to and subordinate to the lien of the security instrument securing the Capital Plaza Mortgage Loan and the tenant agrees to attorn to lender; and (viii) is otherwise on market terms and is reasonably acceptable to the lender.
Property Management. The Capital Plaza Property is managed by an affiliate of the borrower.
Partial Release. Not permitted.
Real Estate Substitution.Not permitted.
Subordinate and Mezzanine Indebtedness.None.
Ground Lease. None.
Terrorism Insurance.The Capital Plaza Mortgage Loan documents require that the “all risk” insurance policy required to be maintained by the borrower provides coverage for terrorism in an amount equal to the full replacement cost of the Capital Plaza Property, as well as business interruption insurance covering no less than the 18-month period following the occurrence of a casualty event, together with a 6-month extended period of indemnity.
THE INFORMATION IN THIS STRUCTURAL AND COLLATERAL TERM SHEET IS NOT COMPLETE AND MAY BE AMENDED PRIOR TO THE TIME OF SALE. THIS TERM SHEET IS NOT AN OFFER TO SELL THESE SECURITIES AND IT IS NOT A SOLICITATION OF AN OFFER TO BUY THESE SECURITIES IN ANY JURISDICTION WHERE THE OFFER OR SALE IS NOT PERMITTED.
87
| Loan #6 | Cut-off Date Balance: | $31,297,500 | ||
| Self Storage – Self Storage | Inland Life Storage Portfolio | Cut-off Date LTV: | 61.8% | |
| Property Addresses - Various | U/W NCF DSCR: | 1.68x | ||
| U/W NOI Debt Yield: | 9.5% |
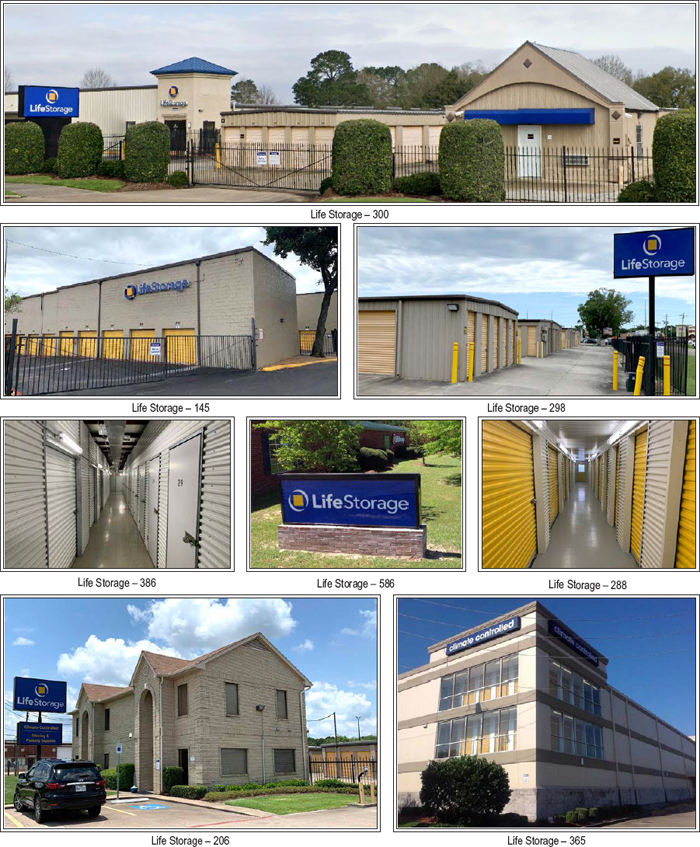
THE INFORMATION IN THIS STRUCTURAL AND COLLATERAL TERM SHEET IS NOT COMPLETE AND MAY BE AMENDED PRIOR TO THE TIME OF SALE. THIS TERM SHEET IS NOT AN OFFER TO SELL THESE SECURITIES AND IT IS NOT A SOLICITATION OF AN OFFER TO BUY THESE SECURITIES IN ANY JURISDICTION WHERE THE OFFER OR SALE IS NOT PERMITTED.
88
| Loan #6 | Cut-off Date Balance: | $31,297,500 | ||
| Self Storage – Self Storage | Inland Life Storage Portfolio | Cut-off Date LTV: | 61.8% | |
| Property Addresses - Various | U/W NCF DSCR: | 1.68x | ||
| U/W NOI Debt Yield: | 9.5% |
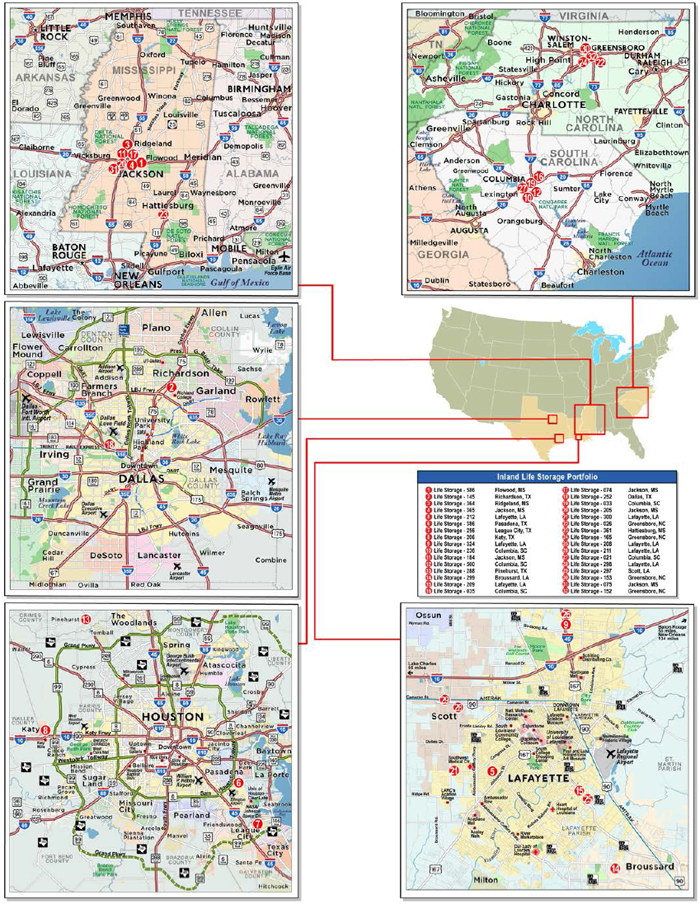
THE INFORMATION IN THIS STRUCTURAL AND COLLATERAL TERM SHEET IS NOT COMPLETE AND MAY BE AMENDED PRIOR TO THE TIME OF SALE. THIS TERM SHEET IS NOT AN OFFER TO SELL THESE SECURITIES AND IT IS NOT A SOLICITATION OF AN OFFER TO BUY THESE SECURITIES IN ANY JURISDICTION WHERE THE OFFER OR SALE IS NOT PERMITTED.
89
| No. 6 – Inland Life Storage Portfolio | |||||||
| Mortgage Loan Information | Mortgaged Property Information | ||||||
| Mortgage Loan Seller: | Barclays Capital Real Estate Inc. | Single Asset/Portfolio: | Portfolio | ||||
Credit Assessment (KBRA/Fitch/Moody’s): | NR/NR/NR | Property Type – Subtype: | Self Storage – Self Storage | ||||
| Original Principal Balance(1): | $31,297,500 | Location: | Various | ||||
| Cut-off Date Balance(1): | $31,297,500 | Size: | 17,278 Units | ||||
| % of Initial Pool Balance: | 3.5% | Cut-off Date Balance Per Unit(1): | $8,051 | ||||
| Loan Purpose: | Acquisition | Maturity Date Balance Per Unit(1): | $6,931 | ||||
| Borrower Sponsor: | Inland Private Capital Corporation | Year Built/Renovated: | Various/Various | ||||
| Guarantor: | Inland Private Capital Corporation | Title Vesting: | Fee | ||||
| Mortgage Rate: | 3.8090% | Property Manager: | Life Storage Solutions, LLC | ||||
| Note Date: | July 2, 2019 | Current Occupancy (As of)(3): | 91.3% (6/5/2019) | ||||
| Seasoning: | 0 months | YE 2018 Occupancy(3): | 90.3% | ||||
| Maturity Date: | August 1, 2029 | YE 2017 Occupancy(3): | 90.0% | ||||
| IO Period: | 36 months | YE 2016 Occupancy(3): | 90.4% | ||||
| Loan Term (Original): | 120 months | YE 2015 Occupancy(3): | 91.0% | ||||
| Amortization Term (Original): | 360 months | Appraised Value(4): | $225,000,000 | ||||
| Loan Amortization Type: | Interest-only, Amortizing Balloon | Appraised Value Per Unit(4): | $13,022 | ||||
| Call Protection: | L(25),GRTR 1% or YM(92),O(3) | Appraisal Valuation Date: | June 28,2019 | ||||
| Lockbox Type: | Springing | Underwriting and Financial Information | |||||
| Additional Debt(1): | Yes | TTM NOI (5/31/2019): | $14,852,222 | ||||
| Additional Debt Type (Balance)(1): | Pari Passu($107,802,500);Future Unsecured Debt | YE 2018 NOI: | $14,694,430 | ||||
| YE 2017 NOI: | $14,628,073 | ||||||
| YE 2016 NOI: | $14,704,582 | ||||||
| U/W Revenues: | $21,860,451 | ||||||
| U/W Expenses: | $8,604,656 | ||||||
| U/W NOI: | $13,255,794 | ||||||
| U/W NCF: | $13,044,942 | ||||||
| Escrows and Reserves(2) | U/W DSCR based on NOI/NCF(1): | 1.70x / 1.68x | |||||
| Initial | Monthly | Cap | U/W Debt Yield based on NOI/NCF(1): | 9.5% / 9.4% | |||
| Taxes | $0 | Springing | NAP | U/W Debt Yield at Maturity based on NOI/NCF(1): | 11.1% / 10.9% | ||
| Insurance | $0 | Springing | NAP | Cut-off Date LTV Ratio(1)(4): | 61.8% | ||
| Replacement Reserve | $424,056 | $35,338 | $424,056 | LTV Ratio at Maturity(1)(4): | 53.2% | ||
| Sources and Uses | ||||||||
| Sources | Uses | |||||||
| Original whole amount | $139,100,000 | 64.6% | Purchase price | $212,000,000 | 98.4% | |||
| Sponsor equity(5) | 76,355,341 | 35.4 | Upfront reserves | 424,056 | 0.2 | |||
| Closing costs | 3,031,285 | 1.4 | ||||||
| Total Sources | $215,455,341 | 100.0% | Total Uses | $215,455,341 | 100.0% | |||
| (1) | The Inland Life Storage Portfolio Mortgage Loan (as defined below) is part of the Inland Life Storage Portfolio Whole Loan (as defined below), which comprises fivepari passunotes with an aggregate original balance of $139,100,000. All statistical information related to the Cut-off Date Balance per Unit, Maturity Date Balance per Unit, U/W Debt Yield based on NOI/NCF, U/W Debt Yield at Maturity based on NOI/NCF, U/W DSCR based on NOI/NCF, Cut-off Date LTV Ratio and LTV Ratio at Maturity are based on the Inland Life Storage Portfolio Whole Loan. |
| (2) | See “Escrows” section for a full description of Escrows and Reserves. Additionally, and unrelated and separate from the Inland Life Storage Portfolio Whole Loan, the Inland Life Storage Portfolio Borrower (as defined below) funded $6,154,728 into a trust reserve account. Collectively, the Initial Escrows and Reserves and trust reserve account will be used for pay for (i) repairs and replacements of the structure, foundation, roof, exterior walls, and parking lot improvements at the Inland Life Storage Portfolio Properties (as defined below), (ii) leasing commissions, (iii) any environmental costs, (iv) any repairs identified in the property condition reports, (v) insurance deductibles and (vi) any other necessary property improvements at the Inland Life Storage Portfolio Properties. |
| (3) | See “Historical Occupancy” section. |
| (4) | The Appraised Value is based on a portfolio appraised value. The difference in the Inland Life Storage Portfolio “as-is” Appraised Value from the purchase price was partially driven by the existing Life Storage retaining management rights, thus excluding potential buyers with their own management platform. The appraisal’s concluded portfolio value of $225.0 million does not consider the management restrictions. The sum of the appraised values of the individual properties is $212,100,000, resulting in a Cut-off Date LTV Ratio and LTV Ratio at Maturity of 65.6% and 56.5%, respectively. |
| (5) | Sponsor equity was funded in part by a $40,000,000 unsecured corporate loan made by Barclays Bank PLC to Inland Private Capital Corporation, which is guaranteed by its parent company, Inland Real Estate Investment Corporation and matures on January 6, 2020. The corporate unsecured loan is not to the borrower and is neither secured by nor dependent upon income from the Inland Life Storage Properties. |
THE INFORMATION IN THIS STRUCTURAL AND COLLATERAL TERM SHEET IS NOT COMPLETE AND MAY BE AMENDED PRIOR TO THE TIME OF SALE. THIS TERM SHEET IS NOT AN OFFER TO SELL THESE SECURITIES AND IT IS NOT A SOLICITATION OF AN OFFER TO BUY THESE SECURITIES IN ANY JURISDICTION WHERE THE OFFER OR SALE IS NOT PERMITTED.
90
| Loan #6 | Cut-off Date Balance: | $31,297,500 | ||
| Self Storage – Self Storage | Inland Life Storage Portfolio | Cut-off Date LTV: | 61.8% | |
| Property Addresses - Various | U/W NCF DSCR: | 1.68x | ||
| U/W NOI Debt Yield: | 9.5% |
The Mortgage Loan.The mortgage loan (the “Inland Life Storage Portfolio Mortgage Loan”) is part of a whole loan (the “Inland Life Storage Portfolio Whole Loan”) evidenced by fivepari passu notes with an original principal balance of $139,100,000 and an outstanding principal balance as of the Cut-off Date of $139,100,000 secured by a first mortgage encumbering the fee interest in 32 self-storage properties located in Mississippi, Texas, Louisiana, South Carolina and North Carolina (the “Inland Life Storage Portfolio Properties” or the “Inland Life Storage Portfolio”). The Inland Life Storage Portfolio Mortgage Loan is evidenced by the non-controlling Note A-2-B. The controlling Note A-1-A and non-controlling Notes A-1-B, A-1-C and A-2-A are expected to be contributed to future securitization trusts. The lender provides no assurances that the non-securitized note will be split further. The Inland Life Storage Portfolio Whole Loan will be serviced under the WFCM 2019-C52 pooling and servicing agreement until the securitization of controlling Note A-1-A, at which time servicing will shift to the pooling and servicing agreement governing the future securitization transaction. See “Description of the Mortgage Pool — The Whole Loans – The Serviced Pari Passu Whole Loans,” “— The Non-Serviced Pari Passu Whole Loans” and “Pooling and Servicing Agreement” in the Preliminary Prospectus.
Note Summary
| Notes | Original Principal Balance | Cut-off Date Balance | Note Holder | Controlling Interest |
| A-1-A | $39,505,000 | $39,505,000 | KeyBank National Association | Yes |
| A-1-B | $27,000,000 | $27,000,000 | KeyBank National Association | No |
| A-1-C | $10,000,000 | $10,000,000 | KeyBank National Association | No |
| A-2-A | $31,297,500 | $31,297,500 | An affiliate of Barclays Capital Real Estate Inc. | No |
| A-2-B | $31,297,500 | $31,297,500 | WFCM 2019-C52 | No |
| Total | $139,100,000 | $139,100,000 |
The Borrower and Borrower Sponsor.The borrower is Self-Storage Portfolio VIII DST (the “Inland Life Storage Portfolio Borrower”), a Delaware statutory trust (“DST”) that is a single purpose, bankruptcy-remote entity. Upon the occurrence of a Conversion Event (as defined below), the Inland Life Storage Portfolio Borrower must convert from a Delaware statutory trust to a Delaware limited liability company. The Inland Life Storage Portfolio Borrower has master leased the Inland Life Storage Portfolio Properties to a master lessee affiliated with the borrower sponsor. The master lessee is structured to be a single purpose entity. The master lessee’s interest in the master lease and all rents are assigned to the lender. The borrower sponsor has a 100% ownership interest in the master lessee. The master lease is subordinate to the Inland Life Storage Portfolio Mortgage Loan. There is no income underwritten from the master lease as the Inland Life Storage Portfolio was underwritten to the underlying property income. There is an independent director for the signatory trustee. Legal counsel to the Inland Life Storage Portfolio Borrower delivered a non-consolidation opinion in connection with the origination of the Inland Life Storage Portfolio Whole Loan. See“Description of the Mortgage Pool—Delaware Statutory Trusts” in the Preliminary Prospectus.
A “Conversion Event” will commence upon written notice from the lender that the lender has determined that the Inland Life Storage Portfolio is in jeopardy of being foreclosed upon due to a default under the loan documents unless the borrower, within 10 business days of such notice provides a reasoned opinion of tax counsel that either (a) the borrower is able to remedy the default situation without effectuating a conversion or (b) that effectuating a conversion would not reasonably be expected to improve the ability of the borrower to remedy the default; provided, further, that if the borrower has failed to remedy such default to the lender’s satisfaction within 30 days of receipt of tax counsel opinion, the borrower will effect a Conversion Event.
The borrower sponsor and carve-out guarantor of the Inland Life Storage Portfolio Whole Loan is Inland Private Capital Corporation (“IPCC”). IPCC is an industry leader in securitized 1031 exchange transactions, sponsoring over 231 private placement programs since its inception which have provided more than $4.5 billion in equity and have served over 12,500 investors. According to the sponsor, through December 31, 2018, IPCC-sponsored private placements have included 621 properties comprised of more than 44 million square feet of gross leasable area, including more than 16,500 residential units. According to the borrower sponsor, as of December 31, 2018, IPCC has $7.3 billion assets under management. IPCC has had previous foreclosures and is involved in ongoing foreclosures unrelated to the Inland Life Storage Portfolio. See “Description of the Mortgage Pool – Loan Purpose; Default History, Bankruptcy Issues and Other Proceedings” in the Preliminary Prospectus.
The Properties. The Inland Life Storage Portfolio is a 32-property, 2,108,526 square-foot and 17,278 unit self-storage portfolio located in Mississippi (eight properties, 28.0% of the square footage, 25.7% of units), Texas (six properties, 23.6% of the square footage, 21.5% of units), Louisiana (nine properties, 25.1% of the square footage, 27.8% of units), South Carolina (five properties, 14.6% of the square footage, 16.0% of units) and North Carolina (four properties, 8.6% of the square footage, 9.1% of units). The Inland Life Storage Portfolio Properties were constructed from 1977 to 2003 and range in size from 31,600 square feet to 145,080 square feet and 285 units to 1,006 units, with no Inland Life Storage Portfolio Property comprising of more than 6.9% of the total net rentable area based on square footage and 5.8% of the total storage units, respectively. The Inland Life Storage Portfolio Properties have a total of 17,278 units, 8,147 of which are climate controlled and 263 are humidity-controlled. The Inland Life Storage Portfolio Properties also include 385 RV/parking spaces, and approximately 15,901 square feet of commercial units. The Life Storage – 021 and Life Storage - 033 properties have billboard leases with The Lamar Companies, and Life Storage – 033 and Life Storage – 206 have cell tower land leases. Based on storage units, the Inland Life Storage Portfolio Properties were 91.3% occupied as of June 5, 2019.
THE INFORMATION IN THIS STRUCTURAL AND COLLATERAL TERM SHEET IS NOT COMPLETE AND MAY BE AMENDED PRIOR TO THE TIME OF SALE. THIS TERM SHEET IS NOT AN OFFER TO SELL THESE SECURITIES AND IT IS NOT A SOLICITATION OF AN OFFER TO BUY THESE SECURITIES IN ANY JURISDICTION WHERE THE OFFER OR SALE IS NOT PERMITTED.
91
| Loan #6 | Cut-off Date Balance: | $31,297,500 | ||
| Self Storage – Self Storage | Inland Life Storage Portfolio | Cut-off Date LTV: | 61.8% | |
| Property Addresses - Various | U/W NCF DSCR: | 1.68x | ||
| U/W NOI Debt Yield: | 9.5% |
The following table presents certain information regarding the Inland Life Storage Properties:
| Property Name – Location | Allocated Cut-off Date Balance | % of Portfolio Cut-off Date Balance | Occupancy(1)(2) | Year Built/ Renovated | Net Rentable Area (SF)(2) | Appraised Value | UW NOI(2) | % of UW NOI | Storage Units(2) |
Life Storage - 586 Flowood, MS | $10,090,160 | 7.3% | 93.5% | 2000/2016 | 145,080 | $15,400,000 | $1,019,467 | 7.7% | 1,006 |
Life Storage - 145 Richardson, TX | 8,190,060 | 5.9 | 92.2 | 1985/NAP | 101,328 | 12,400,000 | 731,194 | 5.5 | 929 |
Life Storage - 364 Ridgeland, MS | 8,126,940 | 5.8 | 92.3 | 1997/NAP | 104,724 | 12,400,000 | 824,866 | 6.2 | 698 |
Life Storage - 365 Jackson, MS | 7,862,460 | 5.7 | 95.3 | 2003/NAP | 75,775 | 12,000,000 | 787,232 | 5.9 | 676 |
Life Storage - 212 Lafayette, LA | 6,814,130 | 4.9 | 91.0 | 1994/2005 | 73,275 | 10,400,000 | 674,559 | 5.1 | 655 |
Life Storage - 386 Pasadena, TX | 6,421,010 | 4.6 | 90.9 | 2000/NAP | 99,970 | 9,700,000 | 598,388 | 4.5 | 613 |
Life Storage - 256 League City, TX | 6,158,930 | 4.4 | 93.3 | 1992/2003 | 71,670 | 9,400,000 | 552,896 | 4.2 | 553 |
Life Storage - 206 Katy, TX | 5,831,320 | 4.2 | 92.2 | 1994/NAP | 87,252 | 8,900,000 | 522,385 | 3.9 | 626 |
Life Storage - 324 Lafayette, LA | 5,750,000 | 4.1 | 93.7 | 1995/2016 | 110,325 | 8,400,000 | 584,634 | 4.4 | 819 |
Life Storage - 236 Columbia, SC | 5,500,000 | 4.0 | 82.6 | 1981/2007 | 89,306 | 9,200,000 | 536,313 | 4.0 | 887 |
Life Storage - 184 Jackson, MS | 5,045,080 | 3.6 | 91.1 | 1995/NAP | 60,373 | 7,700,000 | 497,340 | 3.8 | 416 |
Life Storage - 500 Columbia, SC | 4,684,720 | 3.4 | 95.7 | 1977/NAP | 48,578 | 7,150,000 | 417,705 | 3.2 | 463 |
Life Storage - 288 Pinehurst, TX | 4,651,950 | 3.3 | 89.2 | 2003/NAP | 75,950 | 7,100,000 | 436,924 | 3.3 | 493 |
Life Storage - 299 Broussard, LA | 4,650,000 | 3.3 | 91.8 | 2002/2007 | 67,575 | 6,500,000 | 401,338 | 3.0 | 662 |
Life Storage - 209 Lafayette, LA | 4,586,430 | 3.3 | 93.0 | 1992/2014 | 53,475 | 7,000,000 | 442,461 | 3.3 | 503 |
Life Storage - 035 Columbia, SC | 4,000,000 | 2.9 | 90.8 | 1989/2013 | 67,200 | 6,400,000 | 386,177 | 2.9 | 595 |
Life Storage - 074 Jackson, MS | 3,940,000 | 2.8 | 89.4 | 1990/NAP | 65,225 | 6,000,000 | 399,649 | 3.0 | 491 |
Life Storage - 252 Dallas, TX | 3,800,190 | 2.7 | 92.1 | 1985/NAP | 61,472 | 5,800,000 | 349,393 | 2.6 | 504 |
Life Storage - 033 Columbia, SC | 3,505,350 | 2.5 | 91.3 | 1987/NAP | 56,750 | 5,350,000 | 329,332 | 2.5 | 423 |
Life Storage - 205 Jackson, MS | 3,500,000 | 2.5 | 87.8 | 1984/NAP | 57,497 | 4,300,000 | 318,640 | 2.4 | 477 |
Life Storage - 300 Lafayette, LA | 3,472,590 | 2.5 | 90.7 | 1997/2007 | 54,292 | 5,300,000 | 305,105 | 2.3 | 557 |
Life Storage - 026 Greensboro, NC | 3,079,460 | 2.2 | 91.6 | 1985/2008 | 60,795 | 4,700,000 | 280,965 | 2.1 | 535 |
Life Storage - 361 Hattiesburg, MS | 2,880,000 | 2.1 | 95.3 | 1998/NAP | 44,154 | 4,100,000 | 285,607 | 2.2 | 364 |
Life Storage - 165 Greensboro, NC | 2,522,540 | 1.8 | 94.4 | 1993/2000 | 56,388 | 3,850,000 | 249,523 | 1.9 | 461 |
Life Storage - 208 Lafayette, LA | 2,424,260 | 1.7 | 91.3 | 1980/NAP | 56,620 | 3,700,000 | 229,563 | 1.7 | 483 |
Life Storage - 211 Lafayette, LA | 2,358,740 | 1.7 | 91.8 | 1977/2005 | 45,200 | 3,600,000 | 182,795 | 1.4 | 392 |
Life Storage - 021 Columbia, SC | 2,200,000 | 1.6 | 83.9 | 1988/NAP | 46,668 | 4,200,000 | 224,276 | 1.7 | 391 |
Life Storage - 298 Lafayette, LA | 2,096,660 | 1.5 | 89.9 | 2001/2004 | 37,025 | 3,200,000 | 194,575 | 1.5 | 397 |
Life Storage - 297 Scott, LA | 1,500,000 | 1.1 | 92.7 | 1997/NAP | 31,600 | 2,500,000 | 145,401 | 1.1 | 329 |
Life Storage - 153 Greensboro, NC | 1,277,650 | 0.9 | 89.0 | 1996/2001 | 32,875 | 1,950,000 | 121,998 | 0.9 | 291 |
Life Storage - 075 Jackson, MS | 1,179,370 | 0.8 | 87.2 | 1988/NAP | 38,361 | 1,800,000 | 122,592 | 0.9 | 304 |
Life Storage - 152 Greensboro, NC | 1,000,000 | 0.7 | 91.2 | 1995/2000 | 31,748 | 1,700,000 | 102,502 | 0.8 | 285 |
| Total/Weighted Average | $139,100,000 | 100.0% | 91.3% | 2,108,526 | $225,000,000(3) | $13,255,794 | 100.0% | 17,278 |
| (1) | Occupancy is based on storage units. |
| (2) | Based on the underwritten rent roll. |
| (3) | The total Appraised Value is based on a portfolio appraised value. The sum of the appraised values of the individual properties is $212,100,000, resulting in a Cut-off Date LTV Ratio and LTV Ratio at Maturity of 65.6% and 56.5%, respectively. |
THE INFORMATION IN THIS STRUCTURAL AND COLLATERAL TERM SHEET IS NOT COMPLETE AND MAY BE AMENDED PRIOR TO THE TIME OF SALE. THIS TERM SHEET IS NOT AN OFFER TO SELL THESE SECURITIES AND IT IS NOT A SOLICITATION OF AN OFFER TO BUY THESE SECURITIES IN ANY JURISDICTION WHERE THE OFFER OR SALE IS NOT PERMITTED.
92
| Loan #6 | Cut-off Date Balance: | $31,297,500 | ||
| Self Storage – Self Storage | Inland Life Storage Portfolio | Cut-off Date LTV: | 61.8% | |
| Property Addresses - Various | U/W NCF DSCR: | 1.68x | ||
| U/W NOI Debt Yield: | 9.5% |
The following table presents historical occupancy percentages at the Inland Life Storage Portfolio:
Historical Occupancy(1)
12/31/2015(2)(3) | 12/31/2016(2) | 12/31/2017(2) | 12/31/2018(2) | 6/5/2019(4) |
| 91.6% | 90.4% | 90.0% | 90.3% | 91.3% |
| (1) | Occupancy is based on storage units. |
| (2) | Information provided by the Inland Life Storage Portfolio Borrower. |
| (3) | 2015 occupancy excludes the Life Storage – 586 property for which 2015 historical occupancy was not available. |
| (4) | Based on underwritten rent roll. |
Operating History and Underwritten Net Cash Flow. The following table presents certain information relating to the historical operating performance and underwritten net cash flow at the Inland Life Storage Portfolio Properties:
Cash Flow Analysis
| 2016 | 2017 | 2018 | TTM 5/31/2019 | U/W | %(1) | U/W $ per Unit | |
| Base Rent(2) | $21,891,829 | $20,717,492 | $21,192,134 | $21,369,324 | $19,461,586 | 76.0% | $1,126.38 |
| Commercial Income(2) | 0 | 0 | 0 | 0 | 115,692 | 0.5 | 6.70 |
| Parking Income(2) | 0 | 0 | 0 | 0 | 275,172 | 1.1 | 15.93 |
| Grossed Up Vacant Space(3) | 0 | 0 | 0 | 0 | 3,742,236 | 14.6 | 216.59 |
| Gross Potential Rent | $21,891,829 | $20,717,492 | $21,192,134 | $21,369,324 | $23,594,686 | 92.2% | 1,365.59 |
| Other Income(4) | 1,992,781 | 1,972,735 | 1,911,650 | 2,008,001 | 2,008,001 | 7.8 | 116.22 |
| Net Rental Income | $23,884,610 | $22,690,227 | 23,103,784 | $23,377,325 | $25,602,687 | 100.0% | $1,481.81 |
| (Vacancy & Credit Loss) | (2,463,804) | (1,063,695) | (1,529,407) | (1,516,882) | (3,742,236)(5) | (15.9) | (216.59) |
| Effective Gross Income | $21,420,806 | $21,626,532 | $21,574,377 | $21,860,443 | $21,860,451 | 85.4% | $1,265.22 |
| Real Estate Taxes | 1,700,719 | 1,789,947 | 1,853,692 | 1,907,357 | 2,005,928 | 9.2 | 116.10 |
| Insurance | 178,976 | 185,310 | 191,810 | 192,843 | 597,684 | 2.7 | 34.59 |
| Management Fee | 0 | 0 | 0 | 0 | 1,093,023 | 5.0 | 63.26 |
| Other Operating Expenses | 4,836,529 | 5,023,202 | 4,834,445 | 4,908,021 | 4,908,021 | 22.5 | 284.06 |
| Total Operating Expenses | $6,716,224 | $6,998,459 | $6,879,947 | $7,008,221 | $8,604,656 | 39.4% | $498.01 |
| Net Operating Income | $14,704,582 | $14,628,073 | $14,694,430 | $14,852,222 | $13,255,794 | 60.6% | $767.21 |
| Replacement Reserves | 9,342 | 79,193 | 72,587 | 151,008 | 210,853 | 1.0 | 12.20 |
| TI/LC | 0 | 0 | 0 | 0 | 0 | 0.0 | 0.00 |
| Net Cash Flow | $14,695,240 | $14,548,880 | $14,621,843 | $14,701,214 | $13,044,942 | 59.7% | $755.00 |
| NOI DSCR | 1.89x | 1.88x | 1.89x | 1.91x | 1.70x | ||
| NCF DSCR | 1.89x | 1.87x | 1.88x | 1.89x | 1.68x | ||
| NOI Debt Yield | 10.6% | 10.5% | 10.6% | 10.7% | 9.5% | ||
| NCF Debt Yield | 10.6% | 10.5% | 10.5% | 10.6% | 9.4% |
| (1) | Represents (i) percent of Net Rental Income for all revenue fields, (ii) percent of Gross Potential Rent for Vacancy & Credit Loss and (iii) percent of Effective Gross Income for all other fields. |
| (2) | Commercial Income and Parking Income for historical periods are included in Base Rent. |
| (3) | Grossed Up Vacant Space includes commercial grossed up vacant space totaling $28,596. |
| (4) | Other Income includes parking income, late fees, administration fees, merchandise sales, truck rental, insurance income, and other miscellaneous income. |
| (5) | The underwritten economic vacancy is 16.2%. The Inland Life Storage Portfolio Properties were 91.3% occupied as of June 5, 2019 based on storage units. |
Appraisal.The appraiser concluded to an “as-is” Appraised Value for the Inland Life Storage Portfolio of $225,000,000 with a portfolio appraisal dated June 28, 2019. The difference in the Inland Life Storage Portfolio “as-is” Appraised Value from the purchase price was partially driven by the existing Life Storage management platform remaining in place, thus excluding potential buyers with an existing management platform. The appraisal’s concluded portfolio value of $225.0 million does not consider the management restrictions. The sum of the appraised values of the individual properties is $212,100,000, resulting in a Cut-off Date LTV Ratio and LTV Ratio at Maturity of 65.6% and 56.5%, respectively.
Environmental Matters.According to Phase I environmental site assessments dated from March 22, 2019 to March 28, 2019, there was no evidence of any recognized environmental conditions at the Inland Life Storage Portfolio Properties.
THE INFORMATION IN THIS STRUCTURAL AND COLLATERAL TERM SHEET IS NOT COMPLETE AND MAY BE AMENDED PRIOR TO THE TIME OF SALE. THIS TERM SHEET IS NOT AN OFFER TO SELL THESE SECURITIES AND IT IS NOT A SOLICITATION OF AN OFFER TO BUY THESE SECURITIES IN ANY JURISDICTION WHERE THE OFFER OR SALE IS NOT PERMITTED.
93
| Loan #6 | Cut-off Date Balance: | $31,297,500 | ||
| Self Storage – Self Storage | Inland Life Storage Portfolio | Cut-off Date LTV: | 61.8% | |
| Property Addresses - Various | U/W NCF DSCR: | 1.68x | ||
| U/W NOI Debt Yield: | 9.5% |
Market Overview.The Inland Life Storage Portfolio is a 32-property, 2,108,526 square-foot and 17,278 unit self-storage portfolio located in Mississippi (eight properties, 28.0% of the square footage, 25.7% of units), Texas (six properties, 23.6% of the square footage, 21.5% of units), Louisiana (nine properties, 25.1% of the square footage, 27.8% of units), South Carolina (five properties, 14.6% of the square footage, 16.0% of units) and North Carolina (four properties, 8.6% of the square footage, 9.1% of units). According to the third party market reports, the Mississippi properties are located in the Jackson metro area with average monthly asking rents of $76 and $118 per unit for 10x10 foot non-climate controlled and climate controlled units, respectively. As of the end of the first quarter of 2019, the Jackson metro area had a 14.8% vacancy rate for self storage properties. According to the third party market reports, the Texas properties are located in the Houston and Dallas metro areas. Houston has average monthly asking rents of $89 and $119 per unit for 10x10 foot non-climate controlled and climate controlled units, respectively, while Dallas has average monthly asking rents of $102 and $130 per unit, respectively. As of the end of the first quarter of 2019, the Houston metro area had a 14.9% vacancy rate for self storage properties and the Dallas metro area had a vacancy rate of 15.6% for self-storage properties. According to a third party market report, the South Carolina properties are located in the Columbia metro area with average monthly asking rents of $86 and $116 per unit for 10x10 foot non-climate controlled and climate controlled units, respectively. As of the end of the first quarter of 2019, the Columbia metro area had a 13.8% vacancy rate for self-storage properties. According to a third party market report, the North Carolina properties are located in the Greensboro/Winston-Salem metro area with average monthly asking rents of $77 and $104 per unit for 10x10 foot non-climate controlled and climate controlled units, respectively. As of the end of the first quarter of 2019, the Greensboro/Winston-Salem metro area had a 16.9% vacancy rate for self storage properties. The Louisiana properties are located within the Lafayette metro area. The average monthly rents and vacancy rate were unavailable for this metro area.
Escrows.
Real Estate Taxes –The Inland Life Storage Portfolio Borrower is required to make monthly payments of one-twelfth of the taxes payable during the next 12 months upon (i) the occurrence and continuance of an event of default, (ii) the debt service coverage ratio on a trailing three-month basis being less than 1.15x based on a 30-year amortization schedule, or (iii) failure to provide the lender with satisfactory evidence that taxes have been paid 10 days prior to when such taxes are due.
Insurance –The Inland Life Storage Portfolio Borrower is required to make monthly payments of one-twelfth of the insurance premiums payable during the next 12 months upon (i) the occurrence and continuance of an event of default, (ii) the debt service coverage ratio on a trailing three-month basis being less than 1.15x based on a 30-year amortization schedule, or (iii) failure to provide evidence to the lender that the Inland Life Storage Portfolio Properties are insured under a blanket policy.
Replacement Reserves –At closing, the Inland Life Storage Portfolio Borrower deposited $424,056 for replacement reserves. The Inland Life Storage Portfolio Borrower is only required to make monthly payments of $35,338 for replacement reserves (which may be re-assessed as necessary on an annual basis) to the extent that the replacement reserve account does not equal or exceed the replacement reserve cap of $424,056.
Lockbox and Cash Management. The Inland Life Storage Portfolio Whole Loan is structured with springing cash management. The cash management account will be established within five business days of the first occurrence of a Cash Sweep Event (as defined below). During the continuance of a Cash Sweep Event, the Inland Life Storage Portfolio Borrower is required to deposit, or cause to be deposited, all rents into the cash management account within two business days of receipt. During a Cash Sweep Event, the Inland Life Storage Portfolio Borrower will deliver tenant direction letters to the commercial tenants at the Inland Life Storage Portfolio Properties directing such tenants to deliver rents payable directly into the cash management account. Additionally, all funds deposited in the cash management account will be disbursed in accordance with the Inland Life Storage Portfolio Whole Loan documents. During the occurrence of a Cash Sweep Event, all excess cash flow will be deposited into an excess cash flow reserve to be held as additional security for the Inland Self Storage Portfolio Whole Loan.
A “Cash Sweep Event” will commence upon the earliest of (i) the occurrence and continuance of an event of default and (ii) the debt service coverage ratio being less than 1.20x based on the trailing three-month period. A Cash Sweep Event will expire with regard to clause (i), upon the cure of such event of default and with respect to clause (ii), upon the debt service coverage ratio being greater than or equal to 1.25x for two consecutive calendar quarters based upon the trailing three-month period immediately preceding the date of determination.
Property Management.The Inland Life Storage Portfolio Properties are managed by Life Storage Solutions, LLC (“Life Storage”). Life Storage is the prior owner of the Inland Life Storage Portfolio Properties and will remain the property manager. Founded in 1985, Life Storage is a national owner and operator of self storage properties, with over 775 locations in 28 states serving more than 400,000 customers. In addition to the Inland Life Storage Properties, Life Storage manages 217 additional properties for third party entities.
Partial Release.After the lockout period, the Inland Life Storage Portfolio Borrower may release an individual property provided that, among other conditions stated in the Inland Life Storage Portfolio Whole Loan documents, (i) no event of default has occurred and is continuing; (ii) the amount of the Inland Life Storage Portfolio Whole Loan prepaid will be greater than or equal to 120% of the allocated loan amount for the related Inland Life Storage Portfolio property; (iii) the debt service coverage ratio for the remaining properties after such release is at least equal to the greater of (a) 1.67x and (b) the debt service coverage ratio for the remaining properties and the property to be released for the preceding 12 months capped at 1.70x; (iv) the loan-to-value ratio after such release is less than or equal to the lesser of (a) 61.8% and (b) the loan-to-value ratio for the remaining properties and the property to be released immediately preceding the release of the property; however, this condition does not apply to the release of any individual property if, after such release, the aggregate allocated loan amounts of all the properties that have been released are less than 20%
THE INFORMATION IN THIS STRUCTURAL AND COLLATERAL TERM SHEET IS NOT COMPLETE AND MAY BE AMENDED PRIOR TO THE TIME OF SALE. THIS TERM SHEET IS NOT AN OFFER TO SELL THESE SECURITIES AND IT IS NOT A SOLICITATION OF AN OFFER TO BUY THESE SECURITIES IN ANY JURISDICTION WHERE THE OFFER OR SALE IS NOT PERMITTED.
94
| Loan #6 | Cut-off Date Balance: | $31,297,500 | ||
| Self Storage – Self Storage | Inland Life Storage Portfolio | Cut-off Date LTV: | 61.8% | |
| Property Addresses - Various | U/W NCF DSCR: | 1.68x | ||
| U/W NOI Debt Yield: | 9.5% |
of the total original principal balance of the Inland Life Storage Portfolio Whole Loan; (v) the debt yield for the remaining properties after such release is greater than or equal to the greater of (a) 9.3% and (b) the debt yield of the remaining properties and the property to be released for the 12 months prior to such release capped at 9.6%;(vi) rating agency confirmation; and (vii) the payment of the yield maintenance premium (if such partial release occurs prior to June 1, 2029).
Subordinate and Mezzanine Indebtedness.None.
Permitted Additional Unsecured Subordinate Indebtedness.Provided no event of default has occurred and is continuing, the Inland Life Storage Portfolio Borrower may obtain unsecured loans from the guarantor provided that the proceeds of such loans are required to be used solely to pay the monthly debt service payment amount, capital expenditures (as approved by the lender), extraordinary expenses, maintenance expenses, costs of re-tenanting of the Inland Life Storage Portfolio Properties and actual operating expenses as a result of insufficient reserves held by the Inland Life Storage Portfolio Borrower or as a result of insufficient rents being paid. The subordinate debt must at all times be, (i) unsecured, (ii) payable only out of excess cash, (iii) subordinate in all respects to the Inland Life Storage Portfolio Whole Loan pursuant to a subordination and standstill agreement, which is required to be executed and delivered by the guarantor prior to providing the subordinate debt, (iv) without a maturity date, and (v) evidenced by a promissory note with terms and conditions otherwise acceptable to the lender. The aggregate of all guarantor loans that may be entered into without the lender’s consent is $13,910,000; provided, however, that no more than $500,000 of the proceeds of such loan may be used for the payment of operating expenses and debt service without prior written consent from the lender. Under no circumstances may the subordinate debt be used to make distributions to any beneficial owners of the Inland Life Storage Portfolio Borrower.
Ground Lease.None.
Terrorism Insurance.The Inland Life Storage Portfolio Whole Loan documents require that the “all risk” insurance policy required to be maintained by the Inland Life Storage Portfolio Borrower provides coverage for terrorism in an amount equal to the full replacement cost of the Inland Life Storage Portfolio Properties, as well as business interruption insurance covering no less than the 12-month period following the occurrence of a casualty event, together with a six-month extended period of indemnity.
THE INFORMATION IN THIS STRUCTURAL AND COLLATERAL TERM SHEET IS NOT COMPLETE AND MAY BE AMENDED PRIOR TO THE TIME OF SALE. THIS TERM SHEET IS NOT AN OFFER TO SELL THESE SECURITIES AND IT IS NOT A SOLICITATION OF AN OFFER TO BUY THESE SECURITIES IN ANY JURISDICTION WHERE THE OFFER OR SALE IS NOT PERMITTED.
95
| Office – Medical | Loan #7 | Cut-off Date Balance: | $30,000,000 | |
| 5901 and 5975 West Olympic Boulevard | Olympia Medical Office | Cut-off Date LTV: | 59.2% | |
| Los Angeles, CA 90036 | U/W NCF DSCR: | 2.07x | ||
| U/W NOI Debt Yield: | 10.7% |
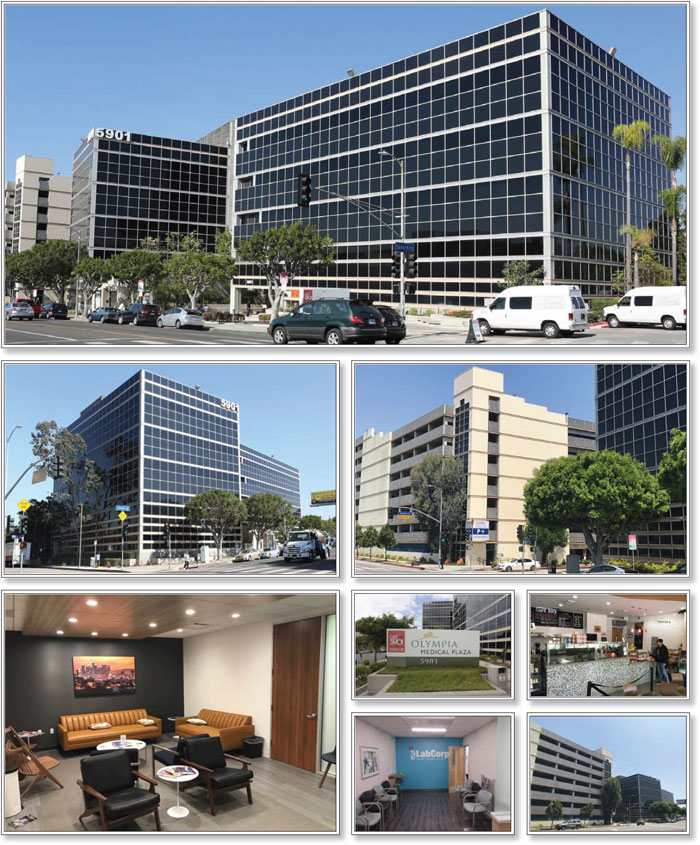
THE INFORMATION IN THIS STRUCTURAL AND COLLATERAL TERM SHEET IS NOT COMPLETE AND MAY BE AMENDED PRIOR TO THE TIME OF SALE. THIS TERM SHEET IS NOT AN OFFER TO SELL THESE SECURITIES AND IT IS NOT A SOLICITATION OF AN OFFER TO BUY THESE SECURITIES IN ANY JURISDICTION WHERE THE OFFER OR SALE IS NOT PERMITTED.
96
| Office – Medical | Loan #7 | Cut-off Date Balance: | $30,000,000 | |
| 5901 and 5975 West Olympic Boulevard | Olympia Medical Office | Cut-off Date LTV: | 59.2% | |
| Los Angeles, CA 90036 | �� | U/W NCF DSCR: | 2.07x | |
| U/W NOI Debt Yield: | 10.7% |
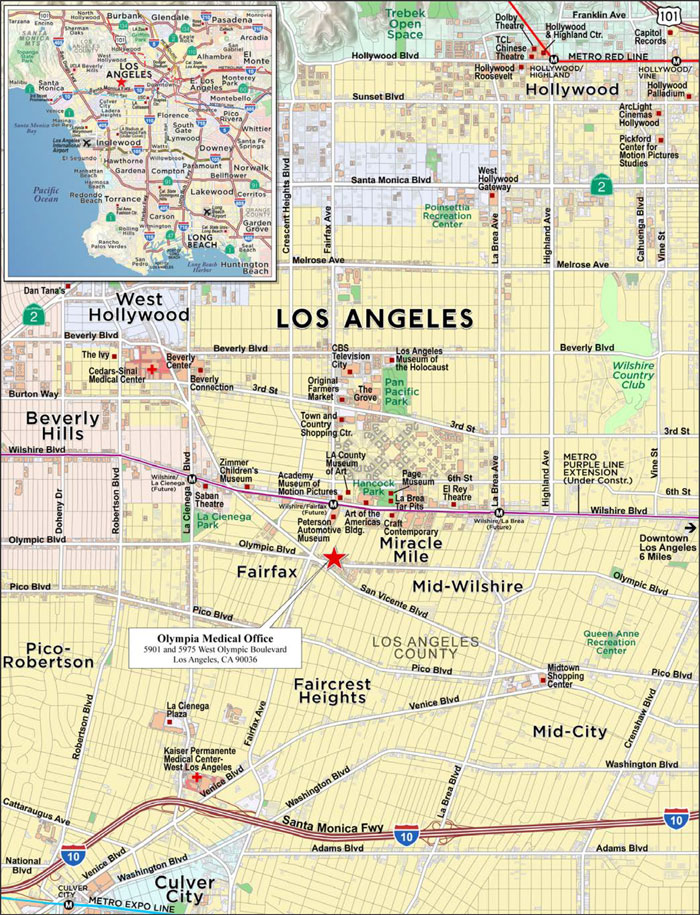
THE INFORMATION IN THIS STRUCTURAL AND COLLATERAL TERM SHEET IS NOT COMPLETE AND MAY BE AMENDED PRIOR TO THE TIME OF SALE. THIS TERM SHEET IS NOT AN OFFER TO SELL THESE SECURITIES AND IT IS NOT A SOLICITATION OF AN OFFER TO BUY THESE SECURITIES IN ANY JURISDICTION WHERE THE OFFER OR SALE IS NOT PERMITTED.
97
| No. 7 – Olympia Medical Office | |||||||
| Mortgage Loan Information | Mortgaged Property Information | ||||||
| Mortgage Loan Seller: | Wells Fargo Bank, National Association | Single Asset/Portfolio: | Single Asset | ||||
Credit Assessment (Fitch/KBRA/Moody’s): | NR/NR/NR | Property Type – Subtype: | Office – Medical | ||||
| Original Principal Balance: | $30,000,000 | Location: | Los Angeles, CA | ||||
| Cut-off Date Balance: | $30,000,000 | Size: | 90,549 SF | ||||
| % of Initial Pool Balance: | 3.3% | Cut-off Date Balance Per SF: | $331.31 | ||||
| Loan Purpose: | Refinance | Maturity Date Balance Per SF: | $331.31 | ||||
| Borrower Sponsor: | Laxman Reddy | Year Built/Renovated: | 1984/2018 | ||||
| Guarantor: | Sunrise Real Estate Holdings, LLC | Title Vesting: | Fee | ||||
| Mortgage Rate: | 4.9500% | Property Manager: | South Park Group, Inc. and Citi West Management Corp. | ||||
| Note Date: | June 20, 2019 | Current Occupancy (As of): | 100.0% (6/11/2019) | ||||
| Seasoning: | 1 month | YE 2018 Occupancy: | 100.0% | ||||
| Maturity Date: | July 11, 2024 | YE 2017 Occupancy: | 93.0% | ||||
| IO Period: | 60 months | YE 2016 Occupancy(3): | 87.4% | ||||
| Loan Term (Original): | 60 months | YE 2015 Occupancy(3): | 73.8% | ||||
| Amortization Term (Original): | NAP | As-Is Appraised Value: | $50,700,000 | ||||
| Loan Amortization Type: | Interest-only, Balloon | As-Is Appraised Value Per SF: | $559.92 | ||||
| Call Protection: | L(25),D(31),O(4) | As-Is Appraisal Valuation Date: | June 1, 2019 | ||||
| Lockbox Type: | Springing | Underwriting and Financial Information | |||||
| Additional Debt: | None | TTM NOI (5/31/2019): | $3,434,413 | ||||
| Additional Debt Type (Balance): | NAP | YE 2018 NOI(4): | $3,418,606 | ||||
| YE 2017 NOI(4): | $3,088,917 | ||||||
| YE 2016 NOI(4): | $2,684,027 | ||||||
| U/W Revenues: | $4,597,714 | ||||||
| U/W Expenses: | $1,385,540 | ||||||
| Escrows and Reserves(1) | U/W NOI: | $3,212,174 | |||||
| Initial | Monthly | Cap | U/W NCF: | $3,132,653 | |||
| Taxes | $91,676 | $22,919 | NAP | U/W DSCR based on NOI/NCF: | 2.13x / 2.07x | ||
| Insurance | $0 | Springing | NAP | U/W Debt Yield based on NOI/NCF: | 10.7% / 10.4% | ||
| Replacement Reserve | $0 | $1,886 | NAP | U/W Debt Yield at Maturity based on NOI/NCF: | 10.7% / 10.4% | ||
| Leasing Reserve | $750,000 | $15,092 | $750,000 | Cut-off Date LTV Ratio: | 59.2% | ||
| Rent Concession Reserve | $355,002 | $0 | NAP | LTV Ratio at Maturity: | 59.2% | ||
| Additional Insurance Reserve | $500,000(2) | $0 | NAP | ||||
| Sources and Uses | ||||||||
| Sources | Uses | |||||||
| Original loan amount | $30,000,000 | 100.0% | Loan payoff(5) | $19,477,830 | 64.9% | |||
| Upfront reserves(2) | 1,696,678 | 5.7 | ||||||
| Closing costs | 379,012 | 1.3 | ||||||
| Return of equity | 8,446,480 | 28.2 | ||||||
| Total Sources | $30,000,000 | 100.0% | Total Uses | $30,000,000 | 100.0% | |||
| (1) | See “Escrows” section below. |
| (2) | The Additional Insurance Reserve was escrowed in an amount of $500,000 at loan origination. The requirements for disbursement under the Olympia Medical Office Mortgage Loan (as defined in “The Mortgage Loan” section below) documents have been met and the funds were released to the Olympia Medical Office Borrower (as defined in “The Borrower and Borrower Sponsor” section below). See the “Escrows” section below for additional information. |
| (3) | See “Historical Occupancy” section for a discussion of historical occupancy increases. |
| (4) | See “Cash Flow Analysis” section for a discussion of historical NOI increases. |
| (5) | The Olympia Medical Office Property (as defined in “The Mortgage Loan” section below) was previously securitized in the GSMS 2012-GC6 transaction. |
The Mortgage Loan. The mortgage loan (the “Olympia Medical Office Mortgage Loan”) is evidenced by a single promissory note secured by a first mortgage encumbering the fee interest in a five-story medical office property in Los Angeles, California (the “Olympia Medical Office Property”).
The Borrower and Borrower Sponsor.The borrower is Plaza Medical Office Building, LLC, a California limited liability company and single purpose entity (the “Olympia Medical Office Borrower). Legal counsel to the Olympia Medical Office Borrower delivered a non-consolidation opinion in connection with the origination of the Olympia Medical Office Mortgage Loan. The non-recourse carve-out guarantor of the Olympia Medical Office Mortgage Loan is Sunrise Real Estate Holdings, LLC and the borrower sponsor is Laxman
THE INFORMATION IN THIS STRUCTURAL AND COLLATERAL TERM SHEET IS NOT COMPLETE AND MAY BE AMENDED PRIOR TO THE TIME OF SALE. THIS TERM SHEET IS NOT AN OFFER TO SELL THESE SECURITIES AND IT IS NOT A SOLICITATION OF AN OFFER TO BUY THESE SECURITIES IN ANY JURISDICTION WHERE THE OFFER OR SALE IS NOT PERMITTED.
98
| Office – Medical | Loan #7 | Cut-off Date Balance: | $30,000,000 | |
| 5901 and 5975 West Olympic Boulevard | Olympia Medical Office | Cut-off Date LTV: | 59.2% | |
| Los Angeles, CA 90036 | U/W NCF DSCR: | 2.07x | ||
| U/W NOI Debt Yield: | 10.7% |
Reddy. Mr. Reddy executed a limited guaranty of recourse obligations related to breach of any representations, warranties or covenants concerning single purpose entity status (including, but not limited to, bankruptcy and insolvency), prohibited transfers or failure to comply with the cash management provisions (see the “Lockbox and Cash Management” section below) under the Olympia Medial Office Mortgage Loan documents.
Mr. Reddy is the Chief Executive Officer of Alecto Healthcare Services (“Alecto”), a healthcare system and management services organization which currently operates a total of four hospital properties located in California, Texas and West Virginia (including Olympia Medical Center, which is adjacent to the Olympia Medical Office Property). Prior to forming Alecto, Mr. Reddy served as the President and Chief Executive Officer of a Prime Healthcare Services(“Prime”), during a period in which it grew from a one-hospital system to a 15-hospital system. Mr. Reddy has more than 25 years of experience in hospital management. Prime was named in a whistleblower lawsuit in October 2011, alleging that Prime violated the False Claims Act by upcoding Medicare patient claims. The U.S. Department of Justice (“DOJ”) joined the lawsuit in 2016. Mr. Reddy was neither personally charged by the DOJ, nor named as a defendant in the lawsuit. See “Description of the Mortgage Pool—Litigation and Other Considerations” in the Preliminary Prospectus for addition information.
The Property.The Olympia Medical Office Property consists of a five-story medical office building totaling 90,549 square feet and a seven-level parking structure located in Los Angeles, California. Situated on a 1.4-acre site, the Olympia Medical Office Property forms a rough L-shape with a central corridor design. The medical office building is situated on the northeast corner of the intersection of Olympic Boulevard and Genesee Avenue and the parking structure is located on the northwest corner of the same intersection. The Olympia Medical Office Property was constructed in 1984 and renovated from 2017-2018. The recent renovations totaled approximately $367,000 and included new lobby finishes, parking garage renovations, new lighting, new corridor carpeting, restroom upgrades, and the replacement of common area flooring. The Olympia Medical Office Property features an on-site pharmacy, café and on-site security. According to the appraisal, many of the medical office suites have their own restrooms. As of June 11, 2019, the Olympia Medical Office Property was 100.0% leased to 28 tenants, with no single tenant representing more than 15.7% of net rentable area or 16.4% of underwritten base rent; and the Olympia Medical Center Property has averaged 88.4% occupancy since 2009 per a third party market research provider.
The parking structure at the Olympia Medical Office Property comprises 732 parking spaces, resulting in a parking ratio of approximately 8.1 spaces per 1,000 square feet of net rentable area. Approximately 450 parking spaces within the parking structure are leased to Olympia Medical Center (which is located directly across Olympic Boulevard from the Olympia Medical Office Property and is affiliated with the Olympia Medical Office Borrower, but not part of the collateral) for a monthly rental rate of $38,250. In addition, the Beverly Hills Audi dealership leases approximately 200 spaces within the parking structure for a monthly rental rate of $21,000. Parking rent per the office tenant leases is generally $85.00 per month for a non-reserved space and $100.00 per month for a reserved space. The parking garage is operated by a third party operator, Imperial Parking Industries, for a monthly fee of $2,500 plus 10% of any net profit above $18,000 (excluding the parking income from the hospital), which such fee is netted out from the underwritten parking income (see the “Operating History and Underwritten Net Cash Flow” section below). See “Description of the Mortgage Pool—Mortgage Pool Characteristics—Property Types—Office Properties” in the Preliminary Prospectus.
Major Tenant.
Largest Tenant: Olympia Health Care (14,174 square feet; 15.7% of net rentable area; 16.4% of underwritten base rent; 5/31/2029 lease expiration) – Founded in 1948, Olympia Health Care, LLC d/b/a Olympia Medical Center, a borrower sponsor affiliate, owns and operates a non-collateral 204-bed acute care hospital located directly across Olympic Boulevard from the Olympia Medical Office Property. The hospital offers comprehensive inpatient and outpatient services, diagnostic imaging, and 24-hour emergency care. Olympia Health Care uses its space at the Olympia Medical Office Property for office/administrative purposes, including a ketamine therapy clinic, California Digestive Diseases Institute gastroenterology center, outpatient psychiatric program, finance department, patient financial services and medical records storage. Olympia Health Care has been a tenant at the Olympia Medical Office Property since August 2011 and expanded its footprint in March 2012, August 2013 and May 2018.
THE INFORMATION IN THIS STRUCTURAL AND COLLATERAL TERM SHEET IS NOT COMPLETE AND MAY BE AMENDED PRIOR TO THE TIME OF SALE. THIS TERM SHEET IS NOT AN OFFER TO SELL THESE SECURITIES AND IT IS NOT A SOLICITATION OF AN OFFER TO BUY THESE SECURITIES IN ANY JURISDICTION WHERE THE OFFER OR SALE IS NOT PERMITTED.
99
| Office – Medical | Loan #7 | Cut-off Date Balance: | $30,000,000 | |
| 5901 and 5975 West Olympic Boulevard | Olympia Medical Office | Cut-off Date LTV: | 59.2% | |
| Los Angeles, CA 90036 | U/W NCF DSCR: | 2.07x | ||
| U/W NOI Debt Yield: | 10.7% |
The following table presents certain information relating to the tenancy at the Olympia Medical Office Property:
Major Tenants
| Tenant Name | Credit Rating Moody’s/ | Tenant NRSF | % of NRSF | Annual U/W Base Rent PSF(1) | Annual U/W Base Rent(1) | % of Total Annual U/W Base Rent | Lease Expiration Date | Extension Options | Termination Option (Y/N) | |
| Major Tenants | ||||||||||
| Olympia Health Care(2) | NR/NR/NR | 14,174 | 15.7% | $46.44 | $658,170(3) | 16.4% | 5/31/2029 | NAP | N | |
| Peter Ruane, MD | NR/NR/NR | 9,035 | 10.0% | $42.57 | $384,575(3) | 9.6% | (4) | (4) | N | |
| A Ishaaya, MD | NR/NR/NR | 8,629 | 9.5% | $43.87 | $378,525(5) | 9.4% | 11/30/2020 | (6) | N | |
| APLA Health & Wellness | NR/NR/NR | 7,688 | 8.5% | $44.39 | $341,236(7) | 8.5% | (8) | (8) | N | |
| Ludmila Bess, MD | NR/NR/NR | 6,343 | 7.0% | $43.92 | $278,588(9) | 6.9% | 9/30/2022 | NAP | N | |
| Total Major Tenants | 45,869 | 50.7% | $44.50 | $2,041,094 | 50.8% | |||||
| Non-Major Tenant | 44,680 | 49.3% | $44.24 | $1,976,670 | 49.2% | |||||
| Occupied Collateral Total | 90,549 | 100.0% | $44.37 | $4,017,764 | 100.0% | |||||
| Vacant Space | 0 | 0.0% | ||||||||
| Collateral Total | 90,549 | 100.0% | ||||||||
| (1) | Annual U/W Base Rent PSF and Annual U/W Base Rent include contractual rent steps through June 2020 totaling $115,288. |
| (2) | Olympia Health Care is affiliated with the Olympia Medical Office Borrower. |
| (3) | Peter Ruane, MD has free rent periods in May 2020 and May 2021. The May 2020 rent abatement (totaling $30,733) was reserved for at origination of the Olympia Medical Office Mortgage Loan. |
| (4) | Peter Ruane, MD leases two spaces at the Olympia Medical Office Property: (1) 8,654 square foot space on a lease expiring July 31, 2022 with one, 5-year renewal option and (2) 381 square feet storage space on a month-to-month basis with no lease expiration date. |
| (5) | A Ishaaya, MD has a free rent period in June 2020 for its 4,363 square foot space and in December 2019 for its 4,266 square foot space, which was reserved for at origination of the Olympia Medical Office Mortgage Loan. |
| (6) | A Ishaaya, MD leases two spaces at the Olympia Medical Office Property: (1) 4,363 square foot space on a lease expiring November 30, 2020 with one, 2-year renewal option and (2) 4,266 square feet space on a lease expiring November 30, 2020 with no renewal options remaining. |
| (7) | APLA Health & Wellness (“APLA”) has a free rent period in April 2020 and is crediting its tenant allowance toward its May 2019 to August 2020 base rent ($12,500 per month), totaling $183,572, all of which was reserved for at origination of the Olympia Medical Office Mortgage Loan. |
| (8) | APLA leases two spaces at the Olympia Medical Office Property: (1) 5,675 square foot space on a lease expiring May 31, 2023 with two, 5-year renewal options remaining and (2) 2,013 square feet space on a lease expiring September 30, 2020 with no renewal options remaining. APLA’s lease for its 2,013 square foot space was assumed from Jay Gladstein, MD in December 2017 and is currently not physically occupied for build-out purposes. |
| (9) | Ludmila Bess, MD has a free rent period in October 2019, which was reserved for at origination of the Olympia Medical Office Mortgage Loan. |
The following table presents certain information relating to the lease rollover schedule at the Olympia Medical Office Property:
Lease Expiration Schedule(1)(2)
| Year Ending December 31, | No. of Leases Expiring | Expiring NRSF | % of Total NRSF | Cumulative Expiring NRSF | Cumulative % of Total NRSF | Annual U/W Base Rent | % of Total Annual U/W Base Rent | Annual U/W Base Rent PSF |
| MTM | 2 | 1,041 | 1.1% | 1,041 | 1.1% | $15,773 | 0.4% | $15.15 |
| 2019 | 4 | 4,181 | 4.6% | 5,222 | 5.8% | $174,684 | 4.3% | $41.78 |
| 2020 | 7 | 17,250 | 19.1% | 22,472 | 24.8% | $769,337 | 19.1% | $44.60 |
| 2021 | 4 | 9,413 | 10.4% | 31,885 | 35.2% | $406,197 | 10.1% | $43.15 |
| 2022 | 9 | 29,587 | 32.7% | 61,472 | 67.9% | $1,333,979 | 33.2% | $45.09 |
| 2023 | 2 | 6,264 | 6.9% | 67,736 | 74.8% | $279,623 | 7.0% | $44.64 |
| 2024 | 1 | 2,268 | 2.5% | 70,004 | 77.3% | $98,590 | 2.5% | $43.47 |
| 2025 | 2 | 3,748 | 4.1% | 73,752 | 81.4% | $161,928 | 4.0% | $43.20 |
| 2026 | 0 | 0 | 0.0% | 73,752 | 81.4% | $0 | 0.0% | $0.00 |
| 2027 | 0 | 0 | 0.0% | 73,752 | 81.4% | $0 | 0.0% | $0.00 |
| 2028 | 0 | 0 | 0.0% | 73,752 | 81.4% | $0 | 0.0% | $0.00 |
| 2029 | 7 | 16,797 | 18.6% | 90,549 | 100.0% | $777,653 | 19.4% | $46.30 |
| Thereafter | 0 | 0 | 0.0% | 90,549 | 100.0% | $0 | 0.0% | $0.00 |
| Vacant | 0 | 0 | 0.0% | 90,549 | 100.0% | $0 | 0.0% | $0.00 |
| Total/Weighted Average | 38 | 90,549 | 100.0% | $4,017,764 | 100.0% | $44.37 |
| (1) | Information obtained from the underwritten rent roll. |
| (2) | Certain tenants may have lease termination options that are exercisable prior to the originally stated expiration date of the subject lease and that are not considered in the Lease Expiration Schedule. |
THE INFORMATION IN THIS STRUCTURAL AND COLLATERAL TERM SHEET IS NOT COMPLETE AND MAY BE AMENDED PRIOR TO THE TIME OF SALE. THIS TERM SHEET IS NOT AN OFFER TO SELL THESE SECURITIES AND IT IS NOT A SOLICITATION OF AN OFFER TO BUY THESE SECURITIES IN ANY JURISDICTION WHERE THE OFFER OR SALE IS NOT PERMITTED.
100
| Office – Medical | Loan #7 | Cut-off Date Balance: | $30,000,000 | |
| 5901 and 5975 West Olympic Boulevard | Olympia Medical Office | Cut-off Date LTV: | 59.2% | |
| Los Angeles, CA 90036 | U/W NCF DSCR: | 2.07x | ||
| U/W NOI Debt Yield: | 10.7% |
The following table presents historical occupancy percentages at the Olympia Medical Office Property:
Historical Occupancy
12/31/2015(1)(2) | 12/31/2016(1)(2) | 12/31/2017(1) | 12/31/2018(1) | 6/11/2019(3) |
| 73.8% | 87.4% | 93.0% | 100.0% | 100.0% |
| (1) | Information obtained from the Olympia Medical Office Borrower. |
| (2) | The increase in occupancy from 2015 to 2016 is attributed to 4 new leases signed at the Olympia Medical Office Property in 2016 totaling approximately 13.5% of net rentable area. |
| (3) | Information obtained from the underwritten rent roll. |
Operating History and Underwritten Net Cash Flow. The following table presents certain information relating to the historical operating performance and underwritten net cash flow at the Olympia Medical Office Property:
Cash Flow Analysis
| 2016(1) | 2017(1)(2) | 2018(2) | TTM 5/31/2019 | U/W | %(3) | U/W $ per SF | |
| Base Rent | $2,916,987 | $3,401,838 | $3,756,115 | $3,790,977 | $3,902,475 | 79.7% | $43.10 |
| Contractual Rent Steps(4) | 0 | 0 | 0 | 0 | 115,288 | 2.4 | 1.27 |
| Grossed Up Vacant Space | 0 | 0 | 0 | 0 | 0 | 0.0 | 0.00 |
| Gross Potential Rent | $2,916,987 | $3,401,838 | $3,756,115 | $3,790,977 | $4,017,763 | 82.0% | $44.37 |
| Parking Income(5) | 795,551 | 864,932 | 839,036 | 861,228 | 861,228 | 17.6 | 9.51 |
| Total Recoveries(6) | 0 | 0 | 0 | 0 | 20,055 | 0.4 | 0.22 |
| Net Rental Income | $3,712,538 | $4,266,770 | $4,595,151 | $4,652,205 | $4,899,046 | 100.0% | $54.10 |
| (Vacancy & Credit Loss) | 0 | 0 | 0 | 0 | (301,332)(7) | (7.5) | (3.33) |
| Effective Gross Income | $3,712,538 | $4,266,770 | $4,595,151 | $4,652,205 | $4,597,714 | 93.8% | $50.78 |
| Real Estate Taxes | 108,153 | 252,627 | 261,558 | 264,128 | 367,922 | 8.0 | 4.06 |
| Insurance | 152,585 | 85,834 | 38,290 | 36,674 | 87,208 | 1.9 | 0.96 |
| Management Fee | 101,420 | 105,735 | 120,511 | 128,677 | 137,931 | 3.0 | 1.52 |
| Other Operating Expenses | 666,353 | 733,657 | 756,186 | 788,313 | 792,478 | 17.2 | 8.75 |
| Total Operating Expenses | $1,028,511 | $1,177,853 | $1,176,545 | $1,217,792 | $1,385,540 | 30.1% | $15.30 |
| Net Operating Income | $2,684,027 | $3,088,917 | $3,418,606 | $3,434,413 | $3,212,174 | 69.9% | $35.47 |
| Replacement Reserves | 0 | 0 | 0 | 0 | 20,187 | 0.4 | 0.22 |
| TI/LC | 0 | 0 | 0 | 0 | 59,334 | 1.3 | 0.66 |
| Net Cash Flow | $2,684,027 | $3,088,917 | $3,418,606 | $3,434,413 | $3,132,653 | 68.1% | $34.60 |
| NOI DSCR | 1.78x | 2.05x | 2.26x | 2.27x | 2.13x | ||
| NCF DSCR | 1.78x | 2.05x | 2.26x | 2.27x | 2.07x | ||
| NOI Debt Yield | 8.9% | 10.3% | 11.4% | 11.4% | 10.7% | ||
| NCF Debt Yield | 8.9% | 10.3% | 11.4% | 11.4% | 10.4% |
| (1) | The increase in Net Operating Income from 2016 to 2017 was driven by nine new leasestotaling 23.7% of underwritten base rent commencing between July 2016 and November 2017 andfour renewal leasestotaling 16.7% of underwritten base rent commencing between November 2016 and October 2017. |
| (2) | The increase in Net Operating Income from 2017 to 2018 was driven by four new leasestotaling 10.5% of underwritten base rent commencing between March 2018 and December 2018 andfour renewal leasestotaling 8.6% of underwritten base rent commencing between July 2018 and September 2018. |
| (3) | Represents (i) percent of Net Rental Income for all revenue fields, (ii) percent of Gross Potential Rent for Vacancy & Credit Loss and (iii) percent of Effective Gross Income for all other fields. |
| (4) | Represents contractual rent steps through June 2020. |
| (5) | See “The Property” section above for further information related to Parking Income. Approximately $459,000 of underwritten Parking Income is attributed to a parking lease with the adjacent Olympia Medical Center, which is affiliated with the Olympia Medical Office Borrower. |
| (6) | The leases at the Olympia Medical Office Property are primarily full service gross with only two tenants (approximately 7.5% of underwritten base rent) on modified gross leases. Historically, reimbursements have not been broken out from base rent on the Olympia Medical Office Property operating statements. |
| (7) | The underwritten economic vacancy is 7.5%. The Olympia Medical Office Property was 100.0% physically occupied as of June 11, 2019. |
Appraisal.The appraiser concluded to an “as-is” Appraised Value for the Olympia Medical Office Property of $50,700,000 as of June 1, 2019.
Environmental Matters. A Phase I environmental site assessment (“ESA”) dated May 17, 2019 identified a recognized environmental condition related to three prior gasoline stations operating on the site from 1933 to approximately 1970. No records of storage tanks, cleanups or removals were identified from the current regulatory agencies. In lieu of a Phase II ESA, the lender obtained a $6,012,920 lender environmental insurance policy from Zurich North America with an eight year term (three years past the loan term), with the
THE INFORMATION IN THIS STRUCTURAL AND COLLATERAL TERM SHEET IS NOT COMPLETE AND MAY BE AMENDED PRIOR TO THE TIME OF SALE. THIS TERM SHEET IS NOT AN OFFER TO SELL THESE SECURITIES AND IT IS NOT A SOLICITATION OF AN OFFER TO BUY THESE SECURITIES IN ANY JURISDICTION WHERE THE OFFER OR SALE IS NOT PERMITTED.
101
| Office – Medical | Loan #7 | Cut-off Date Balance: | $30,000,000 | |
| 5901 and 5975 West Olympic Boulevard | Olympia Medical Office | Cut-off Date LTV: | 59.2% | |
| Los Angeles, CA 90036 | U/W NCF DSCR: | 2.07x | ||
| U/W NOI Debt Yield: | 10.7% |
policy being pre-paid at loan origination. There was no evidence of any other recognized environmental conditions at the Olympia Medical Office Property.
Market Overview and Competition.The Olympia Medical Office Property is located in Los Angeles, California, approximately 8.1 miles west of the central business district (“CBD”), 1.8 miles northeast of Interstate 10 (which provides east/west access through Los Angeles and Santa Monica), 2.7 miles southeast of Beverly Hills, 4.2 miles southwest of Hollywood, 9.4 miles northeast of Santa Monica and 9.1 miles northeast of the Los Angeles International Airport (LAX). The Olympia Medical Office Property is situated on Olympic Boulevard, which runs east/west from the Santa Monica CBD through the Los Angeles CBD. The Olympia Medical Office Property is situated approximately 0.2 miles southeast of the intersection of West Olympic Boulevard and South Fairfax Avenue, which, according to a third party market research provider, had a daily traffic count of 158,693 vehicles as of 2018.
Cedars-Sinai Medical Center, an 886-bed, approximately 2,100-physician nonprofit academic medical center, is located approximately 1.7 miles southeast of the Olympia Medical Office Property; and Kaiser Permanente West Los Angeles Medical Center, a five-story, 915,539 square-foot hospital campus, is situated approximately 1.8 miles southwest of the Olympia Medical Office Property. The Los Angeles Metro is currently expanding the Purple subway line to connect commuters traveling between downtown Los Angeles, the Miracle Mile, Beverly Hills and Westwood. Upon completion, travel time between downtown Los Angeles and Westwood is expected to be approximately 25 minutes, according to the Metro’s project plans. The Wilshire/Fairfax station, situated approximately 0.6 miles northwest of the Olympia Medical Office Property, is currently undergoing construction for the Purple line expansion, with completion scheduled for 2023.
According to a third party market research provider, the estimated 2019 population within a three- and five-mile radius of the Olympia Medical Office Property was approximately 399,444 and 1,074,409, respectively; and the estimated 2019 average household income within the same radii was approximately $97,580 and $84,262, respectively.
Submarket Information (General Office) – According to a third-party market research report, the Olympia Medical Office Property is situated within the Miracle Mile submarket of the Los Angeles Market. As of July 15, 2019, the Miracle Mile office submarket reported a total inventory of approximately 5.9 million square feet with a 16.6% vacancy rate and average asking rent of $49.70 per square foot, gross. Within a three-mile radius of the Olympia Medical Office Property, as of July 15, 2019, there were 1,621 office properties totaling approximately 35.1 million square feet with a 10.8% vacancy rate, per a third-party market research provider.
Submarket Information (Medical Office) – According to a third-party market research report, as of July 19, 2019, the Miracle Mile submarket reported a total medical office inventory of 11 buildings totaling approximately 333,000 square feet with a 16.6% vacancy rate and average asking rent of $49.80 per square foot, gross. Within a three-mile radius of the Olympia Medical Office Property, as of July 19, 2019, there were 153 medical office properties totaling approximately 4.4 million square feet with a 6.0% weighted average vacancy rate, per a third-party market research provider.
Appraiser’s Comp Set –The appraiser identified seven directly competitive medical office properties totaling approximately 451,000 square feet, with an average occupancy rate of 88.7% and base rents ranging from $36.60 to $48.00 per square foot, gross (with one comparable property reporting a tenant’s base rent of $37.80 per square foot, modified gross).
The following table presents certain information relating to the appraiser’s market rent conclusions for the Olympia Medical Office Property:
Market Rent Summary(1)
| Market Rent (PSF) | $43.20 |
| Lease Term (Years) | 5 |
| Lease Type (Reimbursements) | Gross |
| Rent Increase Projection | 3.0% per annum |
| (1) | Information obtained from the appraisal. |
THE INFORMATION IN THIS STRUCTURAL AND COLLATERAL TERM SHEET IS NOT COMPLETE AND MAY BE AMENDED PRIOR TO THE TIME OF SALE. THIS TERM SHEET IS NOT AN OFFER TO SELL THESE SECURITIES AND IT IS NOT A SOLICITATION OF AN OFFER TO BUY THESE SECURITIES IN ANY JURISDICTION WHERE THE OFFER OR SALE IS NOT PERMITTED.
102
| Office – Medical | Loan #7 | Cut-off Date Balance: | $30,000,000 | |
| 5901 and 5975 West Olympic Boulevard | Olympia Medical Office | Cut-off Date LTV: | 59.2% | |
| Los Angeles, CA 90036 | U/W NCF DSCR: | 2.07x | ||
| U/W NOI Debt Yield: | 10.7% |
The table below presents certain information relating to comparable sales pertaining to the Olympia Medical Office Property identified by the appraiser:
Comparable Sales(1)
| Property Name | Location | Rentable Area (SF) | Sale Date | Sale Price | Sale Price (PSF) |
| Medical Office Building | Orange, CA | 25,500 | Jan-19 | $11,350,000 | $445.10 |
| Corona Main Medical Plaza Phase II | Corona, CA | 41,803 | Jan-19 | $17,200,500 | $411.47 |
| Yale Wilshire Medical | Santa Monica, CA | 45,881 | Sep-18 | $30,560,000 | $666.07 |
| The Campus on Villa La Jolla | La Jolla, CA | 193,632 | May-18 | $97,100,000 | $501.47 |
| Facey Medical Center | Mission Hills, CA | 33,438 | Feb-18 | $13,725,000 | $410.46 |
| Medical Office Building | Northridge, CA | 25,375 | May-17 | $11,300,000 | $445.32 |
| Golden State Medical | Burbank, CA | 95,703 | Mar-16 | $48,000,000 | $501.55 |
| Wilshire Harvard Medical | Santa Monica, CA | 58,369 | Jan-16 | $35,000,000 | $599.63 |
| (1) | Information obtained from the appraisal. |
The following table presents certain information relating to comparable medical office leases for the Olympia Medical Office Property:
Comparable Leases(1)
| Property Name/Location | Year Built/ Renovated | Total GLA (SF) | Distance from Subject | Occupancy(2) | Tenant | Tenant Size (SF) | Lease Start Date | Lease Term | Annual Base Rent PSF | Lease Type |
| Olympia Medical Office Property (Subject) | 1984/2018 | 90,549 | - | 100.0%(3) | ||||||
6222 Wilshire Medical Office 6222 Wilshire Blvd Los Angeles, CA | 1986/NAV | 86,736 | 0.7 miles | 96.2% | Medical Office (Asking Rent) | 1,696 | May-19 | 5.0 Yrs | $42.00 | Gross |
Wilshire Medical Arts 6221 Wilshire Blvd. Los Angeles, CA | 1957/1999 | 53,000 | 0.7 miles | 93.6% | Medical Office | 1,300 | Mar-19 | 5.0 Yrs | $39.00 | Gross |
Carthay Garden Plaza 955 Carrillo Dr. Los Angeles, CA | 1990/NAV | 22,568 | 0.5 miles | 100.0% | Medical Office | 2,805 | Feb-19 | 5.0 Yrs | $42.00 | Gross |
MT Professional Office 864 S Robertson Blvd. Los Angeles, CA | 1956/2018 | 16,889 | 1.5 miles | 90.8% | Therapist | 510 | Sep-18 | 4.0 Yrs | $48.00 | Gross |
1122 Washington 1122 W Washington Blvd. Los Angeles, CA | 1984/NAV | 51,380 | 5.2 miles | 64.8% | Laboratory Corporation | 2,188 | Apr-18 | 5.0 Yrs | $37.80 | MG |
640 San Vicente 640 S. San Vicente Blvd. Los Angeles, CA | 1985/NAV | 74,396 | 1.2 miles | 76.2% | Neuro Muscula Massage | 300 | Jan-18 | 2.0 Yrs | $43.46 | Gross |
Samaritan Medical Tower 1127 Wilshire Blvd. Los Angeles, CA | 1987/2000 | 146,354 | 6.0 miles | 99.0% | Paldgen | 2,369 | Dec-17 | 12.0 Yrs | $36.60 | Gross |
| (1) | Information obtained from the appraisal. |
| (2) | Information obtained from a third party market research provider. |
| (3) | Information obtained from the underwritten rent roll. |
Escrows.
Real Estate Taxes – The Olympia Medical Office Mortgage Loan documents require an upfront real estate tax reserve of $91,676 and ongoing monthly real estate tax reserves in an amount equal to one-twelfth of the real estate taxes that the lender estimates will be payable during the next twelve months (initially $22,919).
Insurance – The Olympia Medical Office Mortgage Loan documents do not require ongoing monthly escrows for insurance premiums so long as (i) no event of default has occurred and is continuing, (ii) the Olympia Medical Office Borrower provides the lender with evidence that the Olympia Medical Office Property’s insurance coverage is included in a blanket policy and such policy is in full force and effect, and (iii) the Olympia Medical Office Borrower provides the lender with evidence of timely payment of the insurance premiums and renewals.
THE INFORMATION IN THIS STRUCTURAL AND COLLATERAL TERM SHEET IS NOT COMPLETE AND MAY BE AMENDED PRIOR TO THE TIME OF SALE. THIS TERM SHEET IS NOT AN OFFER TO SELL THESE SECURITIES AND IT IS NOT A SOLICITATION OF AN OFFER TO BUY THESE SECURITIES IN ANY JURISDICTION WHERE THE OFFER OR SALE IS NOT PERMITTED.
103
| Office – Medical | Loan #7 | Cut-off Date Balance: | $30,000,000 | |
| 5901 and 5975 West Olympic Boulevard | Olympia Medical Office | Cut-off Date LTV: | 59.2% | |
| Los Angeles, CA 90036 | U/W NCF DSCR: | 2.07x | ||
| U/W NOI Debt Yield: | 10.7% |
Replacement Reserve – The Olympia Medical Office Mortgage Loan documents require ongoing monthly replacement reserves of $1,886, which the lender may require the Olympia Medical Office Borrower to increase (not more than once per year) if the lender reasonably determines such increase is necessary to maintain the proper operation of the Olympia Medical Office Property.
Leasing Reserve –The Olympia Medical Office Mortgage Loan documents require an upfront general tenant improvements and leasing commissions (“TI/LC”) reserve of $750,000 and ongoing monthly general TI/LC reserves of $15,092, subject to a cap of $750,000 (which cap will only apply so long as no event of default is continuing).
Additional Insurance Reserve – The Olympia Medical Office Mortgage Loan documents required an upfront reserve of $500,000 for the Olympia Medical Office Borrower to purchase additional insurance policies for the Olympia Medical Office Property required pursuant to the Olympia Medical Office Mortgage Loan documents. Upon delivery of evidence satisfactory to the lender that the Olympia Medical Office Borrower has purchased insurance policies which satisfy the requirements of the Olympia Medical Office Mortgage Loan documents (and so long as no event of default is continuing), the lender is required to release any remaining funds in the reserve to the Olympia Medical Office Borrower. As of July 17, 2019, the lender confirmed that the requirements for disbursement under the Olympia Medical Office Mortgage Loan documents were satisfied and the Additional Insurance Reserve funds were subsequently released to the Olympia Medical Office Borrower.
Rent Concession Reserve – The Olympia Medical Office Mortgage Loan documents require an upfront reserve of $355,002 for rent concessions pertaining to 12 tenants at the Olympia Medical Office Property.
Lockbox and Cash Management. Upon the occurrence and continuance of a Cash Trap Event Period (as defined below), the Olympia Medical Office Borrower is required to establish a lender-controlled lockbox account and direct all tenants to deposit rent directly into such lockbox account. During a Cash Trap Event Period, funds in the lockbox account are required to be swept to a lender-controlled cash management account and all excess funds are required to be swept to an excess cash flow subaccount controlled by the lender.
A “Cash Trap Event Period” will commence upon the earlier of the following:
| (i) | the occurrence and continuance of an event of default; |
| (ii) | the amortizing net cash flow debt service coverage ratio (based on a hypothetical 30-year amortization period; “NCF DSCR”) falling below 1.20x at the end of any calendar quarter; |
| (iii) | a default by the Olympia Medical Office Borrower as landlord under any lease to any tenant at the Olympia Medical Office Property (subject to any applicable notice and cure period); or |
| (iv) | the occurrence and continuation of a Major Tenant Event Period (as defined below). |
A Cash Trap Event Period will end upon the occurrence of the following:
| ● | with regard to clause (i), the cure of such event of default; |
| ● | with regard to clause (ii), the amortizing NCF DSCR being greater than or equal to 1.25x for two consecutive calendar quarters; |
| ● | with regard to clause (iii), the Olympia Medical Office Borrower having delivered evidence satisfactory to the lender that the subject default has been cured and no other default having occurred under the related lease (beyond any applicable notice and cure period) for two consecutive calendar quarters following such cure; or |
| ● | with regard to clause (iv), a Major Tenant Event Period Cure (as defined below). |
A “Major Tenant Event Period” will commence upon the earliest to occur of the following:
| (i) | a default, beyond any notice and grace period, under Olympia Health Care’s lease; |
| (ii) | Olympia Health Care failing to continuously occupy its space or failing to be open for business at the Olympia Medical Office Property during customary hours, or giving notice of its intent to commence the foregoing; |
| (iii) | Olympia Health Care filing, as a debtor, a bankruptcy or similar insolvency proceeding, or otherwise becoming involved, as a debtor, in a bankruptcy or any similar insolvency proceeding; |
| (iv) | Olympia Health Care terminating or cancelling its lease (or such lease otherwise fails to be in full force and effect), or giving notice of, or commencing a legal proceeding asserting any of the foregoing; or |
| (v) | Olympia Health Care giving a termination notice under its lease for all or any portion of its space. |
A “Major Tenant Event Period Cure” will occur upon:
| ● | with regard to clause (i) above, the occurrence of (x) a Major Tenant Re-Tenanting Event (as defined below) or (y) the applicable default having been cured and no other default under the related lease having occurred (beyond any notice and cure period) for a period of two consecutive calendar quarters; |
| ● | with regard to clause (ii) above, (x) a Major Tenant Re-Tenanting Event having occurred or (y) Olympia Heath Care having resumed its normal business operations in its space and being open during customary hours for a period of two consecutive calendar quarters; |
| ● | with regard to clause (iii) above, (x) a Major Tenant Re-Tenanting Event having occurred or (y) the bankruptcy or insolvency proceeding having been terminated in a manner satisfactory to the lender, the related lease having been affirmed, and the terms of such lease, as affirmed, being satisfactory to the lender; |
THE INFORMATION IN THIS STRUCTURAL AND COLLATERAL TERM SHEET IS NOT COMPLETE AND MAY BE AMENDED PRIOR TO THE TIME OF SALE. THIS TERM SHEET IS NOT AN OFFER TO SELL THESE SECURITIES AND IT IS NOT A SOLICITATION OF AN OFFER TO BUY THESE SECURITIES IN ANY JURISDICTION WHERE THE OFFER OR SALE IS NOT PERMITTED.
104
| Office – Medical | Loan #7 | Cut-off Date Balance: | $30,000,000 | |
| 5901 and 5975 West Olympic Boulevard | Olympia Medical Office | Cut-off Date LTV: | 59.2% | |
| Los Angeles, CA 90036 | U/W NCF DSCR: | 2.07x | ||
| U/W NOI Debt Yield: | 10.7% |
| ● | with regard to clause (iv) above, (x) a Major Tenant Re-Tenanting Event having occurred or (y) solely in the event that such Major Tenant Event Period commenced as a result of the Olympia Health Care lease not being in full force or effect, anyapplicable default having been cured and such Olympia Health Care lease having been in full force and effect for two consecutive calendar quarters; or |
| ● | with regard to clause (v) above, (x) a Major Tenant Re-Tenanting Event having occurred. |
A “Major Tenant Re-Tenanting Event” will occur upon the lender receiving satisfactory evidence, including, without limitation, a satisfactory estoppel certificate from each such replacement tenant affirming, that: (i) each such replacement tenant is in occupancy of its premises, is open for business and is paying full, unabated rent pursuant to the terms of its replacement lease satisfactory to the lender and (ii) all tenant improvement costs and leasing commissions provided in each such replacement lease have been paid.
Property Management. The Olympia Medical Office Property is managed by South Park Group, Inc. (“South Park”) and Citi West Management Corp. (“Citi West”). South Park was founded in 1979 by CEO Jack Ravan and has completed and represented projects valued in excess of $500,000,000 and 2 million square feet. Citi West is an affiliate of South Park. South Park is primarily responsible for the leasing functions at the Olympia Medical Office Property, while Citi West is primarily responsible for the management functions.
Partial Release. Not permitted.
Real Estate Substitution.Not permitted.
Subordinate and Mezzanine Indebtedness.Not permitted.
Ground Lease. None.
Terrorism Insurance.The Olympia Medical Office Mortgage Loan documents require that the “all risk” insurance policy required to be maintained by the Olympia Medical Office Borrower provides coverage for terrorism in an amount equal to the full replacement cost of the Olympia Medical Office Property, as well as business interruption insurance covering no less than the 18-month period following the occurrence of a casualty event, together with a 6-month extended period of indemnity.
Earthquake Insurance.The Olympia Medical Office Mortgage Loan documents do not require earthquake insurance. The seismic report indicated a probable maximum loss of 15.0% for the office building and 12.0% for the parking structure.
THE INFORMATION IN THIS STRUCTURAL AND COLLATERAL TERM SHEET IS NOT COMPLETE AND MAY BE AMENDED PRIOR TO THE TIME OF SALE. THIS TERM SHEET IS NOT AN OFFER TO SELL THESE SECURITIES AND IT IS NOT A SOLICITATION OF AN OFFER TO BUY THESE SECURITIES IN ANY JURISDICTION WHERE THE OFFER OR SALE IS NOT PERMITTED.
105
| Office - Suburban | Loan #8 | Cut-off Date Balance: | $28,929,851 | |
| 1 Sugar Creek Center Boulevard | Sugar Creek Center | Cut-off Date LTV: | 70.4% | |
| Sugar Land, TX 77478 | U/W NCF DSCR: | 1.57x | ||
| U/W NOI Debt Yield: | 11.0% |
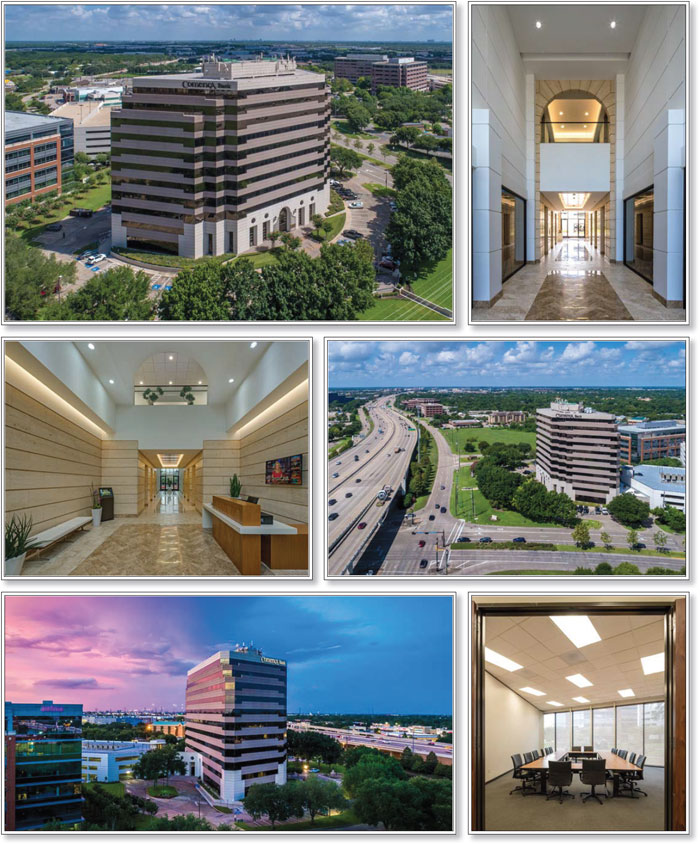
THE INFORMATION IN THIS STRUCTURAL AND COLLATERAL TERM SHEET IS NOT COMPLETE AND MAY BE AMENDED PRIOR TO THE TIME OF SALE. THIS TERM SHEET IS NOT AN OFFER TO SELL THESE SECURITIES AND IT IS NOT A SOLICITATION OF AN OFFER TO BUY THESE SECURITIES IN ANY JURISDICTION WHERE THE OFFER OR SALE IS NOT PERMITTED.
106
| Office - Suburban | Loan #8 | Cut-off Date Balance: | $28,929,851 | |
| 1 Sugar Creek Center Boulevard | Sugar Creek Center | Cut-off Date LTV: | 70.4% | |
| Sugar Land, TX 77478 | U/W NCF DSCR: | 1.57x | ||
| U/W NOI Debt Yield: | 11.0% |
THE INFORMATION IN THIS STRUCTURAL AND COLLATERAL TERM SHEET IS NOT COMPLETE AND MAY BE AMENDED PRIOR TO THE TIME OF SALE. THIS TERM SHEET IS NOT AN OFFER TO SELL THESE SECURITIES AND IT IS NOT A SOLICITATION OF AN OFFER TO BUY THESE SECURITIES IN ANY JURISDICTION WHERE THE OFFER OR SALE IS NOT PERMITTED.
107
| No. 8 – Sugar Creek Center | |||||||
| Mortgage Loan Information | Mortgaged Property Information | ||||||
| Mortgage Loan Seller: | Rialto Mortgage Finance, LLC | Single Asset/Portfolio: | Single Asset | ||||
Credit Assessment (Fitch/KBRA/Moody’s): | NR/NR/NR | Property Type – Subtype: | Office – Suburban | ||||
| Original Principal Balance: | $29,000,000 | Location: | Sugar Land, TX | ||||
| Cut-off Date Balance: | $28,929,851 | Size: | 193,996 SF | ||||
| % of Initial Pool Balance: | 3.2% | Cut-off Date Balance Per SF: | $149.13 | ||||
| Loan Purpose: | Acquisition | Maturity Date Balance Per SF: | $121.66 | ||||
| Borrower Sponsors: | Kevin Glazer | Year Built/Renovated: | 1983/2017 | ||||
| Guarantors: | Glazer Management LLC | Title Vesting: | Fee | ||||
| Mortgage Rate: | 4.6900% | Property Manager: | Self-managed | ||||
| Note Date: | May 17, 2019 | Current Occupancy (As of): | 86.6% (5/16/2019) | ||||
| Seasoning: | 2 months | YE 2018 Occupancy: | 88.3% | ||||
| Maturity Date: | June 6, 2029 | YE 2017 Occupancy: | 80.5% | ||||
| IO Period: | 0 months | YE 2016 Occupancy: | 79.4% | ||||
| Loan Term (Original): | 120 months | YE 2015 Occupancy: | 88.6% | ||||
| Amortization Term (Original): | 360 months | As-Is Appraised Value: | $41,100,000 | ||||
| Loan Amortization Type: | Amortizing Balloon | As-Is Appraised Value Per SF: | $211.86 | ||||
| Call Protection: | L(24),GRTR 1% or YM(89),O(7) | As-Is Appraisal Valuation Date: | April 22, 2019 | ||||
| Lockbox Type: | Springing | Underwriting and Financial Information | |||||
| Additional Debt: | None | TTM NOI (3/31/2019)(4): | $2,444,973 | ||||
| Additional Debt Type (Balance): | NAP | YE 2018 NOI: | $2,720,574 | ||||
| YE 2017 NOI: | $2,452,462 | ||||||
| YE 2016 NOI: | $2,729,890 | ||||||
| U/W Revenues: | $5,605,584 | ||||||
| U/W Expenses: | $2,420,603 | ||||||
| Escrows and Reserves(1) | U/W NOI(4): | $3,184,981 | |||||
| Initial | Monthly | Cap | U/W NCF: | $2,830,662 | |||
| Taxes | $321,072 | $50,964 | NAP | U/W DSCR based on NOI/NCF: | 1.77x / 1.57x | ||
| Insurance | $20,734 | $19,747 | NAP | U/W Debt Yield based on NOI/NCF: | 11.0% / 9.8% | ||
| Replacement Reserve | $0 | $4,527 | NAP(2) | U/W Debt Yield at Maturity based on NOI/NCF: | 13.5% / 12.0% | ||
| TI/LC Reserve | $250,000 | $25,000 | $750,000 | Cut-off Date LTV Ratio: | 70.4% | ||
| Deferred Maintenance | $138,750 | $0 | NAP | LTV Ratio at Maturity: | 57.4% | ||
| Other(3) | $497,304 | $0 | NAP | ||||
| Sources and Uses | ||||||||
| Sources | Uses | |||||||
| Original loan amount | $29,000,000 | 70.8% | Purchase Price(5) | $39,389,594 | 96.1% | |||
| Sponsor’s new loan contribution | 11,987,440 | 29.2 | Closing Costs | 369,986 | 0.9 | |||
| Upfront Reserves | 1,227,860 | 3.0 | ||||||
| Total Sources | $40,987,440 | 100.0% | Total Uses | $40,987,440 | 100.0% | |||
| (1) | See “Escrows” section for a full description of Escrows and Reserves. |
| (2) | After the replacement of the chiller located at the Sugar Creek Center Property (as defined below), there will be a cap of $162,957 for the replacement reserve. |
| (3) | Other Reserves include an Outstanding TI/LC Reserve ($337,208) and a Free Rent Reserve ($160,096). |
| (4) | The U/W NOI increased compared to the TTM 3/31/2019 NOI due to (i) recent leasing activities in 2018 and 2019 at the Sugar Creek Center Property (as defined below), totaling 45,043 square feet (23.2% of NRA), (ii) the expiration of free rent periods and free reimbursement periods of some tenants that started in 2018, and (ii) the conversion of certain tenants from modified gross leases to NNN leases. |
| (5) | The Sugar Creek Center Property purchase price was $39,766,500. At origination, the Sugar Creek Center Borrower (as defined below) received a credit of $376,906 for certain outstanding landlord obligations. |
The Mortgage Loan. The mortgage loan (the “Sugar Creek Center Mortgage Loan”) is evidenced by a single promissory note secured by a first mortgage encumbering the fee interest in a 193,996 square feet office property located in Sugar Land, Texas (the “Sugar Creek Center Property”).
The Borrower and Borrower Sponsor.The borrower is Sugar Creek Center Houston, TX. LLC (the “Sugar Creek Center Borrower”), a Delaware limited liability company and single purpose entity with one independent director. Legal counsel to the Sugar Creek Center Borrower delivered a non-consolidation opinion in connection with the origination of the Sugar Creek Center Mortgage Loan. The nonrecourse carve-out guarantor of the Sugar Creek Center Mortgage Loan is Glazer Management LLC.
Glazer Management LLC, an affiliate of Glazer Properties, provides management, leasing, and other services to 57 commercial properties owned by Kevin Glazer and his family members with a total leasable area of approximately 3.6 million square feet. The
THE INFORMATION IN THIS STRUCTURAL AND COLLATERAL TERM SHEET IS NOT COMPLETE AND MAY BE AMENDED PRIOR TO THE TIME OF SALE. THIS TERM SHEET IS NOT AN OFFER TO SELL THESE SECURITIES AND IT IS NOT A SOLICITATION OF AN OFFER TO BUY THESE SECURITIES IN ANY JURISDICTION WHERE THE OFFER OR SALE IS NOT PERMITTED.
108
| Office - Suburban | Loan #8 | Cut-off Date Balance: | $28,929,851 | |
| 1 Sugar Creek Center Boulevard | Sugar Creek Center | Cut-off Date LTV: | 70.4% | |
| Sugar Land, TX 77478 | U/W NCF DSCR: | 1.57x | ||
| U/W NOI Debt Yield: | 11.0% |
borrower sponsor of the Sugar Creek Center Mortgage Loan is Kevin Glazer, founder and owner of Glazer Properties. Glazer Properties is an industry leader in the ownership, acquisition, management, and leasing of commercial real estate throughout the United States. Kevin Glazer has been involved in the ownership, management and leasing of commercial real estate for 30 years. Mr. Glazer is also a co-owner of the Tampa Bay Buccaneers and a principal investor in the Manchester United Football Club. The borrower sponsor disclosed eleven foreclosures and three discounted payoffs related to non-recourse loans secured by retail shopping centers in which he held an interest in the borrowing entity. See “Description of the Mortgage Pool—Loan Purpose; Default History, Bankruptcy Issues and Other Proceedings” in the Preliminary Prospectus.
The Property.The Sugar Creek Center Property is comprised of an 11-story Class A office building totaling 193,996 square feet located in Sugar Land, Texas. Situated on an approximately 4.5 acre site, the Sugar Creek Center Property was constructed in 1983 and renovated in 2017. The prior owner of the Sugar Creek Center Property completed an approximately $3.1 million capital improvement projects, which improvements included interior renovation, water risers, curtain wall improvements, management office and conference center upgrades, garage improvements, concrete work, and landscaping/sitting area improvements. Parking is provided via 794 garage and surface spaces, resulting in a parking ratio of 4.1 spaces per 1,000 square feet of net rentable area. As of May 16, 2019, the Sugar Creek Center Property was 86.6% occupied by 43 tenants.
Major Tenants.
Largest Tenant: Amerex Brokers (BBB-/BBB- by S&P/Fitch; 16.7% of underwritten base rent; 20,781 square feet; 5/31/2022 lease expiration) –Founded in 1978, Amerex Brokers is a leading over-the-counter energy brokerage offering services in electricity, natural gas, emission credits and allowances, renewable energy credits, retail energy procurement, energy consulting and energy data services. Headquartered at the Sugar Creek Center Property, Amerex Brokers offers liquidity and timely execution to meet the needs of a global client network of more than 1,000 firms including thousands of traders and risk management professionals. Amerex Brokers is a wholly-owned indirect subsidiary of BGC Partners, Inc., which is a subsidiary of Cantor Fitzgerald. Amerex Brokers has been at the Sugar Creek Center Property since 1995 and has one 5-year renewal option remaining.
2nd Largest Tenant: The ProNet Group (8.8% of underwritten base rent; 15,109 square feet; 3/31/2027 lease expiration) – The ProNet Group (“ProNet”) is a multi-disciplinary forensic engineering and consulting firm that has been in existence since 1990. ProNet has full-time, on-staff forensic experts in the following areas: structural, electrical and mechanical engineering, fire origin & cause investigations, and vehicular forensic analysis. ProNet specializes in property damage evaluations, construction defect and surety consulting, product liability analysis, fire/explosion origin and cause investigations, lightning and electrical damage analysis, wind and hail damage evaluations, as well as vehicle accident reconstruction, mechanical failures, and theft damage evaluations. ProNet has been a tenant at the Sugar Creek Center Property since 2006 and has one 5-year renewal option remaining.
3rd Largest Tenant: Wholesome Sweeteners (8.0% of underwritten base rent; 14,743 square feet; 4/30/2024 lease expiration) –Wholesome Sweeteners produces sugars, honeys and treats made from natural organic ingredients and are a fair trade partner with farmers and beekeepers. Wholesome Sweeteners was founded in Sugar Land, Texas in 2001. The Sugar Creek Center Property serves as its corporate office. Wholesome Sweeteners has been a tenant at the Sugar Creek Center Property since 2018.
THE INFORMATION IN THIS STRUCTURAL AND COLLATERAL TERM SHEET IS NOT COMPLETE AND MAY BE AMENDED PRIOR TO THE TIME OF SALE. THIS TERM SHEET IS NOT AN OFFER TO SELL THESE SECURITIES AND IT IS NOT A SOLICITATION OF AN OFFER TO BUY THESE SECURITIES IN ANY JURISDICTION WHERE THE OFFER OR SALE IS NOT PERMITTED.
109
| Office - Suburban | Loan #8 | Cut-off Date Balance: | $28,929,851 | |
| 1 Sugar Creek Center Boulevard | Sugar Creek Center | Cut-off Date LTV: | 70.4% | |
| Sugar Land, TX 77478 | U/W NCF DSCR: | 1.57x | ||
| U/W NOI Debt Yield: | 11.0% |
The following table presents certain information relating to the tenancy at the Sugar Creek Center Property:
Major Tenants
| Tenant Name | Credit Rating (Fitch/Moody’s/ S&P)(1) | Tenant NRSF | % of NRSF | Annual U/W Base Rent PSF(2) | Annual U/W Base Rent(2) | % of Total Annual U/W Base Rent | Lease Expiration Date | Extension Options | Termination Option (Y/N) |
| Anchor Tenants | |||||||||
| Amerex Brokers | BBB-/NR/BBB- | 20,781 | 10.7% | $27.50 | $571,478 | 16.7% | 5/31/2022 | 1, 5-year | Y(3) |
| The Pronet Group | NR/NR/NR | 15,109 | 7.8% | $20.00 | $302,180 | 8.8% | 3/31/2027 | 1, 5-year | N |
| Wholesome Sweeteners | NR/NR/NR | 14,743 | 7.6% | $18.50 | $272,746 | 8.0% | 4/30/2024 | None | N |
| Comerica Bank(4) | A/A3/BBB+ | 9,681 | 5.0% | $21.00 | $203,301 | 5.9% | 9/30/2025 | None | N |
| Hydro Resources | NR/NR/NR | 7,911 | 4.1% | $19.00 | $150,309 | 4.4% | 12/31/2025 | 1, 5-year | N |
| Total Anchor Tenants | 68,225 | 35.2% | $21.99 | $1,500,013 | 43.9% | ||||
| Other Tenants | 99,768 | 51.4% | $19.24 | $1,919,954 | 56.1% | ||||
| Occupied Collateral Total | 167,993 | 86.6% | $20.36 | $3,419,967 | 100.0% | ||||
| Vacant Space | 26,003 | 13.4% | |||||||
| Collateral Total | 193,996 | 100.0% | |||||||
| (1) | Certain ratings are those of the parent company whether or not the parent company guarantees the lease. |
| (2) | Annual U/W Base Rent PSF and Annual U/W Base Rent include contractual rent steps through June 2020 totaling $84,589. |
| (3) | Amerex Brokers has a one-time termination option effective on June 1, 2020 with nine months written notice and a termination fee of $393,176. Additionally, Amerex Brokers has a right of first refusal to lease any space on the eighth floor as space becomes available. |
| (4) | Comerica Bank received two months of free rent and reimbursements under its recent renewal. At closing, the Sugar Creek Center Borrower deposited $51,777 into a free rent reserve and $55,613 into an outstanding TI/LC reserve for the tenant. |
The following table presents certain information relating to the lease rollover schedule at the Sugar Creek Center Property:
Lease Expiration Schedule(1)(2)
| Year Ending December 31, | No. of Leases Expiring | Expiring NRSF | % of Total NRSF | Cumulative Expiring NRSF | Cumulative % of Total NRSF | Annual U/W Base Rent(3) | % of Total Annual U/W Base Rent | Annual U/W Base Rent PSF(3) |
| MTM | 0 | 0 | 0.0% | 0 | 0.0% | $0 | 0.0% | $0.00 |
| 2019 | 5 | 9,742 | 5.0% | 9,742 | 5.0% | $181,862 | 5.3% | $18.67 |
| 2020 | 12 | 24,893 | 12.8% | 34,635 | 17.9% | $485,213 | 14.2% | $19.49 |
| 2021 | 13 | 31,959 | 16.5% | 66,594 | 34.3% | $657,695 | 19.2% | $20.58 |
| 2022 | 7 | 33,743 | 17.4% | 100,337 | 51.7% | $821,924 | 24.0% | $24.36 |
| 2023 | 3 | 3,514 | 1.8% | 103,851 | 53.5% | $64,159 | 1.9% | $18.26 |
| 2024 | 6 | 23,726 | 12.2% | 127,577 | 65.8% | $453,174 | 13.3% | $19.10 |
| 2025 | 3 | 19,101 | 9.8% | 146,678 | 75.6% | $383,790 | 11.2% | $20.09 |
| 2026 | 0 | 0 | 0.0% | 146,678 | 75.6% | $0 | 0.0% | $0.00 |
| 2027 | 1 | 15,109 | 7.8% | 161,787 | 83.4% | $302,180 | 8.8% | $20.00 |
| 2028 | 0 | 0 | 0.0% | 161,787 | 83.4% | $0 | 0.0% | $0.00 |
| 2029 | 0 | 0 | 0.0% | 161,787 | 83.4% | $0 | 0.0% | $0.00 |
| Thereafter(4) | 3 | 6,206 | 3.2% | 167,993 | 86.6% | $69,970 | 2.0% | $11.27 |
| Vacant | 0 | 26,003 | 13.4% | 193,996 | 100.0% | $0 | 0.0% | $0.00 |
| Total/Weighted Average | 53 | 193,996 | 100.0% | $3,419,967 | 100.0% | $20.36 |
| (1) | Information obtained from the underwritten rent roll. |
| (2) | Certain tenants may have lease termination options that are exercisable prior to the originally stated expiration date of the subject lease and that are not considered in the Lease Expiration Schedule. |
| (3) | Total/Weighted Average Annual U/W Base Rent and Annual U/W Base Rent PSF exclude vacant space. |
| (4) | Thereafter square feet includes 2,618 square feet used as the management office (1,309 square feet) and the conference center (1,309 square feet), which spaces are not leased to third parties and do not contribute to the Annual U/W Base Rent. |
THE INFORMATION IN THIS STRUCTURAL AND COLLATERAL TERM SHEET IS NOT COMPLETE AND MAY BE AMENDED PRIOR TO THE TIME OF SALE. THIS TERM SHEET IS NOT AN OFFER TO SELL THESE SECURITIES AND IT IS NOT A SOLICITATION OF AN OFFER TO BUY THESE SECURITIES IN ANY JURISDICTION WHERE THE OFFER OR SALE IS NOT PERMITTED.
110
| Office - Suburban | Loan #8 | Cut-off Date Balance: | $28,929,851 | |
| 1 Sugar Creek Center Boulevard | Sugar Creek Center | Cut-off Date LTV: | 70.4% | |
| Sugar Land, TX 77478 | U/W NCF DSCR: | 1.57x | ||
| U/W NOI Debt Yield: | 11.0% |
The following table presents historical occupancy percentages at the Sugar Creek Center Property:
Historical Occupancy
12/31/2015(1) | 12/31/2016(1) | 12/31/2017(1) | 12/31/2018(1) | 5/16/2019(2) |
| 88.6% | 79.4% | 80.5% | 88.3% | 86.6% |
| (1) | Information obtained from the Sugar Creek Center Borrower. |
| (2) | Information obtained from the underwritten rent roll. 2,168 square feet of management office and conference center were not included in the occupancy number. |
Operating History and Underwritten Net Cash Flow. The following table presents certain information relating to the underwritten net cash flow at the Sugar Creek Center Property:
Cash Flow Analysis
| 2016 | 2017 | 2018 | TTM 3/31/2019 | U/W | %(1) | U/W $ per SF | |
| Rents in Place | $3,647,574 | $3,350,122 | $3,378,836 | $3,230,197 | $3,335,379 | 51.6% | $17.19 |
| Contractual Rent Steps(2) | 0 | 0 | 0 | 0 | 84,589 | 1.3 | 0.44 |
| Straight Line Rent(3) | 0 | 0 | 0 | 0 | 9,681 | 0.1 | 0.05 |
| Grossed Up Vacant Space | 0 | 0 | 0 | 0 | 533,062 | 8.3 | 2.75 |
| Gross Potential Rent | $3,647,574 | $3,350,122 | $3,378,836 | $3,230,197 | $3,962,710 | 61.3% | $20.43 |
| Other Income | 300,473 | 278,591 | 278,342 | 278,460 | 297,506 | 4.6 | 1.53 |
| Total Recoveries(4) | 709,288 | 942,989 | 1,176,344 | 1,057,098 | 2,199,454 | 34.0 | 11.34 |
| Net Rental Income | $4,657,335 | $4,571,702 | $4,833,523 | $4,565,754 | $6,459,670 | 100.0% | $33.30 |
| (Vacancy & Credit Loss) | 0 | 0 | 0 | 0 | (854,087)(5) | (21.6) | (4.40) |
| Effective Gross Income | $4,657,335 | $4,571,702 | $4,833,523 | $4,565,754 | $5,605,584 | 86.8% | $28.90 |
| Real Estate Taxes | 595,209 | 526,298 | 564,557 | 584,979 | 611,565 | 10.9 | 3.15 |
| Insurance | 57,784 | 57,958 | 66,568 | 69,208 | 235,240 | 4.2 | 1.21 |
| Management Fee | 77,303 | 74,862 | 75,825 | 74,649 | 168,168 | 3.0 | 0.87 |
| Other Operating Expenses | 1,197,149 | 1,460,122 | 1,405,998 | 1,391,945 | 1,405,631 | 25.1 | 7.25 |
| Total Operating Expenses | $1,927,445 | $2,119,240 | $2,112,949 | $2,120,781 | $2,420,603 | 43.2% | $12.48 |
| Net Operating Income(4) | $2,729,890 | $2,452,462 | $2,720,574 | $2,444,973 | $3,184,981 | 56.8% | $16.42 |
| Replacement Reserves | 0 | 0 | 0 | 0 | 54,319 | 1.0 | 0.28 |
| TI/LC | 0 | 0 | 0 | 0 | 300,000 | 5.4 | 1.55 |
| Net Cash Flow | $2,729,890 | $2,452,462 | $2,720,574 | $2,444,973 | $2,830,662 | 50.5% | $14.59 |
| NOI DSCR | 1.51x | 1.36x | 1.51x | 1.36x | 1.77x | ||
| NCF DSCR | 1.51x | 1.36x | 1.51x | 1.36x | 1.57x | ||
| NOI Debt Yield | 9.4% | 8.5% | 9.4% | 8.5% | 11.0% | ||
| NCF Debt Yield | 9.4% | 8.5% | 9.4% | 8.5% | 9.8% |
| (1) | Represents (i) percent of Net Rental Income for all revenue fields, (ii) percent of Gross Potential Rent for Vacancy & Credit Loss and (iii) percent of Effective Gross Income for all other fields. |
| (2) | Represents contractual rent steps through June 2020. |
| (3) | Represents straight line rent for Comerica Bank. |
| (4) | The U/W Total Recoveries and the U/W Net Operating Income increased compared to the TTM 3/31/2019 Recoveries and the TTM 3/31/2019 Net Operating Income due to (i) recent leasing activities in 2018 and 2019 at the Sugar Creek Center Property, totaling 45,043 square feet (23.2% of NRA), (ii) the expiration of free rent periods and free reimbursement periods of some tenants that started in 2018, and (ii) the conversion of certain tenants from modified gross leases to NNN leases. |
| (5) | The underwritten economic vacancy is 13.9%.The Sugar Creek Center Property was 86.6% leased as of May 16, 2019. |
THE INFORMATION IN THIS STRUCTURAL AND COLLATERAL TERM SHEET IS NOT COMPLETE AND MAY BE AMENDED PRIOR TO THE TIME OF SALE. THIS TERM SHEET IS NOT AN OFFER TO SELL THESE SECURITIES AND IT IS NOT A SOLICITATION OF AN OFFER TO BUY THESE SECURITIES IN ANY JURISDICTION WHERE THE OFFER OR SALE IS NOT PERMITTED.
111
| Office - Suburban | Loan #8 | Cut-off Date Balance: | $28,929,851 | |
| 1 Sugar Creek Center Boulevard | Sugar Creek Center | Cut-off Date LTV: | 70.4% | |
| Sugar Land, TX 77478 | U/W NCF DSCR: | 1.57x | ||
| U/W NOI Debt Yield: | 11.0% |
Appraisal.As of the appraisal valuation date of April 22, 2019, the Sugar Creek Center Property’s “as-is” appraised value is $41,100,000.
Environmental Matters. According to a Phase I environmental site assessment dated April 26, 2019, there was no evidence of any recognized environmental conditions at the Sugar Creek Center Property.
Market Overview and Competition.The Sugar Creek Center Property is located in Sugar Land, Fort Bend, Texas, within the Houston-The Woodlands-Sugar Land metropolitan statistical area (the “Houston MSA”). The Houston MSA economy is driven by manufacturing, construction, public administration, transportation/utilities and agriculture. Major employers within the Houston MSA include Memorial Hermann Health System, The University of Texas Health Science Center, Schlumberger Ltd., Landry’s Inc., and Exxon Mobile Corp.
The Sugar Creek Center Property is located approximately 19.0 miles southwest of the Houston central business district (“Houston CBD”). Access to the Sugar Creek Center Property’s neighborhood is provided by Southwest Freeway, a major arterial that crosses the Houston metro area in a southwest/northwest direction. Southwest Freeway provides access to the Sugar Creek Property via South Diary Ashford Road. Other major traffic arterials include Highway 90A, Sugar Lakes Drive and Dulles Avenue. The Sugar Creek Center Property is additionally accessed by Frontage Road, which has an average daily traffic count of 21,430 vehicles per day according to a third party market research company. The neighborhood surrounding the Sugar Creek Center Property consists of office properties with supporting retail. Approximately 3.0 miles northeast of the Sugar Creek Center Property are neighborhood shopping centers that include retailers such as Stein Mart, Hobby Lobby, Old Navy Outlet, Bed Bath & Beyond, and an AMC movie theater. Sugar Land Town Square, with 1.4 million square feet of mixed-use development, is located at the intersection of U.S. 59 and Highway 6, and approximately 2.5 miles southwest of the Sugar Creek Center Property. Sugar Land Town Square includes a 300-room full-service Marriott hotel and conference center, a 82,000 square foot City Hall, 167 mid-rise residential condominiums, 566,000 square feet of office space, 238,000 square feet of Main Street retail and restaurants and a 1.4-acre pedestrian plaza. According to a third party market research report, the estimated 2019 population in a one, three, and five-mile radius of the Sugar Creek Center Property is 4,543, 98,451 and 318,863. The average household income within the same radii is $187,968, $107,915, and $101,641, respectively.
Submarket Information – According to a third-party market research report, the Sugar Creek Center Property is situated within the East Fort Bend Co/Sugar Land retail submarket. As of first quarter 2019, the submarket reported a total inventory of 10.1 million square feet with a 10.5% vacancy rate and an average quoted rental rate of $26.28 per square feet. As of first quarter 2019, the East Fort Bend Co/Sugar Land retail submarket reported positive absorption of 154,640 square feet, with new construction of 110,000 square feet in 13 buildings and no new deliveries.
Appraiser’s Comp Set – The appraiser identified five competitive properties for the Sugar Creek Center Property totaling approximately 1.02 million square feet, which reported an average occupancy rate of approximately 85.3%. The appraiser concluded to net market rents for the Sugar Creek Center Property of $20.50 per square foot, for office tenants, $12.50 per square foot for deli space.
The following table presents certain information relating to the appraiser’s market rent conclusion for the Sugar Creek Center Property:
Market Rent Summary(1)
| Office | Deli | |
| Market Rent (PSF) | $20.50 | $12.50 |
| Lease Term (Years) | 5 | 5 |
| Lease Type (Reimbursements) | NNN | Gross |
| Rent Increase Projection | $0.50 | None |
| (1) | Information obtained from the appraisal. |
THE INFORMATION IN THIS STRUCTURAL AND COLLATERAL TERM SHEET IS NOT COMPLETE AND MAY BE AMENDED PRIOR TO THE TIME OF SALE. THIS TERM SHEET IS NOT AN OFFER TO SELL THESE SECURITIES AND IT IS NOT A SOLICITATION OF AN OFFER TO BUY THESE SECURITIES IN ANY JURISDICTION WHERE THE OFFER OR SALE IS NOT PERMITTED.
112
| Office - Suburban | Loan #8 | Cut-off Date Balance: | $28,929,851 | |
| 1 Sugar Creek Center Boulevard | Sugar Creek Center | Cut-off Date LTV: | 70.4% | |
| Sugar Land, TX 77478 | U/W NCF DSCR: | 1.57x | ||
| U/W NOI Debt Yield: | 11.0% |
The table below presents certain information relating to comparable sales for the Sugar Creek Center Property identified by the appraiser:
Comparable Sales(1)
| Property Name | Location | Rentable Area (SF) | Sale Date | Sale Price | Sale Price (PSF) |
| Burns & McDonnell Plaza | Houston, TX | 272,941 | Jun-17 | $52,000,000 | $190.52 |
| Echo Lane Office Portfolio | Houston, TX | 189,162 | Apr-18 | $44,500,000 | $235.25 |
| 2100 West Loop South | Houston, TX | 165,985 | Oct-17 | $31,500,000 | $189.78 |
| 77 Sugar Creek | Sugar Land, TX | 143,410 | Apr-19 | $27,600,000 | $192.46 |
| 3 Sugar Creek Center | Sugar Land, TX | 152,742 | Apr-18 | $40,000,000 | $261.88 |
| (1) | Information obtained from the appraisal. |
The table below presents certain information relating to five comparable office properties to the Sugar Creek Property identified by the appraiser:
Competitive Set(1)
Sugar Creek Center (Subject) | Three Sugar Creek Center | 77 Sugar Creek | Sugar Creek I | Sugar Creek II | Commerce Green One | |
| Location | Sugar Land, TX | Sugar Land, TX | Sugar Land, TX | Sugar Land, TX | Sugar Land, TX | Sugar Land, TX |
| Distance from Subject | -- | 0.2 miles | 0.4 miles | 0.8 miles | 0.8 miles | 0.4 miles |
| Property Type | Office | Office | Office | Office | Office | Office |
| Year Built/Renovated | 1983/2017 | 2008/NAP | 1999/NAP | 1999/NAP | 2008/NAP | 2000/NAP |
| Total GLA | 193,996 SF | 152,743 SF | 143,410 SF | 204,377 SF | 204,791 SF | 110,036 SF |
| Total Occupancy | 86.6% | 94.1% | 78.7% | 77.0% | 82.0% | 94.9% |
| (1) | Information obtained from the appraisal and the underwritten rent roll dated May 16 2019 |
The following table presents certain information relating to four comparable leases to those at the Sugar Creek Center Property:
Comparable Leases(1)
| Property Name/Location | Year Built/ Renovated | Total GLA (SF) | Distance from Subject | Occupancy | Lease Term | Tenant Size (SF) | Annual Base Rent PSF | Reimbursement Amount PSF | Lease Type |
Sugar Creek on the Lake 14141 Southwest Fwy Sugar Land, TX | 1982/NAP | 515,115 | 2.0 miles | NAV | 5.0 Yrs | 2,322 | $18.50 | NAV | NNN |
77 Sugar Creek 77-99 Sugar Creek Center Sugar Land, TX | 1999/NAP | 143,410 | 0.4 miles | 78.7% | 3.1Yrs | 2,583 | $20.00 | NAV | NNN |
Sugar Creek I 13135 Dairy Ashford Road Sugar Land, TX | 1999/NAP | 204,377 | 0.8 miles | 77.0% | 5.3 Yrs | 4,300 | $23.00 | NAV | NNN |
Sugar Creek II 13131 Dairy Ashford Road Sugar Land, TX | 2008/NAP | 204,791 | 0.8 miles | 82.0% | 5.1 Yrs | 3,615 | $22.50 | NAV | NNN |
| (1) | Information obtained from the appraisal. |
Escrows.
Real Estate Taxes – The loan documents require an upfront real estate tax reserve of $321,072 and ongoing monthly real estate tax reserves in an amount equal to one-twelfth of the real estate taxes that the lender estimates will be payable during the next twelve months (initially $50,964).
Insurance – The loan documents require an upfront insurance reserve of $20,734 and ongoing monthly insurance reserves in an amount equal to one-twelfth of the insurance premiums that the lender estimates will be payable during the next twelve months (initially $19,747).
THE INFORMATION IN THIS STRUCTURAL AND COLLATERAL TERM SHEET IS NOT COMPLETE AND MAY BE AMENDED PRIOR TO THE TIME OF SALE. THIS TERM SHEET IS NOT AN OFFER TO SELL THESE SECURITIES AND IT IS NOT A SOLICITATION OF AN OFFER TO BUY THESE SECURITIES IN ANY JURISDICTION WHERE THE OFFER OR SALE IS NOT PERMITTED.
113
| Office - Suburban | Loan #8 | Cut-off Date Balance: | $28,929,851 | |
| 1 Sugar Creek Center Boulevard | Sugar Creek Center | Cut-off Date LTV: | 70.4% | |
| Sugar Land, TX 77478 | U/W NCF DSCR: | 1.57x | ||
| U/W NOI Debt Yield: | 11.0% |
Replacement Reserves – The loan documents require ongoing monthly replacement reserve of $4,527. The replacement reserves will be subject to a cap of $162,957 after the replacement of the chiller at the Sugar Creek Center Property.
TI/LC Reserve – The loan documents require an upfront tenant improvements and leasing commissions (“TI/LC”) reserve of $250,000 and ongoing TI/LC reserves of $25,000 (subject to a cap of $750,000). The TI/LC reserve cap will be reduced to $350,0000 when either Amerex Brokers, LLC or a replacement tenant satisfactory to the lender (i) executes a renewal of its lease or a new lease satisfactory to the lender for a term of at least three years for the entirety of the space currently leased by Amerex Brokers, LLC, (ii) has taken occupancy and is conducting normal business operations at the demised space; and (iii) has commenced the payment of full rent, and all tenant improvement costs, leasing commissions and other material costs and expenses have been satisfied.
Deferred Maintenance Reserve – The loan documents require an upfront reserve of $138,750 for immediate repairs.
Outstanding TI/LC Reserve –The loan documents require an upfront reserve of $337,208 for outstanding TI/LC with respect to Enjet, LLC ($152,960), Chad Dick & Elan Levy ($48,681), MS Benow & Assoc. ($66,946), Comerica Bank ($55,613) and Larry Harrison ($13,009).
Free Rent Reserve – The loan documents require an upfront reserve of $160,096 for free rent with respect to Enjet, LLC ($80,944), Chad Dick & Elan Levy ($7,011), MS Benow & Assoc. ($15,768), Comerica Bank ($51,777) and Larry Harrison ($4,596).
Lockbox and Cash Management.The Sugar Creek Center Mortgage Loan requires a springing lockbox and springing cash management. Upon the occurrence and continuance of a Cash Management Trigger Event (as defined below) (i) all rents at the Sugar Creek Center Property will be required to be paid directly to the property manager and deposited daily by the property manager to a lender-controlled lockbox account and (ii) following an event of default, amounts in the lockbox account will be applied to debt service and fund reserves (and as otherwise required under the Sugar Creek Center Mortgage Loan documents).
A “Cash Management Trigger Event” will commence upon the occurrence of the following:
| (i) | an event of default; or |
| (ii) | a bankruptcy action of the guarantor or property manager; |
A Cash Management Trigger Event will end upon the occurrence of:
| ● | with regard to clause (i) above, the cure of such event of default having been accepted or waived by the lender; or |
| ● | with regard to clause (ii) above, the property manager being replaced with an acceptable replacement property manager as defined in the loan documents or the guarantor being replaced with a guarantor acceptable to the lender. |
Property Management. The Sugar Creek Center Property is managed by Glazer Management LLC, an affiliate of the Sugar Creek Center Borrower.
Partial Release. Not permitted.
Real Estate Substitution.Not permitted.
Subordinate and Mezzanine Indebtedness.Not permitted.
Ground Lease. None.
Terrorism Insurance.The Sugar Creek Center Mortgage Loan documents require that the “all risk” insurance policy required to be maintained by the Sugar Creek Center Borrower provides coverage for terrorism in an amount equal to the full replacement cost of the Sugar Creek Center Property, as well as business interruption insurance covering no less than the 12-month period following the occurrence of a casualty event, together with a 180 days extended period of indemnity.
THE INFORMATION IN THIS STRUCTURAL AND COLLATERAL TERM SHEET IS NOT COMPLETE AND MAY BE AMENDED PRIOR TO THE TIME OF SALE. THIS TERM SHEET IS NOT AN OFFER TO SELL THESE SECURITIES AND IT IS NOT A SOLICITATION OF AN OFFER TO BUY THESE SECURITIES IN ANY JURISDICTION WHERE THE OFFER OR SALE IS NOT PERMITTED.
114
(THIS PAGE INTENTIONALLY LEFT BLANK)
THE INFORMATION IN THIS STRUCTURAL AND COLLATERAL TERM SHEET IS NOT COMPLETE AND MAY BE AMENDED PRIOR TO THE TIME OF SALE. THIS TERM SHEET IS NOT AN OFFER TO SELL THESE SECURITIES AND IT IS NOT A SOLICITATION OF AN OFFER TO BUY THESE SECURITIES IN ANY JURISDICTION WHERE THE OFFER OR SALE IS NOT PERMITTED.
115
| Office - Suburban | Loan #9 | Cut-off Date Balance: | $28,560,000 | |
| 3300 East Renner Road | 3300 Renner | Cut-off Date LTV: | 63.4% | |
| Richardson, TX 75080 | U/W NCF DSCR: | 2.59x | ||
| U/W NOI Debt Yield: | 11.1% |
THE INFORMATION IN THIS STRUCTURAL AND COLLATERAL TERM SHEET IS NOT COMPLETE AND MAY BE AMENDED PRIOR TO THE TIME OF SALE. THIS TERM SHEET IS NOT AN OFFER TO SELL THESE SECURITIES AND IT IS NOT A SOLICITATION OF AN OFFER TO BUY THESE SECURITIES IN ANY JURISDICTION WHERE THE OFFER OR SALE IS NOT PERMITTED.
116
| Office - Suburban | Loan #9 | Cut-off Date Balance: | $28,560,000 | |
| 3300 East Renner Road | 3300 Renner | Cut-off Date LTV: | 63.4% | |
| Richardson, TX 75080 | U/W NCF DSCR: | 2.59x | ||
| U/W NOI Debt Yield: | 11.1% |

THE INFORMATION IN THIS STRUCTURAL AND COLLATERAL TERM SHEET IS NOT COMPLETE AND MAY BE AMENDED PRIOR TO THE TIME OF SALE. THIS TERM SHEET IS NOT AN OFFER TO SELL THESE SECURITIES AND IT IS NOT A SOLICITATION OF AN OFFER TO BUY THESE SECURITIES IN ANY JURISDICTION WHERE THE OFFER OR SALE IS NOT PERMITTED.
117
| No. 9 – 3300 Renner | |||||||
| Mortgage Loan Information | Mortgaged Property Information | ||||||
| Mortgage Loan Seller: | Argentic Real Estate Finance LLC | Single Asset/Portfolio: | Single Asset | ||||
Credit Assessment (Fitch/KBRA/Moody’s): | NR/NR/NR | Property Type – Subtype: | Office – Suburban | ||||
| Original Principal Balance: | $28,560,000 | Location: | Richardson, TX | ||||
| Cut-off Date Balance: | $28,560,000 | Size: | 185,078 SF | ||||
| % of Initial Pool Balance: | 3.2% | Cut-off Date Balance Per SF: | $154.31 | ||||
| Loan Purpose: | Acquisition | Maturity Date Balance Per SF: | $154.31 | ||||
| Borrower Sponsor: | Apex Capital Investments Corporation | Year Built/Renovated: | 1983/2019 | ||||
| Guarantors: | Apex Capital Investments Corporation | Title Vesting: | Fee | ||||
| Mortgage Rate: | 4.0400% | Property Manager: | Peloton Real Estate Management, LLC | ||||
| Note Date: | July 19, 2019 | Current Occupancy (As of): | 100.0% (6/14/2019) | ||||
| Seasoning: | 0 months | YE 2018 Occupancy(1): | NAV | ||||
| Maturity Date: | August 6, 2029 | YE 2017 Occupancy(1): | NAV | ||||
| IO Period: | 120 months | YE 2016 Occupancy(1): | NAV | ||||
| Loan Term (Original): | 120 months | YE 2015 Occupancy(1): | NAV | ||||
| Amortization Term (Original): | NAP | Appraised Value(2): | $45,020,000 | ||||
| Loan Amortization Type: | Interest-only, Balloon | Appraised Value Per SF(2): | $243.25 | ||||
| Call Protection: | L(24),D(92),O(4) | Appraisal Valuation Date(2): | September 1, 2019 | ||||
| Lockbox Type: | Hard/Springing Cash Management | Underwriting and Financial Information | |||||
| Additional Debt: | None | TTM NOI(1): | NAV | ||||
| Additional Debt Type (Balance): | NAP | YE 2018 NOI(1): | NAV | ||||
| YE 2017 NOI(1): | NAV | ||||||
| YE 2016 NOI(1): | NAV | ||||||
| U/W Revenues: | $4,872,142 | ||||||
| Escrows and Reserves(3) | U/W Expenses: | $1,715,746 | |||||
| Initial | Monthly | Cap | U/W NOI: | $3,156,396 | |||
| Taxes | $0 | Springing | NAP | U/W NCF: | $3,035,481 | ||
| Insurance | $0 | Springing | NAP | U/W DSCR based on NOI/NCF: | 2.69x / 2.59x | ||
| Replacement Reserve | $0 | $3,085 | 111,047 | U/W Debt Yield based on NOI/NCF: | 11.1% / 10.6% | ||
| TI/LC Reserve | $0 | Springing | NAP | U/W Debt Yield at Maturity based on NOI/NCF: | 11.1% / 10.6% | ||
| Free Rent Reserve | $261,628 | $0 | NAP | Cut-off Date LTV Ratio(2): | 63.4% | ||
| Outstanding TI/LC Reserve(4) | $4,194,944 | $0 | NAP | LTV Ratio at Maturity(2): | 63.4% | ||
| Sources and Uses | ||||||
| Sources | Uses | |||||
| Original loan amount | $28,560,000 | 57.6% | Purchase price(4) | $43,500,000 | 87.7% | |
| Cash equity contribution | 16,869,429 | 34.0 | Upfront reserves | 4,456,572 | 9.0 | |
| Seller TI Credit(4) | 4,194,944 | 8.5 | Closing costs | 1,667,801 | 3.4 | |
| Total Sources | $49,624,373 | 100.0% | Total Uses | $49,624,373 | 100.0% | |
| (1) | Historical cash flows and occupancy figures are not available as the transaction is an acquisition. |
| (2) | The Appraised Value represents the “Prospective As-Stabilized” value of $45,020,000 as of September 1, 2019. The “Prospective As-Stabilized” and “As-Is” value estimates are subject to the extraordinary assumption that at origination, the seller will credit the borrower the costs for all existing outstanding tenant improvement allowances and FF&E allowances. In addition, the appraiser deducted from the “Prospective As-Stabilized” value the remaining months of free rent for the largest tenant, Genpact (occupying 96.9% of NRA), in calculating the “As-Is” value. The lender escrowed $ 4,194,944 in outstanding TI/LC costs and $261,628 in rent abatement at closing. The Cut-off Date LTV Ratio and LTV Ratio at Maturity based on the as-is appraised value of 44,500,000 are 64.2% and 64.2%, respectively. |
| (3) | See “Escrows” section for a full description of Escrows and Reserves. |
| (4) | As part of the acquisition, the 3300 Renner Borrower received $4,194,944 in outstanding TI/LC from the seller which was escrowed at closing. The purchase price of $43,500,000 is net of the Seller TI Credit. |
THE INFORMATION IN THIS STRUCTURAL AND COLLATERAL TERM SHEET IS NOT COMPLETE AND MAY BE AMENDED PRIOR TO THE TIME OF SALE. THIS TERM SHEET IS NOT AN OFFER TO SELL THESE SECURITIES AND IT IS NOT A SOLICITATION OF AN OFFER TO BUY THESE SECURITIES IN ANY JURISDICTION WHERE THE OFFER OR SALE IS NOT PERMITTED.
118
| Office - Suburban | Loan #9 | Cut-off Date Balance: | $28,560,000 | |
| 3300 East Renner Road | 3300 Renner | Cut-off Date LTV: | 63.4% | |
| Richardson, TX 75080 | U/W NCF DSCR: | 2.59x | ||
| U/W NOI Debt Yield: | 11.1% |
The Mortgage Loan.The mortgage loan (the “3300 Renner Mortgage Loan”) is evidenced by a single promissory note secured by a first mortgage encumbering the borrower’s fee interest in a suburban office property located in Richardson, Texas (the “3300 Renner Property”). The proceeds, along with a cash equity contribution from the borrower in the amount of $16.9 million, of the 3300 Renner Mortgage Loan were primarily used to acquire the 3300 Renner Property for $43.5 million, fund reserves, and pay closing costs.
The Borrower and the Borrower Sponsor. The borrower is 3300 Renner Property Company LLC (the “3300 Renner Borrower”), a single-purpose Delaware limited liability company with one independent director. Apex Capital Investments Corporation (the “3300 Renner Borrower Sponsor”), the U.S. based investment arm of Dimah Capital, will serve as the non-recourse Shariah-compliant carve-out guarantor.
Dimah Capital is an experienced real estate investment firm that has acquired approximately $750 million in US real estate. Upon origination of the 3300 Renner Mortgage Loan, the 3300 Renner Borrower will master-lease the entire 3300 Renner Property to 3300 Renner Operating Company LLC, a single-purpose, bankruptcy remote, special purpose entity affiliated with the 3300 Renner Borrower Sponsor. The master lease structure is required for the financing to be Shariah compliant.
The Property. The 3300 Renner Property is a three-story, 185,078 square foot suburban office building constructed in 1983 and most recently renovated in 2019. The seller reportedly invested approximately $4.3 million ($22 per square foot) in capital expenditures and approximately $8 million ($43 per square foot) in tenant improvements since 2014. The 3300 Renner Property is situated on an 18.0-acre site, features a two-story atrium located at the front entrance along the north side of the structure between the building’s East and West wings. The 3300 Renner Property has access to President George Bush Turnpike within one mile of the property entrance. The 3300 Renner Property contains 1,416 surface parking spaces, resulting in a parking ratio of 7.7 spaces per 1,000 square feet of rentable area.
As of June 14, 2019, the 3300 Renner Property is 100.0% occupied by two tenants. Tenants include Genpact Limited (“Genpact”) (179,402 square feet; 96.9% net rentable area; lease expiration: 8/31/2029) and Verizon Business Services (“Verizon”) (5,265 square feet; 2.8% net rentable area; lease expiration: 12/31/2022). The management office occupies 411 square feet.
Major Tenants. Genpact is a global professional services firm with over 87,000 employees in over 25 countries. Genpact drives digitally-led innovation and runs digitally-enabled intelligent operations for clients including numerous Fortune 500 companies. Started in 1997 as a division of General Electric, Genpact became an independent enterprise in January 2005 and reported 2018 revenues of $3 billion, a market cap of $7.3 billion as of July 23, 2019 and a debt/EBITDA ratio of 2.66x as of the first quarter of 2019. Genpact is rated BBB- and Baa3 by S&P and Moody’s, respectively. Genpact uses its patented “Smart Enterprise Processes” to analyze client transactions and end-to-end business processes across banking & financial services, capital markets, insurance, consumer goods & retail, life sciences & healthcare and numerous other sectors. The Genpact operations at the 3300 Renner Property mainly serve two clients – Goldman Sachs and Facebook.
Genpact originally commenced a lease in July 2017 for 63,603 square feet at the 3300 Renner Property. Since then, Genpact has expanded its presence at the 3300 Renner Property three times for an additional 115,799 square feet and has a lease extending through the end of August 2029. In addition, Genpact recently vacated roughly 30,000 square feet at a neighboring property to consolidate its operations at the 3300 Renner Property. Genpact recently completed upgrades to the lobby at its own expense at an undisclosed amount, and is currently completing upgrades to the third floor space. Genpact’s Lease provides for a one-time right to terminate on August 31, 2026 with 12 months’ prior notice and payment of an early termination fee of approximately $3.5 million ($19 per square foot) and two, five year renewal options remaining.
Verizon is currently leasing 5,265 square feet with a lease expiration of December 31, 2022. Verizon’s lease provides for a one-time right to terminate on December 31, 2021 with a 60-day notice. Pursuant to Genpact’s lease, Genpact is required to lease the premises currently occupied by Verizon on the earlier of January 1, 2023 or the date Verizon vacates its premise until August 31, 2029. Upon taking Verizon’s space, Genpact will be leasing 100.0% of the 3300 Renner Property.
THE INFORMATION IN THIS STRUCTURAL AND COLLATERAL TERM SHEET IS NOT COMPLETE AND MAY BE AMENDED PRIOR TO THE TIME OF SALE. THIS TERM SHEET IS NOT AN OFFER TO SELL THESE SECURITIES AND IT IS NOT A SOLICITATION OF AN OFFER TO BUY THESE SECURITIES IN ANY JURISDICTION WHERE THE OFFER OR SALE IS NOT PERMITTED.
119
| Office - Suburban | Loan #9 | Cut-off Date Balance: | $28,560,000 | |
| 3300 East Renner Road | 3300 Renner | Cut-off Date LTV: | 63.4% | |
| Richardson, TX 75080 | U/W NCF DSCR: | 2.59x | ||
| U/W NOI Debt Yield: | 11.1% |
The following table presents certain information relating to the tenancy at the 3300 Renner Property:
Major Tenants(1)
| Tenant Name | Credit Rating (Fitch/Moody’s/ S&P) | Tenant NRSF | % of NRSF | Annual U/W Base Rent PSF(1) | Annual U/W Base Rent(1) | % of Total Annual U/W Base Rent(1) | Lease Expiration Date | Extension Options | Termination Option (Y/N) |
| Major Tenants | |||||||||
| Genpact | NR/Baa3/BBB- | 179,402 | 96.9% | $19.29 | $3,460,548 | 97.4% | 8/31/2029 | 2, 5-year | Y |
| Verizon / Genpact(2) | BBB+/Baa1/A- | 5,265 | 2.8% | $17.65(3) | $92,923 | 2.6% | 8/31/2029 | None | Y |
| Total Major Tenants | 184,667 | 99.8% | $19.24 | $3,553,471 | 100.0% | ||||
| Amenity Space(4) | 411 | 0.2% | $0.00 | $0.00 | 0.0% | ||||
| Occupied Collateral | 185,078 | 100.0% | $19.24(5) | $3,553,471 | 100.0% | ||||
| Vacant Space | 0 | 0.0% | |||||||
| Collateral Total | 185,078 | 100.0% | |||||||
| (1) | Annual U/W Base Rent PSF, Annual U/W Base Rent, and % of Total Annual U/W Base Rent includes the straight-lining of rent steps through the Genpact’s lease termination date of August 31, 2029 but not recovery income. |
| (2) | Pursuant to Genpact’s lease, Genpact is required to lease the premises currently occupied by Verizon on the earlier of January 1, 2023 or the date Verizon vacates its premises. The expiration of the premises currently occupied by Verizon will be co-terminus with the rest of the Genpact space under the Genpact lease, which currently is August 31, 2029. |
| (3) | The $18.88 in U/W Base Rent PSF for this space is based on the average of Verizon’s rent for the remaining term of its lease and Genpact’s rent until the expiration of the 3300 Renner Mortgage Loan term. The current rent PSF for Verizon is $15.00. |
| (4) | Amenity Space represents the buildings management office and does not pay rent. |
| (5) | Annual U/W Base Rent PSF for the Occupied Collateral excludes the management office space of 411 square feet. |
The following table presents certain information relating to the lease rollover schedule at the 3300 Renner Property:
Lease Expiration Schedule(1)
| Year Ending December 31, | No. of Leases Expiring | Expiring NRSF | % of Total NRSF | Cumulative Expiring NRSF | Cumulative % of Total NRSF | Annual U/W Base Rent(2) | % of Total Annual U/W Base Rent(2) | Annual U/W Base Rent PSF(2) |
| MTM(3) | 1 | 411 | 0.2% | 411 | 0.2% | $0 | 0.0% | $0.00(4) |
| 2019 | 0 | 0 | 0.0% | 411 | 0.2% | $0 | 0.0% | $0.00 |
| 2020 | 0 | 0 | 0.0% | 411 | 0.2% | $0 | 0.0% | $0.00 |
| 2021 | 0 | 0 | 0.0% | 411 | 0.2% | $0 | 0.0% | $0.00 |
| 2022 | 0 | 0 | 0.0% | 411 | 0.2% | $0 | 0.0% | $0.00 |
| 2023 | 0 | 0 | 0.0% | 411 | 0.2% | $0 | 0.0% | $0.00 |
| 2024 | 0 | 0 | 0.0% | 411 | 0.2% | $0 | 0.0% | $0.00 |
| 2025 | 0 | 0 | 0.0% | 411 | 0.2% | $0 | 0.0% | $0.00 |
| 2026 | 0 | 0 | 0.0% | 411 | 0.2% | $0 | 0.0% | $0.00 |
| 2027 | 0 | 0 | 0.0% | 411 | 0.2% | $0 | 0.0% | $0.00 |
| 2028 | 0 | 0 | 0.0% | 411 | 0.2% | $0 | 0.0% | $0.00 |
| 2029(5) | 2 | 184,667 | 99.8% | 185,078 | 100.0% | $3,553,471 | 100.0% | $19.24 |
| Thereafter | 0 | 0 | 0.0% | 185,078 | 100.0% | $0 | 0.0% | $0.00 |
| Vacant | 0 | 0 | 0.0% | 185,078 | 100.0% | $0 | 0.0% | $0.00 |
| Total/Weighted Average | 3 | 185,078 | 100.0% | $3,553,471 | 100.0% | $19.24 |
| (1) | Information obtained from the underwritten rent roll. |
| (2) | Annual U/W Base Rent PSF, Annual U/W Base Rent, and % of Total Annual U/W Base Rent the straight-lining of rent steps through the Genpact’s lease termination date of August 31, 2029 but not recovery income. |
| (3) | MTM tenant is the management office which does not have a lease. |
| (4) | Annual U/W Base Rent PSF for the Occupied Collateral does not include the management office space of 411 square feet. |
| (5) | Under Genpact’s lease, Genpact is required to lease the premises currently occupied by Verizon on the earlier of January 1, 2023 or the date Verizon vacates its premise. The expiration of the premise currently occupied is co-terminus with the rest of the Genpact space under the Genpact lease, which currently is August 31, 2029. |
THE INFORMATION IN THIS STRUCTURAL AND COLLATERAL TERM SHEET IS NOT COMPLETE AND MAY BE AMENDED PRIOR TO THE TIME OF SALE. THIS TERM SHEET IS NOT AN OFFER TO SELL THESE SECURITIES AND IT IS NOT A SOLICITATION OF AN OFFER TO BUY THESE SECURITIES IN ANY JURISDICTION WHERE THE OFFER OR SALE IS NOT PERMITTED.
120
| Office - Suburban | Loan #9 | Cut-off Date Balance: | $28,560,000 | |
| 3300 East Renner Road | 3300 Renner | Cut-off Date LTV: | 63.4% | |
| Richardson, TX 75080 | U/W NCF DSCR: | 2.59x | ||
| U/W NOI Debt Yield: | 11.1% |
The following table presents historical occupancy percentages at the 3300 Renner Property:
Historical Occupancy
12/31/2016(1) | 12/31/2017(1) | 12/31/2018(1) | 6/14/2019(1)(2) |
| NAV | NAV | NAV | 100.0% |
| (1) | Historical occupancy figures are not available as the transaction represents an acquisition. |
| (2) | Information obtained from underwritten rent roll. |
Operating History and Underwritten Net Cash Flow. The following table presents certain information relating to the historical operating statements and underwritten net cash flow at the 3300 Renner Property:
Cash Flow Analysis(1)
| U/W | %(2) | U/W $ per SF | |
| Rents in Place | $3,218,510 | 61.1% | $17.39 |
| Contractual Rent Steps | 334,961(3) | 6.4 | 1.81 |
| Grossed Up Vacant Space | 0 | 0.0 | 0.00 |
| Gross Potential Rent | $3,553,471 | 67.5% | $19.20 |
| Total Recoveries | 1,713,709 | 32.5 | 9.26 |
| Net Rental Income | $5,267,180 | 100.0% | $28.46 |
| (Vacancy & Credit Loss)(4) | (395,039) | (7.5) | (2.13) |
| Effective Gross Income | $4,872,142 | 92.5% | $26.32 |
| Real Estate Taxes | 581,533 | 11.9 | 3.14 |
| Insurance | 68,589 | 1.4 | 0.37 |
| Management Fee | 146,164 | 3.0 | 0.79 |
| Other Operating Expenses | 919,460 | 18.9 | 4.97 |
| Total Operating Expenses | $1,715,746 | 35.2% | $9.27 |
| Net Operating Income | $3,156,396 | 64.8% | $17.05 |
| Replacement Reserves | 46,270 | 0.9 | 0.25 |
| TI/LC | 74,645 | 1.5 | 0.40 |
| Net Cash Flow | $3,035,481 | 62.3% | $16.40 |
| NOI DSCR | 2.69x | ||
| NCF DSCR | 2.59x | ||
| NOI Debt Yield | 11.1% | ||
| NCF Debt Yield | 10.6% |
| (1) | Historical financial information is not available as the transaction represents an acquisition. |
| (2) | Represents (i) percent of Net Rental Income for all revenue fields and Vacancy & Credit Loss and (ii) percent of Effective Gross Income for all other fields. |
| (3) | Represents the straight-lining of rent steps through the Genpact’s lease termination date of August 31, 2029 given investment grade tenancy. |
| (4) | The underwritten vacancy is 7.5%. The 3300 Renner Property was 100.0% leased as of June 14, 2019. |
Appraisal. The appraiser concluded to a “Prospective As-Stabilized” Appraised Value for the 3300 Renner Property of $45,020,000 as of September 1, 2019. The “Prospective As-Stabilized” and “As-Is” value estimates are subject to the extraordinary assumption that at origination, the seller will credit the borrower the costs for all existing outstanding tenant improvement allowances and FF&E allowances. In addition, the appraiser deducted from the “Prospective As-Stabilized” value the two months of free rent for the largest tenant, Genpact (occupying 96.9% of NRA), in calculating the “As-Is” value. The lender escrowed $ 4,194,944 in outstanding TI/LC costs and $261,628 in rent abatement at closing. The Cut-off Date LTV Ratio and LTV Ratio at Maturity based on the as-is appraised value of $44,500,000 are 64.2% and 64.2%, respectively.
Environmental Matters. According to the Phase I environmental site assessment dated May 1, 2019, there was no evidence of any recognized environmental conditions at the 3300 Renner Property.
Market Overview.The 3300 Renner Property is located in Richardson in Collin County, Texas. Primary access to the 3300 Renner Property’s neighborhood is provided by the George Bush Turnpike (SH 190) and US-75 (Central Expressway). The DART light rail line also provides public railway transportation and has four convenient stations in Richardson at Spring Valley Road, Arapaho Road, Galatyn
THE INFORMATION IN THIS STRUCTURAL AND COLLATERAL TERM SHEET IS NOT COMPLETE AND MAY BE AMENDED PRIOR TO THE TIME OF SALE. THIS TERM SHEET IS NOT AN OFFER TO SELL THESE SECURITIES AND IT IS NOT A SOLICITATION OF AN OFFER TO BUY THESE SECURITIES IN ANY JURISDICTION WHERE THE OFFER OR SALE IS NOT PERMITTED.
121
| Office - Suburban | Loan #9 | Cut-off Date Balance: | $28,560,000 | |
| 3300 East Renner Road | 3300 Renner | Cut-off Date LTV: | 63.4% | |
| Richardson, TX 75080 | U/W NCF DSCR: | 2.59x | ||
| U/W NOI Debt Yield: | 11.1% |
Park and at the CityLine/Bush Turnpike. The 3300 Renner Property’s neighborhood is situated in the southern portion of Collin County, about 15 miles northeast of the Dallas Central Business District. The commute to the Dallas Central Business District is about 20 minutes from the 3300 Renner Property, compared with the commute to Fort Worth, which is about a 1.25-hour drive. The Dallas/Fort Worth Airport is about a 45 minute drive from the 3300 Renner Property.
The City of Richardson’s Economic Development department has helped orchestrate significant relocation and expansion efforts in Richardson. Since 2006, these and other projects have resulted in almost 8,000 jobs (announced/retained) and 5.8 million square feet of office space leased or developed. Since 2006, over 20 projects in mixed-use and transit-oriented development have occurred, with new retail developments and retailers, adding more than 115 new restaurants and over $350 million in new investments. Richardson is the second largest employment center in the Dallas/Ft. Worth metro area and includes a diverse range of businesses. The city’s three largest employers represent three separate industries: telecommunications, public education, financial services.
According to the appraisal, the estimated 2018 population within a one-, three- and five-mile radius of the 3300 Renner Property was 10,572, 95,003, and 280,135, respectively; and the estimated 2018 average household income within the same radii was $129,767, $108,317, and $101,448, respectively.
According to the appraisal, the 3300 Renner Property is situated within the Richardson and Plano submarkets of the Dallas – Fort Worth office market. As of the first quarter 2019, the submarket reported a total inventory of approximately 23.6 million square feet of office space with a 22.9% vacancy rate and an average asking rental rate of $22.22 per square foot, on a triple net basis. The submarket’s 39 single tenant buildings have performed at 89.6% to 94.1%, to the current 92.1% average level. There is currently no new supply expected in the next two years.
According to the appraisal, the 3300 Renner Property’s office submarket is a major employment center for the Dallas Metroplex and is conveniently accessed by the freeway and major roadway systems. The area is well served with retail and hotels and has a very desirable reputation for office buildings and retail centers, as well as for single family and multifamily dwellings.
THE INFORMATION IN THIS STRUCTURAL AND COLLATERAL TERM SHEET IS NOT COMPLETE AND MAY BE AMENDED PRIOR TO THE TIME OF SALE. THIS TERM SHEET IS NOT AN OFFER TO SELL THESE SECURITIES AND IT IS NOT A SOLICITATION OF AN OFFER TO BUY THESE SECURITIES IN ANY JURISDICTION WHERE THE OFFER OR SALE IS NOT PERMITTED.
122
| Office - Suburban | Loan #9 | Cut-off Date Balance: | $28,560,000 | |
| 3300 East Renner Road | 3300 Renner | Cut-off Date LTV: | 63.4% | |
| Richardson, TX 75080 | U/W NCF DSCR: | 2.59x | ||
| U/W NOI Debt Yield: | 11.1% |
The following table presents certain information relating to comparable office leases for the 3300 Renner Property:
Comparable Leases(1)
| Name | Year Built/Renovated | NRA (SF) | Occ. | Lease Type (expense basis) | Tenant Names | Lease Date | Lease Area (SF) | Lease
(Years)
| Rent
(PSF)
| |
3300 Renner Property 3300 East Renner Road, | 1983/2019(2) | 185,078(2) | 100%(2) | NNN(2) | Genpact | Aug-29(2) | 184,667(2) | 10.0(2) | $19.29(2) | |
T-Mobile 7668 Warren Parkway Frisco, Texas | 2005 | 158,135 | 100% | NNN | T-Mobile | April-17 | 158,135 | 10.0 | $18.75 | |
Creekview Corporate Center II 1300 E Lookout Drive, Richardson, TX | 2001 | 151,242 | 0% | NNN | NAV | NAV | NAV | NAV | $17.00 | |
Samsung – Legacy Central Office Park 6625 Declaration Boulevard, Building 4. Plano, Texas | 1986 | 216,000 | 100% | NNN | Samsung | Feb-20 | 216,000 | 10.0 | $21.50 | |
1410 E. Renner Road 1410 E. Renner Road, Richardson, TX | 1999 | 122,300 | 9% | NNN | NAV | NAV | NAV | NAV | $17.00 | |
Campbell Glenn II 1125 E. Campbell Road, Richardson, TX | 1997 | 205,817 | 0% | NNN | NAV | NAV | NAV | NAV | $17.50 | |
Galatyn Park Commons 2375 Building A&B Glenville Drive, 1011 Galatyn and 2380 Performance Drive, Richardson, TX | 1998/2016 | 801,923 | 100% | NNN | Goldman Sachs at 1011 G | Jun-18 | 67,833 | 15.0 | $26.40 | |
| Service King Bldg. A | Jun-17 | 65,000 | 10.7 | $19.00 | ||||||
| Quoted | NAV | NAV | NAV | $26.40 |
| (1) | Information obtained from the appraisal. |
| (2) | Information obtained from the underwritten rent roll. |
The table below presents certain information relating to comparable sales pertaining to the 3300 Renner Property identified by the appraiser:
Comparable Sales(1)
| Property Name | Location | Rentable Area (SF) | Sale Date | Sale Price | Sale Price (PSF) |
| 3300 Renner | Richardson, TX | 185,078 | Jul-19 | $43,500,000 | $235 |
| GEICO Office Building | Richardson, TX | 228,506 | May-17 | $52,625,000 | $230 |
| Raytheon Office Building | Richardson, TX | 489,000 | Jul-17 | $118,000,000 | $241 |
| FedEx Office Building | Plano, TX | 263,621 | Nov-17 | $79,650,000 | $302 |
| Nissan Motor Acceptance Corporation | Irving, TX | 268,445 | Sep-18 | $54,250,442 | $202 |
| 5001 Statesman Office | Irving, TX | 93,632 | Jan-19 | $19,150,000 | $205 |
| Lockheed Martin Office Building | Fort Worth, TX | 60,037 | Apr-19 | $12,007,467 | $200 |
| (1) | Information obtained from the appraisal. |
THE INFORMATION IN THIS STRUCTURAL AND COLLATERAL TERM SHEET IS NOT COMPLETE AND MAY BE AMENDED PRIOR TO THE TIME OF SALE. THIS TERM SHEET IS NOT AN OFFER TO SELL THESE SECURITIES AND IT IS NOT A SOLICITATION OF AN OFFER TO BUY THESE SECURITIES IN ANY JURISDICTION WHERE THE OFFER OR SALE IS NOT PERMITTED.
123
| Office - Suburban | Loan #9 | Cut-off Date Balance: | $28,560,000 | |
| 3300 East Renner Road | 3300 Renner | Cut-off Date LTV: | 63.4% | |
| Richardson, TX 75080 | U/W NCF DSCR: | 2.59x | ||
| U/W NOI Debt Yield: | 11.1% |
Escrows.
Real Estate Taxes – The 3300 Renner Mortgage Loan documents require an ongoing monthly real estate tax reserves in an amount equal to one-twelfth of the real estate taxes that the lender estimates will be payable during the next twelve months (initially $39,605) if the Tax Escrow Waiver Requirements (as defined below) are not satisfied.
“Tax Escrow Waiver Requirements” means that (i) no monetary or material non-monetary event of default under the 3300 Renner Mortgage Loan agreement has occurred and is continuing, (ii) Genpact’s lease is in full force and effect, (iii) Genpact is required under its lease to pay all taxes directly to the appropriate governmental taxing authority, and (iv) Genpact has paid all taxes directly to the appropriate governmental taxing authority and the borrower provides (or causes master Lessee (as defined below) to provide) the lender with evidence thereof prior to the applicable due date thereof.
Insurance – The 3300 Renner Mortgage Loan documents require ongoing monthly insurance reserves in an amount equal to one-twelfth of the insurance premiums that the lender estimates will be payable during the next twelve months (initially $5,716) if the Insurance Escrow Waiver Requirements (as defined below) are not satisfied.
“Insurance Escrow Waiver Requirements” means that (i) no monetary or material non-monetary event of default under the 3300 Renner Mortgage Loan agreement has occurred and is continuing, (ii) Genpact’s lease is in full force and effect, (iii) Genpact is required under its lease to maintain fully paid for policies in accordance with the loan agreement, and (iv) Genpact has paid all insurance premiums required under such policies and provides the lender with evidence thereof prior to the applicable due date thereof.
Replacement Reserve – The 3300 Renner Mortgage Loan documents require ongoing monthly replacement reserves in an amount equal to one-twelfth of $0.20 per square foot (currently $3,085), subject to a cap of three years’ of collections (currently $111,047).
TI/LC Reserve – The 3300 Renner Mortgage Loan documents require ongoing monthly reserve in the amount of one-twelfth of $0.50 per square foot, initially ($7,711.58) at the earlier to occur of (x) the 3300 Mortgage Loan entering a Cash Management Period (as defined below) or (y) the payment date occurring in September 2024.
Free Rent Reserve -The 3300 Renner Mortgage Loan documents require an upfront free rent reserve totaling $261,628 for the purpose of creating a reserve for the funding of monies to replicate rents for the Genpact Lease, which is subject to a free rent period.
Outstanding TI/LC Reserve- The 3300 Renner Mortgage Loan documents require an upfront reserve totaling $4,194,944 for outstanding TI/LC costs, paid for by sellers. The reserve was funded with the TI/LC credit provided by the seller at closing.
Lockbox and Cash Management. The 3300 Renner Mortgage Loan documents require that the borrower establish and maintain a lender-controlled lockbox account and that the borrower direct all tenants to pay rent directly into such lockbox account. The 3300 Renner Mortgage Loan documents also require that all rents received by the 3300 Renner Borrower or the property manager be deposited into the lockbox account within one business day of receipt. Prior to the occurrence of a Cash Management Period (as defined below), all funds on deposit in the lockbox account will be disbursed to the 3300 Renner Borrower. During a Cash Management Period, all funds in the lockbox account are required to be swept each business day into the cash management account, and all excess cash flow is required to be swept to an excess cash flow subaccount held by the lender.
A “Cash Management Period” will commence upon the earlier of the following:
| (i) | the occurrence and continuance of an Event of Default; |
| (ii) | the NOI DSCR falling below 1.50x; or |
| (iii) | the commencement of a Lease Sweep Period (as defined below). |
A Cash Management Period will end upon the occurrence of the following:
| ● | with regard to clauses (i), (ii) and (iii) above, payment in full or defeasance in full of the 3300 Renner Mortgage Loan; |
| ● | with regard to clause (i), the cure of such event of default; |
| ● | with regard to clause (ii), the NOI DSCR being equal to or greater than 1.55x for two consecutive calendar quarters; and |
| ● | with regard to clause (iii), the end of a Lease Sweep Period. |
A “Lease Sweep Period” will commence upon the earliest to occur of the following:
| (i) | the date that is 18 months prior to the end of the term of any Major Lease (as defined below) (including any renewal terms); |
| (ii) | the date by which the applicable Major Tenant (as defined below) is required under a Major Lease (as defined below) to give notice of its exercise of a renewal option thereunder (and such renewal has not been so exercised by the Major Tenant under such Major Lease), or the date that any Major Tenant gives written notice to the Master Lessee (as defined below) or the 3300 Renner Borrower of its intention not to renew or extend its Major Lease; |
| (iii) | any Major Lease (or any material portion thereof) is surrendered, cancelled or terminated prior to its then current expiration date or any Major Tenant gives written notice to the Master Lessee or the 3300 Renner Borrower of its intention to terminate, surrender or cancel its Major Lease; |
| (iv) | any Major Tenant discontinues its business at twenty-five percent (25%) or more of its premises (i.e., “goes dark”) or gives written notice to the Master Lessee or the 3300 Renner Borrower that it intends to discontinue its business; |
| (v) | the occurrence and continuance (beyond any applicable notice and cure periods) of a default under any Major Lease by the applicable Major Tenant thereunder; |
| (vi) | the occurrence of a Major Tenant insolvency proceeding; or |
THE INFORMATION IN THIS STRUCTURAL AND COLLATERAL TERM SHEET IS NOT COMPLETE AND MAY BE AMENDED PRIOR TO THE TIME OF SALE. THIS TERM SHEET IS NOT AN OFFER TO SELL THESE SECURITIES AND IT IS NOT A SOLICITATION OF AN OFFER TO BUY THESE SECURITIES IN ANY JURISDICTION WHERE THE OFFER OR SALE IS NOT PERMITTED.
124
| Office - Suburban | Loan #9 | Cut-off Date Balance: | $28,560,000 | |
| 3300 East Renner Road | 3300 Renner | Cut-off Date LTV: | 63.4% | |
| Richardson, TX 75080 | U/W NCF DSCR: | 2.59x | ||
| U/W NOI Debt Yield: | 11.1% |
| (vii) | the credit rating of Major Tenant or Major Tenant Guarantor being downgraded below BB by S&P (or its functional equivalent by any other rating agency). |
A “Lease Sweep Period” will end upon the earliest of the following:
| (i) | determination by the lender that sufficient funds have been accumulated in the Special Rollover Reserve Subaccount (as defined below) to pay for all anticipated expenses in connection with the re-leasing of the space under the applicable Major Lease that gave rise to the subject Lease Sweep Period; with respect to a Lease Sweep Period caused by a matter described in clauses (i), (ii), (iii) or (iv) above, upon the earlier to occur of (A) the date on which the subject Major Tenant irrevocably exercises its renewal or extension option (or otherwise enters into an extension agreement with the 3300 Renner Borrower or Master Lessee and reasonably acceptable to the lender) with respect to all of the space demised under its Major Lease or, (B) the date on which all of the space demised under the subject Major Lease (or portion thereof) that gave rise to the subject Lease Sweep Period has been fully leased; |
| (ii) | with respect to a Lease Sweep Period caused by a matter described in clause (v) above, the subject Major Tenant default being cured, and no other Major Tenant default occurring for a period of six (6) consecutive months following such cure; |
| (iii) | with respect to a Lease Sweep Period caused by a matter described in clause (vi) above, the applicable Major Tenant insolvency proceeding being terminated and the applicable Major Lease being affirmed, assumed or assigned in a manner satisfactory to the lender; and |
| (iv) | with respect to a Lease Sweep Period caused by a matter described in clause (vii) above, upon the credit rating of the Major Tenant (and/or the Major Tenant Guarantor, as the case may be) being restored to at least BB by S&P (or its functional equivalent by any other rating agency). |
“Special Rollover Reserve Subaccount” means the subaccount in which all available cash is deposited which was caused by the occurrence and or continuance of a Lease Sweep Period.
“Major Lease” means Genpact’s lease.
“Major Tenant” means any tenant under a Major Lease.
“Major Tenant Guarantor” means the lease guarantor under any Major Lease.
“Master Lessee” means 3300 Renner Operating Company LLC, a Delaware limited liability company.
Property Management. The 3300 Renner Property is managed by Peloton Real Estate Management, LLC (“Peloton”). Peloton is a full service commercial real estate firm founded in 2002 by industry veterans. Peloton has a portfolio of over 26 million square feet of leased and or managed properties.
Partial Defeasance and Partial Release. Not permitted.
Right of First Refusal. None.
Real Estate Substitution.Not permitted.
Subordinate and Mezzanine Indebtedness.Not permitted.
Ground Lease. None.
Terrorism Insurance.The 3300 Renner Mortgage Loan documents require that the “all risk” insurance policy required to be maintained by the borrower provides coverage for terrorism in an amount equal to the full replacement cost of the 3300 Renner Property, as well as business interruption insurance covering no less than the 18-month period following the occurrence of a casualty event, together with a 6-month extended period of indemnity.
THE INFORMATION IN THIS STRUCTURAL AND COLLATERAL TERM SHEET IS NOT COMPLETE AND MAY BE AMENDED PRIOR TO THE TIME OF SALE. THIS TERM SHEET IS NOT AN OFFER TO SELL THESE SECURITIES AND IT IS NOT A SOLICITATION OF AN OFFER TO BUY THESE SECURITIES IN ANY JURISDICTION WHERE THE OFFER OR SALE IS NOT PERMITTED.
125
| Industrial – Flex | Loan #10 | Cut-off Date Balance: | $28,500,000 | |
| 37-73 Ramapo Valley Road | Mahwah Business Park | Cut-off Date LTV: | 66.4% | |
| Mahwah, NJ 07430 | U/W NCF DSCR: | 1.41x | ||
| U/W NOI Debt Yield: | 8.8% |
THE INFORMATION IN THIS STRUCTURAL AND COLLATERAL TERM SHEET IS NOT COMPLETE AND MAY BE AMENDED PRIOR TO THE TIME OF SALE. THIS TERM SHEET IS NOT AN OFFER TO SELL THESE SECURITIES AND IT IS NOT A SOLICITATION OF AN OFFER TO BUY THESE SECURITIES IN ANY JURISDICTION WHERE THE OFFER OR SALE IS NOT PERMITTED.
126
| Industrial – Flex | Loan #10 | Cut-off Date Balance: | $28,500,000 | |
| 37-73 Ramapo Valley Road | Mahwah Business Park | Cut-off Date LTV: | 66.4% | |
| Mahwah, NJ 07430 | U/W NCF DSCR: | 1.41x | ||
| U/W NOI Debt Yield: | 8.8% |

THE INFORMATION IN THIS STRUCTURAL AND COLLATERAL TERM SHEET IS NOT COMPLETE AND MAY BE AMENDED PRIOR TO THE TIME OF SALE. THIS TERM SHEET IS NOT AN OFFER TO SELL THESE SECURITIES AND IT IS NOT A SOLICITATION OF AN OFFER TO BUY THESE SECURITIES IN ANY JURISDICTION WHERE THE OFFER OR SALE IS NOT PERMITTED.
127
No. 10 – Mahwah Business Park | |||||||
| Mortgage Loan Information | Mortgaged Property Information | ||||||
| Mortgage Loan Seller: | Argentic Real Estate Finance LLC | Single Asset/Portfolio: | Single Asset | ||||
Credit Assessment (Fitch/KBRA/Moody’s): | NR/NR/NR | Property Type – Subtype: | Industrial - Flex | ||||
| Original Principal Balance: | $28,500,000 | Location: | Mahwah, NJ | ||||
| Cut-off Date Balance: | $28,500,000 | Size: | 380,346 SF | ||||
| % of Initial Pool Balance: | 3.2% | Cut-off Date Balance Per SF: | $74.93 | ||||
| Loan Purpose: | Refinance | Maturity Date Balance Per SF: | $63.56 | ||||
| Borrower Sponsor: | Gavriel Alexander | Year Built/Renovated: | 1901/2018 | ||||
| Guarantors: | Gavriel Alexander | Title Vesting: | Fee | ||||
| Mortgage Rate: | 4.2500% | Property Manager: | Ander Properties LLC (borrower-related) | ||||
| Note Date: | July 22, 2019 | Current Occupancy (As of): | 96.3% (7/10/2019) | ||||
| Seasoning: | 0 months | YE 2018 Occupancy: | 95.5% | ||||
| Maturity Date: | August 6, 2029 | YE 2017 Occupancy(2): | NAV | ||||
| IO Period: | 24 months | YE 2016 Occupancy(2): | NAV | ||||
| Loan Term (Original): | 120 months | ||||||
| Amortization Term (Original): | 360 months | Appraised Value: | $42,000,000 | ||||
| Loan Amortization Type: | Interest-only, Amortizing Balloon | Appraised Value Per SF: | $110.43 | ||||
| Call Protection: | L(24),D(91),O(5) | Appraisal Valuation Date: | June 13, 2019 | ||||
| Lockbox Type: | Soft/Springing Cash Management | Underwriting and Financial Information | |||||
| Additional Debt: | None | TTM NOI (5/31/2019): | $2,315,339 | ||||
| Additional Debt Type (Balance): | NAP | YE 2018 NOI(2): | NAV | ||||
| YE 2017 NOI: | $1,540,863 | ||||||
| YE 2016 NOI: | $1,522,326 | ||||||
| U/W Revenues: | $3,608,515 | ||||||
| Escrows and Reserves | U/W Expenses: | $1,146,398 | |||||
| Initial | Monthly | Cap | U/W NOI: | $2,462,117 | |||
| Taxes | $76,165 | $30,466 | NAP | U/W NCF: | $2,327,624 | ||
| Insurance | $37,565 | $12,522 | NAP | U/W DSCR based on NOI/NCF(3): | 1.49x / 1.41x | ||
| Replacement Reserve | $0 | $6,339 | NAP | U/W Debt Yield based on NOI/NCF(3): | 8.8% / 8.3% | ||
| TI/LC Reserve | $785,000 | $0(1) | $785,000 | U/W Debt Yield at Maturity based on NOI/NCF(3): | 10.2% / 9.6% | ||
| Immediate Repairs Reserve | $18,750 | $0 | NAP | Cut-off Date LTV Ratio(3): | 66.4% | ||
| Debt Yield Holdback Reserve | $600,000 | $0 | NAP | LTV Ratio at Maturity(3): | 56.1% | ||
| Sources and Uses | ||||||
| Sources | Uses | |||||
| Original loan amount | $28,500,000 | 100.0% | Loan Payoff | $19,468,683 | 68.3% | |
| Return of Equity | 7,003,519 | 24.9 | ||||
| Upfront reserves | 1,517,479 | 5.3 | ||||
| Closing costs | 510,319 | 1.7 | ||||
| Total Sources | $28,500,000 | 100.0% | Total Uses | $28,500,000 | 100.0% | |
| (1) | The borrower is required to commence ongoing TI/LC monthly deposits of $7,924 if the balance of the reserve drops below $500,000. In addition, the borrower is required to deposit an amount equal to the difference between the then reserve balance and $785,000 if the balance of the reserve is below $785,000 on the payment date occurring in July 2026. |
| (2) | Historical Occupancy and 2018 financials are not available as the previous owner did not provide the borrower sponsor with this information when the borrower sponsor acquired the Mahwah Business Park Property (as defined below) in May 2018. |
| (3) | U/W DSCR based on NOI/NCF, U/W Debt Yield based on NOI/NCF, U/W Debt Yield at Maturity based on NOI/NCF, Cut-off Date LTV Ratio, and LTV Ratio at Maturity are calculated net of the $600,000 holdback reserve. U/W DSCR based on NOI/NCF, U/W Debt Yield based on NOI/NCF, U/W Debt Yield at Maturity based on NOI/NCF, Cut-off Date LTV Ratio, and LTV Ratio at Maturity without the reserve would be 1.46x/1.38x, 8.6%/8.2%, 10.2%/9.6%, 67.9%, and 57.6%, respectively. |
The Mortgage Loan.The mortgage loan (the “Mahwah Business Park Mortgage Loan”) is evidenced by a single promissory note secured by a first mortgage encumbering the borrower’s fee interest in an industrial flex property located in Mahwah, New Jersey (the “Mahwah Business Park Property”). The proceeds of the Mahwah Business Park Mortgage Loan were primarily used to refinance a previous loan in the amount of $19.5 million, fund reserves, and pay closing costs.
The Borrower and the Borrower Sponsor. The borrower is Mahwah BP LLC, (the “Mahwah Business Park Borrower”), a single-purpose New Jersey limited liability company with one independent director. Gavriel Alexander will serve as the non-recourse carve-out guarantor.
THE INFORMATION IN THIS STRUCTURAL AND COLLATERAL TERM SHEET IS NOT COMPLETE AND MAY BE AMENDED PRIOR TO THE TIME OF SALE. THIS TERM SHEET IS NOT AN OFFER TO SELL THESE SECURITIES AND IT IS NOT A SOLICITATION OF AN OFFER TO BUY THESE SECURITIES IN ANY JURISDICTION WHERE THE OFFER OR SALE IS NOT PERMITTED.
128
| Industrial – Flex | Loan #10 | Cut-off Date Balance: | $28,500,000 | |
| 37-73 Ramapo Valley Road | Mahwah Business Park | Cut-off Date LTV: | 66.4% | |
| Mahwah, NJ 07430 | U/W NCF DSCR: | 1.41x | ||
| U/W NOI Debt Yield: | 8.8% |
Gavriel Alexander is the owner and manager of Alexander Property Holdings, LLC, a full service real estate development group offering a complete range of services. Mr. Alexander has over 20 years of experience within the park real estate industry and is currently responsible for managing 2,000 multifamily units and 2.5 million square feet of commercial, industrial and retail properties.
The Property. The Mahwah Business Park Property is located proximate to the intersection of I-287, State Route 17, and the New York State Thruway (I-87). The Mahwah Business Park Property is comprised of 17 buildings, ranging from one to three stories totaling 380,346 square feet of industrial space (83.0% of net rentable area) and office space (17.0% of net rentable area). The Mahwah Business Park Property was constructed in 1901 and most recently renovated in 2018. The Mahwah Business Park Property is situated on a 39.5-acre site, divided by the Ramapo Valley River which runs through the center in a north-south direction. Since May 2018, the Mahwah Business Park Property has undergone approximately $2.5 million in renovations including remodeling, exterior painting, landscaping, signage, security, parking lot repairs, and engineering costs. Since the borrower sponsor’s acquisition of the Mahwah Business Park Property in May 2018, he executed new and renewal leases on 43,553 square feet or 11.5% of net rentable area.
Included as part of the collateral of the Mahwah Business Park Mortgage Loan is an 11,920 square feet vacant building (“Building #59”) which the borrower sponsor intends to demolish, as such, it has been excluded from our analysis (net rentable area square footage, underwritten cash flow, and appraised value).
Major Tenants.The Mahwah Business Park Property is currently 96.3% occupied by 45 tenants with an average remaining lease term of approximately 5.75 years. The five largest tenants occupy 71.6% of the total net rentable area and have an average remaining lease term of 6.7 years.
Extra Space Storage (97,328 square feet, 25.6% of net rentable area, 10/31/2026 lease expiration (490 SF expire on 9/30/2025), S&P rated BBB), is the second largest operator of self-storage facilities in the United States. The company was founded in 1977 and has spread throughout 38 states with 1,400 stores comprising of approximately 910,000 individual storage units. Extra Space Storage operates storage units on-site and has been a tenant at the Mahwah Business Park Property since 1996 when it commenced its initial 30-year lease. The lease provides for five, ten year renewal options and no termination options.
Acupac (93,241 square feet, 24.5% of net rentable area, 11/30/2026 lease expiration, S&P rated B),specializes in designing and manufacturing products and delivery systems for single-use applications. Acupac was acquired by KDC/ONE network in 2015 and has been a tenant at the Mahwah Business Park Property since 1997 when it commenced its initial ten year lease on 62,900 square feet. The tenant has renewed and expanded two times at the Mahwah Business Park Property. The lease does not provide for termination options and there are no renewal options remaining.
Industrial Crating (33,746 square feet, 8.9% of net rentable area, 9/30/2026 lease expiration for 18,746 SF and 3/31/2030 lease expiration for 15,000 SF), a privately owned, full service rigging organization provides export, domestic packaging, warehouse and transportation services since 1977. Industrial Crating has been a tenant at the Mahwah Business Park Property since 1996 when it commenced its initial 30-year lease on 18,746 square feet. The lease does not provide for termination options and there are no renewal options remaining.
MSN Services (29,475 square feet, 7.7% of net rentable area, 4/30/2023 lease expiration), is a carwash and automotive repair firm which has been in operation since approximately 2012. MSN Services has been a tenant at the Mahwah Business Park Property since January 2018 when it commenced its initial 64-month lease on 29,475 square feet. The lease provides for one, five year renewal option and one conditional termination option.
Paulist Press (18,600 square feet, 4.9% of net rentable area, 6/30/2021 lease expiration), is a Catholic faith and culture literature publisher which has been in operation since 1865. Paulist Press’ editorial, business, marketing and distribution offices have been located at the Mahwah Business Park Property since 1985. Paulist Press has been a tenant at the Mahwah Business Park Property since April 1997. The lease does not provide for termination options and there are no renewal options remaining.
THE INFORMATION IN THIS STRUCTURAL AND COLLATERAL TERM SHEET IS NOT COMPLETE AND MAY BE AMENDED PRIOR TO THE TIME OF SALE. THIS TERM SHEET IS NOT AN OFFER TO SELL THESE SECURITIES AND IT IS NOT A SOLICITATION OF AN OFFER TO BUY THESE SECURITIES IN ANY JURISDICTION WHERE THE OFFER OR SALE IS NOT PERMITTED.
129
| Industrial – Flex | Loan #10 | Cut-off Date Balance: | $28,500,000 | |
| 37-73 Ramapo Valley Road | Mahwah Business Park | Cut-off Date LTV: | 66.4% | |
| Mahwah, NJ 07430 | U/W NCF DSCR: | 1.41x | ||
| U/W NOI Debt Yield: | 8.8% |
The following table presents certain information relating to the tenancy at the Mahwah Business Park Property:
Major Tenants(1)
| Tenant Name | Credit Rating (Fitch/Moody’s/ | Tenant NRSF | % of NRSF | Annual U/W Base Rent PSF(2) | Annual U/W Base Rent(2) | % of Total Annual U/W Base Rent(2) | Lease Expiration Date | Extension Options | Termination Option (Y/N) |
| Major Tenants | |||||||||
| Extra Space | NR/NR/BBB | 97,328 | 25.6% | $3.76 | $365,878 | 13.2% | 10/31/2026(3) | 5, 10-year | N |
| Acupac | NR/NR/B | 93,241 | 24.5% | $6.45 | $601,733 | 19.2% | 11/30/2026 | None | N |
| Industrial Crating | NR/NR/NR | 33,746 | 8.9% | $3.99 | $134,748 | 4.8% | 9/30/2026(4) | None | N |
| MSN Services | NR/NR/NR | 29,475 | 7.7% | $9.94 | $293,027 | 10.5% | 4/30/2023 | 1, 5-year | Y(5) |
| Paulist Press | NR/NR/NR | 18,600 | 4.9% | $6.12 | $113,832 | 4.1% | 6/30/2021 | None | N |
| Total Major Tenants | 272,390 | 71.6% | $5.54 | $1,509,217 | 54.2% | ||||
| Other Tenant | 93,703 | 24.6% | $13.58 | $1,272,926 | 45.8% | ||||
| Occupied Collateral | 366,093 | 96.3% | $7.60 | $2,782,144 | 100.0% | ||||
| Vacant Space | 14,253 | 3.7% | |||||||
| Collateral Total | 380,346 | 100.0% | |||||||
| (1) | Information obtained from the underwritten rent roll. |
| (2) | Annual U/W Base Rent PSF, Annual U/W Base Rent, and % of Total Annual U/W Base Rent includes rent steps but does not include recovery income. |
| (3) | 96,838 SF expire on 10/31/2026 and 490 SF expire on 9/30/2025. |
| (4) | 18,746 SF expire on 9/30/2026 and 15,000 SF expire on 3/31/2030. |
| (5) | If at any time during the lease term the tenant is required by law to either install a sprinkler system or make improvements to an existing sprinkler system, and landlord does not elect to either reimburse tenant or assume the responsibility and cost of the installation, tenant has the right to terminate the lease. |
The following table presents certain information relating to the lease rollover schedule at the Mahwah Business Park Property:
Lease Expiration Schedule(1)
| Year Ending December 31, | No. of Leases Expiring | Expiring NRSF | % of Total NRSF | Cumulative Expiring NRSF | Cumulative % of Total NRSF | Annual U/W Base Rent(2) | % of Total Annual U/W Base Rent(2) | Annual U/W Base Rent PSF(2)(3) |
| MTM | 2 | 586 | 0.2% | 586 | 0.2% | $30,920 | 1.1% | $52.76 |
| 2019 | 3 | 4,649 | 1.2% | 5,235 | 1.4% | $77,781 | 2.8% | $16.73 |
| 2020 | 8 | 18,995 | 5.0% | 24,230 | 6.4% | $227,677 | 8.2% | $11.99 |
| 2021 | 10 | 31,428 | 8.3% | 55,658 | 14.6% | $466,044 | 16.8% | $14.83 |
| 2022 | 4 | 3,206 | 0.8% | 58,864 | 15.5% | $59,558 | 2.1% | $18.58 |
| 2023 | 11 | 72,951 | 19.2% | 131,815 | 34.7% | $708,698 | 25.5% | $9.71 |
| 2024 | 5 | 9,963 | 2.6% | 141,778 | 37.3% | $109,107 | 3.9% | $10.95 |
| 2025 | 1 | 490 | 0.1% | 142,268 | 37.4% | $13,068 | 0.5% | $26.67 |
| 2026 | 4 | 208,825 | 54.9% | 351,093 | 92.3% | $1,029,395 | 37.0% | $4.93 |
| 2027 | 0 | 0 | 0.0% | 351,093 | 92.3% | $0 | 0.0% | $0.00 |
| 2028 | 0 | 0 | 0.0% | 351,093 | 92.3% | $0 | 0.0% | $0.00 |
| 2029 | 0 | 0 | 0.0% | 351,093 | 92.3% | $0 | 0.0% | $0.00 |
| Thereafter | 1 | 15,000 | 3.9% | 366,093 | 96.3% | $59,895 | 2.2% | $3.99 |
| Vacant | 0 | 14,253 | 3.7% | 380,346 | 100.0% | $0 | 0.0% | $0.00 |
| Total/Weighted Average | 49 | 380,346 | 100.0% | $2,782,144 | 100.0% | $7.60 |
| (1) | Information obtained from the underwritten rent roll. |
| (2) | Annual U/W Base Rent, % of Total Annual U/W Base Rent, and Annual U/W Base Rent PSF includes rent steps but does not include recovery income. |
| (3) | Annual U/W Base Rent PSF does not include vacant space. |
THE INFORMATION IN THIS STRUCTURAL AND COLLATERAL TERM SHEET IS NOT COMPLETE AND MAY BE AMENDED PRIOR TO THE TIME OF SALE. THIS TERM SHEET IS NOT AN OFFER TO SELL THESE SECURITIES AND IT IS NOT A SOLICITATION OF AN OFFER TO BUY THESE SECURITIES IN ANY JURISDICTION WHERE THE OFFER OR SALE IS NOT PERMITTED.
130
| Industrial – Flex | Loan #10 | Cut-off Date Balance: | $28,500,000 | |
| 37-73 Ramapo Valley Road | Mahwah Business Park | Cut-off Date LTV: | 66.4% | |
| Mahwah, NJ 07430 | U/W NCF DSCR: | 1.41x | ||
| U/W NOI Debt Yield: | 8.8% |
The following table presents historical occupancy percentages at the Mahwah Business Park Property:
Historical Occupancy
12/31/2016(1) | 12/31/2017(1) | 12/31/2018 | 7/10/2019(1) |
| NAV | NAV | 95.5% | 96.3% |
| (1) | The borrower sponsor acquired the Mahwah Business Park Property in May 2018 thus historical occupancy information is not available. |
| (2) | Information obtained from underwritten rent roll. |
Operating History and Underwritten Net Cash Flow. The following table presents certain information relating to the historical operating statements and underwritten net cash flow at the Mahwah Business Park Property:
Cash Flow Analysis
| 2016 | 2017 | TTM 5/31/2019 | U/W | %(1) | U/W $ per SF | |
| Rents in Place | $1,904,189 | $1,945,845 | $2,520,353 | $2,754,193 | 70.6% | $7.24 |
| Contractual Rent Steps | 0 | 0 | 0 | 27,951 | 0.7 | 0.07 |
| Grossed Up Vacant Space | 0 | 0 | 0 | 204,482 | 5.2 | 0.54 |
| Gross Potential Rent | $1,904,189 | $1,945,845 | $2,520,353 | $2,986,625 | 76.6% | $7.85 |
| Total Recoveries | 558,638 | 564,118 | 772,780 | 914,472 | 23.4 | 2.40 |
| Net Rental Income | $2,462,827 | $2,509,963 | $3,293,134 | $3,901,098 | 100.0% | $10.26 |
| Other Income | 115,049 | 76,513 | 92,317 | 0 | 0.0 | 0.00 |
| (Vacancy & Credit Loss) | 0 | 0 | 0 | (292,582)(2) | (7.5) | (0.77) |
| Effective Gross Income | $2,577,876 | $2,586,476 | $3,385,451 | $3,608,515 | 92.5% | $9.49 |
| Real Estate Taxes | 316,104 | 330,410 | 340,033 | 365,590 | 10.1 | 0.96 |
| Insurance | 155,228 | 107,339 | 51,903 | 120,000 | 3.3 | 0.32 |
| Management Fee | 76,443 | 77,610 | 125,623 | 108,255 | 3.0 | 0.28 |
| Other Operating Expenses | 507,775 | 530,254 | 552,553 | 552,553 | 15.3 | 1.45 |
| Total Operating Expenses | $1,055,550 | $1,045,613 | $1,070,111 | $1,146,398 | 31.8% | $3.01 |
| Net Operating Income | $1,522,326 | $1,540,863(3) | $2,315,339 | $2,462,117(3) | 68.2% | $6.47 |
| Replacement Reserves | 0 | 0 | 0 | 57,052 | 1.6 | 0.15 |
| TI/LC | 0 | 0 | 3,085 | 77,442 | 2.1 | 0.20 |
| Net Cash Flow | $1,522,326 | $1,540,863 | $2,312,254 | $2,327,624 | 64.5% | $6.12 |
| NOI DSCR | 0.90x | 0.92x | 1.38x | 1.49x(4) | ||
| NCF DSCR | 0.90x | 0.92x | 1.37x | 1.41x(4) | ||
| NOI Debt Yield | 5.3% | 5.4% | 8.1% | 8.8%(4) | ||
| NCF Debt Yield | 5.3% | 5.4% | 8.1% | 8.3%(4) |
| (1) | Represents (i) percent of Net Rental Income for all revenue fields, (ii) percent of Gross Potential Rent for Vacancy & Credit Loss and (iii) percent of Effective Gross Income for all other fields. |
| (2) | The underwritten vacancy is 7.5%. The Mahwah Business Park Property was 96.3% leased as of July 10, 2019. |
| (3) | The difference between 2017 and U/W Net Operating Income is primarily due to increase in occupancy and renewal of tenants at higher rents. Since the borrower sponsor’s acquisition of the Mahwah Business Park Property in May 2018, he executed new and renewal leases on 43,553 square feet or 11.5% of net rentable area. |
| (4) | U/W DSCR based on NOI/NCF and U/W Debt Yield based on NOI/NCF are calculated net of the $600,000 holdback reserve. U/W DSCR based on NOI/NCF and U/W Debt Yield based on NOI/NCF, without the reserve would be 1.46x/1.38x, 8.6%/8.2%, respectively. |
Appraisal. The appraiser concluded to an “as-is” Appraised Value for the Mahwah Business Park Property of $42,000,000 as of June 13, 2019.
Environmental Matters. The Phase I environmental site assessment dated June 20, 2019 identified certain controlled recognized environmental conditions in connection with: (i) a historical fire at a former foundry building at the Mahwah Business Park Property, which resulted in an impact to 695 cubic yards of previously impacted soils, managed under deed restrictions; (ii) the historical use of the Mahwah Business Park Property as a brake shoe manufacturer, foundry and landfill; and (iii) the removal of 21 underground storage tanks from the Mahwah Business Park Property. The related environmental consultant reported that engineering controls are in place with respect to each controlled recognized environmental condition and recommended no further action. The Mahwah Business Park Mortgage Loan documents require the borrower to comply in all material respects with, among other things, certain deed restrictions and engineering controls. See “Description of the Mortgage Pool—Environmental Considerations” in the Preliminary Prospectus. The implementation of an asbestos O&M plan was also recommended for the Mahwah Business Park Property.
THE INFORMATION IN THIS STRUCTURAL AND COLLATERAL TERM SHEET IS NOT COMPLETE AND MAY BE AMENDED PRIOR TO THE TIME OF SALE. THIS TERM SHEET IS NOT AN OFFER TO SELL THESE SECURITIES AND IT IS NOT A SOLICITATION OF AN OFFER TO BUY THESE SECURITIES IN ANY JURISDICTION WHERE THE OFFER OR SALE IS NOT PERMITTED.
131
| Industrial – Flex | Loan #10 | Cut-off Date Balance: | $28,500,000 | |
| 37-73 Ramapo Valley Road | Mahwah Business Park | Cut-off Date LTV: | 66.4% | |
| Mahwah, NJ 07430 | U/W NCF DSCR: | 1.41x | ||
| U/W NOI Debt Yield: | 8.8% |
Market Overview.The Mahwah Business Park Property is located in the Township of Mahwah in the north-west portion of Bergen County and forms part of the New York-Jersey City-White Plains NY-NJ metro area (“New York MSA”). The Mahwah Business Park Property is approximately 25 miles northwest of New York City and benefits from its proximity to major arterials including, the intersection of I-287, State Route 17, and the New York State Thruway. State Route 17 is a major commercial thoroughfare that traverses northeast-southeast and is improved with various types of retail uses. Public transportation is provided by New Jersey Transit and provides access to most areas in New Jersey as well as New York City. The Newark Liberty International Airport is located approximately 40 miles from the Mahwah Business Park Property.
Within the immediate vicinity of the Mahwah Business Park Property, the predominant uses are industrial and office. Industrial use by the number of properties account for 15% and office properties account for 22%. According to the appraisal, during the last couple of years, development has been limited, consisting predominately of the redevelopment of existing uses with residential infill.
According to the appraisal, the estimated 2018 population within a one-, three-, and five-mile radius of the Mahwah Business Park Property was 11,930, 48,094, and 126,869, respectively; and the estimated 2018 average household income within the same radii was $120,521, $146,941, and $150,253, respectively.
According to the appraisal, the Mahwah Business Park Property is situated within the North Bergen submarket of the Northern New Jersey industrial market. As of the first quarter of 2019, the submarket reported a total inventory of approximately 16.8 million square feet of industrial space with a 5.6% vacancy rate and an average asking rental rate of $9.36 per square foot, on a triple net basis. The appraiser concluded to a market rent for the industrial space at the Mahwah Business Park Property of $7.90 per square foot, on a triple net basis. The appraiser noted a smaller 31,824 square foot industrial building is proposed in the subject market.
According to the appraisal, the Mahwah Business Park Property is situated within the Route 17 corridor submarket of the Northern New Jersey office market. As of the first quarter of 2019, the submarket reported a total inventory of approximately 4.7 million square feet of office space with a 6.1% vacancy rate and an average asking rental rate of $23.39 per square foot, on a gross basis. The appraiser concluded to a market rent for the office space at the Mahwah Business Park Property of $23.49 per square foot, on a gross basis.
The following table presents certain information relating to comparable industrial and office leases for the Mahwah Business Park Property:
Comparable Leases (Industrial)(1)
| Property Name/Address | Year Built/ Renovated | NRA | Submarket | Lease Type | Tenant Names | Lease Date | Lease Term | Annual Base Rent PSF |
Mahwah Business Park 37-73 Ramapo Valley Road Mahwah, NJ (Subject) | 1901/2018(2) | 315,820(2) | Bergen Northwest(2) | Various(2) | Various(2) | Various(2) | Various(2) | $5.87(3) |
150 Franklin Turnpike 150 Franklin Turnpike, Waldwick, NJ | 1953/NAP | 64,000 | Bergen Northwest | Triple Net | Undisclosed | Feb-19 | 60 | $8.00 |
50 Railroad Avenue 50 Railroad Avenue, Closter, NJ | 1959/NAP | 70,000 | Bergen Northeast | Triple Net | Homewood Distribution | Oct-18 | 36 | $8.25 |
Reuten Corporate Park 7 Reuten Drive, Closter, NJ | 1985/NAP | 48,200 | Bergen Northeast | Triple Net | Undisclosed Tenant | Sep-18 | 60 | $7.50 |
18 Industrial Avenue 18 Industrial Avenue, Mahwah, NJ | 1965/NAP | 52,000 | Bergen Northwest | Triple Net | Li | Feb-18 | 84 | $7.75 |
60 Whitney Road 60 Whitney Road, Mahwah, NJ | 2007/NAP | 32,000 | Bergen Northeast | Triple Net | Albright Electric Co. | Feb-17 | 60 | $7.00 |
| (1) | Information obtained from the appraisal. |
| (2) | Information obtained from the underwritten rent roll. |
| (3) | Annual Base Rent PSF excludes vacant space. |
THE INFORMATION IN THIS STRUCTURAL AND COLLATERAL TERM SHEET IS NOT COMPLETE AND MAY BE AMENDED PRIOR TO THE TIME OF SALE. THIS TERM SHEET IS NOT AN OFFER TO SELL THESE SECURITIES AND IT IS NOT A SOLICITATION OF AN OFFER TO BUY THESE SECURITIES IN ANY JURISDICTION WHERE THE OFFER OR SALE IS NOT PERMITTED.
132
| Industrial – Flex | Loan #10 | Cut-off Date Balance: | $28,500,000 | |
| 37-73 Ramapo Valley Road | Mahwah Business Park | Cut-off Date LTV: | 66.4% | |
| Mahwah, NJ 07430 | U/W NCF DSCR: | 1.41x | ||
| U/W NOI Debt Yield: | 8.8% |
Comparable Leases (Office)(1)
| Property Name/Address | Year Built/ Renovated | NRA | Submarket | Lease Type | Tenant Names | Lease Date | Lease Term (Months) | Annual Base Rent PSF |
Mahwah Business Park 37-73 Ramapo Valley Road Mahwah, NJ (Subject) | 1901/2018(2) | 64,526(2) | Bergen Northwest(2) | Various(2) | Various(2) | Various(2) | Various(2) | $14.57(3) |
Ramsey Investments 70 Hilltop Road Ramsey, NJ | 1984/NAP | 47,874 | Bergen North | Gross + TE | The Gifted Child Society | Jul-19 | 60 | $20.00 |
1 Maynard Drive 1 Maynard Drive Park Ridge, NJ | 1986/NAP | 135,840 | Bergen North | Gross + TE | Park Ridge Wealth | Jul-18 | 72 | $24.00 |
Montvale Office Park 1 Paragon Drive Montvale, NJ | 1980/NAP | 107,000 | Bergen North | Gross + TE | Investment Casting | May-18 | 92 | $22.50 |
860 Wyckoff Avenue 860 Wyckoff Avenue Mahwah, NJ | 1990/NAP | 32,589 | Bergen North | Gross + TE | Confidential | Sep-17 | 60 | $21.00 |
| (1) | Information obtained from the appraisal. |
| (2) | Information obtained from the underwritten rent roll. |
| (3) | Annual Base Rent PSF excludes vacant space. |
Escrows.
Real Estate Taxes – The Mahwah Business Park Mortgage Loan documents require an upfront real estate tax reserve in the amount of $76,165, and an ongoing monthly real estate tax reserves in an amount equal to one-twelfth of the real estate taxes that the lender estimates will be payable during the next twelve months (initially $30,466).
Insurance – The Mahwah Business Park Mortgage Loan documents require an upfront insurance reserve of $37,565 and ongoing monthly insurance reserves in an amount equal to one-twelfth of the insurance premiums that the lender estimates will be payable during the next twelve months (initially $12,522).
Replacement Reserve – The Mahwah Business Park Mortgage Loan documents require ongoing monthly replacement reserves in an amount equal to one-twelfth of $0.20 per square foot (currently $6,339).
TI/LC Reserve – The Mahwah Business Park Mortgage Loan documents require an upfront TI/LC reserve totaling $785,000. The Mahwah Business Park Borrower is required to commence ongoing TI/LC monthly deposits of $7,924 if the balance of the reserve drops below $500,000. In addition, the borrower is required to deposit an amount equal to the difference between the then current reserve balance and $785,000 if the balance of the reserve is below $785,000 on the payment date occurring in July 2026.
Immediate Repairs Reserve –The Mahwah Business Park Mortgage Loan documents require an upfront reserve of $18,750 for immediate repairs, which is 125% of the amount recommended by the property engineering reports dated June 20, 2019.
Debt Yield Holdback Reserve - The Mahwah Business Park Mortgage Loan documents require an upfront holdback in the amount of $600,000 to be released at any time from and after the payment date occurring in January 2020 once the following conditions are satisfied among other things: (i) a minimum net operating income debt yield of 8.25% for two consecutive calendar calculation dates, based on a loan amount equal to $28,500,000; and (ii) no event of default or cash management period has occurred or is continuing. If the holdback has not been released by July 22, 2022, the lender must apply the unreleased proceeds to pay down the loan, accompanied by the applicable yield maintenance premium to be paid by the borrower.
Lockbox and Cash Management.The Mahwah Business Park Mortgage Loan is structured with a soft lockbox and springing cash management. Provided no Cash Management Period (as defined below) is in effect, all funds in the lockbox account are required to be transferred to an account controlled by the borrower. During the occurrence and continuance of a Cash Management Period, all funds in the lockbox are required to be swept on each business day into the cash management account controlled by the lender and disbursed on each payment date in accordance with the Mahwah Business Park Mortgage Loan documents, with all excess cash flow to be deposited to an excess cash reserve to be held as additional security for the Mahwah Business Park Mortgage Loan.
A “Cash Management Period” will commence following the earliest to occur of:
| (i) | an event of default under the Mahwah Business Park Mortgage Loan; |
| (ii) | the debt service coverage ratio falling below 1.20x (on an amortizing basis); |
| (iii) | the debt yield being below 8.0%; |
| (iv) | the occupancy falling below 85.0% (excluding the square footage of Building #59); or |
| (v) | the commencement of a Lease Sweep Period (as defined below). |
THE INFORMATION IN THIS STRUCTURAL AND COLLATERAL TERM SHEET IS NOT COMPLETE AND MAY BE AMENDED PRIOR TO THE TIME OF SALE. THIS TERM SHEET IS NOT AN OFFER TO SELL THESE SECURITIES AND IT IS NOT A SOLICITATION OF AN OFFER TO BUY THESE SECURITIES IN ANY JURISDICTION WHERE THE OFFER OR SALE IS NOT PERMITTED.
133
| Industrial – Flex | Loan #10 | Cut-off Date Balance: | $28,500,000 | |
| 37-73 Ramapo Valley Road | Mahwah Business Park | Cut-off Date LTV: | 66.4% | |
| Mahwah, NJ 07430 | U/W NCF DSCR: | 1.41x | ||
| U/W NOI Debt Yield: | 8.8% |
A Cash Management Period will end if:
| (a) | with respect to clause (i) above, such event of default has been cured and no other event of default has occurred and is continuing; |
| (b) | with respect to clause (ii) above, the Mahwah Business Park Property has achieved a debt service coverage ratio of at least 1.25x (on an amortizing basis) for two consecutive calendar quarters; |
| (c) | with respect to clause (iii) above, the Mahwah Business Park Property has achieved a debt yield of at least 8.5% for two consecutive calendar quarters; |
| (d) | with respect to clause (iv) above, the Mahwah Business Park Property has achieved an occupancy of 85.0% or above for two consecutive calendar quarters except for the last 12 months of the loan term which requires an occupancy of 90.0% (in each case, expressly excluding the square footage of Building #59); or |
| (e) | with respect to clause (v) above, such Lease Sweep Period has ended. |
A “Lease Sweep Period” will commence upon the occurrence of any of the following:
| (i) | the commencement of a Major Lease Expiration Period (as defined below) or the occurrence of the date that is 12 months prior to the end of the term of any Combined Tenant Lease (as defined below) (including any renewal terms); |
| (ii) | the earlier of (a) the date required under a Major Lease or Combined Tenant Lease by which the applicable Major Tenant (as defined below) or Combined Tenant (as defined below) is required to give notice of its exercise of a renewal option thereunder (and such renewal has not been so exercised) or (b) the date the applicable Major Tenant or applicable Combined Tenant gives notice of its intention not to renew or extend; |
| (iii) | any Major Lease (or any material portion thereof) or any Combined Tenant Lease (or any material portion thereof) being surrendered, cancelled or terminated prior to its then current expiration date; |
| (iv) | any Major Tenant discontinuing or giving notice to discontinue its business in its leased premises (i.e., “goes dark”); |
| (v) | the occurrence and continuance (beyond any applicable notice and cure periods) of a default under any Major Lease or any Combined Lease by the applicable Major Tenant or applicable Combined Tenants thereunder; or |
| (vi) | the occurrence of a Major Tenant insolvency proceeding or Combined Tenant insolvency proceeding. |
A Lease Sweep Period will end upon the occurrence of any of the following:
| (1) | with respect to clauses (i), (ii), (iii) or (iv) above, the earlier to occur of (A) the date on which the subject Major Tenant or Combined Tenant, as applicable, irrevocably exercises its renewal or extension option (or otherwise enters into an extension agreement with the Mahwah Business Park Borrower and acceptable to the lender) with respect to all of the space demised under its Major Lease or Combined Tenant Lease, as applicable, and in the lender’s judgment, sufficient funds have been accumulated in the special rollover reserve (during the continuance of the subject Lease Sweep Period) to pay for all anticipated approved major leasing expenses as defined in the Mahwah Business Park Mortgage Loan documents for such Major Lease or Combined Tenant Lease, as applicable, and any other anticipated expenses in connection with such renewal or extension, or (B) the date on which all of the space demised under the subject Major Lease (or portion thereof) or Combined Tenant Lease, as applicable, that gave rise to the subject Lease Sweep Period has been fully leased pursuant to a replacement lease or replacement leases approved by the lender, and entered into in accordance with Mahwah Business Park Mortgage Loan documents, and all lender approved major leasing expenses (and any other expenses in connection with re-tenanting of such space) have been paid in full; |
| (2) | with respect to clause (v) above, the subject Major Tenant or Combined Tenant default having been cured, and no other Major Tenant or Combined Tenant default having occurred for a period of 6 consecutive months following such cure; or |
| (3) | with respect to clause (vi) above, the applicable Major Tenant insolvency proceeding or applicable Combined Tenant insolvency proceeding having terminated and the applicable Major Lease or applicable Combined Tenant Lease having been affirmed, assumed or assigned in a manner satisfactory to the lender. |
“Combined Tenant” means, collectively, those tenants under any Combined Tenant Lease.
“Combined Tenant Lease” means leases which in the aggregate and for a period of at least three (3) months (i) cover 15% or more of the rentable square feet of the Improvements, or (ii) have a gross annual rent of 15% or more of the total annual rents of the Mahwah Business Park Property.
“Major Lease” means any lease (A) which covers 10% or more rentable square feet of the improvements, (B) which represents 10% or more of the annual gross revenue from the Mahwah Business Park Property, or (C) which demises at least one full floor of the improvements.
“Major Lease Expiration Period” means a period (A) commencing as of the date that is 12 months prior to the end of the term of any Major Lease (including any renewal terms) and (B) expiring as of the first to occur of (1) the applicable Major Tenant irrevocably exercising its renewal or extension option in writing (or otherwise entering into an extension agreement with the Mahwah Business Park Borrower and acceptable to the lender) with respect to all of the space demised under its Major Lease, (2) the applicable Major Tenant notifying the Mahwah Business Park Borrower that it is not renewing or extending the term of its Major Lease or (3) the applicable Major Lease expiring in accordance with its terms.
“Major Tenant” means any tenant under either a Major Lease or a Combined Tenant Lease.
THE INFORMATION IN THIS STRUCTURAL AND COLLATERAL TERM SHEET IS NOT COMPLETE AND MAY BE AMENDED PRIOR TO THE TIME OF SALE. THIS TERM SHEET IS NOT AN OFFER TO SELL THESE SECURITIES AND IT IS NOT A SOLICITATION OF AN OFFER TO BUY THESE SECURITIES IN ANY JURISDICTION WHERE THE OFFER OR SALE IS NOT PERMITTED.
134
| Industrial – Flex | Loan #10 | Cut-off Date Balance: | $28,500,000 | |
| 37-73 Ramapo Valley Road | Mahwah Business Park | Cut-off Date LTV: | 66.4% | |
| Mahwah, NJ 07430 | U/W NCF DSCR: | 1.41x | ||
| U/W NOI Debt Yield: | 8.8% |
Property Management. The Mahwah Business Park Property is self-managed by Ander Properties LLC, an affiliate of the borrower sponsor.
Partial Defeasance and Partial Release. Not permitted.
Real Estate Substitution.Not permitted.
Subordinate and Mezzanine Indebtedness.Not permitted.
Ground Lease. None.
Terrorism Insurance.The Mahwah Business Park Mortgage Loan documents require that the “all risk” insurance policy required to be maintained by the borrower provides coverage for terrorism in an amount equal to the full replacement cost of the Mahwah Business Park Property, as well as business interruption insurance covering no less than the 18-month period following the occurrence of a casualty event, together with a 6-month extended period of indemnity.
THE INFORMATION IN THIS STRUCTURAL AND COLLATERAL TERM SHEET IS NOT COMPLETE AND MAY BE AMENDED PRIOR TO THE TIME OF SALE. THIS TERM SHEET IS NOT AN OFFER TO SELL THESE SECURITIES AND IT IS NOT A SOLICITATION OF AN OFFER TO BUY THESE SECURITIES IN ANY JURISDICTION WHERE THE OFFER OR SALE IS NOT PERMITTED.
135
| No. 11 – Sequa Corporation Industrial Portfolio | |||||||
| Mortgage Loan Information | Mortgaged Property Information | ||||||
| Mortgage Loan Seller: | Wells Fargo Bank, National Association | Single Asset/Portfolio: | Portfolio | ||||
Credit Assessment (Fitch/KBRA/Moody’s): | NR/NR/NR | Property Type – Subtype: | Industrial – Manufacturing | ||||
| Original Principal Balance: | $27,100,000 | Location: | Various – See Table | ||||
| Cut-off Date Balance: | $27,100,000 | Size: | 600,917 SF | ||||
| % of Initial Pool Balance: | 3.0% | Cut-off Date Balance Per SF: | $45.10 | ||||
| Loan Purpose: | Acquisition | Maturity Date Balance Per SF: | $40.92 | ||||
| Borrower Sponsors: | AG Net Lease III Corp.; AG Net Lease III (SO) Corp. | Year Built/Renovated: | Various – See Table | ||||
| Guarantors: | AG Net Lease III Corp.; AG Net Lease III (SO) Corp. | Title Vesting: | Fee | ||||
| Mortgage Rate: | 3.9900% | Property Manager: | Self-managed | ||||
| Note Date: | July 22, 2019 | Current Occupancy (As of): | 100.0% (8/1/2019) | ||||
| Seasoning: | 0 months | YE 2018 Occupancy: | 100.0% (12/31/2018) | ||||
| Anticipated Repayment Date: | August 11, 2029 | YE 2017 Occupancy(5): | NAV | ||||
| Final Maturity Date: | August 11, 2032 | YE 2016 Occupancy(5): | NAV | ||||
| IO Period: | 60 months | YE 2015 Occupancy(5): | NAV | ||||
| Loan Term (Original): | 120 months | As-Is Appraised Value: | $54,200,000 | ||||
| Amortization Term (Original): | 360 months | As-Is Appraised Value Per SF: | $90.20 | ||||
| Loan Amortization Type: | Interest-only, Amortizing ARD | As-Is Appraisal Valuation Date: | Various | ||||
| Call Protection: | L(24),GRTR 1% or YM(91),O(5) | Underwriting and Financial Information | |||||
| Lockbox Type: | Hard/Upfront Cash Management | TTM NOI(6): | NAV | ||||
| Additional Debt(1): | Yes | YE 2018 NOI(6): | NAV | ||||
| Additional Debt Type (Balance)(1): | Future Mezzanine | YE 2017 NOI(6): | NAV | ||||
| YE 2016 NOI(6): | NAV | ||||||
| U/W Revenues: | $4,674,063 | ||||||
| U/W Expenses: | $1,146,745 | ||||||
| Escrows and Reserves | U/W NOI: | $3,527,318 | |||||
| Initial | Monthly | Cap | U/W NCF: | $3,298,075 | |||
| Taxes(2) | $0 | Springing | NAP | U/W DSCR based on NOI/NCF: | 2.27x / 2.13x | ||
| Insurance(3) | $0 | Springing | NAP | U/W Debt Yield based on NOI/NCF: | 13.0% / 12.2% | ||
| Replacement Reserve(4) | $0 | Springing | NAP | U/W Debt Yield at Maturity based on NOI/NCF: | 14.3% / 13.4% | ||
| Cut-off Date LTV Ratio: | 50.0% | ||||||
| LTV Ratio at Maturity: | 45.4% | ||||||
| Sources and Uses | |||||||||
| Sources | Uses | ||||||||
| Original loan amount | $27,100,000 | 50.0% | Purchase price | $53,450,000 | 98.7 | % | |||
| Cash equity contribution | 27,052,412 | 50.0 | Closing costs | 702,412 | 1.3 | ||||
| Total Sources | $54,152,412 | 100.0% | Total Uses | $54,152,412 | 100.0 | % | |||
| (1) | The Sequa Corporation Industrial Portfolio Mortgage Loan (as defined below) permits a future mezzanine loan, subject to conditions including the following (i) no event of default has occurred and is continuing, (ii) the combined LTV ratio will not exceed 50.0%, (iii) the combined DSCR will not be less than 2.00x, (iv) the combined DSCR based on an amortizing payment and an imputed loan constant equal to 10.0% will not be less than 1.22x, (v) the mezzanine lender will be subject to the approval of the lender, (vi) an intercreditor agreement in form and substance reasonably acceptable to the lender, and (vii) rating agency confirmation. |
| (2) | The loan documents do not require ongoing monthly escrows for real estate taxes so long as (A) if the tenant pays taxes directly (i) no event of default has occurred and is continuing, (ii) the Chromalloy lease is in full force and effect, (iii) Chromalloy is required under the Chromalloy lease to pay all taxes; and (iv) the borrower provides the lender with evidence of payment prior to the applicable delinquency date, or (B) if the borrower pays taxes directly (i) no event of default has occurred and is continuing, and (ii) the borrower provides the lender with evidence of payment prior to the applicable delinquency date. |
| (3) | The loan documents do not require ongoing monthly escrows for insurance premiums so long as (A)(i) no event of default has occurred and is continuing, (ii) the blanket policy is acceptable to the lender, or (iii) the borrower provides the lender with evidence of renewal and payment within at least 10 business days prior to the expiration of the policy, or (B) to the extent Chromalloy is required to obtain and maintain insurance, (i) no event of default has occurred and is continuing, (ii) the blanket policy is acceptable to policies maintained by Chromalloy are approved by the lender; (iii) Chromalloy provides the lender with evidence of renewal and timely payment within 10 business days, and (iv) the Chromalloy lease is in full force and effect. |
| (4) | The loan documents do not require ongoing monthly escrows of $7,511 for replacement reserves so long as (i) no event of default has occurred and is continuing, (ii) the Chromalloy lease is in full force and effect, (iii) the borrower and/or Chromalloy completes any specified repair identified in any lender inspection report in a timely manner, or (iv) the borrower and/or Chromalloy provide evidence of its completion of any specified repair. |
| (5) | Historical occupancy is unavailable as the borrower sponsors recently acquired the Sequa Corporation Industrial Portfolio Properties from the tenant and a lease was not previously in place. |
| (6) | Historical operating statements are unavailable as the borrower sponsors recently acquired the Sequa Corporation Industrial Portfolio Properties from the tenant and a lease was not previously in place. |
THE INFORMATION IN THIS STRUCTURAL AND COLLATERAL TERM SHEET IS NOT COMPLETE AND MAY BE AMENDED PRIOR TO THE TIME OF SALE. THIS TERM SHEET IS NOT AN OFFER TO SELL THESE SECURITIES AND IT IS NOT A SOLICITATION OF AN OFFER TO BUY THESE SECURITIES IN ANY JURISDICTION WHERE THE OFFER OR SALE IS NOT PERMITTED.
136
| Industrial – Manufacturing | Loan #11 | Cut-off Date Balance: | $27,100,000 | |
| Portfolio (Various Locations) | Sequa Corporation | Cut-off Date LTV: | 50.0% | |
| U/W NCF DSCR: | 2.13x | |||
| U/W NOI Debt Yield: | 13.0% |
The Mortgage Loan. The mortgage loan (the “Sequa Corporation Industrial Portfolio Mortgage Loan”) is evidenced by a single promissory note secured by a first mortgage encumbering the fee interests in five cross-collateralized and cross-defaulted industrial manufacturing properties in Tampa, Florida, Carson City, Nevada, Windsor, Connecticut, Phoenix, Arizona, and Oldsmar, Florida, (the “Sequa Corporation Industrial Portfolio Properties”). The Sequa Corporation Industrial Portfolio Mortgage Loan is structured with an anticipated repayment date of August 11, 2029 (the “ARD”) and a final maturity date of August 11, 2032. From and after the anticipated repayment date, the Sequa Corporation Industrial Portfolio Mortgage Loan accrues interest at a fixed rate that is equal to the greater of (a) 3.9900% plus 3.0000% and (b) the 10-year swap yield as of the first business day after August 11, 2029 plus 4.0000%. A cash trap event period (as outlined in the loan documents) will commence on the ARD.
The Properties.The Sequa Corporation Industrial Portfolio Properties consist of five industrial manufacturing buildings totaling 600,917 square feet located in Tampa, Florida (the “Tampa Facility”), Carson City, Nevada (the “Carson City Facility”), Windsor, Connecticut (the “Windsor Facility”), Phoenix, Arizona (the “Phoenix Facility”), and Oldsmar, Florida (the “Oldsmar Facility”). As of August 1, 2019, the Sequa Corporation Industrial Portfolio Properties were 100.0% occupied by Chromalloy Gas Turbine, LLC (“Chromalloy”), a division of Sequa Corporation (“Sequa”). Founded in 1929, Sequa is a diversified industrial company that specializes in the aerospace and metal coating industry segments.
Tampa Facility: The Tampa Facility is a single-story building totaling 167,207 square feet constructed in 2000 and renovated in 2011. The Tampa Facility is situated on a 14.1-acre site and contains 16 dock-high doors, 24-foot clear ceiling heights, and 251 parking spaces (approximately 1.5 spaces per 1,000 square feet). The Tampa Facility serves as an aerospace casting plant and is a hub for Chromalloy’s global network of manufacturing and distribution facilities.
Carson City Facility: The Carson City Facility is a two-story building totaling 189,810 square feet constructed in 1991 and renovated in 2008. The Carson City Facility is situated on a 15.0-acre site and contains 11 dock-high doors, 1 drive-in door, 30-foot clear ceiling heights, and 572 parking spaces (approximately 3.0 spaces per 1,000 square feet). The Carson City Facility accommodates various activities that allow Chromalloy to develop the blades used in engines, including the primary processes of engineering services, machining, grinding, laser welding, heat-treating, metal surface cleaning and etching, x-ray, and protective barrier coatings.
Windsor Facility: The Windsor Facility is a single-story building totaling 125,000 square feet constructed in phases in 1981 and 1997. The Windsor Facility is situated on a 40.5-acre site and contains 5 dock-high doors, 4 drive-in doors, 18-foot to 24-foot clear ceiling heights, and 195 parking spaces (approximately 1.6 spaces per 1,000 square feet). The Windsor Facility accommodates the primary processes of engineering services, protective barrier coatings, machining, thermal processing, and joining technology.
Phoenix Facility: The Phoenix Facility comprises a two-story main production building constructed in 1980 and a single story supply and distribution building constructed in 2013. The Phoenix Facility totals 87,294 square feet situated on a 5.0-acre site and contains 4 drive-in doors, 12-foot to 24-foot clear ceiling heights, and 203 parking spaces (approximately 2.3 spaces per 1,000 square feet). The Phoenix Facility accommodates engineering services, machining, grinding, metal surface cleaning and etching, x-ray, and protective barrier coatings.
Oldsmar Facility: The Oldsmar Facility is a single-story building totaling 31,606 square feet constructed in 1999. The Oldsmar Facility is situated on a 6.9-acre site and contains 1 dock-high door, 3 drive-in doors, 22-foot clear ceiling heights, and 71 parking spaces (approximately 2.3 spaces per 1,000 square feet). The Oldsmar Facility accommodates the primary processes of combustion-turbine engine parts machining and inspection. These processes, combined with the intellectual property only present at the Oldsmar Facility, allow Chromalloy to develop turbine engine components able to withstand extreme pressure during flight.
The following table presents certain information relating to the Sequa Corporation Industrial Portfolio Properties:
Sequa Corporation Industrial Portfolio Properties
| Property Name | Location | Square Feet | Allocated Cut-off Date Balance | % of Cut-off Date Balance | Appraised Value | Allocated Cut-off Date LTV Ratio | Annual U/W Base Rent | Annual U/W Base Rent PSF | % of Annual U/W Base Rent |
| Tampa Facility | Tampa, FL | 167,207 | $9,300,000 | 34.3% | $18,600,000 | 50.0% | $1,254,000 | $7.50 | 34.0% |
| Carson City Facility | Carson City, NV | 189,810 | $7,050,000 | 26.0% | $14,100,000 | 50.0% | $949,162 | $5.00 | 25.8% |
| Windsor Facility | Windsor, CT | 125,000 | $5,150,000 | 19.0% | $10,300,000 | 50.0% | $749,746 | $6.00 | 20.3% |
| Phoenix Facility | Phoenix, AZ | 87,294 | $3,700,000 | 13.7% | $7,400,000 | 50.0% | $480,294 | $5.50 | 13.0% |
| Oldsmar Facility | Oldsmar, FL | 31,606 | $1,900,000 | 7.0% | $3,800,000 | 50.0% | $252,864 | $8.00 | 6.9% |
| Total | 600,917 | $27,100,000 | 100.0% | $54,200,000 | 50.0% | $3,686,066 | $6.13 | 100.0% |
THE INFORMATION IN THIS STRUCTURAL AND COLLATERAL TERM SHEET IS NOT COMPLETE AND MAY BE AMENDED PRIOR TO THE TIME OF SALE. THIS TERM SHEET IS NOT AN OFFER TO SELL THESE SECURITIES AND IT IS NOT A SOLICITATION OF AN OFFER TO BUY THESE SECURITIES IN ANY JURISDICTION WHERE THE OFFER OR SALE IS NOT PERMITTED.
137
| Industrial – Manufacturing | Loan #11 | Cut-off Date Balance: | $27,100,000 | |
| Portfolio (Various Locations) | Sequa Corporation | Cut-off Date LTV: | 50.0% | |
| U/W NCF DSCR: | 2.13x | |||
| U/W NOI Debt Yield: | 13.0% |
Major Tenant.
Largest Tenant: Chromalloy (600,917 square feet; 100.0% of net rentable area; 100.0% of underwritten base rent; 10/31/2038 lease expiration) – Chromalloy, the largest business unit of Sequa Corporation, provides the airline industry with advanced manufacturing and repairs for jet and gas turbine engines serving airlines, engine original equipment manufacturers, militaries, and energy companies. In August 2018, Chromalloy entered into a 20-year, absolute triple-net master lease at the Sequa Corporation Industrial Portfolio Properties. Chromalloy’s rent will increase 2.0%per annum. Chromalloy has one 10-year renewal option, followed by three seven-year renewal options. Each renewal option requires a renewal notice period of at least 24 months. Chromalloy’s lease is guaranteed by Sequa Mezzanine Holdings, LLC.
Market Overview and Competition.
Tampa Facility: The Tampa Facility is located within the Sabal Industrial Park. Nearby industrial uses are light warehouse and distribution buildings mixed among flex space. The Tampa Facility is located approximately 0.4 miles north of State Route 574 (East Broadway Avenue), 1.0 miles east of US Highway 301, 1.5 miles west of Interstate 75, 1.9 miles south of Interstate 4, and 7.5 miles east of the Tampa central business district. According to a third party market research provider, the estimated 2019 population within a three- and five-mile radius of the Tampa Facility was approximately 49,334 and 196,910, respectively; and the estimated 2019 median household income within the same radii was approximately $47,185 and $48,485, respectively.
According to a third-party market research report, the Tampa Facility is situated within the East submarket of the Tampa industrial market. As of the second quarter of 2019, the East submarket reported a total inventory of approximately 53.6 million square feet of industrial space with a 6.3% vacancy rate and average asking rent of $7.04 per square foot, net. The appraiser concluded to a market rent for the Tampa Facility of $5.75 per square foot, net.
Carson City Facility: The Carson City Facility is located along an industrial corridor north of the Carson City airport. The Carson City Facility is situated adjacent to the Carson City Airport, approximately 1.4 miles north of State Route 50 (Lincoln Highway), 2.3 miles northeast of Interstate 580, 4.5 miles northeast of the Carson City central business district. According to a third party market research provider, the estimated 2019 population within a three- and five-mile radius of the Carson City Facility was approximately 35,492 and 52,933, respectively; and the estimated 2019 median household income within the same radii was approximately $45,923 and $50,078, respectively.
According to a third-party market research report, the Carson City Facility is situated within the Carson City County submarket of the Carson City industrial market. As of the second quarter of 2019, the Carson City County submarket reported a total inventory of approximately 3.8 million square feet of industrial space with a 2.8% vacancy rate and average asking rent of $6.82 per square foot, net. The appraiser concluded to a market rent for the Carson City Facility of $4.80 per square foot, net.
Windsor Facility: The Windsor Facility is located in an area with large-scale industrial and office developments within suburban office parks. The Windsor Facility is located approximately 1.4 miles west of Interstate 91, 4.7 miles south of Bradley International Airport, 9.3 miles north of Interstate 84, and 9.4 miles north of the Hartford central business district. According to a third party market research provider, the estimated 2019 population within a three- and five-mile radius of the Windsor Facility was approximately 20,985 and 69,871, respectively; and the estimated 2019 median household income within the same radii was approximately $90,923 and $80,475, respectively.
According to a third-party market research report, the Windsor Facility is situated within the Windsor submarket of the Hartford industrial market. As of the second quarter of 2019, the Windsor submarket reported a total inventory of approximately 11.2 million square feet of industrial space with a 5.5% vacancy rate and average asking rent of $6.57 per square foot, net. The appraiser concluded to a market rent for the Windsor Facility of $6.00 per square foot, net.
Phoenix Facility: The Phoenix Facility is located in an industrial district in the southwest region of Phoenix. The Phoenix Facility is located approximately 0.8 miles south of Interstate 10, 4.3 miles west of Interstate 17, 7.4 miles west of the Phoenix central business district, and 10.7 miles west of the Phoenix Sky Harbor International Airport. According to a third party market research provider, the estimated 2019 population within a three- and five-mile radius of the Phoenix Facility was approximately 140,854 and 387,260, respectively; and the estimated 2019 median household income within the same radii was approximately $31,949 and $35,928, respectively.
According to a third-party market research report, the Phoenix Facility is situated within the SW N of Buckeye Road submarket of the Phoenix industrial market. As of the second quarter of 2019, the SW N of Buckeye Road submarket reported a total inventory of approximately 33.4 million square feet of industrial space with a 6.0% vacancy rate and average asking rent of $5.81 per square foot, net. The appraiser concluded to a market rent for the Phoenix Facility of $5.50 per square foot, net.
Oldsmar Facility: The Oldsmar Facility is located within the industrial and commercial area of downtown Oldsmar, approximately 12.4 miles northwest of the Tampa International Airport, 16.9 miles northwest of the Tampa central business district, and 25.0 miles north of the St. Petersburg central business district. According to a third party market research provider, the estimated 2019 population within a three- and five-mile radius of the Oldsmar Facility was approximately 47,269 and 153,282, respectively; and the estimated 2019 median household income within the same radii was approximately $76,271 and $70,554, respectively.
According to a third-party market research report, the Oldsmar Facility is situated within the North Pinellas submarket of the Tampa industrial market. As of the second quarter of 2019, the North Pinellas submarket reported a total inventory of approximately 13.8
THE INFORMATION IN THIS STRUCTURAL AND COLLATERAL TERM SHEET IS NOT COMPLETE AND MAY BE AMENDED PRIOR TO THE TIME OF SALE. THIS TERM SHEET IS NOT AN OFFER TO SELL THESE SECURITIES AND IT IS NOT A SOLICITATION OF AN OFFER TO BUY THESE SECURITIES IN ANY JURISDICTION WHERE THE OFFER OR SALE IS NOT PERMITTED.
138
| Industrial – Manufacturing | Loan #11 | Cut-off Date Balance: | $27,100,000 | |
| Portfolio (Various Locations) | Sequa Corporation | Cut-off Date LTV: | 50.0% | |
| U/W NCF DSCR: | 2.13x | |||
| U/W NOI Debt Yield: | 13.0% |
million square feet of industrial space with a 1.6% vacancy rate and average asking rent of $8.45 per square foot, net. The appraiser concluded to a market rent for the Oldsmar Facility of $8.00 per square foot, net.
The following table presents certain information relating to the tenancy at the Sequa Corporation Industrial Portfolio Properties:
Major Tenants
| Tenant Name | Credit Rating (Fitch/Moody’s/ S&P) | Tenant NRSF | % of NRSF | Annual U/W Base Rent PSF(1) | Annual U/W Base Rent(1) | % of Total Annual U/W Base Rent | Lease Expiration Date | Extension Options | Termination Option (Y/N) |
| Major Tenants | |||||||||
| Chromalloy | NR/NR/NR | 600,917 | 100.0% | $6.13 | $3,686,066 | 100.0% | 10/31/2038 | 1, 10-year; 3, 7-year | N |
| Occupied Collateral Total | 600,917 | 100.0% | $6.13 | $3,686,066 | 100.0% | ||||
| Vacant Space | 0 | 0.0% | |||||||
| Collateral Total | 600,917 | 100.0% | |||||||
| (1) | Annual U/W Base Rent PSF and Annual U/W Base Rent represent allocated rental rates of $7.50 per square foot for the Tampa Facility, $5.00 per square foot for the Carson City Facility, $6.00 per square foot for the Windsor Facility, $5.50 per square foot for the Phoenix Facility, and $8.00 per square foot for the Oldsmar Facility. |
The following table presents certain information relating to the lease rollover schedule at the Sequa Corporation Industrial Portfolio Properties:
Lease Expiration Schedule(1)
| Year Ending December 31, | No. of Leases Expiring | Expiring NRSF | % of Total NRSF | Cumulative Expiring NRSF | Cumulative % of Total NRSF | Annual U/W Base Rent | % of Total Annual U/W Base Rent | Annual U/W Base Rent PSF |
| MTM | 0 | 0 | 0.0% | 0 | 0.0% | $0 | 0.0% | $0.00 |
| 2019 | 0 | 0 | 0.0% | 0 | 0.0% | $0 | 0.0% | $0.00 |
| 2020 | 0 | 0 | 0.0% | 0 | 0.0% | $0 | 0.0% | $0.00 |
| 2021 | 0 | 0 | 0.0% | 0 | 0.0% | $0 | 0.0% | $0.00 |
| 2022 | 0 | 0 | 0.0% | 0 | 0.0% | $0 | 0.0% | $0.00 |
| 2023 | 0 | 0 | 0.0% | 0 | 0.0% | $0 | 0.0% | $0.00 |
| 2024 | 0 | 0 | 0.0% | 0 | 0.0% | $0 | 0.0% | $0.00 |
| 2025 | 0 | 0 | 0.0% | 0 | 0.0% | $0 | 0.0% | $0.00 |
| 2026 | 0 | 0 | 0.0% | 0 | 0.0% | $0 | 0.0% | $0.00 |
| 2027 | 0 | 0 | 0.0% | 0 | 0.0% | $0 | 0.0% | $0.00 |
| 2028 | 0 | 0 | 0.0% | 0 | 0.0% | $0 | 0.0% | $0.00 |
| 2029 | 0 | 0 | 0.0% | 0 | 0.0% | $0 | 0.0% | $0.00 |
| Thereafter | 1 | 600,917 | 100.0% | 600,917 | 100.0% | $3,686,066 | 100.0% | $6.13 |
| Vacant | 0 | 0 | 0.0% | 0 | 0.0% | $0 | 0.0% | $0.00 |
| Total/Weighted Average | 1 | 600,917 | 100.0% | $3,686,066 | 100.0% | $6.13 |
| (1) | Information obtained from the underwritten rent roll. |
The following table presents historical occupancy percentages at the Sequa Corporation Industrial Portfolio Properties:
Historical Occupancy
12/31/2015(1) | 12/31/2016(1) | 12/31/2017(1) | 12/31/2018(1) | 8/1/2019(2) |
| NAV | NAV | NAV | 100.0% | 100.0% |
| (1) | Historical occupancy is unavailable as the borrower sponsors recently acquired the Sequa Corporation Industrial Portfolio Properties from the tenant and a lease was not previously in place. |
| (2) | Information obtained from the underwritten rent roll. |
THE INFORMATION IN THIS STRUCTURAL AND COLLATERAL TERM SHEET IS NOT COMPLETE AND MAY BE AMENDED PRIOR TO THE TIME OF SALE. THIS TERM SHEET IS NOT AN OFFER TO SELL THESE SECURITIES AND IT IS NOT A SOLICITATION OF AN OFFER TO BUY THESE SECURITIES IN ANY JURISDICTION WHERE THE OFFER OR SALE IS NOT PERMITTED.
139
| Industrial – Manufacturing | Loan #11 | Cut-off Date Balance: | $27,100,000 | |
| Portfolio (Various Locations) | Sequa Corporation | Cut-off Date LTV: | 50.0% | |
| U/W NCF DSCR: | 2.13x | |||
| U/W NOI Debt Yield: | 13.0% |
Operating History and Underwritten Net Cash Flow. The following table presents certain information relating to the underwritten net cash flow at the Sequa Corporation Industrial Portfolio Properties:
Cash Flow Analysis(1)
| U/W | %(2) | U/W $ per SF | ||||
| Base Rent | $3,686,066 | 75.9% | $6.13 | |||
| Grossed Up Vacant Space | 0 | 0.0 | 0.00 | |||
| Gross Potential Rent | $3,686,066 | 75.9% | $6.13 | |||
| Total Recoveries | 1,172,300 | 24.1 | 1.95 | |||
| Net Rental Income | $4,858,366 | 100.0% | $8.08 | |||
| (Vacancy & Credit Loss) | (184,303)(3) | (5.0) | (0.31) | |||
| Effective Gross Income | $4,674,063 | 96.2% | $7.78 | |||
| Real Estate Taxes | 655,666 | 14.0 | 1.09 | |||
| Insurance | 69,924 | 1.5 | 0.12 | |||
| Management Fee | 140,222 | 3.0 | 0.23 | |||
| Other Operating Expenses | 280,933 | 6.0 | 0.47 | |||
| Total Operating Expenses | $1,146,745 | 24.5% | $1.91 | |||
| Net Operating Income | $3,527,318 | 75.5% | $5.87 | |||
| Replacement Reserves | 90,138 | 1.9 | 0.15 | |||
| TI/LC | 139,106 | 3.0 | 0.23 | |||
| Net Cash Flow | $3,298,075 | 70.6% | $5.49 | |||
| NOI DSCR | 2.27x | |||||
| NCF DSCR | 2.13x | |||||
| NOI Debt Yield | 13.0% | |||||
| NCF Debt Yield | 12.2% |
| (1) | Historical operating statements are unavailable as the borrower sponsors recently acquired the Sequa Corporation Industrial Portfolio Properties from the tenant and a lease was not previously in place. |
| (2) | Represents (i) percent of Net Rental Income for all revenue fields, (ii) percent of Gross Potential Rent for Vacancy & Credit Loss and (iii) percent of Effective Gross Income for all other fields. |
| (3) | The underwritten economic vacancy is 5.0%. The Sequa Corporation Industrial Portfolio Properties were 100.0% physically occupied as of August 1, 2019. |
Partial Release.Following the lockout period and in connection with a bona fide sale to an unaffiliated third-party, the Sequa Corporation Industrial Portfolio borrower has the right to partially release any of the Sequa Corporation Industrial Portfolio Properties provided that, among other things, the following conditions have been met: (i) a release price of 110.0% of the allocated loan amount with respect to the individual property being released, (ii) the debt service coverage ratio (“DSCR”) of the remaining properties must be no less than the DSCR as of the note date (July 22, 2019), (iii) the loan-to-value ratio of remaining properties must be no greater than 50.0%, (iv) the net cash flow debt yield of the remaining properties must be no less than 12.7%, and (v) payment of the applicable yield maintenance premium.
Real Estate Substitution. Following the lockout period, so long as the Chromalloy lease is in full force and effect, the Sequa Corporation Industrial Portfolio borrower has the right to release one or more of the Sequa Corporation Industrial Portfolio Properties and the related loan documents encumbering the related property in consideration of substituting therefor one or more other properties, provided that, among other things, the following conditions have been met or, in the lender’s sole discretion, waived, including (i) the LTV of the remaining properties subject to the liens of the loan documents must be no greater than 50.0%, (ii) the DSCR of all the properties (including the replacement property but excluding the substituted property) must be no less than the DSCR (including the substituted property but excluding the replacement property) as of the note date (July 22, 2019), (iii) the substitute property will have an as-is market value equal to or greater than the property being replaced, (iv) the lender has received evidence that Chromalloy has gone dark, vacated, or otherwise ceased normal business operations at the substituted property, and such replacement property is intended to provide Chromalloy with a replacement individual property that has greater utility to Chromalloy in its customary business operations; (v) the Chromalloy lease will be amended to reflect the addition of the substitute property and the rent payable under the Chromalloy lease following such substitution will not be reduced as a result of the substitution; (vi) a rating agency confirmation; and (vii) an opinion of counsel that the REMIC trust will not fail to maintain its REMIC status due to the substitution.
Right of First Offer.If the Sequa Corporation Industrial Portfolio borrower markets any of the Sequa Corporation Industrial Portfolio Properties for sale, Chromalloy has a right of first offer to purchase the related property being offered for sale (the “Chromalloy ROFO”).The Chromalloy ROFO is not extinguished by foreclosure; however, the Chromalloy ROFO does not apply to foreclosure or deed-in-lieu thereof.
Earthquake Insurance.The Sequa Corporation Industrial Portfolio Mortgage Loan documents do not require earthquake insurance. The seismic report indicated a probable maximum loss of 19.0% for the Carson City Facility.
THE INFORMATION IN THIS STRUCTURAL AND COLLATERAL TERM SHEET IS NOT COMPLETE AND MAY BE AMENDED PRIOR TO THE TIME OF SALE. THIS TERM SHEET IS NOT AN OFFER TO SELL THESE SECURITIES AND IT IS NOT A SOLICITATION OF AN OFFER TO BUY THESE SECURITIES IN ANY JURISDICTION WHERE THE OFFER OR SALE IS NOT PERMITTED.
140
(THIS PAGE INTENTIONALLY LEFT BLANK)
THE INFORMATION IN THIS STRUCTURAL AND COLLATERAL TERM SHEET IS NOT COMPLETE AND MAY BE AMENDED PRIOR TO THE TIME OF SALE. THIS TERM SHEET IS NOT AN OFFER TO SELL THESE SECURITIES AND IT IS NOT A SOLICITATION OF AN OFFER TO BUY THESE SECURITIES IN ANY JURISDICTION WHERE THE OFFER OR SALE IS NOT PERMITTED.
141
| No. 12 – Grand Traverse Crossing | |||||||
| Mortgage Loan Information | Mortgaged Property Information | ||||||
| Mortgage Loan Seller: | BSPRT | Single Asset/Portfolio: | Single Asset | ||||
Credit Assessment (Fitch/KBRA/Moody’s): | NR/NR/NR | Property Type – Subtype: | Retail – Anchored | ||||
| Original Principal Balance: | $24,300,000 | Location: | Traverse City, MI | ||||
| Cut-off Date Balance: | $24,300,000 | Size: | 249,196 SF | ||||
| % of Initial Pool Balance: | 2.7% | Cut-off Date Balance Per SF: | $97.51 | ||||
| Loan Purpose: | Refinance | Maturity Date Balance Per SF: | $83.03 | ||||
| Borrower Sponsors: | Kevin Baker; Daniel Kukes; Daniel Kukes Living Trust dated May 15, 2012; Nikolaos Moschouris | Year Built/Renovated: | 1996/2015 | ||||
| Guarantors: | Kevin Baker; Daniel Kukes; Daniel Kukes Living Trust dated May 15, 2012; Nikolaos Moschouris | Title Vesting: | Fee | ||||
| Mortgage Rate: | 4.8600% | Property Manager: | Streamline Commercial Real Estate Solutions, LLC (Borrower-affiliate) | ||||
| Note Date: | May 10, 2019 | Current Occupancy (As of): | 100.0% (5/14/2019) | ||||
| Seasoning: | 2 months | YE 2018 Occupancy: | 100.0% | ||||
| Maturity Date: | June 6, 2029 | YE 2017 Occupancy: | 99.1% | ||||
| IO Period: | 18 months | YE 2016 Occupancy: | 100.0% | ||||
| Loan Term (Original): | 120 months | YE 2015 Occupancy: | 96.9% | ||||
| Amortization Term (Original): | 360 months | Appraised Value: | $34,400,000 | ||||
| Loan Amortization Type: | Interest-only, Amortizing Balloon | Appraised Value Per SF: | $138.04 | ||||
| Call Protection: | L(26),D(89),O(5) | Appraisal Valuation Date: | April 16, 2019 | ||||
| Lockbox Type: | Hard/Springing Cash Management | ||||||
| Additional Debt: | None | Underwriting and Financial Information | |||||
| Additional Debt Type (Balance): | NAP | Annualized 11 2/28/2019 NOI(2): | $2,000,525 | ||||
| TTM 5/31/2018 NOI: | $2,178,400 | ||||||
| Escrows and Reserves | YE 2017 NOI: | $2,122,685 | |||||
| Initial | Monthly | Cap | YE 2016 NOI: | $1,973,067 | |||
| Taxes | $189,485 | $23,686 | NAP | U/W Revenues: | $3,104,380 | ||
| Insurance | $40,096 | $3,341 | NAP | U/W Expenses: | $829,415 | ||
| Replacement Reserve | $0 | $1,717 | NAP | U/W NOI: | $2,274,965 | ||
| TI/LC Reserve | $100,000 | $23,881(1) | $550,000 | U/W NCF: | $2,092,385 | ||
| Deferred Maintenance | $140,156 | $0 | NAP | U/W DSCR based on NOI/NCF: | 1.48x / 1.36x | ||
| HomeGoods Lease Reserve | $1,037,080 | $0 | NAP | U/W Debt Yield based on NOI/NCF: | 9.4% / 8.6% | ||
| HomeGoods Gap Rent Reserve | $340,854 | $0 | NAP | U/W Debt Yield at Maturity based on NOI/NCF: | 11.0% / 10.1% | ||
| HomeGoods Repair Reserve | $9,886 | $0 | NAP | Cut-off Date LTV Ratio: | 70.6% | ||
| LTV Ratio at Maturity: | 60.2% | ||||||
| Sources and Uses | ||||||||
| Sources | Uses | |||||||
| Original loan amount | $24,300,000 | 100.0% | Loan payoff(3) | $21,776,665 | 89.7% | |||
| Upfront reserves | 1,857,558 | 7.6 | ||||||
| Return of equity | 246,421 | 1.0 | ||||||
| Closing costs | 419,357 | 1.7 | ||||||
| Total Sources | $24,300,000 | 100.0% | Total Uses | $24,300,000 | 100.0% | |||
| (1) | The Grand Traverse Crossing Mortgage Loan (as defined below) requires the borrower to deposit $23,881 on each monthly payment date for tenant improvements and leasing commissions until December 6, 2020 and $13,498 on each monthly payment date thereafter. |
| (2) | Annualized 11 2/28/2019 NOI excludes June 2018 financials as the seller did not provide. |
| (3) | Previous debt was originated by Benefit Street Partners Operating Partnership, L.P., which included a fully-funded participation of $31.0 million securitized in the BSPRT 2018-FL4 Mortgage Trust. Loan Payoff amount is also inclusive of approximately $428,000 of credit for escrows on deposit. |
The Mortgage Loan.The mortgage loan (the “Grand Traverse Crossing Mortgage Loan”) is evidenced by a single promissory note secured by a first mortgage encumbering the fee simple interest in a 249,196 square foot anchored retail center located in Traverse City, Michigan (the “Grand Traverse Crossing Property”). The Grand Traverse Crossing Mortgage Loan was originated on May 10, 2019 by BSPRT CMBS Finance, LLC. The Grand Traverse Crossing Mortgage Loan had an original principal balance of $24,300,000, has an outstanding principal balance as of the Cut-off Date of $24,300,000 and accrues interest at an interest rate of 4.8600%per annum. The Grand Traverse Crossing Mortgage Loan had an initial term of 120 months, has a remaining term of 118 months as of the Cut-off
THE INFORMATION IN THIS STRUCTURAL AND COLLATERAL TERM SHEET IS NOT COMPLETE AND MAY BE AMENDED PRIOR TO THE TIME OF SALE. THIS TERM SHEET IS NOT AN OFFER TO SELL THESE SECURITIES AND IT IS NOT A SOLICITATION OF AN OFFER TO BUY THESE SECURITIES IN ANY JURISDICTION WHERE THE OFFER OR SALE IS NOT PERMITTED.
142
| Retail – Anchored | Loan #12 | Cut-off Date Balance: | $24,300,000 | |
| 2632 Crossing Circle | Grand Traverse Crossing | Cut-off Date LTV: | 70.6% | |
| Traverse City, MI 49684 | U/W NCF DSCR: | 1.36x | ||
| U/W NOI Debt Yield: | 9.4% |
Date and requires interest-only payments for the initial 18 payments of the loan term of the Grand Traverse Crossing Mortgage Loan. The Grand Traverse Crossing Mortgage Loan matures on June 6, 2029.
The Property.The Grand Traverse Crossing Property is an anchored retail center containing 249,196 square feet of net rentable area located in Traverse City, in the core of the area’s primary retail node. Built in 1996 and renovated in 2015, the Grand Traverse Crossing Property consists of five, one-story retail buildings located on a 41.2 acre parcel. The Grand Traverse Crossing Property is anchored by Home Depot (111,847 square feet) and junior-anchored by Staples (24,218 square feet), HomeGoods (23,570 square feet), PetSmart (22,365 square feet) and Books-A-Million (20,076 square feet). Additionally, the Grand Traverse Crossing Property is shadow anchored by Walmart (not part of the collateral). The Grand Traverse Crossing Property contains 1,387 surface parking spaces, resulting in a parking ratio of 5.60 spaces per 1,000 square feet of net rentable area. There is an additional 19,370 square feet of space that extends across six tenant spaces in three outparcels, including two restaurant options. As of May 14, 2019, the Grand Traverse Crossing Property was 100.0% occupied by 15 national, regional and local tenants.
Largest Tenant: Home Depot (A/A2/A by Fitch/Moody’s/S&P; 111,847 square feet; 44.9% of net rentable area; 23.4% of underwritten base rent; 1/31/2027 lease expiration) – Founded in 1978 and headquartered in Atlanta, Georgia, Home Depot Inc. (NYSE: HD) is the largest home improvement specialty retailer in the world with fiscal retail sales of $108.2 billion and earnings of $8.6 billion as of year-end 2018. Home Depot employs nearly 400,000 people in 2,290 stores across the U.S. (including the commonwealth of Puerto Rico and the territories of the U.S. Virgin Islands and Guam), Canada and Mexico. Home Depot offers customers over 35,000 products in stores and over 100,000 products online including different kinds of building materials, home improvements supplies, appliances and garden products. As of 2019, Home Depot is ranked #27 on the Fortune 500 list. Home Depot has been a ground lease tenant at the property since the initial development in 1996 and currently pays base rent of $5.43 per square foot NNN. Home Depot has five, five-year renewal options, and no termination options.
2nd Largest Tenant: Staples (NR/B1/B+ by Fitch/Moody’s/S&P; 24,218 square feet; 9.7% of net rentable area; 15.3% of underwritten base rent; 10/31/2021 lease expiration) – Founded in 1985 and headquartered in Framingham, Massachusetts, Staples sells office supplies, office machines, promotional products, technology and business services both in stores and online and operates 1,560 retail stores throughout the United States and Canada. Staples has been a tenant at the Grand Traverse Crossing Property since 1996 and currently pays base rent of $16.35 per square foot NNN and has no termination options.
3rd Largest Tenant: HomeGoods (NR/A2/A+ by Fitch/Moody’s/S&P; 23,570 square feet; 9.5% of net rentable area; 10.8% of underwritten base rent; 6/30/2029 lease expiration) –Founded in 1992 and owned by TJX Companies Inc., HomeGoods is a brick and mortar chain of discount home furnishing stores headquartered in Framingham, MA that specializes in name brand furniture, linens, cooking products, art and other home accessories offered at discount prices. HomeGoods recently became a tenant at the Grand Traverse Crossing Property, executing a ten-year lease that commenced on June 30, 2019. HomeGoods currently pays base rent of $11.85 per square foot NNN and has three, five-year renewal options and no termination options.
THE INFORMATION IN THIS STRUCTURAL AND COLLATERAL TERM SHEET IS NOT COMPLETE AND MAY BE AMENDED PRIOR TO THE TIME OF SALE. THIS TERM SHEET IS NOT AN OFFER TO SELL THESE SECURITIES AND IT IS NOT A SOLICITATION OF AN OFFER TO BUY THESE SECURITIES IN ANY JURISDICTION WHERE THE OFFER OR SALE IS NOT PERMITTED.
143
| Retail – Anchored | Loan #12 | Cut-off Date Balance: | $24,300,000 | |
| 2632 Crossing Circle | Grand Traverse Crossing | Cut-off Date LTV: | 70.6% | |
| Traverse City, MI 49684 | U/W NCF DSCR: | 1.36x | ||
| U/W NOI Debt Yield: | 9.4% |
The following table presents certain information relating to the tenancy at the Grand Traverse Crossing Property:
Major Tenants
| Tenant Name | Credit Rating (Fitch/Moody’s/ S&P)(1) | Tenant NRSF | % of NRSF | Annual U/W Base Rent PSF(2) | Annual U/W Base Rent(2) | % of Total Annual U/W Base Rent | Lease Expiration Date | Extension Options | Termination Option (Y/N) |
| Major Tenants | |||||||||
| Home Depot | A/A2/A | 111,847 | 44.9% | $5.43 | $607,329 | 23.4% | 1/31/2027 | 5, 5-year | N |
| Staples | NR/B1/B+ | 24,218 | 9.7% | $16.35 | $396,037 | 15.3% | 10/31/2021 | 2, 5-year | N |
| HomeGoods | NR/A2/A+ | 23,570 | 9.5% | $11.85 | $279,300 | 10.8% | 6/30/2029 | 3, 5-year | N |
| PetSmart | NR/B3/B- | 22,365 | 9.0% | $12.95 | $289,632 | 11.2% | 1/31/2023 | 2, 5-year | N |
| Books-A-Million | NR/NR/NR | 20,076 | 8.1% | $11.21 | $225,000 | 8.7% | 6/15/2027 | 6, 5-year | N |
| Total Major Tenants | 202,076 | 81.1% | $8.89 | $1,797,298 | 69.2% | ||||
| Non-Major Tenants | 47,120 | 18.9% | $16.97 | $799,510 | 30.8% | ||||
| Occupied Collateral Total | 249,196 | 100.0% | $10.42 | $2,596,808 | 100.0% | ||||
| Vacant Space | 0 | 0.0% | |||||||
| Collateral Total | 249,196 | 100.0% | $10.42 | ||||||
| (1) | Certain ratings are those of the parent company whether or not the parent company guarantees the lease. |
| (2) | Annual U/W Base Rent PSF and Annual U/W Base Rent include contractual rent steps through May 2020 totaling $7,638. |
THE INFORMATION IN THIS STRUCTURAL AND COLLATERAL TERM SHEET IS NOT COMPLETE AND MAY BE AMENDED PRIOR TO THE TIME OF SALE. THIS TERM SHEET IS NOT AN OFFER TO SELL THESE SECURITIES AND IT IS NOT A SOLICITATION OF AN OFFER TO BUY THESE SECURITIES IN ANY JURISDICTION WHERE THE OFFER OR SALE IS NOT PERMITTED.
144
| Retail – Anchored | Loan #12 | Cut-off Date Balance: | $24,300,000 | |
| 2632 Crossing Circle | Grand Traverse Crossing | Cut-off Date LTV: | 70.6% | |
| Traverse City, MI 49684 | U/W NCF DSCR: | 1.36x | ||
| U/W NOI Debt Yield: | 9.4% |
The following table presents certain information relating to major tenant sales at the Grand Traverse Crossing Property:
Tenant Sales (PSF)
| Major Tenant Name | % of Total Annual U/W Base Rent | 2016 | 2017 | 2018 | Major Tenant Occupancy Cost(1) |
| Home Depot(2) | 23.4% | NAV | NAV | NAV | NAV |
| Staples(2) | 15.3% | NAV | NAV | NAV | NAV |
| Home Goods(2) | 10.8% | NAV | NAV | NAV | NAV |
| PetSmart(2) | 11.2% | NAV | NAV | NAV | NAV |
| Books-A-Million | 8.7% | $123 | $117 | $95(3) | 19.0% |
| (1) | Major Tenant Occupancy Cost is based on the underwritten rent as of the May 14, 2019 rent roll and underwritten recoveries divided by most recently reported sales. |
| (2) | Sales figures are not available, as tenant is not required to report sales. |
| (3) | Sales figures do not include sales for December 2018 as that information was not available. |
The following table presents certain information relating to the lease rollover schedule at the Grand Traverse Crossing Property:
Lease Expiration Schedule(1)
| Year Ending December 31, | No. of Leases Expiring | Expiring NRSF | % of Total NRSF | Cumulative Expiring NRSF | Cumulative % of Total NRSF | Annual U/W Base Rent(2) | % of Total Annual U/W Base Rent | Annual U/W Base Rent PSF(2) |
| MTM | 0 | 0 | 0.0% | 0 | 0.00% | $0 | 0.0% | $0.00 |
| 2019 | 0 | 0 | 0.0% | 0 | 0.00% | $0 | 0.0% | $0.00 |
| 2020 | 0 | 0 | 0.0% | 0 | 0.0% | $0 | 0.0% | $0.00 |
| 2021 | 3 | 29,697 | 11.9% | 29,697 | 11.9% | $522,172 | 20.1% | $17.58 |
| 2022 | 1 | 1,580 | 0.6% | 31,277 | 12.5% | $38,505 | 1.5% | $24.37 |
| 2023 | 5 | 49,748 | 20.0% | 81,025 | 32.5% | $738,027 | 28.4% | $14.84 |
| 2024 | 1 | 3,308 | 1.3% | 84,333 | 33.8% | $36,388 | 1.4% | $11.00 |
| 2025 | 0 | 0 | 0.0% | 84,333 | 33.8% | $0 | 0.0% | $0.00 |
| 2026 | 1 | 5,870 | 2.4% | 90,203 | 36.2% | $95,549 | 3.7% | $16.28 |
| 2027 | 3 | 135,423 | 54.3% | 225,626 | 90.5% | $886,867 | 34.2% | $6.55 |
| 2028 | 0 | 0 | 0.0% | 225,626 | 90.5% | $0 | 0.0% | $0.00 |
| 2029 | 1 | 23,570 | 9.5% | 249,196 | 100.0% | $279,300 | 10.8% | $11.85 |
| Thereafter | 0 | 0 | 0.0% | 249,196 | 100.0% | $0 | 0.0% | $0.00 |
| Vacant | 0 | 0 | 0.0% | 249,196 | 100.0% | $0 | 0.0% | $0.00 |
| Total/Weighted Average | 15 | 249,196 | 100.0% | $2,596,808 | 100.0% | $10.42 |
| (1) | Information obtained from the underwritten rent roll dated May 14, 2019. |
| (2) | Annual U/W Base Rent PSF and Annual U/W Base Rent include contractual rent steps through May 2020 totaling $7,638. |
The following table presents historical occupancy percentages at the Grand Traverse Crossing Property:
Historical Occupancy
12/31/2015(1) | 12/31/2016(1) | 12/31/2017(1) | 12/31/2018(1)(2) | 5/14/2019(3) |
| 96.9% | 100.0% | 99.1% | 100.0% | 100.0% |
| (1) | Information obtained from the borrower. |
| (2) | Includes HomeGoods that signed a lease in October 2018 to retenant a former Toys ‘R’ Us space that went dark in April 2018, but had not yet taken occupancy. The HomeGoods lease commenced on June 30, 2019. |
| (3) | Information obtained from the underwritten rent roll. |
THE INFORMATION IN THIS STRUCTURAL AND COLLATERAL TERM SHEET IS NOT COMPLETE AND MAY BE AMENDED PRIOR TO THE TIME OF SALE. THIS TERM SHEET IS NOT AN OFFER TO SELL THESE SECURITIES AND IT IS NOT A SOLICITATION OF AN OFFER TO BUY THESE SECURITIES IN ANY JURISDICTION WHERE THE OFFER OR SALE IS NOT PERMITTED.
145
| Retail – Anchored | Loan #12 | Cut-off Date Balance: | $24,300,000 | |
| 2632 Crossing Circle | Grand Traverse Crossing | Cut-off Date LTV: | 70.6% | |
| Traverse City, MI 49684 | U/W NCF DSCR: | 1.36x | ||
| U/W NOI Debt Yield: | 9.4% |
Operating History and Underwritten Net Cash Flow. The following table presents certain information relating to the underwritten net cash flow at the Grand Traverse Crossing Property:
Cash Flow Analysis
| 2017 | TTM 5/31/2018 | Annualized 11 2/28/2019 | U/W | %(1) | U/W $ per SF | |
| Gross Potential Rent | $2,360,163 | $2,379,146 | $2,301,902 | $2,596,808(2) | 79.5% | $10.42 |
| Bad Debt | (25,757) | (52,213) | (10,624) | 0 | 0.0 | 0.00 |
| Gross Potential Rent | $2,334,406 | $2,326,932 | $2,291,278 | $2,596,808 | 79.5% | $10.42 |
| Other Income | 11,097 | 13,207 | 6,576 | 14,187 | 0.4 | $0.06 |
| Total Recoveries | 510,398 | 567,535 | 434,436 | 656,026 | 20.1 | 2.63 |
| Net Rental Income | $2,855,901 | $2,907,675 | $2,732,290 | $3,267,022 | 100.0% | $13.11 |
| (Vacancy & Credit Loss)(3) | $0 | $0 | $0 | (162,642) | (6.3) | (0.65) |
| Effective Gross Income | $2,855,901 | $2,907,675 | $2,732,290 | $3,104,380 | 95.0% | $12.46 |
| 0.00 | ||||||
| Real Estate Taxes | 196,414 | 197,154 | 276,837 | 275,949 | 8.9 | 1.11 |
| Insurance | 30,643 | 30,055 | 36,451 | 36,451 | 1.2 | 0.15 |
| Management Fee | 120,567 | 123,305 | 96,984 | 93,131 | 3.0 | 0.37 |
| Other Operating Expenses | 385,592 | 378,761 | 321,492 | 423,884 | 13.7 | 1.70 |
| Total Operating Expenses | $733,216 | $729,275 | $731,764 | $829,415 | 26.7% | $3.33 |
| Net Operating Income | $2,122,685 | $2,178,400 | $2,000,525 | $2,274,965 | 73.3% | $9.13 |
| Replacement Reserves | 20,602 | 20,602 | 20,602 | 20,602 | 0.7 | 0.08 |
| TI/LC | 161,977 | 161,977 | 161,977 | 161,977 | 5.2 | 0.65 |
| Net Cash Flow | $1,940,105 | $1,995,821 | $1,817,946 | $2,092,385 | 67.4% | $8.40 |
| NOI DSCR | 1.38x | 1.41x | 1.30x | 1.48x | ||
| NCF DSCR | 1.26x | 1.30x | 1.18x | 1.36x | ||
| NOI Debt Yield | 8.7% | 9.0% | 8.2% | 9.4% | ||
| NCF Debt Yield | 8.0% | 8.2% | 7.5% | 8.6% |
| (1) | Represents (i) percent of Net Rental Income for all revenue fields, (ii) percent of Gross Potential Rent for Vacancy & Credit Loss and (iii) percent of Effective Gross Income for all other fields. |
| (2) | Includes contractual rent steps through May 2020 totaling $7,638. |
| (3) | The underwritten economic vacancy is 5.0%. The Grand Traverse Crossing Property was 100.0% leased as of May 14, 2019. |
Market Overview and Competition.The Grand Traverse Crossing Property is located in Traverse City, Michigan within the Traverse City/Cadillac metropolitan statistical area (the “Traverse City/Cadillac MSA”). The Traverse City/Cadillac MSA is located in the northwest portion of Michigan and is comprised of four counties: Grand Traverse County, Benzie, Kalkaska and Leelenau Counties and is home to a diverse economy that has strong influences in the healthcare, education and retail fields. The Traverse City/Cadillac MSA has a diverse and well positioned economic base and benefits from its strategic location within the greater northern Michigan region. According to the appraisal, the unemployment rate for the Traverse City/Cadillac MSA was 4.2% as of December 2018. In comparison, the state’s unemployment rate was 4.1% and the national unemployment rate was 3.9% for the same period.
Access to the Grand Traverse Crossing Property’s neighborhood is provided by the US-31 (26,000 vehicles per day) and is located on South Airport Road. Traverse City is the largest city in the northern Michigan region and is a popular tourist destination in the Upper Midwest. Traverse City is also known nationally as the “Cherry Capital of the World”. The five counties around Traverse City make up the region that produces approximately 40.0% of the annual tart cherry crop in the United States. The annual, week-long Cherry Festival in July draws nearly 500,000 visitors. Other seasonal draws to the area include the Sleeping Bear Dunes National Lakeshore, Great Wolf Lodge, Lake Michigan and the Grand Traverse Bay. Based on the last economic impact study conducted by the city in 2012, more than 3.3 million visitor trips were made to the area generating $1.23 billion in economic activity for the area. The Grand Traverse Crossing Property is located in the center of the primary retail corridor for the area. The Grand Traverse Crossing Property is in the vicinity of numerous national retailers including Lowe’s, Best Buy, Michaels, Kohl’s, AMC, Meijer, Sam’s Club, as well as the Grand Traverse Mall, the only enclosed mall within a 100-mile radius. The mall is owned by Brookfield Properties, and features Macy’s, H&M, Dunham’s and TJ Maxx. The Grand Traverse Crossing Property’s market also represents one of the few major shopping corridors in upper Michigan. The Home Depot at the Grand Traverse Crossing Property and the non-collateral Walmart are the only store locations within a 40-mile radius. According to a third party market research report, the 2019 estimated population within a three, five, and ten-mile radius is 25,845, 41,416 and 77,547. The average household income within the same radii is $67,131, $72,368, and $79,996.
THE INFORMATION IN THIS STRUCTURAL AND COLLATERAL TERM SHEET IS NOT COMPLETE AND MAY BE AMENDED PRIOR TO THE TIME OF SALE. THIS TERM SHEET IS NOT AN OFFER TO SELL THESE SECURITIES AND IT IS NOT A SOLICITATION OF AN OFFER TO BUY THESE SECURITIES IN ANY JURISDICTION WHERE THE OFFER OR SALE IS NOT PERMITTED.
146
| Retail – Anchored | Loan #12 | Cut-off Date Balance: | $24,300,000 | |
| 2632 Crossing Circle | Grand Traverse Crossing | Cut-off Date LTV: | 70.6% | |
| Traverse City, MI 49684 | U/W NCF DSCR: | 1.36x | ||
| U/W NOI Debt Yield: | 9.4% |
Submarket Information – According to the appraisal, the Grand Traverse Crossing Property is situated within the Traverse City Area Retail Submarket. As of the first quarter of 2019, the submarket reported a total inventory of 5.7 million square feet with a 2.6% vacancy rate and an average quoted rental rate of $13.53 per square feet.
Appraiser’s Comp Set – The appraiser identified five primary competitive general retail properties for the Grand Traverse Crossing Property totaling approximately 168,801 square feet, which reported a weighted average occupancy rate of approximately 98.1%. The appraiser concluded to triple net market rents for the Grand Traverse Crossing Property as described in the Market Rent Summary table below. The appraiser identified six primary competitive junior anchor retail properties for the Grand Traverse Crossing Property totaling approximately 439,000 square feet, which reported a weighted average occupancy rate of approximately 82.4%. The appraiser concluded to triple net market rents for the Grand Traverse Crossing Property as described in the Market Rent Summary table below.
The following table presents certain information relating to the appraiser’s market rent conclusion for the Grand Traverse Crossing Property:
Market Rent Summary(1)
| Retail | Jr. Anchor | Restaurant | Anchor (Ground Lease) | Jr. Anchor (End-Cap) | General Retail (Side Loc) | |
| Market Rent (PSF) | $23.00 | $12.00 | $24.00 | $5.50 | $14.50 | $11.00 |
| Lease Term (Years) | 5 | 10 | 7 | 10 | 10 | 5 |
| Lease Type (Reimbursements) | NNN | NNN | NNN | NNN | NNN | NNN |
| Rent Increase Projection | 2.0% per annum | 2.0% per annum | 2.0% per annum | 2.0% per annum | 2.0% per annum | 2.0% per annum |
| (1) | Information obtained from the appraisal. |
The table below presents certain information relating to five general retail properties for the Grand Traverse Crossing Property identified by the appraiser:
Competitive Set(1)
| Grand Traverse Crossing (Subject) | 3592 Division Street | 3899 West Front Street, Ste LL | 1545 South Division | 201 East Front Street | 125 Park Street | |
| Location | Traverse City, MI | Traverse City, MI | Traverse City, MI | Traverse City, MI | Traverse City, MI | Traverse City, MI |
| Distance from Subject | -- | 1.1 miles | 2.4 miles | 1.4 miles | 2.7 miles | 2.7 miles |
| Property Type | Retail | Retail | Office | Retail | Retail | Retail |
| Year Built/ Renovated | 1996/2015 | 2018/NAP | 2009/2015 | 2002/NAP | 1856/2012 | 2004/NAP |
| Total GLA | 249,196 SF(2) | 7,200 SF | 9,224 SF | 30,336 SF | 6,041 SF | 116,000 SF |
| Total Occupancy | 100.0%(2) | 100.0% | 74.4% | 100.0% | 86.6% | 100.0% |
| (1) | Information obtained from the appraisal. |
| (2) | Information obtained from the underwritten rent roll dated May 14, 2019. The Grand Traverse Crossing Property was 100.0% occupied as of May 14, 2019. |
THE INFORMATION IN THIS STRUCTURAL AND COLLATERAL TERM SHEET IS NOT COMPLETE AND MAY BE AMENDED PRIOR TO THE TIME OF SALE. THIS TERM SHEET IS NOT AN OFFER TO SELL THESE SECURITIES AND IT IS NOT A SOLICITATION OF AN OFFER TO BUY THESE SECURITIES IN ANY JURISDICTION WHERE THE OFFER OR SALE IS NOT PERMITTED.
147
| Retail – Anchored | Loan #12 | Cut-off Date Balance: | $24,300,000 | |
| 2632 Crossing Circle | Grand Traverse Crossing | Cut-off Date LTV: | 70.6% | |
| Traverse City, MI 49684 | U/W NCF DSCR: | 1.36x | ||
| U/W NOI Debt Yield: | 9.4% |
The table below presents certain information relating to six comparable junior anchor retail properties for the Grand Traverse Crossing Property identified by the appraiser:
Competitive Set(1)
| Grand Traverse Crossing (Subject) | Freestanding Retail | Cascade Crossing | Jr. Big Box Retail | Central Park Shopping Center | Pet Smart-Big-Box Retail | Family Fare- Harrison | |
| Location | Traverse City, MI | Southfield, MI | Sault Sainte, MI | Okemos, MI | Okemos, MI | Kentwood, MI | Harrison, MI |
| Distance from Subject | -- | 193.4 miles | 137.5 miles | 151.3 miles | 151.0 miles | 125.4 miles | 64.6 miles |
| Property Type | Retail | Retail | Retail | Retail | Retail | Retail | Retail |
| Year Built/ Renovated | 1996/2015 | 1966/2006 | 1993/NAP | 1971/2009 | 1997/2005 | 1996/2016 | 2001/NAP |
| Total GLA | 249,196 SF(2) | 28,550 SF | 276,361 SF | 19,306 SF | 49,534 SF | 25,993 SF | 38,864 SF |
| Total Occupancy | 100.0%(2) | 100.0% | 74.4% | 100.0% | 86.6% | 100.0% | 100.0% |
| (1) | Information obtained from the appraisal. |
| (2) | Information obtained from the underwritten rent roll dated May 14, 2019. The Grand Traverse Crossing Property was 100.0% occupied as of May 14, 2019. |
THE INFORMATION IN THIS STRUCTURAL AND COLLATERAL TERM SHEET IS NOT COMPLETE AND MAY BE AMENDED PRIOR TO THE TIME OF SALE. THIS TERM SHEET IS NOT AN OFFER TO SELL THESE SECURITIES AND IT IS NOT A SOLICITATION OF AN OFFER TO BUY THESE SECURITIES IN ANY JURISDICTION WHERE THE OFFER OR SALE IS NOT PERMITTED.
148
(THIS PAGE INTENTIONALLY LEFT BLANK)
THE INFORMATION IN THIS STRUCTURAL AND COLLATERAL TERM SHEET IS NOT COMPLETE AND MAY BE AMENDED PRIOR TO THE TIME OF SALE. THIS TERM SHEET IS NOT AN OFFER TO SELL THESE SECURITIES AND IT IS NOT A SOLICITATION OF AN OFFER TO BUY THESE SECURITIES IN ANY JURISDICTION WHERE THE OFFER OR SALE IS NOT PERMITTED.
149
| No. 13 – Lenox Park | |||||||
| Mortgage Loan Information | Mortgaged Property Information | ||||||
| Mortgage Loan Seller: | Argentic Real Estate Finance LLC | Single Asset/Portfolio: | Single Asset | ||||
Credit Assessment (Fitch/KBRA/Moody’s): | NR/NR/NR | Property Type – Subtype: | Office – Suburban | ||||
| Original Principal Balance: | $24,187,500 | Location: | Memphis, TN | ||||
| Cut-off Date Balance: | $24,187,500 | Size: | 391,292 SF | ||||
| % of Initial Pool Balance: | 2.7% | Cut-off Date Balance Per SF: | $61.81 | ||||
| Loan Purpose: | Acquisition | Maturity Date Balance Per SF: | $49.32 | ||||
| Borrower Sponsor: | Group RMC Corporation | Year Built/Renovated: | 1997/2001 | ||||
| Guarantor: | Raymond Massa | Title Vesting: | Fee | ||||
| Mortgage Rate: | 4.1200% | Property Manager: | CBRE, Inc. | ||||
| Note Date: | July 17, 2019 | Current Occupancy (As of): | 86.9% (7/11/2019) | ||||
| Seasoning: | 0 months | YE 2018 Occupancy: | 64.9% | ||||
| Maturity Date: | August 6, 2029 | YE 2017 Occupancy: | 65.2% | ||||
| IO Period: | 0 months | YE 2016 Occupancy: | 60.9% | ||||
| Loan Term (Original): | 120 months | Appraised Value: | $34,600,000 | ||||
| Amortization Term (Original): | 360 months | Appraised Value Per SF: | $88.43 | ||||
| Loan Amortization Type: | Amortizing Balloon | Appraisal Valuation Date: | June 6, 2019 | ||||
| Call Protection: | L(24),D(92),O(4) | ||||||
| Lockbox Type: | Hard/Springing Cash Management | Underwriting and Financial Information | |||||
| Additional Debt: | None | TTM NOI (6/30/2019)(4): | $2,199,679 | ||||
| Additional Debt Type (Balance): | NAP | YE 2018 NOI: | $2,642,708 | ||||
| YE 2017 NOI: | $2,092,824 | ||||||
| YE 2016 NOI: | $1,571,662 | ||||||
| U/W Revenues: | $6,696,090 | ||||||
| Escrows and Reserves | U/W Expenses: | $3,504,558 | |||||
| Initial | Monthly | Cap | U/W NOI(4): | $3,191,533 | |||
| Taxes | $115,511 | $57,756 | NAP | U/W NCF: | $2,852,418 | ||
| Insurance | $0 | Springing | NAP | U/W DSCR based on NOI/NCF: | 2.27x / 2.03x | ||
| Replacement Reserve | $250,000 | $8,152 | NAP | U/W Debt Yield based on NOI/NCF: | 13.2% / 11.8% | ||
| TI/LC Reserve | $1,500,000 | Springing(1) | $1,500,000 | U/W Debt Yield at Maturity based on NOI/NCF: | 16.5% / 14.8% | ||
| Rent Abatement | $763,049(2) | $0 | NAP | Cut-off Date LTV Ratio: | 69.9% | ||
| Outstanding TI/LC | $305,905(3) | $0 | NAP | LTV Ratio at Maturity: | 55.8% | ||
| Sources and Uses | ||||||
| Sources | Uses | |||||
| Original loan amount | $24,187,500 | 67.0% | Purchase price | $32,250,000 | 89.3% | |
| Borrower Equity | 11,915,755 | 33.0 | Upfront reserves | 2,934,463 | 8.1 | |
| Closing costs | 918,791 | 2.5 | ||||
| Total Sources | $36,103,255 | 100.0% | Total Uses | $36,103,255 | 100.0% | |
| (1) | Upon the balance of the TI/LC Reserve falling below $750,000, ongoing TI/LC collections of $1.00 per square foot per annum initially $32,608 per month will commence until reserve balance reaches the $1,500,000 cap. |
| (2) | The free rent reserve is associated with various tenants. |
| (3) | Represents the outstanding tenant improvements and leasing costs associated with various tenants. |
| (4) | The difference between the U/W NOI and the TTM NOI (6/30/2019) is primarily due to increase in occupancy from 80.2% to 86.9%. |
The Mortgage Loan.The mortgage loan (the “Lenox Park Mortgage Loan”) is evidenced by a single promissory note secured by a first mortgage encumbering the borrower’s fee interest in a suburban office property located in Memphis, Tennessee (the “Lenox Park Property”). The proceeds, along with a cash equity contribution from the borrower in the amount of $11.9 million, of the Lenox Park Mortgage Loan were primarily used to acquire the Lenox Park Property for $32.25 million, fund reserves, and pay closing costs.
The Property. The Lenox Park Property is comprised of four, four-story office buildings totaling 391,292 square feet constructed in 1997 and most recently renovated in 2001. The Lenox Park Property is situated on a 28.4-acre site and is part of a larger, seven building office park known as Lenox Park.
The property features on-site amenities including a deli, fitness center, a new conference center, 24-hour security and card controlled building access after-hours. The seller, who purchased the Lenox Park Property in 2012, reportedly invested $1.3 million ($3.31 PSF) in capital expenditures.
THE INFORMATION IN THIS STRUCTURAL AND COLLATERAL TERM SHEET IS NOT COMPLETE AND MAY BE AMENDED PRIOR TO THE TIME OF SALE. THIS TERM SHEET IS NOT AN OFFER TO SELL THESE SECURITIES AND IT IS NOT A SOLICITATION OF AN OFFER TO BUY THESE SECURITIES IN ANY JURISDICTION WHERE THE OFFER OR SALE IS NOT PERMITTED.
150
| Office - Suburban | Loan #13 | Cut-off Date Balance: | $24,187,500 | |
| Various | Lenox Park | Cut-off Date LTV: | 69.9% | |
| Memphis, TN 38115 | U/W NCF DSCR: | 2.03x | ||
| U/W NOI Debt Yield: | 13.2% |
As of July 11, 2019, the Lenox Park Property is currently 86.9% leased to 26 tenants consisting of a diverse tenant mix of international, national and local companies.
Major Tenants.
Varsity Brands, Inc. (“Varsity Brands”) (51,073 square feet, 13.1% of net rentable area, 12/31/2021 expiration) provides customizable products and programs to elementary and middle schools, high schools, and colleges and universities, as well as church organizations, professional and collegiate sports teams and corporations. Headquartered at the Lenox Park Property, Varsity Brands has been a tenant at the Lenox Park Property since December 2001 when it commenced its initial 10-year lease on 51,045 square feet. In September 2010, the tenant extended its lease through December 2021. The lease does not provide for termination options and there are no renewal options remaining.
Varsity Brands may apply for a reduction in taxes applicable to its leased space under the State of Tennessee’s payment in lieu of taxes program (the “PILOT Program”). The lease provides that if the tenant obtains the approval for a reduction in such taxes under the PILOT Program, the borrower will participate with the tenant and the Industrial Development Board of the City of Memphis and County of Shelby, Tennessee (“IDB”), by conveying fee title to the Lenox Park Property to the IDB in exchange for the IDB leasing back the Lenox Park Property to the borrower on the terms and conditions contained in the form agreement attached to such lease. In addition, the lease provides that the borrower will participate in such IDB transaction as an accommodation to the tenant and the borrower is to suffer no risk, loss, cost or damage due to such participation, except as may be expressly agreed in writing by the borrower.
RAC King, LLC (“American Car Center”) (42,828 square feet, 10.9% of net rentable area, 9/30/2028 lease expiration) provides subprime consumers with low mileage vehicles and respective leases structured towards eventual ownership. American Car Center has been a tenant at the Lenox Park Property since November 2016 when it commenced its initial 108-month lease on 17,427 square feet. In September 2018, the tenant expanded into a total 24,994 square feet and extended its lease through May 2027. The tenant further expanded its lease through September 2028 in a second amendment. American Car Center executed an expansion on 5,426 square feet of space with a lease commencement date in January 2020. The lease does not provide for termination options and there is one, five year renewal option remaining.
IMC Companies, LLC (“IMC”) (31,921 square feet, 8.2% of net rentable area, 8/31/2021 lease expiration) is a national network of intermodal logistics businesses providing an array of services including container drayage, customs brokerage, truck brokerage, freight forwarding, warehousing, chassis provisioning and secured container storage. IMC has been a tenant at the Lenox Park Property since June 2008 when it commenced its initial 36-month lease on 10,560 square feet. The tenant has exercised both of its renewal options and has since expanded into a total of 31,921 square feet of space. The lease does not provide for termination options and there are no renewal options remaining.
Graphic Packaging International, LLC (“Graphic Packaging”) (NYSE: GPK, 27,456 square feet, 7.0% of net rentable area, 1/31/2022 lease expiration) is a Fortune 1000 corporation based in Sandy Springs, Georgia. The company is one of the largest manufacturers of paperboard and paper-based packaging. Graphic Packaging has been a tenant at the Lenox Park Property since December 2018 when it commenced its initial 38-month lease on 27,456 square feet. The lease does not provide for termination options and there are no renewal options remaining.
Pickering, Inc. (25,767 square feet, 6.6% of net rentable area, 6/30/2020 lease expiration) has been a tenant at the Lenox Park Property since May 2010 when it commenced its initial 122-month lease on 25,767 square feet. The company, founded in 1946, is a full-service engineering and architectural firm. The lease does not provide for termination options and there are no renewal options remaining.
Market Overview.The Lenox Park Property is located in Memphis in Shelby County, Tennessee, approximately 15 miles southeast of the Memphis central business district. The area immediately surrounding the Lenox Park Property includes residential development in all directions, with most of the commercial development consisting of office and retail uses to the south along Winchester Road, a major commercial corridor in the neighborhood.Within the surrounding neighborhood, primarily along Winchester Road and Hacks Cross Road to the south, there are retail strip shopping centers, free-standing retail stores and fast food restaurants. Primary access to the neighborhood is provided by TN Highway 385. This is an east-west corridor providing a direct link to I-240 and the overall Memphis area. In addition, Poplar Avenue (US-72) is located to the north of the Lenox Park Property and is the traditional route of access to and from Memphis. The Lenox Park Property is approximately 25 minutes southeast of downtown Memphis and approximately 15 minutes east of the Memphis International Airport.
According to the appraisal, the estimated 2018 population within a one-, three- and five-mile radius of the Lenox Park Property was 16,597, 103,489, and 209,193, respectively; and the estimated 2018 median household income within the same radii was $37,934, $51,421, and $58,719, respectively.
According to the appraisal, the Lenox Park Property is situated within the 385 Corridor submarket of the Memphis office market. As of the first quarter of 2019, the submarket reported a total inventory of approximately 8.8 million square feet of office space with a 7.7% vacancy rate and an average asking rental rate of $19.46 per square foot on a gross basis. The appraiser concluded to a market rent for the Lenox Park Property of $18.14 per square foot on a gross basis.
THE INFORMATION IN THIS STRUCTURAL AND COLLATERAL TERM SHEET IS NOT COMPLETE AND MAY BE AMENDED PRIOR TO THE TIME OF SALE. THIS TERM SHEET IS NOT AN OFFER TO SELL THESE SECURITIES AND IT IS NOT A SOLICITATION OF AN OFFER TO BUY THESE SECURITIES IN ANY JURISDICTION WHERE THE OFFER OR SALE IS NOT PERMITTED.
151
| Office - Suburban | Loan #13 | Cut-off Date Balance: | $24,187,500 | |
| Various | Lenox Park | Cut-off Date LTV: | 69.9% | |
| Memphis, TN 38115 | U/W NCF DSCR: | 2.03x | ||
| U/W NOI Debt Yield: | 13.2% |
The following table presents certain information relating to the tenancy at the Lenox Park Property:
Major Tenants(1)
| Tenant Name | Credit Rating (Fitch/Moody’s/ S&P) | Tenant NRSF | % of NRSF | Annual U/W Base Rent PSF(2) | Annual U/W Base Rent(2) | % of Total Annual U/W Base Rent(2) | Lease Expiration Date | Extension Options | Termination Option (Y/N) |
| Major Tenants | |||||||||
| Varsity Brands, Inc. | NR/NR/NR | 51,073 | 13.1% | $26.00 | $1,327,898 | 18.7% | 12/31/2021 | None | N |
| RAC King, LLC | NR/NR/NR | 42,828(3) | 10.9% | $19.60 | $839,429 | 11.8% | 9/30/2028 | 1 X 5 | N |
| IMC Companies, LLC | NR/NR/NR | 31,921 | 8.2% | $20.83 | $664,914 | 9.4% | 8/31/2021 | None | N |
| Graphic Packaging | NR/NR/NR | 27,456 | 7.0% | $20.29 | $557,082 | 7.8% | 1/31/2022 | None | N |
| Pickering, Inc. | NR/NR/NR | 25,767 | 6.6% | $18.50 | $476,690 | 6.7% | 6/30/2020 | None | N |
| Total Major Tenants | 179,045 | 45.8% | $21.59 | $3,866,014 | 54.4% | ||||
| Non-Major Tenant | 160,930 | 41.1% | $20.10 | $3,234,306 | 45.6% | ||||
| Occupied Collateral | 339,975 | 86.9% | $20.88 | $7,100,319 | 100.0% | ||||
| Vacant Space | 51,317 | 13.1% | |||||||
| Collateral Total | 391,292 | 100.0% | |||||||
| (1) | Information obtained from the underwritten rent roll. |
| (2) | Annual U/W Base Rent PSF, Annual U/W Base Rent, % of Total Annual U/W Base Rent includes contractual rent steps but not recovery income. |
| (3) | 5,426 square feet of the space has a lease commencement of January 2020. |
The following table presents certain information relating to the lease rollover schedule at the Lenox Park Property:
Lease Expiration Schedule(1)
| Year Ending December 31, | No. of Leases Expiring | Expiring NRSF | % of Total NRSF | Cumulative Expiring NRSF | Cumulative % of Total NRSF | Annual U/W Base Rent(2) | % of Total Annual U/W Base Rent(2) | Annual U/W Base Rent PSF(2)(3) |
| MTM | 1 | 1,594 | 0.4% | 1,594 | 0.4% | $9,600 | 0.1% | $6.02 |
| 2019 | 1 | 1,847 | 0.5% | 3,441 | 0.9% | $40,579 | 0.6% | $21.97 |
| 2020 | 4 | 36,370 | 9.3% | 39,811 | 10.2% | $717,913 | 10.1% | $19.74 |
| 2021 | 9 | 82,994 | 21.2% | 122,805 | 31.4% | $1,992,812 | 28.1% | $24.01 |
| 2022 | 8 | 73,309 | 18.7% | 196,114 | 50.1% | $1,504,465 | 21.2% | $20.52 |
| 2023 | 7 | 43,260 | 11.1% | 239,374 | 61.2% | $853,385 | 12.0% | $19.73 |
| 2024 | 1 | 9,806 | 2.5% | 249,180 | 63.7% | $197,395 | 2.8% | $20.13 |
| 2025 | 0 | 0 | 0.0% | 249,180 | 63.7% | $0 | 0.0% | $0.00 |
| 2026 | 3 | 47,967 | 12.3% | 297,147 | 75.9% | $944,742 | 13.3% | $19.70 |
| 2027 | 0 | 0 | 0.0% | 297,147 | 75.9% | $0 | 0.0% | $0.00 |
| 2028 | 5 | 42,828 | 10.9% | 339,975 | 86.9% | $839,429 | 11.8% | $19.60 |
| 2029 | 0 | 0 | 0.0% | 339,975 | 86.9% | $0 | 0.0% | $0.00 |
| Thereafter | 0 | 0 | 0.0% | 339,975 | 86.9% | $0 | 0.0% | $0.00 |
| Vacant | 14 | 51,317 | 13.1% | 391,292 | 100.0% | $0 | 0.0% | $0.00 |
| Total/Weighted Average | 53 | 391,292 | 100.0% | $7,100,319 | 100.0% | $20.88 |
| (1) | Information obtained from the underwritten rent roll dated July 11, 2019. |
| (2) | Annual U/W Base Rent, % of Total Annual U/W Base Rent, and Annual U/W Base Rent PSF includes rent steps but not recovery income. |
| (3) | Total/Weighted Average Annual U/W Base Rent PSF excludes vacant space |
The following table presents historical occupancy percentages at the Lenox Park Property:
Historical Occupancy
12/31/2016(1) | 12/31/2017(1) | 12/31/2018(1) | 7/11/2019(1)(2) |
| 60.9% | 65.2% | 64.9% | 86.9% |
| (1) | Information obtained from the underwritten rent roll. |
| (2) | The increase in occupancy is primarily due to various tenants signing new leases or current tenants expanding into additional space. |
THE INFORMATION IN THIS STRUCTURAL AND COLLATERAL TERM SHEET IS NOT COMPLETE AND MAY BE AMENDED PRIOR TO THE TIME OF SALE. THIS TERM SHEET IS NOT AN OFFER TO SELL THESE SECURITIES AND IT IS NOT A SOLICITATION OF AN OFFER TO BUY THESE SECURITIES IN ANY JURISDICTION WHERE THE OFFER OR SALE IS NOT PERMITTED.
152
| Office - Suburban | Loan #13 | Cut-off Date Balance: | $24,187,500 | |
| Various | Lenox Park | Cut-off Date LTV: | 69.9% | |
| Memphis, TN 38115 | U/W NCF DSCR: | 2.03x | ||
| U/W NOI Debt Yield: | 13.2% |
The following table presents certain information relating to comparable office leases for the Lenox Park Property:
Comparable Leases(1)
| Name/Location | Year Built/ Renovated | NRA (SF) | Occ. | Lease Type (expense basis) | Tenant Names | Lease Area (SF) | Lease Date | Lease term | Base Rent (PSF) |
Lenox Park Property 3150 Lenox Park Boulevard; 6750, 6775, 6745 Lenox, Memphis, TN (Subject) | 1997/2001(2) | 391,292(2) | 87%(2) | Full Service(2) | Various(2) | Various(2) | Various(2) | Various(2) | $20.0(2) |
Forum I, II & III 6750 Poplar Avenue, 1770 & 1790 Kirby Parkway, Memphis, TN | 1983
| 345,754
| 99%
| Full Service
| Kristen Miller Hargrove Engineers Cohen Realty Conch Technologies Quoted | 2,444 7,577 1,323 1,545 --- | Oct-18 Jul-18 Jun-18 May-18 --- | 2.0 Yrs. 5.0 Yrs. 3.1 Yrs. 3.0 Yrs. --- | $25.50 $23.25 $23.50 $26.15 $22.50-$24.50 |
Atrium I & II 6800 Poplar Avenue, Memphis, TN | 1985 | 84,223 | 92% | Full Service | Memphis Neuro Rehab eSolutions Quoted
| 1,743 3,873 --- | May-18 Apr-18 --- | 5.0 Yrs. 5.0 Yrs. --- | $21.75 $21.00 $20.50- $22.00 |
Southwind Office Center 3350, 3340, 3400 Players Club Parkway 8245, 8275, 8285, 8295 Tournament Drive, Memphis, TN | 1989 | 492,559 | 67% | Full Service | Greenpoint Ag McDonalds Verizon Wireless Zycron, Inc. Quoted | 1,034 2,333 6,481 2,610 --- | May-17 May-17 May-17 Apr-17 --- | 2.8 Yrs. 5.0 Yrs. 5.0 Yrs. 3.0 Yrs. --- | $20.29 $21.50 $20.26 $20.00 $19.00-$21.00 |
Tournament Trails 8700 Trail Lake Drive, Memphis, TN | 2002 | 73,423 | 93% | Full Service | Kemmons Wilson Insurance Quoted | 8,276 --- | Jan-17 --- | 3.0 Yrs. ---
| $19.50 $20.50
|
Champion Hills 3725 Champion Hills Drive, Memphis, TN | 2001 | 76,686 | 92% | Full Service | Suite 1300 Methodist Healthcare Quoted | 1,311 2,657 2,604 | Mar-19 Apr-17 Feb-17 | N/A 4.0 Yrs. 4.0 Yrs. | $19.00 $20.09 $19.15 |
| (1) | Information obtained from the appraisal. |
| (2) | Information obtained from the underwritten rent roll. |
THE INFORMATION IN THIS STRUCTURAL AND COLLATERAL TERM SHEET IS NOT COMPLETE AND MAY BE AMENDED PRIOR TO THE TIME OF SALE. THIS TERM SHEET IS NOT AN OFFER TO SELL THESE SECURITIES AND IT IS NOT A SOLICITATION OF AN OFFER TO BUY THESE SECURITIES IN ANY JURISDICTION WHERE THE OFFER OR SALE IS NOT PERMITTED.
153
| Office - Suburban | Loan #13 | Cut-off Date Balance: | $24,187,500 | |
| Various | Lenox Park | Cut-off Date LTV: | 69.9% | |
| Memphis, TN 38115 | U/W NCF DSCR: | 2.03x | ||
| U/W NOI Debt Yield: | 13.2% |
Operating History and Underwritten Net Cash Flow. The following table presents certain information relating to the historical operating statements and underwritten net cash flow at the Lenox Park Property:
Cash Flow Analysis
| 2016 | 2017(1) | 2018(1) | TTM 6/30/2019 | U/W | %(1) | U/W $ per SF | |
| Rents in Place | $5,461,811 | $6,122,215 | $6,253,764 | $6,549,645 | $6,980,228(2) | 85.0% | $17.84 |
| Contractual Rent Steps | 0 | 0 | 0 | 0 | 120,091 | 1.5 | 0.31 |
| Grossed Up Vacant Space | 0 | 0 | 0 | 0 | 1,026,340 | 12.5 | 2.62 |
| Gross Potential Rent | $5,461,811 | $6,122,215 | $6,253,764 | $6,549,645 | $8,126,659 | 99.0% | $20.77 |
| Other Income(3) | 7,927 | 68,457 | 19,172 | 20,373 | 20,373 | 0.2 | 0.05 |
| Total Recoveries | 30,812 | 54,422 | 42,907 | 26,803 | 64,405 | 0.8 | 0.16 |
| Net Rental Income | $5,500,550 | $6,245,094 | $6,315,843 | $6,596,821 | $8,211,437 | 100.0% | $20.99 |
| (Vacancy & Credit Loss) | (393,428) | (795,526)(1) | (207,013)(1) | (797,638) | (1,515,347)(4) | (18.6) | (3.87) |
| Effective Gross Income | $5,107,122 | $5,449,568 | $6,108,830 | $5,799,183 | $6,696,090 | 81.5% | $17.11 |
| Real Estate Taxes | 735,760 | 631,397 | 582,977 | 645,221 | 641,283 | 9.6 | 1.64 |
| Insurance | 92,070 | 81,861 | 85,586 | 89,267 | 62,477 | 0.9 | 0.16 |
| Management Fee | 132,967 | 143,808 | 187,601 | 166,557 | 200,883 | 3.0 | 0.51 |
| Other Operating Expenses | 2,574,663 | 2,499,678 | 2,609,958 | 2,698,459 | 2,599,915 | 38.8 | 6.64 |
| Total Operating Expenses | $3,535,460 | $3,356,744 | $3,466,122 | $3,599,504 | $3,504,558 | 52.3% | $8.96 |
| Net Operating Income(5) | $1,571,662 | $2,092,824 | $2,642,708 | $2,199,679 | $3,191,533 | 47.7% | $8.16 |
| Replacement Reserves | 0 | 0 | 0 | 0 | 97,823 | 1.5 | 0.25 |
| TI/LC | 0 | 0 | 0 | 0 | 241,292 | 3.6 | 0.62 |
| Net Cash Flow | $1,571,662 | $2,092,824 | $2,642,708 | $2,199,679 | $2,852,418 | 42.6% | $7.29 |
| NOI DSCR | 1.12x | 1.49x | 1.88x | 1.56x | 2.27x | ||
| NCF DSCR | 1.12x | 1.49x | 1.88x | 1.56x | 2.03x | ||
| NOI Debt Yield | 6.5% | 8.7% | 10.9% | 9.1% | 13.2% | ||
| NCF Debt Yield | 6.5% | 8.7% | 10.9% | 9.1% | 11.8% |
| (1) | The difference between the 2017 and 2018 Net Operating Income is primarily due to burn off of rent abatements owed to a variety of tenants. |
| (2) | Represents (i) percent of Net Rental Income for all revenue fields, (ii) percent of Gross Potential Rent for Vacancy & Credit Loss and (iii) percent of Effective Gross Income for all other fields. |
| (3) | Includes rent associated with 5,426 square feet of RAC King, LLC’s space which has a lease commencement date of January 2020. |
| (4) | Other income consists of tenant over-time HVAC payments, generator licenses, and other miscellaneous income. |
| (5) | The underwritten vacancy is 18.5%. The Lenox Park Property was 86.9% leased as of July 11, 2019. |
| (6) | The difference between the U/W Net Operating Income and the TTM 6/30/2019 Net Operating Income is primarily due to increase in occupancy from 80.2% to 86.9%. |
THE INFORMATION IN THIS STRUCTURAL AND COLLATERAL TERM SHEET IS NOT COMPLETE AND MAY BE AMENDED PRIOR TO THE TIME OF SALE. THIS TERM SHEET IS NOT AN OFFER TO SELL THESE SECURITIES AND IT IS NOT A SOLICITATION OF AN OFFER TO BUY THESE SECURITIES IN ANY JURISDICTION WHERE THE OFFER OR SALE IS NOT PERMITTED.
154
(THIS PAGE INTENTIONALLY LEFT BLANK)
THE INFORMATION IN THIS STRUCTURAL AND COLLATERAL TERM SHEET IS NOT COMPLETE AND MAY BE AMENDED PRIOR TO THE TIME OF SALE. THIS TERM SHEET IS NOT AN OFFER TO SELL THESE SECURITIES AND IT IS NOT A SOLICITATION OF AN OFFER TO BUY THESE SECURITIES IN ANY JURISDICTION WHERE THE OFFER OR SALE IS NOT PERMITTED.
155
| No. 14 – DCB Industrial Portfolio | |||||||
| Mortgage Loan Information | Mortgaged Property Information | ||||||
| Mortgage Loan Seller: | BSPRT CMBS Finance, LLC | Single Asset/Portfolio: | Portfolio | ||||
Credit Assessment (Fitch/KBRA/Moody’s): | NR/NR/NR | Property Type – Subtype: | Industrial – Warehouse Distribution | ||||
| Original Principal Balance: | $24,062,500 | Location: | Various | ||||
| Cut-off Date Balance: | $24,062,500 | Size: | 740,575 SF | ||||
| % of Initial Pool Balance: | 2.7% | Cut-off Date Balance Per SF: | $32.49 | ||||
| Loan Purpose: | Acquisition | Maturity Date Balance Per SF: | $29.64 | ||||
| Borrower Sponsors: | New Mountain Net Lease Partners Corporation | Year Built/Renovated: | Various/Various | ||||
| Guarantors: | New Mountain Net Lease Partners Corporation | Title Vesting: | Fee | ||||
| Mortgage Rate: | 4.3000% | Property Manager: | Self-managed | ||||
| Note Date: | July 19, 2019 | Current Occupancy (As of): | 100.0% (8/1/2019) | ||||
| Seasoning: | 0 months | YE 2018 Occupancy: | 100.0% | ||||
| Maturity Date: | August 6, 2029 | YE 2017 Occupancy: | 100.0% | ||||
| IO Period: | 60 months | YE 2016 Occupancy: | 100.0% | ||||
| Loan Term (Original): | 120 months | YE 2015 Occupancy: | 100.0% | ||||
| Amortization Term (Original): | 360 months | Appraised Value(1): | $40,500,000 | ||||
| Loan Amortization Type: | Interest-only, Amortizing Balloon | Appraised Value Per SF(1): | $54.69 | ||||
| Call Protection: | L(24),GRTR 1% or YM or D(92),O(4) | Appraisal Valuation Date: | June 1, 2019 | ||||
| Lockbox Type: | Hard/Springing Cash Management | ||||||
| Additional Debt: | None | Underwriting and Financial Information | |||||
| Additional Debt Type (Balance): | NAP | TTM NOI(3): | NAV | ||||
| YE 2018 NOI(3): | NAV | ||||||
| YE 2017 NOI(3): | NAV | ||||||
| YE 2016 NOI(3): | NAV | ||||||
| U/W Revenues: | $2,827,203 | ||||||
| Escrows and Reserves | U/W Expenses: | $84,816 | |||||
| Initial | Monthly | Cap | U/W NOI: | $2,742,387 | |||
| Taxes | $0 | Springing(2) | NAP | U/W NCF: | $2,680,982 | ||
| Insurance | $0 | Springing(2) | NAP | U/W DSCR based on NOI/NCF: | 1.92x / 1.88x | ||
| Replacement Reserve | $0 | Springing(2) | NAP | U/W Debt Yield based on NOI/NCF: | 11.4% / 11.1% | ||
| TI/LC Reserve | $0 | Springing(2) | NAP | U/W Debt Yield at Maturity based on NOI/NCF: | 12.5% / 12.2% | ||
| Cut-off Date LTV Ratio(1): | 59.4% | ||||||
| LTV Ratio at Maturity(1): | 54.2% | ||||||
| Sources and Uses | ||||||||||||||
| Sources | Uses | |||||||||||||
| Original loan amount | $24,062,500 | 61.5 | % | Purchase Price | $38,500,000 | 98.3 | % | |||||||
| Borrower Sponsors’ new cash contribution | 15,088,027 | 38.5 | Closing costs | 650,527 | 1.7 | |||||||||
| Total Sources | $39,150,527 | 100.0 | % | Total Uses | $39,150,527 | 100.0 | % | |||||||
| (1) | On a portfolio basis, the DCB Industrial Portfolio (as defined below) has an “as-is” appraised value of $40,500,000. On a stand-alone basis, the six DCB Industrial Portfolio Properties have an aggregate “as-is” appraised value of $39,240,000. The Cut-off Date LTV Ratio and the LTV Ratio at Maturity based on the aggregate stand-alone “as-is” appraised value of $39,240,000 are 61.3% and 55.9%, respectively. |
| (2) | Springing upon the occurrence of certain conditions set forth in the loan documents including, among others: (i) an event of default under the loan documents (ii) the debt service coverage ratio of the mortgage loan (as calculated under the loan documents) is less than 1.15x for two consecutive quarters and (iii) a monetary event of default by Diamond Crystal Brands (as defined below) under its master lease. |
| (3) | Historical operating statements are not available as the DCB Industrial Portfolio was recently acquired and such information was not made available by the prior owner. |
THE INFORMATION IN THIS STRUCTURAL AND COLLATERAL TERM SHEET IS NOT COMPLETE AND MAY BE AMENDED PRIOR TO THE TIME OF SALE. THIS TERM SHEET IS NOT AN OFFER TO SELL THESE SECURITIES AND IT IS NOT A SOLICITATION OF AN OFFER TO BUY THESE SECURITIES IN ANY JURISDICTION WHERE THE OFFER OR SALE IS NOT PERMITTED.
156
| Industrial – Warehouse | Loan #14 | Cut-off Date Balance: | $24,062,500 | |
| Distribution | DCB Industrial Portfolio | Cut-off Date LTV: | 59.4% | |
| Property Addresses - Various | U/W NCF DSCR: | 1.88x | ||
| U/W NOI Debt Yield: | 11.4% |
The Mortgage Loan. The mortgage loan (the “DCB Industrial Portfolio Mortgage Loan”) is evidenced by a single promissory note secured by a first mortgage encumbering the borrower’s fee interest in six industrial properties in five cities located across three states (each a “DCB Industrial Portfolio Property”, and collectively, the “DCB Industrial Portfolio Properties” or “DCB Industrial Portfolio”).
The Properties.The DCB Industrial Portfolio Properties consist of six industrial properties 100.0% leased to Diamond Crystal Brands, Inc. (“Diamond Crystal Brands”) on a triple-net basis under a master lease with an expiration date of August 31, 2034. The master lease commenced on July 19, 2019 and includes contractual rent increases of 2.0% per annum with no termination options and two, 10-year extension options.
Founded in 1966, Diamond Crystal Brands operates out of seven Safe Quality Food (“SQF”) Institute level 3 facilities nationwide, and is a manufacturer and distributor of customized foodservice solutions, including sauces, dressings, condiments, drink mixes, salt, pepper, sweeteners and other food and beverage products. One facility, operated out of Duluth, Georgia, is not part of the portfolio. Diamond Crystal Brands has a diverse customer base of blue chip foodservice distributors, national restaurant chains and convenience stores. The DCB Savannah, GA property (299,200 square feet; 40.4% of net rentable area; 51.7% of underwritten base rent) serves as Diamond Crystal Brands’ corporate headquarters since 1997. The improvements were constructed in 1975 and are situated on an approximately 25-acre site in a traditional industrial area in close proximity to the Port of Savanah and the main CSX rail yard. According to the appraisal, the immediate area remains a strong industrial center for the Savannah MSA due in large part to the proximity to rail and port terminals.
The following table presents certain information relating to the DCB Industrial Portfolio Properties:
| Property Name - Location | Allocated | % of | Occupancy | Year Built/ Renovated | Net Rentable Area (SF) | Appraised Value(1) | Portfolio Cut-off Date LTV(1) | % of UW NOI |
DCB Savannah, GA 3000 Tremont Road Savannah, GA | $12,229,162 | 50.8% | 100.0% | 1975, 1991/NAP | 299,200 | $20,000,000 | 61.3% | 51.1% |
DCB Visalia, CA 8700 West Doe Avenue Visalia, CA | $4,637,629 | 19.3% | 100.0% | 1991/NAP | 107,494 | $7,210,000 | 61.3% | 15.7% |
DCB Bremen, GA 1090 Pacific Avenue Bremen, GA | $4,135,465 | 17.2% | 100.0% | 1999/NAP | 158,080 | $7,000,000 | 61.3% | 18.1% |
DCB Bondurant, IA 1600 2nd Street Northeast Bondurant, IA | $1,725,080 | 7.2% | 100.0% | 1966/2005 | 100,281 | $2,830,000 | 61.3% | 8.2% |
DCB Mitchellville, IA 2 215 Mill Street Mitchellville, IA | $844,816 | 3.5% | 100.0% | 1969/1997 | 46,129 | $1,390,000 | 61.3% | 4.4% |
DCB Mitchellville, IA 1 100 Center Avenue North Mitchellville, IA | $490,348 | 2.0% | 100.0% | 1976/2007 | 29,391 | $810,000 | 61.3% | 2.4% |
| Total/Weighted Average | $24,062,500 | 100.0% | 100.0% | 740,575 | $40,500,000 | 59.4% | 100.0% |
| (1) | On a stand-alone basis, the six DCB Industrial Portfolio Properties have an aggregate “as-is” appraised value of $39,240,000. The Portfolio Cut-off Date LTV based off the aggregate stand-alone “as-is” appraised value of $39,240,000 is 61.3%. |
The following table presents certain information relating to comparable demographic and rental information for each of the DCB Industrial Portfolio Properties:
Warehouse Distribution Market Summary(1)
| Property Name | Net Rentable Area (SF)(2) | 5-Mile Radius Population | 5-Mile Radius Avg Household Income | In-Place U/W Base Rent PSF(2) | Appraiser Concluded Rent PSF | Third Party |
| DCB Savannah, GA | 299,200 | 105,256 | $52,786 | $5.02 | $5.00 | 5.0% |
| DCB Visalia, CA | 107,494 | 77,968 | $88,557 | $4.23 | $4.44 | 4.0% |
| DCB Bremen, GA | 158,080 | 16,412 | $60,279 | $3.39 | $3.25 | 2.7% |
| DCB Bondurant, IA | 100,281 | 23,305 | $89,934 | $2.33 | $2.25 | 4.3% |
| DCB Mitchellville, IA 2 | 46,129 | 6,603 | $91,325 | $2.48 | $2.50 | 4.3% |
| DCB Mitchellville, IA 1 | 29,391 | 5,783 | $92,150 | $2.27 | $2.25 | 4.3% |
| Total/Weighted Average | 740,575 | 61,141 | $68,571 | $3.93 | $3.91 | 4.2% |
| (1) | Information obtained from appraisals. |
| (2) | Information obtained from the underwritten rent roll. In-Place U/W Base Rent PSF includes contractual rent steps through September 2019 totaling $57,018. |
| (3) | Information obtained from a third party market report. |
THE INFORMATION IN THIS STRUCTURAL AND COLLATERAL TERM SHEET IS NOT COMPLETE AND MAY BE AMENDED PRIOR TO THE TIME OF SALE. THIS TERM SHEET IS NOT AN OFFER TO SELL THESE SECURITIES AND IT IS NOT A SOLICITATION OF AN OFFER TO BUY THESE SECURITIES IN ANY JURISDICTION WHERE THE OFFER OR SALE IS NOT PERMITTED.
157
| Industrial – Warehouse | Loan #14 | Cut-off Date Balance: | $24,062,500 | |
| Distribution | DCB Industrial Portfolio | Cut-off Date LTV: | 59.4% | |
| Property Addresses - Various | U/W NCF DSCR: | 1.88x | ||
| U/W NOI Debt Yield: | 11.4% |
The following table presents certain information relating to the tenancy at the DCB Industrial Portfolio Properties:
Major Tenants
| Tenant Name | Credit Rating | Tenant NRSF | % of NRSF | Annual U/W Base Rent PSF(2) | Annual U/W Base Rent(2) | % of Total Annual U/W Base Rent | Lease Expiration Date | Extension Options | Termination Option (Y/N) |
| Diamond Crystal Brands | NR/NR/NR | 740,575 | 100.0% | $3.93 | $2,907,922 | 100.0% | 8/31/2034 | 2, 10-year | N |
| Occupied Collateral Total | 740,575 | 100.0% | $3.93 | $2,907,922 | 100.0% | ||||
| Vacant Space | 0 | 0.0% | |||||||
| Collateral Total | 740,575 | 100.0% | |||||||
| (1) | Certain ratings are those of the parent company whether or not the parent company guarantees the lease. |
| (2) | Annual U/W Base Rent PSF and Annual U/W Base Rent include contractual rent steps through September 2019 totaling $57,018. |
The following table presents certain information relating to the lease rollover schedule at the DCB Industrial Portfolio Properties:
Lease Expiration Schedule(1)
| Year Ending December 31, | No. of Leases Expiring | Expiring NRSF | % of Total NRSF | Cumulative Expiring NRSF | Cumulative % of Total NRSF | Annual U/W Base Rent(2) | % of Total Annual U/W Base Rent | Annual U/W Base Rent PSF(2) | |||||||||||||||
| MTM | 0 | 0 | 0.0 | % | 0 | 0.0 | % | $0 | 0.0 | % | $0.00 | ||||||||||||
| 2019 | 0 | 0 | 0.0 | % | 0 | 0.0 | % | $0 | 0.0 | % | $0.00 | ||||||||||||
| 2020 | 0 | 0 | 0.0 | % | 0 | 0.0 | % | $0 | 0.0 | % | $0.00 | ||||||||||||
| 2021 | 0 | 0 | 0.0 | % | 0 | 0.0 | % | $0 | 0.0 | % | $0.00 | ||||||||||||
| 2022 | 0 | 0 | 0.0 | % | 0 | 0.0 | % | $0 | 0.0 | % | $0.00 | ||||||||||||
| 2023 | 0 | 0 | 0.0 | % | 0 | 0.0 | % | $0 | 0.0 | % | $0.00 | ||||||||||||
| 2024 | 0 | 0 | 0.0 | % | 0 | 0.0 | % | $0 | 0.0 | % | $0.00 | ||||||||||||
| 2025 | 0 | 0 | 0.0 | % | 0 | 0.0 | % | $0 | 0.0 | % | $0.00 | ||||||||||||
| 2026 | 0 | 0 | 0.0 | % | 0 | 0.0 | % | $0 | 0.0 | % | $0.00 | ||||||||||||
| 2027 | 0 | 0 | 0.0 | % | 0 | 0.0 | % | $0 | 0.0 | % | $0.00 | ||||||||||||
| 2028 | 0 | 0 | 0.0 | % | 0 | 0.0 | % | $0 | 0.0 | % | $0.00 | ||||||||||||
| 2029 | 0 | 0 | 0.0 | % | 0 | 0.0 | % | $0 | 0.0 | % | $0.00 | ||||||||||||
| Thereafter | 1 | 740,575 | 100.0 | % | 740,575 | 100.0 | % | $2,907,922 | 100.0 | % | $3.93 | ||||||||||||
| Vacant | 0 | 0 | 0.0 | % | 740,575 | 100.0 | % | $0 | 0.0 | % | $0.00 | ||||||||||||
| Total/Weighted Average | 1 | 740,575 | 100.0 | % | $2,907,922 | 100.0 | % | $3.93 | |||||||||||||||
| (1) | Information obtained from the underwritten rent roll. |
| (2) | Total/Weighted Average Annual U/W Base Rent and Annual U/W Base Rent PSF exclude vacant space includes contractual rent steps through September 2019 totaling $57,018. |
THE INFORMATION IN THIS STRUCTURAL AND COLLATERAL TERM SHEET IS NOT COMPLETE AND MAY BE AMENDED PRIOR TO THE TIME OF SALE. THIS TERM SHEET IS NOT AN OFFER TO SELL THESE SECURITIES AND IT IS NOT A SOLICITATION OF AN OFFER TO BUY THESE SECURITIES IN ANY JURISDICTION WHERE THE OFFER OR SALE IS NOT PERMITTED.
158
| Industrial – Warehouse | Loan #14 | Cut-off Date Balance: | $24,062,500 | |
| Distribution | DCB Industrial Portfolio | Cut-off Date LTV: | 59.4% | |
| Property Addresses - Various | U/W NCF DSCR: | 1.88x | ||
| U/W NOI Debt Yield: | 11.4% |
The following table presents historical occupancy percentages at the DCB Industrial Portfolio:
Historical Occupancy
| 12/31/2015(1) | 12/31/2016(1) | 12/31/2017(1) | 12/31/2018(1) | 8/1/2019(2) | ||||
| 100.0% | 100.0% | 100.0% | 100.0% | 100.0% |
| (1) | Information obtained from the borrower. |
| (2) | Information obtained from the underwritten rent roll. |
Operating History and Underwritten Net Cash Flow. The following table presents certain information relating to the underwritten net cash flow at the DCB Industrial Portfolio Properties:
Cash Flow Analysis(1)
| U/W | %(2) | U/W $ per SF | |||||
| Base Rent(3) | $2,907,922 | 95.1 | % | $3.93 | |||
| Grossed Up Vacant Space | 0 | 0.0 | 0.00 | ||||
| Gross Potential Rent | $2,907,922 | 95.1 | % | $3.93 | |||
| Other Income | 0 | 0.0 | 0.00 | ||||
| Total Recoveries | 148,514 | 4.9 | 0.20 | ||||
| Net Rental Income | $3,056,436 | 100.0 | % | $4.13 | |||
| (Vacancy & Credit Loss) | (229,233)(4) | (7.9) | (0.31) | ||||
| Effective Gross Income | $2,827,203 | 97.2 | % | $3.82 | |||
| Real Estate Taxes | 0 | 0.0 | 0.00 | ||||
| Insurance | 0 | 0.0 | 0.00 | ||||
| Management Fee | 84,816 | 3.0 | 0.11 | ||||
| Other Operating Expenses | 0 | 0.0 | 0.00 | ||||
| Total Operating Expenses | $84,816 | 3.0 | % | $0.11 | |||
| Net Operating Income | $2,742,387 | 97.0 | % | $3.70 | |||
| Replacement Reserves | 61,406 | 2.2 | 0.08 | ||||
| TI/LC | 0 | 0.0 | 0.00 | ||||
| Net Cash Flow | $2,680,981 | 94.8 | % | $3.62 | |||
| NOI DSCR | 1.92x | ||||||
| NCF DSCR | 1.88x | ||||||
| NOI Debt Yield | 11.4% | ||||||
| NCF Debt Yield | 11.1% |
| (1) | Historical operating statements are not available as the DCB Industrial Portfolio was recently acquired and such information was not made available by the prior owner. |
| (2) | Represents (i) percent of Net Rental Income for all revenue fields, (ii) percent of Gross Potential Rent for Vacancy & Credit Loss and (iii) percent of Effective Gross Income for all other fields. |
| (3) | Includes contractual rent steps through September 2019 totaling $57,018. |
| (4) | The underwritten economic vacancy is 7.5%. The DCB Industrial Portfolio Properties were 100.0% physically occupied as of August 1, 2019. As part of the master lease, Diamond Crystal Brands received a rent credit of $75,000 for their August 2019 rent payment only. |
THE INFORMATION IN THIS STRUCTURAL AND COLLATERAL TERM SHEET IS NOT COMPLETE AND MAY BE AMENDED PRIOR TO THE TIME OF SALE. THIS TERM SHEET IS NOT AN OFFER TO SELL THESE SECURITIES AND IT IS NOT A SOLICITATION OF AN OFFER TO BUY THESE SECURITIES IN ANY JURISDICTION WHERE THE OFFER OR SALE IS NOT PERMITTED.
159
| No. 15 – Renaissance Center VI | |||||||
| Mortgage Loan Information | Mortgaged Property Information | ||||||
| Mortgage Loan Seller: | BSPRT | Single Asset/Portfolio: | Single Asset | ||||
Credit Assessment (Fitch/KBRA/Moody’s): | NR/NR/NR | Property Type – Subtype: | Office – Suburban | ||||
| Original Principal Balance(1): | $22,500,000 | Location: | Tampa, FL | ||||
| Cut-off Date Balance(1): | $22,500,000 | Size: | 150,000 SF | ||||
| % of Initial Pool Balance: | 2.5% | Cut-off Date Balance Per SF(1): | $233.33 | ||||
| Loan Purpose: | Recapitalization | Maturity Date Balance Per SF(1): | $218.49 | ||||
| Borrower Sponsor: | DT GRAT JAT, LLC | Year Built/Renovated: | 2018/NAP | ||||
| Guarantor: | DT GRAT JAT, LLC | Title Vesting: | Leasehold | ||||
| Mortgage Rate: | 4.7300% | Property Manager: | CBRE, Inc. | ||||
| Note Date: | July 12, 2019 | Current Occupancy (As of): | 100.0% (8/1/2019) | ||||
| Seasoning: | 0 months | YE 2018 Occupancy: | 100.0% | ||||
| Maturity Date: | August 6, 2026 | YE 2017 Occupancy(6): | NAV | ||||
| IO Period: | 36 months | YE 2016 Occupancy(6): | NAV | ||||
| Loan Term (Original): | 84 months | YE 2015 Occupancy(6): | NAV | ||||
| Amortization Term (Original): | 360 months | Appraised Value: | $50,400,000 | ||||
| Loan Amortization Type: | Interest-only, Amortizing Balloon | Appraised Value Per SF: | $336.00 | ||||
| Call Protection(2): | L(24),D(56),O(4) | Appraisal Valuation Date: | June 11, 2019 | ||||
| Lockbox Type: | Hard/Springing Cash Management | ||||||
| Additional Debt(1): | Yes | Underwriting and Financial Information | |||||
| Additional Debt Type (Balance)(1): | Pari Passu($12,500,500) | TTM NOI (5/31/2019)(7): | $1,983,383 | ||||
| T-9 2018 NOI(7): | $2,231,172 | ||||||
| YE 2017 NOI(6): | NAV | ||||||
| YE 2016 NOI(6): | NAV | ||||||
| U/W Revenues: | $5,044,483 | ||||||
| U/W Expenses: | $1,921,039 | ||||||
| Escrows and Reserves | U/W NOI(7): | $3,123,444 | |||||
| Initial | Monthly | Cap | U/W NCF: | $3,100,944 | |||
| Taxes | $433,336 | $39,394 | NAP | U/W DSCR based on NOI/NCF(1): | 1.43x / 1.42x | ||
| Insurance | $70,956 | $6,451 | NAP | U/W Debt Yield based on NOI/NCF(1): | 8.9% / 8.9% | ||
| Replacement Reserve | $0 | Springing(3) | NAP | U/W Debt Yield at Maturity based on NOI/NCF(1): | 9.5% / 9.5% | ||
| TI/LC Reserve | $0 | Springing(4) | NAP | Cut-off Date LTV Ratio(1): | 69.4% | ||
| Deferred Maintenance | $12,500 | $0 | NAP | LTV Ratio at Maturity(1): | 65.0% | ||
| Ground Lease Reserve | $0 | Springing(5) | NAP | ||||
| Sources and Uses | ||||||||
| Sources | Uses | |||||||
| Original loan amount | $35,000,000 | 100.0% | Return of Equity | $34,099,955 | 97.4% | |||
| Upfront reserves | 516,791 | 1.5 | ||||||
| Closing costs | 383,253 | 1.1 | ||||||
| Total Sources | $35,000,000 | 100.0% | Total Uses | $35,000,000 | 100.0% | |||
| (1) | The Renaissance Center VI Mortgage Loan (as defined below) is part of the Renaissance Center VI Whole Loan (as defined below), which comprises twopari passu notes with an aggregate original balance of $35,000,000. All statistical information related to the Cut-off Date Balance per SF, Maturity Date Balance per SF, U/W Debt Yield based on NOI/NCF, U/W Debt Yield at Maturity based on NOI/NCF, U/W DSCR based on NOI/NCF, Cut-off Date LTV Ratio and LTV Ratio at Maturity are based on the Renaissance Center VI Whole Loan. |
| (2) | Defeasance of the Renaissance Center VI Whole Loan is permitted at any time following the end of the two-year period commencing on the closing date of the securitization of the last piece of the Renaissance Center VI Whole Loan to be securitized. The assumed defeasance lockout period of 24 payments is based on the closing date of this transaction in August 2019. |
| (3) | The Renaissance Center VI Whole Loan documents require ongoing monthly replacement reserves of $1,875 on each monthly payment date occurring on and after September 2022, which the lender may require the borrower to increase if the lender reasonably determines such increase is necessary to maintain the proper operation of the Renaissance Center VI Property (as defined below). |
| (4) | Ongoing monthly TI/LC reserves of $18,750 are not currently required and will be not be required so long as the credit rating of any Specified Tenant (as defined in the loan documents) is above an “A-” rating assigned by AM Best. |
| (5) | Ongoing monthly ground lease reserves of $10,000 are not currently required and will be not be required so long as (i) no event of default is outstanding, (iii) the borrower pays all ground rent directly to the ground lessor in a timely manner, and (iii) upon lenders’ request, borrower provides evidence of full payment. |
| (6) | Historical operating statements and occupancy information are not available as the Renaissance Center VI Property (as defined below) was constructed in 2018. |
| (7) | See “Cash Flow Analysis” section for a discussion of historical NOI increases and the increase in U/W NOI compared to the most recent NOI. |
The Mortgage Loan. The mortgage loan (the “Renaissance Center VI Mortgage Loan”) is part of a whole loan (the “Renaissance Center VI Whole Loan”) evidenced by twopari passu promissory notes with an aggregate original principal balance of $35,000,000 and is secured by a first mortgage encumbering the leasehold interest in a class A office property in Tampa, Florida (the “Renaissance Center VI Property”). The Renaissance Center VI Mortgage Loan consists of the controlling Note A-1, which had an original principal
THE INFORMATION IN THIS STRUCTURAL AND COLLATERAL TERM SHEET IS NOT COMPLETE AND MAY BE AMENDED PRIOR TO THE TIME OF SALE. THIS TERM SHEET IS NOT AN OFFER TO SELL THESE SECURITIES AND IT IS NOT A SOLICITATION OF AN OFFER TO BUY THESE SECURITIES IN ANY JURISDICTION WHERE THE OFFER OR SALE IS NOT PERMITTED.
160
| Office – Suburban | Loan #15 | Cut-off Date Balance: | $22,500,000 | |
| 9125 Henderson Road | Renaissance Center VI | Cut-off Date LTV: | 69.4% | |
| Tampa, FL 33634 | U/W NCF DSCR: | 1.42x | ||
| U/W NOI Debt Yield: | 8.9% |
balance of $22,500,000, has a Cut-off Date Balance of $22,500,000 and is being contributed to the WFCM 2019-C52 trust. The non-controlling Note A-2 had an original principal balance of $12,500,000, has a Cut-off Date Balance of $12,500,000 and is expected to be contributed to a future securitization. See“Description of the Mortgage Pool—The Whole Loans—The Serviced Pari Passu Whole Loans” and“Pooling and Servicing Agreement—Servicing of the Mortgage Loans” in the Preliminary Prospectus.
Note Summary
| Notes | Original Balance | Cut-off Date Balance | Note Holder | Controlling Piece |
| A-1 | $22,500,000 | $22,500,000 | WFCM 2019-C52 | Yes |
| A-2 | $12,500,000 | $12,500,000 | RREF III-D Repo Sub, LLC(1) | No |
| Note Summary | $35,000,000 | $35,000,000 |
| (1) | The Renaissance Center VI Whole Loan was originated by BSPRT CMBS Finance, LLC and the A-2 note was subsequently sold to RREF III-D Repo Sub, LLC. |
The Property.The Renaissance Center VI Property is comprised of a four-story class A office building totaling 150,000 square feet located in Tampa, Florida and is part of a larger approximately 700,000 SF complex known as Renaissance Center. An approximately 573,000 SF portion of the complex was securitized in JPMCC 2016-JP2 and SGCMS 2016-C5. Constructed in 2018, the Renaissance Center VI Property is 100.0% leased to The Auto Club Group, Inc. (“ACG”) as of August 1, 2019. The Renaissance Center VI Property is situated on a 4.2-acre site with 253 parking spaces resulting in a parking ratio of approximately 1.7 spaces per 1,000 square feet of rentable area. The ACG lease provides for the use of an additional 569 parking spaces in the adjacent parking garage. ACG recently consolidated 700 employees across multiple office spaces around Tampa and The Renaissance Center VI Property now serves as ACG’s regional headquarters.
The borrower ground leases an approximately 4.2 acre parcel from an affiliate of the borrower under a 99-year ground lease entered into on February 11, 2016. The ground rent is $120,000 per annum with no increases during the term.
Major Tenant.
Largest Tenant: The Auto Club Group, Inc. (150,000 square feet; 100.0% of net rentable area; 100.0% of underwritten base rent; 3/31/2033 lease expiration) – ACG is the second largest American Automobile Association (“AAA”) club in North America. ACG belongs to the national AAA federation, which includes more than 59 million members located in the United States and Canada, and aims to help improve traffic safety and advance mobility. ACG and its affiliates provide membership, insurance, financial services and travel services to almost 10 million members in multiple states and territories including Florida, Georgia, Illinois, Indiana, Iowa, Michigan, Minnesota, Nebraska, North Dakota, Tennessee, Wisconsin, Puerto Rico and the U.S. Virgin Islands.. Members can map a route, research gas prices, book hotels and access AAA roadside assistance all through AAA. Auto Club South Insurance Company, a subsidiary of ACG, is an insurance provider rated “A” by A.M. Best. ACG currently pays a base rent of $20.60 per square foot, with 3.0% annual increases. ACG has two, ten-year renewal options remaining and no termination options.
THE INFORMATION IN THIS STRUCTURAL AND COLLATERAL TERM SHEET IS NOT COMPLETE AND MAY BE AMENDED PRIOR TO THE TIME OF SALE. THIS TERM SHEET IS NOT AN OFFER TO SELL THESE SECURITIES AND IT IS NOT A SOLICITATION OF AN OFFER TO BUY THESE SECURITIES IN ANY JURISDICTION WHERE THE OFFER OR SALE IS NOT PERMITTED.
161
| Office – Suburban | Loan #15 | Cut-off Date Balance: | $22,500,000 | |
| 9125 Henderson Road | Renaissance Center VI | Cut-off Date LTV: | 69.4% | |
| Tampa, FL 33634 | U/W NCF DSCR: | 1.42x | ||
| U/W NOI Debt Yield: | 8.9% |
The following table presents certain information relating to the tenancy at the Renaissance Center VI Property:
Major Tenant
| Tenant Name | Credit Rating (Fitch/Moody’s/S&P) | Tenant NRSF | % of NRSF | Annual U/W Base Rent PSF | Annual U/W Base Rent(1) | % of Total Annual U/W Base Rent(1) | Lease Expiration Date | Extension Options | Termination Option (Y/N) |
| The Auto Club Group, Inc. | NR/NR/NR | 150,000 | 100.0% | $22.66 | $3,399,459 | 100.0% | 3/31/2033 | 2, 10-year | N |
| Occupied Collateral Total | 150,000 | 100.0% | $22.66 | $3,399,459 | 100.0% | ||||
| Vacant Space | 0 | 0.0% | |||||||
| Collateral Total | 150,000 | 100.0% | |||||||
| (1) | Annual U/W Base Rent PSF and Annual U/W Base Rent includes straight-line rent averaging for The Auto Group, Inc. over its remaining lease term totaling $309,459. |
Market Overview and Competition.The Renaissance Center VI Property is located in Tampa, Florida, less than one mile from the Veteran’s Expressway (Route-589), which is a major highway that leads to the Tampa central business district (seven miles away) and the Tampa International Airport (three miles away). The Renaissance Center VI Property is also located approximately six miles west of I-275. Interstate 275 is a limited-access six-lane interstate connector which connects downtown Tampa with north Tampa and also provides a second form of access to Interstate 75 for northbound travelers. Interstate 75 extends along the eastern perimeter of development within the Tampa MSA, and connects the Tampa MSA to Northern Florida cities such as Ocala and Gainesville, as well as Sarasota, Ft. Myers, and Naples to the south.
With a population of approximately 3.1 million, the Tampa MSA is one of the fastest growing MSAs in Florida and currently the second largest MSA in the state. The area features an educated workforce, a low cost of living, and a favorable business climate. Companies in Tampa benefit from Florida’s business-friendly environment. Florida, a right-to-work state with no state income taxes, has well-developed public infrastructure and easy access to global transportation and shipping channels. Tampa Bay is home to over 19 corporate headquarters with over $1 billion in annual revenue, eight of which are Fortune 500 companies. Almost 500 foreign-owned companies representing more than 40 nations are established in Tampa as well.
According to the appraisal, the estimated 2018 population within a one, three- and five-mile radius of the Renaissance Center VI Property was approximately 7,646, 109,709 and 257,258, respectively; and the estimated 2018 average household income within the same radii was approximately $78,660, $64,668 and $75,662, respectively.
Submarket Information – According to a third party market research report, the Renaissance Center VI Property is located in the North Tampa submarket. As of first quarter 2019, there is approximately 3.1 million square feet of class A office space in North Tampa that operates at a 10.6% vacancy rate and has had no new completions since 2013 except for the Renaissance Center VI Property. Asking rents across class A office space average $25.14 and average vacancy is at its lowest level since the second quarter of 2009.
Appraiser’s Comp Set –The appraiser identified seven directly competitive office properties totaling approximately 1.2 million square feet, with an average occupancy rate of 96.0% and base rents ranging from $15.00 to $24.50 per square foot, triple net. The appraiser also performed a secondary rent comparable analysis which identified 14 leases across five class A properties. According to the appraiser, typical expenses for class A buildings in the subject market generally range from $9.00 to $11.00 PSF. Therefore, the adjusted triple net rental rates for these comparables would fall in the $21.00 to $22.00 per square foot, triple net.
THE INFORMATION IN THIS STRUCTURAL AND COLLATERAL TERM SHEET IS NOT COMPLETE AND MAY BE AMENDED PRIOR TO THE TIME OF SALE. THIS TERM SHEET IS NOT AN OFFER TO SELL THESE SECURITIES AND IT IS NOT A SOLICITATION OF AN OFFER TO BUY THESE SECURITIES IN ANY JURISDICTION WHERE THE OFFER OR SALE IS NOT PERMITTED.
162
| Office – Suburban | Loan #15 | Cut-off Date Balance: | $22,500,000 | |
| 9125 Henderson Road | Renaissance Center VI | Cut-off Date LTV: | 69.4% | |
| Tampa, FL 33634 | U/W NCF DSCR: | 1.42x | ||
| U/W NOI Debt Yield: | 8.9% |
The following table presents certain information relating to the lease rollover schedule at the Renaissance Center VI Property:
Lease Expiration Schedule(1)
| Year Ending December 31, | No. of Leases Expiring | Expiring NRSF | % of Total NRSF | Cumulative Expiring NRSF | Cumulative % of Total NRSF | Annual U/W Base Rent(2) | % of Total Annual U/W Base Rent | Annual U/W Base Rent PSF(2) |
| MTM | 0 | 0 | 0.0% | 0 | 0.0% | $0 | 0.0% | $0.00 |
| 2019 | 0 | 0 | 0.0% | 0 | 0.0% | $0 | 0.0% | $0.00 |
| 2020 | 0 | 0 | 0.0% | 0 | 0.0% | $0 | 0.0% | $0.00 |
| 2021 | 0 | 0 | 0.0% | 0 | 0.0% | $0 | 0.0% | $0.00 |
| 2022 | 0 | 0 | 0.0% | 0 | 0.0% | $0 | 0.0% | $0.00 |
| 2023 | 0 | 0 | 0.0% | 0 | 0.0% | $0 | 0.0% | $0.00 |
| 2024 | 0 | 0 | 0.0% | 0 | 0.0% | $0 | 0.0% | $0.00 |
| 2025 | 0 | 0 | 0.0% | 0 | 0.0% | $0 | 0.0% | $0.00 |
| 2026 | 0 | 0 | 0.0% | 0 | 0.0% | $0 | 0.0% | $0.00 |
| 2027 | 0 | 0 | 0.0% | 0 | 0.0% | $0 | 0.0% | $0.00 |
| 2028 | 0 | 0 | 0.0% | 0 | 0.0% | $0 | 0.0% | $0.00 |
| 2029 | 0 | 0 | 0.0% | 0 | 0.0% | $0 | 0.0% | $0.00 |
| Thereafter | 1 | 150,000 | 100.0% | 150,000 | 100.0% | $3,399,459 | 100.0% | $22.66 |
| Vacant | 0 | 0 | 0.0% | 150,000 | 100.0% | $0 | 0.0% | $0.00 |
| Total/Weighted Average | 1 | 150,000 | 100.0% | $3,399,459 | 100.0% | $22.66 |
| (1) | Information obtained from the underwritten rent roll. |
| (2) | Annual U/W Base Rent PSF and Annual U/W Base Rent includes straight-line rent averaging for The Auto Group, Inc. over its remaining lease term totaling $309,459. |
The following table presents historical occupancy percentages at the Renaissance Center VI Property:
Historical Occupancy
12/31/2015(1) | 12/31/2016(1) | 12/31/2017(1) | 12/31/2018(2) | 8/1/2019(2) |
| NAV | NAV | NAV | 100.0% | 100.0% |
| (1) | Prior information is not available as the Renaissance Center VI Property was constructed in 2018. |
| (2) | Information obtained from the underwritten rent roll. |
THE INFORMATION IN THIS STRUCTURAL AND COLLATERAL TERM SHEET IS NOT COMPLETE AND MAY BE AMENDED PRIOR TO THE TIME OF SALE. THIS TERM SHEET IS NOT AN OFFER TO SELL THESE SECURITIES AND IT IS NOT A SOLICITATION OF AN OFFER TO BUY THESE SECURITIES IN ANY JURISDICTION WHERE THE OFFER OR SALE IS NOT PERMITTED.
163
| Office – Suburban | Loan #15 | Cut-off Date Balance: | $22,500,000 | |
| 9125 Henderson Road | Renaissance Center VI | Cut-off Date LTV: | 69.4% | |
| Tampa, FL 33634 | U/W NCF DSCR: | 1.42x | ||
| U/W NOI Debt Yield: | 8.9% |
The following table presents certain information relating to comparable office properties to the Renaissance Center VI Property identified by the appraiser:
Comparable Leases(1)
| Property Name/Location | Year Built/ Renovated | Property Subtype | Tenant Size (SF) | Distance from Subject | Occupancy | Asking Base Rent PSF | Lease Type |
| Primary Lease Comparables | |||||||
Siemens Power Generation Services HQ 4400 North Alafaya Trail Orlando, FL | 1983/NAP | Single Tenant | 255,677 | 110.0 miles | 100.0% | $15.00 | NNN |
Disney Reservation Center 14014 East Fieldside Place Tampa, FL | 1996/NAP | Single Tenant | 64,000 | 14.4 miles | 100.0% | $16.50 | Absolute Net |
Proposed McKesson Corporation Office Burnt Mill Road and Gate Parkway Jacksonville, FL | 2019/NAP | Single Tenant | 125,000 | 202.0 miles | 100.0% | $21.19 | Absolute Net |
Syniverse Technologies 8125 Highwoods Palm Way Tampa, FL | 2000/NAP | Single Tenant | 198,750 | 16.4 miles | 100.0% | $15.00 | NNN |
Orange Lake Resorts 9395 South John Young Parkway Orlando, FL | 2013/NAP | Single Tenant | 115,000 | 88.3 miles | 100.0% | $18.50 | NNN |
Gartner Office 13200 Paul J Doherty Parkway Fort Myers, FL | 2018/NAP | Single Tenant | 247,686 | 146.0 miles | 100.0% | $16.80 | NNN |
Renaissance Center VII 8746 Henderson Road Tampa, FL | 2020/NAP | Multi Tenant | 160,000 | 0.6 miles | 71.0% | $24.50 | NNN |
| Secondary Lease Comparables | |||||||
Island Center 2701 North Rocky Point Drive Tampa, FL | 1986/NAP | Multi Tenant | 2,619 3,351 | 6.4 miles | 88.0% | $35.00 $31.00 | MG MG |
Waterford Plaza 7650 West Courtney Campbell Causeway Tampa, FL | 1987/NAP | Multi Tenant | 5,274 5,135 | 6.4 miles | 94.0% | $33.00 $34.00 | MG MG |
Rocky Point Centre 3030 North Rocky Point Drive Tampa, FL | 1985/1992 | Multi Tenant | 1,306 11,470 6,559 | 6.4 miles | 88.0% | $33.00 $33.00 $33.00 | MG MG MG |
Meridian I & II 4300 & 4350 West Cypress Street Tampa, FL | 1985/NAP | Multi Tenant | 5,378 11,429 1,572 | 8.1 miles | 85.0% | $31.00 $31.50 $28.00 | MG MG MG |
Tower Place 1511 North Westshore Boulevard Tampa, FL | 1988/NAP | Multi Tenant | 1,466 4,084 7,134 1,013 | 7.3 miles | 94.0% | $33.00 $33.00 $33.00 $32.25 | MG MG MG MG |
| (1) | Information obtained from the appraisal. |
THE INFORMATION IN THIS STRUCTURAL AND COLLATERAL TERM SHEET IS NOT COMPLETE AND MAY BE AMENDED PRIOR TO THE TIME OF SALE. THIS TERM SHEET IS NOT AN OFFER TO SELL THESE SECURITIES AND IT IS NOT A SOLICITATION OF AN OFFER TO BUY THESE SECURITIES IN ANY JURISDICTION WHERE THE OFFER OR SALE IS NOT PERMITTED.
164
| Office – Suburban | Loan #15 | Cut-off Date Balance: | $22,500,000 | |
| 9125 Henderson Road | Renaissance Center VI | Cut-off Date LTV: | 69.4% | |
| Tampa, FL 33634 | U/W NCF DSCR: | 1.42x | ||
| U/W NOI Debt Yield: | 8.9% |
Operating History and Underwritten Net Cash Flow. The following table presents certain information relating to the historical operating performance and underwritten net cash flow at the Renaissance Center VI Property:
Cash Flow Analysis(1)
| Annualized 9 12/31/2018 | TTM 5/31/2019 | U/W | %(2) | U/W $ per SF | |
| Base Rent | $3,000,000 | $3,015,000 | $3,090,000 | 59.4% | $20.60 |
| Contractual Rent Steps(3) | 0 | 0 | 309,459 | 6.0 | 2.06 |
| Grossed Up Vacant Space | 0 | 0 | 0 | 0.0 | 0.00 |
| Gross Potential Rent | $3,000,000 | $3,015,000 | $3,399,459 | 65.4% | $22.66 |
| Other Income | 0 | 0 | 0 | 0.0 | 0.00 |
| Total Recoveries | 1,425,000 | 1,425,000 | 1,801,039 | 34.6 | 12.01 |
| Net Rental Income | $4,425,000 | $4,440,000 | $5,200,498 | 100.0% | $34.67 |
| Concessions | (750,000)(4) | (750,000)(4) | 0 | 0.0 | 0.00 |
| (Vacancy & Credit Loss) | 0 | 0 | (156,015)(5) | (4.6) | (1.04) |
| Effective Gross Income | $3,675,000 | $3,690,000 | $5,044,483 | 97.0% | $33.63 |
| Real Estate Taxes | 20,166 | 165,724 | 472,730 | 9.4 | 3.15 |
| Insurance | 47,958 | 63,166 | 77,406 | 1.5 | 0.52 |
| Management Fee | 132,750 | 155,325 | 151,334 | 3.0 | 1.01 |
| Other Operating Expenses | 1,242,953 | 1,322,403 | 1,219,569 | 24.2 | 8.13 |
| Total Operating Expenses | $1,443,828 | $1,706,617 | $1,921,039 | 38.1% | $12.81 |
| Net Operating Income | $2,231,172 | $1,983,383 | $3,123,444 | 61.9% | $20.82 |
| Replacement Reserves | 0 | 0 | 22,500 | 0.4 | 0.15 |
| TI/LC | 0 | 0 | 0 | 0.0 | 0.00 |
| Net Cash Flow(4) | $2,231,172 | $1,983,383 | $3,100,944 | 61.5% | $20.67 |
| NOI DSCR(6) | 1.02x | 0.91x | 1.43x | ||
| NCF DSCR(6) | 1.02x | 0.91x | 1.42x | ||
| NOI Debt Yield(6) | 6.4% | 5.7% | 8.9% | ||
| NCF Debt Yield(6) | 6.4% | 5.7% | 8.9% |
| (1) | Historical operating statements are not available as the Renaissance Center VI Property was constructed in 2018. |
| (2) | Represents (i) percent of Net Rental Income for all revenue fields, (ii) percent of Gross Potential Rent for Vacancy & Credit Loss and (iii) percent of Effective Gross Income for all other fields. |
| (3) | Represents straight-line rent averaging for The Auto Group, Inc. over its remaining lease term totaling $309,459. |
| (4) | The Auto Group, Inc. received four months of free rent upon its lease commencement in April 2018. |
| (5) | The underwritten economic vacancy is 3.0%. The Renaissance Center VI Property was 100.0% physically occupied as of August 1, 2019. |
| (6) | The debt service coverage ratios and debt yields are based on the Renaissance Center VI Whole Loan. |
THE INFORMATION IN THIS STRUCTURAL AND COLLATERAL TERM SHEET IS NOT COMPLETE AND MAY BE AMENDED PRIOR TO THE TIME OF SALE. THIS TERM SHEET IS NOT AN OFFER TO SELL THESE SECURITIES AND IT IS NOT A SOLICITATION OF AN OFFER TO BUY THESE SECURITIES IN ANY JURISDICTION WHERE THE OFFER OR SALE IS NOT PERMITTED.
165
| Wells Fargo Commercial Mortgage Trust 2019-C52 | Transaction Contact Information |
VI. Transaction Contact Information
Questions regarding this Structural and Collateral Term Sheet may be directed to any of the following individuals:
| Wells Fargo Securities, LLC | |
| Brigid Mattingly | Tel. (312) 269-3062 |
| A.J. Sfarra | Tel. (212) 214-5613 |
| Alex Wong | Tel. (212) 214-5615 |
| Barclays Capital Inc. | |
| Daniel Vinson | Tel. (212) 528-8224 |
| Brian Wiele | Tel. (212) 412-5780 |
THE INFORMATION IN THIS STRUCTURAL AND COLLATERAL TERM SHEET IS NOT COMPLETE AND MAY BE AMENDED PRIOR TO THE TIME OF SALE. THIS TERM SHEET IS NOT AN OFFER TO SELL THESE SECURITIES AND IT IS NOT A SOLICITATION OF AN OFFER TO BUY THESE SECURITIES IN ANY JURISDICTION WHERE THE OFFER OR SALE IS NOT PERMITTED.
166